Embed Size (px)
Citation preview
SYED HAMAD SHAH
EVALUATION OF LOGISTICS SERVICE LEVEL IN MULTIPLE MODES OF
TRANSPORTATION
Industrial Engineering &
Management Master Thesis
November 2019

i
ABSTRACT
Syed Hamad Shah: Evaluation of Logistics Service Level in Multiple Modes of Transportation Master of Science Thesis, 72 pages Tampere University Master’s Degree Program in Industrial Engineering and Management Majors: International Sales and Sourcing November 2019
Keywords: logistics service level, logistics service quality, evaluating mode of transpor-
tation, logistics costs analysis
The project has been initiated in the aftersales department of an automotive company.
Since the company has had recently record years in gaining market share and further
efforts are being done to gain a competitive edge over the competitive brand by selling
more aftersales parts. Which in turn makes it challenging for logistics to manage the
increasing inflow and outflow of parts. For the case company, logistics processes form
the critical loop involving both the company performance in logistics and customer expe-
rience. The company realizes that logistics costs can vastly impact overall business per-
formance. Hence, an opportunity is presented at the case company to expedite regular
stock-orders by utilizing available space inside emergency-order trucks instead of using
shipping containers. The idea behind this proposed modification is that it will reduce lead
time and increase logistics service quality. But the actual problem in this situation is the
lack of knowledge to understand company-specific logistics service quality and then the
evaluation framework which can help the management to decide whether to proceed or
oppose the business idea.
Literature was reviewed to define the objectives of service levels and how to measure
service quality. Based on the previous literature, a theoretical framework was developed
which served as a guiding principle for the latter empirical analysis. The data collection
was conducted through semi-structured interviews and information was acquired from a
logistics management software. The results from both the quantitative and qualitative
analysis uncovered that the case company has substantial profit margins to proceed with
the proposed logistics activity leaving enough room for overhead costs. The logistics
process does involve multiple challenges, but after performing sensitivity analysis, it was
found that the process is flexible enough to handle challenges. Thus, the study provides
a positive indication to proceed with this opportunity for a pilot test-run project.

PREFACE
I was lucky to receive the thesis topic when I was working as a logistics trainee in the
aftersales department of the case company. Even though my master’s specialization was
related to sales and sourcing, having a similar background, but the learning curve in the
overall thesis process has embarked on its importance in my life.
First, I would like to thank Associate Professor Teemu Laine for taking on the supervision
of this research project. His contribution towards developing a framework and insightful
comments about thesis writing have contributed to a great extent. Also, I would like to
express my gratitude for the case company representatives for their interest and useful
discussion on the topic in general. Most of all, I would like to thank my colleagues in the
logistics team, we have had many brainstorming sessions both formal and informal
where I have received support and encouragement for thesis and general life matters
during the tenure of six months.
Finally, I would like to extend my humble appreciation towards my friends that I have
made while studying in Tampere and relatively short stay whilst working in Espoo. Even
more, a very warmhearted thanks to my parents; without their prayers and guidance in
the right direction, I would not have made it this far.
Tampere, November 2019
Syed Hamad Shah

CONTENTS
1. INTRODUCTION .................................................................................................. 1 1.1 Research Motivation ............................................................................ 1
1.2 Research Context and Case Company ................................................ 2
1.3 Research Objectives and Key Questions ............................................. 3
1.4 Structure of the Study .......................................................................... 4
2. THEORETICAL BACKGROUND........................................................................... 6 2.1 Managing Logistics Operations ............................................................ 6
2.1.1 Logistics Activities, Functions, and Networks ................................ 7
2.1.2 Parts Logistics in the Automotive Industry ................................... 11
2.2 Service levels in logistics ................................................................... 14
2.2.1 Objectives of Logistics Service Levels and Customer Service
Quality ................................................................................................. 14
2.2.2 Evaluation of Service Levels ....................................................... 18
2.3 Competing Through Logistics ............................................................. 21
2.3.1 Logistics Performance Measurement .......................................... 21
2.3.2 Managing Freight Transportation ................................................ 24
3. THEORETICAL FRAMEWORK OF LOGISTICS PERFORMANCE MEASUREMENT AND SERVICE LEVELS ................................................................. 28
4. RESEARCH METHODOLOGY AND DATA ........................................................ 31 4.1 Research Strategy ............................................................................. 31
4.2 Research Process .............................................................................. 33
4.3 Data Collection and Analysis .............................................................. 34
5. EMPIRICAL ANALYSIS AND RESULTS ............................................................. 37 5.1 Case Company X ............................................................................... 37
5.1.1 Aftersales Department ................................................................ 37
5.1.2 Logistics Unit and Inventory Control ............................................ 38
5.2 Current State of Logistics Service Levels ........................................... 41
5.2.1 Review of Lead Time .................................................................. 42
5.2.2 Review of Logistic Costs ............................................................. 44
5.2.3 Review of Order Delivery Quality ................................................ 46
5.3 Analysis of the Proposed Mode of Transportation .............................. 48
5.3.1 Product Selection ........................................................................ 48
5.3.2 Cost Implications......................................................................... 51
5.3.3 Impact on Lead Time and Delivery Quality .................................. 56
5.4 Sensitivity Analysis............................................................................. 57
6. CONCLUSION .................................................................................................... 61 6.1 Summary of Empirical Findings .......................................................... 61
6.1.1 Business Objectives and Key Questions ..................................... 62
6.1.2 Case Study Results .................................................................... 63
6.2 The implication of Results in Literature............................................... 66
6.3 Action Plan and Challenges ............................................................... 68
6.4 Limitations and Criticism .................................................................... 70
6.5 Directions for Future Research .......................................................... 71
7. REFERENCES ................................................................................................... 73
LIST OF FIGURES
Figure 1. Logistics Flow (Adopted from Harrison, 2014, p. 1). ....................................... 6 Figure 2. Supply Network (Adapted from Ghiani, et al., 2013, p. 7). .............................. 9 Figure 3. 3PL Provider Strategic Position (Adapted from Choy, et al., 2007). ............. 11 Figure 4. Automotive Logistics Flow (Adapted from Sabadka, 2015). ......................... 12 Figure 5. Opinion on Logistics Service Levels and Customer Satisfaction
(Adapted from Miricesu, 2013). ............................................................ 15 Figure 6. Service Quality Model (adapted and modified from Saura, et al., 2008). ...... 17 Figure 7 Interrelationship of supply chain performance metrics (Adapted from
Beamon, 1999). ................................................................................... 24 Figure 8. Intermodal LT and LTL Transport (Adopted from Ghiani, et al., 2013,
p.322). ................................................................................................. 26 Figure 9. Theoretical Framework for Performance Measurement and Service
Quality Objectives. ............................................................................... 29 Figure 10. The research process of the project. .......................................................... 34 Figure 11. Aftersales Department of CCX. .................................................................. 38 Figure 12. Physical forward flow of aftersales products............................................... 40 Figure 13. EO - Filled vs vacant capacity. ................................................................... 45 Figure 14. The overview of logistic facts and cost elements (adapted and
modified from Zeng & Rossetti, 2003). ................................................. 52 Figure 15. Sensitivity Analysis (Situation 1). ............................................................... 58 Figure 16. Sensitivity Analysis (Situation 2). ............................................................... 59 Figure 17. Sensitivity Analysis (Situation 3). ............................................................... 59 Figure 18. Sensitivity Analysis (Situation 4). ............................................................... 60 Figure 19. Summary of Evaluation of Service Level. ................................................... 65

LIST OF TABLES
Table 1. Logistic Functions (Adopted and modified from Farahani, et al., 2011, p. 45) ......................................................................................................... 8
Table 2. Main Logistics Costs (Adapted from Ghiani, et al., 2003). ............................. 20 Table 3. Supply Chain Performance Measurement (Adapted from Beamon,
1999). .................................................................................................. 23 Table 4. Research methods (Adapted from Gummesson 2017, p. 215-233). .............. 32 Table 5. List of interview participants. ......................................................................... 35 Table 6. EO truck lead time follow-up. ........................................................................ 42 Table 7. EO truck delivery times. ................................................................................ 43 Table 8. Product Selection. ......................................................................................... 50 Table 9. Product cost analysis. ................................................................................... 54 Table 10. Cost Matrix. ................................................................................................. 55 Table 11. Action plan and recommendations. ............................................................. 69

LIST OF SYMBOLS AND ABBREVIATIONS
CCX Case Company X LSL Logistics Service Level LSQ Logistics Service Quality LMS Logistics Management Software VOR Vehicle Off-Road SOs Stock Orders EOs Emergency Orders ETD Estimated Time of Delivery PMS Performance Measurement System
.

1
1. INTRODUCTION
1.1 Research Motivation
The term logistics relates to the management of supplies and transport required for op-
eration. In today's emerging global economy, the business sector uses this term to de-
scribe the material and information flow from the point it is originated to the point it's
utilized. Since, the concept of logistics is evolved from the supply chain, which is a key
element of business performance measurement which deals with transportation, inven-
tory management, shipping and plays a vital role in evaluating service levels.
In case of the automotive industry, which contains multiple products, new technological
innovations, and processes that make the logistics more complex (Sabadka, 2015). An
automobile usually consists of thousands of different parts being manufactured by mul-
tiple tiers of suppliers and makes the supply network much more complex. No matter the
size of business and brand worth, every automotive company wants to expand its busi-
ness and grow its customer base. Therefore, businesses focus on selling their products
to customers by product positioning and brand image. Whenever a business witnesses
an increase in car sales it greatly influences overall parts movement and logistics, espe-
cially the aftersales parts which are generally sold after a car is sold to the customer. For
some companies, managing the inflow and outflow of the parts becomes difficult to man-
age because of a lack of specialized knowledge. In that case, the companies turn to the
option of using third-party logistics service (3PL). A 3PL organization generally special-
izes in managing logistics and warehouse operations because the organization pos-
sesses the necessary experience and connections to perform integrated warehousing
and transportation service using either its internal or external resources. Hence, numer-
ous automotive industries are utilizing 3PL services to outsource its distribution logistics
and warehouse responsibilities.
Thus, the quest for gaining higher market share has intensified the competition among
the automobile manufacturers. The logistics process forms the critical loop and has great
implications over the flows of materials, information, and the cash flow, which are the key
elements that define logistics service levels (Zeng & Rossetti, 2003). In today’s world,
the business sector has realized that logistics plays the heart of supply chains and there-
2
fore, the reduction of logistics costs can certainly improve business performance effi-
ciency and increase organizational service levels. As argued by Everaert (Everaert, et
al., 2008), in today's streamlined world and global economy, cost-effectiveness in logis-
tics is a requirement. The increased pressure to reduce the logistics in the automobile
industry has certainly changed its dynamics, the costs are getting higher and usually,
14% of companies cannot estimate their costs properly (Sabadka, 2015). Therefore,
many companies try to look for alternative logistics and modes of transportation, but the
important question remains, what impact it can have on the company’s logistics service
levels.
From the company’s perspective, the relationship with the end-customer is highly de-
pendent on the logistics service quality being offered. Timeliness in order-delivery, infor-
mation and order quality has a significant positive or negative impact on end-customers
satisfaction (Saura , et al., 2008). With regard to improving the service quality and causal
relationship, the companies are investigating possible ways to deliver products more ef-
ficiently and in a timely manner. Hence, companies continuously try to investigate differ-
ent modes of transportation, economic order quantities, and delivery service packages.
These efforts are being made not only to reduce the internal logistics costs but also to
understand the complexity of the global logistic process and what can be done to improve
the overall service quality. In this research, the focus is put more on understanding the
complexity of logistic processes and modes of transportation from a real-world case
study problem. Possibility to increase the efficiency of logistic service level and cost re-
duction is analyzed.
1.2 Research Context and Case Company
This thesis is done by collaborating with Case Company X, which acts as an importer
and marketer for an automobile manufacturer. The company operates in seven different
Nordic and Baltics market and this study is focused on Finland’s market. The company
has seven different vehicle models in its portfolio being offered in seven markets. The
main departments of the case company which generate direct revenue are corporate
sales and aftersales by selling tangible products. The corporate sales department is
roughly selling 40,000 vehicles in seven markets in a fiscal year. The aftersales depart-
ment roughly generates a revenue of 40 million euros. The aftersales department offers
several products and services which include genuine accessory, local accessories, gen-
uine parts, and associated business products. The department consists of different
teams managing products and services including logistics, marketing, parts and tires,

3
warranty and technical team. The logistics team handles moving the parts from a central
warehouse to a local warehouse in each territory.
Presently, the logistics department deals with 124,000 active part numbers which are
being delivered to local warehouses. The stock orders are delivered by shipping contain-
ers and emergency orders are being shipped by trucks from a central warehouse in Am-
sterdam to a local warehouse of each territory. The topic of the thesis has been devel-
oped due to the real need of the company to look for alternative ways of modifying trans-
portation that can improve the efficiency of logistics service levels but the implications
over costs are yet to be understood.
1.3 Research Objectives and Key Questions
In the current state, the scheduled delivery of regular stock orders is transported through
shipping containers from the Rotterdam port to the port in Vuosaari. A local Finnish lo-
gistics service corporation provides third-party logistics (3PL) services in Finland and
deals with transporting the goods to Finnish warehouse and storage activities in the local
warehouse located in Vantaa. However, in case of emergency orders, which are first
sent once-daily from Amsterdam to Denmark via trucks and then goods are distributed
to other Nordic countries through trucks, either full-load or a half-load truck.
The regular stock orders being sent through full-load shipping containers provide very
little visibility about the estimated time of arrival and have an average lead time ranging
from 3 weeks to 5 weeks. Therefore, to cater to this issue, the required safety stock is
higher than the average and, in a few cases, parts delay received negative responses
on logistics service level from the local dealers in Finland. The responsible managers
and stakeholders of the logistic process proposed an idea to create a tailor-made mode
of transportation and more specifically the delivery service package including order types
and quantity. However, despite having the defined logistic key performance indicators,
the case company is missing logistic-service-level assessment from a customer and
case company’s point of view. If any development is to be made in the mode of trans-
portation, it requires the information on how to measure the logistic service level and
assess the impact and risk, thus the situation above formed the basis of this thesis with
the following objectives.
• How can the logistics service levels be evaluated in the proposed logistics activ-
ity?
• What metrics are needed to increase the efficiency of logistic service quality?

4
• What challenges and risks are associated with the proposed mode of transporta-
tion?
This thesis aims to answer these questions for Case Company X as accurately as pos-
sible. First, the research is conducted by analyzing the relevant literature in detail and
defining the logistics service levels from the case company’s perspective. Secondly, the
financial information about the products of the company is acquired to analyze the be-
havior of logistics costs for different modes of transportation. For the case company, the
primary customers are the local dealers, thus, the study strives to answer the impact on
customers from their perspective. Logistics service level is a broad concept and deals
with various background factors but for this study, the aim is to investigate the narrow
and relevant issues of service levels such as lead time, logistics visibility, communication,
and customer satisfaction.
In this study the costs analyzed are based on the volume of the product being transport
by 3PL (euro/volume), thus, the other costs of logistics are not taken into consideration.
Furthermore, there are over 80,000 aftersales parts in the case company’s system but
for this study, the latest inventory stock analysis report is examined and only a few parts
were considered to perform this study. The reasoning behind selecting these parts is
explained in chapter 4. This case study is only focused on drafting a business case in a
limited capacity, analyze its current vs planned logistics service levels, understand the
behavior of logistics costs in both the cases, finally present overall challenges and pos-
sible solutions.
1.4 Structure of the Study
The thesis consists of several chapters which are divided categorically. After the intro-
duction, chapter 2 discusses the literature and reviews the theoretical background in
detail. First, managing logistics operations is discussed. The involved operational activi-
ties and challenges are examined especially in the case of the automotive industry. Sec-
ondly, service levels are defined from the case company’s perspective. The emphasis of
this subchapter is on understanding the role of logistics service levels in business per-
formance and customer satisfaction. The third subchapter deepens the involved cost
implications in logistics service levels and its behavior in different modes of transporta-
tion.
After the theoretical background, in the third chapter, a theoretical framework is devel-
oped which reflects theory concepts and provides guidance for empirical analysis. Fur-
thermore, the fourth chapter explains how this study was carried out and the practicalities

5
involved in the collection of data. The main research methods of this study were done by
action research conducted by doing several interviews and brainstorming sessions with
the case company’s section managers. The data for cost analysis is gathered from the
case company’s internal information management system and with their consent. After
discussing the research methodology, chapter five performs the empirical analysis of the
case study and presents its conclusive results too. The first subchapter discusses the
case company’s aftersales department and its performance standings from the inventory
control point of view. Then the current situation is further analyzed in the view of defined
logistics service levels that include lead time, cost of operations and order delivery qual-
ity. The suggested mode of transportation and the case study’s key question is analyzed
in this subchapter. After this, logistics cost analysis’s result is presented, and other in-
volved challenges and risks are discussed as well.
The last chapter of the thesis presents several viewpoints and concludes the thesis
based on quantitative and qualitative analysis. Another subchapter also summarizes the
discussion and findings effectively and presents a solution to this business case. The
limitations of this study are also explained at the end of this chapter and finally, to further
develop this study other possible topics and ideas are also covered at the end of this
chapter.

6
2. THEORETICAL BACKGROUND
2.1 Managing Logistics Operations
Logistics is generally defined as management of all the operations and activities that
support movement or transportation in order to coordinate supply and demand in the
creation of time and location utility (Heskett, et al., 1973, p. 17). Typically, logistics in-
volves several phases including planning, implementation, and control of goods and in-
formation in order to effectively manage forward and reverse flow from the point of origin
to point of consumption (Riopel, et al., 2005, p. 3). The logistics play a key role in the
whole supply chain value stream which not only handles the forward flow of goods and
information but also controls the reverse flow to satisfy the customer requirements. The
physical flow of goods in logistics may include various types of tangible goods such as
materials, equipment, supplies or other consumable items. From the company’s point of
view, the logistics system is seen as a collection of functional activities that determines
the infrastructure and resources required to maintain the flow of materials and infor-
mation required by the end-customers.
The structure of the logistics network is comprised of three main factors including the
flow of materials, flow of information and time taken to fulfill customer demand (Harrison,
2014, p. 1). The overall scope of the logistics network depends on organizational busi-
ness nature, organizational functions, products, and services. A typical example of logis-
tics flow is shown in figure 1 below.
Figure 1. Logistics Flow (Adopted from Harrison, 2014, p. 1).

7
The figure above presents a visual image of the overall logistics flow. The material flow
relates to the transportation of physical goods from the suppliers to the end-customers,
but the information flow is given from the end-customers in the form of demand data to
the suppliers. However, the time dimension is also critical in the logistics flow because it
reflects the network speed that responds to the demand originating from the end-cus-
tomer (Harrison, 2014, p. 13). That is why in the field of logistics management, it is im-
portant to control the reverse and forward flow of goods and information because of the
complexity involved. As argued by (Everaert, et al., 2008) in today's simplified globe,
cost-effectiveness in logistics has become a requirement, so logistics management not
only integrates the supply and demand but also required to improve business efficiency.
2.1.1 Logistics Activities, Functions, and Networks
The logistics functions are dependent on the nature of the organization's business, its
production process, location and distribution centers (Ghiani, et al., 2013, p. 5). In gen-
eral, the logistics functions are comprised of order processing, inventory control, trans-
portation, warehousing, material handling, and packaging. The table 1 below summa-
rizes the activities involved in logistics management.

8
Activities Description
Order Processing The process starts when the order is received from a customer and sub-
mitted to the central warehouse, if out of stock, request for new materials
sent to the suppliers.
Inventory Control It involves the supervision of supply and storage and ensuring that ade-
quate goods and materials are available without over-supply.
Transportation The physical movement of goods from warehouse to customer location
(finished goods) or from supplier to the warehouse (raw-materials), dif-
ferent modes of transportation exist including by road, railways, shipping
container lines and by air-freight.
Warehousing Purpose of warehousing to facilitate the storage and easy delivery for
incoming and outgoing goods, location of warehouse plays a vital role
and operating a warehouse requires special knowledge.
Material Handling It involves handling the materials at the warehouse, incoming goods are
stored in relevant location and outgoing goods are inspected and pre-
pared for shipping
Packaging It involves packing the finished goods and arranging them in shipment
pallets in a way to avoid transport damages and utilizing maximum avail-
able capacity
Table 1 above provides a short overview of the main functions involved in logistics man-
agement (Farahani, et al., 2011, p. 45). In recent years, the customer supply chain has
been acting dynamically and restructured the operating environment of logistics. The
functions of logistics from Table 1 mainly includes the allocation of resources, utilizing
technology and labor to meet certain goals, but this strategy is highly dependent on the
links within the supply chain network.
According to (Ghiani, et al., 2013, p. 5), there are also some aspects of logistics and
involved activities depending on the location of organizational business units. Some of
these logistics aspects include supply logistics, internal logistics, distribution logistics,
and external logistics which are explained below.
• Supply logistics refers to managing upstream suppliers and incoming raw mate-
rials.
Table 1. Logistic Functions (Adopted and modified from Farahani, et al., 2011, p. 45)
9
• Internal logistics relates to picking, storing and handling parts within factory or
warehouse premises (Ghiani, et al., 2013).
• Distribution logistics includes the task of distributing the finished goods to the
downstream tier 1 customers (Harrison, 2014).
• External logistics is the concept consisting of activities collectively from supply
logistics and distribution logistics.
As per the viewpoints, it is realized that the scope of this research lies within the bound-
aries of supply logistics. In order to proceed efficiently with the supply logistics, key play-
ers in today’s business environment have realized the importance of supply network
planning, partnering distribution activities with expert organizations (Peng, et al., 2011).
A supply network typically consists of a focal firm being connected to other entities of
supply chain involving a series of activities which is extended beyond the organizational
boundaries. As the flow of material typically moves from downstream and simultaneously
the information is sent upstream to maintain coordination. In the logistics system, MTO
(Make to Order) phenomenon is also used when a certain is directly received from cus-
tomers which triggers the production activities at the manufacturer to meet that demand.
On the contrary, the concept of MTS (Make to Stock) refers to forecasting and recording
demand in advance to produce according to which therefore affects distribution logistics
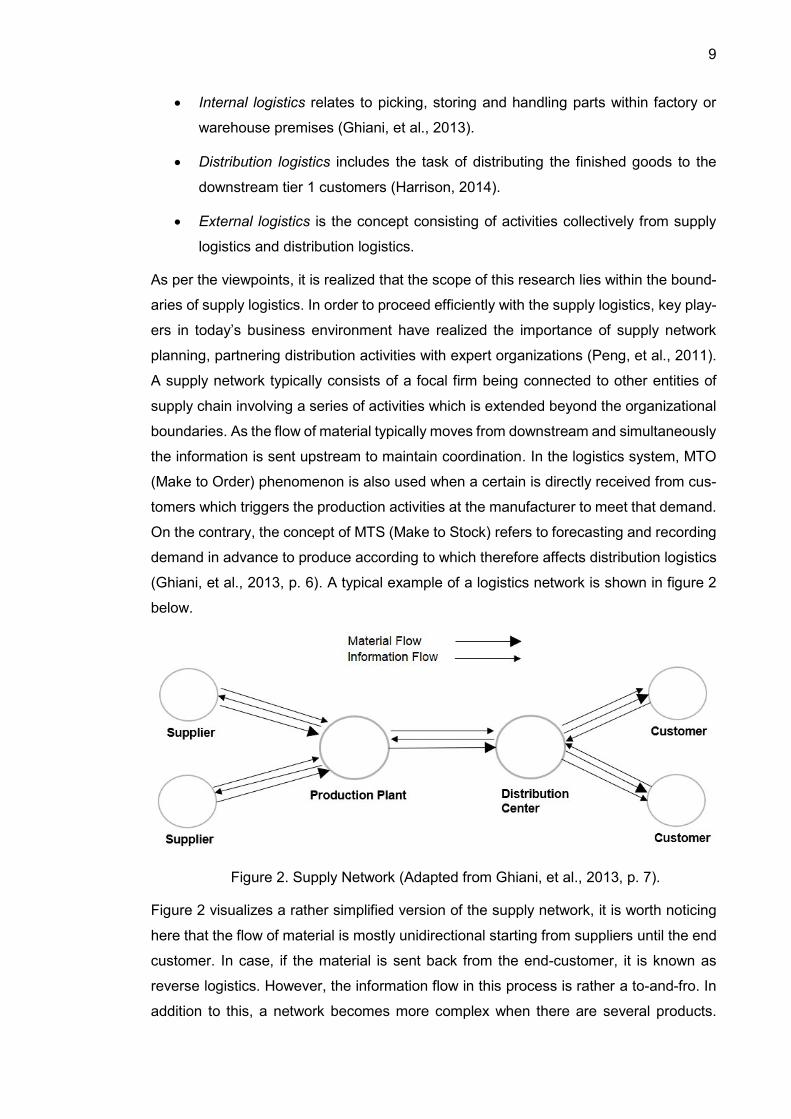
(Ghiani, et al., 2013, p. 6). A typical example of a logistics network is shown in figure 2
below.
Figure 2 visualizes a rather simplified version of the supply network, it is worth noticing
here that the flow of material is mostly unidirectional starting from suppliers until the end
customer. In case, if the material is sent back from the end-customer, it is known as
reverse logistics. However, the information flow in this process is rather a to-and-fro. In
addition to this, a network becomes more complex when there are several products.
Figure 2. Supply Network (Adapted from Ghiani, et al., 2013, p. 7).

10
Companies, in that case, utilize ABC product classification (Ghiani, et al., 2013, p. 7) to
subdivide the product into several categories. Since the case company in question has
thousands of products, therefore, it is widely using ABC classification to manage inven-
tory. The main reason behind classifying inventory is to set service levels (Teunter, et
al., 2010) by assigning service levels for each class which typically is measured by rev-
enue generated by each class in a referent time span (Ghiani, et al., 2013, p. 7). Class
A usually consists of goods that account for 80% of the income generated and Class B
constitutes 15% while Class C products contribute to the rest of the 5% revenue. From
these concepts, it can be said that different modes of logistics and inventory control
measures should be taken for each inventory class (Ghiani, et al., 2013, p. 8). Hence,
the infrastructure of logistics becomes an important factor for success (Chow, et al.,
2006).
When it comes to designing logistics infrastructures, many researchers have tried to op-
timize the communication process, distribution problems and supply network efficiency
(Hokey & Sean, 1994) and transportation multiple mode evaluation and selection
(Vannieuwenhuyse & Pintelon , 2003). Another contribution to this was made by Srini-
vasa in 2001 (Chow, et al., 2006) who introduced a business intelligence tool to improve
the efficiency of warehousing database management especially for larger companies
dealing with bigger volumes. The tool helps to visualize analytics involved in logistics,
deeply examine the logistics function and converts this information into actionable
knowledge which can help to improve the functioning of warehousing and transportation
management.
Despite the technological improvements, operating a facility or warehouse not only re-
quires specialized skills but also poses threats and risks of property losses, causalities,
and natural disasters. Other contingencies such as equipment breakdown, power out-
ages and strikes can also lead to facility disruptions. Hence, the infrastructure of logistics
becomes an important factor for success (Chow, et al., 2006) and once a supply chain
network is designed and infrastructure is built, it is costly to modify it afterward (Peng, et
al., 2011). Therefore, to cope with the daily operational decision making for warehouse
efficiently, many organizations turn to experienced third-party logistics service providers
(3PL) to handle warehousing and decision making related to transportation and material
handling (Chow, et al., 2006). A 3PL service provider acts as an external supplier that
manages, delivers and coordinates logistics activities with the customer on behalf of the
shipper (Hertz & Alfredsson, 2003).
There are typically two types of 3PL service providers namely asset-based and non-
asset-based service providers. Asset-based service providers own the property that runs
11
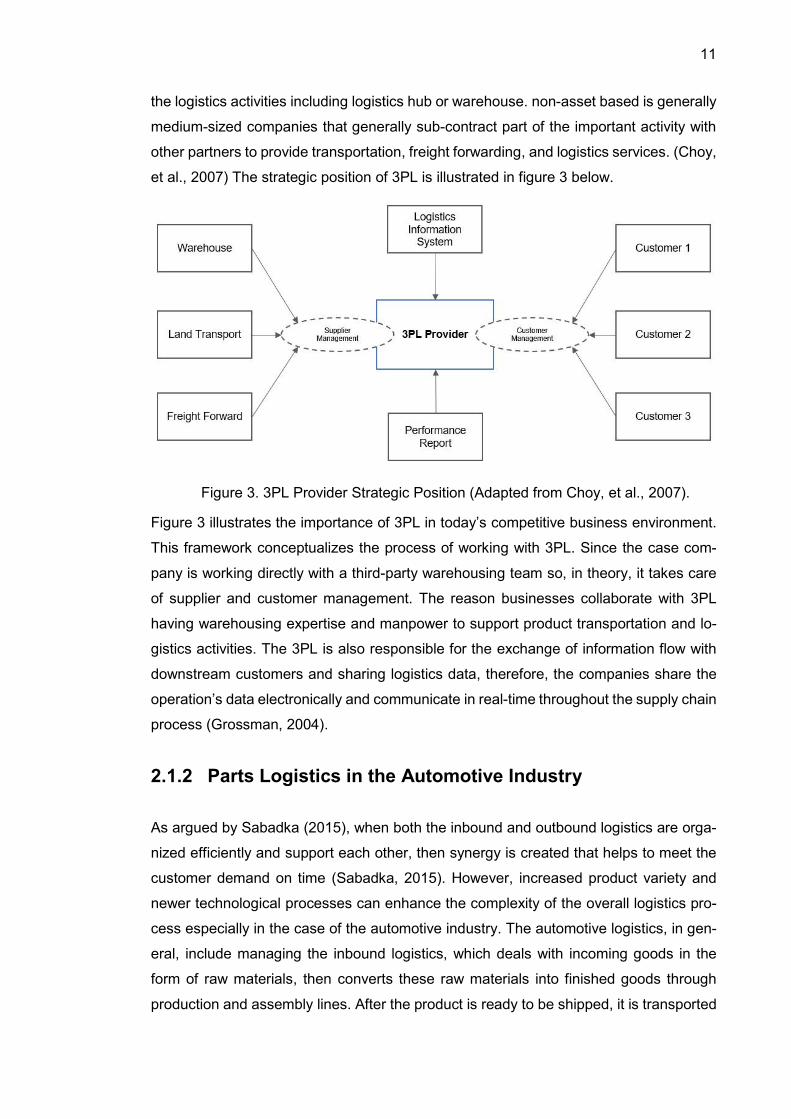
the logistics activities including logistics hub or warehouse. non-asset based is generally
medium-sized companies that generally sub-contract part of the important activity with
other partners to provide transportation, freight forwarding, and logistics services. (Choy,
et al., 2007) The strategic position of 3PL is illustrated in figure 3 below.
Figure 3 illustrates the importance of 3PL in today’s competitive business environment.
This framework conceptualizes the process of working with 3PL. Since the case com-
pany is working directly with a third-party warehousing team so, in theory, it takes care
of supplier and customer management. The reason businesses collaborate with 3PL
having warehousing expertise and manpower to support product transportation and lo-
gistics activities. The 3PL is also responsible for the exchange of information flow with
downstream customers and sharing logistics data, therefore, the companies share the
operation’s data electronically and communicate in real-time throughout the supply chain
process (Grossman, 2004).
2.1.2 Parts Logistics in the Automotive Industry
As argued by Sabadka (2015), when both the inbound and outbound logistics are orga-
nized efficiently and support each other, then synergy is created that helps to meet the
customer demand on time (Sabadka, 2015). However, increased product variety and
newer technological processes can enhance the complexity of the overall logistics pro-
cess especially in the case of the automotive industry. The automotive logistics, in gen-
eral, include managing the inbound logistics, which deals with incoming goods in the
form of raw materials, then converts these raw materials into finished goods through
production and assembly lines. After the product is ready to be shipped, it is transported
Figure 3. 3PL Provider Strategic Position (Adapted from Choy, et al., 2007).
12
to the distribution center and shipped to local and international car dealers. In today’s
competitive business environment, the market pressure is intense which leads to chang-
ing customer needs and increased product individualization. This market behavior is no-
ticed more in the automotive industry and is expected to grow more in the near future
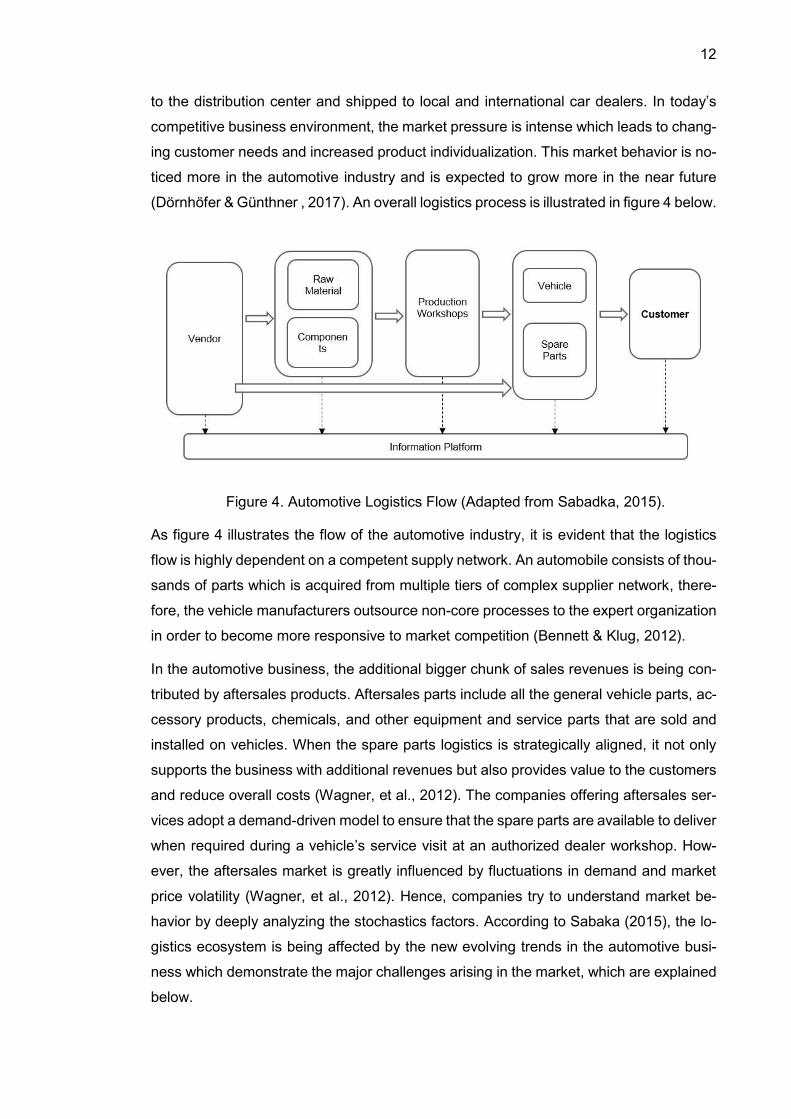
(Dörnhöfer & Günthner , 2017). An overall logistics process is illustrated in figure 4 below.
As figure 4 illustrates the flow of the automotive industry, it is evident that the logistics
flow is highly dependent on a competent supply network. An automobile consists of thou-
sands of parts which is acquired from multiple tiers of complex supplier network, there-
fore, the vehicle manufacturers outsource non-core processes to the expert organization
in order to become more responsive to market competition (Bennett & Klug, 2012).
In the automotive business, the additional bigger chunk of sales revenues is being con-
tributed by aftersales products. Aftersales parts include all the general vehicle parts, ac-
cessory products, chemicals, and other equipment and service parts that are sold and
installed on vehicles. When the spare parts logistics is strategically aligned, it not only
supports the business with additional revenues but also provides value to the customers
and reduce overall costs (Wagner, et al., 2012). The companies offering aftersales ser-
vices adopt a demand-driven model to ensure that the spare parts are available to deliver
when required during a vehicle’s service visit at an authorized dealer workshop. How-
ever, the aftersales market is greatly influenced by fluctuations in demand and market
price volatility (Wagner, et al., 2012). Hence, companies try to understand market be-
havior by deeply analyzing the stochastics factors. According to Sabaka (2015), the lo-
gistics ecosystem is being affected by the new evolving trends in the automotive busi-
ness which demonstrate the major challenges arising in the market, which are explained
below.
Figure 4. Automotive Logistics Flow (Adapted from Sabadka, 2015).

13
• Customer Expectation: One of the most important logistics objectives is to sat-
isfy customer needs, however, customer expectations are increasing and to im-
prove logistics service is becoming even more challenging.
• Networked Economy: Nowadays the increased vertical supply chain collabora-
tion is certainly offering greater benefits but it also challenging to integrate an
organization’s processes and systems.
• Cost Pressure: Total logistics cost has become a performance indicator of sup-
ply chain efficiency (Zeng & Rossetti, 2003). Hence, companies must put effort
into decreasing their logistics costs.
• Globalization: If the logistics infrastructure is not efficient in this globalization
era, then the resulting logistics’ costs and service level will be negatively influ-
enced especially in the emerging markets.
• Demand Volatility: The volatility in demand is a crucial element for the aftersales
business, that’s why most of the companies try to forecast demand to reduce risk.
However, the volatility is also triggered by the economic or political crises in one
part of the world and affects globally.
• New Technology: Companies have realized the importance of analyzing and
utilizing data to plan better and control outcomes. Therefore, investments must
be made to acquire newer technologies and analytical tools.
• Risk and Disruption: In a business environment, external and internal risks are
always present. Organizations are trying to seek effective proactive and reactive
approaches for risk mitigation.
Trends of the automotive industry highlighted by Sabadka (2015) speaks about the future
logistics landscape. The organizations are also trying to research and develop mitigation
strategies to cope up with these challenges. Many manufacturers are trying to centralize
inventories and warehouses to benefit from the economies of scale. Other companies
are trying to strategically align their spare parts logistics with organizational structure,
systems, and supply network (Wagner, et al., 2012). To counter challenges, organiza-
tions are refining their transportation modes enhanced use of technology to product flow
and communication in the logistics (Sabadka, 2015).
Another important area in the aftersales automotive business is reverse logistics. It is
defined as the reverse flow of goods to the upstream suppliers for various reasons in-
cluding transport damages, warranty parts, repairs and mis-shipments (Harrison, 2014,
p. 163). Managing reverse logistics efficiently is one of the performance indicators of
14
logistics service levels. Despite the challenges in managing reverse logistics including
difficult forecasting, additional transport costs, less visibility, and other issues, it is im-
portant to incorporate reverse flow policy into the logistics system. Harrison (2014, p.
164) suggests approaching reverse logistics as a business opportunity by designing for
recycling and commercial returns which will reduce negative market impact and may add
up additional revenues. The case company x is also utilizing the option of taking a com-
mercial return from customers for the aftersales parts, the buying-back price is reduced
by 10% which adds additional profit for the company and return service for the custom-
ers.
In conclusion, the logistics involve both the movement of parts and information from the
point it originated to the point it is consumed. From the case company’s perspective,
which is the automotive industry, it is important to prepare for the upcoming challenges
and future trends which include meeting customer expectations, opportunities to explore
logistics cost and preparation of demand volatility. This section of the chapter provided
adapt knowledge regarding the management of logistics and its functions.
2.2 Service levels in logistics
A service level acts like a mutual agreement between two parties to deliver certain ser-
vice which is usually measurable. A logistics service level (LSL) covers a wide range of
logistics performance in order to satisfy customers (Ghiani, et al., 2013, p. 13). The ser-
vice levels are connected to various factors including the on-time-delivery, promotional
offers and pricing, communication and other collective marketing mix characteristics. In
a competitive business environment, the efficiency of logistics activity will impact the
customer service offered. In these circumstances, the logistics service level becomes a
vital instrument to gain customer satisfaction and then ultimately their loyalty (Miricesu,
2013). A product is generally a combination of physical items combined with its service
offered. Typically, the physical product is influenced by R&D and marketing. On the con-
trary, the service of the product refers to the logistics service level (Harrison, 2014, p.
18).
2.2.1 Objectives of Logistics Service Levels and Customer Ser-
vice Quality
The customer service in logistics is reviewed from multiple pieces of literature to truly
understand its meaning and objectives that define the overall logistics service levels. The
first viewpoint regarding logistics customer refers to it as a powerful competitive tool
15
(Miricesu, 2013). If there is fierce market competition, then product mix, pricing policies,
and marketing campaigns can be imitated by competitors. However, companies can turn
this customer service tool into gaining a competitive advantage because offering reliable
logistics service levels are more durable. Another viewpoint adds that the customer ser-
vice in logistics refers to a set of sales chain activities which are executed to meet cus-
tomer needs (Miricesu, 2013). Another perspective demonstrates the logistics service
level about ensuring that the products are available for the customer at the right time in
the right quantity (Gattorna & Martin, 1990). Therefore, the logistics service can be de-
fined as...
“providing customer service to satisfy end-user demand through supplying the right prod-
uct, in the right form and at the right time” (Harrison, 2014, p. 18).
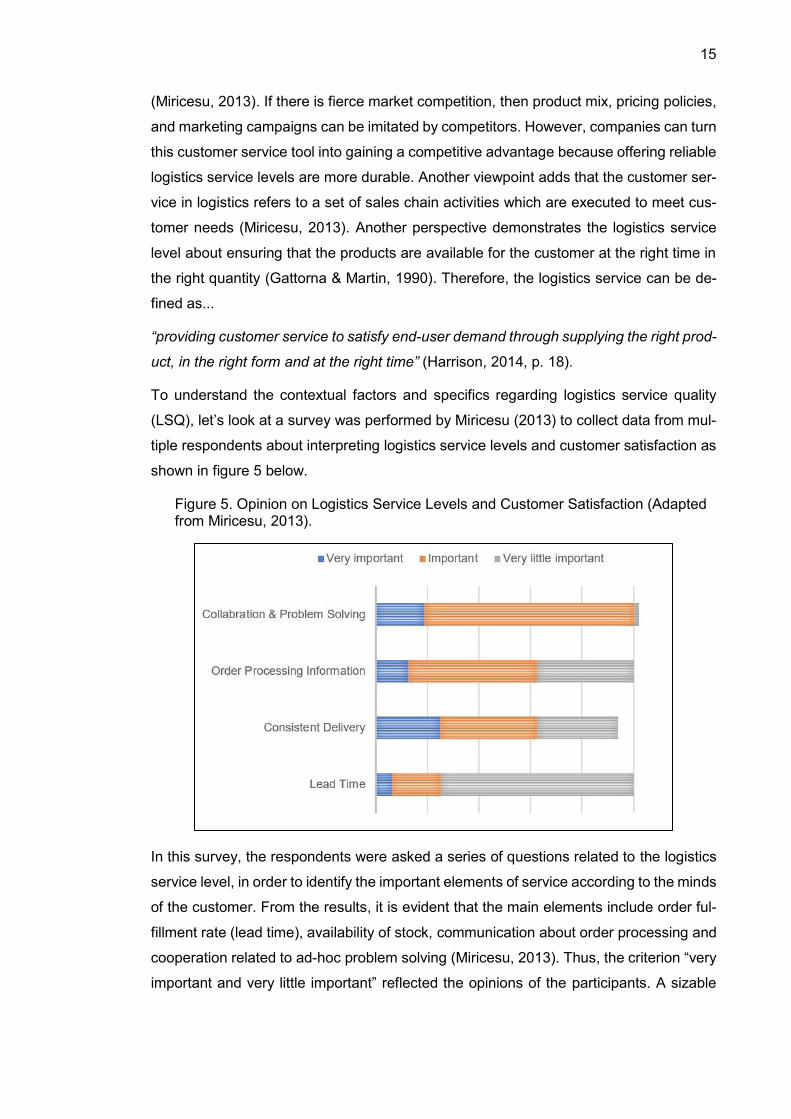
To understand the contextual factors and specifics regarding logistics service quality
(LSQ), let’s look at a survey was performed by Miricesu (2013) to collect data from mul-
tiple respondents about interpreting logistics service levels and customer satisfaction as
shown in figure 5 below.
In this survey, the respondents were asked a series of questions related to the logistics
service level, in order to identify the important elements of service according to the minds
of the customer. From the results, it is evident that the main elements include order ful-
fillment rate (lead time), availability of stock, communication about order processing and
cooperation related to ad-hoc problem solving (Miricesu, 2013). Thus, the criterion “very
important and very little important” reflected the opinions of the participants. A sizable
Figure 5. Opinion on Logistics Service Levels and Customer Satisfaction (Adapted from Miricesu, 2013).

16
population believed to be quicker delivery and collaboration as the most essential ele-
ments in the service level.
The literature discussed in the above section explained the concept of logistics service
levels. Interesting to note here is that, the elements defined in the logistics service levels
such as lead time, consistent delivery, order processing information and customer col-
laboration is realized by the case company’s logistics unit in theory as well, but before
there was no specific definition of logistics service levels so the concept has been
vaguely understood by the logistics unit in past.
Furthermore, a concept of logistics service quality (LSQ) is widely used in logistics, it is
a measure of the extent to which the customer is experiencing the logistics service levels
against their expectations In terms of modeling, service quality has been identified as
having five characteristics from a global perspective (Parasuraman, et al., 1988).
1. Reliability
2. Reactivity
3. Safety
4. Empathy
5. Tangible elements
This model explains that perceived is the difference between two scales including per-
ception versus received results. Different researchers have tried to explain the concept
of logistics service quality; however, recent studies show that the most important com-
ponent in logistics service quality is on-time delivery, accuracy, and quality of order
(Saura , et al., 2008). Finally, information and communication technology (ICT) plays a
great role especially in the context of logistics service quality. Nowadays, enterprises are
using multiple resource planning software and advance electronic data interchange
which enables companies to share real-time accurate data within the supply network.

17
The quest to becoming competitive in the market is achieved by creating inter-organiza-
tional information systems to share updated information (Saura , et al., 2008). An overall
model logistics service quality is illustrated in figure 6 below.
Figure 6 illustrates a model developed by Saura et al. (2008), as per this model the
researchers have proved a hypothesis for LSQ which is defined as following…
“LSQ has a direct and positive impact on customer satisfaction, then from cus-
tomer’s satisfaction comes the loyalty. The impact of LSQ is significantly higher
when ICT is widely used and builds a strong relationship within the supply net-
work”.
Considering the hypothesis and service quality model provided in the above section, it
typifies the idea for the research question “what developments are needed to improve
logistics service quality”? It is now more evident from the above discussion that the lo-
gistics service quality can be increased from improving the order delivery quality and
timeliness. The overall order quality includes the personnel quality, to receive adequate
support from competent personnel; information quality, communication about order arri-
val date and visibility. Thus, from a conceptual point of view, we can draft the objectives
of LSL as elements needed to provide excellent logistics service to its customers. These
Figure 6. Service Quality Model (adapted and modified from Saura, et al., 2008).
18
elements mainly consist of timely delivery and order quality and moreover, with the use
of the right ICTs the resulting relationship with a customer will be much stronger.
2.2.2 Evaluation of Service Levels
The logistics team usually strive to provide the highest service level possible to the cus-
tomer at the lowest cost. A type of adequate service is usually dependent on organiza-
tional setup and customer environment. Hence, organizations contemplate the level of
service to be offered and for all customers, it doesn't have to be at the same level. It is
generally a considered notion that improving the level of service increases the cost, for
example, increasing the possibility to deliver goods through multiple modes of transpor-
tation might increase the company’s flexibility but also can potentially increase the costs.
Therefore, to reach an optimum level where quality is good enough but cost as low as
possible at the same time is important.
In order to find optimum service levels and improve quality, it is important to answer the
research question “how to evaluate the logistics service levels”? Generally, before taking
any decision it is important to assess the levels of logistics service in the current versus
proposed scenario. Based on the literature reviewed in the section above, this section
will further deepen the concept of LSQ and how companies are leveraging their LSQ to
gain competitive advantage.
At first, when organizations try to push a new product into the market, it focuses on its
R&D and marketing efforts. Later logistics comes into picture from ensuring the availa-
bility of parts to other customer services. These logistics services are not only advanta-
geous to the parent organization and its customers, but it also benefits the supply value
chain stream. When it comes to defining logistics advantages, it means that the organi-
zation needs to set clear goals, which are measurable and quantifiable (Harrison, 2014,
p. 18). According to Harrison (2004), these advantages are usually hard objectives and
it includes time, cost and quality.
The Time Advantage
The time measure refers to “lead time” which is defined as the time a customer needs to
wait until the order is delivered. Generally, a lead time is considered from the moment
an order is placed to the moment it is received by the customer (Harrison, 2014, p. 19).
However, important to note here is that these lead times can vary from zero to several
months. In case of the automotive industry, regular running stock-orders are usually
available in inventories to immediately deliver it to the customers. On the other hand, if
there is a new product model introduced or innovated, then it might take several weeks
19
or even months to make the product available for the market. As argued by Miricesu
(2013), the order fulfillment time (lead time) ranks second among the important elements
to provide higher LSL. Therefore, competing on time is like the survival of the fittest
(Harrison, 2014, p. 19).
Since lead time is an absolute figure which is also measurable, the shortening product
lifecycle and requirement of shorter-delivery times have pushed the company’s manag-
ers and leaders to develop new strategies and solutions to overcome this challenge.
Hence, managers have realized the importance of efficient supply networks and new
logistics approaches as a solution to this problem. One of the significant drivers to ensure
competitive benefits in meeting customer demand is to establish a network of business
relationships throughout the supply chain (Bianchini, et al., 2019). Therefore, once a
company manages to reduce time-to-market a product or service, it not only provides
excellent LSL to its customers but also generates positive and quicker cash flow for itself.
The Quality Advantage
The basic principle of managing logistics is to ensure that the end-product reaches its
destination and does its jobs what it was supposed to do. Since quality is an easily inter-
pretable and highly visible aspect of logistics. Therefore, any misadventure in the logis-
tics that can cause defects, inaccurate or late delivery are quite easily identifiable. These
problems affect negatively to the end-users and hurt the LSL (Harrison, 2014, p. 18).
Based on the literature reviewed in the previous sections, it is fair to say that the quality
of service is concerned with delivering the right product in the right quantity while sharing
the order information with the customers. Also, it was concluded by Miricesu (2013) in
the logistics survey, that cooperation in solving problems and offering a variety of delivery
services for the customers proved to be a “really important” criterion to assess the LSL
from a customer perspective.
A study done on the LSQ by Saura et al. (2008) has reviewed previous works of literature
to explore different dimensions of the quality and benefits it can offer to its customers
and the company itself. The aspects of service quality include timeliness, order condition
and accuracy, information quality about order processing, availability, and quality of con-
tact person to receive adequate support (Saura , et al., 2008). In the case of Toyota,
when quality was positioned after the sales and revenue efforts, the brand suffered a
huge loss because of the safety concerns and negative brand image (Harrison, 2014, p.
18). The purchasing decision is made by the end-user and that’s what drives the supply
value chain. Therefore, the logistics service quality has a much bigger impact on overall
business performance and brand image. Logistics service providers who aim to maintain
20
the highest standard of service quality put themselves at an advantage over the rivals
(Harrison, 2014, p. 19).
The Cost Advantage
The logistics process superintends the flow of material, information, and cash. The de-
pendency on the supplier’s and manufacturer’s location, exchange currency and market
situation make logistics as a key element to fulfill customer orders. As argued by Gilmore
(2002), transportation costs are a significant component of corporate expenditures and
the role of logistics is evident when achieving a supply chain excellency (Gilmore, 2002).
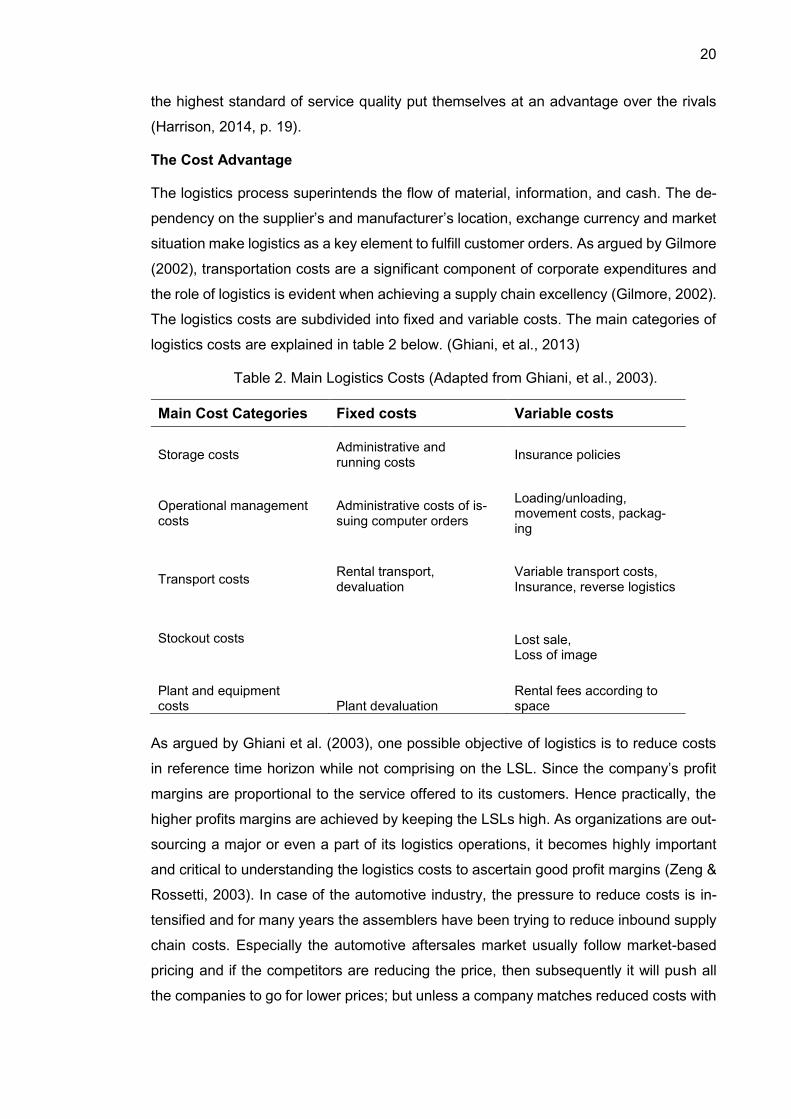
The logistics costs are subdivided into fixed and variable costs. The main categories of
logistics costs are explained in table 2 below. (Ghiani, et al., 2013)
Main Cost Categories Fixed costs Variable costs
Storage costs Administrative and running costs
Insurance policies
Operational management costs
Administrative costs of is-suing computer orders
Loading/unloading, movement costs, packag-ing
Transport costs Rental transport, devaluation
Variable transport costs, Insurance, reverse logistics
Stockout costs Lost sale, Loss of image
Plant and equipment costs Plant devaluation
Rental fees according to space
As argued by Ghiani et al. (2003), one possible objective of logistics is to reduce costs
in reference time horizon while not comprising on the LSL. Since the company’s profit
margins are proportional to the service offered to its customers. Hence practically, the
higher profits margins are achieved by keeping the LSLs high. As organizations are out-
sourcing a major or even a part of its logistics operations, it becomes highly important
and critical to understanding the logistics costs to ascertain good profit margins (Zeng &
Rossetti, 2003). In case of the automotive industry, the pressure to reduce costs is in-
tensified and for many years the assemblers have been trying to reduce inbound supply
chain costs. Especially the automotive aftersales market usually follow market-based
pricing and if the competitors are reducing the price, then subsequently it will push all
the companies to go for lower prices; but unless a company matches reduced costs with
Table 2. Main Logistics Costs (Adapted from Ghiani, et al., 2003).

21
lower transportation costs, that company will eventually go out of business because of
financial crisis (Harrison, 2014, p. 20). To cope with this scenario, companies try to in-
vestigate alternative modes of transportation in order to evaluate its LSL and the behav-
ior of logistics costs in different modes to determine best profit margin possibilities
In conclusion, the logistics service levels are evaluated based on three hard objectives.
First, the time objective, which refers to delivering the product on time. Second, quality
objective means delivering the right product, in the right condition while sharing accurate
order processing information with the customer. Third, the cost objective signifies the
idea to bring the logistics costs down to achieve supply chain excellence. The time and
quality objective are meant to improve the service quality for the customers to affect their
satisfaction positively. The cost objective serves the purpose to reduce the logistics costs
benefiting the internal transportation cost of the case company. From the main cost cat-
egories provided in table 2, only the transportation costs will be analyzed throughout this
research.
2.3 Competing Through Logistics
2.3.1 Logistics Performance Measurement
Market competition always pushes the companies to seek for a differentiation strategy
that can set apart an organization and its offered advantages. No matter how the organ-
ization positions itself in the market with products, it needs to sustain its differentiation
and logistics is a big part of that strategy. It has been on numerous points that “how does
logistics contribute towards gaining competitive advantage”?
Globalization of operations and marketing has given new perspectives to the managers
of today. These new perspectives involve analyzing and investigating the functions of an
organization to assess its performance measure in order to enhance organizational com-
petitiveness (Gunasekaran & Kobu, 2007). When it comes to analyzing the system per-
formance, a combination of qualitative and quantitative tools is used to measure perfor-
mance adequately. Developing an adequate performance measurement system (PMS)
becomes more difficult when it includes the overall scope, product variety, and involved
entities. In case of supply chain logistics, the network usually consists of four levels (sup-
ply, manufacturing, distribution, end-user). However, the complexity of performance
measurement is intense because each level’s system of interest and physical facilities
are different (Beamon, 1999). Hence, selecting supply chain logistics performance
measures are critical to avoid vagueness.
22
The performance measurement as defined by Gunasekaran & Kobu (2007), is the pro-
cess of taking regular measurements in order to quantify the effectiveness and efficiency
of any program or action. However, the term ‘metric’ relates to the definition of measure.
As for as the calculation of metric is concerned, it depends on who is calculating and
how information is acquired (Neely, et al., 1995). The metric of supply chain logistics can
also be subdivided into four categories including cost, quality, time and diagnostic meas-
ure (Bagchi, 1996). According to Bagchi (1996), the four categories of the framework is
a useful tool for different decision-makers of any organization such as operational, tacti-
cal and strategic. Despite the research done on supply chain performance measurement,
it still does not provide a clearer idea of what metrics to choose for an organization’s
supply chain.
As argued by Gunasekaran & Kobu (2007), it is of utmost importance to choose supply
chain metrics that are practical, measurable, reliable and comparable to other competi-
tors in the same industry. The viewpoint of Beamon (1999) which identified metrics for
SC which naming resource, output, and flexibility, the viewpoint is, that a set of reliable
metrics are required which can avoid repetition in the calculation and provide effective
feedback on performance areas.
A good performance measurement tools in supply chains play an important role for the
management to make decisions and take actions. Also, it improves the collaboration
between the involved entities and involves transparent communication which increases
the overall business efficiency (Gunasekaran & Kobu, 2007). Although the availability of
logistics performance metrics is limited, few researchers have tried to explain the pur-
pose and ways to deal with supply chain performance measurement and metrics. Bea-
mon (1999) after analyzing multiple kinds of literature, developed a framework that con-
sists of three most important parameters in supply chain performance measurement.
Each of these three parameters including resource, output, and flexibility has different
goals and covers the overall scope, as presented in Table 3 below.

23
Performance Measure Type
Goal Purpose
Resource Increase efficiency Better resource utilization to increase profitability
Output High level of customer service Without standard output, customers will turn to other supply chains
Flexibility Responsiveness to changing environment
In an uncertain environ-ment and risks the logistics ability to respond
Table 3 presents the supply chain performance metrics which includes three parameters.
First, the resource refers to inventory levels (including safety stock), qualified personnel,
equipment usage, and cost. The efficiency measures the utilization of the resources in-
volved in the logistical process. Therefore, one goal of performance measures is to check
if any of the resources are under-utilized (Beamon, 1999). Examples include transporta-
tion costs, safety stock value, return on investment, space utilization. Second, Output
refers to the quality of service received by the customers. Comparing to previously dis-
cussed literature from Saura, et al. (2008) the service quality closely relates with ele-
ments identified in the category “Output” by Beamon (1999) which includes customer
satisfaction, information about order processing and on-time delivery. Examples include
total sales revenue, fill rate, on-time delivery, estimated order arrival time. Third, flexibility
is the measure of a system’s ability to handle fluctuations in demand and supply. An
example includes the ability to reduce backorders, handling emergency orders and oth-
ers. These three parameters have a different set of goals but each of them is vital to
overall performance improvement. The interrelationship between these three parameters
is illustrated in figure 7 below.
Table 3. Supply Chain Performance Measurement (Adapted from Beamon, 1999).

24
As illustrated in figure 7, at least one of the performance measurement parameters
should be adopted by the organization when aiming for supply chain performance im-
provement. Furthermore, Beamon (1999) argues that the measure of flexibility is more
complex and depends on the context and scope of supply chains. Since the operational
objectives are demonstrated by the resource and output, but the flexibility refers to the
potential of logistics. Flexibility has multiple dimensions and can be used to measure
other objectives such as volume and delivery (Slack, 1983) and the same can be applied
to the ability to deliver via multiple modes of transportation.
The delivery and volume flexibility can also be fulfilled if the supplier can ship the mate-
rials through different modes of transportation. In case when there is increased demand
emerging from the customers, then the ability to deliver the emergency orders forward,
the ability to handle fluctuations in volume, can be satisfied by offering transportation
through different modes. Whether or not, offering multiple modes of transportation is
beneficial for the organization’s LSLs, it certainly can be described as an ability to handle
volume and delivery flexibility.
2.3.2 Managing Freight Transportation
Freight transport structures and activities have become crucial steps in logistics planning.
The effect of globalization, lowest-cost purchasing and changing market behavior had
an adverse effect on the rate of information and material flows across the supply chains.
The importance of freight transport planning is mainly based on two important reasons.
First, freight is comprised of the key part of the total logistics costs (usually between one-
third to two-thirds). Second, chosen freight service has a direct impact on delivery time
and LSQ (Ghiani, et al., 2013, p. 318). The quest for efficient and reduced-cost transpor-
tation is more evident on long-distance through international routes where economies of
scale are important to remain profitable (Beresford & Pettit, 2017, p. 1).
Figure 7 Interrelationship of supply chain performance metrics (Adapted from Bea-mon, 1999).
25
Freight transport includes multiple entities such as the suppliers, who either manufacture
the good or acquire from someplace else; the carriers, which provides the logistics ser-
vice to transport the material at the customer’s location, and government is also involved,
which create the policies and logistics infrastructures at the regional and international
level (Ghiani, et al., 2013, p. 318).
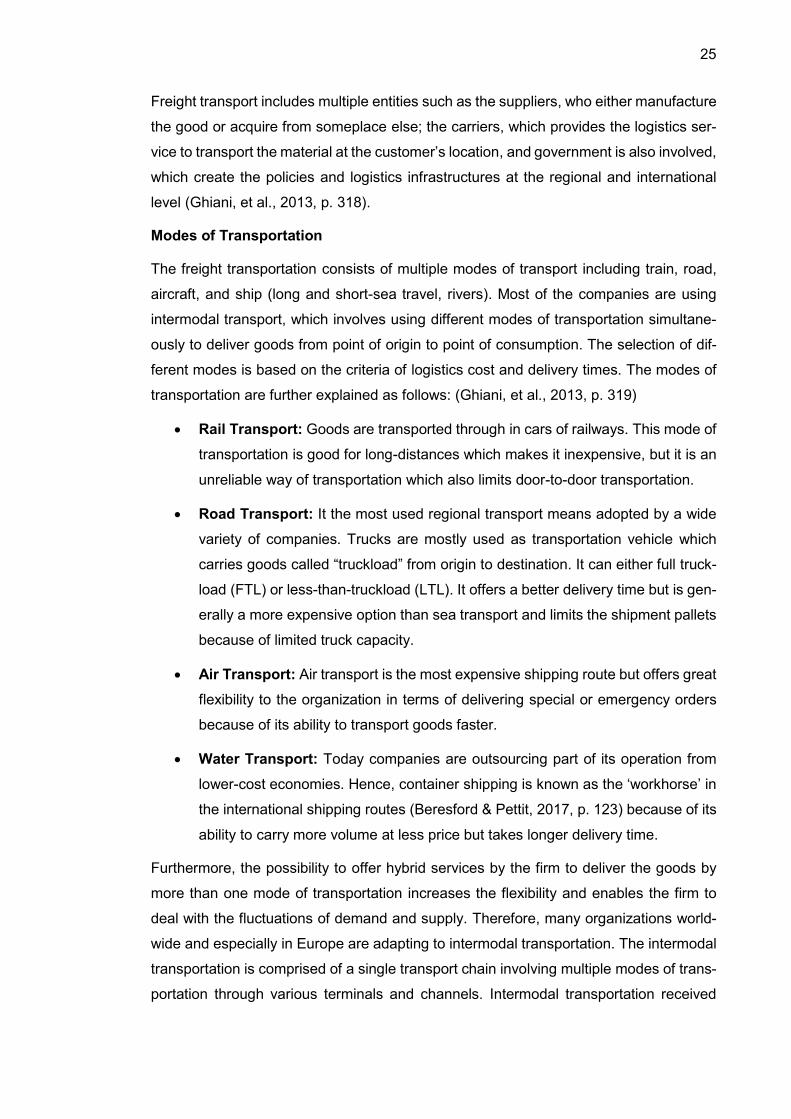
Modes of Transportation
The freight transportation consists of multiple modes of transport including train, road,
aircraft, and ship (long and short-sea travel, rivers). Most of the companies are using
intermodal transport, which involves using different modes of transportation simultane-
ously to deliver goods from point of origin to point of consumption. The selection of dif-
ferent modes is based on the criteria of logistics cost and delivery times. The modes of
transportation are further explained as follows: (Ghiani, et al., 2013, p. 319)
• Rail Transport: Goods are transported through in cars of railways. This mode of
transportation is good for long-distances which makes it inexpensive, but it is an
unreliable way of transportation which also limits door-to-door transportation.
• Road Transport: It the most used regional transport means adopted by a wide
variety of companies. Trucks are mostly used as transportation vehicle which
carries goods called “truckload” from origin to destination. It can either full truck-
load (FTL) or less-than-truckload (LTL). It offers a better delivery time but is gen-
erally a more expensive option than sea transport and limits the shipment pallets
because of limited truck capacity.
• Air Transport: Air transport is the most expensive shipping route but offers great
flexibility to the organization in terms of delivering special or emergency orders
because of its ability to transport goods faster.
• Water Transport: Today companies are outsourcing part of its operation from
lower-cost economies. Hence, container shipping is known as the ‘workhorse’ in
the international shipping routes (Beresford & Pettit, 2017, p. 123) because of its
ability to carry more volume at less price but takes longer delivery time.
Furthermore, the possibility to offer hybrid services by the firm to deliver the goods by
more than one mode of transportation increases the flexibility and enables the firm to
deal with the fluctuations of demand and supply. Therefore, many organizations world-
wide and especially in Europe are adapting to intermodal transportation. The intermodal
transportation is comprised of a single transport chain involving multiple modes of trans-
portation through various terminals and channels. Intermodal transportation received

26
good support and initiative programs launched by the European Commission’s Direc-
torate. Within this transportation model, the freight is not handled directly but instead, the
loading units are only transferred from one mode to another via specified terminals
(Nossack & Pesch, 2013). The CCX is also using intermodal transportation which is
known as ‘fishyback and birdyback’ transport options because it involves ship-truck and
air-truck movement respectively (Ghiani, et al., 2013, p. 323). Intermodal transportation
including LT and LTL is illustrated in figure 8 below.
As illustrated in figure 8, the dotted line represents Less-than-truckload which means
that in intermodal transportation some deliveries are combined to deliver full-truckload
(Terminals A and B), but some deliveries are still transported as less-than-truckload (Line
F). As argued by Ghiani et al. (2013), the goal of involving modes of transportation is to
increase the flexibility of suppliers but keeping the costs low.
In case of the automotive industry, the mode of transportation is subject to a lot of exter-
nal pressure. Depending on the location of suppliers, manufacturing plants, warehouses,
and customer locations, the traditional flow of vehicles and aftersales products from East
Asia to Europe are no longer dominating. Instead, a complex approach, diversified fleet,
and agility are required from the automotive companies to meet the demand especially
in the emerging markets (Beresford & Pettit, 2017, p. 171). Therefore, the logistics man-
agers of automotive companies are always questioning the modes of transportation,
whether the selected delivery routes are optimal or the mode of transportation via road
Figure 8. Intermodal LT and LTL Transport (Adopted from Ghiani, et al., 2013, p.322).
27
and air are being handled efficiently? To answer these questions, managers must eval-
uate the LSL in the preferred mode of delivery in order to understand the impact on
customer satisfaction and logistics costs.

28
3. THEORETICAL FRAMEWORK OF LOGISTICS
PERFORMANCE MEASUREMENT AND SER-
VICE LEVELS
In case of the automotive industry, the latest trends and challenges have pushed the
companies to rethink logistics and adopt a holistic performance measurement metrics
(Dörnhöfer, et al., 2016) (Neto & Pires, 2012). The main elements of success in automo-
tive logistics are by enhancing logistics productivity and customer satisfaction. Produc-
tivity is related to the factors of reduced time-to-market product, operational transporta-
tion, and warehouse expenses and increased communication (Dörnhöfer, et al., 2016).
In addition to this, inventory levels including the safety stock are the key within the com-
pany and across supply chains (Wang & Zhang, 2010). However, to highlight the poten-
tial for improvement, a correctly designed PMS is needed. This PMS should be based
on actionable Key Performance Indicators (KPIs) covering the whole process
(Dörnhöfer, et al., 2016). As argued by Dörnhofer et al. (2017), the research on PMS of
automotive logistics is not thoroughly done yet, but despite the research gap, a suitable
PMS can still be developed according to the individual organizational needs and present
literature.
As discussed in the previous chapter, the logistics service level is a mutual agreement
between two parties to deliver service while meeting the criteria of certain factors. The
number of these factors can be large according to organization setup, but according to
previously discussed literature, the most important criteria are lead time, consistent de-
livery, order delivery quality, and customer collaboration. Working with these factors
might be the requirement of the logistics service levels but to improve the efficiency of
these factors comes under the umbrella of logistics service quality. The logistics service
quality has a direct impact on the customer’s satisfaction. Once the satisfaction im-
proves, the loyalty of the customer stays intact.
Considering the above arguments, a theoretical framework is developed in the figure
below that which includes a performance management system incorporated with dis-
cussed service quality objective to evaluate service level. Figure 9 presents the theoret-
ical framework of performance measurement.

29
As shown in the figure above, the case company is offering service to its customers
which include delivering the goods and providing aftersales support. There are several
factors and megatrends which can initiate altering the current service level in order to
handle demand volatility and increase logistics flexibility. In this case, whenever respon-
sible managers have determined the modification needed in the service levels and be-
fore taking actions, the evaluation of logistics service levels is required which is followed
by considering the performance measurement of current versus future state. The perfor-
mance measurement is based on the measurable metrics which include exploring the
logistics performance both from a quantitative and qualitative perspective to understand
the measures correctly. These measures involve digging-deep into three areas of re-
source, flexibility, and quality. Once the metrics are all set and a possibility to measure
them is understood, then the framework suggests looking into logistics key performance
indicators from increasing efficiency and maintains the highest quality point-of-view.
First, in order to investigate the proposed service level properly, it needs to analyze its
effect on process efficiency. The dimensions of logistics efficiency may include cost KPIs,
supervising the logistics works or identifying opportunities for improvement. Second, par-
allel to investigating efficiency, this model suggests examining the effect on quality. Qual-
ity can be subjective and depends on the context and scope of a business case, but this
research focuses on the case company’s perspective which relates to end-products and
process quality. (Dörnhöfer, et al., 2016)
Furthermore, the model also deals with probing into external factors that might or might
not affect the proposed service level in the future. These factors generally pose the risk
on the process such as distance between the suppliers and customer, political situation
Figure 9. Theoretical Framework for Performance Measurement and Service Quality Objectives.

30
of the region, changing customer demand, price fluctuation, and economic risks. Exam-
ining such factors can provide a bird-eye view about the inbound or outbound logistics
costs and its effect on the overall productivity of the process as well. Finally, the model
provides a development phase that investigates the customer’s perspective and tries to
measure its impact on modifying service level on its customers. Whether quantitatively
or qualitatively, probing into understanding customer satisfaction level is important to
sustain their loyalty with the company’s product and services.
In conclusion, the theoretical framework provides a performance measurement system
in order to evaluate LSL. The framework is useful for automotive logistics, which is bro-
ken down into a process module level from the logistics objectives. The concept of eval-
uating service levels incorporates measuring the service quality of the proposed idea
with the conventional logistics target to maintain its highest efficiency and output quality.
In today’s distinct logistical process landscape and complexity of operations, this modu-
lar approach can not only handle process complexities but also facilitate standardization
of service level processes.

31
4. RESEARCH METHODOLOGY AND DATA
4.1 Research Strategy
To understand the complexity and challenges of the real-world problem from the per-
spective of business management, case study research is a widely used research meth-
odology. This research is also related to analyzing the case company’s logistics process
and service levels, thus it qualifies for traditionally naming it as “case study research”.
Case studies are employed to develop a better understanding of complex research and
are generally known as the empirical inquiry that examines a phenomenon or concept
within its real-life context. One of the most common and critical decisions in case study
research is the selection of methods used for research and data collection. Two well-
known methods have existed for years which include qualitative and quantitative re-
search methods.
As said by Matta (2019), qualitative research is good for building the theoretical back-
ground and set grounds for further reasoning and investigation. On the contrary, the
quantitative research method supports the claims made within the research either as
conforming or disconfirming (Matta, 2019). The author further explains that qualitative
research greatly defers from the quantitative research method. The qualitative research
method involves forming a detailed theoretical overview and background related events
which is used to understand the target phenomenon and based on this understanding, a
logical argument and claims are made. On the contrary, quantitative research allows
constructing a model backed by mathematical or statistical analysis. This allows the user
to manipulate data according to the relevant context, but the challenge is to decode the
statistics into local inferences properly. This viewpoint provided by the author deepens
the knowledge related to the qualitative and quantitative research methods why it was
widely used in this research.
Adding to these research methods, another viewpoint is argued by Gummesson (2017)
in the context of case studies, there are five methods to generate data for management
research. These common data gathering methods in management research are existing
material, interviews, questionnaire surveys, and observation and action science
(Gummesson, 2017, p. 215). Table 4 below describes the characteristics of each re-
search method.
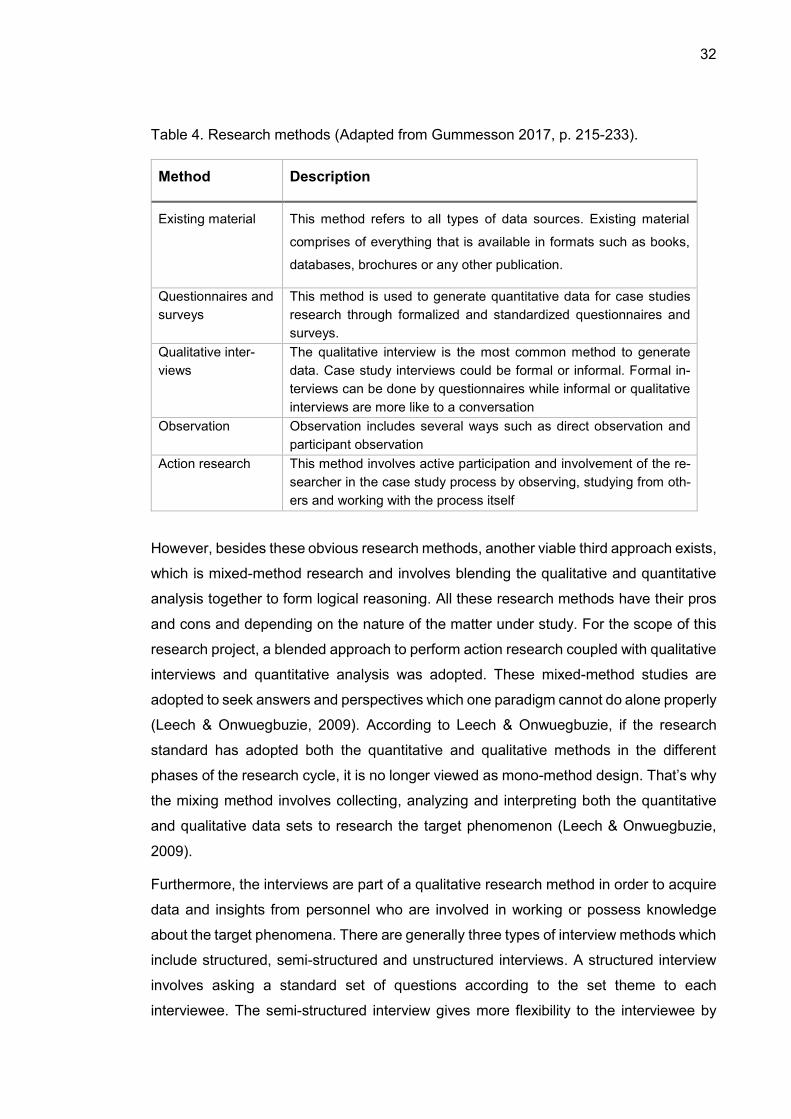
32
Table 4. Research methods (Adapted from Gummesson 2017, p. 215-233).
Method Description
Existing material This method refers to all types of data sources. Existing material
comprises of everything that is available in formats such as books,
databases, brochures or any other publication.
Questionnaires and
surveys
This method is used to generate quantitative data for case studies
research through formalized and standardized questionnaires and
surveys.
Qualitative inter-
views
The qualitative interview is the most common method to generate
data. Case study interviews could be formal or informal. Formal in-
terviews can be done by questionnaires while informal or qualitative
interviews are more like to a conversation
Observation Observation includes several ways such as direct observation and
participant observation
Action research This method involves active participation and involvement of the re-
searcher in the case study process by observing, studying from oth-
ers and working with the process itself
However, besides these obvious research methods, another viable third approach exists,
which is mixed-method research and involves blending the qualitative and quantitative
analysis together to form logical reasoning. All these research methods have their pros
and cons and depending on the nature of the matter under study. For the scope of this
research project, a blended approach to perform action research coupled with qualitative
interviews and quantitative analysis was adopted. These mixed-method studies are
adopted to seek answers and perspectives which one paradigm cannot do alone properly
(Leech & Onwuegbuzie, 2009). According to Leech & Onwuegbuzie, if the research
standard has adopted both the quantitative and qualitative methods in the different
phases of the research cycle, it is no longer viewed as mono-method design. That’s why
the mixing method involves collecting, analyzing and interpreting both the quantitative
and qualitative data sets to research the target phenomenon (Leech & Onwuegbuzie,
2009).
Furthermore, the interviews are part of a qualitative research method in order to acquire
data and insights from personnel who are involved in working or possess knowledge
about the target phenomena. There are generally three types of interview methods which
include structured, semi-structured and unstructured interviews. A structured interview
involves asking a standard set of questions according to the set theme to each
interviewee. The semi-structured interview gives more flexibility to the interviewee by

33
allowing them to set the tone of an interview according to their likeness and discuss a
topic of interest as well. On the other hand, unstructured interviews are quite unrestricted
and informal. Getting the ideas and areas the interviewer wants to investigate is usually
done through a conversation. (Wilson, 2016)
Wilson (2016) argues that the interviews can be done through any medium whether
electronically or face to face. However, the advantage of conducting face to face
interviews is to understand body language and enthusiasm of interviewees as well. To
explore more on how interviews should be done, Beck and Manuel (2008) break down
the interviewing process into steps which include identifying the relevant entities,
deciding the interview medium and schedule, decide the type of interview such as semi-
structured and draft set of questions and pace of the interview. Most importantly
interviewer should have thought ahead of tactics to get useful and critical information out
of the interviewee especially the shy ones (Beck & Manuel, 2008).
Based on the aforementioned literature regarding research methods and qualitative
interviews, the research strategy of this study revolves around the concepts and
procedures that are under-discussed in the current section. Considering the scope of this
project, action research was used for the user to fully participate in the research strategy
and data gathering workshops. To analyze the non-numeric side of this research,
qualitative interviews were arranged with several participants to collect detailed insights
regarding the research topic and case company’s challenges. In addition to this,
quantitative analysis was also performed to verify whether the claims or ideas generated
through the interviews complied with the reality or is the situation is different in general.
In conclusion, the research adopted a multi-method data gathering approach to mix
quantitative and qualitative analyses to generate useful results.
4.2 Research Process
The research process lasted approximately five months which kickstarted from the case
company’s motivation to invest the first month in brainstorming and understanding the
objectives of the study and last month of finishing the reporting. The overall process
briefly comprised of 8-steps, which commenced in the time-span between June till No-
vember of 2019. The steps involved are illustrated in figure 10 below.
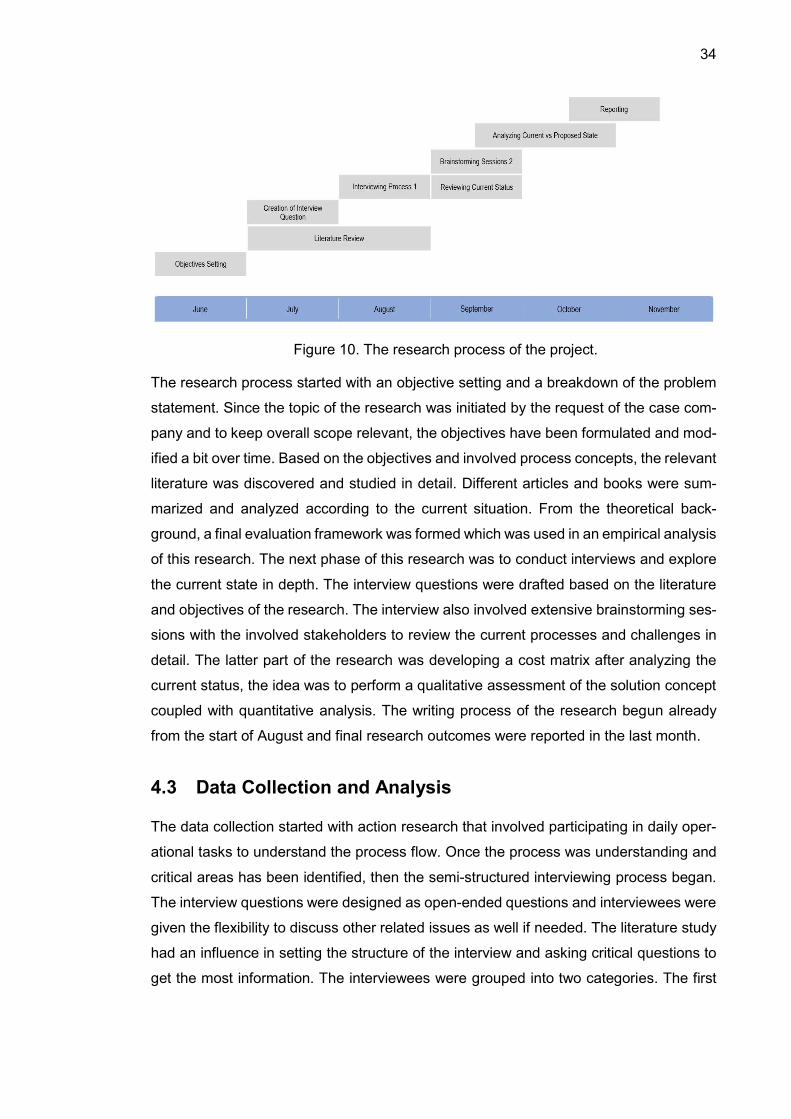
34
The research process started with an objective setting and a breakdown of the problem
statement. Since the topic of the research was initiated by the request of the case com-
pany and to keep overall scope relevant, the objectives have been formulated and mod-
ified a bit over time. Based on the objectives and involved process concepts, the relevant
literature was discovered and studied in detail. Different articles and books were sum-
marized and analyzed according to the current situation. From the theoretical back-
ground, a final evaluation framework was formed which was used in an empirical analysis
of this research. The next phase of this research was to conduct interviews and explore
the current state in depth. The interview questions were drafted based on the literature
and objectives of the research. The interview also involved extensive brainstorming ses-
sions with the involved stakeholders to review the current processes and challenges in
detail. The latter part of the research was developing a cost matrix after analyzing the
current status, the idea was to perform a qualitative assessment of the solution concept
coupled with quantitative analysis. The writing process of the research begun already
from the start of August and final research outcomes were reported in the last month.
4.3 Data Collection and Analysis
The data collection started with action research that involved participating in daily oper-
ational tasks to understand the process flow. Once the process was understanding and
critical areas has been identified, then the semi-structured interviewing process began.
The interview questions were designed as open-ended questions and interviewees were
given the flexibility to discuss other related issues as well if needed. The literature study
had an influence in setting the structure of the interview and asking critical questions to
get the most information. The interviewees were grouped into two categories. The first
Figure 10. The research process of the project.

35
group of respondents included the case company’s internal personnel. The second cat-
egory considers the interviewing session that took place with the 3PL local warehousing
team in Finland. The interviewees were selected based on their ownership and stake in
the logistics process with the CCX. The list of interviewees is shown in table 5 below.
Role Base Office Duration in First
Round (min)
Duration in Second
Round (min)
Interviewee 1 Inventory Controller Espoo 50 45
Interviewee 2 Logistics Helpdesk Espoo 45 30
Interviewee 3 Logistics Manager Espoo 35 15
Interviewee 4 Logistics Officer Espoo 45 30
Interviewee 5 Warehousing Strategy Section Manager
Amsterdam 50
Interviewee 6 3PL Warehousing Supervisor
Vantaa 60 20
Interviewee 7 3PL Warehousing Operation Incharge
Vantaa 60 20
As it is shown in table 5 above, the only exception in these interviews was with the ware-
housing strategy section manager which was conducted through skype audio call and
the rest of the information was shared through emails. However, the other interviews
were conducted face-to-face with open-ended questions, open discussion and opinion
sharing which lasted on average 30-45 minutes. There were also day-to-day conversa-
tions and brainstorming sessions with the logistics team member in Espoo regarding the
research topic. The data gathered through the interviews were later undergone through
qualitative analysis.
After the first round of interviews, the current state of case company logistics processes
was drafted, and critical areas were analyzed including the lead time, costs and order
delivery quality. The first-hand experience gained from action research coupled with
qualitative interviews helped to understand the target phenomenon accurately. The sec-
ond batch of interviews involved brainstorming with the process entities regarding current
versus future state. Discussion involving product type, mode of transportation, costs, and
challenges on product selection happened in these rounds of interviews to further
broaden the concept and to find optimal solutions. Once, the theoretical and conceptual
background of the logistics process, terminologies and objectives were clear, then the
Table 5. List of interview participants.

36
quantitative analysis commenced parallel to the second batch of interviews. Results from
a draft version of mathematical observations were discussed with the inventory controller
and logistics manager to hear further opinions based on their expertise to figure out what
aspects were covered by the quantitative analysis, what further perspectives are left be-
hind and how to solve them.
In addition to this, the use of existing material and research articles provided extensive
knowledge and hypothetical background related to research’s context. The multi-method
qualitative research method was utilized, so different sources and articles were explored
to gain a solid background and understanding of the involved concepts. To ensure con-
sistency in the theoretical background, the sources were chosen based on its relevancy
and ability to maintain conformance with the research objectives. Furthermore, the em-
pirical data were analyzed systematically with respect to the case company’s context.
Due to the limited availability of existing material on the evaluation of logistics mode of
transportation, only a limited number of articles were discovered especially related to
cost implications in the current scenario. Hence, the empirical analysis was done based
on the limited available sources, the case company’s internal KPIs and stakeholder’s
viewpoints.

37
5. EMPIRICAL ANALYSIS AND RESULTS
5.1 Case Company X
5.1.1 Aftersales Department
This research is focused mainly on the case company’s aftersales department and par-
ticularly the logistics unit. This section presents briefly about the aftersales business of
the case company, its functionalities, and challenges.
The case company’s aftersales department is shared into main products, services, and
support functions. Its main products and services consist of accessories, genuine parts,
and associated-business products. In the automotive industry, to perform always at the
highest possible level, vehicles and services require proper maintenance and support;
therefore, it is important to recognize case company’s aftersales supporting functions
such as logistics, aftersales marketing, warranty, and technical support. These functions
make it possible for accessories, genuine parts, and associated-business products to
work smoothly around the clock.
The topic of research relates more to the aftersales logistics and marketing team of the
company; hence, the work procedures are presented only from these areas. First, the
aftersales marketing team is dealing with all the activities related to the promotion, dis-
count, and sales of aftersales parts and accessories. The team is also responsible for
managing spend-funds for product promotions adequately. The spare parts and acces-
sories section manager work closely with the logistics team to harmonize new product
promotions and ensuring stock availability. Second, the associated-business contract
team prepares, evaluate and coordinates all the activities related to the CCX’s service
contracts, warranties, and insurance both with the end-customers and insurers in all the
seven customer markets. CCX is utilizing third-party insurance companies to handle
claims and offer different services for the customer’s ease and safety. Genuine parts and
accessory team are forecasting the parts, organizing promotions and managing the pric-
ing of the parts for dealers and end-customer according to the recommended European
pricing and market competitors. The structure of the aftersales department is shown in
figure 11 below.
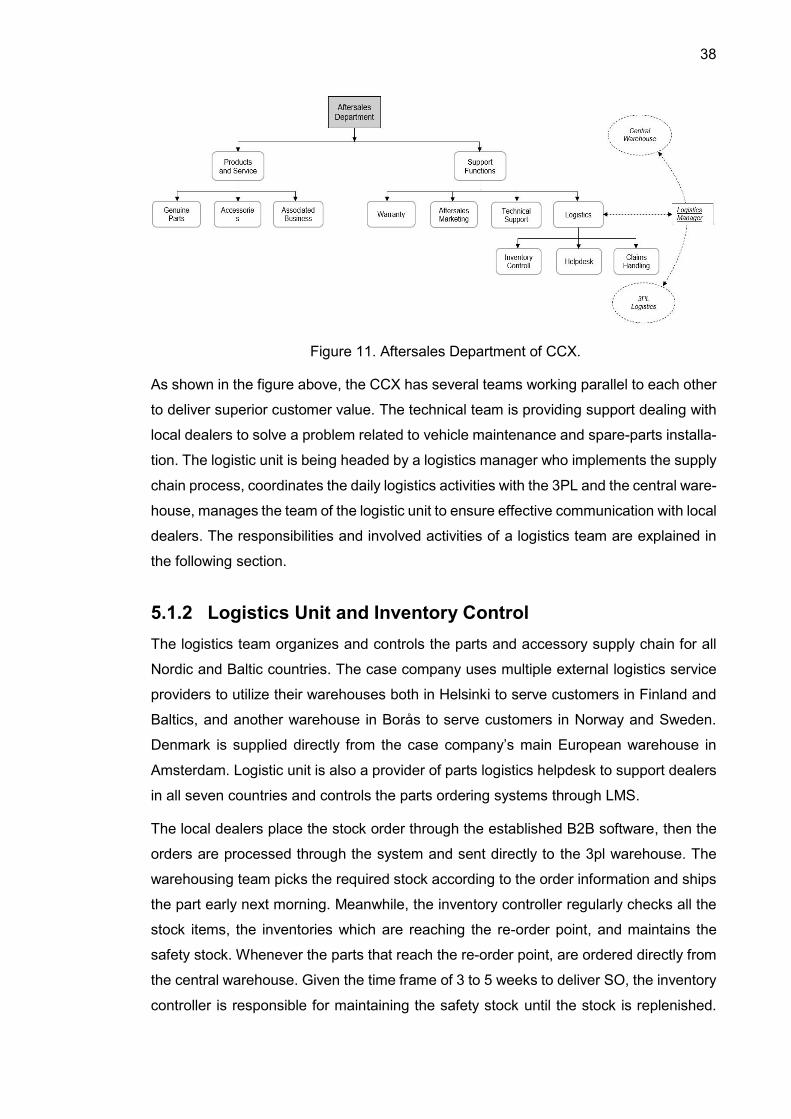
38
As shown in the figure above, the CCX has several teams working parallel to each other
to deliver superior customer value. The technical team is providing support dealing with
local dealers to solve a problem related to vehicle maintenance and spare-parts installa-
tion. The logistic unit is being headed by a logistics manager who implements the supply
chain process, coordinates the daily logistics activities with the 3PL and the central ware-
house, manages the team of the logistic unit to ensure effective communication with local
dealers. The responsibilities and involved activities of a logistics team are explained in
the following section.
5.1.2 Logistics Unit and Inventory Control
The logistics team organizes and controls the parts and accessory supply chain for all
Nordic and Baltic countries. The case company uses multiple external logistics service
providers to utilize their warehouses both in Helsinki to serve customers in Finland and
Baltics, and another warehouse in Borås to serve customers in Norway and Sweden.
Denmark is supplied directly from the case company’s main European warehouse in
Amsterdam. Logistic unit is also a provider of parts logistics helpdesk to support dealers
in all seven countries and controls the parts ordering systems through LMS.
The local dealers place the stock order through the established B2B software, then the
orders are processed through the system and sent directly to the 3pl warehouse. The
warehousing team picks the required stock according to the order information and ships
the part early next morning. Meanwhile, the inventory controller regularly checks all the
stock items, the inventories which are reaching the re-order point, and maintains the
safety stock. Whenever the parts that reach the re-order point, are ordered directly from
the central warehouse. Given the time frame of 3 to 5 weeks to deliver SO, the inventory
controller is responsible for maintaining the safety stock until the stock is replenished.
Figure 11. Aftersales Department of CCX.

39
The parts, that are not found in the store of the central warehouse, are called backorders
since they will be back-ordered to the suppliers. Typical KPIs of the logistic team include
the inventory fill-rate, timely delivery of backorders and emergency orders.
Moreover, three main types of orders are processed through logistics cell which includes
the regular stock orders (SO), vehicle off-road orders (VOR) and emergency orders (EO).
First, the stock orders are placed regularly and include all the classification of inventory
A, B, C and D. The seasonal stock is also ordered in advance and delivered via SO
delivery method. For example, painted bumpers are generally more sold in winter season
because it is prone to get damaged in the cold season and therefore, increases the de-
mand for a product, especially in the Nordic market. The team analyses the historical
car-colors sold and then forecast the required bumpers amount needed to be ordered in
advance.
Second, the vehicle off-road cases are defined as, when the vehicle is not functional or
missing any part, without which, the vehicle cannot be driven. VOR cases are handled
as the priority by all the parties involved to provide quick service to the end-customer. If
the part is not available in a local warehouse, then it is shipped immediately via air from
the central warehouse
Third, the EOs are offered as a service to the local dealers. It involves all the cases where
the vehicle might be functional, but the safety and satisfaction of end-customers are con-
cerned especially in case of vehicle damage maintenance after an accident. In such
cases, a dealer places an emergency and if the parts are available in a local warehouse,
it is shipped the same day or the early next morning. Otherwise, the order is transmitted
to the central warehouse, whose target is to ensure that the required parts are prepared
and shipped within the next business day. The orders are collected by a third-party truck-
ing company whose target is to ensure safe and quick delivery of EO to the local ware-
house within 2 days when the order was received. The overall route of both the EO and
SO is shown in figure 12 below.
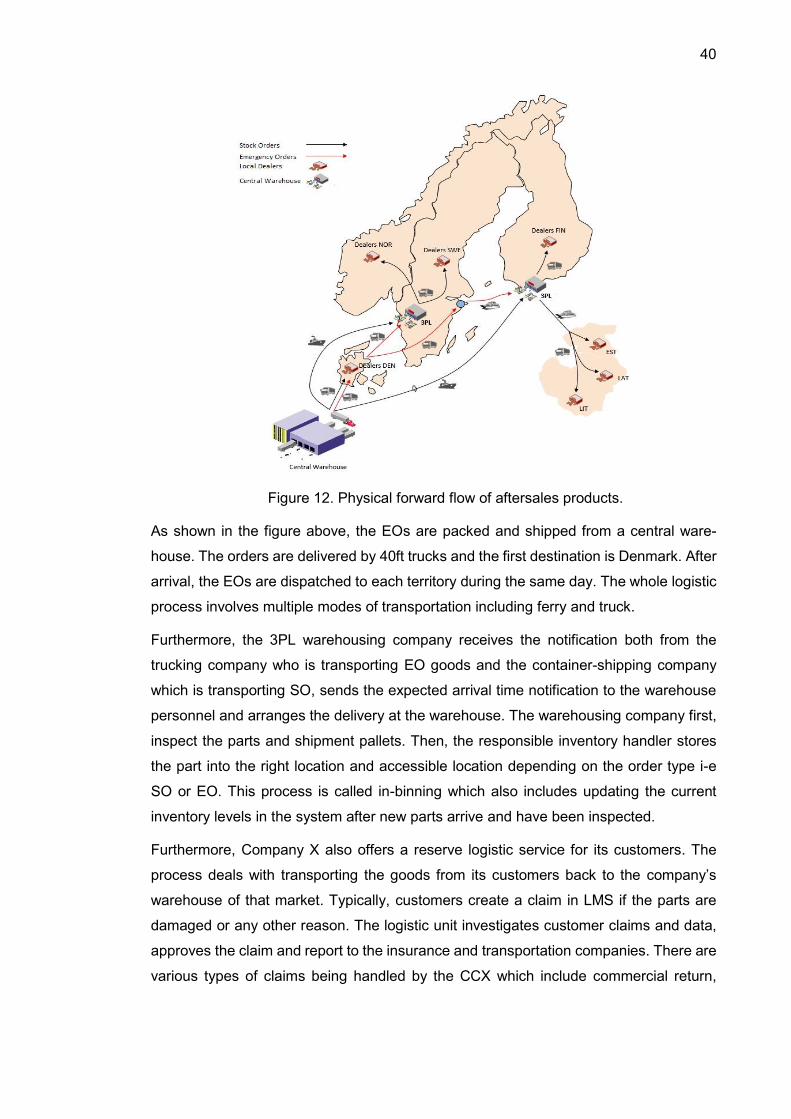
40
As shown in the figure above, the EOs are packed and shipped from a central ware-
house. The orders are delivered by 40ft trucks and the first destination is Denmark. After
arrival, the EOs are dispatched to each territory during the same day. The whole logistic
process involves multiple modes of transportation including ferry and truck.
Furthermore, the 3PL warehousing company receives the notification both from the
trucking company who is transporting EO goods and the container-shipping company
which is transporting SO, sends the expected arrival time notification to the warehouse
personnel and arranges the delivery at the warehouse. The warehousing company first,
inspect the parts and shipment pallets. Then, the responsible inventory handler stores
the part into the right location and accessible location depending on the order type i-e
SO or EO. This process is called in-binning which also includes updating the current
inventory levels in the system after new parts arrive and have been inspected.
Furthermore, Company X also offers a reserve logistic service for its customers. The
process deals with transporting the goods from its customers back to the company’s
warehouse of that market. Typically, customers create a claim in LMS if the parts are
damaged or any other reason. The logistic unit investigates customer claims and data,
approves the claim and report to the insurance and transportation companies. There are
various types of claims being handled by the CCX which include commercial return,
Figure 12. Physical forward flow of aftersales products.

41
transportation damage, mispicked order, wrong content, product catalog error, oversup-
plied or shortages. In case if the mistake or damage is done by the transportation com-
pany or CCX’s warehouse, the transportation is chargeable and paid by the CCX. End-
customers only pay the transportation cost if they wish to return any product as a com-
mercial return with a 10% discount. The overall reverse logistics costs if left unchecked,
can possess a significant impact on business profitability. When asked for a type of re-
peating damage claims, the logistics officer responded:
“Usually the vehicle bumpers, lamps, windshields, and fenders are products that are
more prone to getting damage”
It is mainly because these products require extra care during the packaging and material
handling process. Nevertheless, these products remain on top of the list with the highest
amount of damage and repair claims by the customers. This also indicates the criticality
of choosing the right product to ship inside the EO truck.
5.2 Current State of Logistics Service Levels
This sub-chapter will provide a review of the case company’s logistics service levels and
opinions of the colleagues facing different challenges related to it. The automotive af-
tersales parts supply chain is the exponent of global competition. Since then the case
company being related to a similar industry has been trying to improve its logistics and
supply chain operations and seeking better ways to meet customer satisfaction. The
case company has the right technological resources and established distribution net-
work, but for customers, building a reliable and flexible logistic is the key to success.
Case company’s managers brainstormed about the future upcoming challenges and
among those included were the changing product demand, less order delivery infor-
mation and longer lead times. In a qualitative interview session with the department’s
inventory controller, he said the following.
“Many times, I receive an email from local dealers asking about the availability of certain
products, and I can’t even properly reply with a reliable expected arrival time”
Not only the regular stock order delivery time is huge, but that is the only delivery method
company is using to ship stock orders. Thus, not being flexible enough is also one of the
potential areas for the case company to improve. The inventory controller came up with
the idea of shipping stock orders inside the emergency trucks provided that the truck
allows space for the SO cargo, but most important the logistics service levels are not
negatively affected by that.

42
5.2.1 Review of Lead Time
The logistics unit of CCX is responsible for ordering, maintaining inventory and expedit-
ing deliveries of the automotive aftersales spare parts and accessories. As the process
flow is concerned, the parts are expedited and ordered from the central warehouse which
is in Amsterdam. The local inventory controller in each market is in charge of maintaining
the local stocks. Therefore, the inventory controllers can check both the availability of
existing parts and the introduction of new parts at a central warehouse through the es-
tablished information management system and warehouse management software. Usu-
ally, inventory controllers forecast the demand of each product group by analyzing the
last 12-months sales data and using logistics experience related to seasonal and market
trends, then the controller places the product orders to the central warehouse.
The actual inbound logistics process starts when the inventory controller places the
spare-parts order through the logistics management software (LMS), the software sim-
plifies the order data and transmits the information to the central warehouse. The regular
SO are delivered by shipping routes to both the local 3PL warehouse in each market.
The lead time of SO varies between 3 to 5 weeks, as tracked by the CCX in 2018, the
lead time of shipping containers averaged 7 to 10 days as shown in table 6 below.
Container Departure
Amsterdam
Arrival to HKI
Harbor
Inbinning
Starter
Inbinning
Finished
TX520 24.10. 30.10. 30.10. 31.11.
TX615 25.10. 30.10. 1.11. 2.11.
TX679 25.10. 30.10. 1.11. 2.11.
TX639 25.10. 2.11. 2.11. 5.11.
TX643 25.10. 5.11. 5.11. 7.11.
TX597 26.10. 5.11. 6.11. 9.11.
TX942 01.11. 6.11. 12.11. 12.11.
As evident in table 6 above, the average lead time of container was moderate, however,
the globalization and change in demand have an adverse effect on the lead time. Since
automotive logistics parts also include fast-moving products and main decision problem
arises when an emergency part is required. Therefore, CCX has adopted the milk-run
system, which involves transporting the required parts to the dealers located very close
to the local warehouse. The milk-run system allows multiple deliveries to the dealers and
even allows the possibility to pick the product by themselves at their convenience. How-
ever, not all the dealers are in a nearby geographic region so the idea of supplying the
Table 6. EO truck lead time follow-up.

43
parts urgently is only limited to few dealers. For the rest of the dealers, the transport time
is a bit longer. In case of EO, one of the key performance indicators of the CCX is to
coordinate with involved logistics parties and deliver the EO within 2-3 days after the
order is placed. The CCX tracked the EO order incoming/arrival time to analyze the cur-
rent situation of EO delivery time as shown in table 7 below.
Invoice D.o.D Day D.o.A Day T.o.A In-time
(Y/N)
Note
TC544 29.07 Mon 01.08 Thu 10:15 N Same day shipped
TC620 30.07 Tue 01.08 Thu 10:15 Y Same day shipped
TC728 31.07 Wed 02.08 Fri 10:05 Y Same day shipped
TC815 01.08 Thu 05.08 Mon 6:45 Y Same day shipped
TC782 02.08 Fri 05.08 Mon 6:45 Y Same day shipped
TC986 05.08 Mon 07.08 Wed 10:45 Y Same day shipped
TD239 0608 Tue 0808 Thu 10:20 Y Same day shipped
TD120 0708 Wed 0908 Fri 10:00 Y Same day shipped
TD159 0808 Thu 1208 Mon 7:00 Y Same day shipped
TD279 0908 Fri 1208 Mon 7:00 Y Same day shipped
TD331 1208 Mon 1408 Wed 10:30 Y Same day shipped
As the EO situation is evident in table 4 above, the average lead time of EO is 2-3 days
for the trucks that leave the central warehouse from Monday till Wednesday. For trucks,
that leaves on Thursday and Friday reach the local warehouse in Helsinki on next Mon-
day. To answer the question of the manager, that can we transport SO inside the EO
order trucks in order to bring some prioritized parts faster; the truck container size needs
to be determined and historical truck filled-data is required before further cost analysis is
done. As argued by (Hakim, et al., 2018), the information about the type of container and
capacity of containers used in logistics inbound operation is a very significant choice to
be determined, so that the logistics costs and possibility to ship SO can be examined.
Table 7. EO truck delivery times.

44
If any part is not available in the central warehouse it is declared as a backorder and the
central warehouse places the order the required part to the supplier. The situation be-
comes critical when the backorders are delayed for more than 30 days because it affects
the dealer negatively who has been waiting for the part to arrive. If in some cases, if the
required part is covered by warranty, then as a courtesy, a car is issued to the end-
customer to drive until the backorder is delivered by the CCX. This situation incurs addi-
tional costs; therefore, the lead time is an important factor for the CCX. However, when
the central warehousing strategy section manager was interviewed regarding this sce-
nario, the following viewpoint was discussed:
“The situation with backorder is really tricky if the old supplier does not exist or if they do
not supply that part anymore. In that case, delivering aged backorder is our priority from
other suppliers or taking part from production/assembling plant during the manufacturing
of new vehicle”
This highlights the fact that the factor of lead time is also dependent on a variety of ex-
ternal factors including supplier’s capability, geographical political situation, and others.
Delivering the backorders quickly is a crucial issue for some dealers in order to provide
excellent service quality to the end-customer. This issue is being discussed between the
regional business units i-e CCX and the central warehousing team to find other reliable
solutions. On the contrary, even when the part is acquired by the central warehouse, it
is still treated as regular SO and delivered by shipping routes. Another inventory control-
ler said:
“Dependency on the singular delivery route of SO is also causing us to be less flexible
and adaptive to alternative options”
Moreover, when a dealer suddenly calls or email to ask for expected delivery times the
inventory controller or helpdesk personnel are left with non-convincing answers to justify
the late delivery timing because of less available information. Hence, negatively affecting
the logistic service levels.
5.2.2 Review of Logistic Costs
The lack of delivery information and longer lead times are real-time troublesome issues
for the case company which is causing the company’s logistic to be less predictable. The
less predictability of the logistic delivery times is influencing the safety stock levels, be-
cause the longer the lead times the more inventory and safety stock is needed, which in
turn causing the monetary value to be tied-up. The inventory controller highlighted:

45
“If the SOs are to be shipped in EO trucks as much as space is allowed, this way we
could have been able to decrease our local inventory value and labor on fast-moving
items”
Interestingly, the CCX has many regular fast-moving parts which are classified as inven-
tory classification. This argument highlights the fact that the logistic cost does not only
include the cost of delivery but also the local inventory value especially for the fast-mov-
ing product type A. However, as far as the incurred logistic costs are concerned in EO
delivery, it is important to recognize the type of delivery container is being used. The 3PL
warehousing personnel was tasked to track the EO truck filled versus the available ca-
pacity in order to understand the historical pattern of the volume filled. An average of
recent data from the 40 ft truck container, each week filled volume, is presented in figure
13.
As shown in the figure above, the 40 ft container has a total of 13.20 sqm available
capacity. Historically the truck has been filled with EO averaging to 4.85 sqm of space
utilization in the period of 8 weeks and leaving behind approximately 8.35 sqm space
inside the EO truck. Despite the varying volume of shipped goods each week, this follow-
up of container’s space utilization indicates a positive sign that there is enough space to
also ship SO orders. When presented this data to the inventory controller, a few im-
portant key questions were raised…
Figure 13. EO - Filled vs vacant capacity.

46
“Space utilization’s data shows that there is enough space inside EO truck for SO but
nevertheless the question still remains that what product category can be chosen from
the SO to achieve the optimal cost and productivity from this situation”
This key question holds a significant value from the logistics point of view because the
CCX has 1,24000 active product numbers and hundreds of product categories. There-
fore, defining a criterion for product selection and categorization is necessary to proceed
with this situation. Also, the incurred logistic costs can be higher or lower depending upon
the products chosen and the space it takes.
Furthermore, the logistics cost related to the delivery of EO truck is generally complex
but is made simple for the CCX because the 3PL handles all the customs clearance,
invoice billing to other parties involved and managing the delivery. The CCX is aware of
the chunk of transactions that the company must pay in each logistics transaction of SO
delivery. Roughly, when calculating the gross margins, the company adds 34% of the
logistics cost as contribution margin in each logistic transaction emerging from SO deliv-
ery; this 34% is added on top of the actual product’s standard cost. However, in case of
EO, an amount under 100€ per meter-cube is the cost that the company pays to the 3PL
trucking company for handling and delivering the items. If there are dangerous category
goods such as batteries, compressed oxygen, engine oils or other, add an additional 30€
which is being paid twice a week on average. The exact delivery costs are manipulated
to maintain case company’s secrecy.
In conclusion, the transportation cost to deliver emergency orders by a trucking company
is rather simplistic but what’s more important for the case company is the prioritization of
the regular stock orders and product categories. Historical averages indicate that the
Company X can ship SO inside the EO trucks, however, considering the quoted trans-
portation costs which products can be optimal to keep the costs minimum is still uncer-
tain.
5.2.3 Review of Order Delivery Quality
In addition to being flexible or trying to reduce the lead time, another challenge that the
case company was facing is the quality of order delivery. As argued in the literature
study, quality is the key to takeout and delivery. Company X defines quality as on-time
delivery, in the right quantity and right condition of the product. That is why the company
is also offering the reverse logistic claim service for its customers to raise a claim about
any incident. When asked the logistic offer about claim handling, he said:

47
“If customers have a big order but receive one important part damaged, it affects very
negatively about overall order quality”
This could be partly explained by the company having longer lead times and not all the
parts are available in local warehouses due to pipeline shipments coming from a central
warehouse. That is why, it is utterly important that whether Company X proceeds with
the proposed model of transportation or not, the quality of order cannot be compromised.
However, receiving a damaged product is entirely the Company X fault or mistake, it is
mainly contributed due to mishandling from the external transportation companies. A
noteworthy point was made by a logistic officer:
“Customers sometimes do complain us having bad packaging of some of the products
but most of the time it is mishandling from transporters that damages the product”
Hence, it is important for the case company to realize that both the reliable packaging
and proper material handling is required to ensure that customers receive the product in
form and shape. Furthermore, it was also noticed through the interviews that the com-
munication between the logistics team and customers regarding the order expected time
of arrival is very minimal. When customers place either SO or EO through the B2B portal,
they can only see the expected time of delivery (ETD) for only a few parts, which in some
cases is not reliable. As said by Saura et al. (2008), the importance of sharing accurate
information on time has a direct positive or negative impact on customer perceived ser-
vice quality. In the current scenario, the logistics team receives the first notification in the
form of an invoice from a central warehouse when the parts are shipped from the ware-
house. The next notification is received by the local 3pl warehouse a few days before
the parts are about to arrive at Helsinki harbor. If there is any local dealer contacting
about the expected arrival time in between these 3 to 5 weeks regular shipping, the lo-
gistics team does not usually have a reliable answer.
Less availability of information related to expected arrival time can also be partly ex-
plained by the fact that the logistics team is still using an old-fashioned and limited ver-
sion of the LMS. Currently, the team uses two separate LMS for inventory control pur-
poses and an ERP (Enterprise Resource Planning) to check logistic claims, dealer his-
torical orders, credit and invoicing. The issue is that the two versions of LMS have very
limited and scattered tools. There are no reliable and efficient ways to communicate the
logistics team by the central warehouse, in case, if the parts delivery has been delayed
or has been back-ordered from the supplier. At this moment, it’s a combination of a little
bit of assumption and emailing the central warehouse to ask for an expected arrival date.
Hence, the central warehousing team is developing a renewed LMS called Alias, which
48
will not only replace older versions of LMS but will allow Company X and local inventory
controllers from each country to track their order processing. The software will be able
to synchronize all the orders in its respective markets and in some cases if a backorder
is delayed more than 30 days, then the possibility to obtain apart from other EU ware-
houses, vehicle production and assembling plant will be made visible through the re-
newed LMS.
In conclusion, the logistics unit is currently meeting its most of the KPIs including fill-rate
and order dispatch time. However, there are no ways to asses properly regarding the
overall order delivery quality which includes important elements such as accurate infor-
mation sharing, avoiding transport damages and reliable ERP. The logistics unit realizes
the fact that these three areas also need avenues of development to enhance service
quality. If the renewed Alias begins working soon, then it will not only enhance collabo-
ration between warehouses and other regional business units but can also communicate
accurate information with the local dealers about the expected time of arrival.
5.3 Analysis of the Proposed Mode of Transportation
In the automotive industry, the involved global megatrends and risks such as Brexit deal
and others are continuously pushing Company X to build a robust aftersales logistic de-
sign which is more resilient to risks and disruptions. The managers of the case company
have been brainstorming on how to mitigate the risks of disruption, increase logistics
flexibility and reduce lead times. The idea of using EO trucks to fill-up with SO which was
pitched initially by the inventory controller does seem like a possibility that will enable the
supply chain to function smoothly and reduce the lead times. However, what impact it
might have on logistics flexibility, communication, and overall cost structure. This section
of the research aims to answer these questions in detail.
5.3.1 Product Selection
The associated costs of logistics in a delivery method by trucks are substantial, not sur-
prisingly, it still is just a portion of total logistics costs which also involve warehouse op-
erating costs. The focus of this research relies only on the costs of delivery by trucks.
The cost of delivering a one-meter cube of the product by truck is known to the CCX,
which is of course heavily dependent on the type, weight, and volume of the product
being delivered. In a brainstorming session with an inventory controller, an interesting
viewpoint was raised:
49
“The cost of per meter cube of products does not allow enough room to maneuver, there-
fore, choosing the right products is not only important from a cost perspective but also
from inventory controlling point of view to improve overall efficiency”.
The complexity of the situation becomes obvious because the case company has thou-
sands of active aftersales products being delivered. The products are categorized and
vary greatly in demand; therefore, ABC inventory classification is being used to under-
stand the impact of different product categories on overall turnover. In order to find an
optimal type of product to be able to deliver as a SO inside the EO trucks, each product
category needs to be critically analyzed according to the criteria in the previous section.
Logistic manager of the case company highlighted the following fact:
“If the size and packaging of the product are huge, it will incur higher costs. If the size of
the product is too small, it might be feasible to ship it by EO truck due to lower dealer net
price”.
Keeping this in mind, it is utterly important that the products should not only be optimal
in size, but the dealer net price should be substantial that can make this effort worth it
financially and productivity-wise. Given the number of products available, it was still pos-
sible to make quick adjustments and prioritize items for this study. Since the inventory is
classified into various categories, when asked about which category should be priori-
tized, the inventory controller said:
“If we chose a few fast-moving products among the available, that will probably be the
safest option to start with”
In order to proceed forward in terms of analyzing the parts which can be ideal to ship
inside EO trucks, a stock analysis report was utilized. The report was acquired from the
LMS which included all the figures related to parts sales, demand, quantity on hand and
other information. After analyzing the available data from LMS, few parts were prioritized
based on the set criterion which is displayed in table 8 below, the part names and annual
demand figures were manipulated to maintain the privacy of the case company’s busi-
ness.

50
Product Annual De-
mand (units)
Inventory
Classifica-
tion
Dangerous
Goods
Weight (g) Volume Volume Unit
Item 1 25122 A N 35 77* 48* 48 Mm
Item B 22757 A N 80 100* 100* 70 Mm
Item C 20587 A N 100 255* 185* 40 Mm
Item D 14966 A N 175 380* 140* 85 Mm
Item E 11273 A Y 280 270* 185* 55 Mm
Item F 8531 A Y 19,100 278* 190* 175 Mm
Item G 6925 A N 4 720* 520* 30 Mm
Item H 6936 A N 190 245* 190* 35 Mm
Item I 3399 A N 680 158* 120* 98 Mm
Item J 1642 A N 1,000 255* 255* 50 Mm
Item K 1641 A N 1,250 100* 100* 95 Mm
Item L 384 B N 22,956 1190* 320* 150 Mm
Item M 199 B N 12,500 1026* 810* 170 Mm
Item N 185 B N 100,000 860* 860* 560 Mm
Item O 168 B N 5,910 400* 240* 160 Mm
The empirical investigation as showcased in the table above is based on real-life da-
tasets. In order to evaluate these products, the study also needed information about the
product’s weight and volume. The data related to inventory holding cost of each is not
available and therefore, is not considered in the scope of this study. However, the main
elements to figure out at this point is, which products are more optimal to ship in terms
of cost, potential sales (cash flow in euros) and easier to handle by the 3PL. The empir-
ical investigation was discussed with the logistics helpdesk and 3PL warehousing man-
ager, the idea behind brainstorming sessions was to get a critical review on the fast-
moving products, annual demand and to understand the importance of product weight
and volume. The 3PL warehousing supervisor said:
“These type of inventory parts especially sensor units, oil filters, and timing chain might
be optimal to ship inside EO truck because it occupies less space and easy to handle”
It is interesting to note that, there are still many other parts that have high demand and
included in the list of fast-moving products, for instance, bumpers and lamps; but the
Table 8. Product Selection.

51
reason those product types are not chosen because those products are prone to get
damaged and require extra efforts by the warehousing team to inspect and store.
5.3.2 Cost Implications
In this research, the objective function is to understand the cost behavior and how it can
change when the logistics activity is altered. For the CCX, it is utterly important to be
aware of cost changes while constructing or proposing an alternate mode of logistics.
Generally, the logistic cost is comprised of fixed and variable costs. Both elements in-
clude multiple sub-components contributing financial liability and constituting a full cost
element. The fixed cost in this study is mainly consists of first, the standard cost of the
product, which is the direct material cost that company pays to buy the goods from its
supplier, and secondly, the direct delivery cost, which is the amount that company pays
to its 3pl trucking company that delivers the goods from central warehouse to Helsinki
warehouse. In any logistic circumstances, these costs will remain the same. On the con-
trary, variable cost is the cost behavior which varies directly with changes to a logistics
activity. For CCX, the direct-variable cost is out of scope for this study, however, a mixed
cost element shall be introduced in order to cope with the objective function of this study.
The idea of this study is not to reduce the cost but rather evaluate the costs in both the
business scenarios. The overview of evaluating logistics costs is presented in figure 14
below.

52
As illustrated in the figure above, the fact is that the logistic cost is comprised of different
multiple fixed and variable cost elements, but the scope of this study is focused on the
fixed transportation cost and its behavior in both the scenarios including direct trucking
route to Finland and shipping SO inside EO truck. The illustration in the figure shows
general facts in the first potion. In both the cases of shipping containers and EO trucks,
the transportation cost, nature of order type and safety stock are variable. So, the overall
logistic service level is dependent on the type of transportation mode chosen as well as
the associated risk of transport damages and material handling. The decision-making
process for the CCX includes two different sets of routes, depending on which path
should be chosen, cost implication plays a huge role in that process.
Evaluation Framework
The cost per sqm is already determined by the CCX both, however, to what extent the
logistic costs arising from the prioritized parts delivery can impact the overall process. In
order to find the lengths and cost behavior in this business situation, it is utterly important
to set relevant cost categories and define the evaluation framework. As discussed briefly
in the literature review from Zeng & Rossetti (2003), since the CCX does not have cen-
tralized datasets and information to retrieve related to the costs involved in the overall
logistics process. Therefore, considering the scope of this study, the focus is on only one
Figure 14. The overview of logistic facts and cost elements (adapted and modified from Zeng & Rossetti, 2003).

53
cost category which involves the transportation costs, being paid to 3pl trucking company
for handling and delivering the EO orders. As said by the logistics manager:
“The delivery cost information is available, but we are still missing the cost factors con-
sidering the scope of this study which can determine the proposed logistic setting’s fea-
sibility”
Hence, to cope with this issue, literature from Zeng & Rossetti (2003) has been adopted
and modified according to the case company’s logistic setting. Since the main cost cat-
egory for the CCX is the logistic delivery cost, hence, total logistic cost needs to be de-
termined based on the proposed model. A cost-matrix is constructed on a spreadsheet
in order to estimate the total logistic costs and to understand overall cost behavior. As
pinpointed by the logistic manager above, the evaluation criteria need to be determined
in this case. Since the combination of transportation and delivery modes have been de-
termined, which needs to be evaluated form cost perspective. Therefore, the number of
input parameters needs to be developed which will undergo cost analysis. Since this
study is only concerned with only one cost-category, transportation cost, so a total of
parameters will be used to ascertain logistic cost behavior, as explained below.
1. Product description
2. Net weight (KG)
3. Volume (cbm)
4. Dangerous good (Y/N)
5. Standard cost (€/unit)
6. Dealer net price (€/unit)
7. Logistic cost (€/cbm)
8. Dangerous good cost (€/cbm)
9. Avg. truck available capacity (cbm)
These input parameters have been finalized after verifying with the CCX stakeholders,
net weight, volume, cost, and price of the product plays a significant role to understand
the cost and benefit of both the problem scenarios. These parameters will be used to
construct the cost matrix and the input data has been obtained from LMS.
In addition to developing a cost matrix, evaluation of the effectiveness of shipping alter-
natives and logistics cost awareness needs to be concluded with the help of evaluation
percentages. As argued by Zeng & Rossetti (2003), a computational figure can be ob-
tained in the proposed model by creating different sets of percentages. These percent-
ages can be determined in the following way:
TCF: [Annual Demand(units)*Transportation Cost (€
unit)] + [Annual Demand(units)* Std. Cost(
€
unit)]

54
TCS: Transportation Cost (€
unit) * Maximum Available Capacity (
𝑢𝑛𝑖𝑡𝑠
cbm)
TCVA: TCF
Customer Net Price (€
unit) ∗ Annual Demand (units)
These percentages are extremely useful in order to understand the behavior of logistics
costs. However, for the purpose of illustration, a quantitative analysis has been shown
below. The related data has been obtained from LMS and ERP but has been modified
to protect data privacy. Two important parameters for the data include, first, the trans-
portation costs which are quoted under 100 euros per cubic meter. Secondly, the aver-
age available capacity inside EO truck 4.85 square meters, which was determined in
while tracking EO truck’s historical data. The first part of the cost matrix is shown in table
9 below which includes the unit cost per product.
Product Description Net
Weight
(g)
Dimensions,
LxWxH (mm)
Volume /
Unit
(cbm)
Transport Cost /
Unit
(€/unit.vol)
Available Capacity
40 ft Container incl.
Packaging
(units)
Total Transport
Costs per Availa-
ble Capacity
(€/units)
Item A 35 77* 48* 48 0.00017 0.020 40,721 2,213
Item B 80 100* 100* 70 0.00070 0.084 10,157 2,213
Item C 100 255* 185* 40 0.00189 0.226 3,688 2,213
Item D 175 380* 140* 85 0.00452 0.542 1,539 2,213
Item E 280 270* 185* 55 0.00275 0.329 2,405 2,213
Item F 19,100 278* 190* 175 0.00924 1.535 729 2,767
Item G 4 720* 520* 30 0.01123 1.347 566 2,213
Item H 190 245* 190* 35 0.00163 0.195 4,245 2,213
Item I 680 158* 120* 98 0.00186 0.223 3,705 2,213
Item J 1,000 255* 255* 50 0.00325 0.390 2,167 2,213
Item K 1,250 100* 100* 95 0.00095 0.114 7,453 2,213
Item L 22,956 1190* 320* 150 0.05712 6.850 92 2,213
Item M 12,500 1026* 810* 170 0.14128 16.944 37 2,213
Item N 100,000 860* 860* 560 0.41418 49.672 10 2,213
Item O 5,910 400* 240* 160 0.01536 1.842 394 2,213
Table 9. Product cost analysis.

55
As shown in the figure above, a few products such as Item A and Item B have the highest
number of annual demand and low volume. Hence, the product can be shipped in a large
number of quantities inside the EO truck. On the contrary, Item N has low demand and
because of large unit volume, the maximum number of units possible to ship is also less
comparatively. It is also noticeable that the transportation costs for these products do not
vary in greater quantity especially in the top 80% of the parts. Nonetheless, the parts
which are optimal to ship shall be founded on the evaluation percentages as shown in
Table 10 below.
PRODUCT
DESCRIPTION
TRANSPORT
COST
(€/UNIT)
STD. COST
(€/UNIT)
C.N.P W/O
VAT
(€/UNIT)
ANNUAL
DEMAND
(UNITS)
TCF TCS TCVA
Item A 0.020 4.31 13.28 25122 108,837 € 67.39% 512 €
Item B 0.084 1.58 6.48 22757 37,780 € 74.38% 1,911 €
Item C 0.226 1.86 10.93 20587 42,934 € 80.92% 4,659 €
Item D 0.542 6.51 42.04 14966 105,525 € 83.23% 8,116 €
Item E 0.329 5.62 11.37 11273 67,073 € 47.69% 3,714 €
Item F 1.535 45.30 60.39 8531 399,522 € 22.45% 13,094 €
Item G 1.347 13.12 28.03 6925 100,160 € 48.40% 9,329 €
Item H 0.195 6.26 17.48 6936 44,743 € 63.10% 1,355 €
Item I 0.223 20.13 24.93 3399 69,178 € 18.35% 757 €
Item J 0.390 27.34 88.82 1642 45,539 € 68.78% 640 €
Item K 0.114 25.66 66.42 1641 42,275 € 61.20% 187 €
Item L 6.850 203.89 273.44 384 80,871 € 22.93% 2,629 €
Item M 16.944 168.76 287.25 199 36,971 € 35.35% 3,373 €
Item N 49.672 1,337.89 4,448.04 185 257,283 € 68.81% 9,210 €
Item O 1.842 366.63 886.98 168 61,792 € 58.46% 309 €
As shown in the table above, the percentages can determine the expenses and overall
behavior of logistics cost. The TCF represents the total fixed costs including the transpor-
tation and standard product cost. It is noticeable that the parts including Item F and Item
N can possibly contribute to the highest total costs if transported by trucks. Similarly,
followed by the lowest total cost contribution from Item B and Item M considering the
Table 10. Cost Matrix.

56
annual demand and transportation costs per unit volume. Moreover, the logistics cost
per shipment is reflected from the TCs percentage, which makes it obvious for the inven-
tory controller to evaluate transportation costs per shipment of any part. However, from
the cost’s standpoint, the most favorable product is presumably the one offering higher
gross profit margins. Hence, TCVA represents the overall value that the product can offer
considering the current situation. It presents the ratio of total costs by revenue which is
generated from the customer’s net purchasing price. It is evident that most of the prod-
ucts are offering significant gross margins for the case company nonetheless, some parts
including Item F, Item I and Item L are donating handful profit margins which can reach
breakeven easily if offered as a campaign or kit discount. So, the CCX must proceed
prudently with these types of parts to leave enough room in the gross margins in order
to maneuver with campaign or price changes.
5.3.3 Impact on Lead Time and Delivery Quality
The lead time is a crucial element when analyzing an optimized mode of transportation.
With this research, the case company got to understand the several factors involved in
determining the lead times of truck delivery routes. First, there are two truck delivery
routes that have been deliberately analyzed in previous sections. The present route fol-
lows the Denmark terminal to navigate through Sweden while reaching the Helsinki har-
bor. The route involves multiple offloading and unloading of goods from trucks to
transport ferry. Now, the current routes on average take 2-3 days to deliver goods from
Amsterdam's central warehouse to the Helsinki warehouse. On the contrary, when asked
for lead time from a third-party trucking company that follows the logistics course via
Hamburg. This company quoted the delivery time to be 10 days starting from point of
picking (Amsterdam) to the point of delivery (Helsinki). It is obvious that the new 3PL
trucking company’s quoted time is higher than the current delivery company. Regarding
lead time, the logistics manager said:
“It is questionable as to why the lead time is quoted as 5 days whereas many companies
can delivery within 3 days. Nevertheless, the routes need to be investigated more or get
the current company onboard”
In addition to the manager’s comments regarding getting the current company onboard,
previous negotiations have been done regarding the possibility to launch another truck
to deliver only SO. However, the trucking company agreed to deliver if and only there
will be regularly running orders each day. For the CCX, it might not be the most optimal
solution because the demand volume, product variety, and seasonal products were
stumbling blocks in the past. Either way, the possibility to optimize route together with

57
the trucking company or starting a dialogue with the current company can be a good
starting point.
Order Delivery Quality
The proposed model of transportation and deliveries by trucks does shorten the lead
time from the regular stock order delivery method comparatively. Whether the proposed
logistics model can provide good overall order delivery quality is still uncertain and needs
more process investigation which required more digging and dialogue with the trucking
companies but unfortunately became out of scope for this research. Nonetheless, the
order delivery quality discussed in the current scenario referred mainly to transport dam-
ages and expected arrival date information shared with the customers.
The ability to deliver quality information before and during when customers order is de-
pendent on the information system as well as the logistics helpdesk personnel. When it
comes to displaying ETD in the LMS, the central warehouse plays a vital role in input
updated information in the system. Surprisingly, the complexity and variety of products
make it difficult for the central warehousing team to give out reliable ETD. Still, the LMS
shows ETD for approximately 80% of the parts, but the issue is the reliability. Whether
the proposed mode of transportation can perform outstandingly in sharing ETD is still
highly dependent on a central warehouse which is still unknown because of uncertain
volumes and final types of products. As far as the logistics personnel are concerned,
inventory controller mentioned:
“With this idea, we could modify customers order intake, and we will be able to know
what is being shipped and ETD will be more reliable to present to the customers”
The helpdesk tried its best to push for ETD and other accurate information but sometimes
the response is not given back because of the notion that it’s the same repetitive complex
issue. This mode of transportation brings more transparency in the ETD because of
shorter lead times and well-established information flow process not only with the CCX
logistics team but also with the 3PL local warehouse.
5.4 Sensitivity Analysis
Typically, in a practical business environment, the set of variables or elements which are
part of a system might change due to internal or external factors. Changes in important
parameters might have an adverse effect on the final decision regarding any mode se-
lection and impact on transportation costs (Zeng & Rossetti, 2003). A sensitivity analysis
is a tool, which is further utilized in the current context to check how changes in certain

58
cost and demand elements will affect the projected logistics cost structure. The cost el-
ements selected for assessment include transportation cost (€/unit), standard
cost(€/unit), customer net price (€/unit) and annual product demand(units). The results
analyzed from sensitivity analysis are based on four assumed situations that might hap-
pen in a business environment. In the first, analysis of the annual demand of the product
is assumed to be reduced by 20% due to any external reasons and the rest of the varia-
bles are kept constant. Three columns are created to determine the variance percentage
after the current changes in factors versus the previously determined cost figures. The
first situation is presented in figure 15 below.
As it's visible in the figure above, the annual demand has a direct impact on the total
costs of the product and the total cost of shipment. The variance dropped to an equal
25% in both the percentages. However, the situation is justifiable especially in case of
no variance change in the TCVA because reduced demand will ultimately reduce the cre-
ation of the product; thus, balancing the situation. So, besides the reduction in revenue
generated by the CCX, the demand has no threatening impact on this mode of transpor-
tation and these parts specifically. The second situation with a 30% increase in delivery
cost is presented in figure 16 below.
Figure 15. Sensitivity Analysis (Situation 1).

59
Situation 2 showcases the variance in all these three percentages. TCs undergo the
same variation of +23.08% in all the products due to a flat increase of 30% in transpor-
tation costs. As would be expected, the variance in TCVA and TCF is distinctive for each
product due to different annual demand and unit volume. Looking at the current situation,
even a flat increase in transportation cost does not seem to bring any alarming variation
versus the previous cost figures, it is mainly supported by the fact that the CCX has huge
gross margins in these products to support offset price changes. Situation 3 with a flat
increase in standard cost of up to 20% is shown in figure 17 below.
As illustrated in the figure above, the flat increase in standard costs of the product has
impacted negatively in many products. Although the CCX has a fixed standard cost
agreement with the suppliers for one year it is interesting to be aware of the products
Figure 16. Sensitivity Analysis (Situation 2).
Figure 17. Sensitivity Analysis (Situation 3).

60
reaching an alarming situation. As highlighted, the products including Item F, Item I and
Item L have suffered huge negative variations due to standard costs increase. In the
automotive industry, for certain products, an increase in standard costs between 5% and
8% after a year is a known fact. This is also thought-provoking for the CCX to only publish
the products for this mode of transportation that has enough room in gross margin, and
it can withstand some uncertain increase in standard costs. Finally, a reduction of 25%
in customer net price is presented in figure 18 below.
With a flat reduction of 25% in customer purchasing price, it was anticipated that it will
only impact TCVA and other variance percentages remain unaffected. However, the prod-
ucts including Item F, Item I, and Item L seem to fall into the worrisome category. All
these three products after reducing 25% net price are landing into negative gross profit
margins. If there are a further campaign or virtual kit discounts set up in the case com-
pany, then these products might not be generating any positive cash flow. Hence, it is
important for a case company to realize the sensitivity of discount percentages in items
like these.
In conclusion, changing the cost of variables involved in this study has a direct impact
on evaluation percentages especially TCVA which reflects how much value a part can
generate in the given scenario. Despite showing some negative trends in percentage
TCVA in the above four situations, there is still a substantial number of products offering
higher gross margins. The effects of varying elements can be examined thoroughly in
the sensitivity analysis spreadsheet which can be used as a guideline while decision-
making of product selection and logistics cost sensitivity in the future.
Figure 18. Sensitivity Analysis (Situation 4).

61
6. CONCLUSION
This thesis work was done based on the automotive case company’s context and the
main purpose was to evaluate the logistics service levels in current versus proposed
mode of transportation from shipping containers to trucks. Based on service level argu-
mentation, then identify opportunities and challenges related to this idea. This chapter
summarizes the main results obtained from the empirical analysis of the case study.
Furthermore, a draft action plan has been constructed for the CCX based on the results
and data analysis, the opportunities and risks associated with changing the mode of
transportation are presented as well.
During the execution of this thesis project, research questions remain intact but the
scope of the study, research methods have been modified and adapted to the context of
the case company. Highlighting the facts and figures, opportunities and risks for the case
company related to the study’s objectives have been successful from the case com-
pany’s perspective. Since this study was to examine the pre-launch scenario and asso-
ciated challenges, hence, the validation and endorsement of the idea during the post-
launch stage cannot be authenticated at this point. The decision to go with the launch of
the modifying mode of transportation lies in the case company’s management and the
need for further investigation. The nature of results and proposed recommendations are
not generally valid in every scenario rather it is intended to accomplish research objec-
tives according to the case company’s business environment.
6.1 Summary of Empirical Findings
The thesis work concentrated on the areas of evaluation of logistics service levels and
impact on the service quality for the case company. The aim was to define the logistics
service levels, determine the parameter and impact factors that will be affected by mod-
ifying the service level. Measure the level impact in order to examine the logistics service
quality. Moreover, all the stakeholders involved in the logistics process were expecting
specific factors to be measured that fall under the umbrella of logistics service quality.
This section tries to summarize the findings from the research and discuss them based
on formulated research objectives.
To start with the recap, the logistics service levels were defined in the sub-chapter 2.2.
According to the literature, a logistics service is a mutual agreement between two parties
to deliver something tangible or intangible and is measurable. In this case, the service

62
level denotes the delivery of goods being made by the 3PL trucking on behalf of CCX.
Since the case company is seeking to modify service levels in order to utilize available
resources such as a truck’s capacity. For CCX, to utilize the resource’s capacity properly
will generate more output in the form of revenues by delivering a greater number of prod-
ucts. Also, utilizing the existing resource to its potential will increase the logistics flexibility
to handle volume and demand fluctuations. To be able to move forward with this modifi-
cation, it requires to analyze the proposed mode of transportation and measure its impact
on most of the prioritized factors surrounding logistics costs. In the next section, the dis-
cussion takes place considering this background and tries to justify the arguments ac-
cording to research objectives.
6.1.1 Business Objectives and Key Questions
At the beginning of the research, considering the scope of topic and research objective,
the following three research key questions formulated:
How can the logistics service levels be evaluated in the proposed logistics activity?
What developments are needed to increase the logistic service quality?
What challenges and risks are associated with the proposed mode of transportation?
The first research question asks the process of evaluating the logistics service level.
Since the phenomena of logistic service level is known at the CCX but the procedure
and metrics to measure the LSL was unknown. In the literature, there were underlined
aspects of evaluating LSL based on the hard objectives of LSL including time, cost and
quality (Harrison, 2014, p. 19). In the proposed logistics activity, the LSL was evaluated
by measuring the quality of service being offered. LSQ Since, quality of service in the
context of CCX is comprised of prioritized factors that include lead time, transportation
costs and order delivery quality. This modular approach helped to conceive the idea of
evaluating the service level with the aspect of service quality by measuring the hard
objectives. It can act like a standard process at least in the context of the aftersales
department.
The second research question demands to explore the concept of logistics service qual-
ity from measuring the performance point of view. In the literature chapter 2.2, it has
been established that logistics service quality is the customer service that the responsible
entity provides. It has a direct impact on the end-customer satisfaction. Afterward, the
features of service quality were discussed which included analyzing the influence of each
feature on the customer’s satisfaction including timeliness and order delivery quality
(Saura , et al., 2008). For the CCX, the logistics service quality was analyzed for the
63
proposed logistics activity. In the subchapter 5.2 and 5.3, the features of service quality
are analyzed both quantitatively and qualitatively to identify the impact on the service
quality because of the proposed mode of transportation. The proposed activity brings the
fruitful result to increase the logistics flexibility, reduced lead time and resource utiliza-
tion. However, the areas of development to improve service quality are also discussed
which includes the order delivery quality. The order delivery quality has proven to be
questionable in the proposed logistics activity because of high dependency on 3PL truck-
ing company material handling and most importantly required input from the central
warehouse is a big hurdle. The second research question has been countered effectively
both in the literature and empirical analysis from the case company’s perspective.
The third research question is more generic in nature, but the company-specific chal-
lenges and risks have been discussed throughout the study especially subchapter 5.3
dialogs more about different problem scenarios. Sensitivity analysis has been performed
in the subchapter 5.3 to determine the uncertainty of contributing cost elements in the
proposed logistics study. The outcome in the form of percentage TCVA has been calcu-
lated by taking alternative assumptions about standard cost, transport cost, customer
discounts, and demand fluctuation. From the results, it was evident that there is no ex-
ternal immediate threat to the proposed idea because the CCX has substantial profit
margins to cover the gap. However, the same cannot be assumed for every product
since each product has different dimensions and customer purchasing price.
6.1.2 Case Study Results
Within the project, a current state analysis for the case company has been performed by
reviewing the company-specific service quality hard objectives which include lead time,
logistics cost and order delivery quality. First, the existing lead time of emergency order
was determined which is delivered by trucks. Furthermore, it was noticed that the EO
trucks on average were meeting its delivery KPIs related to lead time which took between
2-3 days to delivery order from the central warehouse in Amsterdam to Vantaa ware-
house. This review of lead time highlights its importance during the qualitative interviews
especially if the order has been backordered to suppliers or the expected arrival date is
uncertain. In this case, case company X faces a negative response to the logistics ser-
vice levels. That is why the importance of early deliveries is huge not only for EO but
also for SO. For the proposed logistics activity this was useful insight about lead time
current situation.
Second, the logistics costs of EO trucks were analyzed in the current state. The case
company pays the trucking company a fixed compensation under 100 € per cubic meter.

64
Therefore, the capacity of trucks being used, and its utilization were an important part to
consider transportation costs. For this study, only fixed transportation costs of under 100
euros were considered and overhead costs such as inventory holding costs and customs
clearance are being handled by the trucking company and were out of scope from this
study. After the historical tracking of trucks, an average of 4.85 sqm were available daily
in the EO truck. Although the CCX is not paying for the vacant space, this serves as an
opportunity to ship SO. The ambiguity in the current state was obvious because of a big
question, which products are optimal from cost and productivity factors to run a test-
model of this idea. Hence, the review of logistics costs also pointed to looking for optimal
products keeping in mind the transportation cost, but the specific cost elements and cri-
teria were yet to be defined.
Third, the order delivery quality has been highlighted as one of the most important ser-
vice quality objectives in the literature which has a direct impact on customer service
being negative or positive. Hence, the order delivery quality has been reviewed in the
subchapter 5.2.3 through the qualitative interviews. From the case company’s point of
view, the order delivery quality included shipping the right part, in the right condition at
the right time. Transport damages and information sharing about expected delivery time
play a major part in delivery quality. Even though the CCX provides a reverse logistics
service in case of transport damages, but it plays an important role in affecting customer
satisfaction regarding aftersales deliveries. Now, the dependency on the central ware-
housing team is becoming a big challenge for CCX to get the ETD. Even though the ETD
is share for 80% of the parts but only 20% or less affect the customers psychologically
especially in case of emergencies. A review of order delivery quality suggests that there
are plenty of areas of development which are discussed in this section below.
Moving forward with the proposed logistics activity to ship SO inside the EO trucks which
have on average 4.85 sqm space available. But what impact it might have on logistics
flexibility, communication, and overall cost structure. The sub-chapter 5.3 discussed
these questions in detail. The importance of product selection is vital to test-run this
model and therefore, to be on the safe side further analysis was performed on few fast-
moving products from inventory class A. Furthermore, the fixed cost of transporting
goods inside EO trucks was simplistic to use in the quantitative analysis. However, the
cost implications of each selected product were performed in section 5.3.2 in order to
analyze the logistics costs. Few evaluation percentages namely TCVA, TCF, and TCF were
introduced and each of these percentages reflected an aspect of the logistics costs so
that it can help in decision making and understanding the overall cost behavior.
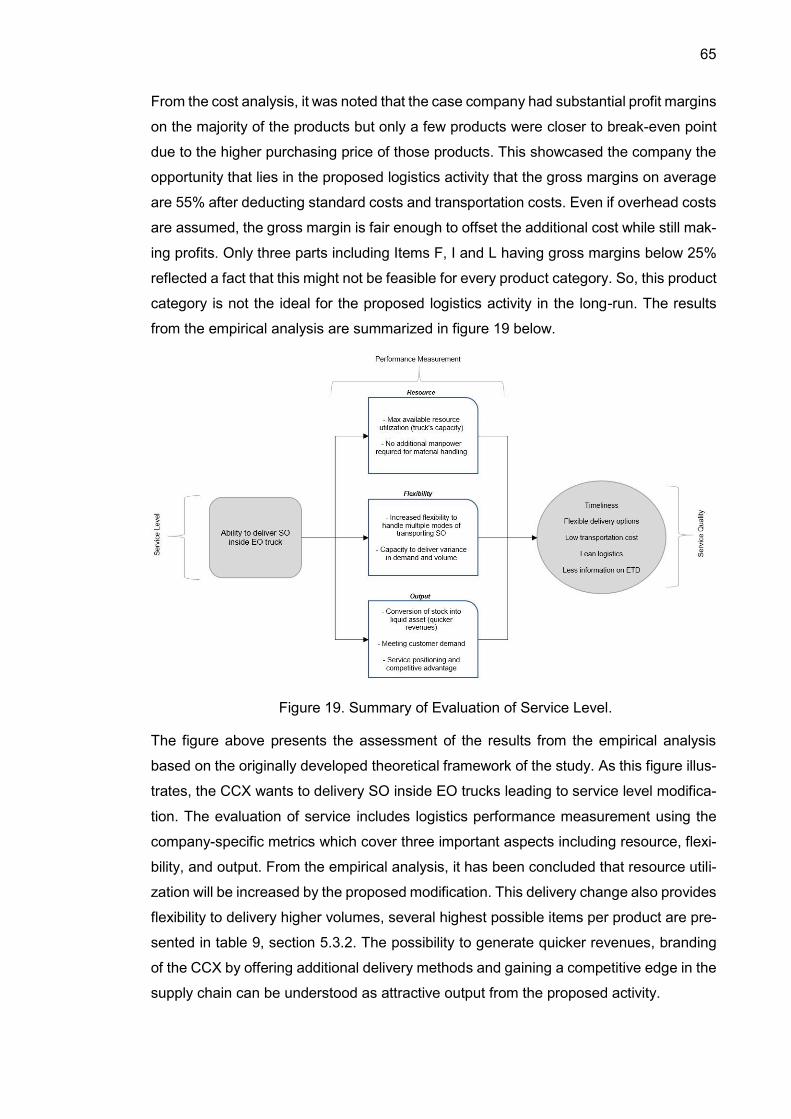
65
From the cost analysis, it was noted that the case company had substantial profit margins
on the majority of the products but only a few products were closer to break-even point
due to the higher purchasing price of those products. This showcased the company the
opportunity that lies in the proposed logistics activity that the gross margins on average
are 55% after deducting standard costs and transportation costs. Even if overhead costs
are assumed, the gross margin is fair enough to offset the additional cost while still mak-
ing profits. Only three parts including Items F, I and L having gross margins below 25%
reflected a fact that this might not be feasible for every product category. So, this product
category is not the ideal for the proposed logistics activity in the long-run. The results
from the empirical analysis are summarized in figure 19 below.
The figure above presents the assessment of the results from the empirical analysis
based on the originally developed theoretical framework of the study. As this figure illus-
trates, the CCX wants to delivery SO inside EO trucks leading to service level modifica-
tion. The evaluation of service includes logistics performance measurement using the
company-specific metrics which cover three important aspects including resource, flexi-
bility, and output. From the empirical analysis, it has been concluded that resource utili-
zation will be increased by the proposed modification. This delivery change also provides
flexibility to delivery higher volumes, several highest possible items per product are pre-
sented in table 9, section 5.3.2. The possibility to generate quicker revenues, branding
of the CCX by offering additional delivery methods and gaining a competitive edge in the
supply chain can be understood as attractive output from the proposed activity.
Figure 19. Summary of Evaluation of Service Level.
66
The results of the empirical analysis evidently point out the fact that the proposed has
some potential opportunities to impressing customer satisfaction positively while some
areas of the activity are still grey. First, this delivery method will take 2-3 days on average
to delivery SO while the regular shipping method of SO takes 3-5 weeks. So, shorter
lead times are attainment emerging from this idea. Secondly, Flexible delivery options
will enable the CCX to gain a competitive edge in the fierce market while also allowing
the inventory controller to release tied-up inventory in the form of safety stocks. An inter-
esting idea can be to analyze the possible impact on safety stock, but this becomes out
of scope for this study. The third takeaway from this study the possibility to make logistics
operation as lean as possible because the lead times are shorter; therefore, in an ideal
scenario there will no need to keep a large stock of inventories at least for the prioritized
SO orders to be delivered by EO trucks. The right product in the right quantity can be
delivered at the right time but the challenge will be to maintain adequate stock at the
central warehouse as well. However, this is not the only challenge that CCX will have to
face. The order delivery quality still needs more investigation and dialogue to take place
between the trucking company, central warehousing team and CCX logistics units. The
main idea is to improve the material handling issues on the trucking side to reduce
transport damages. Furthermore, the situation regarding the launch of the Alias system
at the central warehouse is to be understood. Otherwise, the products which usually do
not have ETD should not be shipped by EO trucks.
6.2 The implication of Results in Literature
The focus of the study was to evaluate LSL in the proposed logistics model but the de-
tection of LSL in the case company context was missing. Before the case company can
evaluate LSL, the interrelation between LSL, service quality and customer impact
needed to understand. The literature sources showed that the logistics service level is
defined as the service offered to its customers. The level of that service assesses the
performance of logistics based on essential factors which are also known as the logistics
service quality. The success of the business lies in the quantification of service quality
and its essential elements (Miricesu, 2013). Hence, multiple frameworks and perspec-
tives have been discussed to determine the essential factors of service quality. One per-
spective from (Parasuraman, et al., 1988) states that service quality is like behavior and
approach of an organization towards the superiority of its offered service. Furthermore,
few researchers have presented specific elements of quality including timeliness, quality
of information, condition of order as the most important set of dimensions to measure

67
logistics performance (Rutner & Langley, 2000). Although the term quality is highly sub-
jective, in the sphere of logistics some case company-specific elements of service quality
needed to be understood out of many discussed elements.
Generally, the key performance indicators are also used by an organization to evaluate
the success of any operation. In this scenario, the case company’s existing KPIs were
not telling the whole story needed to make a decision regarding the proposed activity.
Hence, to find the impact and consequences of service quality, different surveys and
literature work were studied. From the previous work, it was determined that the main
consequences of service quality are satisfaction and loyalty (Saura , et al., 2008). Even
though the satisfaction has been interpreted as customer retention but the interesting
area to explore was how to assess the service quality to determine the satisfaction level.
To answer this, a consequence chain model was presented in figure 6, according to the
model there exists a causal relationship between elements of service quality and cus-
tomer satisfaction. Among all the elements of service quality, timeliness and order deliv-
ery quality were found as the most significant dimension of service quality (Saura , et al.,
2008).
Now that the concept of service quality has been established, but it still has to be deterred
how to calculate it. Hence, a performance measurement system as a standard procedure
for the case company by introducing metrics. A performance measurement system plays
an important role because it offers the necessary information for decision making and
behavior (Gunasekaran & Kobu, 2007). As further said in the literature that if there are
no measurements in logistics, then there are no improvements (Kaplan, 1990). Having
understood that, a performance measurement framework was developed in chapter 3,
figure 9 which illustrated the fact that the management can act as a driver to control the
outcome of proposed logistics activity. The PMS is based on three main elements of
metrics, whose objectives are to satisfy different stakeholders. As said by (Beamon,
1999), resource, output, and flexibility are the most important metrics in logistics perfor-
mance. That is why in CCX context, a resource was considered as a daily incoming EO
truck, quicker delivery of SO as the main output and ability to offer multiple modes of
transportation for the company and reduced logistics internal costs as flexibility emerging
from the proposed model.
Furthermore, reviewing the literature suggested that the effectiveness of the proposed
logistics activity can be summarized if it offers quality and meets customer satisfaction
(Dörnhöfer, et al., 2016). As explained by the researchers, automotive logistics need
hierarchical PMS that includes KPIs, and metrics that will affect the service quality and
ultimately influence customer satisfaction. Thus, the two important components of the

68
service quality which are also applicable in CCX context include timeliness and order
delivery quality (Saura , et al., 2008). Customers that are sensitive to the response of an
organization and adaptability to their requirements are the key competitive advantages
that a company needs to gain (Miricesu, 2013). Hence, the aforementioned arguments
were found to be true in the case company, where the company has received few nega-
tive responses on orders being delivered late and mostly the ability to not share ETD
information with the customers.
6.3 Action Plan and Challenges
This research has contributed to the case company is paving the way to understand the
complexity of the logistics and provided facts and data regarding the proposed mode of
transportation. In CCX, logistics service quality was not measured in the way it is sug-
gested in this research. However, after utilizing previous literature, important and rele-
vant elements of service quality were determined, and measurement methods were un-
derstood and summarized by developing a framework. Using the framework as base
work, the current state analysis of the case company was performed in terms of essential
service quality dimensions including lead time, costs and order delivery quality. Since
CCX has thousands of active part numbers, using qualitative interviews and action re-
search, few fast-moving parts were prioritized to perform quantitative analysis. After de-
veloping the evaluation framework, a cost matrix was developed to perform analysis. The
economic evaluation from the cost matrix showed that company X has enough margins
to proceed with the proposed activity. To investigate the sustainability of the proposed
activity, a sensitivity analysis was done which also indicated positive outcomes, but the
key message is that; the proposed activity is not suitable for all the products due to the
difference in margins. Even though this research provides a constructive conclusion to-
wards the proposed logistics activity, but it only considers gross margins and the fast-
moving product category. This means that it serves as a good starting point to deeply
investigate if company X decides to start the delivery at a bigger scale.
Nevertheless, the generated action plan consists of concrete steps based on case study
analysis and evaluation of logistics service levels for the proposed modification in the
mode of transportation. Table 11 below presents the suggested action plan for the case
company when starting a pilot project.

69
What Who How
Reviewing product groups
based
Parts Manager
and Logistics
team
Categorization of products based on the proposed
model, review product selection criteria
Analyze and record the safety
stock and current stock
Inventory con-
troller
Manually track-record the safety stock and random
inventory checks through LMS
Dialogue with central ware-
housing team to revise order
processing, ETD and shipping
process
Central ware-
housing and
CCX
Performing current state analysis, reducing process
wastages. Vertically integrated information flow with
suppliers for backorders and/or only choose prod-
ucts with available ETD
Review of a received delivery
quotation from trucking com-
pany
Central ware-
housing team
Reviewing quoted transportation costs and trying to
find room for negotiations on economies of scale or
volume discounts
Negotiation and dialogue with
trucking company on material
handling, lead time and deliv-
ery costs
Central ware-
housing, CCX,
and 3PL truck-
ing company
Review and negotiations on economies of scale or
volume discount. To impact delivery quality posi-
tively, improve material handling procedure to avoid
damages
Review current order-take and
scheduling process
Inventory con-
troller and
helpdesk
For selected products, the order-take process can
be altered to receive the deliveries efficiently
Test a pilot-run project CCX, central
warehousing,
3PL provider
A pilot project should be run for 3 months, analyze
overall costs including overhead, evaluate the pro-
cess productivity and forecast future demand to ex-
tend the delivery option for other products
Continuous evaluation of logis-
tics service quality
CCX logistics
team
An update to existing logistics KPIs can be made to
include timeliness and order delivery quality. Stand-
ardize best practices and sustain
The action plan provided in table 11 summarizes the action items that can be taken to
jump-start the project because the initial evaluation of the proposed service level seems
to be promising for the case company. However, with new opportunities comes new
challenges and the challenges included in this pilot-project from the case-company con-
text can be following.
Table 11. Action plan and recommendations.

70
• Right categorization and product selection are the first emerging challenge. Since
CCX launches new products for the new vehicle models each year. So, updating
the masterfiles and cost matrix for the new products will be required.
• Getting the ETD for the parts belonging to aging vehicle models is always a chal-
lenge because in some cases suppliers stop producing the parts. Even though
the reliable delivery times, in this case, allow inventory controller or LMS to intel-
ligently guesstimate the arriving time but more reliable way should be determined
together with the central warehousing team.
• Dynamics in customer preferences regarding certain parts can beget demand
fluctuations. In order to tackle this, either tentative forecasting can be done, or
continuous monitoring of the part’s demand will be required.
• In order to gain a competitive edge in the market, CCX offers certain seasonal
products in campaigns and discounts. A background gross-margin check should
be performed separately for the SO delivered by trucks. Especially in case of
dangerous goods as it can easily reach the alarming gross margins.
• The proposed idea will require a restructuring of logistical processes, physical
and information flow. A huge challenge will be to reform each process not only
physically but also reorganization in the LMS will be required for proper and re-
newed invoicing and billing of the customers.
Despite possible challenges, the countermeasures exist to tackle the issues. In conclu-
sion, the need for logistics activity is justifiable enough now to only start the pilot-project.
After the test-run evaluation, it should be reviewed again only for the parts that generate
most of the business revenues with fair demand.
6.4 Limitations and Criticism
While the study aims at presenting a framework for the case company to analyze pro-
posed service levels, however, logistics service quality should not be compromised to an
alarming situation. Despite supporting the study and conclusion with theoretical and em-
pirical analysis, some observable limitations still exist. The first being case company-
specific solution. Since the thesis was done for an automotive industry so the proposed
action plan to the challenges are rather unique and cannot be generalized.
Second, even though the empirical analysis shows that CCX has substantial gross mar-
gins and products with high demand can be first-mover items to start with. However, the
product selection is still questionable. Within the case company, there was a notion that
71
“fast-moving products are rather shipped by sea than the roads”. This perspective needs
more dialogue to define the product selection criteria accurately. Furthermore, as this
case study only considered the fixed transportation costs of deliveries by trucks. Other
overhead and warehousing costs are not analyzed, therefore, the net profit can dubious
for certain products and it makes the case-study analysis rather shallow considering the
actual net. The developed cost-matrix is accurate for a time-being because the case
company goes through annual price changes once or sometimes twice. Hence, the ac-
curacy of the cost matrix can be outdated and will need proper monitoring.
Third, a part of data collection has been done through qualitative interviews. It has been
argued in the literature as well that the reliability of semi-structured interviews can be
questionable due to some interviewee’s biasness and generalization of things
(Saunders, et al., 2009, pp. 326-336). Even though the interviews were done in a pro-
fessional environment and the interviewees have been working in the industry for more
than 5 years. So, their experience does add value to understanding case study problems
and possible countermeasures but still, it does not necessarily ensure the generalization
and extrapolation of the results. More investigation and research due to changing busi-
ness environment should be performed. Finally, the results of the case study analysis
meant to help company managers in the pre-launch stage of the project. Therefore, the
conclusions and the after-effects of the results can only be validated in a post-launch
stage which was out of scope for this study.
6.5 Directions for Future Research
Although the literature regarding the evaluation of logistics service levels was limited to
the service level concept and performance measurement of the supply chain from ser-
vice quality point of view will enhance. But the results and constraints emerging from this
research point out the following potential research topics.
One approach is to research the effect of logistics service levels onto the safety stock
from monitory perspective. Since inventory and safety stocks are treated as operating
assets which are required in daily logistics operations to generate revenue for the af-
tersales department. Whether it is related to changing the mode of transportation for all
the SO from shipping containers to trucks or for only a few prioritized SO, the effect on
the safety stock and tied-funds in the form of monetary value can be analyzed. Also, the
correlation between safety stock and lean logistics is interesting to explore from theoret-
ical concepts. The idea is to determine if the proposed logistics activity is leaner or is it
investment intensive in the form of operating assets rather than being liquid assets.

72
Secondly, it would be interesting to validate the service level after it has been initiated
by the CCX. The proposed framework in this study can be used and developed further
to analyze the important factors of service quality including internal logistics costs but
also considering the overhead costs, lead time and order delivery quality. Historical track
record of customer complaints regarding transport damages and missing ETD infor-
mation can be used to review and improve order delivery quality.
73
7. REFERENCES
Bagchi, P. K., 1996. Role of Benchmarking as a Competitive Strategy: The Logistics
Experience. International Journal Physical Distribution and Logistics, 26(2), pp. 4-22.
Beamon, B. M., 1999. Measuring Supply Chain Performance. International Journal of
Operations & Production Management, 19(3), pp. 275-292.
Beck, S. E. & Manuel, K., 2008. Pratical Research Methods for Librarians and
Information Professional. Neal-Schuman Publishers, p. 309.
Bennett, D. & Klug, F., 2012. Logistics Supplier Integration in the Automotive Industry.
International Journal of Operations & Production Management , 32(11), pp. 1281-1305.
Beresford, A. K. & Pettit, S. J., 2017. International Freight Transport: Cases,
Structures and Prospects. 1st toim. New York: Kogan Page.
Bianchini, A., Benci, A., Pellegrini , M. & Rossi , J., 2019. Supply Chain Redesign for
Lead-Time Reduction Through Kraljic Purchasing Portfolio and AHP Integration.
Benchmarking: An International Journal , 26(4), pp. 1194-1209.
Chow, K. H., Choy, K. L. & Lee, W. B., 2006. On the Design of a Real-Time
Knowledge-Based System For Managing Logistics Operations. Intelligent Systems in
Accounting, Finance and Management, Osa/vuosikerta 14, pp. 3-25.
Choy, K. L., Leung, D. W., Li, C. & Lau, H., 2007. Managing Uncertainty in Logistics
Service Supply Chain. International Journal of Risk Assessment and Management, 7(1),
pp. 19-43.
Dörnhöfer, M. & Günthner , W. A., 2017. A Research and Industry Perspective on
Automotive Logistics Performance Measurement. The International Journal of Logistics
Management, 28(1), pp. 102-126.
Dörnhöfer, M., Schröder, F. & Günthner, W. A., 2016. Logistics Performance
Measurement System for the Automotive Industry. Logistics Research, Springer Berlin
Heidelberg, 9(1), pp. 1-26.
Everaert, P. ym., 2008. Cost modeling in logistics using time-driven ABC. International
Journal of Physical Distribution & Logistics Management, 38(3), pp. 172-191.
Farahani, R. Z., Rezapour, S. & Kardar, L., 2011. Logistics Operations and
Management. Houston: Elsevier.
74
Gattorna, J. & Martin, C., 1990. Developing Customer Service Strategies: Handbook
of Physical Distribution Management. 4th toim. s.l.:Gower Publishing Company Ltd.
Ghiani, G., Laporte, G. & Musmanno , R., 2013. Introduction to Logistics Systems
Management. 2nd toim. s.l.:John Wiley & Sons, Incorporated.
Gilmore, D., 2002. Achieving Transportation Excellence. World Trade, 15(11), pp. 36-
38.
Grossman, M., 2004. The Role of Trust and Collaboration in the Internet-Enables
Supply Chain. Journal of American Academy of Business, 5(1), pp. 391-396.
Gummesson, E., 2017. Case Theory in Business and Management : Reinventing
Case Study Research. 1st toim. s.l.:SAGE Publications.
Gunasekaran, A. & Kobu, B., 2007. Performance Measures and Metrics in Logistics
and Supply Chain Management: A Review of Recent Literature. International Journal of
Production Research, 45(12), pp. 2819-2840.
Hakim, I. M., Zaqiah , R. O. & Zagloel, Y. M., 2018. Optimization of Inbound Logistics
Cost in Automotive Industry. MATEC Web of Conferences, 204(02007), pp. 1-7.
Harrison, A., 2014. Logistics Management and Strategies: Competing through
Logistics. 5th toim. s.l.:Pearson Education UK.
Hertz , S. & Alfredsson, M., 2003. Strategic Development of Third Party Logistics
Providers. Industrial Marketing Management, 32(1), pp. 139-149.
Heskett, J. L., Glaskowsky, A. N. & Ivie, R. M., 1973. Business Logistics - Physical
Distribution and Materials Management. New York: Ronald Press.
Hokey , M. & Sean, B., 1994. An Integrated Decision Support System for Global
Logistics. International Journal of Physical Distribution & Logistics Management, 24(1),
pp. 29-40.
Kaplan, R. S., 1990. Editor. Measures for Manufacturing Excellence. Boston: Harvard
Business School Press.
Leech, N. L. & Onwuegbuzie, A. J., 2009. A Typology of mixed Methods Research
Designs. Springer Netherlands, 43(2), pp. 265-275.
Matta, C., 2019. Qualitative Research Methods and Evidential Reasoning. SAGE
Publishers, 49(5), pp. 385-413.

75
Miricesu, D., 2013. Study Regarding the Customer Satisfaction Evaluation
Considering the Logistics Service Level. Valahian Journal of Economic Studies, 4(18),
pp. 65-72.
Neely, A., Platts, K. & Gregory, M., 1995. Performance Measurement System Design.
International Journal of Operations and Production Management, 15(4), pp. 80-116.
Neto, M. & Pires, S., 2012. Performance Measurement in Supply Chains: A Study in
the Automotive Industry. Gestão & Produção, 12, 19(4), pp. 733-746.
Nossack, J. & Pesch, E., 2013. A Truck Scheduling Problem Arising in Intermodal
Container Transportation. European Journal of Operation Research, 230(3), pp. 666-
680.
Parasuraman, A., Zeithaml, V. A. & Berry, L. L., 1988. SERVQUAL: a multiple-item
scale for measuring consumer perceptions of service quality. Journal of Retailing, 64(2),
pp. 2-40.
Peng, P., Synder, L. V., Lim, A. & Liu, Z., 2011. Reliable Logistics Networks Desgin
with Facility Disruptions. Transporation Research, Elsevier, 2(45), pp. 1190-1211.
Riopel, D., Langevin, A. & Campbell, J. F., 2005. Teoksessa: The Network of Logisics
Decisions: Definition and Optimization. New York: Springer, pp. 1-38.
Rutner, S. M. & Langley, C. J., 2000. Logistics value: definition, process and
measurement. International Journal of Logistics Management, 1(2), pp. 73-82.
Sabadka, D., 2015. New Trends and Challenges in Automotive Industry Logistics
Operations. International Scientific Journal about Logistics, 2(1), pp. 15-19.
Saunders, M., Lewis, P. & Thornhill, A., 2009. Research Methods for Business
Students. 5th toim. s.l.:Prentice Hall.
Saura , I. G., Contrı , G. B., France ´s , D. S. & Blasco, M. F., 2008. Logistics Service
Quality: A New Way to Loyalty. Industrial Management & Data Systems, Emerald
Publishing, 108(5), pp. 650-668.
Slack, N., 1983. Flexibility as a Manufacturing Objective. International Journal of
Operations & Production Management, 3(3), pp. 4-13.
Teunter, R. H., Babai, M. Z. & Syntetos, A. A., 2010. ABC Classification: Service
Levels and Inventory Costs. Prodiction and Operations Management, 19(3), pp. 343-
252.
Vannieuwenhuyse , L. & Pintelon , L., 2003. An Online Decision Support System for
Transportation Mode Choice. Logistics Information Management, 16(2), pp. 125-133.

76
Wagner, S. M., Jönke, R. & Eisingerich, B. A., 2012. A Strategic Framework for Spare
Parts Logistics. University of Claifornia, California Management Review, 54(4), pp. 69-
92.
Wang, X. & Zhang, J., 2010. System Measurement Research on Supply Chain, In:
Proceeding - 3rd International Conference on Information Management, Innovation
Management and Industrial Engineering. Kunming, IEEE.
Wilson, V., 2016. Research Methods: Interviews. University of Alberta, 11(1), pp. 47-
49.
Zeng, A. Z. & Rossetti, C., 2003. Developing a Framework for Evaluating the Logistics
Costs in Global Sourcing Processes. International Journal of Physical Distribution &
Logistics Management , 33(9), pp. 785-803.