Embed Size (px)
Citation preview

Evaluation of Insecticides and Insecticide Use Patterns for Management of Thrips and Iris Yellow Spot Virus 145
EVALUATION OF INSECTICIDES AND INSECTICIDE USE PATTERNS FOR MANAGEMENT OF THRIPS AND IRIS YELLOW SPOT VIRUS Stuart Reitz, Malheur County Extension, Ontario, OR, 2015 Clint Shock, Erik Feibert, Alicia Rivera, Lamont Saunders, Malheur Experiment Station, Ontario, OR Eric Jemmett, Jemmett Research Farms, Parma, ID
Overview Onion thrips and the iris yellow spot virus that these thrips vector are major limiting factors for onion production in the Treasure Valley. There are about 20,000 acres of onions produced within a 50-mile radius of Ontario, Oregon. This high concentration of onions makes for unique production challenges, especially for onion thrips and iris yellow spot virus management. Thrips are able to rapidly develop resistance to insecticides, and new insecticides may rapidly lose their effectiveness. Therefore, it is important to assess the effectiveness of currently registered insecticides and to develop alternative management methods as part of an overall integrated pest management (IPM) program.
We conducted two field experiments to evaluate different insecticide management programs, with products applied in various sequences over the growing season. One trial consisted of 18 different treatment regimes, with products applied by foliar application. The second trial was designed to compare treatment regimes in which products were applied by drip application or by foliar application.
Trial 1: Foliar Insecticide Trial Materials and Methods Cultural practices Onion seed of variety ‘Vaquero’ was planted at 150,000 seeds/acre on March 10, 2015. Emergence started on March 30. The field had drip tape laid at 4-inch depth between 2 onion beds during planting. The drip tape had emitters spaced 12 inches apart and an emitter flow rate of 0.22 gal/min/100 ft (T-Tape, Rivulis USA, San Diego, CA). The distance between the tape and the center of each double row of onions was 11 inches.

Evaluation of Insecticides and Insecticide Use Patterns for Management of Thrips and Iris Yellow Spot Virus 146
Onions were irrigated automatically to maintain the soil water tension (SWT) in the onion root zone below 20 cb. Soil water tension was measured with six granular matrix sensors (GMS, Watermark Soil Moisture Sensors Model 200SS, Irrometer Co., Riverside, CA) installed at 8-inch depth in the center of the double row. Sensors had been calibrated to SWT. Irrigations were run by a controller programmed to irrigate twice a day applying 0.48 inch of water per irrigation. A Watermark Electronic Module (WEM, Irrometer Co.) was adjusted to override controller irrigations if the SWT was below 20 cb. Four Watermark sensors were connected to the WEM. The last irrigation was on August 24.
For weed control, the following herbicides were applied: on March 30, Roundup PowerMax® at 24 oz/acre was broadcast; on May 1, GoalTender® at 0.09 lb ai/acre (4 oz/acre), Buctril® at 0.25 lb ai/acre (16 oz/acre), and Poast® at 0.25 lb ai/acre (16 oz/acre) were broadcast; on May 4, Prowl® H2O at 0.83 lb ai/acre (2 pt/acre) was broadcast.
For disease control, Badge® fungicide at 0.28 lb ai/acre (1 pt/acre) was broadcast aerially on June 4.
URAN at 20 lb nitrogen (N)/acre was applied through the drip tape weekly starting May 28 and ending June 24, totaling 100 lb N/acre.
Foliar insecticide applications Insecticides were applied weekly beginning May 26, according to the schedule and rates listed in Tables 1 and 2. Five experimental treatments were compared to an untreated check treatment and a standard insecticide treatment. Insecticides were applied with a CO2 backpack sprayer using a 4-nozzle boom with 11004 nozzles at 30 psi and 35 gal/acre.
Data collection Weekly thrips counts were made, starting on May 4 (before applications began). Thrips counts were made by counting the number of thrips on 10 consecutive plants in one of the middle two rows of each plot. Adult and larval (immature) thrips were counted separately. Each treatment plot was 4 double rows wide by 23 ft long.
Onions in each plot were evaluated subjectively for severity of symptoms of iris yellow spot virus (IYSV) and thrips feeding damage on August 8. Ten consecutive plants in one of the middle two rows of each plot were rated on a scale of 0 to 4 of increasing severity of symptoms or feeding damage. Separate ratings were made for the inner, middle, and outer leaves of each plant to estimate damage occurrence over the course of the growing season.
The rating scale was as follows:
Rating IYSV lesions (% foliage with lesions)
Feeding damage (% foliage with scarring)
0 0 0 1 1–25 1–25 2 26–50 26–50 3 51–75 51–75 4 76–100 76–100

Evaluation of Insecticides and Insecticide Use Patterns for Management of Thrips and Iris Yellow Spot Virus 147
Onions were lifted on August 31 and were topped and bagged on September 7. Onions from the middle two double rows in each plot were topped by hand and bagged on September 16 and placed in storage. The onions from each plot were graded on October 12 and 13. During grading, bulbs were separated according to quality: bulbs without blemishes (No. 1s), split bulbs (No. 2s), neck rot (bulbs infected with the fungus Botrytis allii in the neck or side), plate rot (bulbs infected with the fungus Fusarium oxysporum), and black mold (bulbs infected with the fungus Aspergillus niger). The No. 1 bulbs were graded according to diameter: small, medium, jumbo, colossal, and supercolossal. Bulb counts per 50 lb of supercolossal onions were determined for each plot of every variety by weighing and counting all supercolossal bulbs during grading. Marketable yield consisted of No.1 bulbs in the medium or larger size classes (larger than 2¼ inches).
Results and Discussion Temperatures were warmer throughout the growing season in 2015 than the 30-year historical averages (Fig. 1). The warm early spring temperatures likely contributed to an early buildup of thrips populations.
Figure 1. Comparison of the accumulated degree-days for 2015 versus the 30-year average, as recorded at Ontario, OR. The upper line represents the 2015 degree days (base 50°F), and the lower line represents the historical averages.
Treatments began when thrips populations were approximately four adults per plant and few larvae were present.
Season-long control of adult thrips was best in programs that used early season applications of Movento®. The program with tank-mixing of Requiem® was effective, but control was no better than corresponding programs without Requiem.

Evaluation of Insecticides and Insecticide Use Patterns for Management of Thrips and Iris Yellow Spot Virus 148
Programs that started with Aza-Direct® showed a lack of control but applications of Movento that followed improved control. This delayed use of Movento may make better use of Movento’s residual control of immatures when thrips populations are peaking in late June and early July. Delayed use of Movento may require combination with an effective adulticide to prevent populations from building too rapidly.
Early season applications of Radiant® kept larval thrips numbers low; however, control in this program (no. 10) was reduced as the residual effect of Radiant dissipated and Movento had not built to effective levels. The second application of Movento improved control.

Evaluation of Insecticides and Insecticide Use Patterns for Management of Thrips and Iris Yellow Spot Virus 149
Table 1. Insecticide sequences treatments tested for efficacy against onion thrips and iris yellow spot virus. Malheur Experiment Station, Oregon State University, Ontario, OR, 2015. Sequences with unregistered products are not listed.
Application date
May 26 Jun 2 Jun 9 Jun 16 Jun 23 Jun 30 Jul 6 Jul 13
Treatment 1st 2nd 3rd
Application number
4th 5th 6th 7th 8th
1 Control - - - - - - -
2 Movento Movento Agri-Mek Agri-Mek Radiant Radiant Lannate Lannate
3 M-Pede + Aza-Direct
Aza-Direct + Movento
Movento Captiva 11 oz Lannate + Captiva 7 oz
Lannate + Captiva 7 oz
Radiant Radiant
4 M-Pede + Azadirect
Azadirect + Movento
Movento Captiva 11 oz Agri-Mek + Capitva 7 oz
Agri-Mek + Capitva 7 oz
Radiant Radiant
5 M-Pede + Aza-Direct
Movento + Aza-Direct
Movento Lannate Radiant + M-Pede
Radiant + M-Pede
6 Movento + PureSpray Green 0.25 gal
Movento + PureSpray Green 0.25 gal
Agri-Mek + PureSpray Green 0.25 gal
Agri-Mek + PureSpray Green 0.25 gal
Radiant + PureSpray Green 0.25 gal
Radiant + PureSpray Green 0.25 gal
Lannate + PureSpray Green 0.25 gal
Lannate + PureSpray Green 0.25 gal
7 PureSpray Green 1 gal
PureSpray Green 1 gal
Movento + PureSpray Green 0.5 gal
Movento + PureSpray Green 0.5 gal
Agri-Mek + PureSpray Green 0.5 gal
Agri-Mek + PureSpray Green 0.5 gal
Radiant + PureSpray Green 0.5 gal
Radiant + PureSpray Green 0.5 gal
8 PureSpray Green 2 gal
PureSpray Green 2 gal
Movento + PureSpray Green 0.5 gal
Movento + PureSpray Green 0.5 gal
Agri-Mek + PureSpray Green 0.5 gal
Agri-Mek + PureSpray Green 0.5 gal
Radiant + PureSpray Green 0.5 gal
Radiant + PureSpray Green 0.5 gal

Evaluation of Insecticides and Insecticide Use Patterns for Management of Thrips and Iris Yellow Spot Virus 150
Application date
May 26 Jun 2 Jun 9 Jun 16 Jun 23 Jun 30 Jul 6 Jul 13
9 PureSpray Green 1 gal
PureSpray Green 1 gal
Movento + PureSpray Green 0.5 gal
Movento + PureSpray Green 0.5 gal
Agri-Mek + PureSpray Green 0.5 gal
Agri-Mek + PureSpray Green 0.5 gal
PureSpray Green 1 gal
PureSpray Green 1 gal
10 Radiant Radiant Movento Movento Lannate Lannate Agri-Mek Agri-Mek
11 Movento Movento Radiant Radiant Lannate Lannate Agri-Mek Agri-Mek
12 Agri-Mek Agri-Mek Movento Movento Radiant Radiant Lannate Lannate
16 Movento + Lannate
Movento Agri-Mek Agri-Mek Radiant Radiant Lannate Lannate
17 Movento
(Admire soil drench 4/23)
Movento Agri-Mek Agri-Mek Radiant Radiant Lannate Lannate
18 Movento + Requiem 2 qt
(Admire soil drench 4/23)
Movento + Requiem 2 qt
Agri-Mek + Requiem 2 qt
Agri-Mek + Requiem 2 qt
Radiant Radiant Lannate Lannate
19 Movento + Requiem Prime 2 qt
(Admire soil drench 4/23)
Movento + Requiem Prime 2 qt
Agri-Mek + Requiem Prime 2 qt
Agri-Mek + Requiem Prime 2 qt
Radiant Radiant Lannate Lannate
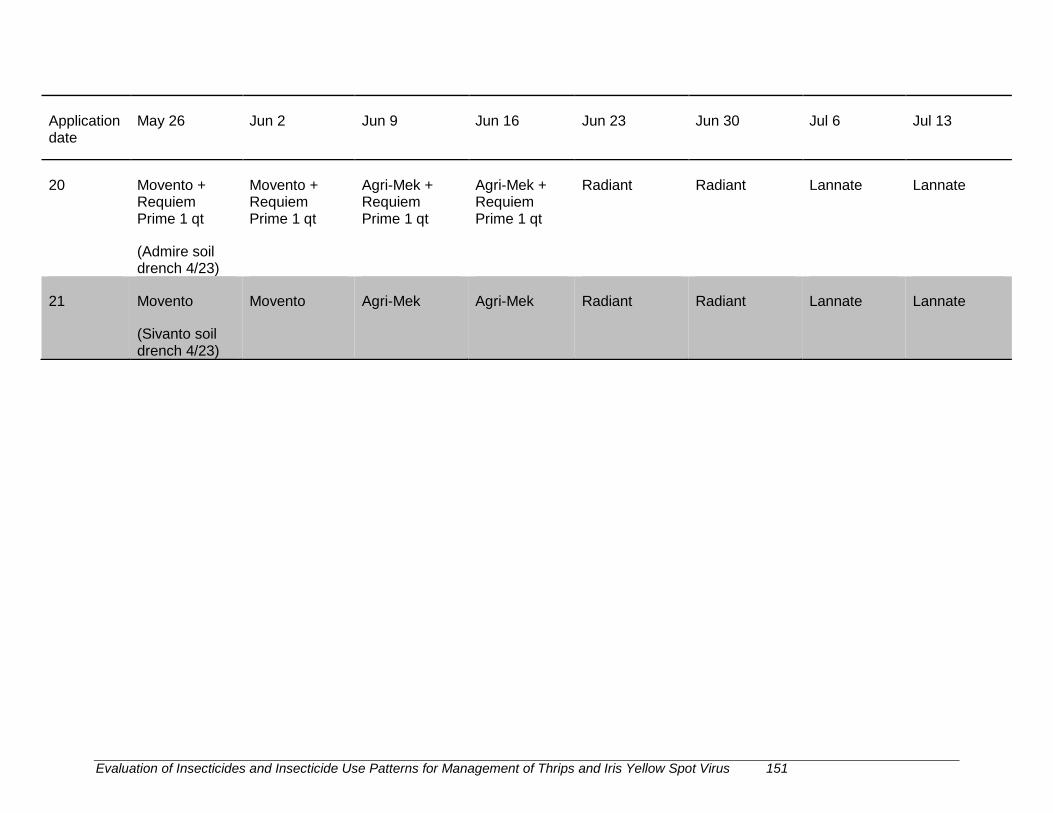
Evaluation of Insecticides and Insecticide Use Patterns for Management of Thrips and Iris Yellow Spot Virus 151
Application date
May 26 Jun 2 Jun 9 Jun 16 Jun 23 Jun 30 Jul 6 Jul 13
20 Movento + Requiem Prime 1 qt
(Admire soil drench 4/23)
Movento + Requiem Prime 1 qt
Agri-Mek + Requiem Prime 1 qt
Agri-Mek + Requiem Prime 1 qt
Radiant Radiant Lannate Lannate
21 Movento
(Sivanto soil drench 4/23)
Movento Agri-Mek Agri-Mek Radiant Radiant Lannate Lannate

Evaluation of Insecticides and Insecticide Use Patterns for Management of Thrips and Iris Yellow Spot Virus 152
Table 2. Characteristics of insecticides tested in 21 foliar treatments for efficacy against onion thrips. Sequences with unregistered products are not listed. Please consult the label to determine appropriate uses. Malheur Experiment Station, Oregon State University, Ontario, OR, 2015. Product Company Rate (product
per acre) Adjuvant Active ingredient pH Mode of action
group Admire Pro Bayer 14 fl oz imidacloprid 6.5 4A Agri-Mek SC Syngenta 3.5 fl oz MSO 0.5% v/v abamectin 7.0 6 Aza-Direct Gowan 12 fl oz - azadirachtin unknown Captiva Gowan 7/11 fl oz capsacin oleoresin, garlic
oil, soybean oil 7.0 unknown
Lannate LV DuPont 3 pt Preference 0.25% v/v
methomyl 5.0 1A
M-Pede Gowan 5.6 pt - potassium salts of fatty acids unknown Movento Bayer 5 fl oz MSO 0.5% v/v spirotretramat 6.5 23 PureSpray Green
PetroCanada 0.25–2.0 gal None refined oil unknown
Radiant Dow 8 fl oz Dyne-Amic 3.75% v/v
spinetoram 7.0 5
Requiem EC Bayer 2 qt
synthetic terpenes derived from Chenopodium ambrosioides
unknown
Requiem Prime
Bayer 1–2 qt
synthetic terpenes derived from Chenopodium ambrosioides
unknown
Sivanto Bayer 21 fl oz flupyradifurone 6.5 4D

Evaluation of Insecticides and Insecticide Use Patterns for Management of Thrips and Iris Yellow Spot Virus 153
Table 3. Mean numbers of thrips (total) per onion plant listed by sampling date in response to 21 foliar insecticide programs. Insecticide applications were made weekly, beginning on May 28 and concluding on July 17. Malheur Experiment Station, Ontario, Oregon, 2015.
Treatment number
Mean total thrips/plant Sampling date
May 29 Jun 4 Jun 11 Jun 18 Jun 25 Jul 2 Jul 10 Jul 17
1 31.4 28.4 41.9 98.4 73.3 81.3 37.1 17.8 2 27.2 26.6 16.6 16.7 15.8 6.7 2.5 5.4 3 28.8 33.8 23.0 21.9 9.8 8.0 2.5 6.0 4 28.3 24.5 20.3 24.7 15.3 6.0 1.6 3.9 5 32.8 32.7 25.5 12.2 26.0 18.1 21.5 7.3 6 26.2 26.9 26.2 40.5 33.2 13.6 8.0 5.6 7 29.8 31.7 43.0 71.1 32.7 30.8 2.7 6.7 8 27.1 30.0 40.5 100.5 39.0 9.6 2.9 2.1 9 30.6 32.3 41.4 73.5 34.7 12.6 6.9 9.0
10 16.1 26.8 34.9 27.6 12.9 8.8 4.3 11.4 11 24.6 27.1 11.3 17.4 15.4 18.2 8.9 18.6 12 30.6 21.2 26.5 54.4 16.6 4.6 1.8 6.6 16 16.3 36.3 13.6 14.4 11.4 7.5 7.5 6.0 17 20.5 27.4 13.3 17.1 12.5 12.7 3.2 4.6 18 29.8 23.3 10.6 11.2 9.3 3.4 2.0 5.2 19 21.8 26.1 19.9 13.6 9.3 1.8 1.9 1.8 20 26.7 29.1 20.1 21.7 22.0 3.9 2.5 3.9 21 26.7 23.5 23.7 46.1 34.9 6.2 2.8 2.0

Evaluation of Insecticides and Insecticide Use Patterns for Management of Thrips and Iris Yellow Spot Virus 154
Table 4. Mean numbers of adult thrips per onion plant listed by sampling date in response to 21 foliar insecticide programs. Insecticide applications were made weekly, beginning on May 28 and concluding on July 17. Malheur Experiment Station, Ontario, Oregon, 2015.
Treatment number
Mean adult thrips/plant Sampling date
May 29 Jun 4 Jun 11 Jun 18 Jun 25 Jul 2 Jul 10 Jul 17
1 4.1 4.8 15.3 12.6 22.3 11.4 1.6 1.4 2 4.0 5.4 8.2 10.7 4.2 2.3 1.4 0.7 3 3.6 6.2 8.4 17.2 7.7 7.6 0.6 0.5 4 4.3 5.6 7.6 18.0 11.3 5.1 0.8 1.2 5 3.2 5.2 10.7 9.2 20.4 13.1 4.1 0.7 6 3.1 5.4 10.2 11.0 3.5 6.0 1.2 0.4 7 3.6 5.7 11.2 12.2 18.4 13.0 0.8 1.7 8 3.5 5.1 10.0 13.8 17.2 7.5 0.9 1.0 9 4.4 4.8 9.4 12.1 15.3 10.2 4.4 1.6
10 2.2 2.7 15.6 20.8 9.3 7.7 2.7 1.1 11 3.3 4.5 5.2 3.7 8.1 5.6 2.1 1.9 12 2.8 3.8 9.1 9.1 13.3 4.0 0.9 3.2 16 2.2 5.5 9.0 9.8 5.7 3.3 2.3 0.6 17 3.9 3.8 8.0 7.5 4.5 2.7 1.7 0.4 18 3.8 4.8 8.0 6.6 4.7 1.5 1.2 1.2 19 2.9 5.1 9.0 9.8 6.0 1.3 0.9 1.0 20 3.9 8.1 8.4 11.4 6.4 2.4 1.4 0.7 21 2.5 4.9 12.0 11.5 3.1 3.3 1.6 0.3

Evaluation of Insecticides and Insecticide Use Patterns for Management of Thrips and Iris Yellow Spot Virus 155
Table 5. Mean numbers of larval thrips per onion plant listed by sampling date in response to 21 foliar insecticide programs. Insecticide applications were made weekly, beginning on May 28 and concluding on July 17. Malheur Experiment Station, Oregon, 2015.
Treatment number
Mean larval thrips/plant Sampling date
May 29 Jun 4 Jun 11 Jun 18 Jun 25 Jul 2 Jul 10 Jul 17
1 27.3 23.6 26.5 85.9 51.0 69.9 35.5 16.4 2 23.2 21.3 8.4 6.0 11.6 4.4 1.1 4.7 3 25.0 27.6 14.6 4.7 2.1 0.5 1.9 5.5 4 24.0 18.9 12.8 6.7 3.9 0.9 0.8 2.7 5 29.5 27.5 14.8 3.1 5.6 5.0 17.5 6.6 6 23.1 21.5 16.0 29.5 29.7 7.6 6.8 5.1 7 26.2 26.0 31.8 58.9 14.3 17.8 1.9 5.1 8 23.6 25.0 30.5 86.7 21.8 2.1 2.0 1.1 9 26.3 27.5 32.0 61.4 19.4 2.4 2.6 7.4
10 13.9 24.1 19.3 6.8 3.6 1.1 1.6 10.3 11 21.3 22.6 6.2 13.7 7.3 12.7 6.8 16.7 12 27.8 17.4 17.4 45.3 3.3 0.6 0.9 3.4 16 14.1 30.8 4.7 4.6 5.7 4.2 5.2 5.4 17 16.6 23.6 5.3 9.6 8.0 10.1 1.5 4.2 18 26.0 18.5 2.6 4.6 4.6 1.9 0.8 4.0 19 18.9 21.0 10.9 3.8 3.3 0.5 1.0 0.8 20 22.8 21.0 11.7 10.3 15.5 1.5 1.1 3.2 21 24.2 18.6 11.8 34.6 31.8 2.9 1.2 1.7

Evaluation of Insecticides and Insecticide Use Patterns for Management of Thrips and Iris Yellow Spot Virus 156
Table 6. Onion yield in response to 21 foliar-applied insecticide treatment programs. Data are the mean number of hundredweight per acre (cwt/acre) for the different yield categories. Means marked with the same letter are not significantly different. The only statistical differences were seen in the colossal size. Malheur Experiment Station, Oregon State University, Ontario, OR, 2015. Treatment
number Small Medium Jumbo Colossal Supercolossal Marketable yield Total yield
------------------------------------------------------- cwt/acre ------------------------------------------------------------
1 7.72 a 45.35 a 668.15 a 40.86 d 3.25 a 757.61 a 774.66 a 2 2.20 a 29.31 a 661.00 a 284.40 ab 16.97 a 991.67 a 1005.67 a 3 3.05 a 14.51 a 681.32 a 309.09 a 12.71 a 1017.63 a 1058.06 a 4 6.25 a 42.66 a 767.88 a 288.97 abc 7.18 a 1106.69 a 1122.68 a 5 2.56 a 23.27 a 596.46 a 76.99 cd 0.00 a 696.71 a 711.59 a 6 2.61 a 15.75 a 553.48 a 206.51 ab 10.56 a 786.30 a 802.27 a 7 3.51 a 23.50 a 605.24 a 223.71 ab 13.17 a 865.62 a 878.63 a 8 7.02 a 23.27 a 715.93 a 147.08 bc 2.17 a 888.45 a 903.22 a 9 4.26 a 24.20 a 645.81 a 235.10 ab 7.05 a 912.16 a 947.00 a 10 8.29 a 30.63 a 684.24 a 273.06 ab 16.22 a 1004.15 a 1058.77 a 11 6.92 a 23.48 a 637.16 a 180.50 abc 11.80 a 852.94 a 866.68 a 12 6.22 a 22.55 a 563.66 a 152.25 abc 5.63 a 744.08 a 762.11 a 16 3.31 a 12.47 a 523.73 a 270.12 a 21.77 a 828.09 a 850.48 a 17 9.07 a 30.37 a 596.38 a 225.80 ab 12.16 a 864.71 a 884.78 a 18 4.52 a 35.49 a 644.24 a 278.95 ab 9.50 a 968.17 a 982.56 a 19 4.86 a 26.58 a 612.57 a 170.89 abc 12.32 a 822.36 a 837.36 a 20 4.73 a 25.00 a 626.83 a 162.86 abc 15.11 a 829.80 a 849.32 a 21 6.97 a 22.16 a 632.12 a 153.98 abc 9.61 a 817.86 a 839.97 a

Evaluation of Insecticides and Insecticide Use Patterns for Management of Thrips and Iris Yellow Spot Virus 157
Figure 2. Cumulative thrips pressure in foliar application trial over the 2015 growing season, Malheur Experiment Station, Ontario, OR. Data are mean cumulative thrips per plot (10 plants). See Table 1 for treatment descriptions. Smaller increases from sample date to sample date indicate better thrips control.
0
500
1000
1500
2000
2500
3000
3500
4000
5/6 5/16 5/26 6/5 6/15 6/25 7/5 7/15 7/25
Thrip
s pre
ssur
e (c
umul
ativ
e th
rips)
01 - Control
02 - M-A-R-L
03 - Az,Mp-Az,M-M,Mp-Cap11-Cap7,L-R
04 - Az,Mp-Az,M-Mp,M-Cap11-Cap,A-R
05 - Mp-Az,M-Az,M-Az,L--R,Mp--R,Mp
10 - R-M-L-A
11 - M-R-L-A
12 - A-M-R-L
16 - M,L-M-A-R-L
17 - Ad-M-A-R-L
18 -Ad-Re,M-Re-A,R,L
21 - Siv-M-A-R-L

Evaluation of Insecticides and Insecticide Use Patterns for Management of Thrips and Iris Yellow Spot Virus 158
Figure 3. Effect of cumulative numbers of thrips over the growing season on onion yield. Malheur Experiment Station, Ontario, OR, 2015. As thrips pressure increases over the season, marketable yield goes down. There are also significant declines in the larger (colossal, supercolossal) size classes.
Medium y = 0.0005x + 19.815
R² = 0.0892
Jumbo y = 0.0004x + 639.41
R² = 0.0007 Colossal
y = -0.0082x + 290.84 R² = 0.2605 Supers
y = -0.0007x + 18.945 R² = 0.3374
Marketable y = -0.008x + 969.01
R² = 0.1243
0
200
400
600
800
1000
1200
0 5000 10000 15000 20000 25000 30000
cwt/
acre
Seasonal thrips pressure (AUC)
Thrips effects on yield - Foliar Trial 2015
Medium Jumbo Colossal Super Marketable

Evaluation of Insecticides and Insecticide Use Patterns for Management of Thrips and Iris Yellow Spot Virus 159
Trial 2: Drip Insecticide Applications Materials and Methods Cultural practices Cultural practices were the same as in described in the foliar application trial above.
Insecticide applications Insecticides were applied weekly beginning May 26, according to the schedule and rates listed in Tables 7 and 8. Drip applications were made by injecting appropriate amounts of the product over a 4-hour period. Injections began about 30 min after irrigation started. Irrigation continued for 4 hours after the end of the injection. Foliar-applied insecticides were applied with a CO2-backpack sprayer using a 4-nozzle boom with 11004 nozzles at 30 psi and 35 gal/acre. Applications were made on a 10-day interval, and 8 total applications were made in this trial.
Data collection Thrips counts were made starting on May 4 (before applications began). After applications began, counts were made 3-4 days after an application. Thrips counts were made by counting the number of thrips on 10 consecutive plants in one of the middle 2 rows of each plot. Adult and larval (immature) thrips were counted separately. Each treatment plot was 4 double rows wide by 23 ft long. Onions in each plot were evaluated subjectively for severity of symptoms of IYSV and thrips feeding damage on August 8. Ten consecutive plants in one of the middle 2 rows of each plot were rated on a scale of 0 to 4 of increasing severity of symptoms or feeding damage. Separate ratings were made for the inner, middle, and outer leaves of each plant to estimate damage occurrence over the growing season.
Onions were lifted on August 31 and were topped and bagged on September 7. Onions from the middle two double rows in each plot were topped by hand and bagged on September 16 and placed in storage. The onions from each plot were graded on October 12 and 13. During grading, bulbs were separated according to quality: bulbs without blemishes (No. 1s), split bulbs (No. 2s), neck rot (bulbs infected with the fungus Botrytis allii in the neck or side), plate rot (bulbs infected with the fungus Fusarium oxysporum), and black mold (bulbs infected with the fungus Aspergillus niger). The No. 1 bulbs were graded according to diameter: small, medium, jumbo, colossal, and supercolossal. Bulb counts per 50 lb of supercolossal onions were determined for each plot of every variety by weighing and counting all supercolossal bulbs during grading. Marketable yield consisted of No.1 bulbs in the medium or larger size classes (larger than 2¼ inches).
Results and Discussion The early season drip applications of Verimark® were as effective as the foliar standard of starting with two applications of Movento. Vydate® applied as a drip treatment with foliar-applied Movento did not improve control compared with Movento applied by itself.

Evaluation of Insecticides and Insecticide Use Patterns for Management of Thrips and Iris Yellow Spot Virus 160
Exirel® and Verimark contain the same active ingredient, cyazypyr. However, foliar applied Exirel was not as effective as drip-applied Verimark, in terms of total numbers of thrips (adults and immatures combined).
Over the entire season, treatment programs that started either with Movento (foliar) or Verimark (drip) were the most effective. Programs with foliar or drip applications of Aza-Direct resulted in intermediate thrips control.
No individual insecticides or season-long treatment programs were effective in reducing the numbers of adult thrips. This lack of effectiveness is probably due in part to adult thrips continuing to disperse into our small research plots. Greater effects are likely to be seen in large commercial fields. However, thrips dispersal into commercial fields may mean that populations at the edges of fields will be different from populations in the center of fields. These differences should be considered in scouting programs.
Foliar applications of Movento and the program with two drip applications of Verimark provided the best control of immature thrips, which comprise the majority of thrips populations. These applications seemed to provide good residual control as populations remained low for up to 2 sampling periods (~3 weeks) after the second application. The program with a single application of Verimark by drip followed by three foliar applications of Lannate® had noticeably less control than programs with two applications of Verimark or Movento.
Radiant provided effective mid- to late-season control of immature thrips.
In terms of season-long control of immatures, the programs that started with two applications of Movento or Verimark were the most successful. The good early season control and residual effects helped to keep populations from building during the typical peak in late June and early July. Although Aza-Direct was not highly effective in early season applications, its use at the beginning of the spray program allowed Movento to be used later in the season. This later use of Movento made use of its residual control when thrips populations were at their peak.
There were no significant differences in yields among the ten different treatment programs (Table 14). Although not statistically different, treatment program 7, which represented a “foliar standard” had approximately 40-108% more colossal bulbs compared to the other treatment programs.
Although the drip applications did not improve thrips management, drip applications may provide benefits in terms of reduced application costs. Newer products, such as ones containing cyazapyr may ultimately be useful for inclusion in insecticide-resistance management programs.
Acknowledgments
We greatly appreciate the technical assistance of Emily Fisher, Kay Hadley, Jillian Nielson, and Ian Trenkel. Financial support for this project came from the IEOOC Research Committee, Bayer, Dow, DuPont, PetroCanada, and Gowan.

Evaluation of Insecticides and Insecticide Use Patterns for Management of Thrips and Iris Yellow Spot Virus 161
Table 7. Insecticide sequence treatments tested for efficacy against onion thrips and iris yellow spot virus. Malheur Experiment Station, Oregon State University, Ontario, OR, 2015. Applications were made by drip (D) or foliar (F) application. Sequences with unregistered products are not listed.
Application date
May 26 Jun 6 Jun 16 Jun 25 Jul 7 Jul 17 Jul 27 Aug 6
Application number
Treatment 1st 2nd 3rd 4th 5th 6th 7th 8th
1 Control - - - - -
2 Verimark (D) Verimark (D) Lannate (F) Lannate (F) Radiant (F) Radiant (F) Lannate (F) Lannate (F)
3 Verimark (D) Lannate (F) Lannate (F) Lannate (F) Radiant (F) Radiant (F)
4 Exirel (F) + Vydate (D) + Fontelis (D) for pink root
Exirel (F) Lannate (F) Lannate (F) + Fontelis (D) for pink root
Radiant (F) Radiant (F) Lannate (F) Lannate (F)
5 Verimark (D)
10.3 oz
Verimark (D)
10.3 oz
Vydate(D) Vydate (D) Radiant (F) Radiant (F) - -
6 Movento (F) Movento (F) Lannate (F) Lannate (F) Radiant (F) Radiant (F) Lannate (F) Lannate (F)
7 Movento (F) Vydate (D) + Fontelis (D) for pink root
Movento (F) Lannate (F) Lannate (F) + Fontelis (D) for pink root
Radiant (F) Radiant (F) Lannate (F) Lannate (F)
8 Aza-Direct 32 fl oz (D)
Aza-Direct 32 fl oz (D)
Movento (F) Movento (F) Radiant (F) Radiant (F) Agri-Mek (F) Agri-Mek (F)

Evaluation of Insecticides and Insecticide Use Patterns for Management of Thrips and Iris Yellow Spot Virus 162
Application date
May 26 Jun 6 Jun 16 Jun 25 Jul 7 Jul 17 Jul 27 Aug 6
9 Aza-Direct 12 fl oz (F) + M-Pede (F)
Aza-Direct 12 fl oz (F) + M-Pede (F)
Movento (F) Movento (F) Radiant (F) Radiant (F) Agri-Mek (F) Agri-Mek (F)
10 Movento (F) Movento (F) Agri-Mek (F)
Agri-Mek (F) Radiant (F) Radiant (F) Lannate (F) Lannate (F)

Evaluation of Insecticides and Insecticide Use Patterns for Management of Thrips and Iris Yellow Spot Virus 163
Table 8. Characteristics of insecticides tested in 10 treatment programs for efficacy against onion thrips. Treatments were applied by drip or foliar applications (see Table 7). Sequences with unregistered products are not listed. Please consult the label to determine appropriate uses. Malheur Experiment Station, Oregon State University, Ontario, OR, 2015. Product Company Rate
(product per acre) Adjuvant Active
ingredient pH Mode of action
group Agri-Mek SC Syngenta 3.5 fl oz MSO 0.5% v/v abamectin 7.0 6 Aza-Direct Gowan 12 – 32 fl oz - azadirachtin 6.0 unknown Exirel 10% SE DuPont 13.5 fl oz MSO 0.5% v:v cyazypyr 5.0 28 Lannate LV DuPont 3 pt Preference 0.25%
v/v methomyl 5.0 1A
M-Pede Gowan 5.6 pt - potassium salts of fatty acids
unknown
Movento Bayer 5 fl oz MSO 0.5% v/v spirotretramat 6.5 23 Radiant Dow 8 fl oz Dyne-Amic 3.75%
v/v spinetoram 7.0 5
Verimark DuPont 10.3 oz - cyazypyr 5.0 28 Vydate DuPont 2 qt / ac - oxamyl 5.0 1A

Evaluation of Insecticides and Insecticide Use Patterns for Management of Thrips and Iris Yellow Spot Virus 164
Table 9. Mean numbers of thrips (total) per onion plant listed by sampling date in response to 10 drip or foliar insecticide programs. Insecticide applications were made every 10 days, beginning on May 26 and concluding on August 6. Malheur Experiment Station, Ontario, OR, 2015.
Treatment number
Mean total thrips/plant Sampling date
May 29 Jun 9 Jun 19 Jun 29 Jul 10 Jul 20 Jul 30 Aug 10
1 28.4
49.4
75.5
75.6
69.8
12.5
3.3
0.7 2 22.5
30.2
18.0
52.2
25.0
1.1
0.8
0.2
3 28.2
30.8
54.3
68.5
18.0
1.4
0.6
1.1 4 26.9
42.4
60.9
66.8
29.6
2.1
1.4
0.2
5 16.8
44.4
44.6
81.1
26.0
3.4
1.2
0.3 6 24.1
20.9
10.9
27.3
47.9
6.0
1.3
0.4
7 23.3
27.1
11.5
20.4
29.0
2.7
0.8
0.4 8 24.5
38.5
75.2
20.2
2.3
0.9
1.3
0.4
9 25.6
40.0
64.4
19.0
3.6
2.0
1.4
0.2 10 21.4
23.0
25.0
30.5
28.4
1.1
1.3
0.1

Evaluation of Insecticides and Insecticide Use Patterns for Management of Thrips and Iris Yellow Spot Virus 165
Table 10. Mean numbers of adult thrips per onion plant listed by sampling date in response to drip or foliar insecticide programs. Insecticide applications were made every 10 days, beginning on May 26 and concluding on August 6. Malheur Experiment Station, Ontario, OR, 2015.
Treatment number
Mean adult thrips/plant Sampling date
May 29 Jun 9 Jun 19 Jun 29 Jul 10 Jul 20 Jul 30 Aug 10
1 3.7
10.3
13.1
14.5
2.1
1.1
0.5
0.3 2 3.9
7.3
7.2
12.3
1.1
0.5
0.1
0.1
3 3.8
11.6
6.2
14.4
0.5
0.1
0.1
0.2 4 3.3
13.7
5.5
11.9
1.8
0.3
0.2
0.1
5 3.1
15.8
5.8
15.2
0.8
0.1
0.2
0.1 6 3.2
7.6
5.8
11.1
0.8
0.5
0.2
0.1
7 3.3
12.2
8.3
10.8
0.7
0.3
0.1
0.1 8 4.5
9.1
12.5
14.5
1.7
0.6
0.3
0.1
9 3.3
9.6
9.9
13.9
1.1
0.5
0.5
0.1 10 2.3
8.9
13.7
8.8
0.7
0.2
0.5
0.1

Evaluation of Insecticides and Insecticide Use Patterns for Management of Thrips and Iris Yellow Spot Virus 166
Table 11. Mean numbers of immature thrips per onion plant listed by sampling date in response to 10 drip or foliar insecticide programs. Insecticide applications were made every 10 days, beginning on May 26 and concluding on August 6. Malheur Experiment Station, Ontario, OR, 2015.
Treatment number
Mean immature thrips/plant Sampling date
May 29 Jun 9 Jun 19 Jun 29 Jul 10 Jul 20 Jul 30 Aug 10
1 24.7
39.1
62.4
61.1
67.8
11.4
2.8
0.3 2 18.6
22.9
10.8
39.8
23.9
0.7
0.7
0.2
3 24.4
19.2
48.1
54.1
17.5
1.3
0.4
0.9 4 23.6
28.8
55.4
54.9
27.8
1.8
1.2
0.1
5 13.6
28.6
38.8
65.5
25.2
3.4
1.0
0.3 6 20.9
13.4
5.1
16.2
47.1
5.6
1.1
0.3
7 20.0
14.9
3.2
9.6
28.3
2.5
0.7
0.3 8 20.0
29.4
62.8
5.7
0.6
0.3
1.0
0.3
9 22.4
30.4
54.5
5.1
2.5
1.5
0.9
0.2 10 19.1
14.1
11.3
21.7
27.7
0.9
0.9
0.1

Evaluation of Insecticides and Insecticide Use Patterns for Management of Thrips and Iris Yellow Spot Virus 167
Table 12. Onion yield in response to drip or foliar applied insecticide treatment programs. Data are the mean number of hundredweight per acre (cwt/acre) for the different yield categories. Means marked with the same letter are not significantly different. Programs with unregistered products are not shown. Malheur Experiment Station, Oregon State University, Ontario, OR, 2015.
Treatment number
Small Medium Jumbo Colossal Supercolossal Marketable Total --------------------------------------------------------- cwt/acre ---------------------------------------------------------
1 4.78 a 70.35 a 552.73 a 158.03 abc 5.09 c 786.20 c 801.03 bc 2 8.73 a 102.09 a 662.88 a 177.99 abc 4.42 c 947.38 ab 964.07 ab 3 4.16 a 19.40 a 572.08 a 125.18 bc 9.94 abc 726.59 c 739.02 c 4 6.04 a 131.40 a 715.88 a 181.74 ab 3.82 c 1032.84 a 1042.37 a 5 2.48 a 12.19 a 604.67 a 215.47 ab 3.82 c 836.15 bc 846.27 bc 6 3.31 a 46.88 a 521.12 a 305.83 a 28.43 ab 902.26 ab 915.02 ab 7 1.21 a 47.65 a 548.60 a 304.07 a 29.36 a 929.68 ab 940.47 ab 8 7.41 a 60.07 a 546.79 a 98.55 c 11.29 bc 716.70 c 728.71 c 9 1.39 a 14.93 a 605.34 a 221.67 ab 9.19 abc 851.13 abc 859.01 abc
10 3.20 a 12.94 a 620.11 a 220.22 ab 7.31 abc 860.58 abc 871.89 abc

Evaluation of Insecticides and Insecticide Use Patterns for Management of Thrips and Iris Yellow Spot Virus 168
Figure 4. Cumulative thrips pressure in the drip application trial over the 2015 growing season, Malheur Experiment Station, Ontario, OR. Data are mean cumulative thrips per plot (10 plants). Smaller increases from sample date to sample date indicate better thrips control.
0
500
1000
1500
2000
2500
3000
3500
5/18 5/28 6/7 6/17 6/27 7/7 7/17 7/27 8/6 8/16
Thrip
s pre
ssur
e (c
umul
ativ
e th
rips)
1 Control
2 V2-L2-R2-L2
3 V1-L3-R2
4 E2-VY1-L2-R2-L2
5 E2-L2-R2-L2
6 M2-L2-R2-L2
7 VY-M2-L2-R2-L2
8 AZ2DRIP-M2-R2-AG2
9 AZ+MP2FOLIAR-M2-R2-AG2
10 M2-AG2-R2-L2

Evaluation of Insecticides and Insecticide Use Patterns for Management of Thrips and Iris Yellow Spot Virus 169
Figure 5. Effect of cumulative numbers of thrips over the growing season on onion yield. Malheur Experiment Station, Ontario, OR, 2015. As thrips pressure increases over the season, marketable yield goes down. There are also significant declines in the larger (colossal, supercolossal) size classes.
Medium y = 0.0006x + 29.5
R² = 0.0138
Jumbo y = 0.0018x + 556.67
R² = 0.0489 Colossal y = -0.0062x + 314.98
R² = 0.4106
Supers y = -0.0006x + 21.662
R² = 0.225
Marketable y = -0.0043x + 922.82
R² = 0.1004
0
200
400
600
800
1000
1200
0 5000 10000 15000 20000 25000 30000 35000 40000
cwt/a
cre
Seasonal thrips pressure (AUC)
Thrips effects on yield - Drip Trial 2015
Medium Jumbo Colossal Super Marketable