Embed Size (px)
Citation preview
Octa Journal of Environmental Research
Research Article
EVALUATION OF HYDROCHEMICAL FACIES AND IONIC RATIO OF AL-SALAM CANAL WATER AND ITS RELATION WITH WATERY EXTRACTED SOIL AND
WATER TABLE - NORTH SINAI-EGYPT Yasser A. M. Abdulhadya , Ahmed S. A. Sayedb
a. Hydrogeochemistry Department, Desert Research Center, Water Treatment and Desalination, El –Matariya, Cairo, Egypt. b. Pedology Department, Desert Research Center, El –Matariya, Cairo, Egypt.
*Corresponding author’s E-mail address: [email protected] Received: 24th Mar. 2018 Revised: 29th Mar. 2018 Accepted: 30th Mar. 2018
Abstract: Irrigation projects lead to a better use of the available fresh and mixed water is very important for the sustainable agricultural development. Soil profiles represent the area under study were chosen to represented of selected agricultural farms and were dug wide open to a depth of 150 cm or opposed by water table level. Soil texture throughout the entire depth is variable textural composition, from clay to coarse sand at the soil surface. The higher values of soluble cations and anions in these soils may be due to fine soil textured and the seepage of sea water from the Suez Canal. Water samples were analyzed for their physical, chemical properties, besides of the major chemical compositions, ionic ratio (HCO3
– /Cl–, Na+/Ca++, Ca++/Cl–, Mg++/ Cl–, Na+/Cl–, K+/Cl–, SO42- /Cl-
and Ca++/SO42-) was used to delineate saline water intrusion. The analytical results present the
abundance of the ions in the following order: Mg++ > Ca++ > Na++ > K+ = Cl > SO4 > HCO3. Chloride is the dominant anion found in the watery soil extract of the study area. Piper tri-linear diagram for the study area shows that there is a mixture of two types of water with variable concentrations of major ions. These are Ca++ – Mg++ – Cl– – SO4
2- types and Na+/K+/Cl-/SO42- type water. This means that
watery soil extract in the area is mainly made up of mixtures of earth alkaline and alkaline metals and predominantly Cl- - SO4
2- water type. The quality of watery soil extract and the processes that control the concentration of major constituents is very necessary. Achieving these aims will establish a basis for developing an appropriate monitoring programme and therefore improved water management of the area. Keywords: Hydro geochemical; Hypothetical salts; Ionic ratios; Soil water extract; Sea water intrusion; Water table level.
Postal Address: Desert Research Center, Water Treatment and Desalination Unit, El–Matariya, Cairo - 11753 Egypt, Tel: +002 01016941598
INTRODUCTION
Hydro geochemical processes such as dissolution, precipitation, ion-exchange processes and the residence time along the flow path control the chemical composition of groundwater (American Society for Testing and
Materials 2002; Martinez et al., 2002). El-Tina plain extends from north to south for about 75 km, with a width of 25 km, bounded from north by El-Tina bay, from west by Suez canal and from east by sand dune belts. El-Tina plain slopes gently towards west and northwest generally lower than the surrounding areas.
Two sub unit’s exhibits in El-Tina plain (El-Tina bay and El-Tina mud flat). El-Tina bay exists between Port Said in the west and El-Bardawil lagoon due east, on the other hand El-Tina mud flat occupies the northwestern part of El-Tina plain. El-Tina bay is formed due to the interface of seawater and Nile water at the most northern part of Sinai many years ago. The deposits are built of silt and clays during the transgression and regression of the sea forming a huge salty clay and silt section (Abdallah, 2006). The climatic conditions of the study area are typically arid characterized by

Yasser and Ahmed, 2018; Evaluation of Hydrochemical Facies and Ionic Ratio of Al-Salam Canal Water and Its Relation with Watery extracted soil and Water Table - North Sinai-Egypt
low rainfall, high temperatures, strong wind, high evaporation and low relative humidity. The maximum temperature (27.3ºC) is recorded in (August) in Port Said, while the minimum (14.4°C) is recorded in January. The annual rainfall is low as it does not exceed 86.2 mm; the maximum monthly rainfall is 25.30 mm in January. Evaporation data indicate that the lowest value of evaporation (2.3 mm/day) is recorded in December while the highest value is monitored in October (4.50 mm/day). With such high annual evaporation, both irrigation water and energy costs required for irrigation would be very high. Sinai geological structure falls within two groups, a Precambrian basement that is largely exposed in the south and a triangular area of sedimentary layers in the north that becomes thicker and more pronounced near the Mediterranean coast (Saleh and Aboelghar 2013).The study area is characterized by landforms that were developed by erosional process rather than structural agents. The landforms of this region constitute the north Sinai sand sea, the costal forms and the El-Tina deltaic plain. The parent materials of the studied soils in the northern part of the Sinai along the Al-Salam Canal area were recognized according to the filed description into two groups. These groups are the Nile alluvium, and lacustrine sand deposits of the El-Tina Plain area, and Aeolian sand deposits of the active dunes and sand sheet deposits in the South El Kantara Shark, the Rabaa and Qatia areas (Hassan, 2002). In El-Tina Plain area and a portion of South El Kantara Shark studies the understanding of watery soil extract salinity which causes the effecting the interaction of Al-Salam canal water with soil types in different layers sections that involve chemical indicators and subsequent hydro chemical evolution of water by using chemical data from the standpoint of environmental geochemistry are relatively few. Al-Salam canal water is a mixture of Nile water and drainage water with a ratio of about 1:1. The total quantity of water is nearly 4.45 billion m3/year, 2.11 billion m3/year of the Nile fresh water from Damietta branch mixed with 1.905 billion m3/year from Bahr-Hadous and 0.435
billion m3/year from El-Serw drainage water (Agramaa and Amer, 2012).
Fresh and drainage water will be mixed reaching out to the hope for end of cultivate nearly 620,000 feddan, certainly of newly reclaimed lands, divided to 220,000 feddan west of Suez Canal and about 400,000 feddan (about 330,000 feddan in the study area) east of Suez Canal in Sinai Peninsula (Hafez, 2005). Water chemistry is the result of interactions between infiltrating water (rain or surface water) and rocks (Schoeller, 1962). Chemical properties of groundwater are depending on the recharge water type (seawater – atmospheric precipitation – inland surface water) and subsurface geochemical processes. Such factors are affecting on the water quality during its underground movement by changing the amount and kind of the dissolved solids to understand the origin and the history of rocks which groundwater has contacted (Mattess, 1982). Yousef and El Shenawy (2000) studied the factors that affected on the sediments salinity in northwest Sinai by using chemical data, they concluded that, there are different factors affecting the chemical properties of the North. Hafez et al., (2008) studied the physical and chemical water properties of El Salam canal. The results obtained in this study indicated the variation of the quality of water from month to month. D.R.C. (2009) studied the quality of Al-Salam canal water, concluded that TDS of Al-Salam canal water varies from 470 mg/L to 2200 mg/L in the end of the canal. The average values of minor and heavy metals in Al-Salam canal water under the permissible limits for irrigation purposes, the statistical techniques were used to subdivide the pollution sources of Al-Salam canal, Egypt (Donia, 2011). The obtained results indicated that Damietta Branch has the major effect on increasing COD in the canal. Bahr Hadous drain has the major effect on increasing TDS, Cu and total phosphates downstream. Agrama and Amer (2012) reported the water quality of Al-Salam canal water with respect to its suitability for agriculture in principle as well as for livestock and fisheries. They concluded that the water quality in the study is excellent for livestock uses, some extent all locations are fair
Yasser and Ahmed, 2018; Evaluation of Hydrochemical Facies and Ionic Ratio of Al-Salam Canal Water and Its Relation with Watery extracted soil and Water Table - North Sinai-Egypt
for irrigation uses, and water quality in the area of study is not suitable for fisheries uses. The results clearly indicate the urgent need for effective strategies for the treatment of the drainage water resources before mixing with the Nile water. Elkorashey (2012) evaluated Al-Salam canal water quality for irrigation purposes and defined the most effective mixing points that need improvement. Concluded that the negative impact of mixing Bahr Hadous Drain on the water quality of the canal at this area. After mixing with Bahr Hadous Drain, it is suitable for irrigation of cereal, industrial as well as fodder crops and trees. However, health associated risk could be expected on using for irrigation of crops that are eaten raw or uncooked. It is very essential to understand the hydro geochemical processes that take place in the target area. This study attempts to evaluate the different water types and hydro geochemistry of the main source of water supply in the area (Al-Salam canal) as well as determine the surface water characteristics. Al-Salam canal water is considered as mixed Nile river water with agriculture drains so that the chemical and physical characteristics were changed. The most relevant controls on the water quality and ionic processes which control the watery soil extract composition of the target area will also be opportunity to observe a detailed profile of the dominant hydro geochemical facies distribution with a view to predicting their water character. In view of the aforementioned, it has become necessary to study the quality of Al-Salam water and the processes that control the concentration of major constituents in the area. Therefore, it is very imperative that adequate hydro chemical knowledge be improved, in order to evaluate the hydro chemical characteristics, determine the ionic interactions as well as the hydro
geochemical facies distribution in the area with hypothetical salts. Achieving these aims will establish a basis for developing an appropriate monitoring programme and improved management of the groundwater resources of the area.
EXPERIMENTAL
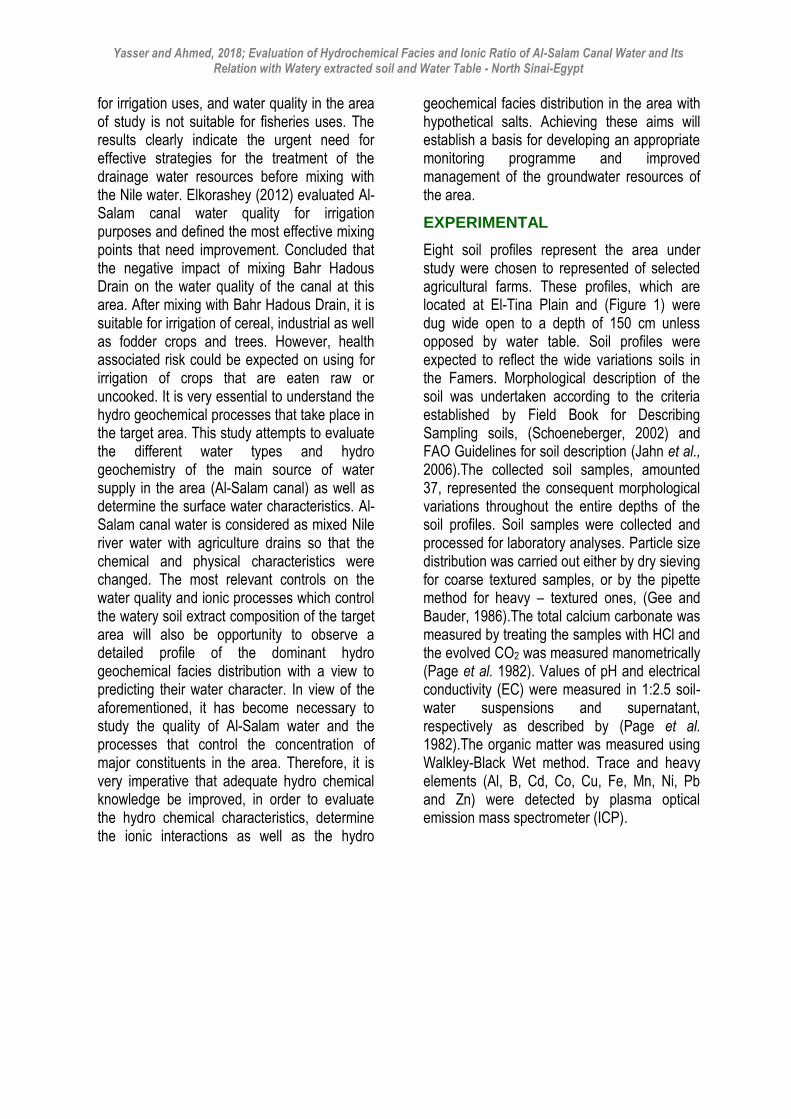
Eight soil profiles represent the area under study were chosen to represented of selected agricultural farms. These profiles, which are located at El-Tina Plain and (Figure 1) were dug wide open to a depth of 150 cm unless opposed by water table. Soil profiles were expected to reflect the wide variations soils in the Famers. Morphological description of the soil was undertaken according to the criteria established by Field Book for Describing Sampling soils, (Schoeneberger, 2002) and FAO Guidelines for soil description (Jahn et al., 2006).The collected soil samples, amounted 37, represented the consequent morphological variations throughout the entire depths of the soil profiles. Soil samples were collected and processed for laboratory analyses. Particle size distribution was carried out either by dry sieving for coarse textured samples, or by the pipette method for heavy – textured ones, (Gee and Bauder, 1986).The total calcium carbonate was measured by treating the samples with HCl and the evolved CO2 was measured manometrically (Page et al. 1982). Values of pH and electrical conductivity (EC) were measured in 1:2.5 soil-water suspensions and supernatant, respectively as described by (Page et al. 1982).The organic matter was measured using Walkley-Black Wet method. Trace and heavy elements (Al, B, Cd, Co, Cu, Fe, Mn, Ni, Pb and Zn) were detected by plasma optical emission mass spectrometer (ICP).

Octa Journal of Environmental Research
Figure 1. Location map and soil profiles of the study area
Water Sampling from Al-Salam Canal Chemical Analysis The analytical methods can be grouped as volumetric and instrumental. After the water samples have been collected from the water points they were preserved in a proper way. Clean dry polyethylene bottles of one liter size were used to collect water samples for major and minor elements analysis. Clean dray polyethylene bottles of 50 ml size used to collect water samples acidified with few drops of nitric acid for trace and heavy metal analysis. The analysis methods includes measurement of major cations and anions, carbonates (CO3
2-
), bicarbonates (HCO3-), chloride (Cl-), calcium
(Ca2+), magnesium (Mg2+), sodium (Na+), potassium (K+), sulfate (SO4
2-). Minor, trace and heavy metals which include aluminum (Al), boron(B), cadmium (Cd), cobalt (Co), chromium (Cr), copper (Cu), iron (Fe), molybdenum (Mo), manganese (Mn), nickel (Ni), nitrate (NO3), lead (Pb), strontium (Sr), vanadium (V) and zinc (Zn). Groundwater samples analyses were performed in the Hydrogeochemistry Department at the Desert Research Center
according to the methods adopted by Rainwater (Onken and Sunderman, 1977; Fishman and Friedman, 1985; Barer et al., 2000) and American Society for Testing Materials (A.S.T.M), 2002). Chemical analysis results are expressed in milligrams per liter (mg/L), mL equivalents per liter (meq/l. Chloride (Cl-), calcium (Ca2+), magnesium (Mg2+), sodium (Na+), potassium (K+), sulfate (SO4
2-), nitrate (NO3
2-) achieved either by using ion chromatography (Dionex, ICS-1100). Trace and heavy elements (Al, B, Cd, Co, Cr, Cu, Fe, Mo, Mn, Ni, Pb, Sr, V and Zn) were detected by plasma optical emission mass spectrometer (ICP) (POEMSIII, Thermo Jarrell Elemental Company USA), using 1000 mg/L (Merck) Stock solution for standard preparation.
RESULTS AND DISCUSSION
Characterization of the studied soils The morphological characteristic, in the northern part of Sinai Peninsula could be recognized as follows: Coastal plain sand sheet and sand dunes, individual Sabkha, March and Swamp areas. Based on the specific soil

Yasser and Ahmed, 2018; Evaluation of Hydrochemical Facies and Ionic Ratio of Al-Salam Canal Water and Its Relation with Watery extracted soil and Water Table - North Sinai-Egypt
attributes depth and soil texture distribution, the soils of studied area were classified to five mapping units. For the allocation of the texture classes to the soil profiles, the dominant soil texture within the soil depth was indicative. The topography of the landscape is generally flat (<0.5%) with nearly level sloping (0.5-1.0%) surface. The surface is generally covered with field crops (wheat and Bean). The common features of this soils are depth (>100 cm) Figure 2, the elevation is at mean sea level or just above or below and varies between 115
and 185 cm a.s.l. Generally, the soils under study have been formed from different origins, Nile alluvium and lacustrine sand deposits (old deltaic and lacustrine) and Aeolian deposits (Hassan 2002; Omran 2017). Based on water table levels the drainage is imperfect to moderately drain. The highest water table levels are located of the soils closed to Baloza drain and Suez Canal. These are mainly attributed to the seepage of sea water from Suez Canal in this area through ground water fluctuations.
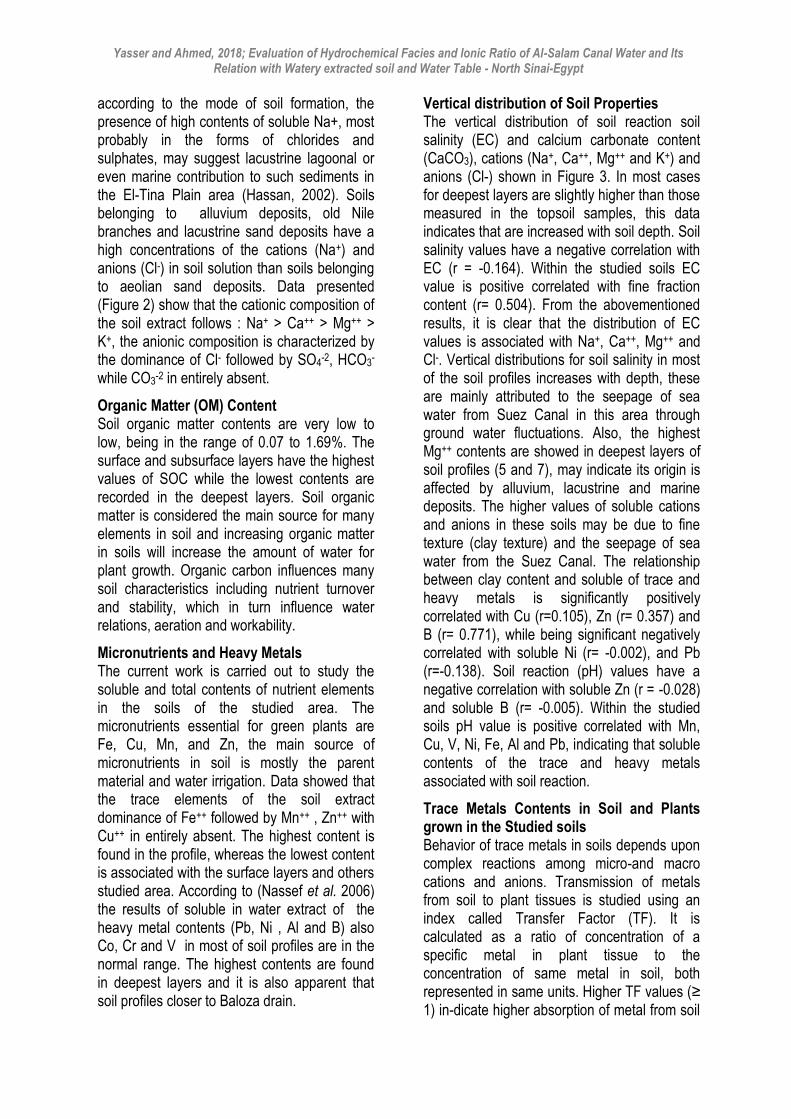
Figure 2. Depthwise of major cations, anions and soil properties of the study area

Yasser and Ahmed, 2018; Evaluation of Hydrochemical Facies and Ionic Ratio of Al-Salam Canal Water and Its Relation with Watery extracted soil and Water Table - North Sinai-Egypt
The major of soil physical, chemical and physic-chemical are determined and presented as following:
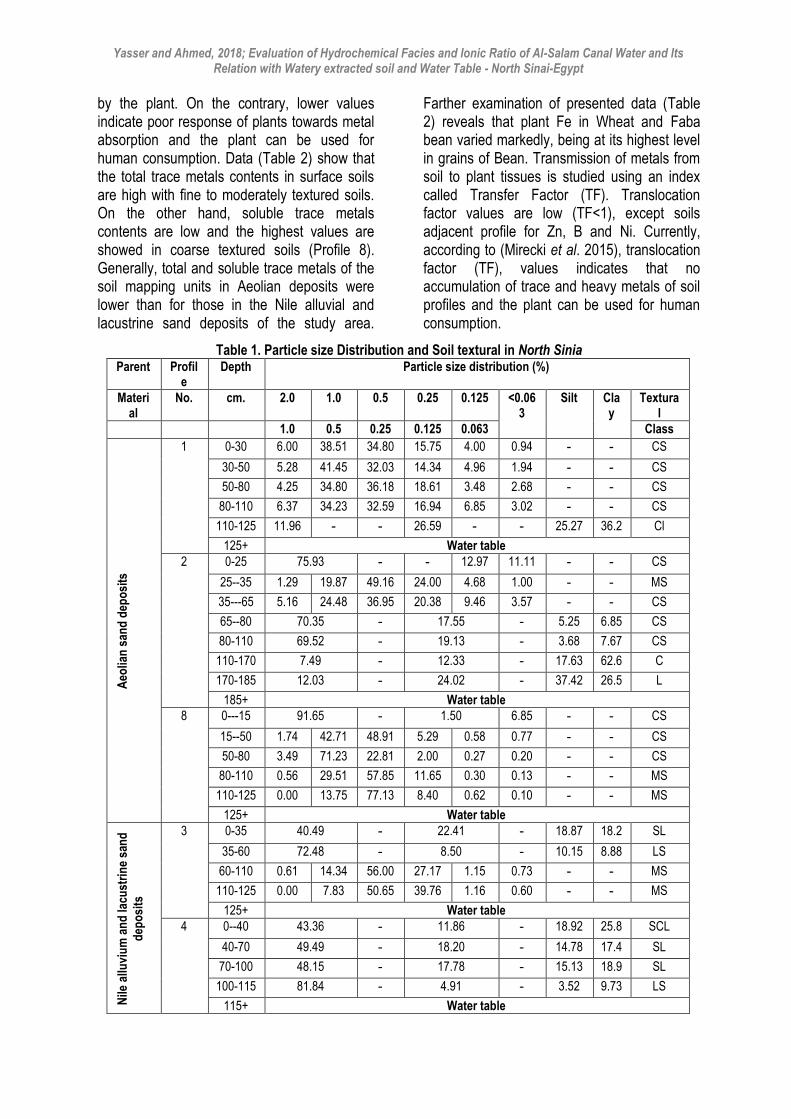
Soil Texture Data in Table 1, show that soil texture varies from area to another and within the subsequent layers of each area based on the parent material formation. The parent material of the El-Tina Plain area is a mixture of alluvium deposits, originating from old Nile branches and lacustrine sand deposits, sometimes inter mixed with Aeolian sand deposits. (Hassan, 2002). Soil texture throughout the entire depth is variable textural composition, from clay to coarse sand at the soil surface. To suffices, the studied area which represented soil profiles could be distinguished according to soil textural variations within each profile into five groups are follows: Alluvium deposits, old Nile branches and lacustrine sand deposits:
Deep moderately textured with coarse textured substratum (Profiles 4, 5, 6,Table 1),
Deep coarse textured soils with moderately coarse textured surface (Profile 3),
Deep Moderately textured soils (Profile 7), Aeolian sand deposits:
Deep coarse textured soils with moderately to fine textured substratum (Profiles 1 and 2),
Deep coarse textured soils (Profile 8).
The wide variations of texture classes in the studied area may indicate various modes of soil formation and may be attributed to the interference between the alluvial and Aeolian deposits. Depthwise distribution of soil texture indicates that the soil texture throughout the entire depth of these soil profiles are coarse-textured and sometimes medium to course textured in surface layers. While the fine fractions are increased throughout the entire depth. The values of available water in the soil of this area mainly indicate the soil texture is coarse to fine sand texture in the studied soils area. Generally, the results of the particle size distribution in the investigated soil areas for illustrates percent of sand fraction, silt fraction and clay fraction are reveal very evident variations in their texture classes whether
among the profile and surface soil samples or along the entire depths of each soil profile. Calcium Carbonate Content Calcium carbonate contents are slightly calcareous to moderate calcareous (1.32 to 9.47%) Figure 2, the highest contents are mostly detected in the surface layers and decrease with depth. The lowest contents of calcium carbonate are detected in the coarse fractions, while the high contents are detected in fine soil texture. Soil Reaction (pH) From the data presented in this study, it is clear that soil reaction varies considerably between 8.1 and 9.4, indicating moderately alkaline to very strongly alkaline soil reaction. The alkaline pH in this soil is highly; reveal that they have a high concentration of the alkaline cation (Na+) and anion (Cl-) in soil solution. Soil reaction is important because it affects nutrient availability, microbial activity and plant growth. Soil Salinity (dSm-1), Cationic and anionic composition of the soil extract Soil salinity values ranged widely between 0.29 and 36.7 dSm-1 (non-saline to extremely saline), with an average value of 5.6 dSm-1 (strongly saline). The relatively low values in these soils are mainly affected by particle size of texture (coarse sand texture) and low content of fine fractions (silt and clay fractions) in these soils. The highest characterizes the deepest layers whereas the lowest values of EC are that of the top surface and coarse texture. The soils belonging to aeolian sand deposits soils represented by the soil profiled 1, 2 and 8 are dominated by slightly saline. While, those represented by the soil profiles (3,4,5,6 and 7) are strongly to extermely saline. These are mainly attributed to the seepage of the sea water from Suez Canal in this area. Salinity is one of the main edaphic factors which limits the distribution of plant communities in their natural habitats and which is causing increasingly severe agricultural problems. Data from (Figure 2) showed the soil salinity in this soils reveal that they have a high concentration of the cations (Na+) and anions (Cl-) in soil solution, in addition to which the soils were affected by arid climate condition. The soils of North Sinai differ in their chemical and physical properties
Yasser and Ahmed, 2018; Evaluation of Hydrochemical Facies and Ionic Ratio of Al-Salam Canal Water and Its Relation with Watery extracted soil and Water Table - North Sinai-Egypt
according to the mode of soil formation, the presence of high contents of soluble Na+, most probably in the forms of chlorides and sulphates, may suggest lacustrine lagoonal or even marine contribution to such sediments in the El-Tina Plain area (Hassan, 2002). Soils belonging to alluvium deposits, old Nile branches and lacustrine sand deposits have a high concentrations of the cations (Na+) and anions (Cl-) in soil solution than soils belonging to aeolian sand deposits. Data presented (Figure 2) show that the cationic composition of the soil extract follows : Na+ > Ca++ > Mg++ > K+, the anionic composition is characterized by the dominance of Cl- followed by SO4
-2, HCO3-
while CO3-2 in entirely absent.
Organic Matter (OM) Content Soil organic matter contents are very low to low, being in the range of 0.07 to 1.69%. The surface and subsurface layers have the highest values of SOC while the lowest contents are recorded in the deepest layers. Soil organic matter is considered the main source for many elements in soil and increasing organic matter in soils will increase the amount of water for plant growth. Organic carbon influences many soil characteristics including nutrient turnover and stability, which in turn influence water relations, aeration and workability.
Micronutrients and Heavy Metals The current work is carried out to study the soluble and total contents of nutrient elements in the soils of the studied area. The micronutrients essential for green plants are Fe, Cu, Mn, and Zn, the main source of micronutrients in soil is mostly the parent material and water irrigation. Data showed that the trace elements of the soil extract dominance of Fe++ followed by Mn++ , Zn++ with Cu++ in entirely absent. The highest content is found in the profile, whereas the lowest content is associated with the surface layers and others studied area. According to (Nassef et al. 2006) the results of soluble in water extract of the heavy metal contents (Pb, Ni , Al and B) also Co, Cr and V in most of soil profiles are in the normal range. The highest contents are found in deepest layers and it is also apparent that soil profiles closer to Baloza drain.
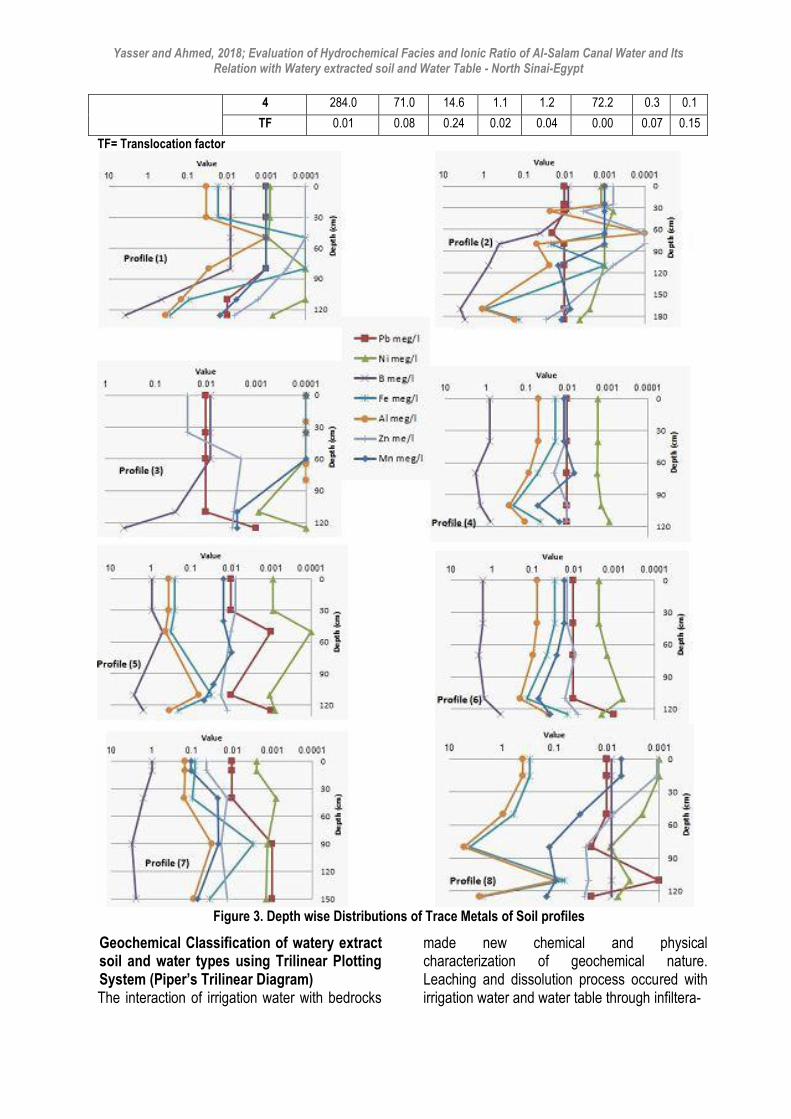
Vertical distribution of Soil Properties The vertical distribution of soil reaction soil salinity (EC) and calcium carbonate content (CaCO3), cations (Na+, Ca++, Mg++ and K+) and anions (Cl-) shown in Figure 3. In most cases for deepest layers are slightly higher than those measured in the topsoil samples, this data indicates that are increased with soil depth. Soil salinity values have a negative correlation with EC (r = -0.164). Within the studied soils EC value is positive correlated with fine fraction content (r= 0.504). From the abovementioned results, it is clear that the distribution of EC values is associated with Na+, Ca++, Mg++ and Cl-. Vertical distributions for soil salinity in most of the soil profiles increases with depth, these are mainly attributed to the seepage of sea water from Suez Canal in this area through ground water fluctuations. Also, the highest Mg++ contents are showed in deepest layers of soil profiles (5 and 7), may indicate its origin is affected by alluvium, lacustrine and marine deposits. The higher values of soluble cations and anions in these soils may be due to fine texture (clay texture) and the seepage of sea water from the Suez Canal. The relationship between clay content and soluble of trace and heavy metals is significantly positively correlated with Cu (r=0.105), Zn (r= 0.357) and B (r= 0.771), while being significant negatively correlated with soluble Ni (r= -0.002), and Pb (r=-0.138). Soil reaction (pH) values have a negative correlation with soluble Zn (r = -0.028) and soluble B (r= -0.005). Within the studied soils pH value is positive correlated with Mn, Cu, V, Ni, Fe, Al and Pb, indicating that soluble contents of the trace and heavy metals associated with soil reaction.
Trace Metals Contents in Soil and Plants grown in the Studied soils Behavior of trace metals in soils depends upon complex reactions among micro-and macro cations and anions. Transmission of metals from soil to plant tissues is studied using an index called Transfer Factor (TF). It is calculated as a ratio of concentration of a specific metal in plant tissue to the concentration of same metal in soil, both represented in same units. Higher TF values (≥ 1) in-dicate higher absorption of metal from soil
Yasser and Ahmed, 2018; Evaluation of Hydrochemical Facies and Ionic Ratio of Al-Salam Canal Water and Its Relation with Watery extracted soil and Water Table - North Sinai-Egypt
by the plant. On the contrary, lower values indicate poor response of plants towards metal absorption and the plant can be used for human consumption. Data (Table 2) show that the total trace metals contents in surface soils are high with fine to moderately textured soils. On the other hand, soluble trace metals contents are low and the highest values are showed in coarse textured soils (Profile 8). Generally, total and soluble trace metals of the soil mapping units in Aeolian deposits were lower than for those in the Nile alluvial and lacustrine sand deposits of the study area.
Farther examination of presented data (Table 2) reveals that plant Fe in Wheat and Faba bean varied markedly, being at its highest level in grains of Bean. Transmission of metals from soil to plant tissues is studied using an index called Transfer Factor (TF). Translocation factor values are low (TF<1), except soils adjacent profile for Zn, B and Ni. Currently, according to (Mirecki et al. 2015), translocation factor (TF), values indicates that no accumulation of trace and heavy metals of soil profiles and the plant can be used for human consumption.
Table 1. Particle size Distribution and Soil textural in North Sinia Parent Profil
e Depth Particle size distribution (%)
Material
No. cm. 2.0 1.0 0.5 0.25 0.125 <0.063
Silt Clay
Textural
1.0 0.5 0.25 0.125 0.063 Class
Aeo
lian
san
d d
epo
sits
1 0-30 6.00 38.51 34.80 15.75 4.00 0.94 - - CS
30-50 5.28 41.45 32.03 14.34 4.96 1.94 - - CS
50-80 4.25 34.80 36.18 18.61 3.48 2.68 - - CS
80-110 6.37 34.23 32.59 16.94 6.85 3.02 - - CS
110-125 11.96 - - 26.59 - - 25.27 36.2 Cl
125+ Water table
2 0-25 75.93 - - 12.97 11.11 - - CS
25--35 1.29 19.87 49.16 24.00 4.68 1.00 - - MS
35---65 5.16 24.48 36.95 20.38 9.46 3.57 - - CS
65--80 70.35 - 17.55 - 5.25 6.85 CS
80-110 69.52 - 19.13 - 3.68 7.67 CS
110-170 7.49 - 12.33 - 17.63 62.6 C
170-185 12.03 - 24.02 - 37.42 26.5 L
185+ Water table
8 0---15 91.65 - 1.50 6.85 - - CS
15--50 1.74 42.71 48.91 5.29 0.58 0.77 - - CS
50-80 3.49 71.23 22.81 2.00 0.27 0.20 - - CS
80-110 0.56 29.51 57.85 11.65 0.30 0.13 - - MS
110-125 0.00 13.75 77.13 8.40 0.62 0.10 - - MS
125+ Water table
Nile
allu
viu
m a
nd
lacu
stri
ne
san
d
dep
osi
ts
3 0-35 40.49 - 22.41 - 18.87 18.2 SL
35-60 72.48 - 8.50 - 10.15 8.88 LS
60-110 0.61 14.34 56.00 27.17 1.15 0.73 - - MS
110-125 0.00 7.83 50.65 39.76 1.16 0.60 - - MS
125+ Water table
4 0--40 43.36 - 11.86 - 18.92 25.8 SCL
40-70 49.49 - 18.20 - 14.78 17.4 SL
70-100 48.15 - 17.78 - 15.13 18.9 SL
100-115 81.84 - 4.91 - 3.52 9.73 LS
115+ Water table

Yasser and Ahmed, 2018; Evaluation of Hydrochemical Facies and Ionic Ratio of Al-Salam Canal Water and Its Relation with Watery extracted soil and Water Table - North Sinai-Egypt
5 0-30 52.50 - 5.10 - 15.10 27.3 SCL
30--60 31.00 - 41.40 - 5.70 21.9 SCL
60-110 21.29 25.92 25.36 13.59 8.21 5.63 CS
110-125 32.47 - - 12.08 - - 15.85 39.6 SC
125+ Water table
6 0-40 35.78 - 14.00 - 18.85 31.4 SCL
40-70 35.49 - 15.34 - 18.45 30.7 SCL
70-110 54.74 - 6.94 - 14.30 24.0 SCL
110-125 81.96 - 2.19 - 2.17 13.7 LS
125+ Water table
7 0-10 23.72 - 13.58 - 22.85 39.8 CL
10-40 31.62 - 19.68 - 20.57 28.1 SCL
40-90 9.54 - 25.84 - 25.08 39.5 CL
90-150 5.40 - 29.15 - 20.90 44.5 C
Table 2. Total, soluble trace metals in surface soils and total in the plants with Translocation factor Parent Material Mapping unit Fe Mn Zn B Ni Al pb Cd
Profile No Total trace metals contents, mg.kg-1 (surface of soils)
Aeolian sand deposits I Deep coarse textured soils with moderately to fine textured substratum
2 6522.00 130.00 21.78 2.53 6.05 6938.00 1.72 0.23
II Deep coarse textured soils
8 3012.00 163.00 13.65 2.36 3.36 3060.00 1.71 0.21
Nile alluvium and lacustrine sand deposits
III Deep coarse textured soils with moderately coarse textured surface
3 15040.00 454.30 46.87 12.80 22.22 26720.00 8.84 0.22
IV Deep moderately textured with coarse textured substratum
4 19540.00 940.40 59.98 55.91 27.64 32140.00 4.29 0.68
Soluble trace metals, Soil extract ( ppm)
Aeolian sand deposits I Deep coarse textured soils with moderately to fine textured substratum
2 0.001 0.001 0.0006 0.008 0.0012 0.001 0.01 tr.
Deep coarse textured soils
8 0.2937 0.0052 0.0011 0.008 0.001 0.4014 0.01 tr.
Nile alluvium and la-custrine sand depos-its
II Deep coarse textured soils with moderately coarse textured surface
3 0.0001 0.0001 0.023 0.008 0.0001 0.0001 0.01 tr.
III Deep moderately textured with coarse textured substratum
4 0.0197 0.0117 0.0109 0.79 0.0017 0.05 0.01 tr.
Trace metals content, grains (ppm)
Aeolian sand deposits I Deep coarse textured soils with moderately to fine textured substratum (Wheat)
2 306.9 54.2 10.3 1.6 1.9 127.9 0.4 0.1
TF 0.05 0.42 0.47 0.63 0.31 0.02 0.23 0.43
II Deep coarse textured soils (Wheat)
8 862.9 28.3 48.4 2.98 3.39 668.9 4.54 0.13
TF 0.29 0.17 3.55 1.26 1.01 0.22 2.65 0.62
Nile alluvium and lacustrine sand deposits
III Deep coarse textured soils with moderately coarse textured surface/ (Wheat)
3 459.5 18.4 47.8 0.35 3.36 455.9 3.18 0.14
TF 0.03 0.04 1.02 0.03 0.15 0.02 0.36 0.64
IV Deep moderately textured with coarse textured substratum /(Faba Bean)
Yasser and Ahmed, 2018; Evaluation of Hydrochemical Facies and Ionic Ratio of Al-Salam Canal Water and Its Relation with Watery extracted soil and Water Table - North Sinai-Egypt
4 284.0 71.0 14.6 1.1 1.2 72.2 0.3 0.1
TF 0.01 0.08 0.24 0.02 0.04 0.00 0.07 0.15
TF= Translocation factor
Figure 3. Depth wise Distributions of Trace Metals of Soil profiles
Geochemical Classification of watery extract soil and water types using Trilinear Plotting System (Piper’s Trilinear Diagram) The interaction of irrigation water with bedrocks
made new chemical and physical characterization of geochemical nature. Leaching and dissolution process occured with irrigation water and water table through infiltera-
Yasser and Ahmed, 2018; Evaluation of Hydrochemical Facies and Ionic Ratio of Al-Salam Canal Water and Its Relation with Watery extracted soil and Water Table - North Sinai-Egypt
-tion process underground. The water types (irrigation and drainage and water table) in the study area can be classified to the salinity parameters, which is formed either from infiltration of surface irrigation water (Al-Salam canal) in already existing rock formations or formed during the sedimentation times. By plotting the chemical data of the surface water (Al-Salam canal) and water table samples in the study area on the piper’s trilinear diagram, it revealed that; the increasing of soil salinity on surface and sub-surface,increasing salinity of drainage water and water table. The big difference between salinity of irrigation water and drainage water with water table proved that raise of soil salinity with different depth. In pieper figures, showed that most of watery extract soil salinity at different depths lied on marine zone which affected by sea water interaction. All irrigation canals, water samples of Al-Salam canal samples are dominated by alkaline earth and weak acid {carbonate hardness CaMg(HCO3)2, secondary alkalinity} sub-area (F5), this reflects that the effect of recharging processes of the (irrigation canal water). Generally, the chemical composition of Al-Salam canal water is primarily dependent on the mixing ratio between Nile River and hadous agriculture drain. The hydro-chemical characteristics of the major and minor ions with a view to determining the water types and visualizing trends of water chemistry, the Piper tri-linear diagrams are used. The Piper tri-linear diagram (Piper, 1944) is applied to show the relative concentrations of the major cations and anions. Analytical result presents the abundance of these ions in the following order: Mg > Ca > Na > K = Cl > SO4 > HCO3. Chloride is the dominant anion found in the watery soil extract of the study area.
Hydro Geochemical facies and Classification The evaluation chemical character of water solutions has been determined with the application of the concept of hydro chemical facies (Freeze et al., 1979) which enables a convenient subdivision of water compositions by identifiable categories and reflects the effect of chemical processes occurring between the minerals within the subsurface rock units and water types. Piper trilinear as example is used
to gain better insight into the hydro chemical processes operating in the water system. The Piper trilinear diagram was used for the purpose of characterizing the water types present in the area. It permits the cation and anion compositions of many samples to be represented, in which major groupings or trends in the data can be discerned visually (Leybourne et al., 1998). Water types are often used in the characterization of waters as a diagnostic tool (Pitkanen et al., 2002). Piper trilinear diagram for the study area shows that there is a mixture of two types of water with variable concentrations of major ions. These are Ca–Mg–Cl–SO4 type and Na-K–Cl–SO4 type water. Chloride is the dominant anion followed by sulphate. Most of the water samples are made up of mixtures of the two water types. The chloride and sulphate ions, as revealed in this study, are clearly the dominant anions and so there are practically no bicarbonate waters,. Given the influence of the recharge in the soil sections of the area, the water ionic raios generally gives a SO4/Cl (in meq/L) that is higher than that corresponding to seawater in the sampled water. This reveals that only a part of the sulphate content can be attributed to seawater and that a significant proportion must come from other saline contributions that differentially enrich the water with the sulphate ion. The appearance of Ca-Cl facies in a target area reflects the operation of inverse ion exchange, whereas the Na-HCO3 facies can indicate direct exchange, and the predominance of Ca-Cl or Ca-Cl, SO4 (Appelo et al., 1993; Howard et al., 1983; Tellam et al., 1986; Lloyd et al., 1988; Ikeda, 1989) faces over much of the aquifer clearly indicates the existence of inverse ion) exchange. In this study, the dominant ions are Cl-, Na with Ca2+ and HCO3
- ions following. Generally, within the evolutionary trend, watery soil extract tends to acquire chemical compositions similar to that of seawater that is more dissolved and relative increase in chloride ion.
Mechanism controlling water chemistry Chloride is the most useful parameter for evaluating atmospheric input to water as it shows very little fractionation. Sodium and Chloride inputs are likely to be mainly from rainfall and, therefore, will largely reflect the
Yasser and Ahmed, 2018; Evaluation of Hydrochemical Facies and Ionic Ratio of Al-Salam Canal Water and Its Relation with Watery extracted soil and Water Table - North Sinai-Egypt
ratio observed in seawater. Cation exchange may account for a reduction in the Na concentration, and halite dissolution may account for high concentration of Cl. The low concentrations of potassium in natural water are a consequence of its tendency to be fixed by clay minerals and participate in the formation of secondary minerals (Matheis, 1982). Dissolved species and their relations with each other can reveal the origin of solutes and the processes that generated the observed
composition of water. The Na/Cl relationship has often been used to identify the mechanism for salinity distribution and saline intrusions (Sami, 1992) and (Panteleit et al., 2001). The Na+ and Ca2+ shows a good correlation indicating that Cl- and for the most part, Na+ are probably derived from the dissolution of disseminated halite in fine-grained sediments. The high Na/Cl ratios are probably controlled by water-rock interaction.
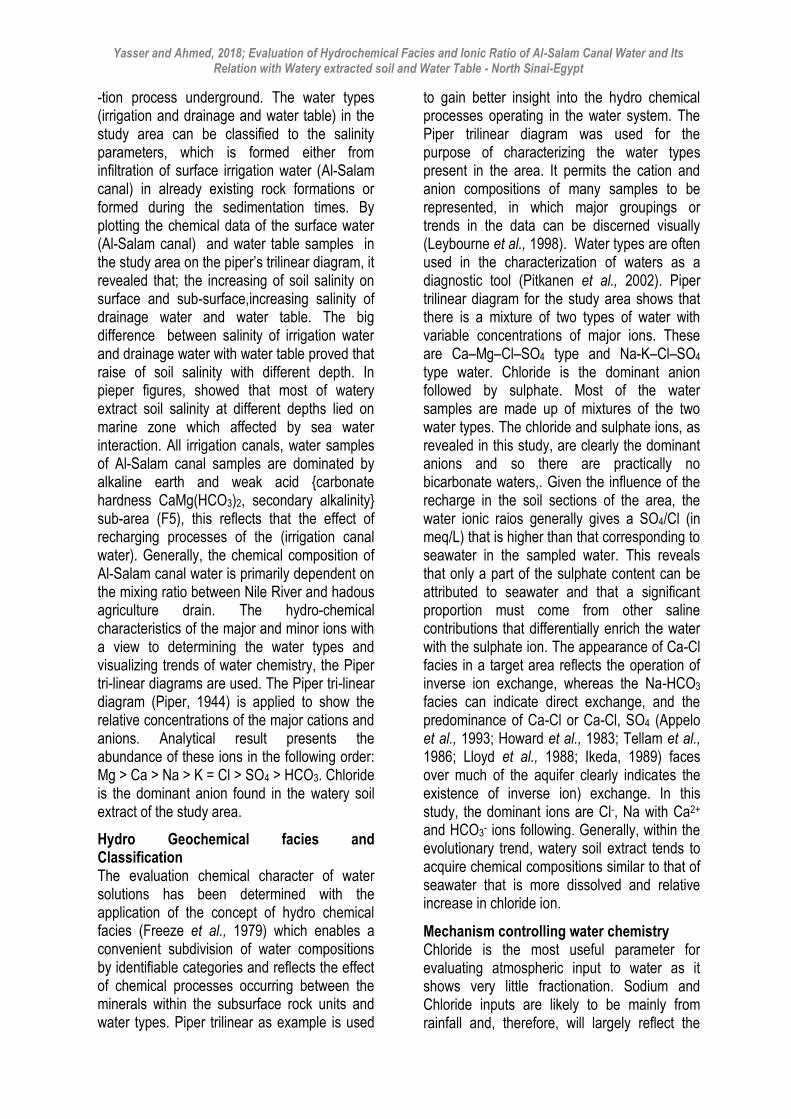
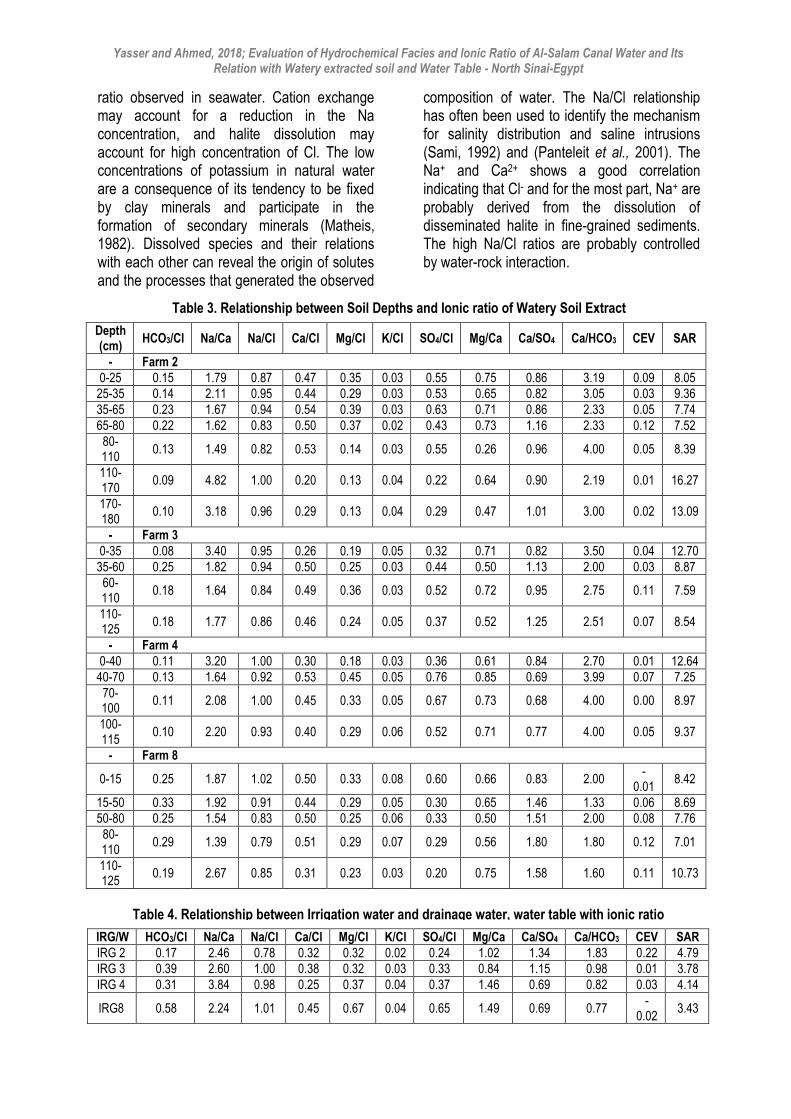
Table 3. Relationship between Soil Depths and Ionic ratio of Watery Soil Extract
Depth (cm)
HCO3/Cl Na/Ca Na/Cl Ca/Cl Mg/Cl K/Cl SO4/Cl Mg/Ca Ca/SO4 Ca/HCO3 CEV SAR
- Farm 2
0-25 0.15 1.79 0.87 0.47 0.35 0.03 0.55 0.75 0.86 3.19 0.09 8.05
25-35 0.14 2.11 0.95 0.44 0.29 0.03 0.53 0.65 0.82 3.05 0.03 9.36
35-65 0.23 1.67 0.94 0.54 0.39 0.03 0.63 0.71 0.86 2.33 0.05 7.74
65-80 0.22 1.62 0.83 0.50 0.37 0.02 0.43 0.73 1.16 2.33 0.12 7.52
80-110
0.13 1.49 0.82 0.53 0.14 0.03 0.55 0.26 0.96 4.00 0.05 8.39
110-170
0.09 4.82 1.00 0.20 0.13 0.04 0.22 0.64 0.90 2.19 0.01 16.27
170-180
0.10 3.18 0.96 0.29 0.13 0.04 0.29 0.47 1.01 3.00 0.02 13.09
- Farm 3
0-35 0.08 3.40 0.95 0.26 0.19 0.05 0.32 0.71 0.82 3.50 0.04 12.70
35-60 0.25 1.82 0.94 0.50 0.25 0.03 0.44 0.50 1.13 2.00 0.03 8.87
60-110
0.18 1.64 0.84 0.49 0.36 0.03 0.52 0.72 0.95 2.75 0.11 7.59
110-125
0.18 1.77 0.86 0.46 0.24 0.05 0.37 0.52 1.25 2.51 0.07 8.54
- Farm 4
0-40 0.11 3.20 1.00 0.30 0.18 0.03 0.36 0.61 0.84 2.70 0.01 12.64
40-70 0.13 1.64 0.92 0.53 0.45 0.05 0.76 0.85 0.69 3.99 0.07 7.25
70-100
0.11 2.08 1.00 0.45 0.33 0.05 0.67 0.73 0.68 4.00 0.00 8.97
100-115
0.10 2.20 0.93 0.40 0.29 0.06 0.52 0.71 0.77 4.00 0.05 9.37
- Farm 8
0-15 0.25 1.87 1.02 0.50 0.33 0.08 0.60 0.66 0.83 2.00 -
0.01 8.42
15-50 0.33 1.92 0.91 0.44 0.29 0.05 0.30 0.65 1.46 1.33 0.06 8.69
50-80 0.25 1.54 0.83 0.50 0.25 0.06 0.33 0.50 1.51 2.00 0.08 7.76
80-110
0.29 1.39 0.79 0.51 0.29 0.07 0.29 0.56 1.80 1.80 0.12 7.01
110-125
0.19 2.67 0.85 0.31 0.23 0.03 0.20 0.75 1.58 1.60 0.11 10.73
IRG/W HCO3/Cl Na/Ca Na/Cl Ca/Cl Mg/Cl K/Cl SO4/Cl Mg/Ca Ca/SO4 Ca/HCO3 CEV SAR
IRG 2 0.17 2.46 0.78 0.32 0.32 0.02 0.24 1.02 1.34 1.83 0.22 4.79
IRG 3 0.39 2.60 1.00 0.38 0.32 0.03 0.33 0.84 1.15 0.98 0.01 3.78
IRG 4 0.31 3.84 0.98 0.25 0.37 0.04 0.37 1.46 0.69 0.82 0.03 4.14
IRG8 0.58 2.24 1.01 0.45 0.67 0.04 0.65 1.49 0.69 0.77 -
0.02 3.43
Table 4. Relationship between Irrigation water and drainage water, water table with ionic ratio

Yasser and Ahmed, 2018; Evaluation of Hydrochemical Facies and Ionic Ratio of Al-Salam Canal Water and Its Relation with Watery extracted soil and Water Table - North Sinai-Egypt
Table 5. Statistical Summary of the Hydro-chemical and Major ions and Heavy Metals of water table
Maximum Minimum Parameters Maximum Minimum Parameters
7.70 7.40 PH 0.30 0.02 HCO3/Cl
26060 2356 EC µS cm-1 8.79 1.00 Na/Ca
15375 1390 TDS 1.14 0.65 Na/Cl
28.60 8.30 Ca+2 % 0.65 0.13 Ca/Cl
42.70 20.80 Mg+2% 0.97 0.34 Mg/Cl
61.10 27.40 Na+1% 0.04 0.01 K/Cl
2.70 0.90 %K+1 0.98 0.29 SO4/Cl
4.20 0.10 CO3-2 2.60 1.49 Mg/Ca
14.80 1.00 HCO3 -1% 0.94 0.23 Ca/SO4
66.60 44.70 Cl-1% 8.48 0.89 Ca/HCO3
43.70 18.00 SO4-2% 0.52 -0.37 CEV
0.1145 <0.001 Mn mg.L-1 21.14 3.78 SAR
0.0133 0.0044 Zn mg.L-1 0.0444 0.0173 Pb mg.L-1
0.0073 <0.002 Cu mg.L-1 0.0005 <0.0002 Co mg.L-1
<0.0005 <0.0005 Ni mg.L-1 <0.0002 <0.0002 Cd mg.L-1
Table 6. Statistical Summary of the Hydro-chemical and Major ions and Heavy metals for Drainage water
Maximum Minimum Parameters Maximum Minimum Parameters
8.20 6.90 PH 0.03 0.00 HCO3/Cl
49900 12210 EC µS cm-1 7.81 3.06 Na/Ca
29441 7203.9 TDS 0.90 0.73 Na/Cl
19.60 7.80 Ca+2 % 0.24 0.10 Ca/Cl
31.30 20.10 Mg+2% 0.39 0.25 Mg/Cl
66.20 59.60 Na+1% 0.02 0.00 K/Cl
1.80 0.70 %K+1 0.34 0.16 SO4/Cl
0.60 0.10 CO3-2 4.00 1.02 Mg/Ca
2.00 0.00 HCO3 -1% 1.06 0.43 Ca/SO4
84.30 72.40 Cl-1% 40.24 3.17 Ca/HCO3
25.30 13.20 SO4-2% 0.99 0.21 CEV
0.1494 <0.001 Mn mg.L-1 34.98 14.93 SAR
0.0133 0.0044 Zn mg.L-1 0.0349 0.0016 Pb mg.L-1
0.004 <0.002 Cu mg.L-1 0.0006 <0.0002 Co mg.L-1
<0.0005 <0.0005 Ni mg.L-1 <0.0002 <0.0002 Cd mg.L-1
Table 7. Statistical Summary of Hydro-chemical and Major ions and Heavy Metals of Irrigation Water
Maximum Minimum Parameters/unit Maximum Minimum Parameters/unit
7.20 6.70 PH 0.58 0.17 HCO3/Cl
2760 1392 EC µS cm-1 3.84 2.24 Na/Ca
1628.4 821 TDS 1.10 0.78 Na/Cl
22.50 16.10 Ca+2 % 0.45 0.25 Ca/Cl
30.80 19.00 Mg+2% 0.67 0.32 Mg/Cl
62.80 44.40 Na+1% 0.05 0.02 K/Cl
Drain Water
DR 2 0.02 3.06 0.73 0.24 0.25 0.00 0.23 1.02 1.06 13.27 0.27 14.93
DR 3 0.02 6.09 0.90 0.15 0.32 0.01 0.34 2.14 0.43 6.10 0.21 21.59
DR 4 0.00 7.64 0.82 0.11 0.28 0.02 0.18 2.59 0.58 40.24 0.48 34.78
DR 8 0.03 7.81 0.75 0.10 0.39 0.02 0.16 4.00 0.61 3.17 0.99 16.62
Water Table
ET 2 0.02 8.79 1.14 0.13 0.34 0.04 0.56 2.60 0.23 6.22 -
0.37 19.73
ET 3 0.26 1.00 0.65 0.65 0.97 0.03 0.98 1.49 0.66 2.51 0.52 3.78
ET 4 0.02 5.02 0.94 0.19 0.37 0.01 0.48 1.94 0.39 8.48 0.11 21.14
ET 8 0.30 3.00 0.80 0.27 0.52 0.04 0.29 1.95 0.94 0.89 0.38 4.03
Yasser and Ahmed, 2018; Evaluation of Hydrochemical Facies and Ionic Ratio of Al-Salam Canal Water and Its Relation with Watery extracted soil and Water Table - North Sinai-Egypt
2.40 1.10 %K+1 0.65 0.24 SO4/Cl
7.00 0.95 CO3-2 1.49 0.84 Mg/Ca
24.60 8.90 HCO3 -1% 1.34 0.69 Ca/SO4
70.80 44.7 Cl-1% 1.83 0.69 Ca/HCO3
29.20 16.90 SO4-2% 0.22 -0.02 CEV
0.70 0.002 Mn mg.L-1 4.79 3.43 SAR
0.040 0.005 Zn mg.L-1 0.060 0.007 Pb mg.L-1
0.002 0.002 Cu mg.L-1 0.0004 0.0002 Co mg.L-1
0.0005 0.0005 Ni mg.L-1 0.0002 0.0002 Cd mg.L-1
Table 8. Statistical Summary of major Cations and anions F2/F3 Maximum Minimum Parameters Maximum Minimum Parameters
7.90 7.60 PH 8.00 7.60 PH
9175 1650 EC µS cm-1 9175 2575 EC µS cm-1
5413 973.5 TDS mg.L-1 5413 1519 TDS mg.L-1
29.53 18.89 Ca+2 % 35.81 15.01 Ca+2 %
21.08 13.50 Mg+2% 21.53 9.15 Mg+2%
64.30 47.8 Na+1% 72.38 47.69 Na+1%
3.33 1.83 %K+1 3.05 1.29 %K+1
14.76 5.4 HCO3 -1% 13.06 6.84 HCO3 -1%
71.54 58.8 Cl-1% 53.83 53.83 Cl-1%
30.65 23.00 SO4-2% 33.72 16.75 SO4-2%
Table 9. Statistical Summary of major Cations and anions F4 / F8 Maximum Minimum Parameters Maximum Minimum Parameters
8.1 7.40 PH 7.70 7.40 PH
2105 725 EC µS cm-1 9425 6525 EC µS cm-1
1241 427 TDS mg.L-1 5560 3849 TDS mg.L-1
32.36 22.40 Ca+2 % 27.84 20.44 Ca+2 %
18.00 15.81 Mg+2% 23.68 12.48 Mg+2%
59.50 45.09 Na+1% 65.30 45.64 Na+1%
4.55 2.14 %K+1 3.41 1.78 %K+1
20.35 13.30 HCO3 -1% 7.57 6.00 HCO3 -1%
72.11 53.89 Cl-1% 68.16 52.88 Cl-1%
32.59 14.06 SO4-2% 40.14 24.27 SO4-2%
Hypothetical Salt Combination of Extracted Soil from El-Tina Plain
Hydrochemical characteristics of groundwater To study hydro-chemical characteristics of water types in the study area, the focus is on the water salinity (total dissolved solids) and the hypothetical salts combinations that characterize the surface water and groundwater in the study area. Water salinity The Salinity hazard can happen when salts accumulate in the zone of the crop to reduce the root sum of water existing at the roots. The available amount of the reduced water occasionally hits such levels that are adversely affecting the crop yield. Plant's growth gets slow rate and drought-like symptoms begins to build up when this water pressure is extended
(Ayers and Westcot, 1985). A high osmotic potential is caused by high salinity in the water or soil solution. Plant roots can be burnt and/or flagged by some salts with a toxic effect. The elevated rates of some metals may intervene with proportional availability and plant absorption of other micronutrients (Porter and Marek, 2006). It is closely related to Total dissolved solids (TDS) due to the function of the ionic solute concentrations. Todd and Meys, (2005) were classified the groundwater based on salinity hazard into these categories: Excellent groundwater (EC ˂ 250µs/cm),
Good groundwater (EC ranges from 250– 750µs/cm),
Allowed groundwater (EC ranges from 750– 2250µs/cm),
Unsuitable groundwater (EC ˃ 2250µs/cm).
The total dissolved solids (TDS) are a measure of the total mass of ions dissolved in water.
Yasser and Ahmed, 2018; Evaluation of Hydrochemical Facies and Ionic Ratio of Al-Salam Canal Water and Its Relation with Watery extracted soil and Water Table - North Sinai-Egypt
Different methods are used for water classification corresponding to its salinity value. According to (Chebotarev,1955), the natural water is classified into three main categories of total salinity, fresh water (TDS up to 1500 mg/L), brackish water (1500-5000 mg/L) and saline water (TDS more than 5000 mg/L). According to this classification, the surface water samples in the study area are related to the fresh water type. Table 12 showed the different values of salinity in watery extract soil at different depths in different farms and table 13 showed the different salinity of water types (irrigation water and drainage water and water table). The low salinity is attributed to the contribution Al-Salam canal to the dwater table sub-surface at different parts in the study area, i.e. there is a recharge from these canals to the groundwater in the study area. While, in the other parts of the study area, the high salinity in the groundwater is due to the leaching and dissolution processes of marine soil during the fresh water flow from up-surface to down surface at differnet depths.
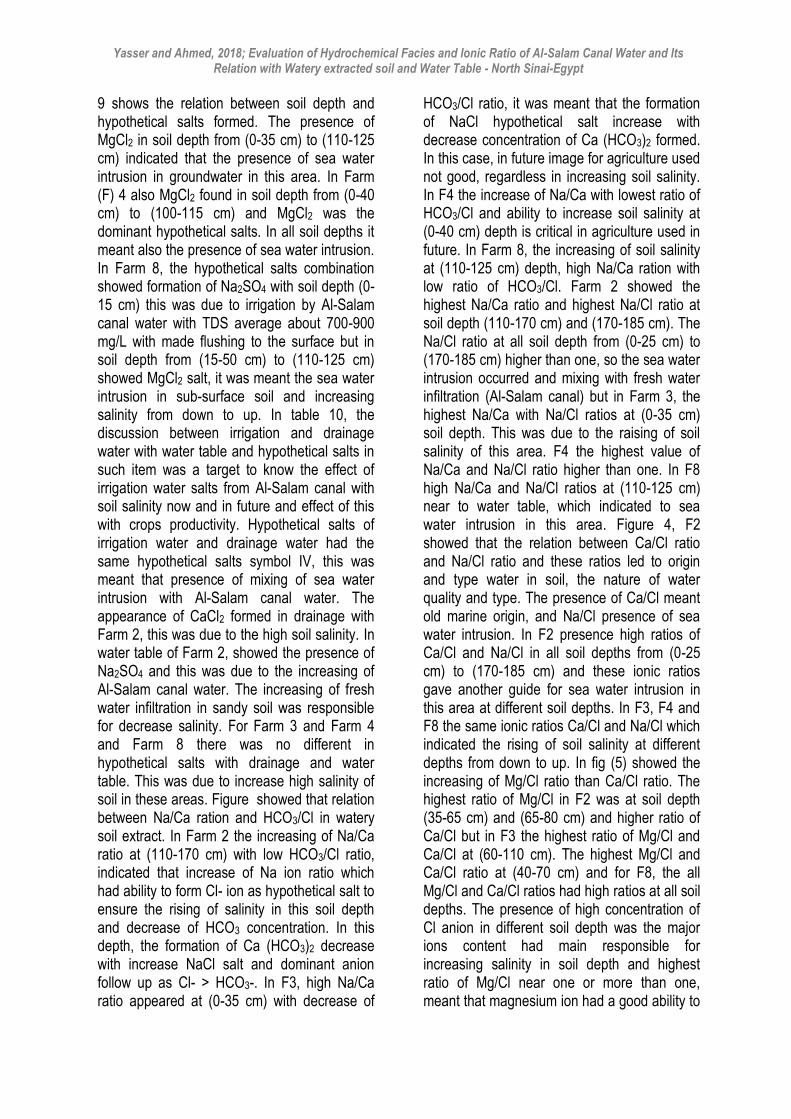
Comparison between soil depth salinity and water type salinity The relationship between salinity of different depth and salinity of irrigation and drainage water and water table was investigated. In farm 2, showed the increasing salinity in water table level with increasing salinity of drainage water as a result of rising soil salinity and this is indicated to damage of soil characterization to removal salinity. In farm 3, showed the riase of salinity at depth 0-35 cm and this depth was an important for palnt and roots nature and increase of salinity in drainge water and water table, so that it should make more flushing with fresh irrigation water to improve soil salinity in future. In farm 4, the increasing salinity of water table was indicated that there was no drainage system in this area also,increasing salinity in drainage water. the decreasing of water table salinity in farm 8, meant there is no saline damage of soil at water table level. The irrigation water could make good flushing preocess for all depth soil levels.
Hypothetical salts combinations of water types The combination between major anions and cations reveals formation of one, five and three main groups of hypothetical salts combinations for the surface water and groundwater table (Table 9,10). Regarding the hypothetical salt combination in Al-Salam canals( irrigation water), water samples, one main assemblage are detected (I), the presence of Na2SO4 salt in this assemblage is a true indication fresh water recharges. But the presence of MgCl2 and MgSO4 salts indicates mixed water conditions. So, such water acquires its chemical composition from leaching and the dissolution of terrestrial salts processes and mixing of nile water with agriculure drainage water from hadous and serw drains along Al-Salam canal. The majority of the water samples (75%) in the study area is characterized by the assemblage of hypothetical salt combination (IV) regardless of their total salinities, where three sulphate salts (MgCl, MgSO4 and CaSO4) which reflects the effect of leaching and dissolution of terrestrial salt with some contribution of cation exchange process as well as downward infiltration of the excess irrigation water of the cultivated soils and seepage of irrigation canals, that leads to the increase of water salinity. Table 9 shows the different hypothetical salts with different soil depth in Farm (F) 2 area. The discussion of the nature of ionic salts in soil depth was more attractive for scientists, in which the formation of different salts indicated to water type and quality. The origin source of water in soil extracted would give us the sea water intrusion or water mixing between (salt and fresh water). The main focusing of an article was study of movement salinity in soil depth and relation between fresh water (Al-Salam canal) and sea water intrusion from Suez Canal and Mediterranean Sea water. Table 9 in Farm 2, the hypothetical salts undergoes to IV symbol, which indicated to form MgCl2 salt in all soil depth from (0-25 cm) to (170-185 cm). The formation of MgCl2 in hypothetical salts combination indicated to sea water intrusion and old sea water formed in ground water in this area. The following anion salts undergoes from Cl- >SO4
-2 >HCO3-.Table
Yasser and Ahmed, 2018; Evaluation of Hydrochemical Facies and Ionic Ratio of Al-Salam Canal Water and Its Relation with Watery extracted soil and Water Table - North Sinai-Egypt
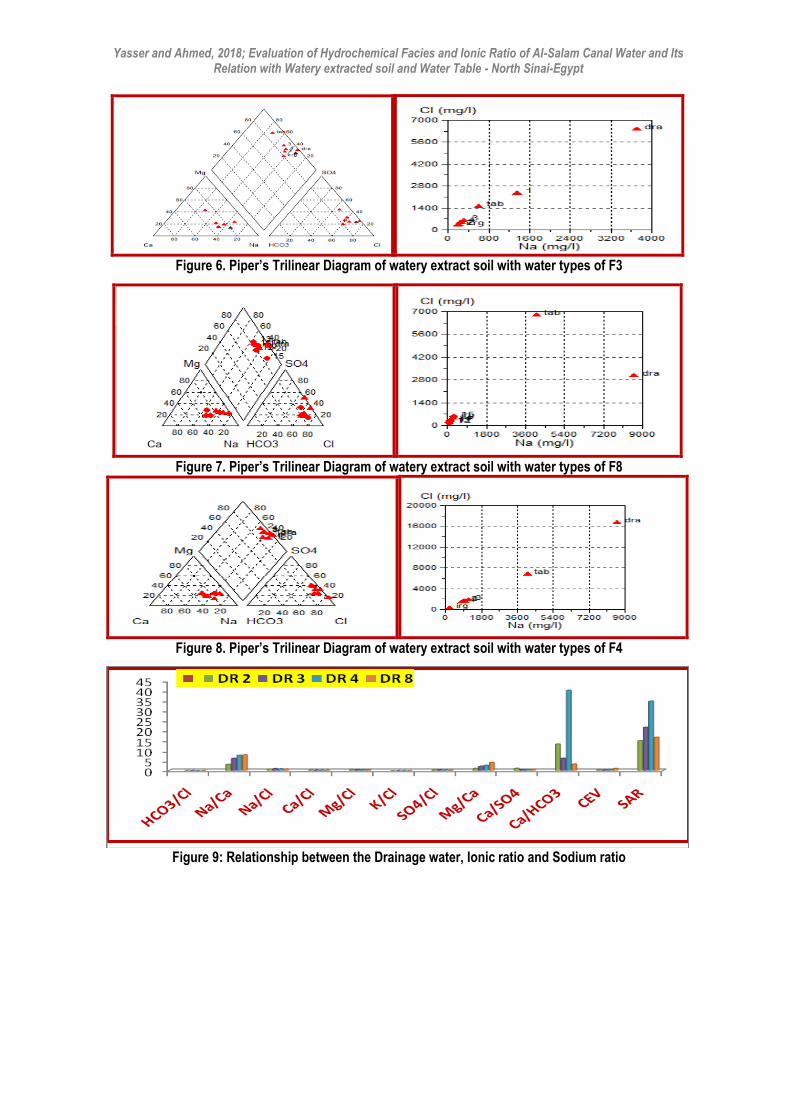
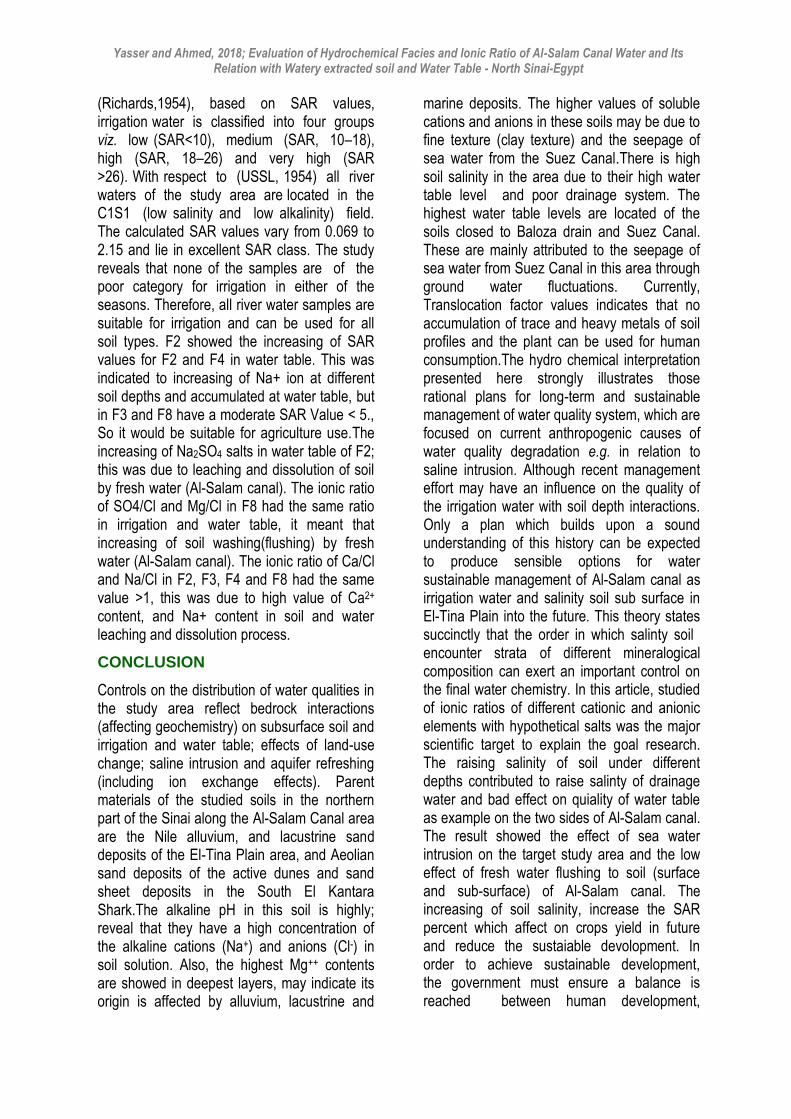
9 shows the relation between soil depth and hypothetical salts formed. The presence of MgCl2 in soil depth from (0-35 cm) to (110-125 cm) indicated that the presence of sea water intrusion in groundwater in this area. In Farm (F) 4 also MgCl2 found in soil depth from (0-40 cm) to (100-115 cm) and MgCl2 was the dominant hypothetical salts. In all soil depths it meant also the presence of sea water intrusion. In Farm 8, the hypothetical salts combination showed formation of Na2SO4 with soil depth (0-15 cm) this was due to irrigation by Al-Salam canal water with TDS average about 700-900 mg/L with made flushing to the surface but in soil depth from (15-50 cm) to (110-125 cm) showed MgCl2 salt, it was meant the sea water intrusion in sub-surface soil and increasing salinity from down to up. In table 10, the discussion between irrigation and drainage water with water table and hypothetical salts in such item was a target to know the effect of irrigation water salts from Al-Salam canal with soil salinity now and in future and effect of this with crops productivity. Hypothetical salts of irrigation water and drainage water had the same hypothetical salts symbol IV, this was meant that presence of mixing of sea water intrusion with Al-Salam canal water. The appearance of CaCl2 formed in drainage with Farm 2, this was due to the high soil salinity. In water table of Farm 2, showed the presence of Na2SO4 and this was due to the increasing of Al-Salam canal water. The increasing of fresh water infiltration in sandy soil was responsible for decrease salinity. For Farm 3 and Farm 4 and Farm 8 there was no different in hypothetical salts with drainage and water table. This was due to increase high salinity of soil in these areas. Figure showed that relation between Na/Ca ration and HCO3/Cl in watery soil extract. In Farm 2 the increasing of Na/Ca ratio at (110-170 cm) with low HCO3/Cl ratio, indicated that increase of Na ion ratio which had ability to form Cl- ion as hypothetical salt to ensure the rising of salinity in this soil depth and decrease of HCO3 concentration. In this depth, the formation of Ca (HCO3)2 decrease with increase NaCl salt and dominant anion follow up as Cl- > HCO3-. In F3, high Na/Ca ratio appeared at (0-35 cm) with decrease of
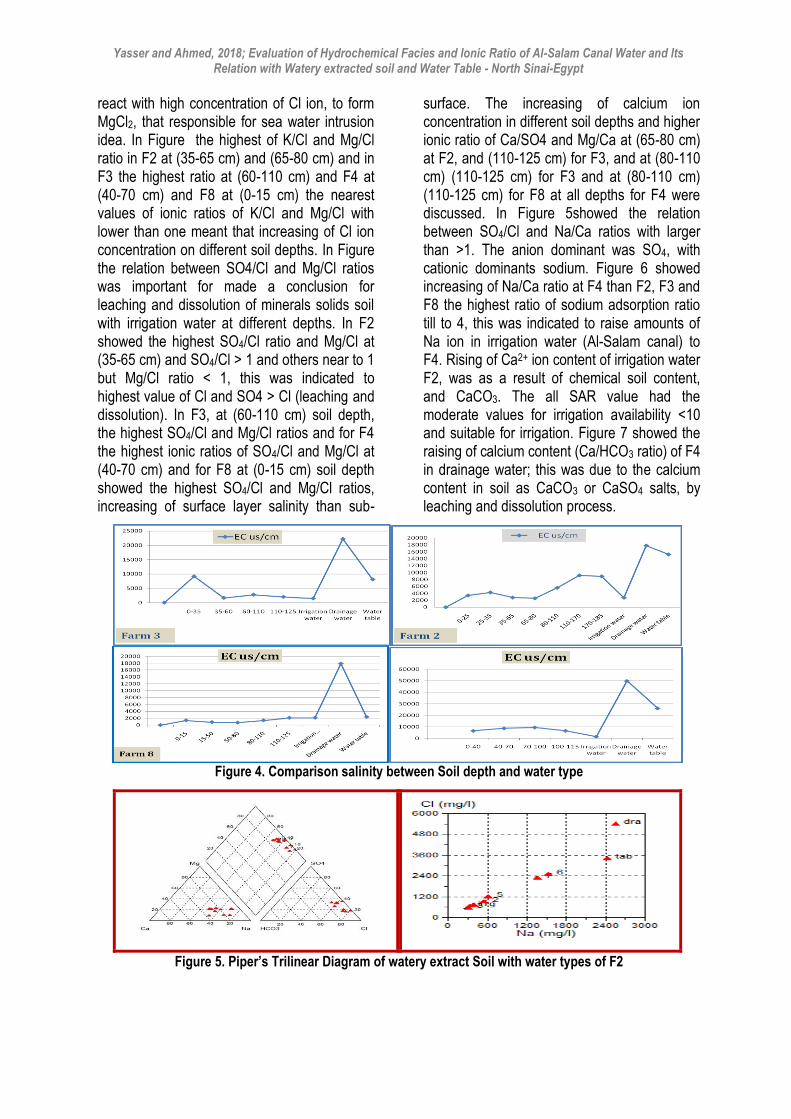
HCO3/Cl ratio, it was meant that the formation of NaCl hypothetical salt increase with decrease concentration of Ca (HCO3)2 formed. In this case, in future image for agriculture used not good, regardless in increasing soil salinity. In F4 the increase of Na/Ca with lowest ratio of HCO3/Cl and ability to increase soil salinity at (0-40 cm) depth is critical in agriculture used in future. In Farm 8, the increasing of soil salinity at (110-125 cm) depth, high Na/Ca ration with low ratio of HCO3/Cl. Farm 2 showed the highest Na/Ca ratio and highest Na/Cl ratio at soil depth (110-170 cm) and (170-185 cm). The Na/Cl ratio at all soil depth from (0-25 cm) to (170-185 cm) higher than one, so the sea water intrusion occurred and mixing with fresh water infiltration (Al-Salam canal) but in Farm 3, the highest Na/Ca with Na/Cl ratios at (0-35 cm) soil depth. This was due to the raising of soil salinity of this area. F4 the highest value of Na/Ca and Na/Cl ratio higher than one. In F8 high Na/Ca and Na/Cl ratios at (110-125 cm) near to water table, which indicated to sea water intrusion in this area. Figure 4, F2 showed that the relation between Ca/Cl ratio and Na/Cl ratio and these ratios led to origin and type water in soil, the nature of water quality and type. The presence of Ca/Cl meant old marine origin, and Na/Cl presence of sea water intrusion. In F2 presence high ratios of Ca/Cl and Na/Cl in all soil depths from (0-25 cm) to (170-185 cm) and these ionic ratios gave another guide for sea water intrusion in this area at different soil depths. In F3, F4 and F8 the same ionic ratios Ca/Cl and Na/Cl which indicated the rising of soil salinity at different depths from down to up. In fig (5) showed the increasing of Mg/Cl ratio than Ca/Cl ratio. The highest ratio of Mg/Cl in F2 was at soil depth (35-65 cm) and (65-80 cm) and higher ratio of Ca/Cl but in F3 the highest ratio of Mg/Cl and Ca/Cl at (60-110 cm). The highest Mg/Cl and Ca/Cl ratio at (40-70 cm) and for F8, the all Mg/Cl and Ca/Cl ratios had high ratios at all soil depths. The presence of high concentration of Cl anion in different soil depth was the major ions content had main responsible for increasing salinity in soil depth and highest ratio of Mg/Cl near one or more than one, meant that magnesium ion had a good ability to
Yasser and Ahmed, 2018; Evaluation of Hydrochemical Facies and Ionic Ratio of Al-Salam Canal Water and Its Relation with Watery extracted soil and Water Table - North Sinai-Egypt
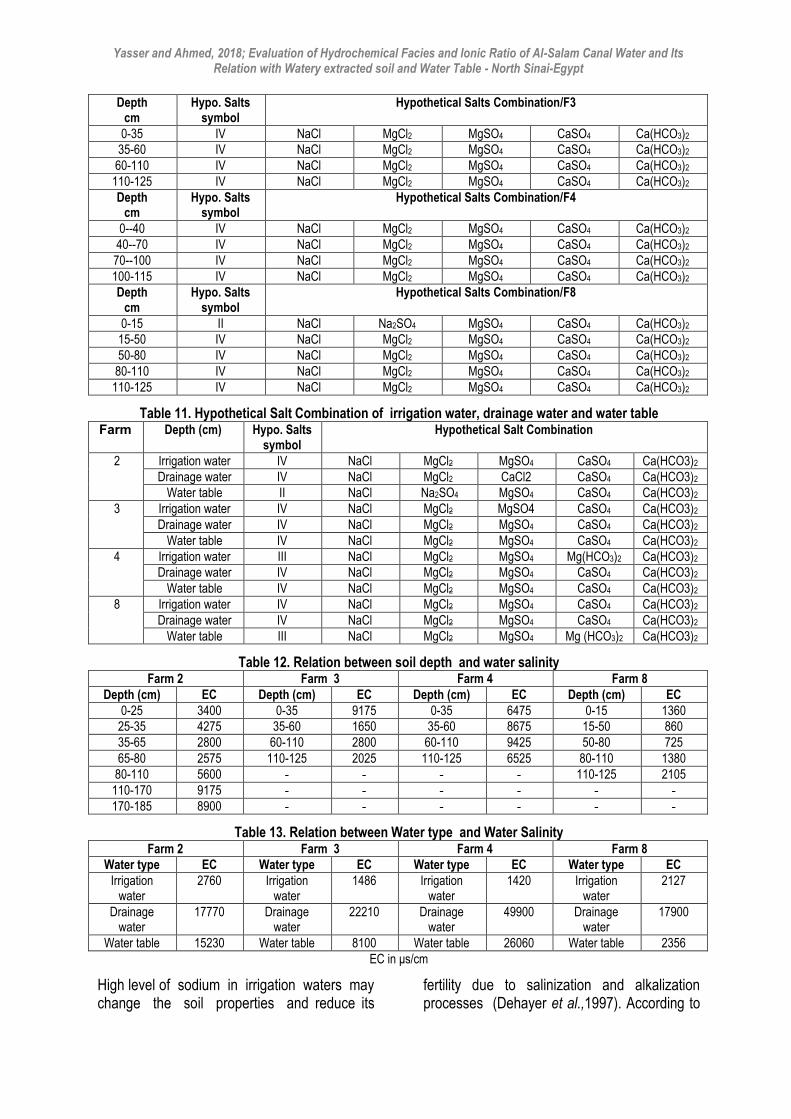
react with high concentration of Cl ion, to form MgCl2, that responsible for sea water intrusion idea. In Figure the highest of K/Cl and Mg/Cl ratio in F2 at (35-65 cm) and (65-80 cm) and in F3 the highest ratio at (60-110 cm) and F4 at (40-70 cm) and F8 at (0-15 cm) the nearest values of ionic ratios of K/Cl and Mg/Cl with lower than one meant that increasing of Cl ion concentration on different soil depths. In Figure the relation between SO4/Cl and Mg/Cl ratios was important for made a conclusion for leaching and dissolution of minerals solids soil with irrigation water at different depths. In F2 showed the highest SO4/Cl ratio and Mg/Cl at (35-65 cm) and SO4/Cl > 1 and others near to 1 but Mg/Cl ratio < 1, this was indicated to highest value of Cl and SO4 > Cl (leaching and dissolution). In F3, at (60-110 cm) soil depth, the highest SO4/Cl and Mg/Cl ratios and for F4 the highest ionic ratios of SO4/Cl and Mg/Cl at (40-70 cm) and for F8 at (0-15 cm) soil depth showed the highest SO4/Cl and Mg/Cl ratios, increasing of surface layer salinity than sub-
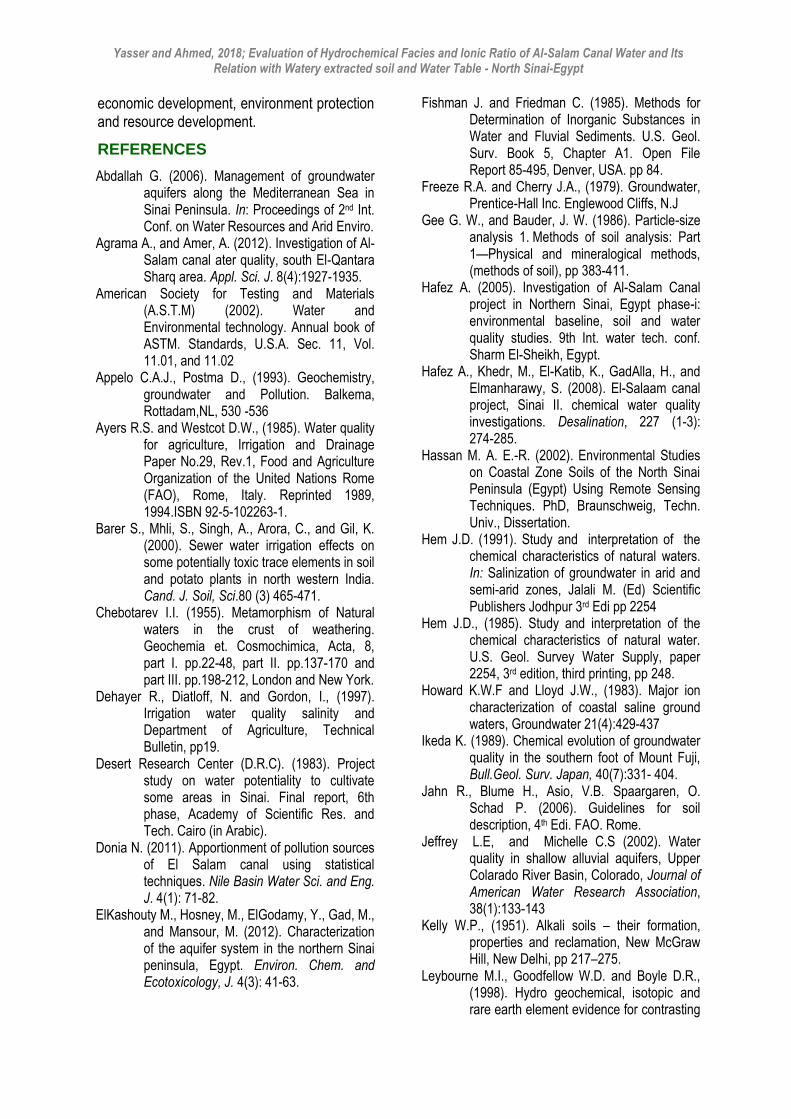
surface. The increasing of calcium ion concentration in different soil depths and higher ionic ratio of Ca/SO4 and Mg/Ca at (65-80 cm) at F2, and (110-125 cm) for F3, and at (80-110 cm) (110-125 cm) for F3 and at (80-110 cm) (110-125 cm) for F8 at all depths for F4 were discussed. In Figure 5showed the relation between SO4/Cl and Na/Ca ratios with larger than >1. The anion dominant was SO4, with cationic dominants sodium. Figure 6 showed increasing of Na/Ca ratio at F4 than F2, F3 and F8 the highest ratio of sodium adsorption ratio till to 4, this was indicated to raise amounts of Na ion in irrigation water (Al-Salam canal) to F4. Rising of Ca2+ ion content of irrigation water F2, was as a result of chemical soil content, and CaCO3. The all SAR value had the moderate values for irrigation availability <10 and suitable for irrigation. Figure 7 showed the raising of calcium content (Ca/HCO3 ratio) of F4 in drainage water; this was due to the calcium content in soil as CaCO3 or CaSO4 salts, by leaching and dissolution process.
Figure 4. Comparison salinity between Soil depth and water type
Figure 5. Piper’s Trilinear Diagram of watery extract Soil with water types of F2
Yasser and Ahmed, 2018; Evaluation of Hydrochemical Facies and Ionic Ratio of Al-Salam Canal Water and Its Relation with Watery extracted soil and Water Table - North Sinai-Egypt
Figure 6. Piper’s Trilinear Diagram of watery extract soil with water types of F3
Figure 7. Piper’s Trilinear Diagram of watery extract soil with water types of F8
Figure 8. Piper’s Trilinear Diagram of watery extract soil with water types of F4
Figure 9: Relationship between the Drainage water, Ionic ratio and Sodium ratio

Yasser and Ahmed, 2018; Evaluation of Hydrochemical Facies and Ionic Ratio of Al-Salam Canal Water and Its Relation with Watery extracted soil and Water Table - North Sinai-Egypt
Figure 10: Relationship between the Irrigation water, Ionic ratio and Sodium ratio
Figure 11. Relationship between the Water table, Ionic ratio and Sodium ratio
Sodium Adsorption Ratio (SAR) Sodium concentration is very important parameter for irrigation water quality because high level of sodium concentration in irrigation water produces an alkaline soil. Todd (1980) described that SAR is an important parameter for the determination of the suitability of irrigation water because it is responsible for the sodium hazard. High level of sodium in water causes the undesirable effects of changing soil properties and reducing soil permeability. SAR value of irrigation water quantifies the relative proportions of sodium (Na+) to calcium (Ca2+) and magnesium (Mg2+) and is a measure of alkali/sodium hazard to crop. The SAR values in the study area can be
calculated by the following equation given by (Hem, 1991) as:
SAR= Na+ / {[Ca2++ Mg2+] /2}0.5 where the concentrations are expressed as milli-equivalents per liter. What SAR provides a beneficial pointer of water irrigation potential detrimental effects on soil structure and permeability. The concentration of the constituents is expressed in (meq/L). (Richards, 1954) classified the irrigation water according to SAR values into the following categories; Good water (SAR up to 10),
Moderate water (SAR ranges from 10 – 18),
Intermediate water (SAR ranges from 18 – 26),
Unsuitable water (SAR ˃ 26).
Table 10. Hypothetical Salts Combination of Extracted Soil from Sahl El-Tina Depth
cm Hypo. Salts
symbol Hypothetical Salts Combination/F2
0-25 IV NaCl MgCl2 MgSO4 CaSO4 Ca(HCO3)2
25-35 IV NaCl MgCl2 MgSO4 CaSO4 Ca(HCO3)2
35-65 IV NaCl MgCl2 MgSO4 CaSO4 Ca(HCO3)2
65-80 IV NaCl MgCl2 MgSO4 CaSO4 Ca(HCO3)2
80-110 IV NaCl MgCl2 MgSO4 CaSO4 Ca(HCO3)2
110-170 IV NaCl MgCl2 MgSO4 CaSO4 Ca(HCO3)2
170-185 IV NaCl MgCl2 MgSO4 CaSO4 Ca(HCO3)2
Yasser and Ahmed, 2018; Evaluation of Hydrochemical Facies and Ionic Ratio of Al-Salam Canal Water and Its Relation with Watery extracted soil and Water Table - North Sinai-Egypt
Depth cm
Hypo. Salts symbol
Hypothetical Salts Combination/F3
0-35 IV NaCl MgCl2 MgSO4 CaSO4 Ca(HCO3)2
35-60 IV NaCl MgCl2 MgSO4 CaSO4 Ca(HCO3)2
60-110 IV NaCl MgCl2 MgSO4 CaSO4 Ca(HCO3)2
110-125 IV NaCl MgCl2 MgSO4 CaSO4 Ca(HCO3)2
Depth cm
Hypo. Salts symbol
Hypothetical Salts Combination/F4
0--40 IV NaCl MgCl2 MgSO4 CaSO4 Ca(HCO3)2
40--70 IV NaCl MgCl2 MgSO4 CaSO4 Ca(HCO3)2
70--100 IV NaCl MgCl2 MgSO4 CaSO4 Ca(HCO3)2
100-115 IV NaCl MgCl2 MgSO4 CaSO4 Ca(HCO3)2
Depth cm
Hypo. Salts symbol
Hypothetical Salts Combination/F8
0-15 II NaCl Na2SO4 MgSO4 CaSO4 Ca(HCO3)2
15-50 IV NaCl MgCl2 MgSO4 CaSO4 Ca(HCO3)2
50-80 IV NaCl MgCl2 MgSO4 CaSO4 Ca(HCO3)2
80-110 IV NaCl MgCl2 MgSO4 CaSO4 Ca(HCO3)2
110-125 IV NaCl MgCl2 MgSO4 CaSO4 Ca(HCO3)2
Table 11. Hypothetical Salt Combination of irrigation water, drainage water and water table mraF Depth (cm) Hypo. Salts
symbol Hypothetical Salt Combination
2 Irrigation water IV NaCl MgCl2 MgSO4 CaSO4 Ca(HCO3)2 Drainage water IV NaCl MgCl2 CaCl2 CaSO4 Ca(HCO3)2
Water table II NaCl Na2SO4 MgSO4 CaSO4 Ca(HCO3)2 3 Irrigation water IV NaCl MgCl2 MgSO4 CaSO4 Ca(HCO3)2
Drainage water IV NaCl MgCl2 MgSO4 CaSO4 Ca(HCO3)2 Water table IV NaCl MgCl2 MgSO4 CaSO4 Ca(HCO3)2
4 Irrigation water III NaCl MgCl2 MgSO4 Mg(HCO3)2 Ca(HCO3)2 Drainage water IV NaCl MgCl2 MgSO4 CaSO4 Ca(HCO3)2
Water table IV NaCl MgCl2 MgSO4 CaSO4 Ca(HCO3)2 8 Irrigation water IV NaCl MgCl2 MgSO4 CaSO4 Ca(HCO3)2
Drainage water IV NaCl MgCl2 MgSO4 CaSO4 Ca(HCO3)2 Water table III NaCl MgCl2 MgSO4 Mg (HCO3)2 Ca(HCO3)2
Table 12. Relation between soil depth and water salinity Farm 2 Farm 3 Farm 4 Farm 8
Depth (cm) EC Depth (cm) EC Depth (cm) EC Depth (cm) EC
0-25 3400 0-35 9175 0-35 6475 0-15 1360
25-35 4275 35-60 1650 35-60 8675 15-50 860
35-65 2800 60-110 2800 60-110 9425 50-80 725
65-80 2575 110-125 2025 110-125 6525 80-110 1380
80-110 5600 - - - - 110-125 2105
110-170 9175 - - - - - -
170-185 8900 - - - - - -
Table 13. Relation between Water type and Water Salinity Farm 2 Farm 3 Farm 4 Farm 8
Water type EC Water type EC Water type EC Water type EC Irrigation
water 2760 Irrigation
water 1486 Irrigation
water 1420 Irrigation
water 2127
Drainage water
17770 Drainage water
22210 Drainage water
49900 Drainage water
17900
Water table 15230 Water table 8100 Water table 26060 Water table 2356 EC in μs/cm
High level of sodium in irrigation waters may change the soil properties and reduce its
fertility due to salinization and alkalization processes (Dehayer et al.,1997). According to
Yasser and Ahmed, 2018; Evaluation of Hydrochemical Facies and Ionic Ratio of Al-Salam Canal Water and Its Relation with Watery extracted soil and Water Table - North Sinai-Egypt
(Richards,1954), based on SAR values, irrigation water is classified into four groups viz. low (SAR<10), medium (SAR, 10–18), high (SAR, 18–26) and very high (SAR >26). With respect to (USSL, 1954) all river waters of the study area are located in the C1S1 (low salinity and low alkalinity) field. The calculated SAR values vary from 0.069 to 2.15 and lie in excellent SAR class. The study reveals that none of the samples are of the poor category for irrigation in either of the seasons. Therefore, all river water samples are suitable for irrigation and can be used for all soil types. F2 showed the increasing of SAR values for F2 and F4 in water table. This was indicated to increasing of Na+ ion at different soil depths and accumulated at water table, but in F3 and F8 have a moderate SAR Value < 5., So it would be suitable for agriculture use.The increasing of Na2SO4 salts in water table of F2; this was due to leaching and dissolution of soil by fresh water (Al-Salam canal). The ionic ratio of SO4/Cl and Mg/Cl in F8 had the same ratio in irrigation and water table, it meant that increasing of soil washing(flushing) by fresh water (Al-Salam canal). The ionic ratio of Ca/Cl and Na/Cl in F2, F3, F4 and F8 had the same value >1, this was due to high value of Ca2+ content, and Na+ content in soil and water leaching and dissolution process.
CONCLUSION
Controls on the distribution of water qualities in the study area reflect bedrock interactions (affecting geochemistry) on subsurface soil and irrigation and water table; effects of land-use change; saline intrusion and aquifer refreshing (including ion exchange effects). Parent materials of the studied soils in the northern part of the Sinai along the Al-Salam Canal area are the Nile alluvium, and lacustrine sand deposits of the El-Tina Plain area, and Aeolian sand deposits of the active dunes and sand sheet deposits in the South El Kantara Shark.The alkaline pH in this soil is highly; reveal that they have a high concentration of the alkaline cations (Na+) and anions (Cl-) in soil solution. Also, the highest Mg++ contents are showed in deepest layers, may indicate its origin is affected by alluvium, lacustrine and
marine deposits. The higher values of soluble cations and anions in these soils may be due to fine texture (clay texture) and the seepage of sea water from the Suez Canal.There is high soil salinity in the area due to their high water table level and poor drainage system. The highest water table levels are located of the soils closed to Baloza drain and Suez Canal. These are mainly attributed to the seepage of sea water from Suez Canal in this area through ground water fluctuations. Currently, Translocation factor values indicates that no accumulation of trace and heavy metals of soil profiles and the plant can be used for human consumption.The hydro chemical interpretation presented here strongly illustrates those rational plans for long-term and sustainable management of water quality system, which are focused on current anthropogenic causes of water quality degradation e.g. in relation to saline intrusion. Although recent management effort may have an influence on the quality of the irrigation water with soil depth interactions. Only a plan which builds upon a sound understanding of this history can be expected to produce sensible options for water sustainable management of Al-Salam canal as irrigation water and salinity soil sub surface in El-Tina Plain into the future. This theory states succinctly that the order in which salinty soil encounter strata of different mineralogical composition can exert an important control on the final water chemistry. In this article, studied of ionic ratios of different cationic and anionic elements with hypothetical salts was the major scientific target to explain the goal research. The raising salinity of soil under different depths contributed to raise salinty of drainage water and bad effect on quiality of water table as example on the two sides of Al-Salam canal. The result showed the effect of sea water intrusion on the target study area and the low effect of fresh water flushing to soil (surface and sub-surface) of Al-Salam canal. The increasing of soil salinity, increase the SAR percent which affect on crops yield in future and reduce the sustaiable devolopment. In order to achieve sustainable development, the government must ensure a balance is reached between human development,
Yasser and Ahmed, 2018; Evaluation of Hydrochemical Facies and Ionic Ratio of Al-Salam Canal Water and Its Relation with Watery extracted soil and Water Table - North Sinai-Egypt
economic development, environment protection and resource development.
REFERENCES
Abdallah G. (2006). Management of groundwater aquifers along the Mediterranean Sea in Sinai Peninsula. In: Proceedings of 2nd Int. Conf. on Water Resources and Arid Enviro.
Agrama A., and Amer, A. (2012). Investigation of Al-Salam canal ater quality, south El-Qantara Sharq area. Appl. Sci. J. 8(4):1927-1935.
American Society for Testing and Materials (A.S.T.M) (2002). Water and Environmental technology. Annual book of ASTM. Standards, U.S.A. Sec. 11, Vol. 11.01, and 11.02
Appelo C.A.J., Postma D., (1993). Geochemistry, groundwater and Pollution. Balkema, Rottadam,NL, 530 -536
Ayers R.S. and Westcot D.W., (1985). Water quality for agriculture, Irrigation and Drainage Paper No.29, Rev.1, Food and Agriculture Organization of the United Nations Rome (FAO), Rome, Italy. Reprinted 1989, 1994.ISBN 92-5-102263-1.
Barer S., Mhli, S., Singh, A., Arora, C., and Gil, K. (2000). Sewer water irrigation effects on some potentially toxic trace elements in soil and potato plants in north western India. Cand. J. Soil, Sci.80 (3) 465-471.
Chebotarev I.I. (1955). Metamorphism of Natural waters in the crust of weathering. Geochemia et. Cosmochimica, Acta, 8, part I. pp.22-48, part II. pp.137-170 and part III. pp.198-212, London and New York.
Dehayer R., Diatloff, N. and Gordon, I., (1997). Irrigation water quality salinity and Department of Agriculture, Technical Bulletin, pp19.
Desert Research Center (D.R.C). (1983). Project study on water potentiality to cultivate some areas in Sinai. Final report, 6th phase, Academy of Scientific Res. and Tech. Cairo (in Arabic).
Donia N. (2011). Apportionment of pollution sources of El Salam canal using statistical techniques. Nile Basin Water Sci. and Eng. J. 4(1): 71-82.
ElKashouty M., Hosney, M., ElGodamy, Y., Gad, M., and Mansour, M. (2012). Characterization of the aquifer system in the northern Sinai peninsula, Egypt. Environ. Chem. and Ecotoxicology, J. 4(3): 41-63.
Fishman J. and Friedman C. (1985). Methods for Determination of Inorganic Substances in Water and Fluvial Sediments. U.S. Geol. Surv. Book 5, Chapter A1. Open File Report 85-495, Denver, USA. pp 84.
Freeze R.A. and Cherry J.A., (1979). Groundwater, Prentice-Hall Inc. Englewood Cliffs, N.J
Gee G. W., and Bauder, J. W. (1986). Particle-size analysis 1. Methods of soil analysis: Part 1—Physical and mineralogical methods, (methods of soil), pp 383-411.
Hafez A. (2005). Investigation of Al-Salam Canal project in Northern Sinai, Egypt phase-i: environmental baseline, soil and water quality studies. 9th Int. water tech. conf. Sharm El-Sheikh, Egypt.
Hafez A., Khedr, M., El-Katib, K., GadAlla, H., and Elmanharawy, S. (2008). El-Salaam canal project, Sinai II. chemical water quality investigations. Desalination, 227 (1-3): 274-285.
Hassan M. A. E.-R. (2002). Environmental Studies on Coastal Zone Soils of the North Sinai Peninsula (Egypt) Using Remote Sensing Techniques. PhD, Braunschweig, Techn. Univ., Dissertation.
Hem J.D. (1991). Study and interpretation of the chemical characteristics of natural waters. In: Salinization of groundwater in arid and semi-arid zones, Jalali M. (Ed) Scientific Publishers Jodhpur 3rd Edi pp 2254
Hem J.D., (1985). Study and interpretation of the chemical characteristics of natural water. U.S. Geol. Survey Water Supply, paper 2254, 3rd edition, third printing, pp 248.
Howard K.W.F and Lloyd J.W., (1983). Major ion characterization of coastal saline ground waters, Groundwater 21(4):429-437
Ikeda K. (1989). Chemical evolution of groundwater quality in the southern foot of Mount Fuji, Bull.Geol. Surv. Japan, 40(7):331- 404.
Jahn R., Blume H., Asio, V.B. Spaargaren, O. Schad P. (2006). Guidelines for soil description, 4th Edi. FAO. Rome.
Jeffrey L.E, and Michelle C.S (2002). Water quality in shallow alluvial aquifers, Upper Colarado River Basin, Colorado, Journal of American Water Research Association, 38(1):133-143
Kelly W.P., (1951). Alkali soils – their formation, properties and reclamation, New McGraw Hill, New Delhi, pp 217–275.
Leybourne M.I., Goodfellow W.D. and Boyle D.R., (1998). Hydro geochemical, isotopic and rare earth element evidence for contrasting
Yasser and Ahmed, 2018; Evaluation of Hydrochemical Facies and Ionic Ratio of Al-Salam Canal Water and Its Relation with Watery extracted soil and Water Table - North Sinai-Egypt
water-rock interactions at two undisturbed Zn-Pb massive sulphide deposits, Bathurst Mining Camp, N.B, Canada, J. Geochem Exp., (64):237-261
Lloyd J.W. and Tellam J.H., (1988). Caraterizacion hidroquimica de las agues subterraneas en areas costeras (Hydro chemical characterization of groundwater in coastal areas), In: Proceedings of International Symposium TIAC’88 (Tecnologia de la Intrusion marina en Acuiferos Costeros), Almunnecar, Granada, Spain, 1:1-8
Martinez D.E. and Bocanegra E.M., (2002). Hydro geochemistry and Cation Exchange Processes in the Coastal Aquifers of Mar Del Plata, Argentina, Hydrogeology Journal, (10):393 - 408
Matheis G. (1982). The properties of groundwater, Wiley, New York, USA.
Mattess G. (1982). The properties of groundwater. Geol. Dept. Kiel Univ. Federal Republic of Germany.
Mirecki, Nataša, Rukie Agic, Ljubomir Sunic, Lidija Milenkovic, and Zoran S. Ilic. (2015).Transfer factor as indicator of heavy metals content in plants. Fresenius Environmental Bulletin 24: 4212-4219.
Nassef M., R. Hannigan, R., EL Sayed, K.A and Tahawy, M.S. E (2006). Determination of Some Heavy metals in the environment of Sadat industrial city. Proceedings of the 2nd Environmental Physics Conference.
Omran E.-S. E. (2017). Land and Groundwater Assessment for Agricultural Development in the Sinai Peninsula, Egypt.
Onken A., and Sunderman, H. (1977). Colorimetric determinations of exchangeable ammonium, urea, nitrate, and nitrite in a single soil extract. Agronomy, J. 69.
Page A.L., Miller, R.H., and Keeney, D.R. (1982). Methods of soil analysis. Part 2. Chemical and microbiological properties. American Society of Agronomy. In: Soil Science Society of America (Vol. 1159).
Panteleit B., Kessels W., Kantor W. and Schulz H.D. (2001). Geochemical characteristics of salinization-zones in the Coastal Aquifer Test Field (CAT-Field) in North-Germany. In: Proceedings of 5th International Conference on Saltwater Intrusion and Coastal Aquifers-Monitoring, Modelling, and Management, Essaouira, Morocco, pp 1-11.
Piper A.M. (1944). A graphical interpretation of water analysis - Transactions of the American Geophysical Union (25):914-928
Pitkanen P., Kaija J., Blomqvist R., Smellie J.A.T., Frape S.K., Laaksoharju M., Negral P.H., Casanova J. and Karhu J. (2002). Hydro geochemical interpretation of groundwater at Palmottu, Paper EUR 19118 EN, European Commission, Brussels, 155-167
Porter and Marek, (2006). Irrigation Management with Saline Water. Texas A&M University, Agriculture Research and Extension Center.
Richards L.A. (1954). Diagnosis and improvement of saline and alkali soils. soil structure stability, Water facts, ISSN 1327–5364
Saleh N. H. and M. A. Aboelghar (2013). Land Cover Map Delineation, for Agriculture Development, Case Study in North Sinai, Egypt Using SPOT4 Data and Geographic Information System. Advances in Remote Sensing 2(01):35.
Sami K. (1992). Recharge mechanisms and geochemical processes in a semi-arid sedimentary basin, Eastern Cape, South Africa, Journal of Hydrology, (139):27-48.
Schoeller, H. (1977). Geochemistry of groundwater. Int. Groundwater studiesan Int. guide for Res. and practice, UNESCO. Paris, 1.
Schoeneberger P.J. (2002). Field Book for Describing and Sampling Soils: Version 2.0, National Soil Survey Center, Natural Resources Conservation Service.
Tellam J.H. and Lloyd J.W., (1986). Problems in the recognition of seawater intrusion by chemical means: an example of apparent chemical equivalence, Q.J. Eng. Geol., (19):389-398
Todd D.K. and Mays L.W., (2005). Groundwater Hydrology, John Wiley and Sons, New York, pp 535.
USSL (1954). Diagnesis and improvement of saline and alkali soils, USDA Hand waters, 3rd Edi. US Geol. Survey, Water Supply Paper 2254, Scientific Pub.
Yousef A., and El Shenawy, A. (2000). Environmental monitoring of North Sinai with emphasis on factors affecting the Salinity of some Sediments. I.C.E.H.M.2000. Cairo Univ. Egypt, 91.
Sources of Financial Support: None. Conflict of interest: None. Declared.