Embed Size (px)
Citation preview

Accepted Manuscript
Evaluation of HPCD batch treatments on enzyme inactivation kinetics and selectedquality characteristics of cloudy juice from Golden delicious apples
A.E. Illera, M.T. Sanz, S. Beltrán, R. Melgosa, A.G. Solaesa, M.O. Ruiz
PII: S0260-8774(17)30448-X
DOI: 10.1016/j.jfoodeng.2017.10.017
Reference: JFOE 9050
To appear in: Journal of Food Engineering
Please cite this article as: A.E. Illera, M.T. Sanz, S. Beltrán, R. Melgosa, A.G. Solaesa, M.O.Ruiz, Evaluation of HPCD batch treatments on enzyme inactivation kinetics and selected qualitycharacteristics of cloudy juice from Golden delicious apples, Journal of Food Engineering (2017), doi:10.1016/j.jfoodeng.2017.10.017
This is a PDF file of an unedited manuscript that has been accepted for publication. As a service toour customers we are providing this early version of the manuscript. The manuscript will undergocopyediting, typesetting, and review of the resulting proof before it is published in its final form. Pleasenote that during the production process errors may be discovered which could affect the content, and alllegal disclaimers that apply to the journal pertain.

MANUSCRIP
T
ACCEPTED
ACCEPTED MANUSCRIPTHPCD inactivation rate of PPO and PME increased with increasing p and T.
Sensitivity to temperature change is similar for HPCD and mild thermal treatment.
PME is more HPCD resistant than PPO.
HPCD treatment decreased particle size of cloudy apple juice.
Colloidal stability and nutritional properties were not affected by HPCD.
MANUSCRIP
T
ACCEPTED
ACCEPTED MANUSCRIPT
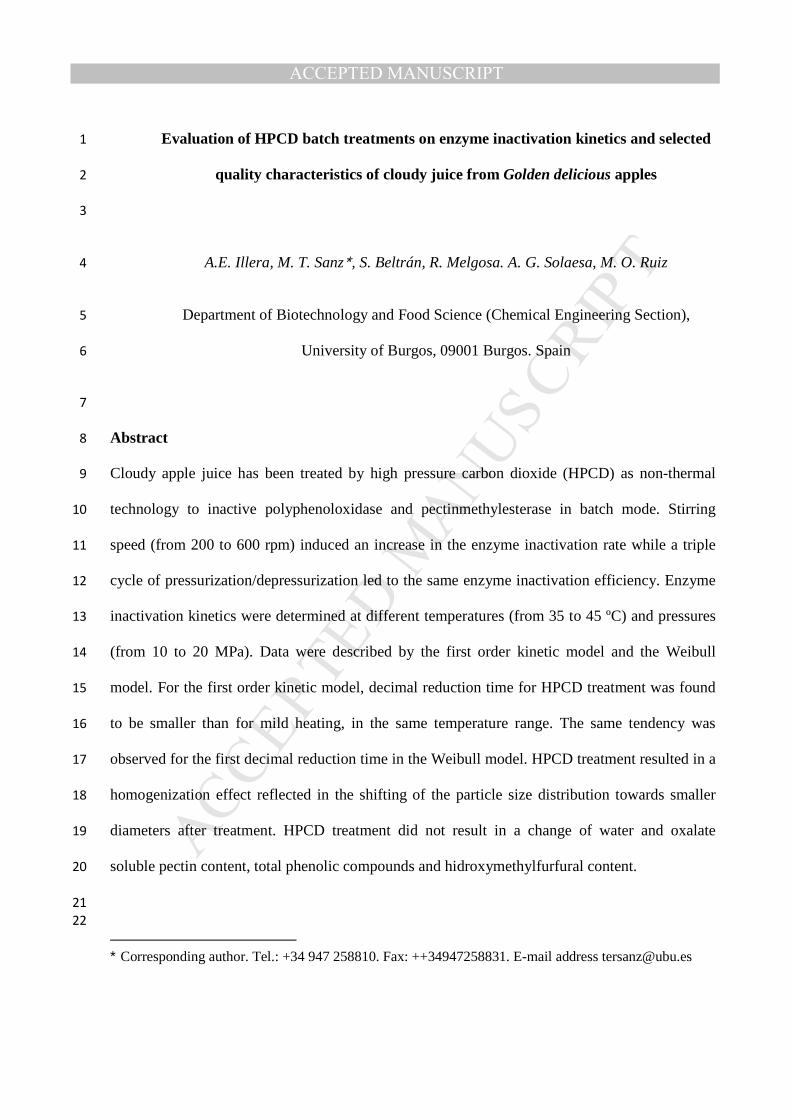
Evaluation of HPCD batch treatments on enzyme inactivation kinetics and selected 1
quality characteristics of cloudy juice from Golden delicious apples 2
3
A.E. Illera, M. T. Sanz∗, S. Beltrán, R. Melgosa. A. G. Solaesa, M. O. Ruiz 4
Department of Biotechnology and Food Science (Chemical Engineering Section), 5
University of Burgos, 09001 Burgos. Spain 6
7
Abstract 8
Cloudy apple juice has been treated by high pressure carbon dioxide (HPCD) as non-thermal 9
technology to inactive polyphenoloxidase and pectinmethylesterase in batch mode. Stirring 10
speed (from 200 to 600 rpm) induced an increase in the enzyme inactivation rate while a triple 11
cycle of pressurization/depressurization led to the same enzyme inactivation efficiency. Enzyme 12
inactivation kinetics were determined at different temperatures (from 35 to 45 ºC) and pressures 13
(from 10 to 20 MPa). Data were described by the first order kinetic model and the Weibull 14
model. For the first order kinetic model, decimal reduction time for HPCD treatment was found 15
to be smaller than for mild heating, in the same temperature range. The same tendency was 16
observed for the first decimal reduction time in the Weibull model. HPCD treatment resulted in a 17
homogenization effect reflected in the shifting of the particle size distribution towards smaller 18
diameters after treatment. HPCD treatment did not result in a change of water and oxalate 19
soluble pectin content, total phenolic compounds and hidroxymethylfurfural content. 20
21
22
∗ Corresponding author. Tel.: +34 947 258810. Fax: ++34947258831. E-mail address [email protected]

MANUSCRIP
T
ACCEPTED
ACCEPTED MANUSCRIPT
Keywords: Cloudy apple juice, HPCD, inactivation kinetics parameters, properties 23
1. Introduction 24
Consumption of cloudy apple juice seems to be more beneficial than consuming clear apple juice 25
due to changes in phenolic compounds and loss of pectins during clarification process 26
(Markowski et al., 2015). However, color and cloud stability are main challenges in preservation 27
of cloudy apple juice during its processing and storage. Enzymatic browning in cloudy apple 28
juice is due to the action of polyphenol oxidase (PPO) that catalyzes the oxidation of phenolic 29
compounds to quinones. On the other hand, the mechanism of cloud stability is not yet 30
understood. Among the different mechanisms proposed, electrostatic repulsion by negative 31
charges present in the partly demethylated pectin due to galacturonic residues could be 32
responsible of cloud stability avoiding aggregation (Zhao et al., 2008). In this regard, the activity 33
of pectinmethylesterase (PME) causes pectin demethylation that could precipitate with calcium 34
ions present in the juice causing clarification and the loss of turbidity. However, other 35
components with negative charge have been also reported in the literature as stabilizing agents of 36
the cloud in the serum such as phosphatide acids of cloud lipids (Krapfenbauer et al., 2006). 37
Thermal treatments have been traditionally used for the inactivation of microorganisms and 38
enzymes that affect negatively the quality of foods. However, these methods cause undesirable 39
effects in quality attributes such as flavor and loss of nutritional components. High pressure 40
carbon dioxide (HPCD) treatment has been proposed as an alternative non-thermal pasteurization 41
technique that can inactivate certain microorganisms and enzymes under mild operation 42
conditions. Typically, operating pressure does not exceed 50 MPa and temperature ranges 43
between 20 and 50 ºC, below pasteurization temperature (Manzocco et al., 2016). The 44
mechanism of pressurized CO2 on enzyme inactivation is not yet fully understood. In the 45

MANUSCRIP
T
ACCEPTED
ACCEPTED MANUSCRIPT
literature different approaches can be found such as pH lowering due to dissolved CO2, 46
conformational changes or formation of different complex with CO2 molecules (Hu et al., 2013). 47
Some studies have been found in the literature regarding the effect of HPCD on enzymes of 48
cloudy apple juice from Fuji apples. Niu et al. (2010) evaluated the quality of cloudy Fuji apple 49
juice processed from apple slices previously treated by HPCD. These authors found that PPO 50
could be completely inactivated at 20 MPa for 20 min and at temperature as low as 25 ºC; 51
however, residual activity of 18% was still found for PME after treatment at 65 ºC and 20 MPa 52
for 20 min. Gui at al. (2007) found higher values of residual activity than the work of Niu et al. 53
(2010), for PPO in HPCD-treated cloudy Fuji apple juice in a batch mode (40% at 30 MPa and 54
55 ºC for 60 min). When using a continuous HPCD system, holding times of 10 min were 55
needed at 22 MPa and 60 ºC to achieve complete inactivation of PPO but, at the same working 56
conditions, still PME residual activity of 42% was obtained (Xu et al., 2011). 57
From previous reported results, it can be clearly observed that there is a great variety in the 58
literature data on enzyme inactivation from cloudy apple. This is a main drawback in the 59
commercialization of this technology and reliable data on juice quality are still needed. 60
According to Wang et al. (2010) the influence of agitation on enzyme inactivation under high-61
pressure environment is a key factor in the design of reactors of industrial scale volume. 62
However, the effect of stirring speed on enzyme activity has not been considered in most of the 63
studies. Wang et al. (2010) determined the effect of agitation at 40ºC on isoamylase, obtained 64
from a fermentation broth from Pseudomonas amyloderamosa after cell removal, and a 65
commercial β-amylase under supercritical carbon dioxide, at different operating times (up to 120 66
min) and different operating pressure (from 11.0 to 17.2 MPa), observing that the activity of both 67
enzymes decreased by increasing the speed of agitation. 68

MANUSCRIP
T
ACCEPTED
ACCEPTED MANUSCRIPT
In this work, the effect of HPCD treatment on some quality characteristics of cloudy apple juice 69
from Golden delicious has been studied. The effect of some variables, non-previously studied in 70
literature, on enzyme inactivation from cloudy apple juice, has been considered such as the effect 71
of stirring speed and the number of successive pressurization/depressurization cycles. Enzyme 72
inactivation kinetic data parameters are also necessary to scale-up HPCD process. This regard, 73
enzyme inactivation kinetics of PPO and PME have been determined at different operating 74
pressures and temperatures. Enzyme inactivation kinetic data have been described by the first 75
order kinetic model and the Weibull model as an alternative to the classical first order kinetic 76
model. Some other important quality parameters of cloudy apple juice have been also determined 77
before and right after HPCD treatment, such as pectin content, particle size distribution, color 78
and antioxidant capacity. 79
2. Materials and methods 80
2.1 Juice preparation 81
Golden delicious apples were peeled and cut in cubes and then added to a 0.3 % of L-ascorbic 82
acid solution to avoid enzymatic browning during processing. Apple cubes were wiped and 83
immediately squeezed with a screw juice extractor. The liqueur was filtered with 2 layers of 84
cheesecloth. The pH of the juice obtained was 3.89 ± 0.01 and the soluble solid content was 12.5 85
± 0.1 °Brix. The juice was stored frozen at −18 °C until further use. 86
2.2 HPCD equipment and processing 87
The HPCD cell was made of stainless steel (SS-316) and had an internal volume of 100 mL with 88
a maximum operating pressure and temperature of 30 MPa and 80 ºC, respectively (Melgosa et 89
al., 2017). For each experiment, 40 mL of apple juice were charged into the high pressure cell 90
that was immersed in a thermostatic water bath at the operating temperature. The magnetic 91
stirring was then connected and the system was pressurized by a using a syringe pump with a 92
MANUSCRIP
T
ACCEPTED
ACCEPTED MANUSCRIPT
pressure controller (ISCO 260 D) up to the desired pressure. CO2 was fed into the high pressure 93
cell through a sintered stainless steel micro-filter with a pore size of 10 µm (Briongos et al., 94
2016). This regard, Ishikawa et al. (1995) showed that the concentration of CO2 in the sample 95
was influenced by the way CO2 was fed into the sample, increasing by decreasing the pore size 96
of the filter at 25 MPa and 35ºC. 97
Samples were collected periodically to follow the inactivation kinetics of the enzymes. 98
Experiments were carried out in the ranges of temperature (T) from 35 to 45 ºC, pressure (p) 99
from 10 to 20 MPa and stirring speed from 200 to 600 rpm. The effect of the sampling procedure 100
and the number of pressurization/depressurization cycles on enzyme activity was also analyzed. 101
To compare the effect of the HPCD treatment on enzyme activity with mild heating treatment, 102
cloudy apple juice was heated at atmospheric pressure in the same temperature range (from 35 to 103
45 ºC). Samples were taken periodically at different treatment times up to 120 min. 104
Some other important quality attributes of cloudy apple juice, such as particle size distribution, ξ 105
potential, turbidity, pH, pectin content, total phenolic compounds, non-enzymatic browning and 106
antioxidant capacity were also determined before and right after HPCD treatment. 107
2.3 Physico-chemical analysis 108
2.3.1. Determination of PPO activity 109
The activity of PPO was determined spectrophotometrically by using a 0.05 M catechol (Sigma 110
Aldrich) solution prepared in a 0.1 M phosphate buffer (pH 6.5) as substrate. Samples were 111
analyzed by adding 100 µL of apple juice into 2.9 mL substrate solution. Oxidation of catechol 112
was determined immediately by the increase in absorbance at 420 nm by using a Jasco V-750 113
spectrophotometer equipped with a Peltier thermostated cell holder and a water pump to keep the 114
temperature constant at 30 ºC. The PPO activity was taken as the very first linear part of the 115
reaction curve. 116
MANUSCRIP
T
ACCEPTED
ACCEPTED MANUSCRIPT
2.3.2. Determination of PME activity 117
PME activity was determined by using an automatic titrator system (Metrohm Titrando) by 118
using a 1 % of pectin solution (Alfa Aesar pectin citrus) prepared in NaCl 0.3 M as substrate. 119
50 mL of pectin solution was mixed with 1 mL of cloudy apple juice and pH was adjusted to 7.5 120
with NaOH 0.02 N. During pectin hydrolysis at 30 ºC, pH was maintained at 7.5 by adding 121
NaOH 0.02 N. The amount of NaOH added for 15 min was recorded. One PME activity unit 122
(UPE) is defined as the micromoles of carboxylic groups produced per minute and mL of juice at 123
pH 7.5 and 30 ºC (Briongos et al., 2016). 124
Relative residual activities of PPO and PME were evaluated as: 125
Residualactivity, RA = ��������������������������� !"#����������������������������������$�%�������&'%��� · 100% = ,,- · 100 [1] 126
2.3.3. Determination of pectic substances 127
Pectic substances in cloudy apple juice before and after HPCD treatment have been determined 128
according to Robertson (1979) by progressive extraction of the alcohol insoluble solids by water 129
(high methoxyl pectins are extracted) and ammonium oxalate (low methoxyl pectins are 130
extracted). Water soluble pectins play an important role in the turbidity of the cloudy apple 131
juices acting as colloid stabilizers, while oxalate-soluble fraction can form gels with polyvalent 132
metal ions (Robertson, 1979). Pectic substances are determined spectrophotometrically at 133
520 nm after total hydrolysis to galacturonic acids by using m-hydroxydiphenil (MHDP) as a 134
chromogenic reagent. Solutions were freshly prepared before analysis: 0.15% solution of m-135
hydroxydiphenyl (Sigma Aldrich) in 0.5% NaOH and 0.0125 M sodium tetraborate (Panreac) in 136
concentrated sulphuric acid. For pectin determination, 1 mL of water extract and 5 mL of the 137
sodium tetraborate solution were mixed and placed in a water-ice bath. The mixture is then 138
heated in water bath at 80 ºC for 6 min and subsequently cooled again in a water-ice bath. 139

MANUSCRIP
T
ACCEPTED
ACCEPTED MANUSCRIPT
0.1 mL of the m-hydroxydiphenyl solution was added and after homogenization of the mixture, 140
absorbance at 520 nm was measured as a function of time. According to Ibarz et al. (Ibarz et al., 141
2006) spectrophotometric data measurements were taken at the highest absorbance instead of at a 142
certain reaction time. A calibration curve was prepared with standard solutions of D-galacturonic 143
acid (Sigma Aldrich) by following the same colorimetric method. A blank was also prepared 144
with no D-galacturonic acid. 145
2.3.4. Particle size distribution and zeta-potential 146
Particle size distribution (PSD) was determined by laser diffraction with a Mastersizer 2000 147
(Malvern® Inst., MA). The system uses a laser light at 750 nm wavelength to size particles from 148
0.4 to 2000 µm by light diffraction. Particle size distribution was calculated by the Fraunhofer 149
model. Size distributions (volume fractions against particle size) before and after HPCD 150
treatment were calculated and the weight-average sizes expressed as: 151
• The equivalent surface area mean diameter: D/3,22 = ∑n�d5�6 ∑n�⁄ d5�8 [2] 152
• The equivalent volume mean diameter: D/4,32 = ∑n�d5�: ∑n�⁄ d5�6 [3] 153
where dlc is the diameter of the particle and nc is the percentage of particles. 154
To describe distribution width one common parameter is the Span: 155
Span = #=,>.@A#=,>.B#=,>.C [4] 156
where Dv,0.9, Dv,0.1 and Dv0.5 are the particle size bellow which, 90%, 50% and 10% of the 157
particles lies. 158
ζ-potential was determined with a Zetasizer Nano ZS apparatus, using the Laser Doppler 159
Velocimetry techniques. Samples were diluted 1:50 with deionized water and filtered through 160
5 µm filter. ζ-potential gives an indication of the potential stability of a colloidal system and it is 161
a good index of the colloidal electrostatic repulsive forces. Particles will repel each other when 162
MANUSCRIP
T
ACCEPTED
ACCEPTED MANUSCRIPT
having a large negative or positive ζ -potential. Soluble pectin carries negative charge being 163
important to keep a high ζ–potential. Particles with ζ -potentials more positive or negative than 164
30 mV or -30 mV are normally considered stable (Genovese and Lozano, 2001). 165
2.3.5. Total phenolic compounds and antioxidant capacity 166
Total phenolic compounds were determined by using the Folin-Ciocalteau reagent (VWR). First, 167
100 µL of the juice were mixed with 2.8 mL of water and subsequently 100 µL of the Folin-168
Ciocalteau reagent, in that order. After that, 2 mL of sodium carbonate 7.5% (w/v) were added 169
and the reaction started. Color was measured after 60 min of reaction at 750 nm at 21 ºC. A 170
blank was also prepared using water instead of juice. A calibration curve was prepared with 171
standard solutions of gallic acid by following the same colorimetric method. 172
Antioxidant capacity was determined by the ABTS method. The ABTS method is based on the 173
decolorization of the radical cation 2,2’-azinobis-(3-ethylbenzothiazoline-6-sulfonic acid) 174
(ABTS˙+). This radical is produced by oxidation of a 7 mM solution of ABTS with potassium 175
persulfate (2.45mM), allowing the mixture to stand in the dark at room temperature for 16 h 176
before use (Re et al., 1999). The ABTS˙+ solution was diluted with ethanol to reach an 177
absorbance close to 0.7 at 734 nm and equilibrated at 21 ºC. Diluted ABTS˙+ solutions were 178
reduced in the presence of hydrogen-donating antioxidants present in the apple juice. For the 179
antioxidant test, juice samples were diluted 1:10 with deionized water. A ratio of 100 µL/1 mL 180
(diluted cloudy apple juice/ABTS˙+ solutions) was chosen and absorbance was registered along 181
time at 734 nm, since antioxidant activity depends on the selected time point (Re et al., 1999). 182
All the spectrophotometric measurements have been carried out at 21 ºC in a Jasco (V-750) 183
spectrophotometer with Peltier temperature control. Results were expressed as inhibition 184
percentage of the radical ABTS+. 185
2.3.6. Turbidity, pH, color and non-enzymatic browning 186

MANUSCRIP
T
ACCEPTED
ACCEPTED MANUSCRIPT
Turbidity of cloudy apple juice was measured at room temperature by diluting it 1/20 with 187
distillate water (Xu et al., 2011). A turbidimeter (Eutech Instruments, TN-100) was used and 188
turbidity was expressed as nephelometric turbidity units (NTU). pH of apple juice was 189
determined with a pH-meter (Crison pH & Ion-Meter GLP 22). 190
The L*, a* and b* values were obtained respectively by a suitable program installed in a 191
Beckman DU-650 spectrophotometer with diode-array of UV–vis (Beckman Instruments), 192
representing brightness, red to green color and yellow to blue color, respectively. Other 193
conditions are illuminant D65 (daylight source) and a 10º standard observer (perception of a 194
human observer) following the CIE recommendations. Changes in color were expressed as: 195
∆E = FGLI��J��∗ − L�����∗ M8 + GaI��J��∗ − a�����∗ M8 + GbI��J��∗ − b�����∗ M8 [5]
According to Krapfenbauer et al. (2006) a casual viewer can notice a difference between two 196
colors when ∆E is higher than 2-3.5, although they pointed out that a trained eye is capable of 197
differentiating two colors that differ by ∆E < 2. 198
Non enzymatic browning reactions are important parameters that determine the quality of food 199
products during processing and storage. Non enzymatic browning in the juice is measured as 200
hydroxymethylfurfural (HMF) concentration. 0.7 mL of juice was mixed with 0.7 mL of ethanol 201
in a 1.5 mL Eppendorf tube. The mixture was centrifuged at 12000 g for 10 min. After that, 202
1 mL of the supernatant is mixed with 1 mL of a trichloroacetic acid solution (734 mM) and 203
1 mL of a thiobarbituric acid solution (25 mM) in a closed recipient. Samples were incubated at 204
40 ºC during 50 min in an agitated batch and absorbance was measure at 443 nm. A blank was 205
also prepared with distilled water instead of juice. A calibration curve was prepared using 206
different concentrations of HMF from 0.5 mg/L to 10 mg/L. 207
MANUSCRIP
T
ACCEPTED
ACCEPTED MANUSCRIPT
2.4 Kinetic data analysis 208
The knowledge of the kinetic parameters that describe the time course of the enzyme inactivation 209
is of great importance for a correct design of a HPCD process. Gui et al. (2007) obtained good 210
results by fitting the inactivation kinetics of PPO in cloudy apple juice to a linear kinetic model. 211
In this work, the inactivation kinetic data at different operating temperatures and pressures were 212
described by using two different models: (1) a first-order kinetic model, and (2) the Weibull 213
model. 214
The first-order kinetic model can be described as: 215
log RRS = −kt [6] 216
where Ao is the initial activity of the enzyme, A is the residual activity at different treatment 217
times, k is the inactivation rate constant at the operating conditions (min-1) and t is the treatment 218
time (min). 219
zT and zP (temperature and pressure increase needed for a 90% reduction of the D value, 220
respectively) were evaluated as the negative reciprocal slope of the regression line of log D as 221
function of T or p respectively: 222
log UDVD8W = T8 − TVzZ [7]
log UDVD8W = p8 − pVz� [8]
The dependence of the inactivation rate constant on temperature and pressure can be expressed 223
through the Arrhenius and Eyring equations respectively: 224
ln [\B\]^ = �_`Z [ VZ] − VZB^ [9] 225
ln [aBa]^ = b_`Z cd8 − pVe [10] 226

MANUSCRIP
T
ACCEPTED
ACCEPTED MANUSCRIPT
where p2, p1, T2, T1 are pressures and temperatures corresponding to the decimal reduction times 227
D1 and D2 or constant k1 and k2, respectively, R is the universal gas constant, Ea, the activation 228
energy (kJ/mol) and Va, cm3/mol, is the activation volume. 229
The non-linear Weilbull model can be written in the power-law form (Van Boekel, 2002): 230
log AAo=- 12.303 ghijk [11] 231
where α is the scale parameter (a characteristic time) and β is the shape parameter. When n < 1 232
indicates upward concavity and n >1 downward concavity of the enzyme inactivation curve. The 233
time required to achieve a number of decimal reductions, d, can be calculated by using the shape 234
and scale parameters (Van Boekel, 2002): 235
lm = n o−pq/10Am2Brs [12] 236
2.5 Statistical analysis 237
Statistical analyses were conducted using software Statgraphics X64. The results are presented as 238
a mean ± standard deviation of at least three replicates. The significance of the differences was 239
determined based on an analysis of the variance with the Fisher’s least significant method at p-240
value ≤ 0.05. 241
To estimate the kinetic parameters for the different models essayed in this work, non-linear 242
regression was performed by using the Marquardt algorithm (Statgraphics X64). The mean 243
relative deviation (MRD) between experimental and calculated residual activities (RA) was also 244
evaluated: 245
MRD = 1nu v wRA��5� − RA�x�RA�x� w�55����5�� y · 100 [13]
246

MANUSCRIP
T
ACCEPTED
ACCEPTED MANUSCRIPT
3. Results and discussion 247
3.1 Agitation speed 248
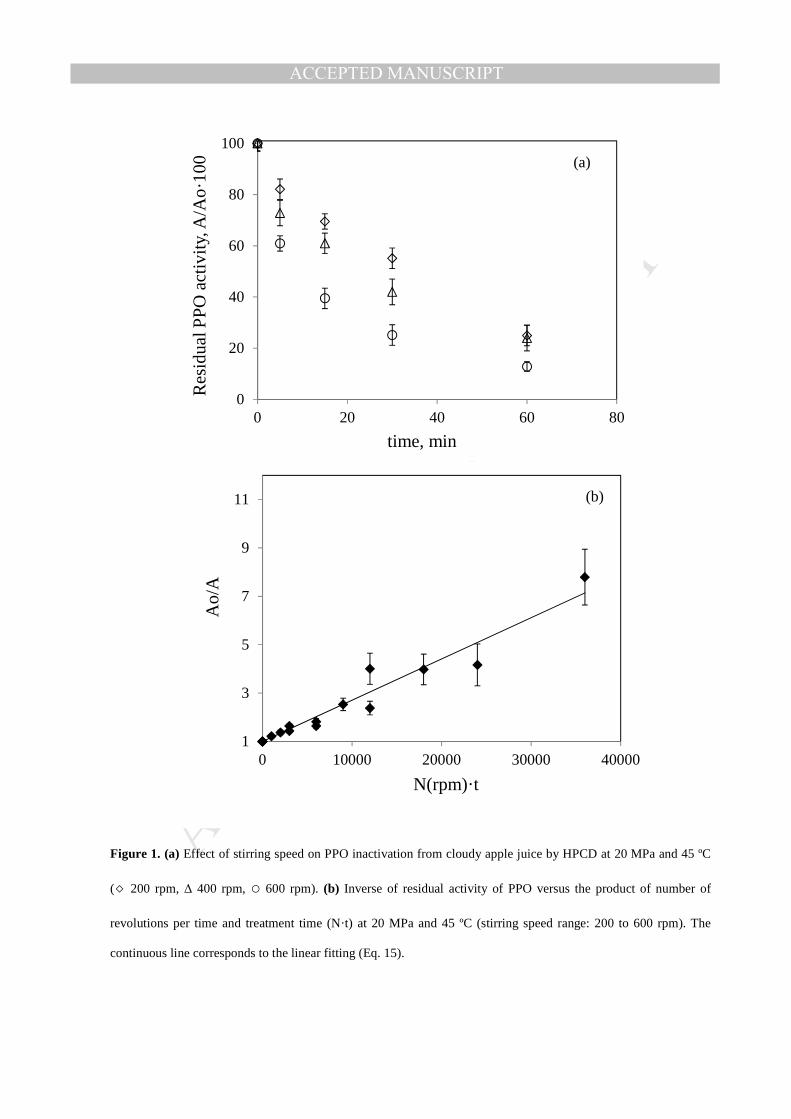
The effect of agitation on the inactivation of PPO from cloudy apple juice has been evaluated at 249
20 MPa and 45 ºC, at three stirring speeds, 200, 400 and 600 rpm (Figure 1a). When working at 250
higher stirring speeds, the magnetic system of agitation did not work properly in our 251
experimental equipment; therefore stirring speeds higher than 600 rpm were not included in this 252
work. At any of the stirring speeds, the inactivation degree increased with increasing time. From 253
Figure 1a, it can be also observed that an increase in the stirring speed led to a higher 254
inactivation degree. Agitation speed enhanced mass transfer rate of CO2 in the medium, 255
facilitating CO2 solubilization and therefore the contact between CO2 and the enzyme (Garcia-256
Gonzalez et al., 2009). In this regard, Wang et al. (2010) also pointed out that an increase in the 257
agitation speed can create a larger amount of bubbles that help to enzyme inactivation. These 258
authors deduced an expression for enzyme inactivation as a function of N·t (stirred speed·time) 259
considering an equilibrium reaction between the native and the denatured enzyme and the 260
consequently irreversible aggregation between the denatured enzymes: 261
/AJ A⁄ 2=1+cte/N·t2 [14]
By plotting the inverse of the residual enzyme activity versus N·t a straight line should be 262
obtained with the intercept equal to 1. Figure 1.b shows that for PPO inactivation in cloudy apple 263
juice, the ratio (Ao/A) is proportional to N·t for operation times shorter than 60 min: 264
/Ao A⁄ 2=1 +1.704·10-4 /N · t2 (R2= 0.940). [15] 265
At longer treatment times, residual activities for all the three stirring speeds became nearly equal 266
and were not included. 267

MANUSCRIP
T
ACCEPTED
ACCEPTED MANUSCRIPT
3.2 Sampling procedure and number of pressurization/depressurization cycles 268
PPO activity after HPCD treatment was compared when sample was obtained after system 269
depressurization or removed while the system was under pressure for a single cycle 270
pressurization. HPCD treatment was carried out at 45 ºC and 20 MPa for 15 min. No significant 271
differences have been determined among sample RA means of different sampling procedure 272
when applying the Fisher’s least significant method at p-value ≤ 0.05, with PPO RA values of 38 273
± 4 % and 33 ± 4 % when sampling was withdrawn while the system was under pressure or after 274
total depressurization, respectively. 275
The effect of a single cycle has been compared with a triple cycle for a total treatment time of 276
15 min, that is 5 min of pressure-treatment each cycle, respectively (ttotal, treatment = tper cycle·× 277
number of cycles). The same effectiveness for PPO inactivation was determined when applying 278
the Fisher’s least significant method at p-value ≤ 0.05, with values of 38 ± 4 % and 33 ± 3 % for 279
one single cycle and a triple cycle for a total treatment time of 15 min, respectively. 280
Primo et al. (2007) studied the effect of successive cycles of pressurization/depressurization in 281
HPCD treatment on inactivation of PPO from mate tea leaves extracts. They observed that PPO 282
presented a continuous loss of activity with the number of cycles at 7.05 MPa, 30 ºC and 1 h 283
each cycle. However, to distinguish between the effect of the number of 284
pressurization/depressurization cycles and treatment time, comparison should be have done at 285
the same pressure and temperature conditions but for a total treatment time equal to tper cycle·× 286
number of cycles, since time plays also an important role in batch enzyme inactivation. In any 287
case, as pointed out by Hu et al (2013) , the effect of pressurization/depressurization on the 288
activity of enzymes depends on the type of enzyme, its environment, pressure, temperature and 289
exposure time, being difficult to establish any rule. No other studies have been found in the 290
MANUSCRIP
T
ACCEPTED
ACCEPTED MANUSCRIPT
literature about the effect of the number of cycles on enzyme inactivation by HPCD on fresh 291
juices. 292
3.3 Effect of mild heating on PPO inactivation 293
PPO inactivation kinetics were determined at atmospheric pressure in the temperature range 294
from 35 to 45 ºC (same temperature range as for HPCD treatment, Figure 2). The maximum 295
reduction of PPO activity was nearly 40 % after 2 h of heating at 45 ºC indicating that PPO of 296
cloudy Golden delicious apple juice was rather stable under mild temperatures. Similar 297
inactivation degrees of PPO from cloudy Fuji apple juice were obtained by Gui et al. (2007). 298
After 1 hour of mild heating, these authors reached a maximum reduction of PPO activity of 299
20% at 45 ºC. However, Niu et al. (2010) found that when subjecting apple slices to mild heating 300
treatment from 25 to 45 ºC for 20 min and then processing them into cloudy apple juice, PPO 301
activity increased by 22-51%. Buckow et al. (2009) also found that at 45 ºC, PPO activity from 302
cloudy apple juice increased 30%, attributing this behavior to the release of latent PPO. 303
Enzyme inactivation kinetic data under mild heating conditions and at atmospheric pressure were 304
described by the first-order model. Parameters are collected in Table 1. Inactivation rate 305
constant, k, increased with the operating temperature, therefore the corresponding D values 306
decreased with temperature. The temperature sensitivity parameter, zT, and the activation energy 307
were evaluated as 36 ºC and 53 kJ/mol, respectively (see Table 1). Values of the same order 308
were reported by Gui et al. (2007) for cloudy Fuji apple juice, 27.0 ºC for zT and 72.0 kJ/mol, for 309
Ea. Thermal stability of extracted apple PPO from Golden delicious was studied in the 310
temperature range from 68 to 78 ºC by Yemenicigly et al. (1997). These authors reported a zT 311
value of 9.9 ºC. The higher value obtained in this work for zT in the temperature range from 35 to 312
45 ºC might indicate a lower susceptibility to temperature change at temperatures lower than the 313
MANUSCRIP
T
ACCEPTED
ACCEPTED MANUSCRIPT
one observed at pasteurization temperatures. In any case, the values of the activation energy 314
were similar in both temperature ranges. 315
3.4. Effect of HPCD treatment on PPO inactivation 316
Enzyme inactivation kinetics for PPO of cloudy Golden deliciuos apple juice have been 317
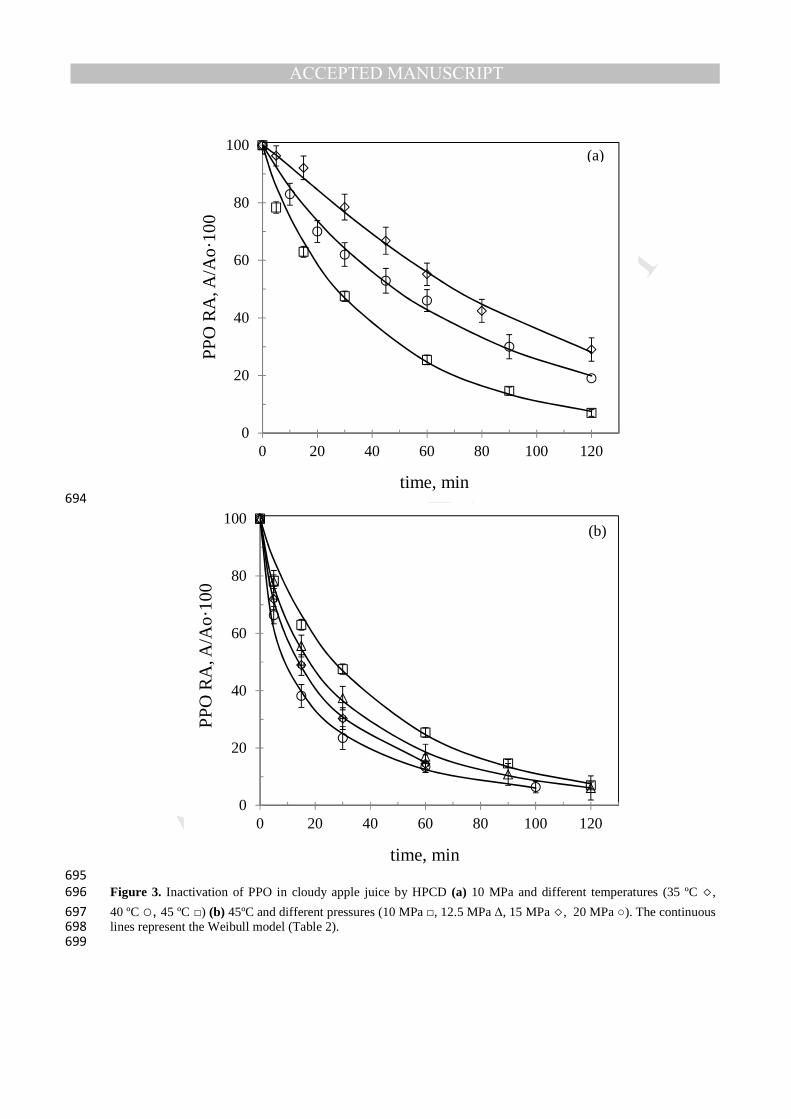
determined at 10 MPa in the temperature range from 35 to 45 ºC (Figure 3a). By increasing 318
temperature, enzyme inactivation rate also increased. In addition to the intrinsic effect of 319
temperature on enzyme inactivation, by increasing temperature, although CO2 density decreased, 320
the diffusivity of CO2 can be improved and accelerate the molecular collisions between CO2 321
molecules and the enzyme. Figure 3b shows the inactivation kinetics at 45 ºC in the pressure 322
range from 10 to 20 MPa. Higher operating pressures led to faster inactivation rates, but the 323
fraction of the resistant form of the enzyme was nearly independent of the operating pressure, 324
being around 6 %. This value was lower than the minimal residual activity of PPO from cloudy 325
Fuji apple juice reported by Gui et al. (2007), 37%, at 30 MPa and 55 ºC for 60 min. In any case, 326
comparison with other HPCD systems is difficult to establish since the inactivation reached 327
would depend not only on the type and source of the enzyme and the experimental conditions 328
such as pressure, temperature and treatment time but also on the agitation of the system and the 329
ratio sample volume/cell volume since this last parameter determines the amount of CO2 injected 330
to the system. Unfortunately in most of the studies these parameters are not detailed. PPO from 331
cloudy Fuji apple juice was completely inactivated by a continuous HPCD system at 22 MPa and 332
60 ºC for 10 min (Xu et al., 2011). This could suggest a higher efficiency of a continuous system 333
due to the turbulent energy, comparable with a good agitation in a discontinuous system. 334
However, 60 ºC cannot be considered as non-thermal and residual activity as high as 47% was 335
obtained in the continuous system at 43 ºC and 25 MPa for 2 min. (Xu et al., 2011). 336
MANUSCRIP
T
ACCEPTED
ACCEPTED MANUSCRIPT
Inactivation kinetic data by HPCD were fitted to the first order kinetic model and the Weibull 337
model (Table 2). Although the Weibull model yielded the best fitting quality, the first order 338
kinetic model described the inactivation curve quite well and therefore, kinetic parameters for 339
the linear regression model have been also listed in Table 2 for comparison with data reported in 340
the literature. 341
For the first order kinetic model, inactivation rate constant, k, increased with temperature and 342
pressure. Consequently, D values decreased with increasing pressure and temperature. At each 343
operating temperature, D values were smaller for HPCD treatment (Table 2) than the 344
corresponding values for mild heating treatment (Table 1) proving that HPCD treatment was 345
more effective than thermal treatment alone. For example D was equal to 515 min at 45 ºC and 346
atmospheric pressure and decreased to 104 min at 45 ºC and 10 MPa. 347
zT and activation energy values were determined as 29 ºC and 64 kJ/mol, respectively, for the 348
first order kinetic model (see Table 2). zT and activation energy values were of the same order as 349
those listed for mild heating treatment (Table 1). This meant that the sensitivity to temperature 350
change was similar for HPCD as for mild heating treatment in the temperature range covered in 351
this work. The same tendency in zT and Ea was found by Liu et al. (2008) in the inactivation of 352
PPO of red beet extracts. These authors found that under mild heating treatment at atmospheric 353
pressure (35-55 ºC), zT and Ea were equal to 34 ºC and 57 kJ/mol, respectively. After HPCD 354
treatment at 37.5 MPa, in the same temperature range, they obtained values of 36 ºC and 355
54 kJ/mol for zT and Ea, respectively. However, Gui et al. (2007) found for PPO of cloudy Fuji 356
apple juice that zT increased from 27 to 108 ºC and activation energy decreased from 72 to 357
18 kJ/mol under mild heating treatment (35-55 ºC) and HPCD at 30 MPa in the same 358
temperature range, respectively. This increase in zT and decrease in Ea found by Gui et al. (2007) 359
would indicate that the enzyme inactivation become less temperature dependent under 360

MANUSCRIP
T
ACCEPTED
ACCEPTED MANUSCRIPT
pressurized CO2. This behavior is difficult to understand and it has not been observed in our 361
work. As it has been previously mentioned, in addition to the intrinsic effect of temperature on 362
enzyme inactivation, temperature has two different effects on important properties of CO2. An 363
increase in temperature involves an improvement of mass transport properties enhancing CO2 364
diffusivity and the number of collisions between the CO2 and the enzyme, but on the other hand, 365
CO2 density and therefore CO2 solubility in the aqueous medium decreases. It seems that these 366
effects play both an important role, since similar sensitivity to temperature was found in mild 367
heat treatment and in HPCD. 368
By using equations 8 and 10 zP and Va have been determined as 25 MPa and -251 cm3/mol, 369
respectively for the first order kinetic model. The negative value of the activation volume 370
indicated that PPO inactivation was favored by increasing operating pressure. Other values of 371
activation volumes reported in the literature for PPO inactivation from different sources are of 372
the same order, -271.7 and -307.9 cm3/mol for the labile and stable fraction of PPO of water 373
melon at 50 ºC in the pressure range of 8-30 MPa (Liu et al., 2013) or -94.31 cm3/mol for PPO 374
from cloudy Fuji apple juice at 55ºC in the pressure range from 8 to 30 MPa (Gui et al., 2007). 375
The Weibull parameters are also listed in Table 2. Scale, α, and shape, β, parameters were used 376
to calculate the time require to inactivate 1 log (td=1) of PPO. Similar to the D-values for the first 377
order kinetic model, td=1 decreased with operating pressure and temperature. As suggested by van 378
Boekel (2002) is important to determine the effect of temperature, and in the present work of 379
pressure, on both parameters of the Weibull model. Scale parameter was statistically significant 380
dependent on temperature and pressure, when tested at the 95% significance level for a linear 381
relationship, decreasing with pressure and temperature. The shape factor, n, was less than 1 382
except for 10 MPa and 35 ºC. The concavity shape of the inactivation curve could be understood 383
as a faster inactivation of the labile form of the enzyme and the presence of a resistant form of 384

MANUSCRIP
T
ACCEPTED
ACCEPTED MANUSCRIPT
the enzyme to HPCD treatment (Figures 3a and 3b). The shape parameter, β, was found to be 385
statistically significant dependent on pressure but although there seemed to be a trend in 386
temperature dependence of β, it was not statistically significant, when tested at the 95% 387
significance level for a linear relationship. In any case, it must be highlighted that only three 388
temperatures have been studied to determine the effect of temperature. According to van Boekel 389
(2002), the scale parameter, α, could be modelled in a similar way to the classical D value of the 390
first order kinetic model, suggesting a linear dependence of the log α on temperature and 391
considering that β did not depend on temperature: 392
p{|n = }V − ~V� [16] 393
A zT’ value can be also defined: 394
��� = V�B [17] 395
The value of the zT’ is listed in Table 2, together with the quality of the fitting. Although the 396
concept of zT and z’T is different since zT is obtained from the linear part, whereas z’T takes also 397
into account the nonlinear part (Van Boekel, 2002), similar values were obtained for both 398
parameters (zT = 29 ºC and z’T = 27 ºC). 399
In this work, it was also found a linear dependence of the log α on pressure: 400
p{|n = }8 − ~8d [18] 401
Although it was found a statistically significant linear relationship between β and p, the inverse 402
of the slope of log α versus p was also evaluated. Analogous to z’T it was defined a z’p 403
��� = − V�] [19] 404
This value is reported in Table 2 and quite similar values can be observed for zp and zp’. 405
3.5. Effect of HPCD on PME 406

MANUSCRIP
T
ACCEPTED
ACCEPTED MANUSCRIPT
To compare the HPCD resistance of PME and PPO, PME inactivation kinetics were determined 407
for the experiments performed at 45 ºC and 10 MPa and 20 MPa (Figure 4). PME inactivation 408
rate was also determined at atmospheric pressure and 45 ºC. At atmospheric pressure, it was 409
found that residual PME activity was still 90% after 120 min at 45ºC (Figure 4). Teleszko et al. 410
(2016) studied thermal treatment of different apple cultivars, founding that PME from cloudy 411
Golden deliciuous apple juice was one of the apple cultivars that presented strongest 412
thermostability (30% of residual activity after heating 5 min at 100 ºC). Niu et al. (2010) found 413
that the RA of PME from cloudy Fuji apple juice from apple slices previously preheated for 414
20 min at the corresponding working temperature, varied between 82 to 72 % at 35 and 45ºC, 415
respectively, but with error bars higher than 10% of RA at each temperature (graphical lecture). 416
After HPCD treatment, higher inactivation rates were observed than for mild heating treatment at 417
the same temperature. Although, residual activity was still around 60 % at 20 MPa and 45 ºC 418
after 60 min. This indicates that PME from cloudy Golden delicious apple juice is rather stable to 419
HPCD at operating temperatures considered as non-thermal treatment. Different HPCD 420
inactivation values of PME from cloudy apple juice have been reported in the literature. Niu et 421
al. (2010) reported a minimal residual activity of 18% for PME of cloudy Fuji apple juice from 422
apple slices treated by HPCD at 20 MPa and 65 ºC for 20 min. In a continuous system, PME 423
from cloudy Fuji apple juice still presented a residual activity of 40% at 22 MPa and 60ºC for 10 424
min (Xu et al., 2011). HPCD inactivation of PME extracts from apple juice was found to be 425
more effectively inactivated at 30 MPa for 60 min, reaching 5% of residual activity at 55 ºC (Zhi 426
et al., 2008). However, in this case, results are different to compare since an extracted enzyme 427
suspended in a buffer solution can give different inactivation results from those obtained in an 428
original juice. 429
MANUSCRIP
T
ACCEPTED
ACCEPTED MANUSCRIPT
Results obtained in this work, indicate that PME from cloudy apple juice was more resistant to 430
HPCD than PPO in the pressure range covered in this work. In the literature, as for thermal 431
treatment, the higher stability has been attributed to the more complex structure of PPO with 432
three or four subunits, in higher plants, than PME, with one subunit. This structure, makes it 433
more susceptible to HPCD treatment (Niu et al., 2010). In addition, PME in fruit juices is more 434
difficult to be effectively inactivated, since PME is bound to the plant cell wall, which contains 435
natural stabilizing factors (Zhou et al., 2010). 436
PME inactivation kinetic data were described by the first order model at atmospheric pressure 437
(Table 1). The decimal reduction time at 45 ºC and atmospheric pressure was found to be much 438
higher than for PPO at the same conditions. HPCD inactivation data at 45ºC and 10 MPa and 439
20 MPa were fitted to the first order kinetic model and the Weibull model (Table 2). The 440
Weibull model yielded the best fitting quality, but still an acceptable good fitting for the first 441
order kinetic model was obtained. For the first order model, inactivation rate constant increased 442
with pressure, but lower values than for PPO inactivation were obtained and therefore higher D 443
values. Regarding the Weibull model, the scale and shape parameters, both, decreased with 444
operating pressure at 45ºC. These parameters were used to calculate the time needed to inactivate 445
1 log (td=1) of PME at the two pressures studied. The td=1 calculated by the Weibull model is 446
much higher than the corresponding D values by the first order kinetic model. Therefore, in this 447
case, the use of the first order kinetic model could lead to an underprocessing estimation for 448
PME inactivation. 449
3.6. Effect of HPCD on different quality parameters of cloudy apple juice 450
Some quality parameters have been determined right after HPCD treatment at 45 ºC, 20 MPa and 451
60 min of treatment time. 452

MANUSCRIP
T
ACCEPTED
ACCEPTED MANUSCRIPT
pH. Initial pH of cloudy apple juice was 3.89 ± 0.01 and immediately after HPCD treatment, pH 453
dropped 0.15 units to 3.74 ± 0.01. Significant differences have been determined among sample 454
pH averages before and after HPCD treatment when applying the Fisher’s least significant 455
method at p-value ≤ 0.05 (Table 3). Gui et al (2007) reported a drop of 0.3 units from 3.95 to 456
3.66 ± 0.03 for Fuji cloudy apple juice after HPCD treatment at 22 MPa and 55 ºC for 60 min. 457
According to Meysammi et al. (1992), juices and beverages can be considered as an aqueous 458
electrolyte system of multiple ions. Under pressurized CO2 a number of dissociation reactions 459
can take place liberating some of them H+ ions that could reduce the pH of the media. In any 460
case, after 2 h after depressurization pH returned to a value close to its initial value (pH = 3.87 ± 461
0.01). 462
Colour parameters. Table 3 lists the L*, a*, b* parameters of cloudy apple juice before and 463
after HPCD treatment. During browning, the L* values decrease, the juice’s colour becomes 464
darker, while a* and b* values increase, with more red and yellow components (Krapfenbauer et 465
al., 2006). After HPCD treatment, lightness (L*) presented slightly, but significant, lower values; 466
however, 99% of the lightness was still retained. No significant difference was observed in the 467
redness component but a significant increase of the yellowness (b*) value has been observed 468
indicating more yellow components right after HPCD treatment. The change in colour, ∆E (Eq. 469
5) is also presented in Table 3. Slightly noticeable differences in color after HPCD treatment 470
have been determined, ∆E ≈ 0.51 ± 0.05 (Yuk et al., 2014). Other authors found that L*, a* and 471
b* values remained almost constant after HPCD treatment at 55 ºC and different operating 472
pressures (8-30 MPa) for 60 min (Gui et al., 2006). 473
MANUSCRIP
T
ACCEPTED
ACCEPTED MANUSCRIPT
Total polyphenolic compounds. Total polyphenols remained unchanged after HPCD. Gasperi 474
et al. (2009) also found no significant differences in polyphenols content after HPCD treatment 475
of a blend of Golden delicious and Granny Smith apple at 10 MPa and 36 ºC for 10 min. 476
Antioxidant capacity. Antioxidant capacity of Golden cloudy apple juice has been determined 477
by the ABTS tests (Table 3). Slightly higher values were obtained after HPCD treatment 478
although differences before and after treatment were found to be no significant (p ≤ 0.05). 479
Hydroxymethylfurfural. Table 3 presents the HMF content before and after HPCD treatment. 480
From these results, it can be concluded that non enzymatic browning reactions were not 481
significant during HPCD processing, probably due to the mild temperatures employed in HPCD 482
treatments. 483
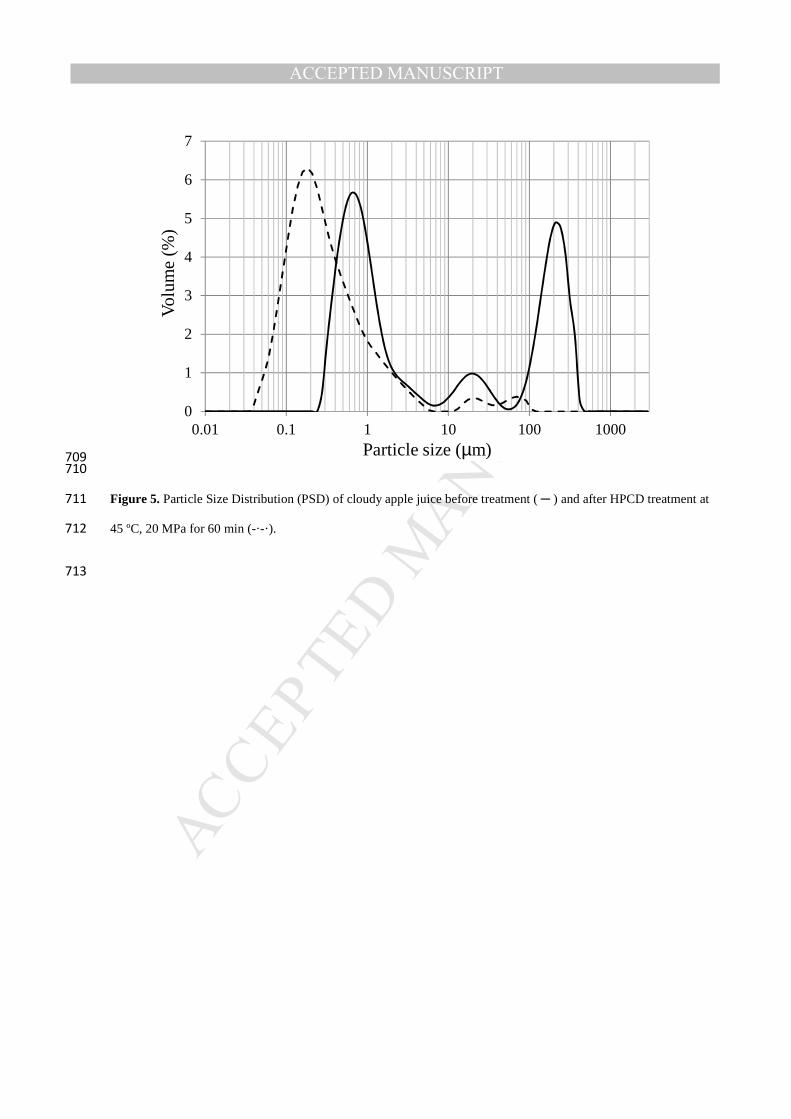
Particle size distribution. The particle size distribution of untreated cloudy apple juice ranged 484
from 0.275 µm to 416.87 µm with three maxima at 0.63, 19.96 and 208.93 µm (see Figure 5). 485
After HPCD treatment, the particle range shifted to smaller particle sizes from 0.04 µm to 486
104.71 µm with one main maximum at 0.182 µm. Table 3 lists values of D[3,2] and D[4,3] of 487
freshly cloudy apple juice and after HPCD treatment. The values after HPCD treatment were 488
significantly lower than those of freshly cloudy apple juice. The homogenization effect of HPCD 489
can be also observed in the values of d(0.1), d(0.5) and d(0.9), which correspond to the size of 490
particle below which 10%, 50% and 90% of the sample lies, respectively. This homogenization 491
effect induced by HPCD could be attributed to the explosive action and the bubbling of CO2 492
from the juice during decompression (Zhou et al., 2010). 493
For freshly cloudy apple juice, the total volume of all particles with diameter less than 5 µm 494
represented 56.5% of the total particles volume, while this number increased up to 96% after 495

MANUSCRIP
T
ACCEPTED
ACCEPTED MANUSCRIPT
HPCD treatment. This fact is also reflected in the Span values (Table 3) that shows a higher 496
degree of uniformity of the cloudy apple juice after HPCD treatment. 497
Turbidity. The turbidity of the cloudy apple juice after HPCD is considerably higher than that of 498
freshly cloudy apple juice (Table 3). It seems that there was a correlation between juice’s 499
turbidity and particle size distribution However, no correlation was found with PME residual 500
activity since, after HPCD treatment, PME activity was still more than 60%. 501
Pectin content. In this work, soluble pectin presented slightly higher values after HPCD (Table 502
4). HPCD treatment could result in a more dissolution of pectin in fruit cell into the juice, 503
increasing the value of soluble pectin. In addition, according to the PSD previously reported, 504
HPCD induced an homogenization with lower particle size diameters, which could result in a 505
higher solubility of the pectin; since, in the literature, it has been reported that pectin solubility in 506
water increases by decreasing its polymer size (Sila et al., 2009) however no significant 507
differences have been found at p ≤ 0.05. No significant differences have been also determined 508
for the oxalate-soluble pectin. 509
In the literature, Zhou et al. (2010) reported no change in water soluble pectin when treating 510
peach juice by HPCD at 30 MPa and 55 ºC at different treatment times, although these authors 511
observed an increase of the large particle after HPCD treatment. However, Yu et al (2013) 512
observed that soluble pectin of HPCD-treated banana pulp at 20 MPa, during 30 min at different 513
temperatures in the range from 45 to 60 ºC, was significantly lower than the untreated pulp. 514
These authors attributed this behavior due to interaction of pectin and protein or gelling of pectin 515
that may occur during HPCD treatment (Yu et al., 2013). 516
ξ potential. ξ potential is an indication of colloidal stability of the juice. Both, untreated and 517
treated apple juice presented negative values of -22.0 mV and -22.3 mV, respectively. These 518
values were within the range reported by Corak and Corredig (2006) of ξ potential as a function 519
MANUSCRIP
T
ACCEPTED
ACCEPTED MANUSCRIPT
of pH for orange juice. Negative values of ξ-potential indicated that juice particles were 520
negatively charged. The extent of this negative surface charge before and after HPCD treatment 521
involves electrostatic charge repulsion which has been established as one of the mechanisms of 522
cloud stabilization (Corak and Corredig, 2006). Since no significant differences at p-values ≤ 523
0.05 were found before and after treatment, it indicates that colloid stability is kept after HPCD 524
treatment. 525
Conclusions 526
HPCD treatment is a valid alternative technology to process Golden delicious cloudy apple juice 527
being more effective than mild thermal treatment in the same temperature range. 528
PPO and PME inactivation rate increased whit operating pressure and temperature, although 529
PME was found to be more HPCD resistant compared to PPO. The non linear Weibull 530
performed a better fitting of the enzyme inactivation kinetics by HPCD than the classical first 531
order kinetic model. 532
However, further research is needed to have reliable data on HPCD as cold pasteurization 533
method, since different results are found in the literature for the same fruit variety. Important 534
variables in enzyme inactivation are usually not described in the research articles such as the way 535
the CO2 is fed into the sample, agitation speed or the ratio juice/volume of the cell that in fact 536
determined the ratio juice/CO2. In this work, it was observed that the stirring speed was an 537
important factor to take into account for enzyme inactivation, due to an improvement in CO2 538
diffusivity 539
HPCD induced a homogenization effect on cloudy apple juice since particle size distribution was 540
shifted to smaller particle size. Colloidal stability is not affect by HPCD treatment as well as the 541
pectic content substances. Slightly noticeable differences in color after HPCD treatment have 542
MANUSCRIP
T
ACCEPTED
ACCEPTED MANUSCRIPT
been determined (∆E ≈ 0.5 ± 0.1). Other quality parameters in cloudy apple juice, such total 543
polyphenolic compounds, antioxidant capacity or hydroxymethylfurfural content did not change 544
after HPCD treatment. Other important aspects need also to be addressed for an industrial 545
application such as sensory quality, shelf life studies and economic aspects. 546
ACKNOWLEDGMENTS 547
To the Spanish Government (MINECO) and the European Regional Development Fund (ERDF) 548
for financial support of project CTQ2015-64396-R and AEI’s contract. To MINECO for RM’s 549
pre-doctoral contract (BES-2013-063937). To University of Burgos for AGS’s pre-doctoral 550
contract. 551
552
LITERATURE 553
Briongos, H., Illera, A.E., Sanz, M.T., Melgosa, R., Beltrán, S., Solaesa, A.G., 2016. Effect of 554
high pressure carbon dioxide processing on pectin methylesterase activity and other orange 555
juice properties. LWT - Food Sci. Technol. 74, 411–419. doi:10.1016/j.lwt.2016.07.069 556
Buckow, R., Weiss, U., Knorr, D., 2009. Inactivation kinetics of apple polyphenol oxidase in 557
different pressure-temperature domains. Innov. Food Sci. Emerg. Technol. 10, 441–448. 558
doi:10.1016/j.ifset.2009.05.005 559
Croak, S., Corredig, M., 2006. The role of pectin in orange juice stabilization: Effect of pectin 560
methylesterase and pectinase activity on the size of cloud particles. Food Hydrocoll. 20, 561
961–965. doi:10.1016/j.foodhyd.2005.10.016 562
Garcia-Gonzalez, L., Geeraerd, A.H., Elst, K., Van Ginneken, L., Van Impe, J.F., Devlieghere, 563
F., 2009. Inactivation of naturally occurring microorganisms in liquid whole egg using high 564
pressure carbon dioxide processing as an alternative to heat pasteurization. J. Supercrit. 565
Fluids 51, 74–82. doi:10.1016/j.supflu.2009.06.020 566
MANUSCRIP
T
ACCEPTED
ACCEPTED MANUSCRIPT
Gasperi, F., Aprea, E., Biasioli, F., Carlin, S., Endrizzi, I., Pirretti, G., Spilimbergo, S., 2009. 567
Effects of supercritical CO2 and N2O pasteurisation on the quality of fresh apple juice. 568
Food Chem. 115, 129–136. doi:10.1016/j.foodchem.2008.11.078 569
Genovese, D.B., Lozano, J.E., 2001. The effect of hydrocolloids on the stability and viscosity of 570
cloudy apple juices. Food Hydrocoll. 15, 1–7. doi:10.1016/S0268-005X(00)00053-9 571
Gui, F., Wu, J., Chen, F., Liao, X., Hu, X., Zhang, Z., Wang, Z., 2007. Inactivation of 572
polyphenol oxidases in cloudy apple juice exposed to supercritical carbon dioxide. Food 573
Chem. 100, 1678–1685. doi:10.1016/j.foodchem.2005.12.048 574
Gui, F., Wu, J., Chen, F., Liao, X., Hu, X., Zhang, Z., Wang, Z., 2006. Change of polyphenol 575
oxidase activity, color, and browning degree during storage of cloudy apple juice treated by 576
supercritical carbon dioxide. Eur. Food Res. Technol. 223, 427–432. doi:10.1007/s00217-577
005-0219-3 578
Hu, W., Zhou, L., Xu, Z., Zhang, Y., Liao, X., 2013. Enzyme Inactivation in Food Processing 579
using High Pressure Carbon Dioxide Technology. Crit. Rev. Food Sci. Nutr. 53, 145–161. 580
doi:10.1080/10408398.2010.526258 581
Ibarz, A., Pagán, A., Tribaldo, F., Pagán, J., 2006. Improvement in the measurement of 582
spectrophotometric data in the m-hydroxydiphenyl pectin determination methods. Food 583
Control 17, 890–893. doi:10.1016/j.foodcont.2005.06.007 584
Ishikawa, H., Shimoda, M., Kawano, T., Osajime, Y., 1995. Inactivation of Enzymes in an 585
Aqueous Solution by Micro-bubbles of Supercritical Carbon Dioxide. Biosci. Biotechnol. 586
Biochem. 59, 628–632. 587
Krapfenbauer, G., Kinner, M., Gossinger, M., Schonlechner, R., Berghofer, E., 2006. Effect of 588
thermal treatment on the quality of cloudy apple juice. J Agric Food Chem 54, 5453–5460. 589
doi:10.1021/jf0606858 590

MANUSCRIP
T
ACCEPTED
ACCEPTED MANUSCRIPT
Liu, X., Gao, Y., Xu, H., Hao, Q., Liu, G., Wang, Q., 2008. Inactivation of peroxidase and 591
polyphenol oxidase in red beet (Beta vulgaris L.) extract with continuous high pressure 592
carbon dioxide. Food Chem. 9, 24–31. doi:10.1016/j.foodchem.2009.06.002 593
Liu, Y., Hu, X.S., Zhao, X.Y., Zhang, C., 2013. Inactivation of polyphenol oxidase from 594
watermelon juice by high pressure carbon dioxide treatment. J. Food Sci. Technol. 50, 317–595
324. doi:10.1007/s13197-011-0356-6 596
Manzocco, L., Ignat, A., Valoppi, F., Burrafato, K.R., Lippe, G., Spilimbergo, S., Nicoli, M.C., 597
2016. Inactivation of mushroom polyphenoloxidase in model systems exposed to high-598
pressure carbon dioxide. J. Supercrit. Fluids 107, 669–675. 599
doi:10.1016/j.supflu.2015.07.029 600
Markowski, J., Baron, A., Le Quéré, J.M., Plocharski, W., 2015. Composition of clear and 601
cloudy juices from French and Polish apples in relation to processing technology. LWT - 602
Food Sci. Technol. 62, 813–820. doi:10.1016/j.lwt.2014.11.048 603
Melgosa, R., Sanz, M.T., Solaesa, Á.G., Paz, E. De, Beltrán, S., Lamas, D.L., 2017. Supercritical 604
carbon dioxide as solvent in the lipase-catalyzed ethanolysis of fi sh oil : Kinetic study. J. 605
CO2 Util. 17, 170–179. doi:10.1016/j.jcou.2016.11.011 606
Meyssami, B., Balaban, M.O., Teixeira, A.A., 1992. Prediction of pH in Model Systems 607
Pressurized with Carbon Dioxide. Biotechnol. Prog. 8, 149–154. doi:10.1021/bp00014a009 608
Niu, S., Xu, Z., Fang, Y., Zhang, L., Yang, Y., Liao, X., Hu, X., 2010. Comparative study on 609
cloudy apple juice qualities from apple slices treated by high pressure carbon dioxide and 610
mild heat. Innov. Food Sci. Emerg. Technol. 11, 91–97. doi:10.1016/j.ifset.2009.09.002 611
Primo, M.S., Ceni, G.C., Marcon, N.S., Antunes, O.A.C., Oliveira, D., Oliveira, J.V., Dariva, C., 612
2007. Effects of compressed carbon dioxide treatment on the specificity of oxidase 613
enzymatic complexes from mate tea leaves. J. Supercrit. Fluids 43, 283–290. 614

MANUSCRIP
T
ACCEPTED
ACCEPTED MANUSCRIPT
doi:10.1016/j.supflu.2007.07.004 615
Re, R., Pellegrini, N., Proteggente, A., Pannala, A., Yang, M., Rice-Evans, C., 1999. Antioxidant 616
Activity Applying an Improved Abts Radical Cation Decolorization Assay. Free Radic. 617
Biol. Med. 26, 1231–1237. doi:10.1016/S0891-5849(98)00315-3 618
Robertson, G.L., 1979. The fractional extraction and quantitative determination of pectic 619
substances in grapes and musts. Am. J. Enol. Vitic. 30, 182–186. 620
Sila, D.N., Van Buggenhout, S., Duvetter, T., Fraeye, I., De Roeck, A., Van Loey, A., 621
Hendrickx, M., 2009. Pectins in Processed Fruits and Vegetables: Part II-Structure-Function 622
Relationships. Compr. Rev. Food Sci. Food Saf. 8, 86-104 623
Teleszko, M., Nowicka, P., Wojdyło, A., 2016. Chemical, enzymatic and physical characteristic 624
of cloudy apple juices. Agric. Food Sci. 25, 34–43. 625
Van Boekel, M.A.J.S., 2002. On the use of the Weibull model to describe thermal inactivation of 626
microbial vegetative cells. Int. J. Food Microbiol. 74, 139–159. doi:10.1016/S0168-627
1605(01)00742-5 628
Wang, S.S.S., Lai, J.T., Huang, M.S., Tai, C.Y., Liu, H.S., 2010. Deactivation of isoamylase and 629
β-amylase in the agitated reactor under supercritical carbon dioxide. Bioprocess Biosyst. 630
Eng. 33, 1007–1015. doi:10.1007/s00449-010-0425-7 631
Xu, Z., Zhang, L., Wang, Y., Bi, X., Buckow, R., Liao, X., 2011. Effects of high pressure CO2 632
treatments on microflora, enzymes and some quality attributes of apple juice. J. Food Eng. 633
104, 577–584. doi:10.1016/j.jfoodeng.2011.01.020 634
YemenicioĞLu, A., ÖZkan, M., CemeroĞLu, B., 1997. Heat Inactivation Kinetics of Apple 635
Polyphenoloxidase and Activation of its Latent Form. J. Food Sci. 62, 508–510. 636
doi:10.1111/j.1365-2621.1997.tb04417.x 637
Yu, Y., Xiao, G., Wu, J., Xu, Y., Tang, D., Chen, Y., Wen, J., Fu, M., 2013. Comparing 638
MANUSCRIP
T
ACCEPTED
ACCEPTED MANUSCRIPT
characteristic of banana juices from banana pulp treated by high pressure carbon dioxide 639
and mild heat. Innov. Food Sci. Emerg. Technol. 18, 95–100. 640
doi:10.1016/j.ifset.2012.12.003 641
Yuk, H.G., Sampedro, F., Fan, X., Geveke, D.J., 2014. Nonthermal Processing of Orange Juice 642
Using a Pilot-Plant Scale Supercritical Carbon Dioxide System with a Gas-Liquid Metal 643
Contactor. J. Food Process. Preserv. 38, 630–638. doi:10.1111/jfpp.12013 644
Zhao, G.-Y., Wei Zong, An, G.-J., 2008. Effect of Storage on Cloud Stability of Cloudy Apple 645
Juice. Food Sci. Technol. Int. 14, 105–113. doi:10.1177/1082013208090176 646
Zhi, X., Zhang, Y., Hu, X., Wu, J., Liao, X., 2008. Inactivation of apple pectin methylesterase 647
induced by dense phase carbon dioxide. J. Agric. Food Chem. 56, 5394–5400. 648
doi:10.1021/jf800260c 649
Zhou, L., Zhang, Y., Leng, X., Liao, X., Hu, X., 2010. Acceleration of precipitation formation in 650
peach juice induced by high-pressure carbon dioxide. J. Agric. Food Chem. 58, 9605–9610. 651
doi:10.1021/jf101430j 652
653
654
655
656

MANUSCRIP
T
ACCEPTED
ACCEPTED MANUSCRIPT
Table 1. Kinetic parameters at 0.1 MPa for the first order kinetic model for PPO inactivation by 657
mild thermal heating (35-45ºC) and PME at 45 ºC. 658
PPO First order kinetic model T, ºC k, min-1 D, min R2 MRD
35
40
45
0.00102 ± 0.00003
0.00166 ± 0.00005
0.00194 ± 0.00003
980
602
515
0.9814
0.9791
0.9993
1.6
1.1
1.1
zT = 36 ± 11 ºC (R2 = 0.9188) Ea = 53 ± 14 kJ/mol (R2 = 0.9248)
PME, 45ºC 0.00038 ± 0.00003 2632 0.9799 0.8

MANUSCRIP
T
ACCEPTED
ACCEPTED MANUSCRIPT
Table 2. Kinetic parameters for the Weibull and the first order kinetic models for PPO and PME inactivation by HPCD. 659
PPO Weibull model First order kinetic model p, MPa T, ºC α, min β td=1, min R2 MRD k, min-1 D, min R2 MRD
10
10
10
35
40
45
98 ± 2
72 ± 2
41 ± 2
1.13 ± 0.06
0.93 ± 0.04
0.89 ± 0.05
205
177
105
0.9940
0.9939
0.9960
2.3
3.4
4.9
0.0044 ± 0.0001
0.0060 ± 0.0001
0.0096 ± 0.0002
227
167
104
0.9891
0.992
0.992
3.4
3.9
6.8
z’T = 27 ± 4 ºC; (R2 = 0.9726) zT = 29 ± 3 ºC; (R2 = 0.9897)
Ea = 64 ± 8 kJ/mol; (R2 = 0.9834)
12.5
15
20
45
45
45
30 ± 1
23.7 ± 0.4
17.2 ± 0.9
0.74 ± 0.02
0.70 ± 0.02
0.59 ± 0.02
93
78
71
0.9983
0.9995
0.9981
2.9
1.2
5.9
0.015 ± 0.001
0.019 ± 0.001
0.026 ± 0.004
67
53
38
0.966
0.953
0.965
23.6
15.6
44.3
z’P = 27 ± 3 MPa; (R2 = 0.9729) zP = 25 ± 5 MPa; (R2 = 0.9226)
Va=- 251 ± 48 cm3/mol; (R2 = 0.9332 )
PME α, min β td=1, min R2 MRD k, min-1 D, min R2 MRD p, MPa T, ºC
10 45 785 ± 294 0.55 ± 0.09 3576 0.9587 2.3 0.0015 ± 0.0001 667 0.9424 5.2
20 45 373 ± 74 0.45 ± 0.04 2380 0.9940 1.1 0.0037 ± 0.0006 270 0.9181 8.6
660
661
662
MANUSCRIP
T
ACCEPTED
ACCEPTED MANUSCRIPT
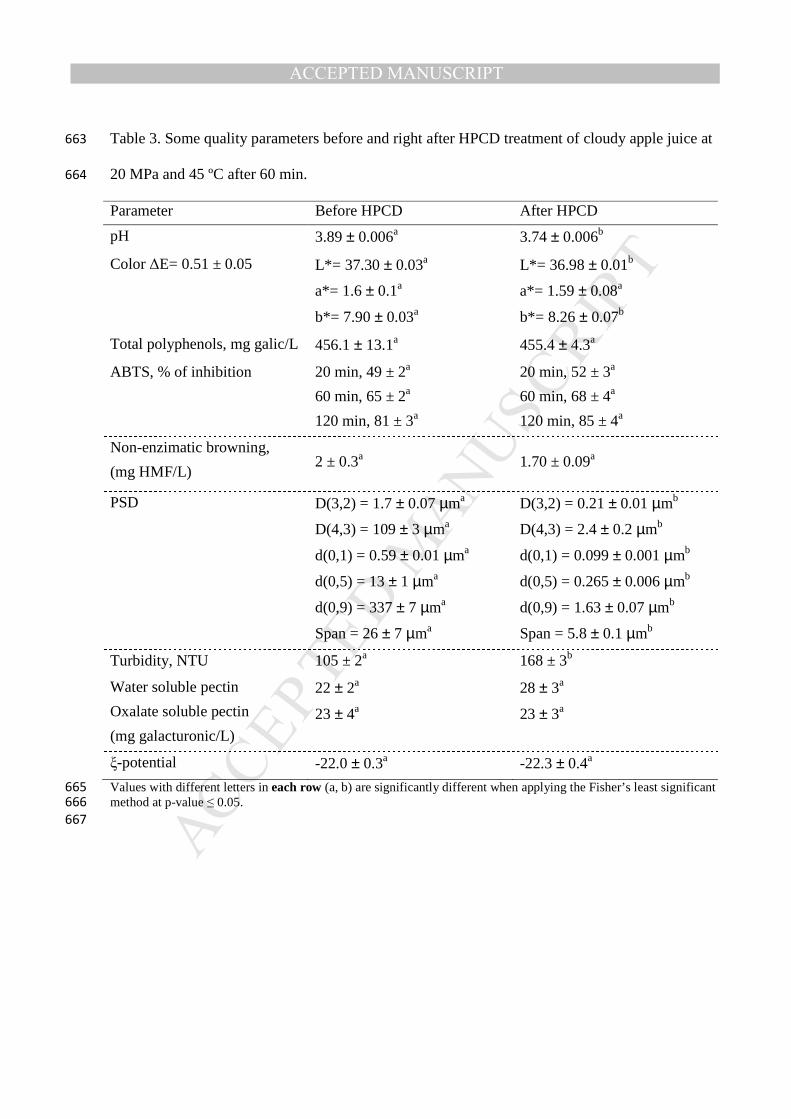
Table 3. Some quality parameters before and right after HPCD treatment of cloudy apple juice at 663
20 MPa and 45 ºC after 60 min. 664
Parameter Before HPCD After HPCD
pH 3.89 ± 0.006a 3.74 ± 0.006b
Color ∆E= 0.51 ± 0.05 L*= 37.30 ± 0.03a
a*= 1.6 ± 0.1a
b*= 7.90 ± 0.03a
L*= 36.98 ± 0.01b
a*= 1.59 ± 0.08a
b*= 8.26 ± 0.07b
Total polyphenols, mg galic/L 456.1 ± 13.1a 455.4 ± 4.3a
ABTS, % of inhibition
20 min, 49 ± 2a
60 min, 65 ± 2a
120 min, 81 ± 3a
20 min, 52 ± 3a
60 min, 68 ± 4a
120 min, 85 ± 4a
Non-enzimatic browning,
(mg HMF/L) 2 ± 0.3a 1.70 ± 0.09a
PSD D(3,2) = 1.7 ± 0.07 µma
D(4,3) = 109 ± 3 µma
d(0,1) = 0.59 ± 0.01 µma
d(0,5) = 13 ± 1 µma
d(0,9) = 337 ± 7 µma
Span = 26 ± 7 µma
D(3,2) = 0.21 ± 0.01 µmb
D(4,3) = 2.4 ± 0.2 µmb
d(0,1) = 0.099 ± 0.001 µmb
d(0,5) = 0.265 ± 0.006 µmb
d(0,9) = 1.63 ± 0.07 µmb
Span = 5.8 ± 0.1 µmb
Turbidity, NTU 105 ± 2a 168 ± 3b
Water soluble pectin
Oxalate soluble pectin
(mg galacturonic/L)
22 ± 2a
23 ± 4a
28 ± 3a
23 ± 3a
ξ-potential -22.0 ± 0.3a -22.3 ± 0.4a
Values with different letters in each row (a, b) are significantly different when applying the Fisher’s least significant 665
method at p-value ≤ 0.05. 666
667

MANUSCRIP
T
ACCEPTED
ACCEPTED MANUSCRIPT
List of Figure captions 668
Figure 1. (a) Effect of stirring speed on PPO inactivation from cloudy apple juice by HPCD at 669
20 MPa and 45 ºC (◇ 200 rpm, ∆ 400 rpm, ○ 600 rpm). (b) Inverse of residual activity of PPO 670
versus the product of number of revolutions per time and treatment time (N·t) at 20 MPa and 45 671
ºC (stirring speed range: 200 to 600 rpm). The continuous line corresponds to the linear fitting 672
(Eq. 15). 673
Figure 2. Inactivation of PPO in cloudy apple juice at atmospheric pressure at different mild 674
temperatures (35 ºC ◇, 40 ºC ○, 45 ºC □). The continuous lines represent the first order model 675
(Table 1). 676
Figure 3. Inactivation of PPO in cloudy apple juice by HPCD (a) 10 MPa and different 677
temperatures (35 ºC ◇, 40 ºC ○, 45 ºC □) (b) 45ºC and different pressures (10 MPa □, 12.5 MPa 678
∆, 15 MPa ◇, 20 MPa ○). The continuous lines represent the Weibull model (Table 2). 679
Figure 4. Inactivation of PME in cloudy apple juice under mild heating treatment at 45ºC (∆ 680
atmospheric pressure) and by HPCD at 45 ºC (10 MPa □, 20 MPa ○). The continuous lines at 681
atmospheric pressure represent the first order kinetic model (Table 1), while in HPCD treatment 682
represent the Weibull model (Table 2). 683
Figure 5. Particle Size Distribution (PSD) of cloudy apple juice before treatment ( ─ ) and after 684
HPCD treatment at 45 ºC, 20 MPa for 60 min (-·-·). 685
686
687
MANUSCRIP
T
ACCEPTED
ACCEPTED MANUSCRIPT
Figure 1. (a) Effect of stirring speed on PPO inactivation from cloudy apple juice by HPCD at 20 MPa and 45 ºC
(◇ 200 rpm, ∆ 400 rpm, ○ 600 rpm). (b) Inverse of residual activity of PPO versus the product of number of
revolutions per time and treatment time (N·t) at 20 MPa and 45 ºC (stirring speed range: 200 to 600 rpm). The
continuous line corresponds to the linear fitting (Eq. 15).
0
20
40
60
80
100
0 20 40 60 80
Re
sid
ual P
PO
act
ivity
, A/A
o·1
00
time, min
1
3
5
7
9
11
0 10000 20000 30000 40000
Ao/
A
N(rpm)·t
(b)
(a)

MANUSCRIP
T
ACCEPTED
ACCEPTED MANUSCRIPT
688
689
Figure 2. Inactivation of PPO in cloudy apple juice at atmospheric pressure at different mild temperatures (35 ºC ◇, 690
40 ºC ○, 45 ºC □). The continuous lines represent the first order model (Table 1). 691
692
693
0
20
40
60
80
100
0 20 40 60 80 100 120
PP
O R
A, A
/Ao·
100
time, min
MANUSCRIP
T
ACCEPTED
ACCEPTED MANUSCRIPT
694
695
Figure 3. Inactivation of PPO in cloudy apple juice by HPCD (a) 10 MPa and different temperatures (35 ºC ◇, 696
40 ºC ○, 45 ºC □) (b) 45ºC and different pressures (10 MPa □, 12.5 MPa ∆, 15 MPa ◇, 20 MPa ○). The continuous 697
lines represent the Weibull model (Table 2). 698
699
0
20
40
60
80
100
0 20 40 60 80 100 120
PP
O R
A, A
/Ao
·10
0
time, min
(a)
0
20
40
60
80
100
0 20 40 60 80 100 120
PP
O R
A, A
/Ao·
100
time, min
(b)

MANUSCRIP
T
ACCEPTED
ACCEPTED MANUSCRIPT
700
Figure 4. Inactivation of PME in cloudy apple juice under mild heating treatment at 45ºC (∆ atmospheric pressure) 701
and by HPCD at 45 ºC (10 MPa □, 20 MPa ○). The continuous lines at atmospheric pressure represent the first order 702
kinetic model (Table 1), while in HPCD treatment represent the Weibull model (Table 2). 703
704
705
706
707
708
0
20
40
60
80
100
0 20 40 60 80 100 120
PM
E R
A, A
/Ao·
100
time, min
MANUSCRIP
T
ACCEPTED
ACCEPTED MANUSCRIPT
709
710
Figure 5. Particle Size Distribution (PSD) of cloudy apple juice before treatment ( ─ ) and after HPCD treatment at 711
45 ºC, 20 MPa for 60 min (-·-·). 712
713
0
1
2
3
4
5
6
7
0.01 0.1 1 10 100 1000
Volu
me
(%)
Particle size (µm)