Embed Size (px)
Citation preview

Civil and Environmental Research www.iiste.org
ISSN 2224-5790 (Paper) ISSN 2225-0514 (Online)
Vol.7, No.6, 2015
41
Evaluation of Growth of Motor Vehicles Fleet and Ambience Air
Quality in India
Mary Tahir1 Tahir Hussain
2 Ayele Behaylu
3*
1. Associate Professor, Department of Geography, Jamia Millia Islamia University, New Delhi, India
2. Professor, Department of Geography and Environmental Studies, Adigrat University, Ethiopia
3. Lecturer, Department of Geography and Environmental Studies, Adigrat University, Ethiopia *Corresponding author: [email protected]
Abstract
Increasing Vehicular population and deteriorating quality of air is the by-product of rapid growth of population
in India. Undoubtedly on one hand transport sector plays a significant role in the overall development of a
nation's economy, but on the other this sector accounts for a substantial and growing proportion of air pollution
also. The urban expansion, industrialization, lack of services, energy and transport demands are leading to a
vicious cycle of pollution. According to the Inter-governmental Panel on Climate Change (IPCC), the main
sources of emission are energy (26%), transport (18%), industry (19%) and buildings (10%) are the main sources
of emissions. The road traffic accounts for about 80% of the passenger traffic and 60% of the goods. For
vehicular motors emits various pollutants, such as carbon monoxide, nitric-oxide, carbon dioxide and several
organic compounds which are responsible for the deterioration of the environment. In developing countries like
India especially, increasing demand for private vehicles is outpacing the supply of transport infrastructure –
including both road networks and public transit networks. The result is growing congestion and air pollution.
The transport sector in India consumes about 16.9% fossil fuel based energy sources. The aim of this paper is to
focus on the state wise emissions of variety of pollutants and asses the quality of air, using region specific mass
emission factors for each type of vehicles.
Keywords- Transport, Quality of air, Industrialization, Development, Greenhouse gas (GHG)
Introduction
India is the seventh largest country in the world covering an area of 3.5 million square kilometres and has a
population of 1.2 billion. 30% of India’s population lives in urban areas and the rate of urbanization is growing
steadily due to push/pull effects of employment opportunities and declining viability of rural agriculture
(Guttikunda and Jawahar, 2012). As India’s capital, Delhi has grown across all sectors - industry, transport, and
housing, all of which have contributed to an increase in city’s air pollution problems (Horowitz, 1982; Narain,
2006). The basic infrastructures required for the region’s economic growth are roads, railways, water and air
connectivity. Road transport is vital to the economic prosperity and social integration of the country including
the development of rural areas. Road transport provides indispensable mobility for all citizens and goods.
Transport fulfils a major role in the Indian economy involving a wide range of industries and services from
vehicle manufacturers and suppliers to infrastructure builders, services, energy providers, public authorities,
insurance and many others. Transport predominantly relies on a single fossil resource, petroleum that supplies 95%
of the total energy used by world transport. With the increase in economic activities, the dependence of fossil
fuel based energy sources and consequent greenhouse gas (GHG) emissions have increased rapidly in recent
times which in turn are responsible for Global warming and Climate Change. In 2004, transport was responsible
for 23% of world energy-related GHG emissions with about three quarters coming from road vehicles. Over the
past decade, transport’s GHG emissions have increased at a faster rate than any other energy using sector
Transport activity is expected to grow robustly over the next several decades (Kamalakar, 1991).
Unless there is a major shift away from current patterns of energy use, world transport energy use is
projected to increase at the rate of about 2% per year, with the highest rates of growth in the emerging economies,
and total transport energy use and carbon emissions is projected to be about 80% higher than current levels by
2030 (Tahir and Mary, 1992).
The global warming issue in transport will have to be addressed in the context of the broader goal of
sustainable development. GHG emission reduction will be only one of several key issues in transport during the
coming decades and will not be the foremost issue in many areas. The majority of GHG emissions from
transportation are CO2 emissions resulting from the combustion of petroleum-based products, like gasoline, in
internal combustion engines. India’s auto sector accounts for about 18 per cent of the total CO2 emissions in the
country. Relative CO2 emissions from transport have risen rapidly in recent years. Road transport is the largest
contributor to global warming. It is known that Transport is a key factor to social, regional and economic
cohesion. However, the impact of road transport on the environment and health remains a major challenge in
many aspects. Transport sector accounts for a share of 6.4 percent in India’s Gross Domestic Product (GDP)
(Hussain and Mary, 1992).

Civil and Environmental Research www.iiste.org
ISSN 2224-5790 (Paper) ISSN 2225-0514 (Online)
Vol.7, No.6, 2015
42
The economic growth, increasing disposable income, and increasing urbanization is creating greater
demand for transport and the number of vehicles on India’s road system is growing rapidly. India like many
other counties in Asia has experienced high annual growth rate in excess of 10%. This is equivalent to doubling
vehicle fleets in about seven years. This factor coupled with high proportion of two motorized vehicles and the
relatively young age of the majority of the population, all make India’s road safety challenging problem. Energy
consumption also varies with the mozxdes of transport and public transport system has least average energy
consumption per passenger kilometre.
Various energy sources used in this sector are coal, diesel, petroleum (gasoline) and electricity. Road,
rail and air are responsible for emission of 80%, 13% and 6% respectively. Vehicular emissions account for
about 60% of the GHG’s from various activities in India. With a rising income and greater need for mobility the
personalized mode of transport is likely to grow in importance in the coming years. The proliferation in the
personalized mode of transport has serious implications for traffic congestion, energy efficiency and pollution.
Lax environmental protection laws and policies, and poor maintenance of vehicles are exacerbating this situation
(Seinfled, 1986; Guttikunda and Jawahar, 2012).
Transport Scenario in India
India became the fifth largest motor vehicle/car manufacturer in the world in 2011. Indian auto manufacturers
produced a record 14.82 million motor vehicles in 2010. 3.54 m (million) cars and commercial vehicles were
produced in 2010 out of which 3.05 m were cars. Domestic passenger vehicle sales hit a new record in 2009-10
(Apr-Mar) when over 1.95 million vehicles were sold.
India is the largest manufacturer of three-wheelers (444,000 in 2009-10) and the eighth largest
commercial vehicle (0.53 m in 2009-10) (Sibal and Sachdeva 2001).
India is also the largest tractor manufacturing country (around 1/3 of global output) having produced
around 370,000 units in 2009-10. A large and efficiently managed public transport system would be the ultimate
solution for reducing air pollution by reducing growth of private vehicles on the roads. Road surface quality is
generally poor. Most of the road network has not been provided with footpaths. Even the available limited road
capacity is reduced by way of on-street parking and encroachments. Surveys have shown that about 30 percent
of a carriageway of major roads in Indian cities is encroached (ibid).
Growth in Number of Registered Motor Vehicles
India had 89.6 million registered motor vehicles at the end of fiscal year 2005-06. Personalized mode
(constituting mainly two wheelers and cars) accounted for more than four fifth of the motor vehicles in the
country compared to their share of little over three-fifth in1951 (Figure-1).
Further break up of motor vehicle population reflects preponderance of two wheelers with a share of
more than 72 percent in total vehicle population. In contrast to personalized mode, the share of buses in total
registered vehicles has declined from 11.1% in1951 to 1.1 during 2006. The share of buses in the vehicle
population at about 1 percent possibly indicates the slow growth in public transport (Hussain and Mary, 1991).
The growth in number of registered vehicles amongst different categories of vehicles during the period
(1991 to 2006) which coincides with era of significant economic reforms shows compound annual growth rate
(CAGR) of about 10% in total vehicle registrations with variation across vehicle categories. Personalized
category of motor vehicles, viz., two-wheelers and cars grew at a CAGR 10.6% and 9.5% respectively which
was higher compared to growth in buses (7.6% per annum) and goods vehicles (8.2% per annum). The higher
growth in personalized motor vehicles reflects rising disposable income; easing of supply side restraints (lifting
of licensing, Quantitative Restrictions etc.); and availability of more convenient financing options. In contrast,
slower growth in goods vehicle category to some extent shows changes in structure of economy and shift from
commodity producing sector (agriculture and industry) towards services which are far less material intensive
together with higher input costs ( tyres etc.) and a plethora of regulations (ibid).
Growth in terms of CAGR of registered vehicles amongst the States and Union Territories for the
quinquennium ending 2006 (2001-2006) shows that total vehicle population in terms of registration grew at
10.3 %. Several States exceeded the all-India growth rate and clocked CAGR of over 11%. These States include
Andhra Pradesh, Assam, Chhattisgarh, Karnataka, Kerala, Orissa, Sikkim, Tamil Nadu, Tripura and Uttarakhand
(Pundir, 1989).
Civil and Environmental Research www.iiste.org
ISSN 2224-5790 (Paper) ISSN 2225-0514 (Online)
Vol.7, No.6, 2015
43
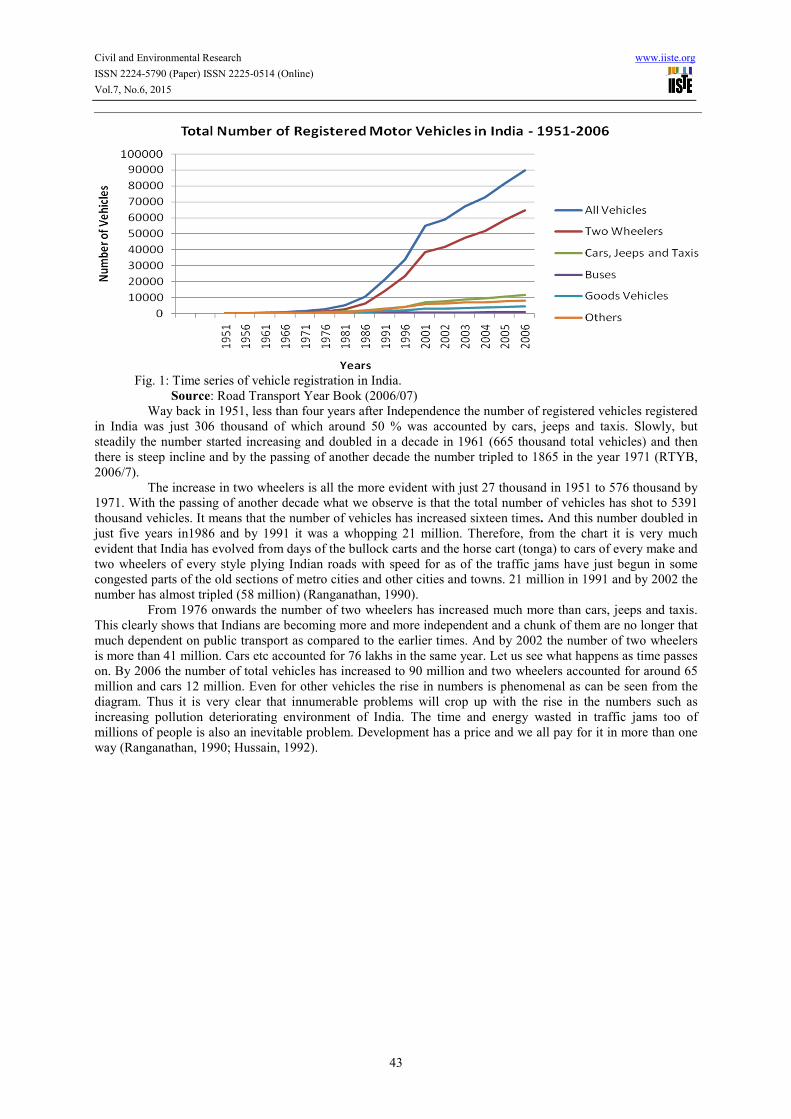
Fig. 1: Time series of vehicle registration in India.
Source: Road Transport Year Book (2006/07)
Way back in 1951, less than four years after Independence the number of registered vehicles registered
in India was just 306 thousand of which around 50 % was accounted by cars, jeeps and taxis. Slowly, but
steadily the number started increasing and doubled in a decade in 1961 (665 thousand total vehicles) and then
there is steep incline and by the passing of another decade the number tripled to 1865 in the year 1971 (RTYB,
2006/7).
The increase in two wheelers is all the more evident with just 27 thousand in 1951 to 576 thousand by
1971. With the passing of another decade what we observe is that the total number of vehicles has shot to 5391
thousand vehicles. It means that the number of vehicles has increased sixteen times. And this number doubled in
just five years in1986 and by 1991 it was a whopping 21 million. Therefore, from the chart it is very much
evident that India has evolved from days of the bullock carts and the horse cart (tonga) to cars of every make and
two wheelers of every style plying Indian roads with speed for as of the traffic jams have just begun in some
congested parts of the old sections of metro cities and other cities and towns. 21 million in 1991 and by 2002 the
number has almost tripled (58 million) (Ranganathan, 1990).
From 1976 onwards the number of two wheelers has increased much more than cars, jeeps and taxis.
This clearly shows that Indians are becoming more and more independent and a chunk of them are no longer that
much dependent on public transport as compared to the earlier times. And by 2002 the number of two wheelers
is more than 41 million. Cars etc accounted for 76 lakhs in the same year. Let us see what happens as time passes
on. By 2006 the number of total vehicles has increased to 90 million and two wheelers accounted for around 65
million and cars 12 million. Even for other vehicles the rise in numbers is phenomenal as can be seen from the
diagram. Thus it is very clear that innumerable problems will crop up with the rise in the numbers such as
increasing pollution deteriorating environment of India. The time and energy wasted in traffic jams too of
millions of people is also an inevitable problem. Development has a price and we all pay for it in more than one
way (Ranganathan, 1990; Hussain, 1992).
Civil and Environmental Research www.iiste.org
ISSN 2224-5790 (Paper) ISSN 2225-0514 (Online)
Vol.7, No.6, 2015
44
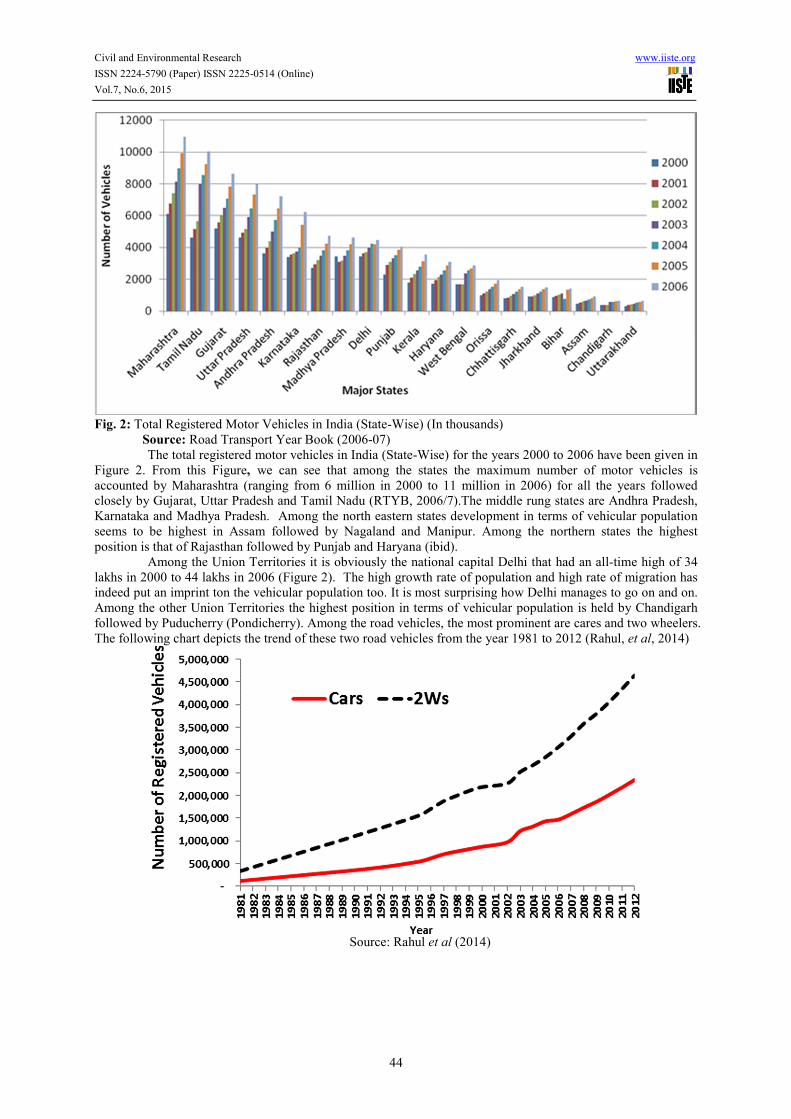
Fig. 2: Total Registered Motor Vehicles in India (State-Wise) (In thousands)
Source: Road Transport Year Book (2006-07)
The total registered motor vehicles in India (State-Wise) for the years 2000 to 2006 have been given in
Figure 2. From this Figure, we can see that among the states the maximum number of motor vehicles is
accounted by Maharashtra (ranging from 6 million in 2000 to 11 million in 2006) for all the years followed
closely by Gujarat, Uttar Pradesh and Tamil Nadu (RTYB, 2006/7).The middle rung states are Andhra Pradesh,
Karnataka and Madhya Pradesh. Among the north eastern states development in terms of vehicular population
seems to be highest in Assam followed by Nagaland and Manipur. Among the northern states the highest
position is that of Rajasthan followed by Punjab and Haryana (ibid).
Among the Union Territories it is obviously the national capital Delhi that had an all-time high of 34
lakhs in 2000 to 44 lakhs in 2006 (Figure 2). The high growth rate of population and high rate of migration has
indeed put an imprint ton the vehicular population too. It is most surprising how Delhi manages to go on and on.
Among the other Union Territories the highest position in terms of vehicular population is held by Chandigarh
followed by Puducherry (Pondicherry). Among the road vehicles, the most prominent are cares and two wheelers.
The following chart depicts the trend of these two road vehicles from the year 1981 to 2012 (Rahul, et al, 2014)
Source: Rahul et al (2014)
Civil and Environmental Research www.iiste.org
ISSN 2224-5790 (Paper) ISSN 2225-0514 (Online)
Vol.7, No.6, 2015
45
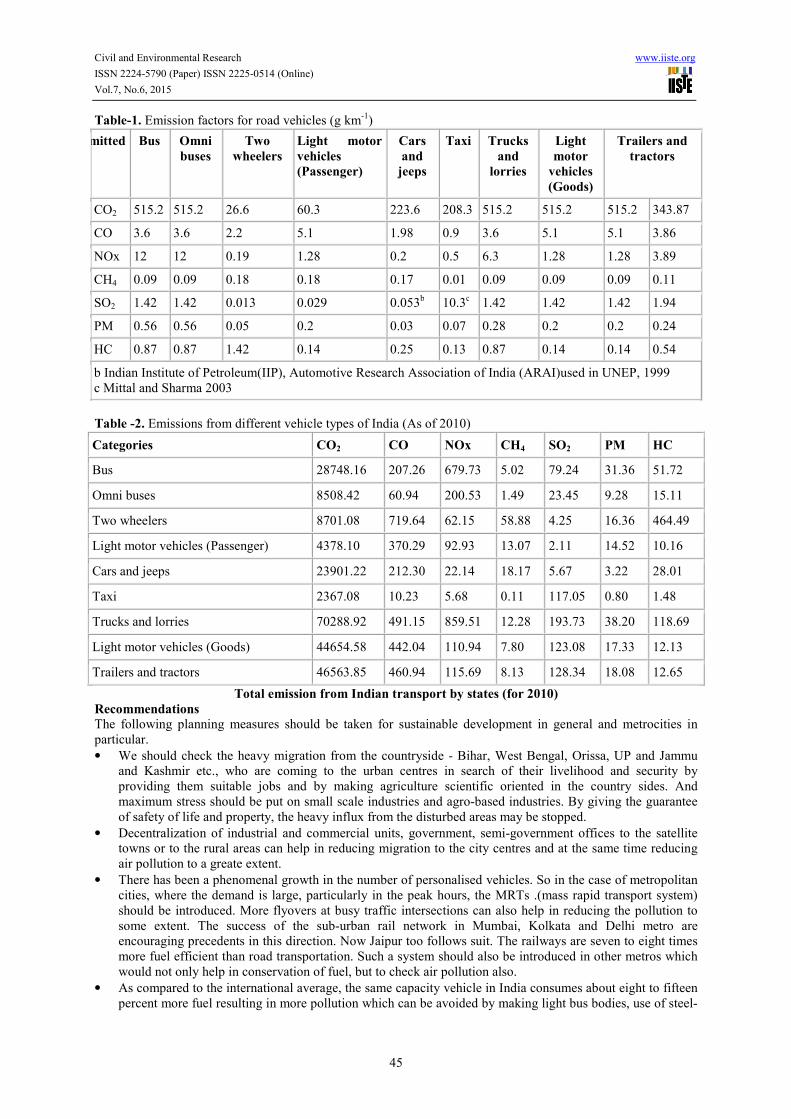
Table-1. Emission factors for road vehicles (g km-1
)
Gases emitted Bus Omni
buses
Two
wheelers
Light motor
vehicles
(Passenger)
Cars
and
jeeps
Taxi Trucks
and
lorries
Light
motor
vehicles
(Goods)
Trailers and
tractors
CO2 515.2 515.2 26.6 60.3 223.6 208.3 515.2 515.2 515.2 343.87
CO 3.6 3.6 2.2 5.1 1.98 0.9 3.6 5.1 5.1 3.86
NOx 12 12 0.19 1.28 0.2 0.5 6.3 1.28 1.28 3.89
CH4 0.09 0.09 0.18 0.18 0.17 0.01 0.09 0.09 0.09 0.11
SO2 1.42 1.42 0.013 0.029 0.053b 10.3
c 1.42 1.42 1.42 1.94
PM 0.56 0.56 0.05 0.2 0.03 0.07 0.28 0.2 0.2 0.24
HC 0.87 0.87 1.42 0.14 0.25 0.13 0.87 0.14 0.14 0.54
b Indian Institute of Petroleum(IIP), Automotive Research Association of India (ARAI)used in UNEP, 1999
c Mittal and Sharma 2003
Table -2. Emissions from different vehicle types of India (As of 2010)
Categories CO2 CO NOx CH4 SO2 PM HC
Bus 28748.16 207.26 679.73 5.02 79.24 31.36 51.72
Omni buses 8508.42 60.94 200.53 1.49 23.45 9.28 15.11
Two wheelers 8701.08 719.64 62.15 58.88 4.25 16.36 464.49
Light motor vehicles (Passenger) 4378.10 370.29 92.93 13.07 2.11 14.52 10.16
Cars and jeeps 23901.22 212.30 22.14 18.17 5.67 3.22 28.01
Taxi 2367.08 10.23 5.68 0.11 117.05 0.80 1.48
Trucks and lorries 70288.92 491.15 859.51 12.28 193.73 38.20 118.69
Light motor vehicles (Goods) 44654.58 442.04 110.94 7.80 123.08 17.33 12.13
Trailers and tractors 46563.85 460.94 115.69 8.13 128.34 18.08 12.65
Total emission from Indian transport by states (for 2010)
Recommendations
The following planning measures should be taken for sustainable development in general and metrocities in
particular.
• We should check the heavy migration from the countryside - Bihar, West Bengal, Orissa, UP and Jammu
and Kashmir etc., who are coming to the urban centres in search of their livelihood and security by
providing them suitable jobs and by making agriculture scientific oriented in the country sides. And
maximum stress should be put on small scale industries and agro-based industries. By giving the guarantee
of safety of life and property, the heavy influx from the disturbed areas may be stopped.
• Decentralization of industrial and commercial units, government, semi-government offices to the satellite
towns or to the rural areas can help in reducing migration to the city centres and at the same time reducing
air pollution to a greate extent.
• There has been a phenomenal growth in the number of personalised vehicles. So in the case of metropolitan
cities, where the demand is large, particularly in the peak hours, the MRTs .(mass rapid transport system)
should be introduced. More flyovers at busy traffic intersections can also help in reducing the pollution to
some extent. The success of the sub-urban rail network in Mumbai, Kolkata and Delhi metro are
encouraging precedents in this direction. Now Jaipur too follows suit. The railways are seven to eight times
more fuel efficient than road transportation. Such a system should also be introduced in other metros which
would not only help in conservation of fuel, but to check air pollution also.
• As compared to the international average, the same capacity vehicle in India consumes about eight to fifteen
percent more fuel resulting in more pollution which can be avoided by making light bus bodies, use of steel-

Civil and Environmental Research www.iiste.org
ISSN 2224-5790 (Paper) ISSN 2225-0514 (Online)
Vol.7, No.6, 2015
46
belated radical tyres, electronic control devices and time to time testing of emission level.
• Last, but not the least illegal migrants from Bangladesh and Myanmar should be stopped immediately lest
our cities lose all sense of identities and furthering environmental degradation.
References
Sarath Guttikunda and Puja Jawahar, 2012) Emissions, Pollution & Health Impacts; Road Transport in India
2010-30
Fernades, B.G. (1992). 'Solvaging big cities' in Hindustan Times, March 18.
Horowitz, J .M. (1982) Air Quality Analysis for Urban Transportation Planning MIT Press, Cambridge.
Hussain T. ansl T. Mary (1991) 'Deteriorating Urban Environment with increasing vehicular population' Link
News Weekly Dec. 22.
Hussain, T. and T. Mary (1992) 'Energy Crisis, vis-a-vis transport sector' Link News Weekly March 1.
Hussain, T. (1992) 'Vehicular Pollution vis-a-vis Environment' in Environmental Management and Sustainable
Development. Department of Geography, Jamia Millia Islamia, New Delhi.
Kamalakar J.A. (1991) 'A Study of Air Pollution in Union Territory of Delhi' Ecology Vol. 5 (No.9) February.
Pundir, B.P. (1989) 'Vehicle Air Pollution in India' Ecology Vol. 4 (No.7) December.
Ranganathan, S. (1990) 'A sustainable India' Ecology VI. 1 (No. 12) May. Saranthan, TR. (1987) 'Automobile
Pollution' Ecology Vol. 1 (No. 12) May.
Seinfled, J .H. (1986) Atmospheric Chemistry and Physics of air pollution John Wiley, New York. (1992)
'Environmental Pollution' Civil Services Chronicle, March.
Sibal, V. and Sachdeva Y. (2001). Urban Transport Scenario in India and its Linkages with Energy and
Environment, Urban . Transport Journal, Vol. 2, No.1, March.
Narain, U., Bell, R.G., 2006. Who changed Delhi’s air? Econ. Political Wkly., 1584–1588.
Rahul Goel, Sarath K. Guttikunda, Dinesh Mohan, and Geetam Tiwari (2014) Benchmarking vehicle and
passenger travel characteristics in Delhi for on-road emissions analysis. Elsevier
www.elsevier.com/locate/tbs.
RTYB (Road Transport Year Book) (2006/07). Annual report, India.
The IISTE is a pioneer in the Open-Access hosting service and academic event management.
The aim of the firm is Accelerating Global Knowledge Sharing.
More information about the firm can be found on the homepage:
http://www.iiste.org
CALL FOR JOURNAL PAPERS
There are more than 30 peer-reviewed academic journals hosted under the hosting platform.
Prospective authors of journals can find the submission instruction on the following
page: http://www.iiste.org/journals/ All the journals articles are available online to the
readers all over the world without financial, legal, or technical barriers other than those
inseparable from gaining access to the internet itself. Paper version of the journals is also
available upon request of readers and authors.
MORE RESOURCES
Book publication information: http://www.iiste.org/book/
Academic conference: http://www.iiste.org/conference/upcoming-conferences-call-for-paper/
IISTE Knowledge Sharing Partners
EBSCO, Index Copernicus, Ulrich's Periodicals Directory, JournalTOCS, PKP Open
Archives Harvester, Bielefeld Academic Search Engine, Elektronische Zeitschriftenbibliothek
EZB, Open J-Gate, OCLC WorldCat, Universe Digtial Library , NewJour, Google Scholar