Embed Size (px)
Citation preview

Vol. 6 | No.3 | 245-257| July- September | 2013
ISSN: 0974-1496 | e-ISSN: 0976-0083 | CODEN: RJCABP
http://www.rasayanjournal.com
http://www.rasayanjournal.co.in
WATER QUALITY WITH REGARD TO LIVESTOCK USE K.K. Deshmukh
EVALUATION OF GROUNDWATER QUALITY WITH
REGARD TO LIVESTOCK USE FROM SANGAMNER AREA,
AHMEDNAGAR DISTRICT, MAHARASHTRA, INDIA
K.K. Deshmukh
Post-Graduate Research Center in Chemistry, Sangamner Nagarpalika Arts, D.J. Malpani
Commerce & B.N. Sarda Science College, Sangamner – 422605, Dist. Ahmednagar, (M.S.)
E-mail: [email protected]
ABSTRACT
Livestock is a key asset for poor people, fulfilling multiple economic, social and risk management functions. In
India, smallholder farmers rely greatly for their survival on livestock keeping which is a safety valve for them. There
is a need to look into the welfare of livestock such as feed, water and health etc. Health of livestock similar to
human being is mainly affected by water they drink. Cows, buffaloes, bullocks, sheep, goats are common livestock
in Sangamner area. These livestock and dairy serve as the major source of earning to farmers besides agriculture.
Every farmer in the area maintains some kind of livestock population. It is, therefore necessary to evaluate the
quality of groundwater for the consumption of livestock population. 68 groundwater samples were analyzed for
various parameters such as pH, EC, TDS, Ca2+
, Mg2+
, Na+, K
+, Ca
2+, Mg
2+, SO4
2- and NO3
- during pre and post
monsoon season using standard methods. It was found that the parameters like EC, total hardness and nitrate were
exceeded the limit recommended for the use of water for livestock and poultry suggested by National Research
Council. Higher EC were observed in low-lying area which are poorly drained and are under intensive agriculture.
Wide variations in the response of livestock to saline water were observed. Some of the major factors that influence
the response of livestock to saline water depend on kind of livestock, age, sex, pregnancy and lactation, intensity of
work performed by the animal and climatic conditions. The cattles from some of the areas were to allowed drink the
groundwater from the area, they start suffering from diseases and their pregnancy period was prolonged. Educating
the farmers to adopt better farm management and better livestock care has been suggested to reduce the problem of
groundwater deterioration and welfare of livestock population.
Keywords: Groundwater quality, livestock use, National Research Council, groundwater deterioration. ©2013 RASĀYAN. All rights reserved
INTRODUCTION Water is one of the foremost essential components and it is essentially required by all living
organisms. The quality of water is of vital concern to all living beings. About 97.2% of water
on earth is salty and 2.8% is present as fresh water from which about 20% constitutes
groundwater1. Therefore determining groundwater quality is important to observe the suitability
of water for particular purpose through anthropogenic and other sources like different land
conditions, rain conditions, use of different chemical pesticides and different depth of bore
wells2. Human activities and livestock farming also have a significant effect on groundwater
quality.
Livestock require water for survival as water is necessary for the transport of nutrients, waste
products and harmones. Often there is a belief that animals will drink any type of water but it
was observed that the animals usually drink poor quality water only when there is no option.
Livestock plays an important role in agricultural economy and it is absolutely essential to look
into needs with respect to their water quality. Good quality water is essential for the production
of livestock and poultry3. Some of the major factors that influence the response of livestock to
saline water depend on the kind of livestock, age, sex, pregnancy, lactation, intensity of work
performed by animals and climatic conditions. Water quality can affect both the total water
consumption of livestock and the health of that livestock. Objectionable taste and odor will

Vol. 6 | No.3 | 245-257| July- September | 2013
WATER QUALITY WITH REGARD TO LIVESTOCK USE K.K. Deshmukh 246
discourage livestock water consumption, reduce useless gain. Several studies on groundwater
quality with regard to livestock use have been reported 4-10
.
Sangamner is in semi–arid region with low rainfall. There is greater dependence on the
groundwater. Groundwater is mainly used for drinking, washing bathing, irrigation and for
livestock raring in the area. However, the establishment of industrial estate by the Govt. of
Maharashtra at Sangamner and growth of sugarcane and allied industries has staring
deteriorating the groundwater quality in some parts of the area. Cows, buffaloes, bullocks, sheep
and goats are common livestock in the area. These livestock and diary serve as the major source of
earning to farmers besides agriculture. Their basis input i.e. feed has been sourced from agriculture.
On an average every farmer in the area maintains some kind of livestock population. It is, therefore,
necessary to evaluate the quality of water for the consumption of livestock population. In the
majority part of the study area, poultry and dairy farming is the backbone of rural economy. Since the
soils from the area have started deteriorating due to excess use of fertilizers, use of saline water and
practicing of mono culture type of cropping pattern, the crop yield have gone down. This is in turn
affected the economy of the family. Thus farmers have developed the dairy farming to a large extent.
There is a large network of co-operative dairies in the area. This agro-based industry is developed
due to deterioration in the quality of groundwater. Researchers have carried out an extensive work
on groundwater quality for various purposes in the area 11-14
. But there is however no data
available about the groundwater quality with regard to livestock use of Sangamner area. In this
view, an attempt has been made to evaluate the groundwater quality of Sangamner area.
Study Area Sangamner area is located in the northern part of the Ahmednagar district of Maharashtra State. The tahsil
lies between 18o36' N to 19
o 1’N latitude and 74
o 1’W to 74
o 56’W longitude. The Sangamner town is
located on the confluence of the Mahalungi and the Pravara River. It is a Taluka head quarter which is at
a distance of 150 km from Pune, on Pune - Nasik National Highway No. NH-50 (Fig.-1).
Fig.-1: Locations of ground water sampling stations in the Study area.
The area is drained by the Pravara River which is a tributary of Godavari and has its origin in the hilly
region of Western Ghats. Geologically, basalt underlay the Pravara basin, which is characterized by thick
alluvium (upto 35 m.). Several dams and weirs have been constructed across Pravara River. Because of
construction of Bhandardara Dam in the source region of Pravara River, the valley has been brought

Vol. 6 | No.3 | 245-257| July- September | 2013
WATER QUALITY WITH REGARD TO LIVESTOCK USE K.K. Deshmukh 247
under intensive agriculture with sugarcane as a single dominant crop. Subsequent to the establishment of
co-operative sugar mill at Sangamner in 1967, the agriculture in the area has witnessed rapid changes in
the cropping pattern. In addition to sugar industry, several allied industrial units have also come up in the
area. The effluents from sugar industry, with little or no treatment have been stored in lagoons and then
discharged into the natural stream flowing through the agricultural area for a distance of about 8 to 9 km.
This effluent stream finally meets the Pravara River at Sangamner and deteriorate the quality of water. In
some remote areas, river and pond water is also used for various domestic purposes including cooking
drinking and livestock raring. The medical facilities in this area are also not appropriate. Majority of the
people are farmers residing in the fields along with livestock near the wells and on the bank of river.
EXPERIMENTAL A network of 68 groundwater-sampling stations distributed over mainly the irrigated region of the
Sangamner area. The samples were collected for two seasons i.e. pre monsoon (May) and Post monsoon
(November). The 54 of them were from irrigated area and 14 from non-irrigated area. Sampling locations
were chosen on the basis of pilot geological and hydro-geological survey of the area. The samples from
dug / bore wells were collected on the basis its use for drinking / domestics purposes. The samples were
collected in polyethylene bottles of one-liter capacity. The care was taken to collect samples after
pumping for some time. To determine the suitability of groundwater for livestock, the parameters like pH,
EC, alkalinity, hardness, chlorides, sulphate, nitrate and sodium were analysed. The pH, electrical
conductivity (EC) were measured in the field. The samples were then brought to the laboratory for further
chemical analysis. The analysis was carried out in the laboratory by using the procedures given by APHA,
AWWA, WPCF 15
. Using titrimetric methods performed the analysis of chloride (Cl-), total alkalinity as
CaCO3, Calcium (Ca2+
) and total hardness as CaCO3 (TH). While nitrate and sulphate were analyzed by
spectrophotometric methods and the alkali element sodium were detected by flame photometer (E, 850 A,
Equiptronics). The results of the groundwater analysis are presented in Table-1 and 2.
Table-1: Physico-chemical data of groundwater samples from Sangamner area, Ahmednagar
district, Maharashtra (Pre - monsoon).
S. No. WT pH EC TDS Na Ca Mg Cl HCO3 SO4 NO3 TH
W1 3.03 8.2 4630 3010 260 19 25 129 689 161 36 150
W2 2.12 8 4930 3205 348 27 36 184 719 156 29 210
W3 1.51 8.4 4870 3166 232 45 52 186 572 158 8 324
W4 3.63 8 5630 3660 300 42 47 194 572 168 52 296
W5 2.42 8.2 6420 4173 360 25 35 198 602 166 29 204
W6 7.57 7.8 7161 4655 376 66 80 284 673 165 58 492
W7 2.42 8 4670 3036 260 39 49 161 592 163 36 300
W8 4.54 8.2 3860 2509 216 24 41 123 490 162 49 228
W9 6.06 7.9 5760 3744 192 90 102 307 556 160 46 644
W10 7.57 7.6 5320 3458 172 116 93 272 393 164 56 672
W11 6.06 7.7 10360 6734 380 148 131 533 398 167 40 904
W12 5.75 7.7 10250 6663 380 87 146 598 536 165 72 814
W13 1.51 8 5630 3660 187 70 105 360 260 161 39 609
W14 4.54 8.2 8460 5499 340 56 103 439 587 160 70 562
W15 3.03 8 6620 4303 284 65 82 302 602 166 47 500
W16 3.93 8.3 5290 3439 210 18 27 110 550 164 30 154
W17 3.63 8.4 5160 3354 280 21 24 146 583 161 52 150
W18 2.72 8.3 6770 4401 332 38 35 216 755 159 68 238
W19 9.09 8.2 6300 4095 272 62 75 243 699 158 81 462
W20 10.6 7.8 6010 3907 232 67 81 252 694 162 58 500
W21 18.8 8.2 3780 2457 134 25 54 103 485 151 52 284

Vol. 6 | No.3 | 245-257| July- September | 2013
WATER QUALITY WITH REGARD TO LIVESTOCK USE K.K. Deshmukh 248
W22 15.2 7.5 7650 4973 190 112 95 289 302 153 89 670
W23 7.57 8 6690 4349 280 31 18 253 538 157 44 152
W24 9.09 7.9 7240 4706 272 44 24 193 592 153 66 208
W25 18.2 7.8 5610 3647 210 44 39 211 507 154 48 270
W26 8.18 8.1 1370 891 16 25 29 51 142 40 42 182
W27 12.1 8.5 720 468 30 13 7 14 86 28 26 62
W28 12.1 8 4870 3166 260 38 35 142 614 158 34 240
W29 12.7 8.2 3970 2581 208 28 29 107 568 149 40 188
W30 10.6 7.6 4470 2906 136 51 53 149 466 123 57 342
W31 13.6 7.4 4640 3016 68 52 109 220 252 141 62 378
W32 14.8 7.4 2860 1859 44 40 46 89 288 101 29 288
W33 15.2 8.2 2870 1866 78 35 44 85 232 118 52 270
W34 12.7 7.8 4740 3081 130 64 68 239 257 124 37 438
W35 18.1 7.8 4260 2769 118 64 66 144 369 170 28 432
W36 19.7 7.9 3650 2373 88 40 65 109 298 145 40 366
B37 - 7.8 4600 2990 124 51 69 176 339 154 44 410
W38 7.57 7.5 5700 3705 110 88 111 369 383 156 29 674
W39 22.7 8.4 2770 1801 122 20 31 105 457 76 36 176
W40 19.7 7.6 2550 1658 52 60 48 105 353 69 48 358
W41 15.2 7.8 2140 1391 72 48 56 90 364 123 46 346
W42 12.1 8 3300 2145 116 51 37 156 318 122 61 280
W43 12.1 7.6 5930 3855 126 97 113 335 453 168 57 704
W44 8.48 7.6 4500 2925 124 172 79 300 362 155 65 754
B45 - 7.6 3480 2262 212 64 35 141 525 156 37 318
W46 10.9 8.2 4050 2633 112 28 24 34 339 122 52 170
W47 9.09 8.1 1610 1047 146 33 38 100 563 155 26 238
W48 1.51 7.9 2700 1755 116 35 32 91 441 153 46 218
W49 12.1 8.6 2070 1346 224 13 7 28 565 105 36 62
W50 19.7 8 4170 2711 140 48 44 133 499 156 53 300
W51 7.57 8 7350 4778 328 49 92 298 606 167 38 500
W52 4.54 8.2 1860 1209 120 30 30 122 359 129 48 200
W53 9.09 8.2 1680 1092 126 21 57 71 436 109 36 286
W54 12.1 8 5690 3699 154 48 46 212 373 156 49 310
B55 - 8.4 830 531 28 26 14 30 140 53 29 120
W56 7.57 8.4 580 371 25 19 16 10 116 47 22 112
W57 18.1 7.9 1590 1018 76 30 30 47 205 98 34 200
W58 12.1 7.9 1240 794 26 35 29 41 167 71 46 204
W59 18.2 8.1 1390 890 56 25 22 28 172 80 56 152
W60 9.09 8.2 1150 736 52 20 25 24 132 92 59 154
W61 6.66 8 3200 2048 76 50 48 121 237 142 34 322
W62 12.1 8.2 810 5184 31.2 25 21 44 132 69 22 148
W63 6.06 8.6 640 410 36 23 17 18 80 63 15 128
W64 12.1 8.6 540 346 34.8 21 8 16 135 50 10 84
W65 9.09 8.4 760 486 37.6 16 12 13 152 54 16 90
W66 8.48 8.4 650 416 21.2 24 15 23 95 48 9 122
W67 18.2 8.1 420 269 16.4 27 13 12 132 39 0.6 120
W68 19.7 8.1 360 230 34.4 26 7 9 160 37 2.4 92 Note:
1. All values of the constituents are in ppm / mg/l, except pH and EC (µS/cm).
2. W- Dugwell, B- Borewell, TH-Total hardness.
3. Water Table (WT) depth is in meters.

Vol. 6 | No.3 | 245-257| July- September | 2013
WATER QUALITY WITH REGARD TO LIVESTOCK USE K.K. Deshmukh 249
Table-2: Physico-chemical data of groundwater samples from Sangamner area, Ahmednagar
district, Maharashtra (Post - monsoon).
S. No. WT pH EC TDS Na Ca Mg Cl HCO3 SO4 NO3 TH
W1 1.81 8.4 890 578 144 80 12 142 235 72 26 250
W2 1.81 8.1 4500 2925 541 80 93 476 673 175 12 581
W3 1.21 8 4700 3055 532 150 148 675 651 171 9 984
W4 0.6 8.2 7905 5138 829 120 141 937 666 177 3 880
W5 0.9 8.5 4750 3087 560 138 106 582 589 169 2 781
W6 0.3 7.9 7385 4761 529 228 288 930 827 181 13 1755
W7 0.3 8.2 3620 2353 458 124 163 497 669 174 2 981
W8 1.21 8 4158 2703 527 112 167 553 640 173 27 967
W9 2.12 7.4 6610 4297 365 280 320 950 659 179 12 2016
W10 0.9 7.4 7516 4885 425 320 340 1071 689 177 3 2199
W11 2.12 8 7922 5149 648 388 321 1292 710 175 14 2290
W12 1.51 7.8 9200 5980 760 326 309 1503 753 180 38 2333
W13 0.9 7.8 7315 4755 516 216 392 1092 710 174 6 2153
W14 0.9 8.2 8826 5737 729 216 294 1262 710 178 7 1749
W15 0.9 7.9 6720 4368 540 220 248 923 735 170 14 1570
W16 1.81 8 3850 2502 578 76 102 532 657 169 11 609
W17 0.9 7.6 6610 3907 662 180 185 767 678 172 11 1211
W18 1.21 8.2 5100 3315 488 104 136 639 622 168 2 819
W19 14.5 8 5816 3780 476 202 227 717 768 172 18 1439
W20 12.7 7.9 5408 3515 495 196 235 710 737 169 19 1457
W21 7.57 8.6 3815 2480 418 100 124 667 615 144 21 761
W22 9.09 7.9 7212 4688 623 268 289 1533 457 167 33 1859
W23 4.54 8.3 7500 4875 671 234 321 1480 735 167 24 1486
W24 8.18 8.9 6411 4167 681 140 170 1235 674 166 21 1049
W25 4.84 8.3 5209 3386 495 176 216 1030 745 166 40 1328
W26 1.51 8.3 1400 910 74 100 76 198 326 38 36 563
W27 1.51 8.5 1000 650 82 80 63 85 433 42 2 460
W28 3.03 8.4 5008 3255 458 140 160 795 744 165 2 1008
W29 7.57 8.8 800 520 10 112 43 135 204 42 2 456
W30 4.54 8.1 4304 2798 318 236 241 830 566 142 28 1581
W31 2.42 8.2 4612 2998 183 288 240 950 557 131 30 1707
W32 6.96 8.4 3520 2288 147 204 214 631 562 125 11 1391
W33 9.09 8.4 5810 3776 188 304 457 1256 551 161 57 2641
W34 6.06 8.2 5080 3302 322 308 363 1285 582 118 46 2264
W35 10.6 8.3 4612 2997 199 328 214 837 533 126 38 1700
W36 7.57 8.3 3540 2301 134 134 276 695 513 144 30 1470
B37 - 8.2 4814 3129 262 178 258 1008 502 167 39 1508
W38 0.6 8.5 2913 1894 128 144 198 497 482 115 16 1175
W39 12.1 8.5 2301 1496 141 88 136 312 642 63 38 780

Vol. 6 | No.3 | 245-257| July- September | 2013
WATER QUALITY WITH REGARD TO LIVESTOCK USE K.K. Deshmukh 250
W40 12.1 8.5 2412 1568 37 208 152 447 482 58 40 1142
W41 9.09 8.1 2100 1365 65 182 120 319 523 112 30 948
W42 7.57 8.3 2412 1568 142 152 232 525 597 104 87 1335
W43 4.24 8 5990 3894 209 284 370 1093 528 163 52 2232
W44 4.84 8.3 2716 1765 144 441 280 1015 546 164 100 2254
B45 - 8.1 4260 2769 232 188 143 489 594 163 58 1058
W46 5.45 8.7 4698 3054 318 128 141 568 661 161 31 900
W47 3.03 8.8 1580 1030 120 96 80 113 518 90 3 569
W48 0.3 8.3 2896 1882 171 144 121 348 510 146 30 858
W49 10.6 8.7 1986 1291 297 56 20 121 673 79 3 220
W50 9.09 8.3 4164 2707 313 170 125 426 683 164 23 939
W51 4.54 8.9 5574 3623 555 128 187 717 652 167 12 1089
W52 - 8.7 2192 1425 122 148 121 334 408 131 20 868
W53 4.54 8.6 1789 1163 198 84 56 170 489 99 48 441
W54 4.54 8.1 4768 3099 295 138 223 738 732 165 51 1263
W55 - 8.6 890 579 61 98 48 122 316 39 42 442
W56 3.93 8.7 880 572 43 80 63 70 351 67 3 459
W57 7.57 8.1 3090 2009 23 100 56 78 355 50 14 480
W58 3.03 8.3 1390 904 52 124 73 174 377 55 69 610
W59 10.6 8.5 1210 787 63 102 77 114 357 67 66 572
W60 1.21 8.8 1296 843 58 88 69 97 356 62 26 504
W61 7.57 8.4 3216 2090 169 208 188 560 567 137 20 1293
W62 0.3 8.7 810 527 45 102 65 90 351 43 26 522
W63 7.57 8.7 680 442 41 80 34 102 285 47 3 340
W64 3.63 8.5 1590 1034 105 80 126 224 540 78 7 719
W65 3.03 8.6 940 611 53 88 58 91 382 41 18 459
W66 2.42 8.1 820 533 37 88 53 110 270 40 18 438
W67 7.57 8 1080 702 25 144 90 102 467 45 13 730
W68 8.18 7.9 620 403 16 110 10 69 244 19 2 316
Note: 1. All values of the constituents are in mg/l, except pH and EC (µS/cm).
2. Values of Fe are in ppb.
3. W- Dugwell, B- Borewell, TH-Total hardness.
4. Water Table (WT) depth is in meters.
RESULTS AND DISCUSSION Total dissolved salts / electrical conductivity of groundwater with regard to livestock use The electrical conductivity provides an indication of the total salts in the water. The electrical
conductivity (EC) is expressed in µS/cm at 250C approximately equal to and can be substituted for
TDS without introducing error in interpretation depending on type of salts present16
. The quality
requirement of livestock is more or less same as that for drinking water for human consumption.
However, the higher concentration of EC / TDS can be tolerated by animals17
. As the concentration
of salt increases above 1000µS/cm, risk of health problems and reduced productivity in livestock
may occur. Saline water toxicity upsets the electrolyte balance in animals and will result in
symptoms similar to dehydration. At EC over 10,000 µS/cm, water will not be palatable and diarrhea
and weight loss can be expected. The use of such water is not recommended for animals16
. The EC
values from study area ranges from 840 to 11350µS/cm and 620 to 9200 µS/cm during pre and post

Vol. 6 | No.3 | 245-257| July- September | 2013
WATER QUALITY WITH REGARD TO LIVESTOCK USE K.K. Deshmukh 251
monsoon respectively. Lowing of EC in post – monsoon could be due to dilution effect caused by
rainfed recharge during monsoon season leading to higher groundwater level. The higher values of
EC during pre monsoon reflect concentration effect. The groundwater from the study area is
classified based on the general guide to use saline water for livestock and poultry recommended by
National Academy of Sciences18
.
Table-3: Classification of groundwater on the basis of EC to the use of saline water for livestock and poultry18
from study area.
EC (µS/cm) No. and Locations of Samples
(Pre monsoon)
No. and Locations of samples
(Post - Monsoon)
Less than 1000 W26,W27,W55,W56,W63,W65
=6(8.82%)
W1,W29,B55,W56,W62,W63,
W65, W66, W68 = 9 (13.23%)
1000-2999 W40,W41,W47,W49,W52,W53,W57,
W58,W59,W60,W61,W62,W64,W66,
W67, W68 = 16(23.52%)
W26,W27,W38,W39,W40,W41,
W42,W44,W47,W48,W49,W52,
W53,W58,W59,W60,W64,W67
=18(26.47%)
3000-4999 W1,W3,W7,W8,W11,W21,W29,W30,
W32,W33,W34,W35,W36,W39,W42,
W45,W46,W48,W50 = 19 (27.94%)
W2,W3,W5,W7,W18,W16,W21,
W30,W31,W32,W35,W36,W37,
W45,W46,W50,W54,W57
=19 (27.94%)
5000-6999 W2,W4,W5,W9,W10,W16,W17,W19,
W20,W24,W25,W28,W31,W37,W38
= 17(25%)
W9,W15,W17,W18,W19,W20,
W24,W25,W28,W33,W34,W43,
W51 = 13 (19.11%)
7000-10,000 W6,W13,W14,W15,W18,W22,W23,
W43,W51 = 9 (13.23%)
W4,W6,W10,W11,W12,W13,
W14,W22,W23 = 9 (13.23%)
Over 10,000 W 12 = 1(1.47 %) Nil
It is observed that 6(8.82%) samples in pre monsoon and 9(13.23%) samples in post monsoon
season show less than 1000 µS/cm indicating relatively low level of salinity. Such type of
groundwater is excellent for all classes of livestock and poultry as per the guidelines18
. These lower
values of EC were observed in the topographically high and well drained areas with non – irrigated
agriculture. The groundwater from this area is suitable for all kinds of livestock. 16(23.52%)
samples in pre monsoon and 18(26.47%) samples in post monsoon where EC is ranging from 1000-
2999µS/m. This type of saline water may cause temporary and mild diarrhea in livestock not
accustomed to them or watery droppings in poultry but not affecting their health or performance18
.
19(27.94%) samples both in pre-monsoon and post-monsoon seasons in the area show EC in the
range of 3000 to 4999 µS/m as per the guidelines of suitability of water to livestock. This water is
satisfactory for livestock but may cause temporary diarrhea be refused at first by animals. Such type
of water is poor water for poultry, often causing watery feces and increased mortality among the
livestock16
. Higher percentages 17(25%) samples in pre monsoon season belongs to higher salinity
of groundwater i.e. higher EC 5000-6999 µS/m as compared to 13(19.11%) samples in post
monsoon season.
This type of water should not be used for poultry but with reasonable safety can be used for dairy
and beef cattle, sheep, swine and horses. It is advisable to avoid this groundwater for pregnant or
lactating animals. Such type of groundwater is observed in low lying area which are poorly drained
and are under intensive agriculture. 9(13.23%) samples both in pre and post monsoon seasons in the
area show EC of ground water lies in between 7000-10,000µS/cm which is unfit for poultry and
probably for swine. Considerable risk may exist in using these waters for pregnant or lactating cows,
horses, sheep, the young of these species or for any animals subjected to have heat stress or water
loss18
. Only one sample (Sr. No. W12) in pre monsoon season show EC higher than 10000 µS/cm
which is in the downstream part of river. This water is highly saline which cannot be recommended

Vol. 6 | No.3 | 245-257| July- September | 2013
WATER QUALITY WITH REGARD TO LIVESTOCK USE K.K. Deshmukh 252
for the use for livestock under any conditions. The cattle when allowed to drink such type of water,
they start suffering from diseases and their pregnancy period is prolonged. Therefore the
groundwater from this area is not suitable for poultry, pigs and dairy cattle.
Hardness of groundwater with regard to livestock use Hardness is caused by divalent metallic cations that react both with soap to form precipitates and
with certain anions to form scale. The principle hardness-causing cations are calcium, magnesium,
strontium, ferrous iron and manganous ions. If the water is already high in salinity, softening the
water through the exchange of divalent cations with sodium may cause problems. Hardness does
not usually affect the palatability or safety of water for livestock. The hardness of livestock waters is
measured in order to determine the amount of calcium and magnesium relative to other salts in
the water16. The hardness in water is also derived largely from contact with the soil and rock
formations. In general, hard waters originate in areas where the topsoil is thick and limestone
formations are present. Soft water originates in areas where the topsoil is thin and limestone
formations are spare or absent19. Water hardness is not necessarily correlated with salinity. Saline
waters can be very soft if they contain low levels of calcium and magnesium. The principle cations
that cause hardness are calcium and magnesium which are usually present at less than 1000 mg/L
in water.
On the basis of hardness, groundwater for livestock commonly classified in terms of degree of hardness into
following categories 19 .
• Soft : < 75 mg/l
• Moderately Hard : 75 – 150 mg/l
• Hard : 150-300 mg/l
• Very Hard : > 300 mg/l
According to above rating the groundwater from the study area are classified. As seen from table 1 &
2, out of 68 samples 2(2.95%) samples in pre monsoon show moderately hard category of
groundwater. 7 (10.20%) samples in pre monsoon season and 2(2.95%) samples in post monsoon
season show hard category type of groundwater. Remaining all the samples i.e. 59 (86.76%) samples
in pre - monsoon and 66 (97.05%) samples in post - monsoon show very hard category type of
groundwater. Hard water has not been demonstrated to have either a positive or negative impact on
poultry performance. If poultry drinking water is softened, care should be taken to balance the
diet for the increased sodium content of the water20
. Although hardness has no effect on water
safety, it can result in the accumulation of scale (mostly magnesium, manganese, iron, and calcium
carbonates) in water delivery equipment. The clogging of pipes and drinkers can lead to reduced
water consumption and its associated problems21
.
Relationship of hardness and alkalinity of groundwater with regards to livestock use Alkalinity in water is a combined measure of bicarbonates, carbonates and hydroxide ions.
Borates, silicates and phosphates are also included, but are usually minor. pH of groundwater
ranges from 7.1 to 8.8 and 7.4 to 8.9 during pre and post monsoon respectively which indicates
weakly to moderately alkaline nature of groundwater. The slight increase of pH can be
attributed to the higher proportion of bicarbonates. In the study area 46(67.64%) samples in post
monsoon out 22(32.35%) samples in pre monsoon have alkalinities less than 500mg/l which are
not harmful where as the remaining samples i.e. 22(32.35%) samples in post monsoon and
46(67.64% samples in pre monsoon have alkalinities greater than 500mg/l which can cause
physiological and digestive upset in livestock22
. The alkalinities are higher in post monsoon than
in pre monsoon indicating concentration dilution effect related to climate. The higher
alkalinities are observed in the areas showing rolling topography (S. No. W61, W62 and W67).

Vol. 6 | No.3 | 245-257| July- September | 2013
WATER QUALITY WITH REGARD TO LIVESTOCK USE K.K. Deshmukh 253
This is possibly due to rock-water interaction. Both silicate weathering of basalt and dissolution
of carbonates (i.e. calcrete) present in the alluvium are potential source of bicarbonates in the
groundwater. Determining both hardness and alkalinity help in interpreting the suitability of water
for use by livestock. This information helps to judge what types of salts are present in the
groundwater, which is important because some salts are more harmful than others16
.
When alkalinity equals hardness, salts of calcium and magnesium combined with carbonates and
bicarbonates are observed. When alkalinity is less than hardness, salts of calcium and magnesium
are more likely to be sulphates (instead of carbonates). Because of an interaction between sulphates
and alkalinity, the laxative effects of high- sulphate water will be more pronounced as alkalinity levels
increase. When alkalinity is greater than hardness, the presence of sodium and potassium salts in
addition to calcium and magnesium are indicated16
.
By using this criterion, it is observed that (Table-1 and 2), the majority of the samples i.e. 65
(95.58%) samples from post monsoon season and 54(79.41%) samples from pre monsoon season
show alkalinity less than hardness. It means that in the study area the presence of salts of
calcium and magnesium are more likely to be sulphates instead of carbonates. 3(4.41%) samples
in post monsoon and 14(20.58%) samples in pre monsoon season show alkalinity greater than
hardness, indicating the presence of sodium and potassium salts in addition to calcium and
magnesium. In pre monsoon season, sodium and potassium in addition to calcium and
magnesium predominates while in post monsoon season, salts of calcium and magnesium are
more likely to be sulphates in the area.
Sodium in groundwater with regard to livestock use The primary symptom of sodium deficiency is loss of appetite. In very hot areas this is particularly
noticeable in cattle. Reduced growth and milk production and decrease in reproduction may also result.
Subsistence on water with a very high sodium content can lead to sodium ion toxicosis, which is
diagnosed by high sodium concentration in plasma, cerebrospinal fluid, or brain tissue23
. Excessive levels
of sodium have a diuretic effect. Studies indicate that a sodium level of 50 mg/L is detrimental to poultry
performance if the sulfate level is also 50 mg/L or higher and the chloride level is 14 mg/L or higher20
.
Sodium sulfate is a well-known laxative. By themselves, magnesium and sodium normally pose little risk
to livestock, but their association with sulfate is a major concern. Water over 800 mg sodium/L can cause
diarrhea and a drop in milk production in dairy cows. High levels of sodium may necessitate adjustments
to rations because chlorine deficiency may result when removing or reducing salt from swine and dairy
rations. In such situation the care should be taken when adjusting rations. Salt may be reduced in swine
diets if the sodium in the water exceeds 400 mg/L3,24
.
The sodium content of the groundwater ranges from 21 to 490 mg/l in pre-monsoon season and 16 to 829
mg/l in post-monsoon season. On the basis of NRC18 guidelines for sodium the groundwater from study
area, it is observed from table 1 and 2 that 9 (13.23%) samples from study area both in pre and post
monsoon have sodium less than 50mg/l which have little risk to poultry. These samples lies in the
upstream part indicates faster circulation of groundwater attributable to physiography of the area. The
remaining 59 (86.76 %) samples both in pre and post monsoon season have sodium greater than 50mg/l
may affect the performance of poultry if sulphate or chloride is high. All samples except one sample (S.
No. W4) from the study area have sodium content less than 800 mg/l. This sample lies in the downstream
part of Pravara River. The groundwater from this area is not suitable for livestock use.
Sulphates in groundwater with regard to livestock use Sulphates are present in groundwater in the form of sodium sulphate, calcium sulphate and
magnesium sulphates. All these have a laxative effect and impart objectionable, bitter taste16
. Many
researchers studied the impact of high sulphate water on animal health and performance25-28
. The
cattle consuming water with 3000mg/l sulfates or greater during the summer at a higher risk of
polioencephalomalacia (PEM)29
. Ruminants consuming high dietary sulphur concentration in
combination with high grain diet are at a particular risk for sulphur associated PEM28
. The negative
Vol. 6 | No.3 | 245-257| July- September | 2013
WATER QUALITY WITH REGARD TO LIVESTOCK USE K.K. Deshmukh 254
response to high - sulphate water does not appear to be as pronounced in grazing cattle. In addition to
sulphur associated PEM, high concentration of sulphates can also contribute to copper deficiencies in
ruminants. Researchers have clearly demonstrated that the consumption of high sulphate water can
result in a decline in liver copper stores in growing cattle. A reduction in copper status can have a
negative impact on the health, growth performance and reduction function of livestock30
.
Keeping this in mind, an attempt has been made to categories sulphate of groundwater from the study
area as per the guidelines to the use of groundwater containing sulphate for livestock and poultry16
.
The sulphate content of the groundwater ranges from 2.4 to 216 mg/l in pre-monsoon and in the post-
monsoon it varies from 19 to 181 mg/l. It is observed from the table that entire samples in the study
area are within the limit specified by National Research Council i.e. less than 250 mg/l. Therefore,
the groundwater is safe for livestock use. The sulphate content above 50mg/l may affect performance
if magnesium and chloride levels are high16
. As far as study area is concerned, it is observed from the
Table-1 and 2 that 9 (13.23%) samples in post – monsoon season and 13 (19.11%) samples in pre
monsoon season have sulphate content less than 50mg/l. The remaining samples have sulphate
content higher than 50mg/l may affect the performance of livestock. Higher sulphate level have a
laxative effect. The sulphate content is higher in post monsoon may be due to action of leaching and
anthropogenic activities. SO4 is not active in summer season because it is mainly derived from
fertilizer sources and farmers do not generally use fertilizer in summer.
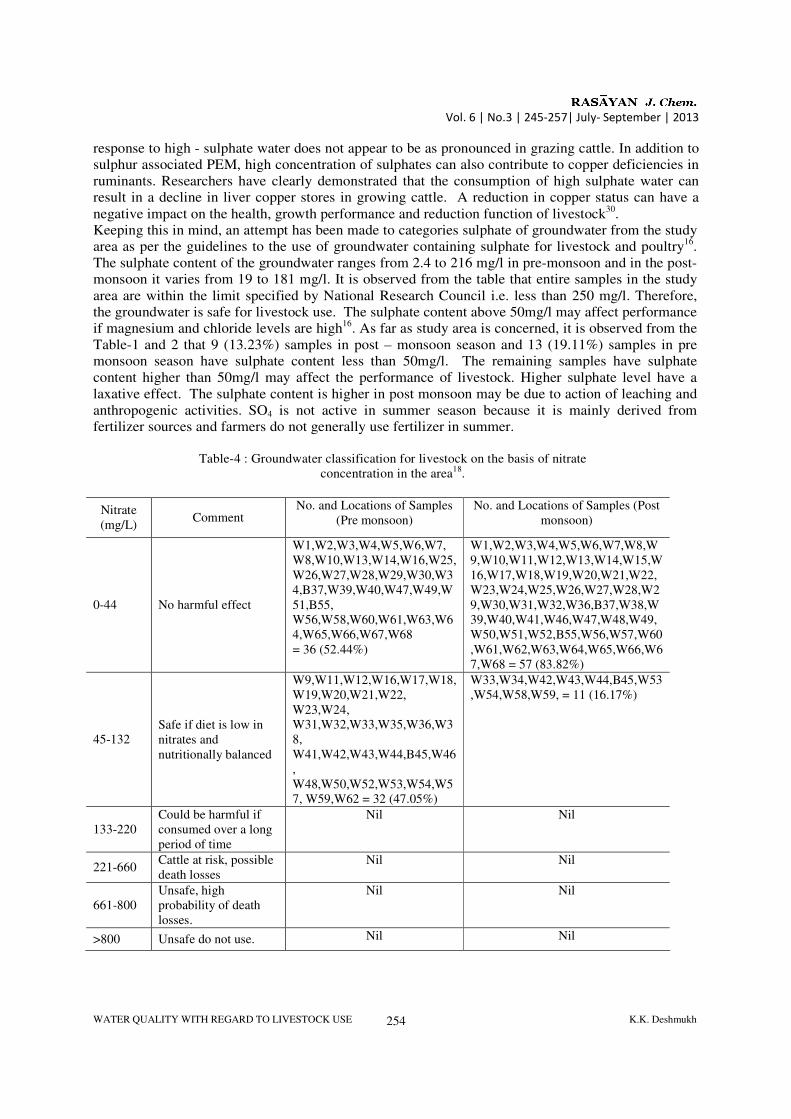
Table-4 : Groundwater classification for livestock on the basis of nitrate
concentration in the area18
.
Nitrate
(mg/L) Comment
No. and Locations of Samples
(Pre monsoon)
No. and Locations of Samples (Post
monsoon)
0-44 No harmful effect
W1,W2,W3,W4,W5,W6,W7,
W8,W10,W13,W14,W16,W25,
W26,W27,W28,W29,W30,W3
4,B37,W39,W40,W47,W49,W
51,B55,
W56,W58,W60,W61,W63,W6
4,W65,W66,W67,W68
= 36 (52.44%)
W1,W2,W3,W4,W5,W6,W7,W8,W
9,W10,W11,W12,W13,W14,W15,W
16,W17,W18,W19,W20,W21,W22,
W23,W24,W25,W26,W27,W28,W2
9,W30,W31,W32,W36,B37,W38,W
39,W40,W41,W46,W47,W48,W49,
W50,W51,W52,B55,W56,W57,W60
,W61,W62,W63,W64,W65,W66,W6
7,W68 = 57 (83.82%)
45-132
Safe if diet is low in
nitrates and
nutritionally balanced
W9,W11,W12,W16,W17,W18,
W19,W20,W21,W22,
W23,W24,
W31,W32,W33,W35,W36,W3
8,
W41,W42,W43,W44,B45,W46
,
W48,W50,W52,W53,W54,W5
7, W59,W62 = 32 (47.05%)
W33,W34,W42,W43,W44,B45,W53
,W54,W58,W59, = 11 (16.17%)
133-220
Could be harmful if
consumed over a long
period of time
Nil Nil
221-660 Cattle at risk, possible
death losses
Nil Nil
661-800
Unsafe, high
probability of death
losses.
Nil Nil
>800 Unsafe do not use. Nil Nil

Vol. 6 | No.3 | 245-257| July- September | 2013
WATER QUALITY WITH REGARD TO LIVESTOCK USE K.K. Deshmukh 255
Nitrates in groundwater with regard to livestock use High concentrations of nitrate in water can poison livestock. Nitrate is almost always found in
higher concentration in water supplies than the more toxic nitrite. In ruminant animals and horses
( which have acecum), bacteria reduce nitrate to nitrite, which enters the bloodstream and
interferes with the ability of haemoglobin to carry oxygen. Animals may die due to lack of oxygen.
In poultry and hogs, which have a more simple stomach than ruminants, bacterial conversion of
nitrate to nitrite occurs but is less of a problem31
. If nitrate concentrations are high in a livestock
water supply and in the animal’s feed, nitrite poisoning is more likely to occur. Feeds like silage or
hay cut during drought can contain high amounts of nitrate.
Symptoms of nitrate poisoning include labored breathing, a blue muzzle, trembling, lack of
coordination, and an inability to stand. If the animals do not die, they can often recover
completely after the nitrate source is removed. Symptoms of acute nitrate toxicity in non-ruminants
include clinical signs of restlessness, frequent urination, dyspnoea and cyanosis. Advanced stage
may include vomiting, ataxia, convulsions, inability to rise and death. Symptoms of
methemoglobinemia include weakness, ataxia, hypersensitivity, dyspnoea, rapid pulse rate, increase
in respiration and urination and cyanosis. Nitrogen – related health problems can often be attributed
to a wasteful use of nitrogen fertilser. This is well documented for certain forages such as midmar
ryegrass (Lolium multiforum) and kikuyu grass (Pennisetum clandestinum). Unadapted and hungry
animals should not be allowed free access to highly fertilizers. Pastures32
.
In the present study, it is found that nitrate concentrations are higher in pre monsoon than in post
monsoon (Table-1 and 2). The nitrate from the ground water in the study area are classified as per
the guidelines of NRC18
(Table-4). It is found that 36 samples (52.44%) and 57 (83.82%) samples in
the pre monsoon and post monsoon respectively have nitrate in the range of 0-44 mg/l which has no
harmful effect (Table-4) as per guidelines of National Research Council18
. 32 samples (47.05%) in
pre monsoon and 11 samples (16.17%) in post monsoon in the area show nitrate concentration in the
range of 45-132 mg/l which is safe if diet is low in nitrates and nutritionally balanced for livestock
(Table-4). Overall nitrate concentration in the study area is not harmful for livestock use. The high
values of nitrate are observed in the irrigated area which can be attributed to excessive use of
chemical fertilizers in the sugarcane cultivating tract.
The groundwater from the villages like Kanoli, Manoli, Rahimpur, Jorve have high concentration of
nitrate (Fig.-1). It is also significant to note that area which is thickly populated with residential
colonies and industrial sector have high nitrate concentration. The farmers from this area are
informed to take care of the livestocks regarding nitrate poisoning.
Climate change and groundwater quality for livestock use Climate change will have a substantial effect on global water availability in the future. Not only will
this affect livestock drinking water resources, but it will also have a bearing on livestock feed
production systems and pasture yield. As climate changes becomes more variable, niches for different
species alter. This may modify animal diets and compromise the ability of small holders to manage
feed deficits33
.
The climate has a profound effect on the soil formation processes as well as Chemistry of water34.
The climate in the study area is characterized by a hot summer and general dryness during major part
of the year excepting during southwest monsoon season. The maximum temperature is as high as
42oC whereas the minimum temperature is as low as 10
oC during winter. As the area falls under the
rain shadow zone of Western Ghats, it receives very low precipitations with the annual rainfall
ranging from 300 to 700 mm. The annual average rainfall is 496.5mm and the distribution is mostly
uneven. Therefore care is to be taken of the livestock during summer season in the area.
CONCLUSIONS In order to evaluate the suitability of groundwater for livestock use, 68 groundwater samples from
Sangamner area were analysed for pH, EC/TDS, alkalinity, hardness, chlorides, sulphates, nitrate and

Vol. 6 | No.3 | 245-257| July- September | 2013
WATER QUALITY WITH REGARD TO LIVESTOCK USE K.K. Deshmukh 256
sodium in pre and post monsoon. The lower values of EC/TDS were observed in the topographically high
and well drained areas with non-irrigated agriculture. The groundwaters from this area are suitable for all
kinds of livestock. The groundwater from the area (Table-3) with EC higher than 7000-10000µS/cm is
unfit for poultry and can be used with considerable risk for pregnant or lactating cows, horses, sheep.
This type of groundwater is observed in low lying areas which are poorly drained and are under intensive
agriculture. Majority of the groundwater samples in the area show very hard category type of
groundwater but it has not shown to have either a positive or negative impact on poultry and other
livestock. But it can result in the accumulation of scale in water delivery equipments. Hardness and
alkalinity of groundwater both help to determine complete interpretation of suitability of groundwater for
livestock use. In the study area, the majority of the samples showed alkalinity greater than hardness
indicating presence of salts of calcium and magnesium predominating sulphates instead of carbonates.
The majority of the samples in the area in pre and post monsoon season have sodium greater than 50mg/l
which affect the performance of poultry when sulphate and chloride is high in the groundwater. The
sulphate in the study area is higher than 50mg/l in the majority of the groundwater samples which affect
the performance of livestock. The sulphate found to be higher in post monsoon season than in pre
monsoon. In the study area, nitrate concentration are higher in pre monsoon than in post monsoon. The
nitrate in the study area is not harmful for livestock. The higher nitrate concentration is observed in the
irrigated area which can be attributed to excessive use of chemical fertilizers in the sugarcane cultivating
tract. The hot summer and dryness in the area is found to affect the health of livestock.
Remedial measures Considering the importance of livestock in maintaining the rural economy of the area, the following
remedial measures can be suggested.
• Frequent chlorination of wells at regular interval should be done to fight bacteriological menace
and to make the water potable for human and livestock use.
• Prohibit access to cattle / livestock near the storage of water / water pumps.
• Supplying drinking water should be located, designed and constructed in such a way that the
groundwater is protected from contamination and wells are used and maintained in a hygienic
manner. The well construction should be improved to avoid the possibility of recharge by polluted
water through the well lining.
• The education must receive due priority to farmers regarding the better use of groundwater for
livestock which are the wealth of our nation.
REFERENCES
1. P Mathur and P Tomer, Int. J. Chem. Sci, 9 (3), 1319(2011).
2. N.J. Pawar, G.L. Pondhe and S.F. Patil, Environ. Geol. 34(8), 1165(1998).
3. J.F. Patience, J. McLeese and M.L. Tremblay, Water quality implication for pork production,
Proceedings of the 10th Western Nutrition Conference, Sasktoon, Saskatchewan, (1989).
4. J.P. Sykes, Animals, fowl and water, Year Book of Agriculture, USDA, Washington D.C. (1998).
5. Martin - Queller E., Moreno – D. Mateos, C. Pedrocchi, J. Cervantes and G. Martinez, Environ
Monit Assess, 167, 423(2010).
6. W.J. Showers, C.M. Williams and G.D. Jennings, Int. J. of Poultry Science 5(4), 318(2006).
7. Hao Xiu –Zhen, Zhou Dong-Mei, Chen Hnai-Man and Dong Yuan- Hua, Pedosphere, 18(1),
69(2008).
8. E.A. Clark, Canadian J. of Plant Science, 78, 181(1998).
9. A Ravel, S Brazean, P Berthiaume, P Michel and M Bigras – Poulin, Bio System Engineering,
105, 82(2010).
10. W.C. Darrell Corkel, Schutzman and R. Clint. Hilliard, J. of Toxicology and Environmental
Health, Part A, Current Issues, 67(20-22), 1619 (2004).
11. K.K. Deshmukh, Rasayan Journal Chemistry, 4(4), 770(2011).

Vol. 6 | No.3 | 245-257| July- September | 2013
WATER QUALITY WITH REGARD TO LIVESTOCK USE K.K. Deshmukh 257
12. K.K. Deshmukh, J. Environ, Res. Develop., 7(1), 10(2012).
13. K.K. Deshmukh, Impact of irrigation on the chemistry of groundwater from Sangamner area,
Ph.D. Thesis, University of Pune (2001).
14. M. Rakib Uddin, The natural environment of Pravara River basin and its impact on land
utilization, Ph.D. Thesis, University of Pune (1984).
15. APHA, AWWA and WPCF, Standard methods for the examination of water and waste water,
19th Edition, American Public Health Association (1995).
16. Dave German, Interpretation of water analysis for livestock suitability, U.S. Department of
Agriculture, South Dakota, C274, 3-12 (2008).
17. N.J. Pawar, Hydrology of the Pune metropolis with special referent to chemistry of surface and
groundwater, Ph.D. Thesis, University of Pune (1985).
18. Singler Adam W and J Bander, Suitability of water for livestock, National Research Council,
National Academy Press South Dakota (2004).
19. Sawyer, Clair N and Perry L. McCarty, Chemistry for sanitary Engineers, 2nd
Ed. McGraw Hill
Series in Sanitary Science and Water Resources Engineering, McGraw – Hill, 349-353 (1967).
20. Carter, A. Thomas, E. Ronald, Sneed, Drinking water quality for Poultry, North. Carolina
Cooperative Extension Service (1996).http://www. Bae.ncsu.edu / programs / extension / publicat
/ wqwm/pst42.html.
21. Monitoba, Evaluating water quality for livestock, Monitoba Agriculture, food and Rural
Initiatives (2004).
22. O.E. Olson and D.G. Fox, Great plains beef cattle feeding handbook, GPE – 1401, South Dakota
University, Brookings SD. (1981).
23. D.H. Gould, Polioencephalomalacia, J. Anim. Sci, 76, 309(1998).
24. M.E. Smart, D. McLean and D.A. Christensen, The dietary impact of water quality, Proceedings
of the Tenth Western Nutrition Conference, Saskatoon, Saskkatchewan, (1989).
25. K. Kandylis, J. Dairy Science, 67(21), 79(1984).
26. M.F. Veenhuizen and G.C. Shurson, J. Am. Vet. Med. Assoc., 201, 487(1992).
27. K.E. Tijardes, H.H. Patterson, and B.D. Rops, J. Anim. Sci, 82,113 (2004).
28. National Research Council, Mineral tolerance of animals, 2nd
Ed. National Academy Press,
Washington DC (2005).
29. H.H. Patterson, P.S. Johnson, and W.B. Epperson., Proc. of West. Section of Amer. Soc. of Anim.
Sci., 54,378 (2003).
30. C.L. Wright, J.W. Spears, T.E. Engle, and T.A. Armstrong, Trace Elements in Man and Animals,
10, 759(2000).
31. O.E. Olson and D.G. Fox., Great Plains beef cattle feeding handbook. GPE-1401. South Dakota
State University. Brookings, SD. (1981).
32. R.J. Eckard, J. Grass Coc. South Afri., 7 (3), 174(1990).
33. IFAD (International Fund for Agricultural Development) Enabling poor rural people to overcome
property, Livestock and Climate Change (2010).
34. J.D. Hem, Study and interpretation of chemical characteristic of natural water, U.S. Geol. Surv.
Water Supply Paper No. 2254 (1991).
[RJC-1069/2013]