Embed Size (px)
Citation preview
Evaluation ofGroundwater Characterization
and Modelingat the Pantex Plant
prepared for
STAND
Serious Texans Against Nuclear Dumping
by
George Rice, Hydrogeologist
June 2001

Executive SummaryThis is an evaluation of the U.S. Department of Energy’s (DOE) efforts to characterize and modelgroundwater contamination at the Pantex plant. This evaluation was performed on behalf ofSerious Texans Against Nuclear Dumping (STAND).
The major findings of this evaluation are:
• Contaminants from Pantex have entered the perched aquifer and the Ogallala Aquifer.Contaminants in the perched aquifer have migrated onto private property adjacent to Pantex.
• DOE has not determined the full extent of contamination in either aquifer.
• The investigation of the Ogallala Aquifer at Pantex is inadequate. Site specific data con-cerning important hydraulic and geochemical properties are insufficient or nonexistent.
• DOE’s efforts to estimate background concentrations for the Ogallala Aquifer at Pantexare questionable. DOE has not shown that the background samples it has used arerepresentative of background concentrations at Pantex. DOE is reassessing its evaluationof background concentrations.
• The groundwater modeling performed to date is inadequate. The models used cannot simu-late significant physical processes. Necessary data have not been collected. The modelsare based on questionable assumptions, and do not account for all major contaminants.
• DOE is using contaminant concentrations greater than the Maximum Contaminant Limit(MCLs1) to establish the limits of contamination emanating from Pantex. MCLs are theregulatory standard established to protect human health.
• On numerous occasions between 1992 and 1999 DOE failed to notify the public or regula-tory agencies that it had found concentrations of contaminants in the Ogallala Aquiferabove MCLs.
• DOE has not investigated the hydraulic relationship between the Ogallala Aquifer and theunderlying Dockum Group. DOE has not investigated the possibility that contaminantsfrom Pantex may enter the Dockum Group.
• DOE has not investigated the possibility that groundwater in the vicinity of Pantex Lakemay be affected by wastes it has discharged to the lake.
DOE acknowledges the existence of data gaps in its characterization of groundwater contamina-tion, and inadequacies in its groundwater modeling. It plans to fill some of the data gaps and toimprove the modeling.
iii

Table of Contents
Executive Summary . . . . . . . . . . . . . . . . . . . . . . . . . . . . . . . . . . . . . . . . . . . . . . . . . . . . . . . . . . . . . iii
Introduction . . . . . . . . . . . . . . . . . . . . . . . . . . . . . . . . . . . . . . . . . . . . . . . . . . . . . . . . . . . . . . . . . . . . . 1
Stratigraphy and Groundwater Occurrence . . . . . . . . . . . . . . . . . . . . . . . . . . . . . . . . . . . . . . . . . . . . . 1
Hazardous Materials and Groundwater Contamination . . . . . . . . . . . . . . . . . . . . . . . . . . . . . . . . . . . . 7
Background and the Extent of Contamination and Cleanup . . . . . . . . . . . . . . . . . . . . . . . . . . . . . . . 10
Groundwater Modeling . . . . . . . . . . . . . . . . . . . . . . . . . . . . . . . . . . . . . . . . . . . . . . . . . . . . . . . . . . . 11
Miscellaneous Issues and Data Gaps . . . . . . . . . . . . . . . . . . . . . . . . . . . . . . . . . . . . . . . . . . . . . . . . . 12
Conclusions and Recommendations . . . . . . . . . . . . . . . . . . . . . . . . . . . . . . . . . . . . . . . . . . . . . . . . . 13
Notes . . . . . . . . . . . . . . . . . . . . . . . . . . . . . . . . . . . . . . . . . . . . . . . . . . . . . . . . . . . . . . . . . . . . . . . . . 15
References . . . . . . . . . . . . . . . . . . . . . . . . . . . . . . . . . . . . . . . . . . . . . . . . . . . . . . . . . . . . . . . . . . . . . 20
Appendices
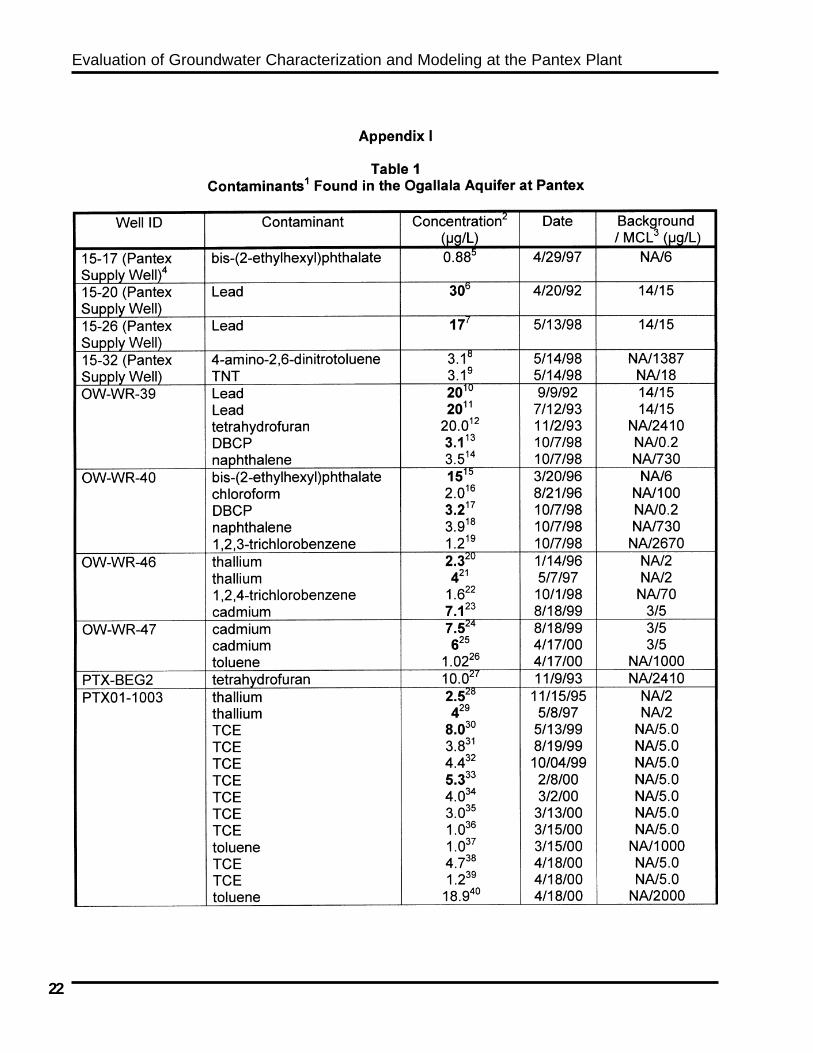
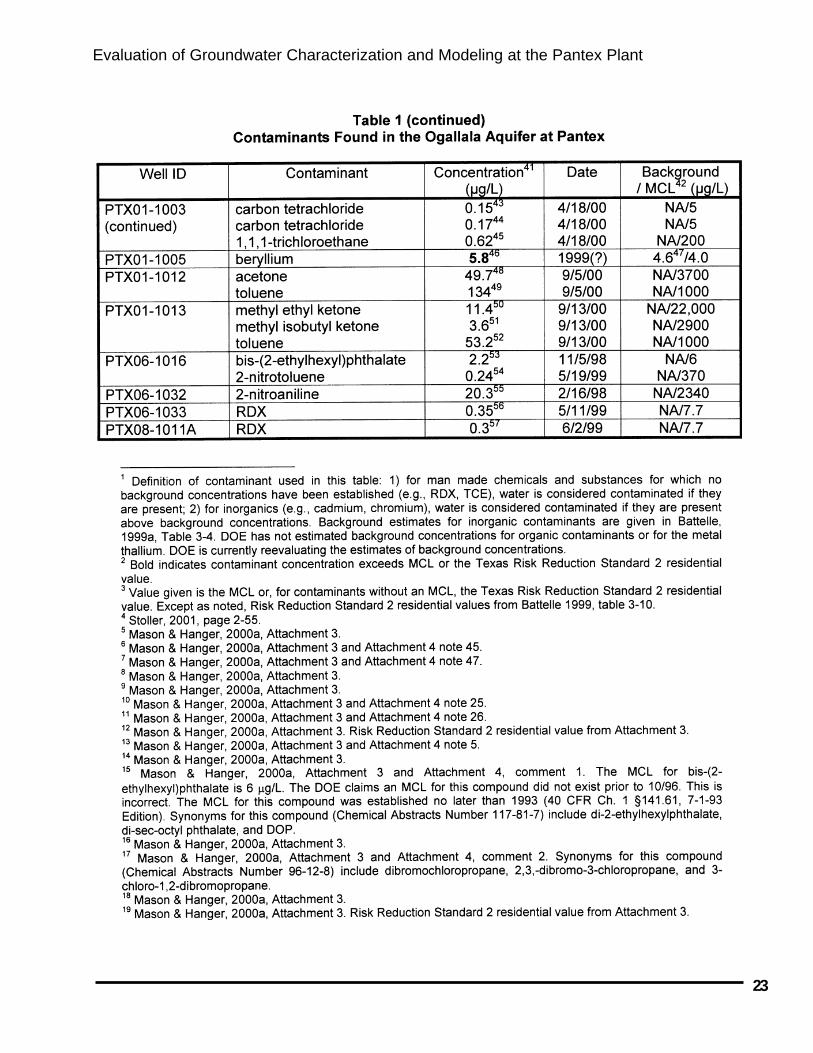
Appendix I, Contaminants Found in the Ogallala Aquifer at Pantex . . . . . . . . . . . . . . . . . . . . . . . . 22
Appendix II, Migration Rates of TCE and Toluene . . . . . . . . . . . . . . . . . . . . . . . . . . . . . . . . . . . . . . 25
List of Figures
1 — Pantex Location Map . . . . . . . . . . . . . . . . . . . . . . . . . . . . . . . . . . . . . . . . . . . . . . . . . . . . . . . . . . 2
2 — Pantex Site Map . . . . . . . . . . . . . . . . . . . . . . . . . . . . . . . . . . . . . . . . . . . . . . . . . . . . . . . . . . . . . . 3
3 — Geologic Column at Pantex . . . . . . . . . . . . . . . . . . . . . . . . . . . . . . . . . . . . . . . . . . . . . . . . . . . . . 4
4 — Groundwater Flow Directions in the Ogallala Aquifer . . . . . . . . . . . . . . . . . . . . . . . . . . . . . . . . 6
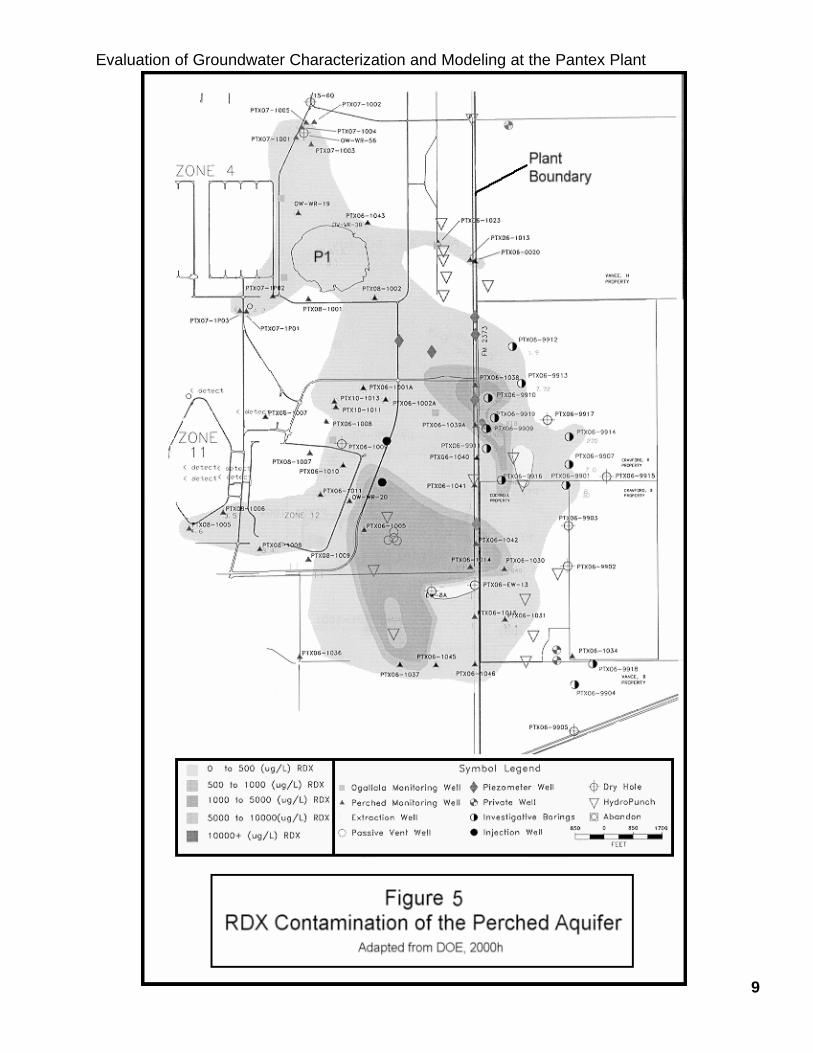
5 — RDX Contamination of the Perched Aquifer . . . . . . . . . . . . . . . . . . . . . . . . . . . . . . . . . . . . . . . . 9
v

Introduction
This evaluation was performed on behalf of Serious Texans Against Nuclear Dumping (STAND), anon-profit organization of concerned citizens. The purpose of this evaluation is to:
• Determine whether the U.S. Department of Energy (DOE) has adequately characterized ground-water contamination at and around Pantex.
• Determine whether the computerized groundwater models used by DOE can adequately simu-late the fate and transport of groundwater contaminants, and predict the effects of remedialactions.
This evaluation is based on reviews of documents, and discussions with DOE and DOE contractorpersonnel2. The documents are listed in the reference section.
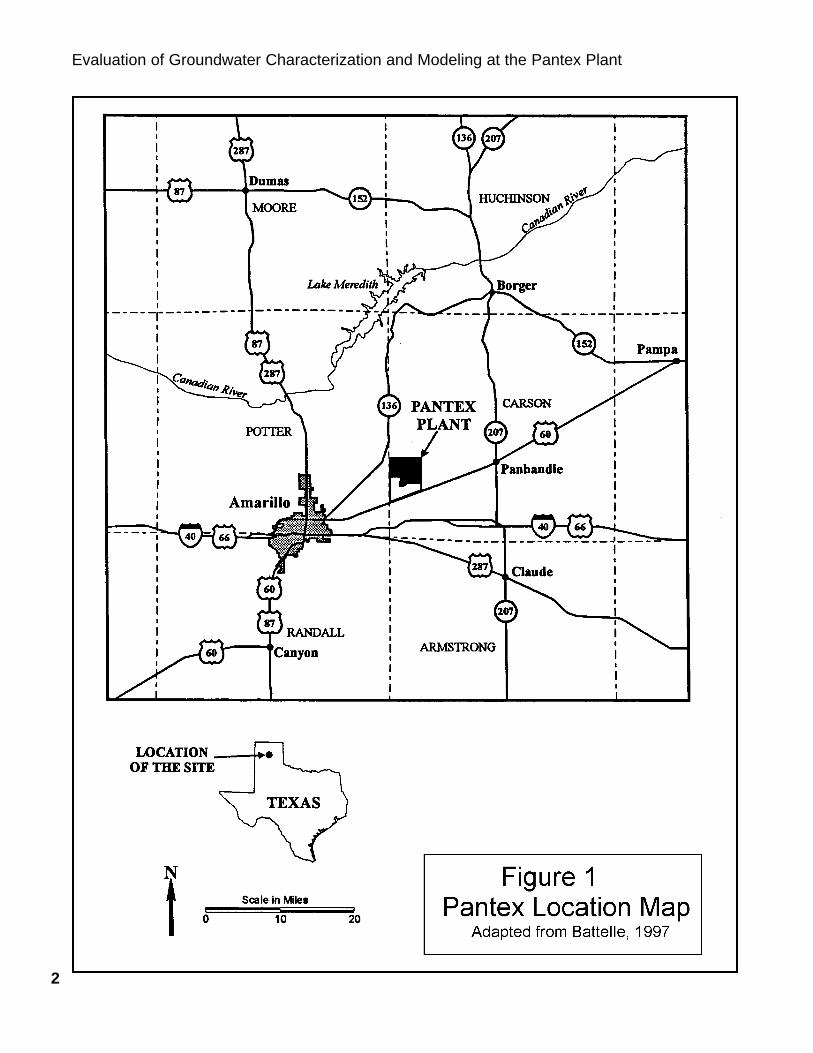
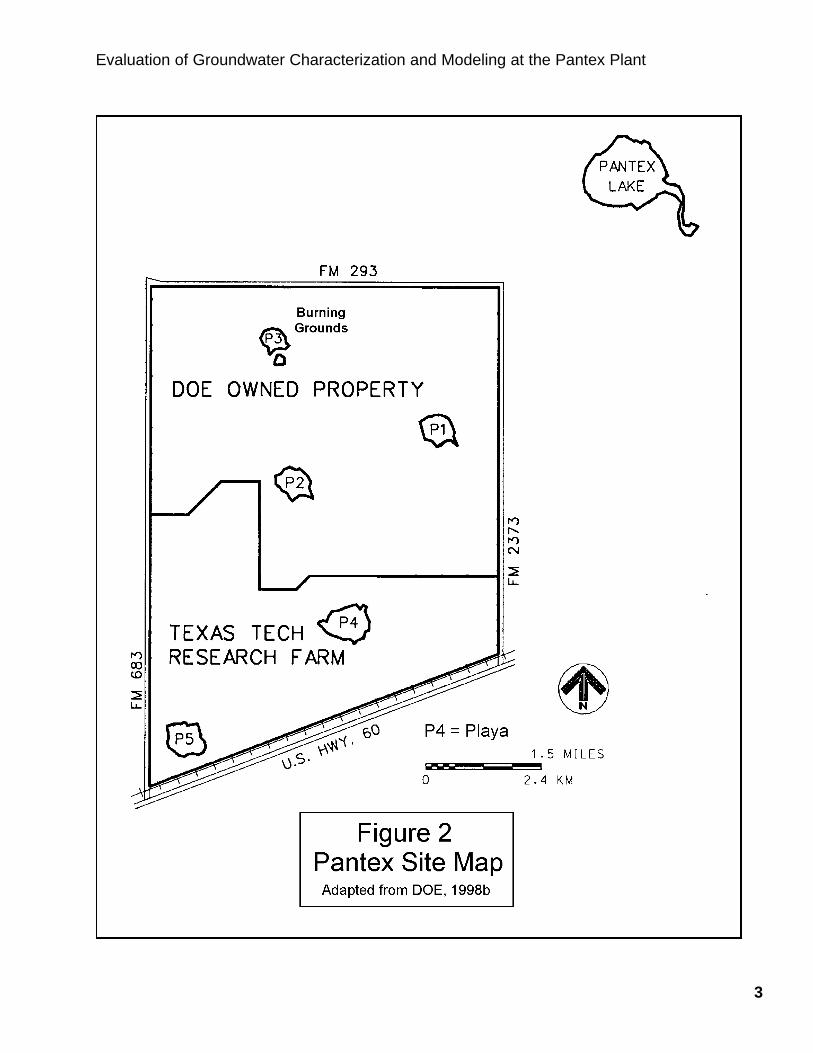
The Pantex plant is 17 miles northeast of Amarillo, Texas. It occupies 15,940 acres (figure 1)3. DuringWorld War II the U.S. Army produced conventional shells and bombs at the plant. Since the early 1950sPantex has been operated by the DOE and its predecessor agencies as a facility to assemble and disas-semble nuclear weapons, and to fabricate and test chemical explosives.4 The plant contains buildingsand industrial structures, a wastewater treatment plant5, landfills, waste disposal pits, borrow pits, andagricultural lands6. There are five playas on the plant-site. DOE also controls Pantex Lake, a playaabout 2.5 miles northeast of the plant7 (figure 2).
Stratigraphyand Groundwater Occurrence
1
Evaluation of Groundwater Characterization and Modeling at the Pantex Plant
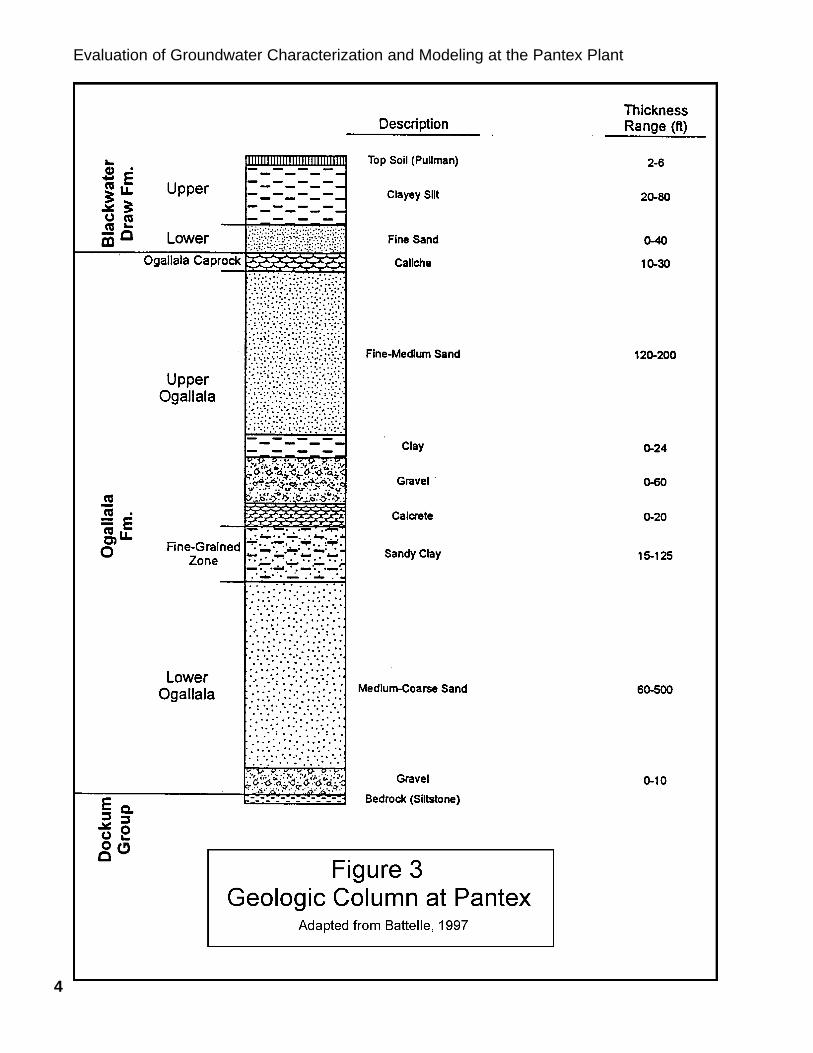
Pantex is underlain by four to six feet of soils.The soils are developed in the Blackwater DrawFormation, a 50 to 80 feet thick sequence of wind-deposited clays, silts, and sands. It does not con-tain groundwater. The Blackwater Draw is under-lain by the Ogallala Formation, a sequence ofclays, silts, sands, and gravels. The thickness ofthe Ogallala ranges from 325 to 725 feet. Thereare two water bearing zones in the Ogallala; aperched aquifer, and the main Ogallala Aquifer8.The Ogallala is underlain by the Dockum Group,a sequence of shale, siltstone, and sandstone (fig-ure 3).The Ogallala Aquifer is also known as theHigh Plains Aquifer9.
The perched aquifer is found at depths rangingfrom 260 to 290 feet below land surface. It existsbecause downward flowing water is impeded bya low permeability ‘fine grained zone’10. The av-erage saturated thickness of water in the perchedaquifer is about 14 feet and the maximum thick-ness is about 75 feet11.
The perched aquifer does not exist beneath all ofPantex. It is absent near the Burning Grounds andin isolated areas along the eastern boundary of theplant12. On the other hand, the full extent of theperched aquifer in the vicinity of Pantex has notbeen completely determined. Its extent to the north
2
Evaluation of Groundwater Characterization and Modeling at the Pantex Plant
3
Evaluation of Groundwater Characterization and Modeling at the Pantex Plant
4
Evaluation of Groundwater Characterization and Modeling at the Pantex Plant
and northeast of the plant is unknown13, and largeportions of the plantsite contain no perched aqui-fer monitor wells (e.g., northwest corner, area westof Playa 2)14.
Flow directions in the perched aquifer are vari-able. Near the western plant boundary groundwa-ter flows southeasterly, onto the plant. In the east-ern portion of the plant, groundwater flows radi-ally (in all directions) from beneath Playa 1, witha significant amount flowing off-site to the eastand southeast15. Recharge is believed to occur pri-marily through playas and ditches that dischargeto the playas16. DOE estimates of groundwater flowrates in the perched aquifer range from 60 to 2700feet per year17. Water may leave the perched aqui-fer by being pumped from wells or by flowingdownward, towardthe Ogallala Aqui-fer. Downward flowmay occur throughhigh permeabilityzones in the finegrained zone, oralong the marginsof the aquifer. Theperched aquifer isused as a source ofdomestic and agri-cultural water18.
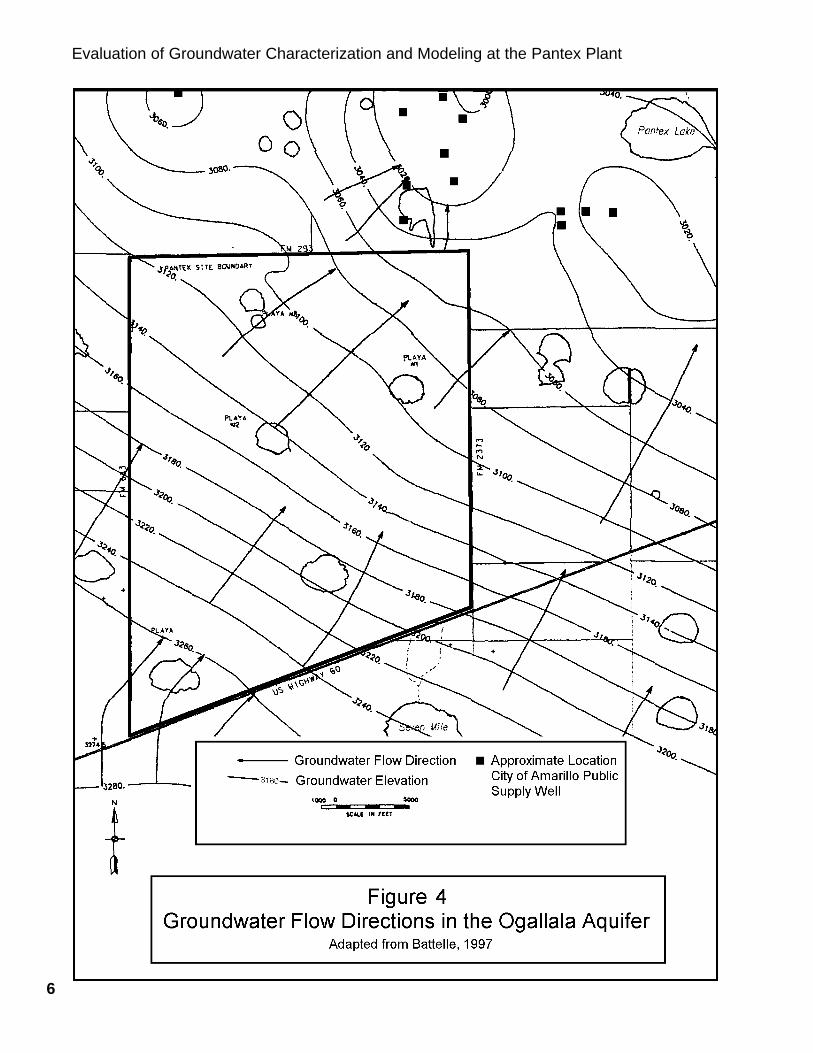
The Ogallala Aquifer is separated from the perchedaquifer by the fine grained zone and unsaturatedsediments. The thickness of the fine grained zoneranges from about ten to 120 feet. The averagethickness is about 50 feet19. The distance betweenthe bottom of the fine grained zone and the watertable of the Ogallala Aquifer varies greatly acrossPantex. In the southern portion of the plant, thewater table of the Ogallala intersects and risesabove the base of the fine grained zone. However,the average distance between the bottom of thefine grained zone and the water table of theOgallala Aquifer is about 120 feet20. The depth ofthe water table ranges from 350 to 425 feet belowland surface21. Groundwater in the Ogallala flowsto the northeast (figure 4). DOE estimates of flowrates range from 20 to 3900 feet per year22. Most
Evaluation of Groundwater Characterization and Modeling at the Pantex Plant
5
of the water in the Ogallala beneath the plant flowsin laterally from the southeast. Additional sourcesof recharge are leakage from the overlying perchedaquifer and, where the perched aquifer is absent,directly from playas23. The amount of leakagefrom the perched aquifer depends on the proper-ties of the underlying fine grained zone. Leakageis likely to be greatest in areas where the finegrained zone is relatively thin, or where it is com-posed of more permeable materials.
The Ogallala Aquifer is the primary source ofgroundwater in the Southern High Plains24. TheCity of Amarillo operates a public supply wellfield in the Ogallala north and northeast of Pantex.The nearest city well is about 2500 feet from theplant25 (figure 4). Landowners near the plant useOgallala water for domestic and agricultural pur-
poses, and theplant obtains itswater from fiveon-site Ogallalawells26.
DOE has installed19 Ogallala moni-tor wells on Pantexproperty, and oneimmediately to theeast of Pantex27.
However, large areas on Pantex contain noOgallala wells. These include the northwest por-tion of the plant, the areas around playas 2 and 4,and the area between the Burning Grounds andthe supply wells in the northeast corner of theplant28.
The Ogallala is underlain by the Dockum Group.This unit is less than 100 feet thick at Pantex29.South of Pantex, water from the Dockum Groupis used for domestic and agricultural purposes30.
The lateral extent and hydraulic properties of theDockum Group at Pantex are unknown. The di-rection of any groundwater flow between theOgallala Aquifer and the Dockum Group is alsounknown31.
. . .the full extent of the perched aquifer in thevicinity of Pantex has not been completelydetermined. Its extent to the north andnortheast of the plant is unknown, and largeportions of the plantsite contain no perchedaquifer monitor wells.
6
Evaluation of Groundwater Characterization and Modeling at the Pantex Plant
Hazardous Materials and GroundwaterContamination32
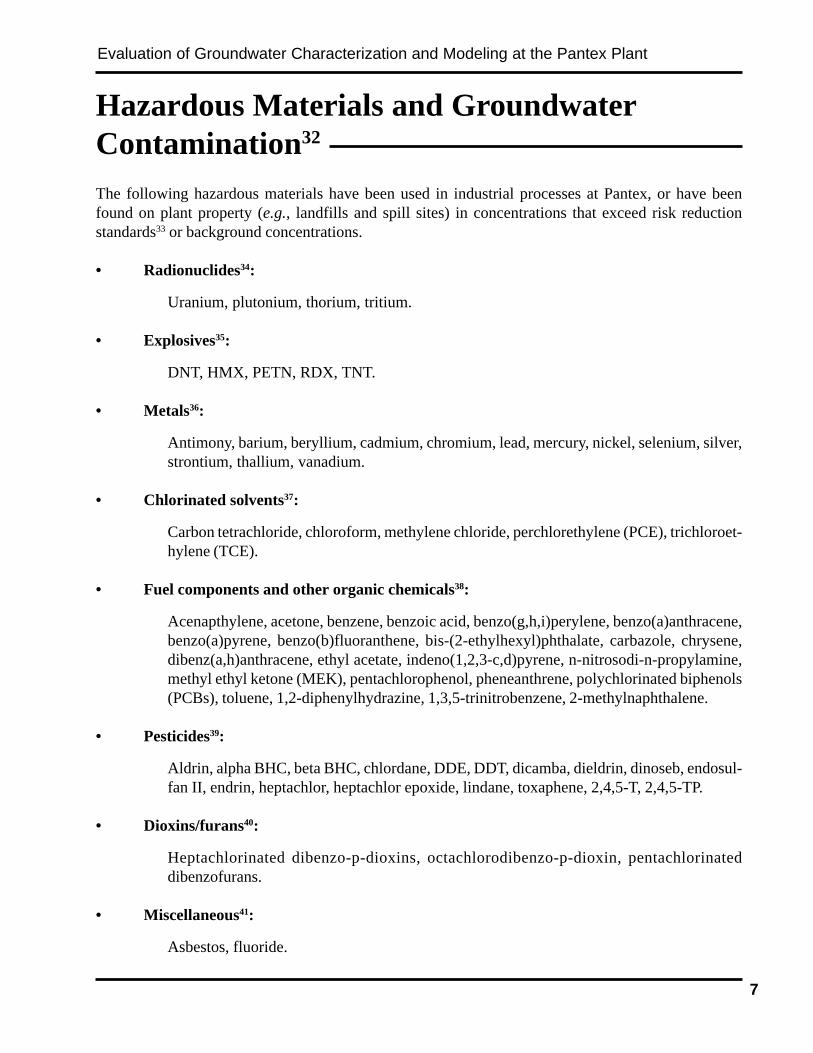
The following hazardous materials have been used in industrial processes at Pantex, or have beenfound on plant property (e.g., landfills and spill sites) in concentrations that exceed risk reductionstandards33 or background concentrations.
• Radionuclides34:
Uranium, plutonium, thorium, tritium.
• Explosives35:
DNT, HMX, PETN, RDX, TNT.
• Metals36:
Antimony, barium, beryllium, cadmium, chromium, lead, mercury, nickel, selenium, silver,strontium, thallium, vanadium.
• Chlorinated solvents37:
Carbon tetrachloride, chloroform, methylene chloride, perchlorethylene (PCE), trichloroet-hylene (TCE).
• Fuel components and other organic chemicals38:
Acenapthylene, acetone, benzene, benzoic acid, benzo(g,h,i)perylene, benzo(a)anthracene,benzo(a)pyrene, benzo(b)fluoranthene, bis-(2-ethylhexyl)phthalate, carbazole, chrysene,dibenz(a,h)anthracene, ethyl acetate, indeno(1,2,3-c,d)pyrene, n-nitrosodi-n-propylamine,methyl ethyl ketone (MEK), pentachlorophenol, pheneanthrene, polychlorinated biphenols(PCBs), toluene, 1,2-diphenylhydrazine, 1,3,5-trinitrobenzene, 2-methylnaphthalene.
• Pesticides39:
Aldrin, alpha BHC, beta BHC, chlordane, DDE, DDT, dicamba, dieldrin, dinoseb, endosul-fan II, endrin, heptachlor, heptachlor epoxide, lindane, toxaphene, 2,4,5-T, 2,4,5-TP.
• Dioxins/furans40:
Heptachlorinated dibenzo-p-dioxins, octachlorodibenzo-p-dioxin, pentachlorinateddibenzofurans.
• Miscellaneous41:
Asbestos, fluoride.
Evaluation of Groundwater Characterization and Modeling at the Pantex Plant
7
In the past, industrial wastes were discharged toall the playas at Pantex42. Explosives, pesticides,metals, PCBs, and volatile organic compoundswere discharged to playas via unlined ditches43.From 1942 to 1970 Pantex Lake received wastesfrom the Old Sewage Treatment Plant (OSTP).The OSTP treated sewage and industrial wastes44.Only Playa 1 continues to receive waste waters,and the wastes are treated before being dischargedto the playa45. All the playas receive stormwaterrunoff 46.
Pantex contains many sites that may have releasedhazardous materials to the environment47. Theseinclude sludge beds, unlined burn pits, subsurfaceleaching beds, pesticide rinse areas, leaking un-derground storage tanks, unlined landfills, wastedrum storage areas, solvent leak sites, acid spillsites, a transformer leak site, and a scrap/salvageyard48. Because hazardous materials have beenused at Pantex for more than 50 years, it is prob-ably not possible to identify all areas where theyhave been handled, stored, spilled, buried, burned,
or dumped; with or without the authorization ofplant officials49.
The perched aquifer beneath the Pantex site iscontaminated with a variety of hazardous sub-stances including: 2,4-DNT, HMX, RDX, TNT,benzene, 1,2-DCA, TCE, PCE, and chromium50.RDX is the most widespread groundwater con-taminant51 (figure 5). Pantex is the source of most,if not all of these contaminants. Contaminatedgroundwater in the perched aquifer has migratedfrom Pantex onto private property adjacent to theplant52. The extent of groundwater contaminationin the perched aquifer has not been completelydetermined53.
Evaluation of Groundwater Characterization and Modeling at the Pantex Plant
In 1996 DOE began cleaning up the perched aqui-fer in the eastern portion of the plant54. Extractionwells pump contaminated water to a treatmentsystem that removes organics, explosives, andchromium. The treated water is injected back intothe perched aquifer. DOE estimates that cleanupof the southeast contaminant plume will be com-pleted in 35 to 55 years55. However, this estimatedoes not appear to include the time required toclean up chromium, a major contaminant in theperched aquifer56.
Many contaminants have been found in theOgallala Aquifer at Pantex, and contaminant con-centrations have exceeded MCLs on numerousoccasions between 1992 and 2000 (see AppendixI). However, until 2000, DOE failed to notify thepublic or regulatory agencies that it had foundconcentrations of contaminants above MCLs.These contaminants include bis(2-ethylhexyl)phthalate57, DBCP58, TCE59, cad-mium60, chromium61, lead62, nickel63, and thal-lium64.
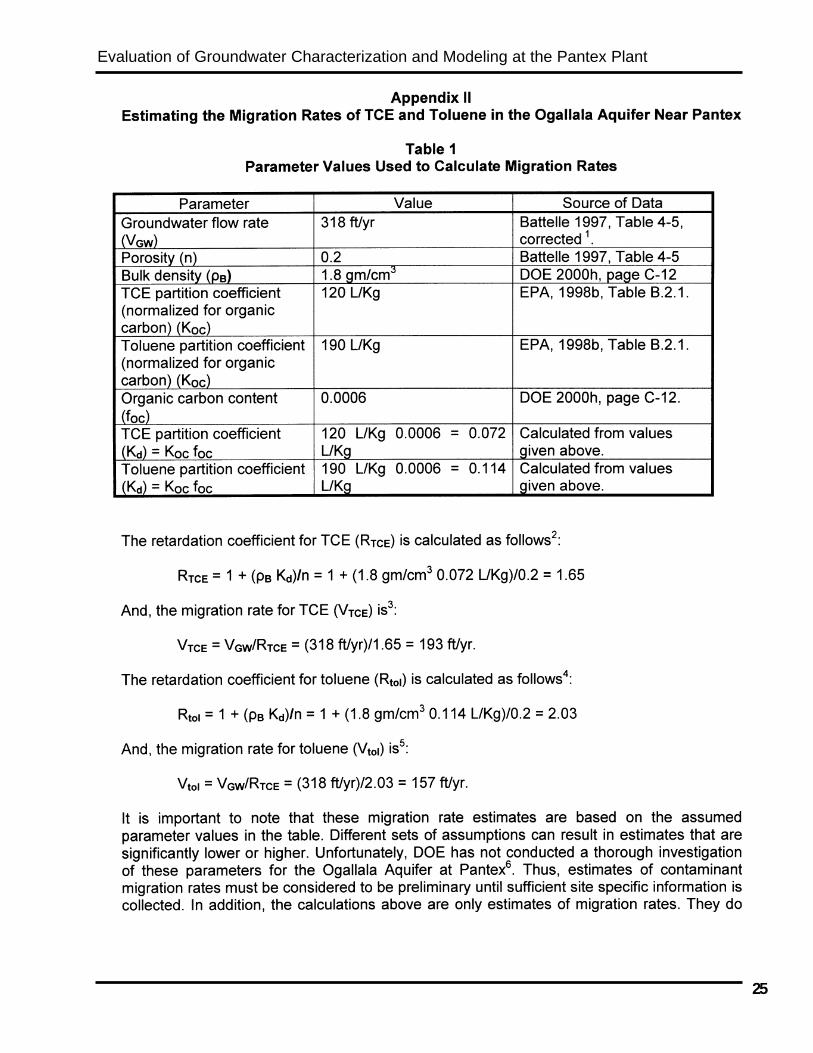
The Ogallala Aquifer at the Burning Grounds (fig-ure 2) is contaminated with cadmium, TCE, andtoluene65. Toluene has also been found in wellsnorth of the Burning Grounds, along the plantboundary66. Groundwater at the Burning Groundsflows toward the City of Amarillo’s well field (seefigure 4). The nearest city well is approximately2500 feet north of the plant67. The migration ratesfor TCE and toluene are estimated to be approxi-mately 200 feet per year, and 150 feet per year,respectively68 (see Appendix II).
The extent of contamination in the Ogallala Aqui-fer is unknown. As mentioned above, large areason Pantex contain no Ogallala wells.
8
However, until 2000, DOE failed to notify the public or regulatory agenciesthat it had found . . . contaminants above MCLs. These contaminants includebis(2-ethylhexyl)phthalate57, DBCP58, TCE59, cadmium60, chromium61, lead62,
nickel63, and thallium64.
Evaluation of Groundwater Characterization and Modeling at the Pantex Plant
9
The methods DOE has used to estimate back-ground concentrations for the Ogallala Aquifer andto estimate the extent of contamination in bothaquifers are described in Final Risk ReductionGuidance to the Pantex Plant RFI70.
DOE intends to use background concentrationsand practical quantitation limits (PQLs)71 to de-termine the extent of contamination and “ … asthe basis on which the extent of acceptable re-sidual contamination is determined.” 72. If the PQLis greater than the background concentration, DOEwill cleanup to the PQL rather than the backgroundconcentration73. Thus, the extent of DOE’s cleanupdepends on their estimates of background concen-trations and on the ability of their laboratories tomeasure the presence of contaminants.
The methods and samples used in the Final RiskReduction Guidance to estimate background con-centrations in the Ogallala Aquifer have led toquestionable results. For example, DOE estimatedthe Pantex background concentration of nitrate (asnitrogen) to be 16.2 mg/L74. This is the highestconcentration found in over 100 Ogallala wells. Itwas found in a well just northwest of Amarillo,approximately 15 miles from Pantex75.
In contrast, the highest nitrate-nitrogen concen-tration found within two miles of Pantex was 7.8mg/L76. Based on this information, it is reason-able to conclude that the background concentra-tion of nitrate-nitrogen at Pantex is something lessthan 8 mg/L, not 16.2 mg/L.
DOE plans to change the wells it uses to estimatebackground concentrations. It has proposed usingsamples from wells in the vicinity of Pantex, anddiscontinuing the use of wells many miles away.However, some of the proposed background wellsare on Pantex property, and others are north ofPantex, in the path of contaminants that may beemanating from the Burning Grounds77.
These wells may be affected, now or in the future,by contaminants from Pantex.
There are also problems associated with the tech-niques DOE is using to collect backgroundsamples for metals.
DOE is collecting unfiltered samples from privateOgallala Aquifer wells near Pantex78. Thesesamples are preserved with acid. Unfiltered watersamples may contain fine sediments that dissolveand release metals when acid is added.
Thus, estimates of metal concentrations that arebased on unfiltered samples may be too high. Theuse of unfiltered samples is appropriate when thepurpose of sampling is to determine what peoplemay be ingesting with their water.
But, when the purpose is to determine the con-centrations of metals being transported by ground-water, filtered samples are more appropriate.
Estimates of background concentrations basedon the new set of background wells have notbeen published.
There are no Ogallala monitor wells between the Burning Grounds and the City of Amarillo wells69.DOE has not investigated the possibility that contaminants from Pantex could enter the underlyingDockum Group.
At this time, there is no reason to believe that contaminants in the Ogallala cannot flow into the Dockum.
Background and the Extent of Contaminationand Cleanup
Evaluation of Groundwater Characterization and Modeling at the Pantex Plant
10
Groundwater ModelingContaminant fate and transport models may be used to predict contaminant flow rates, and to designand predict the effects of groundwater cleanup systems. The evaluation of DOE’s modeling consistedprimarily of reviewing documents describing modeling performed to date. Model input and output fileswere requested from DOE, but have not been provided79.
In 1997 Battelle modeled groundwater flow and contaminant transport in the perched and Ogallalaaquifers80. In 2000 IT Corporation and Battelle modeled the effects of various pump and treat systemson contaminants in the perched aquifer81. The later models were based on the model developed byBattelle in 1997.
Evaluation of Groundwater Characterization and Modeling at the Pantex Plant
11
The modeling performed thus far is inadequate in several respects.
First, the models used82 are incapable of simulating flow and transport through unsaturatedmaterial. The unsaturated zones at Pantex are probably major contaminant pathways, both fromground surface to the perched aquifer, and from the perched aquifer to the Ogallala Aquifer.
Second, the hydraulic and geochemical properties of the Ogallala Aquifer at Pantex have notbeen adequately characterized. Only one measurement of hydraulic conductivity has been per-formed - a single slug test conducted in 199483. No measurements of effective porosity havebeen performed, and only one measurement of organic carbon content has been performed84. Inaddition, little or no site specific information on dispersivities or partition coefficients havebeen collected for either aquifer at Pantex85. Reliable estimates of these properties are requiredin order to produce dependable simulations of contaminant migration rates and the effects ofproposed remedial actions.
Third, the models are based on questionable assumptions.
• The models assume that contaminant sources are no longer contributing contaminantsto the perched aquifer86. There is no reason to believe this is correct.
• The models assume there is no flow between Ogallala and the underlying DockumGroup87. There is no information to show this is correct.
• The models assume the vertical hydraulic conductivity of the fine grained zone beneaththe perched aquifer is uniformly low throughout Pantex88. This may not be correct.Estimates of vertical hydraulic conductivity are based on laboratory tests of coresamples89. However, laboratory tests may not identify field scale features (offset beds,fractures, stream channels) that can significantly increase the hydraulic conductivity ofthe fine grained zone. These localized areas of high conductivity may allow significantamounts of water to flow from the perched aquifer to the Ogallala.
DOE recognizes some of the shortcomings of its modeling efforts93. It has formed the Innovative Tech-nology Remediation Demonstration Pantex Southeast Groundwater Project (ITRD). One of the goalsof the ITRD is to develop improved groundwater models for Pantex94.
Miscellaneous Issues and Data Gaps
Pantex Lake
Wastewater from the OSTP was discharged to Pantex Lake until 197095. DOE has not investigated thepossibility that the wastes may have contaminated groundwater near the lake.
COPCs
DOE does not consider several contaminants to be contaminants of potential concern (COPCs)96, eventhough they have been found in Ogallala Aquifer wells at Pantex in concentrations greater than MCLsor background. These include cadmium, lead, bis(2-ethylhexyl)phthalate, DBCP, and toluene (see Ap-pendix I).
PQLs vs. MCLs
Some of DOE’s PQLs are higher than MCLs. For example, the PQL for thallium is 3 mg/L while theMCL is 2 mg/L; the PQL for vinyl chloride is 10 mg/L while the MCL is 2 mg/L; and the PQL for bis(2-ethylhexyl)phthalate is 10 mg/L while the MCL is 6 mg/L97. Thus, areas that contain contaminantconcentrations higher than MCLs may not be cleaned up, even if they are affected by contaminantsemanating from Pantex.
RDX Degradation Products
DOE does not appear to be analyzing water samples for 1,1-dimethylhydrazine and 1,2-dimethylhydra-zine. These degradation products of RDX98 are believed to be human carcinogens99. In addition, DOE’spreliminary remediation goal (PRG) for RDX is 0.0077 mg/L100. However, the EPA health advisoryguideline for lifetime exposure to RDX is 0.002 mg/L101. DOE should consider reducing the PRG to thehealth advisory guideline.
Evaluation of Groundwater Characterization and Modeling at the Pantex Plant
12
Finally, the modeling of remedial designs for the perched aquifer neglects chromium con-tamination90. Chromium is one of the most widespread contaminants in the perched aquifer91.Because of its geochemical properties it may be more difficult to remove than other contami-nants (e.g., RDX, TCE)92.
Thus, estimates of cleanup times that neglect chromium may be unrealistically optimistic.
Conclusions and Recommendations
Although DOE has been investigating environmental conditions at Pantex since the early 1980s102,significant issues remain unresolved. Serious investigation of the Ogallala Aquifer appears to be justbeginning, even though DOE has found high concentrations of contaminants in the Ogallala since theearly 1990s.
Little is known about the distribution of contaminants within the Ogallala, or about the hydraulic andgeochemical properties that control their distribution. More is known about the perched aquifer, butsignificant data gaps remain.
DOE acknowledges the existence of data gaps and other problems in its characterization and modelingof groundwater contamination at Pantex103. It is developing plans to correct some of these problems.
The following recommendations address the major data gaps and issues identified in this report.
1. More monitor wells are needed in the Ogallala Aquifer. Wells should be installed in the largeareas on Pantex that contain no Ogallala wells. Wells should also be installed north of Pantex,in the potential flow paths of contaminants originating in the Burning Grounds. One purpose ofthese wells would be to detect contaminants before they reached private wells or the City ofAmarillo’s wells.
2. More monitor wells are needed to determine the extent of the perched aquifer, and to deter-mine the extent of contaminants in the perched aquifer. Wells should be installed in the largeareas on Pantex that contain no perched wells, and to the north and east of the plant.
3. DOE should develop reliable estimates of the properties that control groundwater flow andcontaminant transport in all the hydraulic units at Pantex (i.e., the aquifers and unsaturatedzones). These properties include hydraulic conductivity, dispersivity, porosity, bulk density,organic carbon content, and partition coefficients.
4. DOE should redo its evaluation of background water quality for the Ogallala Aquifer104.Background should be determined primarily, if not entirely, from samples collected from Ogallalawells immediately (within a few hundred feet) up gradient of the plant. Because hazardousmaterials may have been used or disposed anywhere on the plant, no background wells shouldbe located on property controlled by DOE or its predecessor agencies. No background samplesshould be collected from wells down gradient of Pantex, as they may be in the flow paths ofcontaminants emanating from the plant.
5. DOE should continue to develop a revised groundwater model for Pantex.
6. The hydraulic relationship between the Ogallala Aquifer and the Dockum Group should bedetermined.
Evaluation of Groundwater Characterization and Modeling at the Pantex Plant
13
7. Groundwater near Pantex Lake should be investigated to determine whether it has beencontaminated by the wastes that DOE discharged to the lake.
8. All contaminants found in Ogallala wells at Pantex in concentrations above background orMCLs should be considered COPCs. All PQLs should be less than MCLs. DOE should moni-tor groundwater for the toxic decomposition products of RDX.
Evaluation of Groundwater Characterization and Modeling at the Pantex Plant
14
Notes
Evaluation of Groundwater Characterization and Modeling at the Pantex Plant
15
1 MCL = Maximum Contaminant Limit, theregulatory standard established to protect humanhealth.
2 DOE, 2001a.
3 Battelle, 1997, page 5.
4 DOE, 1998a, page 2-1.
5 The treatment plant receives both sewage andindustrial effluent. DOE, 2000i, page 2-8.
6 DOE, 2000h, pages 2-11 and 4-2.
7 Battelle, 1997, page 8.
8 Battelle, 1997, pages 10 & 11.
9 DOE 1998a, page 4-1.
10 DOE, 2000f, page 1.
11 Battelle, 1997, page 40.
12 Stoller, 2001, figure 2-15. Note: it is some-times difficult to determine the presence of theperched aquifer. The dry zone shown just northof Zone 12 may have been identified based on awell that was screened above the water table.The dry zone shown in Zone 11 may have beenidentified based on wells that were screened inthe fine grained zone. See Battelle, 1997, page40.
13 Stoller, 2001, figure 2-15.
14 Stoller, 2001, figure 1-19.
15 Battelle, 1997, page 41, Figure 4-10.
16 DOE, 2000h, page C-1.
17 DOE, 2000h, page 4-4.
18 Argonne and Battelle, 1995, page 5-25.
19 DOE, 2000h, page 4-4.
20 DOE, 2000h, pages 4-4 and 4-5.
21 DOE, 2000h, page 2-5.
22 DOE, 2000h, page 4-5.
23 DOE, 2000h, page C-3.
24 DOE, 2000f, page 2.
25 Battelle, 1999a, page 2-6.
26 DOE, 2000h, pages 2-10 and 2-11.
27 Stoller, 2001, page 2-59, table 2-3, figure 2-18, and Appendix B. Total does not include thefive water supply wells on Pantex or the drywell PTX06-1054.
28 Stoller, 2001, figure 1-19.
29 Battelle, 1997, page 13.
30 Battelle, 1997, page 13.
31 DOE, 2000h, page C-9.
32 The definition of contamination used in thisevaluation is: 1) for man made chemicals (e.g.,RDX, TCE), water is considered contaminatedif they are present; 2) for naturally occurringchemicals (e.g., cadmium, chromium), water isconsidered contaminated if they are presentabove background concentrations. A DOEdefinition of the extent of contamination isgiven in the Final Risk Reduction Rule Guid-ance to the Pantex Plant RFI (Battelle, 1999a,page 2-1): “It is proposed that RRS 1 or PQLsbe used to determine the extent of contaminationat the SWMUs under investigation at the PantexPlant.” RRS 1 = background. PQLs = labora-tory practical quantitation limits.
33 Risk reduction standards (RRS) are a set ofregulations promulgated by the State of Texas toprotect health and the environment.
34 DOE, 1998b, Appendix B.
35 DOE, 1998b, Appendix B. Stoller, 2001, page 1-39. DNT = dinitrotoluene, HMX =cyclotetramethylene tetranitramine; PETN = pentaerythrite tetranitrate; RDX = royal demolitionexplosive, cyclotrimethylene trinitramine; TNT = Trinitrotoluene. These explosives are also knownby other synonyms.
36 DOE, 1998a, page 16-10. DOE, 1998b, Appendix B. Stoller, 2001, pages 1-26, 1-43, and 1-69.DOE Public Meeting, 3/5/2001, statement by Boyd Deaver regarding use of thallium at Pantex.
37 DOE, 2000d, page 6. DOE 2000f, page 1. Stoller, 2001, pages 1-54 and 1-83.
38 DOE, 2000d, page 6. DOE 2000f, page 1. Stoller, 2001, pages 1-26, 1-35, 1-43, 1-44, 1-54, 1-56,1-70, 1-75, and 1-83.
39 Stoller, 2001, pages 1-35, 1-43, 1-44, 1-75, 1-76, and 1-77.
40 Stoller, 2001, page 1-35.
41 DOE, 1998a, page 16-10.
42 Battelle, 1997, page 8. The wastes discharged to playa 5 came from the Amarillo Air Base andwere used as a source of irrigation water.
43 DOE, 1999a, page 6. Stoller, 2001, pages 1-49.
44 DOE, 1998a, page 5-5.
45 DOE, 2000h, pages 4-6 and 4-8.
46 Battelle, 1997, page 8.
47 Pantex contains 143 RCRA solid waste management units (SWMUs). Stoller, 2001, page 1-14.
48 EPA, 2000; page 2. Mason & Hanger Corporation, 1993, pages 38 - 40.
49 An example of groundwater contamination occurring where DOE did not expect it is the areasoutheast of Playa 1, between monitor well PTX08-1002 and the plant boundary. In response to aTNRCC comment concerning lack of groundwater information in this area, DOE stated “ It is un-likely that groundwater contamination exists in the perched aquifer in this area due to a lack ofpotential historic or present sources or releases (i.e., Plant production facilities and buildings,drainage ditches, etc.)”. The groundwater in this area was subsequently found to be highly contami-nated with RDX (>2000 µg/L). Stoller, 2001, page 1-145 and figure 4-1.
50 IT, 2000, page 3-1; and DOE 2000f, page 1. 2,4-DNT = 2,4-dinitrotoluene.
51 Stoller, 2001, page 4-3.
52 Battelle, 1997, page 131; and DOE, 2000i, figures 6.4 and 6.5.
53 Stoller, 2001, pages 4-4, 4-10, 4-12, and 4-15. In addition, the distribution of contaminants in theportions of the plant that contain no perched aquifer monitor wells (e.g., northwest corner, area westof Playa 2) is unknown.
Evaluation of Groundwater Characterization and Modeling at the Pantex Plant
16
54 DOE, 2000h, page 2-12.
55 DOE, 2000h, page 2-15.
56 IT, 2000, pages 4-57 – 4-64, and Appendix B.
57 On 3/20/96 15.00 mg/L bis-(2-ethylhexyl)phthalate was found in well OW-WR-40. The MCL forbis-(2-ethylhexyl)phthalate is 6 mg/L. The DOE claims an MCL for this compound did not existprior to 10/96 (Mason & Hanger, 2000a, Attachment 3 and Attachment 4, comment 1). This isincorrect. The MCL for this compound was established no later than 1993 (40 CFR Ch. 1 §141.61,7-1-93 Edition). Synonyms for this compound (Chemical Abstracts Number 117-81-7) include di-2-ethylhexylphthalate, di-sec-octyl phthalate, and DOP.
58 On 10/7/98 3.1 mg/L and 3.2 mg/L DBCP were found in wells OW-WR-39 and OW-WR-40,respectively. The MCL for DBCP is 0.2 mg/L (Mason & Hanger, 2000a, Attachment 3). Synonymsfor this compound (Chemical Abstracts Number 96-12-8) include dibromochloropropane, 2,3,-dibromo-3-chloropropane, and 3-chloro-1,2-dibromopropane.
59 On 5/13/99 8.00 mg/L TCE (trichloroethylene) was found in well PTX01-1003. The MCL for TCEis 5 mg/L (Mason & Hanger, 2000a, Attachment 3).
60 On 8/18/99 7.1 mg/L and 7.5 mg/L cadmium were found in wells OW-WR-46 and OW-WR-47respectively. The MCL for cadmium is 5 mg/L. DOE appears to claim that its contractor did not tellthem of these detections (Mason & Hanger, 2000a, Attachment 3 and Attachment 4 notes 56 and 64).
61 On 8/18/99 2830 mg/L and 3020 mg/L chromium were found in well OW-WR-48 (Note: theseresults represent either two samples from one well, or two analyses of the same sample). The MCLfor chromium is 100 mg/L. DOE appears to claim that its contractor did not tell them of these detec-tions. It is possible that these high concentrations of chromium are due to corrosion of stainless steelwell screen or sampling equipment. DOE is investigating this issue (Mason & Hanger, 2000a, At-tachment 3 and Attachment 4 note 68).
62 Lead has been found in concentrations above Risk Reduction Standard 2 (residential, 15 mg/L) inwells OW-WR-39 (20 mg/L on 9/9/92 and 7/12/93), 15-20 (30 mg/L on 4/20/92), and 15-26 (17 mg/L on 5/13/98). DOE claims it did not know what the regulatory standard for lead was (Mason &Hanger, 2000a, Attachment 3 and Attachment 4 notes 25, 26, 45, and 47).
63 On 8/18/99 214 mg/L nickel was found in well OW-WR-48. The MCL for nickel is 100 mg/L.DOE appears to claim that its contractor did not tell them of this detection. In addition, it is possiblethat the nickel is a result of corrosion of stainless steel well screen or sampling equipment. DOE isinvestigating this issue (Mason & Hanger, 2000a, Attachment 3 and Attachment 4 note 75).
64 On 11/15/95 and 5/8/97 2.5 mg/L and 4 mg/L thallium respectively were found in well PTX01-1003. On 1/14/96 and 5/7/97 2.3 mg/L and 4 mg/L thallium respectively were found in well OW-WR-46. The MCL for thallium is 2 mg/L. DOE appears to claim that its contractor did not tell themof these detections (Mason & Hanger, 2000a, Attachment 3 and Attachment 4 notes 54, 55, 62, and63).
65 DOE, 2000a, page 17, and DOE, 2000c, pages 19 and 29. High concentrations of chromium (> 500ppb; DOE 2000b, page 22) have also been found at the Burning Grounds. However, the source of the
Evaluation of Groundwater Characterization and Modeling at the Pantex Plant
17
chromium may be the well screen or other equipment used to sample the well (DOE 2000b and DOE2000c).
66 DOE Environmental Monitoring Quarterly Report for the third quarter of 2000. On 9/5/2000toluene (123 µg/L - 150 µg/L) was found in three of nine analyses of samples from PTX01-1012. On9/13/2000 toluene (27 µg/L - 71 µg/L) was found in six of six analyses of samples from PTX01-1013.
67 Battelle, 1999a, page 2-6.
68 See Appendix 1.
69 DOE plans to install additional Ogallala Monitor wells on Pantex and between the BurningGrounds and the City of Amarillo wells. DOE 2001a.
70 Battelle 1999a.
71 According to Battelle 1999a, page 2-2, “The PQL represents a practical and routinely achievabledetection limit with a relatively good certainty that any reported value is reliable (APHA et al.,1995).”
72 Battelle 1999a, page ii.
73 Battelle 1999a, page 2-1
74 Battelle, 1999a, page 3-44.
75 Battelle, 1999a, figure 3-5, and pages F-5 – F-7, well 49-309.
76 Battelle, 1999a, figure 3-5, and page F-5, analyses from ten wells. The MCL for nitrate-nitrogen is10 mg/L, EPA 1998a.
77 DOE Public Meeting, 3/5/2001.
78 DOE Public Meeting, 3/5/2001. Note: some samples from private wells may have been collectedfrom faucets. These may be affected by metals or other substances leached from tanks, pipes, orother hardware. Groundwater samples should be collected directly from the well, or as close to thewell as is practical. Samples from faucets are appropriate when their purpose is to determine thequality of water that people are drinking.
79 Model input and output files may be provided in the future. DOE 2001a.
80 Battelle, 1997.
81 IT, 2000.
82 All simulations used the model MODFLOW; US Geological Survey, 1988.
83 DOE 2000h, page C-11.
84 Battelle, 1997, pages 66 and 68.
85 Battelle, 1997, pages 134 and 137.
Evaluation of Groundwater Characterization and Modeling at the Pantex Plant
18
86 Battelle, 1997, page 235; and IT, 2000, page 4-57 and Appendix B.
87 Battelle, 1997, page 60, and IT, 2000, page 4-4.
88 10-7cm/s, Battelle, 1997, pages 83 and 85. The fine grained zone is not a single continuous layer. Itconsists of several interbedded clay lenses: Battelle 1997, page 46.
89 Battelle, 1997, page 64.
90 IT, 2000.
91 IT, 2000, Figure 3-3.
92 Estimates of chromium, RDX (cyclotrimethylene trinitramine), and TCE partition coefficients (14– 1200 [K
d], 63 [K
oc], and 295 [K
oc], respectively) are contained in: Figure 1: 30 TAC § 350.53(e) –
COC Chemical/Physical Parameter Values. For estimates of RDX and TCE retardation factors (1.21and 2.99, respectively) see IT 2000, Appendix B. A different estimate of the TCE retardation factor(1.65) is given in Appendix 1 of this report. It should be noted that the mobility of metals such aschromium may be increased by complexation. The effect of complexation on the mobility of chro-mium at Pantex is unknown.
93 DOE 2000f, pages 2 – 6; and DOE 2000h, page 4-8.
94 ITRD July 11, 2000 meeting minutes.
95 Battelle, 1997, page 8.
96 Stoller, 2001, pages 3-7 through 3-19.
97 Battelle 1999a, pages vi and ix; and EPA 1998a.
98 Battelle, 1997, page 132. 1,1-dimethylhydrazine or 1,2-dimethylhydrazine do not appear in the listof analytes given in DOE, 1999b or DOE, 2000i. Nor were analyses for these compounds found inEnvironmental Monitoring Quarterly Reports for the first, second, or third quarters of 2000. Moni-toring reports available at: http://www.pantex.com/environment/epd/index.htm.
99 ATSDR, 1997, page 3.
100 Battelle, 1999a, page 3-44.
101 ATSDR, 1996, page 3.
102 Stoller, 2001, page 14.
103 Stoller, 2001, chapter 6.
104 Background may be defined as follows: the quality of water that would exist if it had not beenaffected by activities at Pantex. This is not the same as native water quality, which is the quality thatwould exist if it were unaffected by any human activity.
Evaluation of Groundwater Characterization and Modeling at the Pantex Plant
19
References
Argonne National Laboratory and Battelle Memorial Institute, 1995; Draft RCRA Facility Investiga-tion Report for the Groundwater in Zone 12 at the DOE Pantex Plant, November 1995.
ATSDR (Agency for Toxic Substances and Disease Registry), 1996; ToxFAQs for RDX, September1996 (CAS# 121-82-4).
ATSDR (Agency for Toxic Substances and Disease Registry), 1997; ToxFAQs for Hydrazines, Sep-tember 1997, (hydrazine, 1,1-dimethylhydrazine, and 1,2-dimethylhydrazine (CAS#s 302-01-2, 57-14-7, and 540-73-8).
Battelle, 1997; Three-Dimensional (3-D) Groundwater Flow Model and Contaminant Transport Modelfor U.S. Department of Energy Pantex Plant, Draft Final Report, prepared by Battelle Columbus Op-erations, March 17, 1997.
Battelle, 1999a: Final Risk Reduction Rule Guidance to the Pantex Plant RFI, June 1999.
DOE, 1998a; Environmental Information Document, October 1998.
DOE, 1998b; Safety Information Document, October 1998.
DOE 1999a, Final Corrective Action Plan and Response to Self-Assessment of the Pantex GroundWater Project, June 9, 10, and 11, 1999; October 4, 1999.
DOE, 1999b; 1998 Site Environmental Report, DOE/AL/65030-9904.
DOE, 2000a; Pantex Plant Burning Ground Monitoring Data Analysis Report for 1999, April 2000(citation uncertain).
DOE, 2000b; Pantex Plant Burning Ground Monitoring Data Analysis Report for First Quarter 2000(January through March), June 2000.
DOE, 2000c; Pantex Plant Burning Ground Monitoring Data Analysis Report for Second Quarter2000 (April through June), September 2000.
DOE, 2000d; Protecting the Ogallala Aquifer, Recommendations for Characterization of Trichloroet-hylene at the Pantex Burning Grounds, Final Report to the Secretary of Energy, May 5, 2000.
DOE, 2000e; Pantex Ground Water Monitoring and Reporting Program Review, Recommendations forImproving Site-Wide Ground Water Monitoring and Reporting System Procedures at the Pantex Plant,Report to the Secretary of Energy, May 30, 2000.
DOE, 2000f; Protecting the Ogallala Aquifer II, Recommendations for Characterization and Remediationof the Southeastern Plume at the Pantex Plant, June 9, 2000.
DOE, 2000g; Drinking Water Sampling Program for Offsite Domestic/Residential Well Water, Septem-ber 28, 2000.
Evaluation of Groundwater Characterization and Modeling at the Pantex Plant
20
DOE, 2000h; Groundwater Program Management Action Process (GPMAP), June 2000.
DOE, 2000i; 1999 Site Environmental Report for Pantex Plant, May 2000.
DOE 2001a; meeting with DOE and DOE contractor personnel: Joan Bozzone, Jay Childress, BoydDeaver, Tom Hicks, and Dale Stout. Also present: Pam Allison (STAND), Ray Brady (Panhandle Ground-water District), Beverly Gattis (STAND), Robert Musick (TNRCC), Doris Smith (PANAL), Panhandle,Texas, March 5 2001.
DOE Environmental Monitoring Quarterly Reports, posted on the Pantex web site: http://www.pantex.com/environment/epd/index.htm.
DOE Public Meeting Notes, 10/2/2000.
DOE Public Meeting Notes, 12/4/2000.
DOE Public Meeting Notes, 2/8/2001. Meeting cancelled, notes distributed prior to meeting.
DOE Public Meeting, 3/5/2001, presentation and notes.
EPA 1986; Ground-Water Monitoring Technical Enforcement Guidance Document OSWER-9950.1,September 1986.
EPA 1998a; Safe Drinking Water is in Our Hands, Existing Standards and Future Priorities, EPA 815-F-98-007, June 1998.
EPA 1998b; Technical Protocol for Evaluating Natural Attenuation of Chlorinated Solvents in GroundWater, EPA/600/R-98/128, September 1998.
EPA, 2000; Pantex Plant (USDOE) Texas, July 10, 2000.
IT Corporation, 2000; Interim Corrective Measures Design: On-Site Stabilization and Treatment of thePantex Perched Aquifer in the Zone 12 Area by Groundwater Extraction, GAC Filtration, and Chemi-cal Precipitation, Design Basis Document, Prepared by IT Corporation and S.M. Stoller Corporation,August 2000.
ITRD 2000; Innovative Technology Remediation Demonstration, Pantex Southeast Groundwater Project,notes from meetings and conference calls of the Technical Advisory Group.
Mason & Hanger Corporation, 1993; Groundwater Protection Management Program Plan, May 28,1993.
Mason & Hanger Corporation, 2000a; Evaluation of Ogallala Aquifer, Letter and report to Mr. Jerry S.Johnson of DOE, April 10, 2000.
Stoller, S.M. Corporation, 2001; Final FY 2000 Summary and Progress Report for Groundwater Inves-tigations at DOE Pantex Plant, January 29, 2001.
US Geological Survey, 1988; Open-File Report 83-875, A Modular Three-Dimensional Finite-Differ-ence Ground-Water Model.
Evaluation of Groundwater Characterization and Modeling at the Pantex Plant
21
Evaluation of Groundwater Characterization and Modeling at the Pantex Plant
22
Evaluation of Groundwater Characterization and Modeling at the Pantex Plant
23
Evaluation of Groundwater Characterization and Modeling at the Pantex Plant
24
Evaluation of Groundwater Characterization and Modeling at the Pantex Plant
25
Evaluation of Groundwater Characterization and Modeling at the Pantex Plant
26


![Groundwater Investigation and Characterization · Groundwater Investigation and Characterization ... manual for environmental site characterization [2] ... through drilling, well](https://img.pdfslide.us/doc/110x75/5b4001557f8b9a5e528ccc77/groundwater-investigation-and-characterization-groundwater-investigation-and.jpg)