Embed Size (px)
Citation preview

remote sensing
Article
Evaluation of GPM-era Global Satellite PrecipitationProducts over Multiple Complex Terrain Regions
Yagmur Derin 1 , Emmanouil Anagnostou 1,*, Alexis Berne 2, Marco Borga 3,Brice Boudevillain 4, Wouter Buytaert 5, Che-Hao Chang 6, Haonan Chen 7 , Guy Delrieu 4,Yung Chia Hsu 8, Waldo Lavado-Casimiro 9 , Bastian Manz 5, Semu Moges 10,Efthymios I. Nikolopoulos 11 , Dejene Sahlu 12 , Franco Salerno 13 ,Juan-Pablo Rodríguez-Sánchez 14 , Humberto J. Vergara 15 and Koray K. Yilmaz 16
1 Department of Civil and Environmental Engineering, University of Connecticut, Storrs, CT 06269, USA;[email protected]
2 Environmental Remote Sensing Laboratory, École Polytechnique Fédérale de Lausanne, 1015 Lausanne,Switzerland; [email protected]
3 Department of Land, Environment, Agriculture and Forestry, University of Padova, 35139 Padova, Italy;[email protected]
4 Institute of Environmental Geosciences, University of Grenoble Alpes Community, F-38000 Grenoble, France;[email protected] (B.B.); [email protected] (G.D.)
5 Department of Civil and Environmental Engineering, Imperial College London, London SW7 2AZ, UK;[email protected] (W.B.); [email protected] (B.M.)
6 Department of Civil Engineering, National Taipei University of Technology, Taipei 10608, Taiwan;[email protected]
7 Physical Sciences Division of NOAA—Earth System Research Laboratory, Boulder, CO 80301, USA;[email protected]
8 Disaster Prevention and Water Environment Research Center, National Chiao Tung University,Hsinchu 30010, Taiwan; [email protected]
9 Servicio Nacional de Meteorología e Hidrología, Lima 10032, Peru; [email protected] School of Civil and Environmental Engineering, Addis Ababa Institute of Technology, Addis Ababa 1000,
Ethiopia; [email protected] Department of Mechanical and Civil Engineering Florida Institute of Technology Melbourne, Melbourne,
FL 329016975, USA; [email protected] Institute of Disaster Risk Management & Food Security Studies, Bahir Dar University, Bahir Dar 6000,
Ethiopia; [email protected] National Research Council, Water Research Institute, 38930 Brugherio (IRSA-CNR), Italy; [email protected] Department of Civil and Environmental Engineering, Universidad de los Andes, Bogotá 111711, Colombia;
[email protected] Cooperative Institute for Mesoscale Meteorological Studies, The University of Oklahoma, Norman,
OK 73019, USA; [email protected] Department of Geological Engineering, Middle East Technical University, 06531 Ankara, Turkey;
[email protected]* Correspondence: [email protected]; Tel.: +1-860-486-6806
Received: 13 October 2019; Accepted: 2 December 2019; Published: 7 December 2019�����������������
Abstract: The great success of the Tropical Rainfall Measuring Mission (TRMM) and its successorGlobal Precipitation Measurement (GPM) has accelerated the development of global high-resolutionsatellite-based precipitation products (SPP). However, the quantitative accuracy of SPPs has tobe evaluated before using these datasets in water resource applications. This study evaluatesthe following GPM-era and TRMM-era SPPs based on two years (2014–2015) of reference dailyprecipitation data from rain gauge networks in ten mountainous regions: Integrated Multi-SatellitERetrievals for GPM (IMERG, version 05B and version 06B), National Oceanic and AtmosphericAdministration (NOAA)/Climate Prediction Center Morphing Method (CMORPH), Global SatelliteMapping of Precipitation (GSMaP), and Multi-Source Weighted-Ensemble Precipitation (MSWEP),
Remote Sens. 2019, 11, 2936; doi:10.3390/rs11242936 www.mdpi.com/journal/remotesensing

Remote Sens. 2019, 11, 2936 2 of 24
which represents a global precipitation data-blending product. The evaluation is performed at dailyand annual temporal scales, and at 0.1 deg grid resolution. It is shown that GSMaPV07 surpass theperformance of IMERGV06B Final for almost all regions in terms of systematic and random errormetrics. The new orographic rainfall classification in the GSMaPV07 algorithm is able to improvethe detection of orographic rainfall, the rainfall amounts, and error metrics. Moreover, IMERGV05Bshowed significantly better performance, capturing the lighter and heavier precipitation valuescompared to IMERGV06B for almost all regions due to changes conducted to the morphing, wheremotion vectors are derived using total column water vapor for IMERGV06B.
Keywords: satellite-based precipitation product; complex terrain; validation
1. Introduction
To understand and manage water systems under a changing climate and meet the increasingdemand for water, a quantitative understanding of the water cycle at a regional to global scale isimportant. Gaining this understanding requires that precipitation—a fundamental component ofthe water cycle—be studied in detail. Precipitation is the main trigger of natural hazards like floods,landslides, and avalanches over complex terrain, but the measurement of its frequency and quantityover these regions has been very difficult. The small space-time scales and remarkable rain ratesassociated with complex terrain stretch the need for improved quantitative precipitation estimates(QPEs) at high spatiotemporal resolution. In short, an understanding of the specific precipitationformation processes and complex patterns resulting from complex topography and associated verticalgradients is greatly needed.
Rainfall measurement can be conducted at the ground surface—for example, by rain gauge andradar networks—or from space with satellite sensors. While rain gauges provide direct physicalmeasurement of surface rainfall, they are susceptible to sources of uncertainty, such as the size of thecollector, evaporative loss, wind, siting, and so on [1,2]. Furthermore, the sparseness of gauge networksover complex terrain limits the spatial representation of rainfall variability. Weather radar networks,on the other hand, provide rainfall measurement at high spatial and temporal resolutions. They arealso susceptible, however, to certain limitations and errors, especially over mountainous regions,where accuracy tends to degrade as a result of beam overshooting, range effects, beam blockage, andbright band effects [3,4]. In both cases, establishing and maintaining ground-based gauge and radarnetworks is often cost prohibitive, especially in remote parts of the world or regions with limitedfinancial resources. Thus, the observations that are generally available are over lowlands, leavingan observational gap in global precipitation data over complex terrain, where rainfall is typicallycharacterized by high spatial variability leading to small- to medium-scale hydrological events (suchas flash floods). The scarcity of ground-based observations in these regions affects the reliability ofhydrological modeling and water resources assessment [5,6].
The difficulties in the representation of spatial rainfall variability from ground-based observationshighlights the need to use integrated satellite-based precipitation products (SPPs)—that is, combinedinfrared (IR) radiances and passive microwave (PMW) precipitation retrievals—because of their abilityto represent the space-time variability of rainfall with quasi-global coverage. The great success ofthe Tropical Rainfall Measuring Mission (TRMM) has accelerated the development of rain retrievalalgorithms, such as the Goddard profiling algorithm (GPROF) [7]. The PMW algorithms retrieveprecipitation based on the scattering effect in high-frequency channels (equal to or higher than 85 GHz)over land. These estimates are normally characterized by uncertainties, with more pronounced biasesduring extreme events due to the mean observed ratio between ice aloft and the surface rainfall. Thisunderestimation from satellite sensors is more distinct over mountainous regions [8–10] and is oftenattributed to the occurrence of heavy precipitation associated with warm-rain processes [11,12].

Remote Sens. 2019, 11, 2936 3 of 24
In short, the indirect nature of the measurement, the spatial heterogeneity of the precipitationfields, the sensor resolution, the sensor sensitivity, and the retrieval algorithms instigates SPPs tobe susceptible to significant uncertainty. To take advantage of the strengths of both IR and PMW,the most recent algorithms combine IR and PMW observations to create global-scale, multi-satelliteprecipitation products. Well-known products include the Integrated Multi-satellitE Retrievals forGlobal Precipitation Measurement (GPM, IMERG) Early-, Late-, and Final-Run (gauge-adjusted)products. The GPM Core Observatory is an advanced successor to the TRMM satellite, with additionalsensors and channels, like the Dual-frequency Precipitation Radar (DPR) and the GPM MicrowaveImager (GMI), with capabilities to sense light rain and falling snow [13,14]. Other currently distributedproducts are the National Oceanic and Atmospheric Administration (NOAA) Climate Prediction Centermorphing technique (CMORPH) [15] and gauge-adjusted product [16] and the gauge-adjusted GlobalSatellite Mapping of Precipitation (GSMaP) datasets produced at the Earth Observation ResearchCenter (EORC) of the Japan Exploration Agency (JAXA) [17,18].
These SPPs have been evaluated for different continental regimes in the past two decades [19,20].Regional studies have been conducted over the continental United States [21–24], South America [25–28],Europe [29–31], Africa [32–34], and Asia [35,36] by considering various spatial scales, temporal scales,precipitation regimes, and so on. One review of multiple SPPs during the TRMM era to assess theiraccuracy [37] showed that in regions characterized by complex orography, SPP rainfall detection wasweak, and mean error exhibited magnitude dependence. SPPs have, overall, demonstrated largeuncertainties for heavy precipitation events [24,38–40].
In light of this literature, it is now well known that SPPs over complex terrain suffer from varioussources of uncertainty. However, with the aid of error correction procedures it has been shown thatthese datasets can still offer important information for numerous hydrometeorological applications.The authors of one study [41] modeled SPP errors over mountainous terrain by using a well-knownSREM2D model and showed their error model was able to correct SPPs over complex terrain withbetter performance at the daily scale than at the 3-hourly scale. A subsequent study [19] sought tounderstand this by evaluating nine different SPPs (TRMM sensors and algorithms) over nine complexterrains throughout the globe. The present study is an extension of the latter. In it, we evaluateGPM-era sensors and algorithms to gain an understanding of the improvements to them and theirongoing deficiencies.
To address this goal, in this article we evaluate the major global SPPs over multiple regions of theEarth characterized by complex terrain. The products include IMERGV05B, IMERGV06B, CMORPH,GSMaPV07, and Multi-Source Weighted-Ensemble Precipitation (MSWEP) V2.2, and we evaluate themover ten mountainous regions: the Italian and Swiss Alps, the French Cévennes, the western Black Searegion of Turkey, the Colombian Andes, the Peruvian Andes, the U.S. Rocky Mountains, the upperBlue Nile, western Taiwan, the San Francisco Bay area in California, and the Himalayas over Nepal.We conducted the evaluations by taking averages of rain gauge measurements over correspondingSPP native grid resolutions during 2014 and 2015. The performance of the SPPs was assessed usingstatistical measures and visual comparison methods. Section 2 provides the details of the study areaand rain gauges, and Section 3 describes each of the SPPs. Evaluation methodology is presented inSection 4 and the results in Section 5. Section 6 discusses the results and summarizes our conclusions.
2. Study Regions and Rain Gauge Networks
As mentioned above, the study areas involve ten data-rich mountainous ground validation sites.All the regions differ in rain gauge network density and time periods of data record. To make this studyconsistent across different domains, we limit the ground validation datasets to those with daily timeresolution, in which in situ data records span two years (2014–2015) (Table 1). To represent elevationeffects, we divided certain regions into those with lower-elevation rain gauges and higher-elevationrain gauges. It should be noted that since no universal quality control has been applied to the rain

Remote Sens. 2019, 11, 2936 4 of 24
gauge data, their quality most likely varies, which may affect the comparison of results across thedifferent regions.
Table 1. General information on the rain gauge datasets representing the ground validation of thestudy regions.
Region Geographic Extent(Latitude/Longitude)
Number of Gauges(% of Pixel with
Multiple Rain Gauges)Elevation Range (m)
Blue Nile 36.46◦–38.5◦N10.00◦–12.85◦E 56 (9.8%) 1615−3012
Eastern Italian Alps 10.42◦–12.48◦N46.16◦–47.20◦E 57 (16.6%) 212−1950
Swiss Alps 6.00◦–10.50◦N45.80◦–47.78◦E 251 (16.6%) 203−3302
Turkey 31.48◦–34.15◦N40.25◦–41.70◦E 25 (0%) 1−1305
Peruvian Andes 68.65◦–79.93◦S4.96◦–17.60◦W 466 (4.2%) 6−5088
Colombian Andes 72.38◦–78.00◦S0.78◦–7.36◦E 97 (4.3%) 490−3310
Taiwan 120.50◦–120.90◦N23.20◦–23.53◦E 34 (85.7%) 531−2540
Nepal/Himalayas 85.15◦–88.00◦N26.15◦–28.75◦E 11 (22.2%) 497−5600
US Rocky Mountains 103.10◦–123.15◦S31.35◦–48.80◦E 1167 (97.4%) 74−3124
French Cevennes 3.00◦–4.60◦N43.65◦–45.40◦E 432 (42.5%) 1−1567
California 120.18◦–124.11◦S35.38◦–40.97◦E 60 (29.2%) 15−2014
Derin and colleagues [19] have described the climatology of each of the ten study regions. Theycan be briefly characterized as follows:
Taiwan: A tropical climate with annual precipitation exceeding 3300 mm, unevenly distributedthroughout the year.
Swiss Alps: Under the effect of southern circulation from the Mediterranean, which generatesintense precipitation on the southern side of the Alps in the autumn.
Blue Nile: Widely varying topography that strongly influences climate, from cool highlands tohot deserts, with most precipitation occurring in the wet season (June–September), driven by theintertropical convergence zone (ITCZ) that drives the summer monsoon.
Eastern Italian Alps: Steep topographical gradients where the precipitation is primarily attributedto early fall and frontal systems during fall and early winter.
French Cévennes: A largely Mediterranean climate, with annual precipitation totals ranging fromabout 500 mm near the sea to 2000 mm over the mountains.
Turkey: In general, affected in the winter by polar air masses of continental origin of cold Siberianhigh and maritime origin of Iceland low and in the summer by subtropical air masses.
Himalayas: Located in the subtropical zone and influenced by the monsoon system, with localcirculation dominated by a system of mountain and valley breezes.
U.S. Rocky Mountains: A highland (alpine) climate where mean annual precipitation is 522 mm.Peruvian Andes: Precipitation patterns controlled by the interaction of synoptic-scale atmospheric
currents and the complex Andean topography.Colombian Andes: Precipitation represented by a complex interaction of low-level jet stream with
local topography and the ITCZ.

Remote Sens. 2019, 11, 2936 5 of 24
Figure 1 provides mean daily precipitation computed for all days by rain gauge elevation for theten regions. For the Alps, the French Cévennes, and the Blue Nile regions, the rain gauges providesimilar patterns and show no clear elevation-dependent pattern. For the Peruvian Andes, ColombianAndes, U.S. Rocky Mountains, Turkey, and the Himalayas we see a clear decrease in precipitationamounts with increasing elevation. Taiwan and California study sites show increasing precipitationamounts with increasing elevation. For this reason, we divided these regions into two elevation groupsaccording to rain gauges at lower elevations (shown by black dots in the figure) and higher elevations(grey dots) throughout this study.
Remote Sens. 2019, 11, x FOR PEER REVIEW 5 of 24
U.S. Rocky Mountains: A highland (alpine) climate where mean annual precipitation is 522 mm Peruvian Andes: Precipitation patterns controlled by the interaction of synoptic-scale atmospheric
currents and the complex Andean topography Colombian Andes: Precipitation represented by a complex interaction of low-level jet stream with
local topography and the ITCZ Figure 1 provides mean daily precipitation computed for all days by rain gauge elevation for the
ten regions. For the Alps, the French Cévennes, and the Blue Nile regions, the rain gauges provide similar patterns and show no clear elevation-dependent pattern. For the Peruvian Andes, Colombian Andes, U.S. Rocky Mountains, Turkey, and the Himalayas we see a clear decrease in precipitation amounts with increasing elevation. Taiwan and California study sites show increasing precipitation amounts with increasing elevation. For this reason, we divided these regions into two elevation groups according to rain gauges at lower elevations (shown by black dots in the figure) and higher elevations (grey dots) throughout this study.
Figure 1. Geographic location of the study regions and mean daily precipitation (mm/hour) vs. rain gauge elevation (m) for (a) the French Cévennes, (b) the Italian Alps, (c) Turkey, (d) Nepal, (e) Taiwan, (f) the Blue Nile, (g) the Peruvian Andes, (h) the Colombian Andes, (i) California, and (j) the U.S. Rocky Mountains. Faint colors represent higher-elevation rain gauge values.
3. Satellite-Based Precipitation Products
The SPPs evaluated in this study are summarized in Table 2. The five SPPs are based on different techniques applied to PMW and IR measurements, which will be explained in detail in the following sections. IMERGV05B Final, IMERGV06B Final, GSMaPV07 and MSWEP SPPs are gauge corrected. In addition to comparing different products that are gauge corrected, in order to understand the performance of gauge adjustment to the satellite-only products, a comparison between satellite only products and gauge-adjusted products is performed for IMERGV06B Late and GSMaPV07 mvk which are satellite only SPPs.
Table 2. Summary of satellite-based precipitation products (SPPs) used in this study.
Abbreviation Full Name Provider Spatial
Resolution (°) Temporal
Resolution
Figure 1. Geographic location of the study regions and mean daily precipitation (mm/hour) vs. raingauge elevation (m) for (a) the French Cévennes, (b) the Italian Alps, (c) Turkey, (d) Nepal, (e) Taiwan,(f) the Blue Nile, (g) the Peruvian Andes, (h) the Colombian Andes, (i) California, and (j) the U.S. RockyMountains. Faint colors represent higher-elevation rain gauge values.
3. Satellite-Based Precipitation Products
The SPPs evaluated in this study are summarized in Table 2. The five SPPs are based on differenttechniques applied to PMW and IR measurements, which will be explained in detail in the followingsections. IMERGV05B Final, IMERGV06B Final, GSMaPV07 and MSWEP SPPs are gauge corrected.In addition to comparing different products that are gauge corrected, in order to understand theperformance of gauge adjustment to the satellite-only products, a comparison between satellite onlyproducts and gauge-adjusted products is performed for IMERGV06B Late and GSMaPV07 mvk whichare satellite only SPPs.

Remote Sens. 2019, 11, 2936 6 of 24
Table 2. Summary of satellite-based precipitation products (SPPs) used in this study.
Abbreviation Full Name Provider SpatialResolution (◦)
TemporalResolution
IMERGV05B Integrated Multi-satellitERetrievals NASA GSFC 0.1 30-min
IMERGV06B Integrated Multi-satellitERetrievals NASA GSFC 0.1 30-min
GSMaPV07 Global Satellite Mapping ofPrecipitation JAXA 0.1 hourly
CMORPH CPC MORPHing technique V2 NOAA 0.07 30-min
MSWEPV2.2Multi-Source
Weighted-EnsemblePrecipitation
0.1 3-hourly
3.1. Integrated Multi-Satellite Retrievals for GPM (IMERG)
IMERG blends SPP estimates from infrared (IR) and passive microwave (PMW)sensors [14,42]. First, precipitation estimates retrieved from PMW datasets by GPROF are calibratedusing: (i) GPM Combined Radar-Radiometer (CORRA) precipitation estimates, which are derivedfrom GPM Microwave Imager (GMI) and Dual-Frequency Precipitation Radar (DPR); and (ii) GlobalPrecipitation Climatology Project (GPCP) monthly precipitation estimates. These PMW precipitationestimates are blended with the more frequent IR-based Precipitation Estimation from RemotelySensed Information using Artificial Neural Networks-Cloud Classification System (PERSIANN-CCS)algorithm [43] by using CMORPH-Kalman Filter Lagrangian time interpolation [15]. The blendingprocess relies on motion vectors derived from Climate Prediction Center IR (CPC–IR) cloud toptemperature maps to produce half hourly precipitation estimates. This blending technique providesnear–real time estimates at high spatial (0.1◦) and temporal resolution (30 min) with quasi-globalcoverage. As an end product, IMERG produces the separate Early- (4 h after observation), Late- (12 hafter observation), and Final- (2 months after observation) Run products.
IMERG algorithm released four different versions from 2014 to 2019 (version 3, version 4, version 5,and version 6). One of the main differences among these versions is that IMERGV03 and V04 rely onthe use of successively different GPROF algorithms (V03 and V04) meanwhile IMERG V05 and V06 useGPROFV05. The one of the main differences between these GPROF versions is that, GPROFV04 andGPROFV05 included threshold precipitation rate to adjust fractional coverage. Other improvementsfrom IMERG V03, V04 to V05 are: (i) the use Global Precipitation Climatology Project (GPCP) v2.3;(ii) inclusion of the advanced Technology microwave sounder (ATMS) dataset; (iii) dynamic calibrationof PERSIANN-CCS with PMW retrievals; and (iv) removal of GPCC grid box volume adjustment toeliminate blocky gauge adjustment.
Up to IMERGV05B, the Lagrangian time interpolation scheme was computed from the IR data. InIMERGV06, these vectors are computed from Modern-Era Retrospective Reanalysis 2 (MERRA-2) andGoddard Earth Observing System model (GEOS) Forward Processing (FP) data using total columnwater vapor (TQV). IMERGV06B had an upgrade of full intercalibration to GPM combined instrumentdataset (2BCMB) meanwhile IMERGV05B was taking shortcuts. SAPHIR estimates are incorporatedinto IMERG for the first time in V06 and are computed with PRPS. For both V05 and V06, inputprecipitation rates are thresholded at 0.03 mm/h to adjust fractional coverage. Moreover, IMERGV06Bincrease the maximum precipitation rate from 50 to 200 mm/h and it is no longer discrete. In this studywe use IMERG version 6B Late and Final and IMERGV05B Final products. As mentioned, IMERGV06Buses TQV as the variable for deriving the motion vectors. It should be noted that being a verticallyintegrated quantity, TQV is reduced at higher elevations and hence has the possible negative effect oforography [13]. To investigate this issue, in this study we compared IMERGV05B Final product toIMERGV06B Final product. Moreover, in order to understand the rain gauge correction effectiveness,we compared IMERGV06B Final to IMERGV06B Late products.

Remote Sens. 2019, 11, 2936 7 of 24
3.2. CPC MORPHing Technique (CMORPH)
The NOAA Climate Prediction Center (CPC) MORPHing technique [15] provides quasi-globalestimates of precipitation at high spatial and temporal resolution. CMORPH derives precipitationestimates from PMW-only satellite estimates, which are propagated by motion vectors derived fromCPC-IR data [15]. The new version of CMORPH-v1.0 uses a fixed algorithm and homogeneous inputto fix substantial inconsistencies that were present between 2003 and 2006. CMORPH provides asatellite-only version (CMORPH–RAW), a bias-corrected version (CMORPH–CRT), and a satellite-gaugeblended version (CMORPH–BLD). CMORPH-RAW is adjusted using CPC unified gauge-based analysisover land and the pentad GPCP over the ocean to create CMORPH-CRT. CMORPH–CRT is thencombined with the gauge analysis using the optimal interpolation technique to generate CMORPH–BLD.In this study, we used CMORPH-CRT, referring to it as CMORPH, since this product provides 8km30min resolution.
3.3. Global Satellite Mapping of Precipitation (GSMaP)
GSMaP estimates are derived from PMW estimates and propagated by using IR estimates [17].The algorithm retrieves precipitation estimates from PMW datasets; then a Kalman filter model isapplied to refine the precipitation rate propagated using atmospheric moving vectors derived fromCPC–IR data [44], providing hourly precipitation estimates. This product (GSMaP-MVK), calibratedusing CPC, unifies gauge-based analyses of global daily precipitation. In this study, we used the latestversion of GSMaP-MVK, version 07. GSMaPV07 includes the GPM/DPR database and implementssnowfall estimation over high latitudes. In addition, GSMaPV07 includes an improvement of theorographic rain correction method by incorporating variable threshold for orographically-forcedupward vertical motion determined based on the mean horizontal wind, using GPM/DPR observationsas its database, and improving the gauge-correction method both at near-real-time and standardproduct. Improvements to the orographic rain correction method applied in GSMaPV07 algorithmwas able to give a solution to overestimates of orographic rainfall cases over inland regions. However,it has been noted in an earlier study [11] that the separation from tall orographic rainfall and othertypes (other than shallow orographic rainfall) of orographic enhancement have not been detected.
3.4. Multi-Source Weighted-Ensemble Precipitation (MSWEP)
MSWEP merges SPP, reanalysis-based, and gauged-based precipitation products [45,46]. Theproduct, developed specifically to overcome shortages related to the performance of SPP overmountainous, tropical, and snowmelt-driven regions, considers the gauge under-catch and orographiceffects by using a Budyko-based framework and global-coverage runoff observations. The temporalvariability of MSWEP is determined by weighted averaging of precipitation anomalies from sevendatasets: two based solely on interpolation of gauge observations (CPC Unified and GPCC), threeon SPP (CMORPH, GSMaP-MVK, and TMPA 3B42RT), and two on atmospheric model reanalysis(ERA-Interim and JRA-55). For each grid cell, the weights assigned to the gauge-based estimates arecalculated from the gauge network density, while the weights assigned to the SPP and reanalysis arecomputed from their comparative performance at the surrounding gauges. In this study, we usedMSWEPV2.2.
4. Evaluation Methodology
The gauge adjusted SPPs in this study are based on gauge observations from the GlobalPrecipitation Climatology Project (GPCP) monthly rain gauge analysis, developed by the GlobalPrecipitation Climatology Centre (GPCC) [47]. To represent the dependency of our evaluation to thesegauge observations, we acquired the locations of the rain gauges used by GPCC and compared themto the locations of the rain gauges used in this study for ground validation. Table 3 provides thepercentage overlap of our rain gauges with GPCC’s. It should be noted that 97%, 83% and 62% of

Remote Sens. 2019, 11, 2936 8 of 24
the rain gauges for the Swiss Alps, French Cévennes and Himalayas, respectively, are used by GPCC,which means that evaluations of SPPs over these regions are not fully independent to the gauges usedin the gauge adjustment of the SPPs. In the remaining sites, overlap is insignificant, and our SPPs’evaluation results can be considered independent.
Table 3. Percentage of rain gauges used by the Global Precipitation Climatology Centre (GPCC) overeach region.
Regions Overlap (%) Regions Overlap (%)
Blue Nile 7.8 California 13.4Colombia 2.8 South France 83.3Himalayas 62.5 Taiwan 0
NE Italy 37.7 Turkey 24.3Swiss 97.2 Rockies USA 5.2Peru 5.2
The evaluation was conducted at daily and annual time scales at the SPPs’ native spatial resolution.Gauges are interpolated at the SPPs’ grid cells by averaging gauge measurements within commonsatellite grid cells. The analysis excludes satellite grid cells with no overlapping gauges. In Table 1,percentage of pixels with multiple rain gauges is provided to give an insight into the ratio of the pixelswith single rain gauges vs. multiple rain gauges.
We investigated the performance of the different products using quantitative, categorical, andgraphical measures. To obtain an understanding of the performance of the SPPs over the differentregions and elevation groups (representing the lower-elevation and higher-elevation rain gauges), wefirst focused on the mean annual precipitation values. Next, we evaluated the rain occurrences of eachSPP by comparing probability density function (PDF) occurrence of daily precipitation of SPP to therain gauges for each region. We also investigated daily detection capability by calculating normalizedmissed rainfall volume (NMRV) and normalized false alarm satellite rainfall volume (NFASRV) metricsfor each region and each SPP. Finally, we evaluated rain rates by calculating mean relative error (MRE)and centralized root-mean-square error (CRMSE). These error metrics are represented by conditioningto the rain gauge and SPP average quantile intervals—less than 20th quantile; 20th to 40th quantile; 40thto 60th quantile; 60th to 80th quantile; 80th to 95th quantile; and greater than 95th quantile—to analyzeSPP performance for different precipitation exceedance values. The equations for the performancemetrics that were considered are provided below:
MRE =
∑(S−G)∑
G, (1)
and
CRMSE =
√1M
∑[S−G− 1
M∑(S−G)
]2
1M
∑G
, (2)
NMRV =
∑[(G)
∣∣∣G > 0 & S = 0]∑G
, (3)
NFASRV =
∑[(S)
∣∣∣G = 0 & S > 0]∑G
(4)
where S and G represent SPP and rain gauge estimates, respectively, and M represents total number ofdays. The MRE measures the systematic error component with values greater or smaller than zero,indicating over- or underestimation, respectively. CRMSE measures the random component of error,as bias has been removed. The NMRV metric quantifies the missed rainfall volume by SPP, normalizedby the total reference rainfall volume throughout the study period. The NFASRV metric measures

Remote Sens. 2019, 11, 2936 9 of 24
falsely detected rainfall volume by SPP, normalized by the total reference rainfall volume during thesame period of time. A good performance of the SPP would imply low systematic error (that is, MRE),accompanied by low magnitude of the random error component (CRMSE) and accurate rainfall areadetection (low NMRV and NFASRV, expressed in percent hereafter).
5. Results
5.1. Regional Evaluation
Figure 2 provides mean annual precipitation over the ten study regions for IMERGV05B Final,IMERGV06B Final, IMERGV06 Late, GSMaPV07, GSMaPV07 mvk, CMORPH and MSWEP. Thestraight line in the figure represents the mean annual precipitation of the rain gauges over thatregion, and each bar represents a SPP. The lower-elevation and higher-elevation rain gauge elevationgroups are represented by darker- and lighter-colored bars, respectively, for those regions that havebeen subdivided.
Remote Sens. 2019, 11, x FOR PEER REVIEW 9 of 24
rainfall volume during the same period of time. A good performance of the SPP would imply low systematic error (that is, MRE), accompanied by low magnitude of the random error component (CRMSE) and accurate rainfall area detection (low NMRV and NFASRV, expressed in percent hereafter).
5. Results
5.1. Regional Evaluation
Figure 2 provides mean annual precipitation over the ten study regions for IMERGV05B Final, IMERGV06B Final, IMERGV06 Late, GSMaPV07, GSMaPV07 mvk, CMORPH and MSWEP. The straight line in the figure represents the mean annual precipitation of the rain gauges over that region, and each bar represents a SPP. The lower-elevation and higher-elevation rain gauge elevation groups are represented by darker- and lighter-colored bars, respectively, for those regions that have been subdivided.
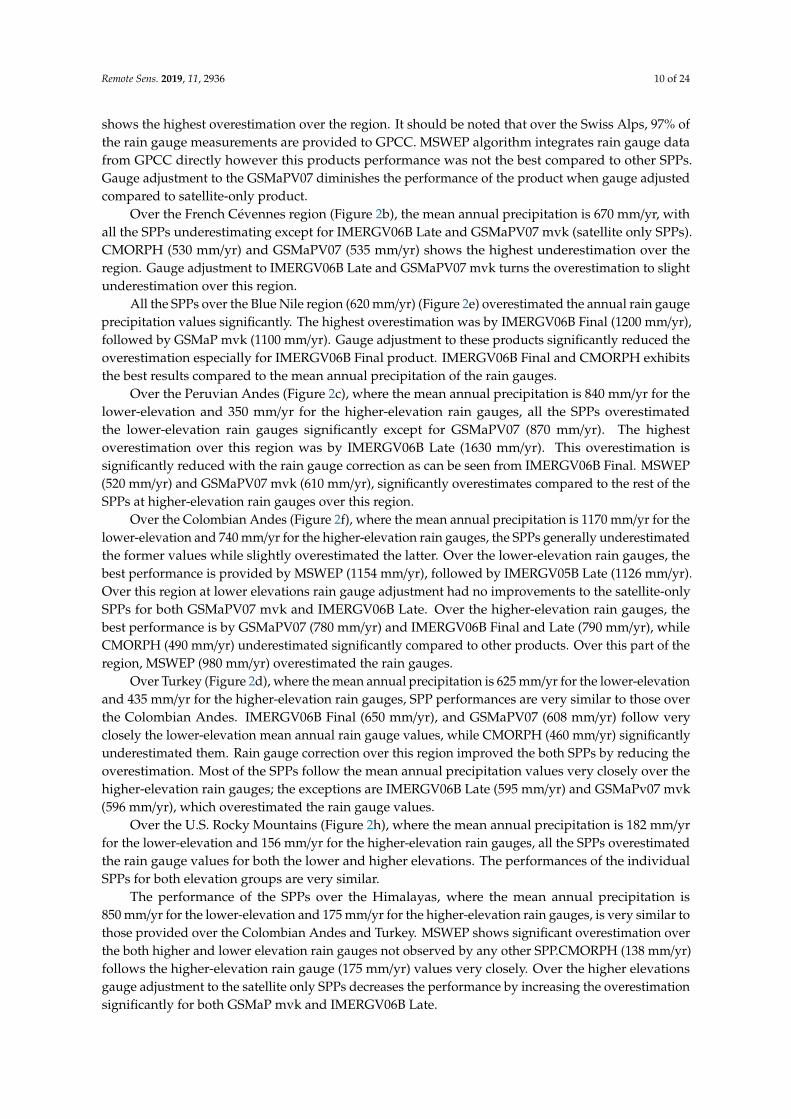
Figure 2. Mean annual precipitation over (a) the Italian Alps, (b) the French Cévennes, (c) the Peruvian Andes, (d) Turkey, (e) the Blue Nile, (f) the Colombian Andes, (g) Taiwan, (h) the U.S. Rocky Mountains, (i) Nepal, and (j) California for IMERGV05B Final, IMERGV06B Final, IMERGV06 Late, Global Satellite Mapping of Precipitation GSMaPV07, GSMaPV07 mvk, CMORPH and MSWEP and for rain gauges (solid black line). For regions that has elevation groups, higher elevations are represented by light grey bars and lower elevations by dark grey bars.
Over the Alps (Figure 2a; the Swiss Alps and North Italian Alps regions are combined) the mean annual precipitation measured by rain gauges is 550 mm/yr, with all the SPPs overestimating the mean annual precipitation compared to the rain gauges with GSMaPV07 mvk being an exception. CMORPH (600mm/yr) and GSMaPV07 mvk (540 mm/yr) performed best, while MSWEP (845 mm/yr) shows the highest overestimation over the region. It should be noted that over the Swiss Alps, 97% of the rain gauge measurements are provided to GPCC. MSWEP algorithm integrates rain gauge data
Figure 2. Mean annual precipitation over (a) the Italian Alps, (b) the French Cévennes, (c) the PeruvianAndes, (d) Turkey, (e) the Blue Nile, (f) the Colombian Andes, (g) Taiwan, (h) the U.S. Rocky Mountains,(i) Nepal, and (j) California for IMERGV05B Final, IMERGV06B Final, IMERGV06 Late, Global SatelliteMapping of Precipitation GSMaPV07, GSMaPV07 mvk, CMORPH and MSWEP and for rain gauges(solid black line). For regions that has elevation groups, higher elevations are represented by light greybars and lower elevations by dark grey bars.
Over the Alps (Figure 2a; the Swiss Alps and North Italian Alps regions are combined) the meanannual precipitation measured by rain gauges is 550 mm/yr, with all the SPPs overestimating themean annual precipitation compared to the rain gauges with GSMaPV07 mvk being an exception.CMORPH (600 mm/yr) and GSMaPV07 mvk (540 mm/yr) performed best, while MSWEP (845 mm/yr)
Remote Sens. 2019, 11, 2936 10 of 24
shows the highest overestimation over the region. It should be noted that over the Swiss Alps, 97% ofthe rain gauge measurements are provided to GPCC. MSWEP algorithm integrates rain gauge datafrom GPCC directly however this products performance was not the best compared to other SPPs.Gauge adjustment to the GSMaPV07 diminishes the performance of the product when gauge adjustedcompared to satellite-only product.
Over the French Cévennes region (Figure 2b), the mean annual precipitation is 670 mm/yr, withall the SPPs underestimating except for IMERGV06B Late and GSMaPV07 mvk (satellite only SPPs).CMORPH (530 mm/yr) and GSMaPV07 (535 mm/yr) shows the highest underestimation over theregion. Gauge adjustment to IMERGV06B Late and GSMaPV07 mvk turns the overestimation to slightunderestimation over this region.
All the SPPs over the Blue Nile region (620 mm/yr) (Figure 2e) overestimated the annual rain gaugeprecipitation values significantly. The highest overestimation was by IMERGV06B Final (1200 mm/yr),followed by GSMaP mvk (1100 mm/yr). Gauge adjustment to these products significantly reduced theoverestimation especially for IMERGV06B Final product. IMERGV06B Final and CMORPH exhibitsthe best results compared to the mean annual precipitation of the rain gauges.
Over the Peruvian Andes (Figure 2c), where the mean annual precipitation is 840 mm/yr for thelower-elevation and 350 mm/yr for the higher-elevation rain gauges, all the SPPs overestimatedthe lower-elevation rain gauges significantly except for GSMaPV07 (870 mm/yr). The highestoverestimation over this region was by IMERGV06B Late (1630 mm/yr). This overestimation issignificantly reduced with the rain gauge correction as can be seen from IMERGV06B Final. MSWEP(520 mm/yr) and GSMaPV07 mvk (610 mm/yr), significantly overestimates compared to the rest of theSPPs at higher-elevation rain gauges over this region.
Over the Colombian Andes (Figure 2f), where the mean annual precipitation is 1170 mm/yr for thelower-elevation and 740 mm/yr for the higher-elevation rain gauges, the SPPs generally underestimatedthe former values while slightly overestimated the latter. Over the lower-elevation rain gauges, thebest performance is provided by MSWEP (1154 mm/yr), followed by IMERGV05B Late (1126 mm/yr).Over this region at lower elevations rain gauge adjustment had no improvements to the satellite-onlySPPs for both GSMaPV07 mvk and IMERGV06B Late. Over the higher-elevation rain gauges, thebest performance is by GSMaPV07 (780 mm/yr) and IMERGV06B Final and Late (790 mm/yr), whileCMORPH (490 mm/yr) underestimated significantly compared to other products. Over this part of theregion, MSWEP (980 mm/yr) overestimated the rain gauges.
Over Turkey (Figure 2d), where the mean annual precipitation is 625 mm/yr for the lower-elevationand 435 mm/yr for the higher-elevation rain gauges, SPP performances are very similar to those overthe Colombian Andes. IMERGV06B Final (650 mm/yr), and GSMaPV07 (608 mm/yr) follow veryclosely the lower-elevation mean annual rain gauge values, while CMORPH (460 mm/yr) significantlyunderestimated them. Rain gauge correction over this region improved the both SPPs by reducing theoverestimation. Most of the SPPs follow the mean annual precipitation values very closely over thehigher-elevation rain gauges; the exceptions are IMERGV06B Late (595 mm/yr) and GSMaPv07 mvk(596 mm/yr), which overestimated the rain gauge values.
Over the U.S. Rocky Mountains (Figure 2h), where the mean annual precipitation is 182 mm/yrfor the lower-elevation and 156 mm/yr for the higher-elevation rain gauges, all the SPPs overestimatedthe rain gauge values for both the lower and higher elevations. The performances of the individualSPPs for both elevation groups are very similar.
The performance of the SPPs over the Himalayas, where the mean annual precipitation is850 mm/yr for the lower-elevation and 175 mm/yr for the higher-elevation rain gauges, is very similar tothose provided over the Colombian Andes and Turkey. MSWEP shows significant overestimation overthe both higher and lower elevation rain gauges not observed by any other SPP.CMORPH (138 mm/yr)follows the higher-elevation rain gauge (175 mm/yr) values very closely. Over the higher elevationsgauge adjustment to the satellite only SPPs decreases the performance by increasing the overestimationsignificantly for both GSMaP mvk and IMERGV06B Late.

Remote Sens. 2019, 11, 2936 11 of 24
The MSWEP (1826 mm/yr) product over Taiwan (Figure 2g), where the mean annual precipitationis 1106 mm/yr for the lower-elevation and 1630 mm/yr for the higher-elevation rain gauges, has highestoverestimation for both elevation groups. On the other hand, the SPPs were not able to capture theincrease in precipitation magnitude with elevation. All the SPPs underestimated the mean annualrain gauge precipitation value significantly over the higher-elevations, with MSWEP (2005 mm/yr)again being an exception by overestimating the precipitation over this elevation group. The rain gaugeadjustment to the satellite-only SPPs improve the performance of GSMaPV07 mvk and IMERGv06BLate over lower elevations meanwhile over higher elevations the performance is reduced significantlywhere underestimation increases compared to mean annual rain gauge values.
The SPP performances over California (Figure 2j), where the mean annual precipitation is280 mm/yr for the lower-elevation and 760 mm/yr for the higher-elevation rain gauges, are very similarto those over Taiwan, where the SPPs are not able to capture the increase in mean annual precipitationwith increasing elevations.
Overall, the SPP performances for regions that are not divided into two elevation groups (the Alps,the French Cévennes, and the Blue Nile) are very similar—that is, over the Alps and the Blue Nile theygenerally overestimate, and for the French Cévennes they generally underestimate. For these regions,CMORPH follows the mean annual rain gauge values very closely, while MSWEP, IMERGV06B Lateand GSMaPV07 mvk overestimate the most of all the SPPs.
To summarize, the performance of MSWEP is similar to that of IMERGV06B Late and GSMaPV07mvk, both of which are satellite-only SPPs, and MSWEP has gone through rain gauge correction.On the other hand, the IMERGV06B Final performance has improvement over lower elevationgroups compared to IMERGV06B Late similar with GSMaPV07 and GSMaPV07 mvk products. Theperformances over the Colombian Andes, Turkey, and the Himalayas are very similar, with the SPPsunderestimating (with exceptions) the lower-elevation mean annual rain gauge precipitation valuesand overestimating (with exceptions) the higher-elevation values. In general, the SPPs are able tocapture well the decrease in precipitation amounts between the lower- and higher-elevation elevationgroups. They are not, however, able to capture the increase in precipitation values between the lower-and higher-elevation groups of the Taiwan and California regions.
5.2. Evaluation of Rain Occurences
In this section, we report our evaluation of rain occurrence in an effort to understand thespatiotemporal variability of precipitation and the dependence of estimation errors on SPP precipitationrates. Figure 3 provides the frequency of occurrence of daily precipitation for different precipitationintensities of the rain gauges. Rainfall intensities are based on reference rainfall and shown at intervalsof 0–0.5, 0.5–1, 1–2, 2–5, 5–10, 10–20, and greater than 20 mm/h. In the figure, rain gauge probabilitydistribution is shown by grey bars, and each line represents a different SPP for each of the ten differentregions. For this analysis, each region that was subdivided into two elevation groups is regroupedinto one. Not shown here, but, no elevation dependence was found on the rain occurrence of thedifferent products.

Remote Sens. 2019, 11, 2936 12 of 24
Remote Sens. 2019, 11, x FOR PEER REVIEW 12 of 24
Figure 3. Probability density functions (PDFs) by occurrence of daily precipitation for cases with different intensities for all SPPs over (a) the Italian Alps, (b) the French Cévennes, (c) the Peruvian Andes, (d) Turkey, (e) the Blue Nile, (f) the Colombian Andes, (g) Taiwan, (h) the U.S. Rocky Mountains, (i) Nepal, and (j) California.
Over the Alps (Figure 3a), MSWEP captures the rain gauge distribution trend exceptionally well. As already mentioned, the region designated as “the Alps” incorporates rain gauges from the Eastern Italian Alps and the Swiss Alps. GPCC uses 97% of the rain gauges over the Swiss Alps, which could explain the exceptional performance of MSWEP over this region. The CMOPRH and GSMaPV07 products underestimate the lowest precipitation frequencies. It should be noted that GSMaPV07 has the highest overestimation in the 2–5 mm/hr precipitation interval. The gauge adjustment to the GSMaPV07 mvk product turns the significant overestimation of light precipitation frequencies to significant underestimation meanwhile for the 2–20 mm/hr precipitation interval gauge adjustment deteriorate the performance of the product exhibiting significant overestimation. The gauge adjustment to the IMERGV06B Late product on the other hand, reduces the significant overestimation of the light precipitation frequencies but has not much affect for the rest of the distribution. Most importantly, IMERGV05B Final product has exceptional performance capturing the rain gauge frequencies in all ranges which is significantly deteriorated when compared to IMERGV06B Final product especially for lighter precipitation frequencies.
Figure 3. Probability density functions (PDFs) by occurrence of daily precipitation for cases withdifferent intensities for all SPPs over (a) the Italian Alps, (b) the French Cévennes, (c) the PeruvianAndes, (d) Turkey, (e) the Blue Nile, (f) the Colombian Andes, (g) Taiwan, (h) the U.S. Rocky Mountains,(i) Nepal, and (j) California.
As Figure 3 shows, rain gauge daily precipitation distribution is, in general, very similar for theAlps, the French Cévennes, Turkey, and the Himalayas. Over these regions, occurrence frequencyvalues of the lowest precipitation (0 < R ≤ 0.5) and moderate precipitation (2 < R ≤ 5) are most frequentthan adjacent intervals. Moreover, the highest precipitation values (R > 20 and 0.5 < R ≤ 1) are lessfrequent compared to the rest of the intervals. The SPPs in general capture the trend of the PDF, withthe exceptions.
Distributions over the Peruvian Andes, the Colombian Andes, and the Blue Nile are very similar toeach other, with a clear mode observed at moderate precipitation values (2 < R ≤ 5). SPP performancesfor the Blue Nile are exceptional, while, on the other hand, the SPPs significantly overestimate thelowest precipitation frequencies for the Peruvian Andes and the Colombian Andes.
Over Taiwan and California, the rain gauge distributions are very similar to one another, withclear modes observed at the highest precipitation values. In general, all the SPPs over these two

Remote Sens. 2019, 11, 2936 13 of 24
regions are able to capture the trend of the rain gauge frequencies, except for IMERGV06B Final andIMERGV06B Late over the California region.
Over the Alps (Figure 3a), MSWEP captures the rain gauge distribution trend exceptionally well.As already mentioned, the region designated as “the Alps” incorporates rain gauges from the EasternItalian Alps and the Swiss Alps. GPCC uses 97% of the rain gauges over the Swiss Alps, which couldexplain the exceptional performance of MSWEP over this region. The CMOPRH and GSMaPV07products underestimate the lowest precipitation frequencies. It should be noted that GSMaPV07has the highest overestimation in the 2–5 mm/h precipitation interval. The gauge adjustment to theGSMaPV07 mvk product turns the significant overestimation of light precipitation frequencies tosignificant underestimation meanwhile for the 2–20 mm/h precipitation interval gauge adjustmentdeteriorate the performance of the product exhibiting significant overestimation. The gauge adjustmentto the IMERGV06B Late product on the other hand, reduces the significant overestimation of the lightprecipitation frequencies but has not much affect for the rest of the distribution. Most importantly,IMERGV05B Final product has exceptional performance capturing the rain gauge frequencies in allranges which is significantly deteriorated when compared to IMERGV06B Final product especially forlighter precipitation frequencies.
Over Turkey (Figure 3d), IMERGV06B Final and Late overestimate the lowest precipitation rangefrequency and underestimate the rest of the ranges, meanwhile IMERGV05B follows the rain gaugedistribution very closely in all ranges. The gauge adjustment does not provide any improvement forIMERGV06B product and its performance compared to IMERGV05B significantly low.
IMERGV06B and IMERGV05B Final products follows the rain gauge distribution trend very closelyover the Himalayas (Figure 3i), with the exception of the lowest precipitation range frequency, whereIMERGV06B significantly overestimates. Gauge adjustment to the IMERGV06B Late product improvesthe strong overestimation (underestimation) of the frequencies observed for low (high) precipitationranges. GSMaPV07 in general follows the trend of overestimating the lowest precipitation rangefrequencies and underestimating the highest, while MSWEP underestimates the lower precipitationvalue frequencies and significantly overestimates the highest precipitation value frequencies. Gaugeadjustment to the GSMaPV07 mvk product significantly improves the lower precipitation valuefrequencies while turns the underestimation of the medium precipitation value frequencies toan overestimation.
Over the Peruvian Andes, the SPPs are unable to capture the rain gauge precipitation frequencytrend. All SPPs significantly overestimate the lowest precipitation range and underestimate themedium to high precipitation range frequencies. Over this region rain gauge correction for bothproducts does not introduce any improvements.
Over the Colombian Andes (Figure 3f), the SPPs are similarly unable to capture the rain gaugeprecipitation frequency trend except CMORPH and GSMaPV07. GSMaPV07 follows the rain gaugefrequency closely for the 0.5–10 mm/h ranges, showing better performance than the rest of the SPPs. Thegauge adjustment to the GSMaPV07 mvk improved significantly at all precipitation value frequencies.
Over the Blue Nile (Figure 3e), all SPPs follow the low to medium range rain gauge frequency trendclosely with slight overestimation of the observed values but underestimated the high precipitationrange. Gauge adjustment to both products improved the performance of the SPPs over medium rangeprecipitation value frequencies.
Over Taiwan (Figure 3g), all the SPPs follow the observed occurrence frequency distributionclosely with IMERGV06B Final and Late and GSMaPV07 mvk being exception at the lighter and higherprecipitation frequencies. CMORPH and IMERGV05B Final products exhibit exceptional performanceover this region over all frequencies.
Overall, the SPPs are able to capture the general trend of the rain gauge precipitation frequenciesover the Himalayas, Turkey, the French Cévennes, Blue Nile and the Alps. Over Peru and the ColombianAndes they are not able to capture the trend, SPPs exhibit biases at the lowest and highest precipitationranges. The lowest range is generally problematic, especially over Peruvian and Colombian Andes,

Remote Sens. 2019, 11, 2936 14 of 24
where the SPPs significantly overestimate the frequency of the observed values from rain gauges.IMERGV05B Final product performance for lighter and higher precipitation frequencies are significantlybetter compared to IMERGV06B Final and Late products.
Figure 4 presents the accuracy of the products in capturing rainfall occurrence through an analysisof NMRV (blue box plots) and NFASRV (red box plots) values. The NMRV performance metric showsthe rain gauge rainfall volume that the SPPs missed throughout a specific period of time, normalizedby the total rain gauge rainfall volume during that period; NFASRV represents the rainfall volume thatwas falsely detected by the SPPs, normalized by the total rain gauge rainfall volume during the sameperiod. In the figure, the lower-elevation rain gauges are represented by bold-colored box plots andthe higher-elevation ones by faded box plots. Horizontal lines indicate the 25th and 75th percentilesand the median (red line) of the distribution; vertical lines represent the extent of the rest of the data,which is 1.5 times the 25th–75th percentile range. Outliers are represented by the “+” markers. Ingeneral, NMRV and NFASRV values are between 0% and 40% for the Alps, the French Cévennes, theBlue Nile, Taiwan, and California. NFASRV values are significantly higher for the Peruvian Andes, theColombian Andes, and the U.S. Rocky Mountains.Remote Sens. 2019, 11, x FOR PEER REVIEW 15 of 24
Figure 4. Normalized missed rainfall volume (NMRV) (blue boxplots) and normalized false alarm satellite rainfall volume (NFASRV) (red boxplots) values over (a) the Italian Alps, (b) the French Cévennes, (c) the Peruvian Andes, (d) Turkey, (e) the Blue Nile, (f) the Colombian Andes, (g) Taiwan, (h) the U.S. Rocky Mountains, (i) Nepal, and (j) California for rain gauges and every SPP (blue represents NMRV and red represents NFASRV). For regions that has elevation groups, higher-elevations are represented by faded bars.
5.3. Evaluation of Rain Rates
To capture the systematic error component of SPPs, MRE is presented in Figure 5. The error statistics presented in Figures 5 and 6 were gathered by conditioning MRE and CRMSE with rain gauge and SPP average precipitation quantiles of ranges 0 < R ≤ Q20; Q20 <R ≤ Q40; Q40 < R ≤ Q60; Q60 < R ≤ Q80; Q80 < R ≤ Q95; and Q95 < R. Over all the regions, the SPPs move from overestimation to underestimation from the lowest precipitation quantiles to the higher quantiles, respectively, with the exception of the U.S. Rocky Mountains. The performances of all the SPPs change significantly from the lowest quantile interval to the Q20 < R ≤ Q40 range.
Figure 4. Normalized missed rainfall volume (NMRV) (blue boxplots) and normalized false alarmsatellite rainfall volume (NFASRV) (red boxplots) values over (a) the Italian Alps, (b) the FrenchCévennes, (c) the Peruvian Andes, (d) Turkey, (e) the Blue Nile, (f) the Colombian Andes, (g) Taiwan,(h) the U.S. Rocky Mountains, (i) Nepal, and (j) California for rain gauges and every SPP (blue representsNMRV and red represents NFASRV). For regions that has elevation groups, higher-elevations arerepresented by faded bars.
Over the Alps (Figure 4a), the median and the variation of NFASRV are higher than NMRVvalues for almost all the SPPs. CMORPH has the highest median and variation of NFASRV values.Meanwhile, the gauge correction shows no improvement for both metrics. In general, IMERGV06Bproducts shows higher NFASRV values compared to MSWEP and GSMaPV07 products.

Remote Sens. 2019, 11, 2936 15 of 24
Over Turkey (Figure 4d), the NMRV and NFASRV performances for the lower elevation rain gaugesare better than the higher-elevation performances for almost all the SPPs. The worst performanceof NMRV is by CMORPH for both elevations (45–55%). GSMaPV07 has the best performance interms of both NMRV and NFASRV and both elevations. The rain gauge adjustment does not bringany improvement, especially over higher elevations. IMERGV06B Final has higher (lower) NFASRV(NMRV) values for both elevation groups compared to IMERGV05B Final product.
Over the Peruvian Andes NMRV and NFASRV median and variance values for higher-elevationrain gauges are lower compared to lowest-elevation rain gauge values. The median of the NFASRVvalues for lowest-elevation rain gauges reported was between 30 to 60%, and 10 to 30% forhigher-elevation rain gauges. NFASRV values are significantly higher than NMRV values for all SPPs.The best performance is acheived by the IMERGV06B Late and Final products for NMRV and byGSMaPV07 for NFASRV. The rain gauge adjustment does not show any improvement for IMERGB06BLate product for both NMRV and NFASRV and for both elevations. On the other hand, GSMaPV07mvk performance deteriorates with rain gauge adjustment for NMRV and improves for NFASRV.
Over the Colombian Andes, the medians of the NMRV values range between 5 to 35% whileNFASRV median values range between 20 to 60%; hence it is clear that SPPs are falsely reportingprecipitation over this region, causing an overestimation of the observed values. In general, variationsof both NMRV and NFASRV are very similar for both lower- and higher-elevation rain gauges.
Over the Himalayas, the SPP performances differ slightly from each other and from theirperformances in other regions. In general, NMRV and NFASRV metric values are better at thelower-elevation rain gauges. CMORPH over the higher-elevation rain gauges significantly misses theprecipitation values, with high medians and variances of NMRV. NFASRV variances for lower-elevationrain gauges are significantly higher than for higher-elevation gauges. MSWEP has the highest median(65%) NFASRV value over the higher-elevation rain gauges.
In general, CMORPH, GSMaPV07, and MSWEP products have the best NMRV performances overall the regions, followed by IMERGV06B Final. Depending on the region, the SPP performances onrain occurrence differ between lower- and higher-elevation rain gauges.
5.3. Evaluation of Rain Rates
To capture the systematic error component of SPPs, MRE is presented in Figure 5. The errorstatistics presented in Figures 5 and 6 were gathered by conditioning MRE and CRMSE with raingauge and SPP average precipitation quantiles of ranges 0 < R ≤ Q20; Q20 <R ≤ Q40; Q40 < R ≤ Q60;Q60 < R ≤ Q80; Q80 < R ≤ Q95; and Q95 < R. Over all the regions, the SPPs move from overestimationto underestimation from the lowest precipitation quantiles to the higher quantiles, respectively, withthe exception of the U.S. Rocky Mountains. The performances of all the SPPs change significantly fromthe lowest quantile interval to the Q20 < R ≤ Q40 range.
Over the Alps (Figure 5a), MSWEP has the lowest MRE values for all quantile ranges. GSMaPV07and GSMaPV07 mvk closely follows MSWEP at all quantiles, with the exception that, at the highestquantile range, these products underestimate more than MSWEP. The worst performances amongthe SPPs are by IMERGV05B, IMERGV06B Late and Final products, with the highest MRE valuesexhibited at the lowest quantiles (5) and the highest quantile (–0.8). The rain gauge correction forIMERGV06B Late increases the MRE values at lower quantiles while decreasing the MRE values at thehigher quantiles. The rain gauge correction for GSMaPV07 mvk does not show any improvement.

Remote Sens. 2019, 11, 2936 16 of 24Remote Sens. 2019, 11, x FOR PEER REVIEW 16 of 24
Figure 5. Mean relative error of daily precipitation for different quantiles of rain gauge and SPP average precipitation values for all SPPs over (a) the Italian Alps, (b) the French Cévennes, (c) the Peruvian Andes, (d) Turkey, (e) the Blue Nile, (f) the Colombian Andes, (g) Taiwan, (h) the U.S. Rocky Mountains, (i) Nepal, and (j) California.
Over the Alps (Figure 5a), MSWEP has the lowest MRE values for all quantile ranges. GSMaPV07 and GSMaPV07 mvk closely follows MSWEP at all quantiles, with the exception that, at the highest quantile range, these products underestimate more than MSWEP. The worst performances among the SPPs are by IMERGV05B, IMERGV06B Late and Final products, with the highest MRE values exhibited at the lowest quantiles (5) and the highest quantile (–0.8). The rain gauge correction for IMERGV06B Late increases the MRE values at lower quantiles while decreasing the MRE values at the higher quantiles. The rain gauge correction for GSMaPV07 mvk does not show any improvement.
Over the French Cévennes (Figure 5b), while GSMaPV07 displays the best performance at almost all quantile ranges, this product underestimates the most at the highest quantiles. The rain gauge correction done in GSMaPV07 mvk reduces the MRE for lower quantiles but increases the underestimation at the higher quantiles. IMERGV06B Late, Final and GSMaPV07 mvk have the worst performances, except for the highest quantile ranges, where they exhibit the lowest bias. Moreover, IMERGV05B performance for lower quantile ranges better compared to IMERGV06B.
Over the Peruvian Andes (Figure 5c), GSMaPV07 has the lowest overestimation at the lower quantile ranges and the highest underestimation at higher quantile ranges. The rain gauge correction
Figure 5. Mean relative error of daily precipitation for different quantiles of rain gauge and SPP averageprecipitation values for all SPPs over (a) the Italian Alps, (b) the French Cévennes, (c) the PeruvianAndes, (d) Turkey, (e) the Blue Nile, (f) the Colombian Andes, (g) Taiwan, (h) the U.S. Rocky Mountains,(i) Nepal, and (j) California.
Over the French Cévennes (Figure 5b), while GSMaPV07 displays the best performance atalmost all quantile ranges, this product underestimates the most at the highest quantiles. The raingauge correction done in GSMaPV07 mvk reduces the MRE for lower quantiles but increases theunderestimation at the higher quantiles. IMERGV06B Late, Final and GSMaPV07 mvk have the worstperformances, except for the highest quantile ranges, where they exhibit the lowest bias. Moreover,IMERGV05B performance for lower quantile ranges better compared to IMERGV06B.
Over the Peruvian Andes (Figure 5c), GSMaPV07 has the lowest overestimation at the lowerquantile ranges and the highest underestimation at higher quantile ranges. The rain gauge correction forGSMaPV07 mvk product decreases MRE values significantly at the lower quantiles but increases MREvalues at the higher quantiles slightly. IMERGV05B, IMERGV06B Final and Late product performancesare identical over this region.

Remote Sens. 2019, 11, 2936 17 of 24Remote Sens. 2019, 11, x FOR PEER REVIEW 18 of 24
Figure 6. Centralized root mean square error of daily precipitation for different quantiles of rain gauge and SPP average precipitation values for all SPPs over (a) the Italian Alps, (b) the French Cévennss, (c) the Peruvian Andes, (d) Turkey, (e) the Blue Nile, (f) the Colombian Andes, (g) Taiwan, (h) the U.S. Rocky Mountains, (i) Nepal, and (j) California.
6. Discussion
This study evaluated GPM-era and TRMM-era sensors and algorithms and compared satellite only (IMERGV06B Late and GSMaPV07 mvk) SPPs to the rain gauge corrected versions in an effort to understand the improvements to them and their ongoing deficiencies, especially over complex terrain. In general, GSMaPV07 surpassed the performance of IMERGV06B Final and Late for almost all regions with respect to MRE and CRMSE values. MSWEP failed to follow the performance of the other SPPs for almost all regions with respect to occurrence frequency distributions, MRE and CRMSE values. The rain gauge correction methodology followed by the GSMaPV07 algorithm exhibited significant reduction of the CRMSE values almost over all regions, however when MRE and rain occurrences were checked we could not see improvements. The rain gauge correction methodology followed by IMERGV06B algorithm showed almost no improvements when it comes to CRMSE, MRE and rain occurrences. When it comes to different elevation groups, certain regions
Figure 6. Centralized root mean square error of daily precipitation for different quantiles of rain gaugeand SPP average precipitation values for all SPPs over (a) the Italian Alps, (b) the French Cévennss,(c) the Peruvian Andes, (d) Turkey, (e) the Blue Nile, (f) the Colombian Andes, (g) Taiwan, (h) the U.S.Rocky Mountains, (i) Nepal, and (j) California.
Over Turkey, the MRE values for all the SPPs range from 5 to 9 for the lowest quantile ranges.GSMaPV07 and MSWEP have the lowest overestimation (5–6) for the lowest quantile range and thehighest underestimation (–0.8) for the highest. IMERGV05B, IMERGV06B Final and Late productshave the highest overestimation for lower quantiles and lowest underestimation for higher quantiles.
Over the Blue Nile (Figure 5e), the MRE values range from 4 to –0.8 for all the SPPs. In general,all SPPs’ systematic error patterns are very similar, with overestimation to underestimation from thelowest quantile ranges to the higher quantile ranges, respectively. The rain gauge correction decreasesthe overestimation at lower quantiles slightly and increases the underestimation at higher quantiles.IMERGV05B has the least overestimation for lowest quantiles compared to IMERGV06B Final andLate products.

Remote Sens. 2019, 11, 2936 18 of 24
Over the Colombian Andes (Figure 5f), CMORPH, GSMaPV07 and GSMaPV07 mvk have thelowest overestimation for all quantile ranges except the highest quantile range, where these productshave the highest underestimation. MSWEP has the highest overestimation for the lower quantileranges and high underestimation for the highest quantile ranges. Over this region the rain gaugecorrection conducted to IMERGV06 Late product increases the overestimation significantly for lowerquantiles meanwhile has no affect for higher quantiles.
Over Taiwan (Figure 5g), MSWEP has the highest overestimation (6.5) for the lowest quantilerange; on the other hand, the performance of this product is significantly better for quantiles higherthan Q60 compared to the other SPPs. Rain gauge correction for IMERGV06B Late product shows noimprovement when MRE values are compared meanwhile for GSMaPV07 mvk the underestimationincreases significantly for higher quantiles when compared to GSMaPV07 MRE values.
Over the U.S. Rocky Mountains (Figure 5h), MRE values ranged between 15 and 0, from thelowest to the highest quantile values. GSMaPV07 had the best performance among all SPPs, except forthe highest quantile range. Satellite only products (IMERGV06B Late and GSMaPV07 mvk) exhibitedthe highest overestimation of all SPPs and quantile ranges until Q60, after which MSWEP had thehighest overestimation. The gauge correction over this region reduces the overestimation significantly.
Over the Himalayas (Figure 5i), MSWEP had the highest MRE (10) at the lowest quantile and thelowest MRE (–0.3) at the highest quantile. CMORPH, GSMaPV07 and GSMaPV07 mvk on the otherhand, had the best performance at the lower quantiles. The rain gauge correction had no effect on theMRE values in this region.
Finally, Figure 6 captures the random component of error (CRMSE) of daily precipitation for thedifferent quantiles of rain gauge and SPP average precipitation values. In general, all SPPs exhibitedhigh CRMSE values at lower quantile ranges and lower CRMSE values at higher quantile ranges.Overall, GSMaPV07 exhibited the lowest CRMSE values over almost all regions and all quantileranges. Moreover, IMERGV05B exhibited lower CRMSE (over some regions lowest) values compared toIMERGV06B Final and Late products over all regions. Specifically, over the Alps (Figure 6a), GSMaPV07had the lowest CRMSE values followed by MSWEP. The rain gauge correction for GSMaPV07 mvkreduces the CRMSE values significantly for all quantile ranges. Over the French Cévennes (Figure 6b),IMERGV06B Final, Late, and GSMaPV07 mvk had the highest CRMSE values, while GSMaPV07 andCMORPH had the lowest CRMSE values. Over the Peruvian Andes (Figure 6c), GSMaPV07 had thelowest CRMSE values, while CMORPH, IMERGV06B Late and GSMaPV07 mvk had the highest. Forboth satellite only products the rain gauge adjustment decreased CRMSE values significantly. OverTurkey (Figure 6d), GSMaPV07 and MSWEP had the lowest CRMSE values, and IMERGV06B Late,Final, and GSMaPV07 mvk had the highest. Finally, over the Blue Nile (Figure 6e), MSWEP had thelowest CRMSE values, while IMERGV06B Late and GSMaPV07 mvk had the highest.
6. Discussion
This study evaluated GPM-era and TRMM-era sensors and algorithms and compared satelliteonly (IMERGV06B Late and GSMaPV07 mvk) SPPs to the rain gauge corrected versions in an effort tounderstand the improvements to them and their ongoing deficiencies, especially over complex terrain.In general, GSMaPV07 surpassed the performance of IMERGV06B Final and Late for almost all regionswith respect to MRE and CRMSE values. MSWEP failed to follow the performance of the other SPPsfor almost all regions with respect to occurrence frequency distributions, MRE and CRMSE values.The rain gauge correction methodology followed by the GSMaPV07 algorithm exhibited significantreduction of the CRMSE values almost over all regions, however when MRE and rain occurrenceswere checked we could not see improvements. The rain gauge correction methodology followedby IMERGV06B algorithm showed almost no improvements when it comes to CRMSE, MRE andrain occurrences. When it comes to different elevation groups, certain regions exhibit that NMRVand NFASRV values over lower elevation regions are slightly better compared to higher elevationregions. Moreover, there has been changes to the algorithm between IMERGV05B and IMERGV06B, as

Remote Sens. 2019, 11, 2936 19 of 24
mentioned previously. The effect of this change especially over the complex terrain is unknown andstudied here. IMERGV05B showed significantly better performance capturing the lighter and heavierprecipitation values compared to IMERGV06B for almost all regions. In the meantime, IMERGV05BNMRV values were worse compared to IMERGV06B and NFASRV values were similar to each otherfor almost all regions. More in-depth analysis should be conducted to understand the deficiency thatcomes with changing the method to derive motion vector with IR or TQV. However, it is obvious fromthis study that when motion vectors are derived using TQV, performance of detecting lighter andhigher precipitation decreases over the complex terrain.
Bai and Liu [48] evaluated CMORPH, TMPA, MSWEP, and a few other SPPs over the complexterrain of the Tibetan Plateau and concluded that MSWEP generally provides the best validation results.The authors noted, however, that since MSWEP directly incorporates global-scale daily gauge data,evaluation of this product using the rain gauges could raise independence issues. In regions whereGPCC overlap is minimal (i.e. Blue Nile, Colombian Andes, Peruvian Andes, and Taiwan), MSWEPperformance is the worst relative to other SPPs when we consider MRE and CRMSE metrics; it hasthe highest overestimation for lower precipitation values and the highest underestimation for highervalues. This outcome aligns with findings by Zambrano-Bigiarini and others [49], and by Nair andIndu [50]. Zambrano-Bigiarini and others [49] evaluated multiple SPPs over complex terrain over Chile,including MSWEP, CMORPH, and TMPA. They reported that MSWEP significantly overestimatedlower-range precipitation amounts and underestimated higher-range amounts, while CMORPH andTMPA captured lower-range precipitation with less overestimation. Nair and Indu [50] evaluatedMSWEP over India using rain gauges for pre-monsoon, monsoon, and post-monsoon seasons at dailyscale for 35 years. They concluded that MSWEP shows large errors in detecting the higher quantiles ofrainfall (above the 75th and 95th quantiles). Moreover, they contend that MSWEP overestimates themiddle-range rainfall amounts and underestimates the higher-range amounts.
In general, the mean annual precipitation performances of the SPPs in our study are, as expected,significantly better than the daily performances. For mean annual precipitation, IMERGV06B Finaland GSMaPV07 followed the values of the rain gauges closely, followed by CMORPH. On the otherhand, MSWEP, IMERGV06B Final and Late showed significant overestimation.
Almost all the SPPs are able to follow the occurrence frequency of the rain gauges closely;the exceptions are MSWEP and IMERGV06B Late products. The best performance is exhibited byGSMaPV07, which can be explained by the orographic correction that the algorithm applies.
Over all the regions, SPP performance is very similar, with the SPPs overestimating the lowerprecipitation values significantly and underestimating the higher values. The underestimation ofthe higher values is in agreement with the findings of past studies [10,19,41,51] and is attributed tothe occurrence of shallow, but high, accumulation precipitation related to warm-rain processes [11].Petkovic and Kummerow [51] evaluated the performance of GPM PMW retrievals in an extremeprecipitation event and concluded that satellites underestimate accumulations relative to gauges by60%. They further concluded that fixing this problem requires better understanding of the ice contentin heavy precipitation events.
Tan and others [52] evaluated IMERGv03 and TMPAV07 over the continental United States(CONUS) and concluded that IMERGV03 is better than TMPAV07 in terms of normalized meanabsolute error, whereas the reverse is true for normalized RMSE. Since normalized RMSE is affectedby outliers to a greater degree, this suggests IMERGV03 has more outliers, and/or the outliers havelarger magnitudes. One plausible explanation for this is the fact that IMERGV03 uses a prelaunchGPM database; the transition to a full GPM database indeed improves the accuracy of IMERGV06B(with 20% decrease in MRE and nearly 4% in CRMSE) relative to TMPAV07. Similarly, Manz andothers [28] evaluated IMERG Day-1 against TMPA over Peru and Ecuador and concluded that IMERGperformance was worse compared to TMPA in terms of normalized RMSE for the dry coastal regionof Peru.

Remote Sens. 2019, 11, 2936 20 of 24
Lastly, Maggioni and others [53] conducted an analysis related to the optimal number of raingauges required for SPPs evaluation over complex terrain regions. They showed that the retrievalerror does not exhibit strong dependence on gauge density, while the probability of no-rain detectionand the mean value of missed rain volume showed dependence on gauge density.
7. Conclusions
We conducted an evaluation of four SPPs over ten different regions around the globe characterizedby complex terrain using daily rain gauge precipitation over the 2014–2015 period. The SPPs areavailable at 0.1◦ regular latitude-longitude grids, and we averaged rain gauge measurements withinthose grids. The study evaluated GPM-era and TRMM-era sensors and algorithms and comparedsatellite only (IMERGV06B Late and GSMaPV07 mvk) to rain gauge corrected versions in an effortto understand potential improvements and ongoing deficiencies, especially over complex terrain.The study areas comprise the Alps, the French Cévennes, the western Black Sea region of Turkey,the Colombian Andes, the Peruvian Andes, the U.S. Rocky Mountains, the Blue Nile, westernTaiwan, California, and the Himalayas over Nepal—all complex terrains characterized by differenthydroclimatic characteristics—and we used various evaluation statistics to assess the performance ofthe satellite-based rainfall products. Over the Alps, the French Cévennes, the Peruvian Andes, andTurkey, we observed significant orographic effects. Taiwan, the Blue Nile, and the Colombian/PeruvianAndes are characterized by tropical conditions, and the Colombian Andes is more complex than theothers, with a bimodal annual cycle of precipitation resulting from double passage of the ITCZ. TheU.S. Rocky Mountains and Nepal/Himalayas can be grouped as highland climate; Nepal/Himalayas ismostly influenced by monsoon systems.
The study showed that GPM-era SPPs provided significant results in comparisons of occurrencefrequencies and NMRV, NFASRV, MRE, and CRMSE values. In general, GSMaPV07 surpassed theperformance of IMERGV06B Final for almost all regions with respect to MRE and CRMSE values.CMORPH surpassed the performance of MSWEP and IMERGV06 Late for almost all regions withrespect to MRE and CRMSE values. Rain gauge adjustment to the IMERGV06B Late and GSMaPV07mvk showed that the algorithms do not address the magnitude dependence of the systematic error.Meanwhile the GSMaPV07 rain gauge adjustment algorithm performs significantly well in reducingthe random component of the error. As also shown by Derin et al. [19] for the TRMM-era products, theGPM-era SPP performance still depends highly on rainfall structure. Derin et al. [19] had concludedthat the performances of gauge-adjusted SPPs are dependent on the representativeness of the localrain gauges. This is reflected in the limited performance improvements of gauge adjustment oversatellite-only SPP products. Taking into account all the results presented in this study, we concludethe following:
(1) IMERGV06B Final and GSMaPV07 products follow the mean annual precipitation values ofrain gauges very closely, followed by CMORPH, while GSMaP mvk, IMERGV06B Late and MSWEPshow significant overestimation.
(2) IMERGV06B Final (–0.3–0.8 MRE; 1.1–1.9 CRMSE; 1.8–19 NMRV; 17–50 NFASRV) andGSMaPV07 (–0.1–1.1 MRE; 0.9–1.9 CRMSE; 0.9–34 NMRV; 7.6–35 NFASRV) provide error metricimprovements over MSWEP (–0.3–1.3 MRE; 1.0–2.8 CRMSE; 0.9–32 NMRV; 5–93 NFASRV).
(3) The new orographic rainfall classification in the GSMaPV07 algorithm is able to improve on thedetection of orographic rainfall, the rainfall amounts, and error metrics. It should be noted, moreover,that we demonstrated the improvement of this product beyond the Asian land region.
(4) IMERGV05B showed significantly better performance in capturing the lighter and heavierprecipitation values compared to IMERGV06B for almost all regions. When motion vectors arederived using TQV, performance of detecting lighter and higher precipitation decreases over thecomplex terrain.
(5) The SPPs are able to capture the distribution of precipitation rates for all regions, although lowprecipitation rates are overestimated for some.

Remote Sens. 2019, 11, 2936 21 of 24
It is worth mentioning that in situ observations, while extremely important, provide only limitedrepresentation of heavy precipitation over complex terrain, and spatial-scale mismatch between satellitesand gauges should be considered. Therefore, future work should consider utilizing observations frommore advanced sensors—for example, X-band polarimetric radar—that provide better characterizationof the spatial variability of precipitation over complex terrain and thus can enhance investigation ofsatellite-rainfall error characteristics [53]. Moreover, future research work in this area should include theevaluation of instantaneous PMW precipitation datasets, which constitute the basis of most combinedsatellite precipitation algorithms. Such analysis can give further insight into the error characteristics ofSPPs. Finally, investigation of possible links between the errors and physiographic features withineach region can provide more detailed error characteristics, which can provide useful information toalgorithm developers and data users.
Author Contributions: Y.D. conceived conceptualization, methodology, data curation, software, validation, formalanalysis, investigation; writing—original draft preparation, visualization. E.A. conceived conceptualization,methodology, resources, writing—review and editing; visualization; supervision; project administration; fundingacquisition. G.D., M.B., B.M., E.I.N., K.K.Y., B.B. helped data curation; writing—review and editing, visualization.J.-P.R.-S., W.B., W.L.-C., F.S., H.J.V. helped data curation; writing—review and editing. A.B., H.C., D.S., S.M.,C.-H.C., Y.C.H. helped data curation.
Funding: This work was partially supported by a NASA Precipitation Measurement Mission award(NNX07AE31G) and the Eversource Energy Center at the University of Connecticut.
Conflicts of Interest: The authors declare no conflict of interest. The funders had no role in the design of thestudy; in the collection, analyses, or interpretation of data; in the writing of the manuscript, or in the decision topublish the results.
References
1. Michaelides, S.; Levizzani, V.; Anagnostou, E.; Bauer, P.; Kasparis, T.; Lane, J.E. Precipitation: Measurement,remote sensing, climatology and modeling. Atmos. Res. 2009, 94, 512–533. [CrossRef]
2. Strangeways, I. Precipitation: Theory, Measurement and Distribution; Cambridge University Press: Cambridge,UK, 2011; p. 290.
3. Young, C.B.; Bradley, A.A.; Krajewski, W.F.; Kruger, A.; Morrissey, M.L. Evaluating NEXRAD multi-sensorprecipitation estimates for operational hydrologic forecasting. J. Hydrometeorol. 2000, 1, 241–254. [CrossRef]
4. Krajewski, W.F.; Smith, J.A. Radar hydrology: Rainfall estimation. Adv. Water Resour. 2002, 25, 1387–1394.[CrossRef]
5. Barros, A.P.; Kim, G.; Williams, E.; Nesbitt, S.W. Probing orographic controls in the Himalayas during themonsoon using satellite imagery. Nat. Hazards Earth Syst. Sci. 2004, 4, 29–51. [CrossRef]
6. Immerzeel, W.W.; Petersen, L.; Ragettli, S.; Pellicciotti, F. The importance of observed gradients of airtemperature and precipitation for modeling runoff from a glacierized watershed in the Nepal Himalayas.Water Resour. Res. 2014, 50, 2212–2226. [CrossRef]
7. Kummerow, C.D.; Randel, D.L.; Kulie, M.; Wang, N.-Y.; Ferraro, R.; Munchak, S.J.; Petkovic, V. The evaluationof Goddard profiling algorithm to a fully parametric scheme. J. Atmos. Ocean. Technol. 2015, 32, 2265–2280.[CrossRef]
8. Derin, Y.; Anagnostou, E.; Anagnostou, M.N.; Kalogiros, J.; Casella, D.; Marra, A.C.; Panegrossi, G.;Sano, P. Passive Microwave Rainfall Error Analysis Using High-Resolution X-Band Dual-Polarization RadarObservations in Complex Terrain. IEEE Trans. Geosci. Remote Sens. 2018, 56, 2565–2586. [CrossRef]
9. Kwon, E.-H.; Sohn, B.-J.; Chang, D.-E.; Ahn, M.-H.; Yang, S. Use of numerical forecasts for improving TMIrain retrievals over the mountainous area in Korea. J. Appl. Meteor. Climatol. 2008, 47, 1995–2007. [CrossRef]
10. Kubota, T.; Ushio, T.; Shige, S.; Kida, S.; Kachi, M.; Okamoto, K. Verification of high-resolution satellite-basedrainfall estimates around Japan using a gauge-calibrated ground-radar dataset. J. Meteorol. Soc. Jpn. 2009, 87,203–222. [CrossRef]
11. Yamamoto, M.K.; Shige, S.; Yu, C.-K.; Cheng, L.-W. Further improvement of the heavy orographic rainfallretrievals in the GSMaP Algorithm for Microwave Radiometers. J. Appl. Meteorol. Climatol. 2017, 56,2607–2619. [CrossRef]

Remote Sens. 2019, 11, 2936 22 of 24
12. Bartsotas, N.S.; Anagnostou, E.N.; Nikolopoulos, E.I.; Kallos, G. Investigating satellite precipitationuncertainty over complex terrain. J. Geophys. Res. Atmos. 2018, 123, 5346–5359. [CrossRef]
13. Tan, J.; Huffman, G.J.; Bolvin, D.T.; Nelkin, E.J. IMERG V06: Changes to the Morphing Algorithm. Americanand Oceanic Technology. J. Atmos. Ocean. Technol. 2019. [CrossRef]
14. Huffman, G.J. Algorithm Theoretical Basis Document (ATBD) Version 06. NASA Global PrecipitationMeasurement (GPM) Integrated Multi-Satellite Retrievals for GPM (IMERG), NASA. Available online:https://pmm.nasa.gov/data-access/downloads/gpm (accessed on 4 December 2019).
15. Joyce, J.R.; Janowiak, E.J.; Arkin, P.A.; Xie, P. CMORPH: A method that produces global precipitationestimates from passive microwave and infrared data at high spatial and temporal resolution. J. Hydrometeorol.2004, 5, 487–503. [CrossRef]
16. Xie, P.; Yoo, S.H.; Joyce, R.J. Bias-Corrected CMORPH: A 13-Year Analysis of High-Resolution GlobalPrecipitation. Available online: https://ftp.cpc.ncep.noaa.gov/precip/CMORPH_V1.0/REF/EGU_1104_Xie_bias-CMORPH.pdf (accessed on 4 December 2019).
17. Kubota, T.; Shige, S.; Hashizume, H.; Aonashi, K.; Takahashi, N.; Seto, S.; Hirose, M.; Takayabu, Y.N.;Nakagawa, K.; Iwanami, K.; et al. Global Precipitation Map using Satellite-borne Microwave Radiometersby the GSMaP Project: Production and Validation. IEEE Trans. Geosci. Remote Sens. 2007, 45, 2259–2275.[CrossRef]
18. Ushio, T.; Matsuda, T.; Tashima, T.; Kubota, T.; Kachi, M.; Yoshida, S. Gauge Adjusted Global SatelliteMapping of Precipitation (GSMaP_Gauge). In Proceedings of the 2014 XXXIth URSI General Assembly andScientific Symposium (URSI GASS), Beijing, China, 16–23 August 2014.
19. Derin, Y.; Anagnostou, E.; Berne, A.; Borga, M.; Boudevillain, B.; Buytaert, W.; Chang, C.-H.; Delrieu, G.;Hong, Y.; Hsu, Y.C.; et al. Multi-regional Satellite Precipitation Products Evaluation over Complex Terrain.J. Hydrometeorol. 2016, 17, 1817–1836. [CrossRef]
20. Ebert, E.E.; Janowiak, J.E.; Kidd, C. Comparison of near-real-time precipitation estimates from satelliteobservations and numerical models. Bull. Am. Meteorol. Soc. 2007, 88, 47–64. [CrossRef]
21. McCollum, J.R.; Krajewski, W.F.; Ferraro, R.R.; Ba, M.B. Evaluation of biases of satellite rainfall estimationalgorithms over the continental united states. J. Appl. Meteorol. 2002, 41, 1065–1080. [CrossRef]
22. Gottschalck, J.; Meng, J.; Rodell, M.; Houser, P. Analysis of multiple precipitation products and preliminaryassessment of their impact on global land data assimilation system land surface states. J. Hydrometeorol. 2005,6, 573–598. [CrossRef]
23. Hossain, F.; Huffman, G.J. Investigating error metrics for satellite rainfall data at hydrologically relevantscales. J. Hydrometeorol. 2008, 9, 563–575. [CrossRef]
24. Anagnostou, E.N.; Maggioni, V.; Nikolopoulos, E.; Meskele, T.; Hossain, F.; Papadopoulos, A. Benchmarkinghigh-resolution global satellite raingall products to radar and rain-gauge rainfall estimates. IEEE Trans.Geosci. Remote Sens. 2010, 48, 1667–1683. [CrossRef]
25. Su, F.; Hong, Y.; Lettenmaier, D.P. Evaluation of TRMM Multisatellite Precipitation Analysis (TMPA) and itsutility in hydrologic prediction in the La Plata Basin. J. Hydrometeorol. 2008, 9, 622–640. [CrossRef]
26. Dinku, T.; Connor, S.J.; Ceccato, P. Comparison of CMORPH and TRMM-3B42 over mountainous regions of Africaand South America. Satellite Rainfall Applications for Surface Hydrology; Gebremichael, M., Hossain, F., Eds.;Springer: New York, NY, USA, 2010; pp. 193–204.
27. Scheel, M.L.M.; Rohrer, M.; Huggel, C.; Santos Villar, D.; Silvestre, E.; Huffman, G.J. Evaluation of TRMMmulti-satellite precipitation analysis (TMPA) performance in the central Andes region and its dependency onspatial and temporal resolution. Hydrol. Earth Syst. Sci. 2011, 15, 2649–2663. [CrossRef]
28. Manz, B.; Paez-Bimos, S.; Horna, N.; Buytaert, W.; Ochoa-Tocachi, B.; Lavado-Casimiro, W.; Willems, B.Comparative Ground Validation of IMERG and TMPA at Variable Spatiotemporal Scales in the TropicalAndes. J. Hydrometorol. 2017, 18, 2469–2489. [CrossRef]
29. Stampoulis, D.; Anagnostou, E.N. Evaluation of global satellite rainfall products over continental Europe.J. Hydrometeorol. 2012, 13, 588–603. [CrossRef]
30. Mei, Y.; Anagnostou, E.N.; Nikolopoulos, E.I.; Borga, M. Error analysis of satellite precipitation products inmountainous basins. J. Hydrometeorol. 2014, 15, 1778–1793. [CrossRef]
31. Derin, Y.; Yilmaz, K.K. Evaluation of multiple satellite-based precipitation products over complex topography.J. Hydrometeorol. 2014, 15, 1498–1516. [CrossRef]

Remote Sens. 2019, 11, 2936 23 of 24
32. Dinku, T.; Ceccato, P.; Grover-Kopec, E.; Lemma, M.; Connor, S.J.; Ropelewski, C.F. Validation of satelliterainfall products over East Africa’s complex topography. Int. J. Remote Sens. 2007, 28, 1503–1526. [CrossRef]
33. Hirpa, F.; Gebremichael, M.; Hopson, T. Evaluation of high-resolution satellite precipitation products oververy complex terrain in Ethiopia. J. Appl. Meteorol. Clim. 2010, 49, 1044–1051. [CrossRef]
34. Habib, E.; Elsaadani, M.; Haile, A.T. Climatology-focused evaluation of CMORPH and TMPA satellite rainfallproducts over the nile basin. J. Appl. Meteorol. Clim. 2012, 51, 2105–2121. [CrossRef]
35. Chen, S.; Hong, Y.; Cao, Q.; Kirstetter, P.E.; Gourley, J.J.; Qi, Y.; Zhang, J.; Howard, K.; Hu, J.; Wang, J.Performance of evaluation of radar and satellite rainfalls for typhoon morakot over Taiwan: Areremote-sensing products ready for gauge denial scenario of extreme events? J. Hydrol. 2013, 506, 4–13.[CrossRef]
36. Yong, B.; Ren, L.; Hong, Y.; Gourley, J.J.; Tian, Y.; Huffman, G.J.; Chen, X.; Wang, W.; Wen, Y. First evaluationof climatological calibration algorithm in the real-time TMPA precipitation estimates over two basins at highand low latitudes. Water Resour. Res. 2013, 49, 2461–2472. [CrossRef]
37. Maggioni, V.; Meyers, P.C.; Robinson, M.D. A review of merged high-resolution satellite precipitation productaccuracy during the tropical rainfall measuring mission (TRMM) era. J. Hydrometeorol. 2016, 17, 1101–1117.[CrossRef]
38. Maggioni, V.; Sapiano, M.R.; Adler, R.F.; Tian, Y.; Huffman, G.J. An error model for uncertainty quantificationin high-time-resolution precipitation products. J. Hydrometeorol. 2014, 15, 1274–1292. [CrossRef]
39. Prakash, P.; Mitra, A.K.; Mitra, D.S.; AghaKouchak, A. From TRMM to GPM: How well can heavy rainfall bedetected from space? Adv. Water Resour. 2016, 88, 1–7. [CrossRef]
40. Derin, Y.; Nikolopoulos, E.; Anagnostou, M.N. Retrieving Extreme Precipitation with Multiple Satellite-basedPrecipitation Products. Extreme Hydroclimatic Events and Multivariate Hazards in a Changing Climate; Elsevier:Amsterdam, The Netherlands, 2019.
41. Maggioni, V.; Nikolopoulos, E.I.; Anagnostou, E.N.; Borga, M. Modeling satellite precipitation errors overmountainous terrain: The influence of gauge density, seasonality, and temporal resolution. IEEE Trans.Geosci. Remote Sens. 2017, 55, 4130–4140. [CrossRef]
42. Huffman, G.J.; Bolvin, D.T.; Braithwaite, D.; Hsu, K.; Joyce, R.; Xie, P. NASA Global Precipitation Measurement(GPM) Integrated Multi-Satellite Retrievals for GPM (I-MERG). Available online: http://pmm.nasa.gov/sites/default/failes/document_files/IMERG_ATBD_V4.5.pdf (accessed on 4 December 2019).
43. Hong, Y.; Gochis, D.; Cheng, J.; Hsu, K.; Sorooshian, S. Evaluation of PERSIANN-CCS rainfall measurementusing the NAME event rain gauge network. J. Hydrometeorol. 2007, 8, 469–482. [CrossRef]
44. Ushio, T.; Sasashige, K.; Kubota, T.; Shige, S.; Okamoto, K.; Aonashi, K.; Inoue, T.; Takahashi, N.; Iguchi, T.;Kachi, M. A Kalman Filter Approach to the Global Satellite Mapping of Precipitation (GSMaP) from CombinedPassive Microwave and Infrared Radiometric Data. J. Meteorol. Soc. Jpn. 2009, 87, 137–151. [CrossRef]
45. Beck, H.E.; van Dijk, A.I.J.M.; Levizzani, V.; Schellekens, J.; Miralles, D.G.; Martens, B.; de Roo, A. MSWEP:3-hourly 0.25◦ global gridded precipitation (1979–2015) by merging gauge, satellite, and reanalysis data.Hydrol. Earth Syst. Sci. 2017, 21, 589–615. [CrossRef]
46. Beck, H.E.; Wood, E.F.; Pan, M.; Fisher, C.K.; Miralles, D.G.; Van Dijk, A.I.; McVicar, T.R.; Adler, R.F. MSWEPV2 global 3-hourly 0.1◦ precipitation: Methodology and quantitative assessment. Bull. Am. Meteorol. Soc.2019, 100, 473–500. [CrossRef]
47. Schneider, U.; Fuchs, T.; Meyer-Christoffer, A.; Rudolf, B. Global Precipitation Analysis Products of theGPCC. Available online: http://gpcc.dwd.de (accessed on 13 October 2019).
48. Bai, P.; Liu, X. Evaluation of five satellite-based precipitation products in two gauge-scarce basins on theTibetan Plateau. Remote Sens. 2018, 10, 1316. [CrossRef]
49. Zambrano-Bigiarini, M.; Nauditt, A.; Birkel, C.; Verbist, K.; Ribbe, L. Temporal and spatial evaluationof satellite-based rainfall estimates across the complex topographical and climatic gradients of Chile.Hydrol. Earth Syst. Sci. 2017, 21, 1295–1320. [CrossRef]
50. Nair, A.S.; Indu, J. Performance Assessment of Multi-Source Weighted-Ensemble Precipitation (MSWEP)Product over India. Climate 2017, 5, 2. [CrossRef]
51. Petkovic, V.; Kummerow, C.D. Performance of the GPM passive microwave retrieval in the Balkan floodevent of 2014. J. Hydrometeorol. 2015, 16, 2501–2518. [CrossRef]

Remote Sens. 2019, 11, 2936 24 of 24
52. Tan, J.; Petersen, W.A.; Kirstetter, P.-E.; Tian, Y. Performance of IMERG as a function of spatiotemporal scale.J. Hydrometeorol. 2017, 18, 307–319. [CrossRef] [PubMed]
53. Derin, Y.; Anagnostou, E.; Anagnostou, M.; Kalogiros, J. Evaluation of X-band Dual-PolarizationRadar-Rainfall Estimates from OLYMPEX. J. Hydrometeorol. 2019, 20, 1941–1959. [CrossRef]
© 2019 by the authors. Licensee MDPI, Basel, Switzerland. This article is an open accessarticle distributed under the terms and conditions of the Creative Commons Attribution(CC BY) license (http://creativecommons.org/licenses/by/4.0/).