Embed Size (px)
Citation preview
the plant genome july 2017 vol. 10, no. 2 1 of 13
original research
Evaluation of Genetic Diversity and Host Resistance to Stem Rust in USDA NSGC Durum Wheat Accessions
Shiaoman Chao,* Matthew N. Rouse, Maricelis Acevedo, Agnes Szabo-Hever, Harold Bockelman, J. Michael Bonman, Elias Elias, Daryl Klindworth, and Steven Xu
AbstractThe USDA–ARS National Small Grains Collection (NSGC) maintains germplasm representing global diversity of small grains and their wild relatives. To evaluate the utility of the NSGC durum wheat (Triticum turgidum L. ssp. durum) accessions, we as-sessed genetic diversity and linkage disequilibrium (LD) patterns in a durum core subset containing 429 lines with spring growth habit originating from 64 countries worldwide. Genetic diversity estimated using wheat single-nucleotide polymorphism (SNP) markers showed considerable diversity captured in this collection. Average LD decayed over a genetic distance to within 3 cM at r2 = 0.2, with a fast LD decay for markers linked at >5 cM. We evaluated accessions for resistance to wheat stem rust, caused by a fungal pathogen, Puccinia graminis Pers. Pers. f. sp. tritici Eriks. and E. Henn (Pgt), using races from both eastern Africa and North America, at seedling and adult plant stages. Five accessions were identified as resistant to all stem rust pathogen races evaluated. Genome-wide association analysis detected 17 significant asso-ciations at the seedling stage with nine likely corresponding to Sr7, Sr12, and Sr13 and the remaining potentially being novel genes located on six chromosomes. A higher frequency of resistant ac-cessions was found at the adult plant stage than at the seedling stage. However, few significant associations were detected pos-sibly a result of strong G E interactions not properly accounted for in the mixed model. Nonetheless, the resistant accessions iden-tified in this study should provide wheat breeders with valuable resources for improving stem rust resistance.
Wheat stem rust caused by a fungal pathogen, P. graminis (Pgt), poses a significant threat to pro-
duction of both common wheat (T. aestivum L.) and durum wheat throughout the world. Ug99, formally characterized as race TTKSK (Jin et al., 2008), from
Published in Plant Genome Volume 10. doi: 10.3835/plantgenome2016.07.0071 © Crop Science Society of America 5585 Guilford Rd., Madison, WI 53711 USA This is an open access article distributed under the CC BY-NC-ND license (http://creativecommons.org/licenses/by-nc-nd/4.0/).
S. Chao, D. Klindworth, S. Xu, USDA–ARS, Cereal Crops Research Unit, 1605 Albrecht Blvd N, Fargo, ND 58102; M.N. Rouse, USDA–ARS, Cereal Disease Lab., Dep. of Plant Pathology, Univ. of Min-nesota, St. Paul, MN 55018; M. Acevedo, Dep. of Plant Pathology, North Dakota State Univ., Fargo, ND 58108; M. Acevedo, current address: Delivering Genetic Gain in Wheat Project, International Programs, Cornell Univ., Ithaca, NY 14583; A. Szabo-Hever, E. Elias, Dep. of Plant Sciences, North Dakota State Univ., Fargo, ND 58108; H. Bockelman, J.M. Bonman, USDA–ARS, Small Grains and Potato Germplasm Research Unit, Aberdeen, ID 83210. Received 22 July 2016. Accepted 14 Feb. 2017. *Corresponding author ([email protected]). Assigned to Associate Editor Jason Holliday.
Abbreviations: AMOVA, analysis of molecular variance; CS, Chinese Spring; DArT, diversity arrays technology; Fst, fixation index; GWAS, Genome-wide association study; IT, infection type; LD, linkage dis-equilibrium; MAF, minor allele frequency; NSGC, National Small Grains Collection; PCA, principle component analysis; PIC, poly-morphic information content; QTL, quantitative trait loci; SNP, single-nucleotide polymorphism; SSR, simple-sequence repeat.
Core Ideas
• Characterized the utility of a core subset of USDA–NSGC worldwide durum wheat accessions
• The durum core subset captured a considerable amount of genetic diversity
• Identified accessions’ resistance to wheat stem rust pathogen races
• Assessed genome-wide LD present in the durum core subset
• Revealed novel genes or QTL associated with stem rust resistance in durum wheat
Published online July 13, 2017
2 of 13 the plant genome july 2017 vol. 10, no. 2
eastern Africa and its rapidly evolving lineage are par-ticularly alarming because of their broad virulence to many stem rust resistance (Sr) genes commonly found in wheat cultivars and impacting >90% of the wheat culti-vars grown worldwide (Jin et al., 2007; Singh et al., 2011). Compared with common wheat, a greater percentage of durum wheat germplasm is resistant to race TTKSK, particularly those developed in North America (Jin et al., 2007; Pozniak et al., 2008). This more frequent resistance is mostly provided by the Sr13 gene originating from Khapli, an emmer wheat (T. turgidum, ssp. dicoccum) (Jin et al., 2007; Klindworth et al., 2007). However, races JRCQC and TRTTF, identified in Ethiopia and Yemen, respectively, were characterized as virulent to Sr13 and Sr9e (Olivera et al., 2012b), thus rendering many durum cultivars vulnerable to stem rust.
Currently, more than 70 Sr genes have been char-acterized in wheat (McIntosh et al., 2013, 2014; Rah-matov et al., 2016), ~34 of which remain effective against races of the Ug99 lineage (Singh et al., 2015). Molecular markers linked to many of these genes are readily avail-able (http://maswheat.ucdavis.edu). Genetic studies to identify and map new sources of resistance genes are underway worldwide through a concerted effort orga-nized by the Borlaug Global Rust Initiative (http://www.globalrust.org). However, most of these studies have focused on the stem rust resistance in common wheat and wild relatives of wheat, and the genetics of stem rust resistance in durum wheat is less studied. The molecular markers linked to Sr genes developed for common wheat may not always be informative for durum wheat (Haile et al., 2013). Efforts to discover novel Sr genes or alleles in durum wheat have been reported using either bipa-rental mapping populations (Haile et al., 2012; Singh et al., 2013), or association mapping approaches based on a diverse panel of cultivars and breeding lines (Pozniak et al., 2008), or elite accessions (Letta et al., 2013, 2014). Evaluations of the cultivated emmer wheat accessions in the field and at the seedling stage have also identified lines with novel resistance to TTKSK and other races with broad virulence (Olivera et al., 2012a).
The USDA–ARS NSGC located in Aberdeen, ID, is a genebank that maintains collections representing global diversity of small grains and their wild relatives (http://www.ars.usda.gov/main/docs.htm?docid=2884). Since 1897, over 142,000 accessions have been acquired and deposited. Resistance to diseases and insects have been extensively explored in both wheat (Porter et al., 1993; Bonman et al., 2006, 2007; Olivera et al., 2012a; New-comb et al., 2013; Maccaferri et al., 2015b) and barley (Hordeum vulgare L.) (Bonman et al., 2005; Dahleen et al., 2012) accessions, providing valuable resources for crop improvement. A core subset of the small grains col-lection was established in 1995 containing ~10% of the entire collection randomly selected with broad represen-tation of geographic regions. Using high-density SNP markers genetic diversity present in the core set for bar-ley (Muňoz-Amatrian et al., 2014) and common wheat
(Bonman et al., 2015) has been assessed, thus permitting genetic characterization and exploitation of the diverse core set using methods such as association mapping. Of the NSGC accessions, 8325 are durum collected from 80 different countries and regions, with 5700 being landra-ces and the remaining being cultivars and breeding lines. The durum core set is comprised of 782 accessions, and their extent of genetic diversity is not yet investigated.
Genome-wide association studies (GWAS) provide a mapping approach that exploits historical recombination events accumulated over many generations in a mapping panel and allows associations of DNA markers and trait gene and quantitative trait loci (QTL) to be detected when they are in LD. In self-pollinated crops, such as barley and wheat, as demonstrated in previous studies, the extent of LD varied on different chromosomes (Chao et al., 2010; Muňoz-Amatrian et al., 2014), presumably a result of selection pressure at regions associated with important agronomic traits. Linkage disequilibrium patterns can also vary greatly depending on the populations used. In general, cultivars have much higher LD than landraces, while rare outcrossing events occurred in self-pollinated wild species, such as wild barley, were enough to main-tain linkage equilibrium in a large population (Morrell et al., 2005; Hamblin et al., 2011). Previous studies showed that in durum wheat, LD can extend from within 5 to 20 cM in elite cultivars and advanced lines accessed by simple-sequence repeat (SSR) or diversity arrays technol-ogy (DArT) markers (Maccaferri et al., 2005, 2011, 2014; Somers et al., 2007). Knowledge of LD patterns can help determine what constitutes adequate genome coverage for detecting marker and trait associations.
The extent and distribution of LD in the NSGC cul-tivated barley and common wheat accessions have been evaluated (Muňoz-Amatrian et al., 2014; Maccaferri et al., 2015b). Novel QTL associated with stripe rust resistance have been identified from the NSGC common wheat accessions using GWAS (Maccaferri et al., 2015b). In this study, we assessed genetic diversity and LD patterns in a subset of 429 NSGC durum core accessions with spring growth habit. We further evaluated the set for resistance to stem rust using multiple North American Pgt races, and more recently emerged eastern African races, both at the seedling stage and under field conditions and conducted GWAS to identify potentially novel genes and QTL associ-ated with stem rust resistance in durum wheat.
Materials and Methods
Plant MaterialsA total of 497 NSGC durum wheat lines from the durum core subset selected as part of the Triticeae Coordinated Agricultural Project were obtained from USDA–ARS NSGC at Aberdeen, ID, for this study. This sample rep-resents 80% of the spring habit accessions in the durum core subset. Limited information indicated that these accessions were acquired between 1900 and 2004 (Supple-mental Table S1). Seed increase was performed in the field
chao et al.: nsgc durum wheats and stem rust resistance 3 of 13
at Prosper, ND, in 2012 and in 2013 from heads harvested in the greenhouse. Sixty-four duplicate lines with identi-cal SNP genotypes were identified and merged, and the line with the most complete data was retained. Two hexa-ploid wheat accessions (PI 477895 and PI 585023) misclas-sified as durum were identified and eliminated based on cytogenetics analysis. After removing two lines (PI 68288 and PI 78810) with winter habit, the final set containing 429 unique durum wheat accessions with spring habit, representing 69% of the spring habit accessions in the core subset, was used for the analyses performed in this study. The improvement status recorded in the passport data indicated that 75 accessions were breeding materi-als, 49 were cultivars, 113 were of uncertain improvement status, and 192 were landraces (Supplemental Table S1). Except for five accessions with unknown country of ori-gin, the other 424, representing 64 countries and regions, were grouped based on geographic origin for data analy-sis. The groups included Africa containing 78 accessions from 13 countries, the Americas containing 80 accessions from 11 countries, Asia including 150 accessions from 22 countries, and Europe including 116 accessions from 18 countries (Supplemental Table S2).
Phenotype DataThe entire 497 accessions were evaluated for stem rust resistance both at the seedling stage in the greenhouse and at the adult plant stage in the field. Phenotypic evalu-ation results can be accessed from The Triticeae Toolbox Wheat database (https://triticeaetoolbox.org/wheat/).
Seedling EvaluationsSeedling tests were performed using five Pgt races, BCCBC, TTTTF, TTKSK, TRTTF, and JRCQC (Table 1), and a bulk of six races, MCCFC, QFCSC, QTHJC, RCRSC, RKQQC, and TPMKC (isolates 59KS19, 06ND76C, 75ND717C, 77ND82A, 99KS76A, and 74MN1409, respectively). Except for three races, TTKSK, TRTTF, and JRCQC, originating from Kenya, Yemen, and Ethiopia, respectively, the other races were collected from the United States. The evaluation experiments were conducted at the USDA–ARS Cereal Disease Labora-tory, St. Paul, MN, following the procedure described by Rouse et al. (2011). Briefly, six seeds per accession were planted in trays filled with vermiculite. The 8- to 9-d-old seedling plants were inoculated with Pgt urediniospores. After inoculation, the plants were grown in a greenhouse
at 22 2C and 18 2C (day and night temperature, respectively) with supplemental lighting for a photoperiod of 16 h. Plants were scored at 14 d after inoculation using the infection type (IT) scale (0, ; , 1, 2, 3, and 4) described by Stakman et al. (1962). Two symbols, “−” and “+”, were used to indicate smaller and larger pustules, respectively, for each of ITs 1, 2, or 3 (Roelfs and Martens, 1988). To estimate the frequency of the accessions resistant to dif-ferent races at the seedling stage, lines were grouped in three categories based on IT scores. Those with IT 2 were considered as resistant (R), those with IT between 2+ and 3− were intermediate (I), and those with IT 3 were susceptible (S) (Supplemental Table S3).
Field EvaluationsField experiments for evaluating resistance at the adult plant stage were performed in St. Paul, MN, from April to July in three seasons from 2012 to 2014 and in Debre Zeit, Ethiopia from June to October in 2014 following the experiment procedures described by Olivera et al. (2012a). At the St. Paul location, the accessions were planted in one-row (1 m long) plots with one replicate in each of the three seasons, and the inoculum contained a mix-ture of six US races (MCCFC, QFCSC, QTHJC, RCRSC, RKQQC, and TPMKC). At Debre Zeit, the accessions were planted in two-row (1 m long) plots in a random complete block design with two replicates, and the inocu-lum was a bulk of urediniospores (including races TTKSK and JRCQC) collected from durum wheat. In both nurseries, a mixture of susceptible wheat cultivars were planted perpendicular to all entries as stem rust spread-ers. The plants in spreader rows were artificially inocu-lated two to three times (once a week) starting at stem elongation stage. The infection response (pustule type and size) and disease severity (percentage of infected tissue) were generally scored at two different dates at the soft-dough stage. In the St. Paul, MN, trials, higher missing scores were observed for one of the two ratings in Season 1 (season1_2) and Season 3 (season3_1) (Supplemental Table S3). This was mainly because the rating date was not ideal for durum wheat. For example, the second rating for Season 1 (season1_2) was too late when most plants rated in the first rating were already matured by the sec-ond rating, while the first rating for Season 3 (season3_1) was too early for most plants. Disease severity was deter-mined based on the modified Cobb Scale (Peterson et al., 1948). The infection response was scored as R, MR, MS,
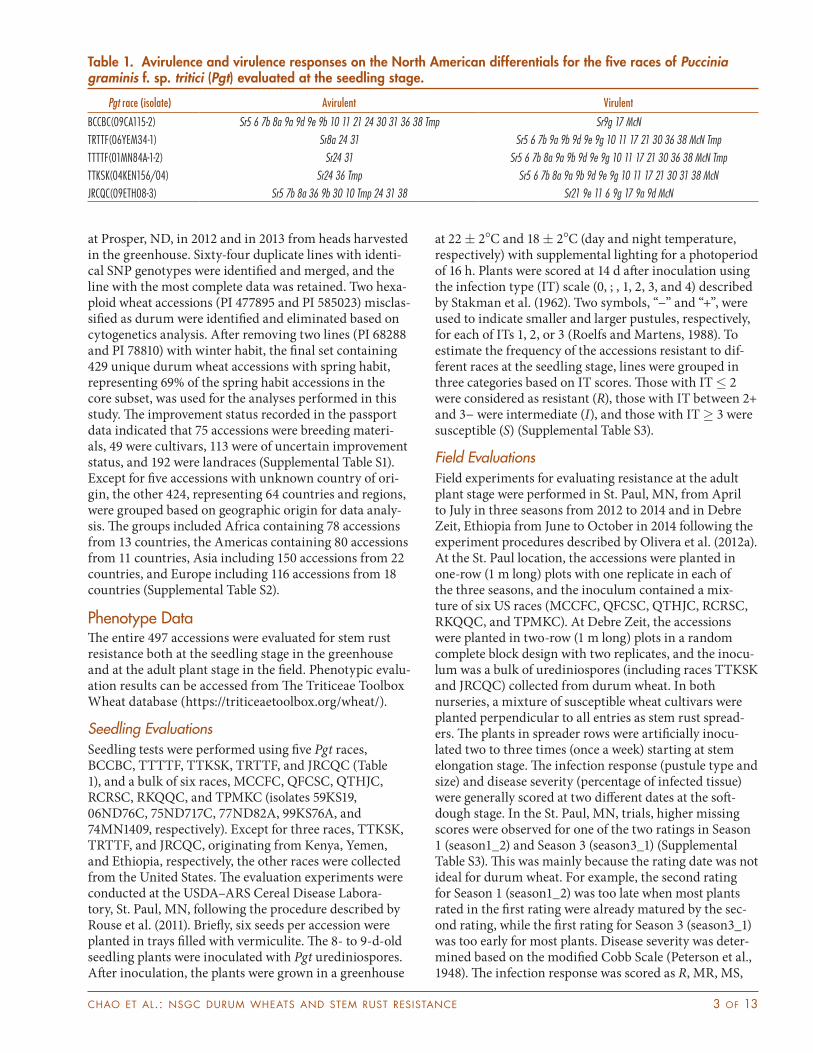
Table 1. Avirulence and virulence responses on the North American differentials for the five races of Puccinia graminis f. sp. tritici (Pgt) evaluated at the seedling stage.
Pgt race (isolate) Avirulent Virulent
BCCBC(09CA115-2) Sr5 6 7b 8a 9a 9d 9e 9b 10 11 21 24 30 31 36 38 Tmp Sr9g 17 McNTRTTF(06YEM34-1) Sr8a 24 31 Sr5 6 7b 9a 9b 9d 9e 9g 10 11 17 21 30 36 38 McN TmpTTTTF(01MN84A-1-2) Sr24 31 Sr5 6 7b 8a 9a 9b 9d 9e 9g 10 11 17 21 30 36 38 McN TmpTTKSK(04KEN156/04) Sr24 36 Tmp Sr5 6 7b 8a 9a 9b 9d 9e 9g 10 11 17 21 30 31 38 McNJRCQC(09ETH08-3) Sr5 7b 8a 36 9b 30 10 Tmp 24 31 38 Sr21 9e 11 6 9g 17 9a 9d McN
4 of 13 the plant genome july 2017 vol. 10, no. 2
and S categories for resistant, moderately resistant, mod-erately susceptible, and susceptible, respectively (Roelfs et al., 1992). Combinations of single categories were also recorded when two different infection responses occurred on a single stem. To calculate the frequency of adult plant resistance in the set, the accessions were grouped in resis-tant and susceptible categories as described by Newcomb et al. (2013) (Supplemental Table S3).
For GWAS, both seedling scores and field disease rat-ings were linearized using a custom Perl script (https://github.com/umngao/rust_scores_conversion) (Gao et al., 2016). The seedling IT scores were converted using a scale of 0 to 9 following the method described by Zhang et al. (2014). The adult plant disease ratings from each replicate or season were converted to coefficient of infec-tion values by multiplying disease severity values on a scale of 0 to 100 by infection response ratings linearized to a scale of 0 to 1 based on the method of Yu et al. (2011). Ethiopia data set was obtained from one field season with two replications, and least-squares means were calculated across replicates to obtain adult plant disease values from the Ethiopia trial by fitting genotype as a fixed effect in a linear model using JMP (v.11; SAS Institute, 2014a) (Supplemental Table S3). The fixed effect model used was xij = + ai + ij, where ai is the ith line fixed effect, and ij is residual error. The St. Paul data set was obtained from three field seasons with one replication in each season, and best linear unbiased prediction values were estimated across all three seasons for the St. Paul, MN, field trials by fitting genotype as a random effect in a linear mixed model using lmer function in the lme4 package (Bates et al., 2015) for R (https://www.r-project.org/) (Supplemental Table S3). The random effect model used was xij = + ai + bj + ij, where ai is the ith line random effect, bj is the jth year random effect, and ij is residual error.
Genotype DataThe entire set of 497 accessions were genotyped with Illumina’s iSelect wheat 9K array containing 9000 gene-derived SNPs, of which 8632 are functional (Cavanagh et al., 2013), using Illumina’s Infinium method following manufacturer’s protocols. The SNP genotype calls were performed using the genotyping module implemented in the Illumina’s GenomeStudio software v.2011.1. Genotype data were manually inspected for call accuracy before exporting the data file containing 6538 polymorphic SNP markers, and are publicly available from The Triticeae Toolbox Wheat database (https://triticeaetoolbox.org/wheat/). After converting heterozygote calls to missing data, SNPs with a missing data rate of 10% or higher were filtered out. The high-density SNP based consensus map developed for tetraploid wheat (Maccaferri et al., 2015a) was then used to remove SNPs with no map information, and the resulting final data set retained 3806 SNP markers.
Genetic Diversity and Genome-Wide Association AnalysisUsing the full data set containing 3806 SNP markers, genetic diversity measured as polymorphic information content (PIC) (Weir, 1996) was calculated for all samples and for samples grouped based on improvement status and geographic origin separately using JMP Genomics 7 (SAS Institute, 2014b).
Linkage disequilibrium between markers measured as r2, representing the correlation between alleles at two loci, was calculated by TASSEL4 (Bradbury et al., 2007). To reduce large variances from rare alleles, a subset of 2827 SNPs with minor allele frequency (MAF) 0.10 was used to calculate LD (Remington et al., 2001). The p-values for the LD estimates were determined based on a two-sided Fisher’s exact test. Linkage disequilibrium decay with genetic distance in centimorgans between markers on the same chromosomes was evaluated by nonlinear regression following the method described by Remington et al. (2001) using nls function in R (https://www.r-project.org/). The 95th percentile of r2 distribution for unlinked markers was taken as a population-specific critical value for back-ground LD (Breseghello and Sorrells, 2006).
Population structure was analyzed using both prin-ciple component analysis (PCA) in R (https://www.r-proj-ect.org/), and a Bayesian clustering method implemented in Structure v.2.3.4 (Pritchard et al., 2000). To minimize overestimation of the number of subpopulation affected by SNPs in strong LD, the Structure analysis was per-formed using a subset of 694 SNPs with LD at r2 < 0.2 by setting the number of subpopulations (k) from 1 to 8 with each run repeated 10 times. The length of burn-in period was set at 5000 followed by a simulation run length set at 10,000 using admixture model and correlated allele frequency (Falush et al., 2003). To estimate the optimal number of subpopulations, ∆k values were calculated using the log probability [LnP(D)] values according to Evanno et al. (2005). The graphical display of population structure showing the proportion of the genomes from each of the accessions clustered in the subpopulations was done using the software program Distruct (Rosenberg, 2004) (Supplemental Fig. S1). To investigate the amount of genetic variation and population differentiation for sam-ples from different geographic origin and within the same origin, analysis of molecular variance (AMOVA) was per-formed using Arlequin v.3.5 (Excoffier et al., 2005).
For GWAS, the data set was first filtered by removing SNPs with MAF below 0.01. Because markers in perfect LD generally provided no additional information, a tag SNP was selected representing SNPs in perfect LD (r2 = 1.0) using the LD tag SNP Selection function in JMP Genomics 7 (SAS Institute, 2014b). The resulting data set used for GWAS contained 3268 SNPs distributed on a map spanning a total of 2530 cM on 14 chromosomes. Association analysis for individual traits was performed using the GWAS function implemented in rrBLUP 4 (Endelman, 2011) in R (https://www.r-project.org/) based on the efficient mixed-model association eXpedited
chao et al.: nsgc durum wheats and stem rust resistance 5 of 13
algorithm (Kang et al., 2010). Two models, K-only and P+K, were tested and compared. In the K-only model, an identical-in-state kinship (K) matrix was calculated to estimate phenotypic covariance from relatedness. The P+K model contained both the K matrix fitted as a random effect and the first two principle components (P) accounting for 12.1 and 6.1%, respectively, of the pheno-typic variations as fixed effects. The threshold to declare significant associations was calculated using the qvalue package incorporated in rrBLUP that corresponds to a false discovery rate of 0.05. Chromosome and chromo-some arm locations for markers significantly associated with the disease responses to Pgt races were determined by BLASTn searches of the SNP contextual sequences against the Chinese Spring (CS) chromosome survey sequences (http://wheat-urgi.versailles.inra.fr/Seq-Repos-itory/BLAST). The best hits with e-value cutoff at 1 10−30 were extracted from the BLASTn output. Genotype data and phenotype data (Supplemental Table S3) used for GWAS are available from the GrainGenes database (http://wheat.pw.usda.gov/GG3/).
Results
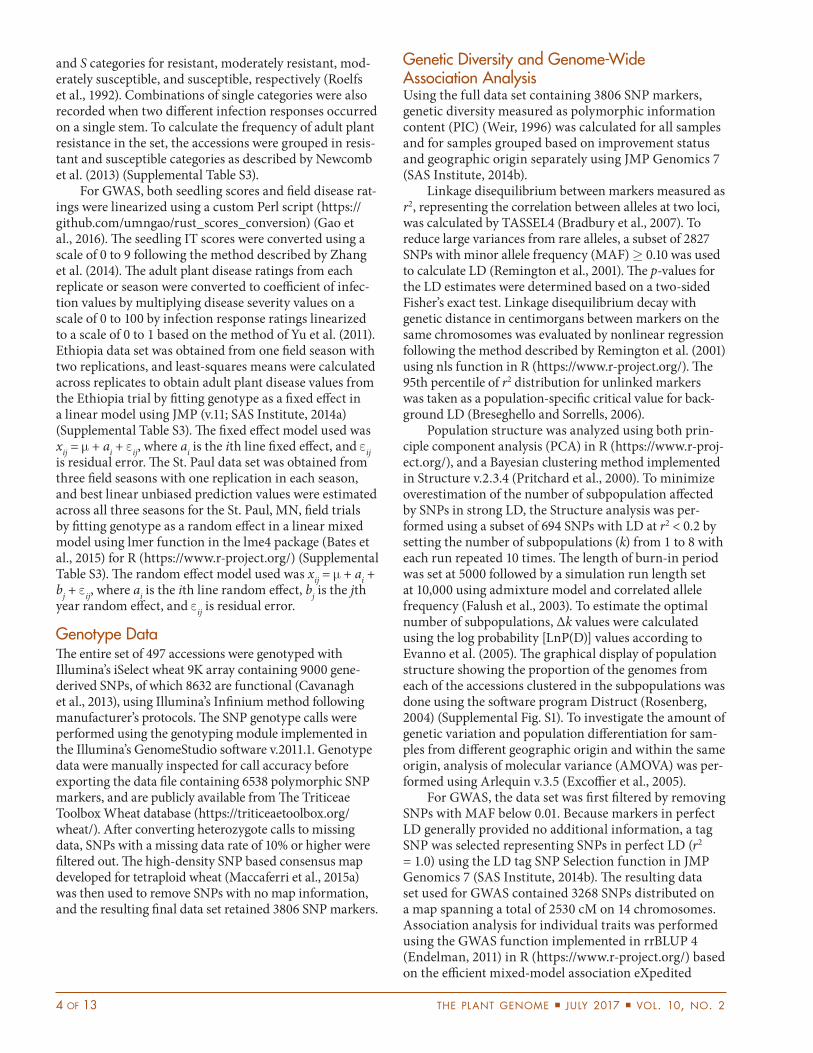
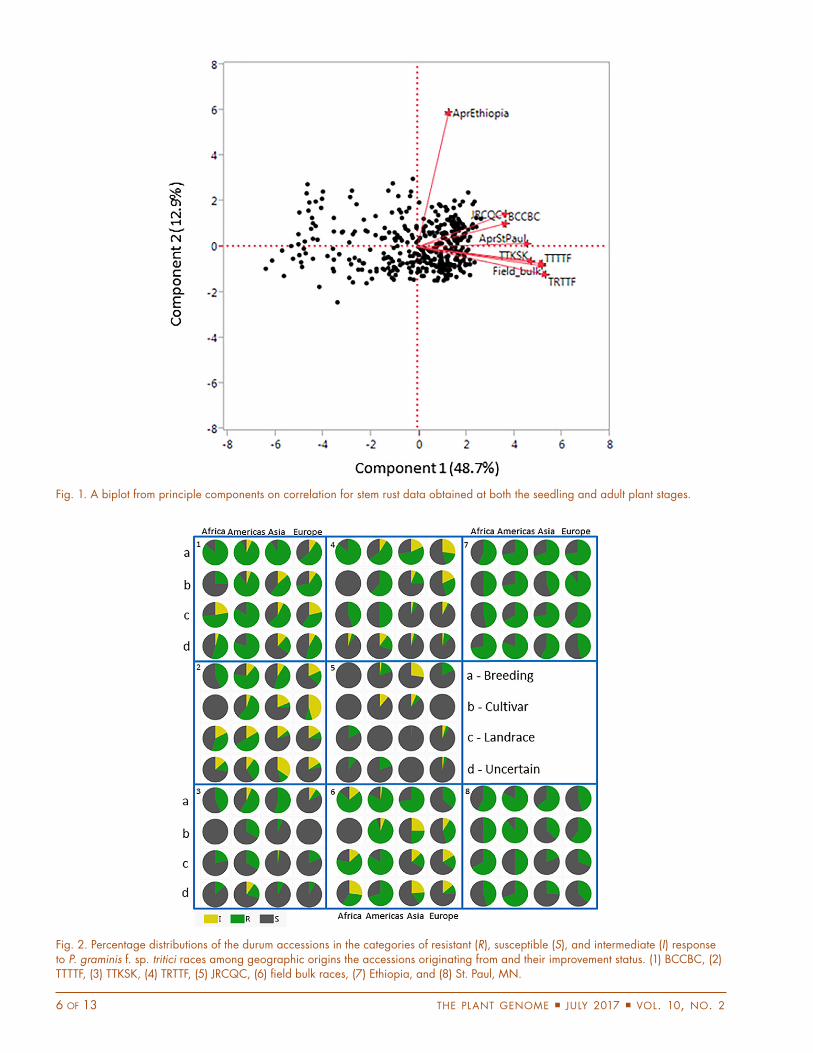
Host Resistance to Stem Rust in Durum AccessionsWe evaluated a subset of the spring habit accessions from the NSGC durum wheat core for their responses to five Pgt races and a mixture of six races at the seedling stage and observed various frequencies of resistance to different races (Table 2). The highest frequency of resistance was found to race BCCBC (56.1%)—a very avirulent race—and to the bulked North American races (38.5%). The fre-quencies of resistance to the four races, JRCQC, TTKSK, TTTTF, and TRTTF, were 7, 17, 22.2, and 22.5%, respec-tively. Although only 29 (7%) accessions were resistant to JRCQC—a highly virulent race from Ethiopia—three were highly resistant exhibiting an immune response (IT 0 and 0;) (Table 2; Supplemental Table S3). Acces-sions highly resistant to TRTTF (18)—a virulent race from Yemen—and to the North American race TTTTF (14) were also observed. The 14 accessions exhibiting an immune or near-immune response to race TTTTF all had low IT (2) to race TRTTF, with 12 of them also having low IT to race TTKSK. In contrast to the seedling evalua-tions, a much higher frequency of resistance was observed under the field conditions in both Ethiopia (63.7%) and the United States (45.9%) (Table 2). Except for the field data obtained from Ethiopia, correlations between the various tests were highly significant (p < 0.001) (Fig. 1). The lack of correlation for the Ethiopia test was possibly due to a strong environmental influence on the genotype race interactions, although more field experiments are needed to further confirm this hypothesis.
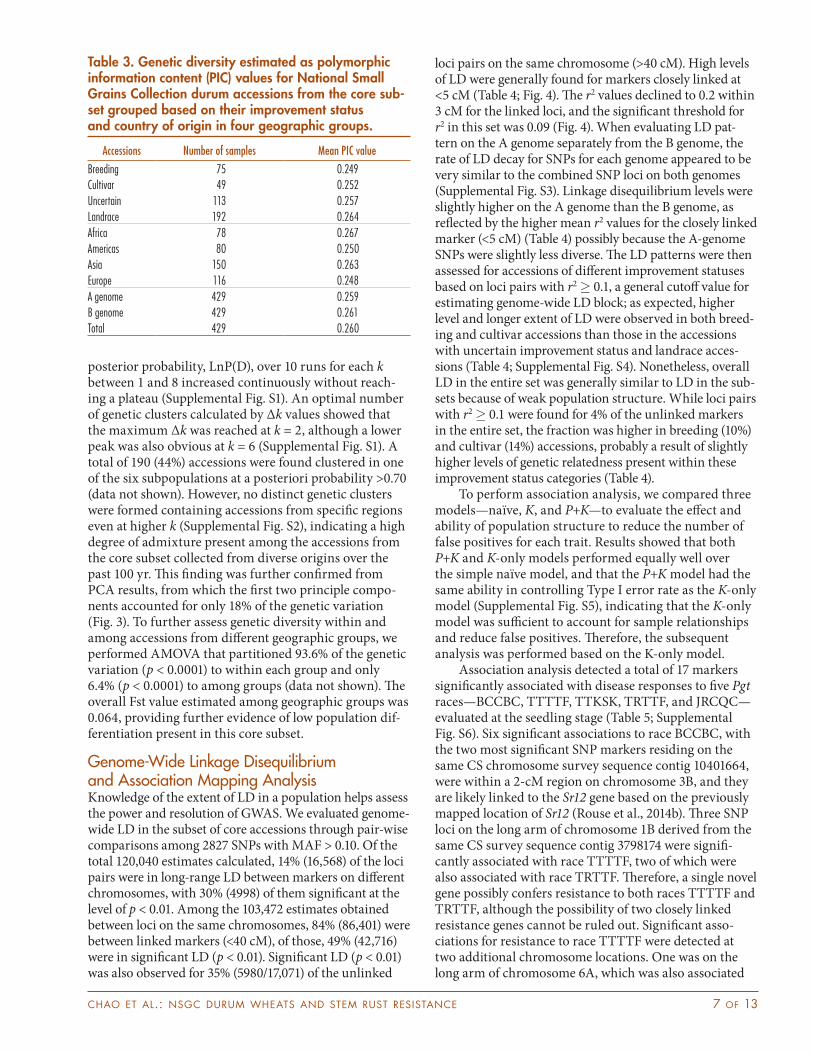
To examine the percentage distributions of the durum accessions from different geographic origin and at different improvement status in terms of dis-ease responses, the accessions were grouped in three
categories—resistant, susceptible, and intermediate—from the seedling scores, but in two categories for the field ratings—resistant and susceptible (Fig. 2). In general, resistant accessions to different races were well-repre-sented in countries from all geographic origins. Although ample resistance sources were present among accessions of various improvement statuses, a higher proportion of breeding lines, in particular, were more resistant to TTTTF and three African races, TTKSK, TRTTF, and JRCQC. Except for race JRCQC, accessions resistant to TTKSK, TRTTF and TTTTF were also represented in both uncertain improvement status and landrace cat-egories. Cultivars developed in the Americas generally had a much higher frequency of resistance to these races than those from Africa, where none of the cultivars were resistant to TTTTF and the three African races evaluated. Altogether 12 accession were identified as resistant or intermediate to all races at the seedling stage and in the two field locations, of those, five were resistant to all races evaluated (Supplemental Table S3): CItr 15769 (a breeding line from the United States), PI 94758 (a line with uncer-tain improvement status from Ethiopia), and three land-races from Ethiopia, PI 298547, PI 479941, and PI 479983.
Genetic Diversity and Population StructureAmong the durum accessions studied, PIC values ranged from 0.018 to 0.375 (data not shown) with a mean of 0.260, and the B-genome SNPs were slightly more diverse than those on the A genome (Table 3). Mean PIC values were then calculated for the accessions in improvement status and in geographic origin, separately (Table 3). Higher levels of genetic diversity were observed for land-race and accessions of uncertain improvement status, and accessions originating from the African countries tended to be more diverse than those from other regions (Table 3). Population structure among accessions in the four geographic groups was investigated using both a model-based clustering method implemented in the Structure program and PCA. From Structure results, mean log
Table 2. Number and percentage of National Small Grains Collection accessions sampled from the durum core subset exhibiting resistant, susceptible, and inter-mediate responses to different P. graminis f. sp. tritici races at the seedling stage and in the field evaluations.
Race Resistant Susceptible Intermediate
———————————— % ———————————— Seedling evaluations BCCBC 238 (56.1) 144 (34.0) 42 (9.9) TTTTF 95 (22.2) 264 (61.7) 69 (16.1) TTKSK 73 (17.0) 350 (81.6) 6 (1.4) TRTTF 96 (22.5) 308 (72.1) 23 (5.4) JRCQC 29 (7.0) 378 (90.6) 10 (2.4) Field bulk 163 (38.5) 208 (49.2) 52 (12.3)Field evaluations Ethiopia 267 (63.7) 152 (36.3) – St. Paul, MN 191 (45.9) 225 (54.1) –
6 of 13 the plant genome july 2017 vol. 10, no. 2
Fig. 1. A biplot from principle components on correlation for stem rust data obtained at both the seedling and adult plant stages.
Fig. 2. Percentage distributions of the durum accessions in the categories of resistant (R), susceptible (S), and intermediate (I) response to P. graminis f. sp. tritici races among geographic origins the accessions originating from and their improvement status. (1) BCCBC, (2) TTTTF, (3) TTKSK, (4) TRTTF, (5) JRCQC, (6) field bulk races, (7) Ethiopia, and (8) St. Paul, MN.
chao et al.: nsgc durum wheats and stem rust resistance 7 of 13
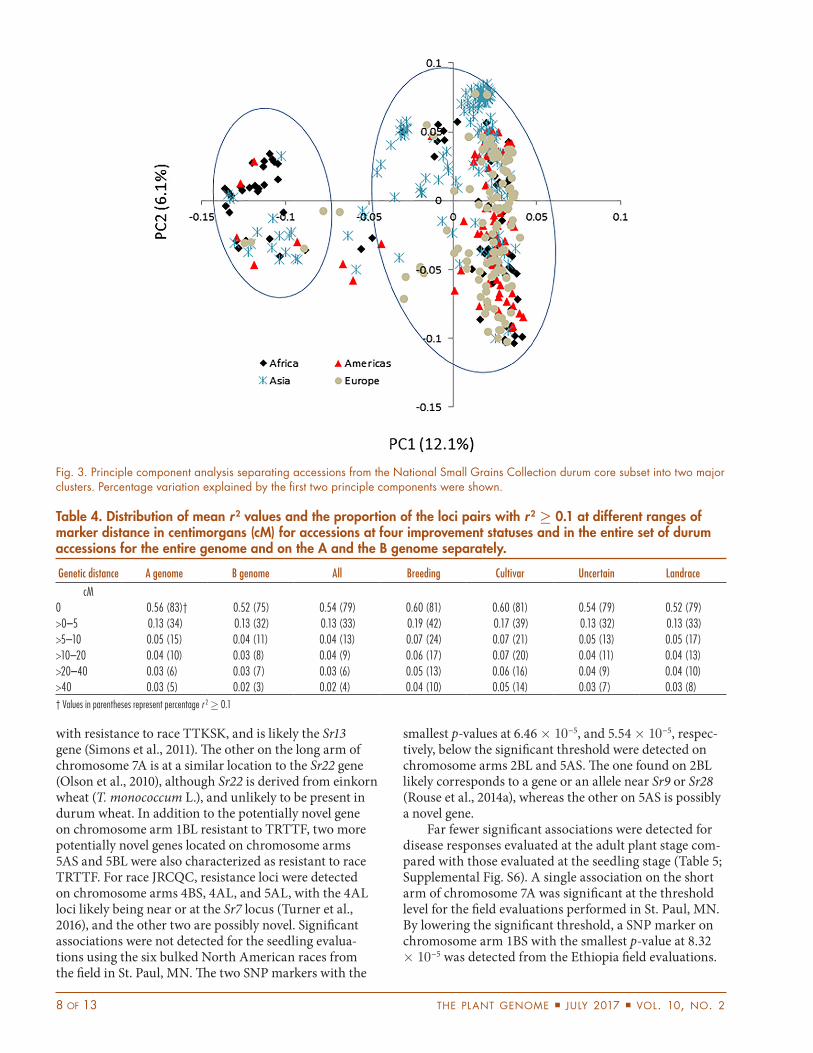
posterior probability, LnP(D), over 10 runs for each k between 1 and 8 increased continuously without reach-ing a plateau (Supplemental Fig. S1). An optimal number of genetic clusters calculated by ∆k values showed that the maximum ∆k was reached at k = 2, although a lower peak was also obvious at k = 6 (Supplemental Fig. S1). A total of 190 (44%) accessions were found clustered in one of the six subpopulations at a posteriori probability >0.70 (data not shown). However, no distinct genetic clusters were formed containing accessions from specific regions even at higher k (Supplemental Fig. S2), indicating a high degree of admixture present among the accessions from the core subset collected from diverse origins over the past 100 yr. This finding was further confirmed from PCA results, from which the first two principle compo-nents accounted for only 18% of the genetic variation (Fig. 3). To further assess genetic diversity within and among accessions from different geographic groups, we performed AMOVA that partitioned 93.6% of the genetic variation (p < 0.0001) to within each group and only 6.4% (p < 0.0001) to among groups (data not shown). The overall Fst value estimated among geographic groups was 0.064, providing further evidence of low population dif-ferentiation present in this core subset.
Genome-Wide Linkage Disequilibrium and Association Mapping AnalysisKnowledge of the extent of LD in a population helps assess the power and resolution of GWAS. We evaluated genome-wide LD in the subset of core accessions through pair-wise comparisons among 2827 SNPs with MAF > 0.10. Of the total 120,040 estimates calculated, 14% (16,568) of the loci pairs were in long-range LD between markers on different chromosomes, with 30% (4998) of them significant at the level of p < 0.01. Among the 103,472 estimates obtained between loci on the same chromosomes, 84% (86,401) were between linked markers (<40 cM), of those, 49% (42,716) were in significant LD (p < 0.01). Significant LD (p < 0.01) was also observed for 35% (5980/17,071) of the unlinked
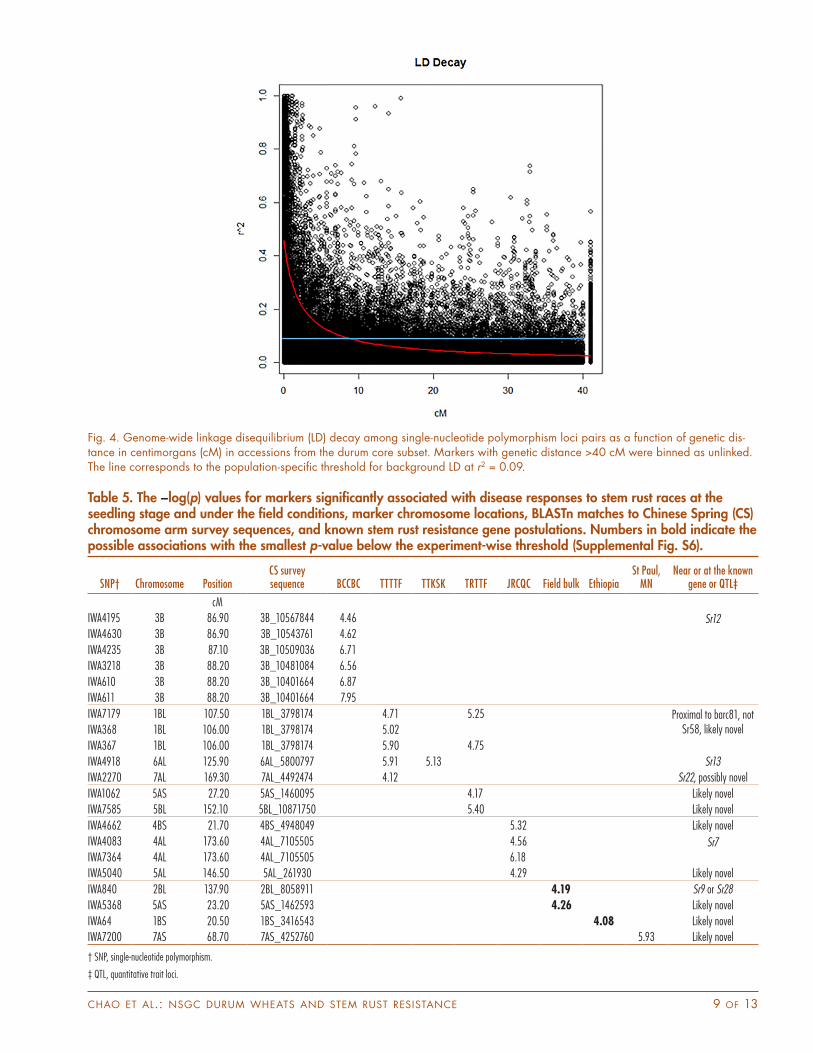
loci pairs on the same chromosome (>40 cM). High levels of LD were generally found for markers closely linked at <5 cM (Table 4; Fig. 4). The r2 values declined to 0.2 within 3 cM for the linked loci, and the significant threshold for r2 in this set was 0.09 (Fig. 4). When evaluating LD pat-tern on the A genome separately from the B genome, the rate of LD decay for SNPs for each genome appeared to be very similar to the combined SNP loci on both genomes (Supplemental Fig. S3). Linkage disequilibrium levels were slightly higher on the A genome than the B genome, as reflected by the higher mean r2 values for the closely linked marker (<5 cM) (Table 4) possibly because the A-genome SNPs were slightly less diverse. The LD patterns were then assessed for accessions of different improvement statuses based on loci pairs with r2 0.1, a general cutoff value for estimating genome-wide LD block; as expected, higher level and longer extent of LD were observed in both breed-ing and cultivar accessions than those in the accessions with uncertain improvement status and landrace acces-sions (Table 4; Supplemental Fig. S4). Nonetheless, overall LD in the entire set was generally similar to LD in the sub-sets because of weak population structure. While loci pairs with r2 0.1 were found for 4% of the unlinked markers in the entire set, the fraction was higher in breeding (10%) and cultivar (14%) accessions, probably a result of slightly higher levels of genetic relatedness present within these improvement status categories (Table 4).
To perform association analysis, we compared three models—naïve, K, and P+K—to evaluate the effect and ability of population structure to reduce the number of false positives for each trait. Results showed that both P+K and K-only models performed equally well over the simple naïve model, and that the P+K model had the same ability in controlling Type I error rate as the K-only model (Supplemental Fig. S5), indicating that the K-only model was sufficient to account for sample relationships and reduce false positives. Therefore, the subsequent analysis was performed based on the K-only model.
Association analysis detected a total of 17 markers significantly associated with disease responses to five Pgt races—BCCBC, TTTTF, TTKSK, TRTTF, and JRCQC—evaluated at the seedling stage (Table 5; Supplemental Fig. S6). Six significant associations to race BCCBC, with the two most significant SNP markers residing on the same CS chromosome survey sequence contig 10401664, were within a 2-cM region on chromosome 3B, and they are likely linked to the Sr12 gene based on the previously mapped location of Sr12 (Rouse et al., 2014b). Three SNP loci on the long arm of chromosome 1B derived from the same CS survey sequence contig 3798174 were signifi-cantly associated with race TTTTF, two of which were also associated with race TRTTF. Therefore, a single novel gene possibly confers resistance to both races TTTTF and TRTTF, although the possibility of two closely linked resistance genes cannot be ruled out. Significant asso-ciations for resistance to race TTTTF were detected at two additional chromosome locations. One was on the long arm of chromosome 6A, which was also associated
Table 3. Genetic diversity estimated as polymorphic information content (PIC) values for National Small Grains Collection durum accessions from the core sub-set grouped based on their improvement status and country of origin in four geographic groups.
Accessions Number of samples Mean PIC value
Breeding 75 0.249Cultivar 49 0.252Uncertain 113 0.257Landrace 192 0.264Africa 78 0.267Americas 80 0.250Asia 150 0.263Europe 116 0.248A genome 429 0.259B genome 429 0.261Total 429 0.260
8 of 13 the plant genome july 2017 vol. 10, no. 2
with resistance to race TTKSK, and is likely the Sr13 gene (Simons et al., 2011). The other on the long arm of chromosome 7A is at a similar location to the Sr22 gene (Olson et al., 2010), although Sr22 is derived from einkorn wheat (T. monococcum L.), and unlikely to be present in durum wheat. In addition to the potentially novel gene on chromosome arm 1BL resistant to TRTTF, two more potentially novel genes located on chromosome arms 5AS and 5BL were also characterized as resistant to race TRTTF. For race JRCQC, resistance loci were detected on chromosome arms 4BS, 4AL, and 5AL, with the 4AL loci likely being near or at the Sr7 locus (Turner et al., 2016), and the other two are possibly novel. Significant associations were not detected for the seedling evalua-tions using the six bulked North American races from the field in St. Paul, MN. The two SNP markers with the
smallest p-values at 6.46 −5, and 5.54 −5, respec-tively, below the significant threshold were detected on chromosome arms 2BL and 5AS. The one found on 2BL likely corresponds to a gene or an allele near Sr9 or Sr28 (Rouse et al., 2014a), whereas the other on 5AS is possibly a novel gene.
Far fewer significant associations were detected for disease responses evaluated at the adult plant stage com-pared with those evaluated at the seedling stage (Table 5; Supplemental Fig. S6). A single association on the short arm of chromosome 7A was significant at the threshold level for the field evaluations performed in St. Paul, MN. By lowering the significant threshold, a SNP marker on chromosome arm 1BS with the smallest p-value at 8.32 −5 was detected from the Ethiopia field evaluations.
Fig. 3. Principle component analysis separating accessions from the National Small Grains Collection durum core subset into two major clusters. Percentage variation explained by the first two principle components were shown.
Table 4. Distribution of mean r2 values and the proportion of the loci pairs with r2 ³ 0.1 at different ranges of marker distance in centimorgans (cM) for accessions at four improvement statuses and in the entire set of durum accessions for the entire genome and on the A and the B genome separately.
Genetic distance A genome B genome All Breeding Cultivar Uncertain Landrace
cM0 0.56 (83)† 0.52 (75) 0.54 (79) 0.60 (81) 0.60 (81) 0.54 (79) 0.52 (79)>0–5 0.13 (34) 0.13 (32) 0.13 (33) 0.19 (42) 0.17 (39) 0.13 (32) 0.13 (33)>5–10 0.05 (15) 0.04 (11) 0.04 (13) 0.07 (24) 0.07 (21) 0.05 (13) 0.05 (17)>10–20 0.04 (10) 0.03 (8) 0.04 (9) 0.06 (17) 0.07 (20) 0.04 (11) 0.04 (13)>20–40 0.03 (6) 0.03 (7) 0.03 (6) 0.05 (13) 0.06 (16) 0.04 (9) 0.04 (10)>40 0.03 (5) 0.02 (3) 0.02 (4) 0.04 (10) 0.05 (14) 0.03 (7) 0.03 (8)† Values in parentheses represent percentage r 2 0.1
chao et al.: nsgc durum wheats and stem rust resistance 9 of 13
Fig. 4. Genome-wide linkage disequilibrium (LD) decay among single-nucleotide polymorphism loci pairs as a function of genetic dis-tance in centimorgans (cM) in accessions from the durum core subset. Markers with genetic distance >40 cM were binned as unlinked. The line corresponds to the population-specific threshold for background LD at r2 = 0.09.
Table 5. The −log(p) values for markers significantly associated with disease responses to stem rust races at the seedling stage and under the field conditions, marker chromosome locations, BLASTn matches to Chinese Spring (CS) chromosome arm survey sequences, and known stem rust resistance gene postulations. Numbers in bold indicate the possible associations with the smallest p-value below the experiment-wise threshold (Supplemental Fig. S6).
SNP† Chromosome PositionCS survey sequence BCCBC TTTTF TTKSK TRTTF JRCQC Field bulk Ethiopia
St Paul, MN
Near or at the known gene or QTL‡
cMIWA4195 3B 86.90 3B_10567844 4.46 Sr12IWA4630 3B 86.90 3B_10543761 4.62IWA4235 3B 87.10 3B_10509036 6.71IWA3218 3B 88.20 3B_10481084 6.56IWA610 3B 88.20 3B_10401664 6.87IWA611 3B 88.20 3B_10401664 7.95IWA7179 1BL 107.50 1BL_3798174 4.71 5.25 Proximal to barc81, not
Sr58, likely novelIWA368 1BL 106.00 1BL_3798174 5.02IWA367 1BL 106.00 1BL_3798174 5.90 4.75IWA4918 6AL 125.90 6AL_5800797 5.91 5.13 Sr13IWA2270 7AL 169.30 7AL_4492474 4.12 Sr22, possibly novelIWA1062 5AS 27.20 5AS_1460095 4.17 Likely novelIWA7585 5BL 152.10 5BL_10871750 5.40 Likely novelIWA4662 4BS 21.70 4BS_4948049 5.32 Likely novelIWA4083 4AL 173.60 4AL_7105505 4.56 Sr7IWA7364 4AL 173.60 4AL_7105505 6.18IWA5040 5AL 146.50 5AL_261930 4.29 Likely novelIWA840 2BL 137.90 2BL_8058911 4.19 Sr9 or Sr28IWA5368 5AS 23.20 5AS_1462593 4.26 Likely novelIWA64 1BS 20.50 1BS_3416543 4.08 Likely novelIWA7200 7AS 68.70 7AS_4252760 5.93 Likely novel
† SNP, single-nucleotide polymorphism.
‡ QTL, quantitative trait loci.
10 of 13 the plant genome july 2017 vol. 10, no. 2
DiscussionGenetic Diversity and Linkage Disequilibrium Pattern of the National Small Grains Collection Durum Core AccessionsIn this study, we evaluated 429 durum accessions with spring habit deposited at USDA–ARS NSGC representing 69% of the spring accessions from the durum core subset and originating from 64 countries worldwide. Genetic diversity estimated using wheat SNP markers showed a mean PIC value of 0.26 for this set (Table 3). While it is not possible to compare SNP marker diversity in this material with SSR marker-based diversity in the diverse and elite durum germplasm reported previously (Mac-caferri et al., 2005; Somers et al., 2007), a separate study using SNP markers on a set of 150 worldwide durum wheats, including both landraces and cultivars, showed a mean PIC value of 0.19 (Ren et al., 2013). Similar levels of marker diversity present in both cultivars and landraces in the current set further indicated that a considerable amount of diversity was captured in this historical and worldwide durum collection. Population structure was generally weak among the accessions originating from different geographical origins with Fst values ranging from 0.05 to 0.08, suggesting that either germplasm was frequently shared among researchers from differ-ent countries, or limited selection pressure and genetic drift maintained high levels of genetic diversity in this set as evidenced by a large proportion of genetic variance within geographic origins from the AMOVA test.
Assessments of LD patterns have been reported in cultivated durum wheat before, but those studies were mostly based on SSR or DArT markers. Depending on the germplasm evaluated, LD extent varied from within 5 cM in a diverse set of 93 breeding lines (Somers et al., 2007) and 183 accessions adapted to the Mediterranean areas (Maccaferri et al., 2014), to 10 cM in a population of 189 cultivars and advanced breeding lines mostly from the Mediterranean regions (Maccaferri et al., 2006, 2011), and to 20 cM in 134 worldwide accessions (Maccaferri et al., 2005). It might not be prudent to directly compare LD patterns measured using multiallelic markers with that measured with biallelic markers (Hedrick, 1987). In addition, we used far more SNP markers (2827) to assess the LD pattern than any of the previous studies. With these two caveats, it seemed that average LD estimates between loci pairs at different genetic distances were gen-erally lower in the present study than those observed in the study using 183 accessions from the Mediterranean regions evaluated by 957 SSR or sequence-tagged site and DArT markers (Maccaferri et al., 2014). This result implied that LD decayed much faster, particularly after 5 cM, in the NSGC core subset population providing ade-quate resolution for finding closely linked markers using an association mapping approach.
Identification of Genomic Regions Potentially Harboring Novel Stem Rust Resistance GenesExcept for the lower frequency of resistance to race JRCQC, we observed >15% of the accessions to be resistant to the other four Pgt races (BCCBC, TTTTF, TTKSK, and TRTTF) at the seedling stage (Table 2). Results also showed that a high proportion of breed-ing materials were resistant to the races at the seedling stage and that accessions originating from the Americas tended to be more resistant than accessions from other geographic areas (Fig. 2). These findings generally agreed with the results of Olivera et al. (2012b), who evaluated 137 NSGC durum accessions, of which 66 accessions were included in the set used in the present study, for their responses to races TTKSK, TRTTF, and JRCQC at the seedling stage. They found that 66% of the suscep-tible entries were landraces and materials of uncertain improvement status originating from Africa and Asia.
To identify potentially novel resistance genes, we per-formed association analysis and detected 17 significant associations for resistance to five races at the seedling stage. Nine of these associations likely corresponded to three known Sr genes, Sr7, Sr12, and Sr13, conferring resis-tance to races BCCBC, TTTTF, TTKSK, and JRCQC. The remaining associations likely corresponded to novel genes located at six chromosome arm regions on 1BL, 4BS, 5AS, 5AL, 5BL, and 7AL conferring resistance to races TTTTF, TRTTF, and JRCQC. None of the novel genes discovered in the present study correspond to those found in a previ-ous association mapping analysis based on a set of diverse durum germplasm screened with the same races, TRTTF, TTTTF, TTKSK and JRCQC (Letta et al., 2014). In their study, one of the significant associations identified on chromosome 4AL tagged by a SSR marker, barc78, was 12 cM proximal to the two SNP markers we identified accord-ing to the consensus map for durum wheat (Maccaferri et al., 2015a). Therefore, the 4AL gene found in their study would be different from the postulated Sr7 allele found in our study. In contrast to the GWAS results from using a single race, evaluation of seedling resistance using a mix-ture of six races from the field did not yield any significant associations. A possible explanation is that we were in fact mapping a complex disease resistance trait conditioned by at least six or more resistance genes responsive to the six races used. Previous simulation studies have shown that by increasing the samples surveyed the power to detect associations can be improved for traits controlled by QTL accounting for increasing phenotype variation (Long and Langley 1999; Bradbury et al., 2011). Results from the lat-ter study based on diverse barley breeding populations indicated that one would need 1600 lines to achieve the detection power to above 0.80, assuming 10 QTL with additive effects and heritability of 0.75, using the K-only model (Bradbury et al., 2011). Although it is not possible to estimate the genetic effects of resistant genes to the six races evaluated and their interactions, we speculate that sample size (429) used in this study may have not been large enough to provide adequate detection power.
chao et al.: nsgc durum wheats and stem rust resistance 11 of 13
A much higher frequency of resistant accessions was found in the field assays (Table 2). However, association mapping detected only one significant association in the St. Paul, MN, environment, and one below the exper-iment-wise threshold in the Ethiopia trial. This result is in contrast to the previous field studies performed in Kenya (Pozniak et al., 2008) and in Ethiopia (Letta et al., 2013). Pozniak et al. (2008) used a set of 96 diverse durum wheats from 13 countries and detected >10 loci affect-ing field resistance, five of which were possibly linked to known resistance genes. Using the 183 elite accessions assembled by Maccaferri et al. (2006, 2011), the study of Letta et al. (2013) measured resistance responses to TTKSK and a mixture of durum-specific races through artificial inoculation. They showed over 30 significant associations expressed in multiple environments, five of which mapped near known resistance genes. Environ-mental conditions and the presence of pathogen races in different field settings can vary greatly and made compar-isons among different field trials difficult. Our Ethiopian study was performed in only one environment with two replications where genetic effects confounded by genotype environment interactions not properly accounted for in the model could have reduced the power of association analysis, particularly when there may be many genes for the trait each with smaller effects influencing adult plant resistance (Zhu et al., 2008). Smaller sample size would have reduced the detection power even further.
None of the resistant loci detected for the seedling infections affected field response in our study. However, the locus on chromosome 7AL near the mapped location of Sr22 that conditioned resistance to TTTTF in our study was identified previously as being associated with the field resistance by Pozniak et al. (2008) and Letta et al. (2013), although the former study also showed that this locus was associated with seedling resistance to race Ug99. Though Sr22 was indicated as possibly being detected by Pozniak et al. (2008) and Letta et al. (2013), the presence of Sr22 in durum wheat would be unusual since this gene was derived from einkorn wheat. Further studies are needed to determine if the association detected in durum wheat near the Sr22 locus is indeed conferred by Sr22.
ConclusionWe characterized a set of 429 historical durum accessions in this study. The high levels of genetic diversity, weak genetic structure, and <10 cM of average rate of LD decay found in this set make it suitable for association map-ping studies. Accessions identified in the present study with resistance to the recently emerged virulent races to durum wheat, such as TRTTF and JRCQC, should pro-vide wheat breeders with valuable resources for improv-ing stem rust resistance. The GWAS results provided preliminary evidence of genomic regions potentially har-boring novel stem rust resistance genes in durum wheat. To better understand which resistant accessions carrying particular novel genes, follow up studies are underway to
more precisely map the genes and QTL and study their genetic effects with biparental mapping populations and to develop markers for use by breeders.
Supplemental InformationSupplemental Fig. S1. Population structure analysis.Supplemental Fig. S2. Proportion of the genomes
from each accessions sampled from the NSGC durum core subset clustered in the subpopulations from K = 2 to K = 6. Four populations predefined were accessions grouped in Africa, the Americas, Asia, and Europe.
Supplemental Fig. S3. Genome-wide LD decay esti-mated for SNPs on the wheat A (a) and B (b) genome, and the combined SNP set. The line corresponds to the popu-lation-specific threshold for background LD at r2 = 0.09.
Supplemental Fig. S4. LD decay for samples at differ-ent improvement status and in the entire accessions.
Supplemental Fig. S5. Model comparisons to test the effectiveness of including population structure in the mixed model to control type I error rate. The line in diagonal corresponds to expected p-value distribution. The cumulative distribution of p-values for either K only or P+K model closely followed the expected distribution, indicating both models were equally adequate to reduce spurious associations (Kang et al., 2008).
Supplemental Fig. S6. Quantile–quantile (QQ) plots of the distribution of p-values and genome-wide Man-hattan plots displaying association analysis findings with respect to their genomic positions for each trait. The dash line in the Manhattan plots showed p-value correspond-ing to a false discovery rate of 0.05.
Supplemental Table S1. Passport data for the NSGC durum accessions used.
Supplemental Table S2. Number of NSGC durum accessions, their country or regions, and the geographic origin each accessions grouped into.
Supplemental Table S3. Original disease score, linear-ized data, and accessions grouped in the categories of resis-tant (R), susceptible (S), and intermediate (I). Lines high-lighted exhibited resistant response to all races evaluated.
AcknowledgmentsThe authors like to thank Gebre Hiwot Abraham and Beti Hidbo at Ethiopian Institute of Agricultural Research for their technical support during the rust data collection in Debre Zeit, Ethiopia. This project was supported in part by USDA National Institute of Food and Agriculture, National Research Initiative Competitive Grant 2011-68002-30029 (Tri-ticeae CAP) (SC, HB, JMB), the USDA National Plant Disease Recovery System (MNR), North Dakota Wheat Commission and North Dakota State Board of Agricultural Research Education (MA), and by USDA CRIS Project (SC, ASH, DK, SX). Mention of trade names or commercial products in this publication is solely for the purpose of providing specific information and does not imply recommendation or endorsement by the USDA. The USDA is an equal opportunity provider and employer.
ReferencesBates, D., M. Mächler, B.M. Bolker, and S.C. Walker. 2015. Fitting linear
mixed-effects models using lme4. J. Stat. Softw. 67:1–48. doi:10.18637/jss.v067.i01
12 of 13 the plant genome july 2017 vol. 10, no. 2
Bonman, J.M., E.M. Babiker, A. Cuesta-Marcos, K. Esvelt-Klos, G. Brown-Guedira, S. Chao, D. See, J. Chen, E. Akhunov, J. Zhang, H.E. Bockelman, and T.C. Gordon. 2015. Genetic diversity among wheat accessions from the USDA National Small Grains Collection. Crop Sci. 55:1243–1253. doi:10.2135/cropsci2014.09.0621
Bonman, J.M., H.E. Bockelman, B.J. Goates, D.E. Obert, P.E. McGuire, C.O. Qualset, and R. Hijmans. 2006. Geographic distribution of common and dwarf bunt resistance in landraces of Triticum aes-tivum subsp. aestivum. Crop Sci. 46:1622–1629. doi:10.2135/crop-sci2005.12-0463
Bonman, J.M., H.E. Bockelman, L.F. Jackson, and B.J. Steffenson. 2005. Disease and insect resistance in cultivated barley accessions from the USDA National Small Grains Collection. Crop Sci. 45:1271–1280. doi:10.2135/cropsci2004.0546
Bonman, J.M., H.E. Bockelman, Y. Jin, R.J. Hijmans, and A.I.N. Gironella. 2007. Geographic distribution of stem rust resistance in wheat landra-ces. Crop Sci. 47:1955–1963. doi:10.2135/cropsci2007.01.0028
Bradbury, P., T. Parker, M.T. Hamblin, and J.L. Jannink. 2011. Assessment of power and false discovery rate in genome-wide association studies using the barley CAP germplasm. Crop Sci. 51:52–59. doi:10.2135/crop-sci2010.02.0064
Bradbury, P.J., Z. Zhang, D.E. Kroon, T.M. Casstevens, Y. Ramdoss, and E.S. Buckler. 2007. TASSEL: Software for association mapping of complex traits in diverse samples. Bioinformatics 23:2633–2635. doi:10.1093/bioinformatics/btm308
Breseghello, F., and M.E. Sorrells. 2006. Association mapping of kernel size and milling quality in wheat (Triticum aestivum L.) cultivars. Genetics 172:1165–1177. doi:10.1534/genetics.105.044586
Cavanagh, C., S. Chao, S. Wang, B.E. Huang, S. Stephen, S. Kiani, K. For-rest, C. Saintenac, G. Brown-Guedira, A. Akhunova, D. See, G. Bai, M. Pumphrey, L. Tomar, D. Wong, S. Kong, M. Reynolds, M.L. da Silva, H. Bockelman, L. Talbert, J. Anderson, S. Dreisigacker, S. Baenziger, A. Carter, V. Korzun, P. Morrell, J. Dubcovsky, M. Morell, M. Sorrells, M. Hayden, and E. Akhunov. 2013. Genome-wide comparative diversity uncovers multiple targets of selection for improvement in hexaploid wheat landrace and cultivars. Proc. Natl. Acad. Sci. USA 110:8057–8062. doi:10.1073/pnas.1217133110
Chao, S., J. Dubcovsky, J. Dvorak, M.C. Luo, P.S. Baenziger, R. Matnyazov, D.R. Clark, L. Talbert, J.A. Anderson, S. Dreisigacker, K. Glover, J. Chen, K. Campbell, P.L. Bruckner, J.C. Rudd, S. Haley, B.F. Carver, R. Sims, M.E. Sorrells, and E. Akhunov. 2010. Population-specific pat-terns of linkage disequilibrium and SNP variation in spring and winter polyploid wheat. BMC Genomics 11:727. doi:10.1186/1471-2164-11-727
Dahleen, L.S., P. Bregitzer, D. Mornhinweg, and E.W. Jackson. 2012. Association mapping of Russian Wheat Aphid resistance in barley as method to identify diversity in the National Small Grain Collection. Crop Sci. 52:1651–1662. doi:10.2135/cropsci2011.09.0525
Endelman, J.B. 2011. Ridge regression and other kernels for genomic selec-tion with R package rrBLUP. Plant Genome 4:250–255. doi:10.3835/plantgenome2011.08.0024
Evanno, G., S. Regnaut, and J. Goudet. 2005. Detecting the number of clusters of individuals using the software STRUCTURE: A simulation study. Mol. Ecol. 14:2611–2620. doi:10.1111/j.1365-294X.2005.02553.x
Excoffier, L., G. Laval, and S. Schneider. 2005. Arlequin ver. 3.0: An inte-grated software package for population genetics data analysis. Evol. Bioinform. Online 1:4750.
Falush, D., M. Stephens, and J.K. Pritchard. 2003. Inference of population structure using multilocus genotype data: Linked loci and correlated allele frequencies. Genetics 164:1567–1587.
Gao, L., M.K. Turner, S. Chao, J. Kolmer, and J.A. Anderson. 2016. Genome wide association study of seedling and adult plant leaf rust resistance in elite spring wheat breeding lines. PLoS One 11:e0148671. doi:10.1371/journal.pone.0148671
Haile, J.K., K. Hammer, A. Badebo, R.P. Singh, and M.S. Röder. 2013. Haplotype analysis of molecular markers linked to stem rust resistance genes in Ethiopian improved durum wheat varieties and tetraploid wheat landraces. Genet. Resour. Crop Evol. 60:853–864. doi:10.1007/s10722-012-9880-0
Haile, J.K., M.M. Nachit, K. Hammer, A. Badebo, and M.S. Röder. 2012. QTL mapping of resistance to race Ug99 of Puccinia graminis f. sp. tritici in durum wheat (Triticum durum Desf.). Mol. Breed. 30:1479–1493. doi:10.1007/s11032-012-9734-7
Hamblin, M., E.S. Buckler, and J.L. Jannink. 2011. Population genetics of genomics-based crop improvement methods. Trends Genet. 27:98–106. doi:10.1016/j.tig.2010.12.003
Hedrick, P.W. 1987. Gametic disequilibrium measures: Proceed with cau-tion. Genetics 117:331–341.
Jin, Y., R.P. Singh, R.W. Ward, R. Wanyera, M.G. Kinyua, P. Njau, T. Fetch, Jr., Z.A. Pretorius, and A. Yahyaoui. 2007. Characterization of seedling infection types and adult plant infection responses of monogenic Sr gene lines to race TTKS of Puccinia graminis f. sp. tritici. Plant Dis. 91:1096–1099. doi:10.1094/PDIS-91-9-1096
Jin, Y., L.J. Szabo, Z.A. Pretorius, R.P. Singh, R. Ward, and T. Fetch. 2008. Detection of virulence to resistance gene Sr24 within race TTKS of Puccinia graminis f. sp tritici. Plant Dis. 92:923–926. doi:10.1094/PDIS-92-6-0923
Kang, H.M., J.H. Sul, S.K. Service, N.A. Zaitlen, S.Y. Kong, N.B. Freimer, C. Sabatti, and E. Eskin. 2010. Variance component model to account for sample structure in genome-wide association studies. Nat. Genet. 42:348–354. doi:10.1038/ng.548
Kang, H.M., N.A. Zaitlen, C.M. Wade, A. Kirby, D. Heckerman, M.J. Daly, and E. Eskin. 2008. Efficient control of population structure in model organism association mapping. Genetics 178:1709–1723. doi:10.1534/genetics.107.080101
Klindworth, D.L., J.D. Miller, Y. Jin, and S.S. Xu. 2007. Chromosomal loca-tion of genes for stem rust resistance in monogenic lines derived from tetraploid wheat accession ST464. Crop Sci. 47:1441–1450. doi:10.2135/cropsci2006.05.0345
Letta, T., M. Maccaferri, A. Badebo, K. Ammar, A. Ricci, J. Crossa, and R. Tuberosa. 2013. Searching for novel sources of field resistance to Ug99 and Ethiopian stem rust races in durum wheat via association mapping. Theor. Appl. Genet. 126:1237–1256. doi:10.1007/s00122-013-2050-8
Letta, T., P. Olivera, M. Maccaferri, Y. Jin, K. Ammar, A. Badebo, S. Salvi, E. Noli, J. Crossa, and R. Tuberosa. 2014. Association mapping reveals novel stem rust resistance loci in durum wheat at the seedling stage. Plant Genome 7. doi:10.3835/plantgenome2013.08.0026
Long, A.D., and C.H. Langley. 1999. The power of association studies to detect the contribution of candidate genetic loci to variation in com-plex traits. Genome Res. 9:720–731.
Maccaferri, M., M.A. Cane, M.C. Sanguineti, S. Salvi, M.C. Colalongo, A. Massi, F. Clarke, R. Knox, C.J. Pozniak, J.M. Clarke, T. Fahima, J. Dub-covsky, S. Xu, K. Ammar, I. Karsai, G. Vida, and R. Tuberosa. 2014. A consensus framework map of durum wheat (Triticum durum Desf.) suitable for linkage disequilibrium analysis and genome-wide associa-tion mapping. BMC Genomics 15:873. doi:10.1186/1471-2164-15-873
Maccaferri, M., A. Ricci, S. Salvi, S.G. Milner, E. Noli, P.L. Martelli, R. Casadio, E. Akhunov, S. Scalabrin, V. Vendramin, K. Ammar, A. Blanco, F. Desiderio, A. Distelfeld, J. Dubcovsky, T. Fahima, J. Faris, A. Korol, A. Massi, A. Mastrangelo, M. Morgante, C. Pozniak, S. Xu, and R. Tuberosa. 2015a. A high-density, SNP-based consensus map of tetra-ploid wheat as a bridge to integrated durum and bread wheat genomics and breeding. Plant Biotechnol. J. 13:648–663. doi:10.1111/pbi.12288
Maccaferri, M., M.C. Sanguineti, A. Demontis, A. El-Ahmed, L.G. del Moral, F. Maalouf, M. Nachit, N. Nserallah, H. Ouabbou, S. Rhouma, C. Royo, D. Villegas, and R. Tuberosa. 2011. Association mapping in durum wheat grown across a broad range of water regimes. J. Exp. Bot. 62:409–438. doi:10.1093/jxb/erq287
Maccaferri, M., M.C. Sanguineti, V. Natoli, J.L.A. Ortega, M.B. Salem, J. Bort, C. Chenenaoui, E. De Ambrogio, L.G. del Moral, A. De Montis, A. El-Ahmed, F. Maalouf, H. Machlab, M. Moragues, J. Motawaj, M. Nachit, N. Nserallah, H. Ouabbou, C. Royo, and R. Tuberosa. 2006. A panel of elite accessions of durum wheat (Triticum durum Desf.) suit-able for association mapping studies. Plant Genet. Resour. 4:79–85. doi:10.1079/PGR2006117
Maccaferri, M., M.C. Sanguineti, E. Noli, and R. Tuberosa. 2005. Popula-tion structure and long-range linkage disequilibrium in a durum wheat elite collection. Mol. Breed. 15:271–289. doi:10.1007/s11032-004-7012-z
Maccaferri, M., J. Zhang, P. Bulli, Z. Abate, S. Chao, D. Cantu, E. Bosso-lini, X. Chen, M. Pumphrey, and J. Dubcovsky. 2015b. A genome-wide association study of resistance to stripe rust (Puccinia striiformis f. sp. tritici) in a worldwide collection of hexaploid spring wheat (Triticum aestivum L.). G3: Genes, Genomes, Genet. 5:449–465. doi:10.1534/g3.114.014563
chao et al.: nsgc durum wheats and stem rust resistance 13 of 13
McIntosh, R.A., J. Dubcovsky, W.J. Rogers, C. Morris, R. Appels, and X.C. Xia. 2014. Catalogue of gene symbols for wheat: 2013–2014 supplement. Committee for the National BioResource Project (NBRP)/KOMUGI, Japan. http://shigen.nig.ac.jp/wheat/komugi/genes/macgene/supple-ment2013.pdf (accessed 12 May 2016).
McIntosh, R.A., Y. Yamazaki, J. Dubcovsky, J. Rogers, C. Morris, R. Appels, and X.C. Xia. 2013. Catalogue of gene symbols for wheat. Committee for the National BioResource Project (NBRP)/KOMUGI, Japan. http://www.shigen.nig.ac.jp/wheat/komugi/genes/download.jsp (accessed on 12 May 2016).
Morrell, P.L., D.M. Toleno, K.E. Lundy, and M.T. Clegg. 2005. Low levels of linkage disequilibrium in wild barley (Hordeum vulgare ssp. sponta-neum) despite high rates of self-fertilization. Proc. Natl. Acad. Sci. USA 102:2442–2447. doi:10.1073/pnas.0409804102
Muňoz-Amatrian, M., A. Cuesta-Marcos, J.B. Endelman, J. Comadran, J.M. Bonman, H.E. Bockelman, S. Chao, J. Russell, R. Waugh, P.M. Hayes, and G.J. Muehlbauer. 2014. The USDA barley core collection: Genetic diversity, population structure, and potential for genome-wide association studies. PLoS One 9:e94688. doi:10.1371/journal.pone.0094688
Newcomb, M., M. Acevedo, H.E. Bockelman, G. Brown-Guedira, B.J. Goates, E.W. Jackson, Y. Jin, P. Njau, M.N. Rouse, D. Singh, R. Wan-yera, and J.M. Bonman. 2013. Field resistance to the Ug99 race group of the stem rust pathogen in spring wheat landraces. Plant Dis. 97:882–890. doi:10.1094/PDIS-02-12-0200-RE
Olivera, P.D., A. Badebo, S.S. Xu, D.L. Klindworth, and Y. Jin. 2012a. Resistance to race TTKSK of Puccinia graminis f. sp. tritici in emmer wheat. Crop Sci. 52:2234–2242. doi:10.2135/cropsci2011.12.0645
Olivera, P.D., Y. Jin, M. Rouse, A. Badebo, T. Fetch, Jr., R.P. Singh, and A. Yahyaoui. 2012b. Races of Puccinia graminis f. sp. tritici with combined virulence of Sr13 and Sr9e in a field stem rust screening nursery in Ethiopia. Plant Dis. 96:623–628. doi:10.1094/PDIS-09-11-0793
Olson, E.L., G. Brown-Guedira, D. Marshall, E. Stack, R.L. Bowden, Y. Jin, M. Rouse, and M.O. Pumphrey. 2010. Development of wheat lines having a small introgressed segment carrying stem rust resistance gene Sr22. Crop Sci. 50:1823–1830. doi:10.2135/cropsci2009.11.0652
Peterson, R.F., A.B. Campbell, and A.E. Hannah. 1948. A diagrammatic scale for estimating rust severity on leaves and stems of cereals. Can. J. Genet. Cytol. C26:496–500.
Porter, D.R., J.A. Webster, and C.A. Baker. 1993. Detection of resistance to the Russian wheat aphid in hexaploid wheat. Plant Breed. 110:157–160. doi:10.1111/j.1439-0523.1993.tb01228.x
Pozniak, C.J., S. Reimer, T. Fetch, J.M. Clarke, F.R. Clarke, D. Somers, R.E. Knox, and A.K. Singh. 2008. Association mapping of Ug99 resistance in a diverse durum wheat population. In: R. Appels, R. Eastwood, E. Lagudah, P. Langridge, M. Mackay, L. McIntyre, and P. Sharp, editors, Proc. 11th Int. Wheat Genetics Symp. Sydney Univ. Press, Sydney, Aus-tralia, p. 485-487.
Pritchard, J.K., M. Stephens, and P. Donnelly. 2000. Inference of popula-tion structure using multilocus genotype data. Genetics 155:945–959.
Rahmatov, M., M.N. Rouse, J. Nirmala, T. Danilova, B. Friebe, B.J. Steffen-son, and E. Johansson. 2016. A new 2DS·2RL Robertsonian transloca-tion transfers stem rust resistance gene Sr59 into wheat. Theor. Appl. Genet. 129:1383–1392. doi:10.1007/s00122-016-2710-6
Remington, D.L., J.M. Thornsberry, Y. Matsuoka, L.M. Wilson, S.R. Whitt, J. Doebley, S. Kresovich, M.M. Goodman, and E.S. Buckler, IV. 2001. Structure of linkage disequilibrium and phenotypic associations in the maize genome. Proc. Natl. Acad. Sci. USA 98:11479–11484. doi:10.1073/pnas.201394398
Ren, J., D. Sun, L. Chen, F.M. You, J. Wang, Y. Peng, E. Nevo, D. Sun, M.C. Luo, and J. Peng. 2013. Genetic diversity revealed by single nucleotide polymorphism markers in a worldwide germplasm collection of durum wheat. Int. J. Mol. Sci. 14:7061–7088. doi:10.3390/ijms14047061
Roelfs, A.P., and J.W. Martens. 1988. An international system of nomen-clature for Puccinia graminis f. sp. tritici. Phytopathology 78:526–533. doi:10.1094/Phyto-78-526
Roelfs, A.P., R.P. Singh, and E.E. Saari. 1992. Rust diseases of wheat: Con-cepts and methods of disease management. CIMMYT, Mexico, D.F. http://repository.cimmyt.org/xmlui/handle/10883/1153 (accessed on 14 May 2016).
Rosenberg, N.A. 2004. Distruct: A program for the graphical display of population structure. Mol. Ecol. Notes 4:137–138. doi:10.1046/j.1471-8286.2003.00566.x
Rouse, M.N., J. Nirmala, Y. Jin, S. Chao, T.G. Fetch, Jr., Z.A. Pretorius, and C.W. Hiebert. 2014a. Characterization of Sr9h, a wheat stem rust resistance allele effective to Ug99. Theor. Appl. Genet. 127:1681–1688. doi:10.1007/s00122-014-2330-y
Rouse, M.N., L.E. Talbert, D. Singh, and J.D. Sherman. 2014b. Comple-mentary epistasis involving Sr12 explains adult plant resistance to stem rust in Thatcher wheat (Triticum aestivum L.). Theor. Appl. Genet. 127:1549–1559. doi:10.1007/s00122-014-2319-6
Rouse, M.N., R. Wanyera, P. Njau, and Y. Jin. 2011. Sources of resistance to stem rust race Ug99 in spring wheat germplasm. Plant Dis. 95:762–766. doi:10.1094/PDIS-12-10-0940
SAS Institute. 2014a. JMP statistical software, version 11. SAS Inst. Inc., Cary, NC.
SAS Institute. 2014b. JMP Genomics, version 7. SAS Inst. Inc., Cary, NC.Simons, K., Z. Abate, S. Chao, W. Zhang, M. Rouse, Y. Jin, E. Elias, and J.
Dubcovsky. 2011. Genetic mapping of stem rust resistance gene Sr13 in tetraploid wheat (Triticum turgidum ssp. durum L.). Theor. Appl. Genet. 122:649–658. doi:10.1007/s00122-010-1444-0
Singh, A., M.P. Pandey, A.K. Singh, R.E. Knox, K. Ammar, J.M. Clarke, F.R. Clarke, R.P. Singh, C.J. Pozniak, R.M. DePauw, B.D. McCallum, R.D. Cuthbert, H.S. Randhawa, and T.G. Fetch, Jr. 2013. Identifica-tion and mapping of leaf, stem and stripe rust resistance quantita-tive trait loci and their interactions in durum wheat. Mol. Breed. 31:405–418. doi:10.1007/s11032-012-9798-4
Singh, R.P., D.P. Hodson, J. Huerta-Espino, Y. Jin, S. Bhavani, P. Njau, S. Herrera-Foessel, P.K. Singh, S. Singh, and V. Govindan. 2011. The emergence of Ug99 races of the stem rust fungus is a threat to world wheat production. Annu. Rev. Phytopathol. 49:465–481. doi:10.1146/annurev-phyto-072910-095423
Singh, R.P., D.P. Hodson, Y. Jin, E.S. Lagudah, M.A. Ayliffe, S. Bhavani, M.N. Rouse, Z.A. Pretorius, L.J. Szabo, J. Huerta-Espino, B.R. Basnet, C. Lan, and M.S. Hovmøller. 2015. Emergence and spread of new races of wheat stem rust fungus: Continued threat to food security and prospects of genetic control. Phytopathology 105:872–884. doi:10.1094/PHYTO-01-15-0030-FI
Somers, D.J., T. Banks, R. DePauw, S. Fox, J. Clarke, C. Pozniak, and C. McCartney. 2007. Genome-wide linkage disequilibrium analysis in bread wheat and durum wheat. Genome 50:557–567. doi:10.1139/G07-031
Stakman, E.C., D.M. Stewart, and W.Q. Loegering. 1962. Identification of physiological races of Puccinia graminis var. tritici. USDA–ARS E-617.
Turner, M.K., Y. Jin, M.N. Rouse, and J.A. Anderson. 2016. Stem rust resistance in ‘Jagger’ winter wheat. Crop Sci. 56:1–7. doi:10.2135/crop-sci2015.11.0683
Weir, B.S. 1996. Genetic data analysis II. Sinauer Associate, Inc., Sunder-lands.
Yu, L.X., A. Lorenz, J. Rutkoski, R.P. Singh, S. Bhavani, J. Huerta-Espino, and M.E. Sorrells. 2011. Association mapping and gene–gene interac-tion for stem rust resistance in CIMMYT spring wheat germplasm. Theor. Appl. Genet. 123:1257–1268. doi:10.1007/s00122-011-1664-y
Zhang, D., R.L. Bowden, J. Yu, B.F. Carver, and G. Bai. 2014. Associa-tion analysis of stem rust resistance in U.S. winter wheat. PLoS One 9:e103747. doi:10.1371/journal.pone.0103747
Zhu, C., M. Gore, E.S. Buckler, and J. Yu. 2008. Status and prospects of association mapping in plants. Plant Genome 1:5–20. doi:10.3835/plantgenome2008.02.0089
![Review of Concepts and Methods of Genetic Characterization ... · [23]. Breeding for resistance to pest involves the manipulation of genetic systems of both the host and parasite](https://img.pdfslide.us/doc/110x75/5fa9fffb5cc39f40105c125a/review-of-concepts-and-methods-of-genetic-characterization-23-breeding-for.jpg)