Embed Size (px)
Citation preview
1
Animal and Poultry Waste Management Center Campus Box 7608
Raleigh, NC 27695-7608
919.515.5386
919.513.1762 (FAX)
Project Title: Evaluation of Generation 3 Treatment Technology for Swine Waste
Project Sponsor:
Compiled by: C.M. (Mike) Williams, Ph.D.
Professor and Director North Carolina State University (NCSU) Animal
and Poultry Waste Management Center (APWMC)
Date: August 19, 2013
TABLE OF CONTENTS
Page
Narrative statement evaluating and summarizing the completed project …………. 2
Narrative description and evaluation of water quality improvements achieved...…. 3
Lessons learned in completing the project…………..………………………………… 3
Acknowledgements………………………………………………………………………….. 3
Additional documents
Appendix A: Technical Report prepared by M. Vanotti, et al. (50 pages)
Appendix B: Economic Assessment prepared by K. Zering (21 pages)
2
Narrative statement evaluating and summarizing the completed project: The primary objective for this project was to construct and evaluate an innovative swine manure
treatment system. The system was designed to: separate solids and liquids with the aid of settling
and polymer flocculants; biologically remove ammonia nitrogen with bacteria adapted to high-
strength wastewater; remove phosphorus via alkali precipitation; and reduce emissions of odorant
compounds, ammonia, pathogens, and heavy metals to environmental media. Evaluation criteria
included a comprehensive analysis of technical environmental performance and economic feasibility
conducted in accordance with an Agreement, dated July 25, 2000 between the Attorney General of
North Carolina and Smithfield Foods, Inc.i
The targeted technology, developed by Terra Blue, Inc. (previously Super Soil Systems, USA) was
initially demonstrated and evaluated (generation one) on a commercial swine farm site in Duplin
County, NC. Results showed that the technology met the Agreement criteria for environmental
performance standards.ii The project described herein involved the evaluation completion of a
second generation of the technology on a commercial farm site in Sampson County, NC and the
construction and evaluation of a third generation of the technology on a commercial farm site in
Wayne County, NC. The second and third generation technologies were designed to improve the
economic feasibility of the technology system while maintaining the environmental performance
standards as demonstrated with the generation one system. Technical environmental performance
standards included parameters identified by the State of North Carolina in 15A NCAC 02T. 2010.
Swine Waste Management System Performance Standards.iii The standards include: discharge of
animal waste to surface waters and groundwater; emission of ammonia; emission of odor; release of
disease-transmitting vectors and airborne pathogens; and nutrient and heavy metal contamination of
soil and groundwater. Economic feasibility variables included the projected 10-year annualized costs
and returns analysis for the technology; projected revenues from byproduct utilization; consideration
of available cost-share monies; and the impact that the adoption of the technology may have on the
competitiveness of the North Carolina pork industry as compared to the pork industry in other states.
Research teams comprised of faculty and staff from North Carolina State University (NCSU) and the
United States Department of Agriculture – Agricultural Research Service (USDA-ARS) conducted
the studies and their reports are provided in the Appendices. The reports were subjected to a peer
review process prior to finalization.
The results showed that both the second and third generation technologies achieved efficient
technical environmental performance at reduced costs compared to the first generation system. The
technical and economic results for the second generation technology were previously published.iv
Economic analysis showed that cost reductions for the second generation standardized model and
third generation actual model was approximately 25% and 60%, respectively as compared to the cost
determination for the generation one technology. These cost reductions are significant but do not
meet the economic feasibility standard as established for existing farm categories per criteria
previously established in the referenced Agreement between the Attorney General of North Carolina
and Smithfield Foods, Inc. The economic feasibility determination in the referenced Agreement is
specific to the company owned farms identified in that initiative. Applicability and appropriateness
of this (or other) technology for incorporation onto any new or existing farms in NC is at the
discretion of farm owners and applicable permitting agencies. Based on the technical environmental
performance results previously reported for the second generation technology and reported herein for
the third generation technology both meet the criteria identified in the referenced NC Swine Waste
3
Management System Performance Standards. Under current NC regulations this would enable
producers to incorporate the technology onto swine farm sites proposed for new and/or expanding
operations and/or retrofit of existing operations with no expansion pending permit approval by NC
Departmental of Environment and Natural Resources (NCDENR).
Narrative description and evaluation of water quality improvements achieved:
The results showed that the innovative swine manure treatment system was capable of operating
under steady state conditions treating flushed swine manure at a rate of approximately 75,000 gallons
of manure per day. The treatment system was documented to remove approximately 99% of total
suspended solids, 98% of COD, 99% of TKN (Total Kjeldahl nitrogen), 100% ammonia, 92%
phosphorus, 95% copper, and 97% zinc from the flushed manure. Fecal coliform reductions were
measured to be 99.98% (when the alkali precipitation component of the system was at a pH of 10.1).
The treatment system is contained in tanks. The treatment process also provides a mechanism and
market for the solids that are separated. Collectively this treatment process, when operated and
managed under the conditions during which we conducted this study, significantly reduces the
potential for transfer of nutrients and pathogenic bacteria to surface and groundwater in the drainage
basin where the animals are grown on animal feeding operations.
Lessons learned in completing the project:
Page 30 of the technical report (Appendix A) prepared by Vanotti et al. has a section entitled
Lessons Learned – Jernigan Farm Project. The items listed are specific to the third
generation technology system as compared to the generation one and two systems.
Acknowledgements
Funding resources provided by the North Carolina Clean Water Management Trust Fund and the
North Carolina Attorney General’s Environmental Enhancement Grant Program made this research
possible. Appreciation is also expressed to numerous NCSU investigators and USDA-ARS project
investigators for their time and effort on this project. The farm property owners and the technology
supplier (Terra Blue, Inc.) are recognized for their cooperation and especially their personal
expenditures of resources exceeding grant allocations. The findings reported herein greatly advance
the knowledge base for exploring alternative methods to treating animal production agriculture by
products and would not have been possible without the collaborative efforts of all parties noted.
i See http://www.cals.ncsu.edu/waste_mgt/smithfield_projects/agreement.pdf ii See http://www.cals.ncsu.edu/waste_mgt/smithfield_projects/phase1report04/phase1report.htm
iii See
http://portal.ncdenr.org/c/document_library/get_file?uuid=eb13e046-e452-4b1c-9182-7f9ba497b45a&groupId=38364 ivSee
http://www.cals.ncsu.edu/waste_mgt/smithfield_projects/supersoils2ndgeneration/ss2ndgenerationreport.html
Appendix A
August 2013
Evaluation of Generation 3 Treatment Technology for Swine Waste - A North Carolina's Clean Water Management Trust Fund project
FINAL TECHNICAL ENVIRONMENTAL PERFORMANCE REPORT
Prepared for: Mike Williams, Director, NCSU Animal and Poultry Waste Management Center
Prepared by:
Matias Vanotti, Patrick Hunt, Mark Rice, Airton Kunz and John Loughrin
2
Project Title:
Evaluation of Generation 3 Treatment Technology for Swine Waste - A North Carolina's Clean Water Management Trust Fund project. Project Reference: The sponsor of this demonstration project is North Carolina's Clean Water Management Trust Fund project (CWMTF), Project 2006A-522: “WW/Alternative Swine Waste System, cape Fear Tributary” – awarded to NC State University, Project PI: Mike Williams, Ph.D., Director, NC State University Animal and Poultry Waste Management Center. Investigators Contributing to Technical Environmental Performance Report, e-mail and address:
• Matias Vanotti, Ph.D. USDA-ARS Coastal Plains Soil, Water and Plant Research Center 2611 W. Lucas Street, Florence, South Carolina 29501 Tel. 843-669-5203 ext 108 [email protected]
• Patrick Hunt, Ph.D., USDA-ARS, Coastal Plains Soil, Water and Plant Research Center, Florence, South Carolina. [email protected]
• Mark Rice, North Carolina State University, Dept. Biological And Agricultural
Engineering, Raleigh, NC [email protected]
• Airton Kunz, Ph.D., Embrapa Swine and Poultry, Brazil (Visiting Scientist at USDA-ARS Florence, SC during evaluation) [email protected]
• John Loughrin, Ph.D., USDA-ARS, Animal Waste Management Research Unit, Bowling Green, Kentucky. [email protected]
Field Monitoring: William Brigman and Ray Winans, USDA-ARS, Florence, SC Laboratory Analyses: Chris Brown, USDA-ARS, Florence, SC
Dates Covered for Report: 04/03/2012 – 10/23/2012 (extended to 12/6/2012 for pathogen testing). Revised 8/8/2013 after External Reviewer (3) comments. Data for N removal system during winter weather were added. Production records for a second batch of pigs were also added.
3
Table of Contents
Project Title, Investigators, and Dates ........................................................................................... 2 Executive Summary ......................................................................................................................... 4 Technology Description ................................................................................................................... 5 Technology Provider ........................................................................................................................ 6 Swine Producer and Farm .............................................................................................................. 6 Background ...................................................................................................................................... 7 First Generation Technology ..................................................................................................... 7 Second Generation Technology ................................................................................................. 7 Gen 3 System Description ............................................................................................................... 8 Swine Farm Characteristics ...................................................................................................... 8 System processes ..................................................................................................................... 9 Design Considerations .....................................................................................................................11 Objectives..........................................................................................................................................12 Results ...............................................................................................................................................13 Permitting .................................................................................................................................13 Construction ...............................................................................................................................13 Sample Collection, Analytical Methods, and Monitoring .........................................................13 Technology Verification Conditions..........................................................................................15 Timeframe ...........................................................................................................................15 Weather ...............................................................................................................................15 Livestock Inventory ............................................................................................................16 Manure Inventory................................................................................................................18 Water Quality Improvements by System ...................................................................................20 System Efficiencies Based on Mass Balance.............................................................................21 Biological N removal performance during winter ....................................................................21 Solids Production .......................................................................................................................22 Reduction of Odors ...................................................................................................................24 Reduction of Pathogens .............................................................................................................24 Evaluation of Decanting Tank ..................................................................................................26 Operational Problems Experienced and Solutions .....................................................................29 Operation Notes .........................................................................................................................29 Lessons learned .........................................................................................................................29 Phase Two: Swine production changes .....................................................................................30 Conclusions .......................................................................................................................................30 Acknowledgements ..........................................................................................................................31 Citations ............................................................................................................................................32 Appendix ...........................................................................................................................................35 A. Project pictures ....................................................................................................................35 B. Graphs of water quality improvements with treatment system ...........................................43 C. Monitoring of liquid level dynamics in various tanks.........................................................48
4
Executive Summary
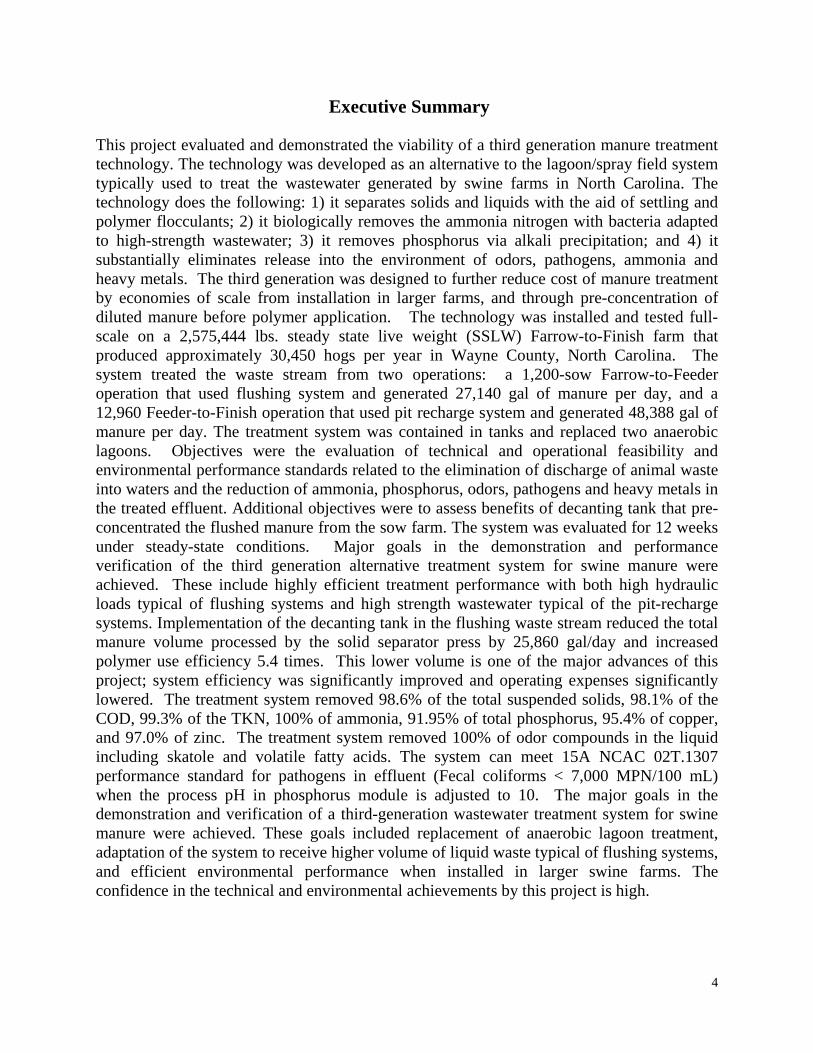
This project evaluated and demonstrated the viability of a third generation manure treatment technology. The technology was developed as an alternative to the lagoon/spray field system typically used to treat the wastewater generated by swine farms in North Carolina. The technology does the following: 1) it separates solids and liquids with the aid of settling and polymer flocculants; 2) it biologically removes the ammonia nitrogen with bacteria adapted to high-strength wastewater; 3) it removes phosphorus via alkali precipitation; and 4) it substantially eliminates release into the environment of odors, pathogens, ammonia and heavy metals. The third generation was designed to further reduce cost of manure treatment by economies of scale from installation in larger farms, and through pre-concentration of diluted manure before polymer application. The technology was installed and tested full-scale on a 2,575,444 lbs. steady state live weight (SSLW) Farrow-to-Finish farm that produced approximately 30,450 hogs per year in Wayne County, North Carolina. The system treated the waste stream from two operations: a 1,200-sow Farrow-to-Feeder operation that used flushing system and generated 27,140 gal of manure per day, and a 12,960 Feeder-to-Finish operation that used pit recharge system and generated 48,388 gal of manure per day. The treatment system was contained in tanks and replaced two anaerobic lagoons. Objectives were the evaluation of technical and operational feasibility and environmental performance standards related to the elimination of discharge of animal waste into waters and the reduction of ammonia, phosphorus, odors, pathogens and heavy metals in the treated effluent. Additional objectives were to assess benefits of decanting tank that pre-concentrated the flushed manure from the sow farm. The system was evaluated for 12 weeks under steady-state conditions. Major goals in the demonstration and performance verification of the third generation alternative treatment system for swine manure were achieved. These include highly efficient treatment performance with both high hydraulic loads typical of flushing systems and high strength wastewater typical of the pit-recharge systems. Implementation of the decanting tank in the flushing waste stream reduced the total manure volume processed by the solid separator press by 25,860 gal/day and increased polymer use efficiency 5.4 times. This lower volume is one of the major advances of this project; system efficiency was significantly improved and operating expenses significantly lowered. The treatment system removed 98.6% of the total suspended solids, 98.1% of the COD, 99.3% of the TKN, 100% of ammonia, 91.95% of total phosphorus, 95.4% of copper, and 97.0% of zinc. The treatment system removed 100% of odor compounds in the liquid including skatole and volatile fatty acids. The system can meet 15A NCAC 02T.1307 performance standard for pathogens in effluent (Fecal coliforms < 7,000 MPN/100 mL) when the process pH in phosphorus module is adjusted to 10. The major goals in the demonstration and verification of a third-generation wastewater treatment system for swine manure were achieved. These goals included replacement of anaerobic lagoon treatment, adaptation of the system to receive higher volume of liquid waste typical of flushing systems, and efficient environmental performance when installed in larger swine farms. The confidence in the technical and environmental achievements by this project is high.
5
Technology Name and Description: Generation 3 Terra Blue Technology
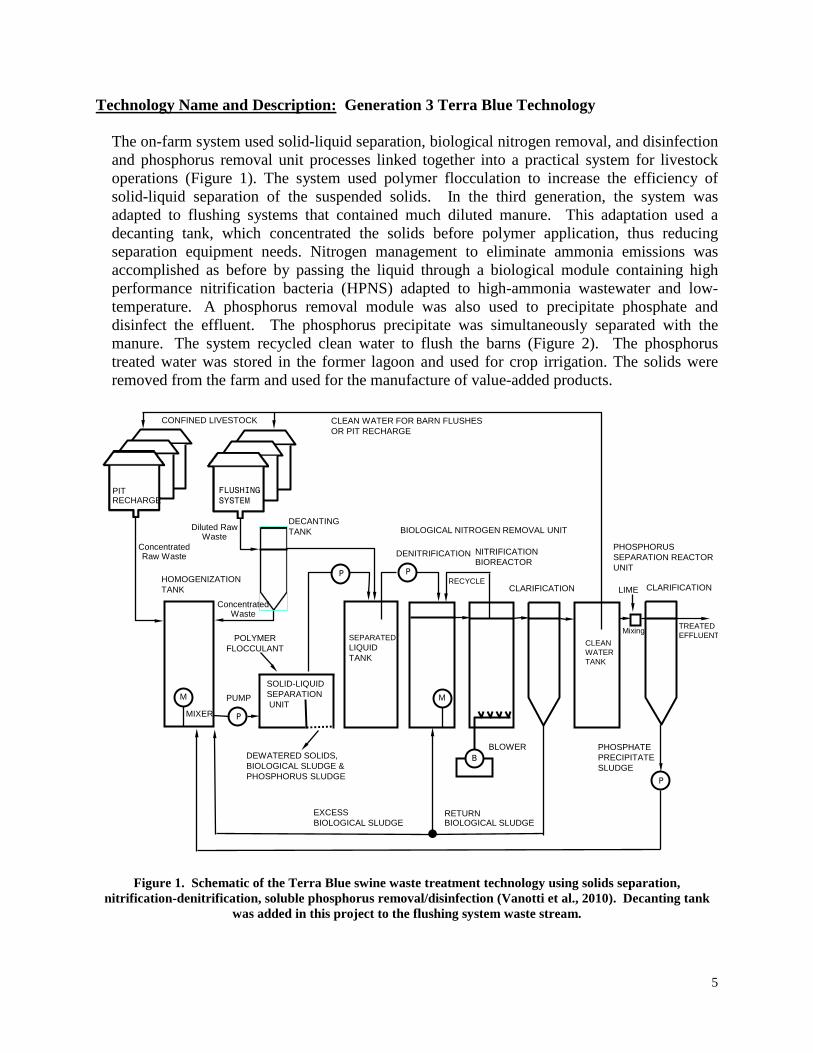
The on-farm system used solid-liquid separation, biological nitrogen removal, and disinfection and phosphorus removal unit processes linked together into a practical system for livestock operations (Figure 1). The system used polymer flocculation to increase the efficiency of solid-liquid separation of the suspended solids. In the third generation, the system was adapted to flushing systems that contained much diluted manure. This adaptation used a decanting tank, which concentrated the solids before polymer application, thus reducing separation equipment needs. Nitrogen management to eliminate ammonia emissions was accomplished as before by passing the liquid through a biological module containing high performance nitrification bacteria (HPNS) adapted to high-ammonia wastewater and low-temperature. A phosphorus removal module was also used to precipitate phosphate and disinfect the effluent. The phosphorus precipitate was simultaneously separated with the manure. The system recycled clean water to flush the barns (Figure 2). The phosphorus treated water was stored in the former lagoon and used for crop irrigation. The solids were removed from the farm and used for the manufacture of value-added products.
TREATEDEFFLUENT
PHOSPHORUS SEPARATION REACTORUNIT
PHOSPHATE PRECIPITATE SLUDGE
Concentrated Raw Waste
BBLOWER
POLYMERFLOCCULANT
P
DENITRIFICATION
CLARIFICATION
NITRIFICATION BIOREACTOR
RETURNBIOLOGICAL SLUDGE
SOLID-LIQUID SEPARATIONUNIT
EXCESSBIOLOGICAL SLUDGE
RECYCLE
P
M
HOMOGENIZATIONTANK
MIXER
LIME
DEWATERED SOLIDS,BIOLOGICAL SLUDGE & PHOSPHORUS SLUDGE
P
M
BIOLOGICAL NITROGEN REMOVAL UNIT
P
SEPARATEDLIQUIDTANK
PUMP
CONFINED LIVESTOCK
DECANTING TANK
PIT RECHARGE
FLUSHINGSYSTEM
Diluted Raw Waste
Mixing
CLARIFICATION
Concentrated Waste
CLEAN WATER FOR BARN FLUSHES OR PIT RECHARGE
CLEANWATERTANK
Figure 1. Schematic of the Terra Blue swine waste treatment technology using solids separation,
nitrification-denitrification, soluble phosphorus removal/disinfection (Vanotti et al., 2010). Decanting tank was added in this project to the flushing system waste stream.
6
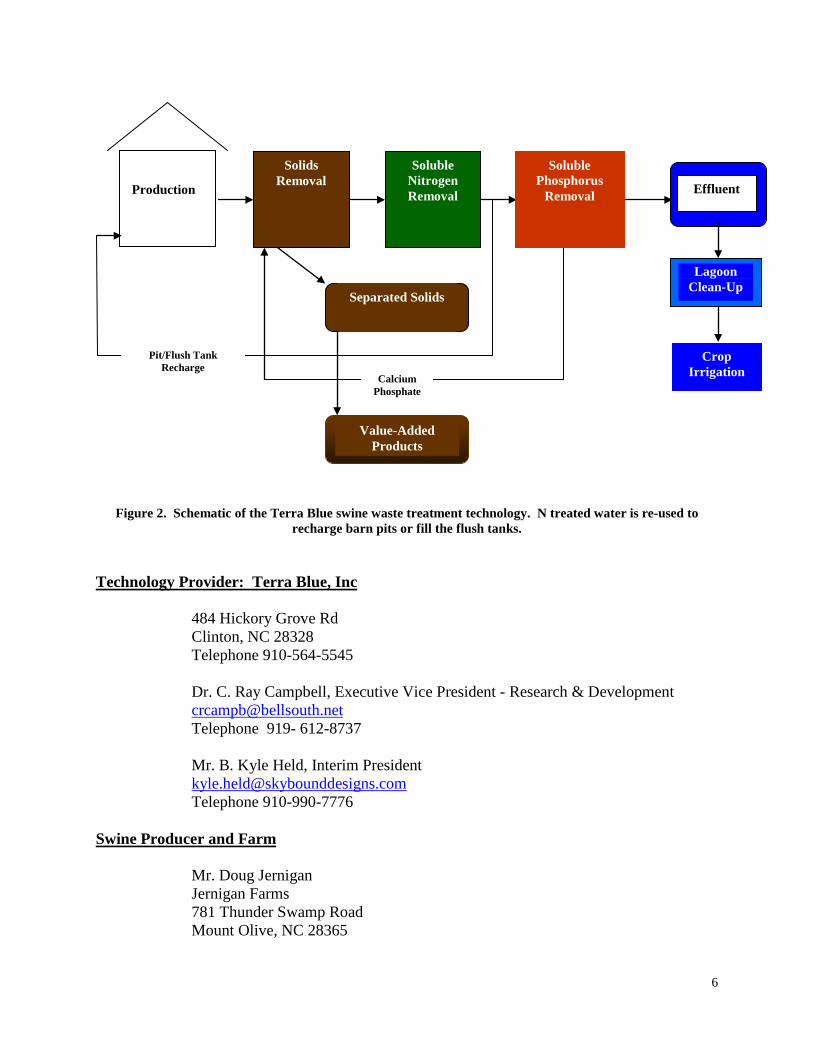
Figure 2. Schematic of the Terra Blue swine waste treatment technology. N treated water is re-used to recharge barn pits or fill the flush tanks.
Technology Provider: Terra Blue, Inc
484 Hickory Grove Rd Clinton, NC 28328 Telephone 910-564-5545 Dr. C. Ray Campbell, Executive Vice President - Research & Development [email protected] Telephone 919- 612-8737 Mr. B. Kyle Held, Interim President [email protected] Telephone 910-990-7776
Swine Producer and Farm
Mr. Doug Jernigan Jernigan Farms 781 Thunder Swamp Road Mount Olive, NC 28365
Solids SRemoSolidsval
Solids Removal
Separated Solids
Production
Soluble Nitrogen Removal
Soluble Phosphorus
Removal
Calcium Phosphate
Pit/Flush Tank Recharge
Value-Added Products
Effluent
Crop Irrigation
Lagoon Clean-Up
7
Background:
This project evaluated the viability of a third generation version of a manure treatment technology developed as an alternative to the lagoon/spray field system typically used to treat the wastewater generated by swine farms in North Carolina (Figure 2). It separates solids and liquids with the aid of polymer flocculants; removes the ammonia nitrogen biologically with acclimated bacteria; removes phosphorus; and substantially eliminate release of pathogens, odors, ammonia and heavy metals into the environment. The first generation met the technical and operational feasibility standards of an Environmental Superior Technology (Williams, 2004) (Note: the technology provider, Super Soil Systems USA, was renamed Terra Blue Inc. in 2010). The second generation technology achieved efficient technical (environmental) performance at reduced costs [$132.24/1000 lbs. steady state live weight (SSLW)/year] compared to the first generation system ($399.71/1000 lbs SSLW/year) (Williams, 2007). These cost reductions supported Williams (2007) conclusions that “the optimal method of achieving net cost reductions from alternative technologies is to install targeted technologies on a sufficient number of farms to facilitate engineering improvements, value-added product market development, and other cost reduction methods.” The third generation was designed to further reduce costs of treatment by: 1) Economies of scale from installation of the same system in a larger swine farm; and 2) Adaptation to flushing systems by concentrating the diluted manure with rapid settling and applying polymer only to the settled solids. The performance verification of Gen 3 was done in a larger swine operation at full-scale under steady-state operational conditions.
First Generation Technology
The first generation technology was demonstrated by Terra Blue Inc. (previously Super Soil Systems USA) at full-scale at Goshen Ridge farm, a 4,360-head finishing farm in Duplin County, NC, that used pit-recharge (Vanotti et al., 2007). The system, which combined solids separation, nitrification/denitrification and phosphorus removal, received US Patent (6,893,567 B1, 2005). The on-farm technology met the environmental performance criteria of an EST (Williams, 2004).
Second Generation Technology The second generation was demonstrated by Terra Blue Inc. (previously Super Soil Systems USA) at full-scale in B&B Tyndall farm, a 5,145-head finishing farm located in Sampson County, NC, that used pit-recharge (Williams, 2007; Vanotti et al., 2009). The second generation incorporated two new inventions that significantly lowered capital, maintenance and operating costs of the Terra Blue system: 1) US Patent 7,674,379 B2 (2010) “Wastewater treatment system with simultaneous separation of phosphorus and manure solids”, and 2) US Patent 8,445,253 B2 (2013) “High performance nitrifying sludge (HPNS) for high ammonium concentration and low temperature wastewater treatment”. The system met unconditional EST status when implemented in new farms (combined with an unconditional EST for solids treatment), but at that time it did not meet economic feasibility conditions as required for unconditional EST to be implemented onto existing farm categories in North Carolina (Williams, 2007).
8
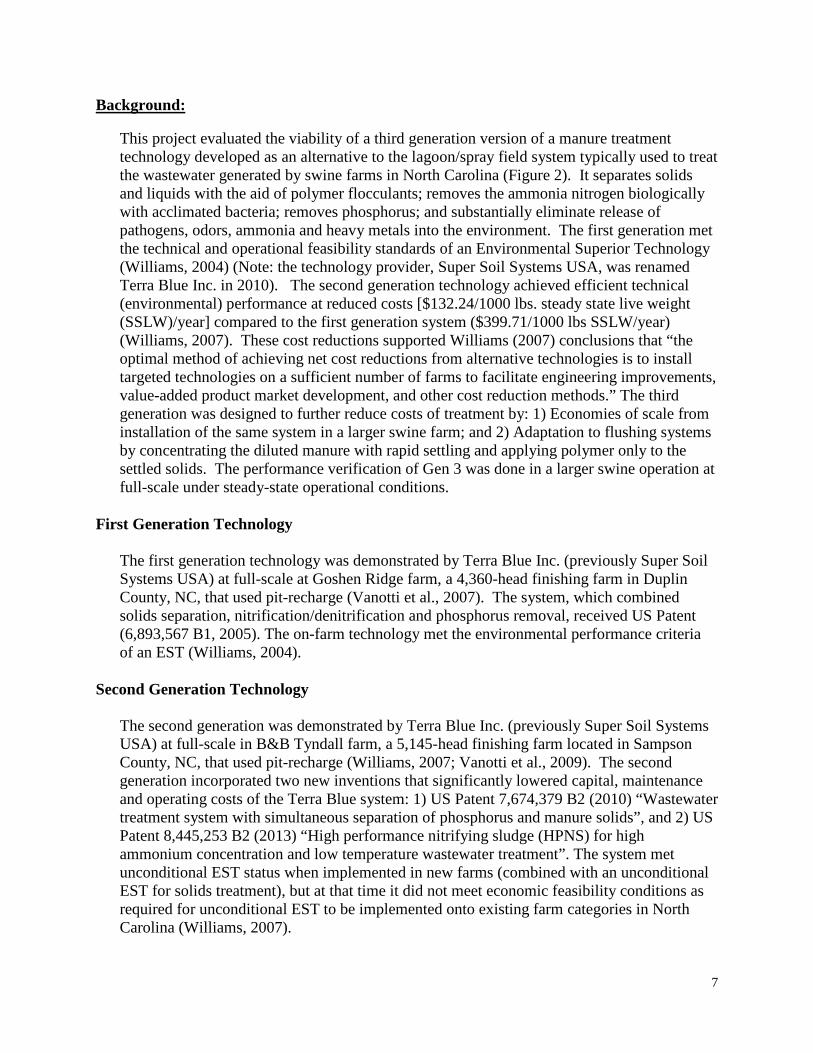
Gen 3 System Description Swine farm characteristics: The waste treatment system was designed and constructed by Terra Blue Inc. and installed at Jernigan farm near Mount Olive in Wayne County, NC. The system evaluated provided treatment to all the manure generated by both a farrow-to-feeder operation (Sow farm B) with 1,200 sows, and a finishing operation (feeder-to-finish) with 12,960 heads (Figure 3). This was a complete farrow-to-finish operation: all the feeders produced in Sow farm B were moved into the finishing operation and finished in 21 weeks. Once the treatment plant was fully operational, it replaced the lagoon treatment. The system used three process units (Figure 2) and incorporated the three US Patents referenced above. The finishing operation used pit-recharge system (Barker, 1996a) that evacuates manure from the barn once per week; it was also used at Goshen Ridge and Tyndall farms during testing of the first- and second-generation. The Sow farm B used flushing system (Barker, 1996b) that used flush tanks to evacuate manure form the barn several times per day producing much diluted manure. This configuration was not tested with the Terra Blue system before. Before conversion, lagoon liquid (with 433 ± 146 mg NH4-N/L) was used to recharge the pits (finishers) and fill the flush tanks (sow farm). After conversion, the N treated water (with 14 ± 26 mg NH4-N/L) replaced lagoon water to recharge the pits and fill the flush tanks; it was stored in the clean water storage tank (Figure 4).
Figure 3. Terra Blue Gen 3 wastewater treatment system (tanks in center) that replaced the lagoon treatment
at Jernigan farm. The system provided treatment to all the manure from a 1200-sow (farrow to feeder) farm (three barns shown at right) with flushing system, and a 12,960-head feeder to finish farm (four and a
half “quad” barns shown at left) with pit-recharge system. Photo source: Flashearth.com.
9
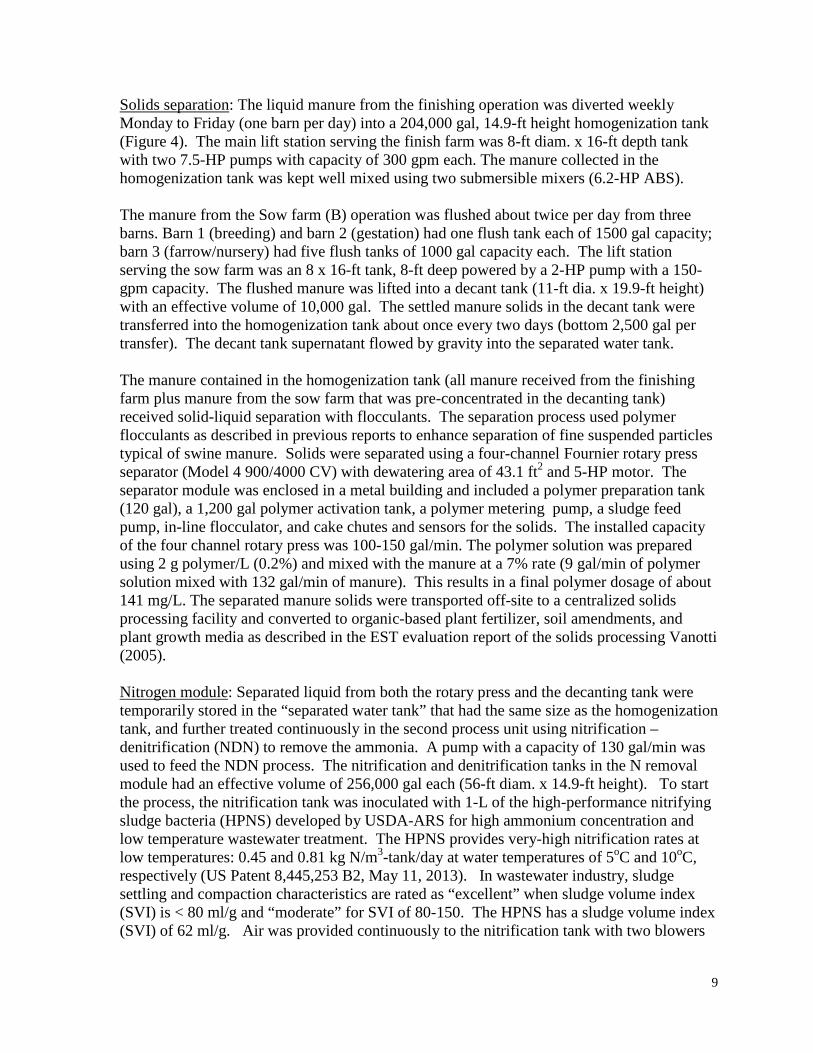
Solids separation: The liquid manure from the finishing operation was diverted weekly Monday to Friday (one barn per day) into a 204,000 gal, 14.9-ft height homogenization tank (Figure 4). The main lift station serving the finish farm was 8-ft diam. x 16-ft depth tank with two 7.5-HP pumps with capacity of 300 gpm each. The manure collected in the homogenization tank was kept well mixed using two submersible mixers (6.2-HP ABS). The manure from the Sow farm (B) operation was flushed about twice per day from three barns. Barn 1 (breeding) and barn 2 (gestation) had one flush tank each of 1500 gal capacity; barn 3 (farrow/nursery) had five flush tanks of 1000 gal capacity each. The lift station serving the sow farm was an 8 x 16-ft tank, 8-ft deep powered by a 2-HP pump with a 150-gpm capacity. The flushed manure was lifted into a decant tank (11-ft dia. x 19.9-ft height) with an effective volume of 10,000 gal. The settled manure solids in the decant tank were transferred into the homogenization tank about once every two days (bottom 2,500 gal per transfer). The decant tank supernatant flowed by gravity into the separated water tank. The manure contained in the homogenization tank (all manure received from the finishing farm plus manure from the sow farm that was pre-concentrated in the decanting tank) received solid-liquid separation with flocculants. The separation process used polymer flocculants as described in previous reports to enhance separation of fine suspended particles typical of swine manure. Solids were separated using a four-channel Fournier rotary press separator (Model 4 900/4000 CV) with dewatering area of 43.1 ft2 and 5-HP motor. The separator module was enclosed in a metal building and included a polymer preparation tank (120 gal), a 1,200 gal polymer activation tank, a polymer metering pump, a sludge feed pump, in-line flocculator, and cake chutes and sensors for the solids. The installed capacity of the four channel rotary press was 100-150 gal/min. The polymer solution was prepared using 2 g polymer/L (0.2%) and mixed with the manure at a 7% rate (9 gal/min of polymer solution mixed with 132 gal/min of manure). This results in a final polymer dosage of about 141 mg/L. The separated manure solids were transported off-site to a centralized solids processing facility and converted to organic-based plant fertilizer, soil amendments, and plant growth media as described in the EST evaluation report of the solids processing Vanotti (2005). Nitrogen module: Separated liquid from both the rotary press and the decanting tank were temporarily stored in the “separated water tank” that had the same size as the homogenization tank, and further treated continuously in the second process unit using nitrification – denitrification (NDN) to remove the ammonia. A pump with a capacity of 130 gal/min was used to feed the NDN process. The nitrification and denitrification tanks in the N removal module had an effective volume of 256,000 gal each (56-ft diam. x 14.9-ft height). To start the process, the nitrification tank was inoculated with 1-L of the high-performance nitrifying sludge bacteria (HPNS) developed by USDA-ARS for high ammonium concentration and low temperature wastewater treatment. The HPNS provides very-high nitrification rates at low temperatures: 0.45 and 0.81 kg N/m3-tank/day at water temperatures of 5oC and 10oC, respectively (US Patent 8,445,253 B2, May 11, 2013). In wastewater industry, sludge settling and compaction characteristics are rated as “excellent” when sludge volume index (SVI) is < 80 ml/g and “moderate” for SVI of 80-150. The HPNS has a sludge volume index (SVI) of 62 ml/g. Air was provided continuously to the nitrification tank with two blowers
10
(25-HP each with 832 cfm), and 416 fine-air disc (12”) diffusers. Nitrification transformed NH4-N into NO3-N and NO2-N. A pre-denitrification configuration transformed NO3-N into N2 gas where nitrified wastewater was continually recycled to anoxic denitrification tank. In this tank, suspended denitrifying bacteria used soluble manure carbon contained in the separated liquid to remove the NO3
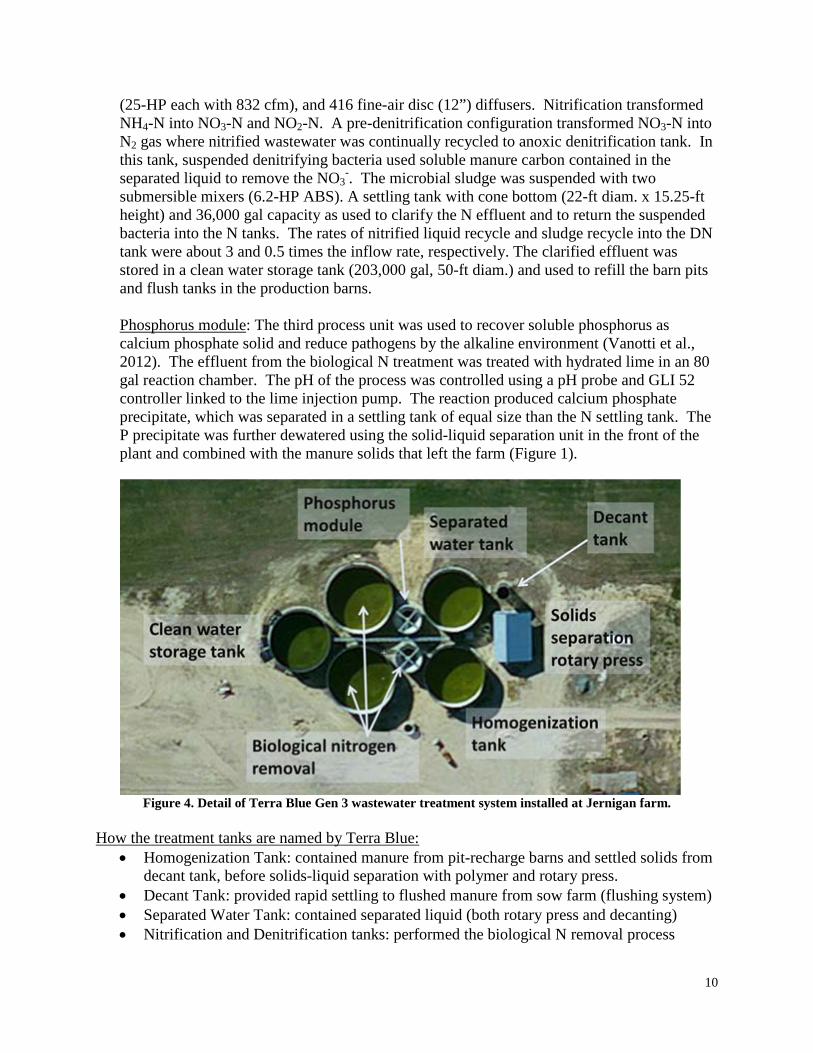
-. The microbial sludge was suspended with two submersible mixers (6.2-HP ABS). A settling tank with cone bottom (22-ft diam. x 15.25-ft height) and 36,000 gal capacity as used to clarify the N effluent and to return the suspended bacteria into the N tanks. The rates of nitrified liquid recycle and sludge recycle into the DN tank were about 3 and 0.5 times the inflow rate, respectively. The clarified effluent was stored in a clean water storage tank (203,000 gal, 50-ft diam.) and used to refill the barn pits and flush tanks in the production barns. Phosphorus module: The third process unit was used to recover soluble phosphorus as calcium phosphate solid and reduce pathogens by the alkaline environment (Vanotti et al., 2012). The effluent from the biological N treatment was treated with hydrated lime in an 80 gal reaction chamber. The pH of the process was controlled using a pH probe and GLI 52 controller linked to the lime injection pump. The reaction produced calcium phosphate precipitate, which was separated in a settling tank of equal size than the N settling tank. The P precipitate was further dewatered using the solid-liquid separation unit in the front of the plant and combined with the manure solids that left the farm (Figure 1).
Figure 4. Detail of Terra Blue Gen 3 wastewater treatment system installed at Jernigan farm.
How the treatment tanks are named by Terra Blue:
• Homogenization Tank: contained manure from pit-recharge barns and settled solids from decant tank, before solids-liquid separation with polymer and rotary press.
• Decant Tank: provided rapid settling to flushed manure from sow farm (flushing system) • Separated Water Tank: contained separated liquid (both rotary press and decanting) • Nitrification and Denitrification tanks: performed the biological N removal process
11
• Clean Water Tank: stored liquid after N treatment for recycle (flushing the barns and recharging the pits under the barns).
• Plant effluent: is the final effluent after treatment in the phosphorus module. This effluent was stored in the former lagoon and land applied.
Design Considerations
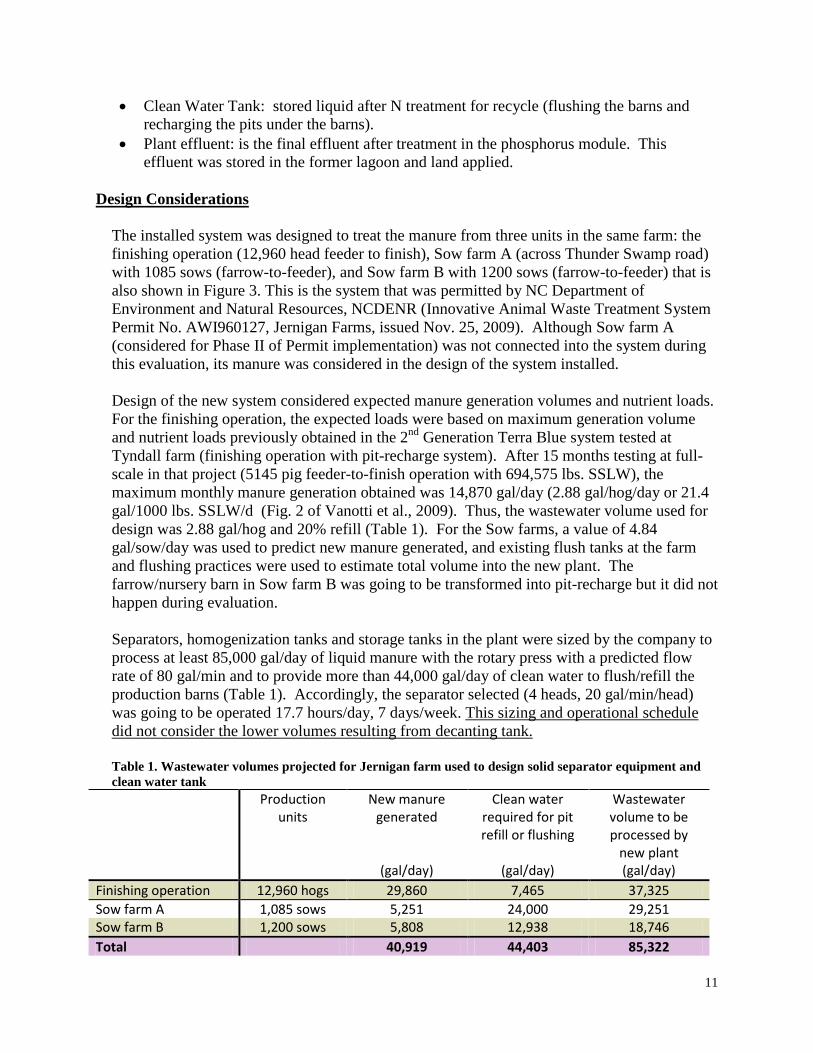
The installed system was designed to treat the manure from three units in the same farm: the finishing operation (12,960 head feeder to finish), Sow farm A (across Thunder Swamp road) with 1085 sows (farrow-to-feeder), and Sow farm B with 1200 sows (farrow-to-feeder) that is also shown in Figure 3. This is the system that was permitted by NC Department of Environment and Natural Resources, NCDENR (Innovative Animal Waste Treatment System Permit No. AWI960127, Jernigan Farms, issued Nov. 25, 2009). Although Sow farm A (considered for Phase II of Permit implementation) was not connected into the system during this evaluation, its manure was considered in the design of the system installed. Design of the new system considered expected manure generation volumes and nutrient loads. For the finishing operation, the expected loads were based on maximum generation volume and nutrient loads previously obtained in the 2nd Generation Terra Blue system tested at Tyndall farm (finishing operation with pit-recharge system). After 15 months testing at full-scale in that project (5145 pig feeder-to-finish operation with 694,575 lbs. SSLW), the maximum monthly manure generation obtained was 14,870 gal/day (2.88 gal/hog/day or 21.4 gal/1000 lbs. SSLW/d (Fig. 2 of Vanotti et al., 2009). Thus, the wastewater volume used for design was 2.88 gal/hog and 20% refill (Table 1). For the Sow farms, a value of 4.84 gal/sow/day was used to predict new manure generated, and existing flush tanks at the farm and flushing practices were used to estimate total volume into the new plant. The farrow/nursery barn in Sow farm B was going to be transformed into pit-recharge but it did not happen during evaluation. Separators, homogenization tanks and storage tanks in the plant were sized by the company to process at least 85,000 gal/day of liquid manure with the rotary press with a predicted flow rate of 80 gal/min and to provide more than 44,000 gal/day of clean water to flush/refill the production barns (Table 1). Accordingly, the separator selected (4 heads, 20 gal/min/head) was going to be operated 17.7 hours/day, 7 days/week. This sizing and operational schedule did not consider the lower volumes resulting from decanting tank. Table 1. Wastewater volumes projected for Jernigan farm used to design solid separator equipment and clean water tank
Production units
New manure generated
(gal/day)
Clean water required for pit refill or flushing
(gal/day)
Wastewater volume to be processed by
new plant (gal/day)
Finishing operation 12,960 hogs 29,860 7,465 37,325 Sow farm A 1,085 sows 5,251 24,000 29,251 Sow farm B 1,200 sows 5,808 12,938 18,746 Total 40,919 44,403 85,322
12
For sizing the nitrification tank, it was projected that Sow farms A and B (2,285 sows) would be equivalent to 8,830 finishing pigs (by animal weight (SSLW), 522 lbs./sow vs. 135 lbs./finishing pig). Therefore, the biological N removal system in this project was designed to treat polymer separated wastewater equivalent from about 21,790 finishing pigs (12,960 + 8,830). This number was 4.2 times greater than the 2nd Generation project that had a capacity to treat peak monthly loads of about 159 lbs. of ammonia-N/day (72 kg N/day) in winter from 5,145 finishing pigs using HPNS in a 60,000 gal nitrification tank. Thus, the nitrification tank size installed in the new project was 4.2 times larger (254,000 gal tank), and other design components like air supply and diffusers were adjusted proportionally. The exception was the size of the denitrification tank that was reduced 20% in relative size from previous project. The incorporation of an experimental small decanting tank (11,000 gal) was proposed by Vanotti for this project to improve system efficiency by reducing liquid volume load into the rotary press separator from the sow farms that used flushing systems and large amounts of water (Figure 1). The decanting tank size was designed to handle the flushes from Sow farm B during Phase One of the project, based on results of previous research using rapid (60 min) gravity settling of flushed swine manure (Chastain and Vanotti, 2003).
Objectives:
Our objectives were to: 1) assist company with the start-up of the new system in this large operation to achieve steady state conditions; 2) to assess in more detail the benefits of using a decanting tank before polymer separation in operations with flushing systems; and 3) to provide environmental performance evaluation of the 3rd Generation wastewater treatment technology in terms of ammonia, phosphorus, odors, pathogens, and heavy metals.
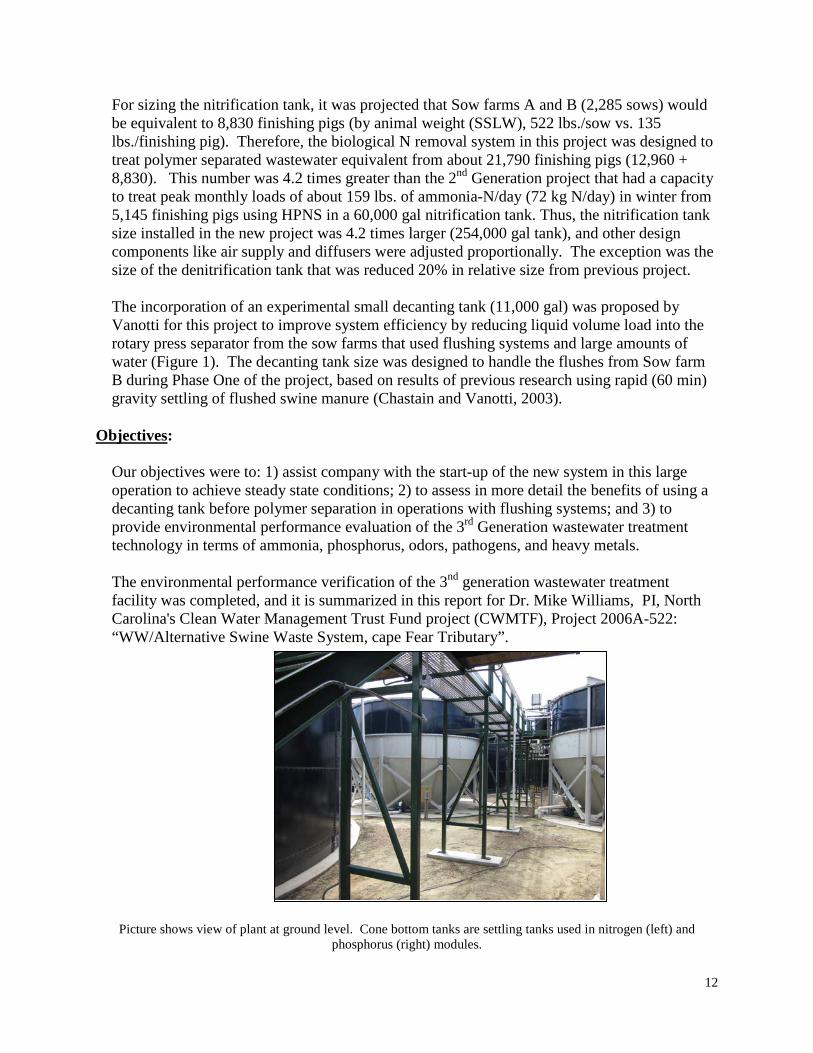
The environmental performance verification of the 3nd generation wastewater treatment facility was completed, and it is summarized in this report for Dr. Mike Williams, PI, North Carolina's Clean Water Management Trust Fund project (CWMTF), Project 2006A-522: “WW/Alternative Swine Waste System, cape Fear Tributary”.
Picture shows view of plant at ground level. Cone bottom tanks are settling tanks used in nitrogen (left) and phosphorus (right) modules.
13
Results: 1. Permitting
Permit No. AWI960127N was issued Nov. 25, 2009, by NC Department of Environment and Natural Resources (NCDENR) authorizing the construction and operation of an Innovative Animal Waste Treatment System for the Jernigan Farms located in Wayne County, NC. The approval consisted of a two-stage implementation of the Terra Blue technology to replace the lagoon treatment. When fully implemented, the system serves the entire waste stream from 2,285 Farrow to Feeder and 12,960 Feeder to Finish swine operation. Phase One included construction of the total treatment system and implementation for the 12,960 Feeder to Finish swine and 1200 Farrow to Feeder swine (Sow farm B). Phase Two included merging the remaining 1,085 Farrow to Feeder swine waste stream into the Innovative Animal Waste Treatment System contingent upon analyses of Phase One performance (this reporting) and Division approval.
2. Construction
Construction and installation of the wastewater treatment facility was started in 2010. The tanks, pumps and blower were ready April 1, 2012. At this date the biological system was started. The solid-separation facility started receiving and treating waste from the finishing operation on May 31, 2012. During the period June-July 2012, Sow farm B used the clean treated water produced by the system to flush the three barns, but the flushed manure went into the lagoon. Incorporation of this additional waste (from Sow farm B) into the system (decanting tank, connection pipelines and additional lift station) started August 1, 2012 (barns 1 and 2) and was completed September 15, 2012 (barn 3).
3. Sample collection, analytical methods, and monitoring
Liquid samples were collected weekly from 1) the manure in the homogenization tank, 2) the effluent of the decanting tank, 3) the effluent of the separated water tank, 4) the effluent in the clean water tank after nitrification-denitrification treatment, and 5) the effluent after the phosphorus removal treatment. Grab samples were also taken weekly at intermediate points of the nitrogen system to check mixed liquor suspended solids. Liquid samples were transported on ice to the ARS Florence laboratory for analyses. For the separated solids, manure was placed in calibrated 5-gal. buckets and weighed at the farm for calculation of the bulk density of the solids used together with farm solid’s removed records for solids production determinations. Wastewater analyses were performed according to Standard Methods for the Examination of Water and Wastewater (APHA, AWWA & WEF, 1998), as described in the second generation report (Vanotti and Szogi, 2007). Solids analyses of the treated and untreated liquid samples included total solids (TS), total suspended solids (TSS), and volatile suspended solids (VSS). Total solids are TSS plus soluble solids. Chemical analyses consisted of pH, chemical oxygen demand (COD), 5-d biochemical oxygen demand (BOD5), ammonia-N (NH3-N), total Kjeldahl N (TKN), orthophosphate-P (PO4), and total P (TP), nitrite (NO2-N) and nitrate (NO3-N) referred in the report as oxidized N or NOx-N. TKN
14
includes organic N and ammonia-N. TN is the sum of TKN and NOx-N. Alkalinity was determined by acid titration to the bromocresol green endpoint (pH=4.5) and expressed as mg CaCO3 L-1. Cu, Zn, S, and K were measured in acid digestion extracts using inductively coupled plasma (ICP) analysis. Microelements and P in the solids were measured by ICP analysis after acid digestion. Carbon and N contents in the solids were determined using a dry combustion analyzer. In this evaluation, we provided tests kits and a laboratory cart to measure on-site the concentration of alkalinity (Hach Company, Loveland, CO), ammonium and nitrite (Quantofix, Macherey-Nagel, Germany) in the nitrogen module (nitrification and denitrification effluent). This provided instant feed-back of process performance. The ammonia data was calibrated with corresponding laboratory determinations using Standard Methods (APHA, 1998) showing good correlation (r=0.97). Odor analyses determinations were done on liquid samples collected during September and October, 2012 (n = 4) at the five sample locations. Liquid samples were analyzed in the laboratory of Dr. John Loughrin in Bowling Green, KY using the odorant extraction and chromatographic method (Loughrin et al., 2009) that was also used for the second-generation evaluation. The method determined concentration of malodorous compounds (Skatole, Phenol, p-Cresol, p-Ethylphenol and Indole) and volatile fatty acids (acetate, propionate and iso-butyric) contained in the liquid manure as it passed through the treatment system. Microbiological analyses of liquid samples from influent and effluent were done by NCSU and private laboratories using the standard protocols for pathogens and indicator microbes for the examination of wastewater. Volume flows of manure into the treatment system were measured hourly using Doppler flow meters that measured: 1) volumes of manure from the finishing operation into the homogenization tank, and 2) volumes of manure from the sow farm B into the decant tank. These flow meter readings were calibrated using liquid-level ultrasonic probes (SR50 Sonic Ranging Sensor, Campbell Scientific Inc., Logan, UT) placed on top of the homogenization tank, decanting tank, and separated water tank that provided actual volume dynamics based on liquid height and area of the tank. Additional level sensors were placed in the clean water tank and settling tanks. This allowed calculations of manure flushes, separation activity and flow rates, decant tank activity, and sludge wasting. We also monitored air and water temperatures, precipitation, and DO and pH in the nitrification tank. Process data were retrieved from the Florence, SC laboratory using internet and cell phones connected to the field devices, or during weekly visits to the site. Manure volume data processed by the press separator was taken from the flow meter that was installed with the separator and used for separation process control.
15
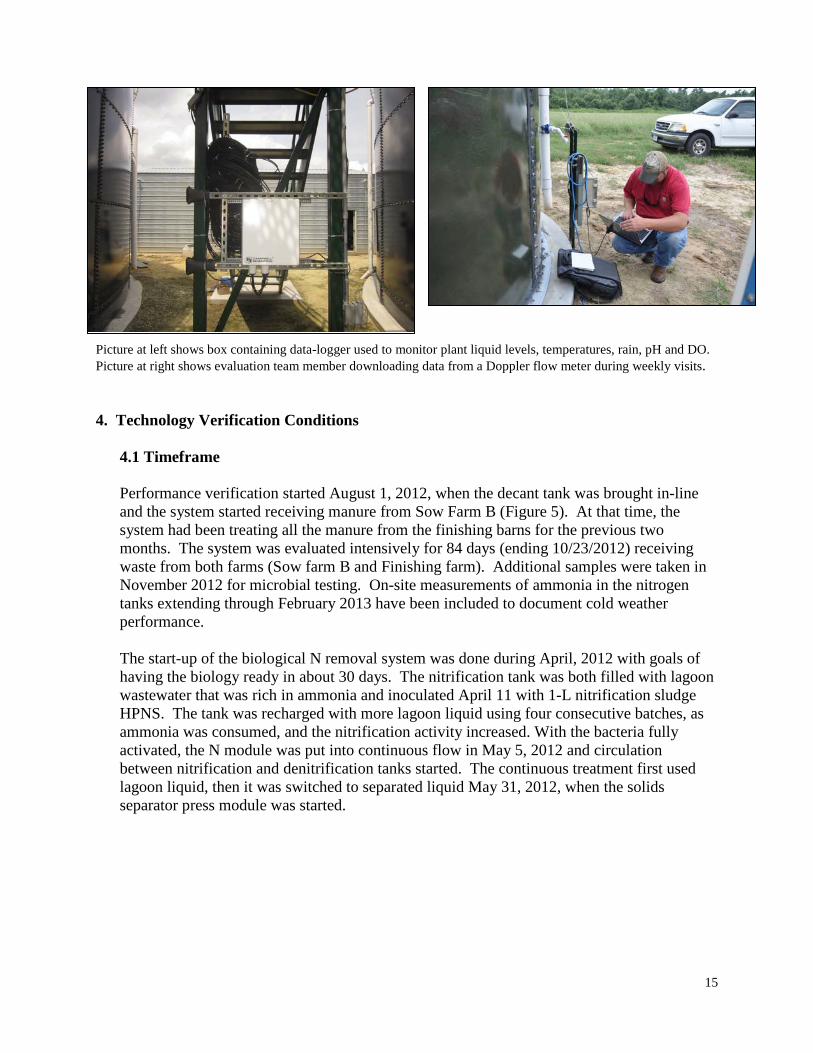
Picture at left shows box containing data-logger used to monitor plant liquid levels, temperatures, rain, pH and DO. Picture at right shows evaluation team member downloading data from a Doppler flow meter during weekly visits. 4. Technology Verification Conditions
4.1 Timeframe
Performance verification started August 1, 2012, when the decant tank was brought in-line and the system started receiving manure from Sow Farm B (Figure 5). At that time, the system had been treating all the manure from the finishing barns for the previous two months. The system was evaluated intensively for 84 days (ending 10/23/2012) receiving waste from both farms (Sow farm B and Finishing farm). Additional samples were taken in November 2012 for microbial testing. On-site measurements of ammonia in the nitrogen tanks extending through February 2013 have been included to document cold weather performance. The start-up of the biological N removal system was done during April, 2012 with goals of having the biology ready in about 30 days. The nitrification tank was both filled with lagoon wastewater that was rich in ammonia and inoculated April 11 with 1-L nitrification sludge HPNS. The tank was recharged with more lagoon liquid using four consecutive batches, as ammonia was consumed, and the nitrification activity increased. With the bacteria fully activated, the N module was put into continuous flow in May 5, 2012 and circulation between nitrification and denitrification tanks started. The continuous treatment first used lagoon liquid, then it was switched to separated liquid May 31, 2012, when the solids separator press module was started.
16
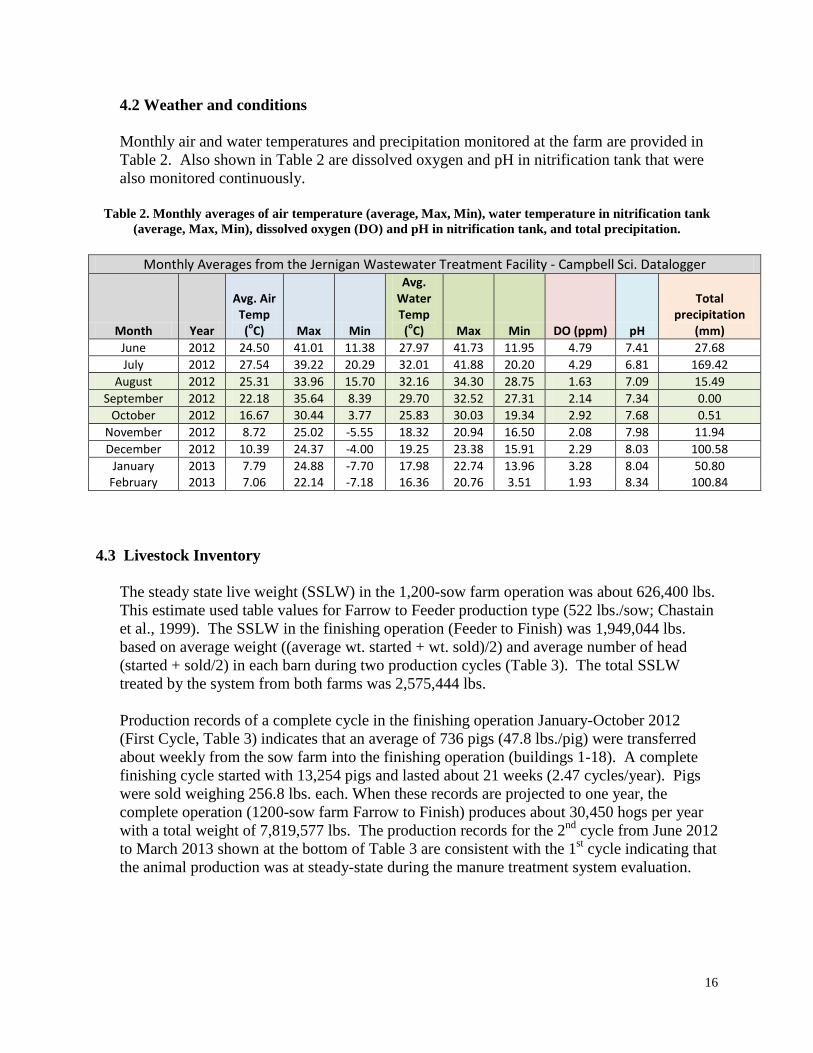
4.2 Weather and conditions Monthly air and water temperatures and precipitation monitored at the farm are provided in Table 2. Also shown in Table 2 are dissolved oxygen and pH in nitrification tank that were also monitored continuously.
Table 2. Monthly averages of air temperature (average, Max, Min), water temperature in nitrification tank (average, Max, Min), dissolved oxygen (DO) and pH in nitrification tank, and total precipitation.
Monthly Averages from the Jernigan Wastewater Treatment Facility - Campbell Sci. Datalogger
Month Year
Avg. Air Temp (oC) Max Min
Avg. Water Temp (oC) Max Min DO (ppm) pH
Total precipitation
(mm) June 2012 24.50 41.01 11.38 27.97 41.73 11.95 4.79 7.41 27.68 July 2012 27.54 39.22 20.29 32.01 41.88 20.20 4.29 6.81 169.42
August 2012 25.31 33.96 15.70 32.16 34.30 28.75 1.63 7.09 15.49 September 2012 22.18 35.64 8.39 29.70 32.52 27.31 2.14 7.34 0.00
October 2012 16.67 30.44 3.77 25.83 30.03 19.34 2.92 7.68 0.51 November 2012 8.72 25.02 -5.55 18.32 20.94 16.50 2.08 7.98 11.94 December 2012 10.39 24.37 -4.00 19.25 23.38 15.91 2.29 8.03 100.58
January 2013 7.79 24.88 -7.70 17.98 22.74 13.96 3.28 8.04 50.80 February 2013 7.06 22.14 -7.18 16.36 20.76 3.51 1.93 8.34 100.84
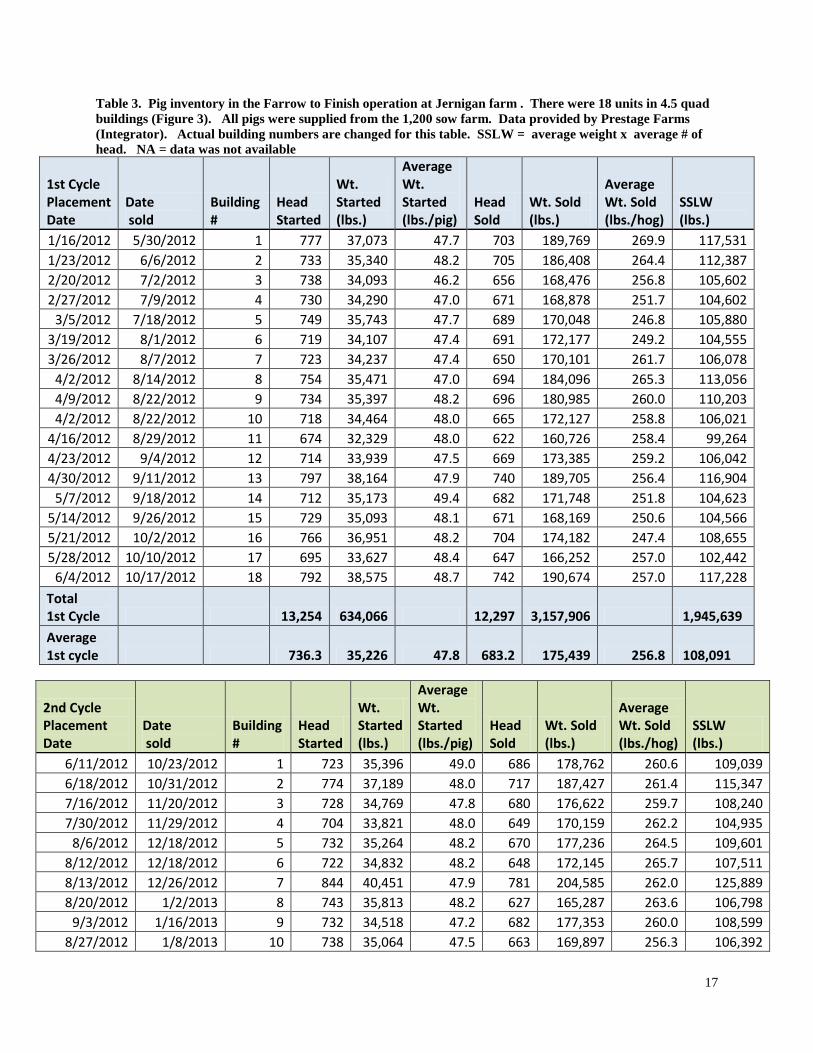
4.3 Livestock Inventory The steady state live weight (SSLW) in the 1,200-sow farm operation was about 626,400 lbs. This estimate used table values for Farrow to Feeder production type (522 lbs./sow; Chastain et al., 1999). The SSLW in the finishing operation (Feeder to Finish) was 1,949,044 lbs. based on average weight ((average wt. started + wt. sold)/2) and average number of head (started + sold/2) in each barn during two production cycles (Table 3). The total SSLW treated by the system from both farms was 2,575,444 lbs. Production records of a complete cycle in the finishing operation January-October 2012 (First Cycle, Table 3) indicates that an average of 736 pigs (47.8 lbs./pig) were transferred about weekly from the sow farm into the finishing operation (buildings 1-18). A complete finishing cycle started with 13,254 pigs and lasted about 21 weeks (2.47 cycles/year). Pigs were sold weighing 256.8 lbs. each. When these records are projected to one year, the complete operation (1200-sow farm Farrow to Finish) produces about 30,450 hogs per year with a total weight of 7,819,577 lbs. The production records for the 2nd cycle from June 2012 to March 2013 shown at the bottom of Table 3 are consistent with the 1st cycle indicating that the animal production was at steady-state during the manure treatment system evaluation.
17
Table 3. Pig inventory in the Farrow to Finish operation at Jernigan farm . There were 18 units in 4.5 quad buildings (Figure 3). All pigs were supplied from the 1,200 sow farm. Data provided by Prestage Farms (Integrator). Actual building numbers are changed for this table. SSLW = average weight x average # of head. NA = data was not available
1st Cycle Placement Date
Date sold
Building #
Head Started
Wt. Started (lbs.)
Average Wt. Started (lbs./pig)
Head Sold
Wt. Sold (lbs.)
Average Wt. Sold (lbs./hog)
SSLW (lbs.)
1/16/2012 5/30/2012 1 777 37,073 47.7 703 189,769 269.9 117,531 1/23/2012 6/6/2012 2 733 35,340 48.2 705 186,408 264.4 112,387 2/20/2012 7/2/2012 3 738 34,093 46.2 656 168,476 256.8 105,602 2/27/2012 7/9/2012 4 730 34,290 47.0 671 168,878 251.7 104,602
3/5/2012 7/18/2012 5 749 35,743 47.7 689 170,048 246.8 105,880 3/19/2012 8/1/2012 6 719 34,107 47.4 691 172,177 249.2 104,555 3/26/2012 8/7/2012 7 723 34,237 47.4 650 170,101 261.7 106,078
4/2/2012 8/14/2012 8 754 35,471 47.0 694 184,096 265.3 113,056 4/9/2012 8/22/2012 9 734 35,397 48.2 696 180,985 260.0 110,203 4/2/2012 8/22/2012 10 718 34,464 48.0 665 172,127 258.8 106,021
4/16/2012 8/29/2012 11 674 32,329 48.0 622 160,726 258.4 99,264 4/23/2012 9/4/2012 12 714 33,939 47.5 669 173,385 259.2 106,042 4/30/2012 9/11/2012 13 797 38,164 47.9 740 189,705 256.4 116,904
5/7/2012 9/18/2012 14 712 35,173 49.4 682 171,748 251.8 104,623 5/14/2012 9/26/2012 15 729 35,093 48.1 671 168,169 250.6 104,566 5/21/2012 10/2/2012 16 766 36,951 48.2 704 174,182 247.4 108,655 5/28/2012 10/10/2012 17 695 33,627 48.4 647 166,252 257.0 102,442
6/4/2012 10/17/2012 18 792 38,575 48.7 742 190,674 257.0 117,228 Total 1st Cycle 13,254 634,066 12,297 3,157,906 1,945,639 Average 1st cycle 736.3 35,226 47.8 683.2 175,439 256.8 108,091
2nd Cycle Placement Date
Date sold
Building #
Head Started
Wt. Started (lbs.)
Average Wt. Started (lbs./pig)
Head Sold
Wt. Sold (lbs.)
Average Wt. Sold (lbs./hog)
SSLW (lbs.)
6/11/2012 10/23/2012 1 723 35,396 49.0 686 178,762 260.6 109,039 6/18/2012 10/31/2012 2 774 37,189 48.0 717 187,427 261.4 115,347 7/16/2012 11/20/2012 3 728 34,769 47.8 680 176,622 259.7 108,240 7/30/2012 11/29/2012 4 704 33,821 48.0 649 170,159 262.2 104,935
8/6/2012 12/18/2012 5 732 35,264 48.2 670 177,236 264.5 109,601 8/12/2012 12/18/2012 6 722 34,832 48.2 648 172,145 265.7 107,511 8/13/2012 12/26/2012 7 844 40,451 47.9 781 204,585 262.0 125,889 8/20/2012 1/2/2013 8 743 35,813 48.2 627 165,287 263.6 106,798
9/3/2012 1/16/2013 9 732 34,518 47.2 682 177,353 260.0 108,599 8/27/2012 1/8/2013 10 738 35,064 47.5 663 169,897 256.3 106,392
18
9/10/2012 1/22/2013 11 746 35,248 47.2 678 176,276 260.0 109,377 9/17/2012 1/30/2013 12 733 34,541 47.1 623 158,365 254.2 100,452 9/24/2012 1/3/1900 13 702 33,070 47.1 618 159,393 257.9 100,660 10/1/2012 2/13/2013 14 771 36,561 47.4 692 176,569 255.2 110,669 10/8/2012 2/2/2013 15 701 33,413 47.7 644 167,875 260.7 103,679
10/22/2012 3/7/2012 16 736 34,653 47.1 NA NA 10/23/2012 3/7/2013 17 754 35,631 47.3 NA NA
10/22/2012 3/13/2013 18 722 33,754 46.8 NA NA Total 2nd Cycle 13,305
633,988 1,945,639*
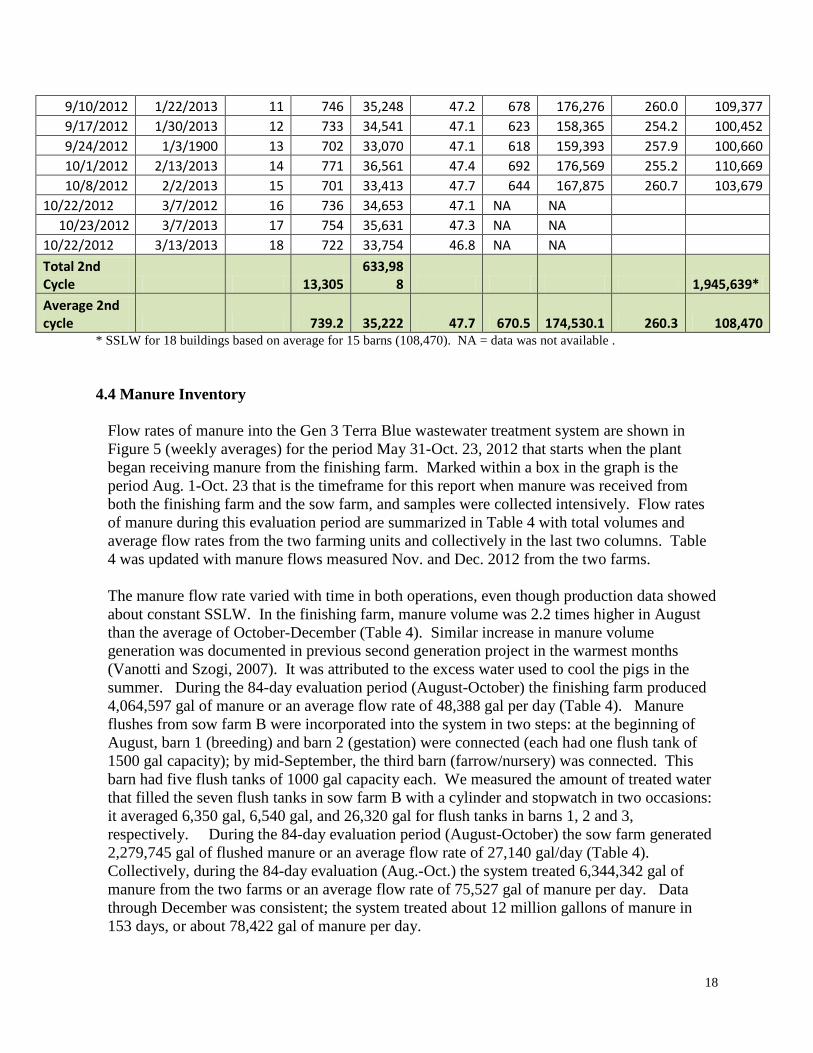
Average 2nd cycle 739.2 35,222 47.7 670.5 174,530.1 260.3 108,470
* SSLW for 18 buildings based on average for 15 barns (108,470). NA = data was not available .
4.4 Manure Inventory
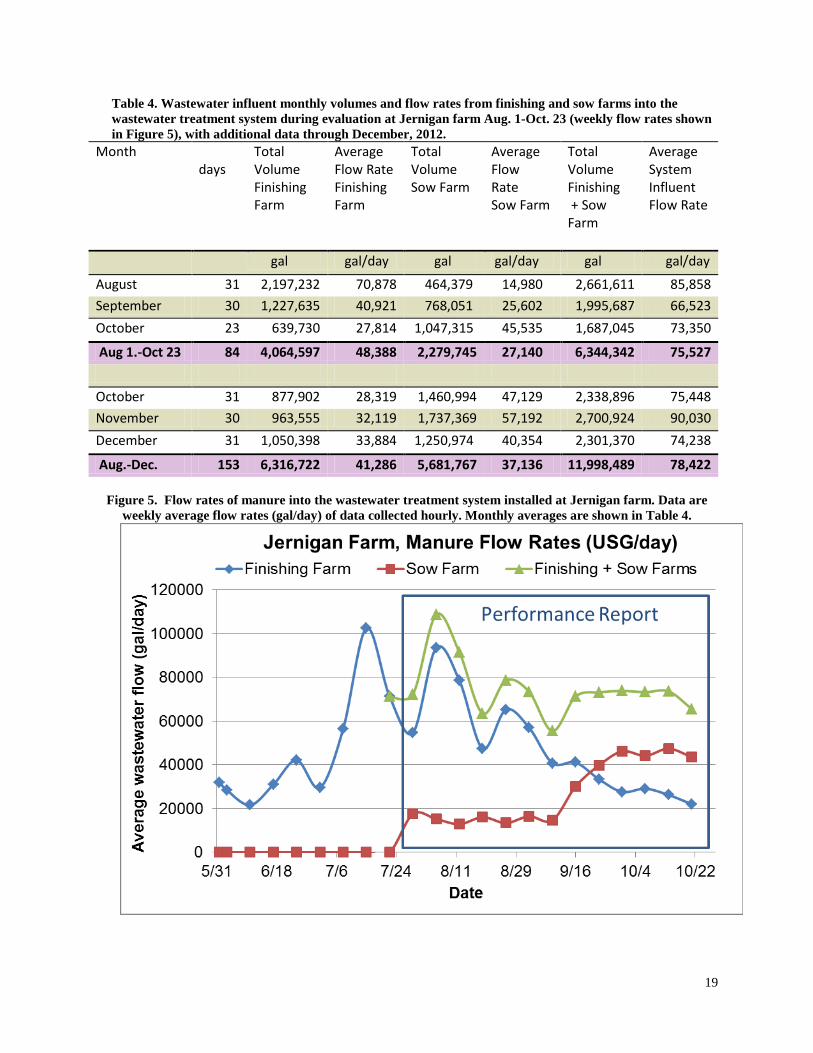
Flow rates of manure into the Gen 3 Terra Blue wastewater treatment system are shown in Figure 5 (weekly averages) for the period May 31-Oct. 23, 2012 that starts when the plant began receiving manure from the finishing farm. Marked within a box in the graph is the period Aug. 1-Oct. 23 that is the timeframe for this report when manure was received from both the finishing farm and the sow farm, and samples were collected intensively. Flow rates of manure during this evaluation period are summarized in Table 4 with total volumes and average flow rates from the two farming units and collectively in the last two columns. Table 4 was updated with manure flows measured Nov. and Dec. 2012 from the two farms. The manure flow rate varied with time in both operations, even though production data showed about constant SSLW. In the finishing farm, manure volume was 2.2 times higher in August than the average of October-December (Table 4). Similar increase in manure volume generation was documented in previous second generation project in the warmest months (Vanotti and Szogi, 2007). It was attributed to the excess water used to cool the pigs in the summer. During the 84-day evaluation period (August-October) the finishing farm produced 4,064,597 gal of manure or an average flow rate of 48,388 gal per day (Table 4). Manure flushes from sow farm B were incorporated into the system in two steps: at the beginning of August, barn 1 (breeding) and barn 2 (gestation) were connected (each had one flush tank of 1500 gal capacity); by mid-September, the third barn (farrow/nursery) was connected. This barn had five flush tanks of 1000 gal capacity each. We measured the amount of treated water that filled the seven flush tanks in sow farm B with a cylinder and stopwatch in two occasions: it averaged 6,350 gal, 6,540 gal, and 26,320 gal for flush tanks in barns 1, 2 and 3, respectively. During the 84-day evaluation period (August-October) the sow farm generated 2,279,745 gal of flushed manure or an average flow rate of 27,140 gal/day (Table 4). Collectively, during the 84-day evaluation (Aug.-Oct.) the system treated 6,344,342 gal of manure from the two farms or an average flow rate of 75,527 gal of manure per day. Data through December was consistent; the system treated about 12 million gallons of manure in 153 days, or about 78,422 gal of manure per day.
19
Table 4. Wastewater influent monthly volumes and flow rates from finishing and sow farms into the wastewater treatment system during evaluation at Jernigan farm Aug. 1-Oct. 23 (weekly flow rates shown in Figure 5), with additional data through December, 2012.
Month days
Total Volume Finishing Farm
Average Flow Rate Finishing Farm
Total Volume Sow Farm
Average Flow Rate Sow Farm
Total Volume Finishing + Sow Farm
Average System Influent Flow Rate
gal gal/day gal gal/day gal gal/day
August 31 2,197,232 70,878 464,379 14,980 2,661,611 85,858 September 30 1,227,635 40,921 768,051 25,602 1,995,687 66,523 October 23 639,730 27,814 1,047,315 45,535 1,687,045 73,350
Aug 1.-Oct 23 84 4,064,597 48,388 2,279,745 27,140 6,344,342 75,527 October 31 877,902 28,319 1,460,994 47,129 2,338,896 75,448 November 30 963,555 32,119 1,737,369 57,192 2,700,924 90,030 December 31 1,050,398 33,884 1,250,974 40,354 2,301,370 74,238
Aug.-Dec. 153 6,316,722 41,286 5,681,767 37,136 11,998,489 78,422
Figure 5. Flow rates of manure into the wastewater treatment system installed at Jernigan farm. Data are weekly average flow rates (gal/day) of data collected hourly. Monthly averages are shown in Table 4.
20
5. Water Quality Improvements
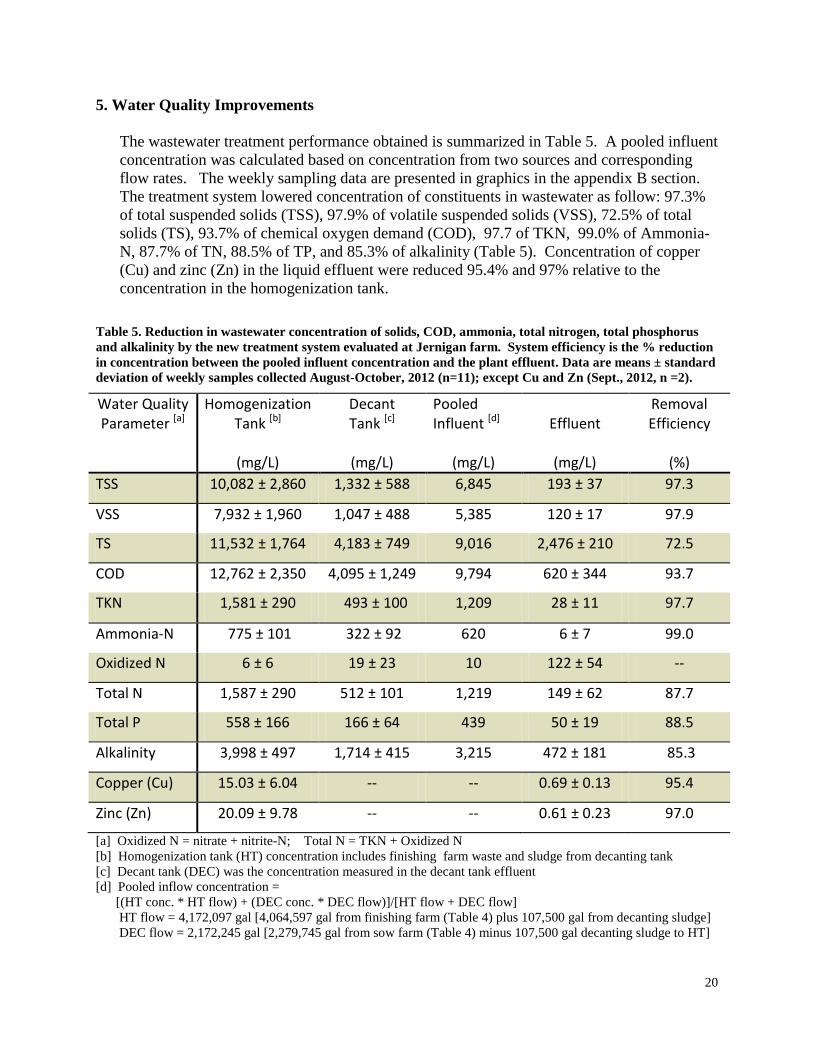
The wastewater treatment performance obtained is summarized in Table 5. A pooled influent concentration was calculated based on concentration from two sources and corresponding flow rates. The weekly sampling data are presented in graphics in the appendix B section. The treatment system lowered concentration of constituents in wastewater as follow: 97.3% of total suspended solids (TSS), 97.9% of volatile suspended solids (VSS), 72.5% of total solids (TS), 93.7% of chemical oxygen demand (COD), 97.7 of TKN, 99.0% of Ammonia-N, 87.7% of TN, 88.5% of TP, and 85.3% of alkalinity (Table 5). Concentration of copper (Cu) and zinc (Zn) in the liquid effluent were reduced 95.4% and 97% relative to the concentration in the homogenization tank.
Table 5. Reduction in wastewater concentration of solids, COD, ammonia, total nitrogen, total phosphorus and alkalinity by the new treatment system evaluated at Jernigan farm. System efficiency is the % reduction in concentration between the pooled influent concentration and the plant effluent. Data are means ± standard deviation of weekly samples collected August-October, 2012 (n=11); except Cu and Zn (Sept., 2012, n =2).
Water Quality Parameter [a]
Homogenization Tank [b]
(mg/L)
Decant Tank [c]
(mg/L)
Pooled Influent [d]
(mg/L)
Effluent
(mg/L)
Removal Efficiency
(%)
TSS 10,082 ± 2,860 1,332 ± 588 6,845 193 ± 37 97.3
VSS 7,932 ± 1,960 1,047 ± 488 5,385 120 ± 17 97.9
TS 11,532 ± 1,764 4,183 ± 749 9,016 2,476 ± 210 72.5
COD 12,762 ± 2,350 4,095 ± 1,249 9,794 620 ± 344 93.7
TKN 1,581 ± 290 493 ± 100 1,209 28 ± 11 97.7
Ammonia-N 775 ± 101 322 ± 92 620 6 ± 7 99.0
Oxidized N 6 ± 6 19 ± 23 10 122 ± 54 --
Total N 1,587 ± 290 512 ± 101 1,219 149 ± 62 87.7
Total P 558 ± 166 166 ± 64 439 50 ± 19 88.5
Alkalinity 3,998 ± 497 1,714 ± 415 3,215 472 ± 181 85.3
Copper (Cu) 15.03 ± 6.04 -- -- 0.69 ± 0.13 95.4
Zinc (Zn) 20.09 ± 9.78 -- -- 0.61 ± 0.23 97.0
[a] Oxidized N = nitrate + nitrite-N; Total N = TKN + Oxidized N [b] Homogenization tank (HT) concentration includes finishing farm waste and sludge from decanting tank [c] Decant tank (DEC) was the concentration measured in the decant tank effluent [d] Pooled inflow concentration = [(HT conc. * HT flow) + (DEC conc. * DEC flow)]/[HT flow + DEC flow] HT flow = 4,172,097 gal [4,064,597 gal from finishing farm (Table 4) plus 107,500 gal from decanting sludge] DEC flow = 2,172,245 gal [2,279,745 gal from sow farm (Table 4) minus 107,500 gal decanting sludge to HT]
21
6. System efficiencies based on mass balance
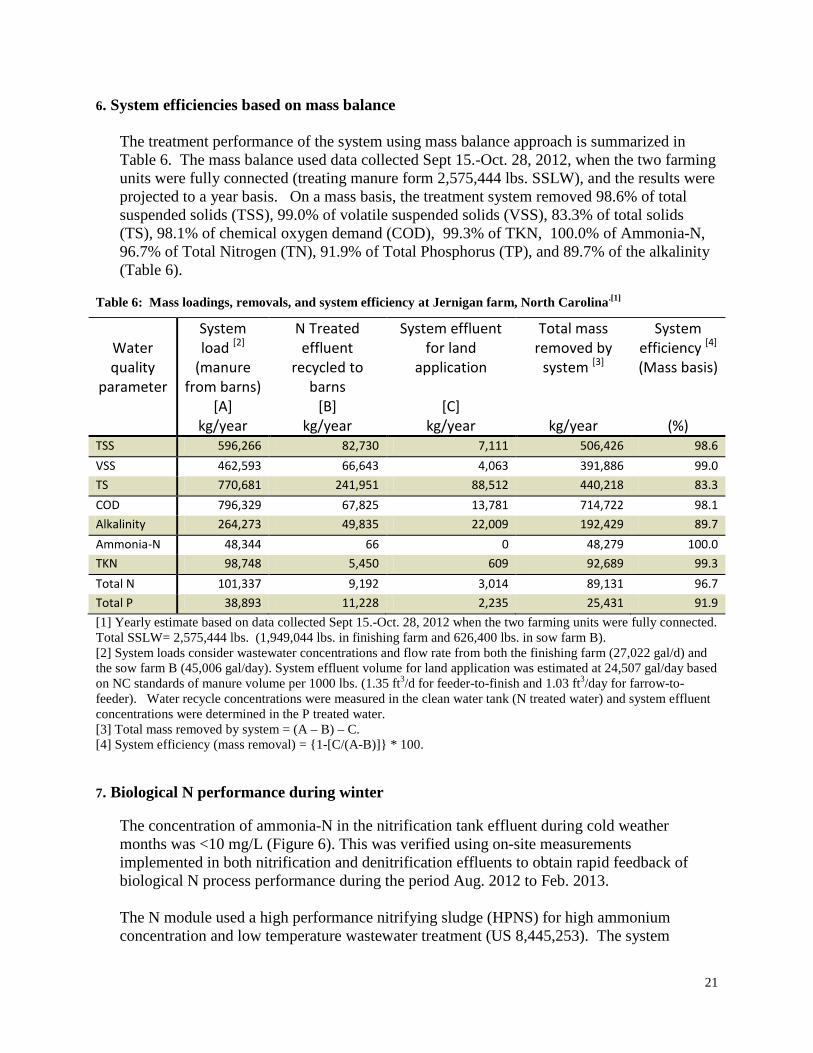
The treatment performance of the system using mass balance approach is summarized in Table 6. The mass balance used data collected Sept 15.-Oct. 28, 2012, when the two farming units were fully connected (treating manure form 2,575,444 lbs. SSLW), and the results were projected to a year basis. On a mass basis, the treatment system removed 98.6% of total suspended solids (TSS), 99.0% of volatile suspended solids (VSS), 83.3% of total solids (TS), 98.1% of chemical oxygen demand (COD), 99.3% of TKN, 100.0% of Ammonia-N, 96.7% of Total Nitrogen (TN), 91.9% of Total Phosphorus (TP), and 89.7% of the alkalinity (Table 6).
Table 6: Mass loadings, removals, and system efficiency at Jernigan farm, North Carolina.[1]
Water quality
parameter
System load [2]
(manure from barns)
[A] kg/year
N Treated effluent
recycled to barns
[B] kg/year
System effluent for land
application
[C] kg/year
Total mass removed by
system [3]
kg/year
System efficiency [4] (Mass basis)
(%) TSS 596,266 82,730 7,111 506,426 98.6 VSS 462,593 66,643 4,063 391,886 99.0 TS 770,681 241,951 88,512 440,218 83.3 COD 796,329 67,825 13,781 714,722 98.1 Alkalinity 264,273 49,835 22,009 192,429 89.7 Ammonia-N 48,344 66 0 48,279 100.0 TKN 98,748 5,450 609 92,689 99.3 Total N 101,337 9,192 3,014 89,131 96.7 Total P 38,893 11,228 2,235 25,431 91.9 [1] Yearly estimate based on data collected Sept 15.-Oct. 28, 2012 when the two farming units were fully connected. Total SSLW= 2,575,444 lbs. (1,949,044 lbs. in finishing farm and 626,400 lbs. in sow farm B). [2] System loads consider wastewater concentrations and flow rate from both the finishing farm (27,022 gal/d) and the sow farm B (45,006 gal/day). System effluent volume for land application was estimated at 24,507 gal/day based on NC standards of manure volume per 1000 lbs. (1.35 ft3/d for feeder-to-finish and 1.03 ft3/day for farrow-to-feeder). Water recycle concentrations were measured in the clean water tank (N treated water) and system effluent concentrations were determined in the P treated water. [3] Total mass removed by system = (A – B) – C. [4] System efficiency (mass removal) = {1-[C/(A-B)]} * 100.
7. Biological N performance during winter
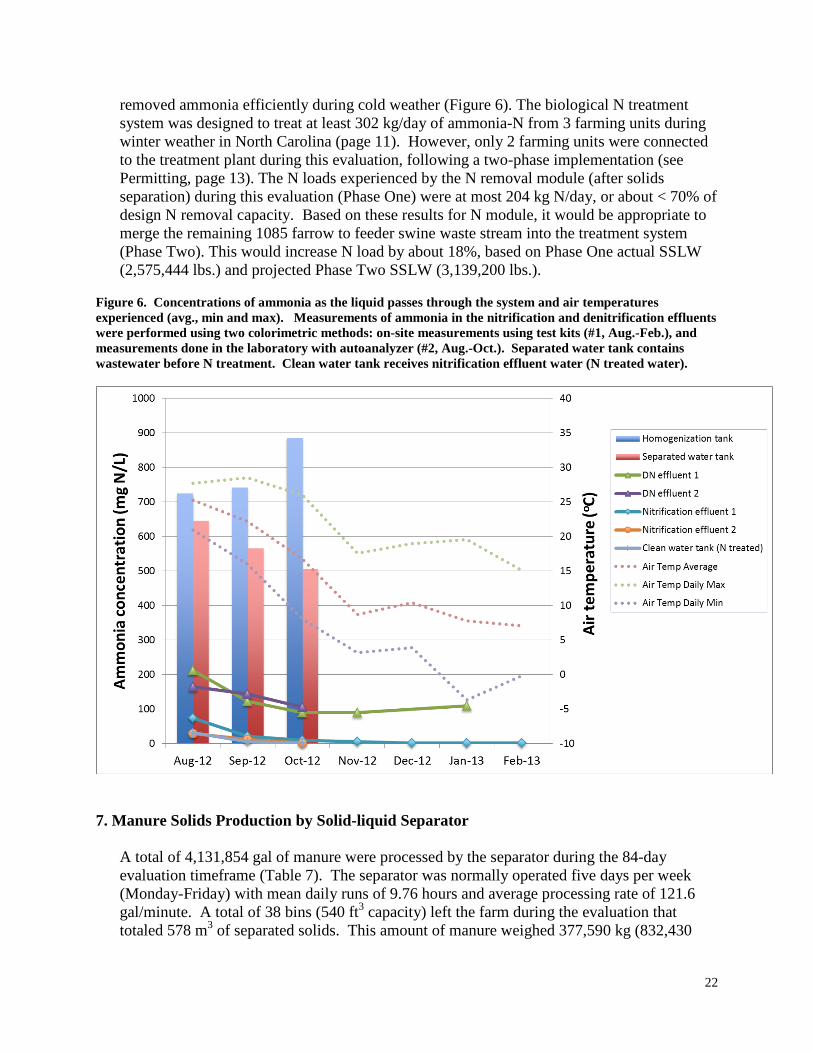
The concentration of ammonia-N in the nitrification tank effluent during cold weather months was <10 mg/L (Figure 6). This was verified using on-site measurements implemented in both nitrification and denitrification effluents to obtain rapid feedback of biological N process performance during the period Aug. 2012 to Feb. 2013. The N module used a high performance nitrifying sludge (HPNS) for high ammonium concentration and low temperature wastewater treatment (US 8,445,253). The system
22
removed ammonia efficiently during cold weather (Figure 6). The biological N treatment system was designed to treat at least 302 kg/day of ammonia-N from 3 farming units during winter weather in North Carolina (page 11). However, only 2 farming units were connected to the treatment plant during this evaluation, following a two-phase implementation (see Permitting, page 13). The N loads experienced by the N removal module (after solids separation) during this evaluation (Phase One) were at most 204 kg N/day, or about < 70% of design N removal capacity. Based on these results for N module, it would be appropriate to merge the remaining 1085 farrow to feeder swine waste stream into the treatment system (Phase Two). This would increase N load by about 18%, based on Phase One actual SSLW (2,575,444 lbs.) and projected Phase Two SSLW (3,139,200 lbs.).
Figure 6. Concentrations of ammonia as the liquid passes through the system and air temperatures experienced (avg., min and max). Measurements of ammonia in the nitrification and denitrification effluents were performed using two colorimetric methods: on-site measurements using test kits (#1, Aug.-Feb.), and measurements done in the laboratory with autoanalyzer (#2, Aug.-Oct.). Separated water tank contains wastewater before N treatment. Clean water tank receives nitrification effluent water (N treated water).
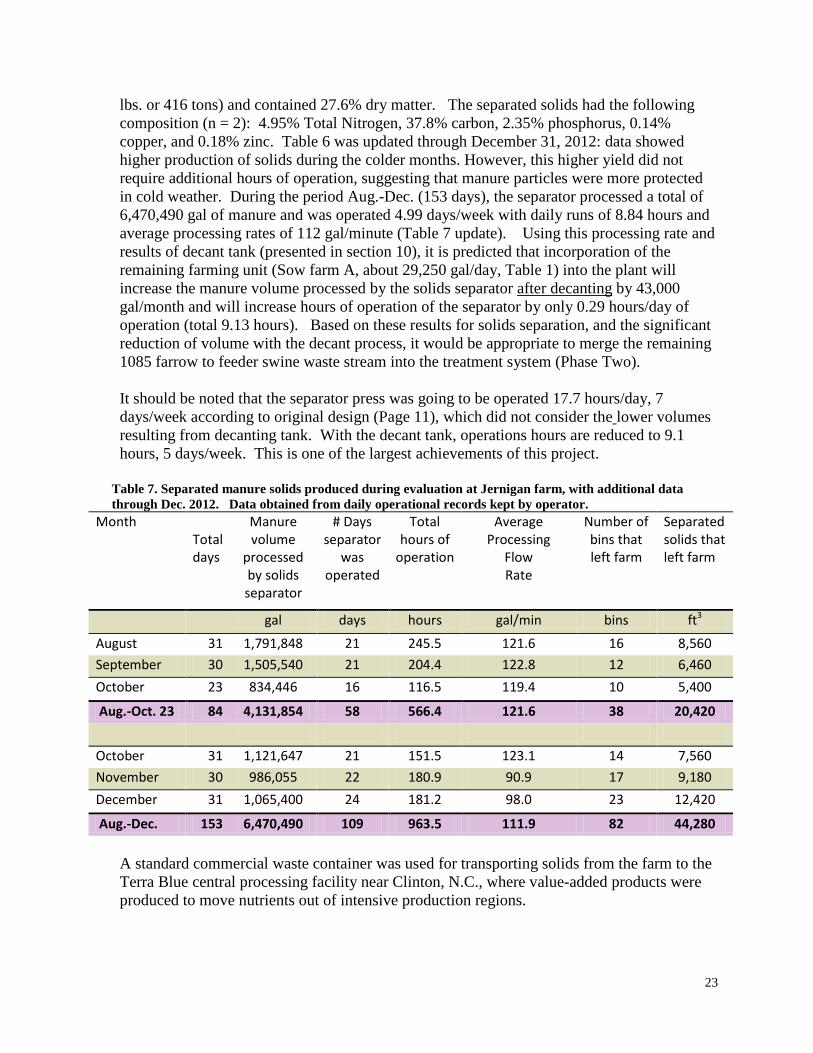
7. Manure Solids Production by Solid-liquid Separator
A total of 4,131,854 gal of manure were processed by the separator during the 84-day evaluation timeframe (Table 7). The separator was normally operated five days per week (Monday-Friday) with mean daily runs of 9.76 hours and average processing rate of 121.6 gal/minute. A total of 38 bins (540 ft3 capacity) left the farm during the evaluation that totaled 578 m3 of separated solids. This amount of manure weighed 377,590 kg (832,430
23
lbs. or 416 tons) and contained 27.6% dry matter. The separated solids had the following composition (n = 2): 4.95% Total Nitrogen, 37.8% carbon, 2.35% phosphorus, 0.14% copper, and 0.18% zinc. Table 6 was updated through December 31, 2012: data showed higher production of solids during the colder months. However, this higher yield did not require additional hours of operation, suggesting that manure particles were more protected in cold weather. During the period Aug.-Dec. (153 days), the separator processed a total of 6,470,490 gal of manure and was operated 4.99 days/week with daily runs of 8.84 hours and average processing rates of 112 gal/minute (Table 7 update). Using this processing rate and results of decant tank (presented in section 10), it is predicted that incorporation of the remaining farming unit (Sow farm A, about 29,250 gal/day, Table 1) into the plant will increase the manure volume processed by the solids separator after decanting by 43,000 gal/month and will increase hours of operation of the separator by only 0.29 hours/day of operation (total 9.13 hours). Based on these results for solids separation, and the significant reduction of volume with the decant process, it would be appropriate to merge the remaining 1085 farrow to feeder swine waste stream into the treatment system (Phase Two). It should be noted that the separator press was going to be operated 17.7 hours/day, 7 days/week according to original design (Page 11), which did not consider the lower volumes resulting from decanting tank. With the decant tank, operations hours are reduced to 9.1 hours, 5 days/week. This is one of the largest achievements of this project.
Table 7. Separated manure solids produced during evaluation at Jernigan farm, with additional data through Dec. 2012. Data obtained from daily operational records kept by operator.
Month Total days
Manure volume
processed by solids separator
# Days separator
was operated
Total hours of
operation
Average Processing
Flow Rate
Number of bins that left farm
Separated solids that left farm
gal days hours gal/min bins ft3
August 31 1,791,848 21 245.5 121.6 16 8,560 September 30 1,505,540 21 204.4 122.8 12 6,460 October 23 834,446 16 116.5 119.4 10 5,400
Aug.-Oct. 23 84 4,131,854 58 566.4 121.6 38 20,420 October 31 1,121,647 21 151.5 123.1 14 7,560 November 30 986,055 22 180.9 90.9 17 9,180 December 31 1,065,400 24 181.2 98.0 23 12,420
Aug.-Dec. 153 6,470,490 109 963.5 111.9 82 44,280 A standard commercial waste container was used for transporting solids from the farm to the Terra Blue central processing facility near Clinton, N.C., where value-added products were produced to move nutrients out of intensive production regions.
24
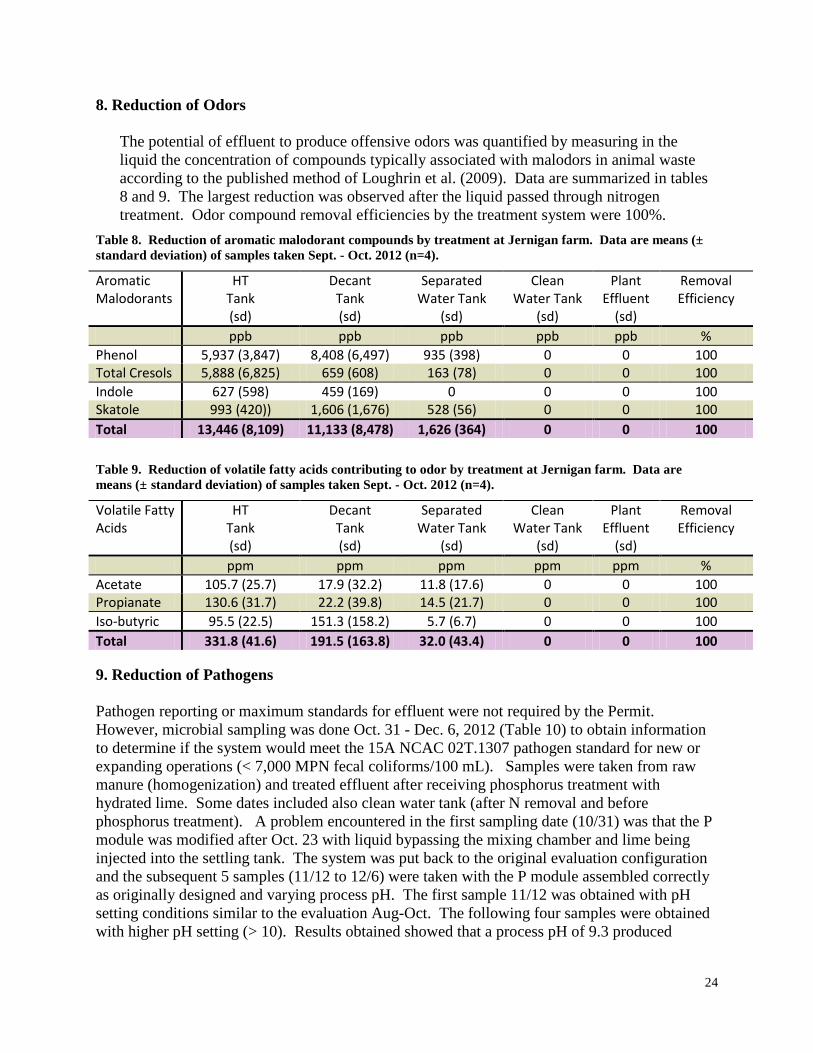
8. Reduction of Odors The potential of effluent to produce offensive odors was quantified by measuring in the liquid the concentration of compounds typically associated with malodors in animal waste according to the published method of Loughrin et al. (2009). Data are summarized in tables 8 and 9. The largest reduction was observed after the liquid passed through nitrogen treatment. Odor compound removal efficiencies by the treatment system were 100%.
Table 8. Reduction of aromatic malodorant compounds by treatment at Jernigan farm. Data are means (± standard deviation) of samples taken Sept. - Oct. 2012 (n=4).
Aromatic Malodorants
HT Tank (sd)
Decant Tank (sd)
Separated Water Tank
(sd)
Clean Water Tank
(sd)
Plant Effluent
(sd)
Removal Efficiency
ppb ppb ppb ppb ppb % Phenol 5,937 (3,847) 8,408 (6,497) 935 (398) 0 0 100 Total Cresols 5,888 (6,825) 659 (608) 163 (78) 0 0 100 Indole 627 (598) 459 (169) 0 0 0 100 Skatole 993 (420)) 1,606 (1,676) 528 (56) 0 0 100 Total 13,446 (8,109) 11,133 (8,478) 1,626 (364) 0 0 100
Table 9. Reduction of volatile fatty acids contributing to odor by treatment at Jernigan farm. Data are means (± standard deviation) of samples taken Sept. - Oct. 2012 (n=4).
Volatile Fatty Acids
HT Tank (sd)
Decant Tank (sd)
Separated Water Tank
(sd)
Clean Water Tank
(sd)
Plant Effluent
(sd)
Removal Efficiency
ppm ppm ppm ppm ppm % Acetate 105.7 (25.7) 17.9 (32.2) 11.8 (17.6) 0 0 100 Propianate 130.6 (31.7) 22.2 (39.8) 14.5 (21.7) 0 0 100 Iso-butyric 95.5 (22.5) 151.3 (158.2) 5.7 (6.7) 0 0 100 Total 331.8 (41.6) 191.5 (163.8) 32.0 (43.4) 0 0 100 9. Reduction of Pathogens
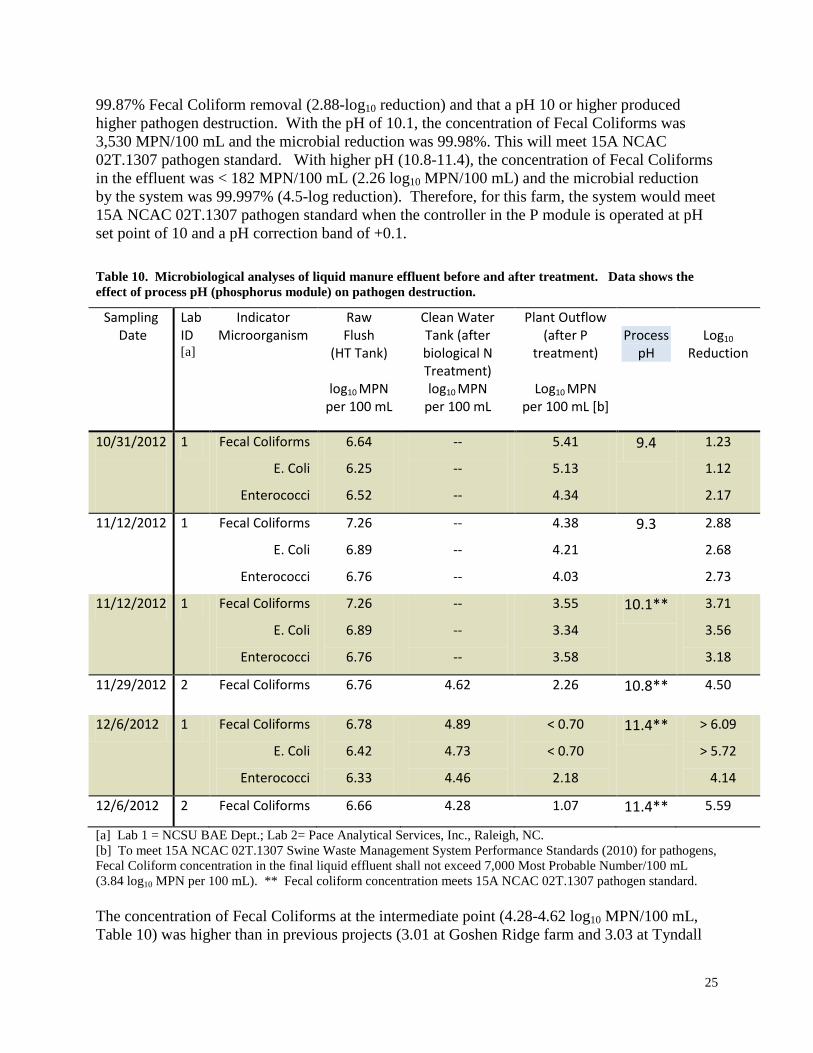
Pathogen reporting or maximum standards for effluent were not required by the Permit. However, microbial sampling was done Oct. 31 - Dec. 6, 2012 (Table 10) to obtain information to determine if the system would meet the 15A NCAC 02T.1307 pathogen standard for new or expanding operations (< 7,000 MPN fecal coliforms/100 mL). Samples were taken from raw manure (homogenization) and treated effluent after receiving phosphorus treatment with hydrated lime. Some dates included also clean water tank (after N removal and before phosphorus treatment). A problem encountered in the first sampling date (10/31) was that the P module was modified after Oct. 23 with liquid bypassing the mixing chamber and lime being injected into the settling tank. The system was put back to the original evaluation configuration and the subsequent 5 samples (11/12 to 12/6) were taken with the P module assembled correctly as originally designed and varying process pH. The first sample 11/12 was obtained with pH setting conditions similar to the evaluation Aug-Oct. The following four samples were obtained with higher pH setting (> 10). Results obtained showed that a process pH of 9.3 produced
25
99.87% Fecal Coliform removal (2.88-log10 reduction) and that a pH 10 or higher produced higher pathogen destruction. With the pH of 10.1, the concentration of Fecal Coliforms was 3,530 MPN/100 mL and the microbial reduction was 99.98%. This will meet 15A NCAC 02T.1307 pathogen standard. With higher pH (10.8-11.4), the concentration of Fecal Coliforms in the effluent was < 182 MPN/100 mL (2.26 log10 MPN/100 mL) and the microbial reduction by the system was 99.997% (4.5-log reduction). Therefore, for this farm, the system would meet 15A NCAC 02T.1307 pathogen standard when the controller in the P module is operated at pH set point of 10 and a pH correction band of +0.1. Table 10. Microbiological analyses of liquid manure effluent before and after treatment. Data shows the effect of process pH (phosphorus module) on pathogen destruction.
Sampling Date
Lab ID [a]
Indicator Microorganism
Raw Flush
(HT Tank)
log10 MPN per 100 mL
Clean Water Tank (after biological N Treatment) log10 MPN
per 100 mL
Plant Outflow (after P
treatment)
Log10 MPN per 100 mL [b]
Process
pH
Log10
Reduction
10/31/2012
1 Fecal Coliforms
E. Coli
Enterococci
6.64
6.25
6.52
--
--
--
5.41
5.13
4.34
9.4 1.23
1.12
2.17
11/12/2012 1 Fecal Coliforms
E. Coli
Enterococci
7.26
6.89
6.76
--
--
--
4.38
4.21
4.03
9.3 2.88
2.68
2.73
11/12/2012 1 Fecal Coliforms
E. Coli
Enterococci
7.26
6.89
6.76
--
--
--
3.55
3.34
3.58
10.1** 3.71
3.56
3.18
11/29/2012 2 Fecal Coliforms 6.76 4.62 2.26 10.8** 4.50
12/6/2012 1 Fecal Coliforms
E. Coli
Enterococci
6.78
6.42
6.33
4.89
4.73
4.46
< 0.70
< 0.70
2.18
11.4** > 6.09
> 5.72
4.14
12/6/2012 2 Fecal Coliforms 6.66 4.28 1.07 11.4** 5.59
[a] Lab 1 = NCSU BAE Dept.; Lab 2= Pace Analytical Services, Inc., Raleigh, NC. [b] To meet 15A NCAC 02T.1307 Swine Waste Management System Performance Standards (2010) for pathogens, Fecal Coliform concentration in the final liquid effluent shall not exceed 7,000 Most Probable Number/100 mL (3.84 log10 MPN per 100 mL). ** Fecal coliform concentration meets 15A NCAC 02T.1307 pathogen standard. The concentration of Fecal Coliforms at the intermediate point (4.28-4.62 log10 MPN/100 mL, Table 10) was higher than in previous projects (3.01 at Goshen Ridge farm and 3.03 at Tyndall
26
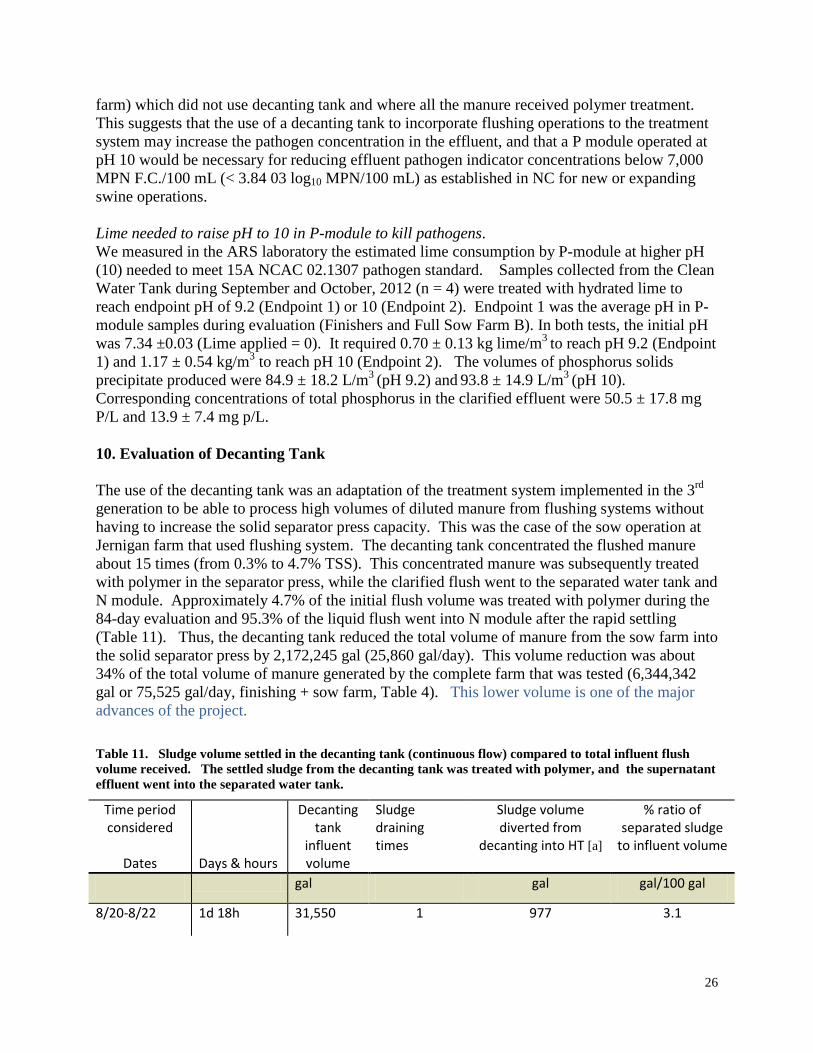
farm) which did not use decanting tank and where all the manure received polymer treatment. This suggests that the use of a decanting tank to incorporate flushing operations to the treatment system may increase the pathogen concentration in the effluent, and that a P module operated at pH 10 would be necessary for reducing effluent pathogen indicator concentrations below 7,000 MPN F.C./100 mL (< 3.84 03 log10 MPN/100 mL) as established in NC for new or expanding swine operations. Lime needed to raise pH to 10 in P-module to kill pathogens. We measured in the ARS laboratory the estimated lime consumption by P-module at higher pH (10) needed to meet 15A NCAC 02.1307 pathogen standard. Samples collected from the Clean Water Tank during September and October, 2012 (n = 4) were treated with hydrated lime to reach endpoint pH of 9.2 (Endpoint 1) or 10 (Endpoint 2). Endpoint 1 was the average pH in P-module samples during evaluation (Finishers and Full Sow Farm B). In both tests, the initial pH was 7.34 ±0.03 (Lime applied = 0). It required 0.70 ± 0.13 kg lime/m3 to reach pH 9.2 (Endpoint 1) and 1.17 ± 0.54 kg/m3 to reach pH 10 (Endpoint 2). The volumes of phosphorus solids precipitate produced were 84.9 ± 18.2 L/m3 (pH 9.2) and 93.8 ± 14.9 L/m3 (pH 10). Corresponding concentrations of total phosphorus in the clarified effluent were 50.5 ± 17.8 mg P/L and 13.9 ± 7.4 mg p/L. 10. Evaluation of Decanting Tank The use of the decanting tank was an adaptation of the treatment system implemented in the 3rd generation to be able to process high volumes of diluted manure from flushing systems without having to increase the solid separator press capacity. This was the case of the sow operation at Jernigan farm that used flushing system. The decanting tank concentrated the flushed manure about 15 times (from 0.3% to 4.7% TSS). This concentrated manure was subsequently treated with polymer in the separator press, while the clarified flush went to the separated water tank and N module. Approximately 4.7% of the initial flush volume was treated with polymer during the 84-day evaluation and 95.3% of the liquid flush went into N module after the rapid settling (Table 11). Thus, the decanting tank reduced the total volume of manure from the sow farm into the solid separator press by 2,172,245 gal (25,860 gal/day). This volume reduction was about 34% of the total volume of manure generated by the complete farm that was tested (6,344,342 gal or 75,525 gal/day, finishing + sow farm, Table 4). This lower volume is one of the major advances of the project. Table 11. Sludge volume settled in the decanting tank (continuous flow) compared to total influent flush volume received. The settled sludge from the decanting tank was treated with polymer, and the supernatant effluent went into the separated water tank.
Time period considered
Dates
Days & hours
Decanting tank
influent volume
Sludge draining times
Sludge volume diverted from
decanting into HT [a]
% ratio of separated sludge
to influent volume
gal gal gal/100 gal
8/20-8/22 1d 18h 31,550 1 977 3.1
27
8/25-8/30 5d 5h 73,068 1 1807 2.5
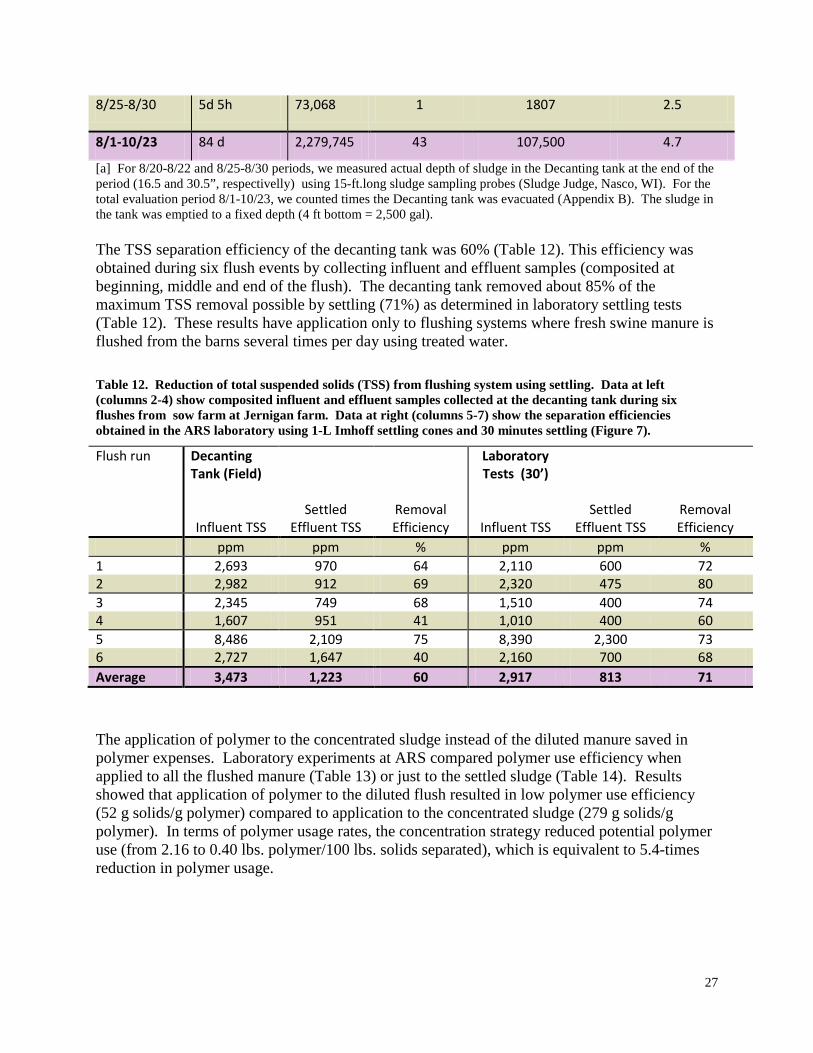
8/1-10/23 84 d 2,279,745 43 107,500 4.7
[a] For 8/20-8/22 and 8/25-8/30 periods, we measured actual depth of sludge in the Decanting tank at the end of the period (16.5 and 30.5”, respectivelly) using 15-ft.long sludge sampling probes (Sludge Judge, Nasco, WI). For the total evaluation period 8/1-10/23, we counted times the Decanting tank was evacuated (Appendix B). The sludge in the tank was emptied to a fixed depth (4 ft bottom = 2,500 gal). The TSS separation efficiency of the decanting tank was 60% (Table 12). This efficiency was obtained during six flush events by collecting influent and effluent samples (composited at beginning, middle and end of the flush). The decanting tank removed about 85% of the maximum TSS removal possible by settling (71%) as determined in laboratory settling tests (Table 12). These results have application only to flushing systems where fresh swine manure is flushed from the barns several times per day using treated water. Table 12. Reduction of total suspended solids (TSS) from flushing system using settling. Data at left (columns 2-4) show composited influent and effluent samples collected at the decanting tank during six flushes from sow farm at Jernigan farm. Data at right (columns 5-7) show the separation efficiencies obtained in the ARS laboratory using 1-L Imhoff settling cones and 30 minutes settling (Figure 7).
Flush run Decanting Tank (Field)
Influent TSS
Settled Effluent TSS
Removal Efficiency
Laboratory Tests (30’)
Influent TSS
Settled Effluent TSS
Removal Efficiency
ppm ppm % ppm ppm % 1 2,693 970 64 2,110 600 72 2 2,982 912 69 2,320 475 80 3 2,345 749 68 1,510 400 74 4 1,607 951 41 1,010 400 60 5 8,486 2,109 75 8,390 2,300 73 6 2,727 1,647 40 2,160 700 68 Average 3,473 1,223 60 2,917 813 71
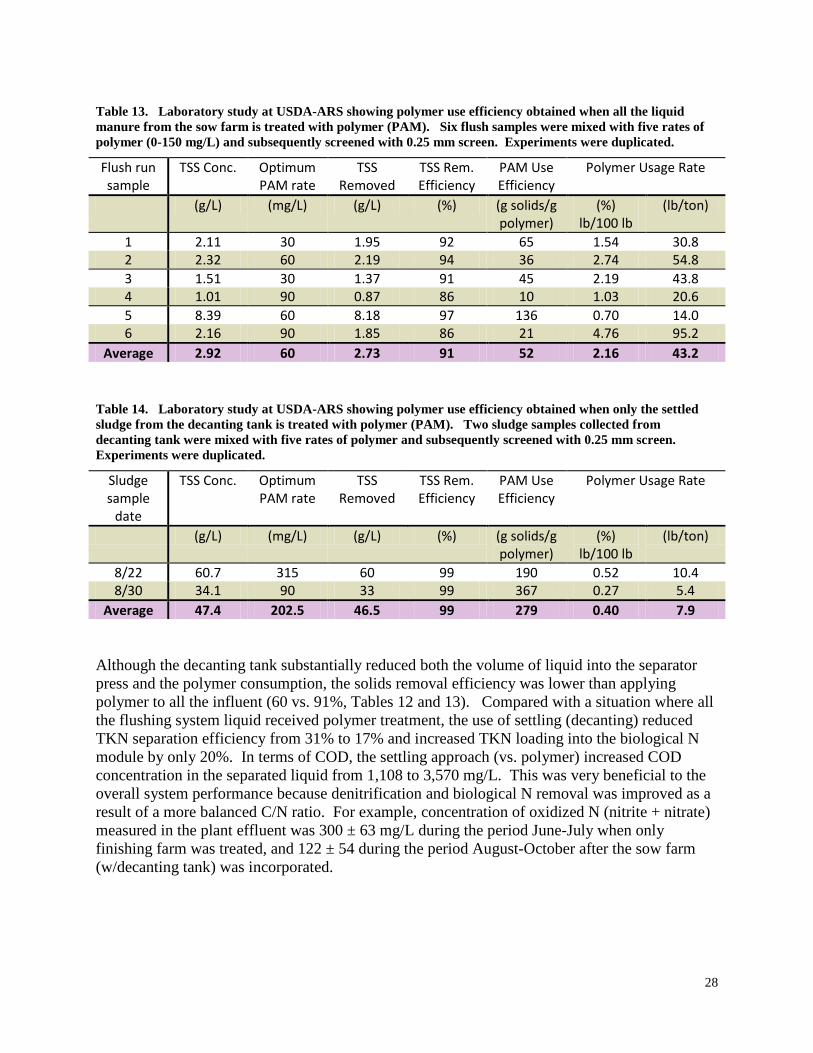
The application of polymer to the concentrated sludge instead of the diluted manure saved in polymer expenses. Laboratory experiments at ARS compared polymer use efficiency when applied to all the flushed manure (Table 13) or just to the settled sludge (Table 14). Results showed that application of polymer to the diluted flush resulted in low polymer use efficiency (52 g solids/g polymer) compared to application to the concentrated sludge (279 g solids/g polymer). In terms of polymer usage rates, the concentration strategy reduced potential polymer use (from 2.16 to 0.40 lbs. polymer/100 lbs. solids separated), which is equivalent to 5.4-times reduction in polymer usage.
28
Table 13. Laboratory study at USDA-ARS showing polymer use efficiency obtained when all the liquid manure from the sow farm is treated with polymer (PAM). Six flush samples were mixed with five rates of polymer (0-150 mg/L) and subsequently screened with 0.25 mm screen. Experiments were duplicated.
Flush run sample
TSS Conc.
Optimum PAM rate
TSS Removed
TSS Rem. Efficiency
PAM Use Efficiency
Polymer Usage Rate
(g/L) (mg/L) (g/L) (%) (g solids/g polymer)
(%) lb/100 lb
(lb/ton)
1 2.11 30 1.95 92 65 1.54 30.8 2 2.32 60 2.19 94 36 2.74 54.8 3 1.51 30 1.37 91 45 2.19 43.8 4 1.01 90 0.87 86 10 1.03 20.6 5 8.39 60 8.18 97 136 0.70 14.0 6 2.16 90 1.85 86 21 4.76 95.2
Average 2.92 60 2.73 91 52 2.16 43.2
Table 14. Laboratory study at USDA-ARS showing polymer use efficiency obtained when only the settled sludge from the decanting tank is treated with polymer (PAM). Two sludge samples collected from decanting tank were mixed with five rates of polymer and subsequently screened with 0.25 mm screen. Experiments were duplicated.
Sludge sample
date
TSS Conc.
Optimum PAM rate
TSS Removed
TSS Rem. Efficiency
PAM Use Efficiency
Polymer Usage Rate
(g/L) (mg/L) (g/L) (%) (g solids/g polymer)
(%) lb/100 lb
(lb/ton)
8/22 60.7 315 60 99 190 0.52 10.4 8/30 34.1 90 33 99 367 0.27 5.4
Average 47.4 202.5 46.5 99 279 0.40 7.9 Although the decanting tank substantially reduced both the volume of liquid into the separator press and the polymer consumption, the solids removal efficiency was lower than applying polymer to all the influent (60 vs. 91%, Tables 12 and 13). Compared with a situation where all the flushing system liquid received polymer treatment, the use of settling (decanting) reduced TKN separation efficiency from 31% to 17% and increased TKN loading into the biological N module by only 20%. In terms of COD, the settling approach (vs. polymer) increased COD concentration in the separated liquid from 1,108 to 3,570 mg/L. This was very beneficial to the overall system performance because denitrification and biological N removal was improved as a result of a more balanced C/N ratio. For example, concentration of oxidized N (nitrite + nitrate) measured in the plant effluent was 300 ± 63 mg/L during the period June-July when only finishing farm was treated, and 122 ± 54 during the period August-October after the sow farm (w/decanting tank) was incorporated.
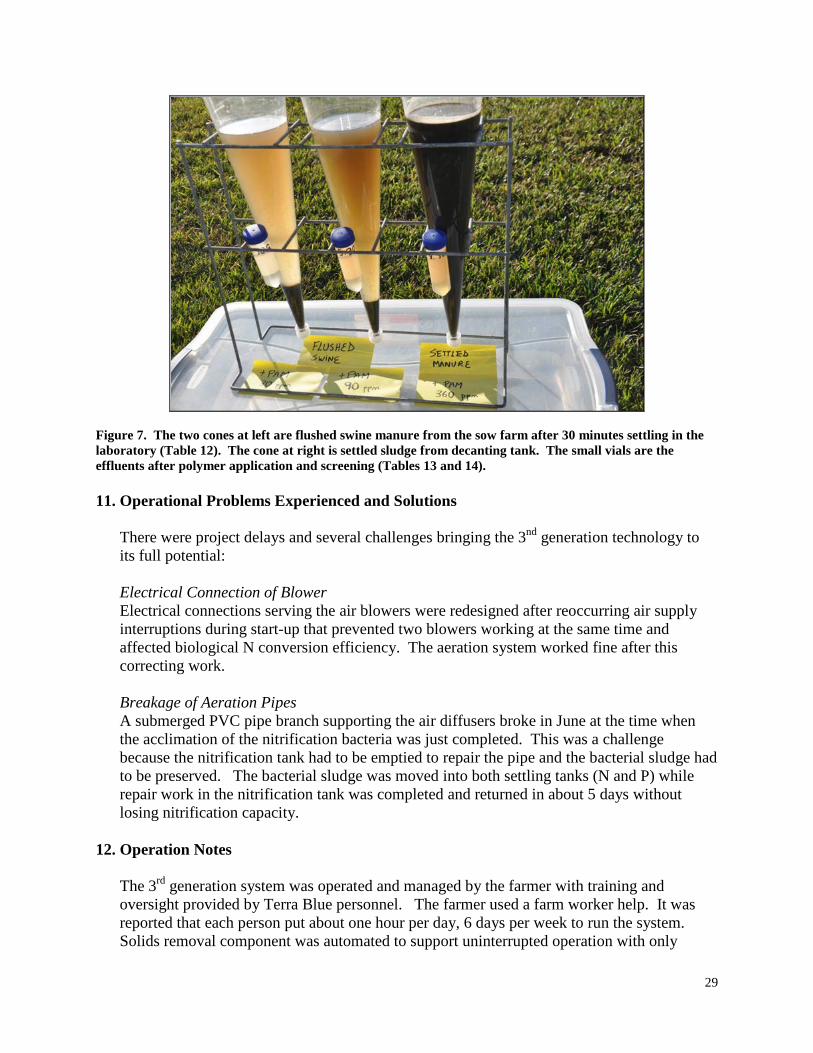
29
Figure 7. The two cones at left are flushed swine manure from the sow farm after 30 minutes settling in the laboratory (Table 12). The cone at right is settled sludge from decanting tank. The small vials are the effluents after polymer application and screening (Tables 13 and 14). 11. Operational Problems Experienced and Solutions
There were project delays and several challenges bringing the 3nd generation technology to its full potential: Electrical Connection of Blower Electrical connections serving the air blowers were redesigned after reoccurring air supply interruptions during start-up that prevented two blowers working at the same time and affected biological N conversion efficiency. The aeration system worked fine after this correcting work. Breakage of Aeration Pipes A submerged PVC pipe branch supporting the air diffusers broke in June at the time when the acclimation of the nitrification bacteria was just completed. This was a challenge because the nitrification tank had to be emptied to repair the pipe and the bacterial sludge had to be preserved. The bacterial sludge was moved into both settling tanks (N and P) while repair work in the nitrification tank was completed and returned in about 5 days without losing nitrification capacity.
12. Operation Notes
The 3rd generation system was operated and managed by the farmer with training and oversight provided by Terra Blue personnel. The farmer used a farm worker help. It was reported that each person put about one hour per day, 6 days per week to run the system. Solids removal component was automated to support uninterrupted operation with only

30
periodic checks during the day. The farmer indicated that the type of machinery and equipment involved was similar in complexity to other equipment, pumps and electronic controls already used in the swine production facilities. In this project the company used on-site testing and also monitoring information from this evaluation to obtain rapid feedback on the process performance. This performance data was shared with the farmer to allow him to make adjustments to the system to maximize his objectives as well. Successful operation of these systems in the future will require ongoing sampling and analysis to provide the operator with real-time process information to ensure optimum system performance. It will be necessary also for the North Carolina Department of Environment and Natural Resources, Division of Water Quality to establish operator training/certification requirements specifically directed towards innovative animal waste treatment systems permitted.
13. Lessons Learned – Jernigan Farm Project 1. System efficiency can be significantly improved and operating expenses significantly
lowered by adding a decanting system (rapid gravity settling) to concentrate solids in farms that use flushing systems.
2. The treatment system can be managed efficiently by farm staff. 3. Solids removal component can be automated to support uninterrupted operation with only
periodic checks during the day. 4. The fresher the wastewater, the greater the operational efficiency and performance. 5. A standard commercial waste container works very well for transporting solids from the
farm to a central processing facility where value-added products can be produced to move nutrients out of intensive production regions.
6. Coordination of flush tanks among barns using timers and valves improves decant tank performance.
7. Lime application during phosphorus treatment using process pH 10 is effective for reduction of pathogens to meet new NC standards.
8. The evaluation of Phase One performance (this report) suggests the remaining waste stream (Sow farm A) can be merged into the treatment system. When fully implemented (Phase Two), the system serves the entire waste stream from three farm units (3,139,200 lbs. SSLW).
14. Swine production changes being done in 2003 The following are updates on Phase Two system implementation at Jernigan farm (7/8/13)
• The initial plan of treating the stream from 2,285 Farrow to Feeder (Sow farms A and B) and 12,960 head Feeder to Finish swine was changed.
• The 1200 Sows in Sow Farm B buildings are all being replaced with 5,440 finishing pigs. • Sow farm A across the road will not be connected to the treatment system. • A new barn is being constructed near the treatment plant for 2,600 finishing pigs. • After these changes are implemented, the same treatment system will serve the entire
waste stream from 21,000-head Farrow to Finish operation (12,960 + 5,440 + 2,600). • Full implementation will be ready October 2013.
31
Conclusions
Major goals in the demonstration and verification of a third-generation wastewater treatment system for swine manure were achieved. These goals included replacement of anaerobic lagoon treatment, adaptation of the system to receive higher volume of liquid waste typical of flushing systems, and efficient environmental performance when installed in larger swine farms. The treatment provided full-scale treatment to a large swine farm with approximately 2,575,444 lbs. SSLW. It processed all the manure from a 1,200-sow operation (Farrow to Feeder) with flushing system (27,000 gal manure/day) and a 12,960 Feeder to Finish operation with pit recharge system (48,000 gal manure/day). A new decanting tank was effective to concentrate the diluted manure from flushing systems and increase solid separator press capacity and polymer effectiveness. Average reductions obtained were: 97.3% TSS, 93.7% COD, 99.0% Ammonia-N, 87.7% of TN, 88.5% of TP, 95.4% Cu, 97.0% Zn, and 100% odor compounds. On a mass basis, the treatment system removed 98.6% TSS, 99.0% VSS, 83.3% TS, 98.1% COD, 99.3% TKN, 100.0% Ammonia-N, 96.7% of TN, and 91.9% TP. For pathogens, the system reduces F.C. < 7,000 MPN/100 mL when the P module is operated at pH 10. It was verified that the third-generation technology is technically and operationally feasible and can meet the high environmental standards demonstrated in previous versions. The confidence in the technical and environmental achievements by this project is high.
Acknowledgements
The sponsor of this demonstration project was North Carolina's Clean Water Management Trust Fund project (CWMTF), Project 2006A-522: “WW/Alternative Swine Waste System, cape Fear Tributary”. Environmental performance evaluation was supported by USDA-ARS National Program 214, Research Project 6657-13630-005-00D “Innovative Bioresource Management Technologies for Enhanced Environmental Quality and Value optimization” at the ARS Research Unit in Florence, SC. Participation of Dr. Kunz as visiting scientist was funded by Embrapa (Brazil’s Agricultural Research Organization) for sabbatical in Florence. Mention of a specific product or vendor does not constitute a guarantee or warrant of the product by the USDA or imply its approval to the exclusion of other products that may be suitable. The authors are grateful to the following individuals and companies that contributed to the success of this full-scale, third generation evaluation: Dr. Mike Williams, NCSU, for leadership in the process of demonstration and identification
of lower-cost, alternative swine treatment technology in North Carolina. Dr. Ray Campbell, Terra Blue Inc., for leadership in project implementation, and help with
the performance evaluation. Mr. Doug Jernigan for providing his farm for this demonstration, operation of the system,
and help in the evaluation.
32
Mr. Nelson Renfrow, Terra Blue Inc., for construction of the system, and assistance with mounting evaluation equipment.
USDA-ARS, Florence, SC, William Brigman and Ray Winans for their help with
monitoring equipment and weekly field sampling, and Chris Brown for all the laboratory analyses.
USDA-ARS, Bowling Green, KY, Robert Derrek Brown for his help with odor analyses. Prestage Farms Inc., for providing the pig production records used in the report.
Citations 15A NCAC 02T. 2010. Swine Waste Management System Performance Standards. http://portal.ncdenr.org/c/document_library/get_file?uuid=eb13e046-e452-4b1c-9182-7f9ba497b45a&groupId=38364 APHA, AWWA, WEF. 1998. Standard methods for the examination of water and wastewater. Am. Public Health Assoc., Washington, DC. Barker, J.C. 1996a. Swine Production Facility Manure Management: Pit Recharge- Lagoon Treatment. North Carolina Cooperative Extension Service. Pub. No. EBAE 128.88. http://www.bae.ncsu.edu/programs/extension/publicat/wqwm/ebae128_88.html Barker, J.C. 1996b. Swine Production Facility Manure Management: Underfloor Flush - Lagoon Treatment. North Carolina Cooperative Extension Service. Pub. No. EBAE 129.88. http://www.bae.ncsu.edu/programs/extension/publicat/wqwm/ebae129_88.html Chastain, J.P., Camberato, J.J., Albrecht, J.E., Adams, J. 1999. Swine manure production and nutrient content. In: South Carolina Confined Animal Manure Managers Certification Program, Chapter 3, 1-17. Clemson Univ., SC. Chastain, J.P. and M.B. Vanotti. 2003. Correlation Equations to Predict the Solids and Plant Nutrient Removal Efficiencies for Gravity Settling of Swine Manure. In: R.T. Burnes (ed), Animal, Agricultural and Food Processing Wastes IX : Proceedings of the Nineth International Symposium, Research Triangle Park, NC, Oct. 12-15, ASAE, St. Joseph, MI, pp 487-495. http://www.clemson.edu/cafls/safes/faculty_staff/research/chastain_correlation_equations.pdf Loughrin, J.H., Vanotti, M.B., Szogi, A.A. and Lovanh, N. 2009. Evaluation of second-generation multistage wastewater treatment system for the removal of malodors from liquid swine waste. J. Environ. Qual. 38:1739-1748. Senate Bill 1465. 2007: Performance standards for animal waste management systems that serve swine farms; lagoon and sprayfield systems prohibited. General Assembly of North Carolina, Session 2007, Session Law 2007-523.
33
http://www.legislature.state.nc.us/EnactedLegislation/SessionLaws/PDF/2007-2008/SL2007-523.pdf U.S. Patent No. 6,893,567. 2005. Wastewater treatment system. Vanotti, M.B., A.A. Szogi, and P.G. Hunt (inventors). US Patent & Trademark Office, Washington, D.C. U.S. Patent No. 7,674,379 B2. 2010. Wastewater treatment system with simultaneous separation of phosphorus sludge and manure solids. Vanotti, M.B., Szogi, A.A., and Fetterman, L. (inventors) U.S. Patent & Trademark Office, Washington, D.C. U.S. Patent No. 8,445,253 B2. 2013. High performance nitrifying sludge (HPNS) for high ammonium concentration and low temperature wastewater treatment. Vanotti, M.B., A.A. Szogi, and T.F. Ducey (inventors). US Patent and Trademark Office, Washington, D.C. Vanotti, M.B. 2004. Evaluation of environmentally superior technology: Swine waste treatment system for elimination of lagoons, reduced environmental impact, and improved water quality (Solids separation / nitrification-denitrification / soluble phosphorus removal / solids processing system). Final Report for the NC Attorney General & Smithfield Foods, Premium Standard Farms, and Frontline Farmers Agreements. Available at: http://www.cals.ncsu.edu/waste_mgt/smithfield_projects/phase1report04/A.9Super%20Soil%20final.pdf. Vanotti, M. B. 2005. Evaluation of Environmentally Superior Technology: Swine waste treatment system for elimination of lagoons, reduced environmental impact, and improved water quality (Centralized composting unit). Phase II: Final Report for Technology Determination per Agreements between NC Attorney General & Smithfield Foods, Premium Standard Farms, and Frontline Farmers. July 25, 2005. Available at: http://www.cals.ncsu.edu/waste_mgt/smithfield_projects/phase2report05/cd,web%20files/A1.pdf Vanotti, M. and Szogi, A. 2007. Evaluation of environmental superior technology contingent determination – Second generation super soil technology. Final Report for NC Department of Justice – Office of the Attorney General Environmental Enhancement Fund Program. 48 pp. Available at: http://www.cals.ncsu.edu/waste_mgt/smithfield_projects/supersoils2ndgeneration/pdfs/technical_report.pdf . Vanotti, M.B., Szogi, A.A., Millner, P.D. and Loughrin, J.H. 2009. Development of a second-generation environmentally superior technology for treatment of swine manure in the USA. Biores. Technol. 100(22):5406-5416. (https://www.ars.usda.gov/SP2UserFiles/Place/66570000/Manuscripts/2009/Man812.pdf ) Vanotti, M., M. Garcia, A. Szogi, P. Hunt, P. Millner. 2012. Method for Recovery of Phosphorus from Animal Wastewater. Presentation at WEFTEC 2012, 85th Annual Water Environment Federation Technical Exhibition and Conference, New Orleans, Oct. 3, 2012 https://www.ars.usda.gov/SP2UserFiles/Place/66570000/FY13/weftec_2012_vanotti.pdf
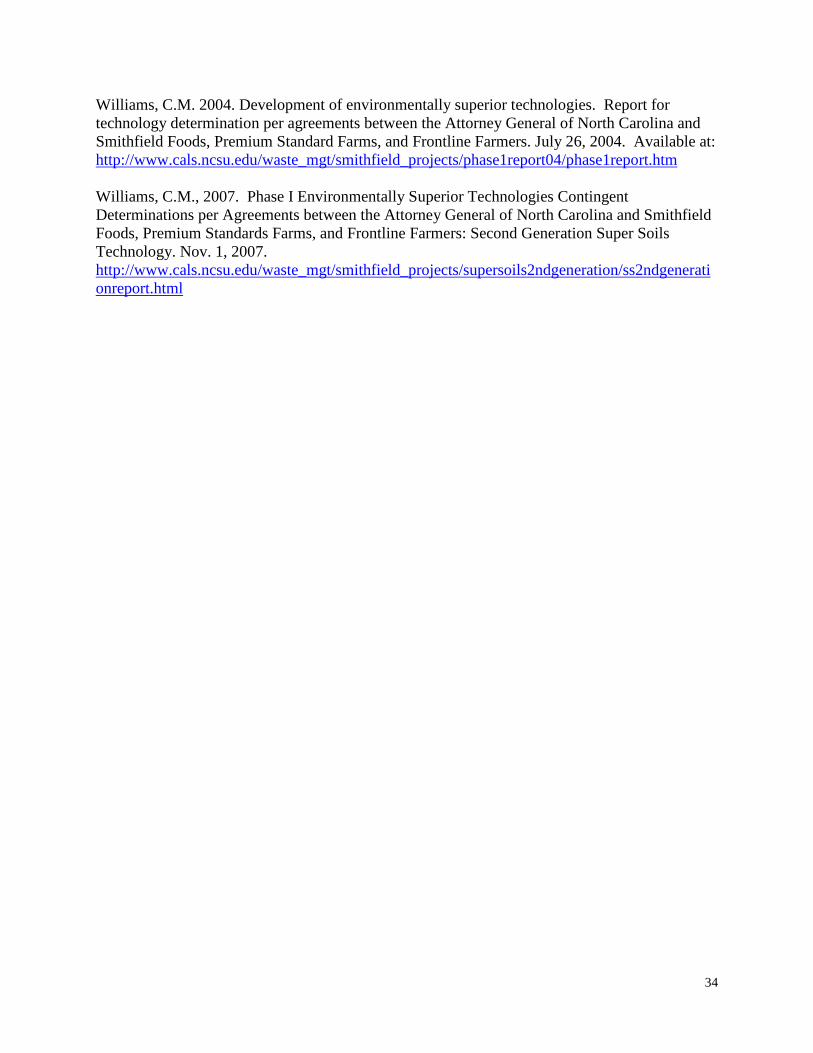
34
Williams, C.M. 2004. Development of environmentally superior technologies. Report for technology determination per agreements between the Attorney General of North Carolina and Smithfield Foods, Premium Standard Farms, and Frontline Farmers. July 26, 2004. Available at: http://www.cals.ncsu.edu/waste_mgt/smithfield_projects/phase1report04/phase1report.htm Williams, C.M., 2007. Phase I Environmentally Superior Technologies Contingent Determinations per Agreements between the Attorney General of North Carolina and Smithfield Foods, Premium Standards Farms, and Frontline Farmers: Second Generation Super Soils Technology. Nov. 1, 2007. http://www.cals.ncsu.edu/waste_mgt/smithfield_projects/supersoils2ndgeneration/ss2ndgenerationreport.html
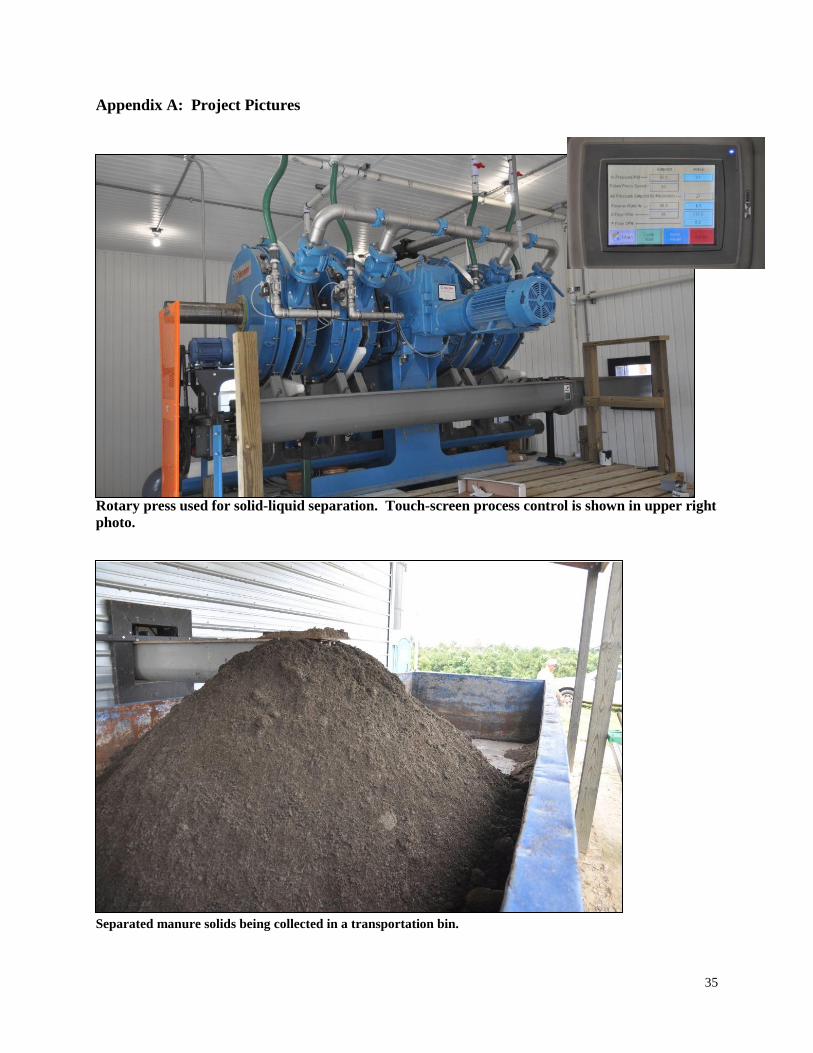
35
Appendix A: Project Pictures
Rotary press used for solid-liquid separation. Touch-screen process control is shown in upper right photo.
Separated manure solids being collected in a transportation bin.
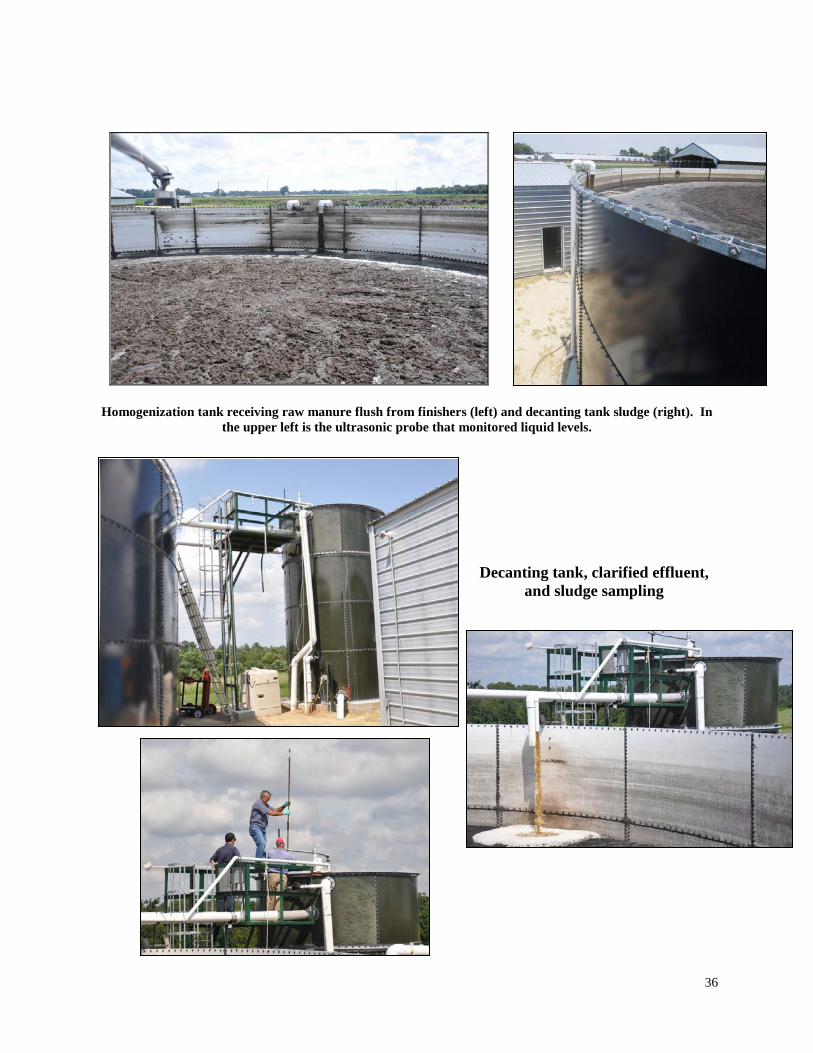
36
Homogenization tank receiving raw manure flush from finishers (left) and decanting tank sludge (right). In
the upper left is the ultrasonic probe that monitored liquid levels.
Decanting tank, clarified effluent, and sludge sampling
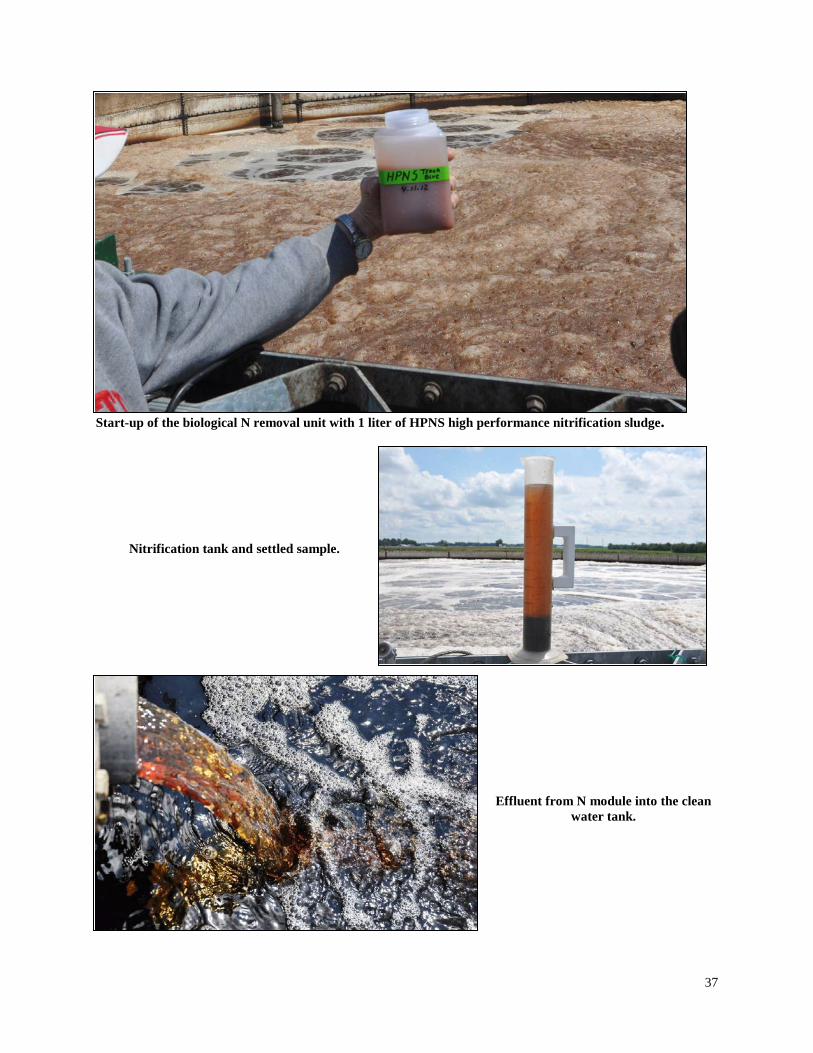
37
Start-up of the biological N removal unit with 1 liter of HPNS high performance nitrification sludge. Nitrification tank and settled sample.
Effluent from N module into the clean water tank.
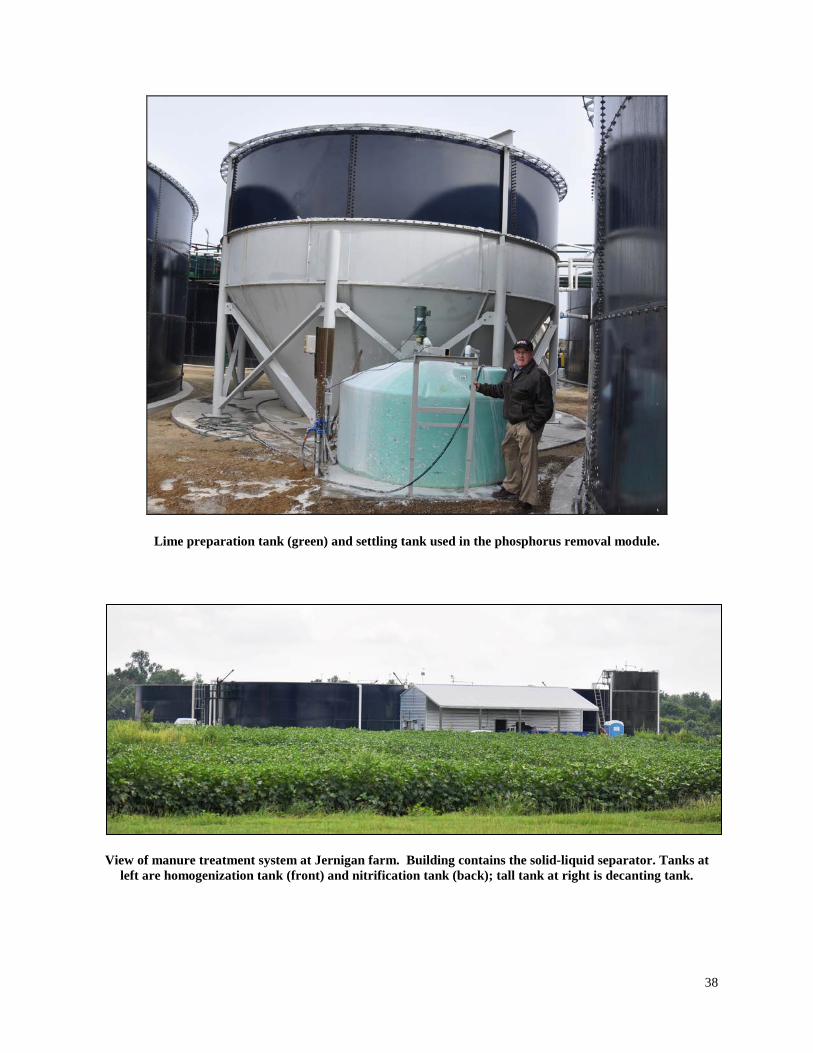
38
Lime preparation tank (green) and settling tank used in the phosphorus removal module.
View of manure treatment system at Jernigan farm. Building contains the solid-liquid separator. Tanks at
left are homogenization tank (front) and nitrification tank (back); tall tank at right is decanting tank.
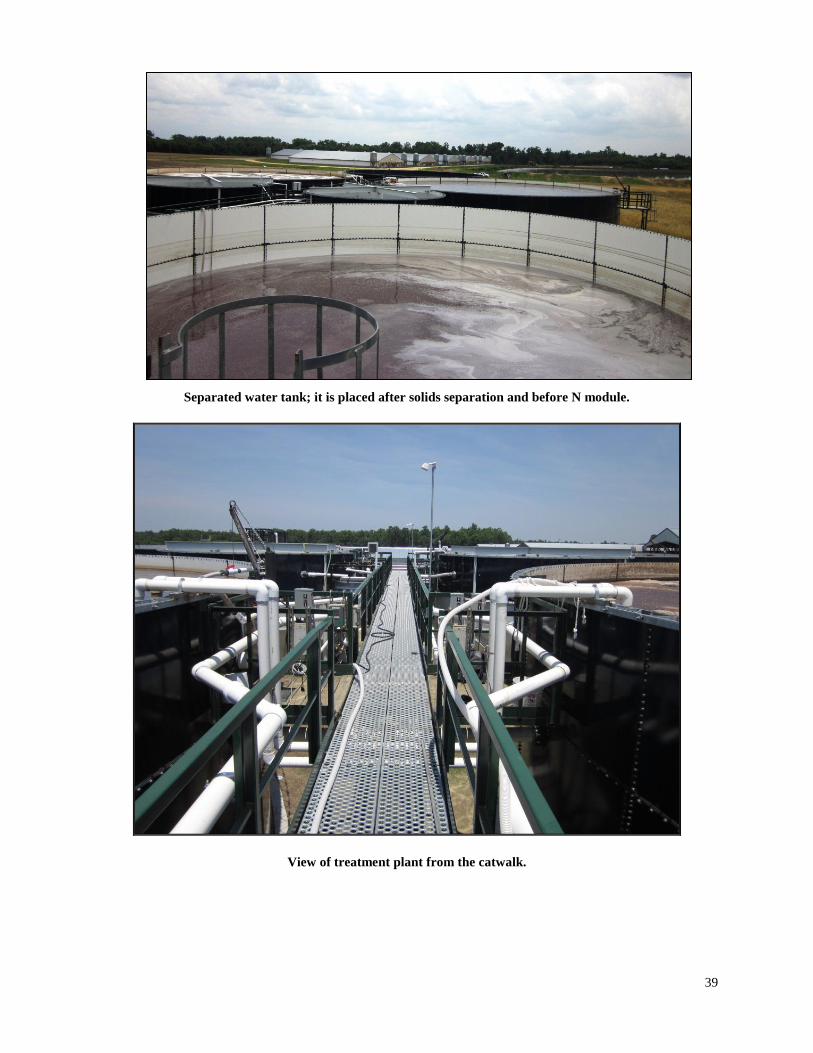
39
Separated water tank; it is placed after solids separation and before N module.
View of treatment plant from the catwalk.
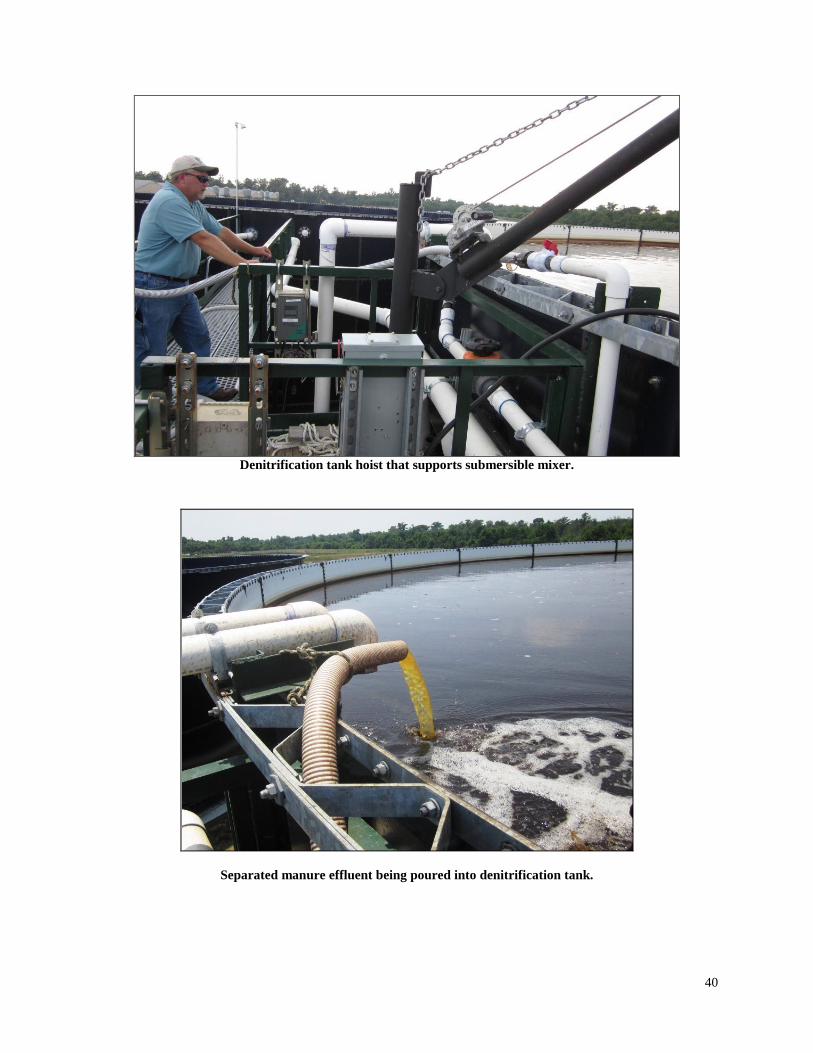
40
Denitrification tank hoist that supports submersible mixer.
Separated manure effluent being poured into denitrification tank.
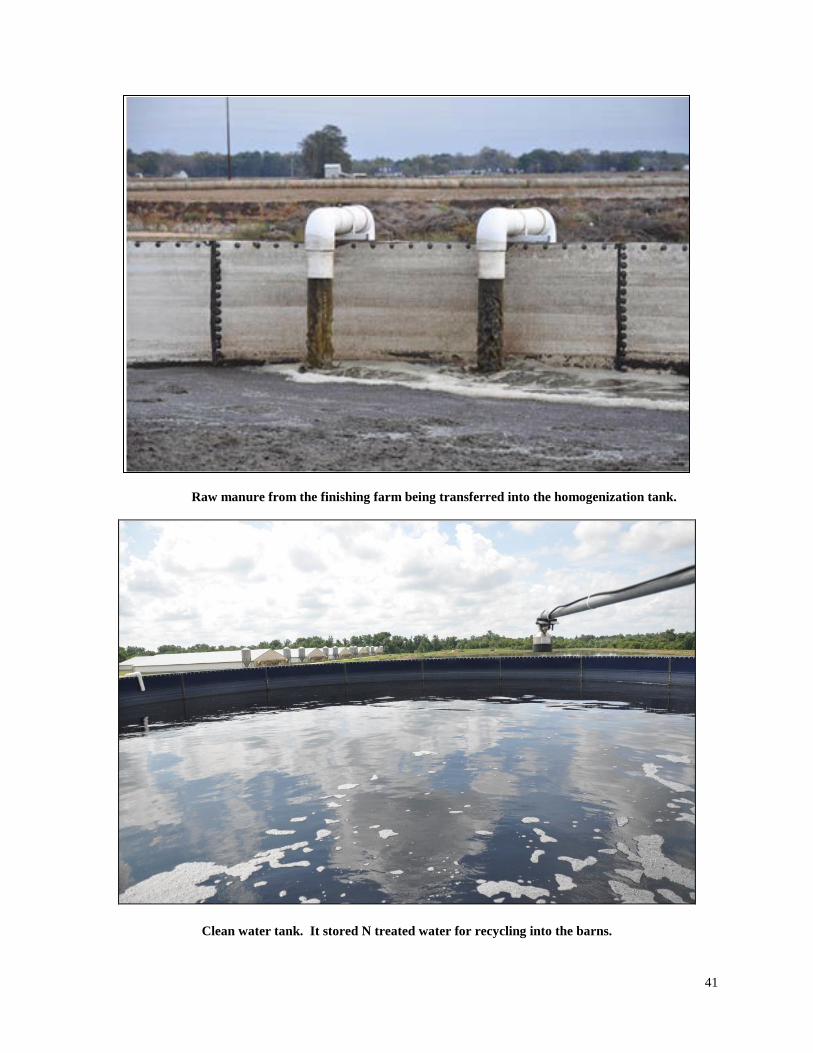
41
Raw manure from the finishing farm being transferred into the homogenization tank.
Clean water tank. It stored N treated water for recycling into the barns.
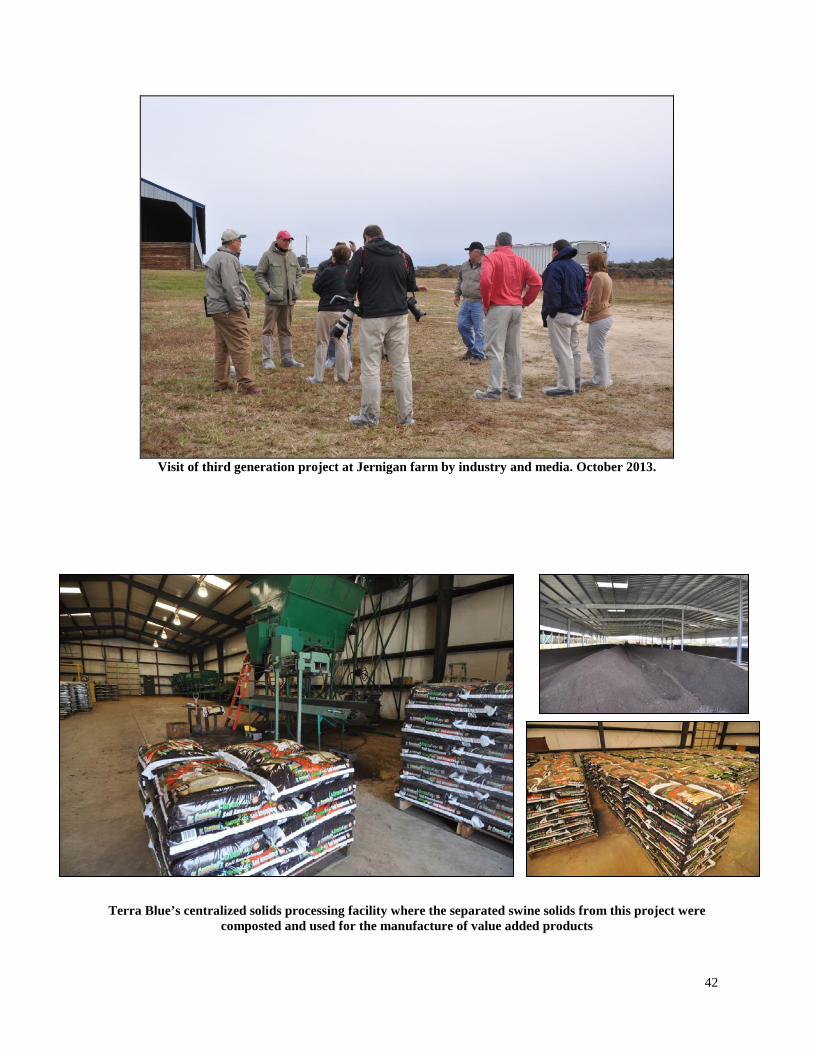
42
Visit of third generation project at Jernigan farm by industry and media. October 2013.
Terra Blue’s centralized solids processing facility where the separated swine solids from this project were composted and used for the manufacture of value added products
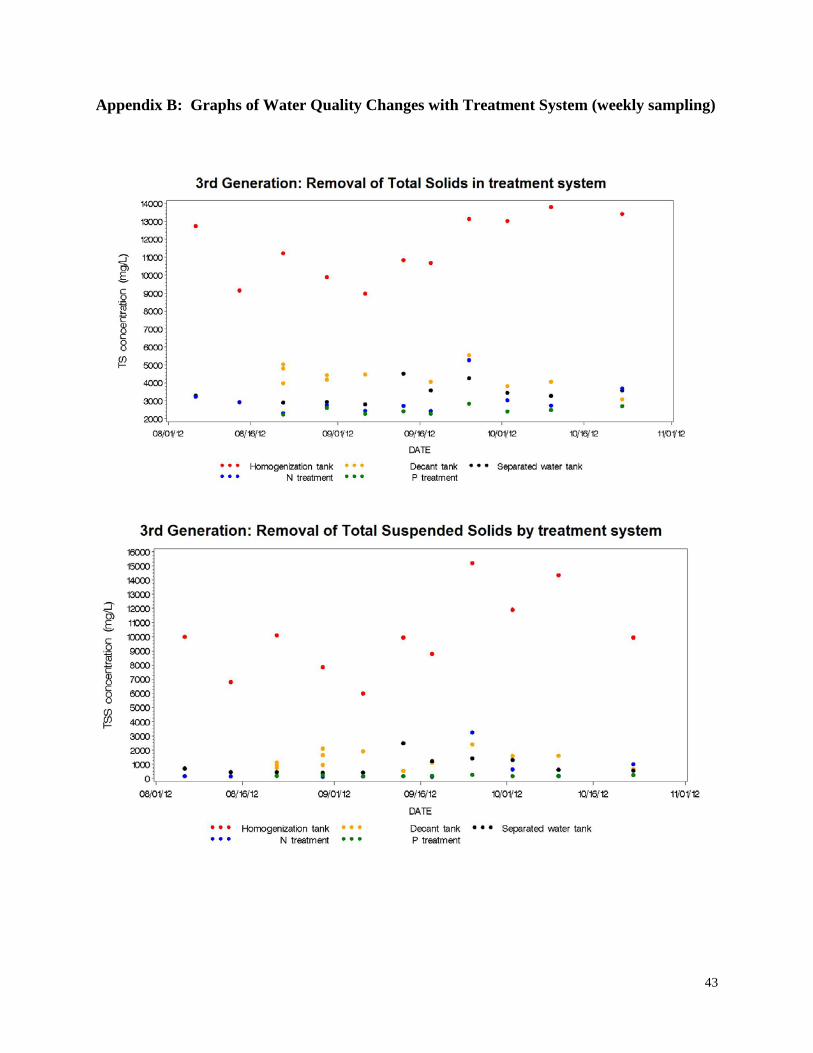
43
Appendix B: Graphs of Water Quality Changes with Treatment System (weekly sampling)
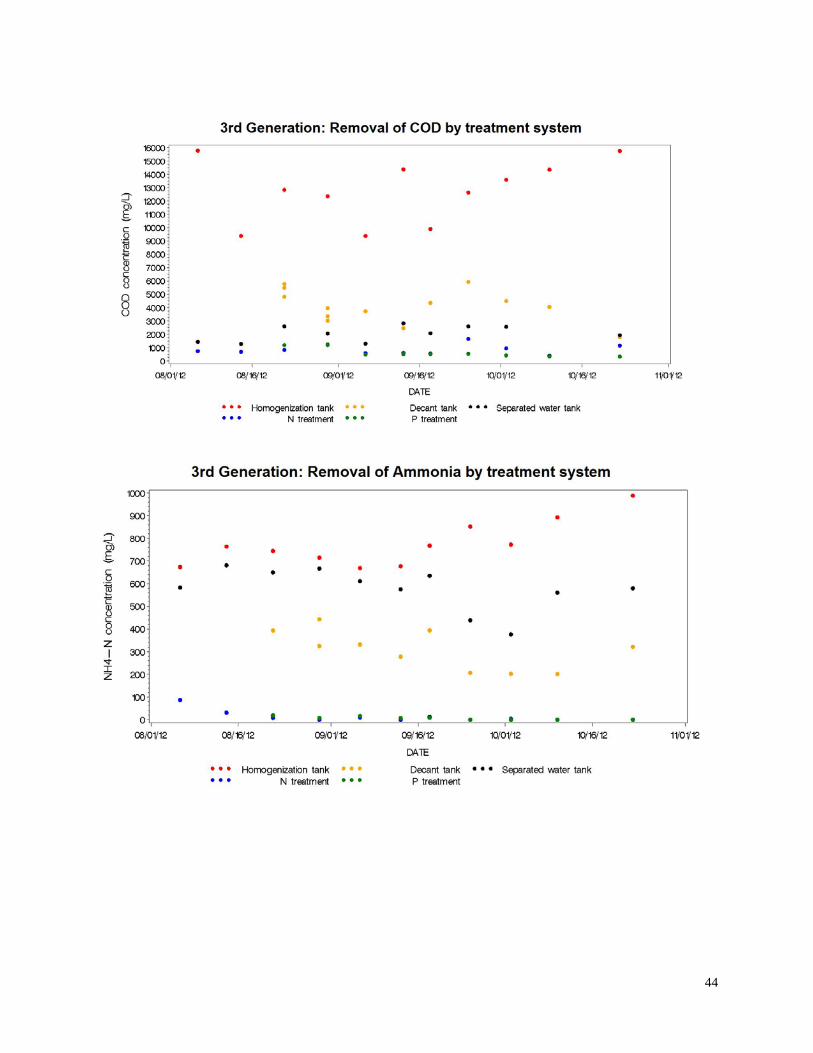
44
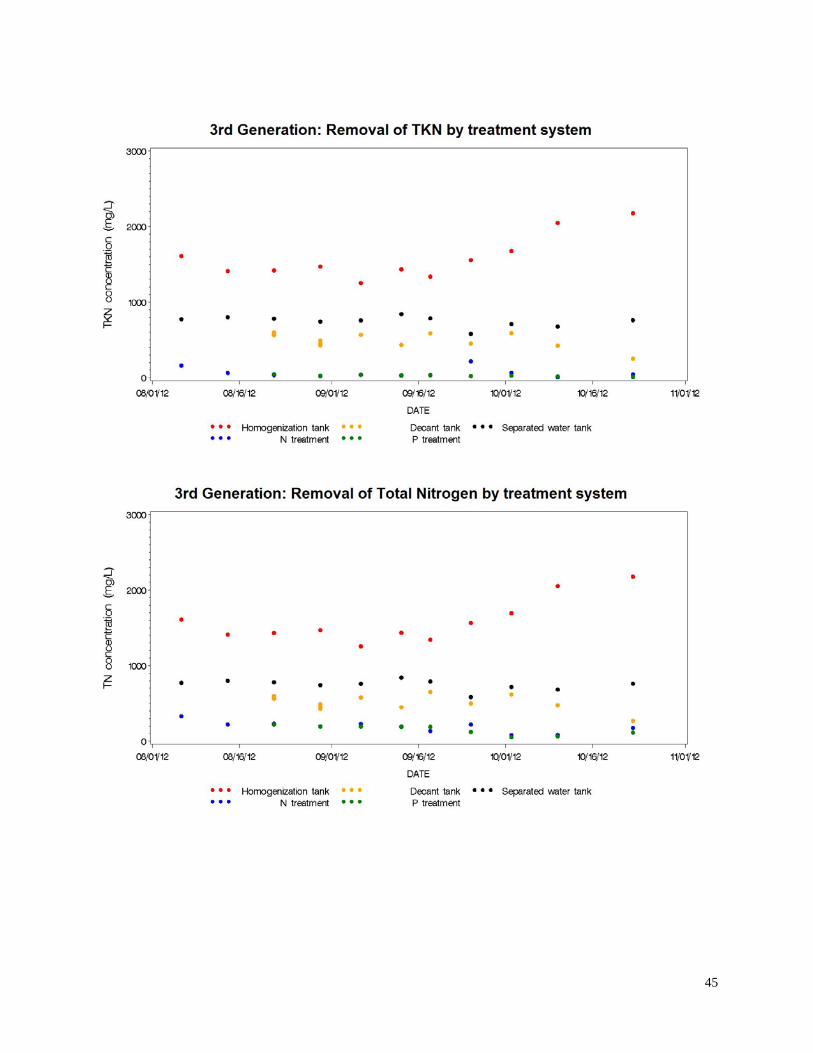
45
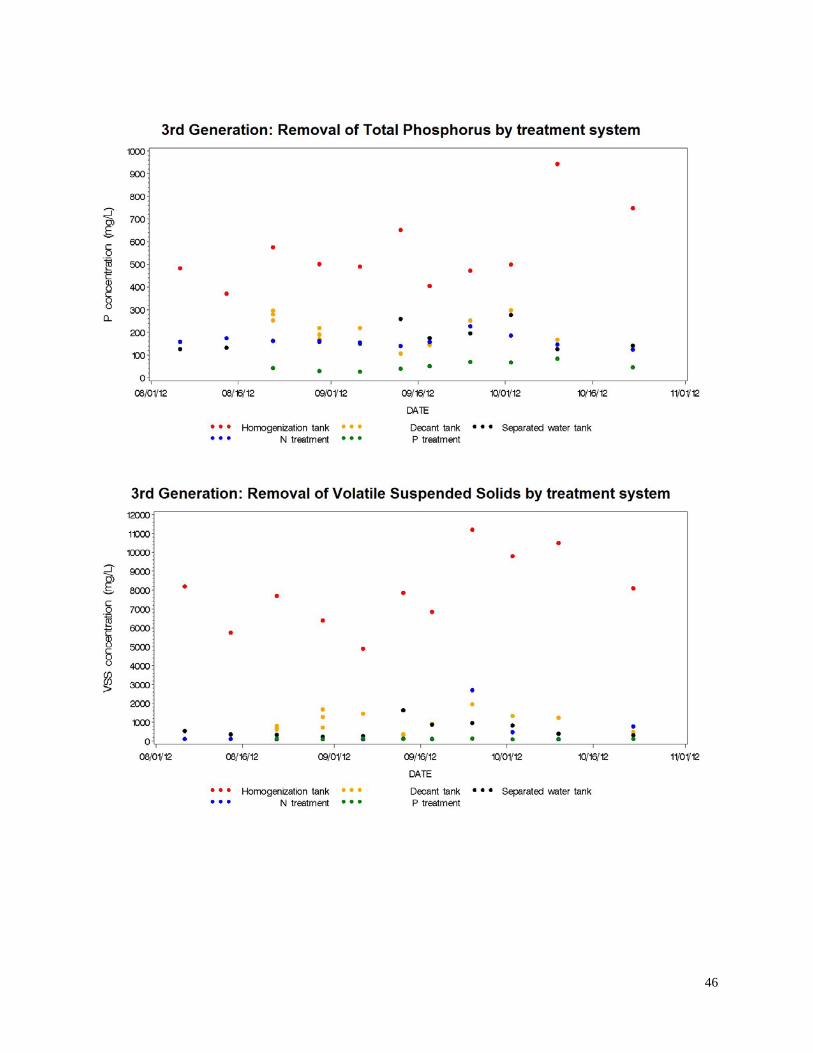
46
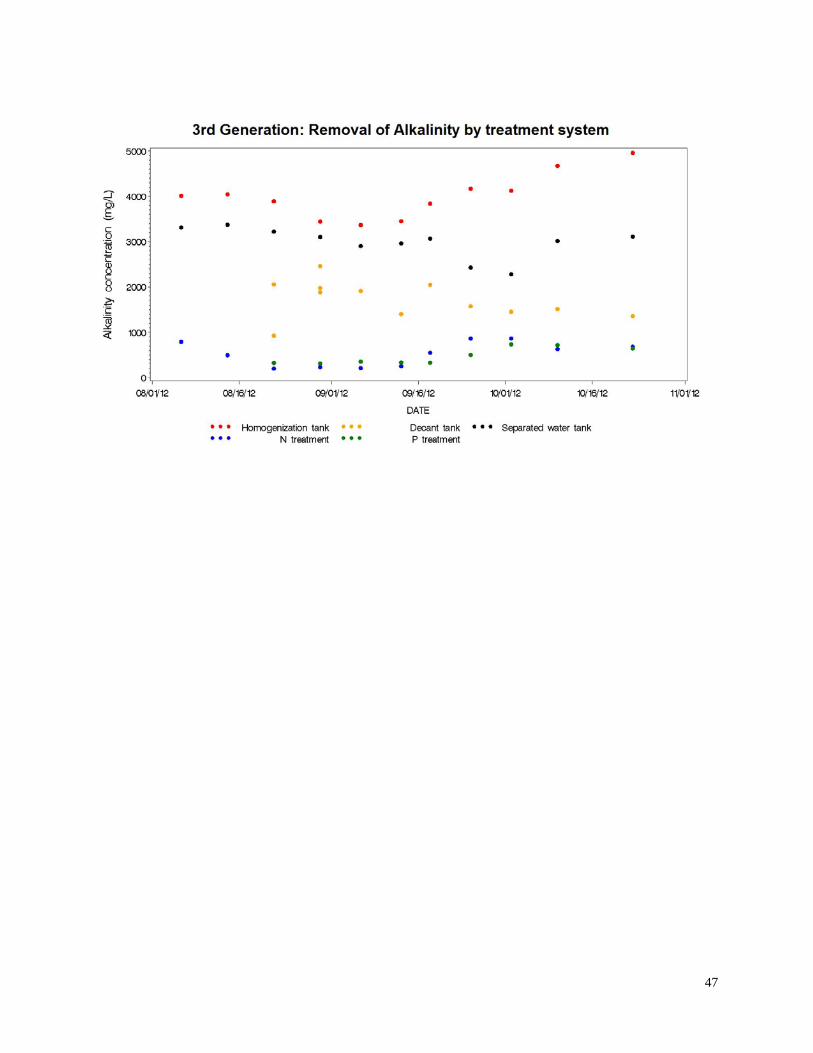
47
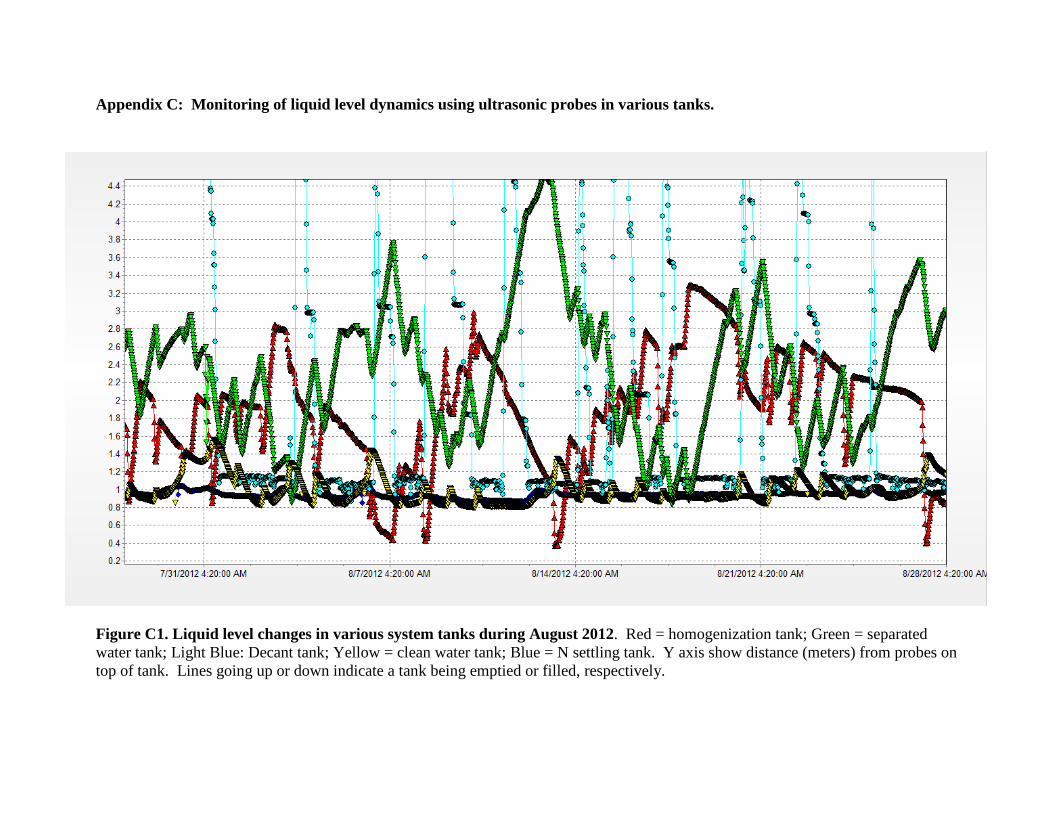
Appendix C: Monitoring of liquid level dynamics using ultrasonic probes in various tanks.
Figure C1. Liquid level changes in various system tanks during August 2012. Red = homogenization tank; Green = separated water tank; Light Blue: Decant tank; Yellow = clean water tank; Blue = N settling tank. Y axis show distance (meters) from probes on top of tank. Lines going up or down indicate a tank being emptied or filled, respectively.
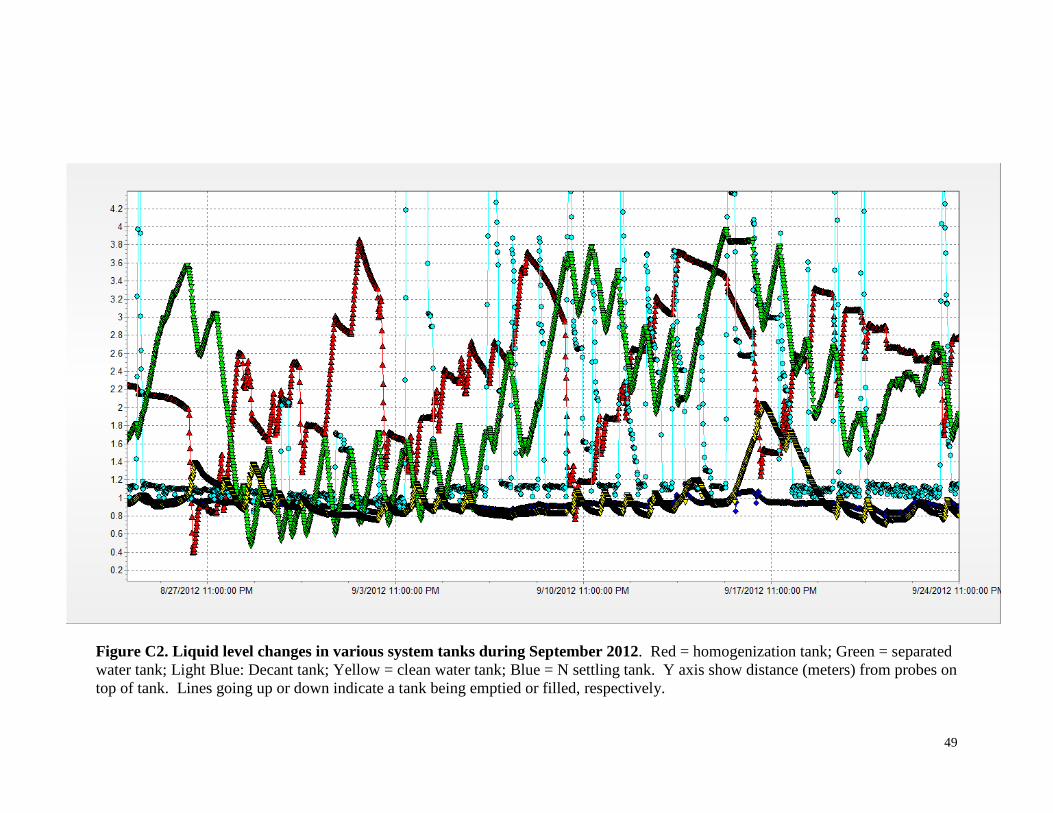
49
Figure C2. Liquid level changes in various system tanks during September 2012. Red = homogenization tank; Green = separated water tank; Light Blue: Decant tank; Yellow = clean water tank; Blue = N settling tank. Y axis show distance (meters) from probes on top of tank. Lines going up or down indicate a tank being emptied or filled, respectively.
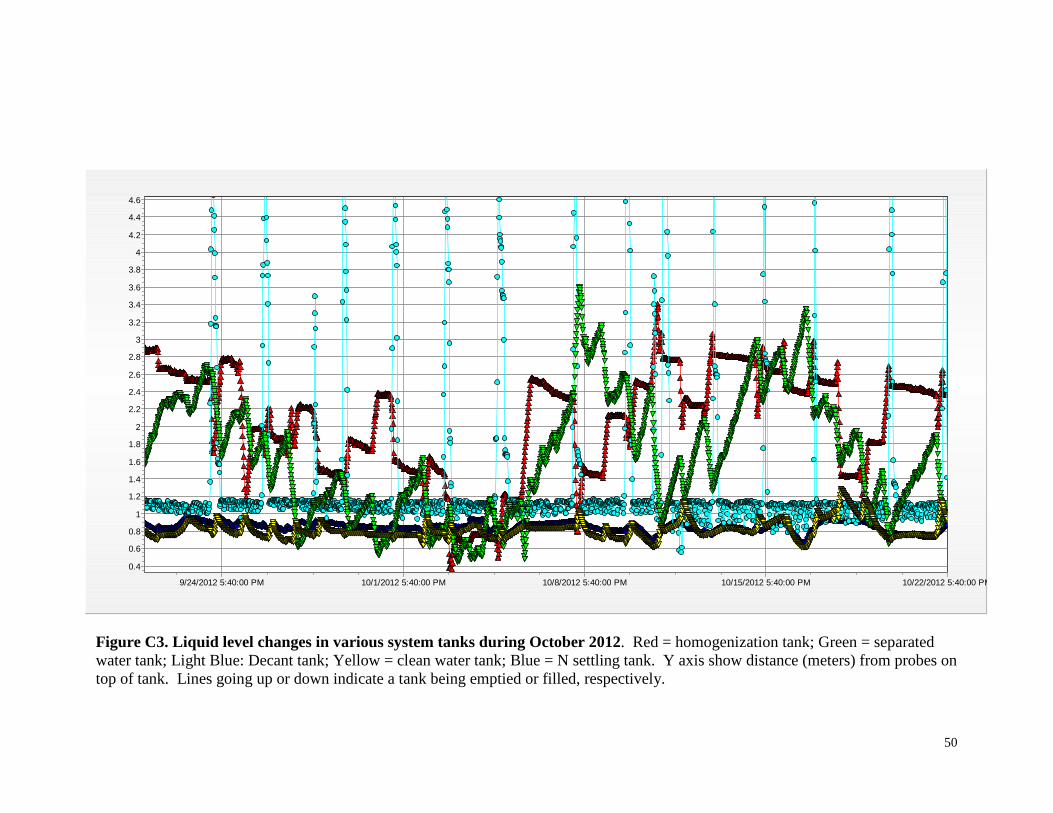
50
Figure C3. Liquid level changes in various system tanks during October 2012. Red = homogenization tank; Green = separated water tank; Light Blue: Decant tank; Yellow = clean water tank; Blue = N settling tank. Y axis show distance (meters) from probes on top of tank. Lines going up or down indicate a tank being emptied or filled, respectively.
10/22/2012 5:40:00 PM10/15/2012 5:40:00 PM10/8/2012 5:40:00 PM10/1/2012 5:40:00 PM9/24/2012 5:40:00 PM
4.6
4.4
4.2
4
3.8
3.6
3.4
3.2
3
2.8
2.6
2.4
2.2
2
1.8
1.6
1.4
1.2
1
0.8
0.6
0.4

Appendix B
July, 2013
Cost and Returns Analysis of the Terra Blue
Generation 3 Manure Management System Evaluated
at Jernigan Farms in North Carolina in 2012
Prepared for:
C. M. (Mike) Williams, Director
Animal and Poultry Waste Management Center
North Carolina State University
Campus Box 7609
Room 134 Scott Hall
2711 Founder’s Drive
Raleigh, NC 27695-7608
Prepared Under North Carolina’s Clean Water Management Trust Fund Project
2006A - 522
Prepared by:
Dr. Kelly Zering
Department of Agricultural
and Resource Economics
North Carolina State University
3301 Nelson Hall
Campus Box 8109
Raleigh, NC 27695-8109
Tel: 919-515-6089
Fax: 919-515-6268
Email: [email protected]

i
Acknowledgments
Analysis presented in this paper employs data and models as well as prior analysis by a
team that worked on Cost and Returns analysis under the agreements between the NC
Attorney General and Smithfield Foods and others. Adrian Atkinson, Jan Chvosta, and
Bailey Norwood are among those that contributed a great deal of effort and insight to
development of the models and data.
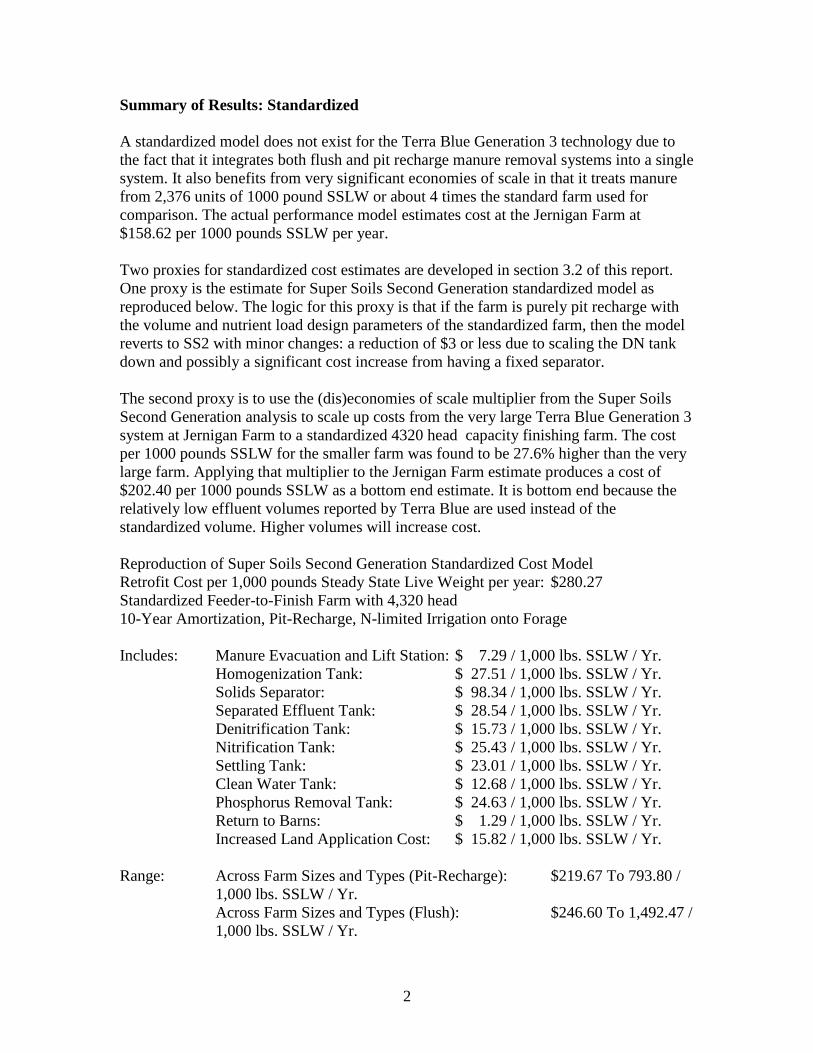
2
Summary of Results: Standardized
A standardized model does not exist for the Terra Blue Generation 3 technology due to
the fact that it integrates both flush and pit recharge manure removal systems into a single
system. It also benefits from very significant economies of scale in that it treats manure
from 2,376 units of 1000 pound SSLW or about 4 times the standard farm used for
comparison. The actual performance model estimates cost at the Jernigan Farm at
$158.62 per 1000 pounds SSLW per year.
Two proxies for standardized cost estimates are developed in section 3.2 of this report.
One proxy is the estimate for Super Soils Second Generation standardized model as
reproduced below. The logic for this proxy is that if the farm is purely pit recharge with
the volume and nutrient load design parameters of the standardized farm, then the model
reverts to SS2 with minor changes: a reduction of $3 or less due to scaling the DN tank
down and possibly a significant cost increase from having a fixed separator.
The second proxy is to use the (dis)economies of scale multiplier from the Super Soils
Second Generation analysis to scale up costs from the very large Terra Blue Generation 3
system at Jernigan Farm to a standardized 4320 head capacity finishing farm. The cost
per 1000 pounds SSLW for the smaller farm was found to be 27.6% higher than the very
large farm. Applying that multiplier to the Jernigan Farm estimate produces a cost of
$202.40 per 1000 pounds SSLW as a bottom end estimate. It is bottom end because the
relatively low effluent volumes reported by Terra Blue are used instead of the
standardized volume. Higher volumes will increase cost.
Reproduction of Super Soils Second Generation Standardized Cost Model
Retrofit Cost per 1,000 pounds Steady State Live Weight per year: $280.27
Standardized Feeder-to-Finish Farm with 4,320 head
10-Year Amortization, Pit-Recharge, N-limited Irrigation onto Forage
Includes: Manure Evacuation and Lift Station: $ 7.29 / 1,000 lbs. SSLW / Yr.
Homogenization Tank: $ 27.51 / 1,000 lbs. SSLW / Yr.
Solids Separator: $ 98.34 / 1,000 lbs. SSLW / Yr.
Separated Effluent Tank: $ 28.54 / 1,000 lbs. SSLW / Yr.
Denitrification Tank: $ 15.73 / 1,000 lbs. SSLW / Yr.
Nitrification Tank: $ 25.43 / 1,000 lbs. SSLW / Yr.
Settling Tank: $ 23.01 / 1,000 lbs. SSLW / Yr.
Clean Water Tank: $ 12.68 / 1,000 lbs. SSLW / Yr.
Phosphorus Removal Tank: $ 24.63 / 1,000 lbs. SSLW / Yr.
Return to Barns: $ 1.29 / 1,000 lbs. SSLW / Yr.
Increased Land Application Cost: $ 15.82 / 1,000 lbs. SSLW / Yr.
Range: Across Farm Sizes and Types (Pit-Recharge): $219.67 To 793.80 /
1,000 lbs. SSLW / Yr.
Across Farm Sizes and Types (Flush): $246.60 To 1,492.47 /
1,000 lbs. SSLW / Yr.
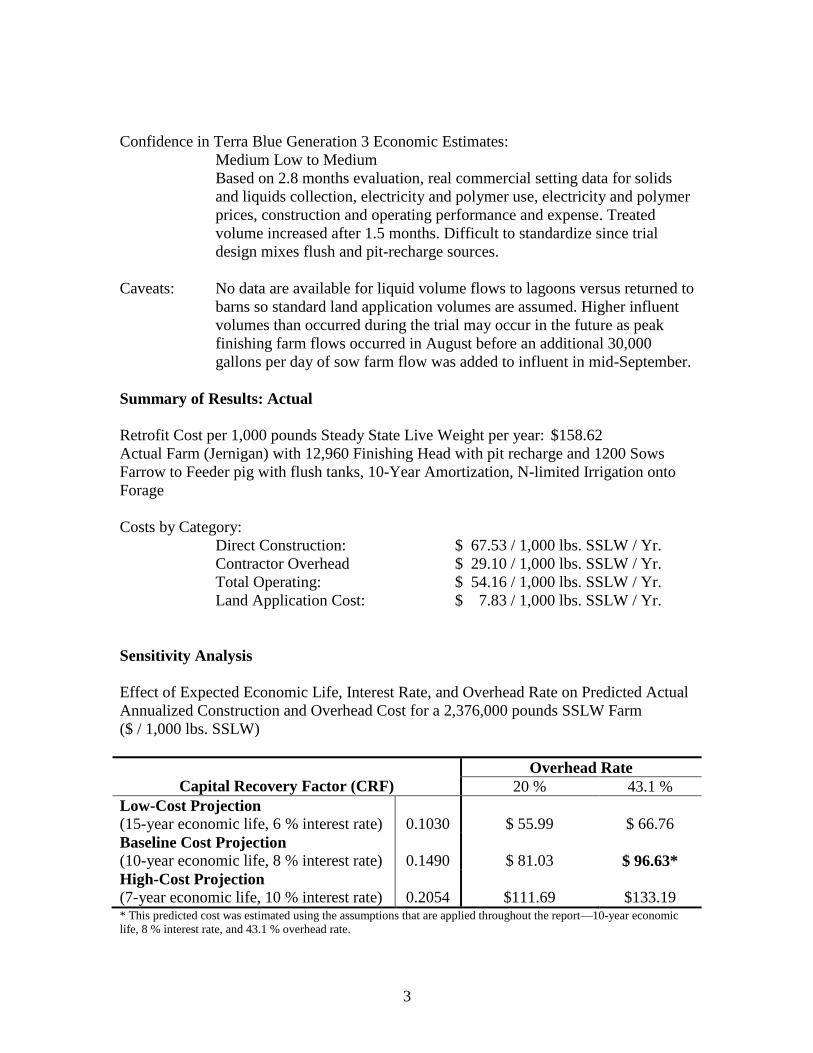
3
Confidence in Terra Blue Generation 3 Economic Estimates:
Medium Low to Medium
Based on 2.8 months evaluation, real commercial setting data for solids
and liquids collection, electricity and polymer use, electricity and polymer
prices, construction and operating performance and expense. Treated
volume increased after 1.5 months. Difficult to standardize since trial
design mixes flush and pit-recharge sources.
Caveats: No data are available for liquid volume flows to lagoons versus returned to
barns so standard land application volumes are assumed. Higher influent
volumes than occurred during the trial may occur in the future as peak
finishing farm flows occurred in August before an additional 30,000
gallons per day of sow farm flow was added to influent in mid-September.
Summary of Results: Actual
Retrofit Cost per 1,000 pounds Steady State Live Weight per year: $158.62
Actual Farm (Jernigan) with 12,960 Finishing Head with pit recharge and 1200 Sows
Farrow to Feeder pig with flush tanks, 10-Year Amortization, N-limited Irrigation onto
Forage
Costs by Category:
Direct Construction: $ 67.53 / 1,000 lbs. SSLW / Yr.
Contractor Overhead $ 29.10 / 1,000 lbs. SSLW / Yr.
Total Operating: $ 54.16 / 1,000 lbs. SSLW / Yr.
Land Application Cost: $ 7.83 / 1,000 lbs. SSLW / Yr.
Sensitivity Analysis
Effect of Expected Economic Life, Interest Rate, and Overhead Rate on Predicted Actual
Annualized Construction and Overhead Cost for a 2,376,000 pounds SSLW Farm
($ / 1,000 lbs. SSLW)
Capital Recovery Factor (CRF)
Overhead Rate
20 % 43.1 %
Low-Cost Projection
(15-year economic life, 6 % interest rate)
0.1030
$ 55.99
$ 66.76
Baseline Cost Projection
(10-year economic life, 8 % interest rate)
0.1490
$ 81.03
$ 96.63*
High-Cost Projection
(7-year economic life, 10 % interest rate)
0.2054
$111.69
$133.19 * This predicted cost was estimated using the assumptions that are applied throughout the report—10-year economic
life, 8 % interest rate, and 43.1 % overhead rate.
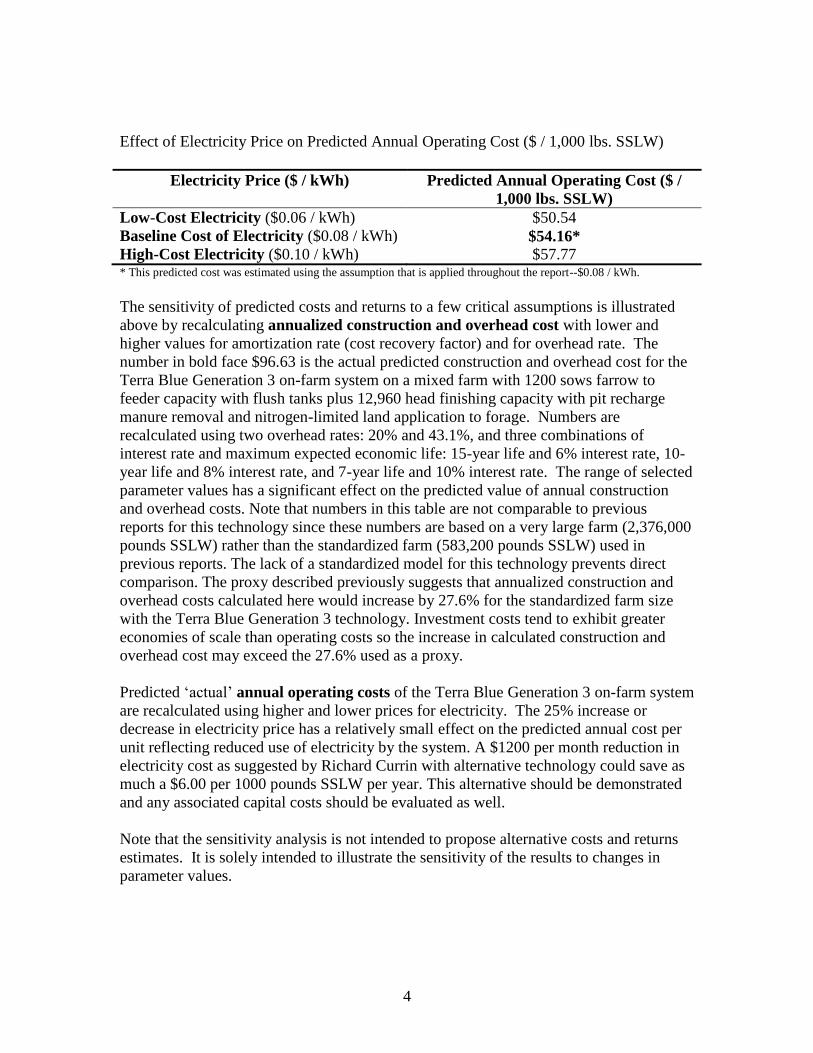
4
Effect of Electricity Price on Predicted Annual Operating Cost ($ / 1,000 lbs. SSLW)
Electricity Price ($ / kWh) Predicted Annual Operating Cost ($ /
1,000 lbs. SSLW)
Low-Cost Electricity ($0.06 / kWh) $50.54
Baseline Cost of Electricity ($0.08 / kWh) $54.16*
High-Cost Electricity ($0.10 / kWh) $57.77 * This predicted cost was estimated using the assumption that is applied throughout the report--$0.08 / kWh.
The sensitivity of predicted costs and returns to a few critical assumptions is illustrated
above by recalculating annualized construction and overhead cost with lower and
higher values for amortization rate (cost recovery factor) and for overhead rate. The
number in bold face $96.63 is the actual predicted construction and overhead cost for the
Terra Blue Generation 3 on-farm system on a mixed farm with 1200 sows farrow to
feeder capacity with flush tanks plus 12,960 head finishing capacity with pit recharge
manure removal and nitrogen-limited land application to forage. Numbers are
recalculated using two overhead rates: 20% and 43.1%, and three combinations of
interest rate and maximum expected economic life: 15-year life and 6% interest rate, 10-
year life and 8% interest rate, and 7-year life and 10% interest rate. The range of selected
parameter values has a significant effect on the predicted value of annual construction
and overhead costs. Note that numbers in this table are not comparable to previous
reports for this technology since these numbers are based on a very large farm (2,376,000
pounds SSLW) rather than the standardized farm (583,200 pounds SSLW) used in
previous reports. The lack of a standardized model for this technology prevents direct
comparison. The proxy described previously suggests that annualized construction and
overhead costs calculated here would increase by 27.6% for the standardized farm size
with the Terra Blue Generation 3 technology. Investment costs tend to exhibit greater
economies of scale than operating costs so the increase in calculated construction and
overhead cost may exceed the 27.6% used as a proxy.
Predicted ‘actual’ annual operating costs of the Terra Blue Generation 3 on-farm system
are recalculated using higher and lower prices for electricity. The 25% increase or
decrease in electricity price has a relatively small effect on the predicted annual cost per
unit reflecting reduced use of electricity by the system. A $1200 per month reduction in
electricity cost as suggested by Richard Currin with alternative technology could save as
much a $6.00 per 1000 pounds SSLW per year. This alternative should be demonstrated
and any associated capital costs should be evaluated as well.
Note that the sensitivity analysis is not intended to propose alternative costs and returns
estimates. It is solely intended to illustrate the sensitivity of the results to changes in
parameter values.
5
1. Overview of the Terra Blue Generation 3 Technology
1.1. Evaluation Site Overview
This technology, constructed and operated by Terra Blue, Inc. of Clinton, North Carolina,
is an on-farm system. In this demonstration, separated solids were removed from the farm
by Terra Blue, Inc. The full-scale facility for on-farm treatment of swine manure is
located on Jernigan Farms near Mount Olive in Wayne County, NC.
The portion of Jernigan Farms included in this demonstration consists of eight swine
buildings: four full size and one half size ‘quad’ finishing buildings with combined
inventory capacity for 12,960 feeder to finish pigs and three buildings that make up a
1200 sow farrow to feeder pig farm. The sow farm buildings include a breeding barn,
gestation barn, and a farrowing and nursery barn. A second farrow to feeder operation
with 1085 sows capacity at Jernigan Farms was included in the design of the system but
was not included in this demonstration (Vanotti et al. 2013). Two anaerobic lagoons
provided manure management for the finishing operation and the 1200 sow farrow to
feeder operation prior to this demonstration. The three barns in the sow operation
employ flush tank manure removal technology with flush tank capacity of 1500 gallons
(breeding), 1500 gallons (gestation), and 5 tanks with 1000 gallons capacity each
(farrowing and nursery) (Vanotti et al., 2013). The finishing buildings employ the pit-
recharge system for manure removal. In total, the Terra Blue Generation 3 technology is
treating manure from barns with capacity for 12,960 feeder-to-finisher pigs or 1,749,600
lbs. of SSLW (@135 lbs SSLW per finishing pig inventory capacity) plus 1200 sows
farrow to feeder or 626,400 pounds SSLW (@ 522 pounds SSLW per sow farrow to
wean capacity) for a total of 2,376,000 pounds.
Closeout sheets for finishing farm placements between January 9 and October 8, 2012
were provided and they covered sales between May 30, 2012 and February 20, 2013.
These records indicate routine placements and marketings. Averages across 33 groups
marketed over the 9 month period include 737.8 feeder pigs placed at an average weight
of 47.8 pounds per pig and 677.4 hogs marketed at an average weight of 258.4. Average
inventory per building can be roughly estimated as less than the average of number of
placements and number of head marketed multiplied by the percentage of time buildings
were occupied. The average number of animals per occupied building is 707.6. The
percentage of time that buildings were occupied is estimated at less than 91.7%
calculated as 132.87 days from last placed to last marketed dates divided by 144.93 days
from last marketed previous group to last marketed current group. These average lengths
of periods were calculated from the fourteen 720 head ‘buildings’ that were filled and
emptied twice during the period covered by the close-out sheets. The estimated average
inventory per building per day is less than 648.7 (707.6 x 91.7%). The estimate is
approximate because it implies that no pigs were placed prior to the date of final date
placed when in fact some pigs were placed a week earlier and because it implies that all
hogs were marketed on the last day marketed when in fact cull pigs may have been
marketed several weeks earlier and many of the hogs may have been marketed one to
three weeks earlier. The estimated average inventory of 648.7 is well below the 720 head
6
per building capacity used to calculate SSLW. Therefore, it is assumed for this report that
the finishing farm was operating near normal capacity during the trial so permitted SSLW
is used as the denominator in analysis of the actual costs. Exact inventory of the 1200
sow farrow to feeder farm was not provided but all parties stated that it was operating at
capacity during the trial.
This report addresses the on-farm component. During the demonstration, Terra Blue, Inc.
removed separated solids. The standardized analysis conducted for candidate EST
technologies assumes that all separated solids and liquids produced by the technology are
land applied. This assumption is based on the absence of a functioning market for
separated swine manure solids in North Carolina and previous analysis that concluded
that land application was the lowest-cost option for handling the solids. Composting as
an alternative to land application was analyzed in a separate report released in November
2005 (Zering et al., 2005).
1.2. Technology Overview and Performance Data
The Terra Blue Generation III technology uses a decanting tank for fast gravity
separation of solids from flushed swine manure, polymer-enhanced liquid-solid
separation employing a rotary press separator, nitrification/denitrification, and
phosphorus removal modules to treat swine manure.
Intensive monitoring of the system for this study was conducted from August 1, 2012
through October 23. 2012. Two stages of operation are included in this 84 day period.
From August 1 through September 15, the system treated all the effluent from the
finishing buildings plus the effluent from the sow farm breeding barn and the gestation
building. The effluent from the farrowing and nursery building was added to the system
on September 15 and included through the October 23 end of the monitoring period.
Total volume of effluent from the sow farm was 2,279,745 gallons for an average of
27,140 gallons per day over the 84 day reporting period. Volume of effluent from the sow
farm tripled from 14,980 gallons per day in August to 45,535 gallons per day in October
after the farrowing and nursery building effluent was added. Vanotti et al. (p.18, 2013)
reported spot estimates of flush tank fill liquid volumes of 6,350 gallons for the breeding
barn, 6,540 for the gestation barn, and 26,320 gallons for the 5 tanks in the farrowing and
nursery barn. It appears that normal operation of the sow farm will generate about 45,000
gallons per day of flushed effluent so the long term average flow to Terra Blue 3 will rise
by 17,860 gallons per day over the trial period average of 27,140.
During the reporting period, the pits in finishing barns were scheduled to be emptied and
recharged once per week on a Monday through Friday schedule (Vanotti et al., 2013).
Effluent volume from the finishing buildings totaled 4,064,597 gallons over the 84 day
evaluation period for an average of 48,388 gallons per day. Vanotti et al. note that
finishing buildings effluent flow was 2.5 times as large in August (70,878 gpd) versus
October (27,814 gpd). Extra volume in August is attributed to water used for cooling the
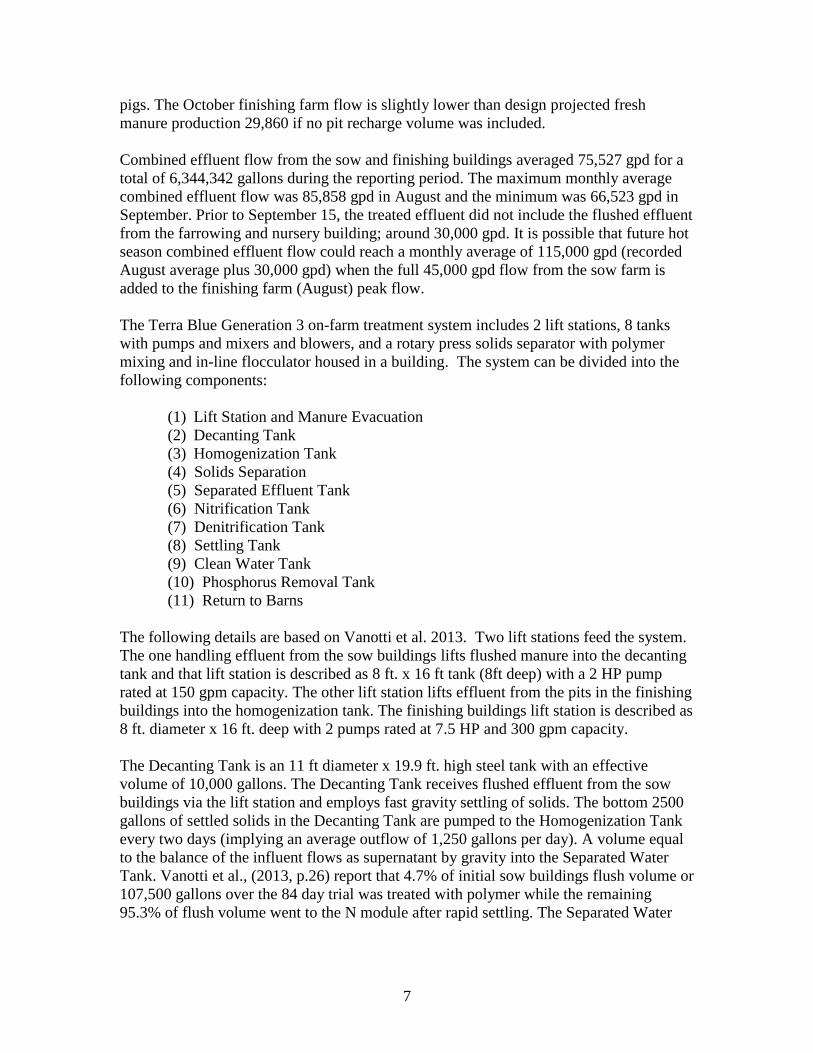
7
pigs. The October finishing farm flow is slightly lower than design projected fresh
manure production 29,860 if no pit recharge volume was included.
Combined effluent flow from the sow and finishing buildings averaged 75,527 gpd for a
total of 6,344,342 gallons during the reporting period. The maximum monthly average
combined effluent flow was 85,858 gpd in August and the minimum was 66,523 gpd in
September. Prior to September 15, the treated effluent did not include the flushed effluent
from the farrowing and nursery building; around 30,000 gpd. It is possible that future hot
season combined effluent flow could reach a monthly average of 115,000 gpd (recorded
August average plus 30,000 gpd) when the full 45,000 gpd flow from the sow farm is
added to the finishing farm (August) peak flow.
The Terra Blue Generation 3 on-farm treatment system includes 2 lift stations, 8 tanks
with pumps and mixers and blowers, and a rotary press solids separator with polymer
mixing and in-line flocculator housed in a building. The system can be divided into the
following components:
(1) Lift Station and Manure Evacuation
(2) Decanting Tank
(3) Homogenization Tank
(4) Solids Separation
(5) Separated Effluent Tank
(6) Nitrification Tank
(7) Denitrification Tank
(8) Settling Tank
(9) Clean Water Tank
(10) Phosphorus Removal Tank
(11) Return to Barns
The following details are based on Vanotti et al. 2013. Two lift stations feed the system.
The one handling effluent from the sow buildings lifts flushed manure into the decanting
tank and that lift station is described as 8 ft. x 16 ft tank (8ft deep) with a 2 HP pump
rated at 150 gpm capacity. The other lift station lifts effluent from the pits in the finishing
buildings into the homogenization tank. The finishing buildings lift station is described as
8 ft. diameter x 16 ft. deep with 2 pumps rated at 7.5 HP and 300 gpm capacity.
The Decanting Tank is an 11 ft diameter x 19.9 ft. high steel tank with an effective
volume of 10,000 gallons. The Decanting Tank receives flushed effluent from the sow
buildings via the lift station and employs fast gravity settling of solids. The bottom 2500
gallons of settled solids in the Decanting Tank are pumped to the Homogenization Tank
every two days (implying an average outflow of 1,250 gallons per day). A volume equal
to the balance of the influent flows as supernatant by gravity into the Separated Water
Tank. Vanotti et al., (2013, p.26) report that 4.7% of initial sow buildings flush volume or
107,500 gallons over the 84 day trial was treated with polymer while the remaining
95.3% of flush volume went to the N module after rapid settling. The Separated Water
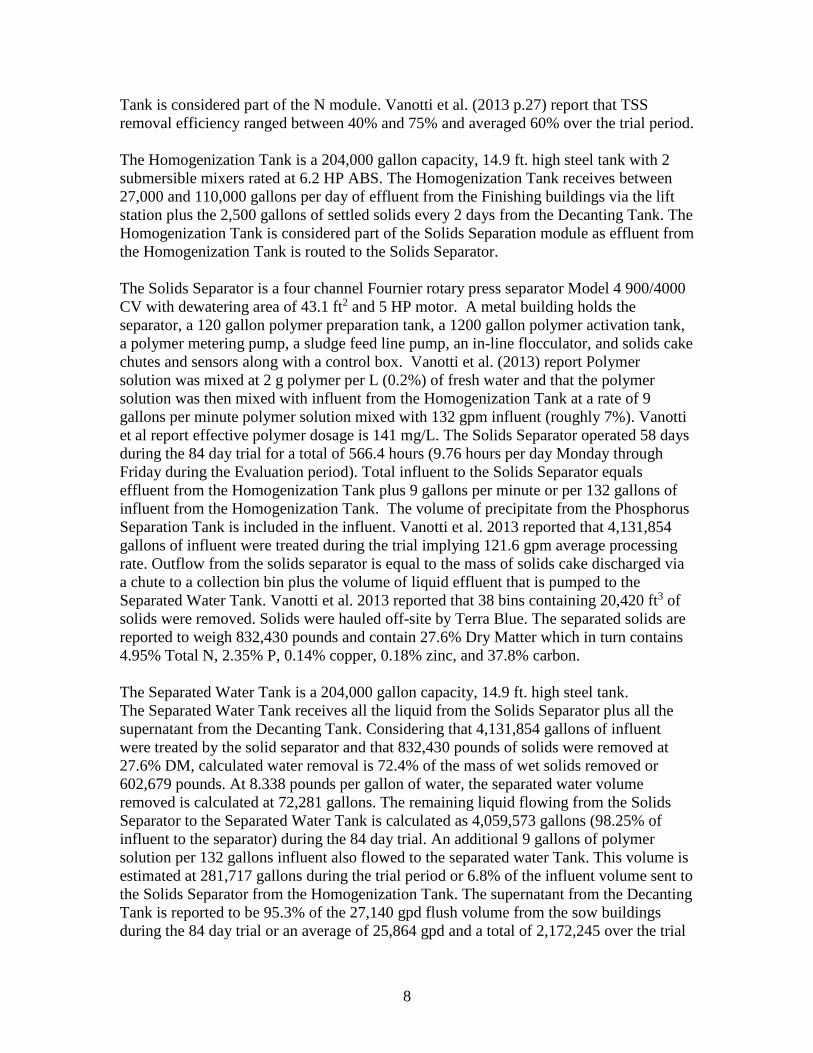
8
Tank is considered part of the N module. Vanotti et al. (2013 p.27) report that TSS
removal efficiency ranged between 40% and 75% and averaged 60% over the trial period.
The Homogenization Tank is a 204,000 gallon capacity, 14.9 ft. high steel tank with 2
submersible mixers rated at 6.2 HP ABS. The Homogenization Tank receives between
27,000 and 110,000 gallons per day of effluent from the Finishing buildings via the lift
station plus the 2,500 gallons of settled solids every 2 days from the Decanting Tank. The
Homogenization Tank is considered part of the Solids Separation module as effluent from
the Homogenization Tank is routed to the Solids Separator.
The Solids Separator is a four channel Fournier rotary press separator Model 4 900/4000
CV with dewatering area of 43.1 ft2 and 5 HP motor. A metal building holds the
separator, a 120 gallon polymer preparation tank, a 1200 gallon polymer activation tank,
a polymer metering pump, a sludge feed line pump, an in-line flocculator, and solids cake
chutes and sensors along with a control box. Vanotti et al. (2013) report Polymer
solution was mixed at 2 g polymer per L (0.2%) of fresh water and that the polymer
solution was then mixed with influent from the Homogenization Tank at a rate of 9
gallons per minute polymer solution mixed with 132 gpm influent (roughly 7%). Vanotti
et al report effective polymer dosage is 141 mg/L. The Solids Separator operated 58 days
during the 84 day trial for a total of 566.4 hours (9.76 hours per day Monday through
Friday during the Evaluation period). Total influent to the Solids Separator equals
effluent from the Homogenization Tank plus 9 gallons per minute or per 132 gallons of
influent from the Homogenization Tank. The volume of precipitate from the Phosphorus
Separation Tank is included in the influent. Vanotti et al. 2013 reported that 4,131,854
gallons of influent were treated during the trial implying 121.6 gpm average processing
rate. Outflow from the solids separator is equal to the mass of solids cake discharged via
a chute to a collection bin plus the volume of liquid effluent that is pumped to the
Separated Water Tank. Vanotti et al. 2013 reported that 38 bins containing 20,420 ft3 of
solids were removed. Solids were hauled off-site by Terra Blue. The separated solids are
reported to weigh 832,430 pounds and contain 27.6% Dry Matter which in turn contains
4.95% Total N, 2.35% P, 0.14% copper, 0.18% zinc, and 37.8% carbon.
The Separated Water Tank is a 204,000 gallon capacity, 14.9 ft. high steel tank.
The Separated Water Tank receives all the liquid from the Solids Separator plus all the
supernatant from the Decanting Tank. Considering that 4,131,854 gallons of influent
were treated by the solid separator and that 832,430 pounds of solids were removed at
27.6% DM, calculated water removal is 72.4% of the mass of wet solids removed or
602,679 pounds. At 8.338 pounds per gallon of water, the separated water volume
removed is calculated at 72,281 gallons. The remaining liquid flowing from the Solids
Separator to the Separated Water Tank is calculated as 4,059,573 gallons (98.25% of
influent to the separator) during the 84 day trial. An additional 9 gallons of polymer
solution per 132 gallons influent also flowed to the separated water Tank. This volume is
estimated at 281,717 gallons during the trial period or 6.8% of the influent volume sent to
the Solids Separator from the Homogenization Tank. The supernatant from the Decanting
Tank is reported to be 95.3% of the 27,140 gpd flush volume from the sow buildings
during the 84 day trial or an average of 25,864 gpd and a total of 2,172,245 over the trial
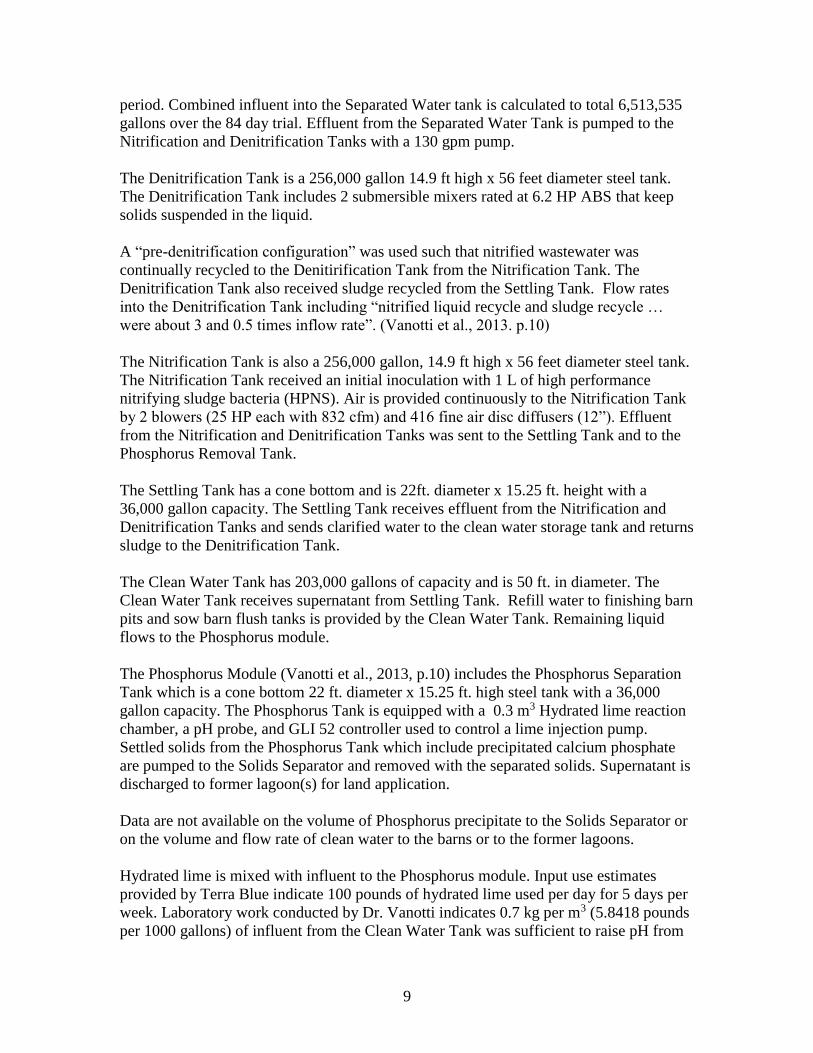
9
period. Combined influent into the Separated Water tank is calculated to total 6,513,535
gallons over the 84 day trial. Effluent from the Separated Water Tank is pumped to the
Nitrification and Denitrification Tanks with a 130 gpm pump.
The Denitrification Tank is a 256,000 gallon 14.9 ft high x 56 feet diameter steel tank.
The Denitrification Tank includes 2 submersible mixers rated at 6.2 HP ABS that keep
solids suspended in the liquid.
A “pre-denitrification configuration” was used such that nitrified wastewater was
continually recycled to the Denitirification Tank from the Nitrification Tank. The
Denitrification Tank also received sludge recycled from the Settling Tank. Flow rates
into the Denitrification Tank including “nitrified liquid recycle and sludge recycle …
were about 3 and 0.5 times inflow rate”. (Vanotti et al., 2013. p.10)
The Nitrification Tank is also a 256,000 gallon, 14.9 ft high x 56 feet diameter steel tank.
The Nitrification Tank received an initial inoculation with 1 L of high performance
nitrifying sludge bacteria (HPNS). Air is provided continuously to the Nitrification Tank
by 2 blowers (25 HP each with 832 cfm) and 416 fine air disc diffusers (12”). Effluent
from the Nitrification and Denitrification Tanks was sent to the Settling Tank and to the
Phosphorus Removal Tank.
The Settling Tank has a cone bottom and is 22ft. diameter x 15.25 ft. height with a
36,000 gallon capacity. The Settling Tank receives effluent from the Nitrification and
Denitrification Tanks and sends clarified water to the clean water storage tank and returns
sludge to the Denitrification Tank.
The Clean Water Tank has 203,000 gallons of capacity and is 50 ft. in diameter. The
Clean Water Tank receives supernatant from Settling Tank. Refill water to finishing barn
pits and sow barn flush tanks is provided by the Clean Water Tank. Remaining liquid
flows to the Phosphorus module.
The Phosphorus Module (Vanotti et al., 2013, p.10) includes the Phosphorus Separation
Tank which is a cone bottom 22 ft. diameter x 15.25 ft. high steel tank with a 36,000
gallon capacity. The Phosphorus Tank is equipped with a 0.3 m3 Hydrated lime reaction
chamber, a pH probe, and GLI 52 controller used to control a lime injection pump.
Settled solids from the Phosphorus Tank which include precipitated calcium phosphate
are pumped to the Solids Separator and removed with the separated solids. Supernatant is
discharged to former lagoon(s) for land application.
Data are not available on the volume of Phosphorus precipitate to the Solids Separator or
on the volume and flow rate of clean water to the barns or to the former lagoons.
Hydrated lime is mixed with influent to the Phosphorus module. Input use estimates
provided by Terra Blue indicate 100 pounds of hydrated lime used per day for 5 days per
week. Laboratory work conducted by Dr. Vanotti indicates 0.7 kg per m3 (5.8418 pounds
per 1000 gallons) of influent from the Clean Water Tank was sufficient to raise pH from
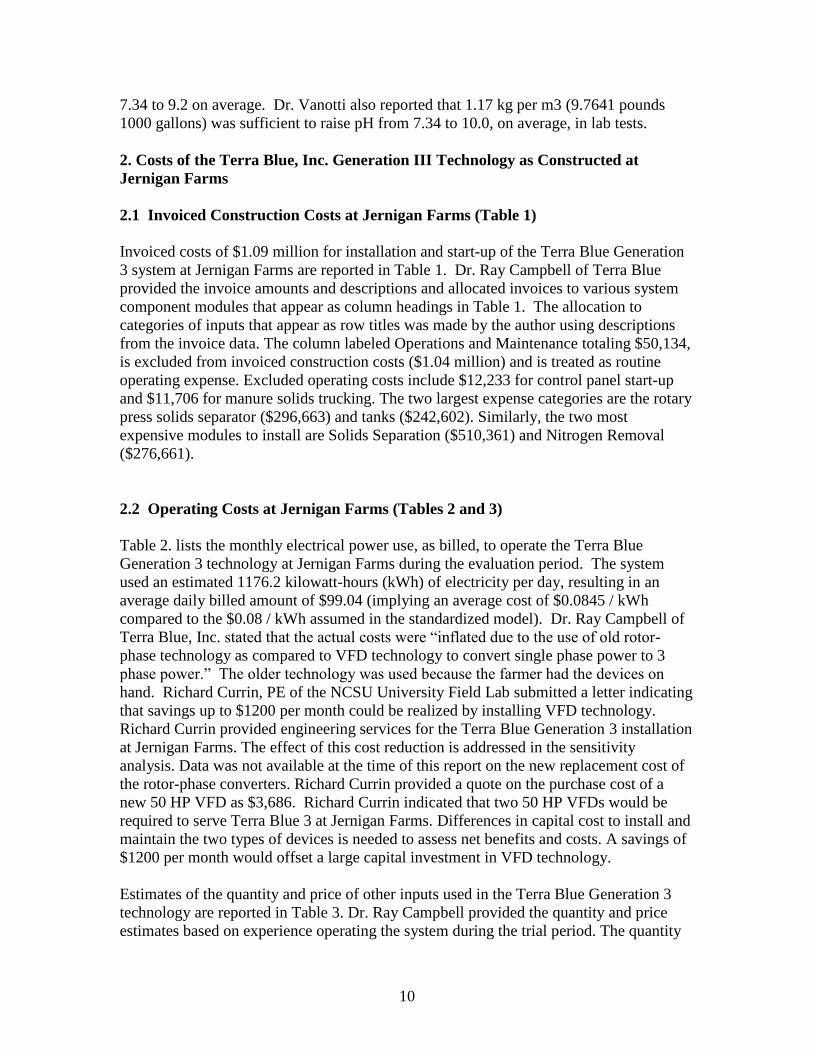
10
7.34 to 9.2 on average. Dr. Vanotti also reported that 1.17 kg per m3 (9.7641 pounds
1000 gallons) was sufficient to raise pH from 7.34 to 10.0, on average, in lab tests.
2. Costs of the Terra Blue, Inc. Generation III Technology as Constructed at
Jernigan Farms
2.1 Invoiced Construction Costs at Jernigan Farms (Table 1)
Invoiced costs of $1.09 million for installation and start-up of the Terra Blue Generation
3 system at Jernigan Farms are reported in Table 1. Dr. Ray Campbell of Terra Blue
provided the invoice amounts and descriptions and allocated invoices to various system
component modules that appear as column headings in Table 1. The allocation to
categories of inputs that appear as row titles was made by the author using descriptions
from the invoice data. The column labeled Operations and Maintenance totaling $50,134,
is excluded from invoiced construction costs ($1.04 million) and is treated as routine
operating expense. Excluded operating costs include $12,233 for control panel start-up
and $11,706 for manure solids trucking. The two largest expense categories are the rotary
press solids separator ($296,663) and tanks ($242,602). Similarly, the two most
expensive modules to install are Solids Separation ($510,361) and Nitrogen Removal
($276,661).
2.2 Operating Costs at Jernigan Farms (Tables 2 and 3)
Table 2. lists the monthly electrical power use, as billed, to operate the Terra Blue
Generation 3 technology at Jernigan Farms during the evaluation period. The system
used an estimated 1176.2 kilowatt-hours (kWh) of electricity per day, resulting in an
average daily billed amount of $99.04 (implying an average cost of $0.0845 / kWh
compared to the $0.08 / kWh assumed in the standardized model). Dr. Ray Campbell of
Terra Blue, Inc. stated that the actual costs were “inflated due to the use of old rotor-
phase technology as compared to VFD technology to convert single phase power to 3
phase power.” The older technology was used because the farmer had the devices on
hand. Richard Currin, PE of the NCSU University Field Lab submitted a letter indicating
that savings up to $1200 per month could be realized by installing VFD technology.
Richard Currin provided engineering services for the Terra Blue Generation 3 installation
at Jernigan Farms. The effect of this cost reduction is addressed in the sensitivity
analysis. Data was not available at the time of this report on the new replacement cost of
the rotor-phase converters. Richard Currin provided a quote on the purchase cost of a
new 50 HP VFD as $3,686. Richard Currin indicated that two 50 HP VFDs would be
required to serve Terra Blue 3 at Jernigan Farms. Differences in capital cost to install and
maintain the two types of devices is needed to assess net benefits and costs. A savings of
$1200 per month would offset a large capital investment in VFD technology.
Estimates of the quantity and price of other inputs used in the Terra Blue Generation 3
technology are reported in Table 3. Dr. Ray Campbell provided the quantity and price
estimates based on experience operating the system during the trial period. The quantity
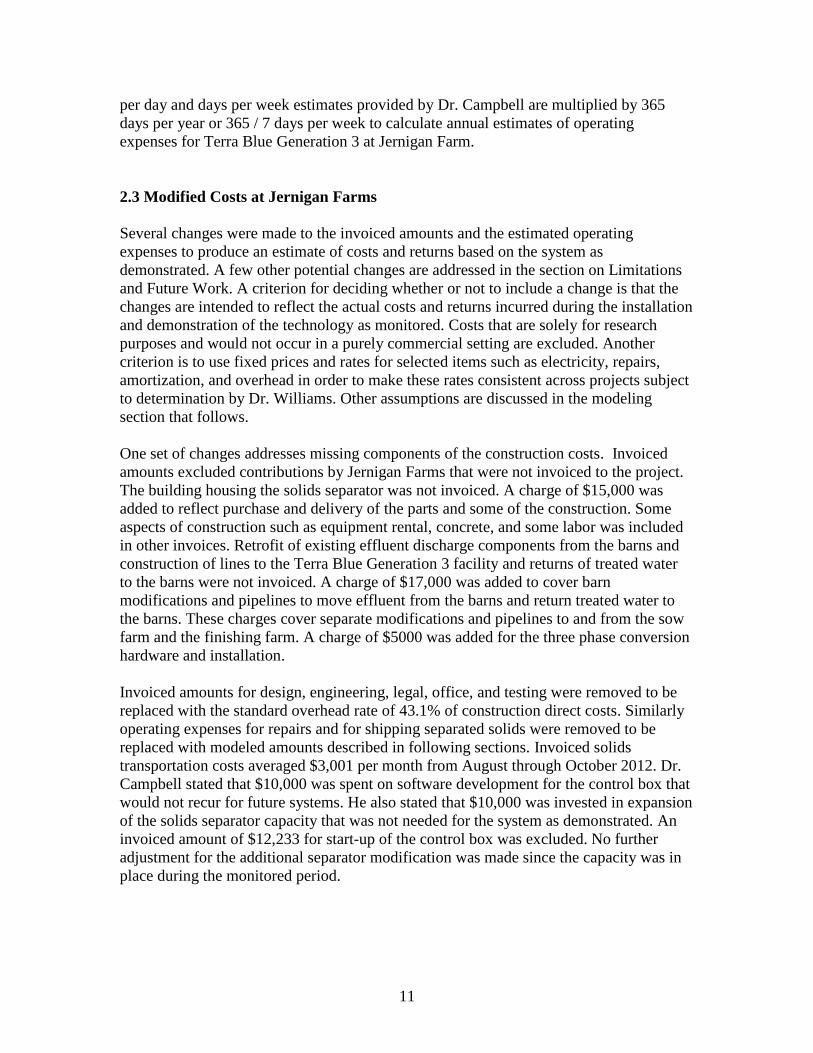
11
per day and days per week estimates provided by Dr. Campbell are multiplied by 365
days per year or 365 / 7 days per week to calculate annual estimates of operating
expenses for Terra Blue Generation 3 at Jernigan Farm.
2.3 Modified Costs at Jernigan Farms
Several changes were made to the invoiced amounts and the estimated operating
expenses to produce an estimate of costs and returns based on the system as
demonstrated. A few other potential changes are addressed in the section on Limitations
and Future Work. A criterion for deciding whether or not to include a change is that the
changes are intended to reflect the actual costs and returns incurred during the installation
and demonstration of the technology as monitored. Costs that are solely for research
purposes and would not occur in a purely commercial setting are excluded. Another
criterion is to use fixed prices and rates for selected items such as electricity, repairs,
amortization, and overhead in order to make these rates consistent across projects subject
to determination by Dr. Williams. Other assumptions are discussed in the modeling
section that follows.
One set of changes addresses missing components of the construction costs. Invoiced
amounts excluded contributions by Jernigan Farms that were not invoiced to the project.
The building housing the solids separator was not invoiced. A charge of $15,000 was
added to reflect purchase and delivery of the parts and some of the construction. Some
aspects of construction such as equipment rental, concrete, and some labor was included
in other invoices. Retrofit of existing effluent discharge components from the barns and
construction of lines to the Terra Blue Generation 3 facility and returns of treated water
to the barns were not invoiced. A charge of $17,000 was added to cover barn
modifications and pipelines to move effluent from the barns and return treated water to
the barns. These charges cover separate modifications and pipelines to and from the sow
farm and the finishing farm. A charge of $5000 was added for the three phase conversion
hardware and installation.
Invoiced amounts for design, engineering, legal, office, and testing were removed to be
replaced with the standard overhead rate of 43.1% of construction direct costs. Similarly
operating expenses for repairs and for shipping separated solids were removed to be
replaced with modeled amounts described in following sections. Invoiced solids
transportation costs averaged $3,001 per month from August through October 2012. Dr.
Campbell stated that $10,000 was spent on software development for the control box that
would not recur for future systems. He also stated that $10,000 was invested in expansion
of the solids separator capacity that was not needed for the system as demonstrated. An
invoiced amount of $12,233 for start-up of the control box was excluded. No further
adjustment for the additional separator modification was made since the capacity was in
place during the monitored period.
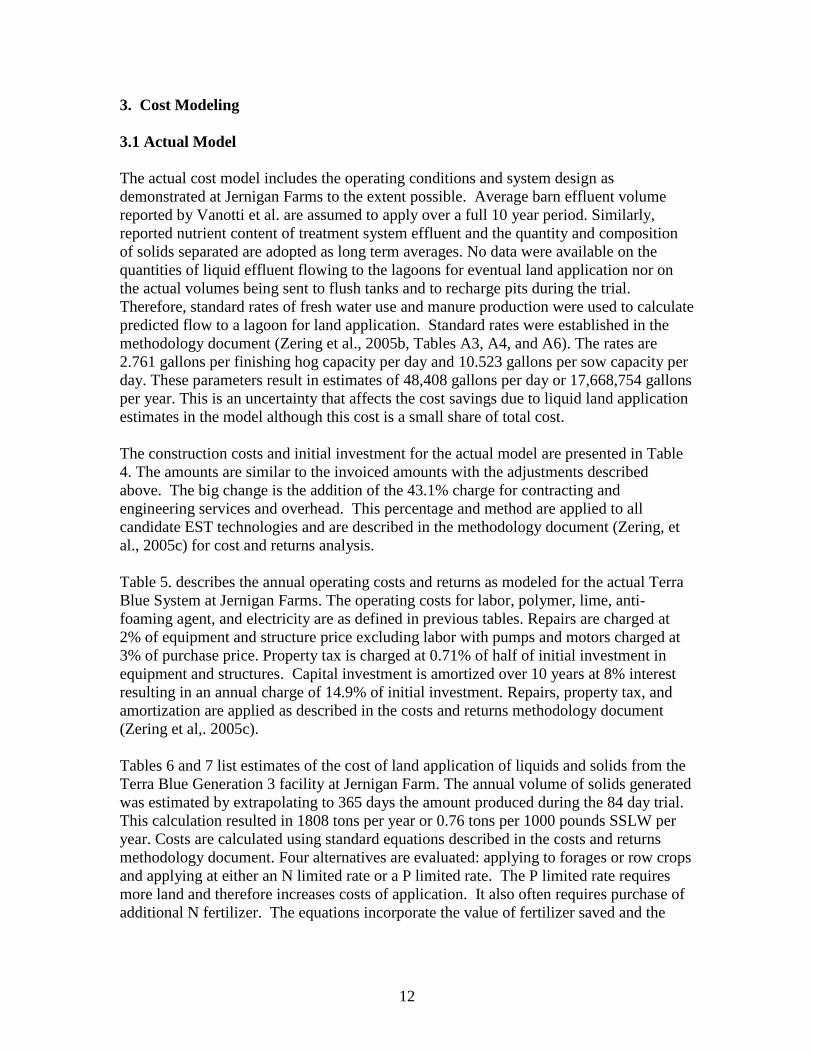
12
3. Cost Modeling
3.1 Actual Model
The actual cost model includes the operating conditions and system design as
demonstrated at Jernigan Farms to the extent possible. Average barn effluent volume
reported by Vanotti et al. are assumed to apply over a full 10 year period. Similarly,
reported nutrient content of treatment system effluent and the quantity and composition
of solids separated are adopted as long term averages. No data were available on the
quantities of liquid effluent flowing to the lagoons for eventual land application nor on
the actual volumes being sent to flush tanks and to recharge pits during the trial.
Therefore, standard rates of fresh water use and manure production were used to calculate
predicted flow to a lagoon for land application. Standard rates were established in the
methodology document (Zering et al., 2005b, Tables A3, A4, and A6). The rates are
2.761 gallons per finishing hog capacity per day and 10.523 gallons per sow capacity per
day. These parameters result in estimates of 48,408 gallons per day or 17,668,754 gallons
per year. This is an uncertainty that affects the cost savings due to liquid land application
estimates in the model although this cost is a small share of total cost.
The construction costs and initial investment for the actual model are presented in Table
4. The amounts are similar to the invoiced amounts with the adjustments described
above. The big change is the addition of the 43.1% charge for contracting and
engineering services and overhead. This percentage and method are applied to all
candidate EST technologies and are described in the methodology document (Zering, et
al., 2005c) for cost and returns analysis.
Table 5. describes the annual operating costs and returns as modeled for the actual Terra
Blue System at Jernigan Farms. The operating costs for labor, polymer, lime, anti-
foaming agent, and electricity are as defined in previous tables. Repairs are charged at
2% of equipment and structure price excluding labor with pumps and motors charged at
3% of purchase price. Property tax is charged at 0.71% of half of initial investment in
equipment and structures. Capital investment is amortized over 10 years at 8% interest
resulting in an annual charge of 14.9% of initial investment. Repairs, property tax, and
amortization are applied as described in the costs and returns methodology document
(Zering et al,. 2005c).
Tables 6 and 7 list estimates of the cost of land application of liquids and solids from the
Terra Blue Generation 3 facility at Jernigan Farm. The annual volume of solids generated
was estimated by extrapolating to 365 days the amount produced during the 84 day trial.
This calculation resulted in 1808 tons per year or 0.76 tons per 1000 pounds SSLW per
year. Costs are calculated using standard equations described in the costs and returns
methodology document. Four alternatives are evaluated: applying to forages or row crops
and applying at either an N limited rate or a P limited rate. The P limited rate requires
more land and therefore increases costs of application. It also often requires purchase of
additional N fertilizer. The equations incorporate the value of fertilizer saved and the

13
value of additional fertilizer required as well as the opportunity cost of land put into
forages.
Table 8 presents the net cost of land application for Terra Blue Generation 3 at Jernigan
Farm. The cost of land application of effluent for the same inventory of pigs using the
lagoon and sprayfield system is subtracted from combined liquids and solids land
application costs of Terra Blue 3 to obtain a net cost. Land application of liquids and
solids to row crops is the least cost of the 4 options for Terra Blue Generation 3 although
it requires 3 times as many acres.
3.2 Comparisons to a Standardized Model
A comparable standardized model doesn’t exist for the Terra Blue Generation 3 system
due to its mixed flush and pit recharge design. The standard model that serves as the
basis of EST determinations has been the 4,320 head feeder to finish operation operating
a pit recharge waste removal system. As stated by Vanotti et al. (2013), Terra Blue
Generation 3 is similar to Super Soils second generation in design: partially scaled to
anticipated finishing liquid volume and with the N removal module scaled by 4.2 times to
accommodate projected N load, adding the decanting tank for flush volume settling, and
reducing the relative size of the denitrification tank by 20 %. One proxy or approach to a
standard model would be to exclude the decanting tank, resize the Homogenization Tank
and N Removal module to the standardized volume and N loads and recalculate the
model. This would essentially reproduce the Super Soils Second Generation
Standardized model with a $280.27 per 1000 pounds SSLW. A 20% reduction in the
Denitrification tank would cut costs by $3 or less per 1000 pounds SSLW. The fixed
solids separation unit featured in Terra Blue Generation 3 may add substantially to the
estimated cost of the Standardized model. The SuperSoils Second Generation system
used a traveling separator such that only a fraction of its cost was born by each farm. The
fixed separator at Terra Blue Generation 3 is an excellent example of economies of scale.
Given the large influent load at the Jernigan Farm, the separator can be kept busy 9.76
hours per day, five days per week and its cost is spread over 2,376 units of 1,000 pounds
SSLW. The standardized farm with its 583 units of 1000 pounds SSLW may have to
support the same separator cost or at least the cost of a smaller version of the same
separator that bears a higher price per unit of capacity. Super Soils First Generation
demonstrated this issue in some respects. The cost of fixed separators per 1000 pounds
steady state increases for smaller farms as typically does the cost of tanks and other
scalable equipment.
Terra Blue Generation 3 at Jernigan Farm is exceptional in that it is a very large volume
system so it captures economies of scale. Another proxy for a standardized model would
be to compare the Terra Blue Generation 3 actual model to the standardized model
projections for other similar systems handling a similar inventory of hogs. Relative
percentages can be used to back out an estimate of a standardized cost per 1000 pounds
SSLW for a farm with 583 units of 1000 pounds SSLW. For example, the Super Soils
second generation standardized model for a farm with pit recharge and 17,136 head
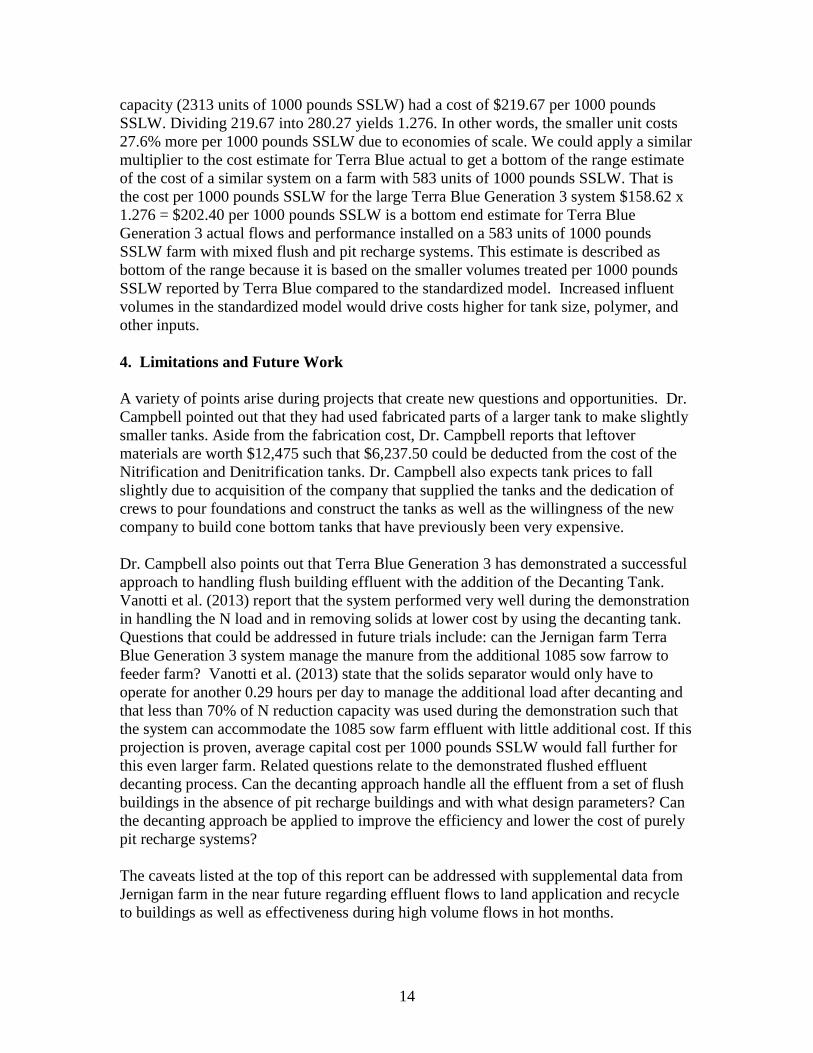
14
capacity (2313 units of 1000 pounds SSLW) had a cost of $219.67 per 1000 pounds
SSLW. Dividing 219.67 into 280.27 yields 1.276. In other words, the smaller unit costs
27.6% more per 1000 pounds SSLW due to economies of scale. We could apply a similar
multiplier to the cost estimate for Terra Blue actual to get a bottom of the range estimate
of the cost of a similar system on a farm with 583 units of 1000 pounds SSLW. That is
the cost per 1000 pounds SSLW for the large Terra Blue Generation 3 system $158.62 x
1.276 = $202.40 per 1000 pounds SSLW is a bottom end estimate for Terra Blue
Generation 3 actual flows and performance installed on a 583 units of 1000 pounds
SSLW farm with mixed flush and pit recharge systems. This estimate is described as
bottom of the range because it is based on the smaller volumes treated per 1000 pounds
SSLW reported by Terra Blue compared to the standardized model. Increased influent
volumes in the standardized model would drive costs higher for tank size, polymer, and
other inputs.
4. Limitations and Future Work
A variety of points arise during projects that create new questions and opportunities. Dr.
Campbell pointed out that they had used fabricated parts of a larger tank to make slightly
smaller tanks. Aside from the fabrication cost, Dr. Campbell reports that leftover
materials are worth $12,475 such that $6,237.50 could be deducted from the cost of the
Nitrification and Denitrification tanks. Dr. Campbell also expects tank prices to fall
slightly due to acquisition of the company that supplied the tanks and the dedication of
crews to pour foundations and construct the tanks as well as the willingness of the new
company to build cone bottom tanks that have previously been very expensive.
Dr. Campbell also points out that Terra Blue Generation 3 has demonstrated a successful
approach to handling flush building effluent with the addition of the Decanting Tank.
Vanotti et al. (2013) report that the system performed very well during the demonstration
in handling the N load and in removing solids at lower cost by using the decanting tank.
Questions that could be addressed in future trials include: can the Jernigan farm Terra
Blue Generation 3 system manage the manure from the additional 1085 sow farrow to
feeder farm? Vanotti et al. (2013) state that the solids separator would only have to
operate for another 0.29 hours per day to manage the additional load after decanting and
that less than 70% of N reduction capacity was used during the demonstration such that
the system can accommodate the 1085 sow farm effluent with little additional cost. If this
projection is proven, average capital cost per 1000 pounds SSLW would fall further for
this even larger farm. Related questions relate to the demonstrated flushed effluent
decanting process. Can the decanting approach handle all the effluent from a set of flush
buildings in the absence of pit recharge buildings and with what design parameters? Can
the decanting approach be applied to improve the efficiency and lower the cost of purely
pit recharge systems?
The caveats listed at the top of this report can be addressed with supplemental data from
Jernigan farm in the near future regarding effluent flows to land application and recycle
to buildings as well as effectiveness during high volume flows in hot months.
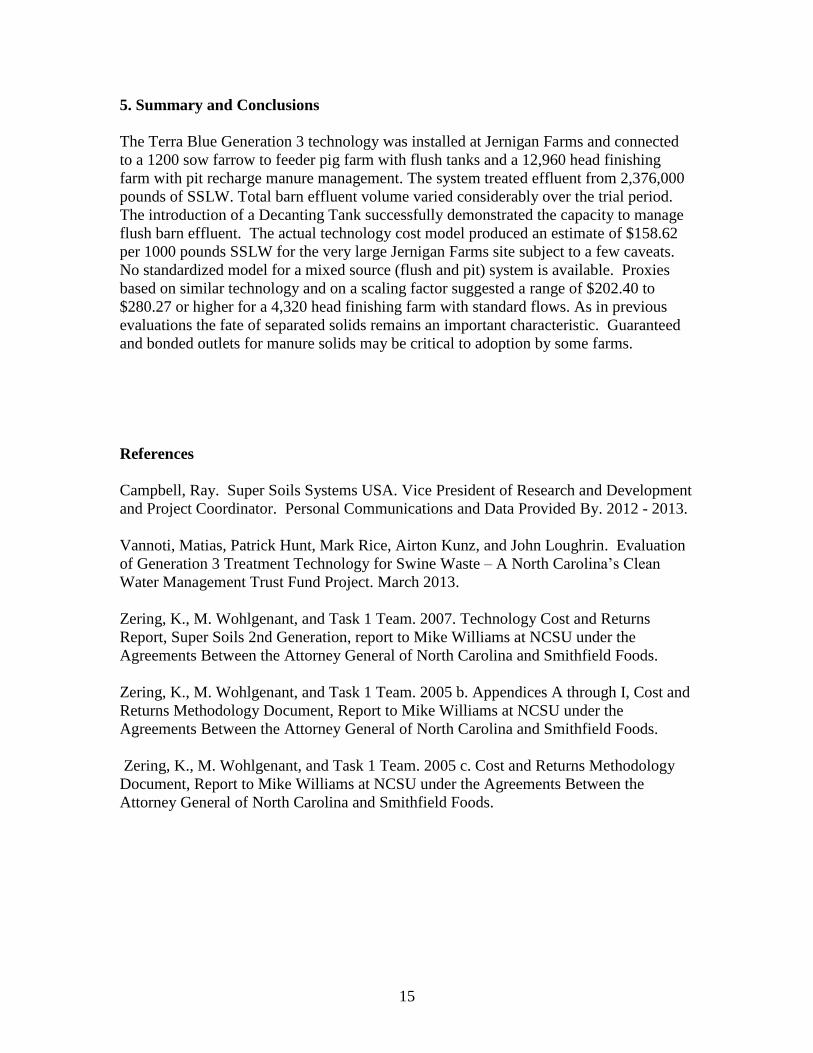
15
5. Summary and Conclusions
The Terra Blue Generation 3 technology was installed at Jernigan Farms and connected
to a 1200 sow farrow to feeder pig farm with flush tanks and a 12,960 head finishing
farm with pit recharge manure management. The system treated effluent from 2,376,000
pounds of SSLW. Total barn effluent volume varied considerably over the trial period.
The introduction of a Decanting Tank successfully demonstrated the capacity to manage
flush barn effluent. The actual technology cost model produced an estimate of $158.62
per 1000 pounds SSLW for the very large Jernigan Farms site subject to a few caveats.
No standardized model for a mixed source (flush and pit) system is available. Proxies
based on similar technology and on a scaling factor suggested a range of $202.40 to
$280.27 or higher for a 4,320 head finishing farm with standard flows. As in previous
evaluations the fate of separated solids remains an important characteristic. Guaranteed
and bonded outlets for manure solids may be critical to adoption by some farms.
References
Campbell, Ray. Super Soils Systems USA. Vice President of Research and Development
and Project Coordinator. Personal Communications and Data Provided By. 2012 - 2013.
Vannoti, Matias, Patrick Hunt, Mark Rice, Airton Kunz, and John Loughrin. Evaluation
of Generation 3 Treatment Technology for Swine Waste – A North Carolina’s Clean
Water Management Trust Fund Project. March 2013.
Zering, K., M. Wohlgenant, and Task 1 Team. 2007. Technology Cost and Returns
Report, Super Soils 2nd Generation, report to Mike Williams at NCSU under the
Agreements Between the Attorney General of North Carolina and Smithfield Foods.
Zering, K., M. Wohlgenant, and Task 1 Team. 2005 b. Appendices A through I, Cost and
Returns Methodology Document, Report to Mike Williams at NCSU under the
Agreements Between the Attorney General of North Carolina and Smithfield Foods.
Zering, K., M. Wohlgenant, and Task 1 Team. 2005 c. Cost and Returns Methodology
Document, Report to Mike Williams at NCSU under the Agreements Between the
Attorney General of North Carolina and Smithfield Foods.
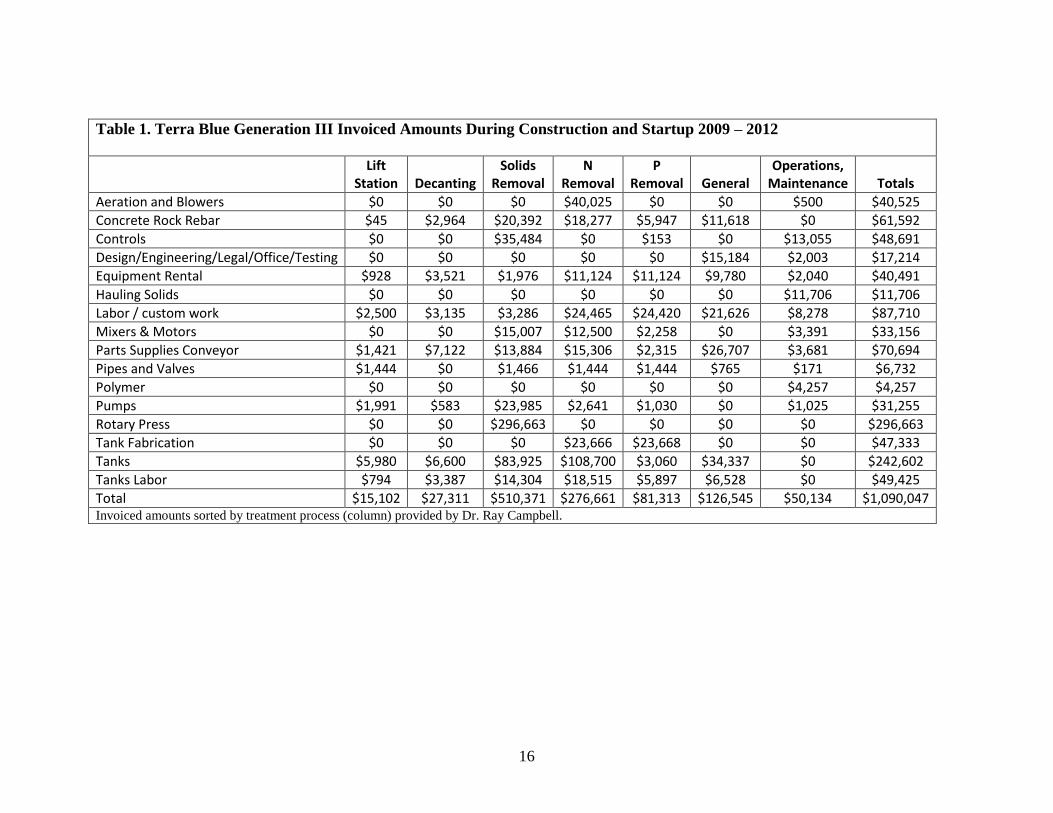
16
Table 1. Terra Blue Generation III Invoiced Amounts During Construction and Startup 2009 – 2012
Lift Station Decanting
Solids Removal
N Removal
P Removal General
Operations, Maintenance Totals
Aeration and Blowers $0 $0 $0 $40,025 $0 $0 $500 $40,525
Concrete Rock Rebar $45 $2,964 $20,392 $18,277 $5,947 $11,618 $0 $61,592
Controls $0 $0 $35,484 $0 $153 $0 $13,055 $48,691
Design/Engineering/Legal/Office/Testing $0 $0 $0 $0 $0 $15,184 $2,003 $17,214
Equipment Rental $928 $3,521 $1,976 $11,124 $11,124 $9,780 $2,040 $40,491
Hauling Solids $0 $0 $0 $0 $0 $0 $11,706 $11,706
Labor / custom work $2,500 $3,135 $3,286 $24,465 $24,420 $21,626 $8,278 $87,710
Mixers & Motors $0 $0 $15,007 $12,500 $2,258 $0 $3,391 $33,156
Parts Supplies Conveyor $1,421 $7,122 $13,884 $15,306 $2,315 $26,707 $3,681 $70,694
Pipes and Valves $1,444 $0 $1,466 $1,444 $1,444 $765 $171 $6,732
Polymer $0 $0 $0 $0 $0 $0 $4,257 $4,257
Pumps $1,991 $583 $23,985 $2,641 $1,030 $0 $1,025 $31,255
Rotary Press $0 $0 $296,663 $0 $0 $0 $0 $296,663
Tank Fabrication $0 $0 $0 $23,666 $23,668 $0 $0 $47,333
Tanks $5,980 $6,600 $83,925 $108,700 $3,060 $34,337 $0 $242,602
Tanks Labor $794 $3,387 $14,304 $18,515 $5,897 $6,528 $0 $49,425
Total $15,102 $27,311 $510,371 $276,661 $81,313 $126,545 $50,134 $1,090,047 Invoiced amounts sorted by treatment process (column) provided by Dr. Ray Campbell.
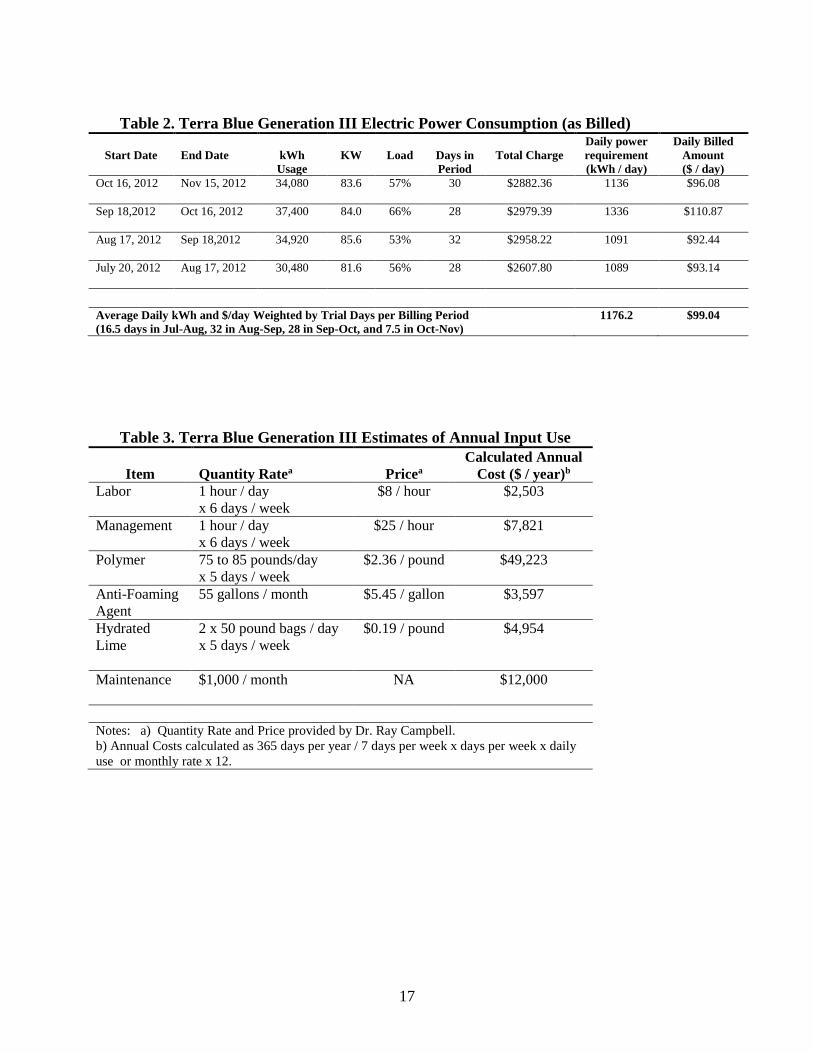
17
Table 2. Terra Blue Generation III Electric Power Consumption (as Billed)
Start Date
End Date
kWh
Usage
KW
Load
Days in
Period
Total Charge
Daily power
requirement
(kWh / day)
Daily Billed
Amount
($ / day)
Oct 16, 2012 Nov 15, 2012 34,080 83.6 57% 30 $2882.36 1136 $96.08
Sep 18,2012
Oct 16, 2012 37,400 84.0 66% 28 $2979.39 1336 $110.87
Aug 17, 2012 Sep 18,2012
34,920 85.6 53% 32 $2958.22 1091 $92.44
July 20, 2012
Aug 17, 2012 30,480 81.6 56% 28 $2607.80 1089 $93.14
Average Daily kWh and $/day Weighted by Trial Days per Billing Period
(16.5 days in Jul-Aug, 32 in Aug-Sep, 28 in Sep-Oct, and 7.5 in Oct-Nov)
1176.2 $99.04
Table 3. Terra Blue Generation III Estimates of Annual Input Use
Item
Quantity Ratea
Pricea
Calculated Annual
Cost ($ / year)b
Labor 1 hour / day $8 / hour $2,503
x 6 days / week
Management
1 hour / day
x 6 days / week
$25 / hour $7,821
Polymer
75 to 85 pounds/day
x 5 days / week
$2.36 / pound $49,223
Anti-Foaming
Agent
55 gallons / month $5.45 / gallon $3,597
Hydrated
Lime
2 x 50 pound bags / day
x 5 days / week
$0.19 / pound $4,954
Maintenance $1,000 / month
NA $12,000
Notes: a) Quantity Rate and Price provided by Dr. Ray Campbell.
b) Annual Costs calculated as 365 days per year / 7 days per week x days per week x daily
use or monthly rate x 12.
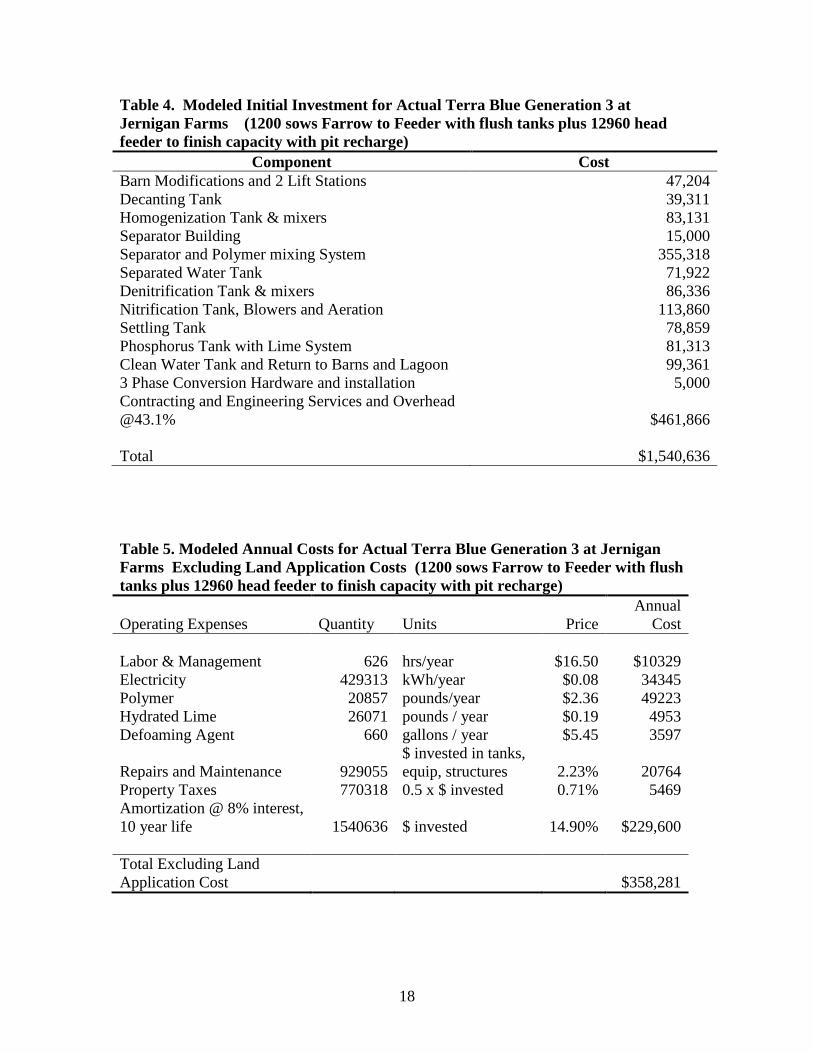
18
Table 4. Modeled Initial Investment for Actual Terra Blue Generation 3 at
Jernigan Farms (1200 sows Farrow to Feeder with flush tanks plus 12960 head
feeder to finish capacity with pit recharge)
Component Cost
Barn Modifications and 2 Lift Stations 47,204
Decanting Tank 39,311
Homogenization Tank & mixers 83,131
Separator Building 15,000
Separator and Polymer mixing System 355,318
Separated Water Tank 71,922
Denitrification Tank & mixers 86,336
Nitrification Tank, Blowers and Aeration 113,860
Settling Tank 78,859
Phosphorus Tank with Lime System 81,313
Clean Water Tank and Return to Barns and Lagoon 99,361
3 Phase Conversion Hardware and installation 5,000
Contracting and Engineering Services and Overhead
@43.1% $461,866
Total $1,540,636
Table 5. Modeled Annual Costs for Actual Terra Blue Generation 3 at Jernigan
Farms Excluding Land Application Costs (1200 sows Farrow to Feeder with flush
tanks plus 12960 head feeder to finish capacity with pit recharge)
Operating Expenses Quantity Units Price
Annual
Cost
Labor & Management 626 hrs/year $16.50 $10329
Electricity 429313 kWh/year $0.08 34345
Polymer 20857 pounds/year $2.36 49223
Hydrated Lime 26071 pounds / year $0.19 4953
Defoaming Agent 660 gallons / year $5.45 3597
Repairs and Maintenance 929055
$ invested in tanks,
equip, structures 2.23% 20764
Property Taxes 770318 0.5 x $ invested 0.71% 5469
Amortization @ 8% interest,
10 year life 1540636 $ invested 14.90% $229,600
Total Excluding Land
Application Cost $358,281
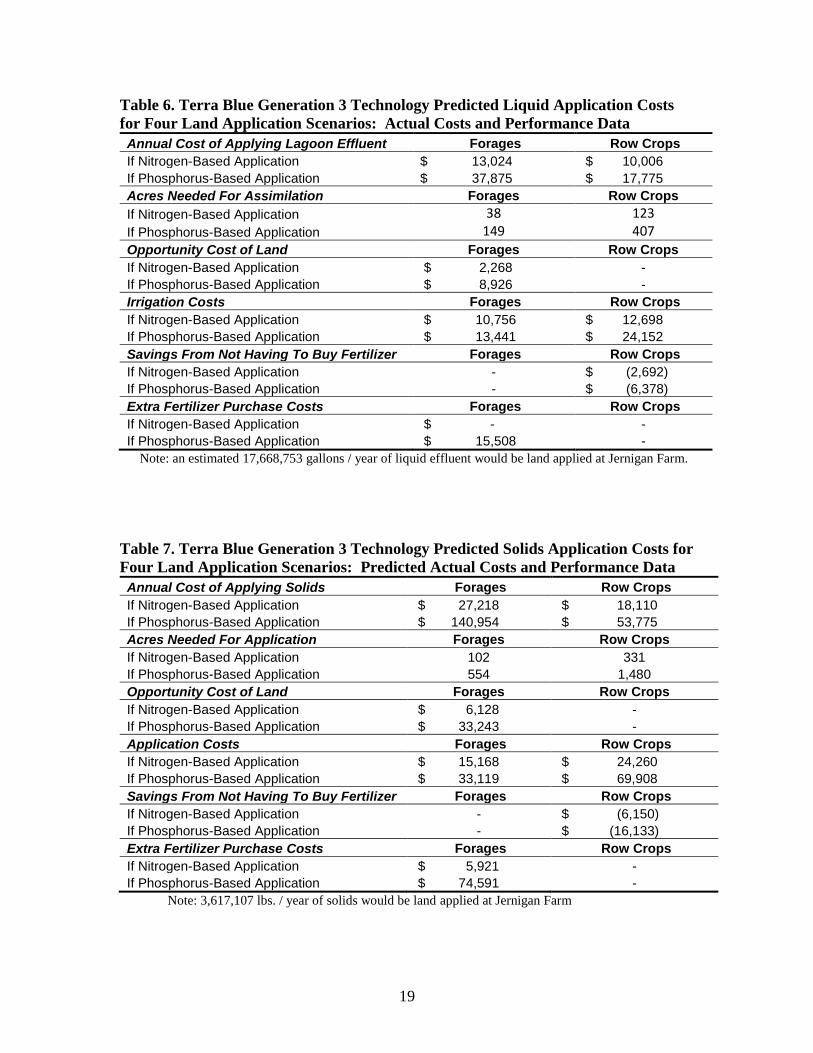
19
Table 6. Terra Blue Generation 3 Technology Predicted Liquid Application Costs
for Four Land Application Scenarios: Actual Costs and Performance Data
Annual Cost of Applying Lagoon Effluent Forages Row Crops
If Nitrogen-Based Application $ 13,024 $ 10,006
If Phosphorus-Based Application $ 37,875 $ 17,775
Acres Needed For Assimilation Forages Row Crops
If Nitrogen-Based Application 38 123
If Phosphorus-Based Application 149 407
Opportunity Cost of Land Forages Row Crops
If Nitrogen-Based Application $ 2,268 -
If Phosphorus-Based Application $ 8,926 -
Irrigation Costs Forages Row Crops
If Nitrogen-Based Application $ 10,756 $ 12,698
If Phosphorus-Based Application $ 13,441 $ 24,152
Savings From Not Having To Buy Fertilizer Forages Row Crops
If Nitrogen-Based Application - $ (2,692)
If Phosphorus-Based Application - $ (6,378)
Extra Fertilizer Purchase Costs Forages Row Crops
If Nitrogen-Based Application $ - -
If Phosphorus-Based Application $ 15,508 -
Note: an estimated 17,668,753 gallons / year of liquid effluent would be land applied at Jernigan Farm.
Table 7. Terra Blue Generation 3 Technology Predicted Solids Application Costs for
Four Land Application Scenarios: Predicted Actual Costs and Performance Data
Annual Cost of Applying Solids Forages Row Crops
If Nitrogen-Based Application $ 27,218 $ 18,110
If Phosphorus-Based Application $ 140,954 $ 53,775
Acres Needed For Application Forages Row Crops
If Nitrogen-Based Application 102 331
If Phosphorus-Based Application 554 1,480
Opportunity Cost of Land Forages Row Crops
If Nitrogen-Based Application $ 6,128 -
If Phosphorus-Based Application $ 33,243 -
Application Costs Forages Row Crops
If Nitrogen-Based Application $ 15,168 $ 24,260
If Phosphorus-Based Application $ 33,119 $ 69,908
Savings From Not Having To Buy Fertilizer Forages Row Crops
If Nitrogen-Based Application - $ (6,150)
If Phosphorus-Based Application - $ (16,133)
Extra Fertilizer Purchase Costs Forages Row Crops
If Nitrogen-Based Application $ 5,921 -
If Phosphorus-Based Application $ 74,591 -
Note: 3,617,107 lbs. / year of solids would be land applied at Jernigan Farm
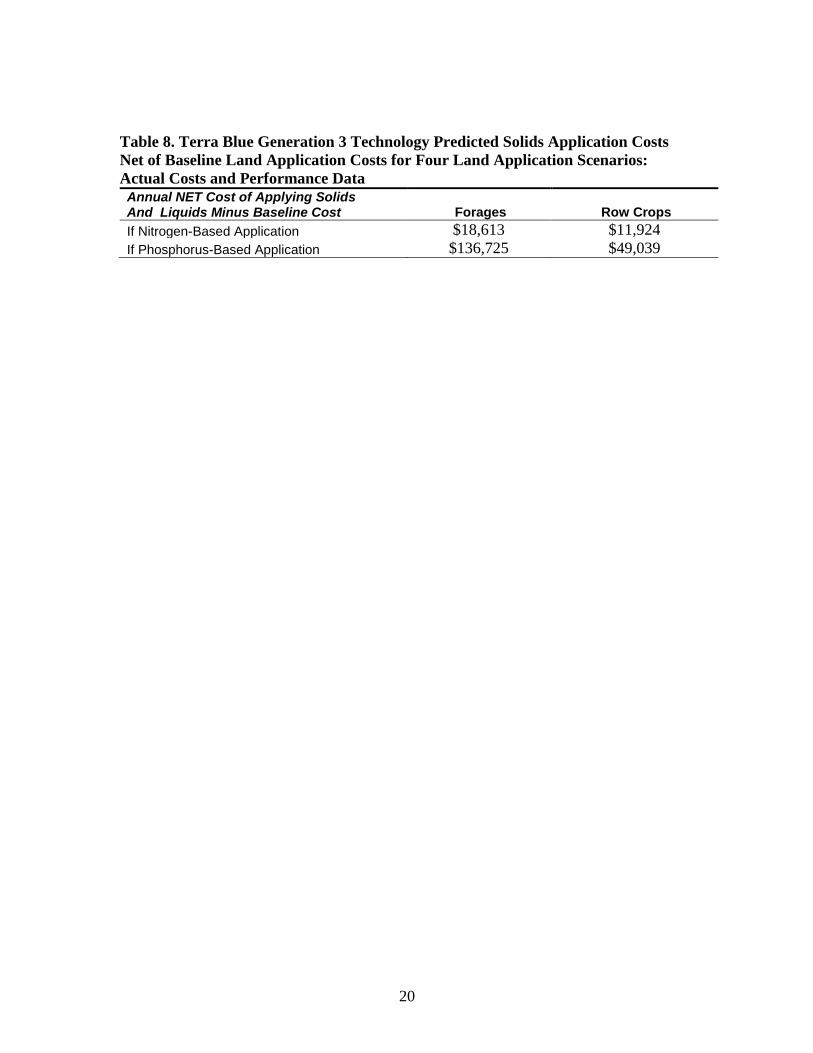
20
Table 8. Terra Blue Generation 3 Technology Predicted Solids Application Costs
Net of Baseline Land Application Costs for Four Land Application Scenarios:
Actual Costs and Performance Data
Annual NET Cost of Applying Solids And Liquids Minus Baseline Cost Forages Row Crops
If Nitrogen-Based Application $18,613 $11,924
If Phosphorus-Based Application $136,725 $49,039


![swine flu kbk-1.ppt [Read-Only]ocw.usu.ac.id/.../1110000141-tropical-medicine/tmd175_slide_swine_… · MAP of H1 N1 Swine Flu. Swine Influenza (Flu) Swine Influenza (swine flu) is](https://img.pdfslide.us/doc/110x75/5f5a2f7aee204b1010391ac9/swine-flu-kbk-1ppt-read-onlyocwusuacid1110000141-tropical-medicinetmd175slideswine.jpg)