Embed Size (px)
DESCRIPTION
civil
Citation preview
Evaluation of Full-Scale House Testing Under Lateral Loading
Prepared for National Association of Home Builders
Prepared by
NAHB Research Center
400 Prince Georges Boulevard
Upper Marlboro, MD 20774-8731
www.nahbrc.org
Report #5822-03_01162009
January 2009


Evaluation of Full-Scale House Testing Under Lateral Loading
NAHB Research Center January 2009 i
Disclaimer Neither the NAHB Research Center, Inc., nor any person acting on its behalf, makes any warranty, express or implied, with respect to the use of any information, apparatus, method, or process disclosed in this publication or that such use may not infringe privately owned rights, or assumes any liabilities with respect to the use of, or for damages resulting from the use of, any information, apparatus, method or process disclosed in this publication, or is responsible for statements made or opinions expressed by individual authors.
Evaluation of Full-Scale House Testing Under Lateral Loading
NAHB Research Center January 2009 ii
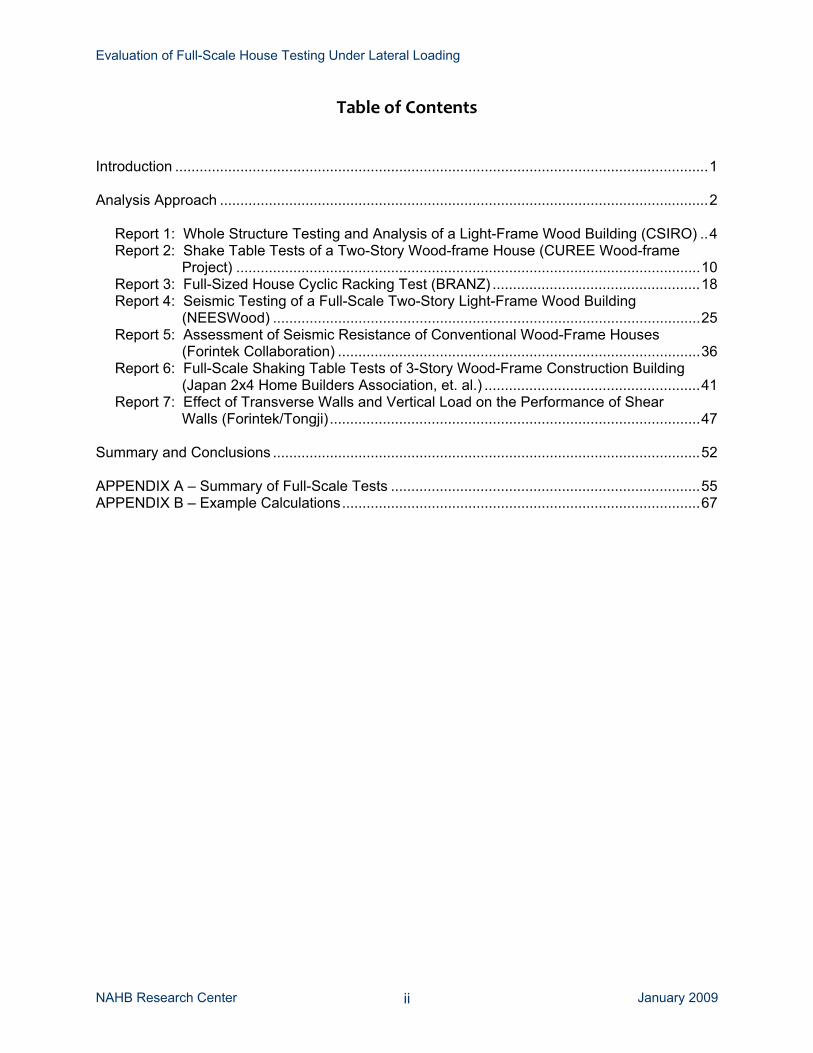
Table of Contents
Introduction ...................................................................................................................................1 Analysis Approach ........................................................................................................................2
Report 1: Whole Structure Testing and Analysis of a Light-Frame Wood Building (CSIRO) ..4 Report 2: Shake Table Tests of a Two-Story Wood-frame House (CUREE Wood-frame
Project) ..................................................................................................................10 Report 3: Full-Sized House Cyclic Racking Test (BRANZ) ...................................................18 Report 4: Seismic Testing of a Full-Scale Two-Story Light-Frame Wood Building
(NEESWood) .........................................................................................................25 Report 5: Assessment of Seismic Resistance of Conventional Wood-Frame Houses
(Forintek Collaboration) .........................................................................................36 Report 6: Full-Scale Shaking Table Tests of 3-Story Wood-Frame Construction Building
(Japan 2x4 Home Builders Association, et. al.) .....................................................41 Report 7: Effect of Transverse Walls and Vertical Load on the Performance of Shear
Walls (Forintek/Tongji)...........................................................................................47 Summary and Conclusions .........................................................................................................52 APPENDIX A – Summary of Full-Scale Tests ............................................................................55 APPENDIX B – Example Calculations........................................................................................67

Evaluation of Full-Scale House Testing Under Lateral Loading
NAHB Research Center January 2009 1
Introduction
Numerous studies have been conducted to measure the lateral performance of low-rise light-frame structures. However, questions remain on correlating engineering design methods to actual building performance, both in the lab and in the field. The difference between calculated and observed performance is commonly attributed to the contribution of finishes and building details that allow the building to act as a complete system. This study uses existing whole-house structural performance data to make inferences about the range of the system effect. It analyzes published results of whole-house tests to determine the magnitude of the system effects based on comparisons of the tested ultimate shear strength of a house and the ultimate strength (capacity) predicted by engineering calculations and current building codes. The study was conducted in two phases. First, a comprehensive literature search for whole-house testing was performed. A total of 42 studies were identified and reviewed. Appendix A provides a tabulated summary of research on full-scale buildings and other three-dimensional (3D) systems. Second, the studies with sufficient information to enable comparison of the tested performance with engineering analysis were selected for a more detailed evaluation. Table 1 provides a summary of the selected studies.
Table 1 - List of Whole-House Structural Studies Selected for Analysis of System Effects
# Title Country Year # Stories
Plan Dimensions Finishes
1 Whole Structure Testing and Analysis of a Light-Frame Wood Building (CSIRO)
Australia 2000 One 30’ x 37’ Interior gypsum
2 Shake Table Tests of a Two-Story Wood-frame House (CUREE Wood-frame Project)
USA 2001 Two 20’ x 16’ Bare Frame /
Fully Finished w Stucco
3 Full-Sized House Cyclic Racking Test (BRANZ)
New Zealand 2006 One 41’ x 19.7’ Fully Finished
4 Seismic Testing of Full-Scale Two-Story Light-Frame Wood Building (NEESWood)
USA 2006 Two 22’ x 58’ Bare Frame /
Fully Finished w Stucco
5 Assessment of Seismic Resistance of Conventional Wood-Frame Houses (Forintek Collaboration)
China 2006 Two 20’ x 20' Interior Gypsum
6
Full-Scale Shaking Table Tests of 3-Story Wood-Frame Construction Buildings (Japan 2x4 Home Builders Association, et. al)
Japan 2006 Three 24’ x 24' Interior and Exterior Finishes
7 Effect of Transverse Walls and Vertical Load on the Performance of Shear Walls (Forintek/Tongji)
Canada 2006 One 20’ long wall None

Evaluation of Full-Scale House Testing Under Lateral Loading
NAHB Research Center January 2009 2
Analysis Approach
To evaluate the contribution of the various building system details to the overall strength of the structure, the ultimate tested shear strength of the house is compared to the ultimate predicted shear strength calculated using applicable engineering methods. Any additional strength observed during testing that cannot be accounted for through design is attributed to whole-house system effects. The system factor was calculated as follows:
AnalysisfromCapacity Predicted Test fromCapacity Measured
=SysF
The magnitude of the system factor depends on the specific assumptions used to calculate the predicted capacity (denominator in the equation above). In this study, a range of design assumptions was used to capture a potential spectrum of system factors. The predicted capacity was estimated with and without applicable building code limitations. The design limitations relevant to this study include segment aspect ratios and combination of structural sheathing with interior gypsum finish in seismic applications. Inclusion of building code limitations in the design process typically results in an increase in the system factor because the code does not recognize the contribution of segments that are narrower than the applicable limit and/or in the case of seismic analysis the contribution of gypsum. However, those elements and materials, although not recognized by code as part of the structural load resisting system, do improve the building’s performance and are a part of the overall building system. Because the majority of houses have segments that are outside of the code range and all houses have finishes, it is important to capture their contribution to the system factor. On the other hand, because there is a possibility that a structure has been optimized to a degree where the number of non-compliant segments is minimized, this study also evaluates scenarios with the contribution of all segments and gypsum wallboard finish included in the predicted capacity at their full unit shear value. The system factor calculated in this manner represents the lower bound range estimate. To provide a better range of comparison, four different design methodologies are used to determine the predicted shear strength of the structure.
Method 1: Perforated Shear Wall Method (Sugiyama) without building code limitations
Method 2: Perforated Shear Wall Method (2006 International Building Code) Method 3: Wind Bracing Design Method used for Public Comment 2 to RB148 (ICC
2007/2008 Code Development Cycle, 2008 Final Action Agenda, International Residential Code)
Method 4: Segmented Shear Wall Method (2006 International Building Code), with and without code limitations
Each building was analyzed using one or more applicable methods selected in each case based on the specific characteristics of the structure. For example, the perforated shear wall (PSW) method was used where hold-downs were installed only at the ends of walls or where hold-

Evaluation of Full-Scale House Testing Under Lateral Loading
NAHB Research Center January 2009 3
downs were not installed with overturning restraint provided by the corners (i.e., perpendicular walls). Where hold-downs were installed at each wall segment, the segmented shear wall method was used. Methods 1 and 2 are forms of the PSW method and represent an engineered design approach. Method 1 uses the PSW method outlined by Sugiyama and Yasumura (see Appendix B), and does not place a limit on the aspect ratio of qualifying braced wall panels or on combining shear capacities of different sheathing materials (e.g., wood structural panel and gypsum wallboard). Method 2 uses the PSW method as applied in accordance with Section 2305.3.8.2 of the 2006 International Building Code (see Appendix B). The IBC places a limit on the maximum aspect ratio for qualifying wall segments that can be included as part of the perforated shear wall. In wind design, this limit is set at 3.5:1 for walls sheathed with wood structural panels and 1.5:1 for walls sheathed with gypsum only (2:1 is permitted for blocked construction). For seismic design, the aspect ratio limit is also 3.5:1, but a further shear capacity reduction factor must be applied to wall segments with aspect ratios greater than 2:1. For the purposes of this study, Method 2 is used to analyze each house separately for wind and seismic design. Method 3 follows the design methodology used to develop Public Comment 2 to RB148. Each qualifying wall segment is multiplied by a nominal design capacity, which is then adjusted by a partial restraint factor depending on the boundary conditions above the wall. A set of sample calculations are provided in Appendix B. As in Method 2, only the contribution of those wall segments having an aspect ratio less than a maximum allowable limit is included. For Method 3, the maximum aspect ratio ranges between 4:1 and 2:1, depending on the height of the opening next to the wall segment. Method 3 also included a system effect factor ranging between 1.2 and 1.5. However, because the purpose of this analysis is to arrive at a system effect factor, it was not included in the calculations. Method 3 was not used for shake-table studies because it is a wind design method. In tests where hold-down anchors were installed along the length of the walls creating separate, fully-restrained segments, a segmented shear wall design method was used per the 2006 IBC (Method 4 above).

Evaluation of Full-Scale House Testing Under Lateral Loading
NAHB Research Center January 2009 4
Report 1: Whole Structure Testing and Analysis of a Light-Frame Wood Building (CSIRO)
General Construction
A one-story, L-shaped house was tested to investigate the response of a light-framed structure under cyclic loading. The house had a footprint consisting of a 23-foot by 37-foot main portion and a 20-foot wide by 6.7-foot long extension at the northwest corner. Figure 1 shows a schematic of the building’s wall layout and Table 2 provides a summary of the materials and construction methods used in the test house. In the direction of loading, the exterior walls of the building were continuously sheathed with plywood including areas above and below all openings.
Figure 1 - Layout of walls in CSIRO house
Evaluation of Full-Scale House Testing Under Lateral Loading
NAHB Research Center January 2009 5
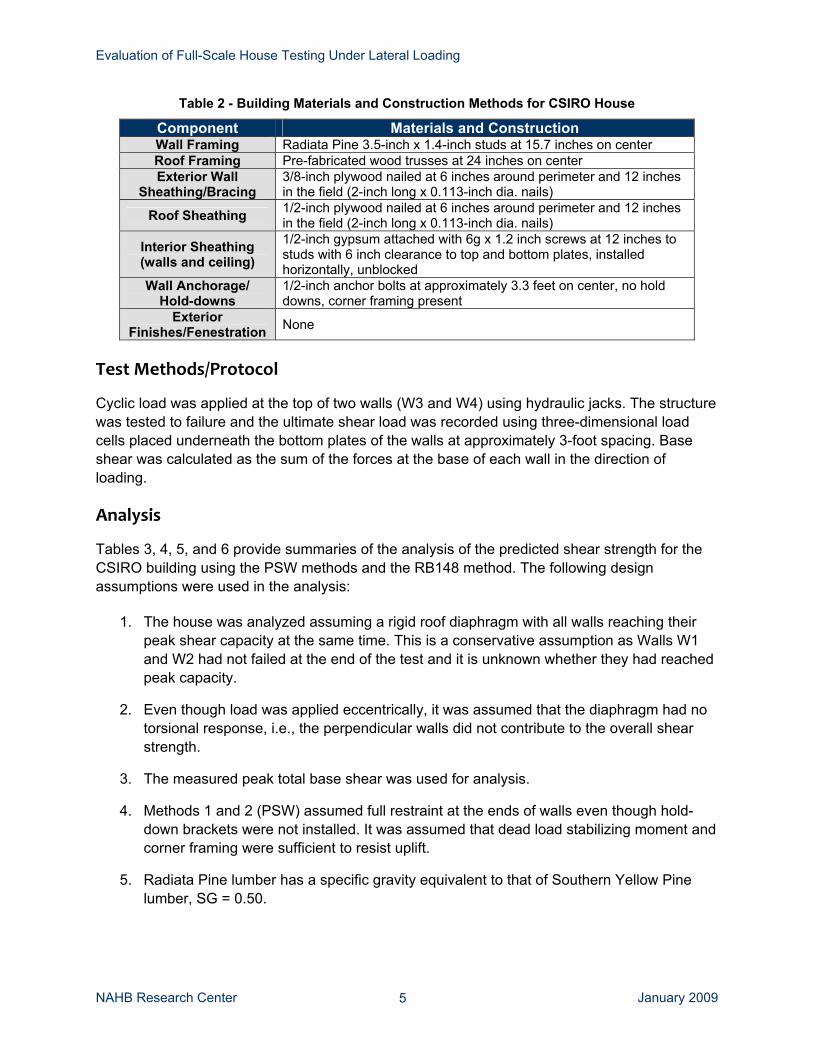
Table 2 - Building Materials and Construction Methods for CSIRO House
Component Materials and Construction Wall Framing Radiata Pine 3.5-inch x 1.4-inch studs at 15.7 inches on center Roof Framing Pre-fabricated wood trusses at 24 inches on center Exterior Wall
Sheathing/Bracing 3/8-inch plywood nailed at 6 inches around perimeter and 12 inches in the field (2-inch long x 0.113-inch dia. nails)
Roof Sheathing 1/2-inch plywood nailed at 6 inches around perimeter and 12 inches in the field (2-inch long x 0.113-inch dia. nails)
Interior Sheathing (walls and ceiling)
1/2-inch gypsum attached with 6g x 1.2 inch screws at 12 inches to studs with 6 inch clearance to top and bottom plates, installed horizontally, unblocked
Wall Anchorage/ Hold-downs
1/2-inch anchor bolts at approximately 3.3 feet on center, no hold downs, corner framing present
Exterior Finishes/Fenestration None
Test Methods/Protocol
Cyclic load was applied at the top of two walls (W3 and W4) using hydraulic jacks. The structure was tested to failure and the ultimate shear load was recorded using three-dimensional load cells placed underneath the bottom plates of the walls at approximately 3-foot spacing. Base shear was calculated as the sum of the forces at the base of each wall in the direction of loading. Analysis
Tables 3, 4, 5, and 6 provide summaries of the analysis of the predicted shear strength for the CSIRO building using the PSW methods and the RB148 method. The following design assumptions were used in the analysis:
1. The house was analyzed assuming a rigid roof diaphragm with all walls reaching their peak shear capacity at the same time. This is a conservative assumption as Walls W1 and W2 had not failed at the end of the test and it is unknown whether they had reached peak capacity.
2. Even though load was applied eccentrically, it was assumed that the diaphragm had no torsional response, i.e., the perpendicular walls did not contribute to the overall shear strength.
3. The measured peak total base shear was used for analysis.
4. Methods 1 and 2 (PSW) assumed full restraint at the ends of walls even though hold-down brackets were not installed. It was assumed that dead load stabilizing moment and corner framing were sufficient to resist uplift.
5. Radiata Pine lumber has a specific gravity equivalent to that of Southern Yellow Pine lumber, SG = 0.50.

Evaluation of Full-Scale House Testing Under Lateral Loading
NAHB Research Center January 2009 6
6. The nominal unit shear capacity of 3/8-inch exterior plywood sheathing nailed at 6 inches around the perimeter and 12 inches in the field is 560 plf, per the AF&PA Special Design Provisions for Wind and Seismic– 2005 Edition.
7. There are no code recognized unit shear capacities for 1/2-inch interior gypsum sheathing attached with screws at 12 inches along the studs with 6-inch clearance from the top and bottom plates. A nominal unit shear capacity of 100 plf was chosen as a reasonable value for this sheathing configuration. (As a benchmark, 1/2-inch gypsum sheathing attached at 12 inches in the field and 8 inches around the perimeter, unblocked, has a unit shear capacity of 120 plf, per the AF&PA Special Design Provisions for Wind and Seismic – 2005 Edition.)
8. Per Section 2305.3.9 of the 2006 IBC, for wind design, the shear capacity of a wall segment sheathed with wood structural panels and gypsum sheathing on opposite faces is the sum of the unit shear capacities of each face. For seismic design, only the unit shear capacity of the wood structural panel is counted towards the shear capacity of the wall.

Evaluation of Full-Scale House Testing Under Lateral Loading
NAHB Research Center January 2009 7
Table 3 - Predicted Shear Strength of CSIRO House Using Method 1 (Sugiyama’s PSW)
Wall Label Sheathing Total Wall Length (ft)
Wall Height (ft)
Total Length of Openings
(ft)
Total Length of Full Height
Sheathed Segments (ft)
Cop1
Nominal
Unit Shear Capacity
(plf)
Fwall (lb)
W1 OSB & Gypsum 20.2 16.4 3.8 0.08 660 1,102 W2 OSB & Gypsum 16.4 9.4 7.0 0.29 660 3,112 W3 Gypsum (both sides) 36.4 4.3 32.1 0.75 200 5,486 W4 OSB & Gypsum 37.0
8
21.2 15.7 0.26 660 6,352 1Adjustment factor calculated using Sugiyama equation, Cop = r / (3-2r)
Total Calculated Shear Strength 16,052 Total Tested Shear Strength 24,700
System Factor 1.54
Table 4 - Predicted Shear Strength of CSIRO House Using Method 2 (2006 IBC PSW) w/ Wind Design Requirements
Wall Label Sheathing Total Wall Length (ft)
Wall Height (ft)
Total Length of Qualifying
PSW Segments1 (ft)
PSW Adjustment Factor, Co2
Nominal
Unit Shear Capacity
(plf)
Fwall (lb)
W13 OSB & Gypsum N/A 0.0 N/A 660 0 W24 OSB & Gypsum 2.6 2.6 1.00 660 1,699 W3 Gypsum (both sides) 36.4 32.1 0.86 200 5,529 W4 OSB & Gypsum 37.0
8
15.7 0.55 660 5,709 1Only full height sheathed segments meeting < 3.5:1 aspect ratio included Total Calculated Shear Strength 12,937 2Value interpolated from Table 2305.3.8.2 in 2006 IBC Total Tested Shear Strength 24,700 3End segments do not meet requirements for qualifying PSW segments System Factor 1.91 4Only one segment meets requirements for a qualifying PSW segment. It is designed as an isolated, fully-restrained shear wall segment (conservative assumption)

Evaluation of Full-Scale House Testing Under Lateral Loading
NAHB Research Center January 2009 8
Table 5 - Predicted Shear Strength of CSIRO House Using Method 2 (2006 IBC PSW) w/ Seismic Design Requirements
Wall Label Sheathing Total Wall Length (ft)
Wall Height (ft)
Total Length of Qualifying
PSW Segments1 (ft)
Aspect Ratio Adjustment
Factor2
PSW Adjustment Factor, Co
3
Nominal
Unit Shear Capacity
(plf)
Fwall (lb)
W14 OSB & Gypsum N/A 0.0 N/A N/A 560 0 W25 OSB & Gypsum 2.6 2.6 0.65 1.0 560 937 W3 Gypsum (both sides) 36.4 32.1 1.0 0.86 200 5,529 W4 OSB & Gypsum 37.0
8
15.7 0.99 0.55 560 4,796 1Only full height sheathed segments meeting < 3.5:1 aspect ratio included Total Calculated Shear Strength 11,262
Total Tested Shear Strength 24,700 2Per Section 2305.3.8.2.2 of 2006 IBC, capacity of segments w/ 2:1< aspect ratio < 3.5:1 must be reduced by 2w/h System Factor 2.19 3 Value interpolated from Table 2305.3.8.2 in 2006 IBC 4End segments do not meet requirements for qualifying PSW segments 5Only one segment meets requirements for a qualifying PSW segment, therefore it is designed as an isolated, fully-restrained shear wall segment (conservative assumption)
Table 6 - Predicted Shear Strength of CSIRO House Using Method 3 (PC2 RB148)
Wall Label Sheathing Total Length of Qualifying PSW Segments1 (ft)
Partial Restraint
Factor (Roof only)
Nominal Unit Shear Capacity (plf) Fwall (lb)
W1 OSB & Gypsum 3.82 660 2,006 W2 OSB & Gypsum 2.6 660 1,357 W3 Gypsum (both sides) 32.2 200 5,144 W4 OSB & Gypsum 15.7
0.8
660 8,315 Total Calculated Shear Strength 16,822 1Only full height sheathed segments meeting requirements of Table R602.10.5 in 2006 IRC are
included Maximum Base Shear 24,700 System Factor w/ W1 included 1.47 2Assumed that W1 wall segments were intended to meet requirement of note 2 in Table R602.10.5
System Factor w/o W1 1.67

Evaluation of Full-Scale House Testing Under Lateral Loading
NAHB Research Center January 2009 9
Results
Table 7 provides a summary of comparisons between the ultimate tested shear strength of the CSIRO test house and the predicted ultimate shear strength calculated by engineering analysis, including the corresponding system effect factor.
Table 7 - Results of Strength Comparison and System Effect Factor for the CSIRO Project
Design Methodology Predicted
Ultimate Shear Strength of House (lb)
Measured Peak Shear Strength of House (lb)
Whole House System Effect
Factor
PSW Method w/ Sugiyama Equation 16,052 1.54
PSW Method w/ 2006 IBC Wind Design Provisions 12,937 1.91
PSW Method w/ 2006 IBC Seismic Design Provisions 11,262 2.19
RB148 Method w/ W1 segments included 16,822 1.47
RB148 Method w/o W1 segments 14,790
24,700
1.67
The conventionally built one-story CSIRO house performed approximately 50% better than predicted by the Sugiyama perforated shear wall method that places no restrictions on wall aspect ratios or detailing. When the applicable building code restrictions were applied, as in Method 2 using wind or seismic provisions, the system effect increased further to 1.91 and 2.19, respectively. The analysis in accordance with Method 3 indicated system factors of 1.47 and 1.67, supporting the use of a 1.5 system factor for a one-story house or a top story in Public Comment 2 to RB148.

Evaluation of Full-Scale House Testing Under Lateral Loading
NAHB Research Center January 2009 10
Report 2: Shake Table Tests of a Two-Story Wood-frame House (CUREE Wood-frame Project)
General Construction
The objective of the CUREE Wood-frame Project was to investigate the dynamic response of light-frame wood structures to uni-directional seismic loading. The research included several phases of testing of a two-story house with a 16-foot wide by 20-foot long rectangular floor plan. Construction methods ranged from fully engineered with uplift hold-downs and straps to conventional light-framed construction. Two of the tested phases are evaluated in this report: Phase 8 and Phase 10. Phase 8 was intended to represent conventional construction, whereas Phase 10 was a fully engineered system with hardware and all finishes installed including exterior stucco and fenestration. Figure 2 shows a schematic of the building’s wall layout for both phases. Table 8 provides a summary of the materials and constructions methods used for Phase 8 and Phase 10. In the direction of loading, the exterior walls of the building were continuously sheathed with plywood including areas above and below all openings. Neither Phase 8 nor Phase 10 tests reached a failure of the system.
Figure 2 - Layout of walls in CUREE project house

Evaluation of Full-Scale House Testing Under Lateral Loading
NAHB Research Center January 2009 11
Table 8 - Building Materials and Construction Methods -- CUREE Project (Phases 8 and 10)
Component Materials and Construction Wall Framing Douglas Fir 2x4 nominal studs at 16 inches on center Floor Framing 2x10 nominal joists at 16 inches on center Roof Framing Pre-fabricated wood trusses at 24 inches on center
Exterior Wall Sheathing/Bracing
Phase 8: 7/16-inch plywood nailed at 6 inches around perimeter and 12 inches in the field (8d box nails, 2.5-inches long x 0.113-inch diameter) Phase 10: Wall 1 – 7/16-inch plywood nailed at 3 inches around perimeter and 12 inches in the field (8d box nails, 2.5-inches long x 0.113-inch diameter) Wall 3 – 7/16-inch plywood nailed at 6 inches around perimeter and 12 inches in the field (8d box nails, 2.5-inches long x 0.113-inch diameter)
Floor Sheathing 3/4-inch tongue and groove plywood nailed at 6 inches around the perimeter and 10 inches in the field (10d box nails, 3-inches long x 0.128-inch diameter), glued
Roof Sheathing 1/2-inch plywood nailed at 6 inches around perimeter and 12 inches in the field (8d box gun nails, 2.5-inches long x 0.113-inch diameter), no blocking
Interior Sheathing
Phase 8: None Phase 10: 1/2-inch gypsum attached at 16 inches on center (1.25 inch long screws), installed horizontally, blocked, taped and mudded
Wall Anchorage/Hold-downs
Phase 8: 1/2-inch anchor bolts 6 feet on center; no hold-downs Phase 10: HTT22 hold-downs at the end of each shear wall segment, two 1/2-inch anchor bolts spaced evenly between hold-downs along each shear wall segment
Exterior Finishes/Fenestration
Phase 8: None Phase 10: 7/8-inch stucco over 17 gauge wire lath; aluminum framed windows and pedestrian door
Test Methods/Protocol
Load was applied using a uni-directional shake table. For Phase 8, the seismic motion input was the Canoga Park ground motion record from the 1994 Northridge earthquake with an amplitude scaling factor of 1.2, resulting in a maximum peak ground acceleration of 0.50g. For Phase 10, the seismic motion input was the Rinaldi ground motion record from the 1994 Northridge earthquake with an amplitude scaling factor of 1.0, resulting in a maximum peak ground acceleration of 0.89g. Base shear was determined through calculations using accelerometer readings and the mass of the building. Testing during Phase 8 resulted in an approximate roof displacement of 2.5 inches, which did not result in specimen failure. Testing during Phase 10 resulted in an approximate roof displacement of 1.0 inch, which again did not result in failure of the specimen. Analysis of Phase 8
Tables 9 and 10 provide summaries of the analysis of the predicted shear strength for the Phase 8 building using the PSW methods. All qualifying shear walls had aspect ratios of less

Evaluation of Full-Scale House Testing Under Lateral Loading
NAHB Research Center January 2009 12
than 2:1. Therefore the predicted strength of the house using Methods 1 and 2 is the same for both wind and seismic design. The following design assumptions were used in the analysis:
1. The house was analyzed assuming a rigid roof diaphragm with all walls reaching their peak shear capacity at the same time.
2. Methods 1 and 2 (PSW) assumed full restraint at the ends of walls even though hold-down brackets were not installed. It was assumed that dead load stabilizing moment and corner framing were sufficient to resist uplift.
3. Doug Fir-Larch lumber with a SG = 0.50 was used in construction.
4. The nominal unit shear capacity of 7/16-inch exterior plywood sheathing nailed at 6 inches around the perimeter and 12 inches in the field with 8d galvanized box nails is 670 plf, per the AF&PA Special Design Provisions for Wind and Seismic – 2005 Edition. Although the CUREE test report does not specify that the nails were galvanized, this report conservatively uses the value for galvanized box nails to avoid introducing an inadvertent increase in the system factor. Moreover, 8d gun nails are typically only 2-3/8 inches long, not 2.5 inches long as required for 8d box nails with a shank diameter of 0.113 inches.

Evaluation of Full-Scale House Testing Under Lateral Loading
NAHB Research Center January 2009 13
Table 9 - Predicted shear strength of CUREE house (Phase 8) using Method 1 (Sugiyama’s PSW)
Wall Label Sheathing Total Wall Length (ft)
Wall Height (ft)
Total Length of Openings
(ft)
Total Length of Full Height Sheathed
Segments (ft) Cop
1 Nominal
Unit Shear Capacity
(plf)
Fwall (lb)
W1 OSB 16.0 3.0 13.0 0.63 670 6,797 W2 none 5.33 0 0 N/A N/A N/A W3 OSB 16.0 3.0 13.0 0.63 670 6,797
W4a & 4b none 4.67
8
0 0 N/A N/A N/A
Total Calculated Shear Strength 13,600 Maximum Base Shear 22,700
1Adjustment factor calculated using Sugiyama equation, Cop = r / (3-2r)
System Factor 1.67
Table 10 - Predicted Shear Strength of CUREE house (Phase 8) using Method 2 (2006 IBC PSW)
Wall Label Sheathing Total Wall Length (ft) Wall Height (ft)
Total Length of Qualifying PSW Segments1 (ft)
PSW Adjustment Factor, Co
2
Nominal Unit Shear Capacity
(plf)
Fwall (lb)
W1 OSB 16.0 13.0 0.78 670 6,794 W2 none 5.3 0 N/A N/A N/A W3 OSB 16.0 13.0 0.78 670 6,794
W4a & 4b none 4.7
8
0 N/A N/A N/A 1Only full height sheathed segments meeting < 3.5:1 aspect ratio included Total Calculated Shear Strength 13,590 2Value interpolated from Table 2305.3.8.2 in 2006 IBC Maximum Base Shear 22,700
System Factor 1.67
Evaluation of Full-Scale House Testing Under Lateral Loading
NAHB Research Center January 2009 14
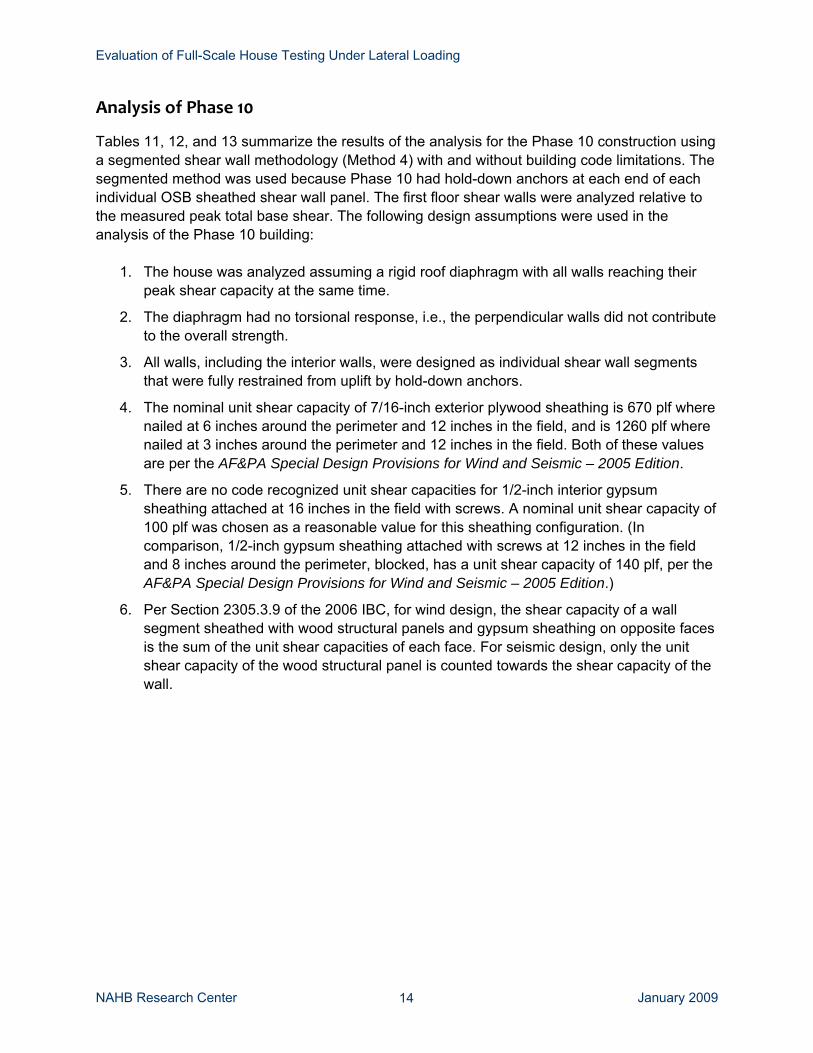
Analysis of Phase 10
Tables 11, 12, and 13 summarize the results of the analysis for the Phase 10 construction using a segmented shear wall methodology (Method 4) with and without building code limitations. The segmented method was used because Phase 10 had hold-down anchors at each end of each individual OSB sheathed shear wall panel. The first floor shear walls were analyzed relative to the measured peak total base shear. The following design assumptions were used in the analysis of the Phase 10 building:
1. The house was analyzed assuming a rigid roof diaphragm with all walls reaching their peak shear capacity at the same time.
2. The diaphragm had no torsional response, i.e., the perpendicular walls did not contribute to the overall strength.
3. All walls, including the interior walls, were designed as individual shear wall segments that were fully restrained from uplift by hold-down anchors.
4. The nominal unit shear capacity of 7/16-inch exterior plywood sheathing is 670 plf where nailed at 6 inches around the perimeter and 12 inches in the field, and is 1260 plf where nailed at 3 inches around the perimeter and 12 inches in the field. Both of these values are per the AF&PA Special Design Provisions for Wind and Seismic – 2005 Edition.
5. There are no code recognized unit shear capacities for 1/2-inch interior gypsum sheathing attached at 16 inches in the field with screws. A nominal unit shear capacity of 100 plf was chosen as a reasonable value for this sheathing configuration. (In comparison, 1/2-inch gypsum sheathing attached with screws at 12 inches in the field and 8 inches around the perimeter, blocked, has a unit shear capacity of 140 plf, per the AF&PA Special Design Provisions for Wind and Seismic – 2005 Edition.)
6. Per Section 2305.3.9 of the 2006 IBC, for wind design, the shear capacity of a wall segment sheathed with wood structural panels and gypsum sheathing on opposite faces is the sum of the unit shear capacities of each face. For seismic design, only the unit shear capacity of the wood structural panel is counted towards the shear capacity of the wall.

Evaluation of Full-Scale House Testing Under Lateral Loading
NAHB Research Center January 2009 15
Table 11 - Predicted Shear Strength of CUREE house (Phase 10) using Method 4 (segmented method) w/o aspect ratio limitations
Wall Label Sheathing Total Wall Length (ft)
Wall Height (ft)
Length of Segment 1 (ft)
Length of Segment 2 (ft)
Nominal Unit Shear Capacity (plf) Fwall (lb)
W1 OSB & Gypsum 16.0 3 3 1,360 8,160 W2 Gypsum (both sides) 5.3 5.33 N/A 200 1,066 W3 OSB & Gypsum 16.0 6.5 6.5 770 10,010
W4a & 4b1 Gypsum (both sides) 4.7
8
2.33 2.33 200 940 Total Calculated Shear Strength 20,176
Total Tested Shear Strength 34,700 System Factor 1.72
Table 12 - Predicted Shear Strength of CUREE house (Phase 10) using Method 4 (segmented method) w/o seismic design requirements
Wall Label Sheathing Total Wall Length (ft)
Wall Height (ft)
Length of Segment 1 (ft)
Length of Segment 2 (ft)
Nominal Unit Shear Capacity (plf) Fwall (lb)
W1 OSB & Gypsum 16.0 3 3 1,360 8,160 W2 Gypsum (both sides) 5.3 5.33 N/A 200 1,066 W3 OSB & Gypsum 16.0 6.5 6.5 770 10,010
W4a & 4b Gypsum (both sides) 4.7
8
2.33 2.33 N/A1 N/A Total Calculated Shear Strength 19,263 1Does not meet aspect ratio limit of < 2:1 for gypsum sheathing per Table R2305.3.4 of 2006 IBC
Total Tested Shear Strength 34,700 System Factor 1.80

Evaluation of Full-Scale House Testing Under Lateral Loading
NAHB Research Center January 2009 16
Table 13 - Predicted Shear Strength of CUREE house (Phase 10) using Method 4 (segmented method) w/ seismic design requirements
Wall Label Sheathing Total Wall Length (ft)
Wall Height (ft)
Length of Segment 1 (ft)
Length of Segment 2 (ft)
Aspect Ratio
Adjustment Factor1
Nominal Unit Shear Capacity
(plf)
Fwall (lb)
W1 OSB & Gypsum 16.0 3 3 0.75 1,260 5,670 W2 Gypsum (both sides) 5.3 5.33 N/A 1.0 200 1,066 W3 OSB & Gypsum 16.0 6.5 6.5 1.0 670 8,710
W4a & 4b Gypsum (both sides) 4.7
8
2.33 2.33 N/A N/A N/A2 Total Calculated Shear Strength 15,446 1Per Section 2305.3.8.2.2 of 2006 IBC, capacity of segments w/ 2:1< aspect ratio < 3.5:1 is reduced by
2w/h Total Tested Shear Strength 34,700 System Factor 2.25 2Does not meet aspect ratio limit of < 2:1 for gypsum sheathing per Table R2305.3.4 of 2006 IBC

Evaluation of Full-Scale House Testing Under Lateral Loading
NAHB Research Center January 2009 17
Results
Tables 14 and 15 provide a summary of comparisons between the predicted ultimate shear strength and the ultimate shear strength of the CUREE test house from Phases 8 and 10, respectively, as well as the corresponding system effect factor.
Table 14 - Results of Strength Comparison and System Effect Factor for Phase 8 of CUREE Project
Design Methodology Predicted Ultimate Shear Strength of
House (lb)
Measured Shear Strength of House (lb)
Whole House System Effect
Factor PSW Method w/ Sugiyama
Equation 13,600 1.67
PSW Method w/ 2006 IBC Wind and Seismic Design
Provisions 13,590
22,7001 1.67
1Test specimen was not taken to failure Table 15 - Results of Strength Comparison and Approximate System Effect Factor for Phase 10 of
CUREE Project
Design Methodology Predicted Ultimate Shear Strength of
House (lb)
Measured Shear Strength of House (lb)
Whole House System Effect
Factor Segmented Method w/o
Seismic Limitations 20,176 1.72
Segmented Method w/o 2006 IBC Seismic Design
Provisions 19,263 1.80
Segmented Method w/ 2006 IBC Seismic Design
Provisions 15,446
34,7001
2.25
1Test specimen was not taken to failure A conventional CUREE house tested in Phase 8 without finishes resulted in a system factor of 1.67 for the PSW method of analysis. This estimate of the system factor is conservative because the house did not fail and presumably had additional reserve capacity. Also, uplift hardware required by the PSW method at the ends of every shear wall was not installed in Phase 8. The Phase 10 house, which was engineered and finished including exterior stucco, windows and doors, resulted in a system factor ranging between 1.7 and 2.0. Again, the house had not yet reached failure at the end of the test and had only exhibited minor cracking of the exterior stucco and interior gypsum sheathing at the corners of some openings, suggesting a significant reserve capacity.
Evaluation of Full-Scale House Testing Under Lateral Loading
NAHB Research Center January 2009 18
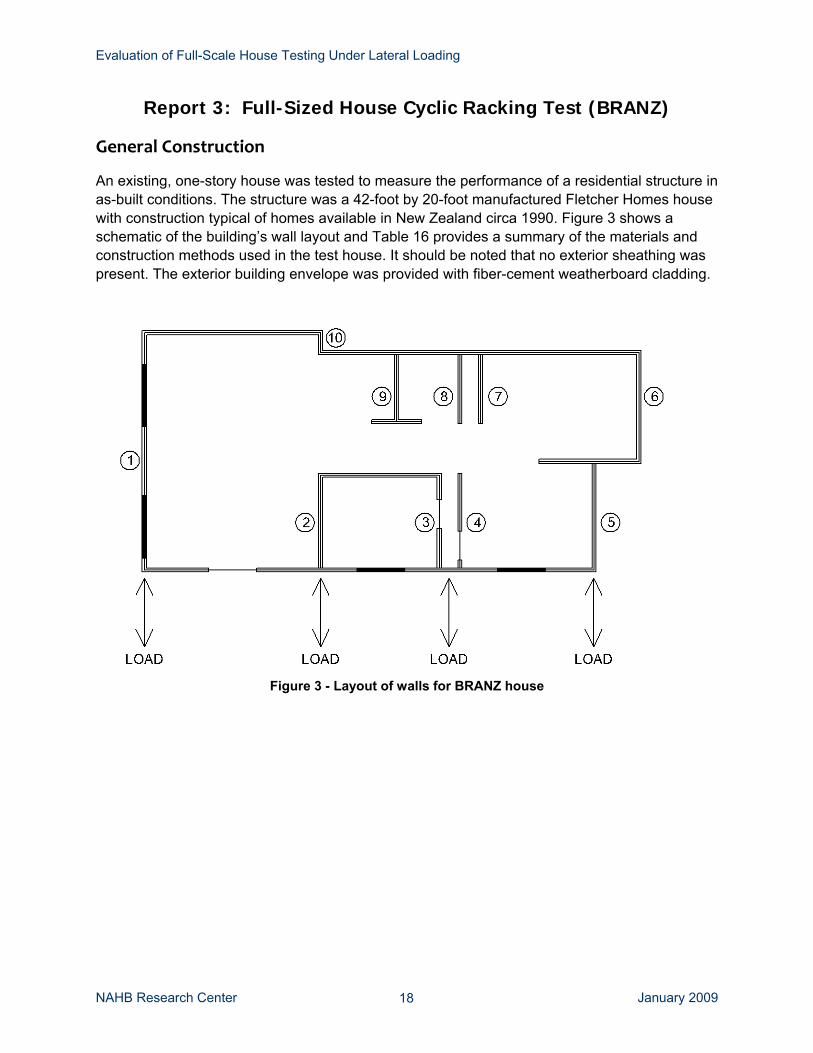
Report 3: Full-Sized House Cyclic Racking Test (BRANZ) General Construction
An existing, one-story house was tested to measure the performance of a residential structure in as-built conditions. The structure was a 42-foot by 20-foot manufactured Fletcher Homes house with construction typical of homes available in New Zealand circa 1990. Figure 3 shows a schematic of the building’s wall layout and Table 16 provides a summary of the materials and construction methods used in the test house. It should be noted that no exterior sheathing was present. The exterior building envelope was provided with fiber-cement weatherboard cladding.
Figure 3 - Layout of walls for BRANZ house

Evaluation of Full-Scale House Testing Under Lateral Loading
NAHB Research Center January 2009 19
Table 16 - Building Materials and Construction Methods of BRANZ House Component Materials and Construction Wall Framing Radiata Pine 3.5-inch x 1.75-inch studs at 24 inches on center.
Roof Framing Pre-fabricated wood trusses at 3.3 feet on center and 2.75-inch by 1.25-inch cross batons at 16 inches on center
Exterior Wall Sheathing/Bracing
none
Roof Sheathing Corrugated metal decking
Interior Sheathing (walls)
3/8-inch bracing grade fiber-reinforced gypsum installed vertically attached at 6 inches around the perimeter only (1.2-inch long x 0.098-inch dia. nails)(Attachment 1);
or 3/8-inch gypsum installed vertically with varying attachment patterns:
- Attachment 2: 12 inches around the perimeter and 24 inches in the field (1.2-inch long x 0.098-inch dia. nails)
- Attachment 3: 6 inches around the perimeter only (1.25-inch long screws)
- Attachment 4: 12 inches around the perimeter only (1.25-inch long screws)
Interior Sheathing (ceiling)
3/8-inch bracing grade gypsum attached at 8-inches on center to cross batons (1.25-inch long screws)
Wall Anchorage/ Hold-downs
One 3.5-inch long x 0.129-inch dia. nail at approximately 24 inches on center, corner framing present
Exterior Finishes/Fenestration
12-inch x 1/4-inch thick fiber-cement planks nailed to studs at 24 inches on center with 3.5-inch long x 0.156-inch dia. nails residential windows and doors
Test Methods/Protocol
Load was applied to the top of walls 1 through 5 cyclically using hydraulic jacks. Load was distributed along the top of each wall using a timber distribution beam. The structure was tested to failure and the ultimate shear load was measured using load cells placed between the hydraulic jacks and the loading beams. Base shear was calculated as the sum of the forces applied by each jack. Analysis
Tables 17, 18, and 19 provide summaries of the analysis of the predicted shear strength of the structure using the PC2/RB148 method (Method 3) and the segmented design method (Method 4). Only gypsum sheathing is used as bracing in this building. The maximum limit on the aspect ratio for gypsum is 2:1 per Table R2305.3.4 of the 2006 IBC for both wind and seismic design. The following design assumptions were used in the analysis:
Evaluation of Full-Scale House Testing Under Lateral Loading
NAHB Research Center January 2009 20
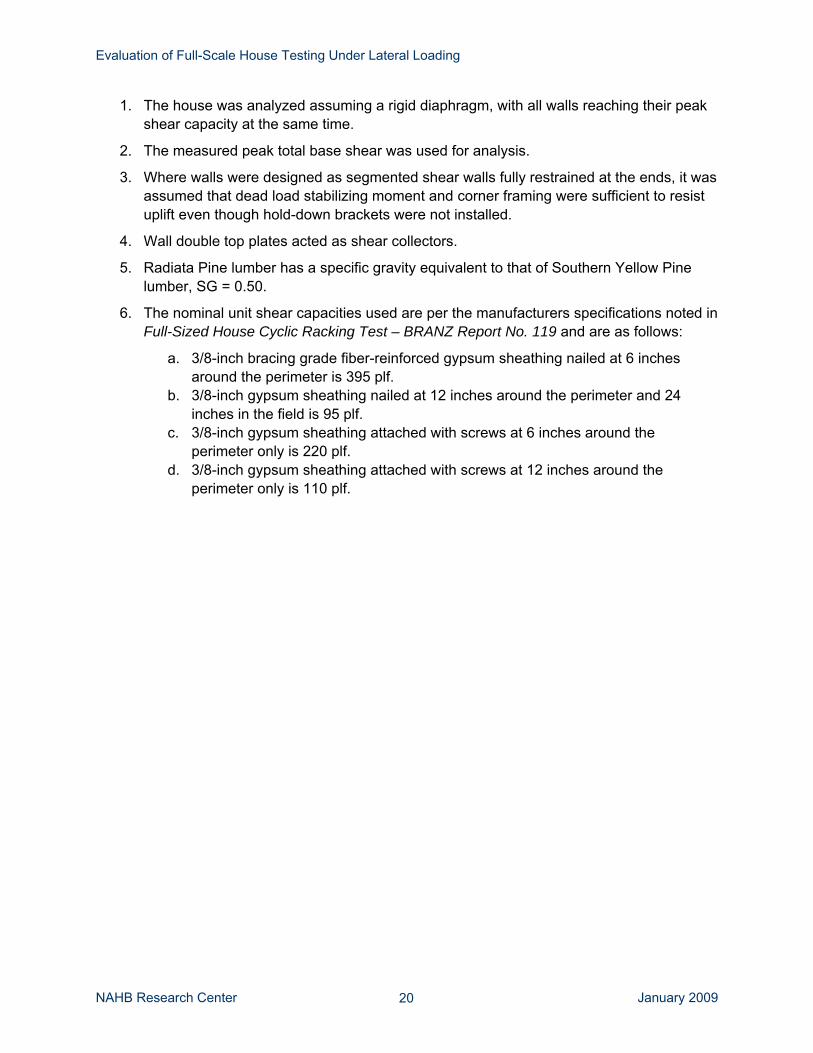
1. The house was analyzed assuming a rigid diaphragm, with all walls reaching their peak shear capacity at the same time.
2. The measured peak total base shear was used for analysis.
3. Where walls were designed as segmented shear walls fully restrained at the ends, it was assumed that dead load stabilizing moment and corner framing were sufficient to resist uplift even though hold-down brackets were not installed.
4. Wall double top plates acted as shear collectors.
5. Radiata Pine lumber has a specific gravity equivalent to that of Southern Yellow Pine lumber, SG = 0.50.
6. The nominal unit shear capacities used are per the manufacturers specifications noted in Full-Sized House Cyclic Racking Test – BRANZ Report No. 119 and are as follows:
a. 3/8-inch bracing grade fiber-reinforced gypsum sheathing nailed at 6 inches around the perimeter is 395 plf.
b. 3/8-inch gypsum sheathing nailed at 12 inches around the perimeter and 24 inches in the field is 95 plf.
c. 3/8-inch gypsum sheathing attached with screws at 6 inches around the perimeter only is 220 plf.
d. 3/8-inch gypsum sheathing attached with screws at 12 inches around the perimeter only is 110 plf.

Evaluation of Full-Scale House Testing Under Lateral Loading
NAHB Research Center January 2009 21
Table 17 - Predicted Shear Strength of BRANZ Test House Using Method 4 (segmented method) w/o Aspect Ratio Limitations
Wall Label Sheathing (gypsum
w/ varying attachment schedules)1
Total Wall Length (ft)
Wall Height (ft)
Length of Segment 1 (ft)
Length of Segment 2 (ft)
Nominal Unit Shear Capacity (plf) Fwall (lb)
1a Attach 4 – 1 side only 1.0 1.0 N/A 110 110 1b Attach 1 – 1 side only 5.4 5.4 N/A 395 2,133 1c Attach 4 – 1 side only 2.3 2.3 N/A 110 253
2 Attach 4 – side 1 Attach 2 – side 2 7.9 7.9 N/A 490 3,871
3 Attach 2 – both sides 7.9 2.75 2.75 190 1,045
4 Attach 2 – side 1 Attach 3 – side 2 5.2 5.2 N/A 315 1,638
5 Attach 4 – 1 side only 7.9 7.9 N/A 110 869 6 Attach 3 – 1 side only 9.1 9.1 N/A 220 2,002
7 Attach 2 – side 1 Attach 3 – side 2 5.8 5.8 N/A 205 1,189
8 Attach 4 – both sides 5.8 5.8 N/A 190 1,102
9 Attach 2 – side 1 Attach 3 – side 2 5.8 5.8 N/A 205 1,189
10 Attach 4 – 1 side only 1.7
8
1.7 N/A 110 187 Total Calculated Shear Strength 15,588
Maximum Base Shear 27,450
1See Table 15 for explanation of sheathing attachment schedules
System Factor 1.76

Evaluation of Full-Scale House Testing Under Lateral Loading
NAHB Research Center January 2009 22
Table 18 - Predicted Shear Strength of BRANZ Test House Using Method 4 (segmented method) w/ Aspect Ratio Limitations
Wall Label Sheathing (gypsum
w/ varying attachment schedules)1
Total Wall Length (ft)
Wall Height (ft)
Length of Segment 1 (ft)
Length of Segment 2 (ft)
Nominal Unit Shear Capacity (plf) Fwall (lb)
1a Attach 4 – 1 side only 1.0 1.0 N/A 110 N/A2 1b Attach 1 – 1 side only 5.4 5.4 N/A 395 N/A2 1c Attach 4 – 1 side only 2.3 2.3 N/A 110 N/A2
2 Attach 4 – side 1 Attach 2 – side 2 7.9 7.9 N/A 490 3,871
3 Attach 2 – both sides 7.9 2.75 2.75 190 N/A2
4 Attach 2 – side 1 Attach 3 – side 2 5.2 5.2 N/A 315 1,638
5 Attach 4 – 1 side only 7.9 7.9 N/A 110 869 6 Attach 3 – 1 side only 9.1 9.1 N/A 220 2,002
7 Attach 2 – side 1 Attach 3 – side 2 5.8 5.8 N/A 205 1,189
8 Attach 4 – both sides 5.8 5.8 N/A 190 1,102
9 Attach 2 – side 1 Attach 3 – side 2 5.8 5.8 N/A 205 1,189
10 Attach 4 – 1 side only 1.7
8
1.7 N/A 110 N/A2 1See Table 15 for explanation of sheathing attachment schedules Total Calculated Shear Strength 11,860
Maximum Base Shear 27,450 2Does not meet aspect ratio limit of < 2:1 for gypsum sheathing per Table R2305.3.4 of 2006 IBC System Factor 2.31
Evaluation of Full-Scale House Testing Under Lateral Loading
NAHB Research Center January 2009 23
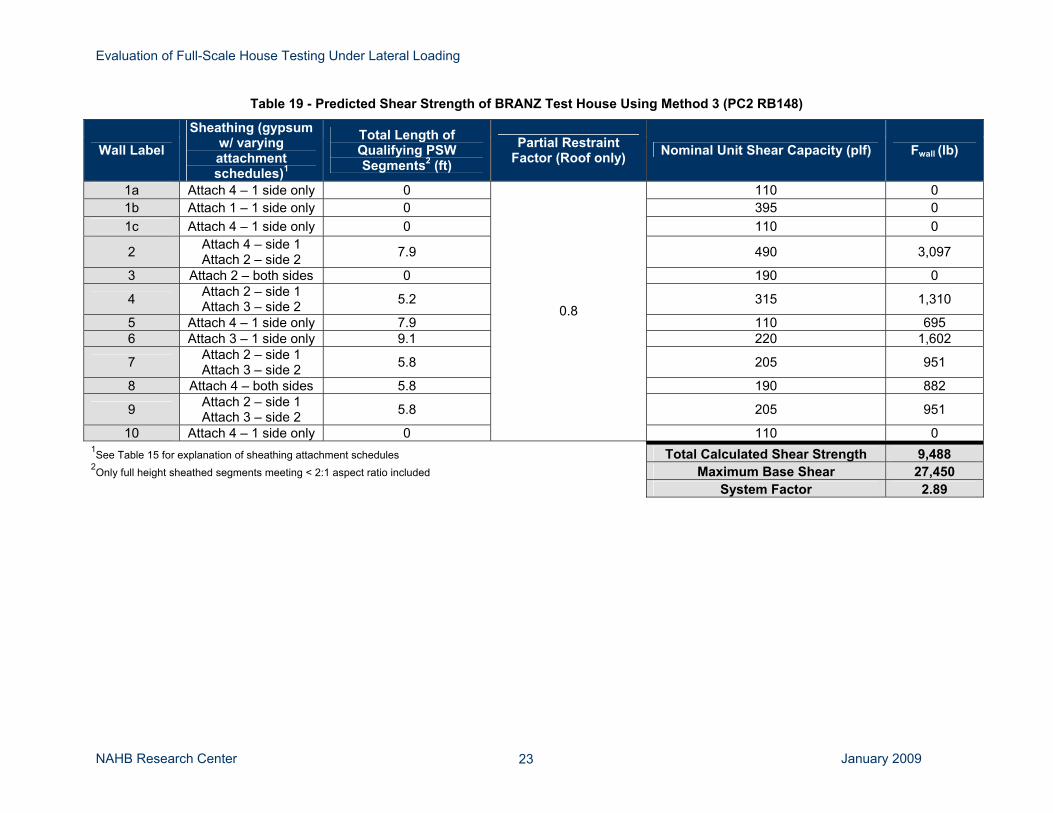
Table 19 - Predicted Shear Strength of BRANZ Test House Using Method 3 (PC2 RB148)
Wall Label Sheathing (gypsum
w/ varying attachment schedules)1
Total Length of Qualifying PSW Segments2 (ft)
Partial Restraint Factor (Roof only) Nominal Unit Shear Capacity (plf) Fwall (lb)
1a Attach 4 – 1 side only 0 110 0 1b Attach 1 – 1 side only 0 395 0 1c Attach 4 – 1 side only 0 110 0
2 Attach 4 – side 1 Attach 2 – side 2 7.9 490 3,097
3 Attach 2 – both sides 0 190 0
4 Attach 2 – side 1 Attach 3 – side 2 5.2 315 1,310
5 Attach 4 – 1 side only 7.9 110 695 6 Attach 3 – 1 side only 9.1 220 1,602
7 Attach 2 – side 1 Attach 3 – side 2 5.8 205 951
8 Attach 4 – both sides 5.8 190 882
9 Attach 2 – side 1 Attach 3 – side 2 5.8 205 951
10 Attach 4 – 1 side only 0
0.8
110 0 1See Table 15 for explanation of sheathing attachment schedules Total Calculated Shear Strength 9,488 2Only full height sheathed segments meeting < 2:1 aspect ratio included Maximum Base Shear 27,450 System Factor 2.89
Evaluation of Full-Scale House Testing Under Lateral Loading
NAHB Research Center 24
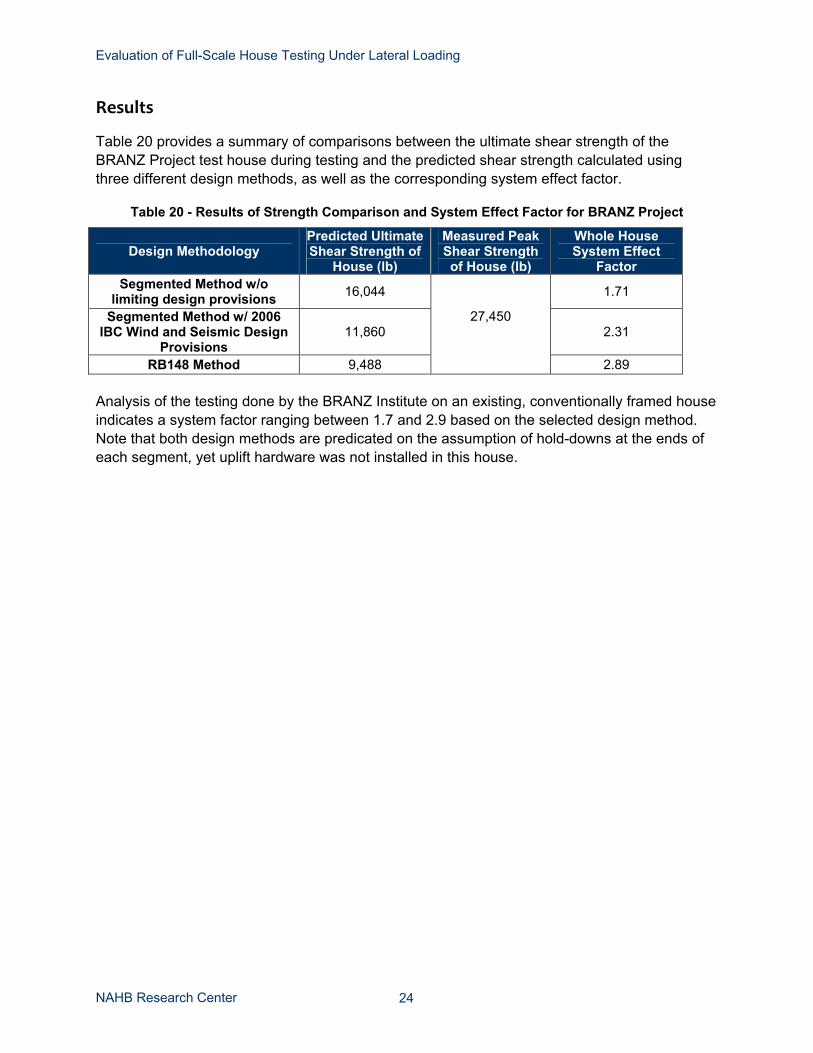
Results
Table 20 provides a summary of comparisons between the ultimate shear strength of the BRANZ Project test house during testing and the predicted shear strength calculated using three different design methods, as well as the corresponding system effect factor.
Table 20 - Results of Strength Comparison and System Effect Factor for BRANZ Project
Design Methodology Predicted Ultimate Shear Strength of
House (lb)
Measured Peak Shear Strength of House (lb)
Whole House System Effect
Factor Segmented Method w/o
limiting design provisions 16,044 1.71
Segmented Method w/ 2006 IBC Wind and Seismic Design
Provisions 11,860 2.31
RB148 Method 9,488
27,450
2.89 Analysis of the testing done by the BRANZ Institute on an existing, conventionally framed house indicates a system factor ranging between 1.7 and 2.9 based on the selected design method. Note that both design methods are predicated on the assumption of hold-downs at the ends of each segment, yet uplift hardware was not installed in this house.

Evaluation of Full-Scale House Testing Under Lateral Loading
NAHB Research Center 25
Report 4: Seismic Testing of a Full-Scale Two-Story Light-Frame
Wood Building (NEESWood) General Construction The NEESWood Benchmark Test project investigated the dynamic response of a two-story, 56-foot by 23-foot wood-frame building with varying levels of finishes to several levels of seismic ground motions. The degree of completion of the test house ranged from a wood structural shell with only the stud framing sheathed with OSB on the exterior to a fully-finished house with windows and doors installed. For the purpose of this study, only the results from the bare frame structure with only exterior OSB sheathing (Phase 1) and the fully finished house test (Phase 5) are analyzed for system effects. Figure 4 shows a schematic of the building’s wall layout and Table 21 provides a summary of the materials and constructions methods used in the test house. The house was designed to be representative of a production house built in the 1980’s and 1990’s. The structural design of the house was in accordance with the 1988 UBC. The walls were continuously sheathed with OSB, including areas above and below all openings.
Figure 4 - Shear wall layout of NEESWood Project test house

Evaluation of Full-Scale House Testing Under Lateral Loading
NAHB Research Center 26
Table 21 - Building Materials and Construction Methods of NEESWood Project House Component Materials and Construction
Wall Framing Hem Fir 2x4 nominal studs at 16 inches on center (except walls of garage which were 2x6 nominal studs)
Floor Framing 2x12 nominal joists at 16 inches on center Roof Framing Pre-fabricated wood trusses at 24 inches on center
Exterior Wall Sheathing/Bracing
7/16-inch OSB nailed at either 3, 4 or 6 inches around the perimeter and 12 inches in the field (8d common nails, 2.5-inches long x 0.131-inch diameter)
Floor Sheathing 3/4-inch tongue and groove OSB nailed at 6 inches around the perimeter and 10 inches in the field (10d common nails, 3-inches long x 0.148-inch diameter), glued
Roof Sheathing 1/2-inch plywood nailed at 6 inches around the perimeter and 12 inches in the field (8d common nails, 2.5-inches long x 0.131-inch diameter), no blocking
Interior Sheathing (walls)
Phase 1 – none Phase 5 – 1/2-inch gypsum attached at 16 inches on center (1.25 inch long screws), installed horizontally, no blocking, taped and mudded
Interior Sheathing (ceilings)
Phase 1 – none Phase 5 – 1/2-inch gypsum attached at 12 inches on center (1.25 inch long screws), installed horizontally, no blocking, taped and mudded
Wall Anchorage/ Hold-downs
PHD2 Simpson Strong-tie hold-down anchors at the end of each shear wall segment (only in N-S direction) and 1/2-inch anchor bolts at 6 feet on center (everywhere), corner framing present
Exterior Finishes/Fenestration
7/8-inch stucco over 16 gauge wire lath; Tile roofing, windows, pedestrian and garage doors also installed
Test Methods/Protocol
Five different levels of seismic loading were applied using two linked tri-axial shake tables. Two different ground motion records were used for the seismic motion input, both recorded during the 1994 Northridge earthquake. The first ground motion was recorded at Canoga Park and was used for the first four levels of loading with amplitude scaling factors from 0.12 to 1.2 and peak ground accelerations from 0.05g to 0.50g in the North-South direction. The second ground motion record was recorded at Rinaldi and was used for the Phase 5 loading level with ground acceleration of 0.84g in the North-South direction. A perpendicular ground motion component was applied in the East-West direction. A corresponding East-West component ranged between 0.04g and 0.43g peak ground acceleration for the four levels of the Canoga Park record, and was 0.45g for the Phase 5 Rinaldi record. A corresponding vertical component ranged from 0.06g to 0.59g peak ground acceleration for the Canoga Park record, and was 0.85g for the Rinaldi record. Base shear was determined through calculations using acceleration readings from sensors placed at each major wall line and the corresponding tributary mass of the building. Phase 1

Evaluation of Full-Scale House Testing Under Lateral Loading
NAHB Research Center 27
testing was only taken to the second level of ground motion (i.e., amplitude scaling factor of 0.53), which resulted in an approximate roof displacement of 2.5 inches and only very minor splitting of the sill plates. Phase 5 testing resulted in an approximate roof displacement of 4.0 inches, but did not result in a catastrophic specimen failure. The observed damage consisted of diagonal cracking of the gypsum sheathing and exterior stucco at the corners of openings, as well as some splitting of the bottom plates and vertical hold-down studs. Analysis
Tables 22 through 27 provide summaries of the analysis of the predicted shear strength for the tested building using a combination of the PSW method and segmented shear wall method based on the detailing provided for individual walls. The measured peak base shear was compared to the performance of the first floor shear walls. The following design assumptions were used in the analysis:
1. The house was analyzed assuming a rigid diaphragm, with all walls reaching their peak shear capacity at the same time.
2. The North-South direction of loading was analyzed – the direction of the primary component of the ground motion record.
3. Three out of the five shear wall lines in the North-South direction were designed as fully-restrained, segmented shear walls, because hold-down anchors were installed at the ends of each fully sheathed segment (see Figure 3). The fourth (walls 6 & 7) and fifth (wall 12) wall lines that did not have hold-downs anchors installed were analyzed as perforated shear walls. It was assumed that the dead load stabilizing moment and corner framing were sufficient to resist uplift. It should be noted that the corner framing was also resisting direct shear from ground motion component in the East-West direction.
4. Hem Fir lumber with a SG = 0.43 was used in construction. All nominal unit shear capacities were adjusted by 0.93 in accordance with note 3 in table 4.3A of AF&PA Special Design Provisions for Wind and Seismic – 2005 Edition.
5. The nominal unit shear capacity of 7/16-inch OSB sheathing nailed at 6 inches around the perimeter and 12 inches in the field and adjusted for Hem-Fir framing is 623 plf, per the AF&PA Special Design Provisions for Wind and Seismic – 2005 Edition.
6. The nominal unit shear capacity of 7/16-inch OSB sheathing nailed at 4 inches around the perimeter and 12 inches in the field and adjusted for Hem-Fir framing is 911 plf, per the AF&PA Special Design Provisions for Wind and Seismic – 2005 Edition.
7. The nominal unit shear capacity of 7/16-inch OSB sheathing nailed at 3 inches around the perimeter and 12 inches in the field and adjusted for Hem-Fir framing is 1,172 plf, per the AF&PA Special Design Provisions for Wind and Seismic – 2005 Edition.
8. There are no code recognized unit shear capacities for 1/2-inch interior gypsum sheathing attached at 16 inches in the field with screws. A nominal unit shear capacity of 100 plf was chosen as a reasonable value for this sheathing configuration. (In comparison, 1/2-inch gypsum sheathing attached with screws at 12 inches in the field

Evaluation of Full-Scale House Testing Under Lateral Loading
NAHB Research Center 28
and 8 inches around the perimeter, blocked, has a unit shear capacity of 140 plf, per the AF&PA Special Design Provisions for Wind and Seismic – 2005 Edition.)
9. Per Section 2305.3.9 of the 2006 IBC, for wind design, the shear capacity of a wall segment sheathed with wood structural panels and gypsum sheathing on opposite faces is the sum of the unit shear capacities of each face. For seismic design, only the unit shear capacity of the wood structural panel is counted towards the shear capacity of the wall.

Evaluation of Full-Scale House Testing Under Lateral Loading
NAHB Research Center January 2009 29
Table 22 - Predicted shear strength of NEESWood test house (Phase 1) using Method 4 (segmented method w/o aspect ratio limitations) (N-S Direction)
Wall Label Sheathing Total Wall Length (ft)
Wall Height (ft)
Length of Segment 1 (ft)
Length of Segment 2 (ft)
Nominal Unit Shear Capacity (plf) Fwall (lb)
5 OSB (4/12 nailing) 21.83 2.33 2.33 911 4,245 6 & 71 OSB (6/12 nailing) 23 7.67 10.75 623 8,835
8 None 7.5 7.25 N/A 0 9 OSB (4/12 nailing) 7.5 7.67 911 6,987 10 OSB (4/12 nailing) 11 2 2 911 3,644 11 None 7.25 1.67 1.67 N/A 0 122 OSB (6/12 nailing) 7 2 2 623 2,972 13 OSB (3/12 nailing) 15.5
8
4.75 4.75 1,172 11,134 Total Calculated Shear Strength 37,817 1Walls 6 & 7 did not have hold-downs. Therefore, walls were designed as perforated shear walls
Total Tested Shear Strength 41,000 System Factor 1.08 2Wall 12 did not have hold-downs. Therefore, the wall was designed as a perforated shear wall

Evaluation of Full-Scale House Testing Under Lateral Loading
NAHB Research Center January 2009 30
Table 23 - Predicted shear strength of NEESWood test house (Phase 1) using Method 4 (segmented method w/o seismic design requirements) (N-S Direction)
Wall Label Sheathing Total Wall Length (ft)
Wall Height (ft)
Length of Segment 1 (ft)
Length of Segment 2 (ft)
Nominal Unit Shear Capacity (plf) Fwall (lb)
5 OSB (4/12 nailing) 21.83 2.33 2.33 911 4,245 6 & 72 OSB (6/12 nailing) 23 7.67 10.75 623 8,835
8 None 7.5 7.25 N/A 0 9 OSB (4/12 nailing) 7.5 7.67 911 6,987 10 OSB (4/12 nailing) 11 2 2 911 N/A1 11 None 7.25 1.67 1.67 N/A 0 123 OSB (6/12 nailing) 7 2 2 623 N/A1 13 OSB (3/12 nailing) 15.5
8
4.75 4.75 1,172 11,134 1Does not meet aspect ratio limit of < 3.5:1 for wood structural panels per Table R2305.3.4 of 2006 IBC Total Calculated Shear Strength 31,201
Total Tested Shear Strength 41,000 2Walls 6 & 7 did not have hold-downs. Therefore, the walls were designed as perforated shear walls System Factor 1.31
3Wall 12 did not have hold-downs. Therefore, the wall was designed as a single perforated shear wall

Evaluation of Full-Scale House Testing Under Lateral Loading
NAHB Research Center January 2009 31
Table 24 - Predicted shear strength of NEESWood test house (Phase 1) using Method 4 (segmented method w/ seismic design requirements) (N-S Direction)
Wall Label Sheathing Total Wall Length (ft)
Wall Height (ft)
Length of Segment 1 (ft)
Length of Segment 2 (ft)
Aspect Ratio
Adjustment Factor1
Nominal Unit Shear Capacity
(plf)
Fwall (lb)
5 OSB (4/12 nailing) 21.83 2.33 2.33 0.63 911 2,675 6 & 73 OSB (6/12 nailing) 23 7.67 10.75 1.0 623 8,835
8 None 7.5 7.25 N/A N/A 0 9 OSB (4/12 nailing) 7.5 7.67 1.0 911 6,987 10 OSB (4/12 nailing) 11 2 2 N/A2 911 N/A 11 None 7.25 1.67 1.67 N/A N/A 0 124 OSB (6/12 nailing) 7 2 2 N/A2 623 N/A 13 OSB (3/12 nailing) 15.5
8
4.75 4.75 1.0 1,172 11,134 Total Calculated Shear Strength 29,631 1Per Section 2305.3.8.2.2 of 2006 IBC, capacity of segments w/ 2:1< aspect ratio < 3.5:1 must be
reduced by 2w/h Total Tested Shear Strength 41,000 2Does not meet aspect ratio limit of < 3.5:1 for wood structural panels per Table R2305.3.4 of 2006 IBC System Factor 1.38 3Walls 6 & 7 did not have hold-downs. Therefore, the walls were designed as perforated shear walls 4Wall 12 did not have hold-downs. Therefore, the wall was designed as a single perforated shear wall

Evaluation of Full-Scale House Testing Under Lateral Loading
NAHB Research Center January 2009 32
Table 25 - Predicted Shear Strength of NEESWood Test House (Phase 5) Using Method 4 (segmented method w/o aspect ratio limitations) (N-S Direction)
Wall Label Sheathing Total Wall Length (ft)
Wall Height (ft)
Length of Segment 1 (ft)
Length of Segment 2 (ft)
Nominal Unit Shear Capacity (plf) Fwall (lb)
5 OSB (4/12 nailing) & Gypsum 21.83 2.33 2.33 1011 4,711
6 & 73 OSB (6/12 nailing) & Gypsum 23 7.67 10.75 723 10,253
8 Gypsum (both sides) 7.5 7.25 200 1,450
9 OSB (4/12 nailing) & Gypsum 7.5 7.67 1,011 7,754
10 OSB (4/12 nailing) & Gypsum 11 2 2 1,011 4,044
11 Gypsum (both sides) 7.25 1.67 1.67 200 667
124 OSB (6/12 nailing) & Gypsum 7 2 2 723 2,972
13 OSB (3/12 nailing) & Gypsum 15.5
8
4.75 4.75 1,272 12,084
Total Calculated Shear Strength 43,935 3Walls 6 & 7 did not have hold-downs. Therefore, the walls were designed as perforated shear walls Total Tested Shear Strength 79,000
System Factor 1.80 4Wall 12 did not have hold-downs. Therefore, the wall was designed as a single perforated shear wall

Evaluation of Full-Scale House Testing Under Lateral Loading
NAHB Research Center January 2009 33
Table 26 - Predicted Shear Strength of NEESWood Test House (Phase 5) Using Method 4 (segmented method w/o seismic limitations) (N-S Direction)
Wall Label Sheathing Total Wall Length (ft)
Wall Height (ft)
Length of Segment 1 (ft)
Length of Segment 2 (ft)
Nominal Unit Shear Capacity (plf) Fwall (lb)
5 OSB (4/12 nailing) & Gypsum 21.83 2.33 2.33 1011 4,711
6 & 73 OSB (6/12 nailing) & Gypsum 23 7.67 10.75 723 10,253
8 Gypsum (both sides) 7.5 7.25 200 1,450
9 OSB (4/12 nailing) & Gypsum 7.5 7.67 1,011 7,754
10 OSB (4/12 nailing) & Gypsum 11 2 2 1,011 N/A1
11 Gypsum (both sides) 7.25 1.67 1.67 200 N/A2
124 OSB (6/12 nailing) & Gypsum 7 2 2 723 N/A1
13 OSB (3/12 nailing) & Gypsum 15.5
8
4.75 4.75 1,272 12,084
Total Calculated Shear Strength 36,252 1Does not meet aspect ratio limit of < 3.5:1 for wood structural panels per Table R2305.3.4 of 2006 IBC 2Does not meet aspect ratio limit of < 2:1 for gypsum sheathing per Table R2305.3.4 of 2006 IBC Total Tested Shear Strength 79,000
System Factor 2.18 3Walls 6 & 7 did not have hold-downs. Therefore, the walls were designed as perforated shear walls
4Wall 12 did not have hold-downs. Therefore, the wall was designed as a single perforated shear wall

Evaluation of Full-Scale House Testing Under Lateral Loading
NAHB Research Center January 2009 34
Table 27 - Predicted Shear Strength of NEESWood Test House (Phase 5) Using Method 4
(segmented method w/ seismic design requirements) (N-S Direction)
Wall Label Sheathing Total Wall Length (ft)
Wall Height (ft)
Length of Segment 1 (ft)
Length of Segment 2 (ft)
Aspect Ratio
Adjustment Factor1
Nominal Unit Shear Capacity
(plf)
Fwall (lb)
5 OSB (4/12 nailing) & Gypsum 21.83 2.33 2.33 0.63 911 2,675
6 & 74 OSB (6/12 nailing) & Gypsum 7.67 10.75 1.0 623 8,835
8 Gypsum (both sides) 7.5 7.25 1.0 200 1,450
9 OSB (4/12 nailing) & Gypsum 7.5 7.67 1.0 911 6,987
10 OSB (4/12 nailing) & Gypsum 11 2 2 N/A2 911 N/A
11 Gypsum (both sides) 7.25 1.67 1.67 N/A3 100 N/A
125 OSB (6/12 nailing) & Gypsum 7 2 2 N/A2 623 N/A
13 OSB (3/12 nailing) & Gypsum 15.5
8
4.75 4.75 1.0 1,172 11,134
Total Calculated Shear Strength 31,081 1Per Section 2305.3.8.2.2 of 2006 IBC, capacity of segments w/ 2:1< aspect ratio < 3.5:1 must be reduced by 2w/h Total Tested Shear Strength 79,000
System Factor 2.55 2Does not meet aspect ratio limit of < 3.5:1 for wood structural panels per Table R2305.3.4 of 2006 IBC 3Does not meet aspect ratio limit of < 2:1 for gypsum sheathing per Table R2305.3.4 of 2006 IBC 4Walls 6 & 7 did not have hold-downs. Therefore, the walls were designed as perforated shear walls 5Wall 12 did not have hold-downs. Therefore, the wall was designed as a single perforated shear wall

Evaluation of Full-Scale House Testing Under Lateral Loading
NAHB Research Center January 2009 35
Results
Table 28 provides a summary of comparisons between the predicted ultimate shear strength of the NEESWood Project test house and the ultimate tested shear strength of the house in the North-South direction, as well as the corresponding system effect factor.
Table 28 - Comparison of predicted to tested strengths and system effect factor of NEESWood Project
Design Methodology Predicted Ultimate Shear Strength of
House (lb)
Measured Shear Strength of House1 (lb)
Whole House System Effect
Factor Phase 1 – Frame w/ OSB
Combined Segmented & PSW Method 37,817 1.08
Combined Segmented & PSW Method w/o 2006 IBC Seismic Design Provisions
31,201 1.31
Combined Segmented & PSW Method w/ 2006 IBC
Seismic Design Provisions 29,631
41,000
1.38
Phase 5 – Finished House Combined Segmented & PSW Method w/o Aspect
Ratio Limitations Provisions
43,935 1.80
Combined Segmented & PSW Method w/o 2006 IBC Seismic Design Provisions
36,252 2.18
Combined Segmented & PSW Method w/ 2006 IBC
Seismic Design Provisions 31,081
79,000
2.55
1Test specimen was not taken to failure A comparison of results from Phases 1 (no finishes) and 5 (fully finished) indicate that finishes contribute significantly to system effects. The predicted capacity of Phase 1 without finishes and with all segments included regardless of the aspect ratio resulted in the lowest system effect of 1.08. However, it should be noted that during Phase 1 the structure’s roof deflection was limited to 2.5 inches indicating a remaining reserve capacity. As a point of comparison, Phase 5 resulted in a roof deflection of nearly 4 inches. Also note that light-frame wood shear walls reach peak strength at story drifts above 2.0 inches. When all applicable seismic aspect ratio limitations were included, the system factor increased to 1.39. When interior sheathing and finishes were added, the corresponding system factor increased significantly. In part, it is attributed to a higher loading, i.e., the system was taken to its capacity. The Phase 5 house experienced nearly 4 inches of roof deflection and sustained damage, but did not reach failure and potentially had some additional reserve capacity. The observed damage consisted of diagonal cracking of the gypsum sheathing and exterior stucco at the corners of openings, as well as splitting of the bottom plates and vertical hold-down studs.

Evaluation of Full-Scale House Testing Under Lateral Loading
NAHB Research Center January 2009 36
Report 5: Assessment of Seismic Resistance of Conventional Wood-Frame Houses (Forintek Collaboration)
General Construction
The Forintek Canada Corp., in collaboration with other industry researchers conducted a series of tests at Tongji University in China to investigate the seismic performance of a conventionally framed house. A two-story, wood-frame building with a square footprint of 20 feet by 20 feet was tested. Figure 5 shows a schematic of the building’s wall layout. Table 29 provides a summary of the materials and construction methods used in the test house. The exterior walls of the building were continuously sheathed with OSB, including areas above and below all openings.
Figure 5 - Wall layout of Forintek Collaboration project test house
Table 29 - Building Materials and Construction Methods of the Forintek Collaboration House Component Materials and Construction Wall Framing SPF No. 2 2x4 nominal studs at 16 inches on center Floor Framing JSI-20 wood I-joists at 16 inches on center Roof Framing Pre-fabricated wood trusses at 24 inches on center
Exterior Wall Sheathing/Bracing
3/8-inch OSB nailed at 6 inches around the perimeter and 12 inches in the field (Twisted nails, 2.5-inches long x 0.126-inch diameter)
Floor Sheathing 3/4-inch tongue and groove OSB Roof Sheathing 7/16-inch plywood
Interior Sheathing (walls)
1/2-inch gypsum attached at 8 inches on center (1.1 inch long x 0.126-inch diameter screws), taped and mudded
Wall Anchorage/ Hold-downs
1/2-inch anchor bolts at 4 feet on center, corner framing present
Exterior Finishes/Fenestration
None

Evaluation of Full-Scale House Testing Under Lateral Loading
NAHB Research Center January 2009 37
Test Methods/Protocol
Four different levels of seismic loading were applied in each direction using a uni-axial shake table. The building was tested in each direction separately, using the same seismic loading. Only the final level of seismic loading was considered for this analysis and consisted of an artificially generated Shanghai earthquake record with a maximum peak ground acceleration of 0.55g. Additional weight was added to simulate 50% design roof and live load. Base shear was calculated from accelerometer readings at the ends of each wall and the seismic mass of the building. Testing resulted in approximate roof displacement of 2.95 inches in the direction parallel with the interior partition and 1.45 inches in the direction perpendicular to the interior partition wall. The specimen did not fail in either direction and only a few instances of cracking of the gypsum sheathing at the corners of wall openings and nails withdrawing slightly from the framing were observed. Analysis
Only the results from testing in the X-direction (see Figure 5) are analyzed in this report as it produced the greatest deformation and was closest to achieving ultimate strength of the structure. Tables 30 through 32 provide summaries of the analysis of the predicted shear strength for the building in the X-direction, using the perforated shear wall methods. The first floor shear walls were analyzed for the measured peak total base shear. The following design assumptions were used in the analysis:
1. The house was analyzed assuming a rigid diaphragm, with all walls in the direction of loading reaching their peak shear capacity at the same time.
2. All walls were designed as perforated shear walls fully restrained at the ends even though hold-down brackets were not installed. It was assumed that dead load and corner framing were sufficient to resist uplift.
3. Spruce-Pine-Fir No. 2 lumber with a SG = 0.42 was used in construction. All nominal unit shear capacities were adjusted by 0.92 in accordance with note 3 in table 4.3A of AF&PA Special Design Provisions for Wind and Seismic – 2005 Edition.
4. Per Table 4.3A in the AF&PA Special Design Provisions for Wind and Seismic – 2005 Edition, the nominal unit shear capacity for 3/8-inch OSB sheathing attached to SPF lumber with 8d galvanized box nails at 6 inches on center on the panel perimeter is 671 plf. Although the report does not specify whether the nails were galvanized, this value is used to avoid overestimating the system factor. In addition, although the nails were not galvanized, they had a deformed shank.
5. The nominal unit shear capacity of 1/2-inch interior gypsum sheathing attached at 4 inches on center with drywall screws and assumed to be installed vertically to qualify as blocked is 320 plf, per the AF&PA Special Design Provisions for Wind and Seismic – 2005 Edition.
6. Per Section 2305.3.9 of the 2006 IBC, for wind design, the shear capacity of a wall segment sheathed with wood structural panels and gypsum sheathing on opposite faces is the sum of the unit shear capacities of each face. For seismic design, only the unit shear capacity of the wood structural panel is counted towards the shear capacity of the wall.

Evaluation of Full-Scale House Testing Under Lateral Loading
NAHB Research Center January 2009 38
Table 30 - Predicted Shear Strength of Forintek Test House Using Method 1 (Sugiyama’s PSW) (X-Direction)
Wall Label Sheathing Total Wall Length (ft)
Wall Height (ft)
Total Length of Openings
(ft)
Total Length of Full Height
Sheathed Segments (ft)
Cop1
Nominal Unit Shear Capacity
(plf)
Fwall (lb)
1 OSB (6/12 nailing) & Gypsum 20 12 8 0.20 991 4,018
2 Gypsum (both sides) 20 6 14 0.48 640 6,100
3 OSB (6/12 nailing) & Gypsum 20
8
12 8 0.20 991 4,018
1Adjustment factor calculated using Sugiyama equation, Cop = r / (3-2r) Total Calculated Shear Strength 14,136 Maximum Base Shear 24,100
System Factor 1.70
Table 31 - Predicted Shear Strength of Forintek Test House Using Method 2 (2006 IBC PSW) w/o seismic limitations (X-Direction)
Wall Label Sheathing Wall Length (ft)
Wall Height (ft)
Total Length of Qualifying PSW Segments1 (ft)
PSW Adjustment Factor, Co
2
Nominal Unit Shear Capacity
(plf)
Fwall (lb)
1 OSB (6/12 nailing) & Gypsum 20 8 0.41 991 3,254
2 Gypsum (both sides) 20 14 0.67 640 6,046
3 OSB (6/12 nailing) & Gypsum 20
8
8 0.41 991 3,254 1Only full height sheathed segments meeting < 3.5:1 aspect ratio included Total Calculated Shear Strength 12,554 2Value interpolated from Table 2305.3.8.2 in 2006 IBC Maximum Base Shear 24,100
System Factor 1.92

Evaluation of Full-Scale House Testing Under Lateral Loading
NAHB Research Center January 2009 39
Table 32 - Predicted Shear Strength of Forintek Test House Using Method 2 (2006 IBC PSW) w/ seismic design requirements (X-Direction)
Wall Label Sheathing Total Wall Length (ft)
Wall Height (ft)
Total Length of Qualifying
PSW Segments1 (ft)
Aspect Ratio Adjustment
Factor2
PSW Adjustment Factor, Co
3
Nominal Unit Shear Capacity
(plf)
Fwall (lb)
1 OSB (6/12 nailing) & Gypsum 20 8 1.0 0.41 671 2,204
2 Gypsum (both sides) 20 14 1.0 0.67 640 6,046
3 OSB (6/12 nailing) & Gypsum 20
8
8 1.0 0.41 671 2,204 1Only full height sheathed segments meeting < 3.5:1 aspect ratio included Total Calculated Shear Strength 10,454
Total Tested Shear Strength 24,100 2Per Section 2305.3.8.2.2 of 2006 IBC, capacity of segments w/ 2:1< aspect ratio < 3.5:1 must be reduced by 2w/h System Factor 2.31 3Value interpolated from Table 2305.3.8.2 in 2006 IBC
Evaluation of Full-Scale House Testing Under Lateral Loading
NAHB Research Center 40
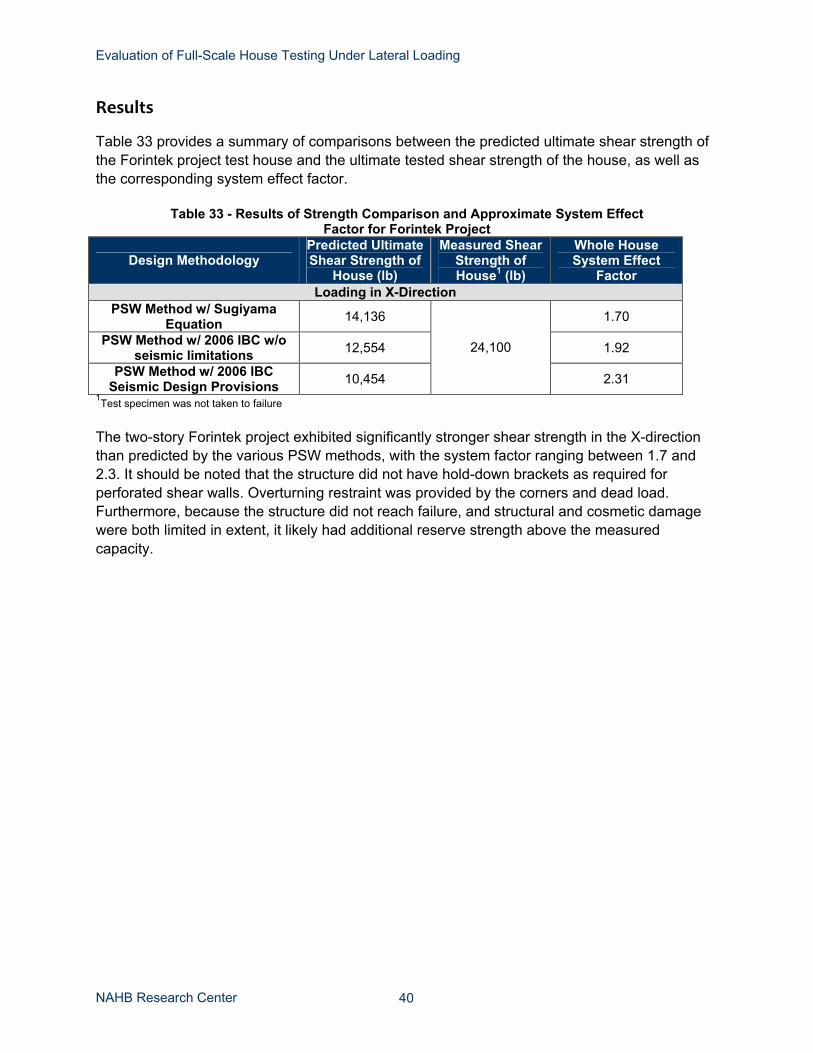
Results
Table 33 provides a summary of comparisons between the predicted ultimate shear strength of the Forintek project test house and the ultimate tested shear strength of the house, as well as the corresponding system effect factor.
Table 33 - Results of Strength Comparison and Approximate System Effect Factor for Forintek Project
Design Methodology Predicted Ultimate Shear Strength of
House (lb)
Measured Shear Strength of House1 (lb)
Whole House System Effect
Factor Loading in X-Direction
PSW Method w/ Sugiyama Equation 14,136 1.70
PSW Method w/ 2006 IBC w/o seismic limitations 12,554 1.92
PSW Method w/ 2006 IBC Seismic Design Provisions 10,454
24,100
2.31 1Test specimen was not taken to failure The two-story Forintek project exhibited significantly stronger shear strength in the X-direction than predicted by the various PSW methods, with the system factor ranging between 1.7 and 2.3. It should be noted that the structure did not have hold-down brackets as required for perforated shear walls. Overturning restraint was provided by the corners and dead load. Furthermore, because the structure did not reach failure, and structural and cosmetic damage were both limited in extent, it likely had additional reserve strength above the measured capacity.

Evaluation of Full-Scale House Testing Under Lateral Loading
NAHB Research Center 41
Report 6: Full-Scale Shaking Table Tests of 3-Story Wood-Frame Construction Building (Japan 2x4 Home Builders Association, et. al.) General Construction
This testing sponsored by the Japan 2x4 Home Builders Association, along with several other industry and academic representatives, investigated the response of a conventionally-framed three-story home to seismic ground motion. The structure was tested with and without finish materials. The building had a 24-foot by 24-foot square footprint. Figure 6 shows a schematic of the building’s wall layout and Table 34 provides a summary of the materials and construction methods used in the test house. The walls of the building were continuously sheathed with plywood, including areas above and below all openings.
Figure 6 - Wall layout of test house

Evaluation of Full-Scale House Testing Under Lateral Loading
NAHB Research Center 42
Table 34 - Building Materials and Construction Methods of Japanese 2x4 Assoc. House
Component Materials and Construction Wall Framing Doug Fir 2x4 nominal studs at 16 inches on center Floor Framing Wood I-joists at 16 inches on center Roof Framing Wood rafters and joists at 16 inches on center
Exterior Wall Sheathing/Bracing
3/8-inch plywood nailed at 4 inches around the perimeter and 12 inches in the field (6d common nails, 2-inches long x 0.113-inch diameter)
Floor Sheathing 3/4-inch tongue and groove OSB Roof Sheathing 7/16-inch plywood (assumed)
Interior Sheathing (walls)
1/2-inch gypsum attached at 4 inches on center (1.25 inch long drywall screws), installed vertically, taped and mudded
Wall Anchorage/ Hold-downs
Hold-down anchors at each end of every shear wall (Perforated Shear Walls)
Exterior Finishes/Fenestration
Exterior ceramic siding and cement slate roofing
Test Methods/Protocol
Seismic loading was applied using a tri-axial shake table. Only the results of the third seismic level of loading were presented in the test report and thus considered for this analysis. It consisted of the ground motion of the Kawaguchi aftershock measured during the 2004 Mid Niigata Prefecture Earthquake. Maximum base shears are reported. Testing during the third stage was taken to an approximate roof displacement of 4.2 inches in the X-direction. Analysis
Tables 35 through 37 provide summaries of the analysis of the predicted shear strength for the building in the X-direction. Only the loads at the first floor shear walls were analyzed. The following design assumptions were used in the analysis:
1. The house was analyzed assuming a rigid diaphragm, with all walls reaching their peak shear capacity at the same time.
2. The measured peak total base shear was used for analysis.
3. All walls, including interior partitions, were designed as Perforated Shear Walls fully restrained at the ends. Hold-down anchors were installed at each end of every shear wall. It was assumed that for interior partition walls where no hold-downs were present, the dead load stabilizing moment and corner framing were sufficient to resist uplift.
4. Douglas Fir-Larch lumber with a SG = 0.50 was used in construction.
5. The nominal unit shear capacity of 3/8-inch exterior plywood sheathing nailed at 4 inches around the perimeter and 12 inches in the field with 6d common nails is 840 plf, per the AF&PA Special Design Provisions for Wind and Seismic – 2005 Edition.
Evaluation of Full-Scale House Testing Under Lateral Loading
NAHB Research Center 43
6. The nominal unit shear capacity of 3/8-inch exterior plywood sheathing nailed at 3 inches around the perimeter and 12 inches in the field with 6d common nails is 1,090 plf, per the AF&PA Special Design Provisions for Wind and Seismic – 2005 Edition.
7. The nominal unit shear capacity of 1/2-inch interior gypsum sheathing attached at 4 inches on center with drywall screws and assumed to be installed vertically to qualify as blocked is 320 plf, per the AF&PA Special Design Provisions for Wind and Seismic – 2005 Edition.
8. Per Section 2305.3.9 of the 2006 IBC, for wind design, the shear capacity of a wall segment sheathed with wood structural panels and gypsum sheathing on opposite faces is the sum of the unit shear capacities of each face. For seismic design, only the unit shear capacity of the wood structural panel is counted towards the shear capacity of the wall.

Evaluation of Full-Scale House Testing Under Lateral Loading
NAHB Research Center January 2009 44
Table 35 - Predicted shear strength of Japanese 2x4 Assoc. test house (X-Direction) using Method 1 (Sugiyama’s PSW)
Wall Label Sheathing Total Wall Length (ft)
Wall Height (ft)
Total Length of Openings
(ft)
Total Length of Full Height
Sheathed Segments (ft)
Cop1
Nominal Unit Shear Capacity
(plf)
Fwall (lb)
1 OSB (4/12 nailing) & Gypsum 24 9 15 0.53 1,160 14,653
2 OSB (3/12 nailing) & Gypsum 22 9 13 0.35 1,410 11,011
3 OSB (4/12 nailing) & Gypsum 24 12 12 0.33 1,160 9,091
7 Gypsum (both sides) 3 0 3 1.00 640 1,920 8 Gypsum (both sides) 6 0 6 1.00 640 3,840 9 Gypsum (both sides) 3
8
0 3 1.00 640 1,920 1Adjustment factor calculated using Sugiyama equation, Cop = r / (3-2r) Total Calculated Shear Strength 42,434
Maximum Base Shear 72,200 System Factor 1.70
Table 36 - Predicted Shear Strength of Japanese 2x4 Assoc. Test House (X-Direction) using Method 2 (2006 IBC PSW) w/o Seismic Design Limitations
Wall Label Sheathing Total Wall Length (ft)
Wall Height (ft)
Total Length of Qualifying PSW Segments1 (ft)
PSW Adjustment Factor, Co
2
Nominal Unit Shear Capacity
(plf)
Fwall (lb)
1 OSB (4/12 nailing) & Gypsum 24 15.00 0.63 1,160 10,962
2 OSB (3/12 nailing) & Gypsum 22 13.00 0.61 1,410 11,181
3 OSB (4/12 nailing) & Gypsum 24 12.00 0.55 1,160 7,656
7 Gypsum (both sides) 3 0 1.00 640 0 8 Gypsum (both sides) 6 6.00 1.00 640 3,840 9 Gypsum (both sides) 3
8
0 1.00 640 0 Total Calculated Shear Strength 33,639 1Only full height sheathed segments meeting < 3.5:1 aspect ratio when sheathed with OSB and < 2:1
when sheathed with gypsum are included Maximum Base Shear 72,200 2Value interpolated from Table 2305.3.8.2 in 2006 IBC System Factor 2.15

Evaluation of Full-Scale House Testing Under Lateral Loading
NAHB Research Center January 2009 45
Table 37 - Predicted Shear Strength of Japanese 2x4 Assoc. Test House (X-Direction) using Method 2 (2006 IBC PSW)
w/ Seismic Design Requirements
Wall Label Sheathing Total Wall Length (ft)
Wall Height (ft)
Total Length of Qualifying
PSW Segments1 (ft)
Aspect Ratio Adjustment
Factor2
PSW Adjustment Factor, Co
3
Nominal Unit Shear Capacity
(plf)
Fwall (lb)
1 OSB (4/12 nailing) & Gypsum 24 15.00 0.75 0.63 840 5,954
2 OSB (3/12 nailing) & Gypsum 22 13.00 0.75 0.61 1,090 6,483
3 OSB (4/12 nailing) & Gypsum 24 12.00 0.75 0.55 840 4,158
7 Gypsum (both sides) 3 0.00 0.75 1.00 640 0 8 Gypsum (both sides) 6 0.00 0.75 1.00 640 0 9 Gypsum (both sides) 3
8
0.00 0.75 1.00 640 0 Total Calculated Shear Strength 16,594 1Only full height sheathed segments meeting < 3.5:1 aspect ratio when sheathed with OSB and < 2:1
when sheathed with gypsum are included Total Tested Shear Strength 72,200 System Factor 4.35 2Per Section 2305.3.8.2.2 of 2006 IBC, capacity of segments w/ 2:1< aspect ratio < 3.5:1 must be
reduced by 2w/h 3Value interpolated from Table 2305.3.8.2 in 2006 IBC
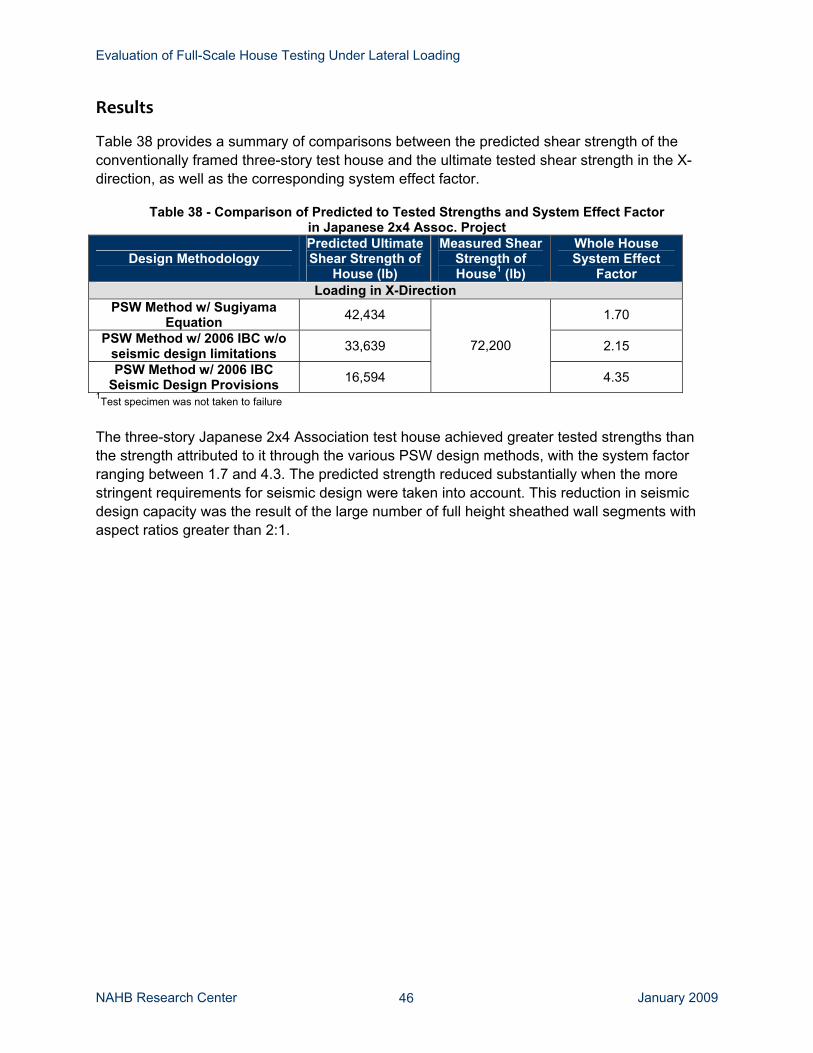
Evaluation of Full-Scale House Testing Under Lateral Loading
NAHB Research Center January 2009 46
Results
Table 38 provides a summary of comparisons between the predicted shear strength of the conventionally framed three-story test house and the ultimate tested shear strength in the X-direction, as well as the corresponding system effect factor.
Table 38 - Comparison of Predicted to Tested Strengths and System Effect Factor in Japanese 2x4 Assoc. Project
Design Methodology Predicted Ultimate Shear Strength of
House (lb)
Measured Shear Strength of House1 (lb)
Whole House System Effect
Factor Loading in X-Direction
PSW Method w/ Sugiyama Equation 42,434 1.70
PSW Method w/ 2006 IBC w/o seismic design limitations 33,639 2.15
PSW Method w/ 2006 IBC Seismic Design Provisions 16,594
72,200
4.35 1Test specimen was not taken to failure The three-story Japanese 2x4 Association test house achieved greater tested strengths than the strength attributed to it through the various PSW design methods, with the system factor ranging between 1.7 and 4.3. The predicted strength reduced substantially when the more stringent requirements for seismic design were taken into account. This reduction in seismic design capacity was the result of the large number of full height sheathed wall segments with aspect ratios greater than 2:1.

Evaluation of Full-Scale House Testing Under Lateral Loading
NAHB Research Center January 2009 47
Report 7: Effect of Transverse Walls and Vertical Load on the Performance of Shear Walls (Forintek/Tongji) General Construction
The Forintek Canada Corp., in collaboration with researchers at Tongji University in China, investigated the effects of perpendicular walls and corner framing on the response of shear walls under cyclic loading. Single 20-foot long shear walls with 4-foot long transverse end walls and two sizes of door openings were tested. A total of five tests were performed on five different wall configurations: one without additional vertical dead load, two with an additional dead load of 240 plf along the top of the transverse end walls and two with an additional dead load of 240 plf along the top of the main shear wall. Figure 7 shows a schematic of the five different test configurations and Table 39 provides a summary of the materials and construction methods used. The walls were continuously sheathed with OSB including areas above and below all openings.
Figure 7 - Configurations of shear walls tested during Forintek/Tongji project

Evaluation of Full-Scale House Testing Under Lateral Loading
NAHB Research Center January 2009 48
Table 39 - Building Materials and Construction Methods for Forintek/Tongji Project Component Materials and Construction Wall Framing SPF No. 2 2x4 nominal studs at 16 inches on center
Exterior Wall Sheathing/Bracing
3/8-inch OSB nailed at 6 inches around the perimeter and 12 inches in the field (twisted nails, 2.5-inches long x 0.129-inch diameter)
Interior Sheathing (walls)
None
Wall Anchorage/Hold-downs
1/2-inch anchor bolts at 16 inches on center, two at the ends of each wall segment, corner framing installed, no hold-downs
Exterior Finishes/Fenestration
None
Test Methods/Protocol
Cyclic load was applied using a hydraulic jack and a spreader beam attached to the top plate of the wall at a rate of 0.8 inch/sec. The walls were tested to failure and the ultimate shear load was measured using a load cell placed between the jack and the spreader beam. Analysis
Because the Forintek/Tongji testing was done on isolated shear walls and corner framing, not an entire structure, it does not lend itself to an evaluation of a whole-house system effect factor. Instead, a partial restraint factor for Method 3 (PC2 to RB148) is evaluated. Because the purpose of this analysis is to arrive at a partial restraint factor, the wall strength used in Method 3 is not reduced to account for any partial restraint. Tables 40 and 41 provide summaries of the analysis of the predicted shear strength for the walls using Method 1 (Sugiyama’s PSW) and Method 3 (PC2 to RB148), as well as the corresponding partial restraint factors where appropriate. None of the more stringent seismic design requirements on aspect ratios were applicable for these wall configurations, i.e., all qualifying shear walls had aspect ratios of less than 2:1. The following design assumptions were used in the analysis:
1. Peak shear strength of the shear walls during testing was used for comparison.
2. All walls were designed as Perforated Shear Walls fully restrained at the ends even though hold-down brackets were not installed. It was assumed that dead load and corner framing were sufficient to resist uplift.
3. Walls E and F were loaded with an additional vertical uniform dead load of 240 plf and therefore were assumed to support one floor and the roof for the purposes of design using the RB148 method. All other tested walls had either no additional vertical load applied, or had vertical load applied to the transverse end walls only, but were still assumed to support only a roof to allow for design using the RB148 method.

Evaluation of Full-Scale House Testing Under Lateral Loading
NAHB Research Center January 2009 49
4. Per Table 4.3A in the AF&PA Special Design Provisions for Wind and Seismic – 2005 Edition, the nominal unit shear capacity for 3/8-inch OSB sheathing attached to SPF lumber with 8d galvanized box nails at 6 inches on center on the panel perimeter is 671 plf. Although the report does not specify whether the nails were galvanized, this value is used to avoid overestimating the system factor. In addition, although the nails were not galvanized, they had a deformed shank.

Evaluation of Full-Scale House Testing Under Lateral Loading
NAHB Research Center January 2009 50
Table 40 - Predicted shear strengths of Forintek shear wall tests using Method 1 (Sugiyama’s PSW)
Wall Label Sheathing Total Wall Length (ft)
Wall Height
(ft)
Applied Gravity Load (plf) / Location
Total Length of Full Height Sheathed
Segments (ft)
Cop1
Nominal Unit Shear Capacity
(plf)
Fwall (lb)
Measured Strength
(lb)
Partial Restraint Factor2
B OSB (6/12 nailing) 20 0 8 0.20 671 2,749 4,105 1.0 C OSB (6/12 nailing) 20 240 / Wing Walls 8 0.20 671 2,749 4,480 1.0 D OSB (6/12 nailing) 20 240 / Main Wall 8 0.20 671 2,749 5,560 1.0 E OSB (6/12 nailing) 20 240 / Wing Walls 16 0.61 671 8,149 8,520 1.0 F OSB (6/12 nailing) 20
8
240 / Main Wall 16 0.61 671 8,149 10,690 1.0 1Adjustment factor calculated using Sugiyama equation, Cop = r / (3-2r) 2Cannot be greater than 1.0
Table 41 - Predicted Shear Strengths of Forintek Shear Wall Tests Using Method 3 (PC1 RB148)
Wall Label Sheathing Applied Gravity
Load (plf) / Location
Total Length of Qualifying PSW Segments (ft)
Nominal Unit Shear Capacity (plf) Fwall (lb)
Measured Strength
(lb)
Partial Restraint Factor1
B OSB (6/12 nailing) 0 8 671 5,368 4,105 0.76 C OSB (6/12 nailing) 240 / Wing Walls 8 671 5,368 4,480 0.83 D OSB (6/12 nailing) 240 / Main Wall 8 671 5,368 5,560 1.0 E OSB (6/12 nailing) 240 / Wing Walls 16 671 10,736 8,520 0.79 F OSB (6/12 nailing) 240 / Main Wall 16 671 10,736 10,690 1.0
1Cannot be greater than 1.0

Evaluation of Full-Scale House Testing Under Lateral Loading
NAHB Research Center January 2009 51
Results
Table 42 provides a summary comparison between the predicted strength of the tested shear wall configurations using design Methods 1 and 3 and the ultimate tested shear strength of the walls, as well as the corresponding partial restraint factor.
Table 42 - Comparison of Predicted to Tested Strengths in Forintek/Tongji Shear Wall Project
Design Methodology Predicted Ultimate Shear Strength of
Shear Wall (lb)
Ultimate Measured Strength of Shear
Wall (lb)
Partial Restraint
Factor Wall B
PSW Method w/ Sugiyama Equation 2,749 1.0
RB148 Method 5,368 4,105
0.76
Wall C PSW Method w/ Sugiyama
Equation 2,749 1.0
RB148 Method 5,368 4,480
0.83
Wall D PSW Method w/ Sugiyama
Equation 2,749 1.0
RB148 Method 5,368 5,560
1.0
Wall E PSW Method w/ Sugiyama
Equation 8,149 1.0
RB148 Method 10,736 8,520
0.79
Wall F PSW Method w/ Sugiyama
Equation 8,149 1.0
RB148 Method 10,736 10,690
1.0
The analysis indicates that the perforated shear wall design method consistently under-predicts the capacity of the walls restrained against uplift with corners and gravity load. Therefore, hold-down brackets may not be required for wall configurations that include corner framing. Because uplift forces increase with the wall’s capacity (i.e., increased nailing schedule), additional testing would be beneficial to establish an upper bound shear strength limit on the use of corners in lieu of hold-downs in perforated shear walls. The analysis of the RB148 methodology supports the selection of the partial restraint factors ranging between 0.8 for single story construction (minimum gravity load) and 1.0 for three-story construction (maximum gravity load). Although the partial restraint factor of 0.76 for Wall B was slightly below the 0.8 value used in RB148, the specimen did not have any dead load from the roof either along the wing walls or along the primary wall line as it would be present in a finished house.

Evaluation of Full-Scale House Testing Under Lateral Loading
NAHB Research Center January 2009 52
Summary and Conclusions
A total of six full-size whole house tests and one shear wall with end walls test were analyzed to compare the structure’s ultimate tested shear strength with the shear strength predicted by applicable engineering design methods. The design methods were selected based on the structure’s detailing and the testing protocol. One or more of following methods was used for each structure, as applicable:
Method 1: Perforated Shear Wall Method (Sugiyama) without building code limitations
Method 2: Perforated Shear Wall Method (2006 International Building Code) Method 3: Wind Bracing Design Method used for Public Comment 1 to RB148 (ICC
2007/2008 Code Development Cycle, 2008 Final Action Agenda, International Residential Code)
Method 4: Segmented Shear Wall Method (2006 International Building Code) with or without code limitations
Structures were analyzed both with and without the penalty of the applicable building code limitations on the aspect ratios and combination of materials to investigate a range of scenarios for system effects. Table 43 provides a matrix of all analyses conducted and the corresponding system factors. The following observations were made based the results of the analysis:
1. Analysis of the results for the whole-house tests supports this study’s hypothesis of significant system effects in residential light-frame wood structures.
2. The magnitude of the system factors depends on the engineering method, applicable code limitations, and the presence of finish materials.
3. The current limitations on aspect ratios and combination of materials may be overly restrictive for typical house configurations.
4. For buildings that had finishes installed (at least on the interior), the system effect ranges between 1.5 and 4.3 depending on the engineering model selected. Overall, structures with finishes had a greater system effect factor than structures without finishes.
5. For buildings that had finishes installed (at least on the interior), the system factor for design methods that included all applicable building code limitations ranged between 1.8 and 4.3.
6. For two structures without any finishes (wood framing and structural sheathing only), the system factor for design methods that included all applicable building code limitations ranged between 1.39 and 1.67. Without the code limitations, the system factor for the NEESWood house had the lowest value of 1.08. However, the structure was not tested to its capacity and was likely to have a reserved strength. After finishes were installed and a higher level ground motion was applied, the system factor increased to 1.80.

Evaluation of Full-Scale House Testing Under Lateral Loading
NAHB Research Center January 2009 53
7. The RB148 method, only used for evaluation of non-dynamic tests, resulted in a system factor ranging between 1.5 and 2.9, supporting the value used to develop the 2009 IRC wind wall bracing provisions.
8. The use of corners as anchorage for the perforated shear wall method in lieu of hold-down brackets did not appear to have an adverse effect on the overall ultimate shear strength of the house. This conclusion applies to all the reviewed tests including those that applied tri-axial loading.
9. There was no apparent direct correlation between the number of stories in the test specimens and the calculated system effect factor.

Evaluation of Full-Scale House Testing Under Lateral Loading
NAHB Research Center January 2009 54
Table 43 - Summary of Results: System Effect Factor and Partial Restraint Factor
# Title Test Protocol Finishes
PSW (Sugiyama)
w/o any code limitations)
PSW w/o seismic
limitations
PSW w/ seismic
limitations
Segmented w/o any code
limitations
Segmented w/o seismic limitations
Segmented w/ seismic limitations
PC2 RB148
System Factor
1 Whole Structure Testing and Analysis of a Light-Frame Wood Building (CSIRO)
Cyclic (static)
Interior gypsum 1.54 1.91 2.19 n/a n/a n/a 1.47 - 1.67
Bare Frame 1.67 1.67 1.67 n/a n/a n/a n/a 2
Shake Table Tests of a Two-Story Wood-frame House (CUREE Wood-frame Project)
Shake table (dynamic) Fully Finished
w Stucco n/a n/a n/a 1.72 1.80 2.25 n/a
3 Full-Sized House Cyclic Racking Test (BRANZ)
Cyclic (static) Fully Finished n/a n/a n/a 1.76 1.76 2.31 2.89
Bare Frame n/a n/a n/a 1.08 1.31 1.38 n/a 4
Seismic Testing of Full-Scale Two-Story Light-Frame Wood Building (NEESWood)
Shake table (dynamic) Fully Finished
w Stucco n/a n/a n/a 1.80 2.18 2.55 n/a
5 Assessment of Seismic Resistance of Conventional Wood-Frame Houses (Forintek Collaboration)
Shake table (dynamic)
Interior Gypsum 1.70 1.92 2.31 n/a n/a n/a n/a
6
Full-Scale Shaking Table Tests of 3-Story Wood-Frame Construction Buildings (Japan 2x4 Home Builders Association, et. al)
Shake table (dynamic)
Interior and Exterior Finishes
1.70 2.15 4.35 n/a n/a n/a n/a
Partial Restraint Factor
7 Effect of Transverse Walls and Vertical Load on the Performance of Shear Walls (Forintek/Tongji)
Cyclic (static) None 1.0 n/a n/a n/a n/a n/a 0.76 - 1.0

Evaluation of Full-Scale House Testing Under Lateral Loading
NAHB Research Center January 2009 55
APPENDIX A – Summary of Full-Scale Tests
# Title Author Year Country Loading Type Design/Code Compliance Exterior Bracing Interior Finish Exterior Finish Ultimate Tested Strength
1 Full Scale Test on a Two-Story House Subjected to Lateral Load
Yokel, Somes 1973 USA Monotonic w/ hydraulic jacks at (4) locations and (2) levels (levels tested separately)
2 story house, 26 'x 47' footprint; 2x4 @ 16" oc, exterior walls and interior partitions
Single 1x4 let in brace @ 45 degrees at each corner of house; 1/2" gyp board installed per ASTM C79
3/8" gypsum wall board installed per ASTM C36
Asbestos and beveled wood siding
Not to failure; drift of lower level LFT wall @ 25 psf (≈7050 lb) = 0.025"; Drift of lower level RT wall @ 25 psf (≈7050 lb) = 0.04"; Diagonal compression of brace @ 5k load = 0.002"; Total 2nd floor level displacement @ 5k load = 0.0175"
2 Testing of a Full-Scale House under Simulated Snow loads and Wind loads
Tuomi, McCutcheon
1974 USA Cyclic at top plates 1 story house, 16' x 24' footprint; 8' tall, Doug Fir 2x4 studs @ 16" oc
3/8" plywood (vertical) nailed w/ 6d nails @ 6" and 12" oc
1/2" gypsum wall board nailed w/ 1.25" nails @ 8" oc
1/2" x 6" Western Red cedar siding w/ 1" lap and 7d nails
Plywood only - 1480 lbs @ 0.1"; Drywall and siding - 1770 lb @ 0.1"; Side walls added - 2220 lb @ 0.1"; Roof trusses added - 2760 lb @ 0.1"
3 Simulated Wind Tests on a House
Boughton, Reardon
1982 Australia Monotonic w/ hydraulic jacks at (4) locations and (3) levels (levels tested separately); uplift loading was also conducted
Built to 1940 U.S. Air Force Specs, not typical construction; 3"x3" studs supporting roof trusses, spaced @ 10' oc. Windows between studs
Diagonal let-in bracing nailed to studs
Plywood sheathing primarily
1.25" x 10" horizontal boards nailed directly to studs
Unknown
4 Structural Development and Evaluation of a Modular Home
Hurst 1983 USA Monotonic w/ air bag and simultaneous uplift on roof (29% less than wall pressure)
1 story house, 12' x 44' footprint; 1x4 S. Pine #2 studs @ 16 oc
3/8" plywood, glued/stapled
1/2" gypsum wall board glue-nailed
None Not loaded to failure; @ 26 psf load, exterior walls saw 0.34" deflection (≈1250 lbs) and 0.63" deflection (≈1840 lbs)
5 Simulated Cyclone Wind Tests on a Timber Frame House
Boughton, Reardon
1984 Australia Cyclic w/ hydraulic jacks, uplift on roof and lateral at top plate; 3 stages: 8000 cycles at 5/8 design load, 2000 cycles at 3/4 design load and 200 cycles at design load, lateral loads only applied on every 10th cycle; Total load applied to house at end was 204 kN (4.75x design load)
Built to 1983 North Queensland Home Building Code, 1 story house on columns, 7m x 13m footprint; 70mm x 45mm exterior wall framing, 70mm x 35mm interior wall framing, roof trusses w/ metal roof sheathing
Unknown Gypsum plaster board
Fiber cement sheathing
Racking tests all done to 204 kN total load: 1) Roof sheathing removed - no failure; 2) Roof sheathing replaced, plaster cornice removed - no failure, but higher displacements; 3) 50% of external sheathing damaged by debris - failure
6 Performance of a Steel Framed Kit House Tested for 63 m/s Cyclonic Winds
Reardon, Boughton
1985 Australia Cyclic w/ hydraulic jacks, uplift on roof and lateral at top plate; 3 stages: 8000 cycles at 5/8 design load, 2000 cycles at 3/4 design load and 200 cycles at design load, lateral loads only applied on every 10th cycle; Total load applied to house at end was
Built to Logan manufacturer specifications, 1 story house, 14m x 7m footprint; 70mm x 1.15 mm thick steel studs, panelized construction
Fiber cement board, glued
Fiber cement board, glued
Unknown Ultimate racking load not determined, failed in uplift: final load of 6.92 kPa laterally w/ "very high" stiffness
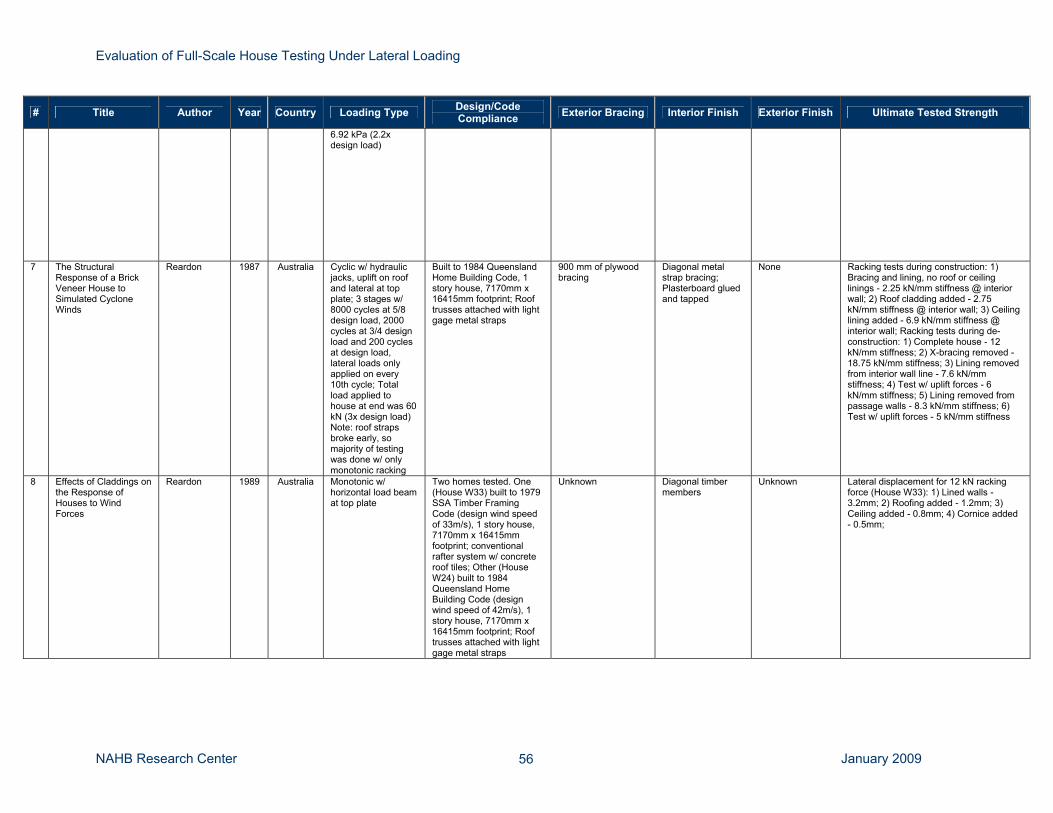
Evaluation of Full-Scale House Testing Under Lateral Loading
NAHB Research Center January 2009 56
# Title Author Year Country Loading Type Design/Code Compliance Exterior Bracing Interior Finish Exterior Finish Ultimate Tested Strength
6.92 kPa (2.2x design load)
7 The Structural Response of a Brick Veneer House to Simulated Cyclone Winds
Reardon 1987 Australia Cyclic w/ hydraulic jacks, uplift on roof and lateral at top plate; 3 stages w/ 8000 cycles at 5/8 design load, 2000 cycles at 3/4 design load and 200 cycles at design load, lateral loads only applied on every 10th cycle; Total load applied to house at end was 60 kN (3x design load) Note: roof straps broke early, so majority of testing was done w/ only monotonic racking
Built to 1984 Queensland Home Building Code, 1 story house, 7170mm x 16415mm footprint; Roof trusses attached with light gage metal straps
900 mm of plywood bracing
Diagonal metal strap bracing; Plasterboard glued and tapped
None Racking tests during construction: 1) Bracing and lining, no roof or ceiling linings - 2.25 kN/mm stiffness @ interior wall; 2) Roof cladding added - 2.75 kN/mm stiffness @ interior wall; 3) Ceiling lining added - 6.9 kN/mm stiffness @ interior wall; Racking tests during de-construction: 1) Complete house - 12 kN/mm stiffness; 2) X-bracing removed - 18.75 kN/mm stiffness; 3) Lining removed from interior wall line - 7.6 kN/mm stiffness; 4) Test w/ uplift forces - 6 kN/mm stiffness; 5) Lining removed from passage walls - 8.3 kN/mm stiffness; 6) Test w/ uplift forces - 5 kN/mm stiffness
8 Effects of Claddings on the Response of Houses to Wind Forces
Reardon 1989 Australia Monotonic w/ horizontal load beam at top plate
Two homes tested. One (House W33) built to 1979 SSA Timber Framing Code (design wind speed of 33m/s), 1 story house, 7170mm x 16415mm footprint; conventional rafter system w/ concrete roof tiles; Other (House W24) built to 1984 Queensland Home Building Code (design wind speed of 42m/s), 1 story house, 7170mm x 16415mm footprint; Roof trusses attached with light gage metal straps
Unknown Diagonal timber members
Unknown Lateral displacement for 12 kN racking force (House W33): 1) Lined walls - 3.2mm; 2) Roofing added - 1.2mm; 3) Ceiling added - 0.8mm; 4) Cornice added - 0.5mm;
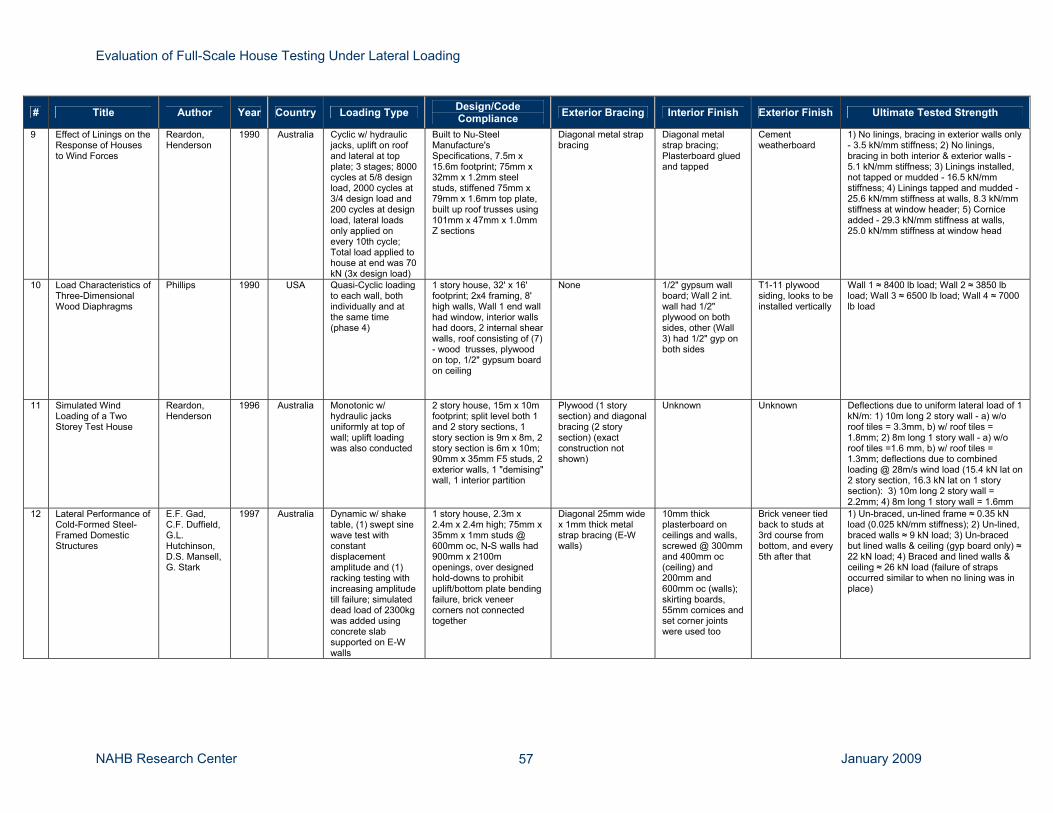
Evaluation of Full-Scale House Testing Under Lateral Loading
NAHB Research Center January 2009 57
# Title Author Year Country Loading Type Design/Code Compliance Exterior Bracing Interior Finish Exterior Finish Ultimate Tested Strength
9 Effect of Linings on the Response of Houses to Wind Forces
Reardon, Henderson
1990 Australia Cyclic w/ hydraulic jacks, uplift on roof and lateral at top plate; 3 stages; 8000 cycles at 5/8 design load, 2000 cycles at 3/4 design load and 200 cycles at design load, lateral loads only applied on every 10th cycle; Total load applied to house at end was 70 kN (3x design load)
Built to Nu-Steel Manufacture's Specifications, 7.5m x 15.6m footprint; 75mm x 32mm x 1.2mm steel studs, stiffened 75mm x 79mm x 1.6mm top plate, built up roof trusses using 101mm x 47mm x 1.0mm Z sections
Diagonal metal strap bracing
Diagonal metal strap bracing; Plasterboard glued and tapped
Cement weatherboard
1) No linings, bracing in exterior walls only - 3.5 kN/mm stiffness; 2) No linings, bracing in both interior & exterior walls - 5.1 kN/mm stiffness; 3) Linings installed, not tapped or mudded - 16.5 kN/mm stiffness; 4) Linings tapped and mudded - 25.6 kN/mm stiffness at walls, 8.3 kN/mm stiffness at window header; 5) Cornice added - 29.3 kN/mm stiffness at walls, 25.0 kN/mm stiffness at window head
10 Load Characteristics of Three-Dimensional Wood Diaphragms
Phillips 1990 USA Quasi-Cyclic loading to each wall, both individually and at the same time (phase 4)
1 story house, 32' x 16' footprint; 2x4 framing, 8' high walls, Wall 1 end wall had window, interior walls had doors, 2 internal shear walls, roof consisting of (7) - wood trusses, plywood on top, 1/2" gypsum board on ceiling
None 1/2" gypsum wall board; Wall 2 int. wall had 1/2" plywood on both sides, other (Wall 3) had 1/2" gyp on both sides
T1-11 plywood siding, looks to be installed vertically
Wall 1 ≈ 8400 lb load; Wall 2 ≈ 3850 lb load; Wall 3 ≈ 6500 lb load; Wall 4 ≈ 7000 lb load
11 Simulated Wind Loading of a Two Storey Test House
Reardon, Henderson
1996 Australia Monotonic w/ hydraulic jacks uniformly at top of wall; uplift loading was also conducted
2 story house, 15m x 10m footprint; split level both 1 and 2 story sections, 1 story section is 9m x 8m, 2 story section is 6m x 10m; 90mm x 35mm F5 studs, 2 exterior walls, 1 "demising" wall, 1 interior partition
Plywood (1 story section) and diagonal bracing (2 story section) (exact construction not shown)
Unknown Unknown Deflections due to uniform lateral load of 1 kN/m: 1) 10m long 2 story wall - a) w/o roof tiles = 3.3mm, b) w/ roof tiles = 1.8mm; 2) 8m long 1 story wall - a) w/o roof tiles =1.6 mm, b) w/ roof tiles = 1.3mm; deflections due to combined loading @ 28m/s wind load (15.4 kN lat on 2 story section, 16.3 kN lat on 1 story section): 3) 10m long 2 story wall = 2.2mm; 4) 8m long 1 story wall = 1.6mm
12 Lateral Performance of Cold-Formed Steel-Framed Domestic Structures
E.F. Gad, C.F. Duffield, G.L. Hutchinson, D.S. Mansell, G. Stark
1997 Australia Dynamic w/ shake table, (1) swept sine wave test with constant displacement amplitude and (1) racking testing with increasing amplitude till failure; simulated dead load of 2300kg was added using concrete slab supported on E-W walls
1 story house, 2.3m x 2.4m x 2.4m high; 75mm x 35mm x 1mm studs @ 600mm oc, N-S walls had 900mm x 2100m openings, over designed hold-downs to prohibit uplift/bottom plate bending failure, brick veneer corners not connected together
Diagonal 25mm wide x 1mm thick metal strap bracing (E-W walls)
10mm thick plasterboard on ceilings and walls, screwed @ 300mm and 400mm oc (ceiling) and 200mm and 600mm oc (walls); skirting boards, 55mm cornices and set corner joints were used too
Brick veneer tied back to studs at 3rd course from bottom, and every 5th after that
1) Un-braced, un-lined frame ≈ 0.35 kN load (0.025 kN/mm stiffness); 2) Un-lined, braced walls ≈ 9 kN load; 3) Un-braced but lined walls & ceiling (gyp board only) ≈ 22 kN load; 4) Braced and lined walls & ceiling ≈ 26 kN load (failure of straps occurred similar to when no lining was in place)

Evaluation of Full-Scale House Testing Under Lateral Loading
NAHB Research Center January 2009 58
# Title Author Year Country Loading Type Design/Code Compliance Exterior Bracing Interior Finish Exterior Finish Ultimate Tested Strength
13 Whole Structure Testing and Analysis of a Light-framed Wood Building - Phase 3 Destructive Testing
Paevere, Foliente, Macindoe, Banks, Kasal, Collins
2000 Australia Static-Cyclic loading at top plate level, (2) out of (4) shear walls loaded
1 story house, L shaped, 9.5m x 11.1m footprint; 90mm x 35mm SYP studs @ 400mm oc, 3 out of 4 shear walls had large openings, roof trusses @ 600mm oc, no blocking, sheathed
9.5mm plywood nailed w/ 50mm x 2.87mm nails @ 150mm and 300mm oc
13mm gypsum wall board screwed w/ self drilling screws @ 300mm oc
None Wall 3 - 33 kN; Wall 4 - 50 kN; Wall 1 -12 kN; Wall 2 - 30 kN
14 Shake Table Tests of a Two-Story Wood-Frame House
Fischer, Filiatrault, Folz, Uang, Seible
2001 USA Dynamic tri-axial w/ shake table, ordinary ground motions of Design Basis Earthquake (DBE) (Northridge 1994) and near-field ground motions of Max Credible Earthquake (MCE) (Northridge 1994); weights added to maintain constant seismic weight during different phases of testing
Built to 1994 UBC, 2 story house 20' x 16' footprint; 2x4 framing @ 16" oc; Note - various engineered straps and hold downs present for testing of interior finishes
3/8" OSB nailed w/ 8d box nails @ 6" and 6" oc.
1/2" gypsum wall board, horizontal, screwed w/ #6 screws @ 16" oc (walls) and @ 12" oc (ceilings), taped and mudded
7/8" plaster stucco
Phase 9 (interior finishes and stucco) ≈29k @ 4.25" displacement
15 Full-Scale Shaking Table Studies of Wood-Frame Residential Construction (Earthquake 99 Wood-frame House Project)
Ventura, Taylor, Prion, Kaharrazi, Pryor
2001 USA Dynamic uni-axial w/ shake table (Northridge 1994)
2 story house, 20' x 25' footprint
OSB panel wall system; Horizontal board sheathing (test 13)
Gypsum wall board Plaster stucco 1) Horizontal board sheathing, no hold-downs, stucco or blocking (Test 13) - 80 kN @ 125mm; 2) Hold-downs, no stucco (Test 14) - 70 kN @ 45mm; 3) Hold-downs and stucco (Test 10) - 55 kN @ 10mm
16 Seismic Evaluation of an Asymmetric Three-Story Wood-Frame Building
Mosalam, Machado, Gliniorz, Naito, Kunkel, Mahin
2002 USA Dynamic tri-axial w/ shake table, ordinary ground motions of Design Basis Earthquake (DBE) (Northridge 1994) and near-field ground motions of Max Credible Earthquake (MCE) (Northridge 1994, max accel of 0.5g); weight of building = 70.93k
Built to 1964 UBC w/ 1997 UBC checks, 3 story house w/ car ports underneath, 32' x 16' footprint; 2x4 framing @ 16" oc;
3/8" plywood nailed w/ 8d nails @ 6", 5" and 4" in various places
5/8" gypsum wall board nailed w/ 6d cooler nails @ 6" oc
7/8" plaster stucco over 18 gauge metal lath
Phase I (no finishes): 1) East wall: story 3 - 9.67k, story 2 - 20.31k, story 1 - 25.86k; 2) West wall: story 3 - 17.39k, story 2 - 19.06k, story 1 - 22.2k: Phase III (w/ finishes): 3) East wall: story 3 - 11.76k, story 2 - 27.25k, story 1 - 43.61k; 4) West wall: story 3 - 18.01k, story 2 - 30.67k, story 1 - 39.69k;

Evaluation of Full-Scale House Testing Under Lateral Loading
NAHB Research Center January 2009 59
# Title Author Year Country Loading Type Design/Code Compliance Exterior Bracing Interior Finish Exterior Finish Ultimate Tested Strength
17 Full-Sized House Cyclic Racking Test - No. 119
Thurston 2003 New Zealand
Cyclic w/ hydraulic jacks at (4) locations, timber loading beams took load directly into walls via plywood above ceiling
1 story house, 19.7' x 41' footprint, 2.4m high; 90mm x 45mm exterior studs, 65mm x 45mm interior studs, all at 600mm oc, plates nailed to floor with 1-nail @ 600mm oc
None Wall 1 (w/ windows) - 10mm gypsum board screwed @ 300mm oc (perimeter only), section between windows - bracing grade gypsum wall board (1630mm long) nailed @ 150mm & 300mm; Wall 2 - 10mm gypsum wall board nailed @ 300mm oc (side 1) and bracing grade gypsum wall board nailed @ 150mm & 300mm (side 2); Wall 3 - 10mm gypsum wall board nailed @ 300mm oc; Wall 4 - 10mm gypsum wall board nailed @ 300mm oc (side 1) and screwed at 150mm & 300mm (side 2); Wall 5 - 10mm gypsum wall board screwed @ 300mm oc (perimeter only); 10mm gypsum wall board screwed at 150mm & 300mm oc.
Fiber cement planks 300mm x 6mm
Peak resistance of house ≈ 122 kN total
18 Lateral Load Testing and Analysis of Manufactured Homes
Koerner, Schmidt, Goodman, Richins
2004 USA Monotonic lateral w/ airbag
Gypsum interior, siding exterior
Gypsum wall board both sides
Exterior siding Only to 30 psf --> gives strains at that loading
19 Experimental and Analytical Deformations of the Wood-Framed Building under Lateral Load
Malesza, Miedzialowski
2004 Poland Monotonic w/ loading beam in tension (assumed to be attached to floor diaphragm)
2.74m tall, Polish Fir 45mm x 135mm stud @ 600mm
12mm thick chip board inside nailed w/ N2.6/60mm nails @ 100mm oc (perimeter only)
None 12.5mm special gypsum outside, staples K1.6/50mm @ 80mm oc around perimeter of Fermacel board.
≈ 12 kN @ 0.18mm

Evaluation of Full-Scale House Testing Under Lateral Loading
NAHB Research Center January 2009 60
# Title Author Year Country Loading Type Design/Code Compliance Exterior Bracing Interior Finish Exterior Finish Ultimate Tested Strength
20 A preliminary Report on the Effect of Various Boundary Conditions on the Performance of the 2006 IRC Method 3 Braced Wall Panel
Dolan and Pryor
2005 USA Monotonic w/ steel rod in tension (attached to roof/floor diaphragm, pick point in center)
Built to IRC 2006, Method 3 Wall Bracing; 1 story box, 20' x 20' footprint; 2x4 @ 16 oc, 2x10 roof/floor joist w/ 7/16" OSB nailed w/ 8d common nails @ 6" and 12"
(1) single 4x8 OSB sheathing, assuming nailed at 6" and 12", not other exterior brace along wall
None None 1) Load Parallel to roof/floor joists - 4100 lb; 2) Load Perpendicular to roof/floor joists - 3175 lb
21 APA Full-Scale House Test Project - 3-D testing with 4:1 aspect ratio wall bracing
2006 USA Monotonic in tension at top plates
1 story structure, 25' x 37.5' footprint, 8' tall; SPF 2x4 framing @ 24"oc
7/16" OSB nailed w/ 8d cooler nails @ 6" and 12" oc
None None 1) (3) 48" panels, corner returns - 5000 lb; 2) (3) 48" panels, no returns - 4500 lb; 3) (6) 24" panels & openings, continuous band of sheathing above and below openings, no return - 8000 lb; 4) (6) 24" panels & openings, hold downs @ corners of house - 8700 lb
22 Assessment of Seismic Resistance of Conventional Wood-frame Houses
NI, Rainer, Chen, Tongji, Karacebeyli, Follesa
2006 China Dynamic uni-axial w/ shake table (up to 0.50g); 50% of live load added @ roof and floor level
Built to 1995 National Building Code of Canada, 2 story house, 6m x 6m footprint, 8' tall; SPF 38mm x 89mm framing @ 16" oc, 1 interior partition wall
3/8" OSB nailed w/ 3.2mm x 65mm twisted nails @ 150mm and 300mm oc
1/2" gypsum wall board screwed w/ 3.2mm x 28mm screws @ 200mm oc
Unknown 1) 1.2m door in direction of load - 68.76 kN; 2) 2.4m door in direction of load - 78.57 kN; 3) 3.6m door direction of load - 107.2 kN; 4) (2) 1.2m windows in direction of load - 101.3 kN
23 Dynamic Tests of Traditional Wooden House in Kyoto Using Large-scale Shaking Table
Suda, Susuki, Shimizu, Ogasawara
2006 Japan Dynamic uni-axial w/ shake table (ground motion records from Hyogoken-Nanbu earthquake (1995), max accel of 400 cm/s2)
Kyo-machiya type, 2 story, 6m x 11.8m footprint, 8.5m tall; 110mm x 110mm column frames
Mud walls (bamboo lath & mud); then reinforced with ladder frames and additional wall inserts where none existed
Mud walls (bamboo lath & mud)
Unknown 1) Un-reinforced house = 1/34 rad @ 200 cm/s2; 2) Reinforced house = 1/47 rad @ 200 cm/s2
24 A study of Collapsing Process of Wood Conventional Houses - Shaking Table Tests of Real-size Models
Mikio, Yasuhiro, Hiroshi, Isao
2006 Japan Dynamic uni-axial and tri-axial w/ shake table (ground motion records from JR-TAKATORI wave (1995))
Built to Japanese 1960 code, 2 story, 3.64m x 5.45m footprint; 120mm x 120mm and 105mm x 105mm column frames, no metal connectors at top and bottom of columns
Wooden strap bracing, 27mm x 105mm
Gypsum sheathing attached to columns
Unknown House with gypsum sheathing was 155% stronger then house w/o gypsum sheathing
25 A Collapsing Response Analysis of Existing Wood House Subjected to Seismic Motion
Tatsuya, Chikahiro, et al
2006 Japan Dynamic uni-axial w/ shake table (ground motion records from JR-TAKATORI wave, 1995)
Built to Japanese 1979 code, 105mm x 105mm columns, (2) N90 nails at bottom of columns, tendon joints at tops, only "L" corner section of 1st fl tested, two other walls made of plywood, lumber and steel bracing to isolate failure
Wooden strap bracing, 25mm x 105mm
Gypsum Sheathing (12.5mm) or Plywood (5.5mm)?
Mortaring w/ wood lath
Unknown

Evaluation of Full-Scale House Testing Under Lateral Loading
NAHB Research Center January 2009 61
# Title Author Year Country Loading Type Design/Code Compliance Exterior Bracing Interior Finish Exterior Finish Ultimate Tested Strength
26 Estimating Seismic Performance of Timber Structures with Plywood-sheathed Walls by Pseudo-dynamic Tests and Time-history Earthquake Response Analysis
Yasumura, Richard, Davenne, Uesugi
2006 Japan Dynamic uni-axial w/ shake table (ground motion records from El Centro (1940) max 0.4g); loaded only at one corner, eccentric
Typical Japanese construction one room box, 3m x3m x 3m footprint; 105mm x 105mm columns @ 1000mm oc, w/ (2) hold-downs @ bottom, (1) hold-down @ top; rigid (R) diaphragm w/ blocking & perimeter nailing, flexible (S) diaphragm w/o blocking & nailing
7.5mm plywood nailed w/ N50 nails @ 150mm oc
None None Displacement response of wall opposite of loading location (X3) is 2x as large for rigid diaphragm as it is for flexible diaphragm; No noticeable difference in response of wall at loading location (X1) between the diaphragms.
27 Effect of Transverse Walls and Vertical Load on the Performance of Shear Walls without Hold-down
Cheng, Ni, Lu, Karacabeyli
2006 Canada Monotonic w/ flexible (pinned) spreader beam @ 7.5 mm/min; Cyclic w/ flexible (pinned) spreader beam per ISO 16670; Vertical load of 3.5 kN/m
Built to Part 9 of 1995 NBCC; 1 story w/ transverse walls, 6m x 2.4m main wall, 1.2m x 2.4m transverse walls, SPF No. 2 38mm x 89mm studs @ 400mm oc, nailed w/ 89mm x 39mm common nails, (1) baseline full wall, (1) garage door (3.6m x 2.1m), (1) regular door (1.2m x 2.1m)
9.5mm OSB nailed w/ 65mm x 3.3mm common nails @ 150mm & 300mm oc
None None 1) Baseline (monotonic) - 10.7 kN/m; 2) Garage door (monotonic) - 6.9 kN/m; 3) Garage door (monotonic) (side walls loaded vert) - 8.6 kN/m; 4) Garage door (monotonic) (main wall loaded vert) - 10.1 kN/m; 5) Regular door (monotonic) (side walls loaded vert) - 7.8 kN/m; 6) Regular door (monotonic) (main wall loaded vert) - 8.6 kN/m
28 Effect of Upper Storey / Floor on the Performance of Wood Shear Walls
Liu, Ni, Rainer, Wensheng
2006 Canada Monotonic w/ flexible (pinned) and rigid spreader beams @ 7.5 mm/min; Cyclic w/ flexible (pinned) and rigid spreader beams per ISO 16670; Vertical load of 3.5 kN/m on one wall, others had no vertical load other then second story dead weight
Built to Part 9 of 1995 NBCC; 1 & 2 story walls, 6m x 2.4m walls, SPF No. 2 38mm x 89mm studs @ 400mm oc, nailed w/ 89mm x 3.9mm common nails, (1) baseline 1 story w/ flex beam, (1) baseline 1 story w/ rigid beam, (1) 2 story w/ garage door (3.6m x 2.1m) (bottom) and two windows above (no vert load added), (1) 2 story w/ garage door (3.6m x 2.1m) (bottom) and two windows above (vert load added)
9.5mm OSB nailed w/ 65mm x 3.3mm common nails @ 150mm & 300mm oc
None None 1) Baseline (monotonic) w/ flex beam - 6.4 kN/m of full height sheathing; 2) Baseline (monotonic) w/ rigid beam - 8.1 kN/m of full height sheathing; 3) 2 story w/o added vert load (monotonic) - 9.3 kN/m; 4) 2 story w/ added vert load (monotonic) - 12 kN/m

Evaluation of Full-Scale House Testing Under Lateral Loading
NAHB Research Center January 2009 62
# Title Author Year Country Loading Type Design/Code Compliance Exterior Bracing Interior Finish Exterior Finish Ultimate Tested Strength
29 Racking Tests on Rooms and Isolated walls to Investigate Uplift Restraint and Systems Effects
Thurston 2006 New Zealand
Cyclic, directly into ceiling diaphragm (strengthened)
1/2 scale rooms, 3.3m x 2.1m x 1.1m high; 90mm x 45mm stud framing @ 600mm oc, single 620mm x 700mm window walls parallel to load, single 975mm x 680mm door in walls perpendicular to load
9mm MDF board nailed w/ 30mm x 2.5mm couts @ 150mm oc (perimeter only)
10mm gypsum plaster board screwed w/ 32mm x 6g screws @ 150mm oc (perimeter only)
None 1) R1 (int. sheathing only, w/o tape and mud) ≈22.5 kN; 2) R2 (int. sheathing only, taped and mudded) ≈25 kN; 3) R3 (int. & ext. sheathing, BP nailed to foundation) ≈39 kN; 4) R4 (int. & ext. sheathing, BP bolted to foundation) ≈55 kN; 5) R5 (both sides used int. sheathing, corners w/ wing walls, BP nailed to foundation) ≈39 kN; 6) R6 (both sides used int. sheathing, corners w/ wing walls, 3 kN strap at door openings) ≈46 kN; 7) R7 (both sides used int. sheathing, corners w/ wing walls, BP bolted to foundation) ≈39 kN
30 Tests on Partially Anchored Wood-Framed Shear Walls
Girhammar, Kallsner
2006 Sweden Monotonic w/ hydraulic jacks at top plate of wall, constant displacement rate, vertical loads applied to simulate construction above
2400mm and 4800mm long walls, Pine C24 45x120mm studs @ 600mm oc
C40, 8mm thick hardboard nailed w/ 50mm x 2.1mm ring shank nails, pre-drilled holes, @ 100mm and 200 mm oc
None None 1) 3.23 kN vert load @ tension corner, 2400mm long wall - 19.4 kN; 2) 6.46 kN vert load @ tension corner, 2400mm long wall - 21.9 kN; 3) 1.29 kN total vert load (spread uniformly across top), 4800mm long wall - 55.3 kN; 4) 3.23 kN total vert load (spread uniformly across top), 4800mm long wall - 55.5 kN; 5) 6.46 kN total vert load (spread uniformly across top), 4800mm long wall - 58.4 kN;
31 Seismic Testing of a Full Scale Two Story Light-Frame Wood Building: NEESWood Benchmark Test
Christovasilis, Filiatrault, Wanitkorkul
2006 USA Dynamic tri-axial w/ shake table, ordinary ground motions of Design Basis Earthquake (DBE) and near-field ground motions of Max Credible Earthquake (MCE)
Built to 1988 UBC, CUREE index building, 2 story house, 22' x 58'-4" footprint; 2x4 hem-fir framing @ 16" oc
7/16" plywood nailed w/ 8d common nails @ 6", 4" or 3" and 12" oc.
1/2" gypsum wall board (walls and ceilings), horizontal, screwed w/ #6 screws @ 16" oc
7/8" plaster stucco
In long dimension direction: 1) Phase 1 (wood structural elements only) - 18.6k @ 0.32"; 2) Phase 3 (gypsum installed on structural walls) - 21.6k @ 0.30"; 3) Phase 4 (gypsum installed on all walls and ceiling) - 22.8k @ 0.27"; 4) Phase 5 (stucco applied on exterior) - 29.7k @ 0.12"; In short dimension direction: 5) Phase 1 (wood structural elements only) - 41.0k @ 2.50"; 6) Phase 3 (gypsum installed on structural walls) - 35.3k @ 1.39"; 7) Phase 4 (gypsum installed on all walls and ceiling) - 35.8k @ 1.02"; 8) Phase 5 (stucco applied on exterior) - 38.2k @ 0.65";
32 Shear Wall Test Noory, Smith, Asiz
2006 Japan Monotonic w/ loading beam, vertical load of 11.1 kN applied uniformly (ASTM E 564)
12' x 8' walls, Built to recommendations of Canadian Mortgage and Housing Corporation, 38mm x 89mm SPF #2 @ 610mm oc
11.1mm OSB nailed w/ 60mm pneumatic nails @ 150mm and 300mm oc
12.7mm gypsum wall board screwed w/ 40mm screws @ 150mm and 300mm oc
38mm rigid insulation; 85mm x 17mm x 2.4m long wood strips spaced @ 406mm, nailed through insulation to OSB w/ 16d nails; 1x8 clapboard siding nailed w/ 63.5mm nails into wood strips
Ultimate load: 1) Framing and OSB only - 20 kN @ 26mm; 2) Insulation and wood straps added - 21 kN @ 31mm; 3) Clapboard siding added - 23 kN @ 19mm; 4) Interior gypsum added - 23.5 kN @ 13mm

Evaluation of Full-Scale House Testing Under Lateral Loading
NAHB Research Center January 2009 63
# Title Author Year Country Loading Type Design/Code Compliance Exterior Bracing Interior Finish Exterior Finish Ultimate Tested Strength
33 Full Scale Shaking Table Tests of 3-Story Wood-frame Construction Buildings
Okiura, Kawai, Umemori, Murakami, Isoda
2006 Japan Dynamic tri-axial w/ shake table (ground motion records from Kobe earthquake wave, 1995)
Two 3 story houses, 7.28m x 7.28m footprint; 2x4 wood-frame construction, house A w/ only wood framing, house B w/ finish materials including cement slate plates on roof
9mm plywood nailed w/ CN50 nails @ 100mm oc
12.5mm gypsum wall board w/ GNF40 @ 100mm oc (house A and B); 9mm plywood nailed w/ CN50 nails @ 75mm oc (house B)
Ceramic siding boards (house B)
Ultimate base shear: House A - 230 kN; House B - 289 kN; Story Stiffnesses: House A Story 3 - 4.61 kN/mm (x-dir) and 5.79 kN/mm (y-dir); House A Story 2 - 4.61 kN/mm (x-dir) and 5.61 kN/mm (y-dir); House A Story 1 - 6.26 kN/mm (x-dir) and 6.69 kN/mm (y-dir); House B Story 3 - 4.61 kN/mm (x-dir) and 5.79 kN/mm (y-dir); House B Story 2 - 5.95 kN/mm (x-dir) and 5.61 kN/mm (y-dir); House B Story 1 - 7.23 kN/mm (x-dir) and 7.91 kN/mm (y-dir);
34 Shaking Table Tests and Seismic Design Method of Wooden Houses with Eccentricity
Takahiro, Mikio, Katsuhiko, Kenji, Yoshimitsu, Isao
2006 Japan Dynamic uni-axial w/ shake table (ground motion records from JMA Kobe N-S wave, 1995); weights installed below roof, between 7.3 kN and 14.2 kN
Built using conventional Japanese frame construction (columns and plywood), 1 story, 4.55m x 3.64m footprint; 105mm x 105mm columns @ 910mm oc, stiff roof diaphragm using 105mm x 180mm beams at each column, 12mm thick plywood sheathing on top; soft stiffness roof diaphragm using same beams, 45mm x 60mm joists @ 455mm and 180mm wide x 13mm thick plants in dir of loading, nailed w/ (2) nails per plank; various configurations/layouts of exterior walls with openings to create eccentricity, openings either 910mm, 1820mm or 2730mm wide
9mm plywood nailed w/ 45mm x 2.87mm nails @ 200mm oc along columns
None None Stiff Roof: Symmetrical layout (D8) - 14.2 kN and 13.61 kN; One less shear panel on one side (D9) - 6.14 kN and 5.14 kN; Two less shear panels on one side (D10) - 9.53 kN and 5.8 kN; Soft Roof: Symmetrical layout (D8) - 8.17 kN and 8.29 kN; One less shear panel on one side (D9) - 8.17 kN and 6.58 kN; Two less shear panels on one side (D10) - 4.36 kN;

Evaluation of Full-Scale House Testing Under Lateral Loading
NAHB Research Center January 2009 64
# Title Author Year Country Loading Type Design/Code Compliance Exterior Bracing Interior Finish Exterior Finish Ultimate Tested Strength
35 Maximum Wall Bracing Rating that is Compatible with NZS 3604 Construction Phase II - Testing of Room 1
Thurston 2007 New Zealand
Cyclic, directly into ceiling diaphragm @ each wall; vertical floor and roof live load of 0.2 kPa added using weights
Built to NZS 3604:1999, 1 story, 6.49m x 3.29m footprint, 2.42m high; founded on piles (not continuous foundation), 90mm x 45mm stud framing @ 600mm oc, (1) - 1.95m x 0.8m door and (1) - 1.6m x 1.235m window in each wall parallel to load, strapping tied stud to bottom plate at all openings, not to foundation directly though
None 10mm GIB Braceline® by Winstone Wall boards
None Test 2 - max applied load = 46.9 kN (total length of bracing elements 7.48m)
36 Shaking Table Tests of Two-Story Passively-Controlled Wood Frames with Inner and Outer Walls
Matsuda, Sakata, Kasai, Ooki
2008 Japan Dynamic uni-axial w/ shake table (ground acceleration records from Kobe earthquake wave, 1995, max acceleration of 0.83g); weights of 1.44 kN/m2 and 1.67 kN/m2 added
Built using conventional Japanese frame construction (columns and plywood), 2 story frame, 2.73m x 2.73m footprint; 3 column lines x 4 column lines, 105mm x 105mm columns @ 910mm oc, 105mm x 30mm intermediate columns, 105mm x 180mm beams, 28mm thick plywood floor and roof
1m wide wood panel "structural element" w/ 1.96m shear force resistance, located in center column line of frame; Visco-elastic dampening k-braces
12mm gypsum wall board screwed @ 150mm oc on columns and intermediate columns
12mm ceramic siding (only on center bay)
Not taken to failure: 1) Wood panel structural elements w/ gypsum and ceramic siding ≈47 kN @ 35mm; 2) Visco-elastic dampeners w/ gypsum only ≈40 kN @ 20mm; 3) Visco-elestic dampeners w/ gypsum and ceramic siding ≈42 kN @ 15mm
37 Shaking Table Test and Seismic Property Evaluation of Wooden House with Various Types of Shear Walls
Umemori, Tsuzuki, Miyazawa
2008 Japan Dynamic uni-axial and tri-axial w/ shake table (ground acceleration records from Kobe earthquake wave, 1995); weight was added to simulate building materials and live load
Built using conventional Japanese frame construction (columns and plywood), 2 story house, 6.2m x 4.2m footprint; 105mm x 105mm columns @ 910mm oc, 2m x 2.03m openings in centers of walls, 1m x full height openings at ends of long dimension (2 out of 3 configurations reported on here), hold down connectors at all shear wall ends
9.5mm plywood; 11mm OSB SIPs panels
12.5mm gypsum wall board; 9.5mm plywood
None Story Shear Forces: 1) Configuration 1 (plywood and gypsum in short direction, plywood both sides in long direction) - 118.1 kN @ 1/26 rad (long direction) and 117.6 kN @ 1/34 rad (short direction); 2) Configuration 2 (SIPs panels, gypsum and plywood in center short direction wall) - 116.2 kN @ 1/44 rad (long direction) and 185.2 kN @ 1/37 rad (short direction); 3) Configuration 3 (SIPs panels, corners closed i.e., openings towards center) - 117.2 kN @ 1/39 rad (long direction) and 122.2 kN @ 1/41 rad (short direction)

Evaluation of Full-Scale House Testing Under Lateral Loading
NAHB Research Center January 2009 65
# Title Author Year Country Loading Type Design/Code Compliance Exterior Bracing Interior Finish Exterior Finish Ultimate Tested Strength
38 Seismic Performance Verification of Traditional Wooden House Based on Cyclic Loading Tests and Analytical Methods
Nakaji, Yamada, Suda, Suzuki
2008 Japan Cyclic, directly to top of frame at each frame, in short direction
Built using traditional Japanese frame construction (columns and frames) circa 1898, 1 story house with raised copula like middle roof section, 18.5m x 9.55m footprint; 175mm x 175mm columns, 135mm x 330mm beams
None None 75mm mud-plastered hanging walls
Frame X1 (4.6m high, (3) - bays of 1.82m, 1.82m and 3.64m) - 106.6 kN @ 0.09 rad
39 Moment Resistance of Traditional Wooden Structure by Dynamic and Static Tests
Maeno, Suzuki, Saito
2008 Japan Dynamic uni-axial w/ shake table (ground motion records from El Centro (1940) max accel 250 cm/s2); static racking at top of frame; 110 kN weight added on top
Built using traditional Japanese frame construction (columns and frames) circa 1898, 1 story frame, 3.75m x 2.25m footprint; 308mm round columns, 114mm x 181mm beams, notched joints only, columns only set on foundation (no pins)
Frame only None None Bending moment at top of columns: Dynamic loading - 0.9 kN*m @ 1/120 rad; Bending moment at bottom of columns: Dynamic loading - 1.8 kN*m @ 1/120 rad;
40 Pseudo-dynamic Lateral Load Tests on Full-Scale Two Story Wooden Structure with Moment Resisting Frames
Yasumura, Uesugi, Davenne, Suzuki
2008 Japan Dynamic uni-axial w/ hydraulic jacks at each story height (ground motion records from El Centro (1940) max accel 20.5g)
Built to 2000 Japanese building codes, 2 story frame only, 6m x 3m footprint; 120mm x 300mm columns and 120mm x 390mm beams w/ moment connections in loading direction, columns fixed to base of test apparatus, 120mm x 240mm beams in transverse direction, single glue laminated sugi panel at each corner of transverse wall plane, same panels used as flooring
Moment frames using moment connections of (14) 12mm dowels and (12) 12mm bolts; transverse direction - 30mm thick x 1000mm wide glue laminated sugi panels (similar to plywood construction) screwed w/ 69.3mm x 3.85mm screws @ 150mm oc
None None Lateral load from actuator load cells: First floor - 90 kN @ 75mm; Second floor - 70 kN @ 60mm
41 Full-scale Shaking Table Tests of Wood Framed Houses
Ohashi, Watahiki, Machida
2008 Japan Dynamic uni-axial w/ shake table (ground motion records from JMA Kobe N-S wave, 1995); weights to simulate floor live load of 0.6 kN/m2
Built to traditional Japanese construction (columns and frames), 2 story house, 8.19m x 9.1m footprint; 85mm x 300mm columns, 120mm x 330mm beams
Diagonal wood brace; Cross Panel (wood lattice type panel)
12mm gypsum wall board
12mm ceramic siding
Braced home - 315 kN @ 0.034 rad; Cross Panel home - 360 kN @ 0.039 rad
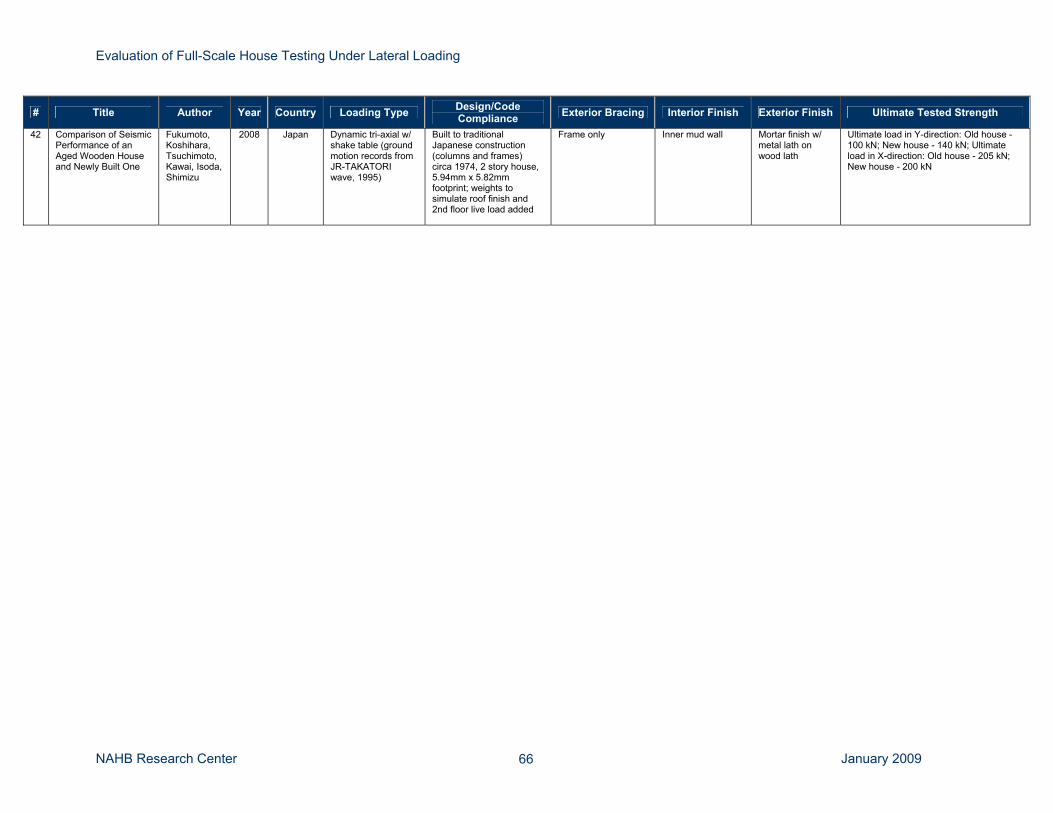
Evaluation of Full-Scale House Testing Under Lateral Loading
NAHB Research Center January 2009 66
# Title Author Year Country Loading Type Design/Code Compliance Exterior Bracing Interior Finish Exterior Finish Ultimate Tested Strength
42 Comparison of Seismic Performance of an Aged Wooden House and Newly Built One
Fukumoto, Koshihara, Tsuchimoto, Kawai, Isoda, Shimizu
2008 Japan Dynamic tri-axial w/ shake table (ground motion records from JR-TAKATORI wave, 1995)
Built to traditional Japanese construction (columns and frames) circa 1974, 2 story house, 5.94mm x 5.82mm footprint; weights to simulate roof finish and 2nd floor live load added
Frame only Inner mud wall Mortar finish w/ metal lath on wood lath
Ultimate load in Y-direction: Old house - 100 kN; New house - 140 kN; Ultimate load in X-direction: Old house - 205 kN; New house - 200 kN

Evaluation of Full-Scale House Testing Under Lateral Loading
NAHB Research Center January 2009 67
APPENDIX B – Example Calculations
Example Calculation: the Sugiyama PSW (Method 1) CSIRO House Test
Nominal unit shear capacities:
FsOSB = 560 plf [Table 4.3A of AF&PA Wind and Seismic Design Provisions – 2005 Edition: 3/8” WSP – Sheathing, 6d, 6/12 nailing, wind]
FsGyp = 100 plf [Based on extrapolation from tabulated values in Table 2305.3.8.2 in 2006 IBC]
Capacities are additive per Section 2305.3.9 of 2006 IBC for wind design: Fs = 560 plf + 100 plf = 660 plf
Fwall = Fs L Cop Where: Fwall = Capacity of perforated shear wall line Fs = Un-adjusted nominal unit shear capacity L = Length of the perforated shear wall
Cop = Opening adjustment factor according to Sugiyama equation
Cop = )23( r
r−
r = )1(
1
i
o
LHAΣ
+
Where: Ao = Total area of the openings H = Height of the wall
ΣLi = Summation of length of full height wall segments Wall W1 (8-foot high, 20.2-foot long wall with one 16.4-foot wide by 6.9-foot high garage door opening in center; sheathed with OSB on exterior, gypsum on interior) No maximum requirement on qualifying aspect ratios
r = )
8.384.169.61(
1
ftftftft
××
+ = 0.213
Cop = ))213.02(3(
213.0×−
= 0.083
Ultimate capacity of the wall:
Fwall = 083.02.20660 ×× ftplf = 1,102 lb

Evaluation of Full-Scale House Testing Under Lateral Loading
NAHB Research Center January 2009 68
Example Calculation: the 2006 IBC PSW (Method 2) with Wind Design Requirements CSIRO House Testing
Nominal unit shear capacities: FsOSB = 560 plf [Table 4.3A of AF&PA Wind and Seismic Design Provisions – 2005 Edition: 3/8” WSP – Sheathing, 6d, 6/12 nailing, wind] FsGyp = 100 plf [Based on extrapolation from tabulated values in Table 2305.3.8.2 in 2006
IBC]
Capacities are additive per Section 2305.3.9 of 2006 IBC for wind design: Fs = 560 plf + 100 plf = 660 plf
Fwall = Fs L Cop
Where: Fwall = Capacity of perforated shear wall line Fs = Un-adjusted nominal unit shear capacity
L = Sum of the lengths of qualifying wall segments Co = Opening adjustment factor from Table 2305.3.8.2 of 2006 IBC
Wall W1 (8-foot high, 20.2-foot long wall w/ one 16.4-foot by 6.9-foot high garage door opening in center; sheathed with OSB on exterior, Gypsum on interior) Wind design requirements per Section 2305.3.4 of 2006 IBC place a maximum limit of 3.5:1 on all qualifying wall segments. Check for qualifying wall segments:
Maximum allowed aspect ratio ≤ 3.5:1
Wall segment aspect ratio = ft
ft9.1
8 = 4.13 > 3.5 doesn’t qualify for wind design
**No qualifying wall segments in Wall W1** Wall W4 (8-foot high, 37-foot long wall w/ one 8-foot by 4-foot high window opening, one 4-foot by 6.5-foot door opening and one 9.5-foot by 6.5-foot door opening; narrowest fully sheathed wall segment is 3.9-foot long; sheathed with OSB on exterior, gypsum on interior)
Maximum allowed aspect ratio ≤ 3.5:1
Typical wall segment aspect ratio = ft
ft9.3
8 = 2.05 ≤ 3.5 check ok for Wind Design
Fs = 660 plf Calculate the percent of the wall line that has full height sheathing:

Evaluation of Full-Scale House Testing Under Lateral Loading
NAHB Research Center January 2009 69
% of Full Height Sheathing = ft
ftftftft37
9.39.39.39.3 +++ = 43%
Interpolate Co from Table 2305.3.8.2 for maximum opening heights between 5H/6 and H and percent of full height sheathing between 40% and 50%:
Co = 0.55 Calculate ultimate capacity of the wall: Fwall = ( ) 55.09.39.39.39.3660 ×+++× ftftftftplf = 5,709 lb

Evaluation of Full-Scale House Testing Under Lateral Loading
NAHB Research Center January 2009 70
Example Calculation: the 2006 IBC PSW (Method 2) with Seismic Design Requirements CSIRO House Testing
Nominal unit shear capacities: FsOSB = 560 plf [Table 4.3A of AF&PA Wind and Seismic Design Provisions – 2005 Edition: 3/8” WSP – Sheathing, 6d, 6/12 nailing, wind]
Fwall = Fs L Cop Where: Fwall = Capacity of perforated shear wall line Fs = Un-adjusted nominal unit shear capacity
L = Sum of the lengths of qualifying wall segments Co = Opening adjustment factor from Table 2305.3.8.2 of 2006 IBC
Wall W1 (8-foot high, 20.2-foot long wall w/ one 16.4-foot by 6.9-foot high garage door opening in center; sheathed with OSB on exterior, Gypsum on interior) Seismic design requirements per Section 2305.3.4 of 2006 IBC place a maximum limit of 2:1 on all qualifying wall segments. If aspect ratio is greater than 2:1 but less than 3.5:1, Fs must be reduced by 2w/h. Check for qualifying wall segments:
Maximum allowed aspect ratio ≤ 2:1
Typical wall segment aspect ratio = ft
ft9.1
8 = 4.13 > 3.5 doesn’t qualify for seismic design
**No qualifying wall segments in Wall W1** Wall W4 (8-foot high, 37-foot long wall w/ one 8-foot by 4-foot high window opening, one 4-foot by 6.5-foot door opening and one 9.5-foot by 6.5-foot door opening; narrowest fully sheathed wall segment is 3.9-foot long; sheathed with OSB on exterior, Gypsum on interior) Check for qualifying wall segments:
Maximum allowed aspect ratio ≤ 3.5:1
Typical Wall Segment Aspect Ratio = 9.3
8 ft = 2:0 ≤ 2.05 ≤ 3.5:1
Reduce the strength of the wall for seismic design:
Aspect Ratio Adjustment Factor = ( )
ftft
89.32×
= 0.99
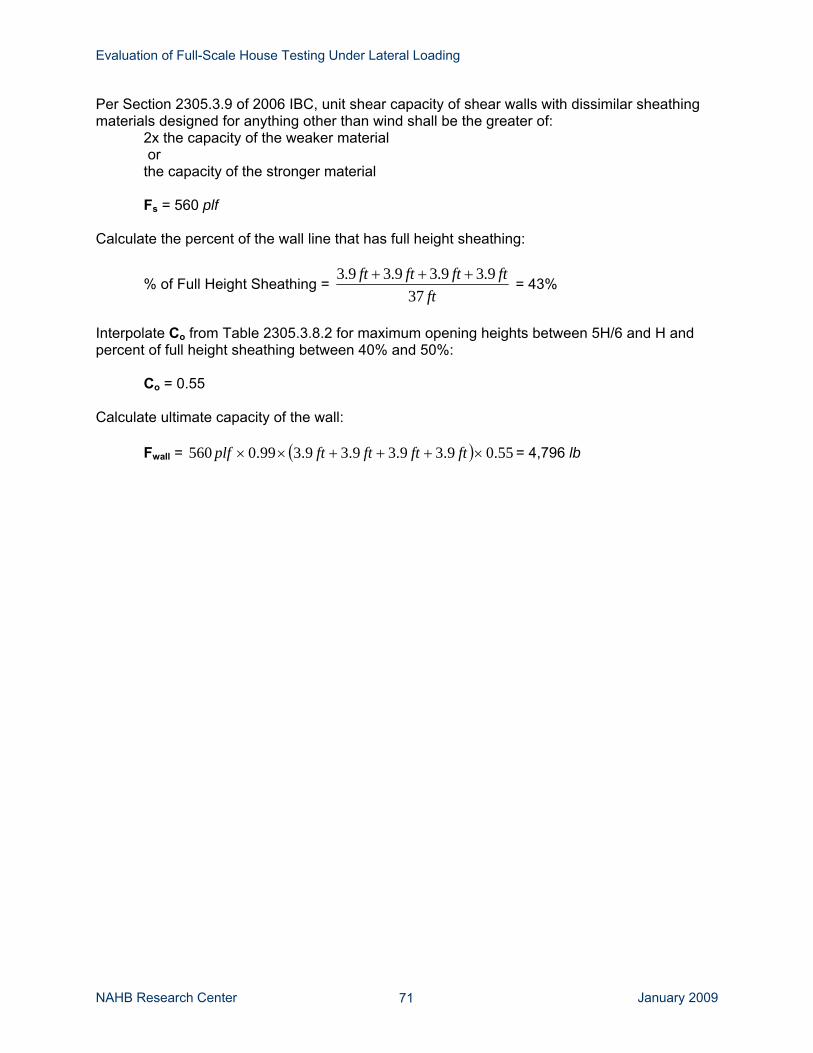
Evaluation of Full-Scale House Testing Under Lateral Loading
NAHB Research Center January 2009 71
Per Section 2305.3.9 of 2006 IBC, unit shear capacity of shear walls with dissimilar sheathing materials designed for anything other than wind shall be the greater of: 2x the capacity of the weaker material
or the capacity of the stronger material
Fs = 560 plf Calculate the percent of the wall line that has full height sheathing:
% of Full Height Sheathing = ft
ftftftft37
9.39.39.39.3 +++ = 43%
Interpolate Co from Table 2305.3.8.2 for maximum opening heights between 5H/6 and H and percent of full height sheathing between 40% and 50%:
Co = 0.55 Calculate ultimate capacity of the wall: Fwall = ( ) 55.09.39.39.39.399.0560 ×+++×× ftftftftplf = 4,796 lb

Evaluation of Full-Scale House Testing Under Lateral Loading
NAHB Research Center January 2009 72
Example Calculation: PC1 RB148 Method (Method 3) CSIRO House Testing
Nominal unit shear capacities:
FsOSB = 560 plf [Table 4.3A of AF&PA Wind and Seismic Design Provisions – 2005 Edition: 3/8” WSP – Sheathing, 6d, 6/12 nailing, wind]
FsGyp = 100 plf [Based on extrapolation from tabulated values in Table 2305.3.8.2 in 2006 IBC]
Capacities are additive per Section 2305.3.9 of 2006 IBC for wind design: Fs = 560 plf + 100 plf = 660 plf
Fwall = Fs L Cprf
Where: Fwall = Capacity of perforated shear wall line Fs = Un-adjusted nominal unit shear capacity
Cprf = Partial restraint factor [from RB148] L = Sum of the lengths of qualifying wall
Aspect ratio criteria for continuously sheathed structures: Per Section R602.10.5 of 2006 IRC, buildings having continuous wood structural panel sheathing above and below all openings shall have minimum braced wall lengths in accordance with Table R602.10.5. For segments next to wall openings, aspect ratio limits range from 2:1 to 4:1 depending on the opening height. At garage openings in one-story structures, segments with 4:1 aspect ratio are permitted. Wall W1 (8-foot high, 20.2-foot long wall w/ one 16.4-foot by 6.9-foot high garage door opening in center; sheathed with OSB on exterior, gypsum on interior)
Maximum allowed aspect ratio ≤ 4:1
Typical wall segment aspect ratio = ft
ft9.1
8 = 4.13 > 4 doesn’t qualify
**No qualifying wall segments in Wall W1** However, because the aspect ratio is close to the IRC limit, analysis is performed for both scenarios, with and without W1, to investigate the impact on the system factor. Wall W4 (8-foot high, 37-foot long wall w/ one 8-foot by 4-foot high window opening, one 4-foot by 6.5-foot door opening and one 9.5-foot by 6.5-foot door opening; narrowest fully sheathed wall segment is 3.9-foot long; sheathed with OSB on exterior, gypsum on interior) Check adjacent opening % of full wall height:

Evaluation of Full-Scale House Testing Under Lateral Loading
NAHB Research Center January 2009 73
% = 10089.6
×ftft
= 87%
Per Table R602.10.5, wall segments with adjacent openings of 87% of the wall height must have maximum aspect ratio of 3:1.
Maximum allowed aspect ratio ≤ 3:1
Typical wall segment aspect ratio = ft
ft9.3
8 = 2.05 ≤ 3 check ok
For shear wall carrying only roof above: Cprf = 0.8
Calculate ultimate capacity of the wall:
Fs = 660 plf
Fwall = ( ) 8.09.39.39.39.3660 ×+++× ftftftftplf = 8,315 lb