Embed Size (px)
Citation preview
EVALUATION OF FRP PRESTRESSED PANELS/SLABS FOR I-225 / PARKER ROAD PROJECT
by
Reuben Zylstra P. Benson Shing
Yunping Xi
Department of Civil, Environmental & Architectural Engineering
University of Colorado Boulder, CO 80309-0428
Sponsored by U.S. Department of Transportation Federal Highway Administration
December 2001
Report No. CDOT-DTD-R-2001-14 Colorado Department of Transportation
Research Branch 4201 E. Arkansas Ave.
Denver, CO 80222

i
EXECUTIVE SUMMARY
Under the Innovative Bridge Research and Construction (IBRC) program of the
Federal Highway Administration (FHWA), the Colorado Department of
Transportation (CDOT) has introduced fiber reinforced polymeric (FRP)
reinforcement in a current bridge project at I-225/Parker Road. In this project,
precast prestressed concrete panels are used as stay-in-place forms for a bridge deck.
Some of these panels are prestressed with carbon fiber reinforced polymeric (CFRP)
tendons and the rest with regular seven-wire steel strands. The primary objective of
this project is to demonstrate the feasibility of using CFRP tendons in place of seven-
wire steel strand for prestressed concrete panels. Furthermore, the applicability of
current AASHTO provisions to CFRP prestressed panels is investigated and
additional design requirements for FRP reinforcement are identified from research
results in the literature. This study includes the review of existing literature on FRP
reinforcement, evaluation of the bond strength of the FRP bars used in the bridge
project by pullout tests, and the testing of three prestressed panels and two composite
slabs to failure.
Pullout tests conducted in this study showed that Leadline CFRP prestressing
tendons and C-BAR glass fiber reinforced polymeric (GFRP) reinforcing bars had
higher bond strengths than seven-wire steel strand and regular steel reinforcing bars,
respectively.
Load tests were first performed on two panels, one prestressed and reinforced
with FRP and the other prestressed and reinforced with steel. Both panels were

ii
designed to barely satisfy the AASHTO specifications. An additional panel that was
prestressed and reinforced with FRP and brought from the I-225/Parker Road project
was tested as well. This panel was conservatively designed with a significant reserve
capacity compared to the first two. Load tests were also performed on steel and FRP
prestressed panels that had a 125 mm (5 in.) composite topping slab. All test results
show the feasibility of using CFRP tendons for prestressing and GFRP bars for
temperature and distribution reinforcement in precast bridge panel construction. The
GFRP reinforcement was selected according to the recommendation for temperature
reinforcement in the ACI 440H draft report.
Load distribution data were taken during the composite slab tests to validate the
adequacy of the Equivalent Width Strip method used in AASHTO LRFD
Specifications. The method was found to be conservative for both steel and FRP
reinforced composite slabs.
However, results show that the steel reinforced slab better distributed the loading
in the transverse direction than the FRP reinforced slab. This suggests that the
recommendation for temperature reinforcement in the ACI 440H draft report may not
be adequate for distribution reinforcement.

iii
ACKNOWLEDGMENTS
This study was sponsored by the Federal Highway Administration (FHWA) and
conducted in conjunction with the Colorado Department of Transportation (CDOT) as
part of FHWA’s Innovative Bridge Research and Construction Program. The project
was monitored by Matthew Greer of the Colorado Division of FHWA, and
administered by Ahmad Ardani of the Research Branch of CDOT.
The technical input provided by Michael McMullen, who is the lead engineer of
CDOT in this project, is gratefully acknowledged. The writers would like to thank
Matthew Greer of FHWA, Michael McMullen and Mark Leonard of Staff Bridge of
CDOT, Ahmad Ardani and Richard Griffin of the Research Branch of CDOT, who
were instrumental in making this project a success.
The writers appreciate the invaluable assistance of William Phaup, James Lewis,
and John Hamilton, undergraduate students at the University of Colorado, in carrying
out the experimental work.
Opinions expressed in this report are, however, those of the writers and do not
necessarily represent those of CDOT or FHWA.

v
TABLE OF CONTENTS
1. INTRODUCTION...................................................................................................... 11.1 BACKGROUND................................................................................................ 11.2 SCOPE............................................................................................................. 31.3 ORGANIZATION OF THE REPORT..................................................................... 4
2. BOND STRENGTH AND PULLOUT TESTS ....................................................... 72.1 GENERAL ....................................................................................................... 72.2 DEVELOPMENT LENGTH................................................................................. 92.3 PULLOUT TESTS ........................................................................................... 102.4 LITERATURE REVIEW ................................................................................... 122.5 EXPERIMENTAL PROGRAM ........................................................................... 222.7 RESULTS....................................................................................................... 34
3. DESIGN OF PRECAST PANEL WITH COMPOSITE TOPPING ..................... 533.1 GENERAL ..................................................................................................... 533.2 CDOT PANELS............................................................................................. 543.3 STRENGTH EVALUATION OF PANELS AND COMPOSITE SLABS WITH FRPTENDONS.................................................................................................................. 553.4 DESIGN CONSIDERATIONS FOR PANELS WITH FRP TENDONS ...................... 643.5 DESIGN OF PRECAST PANELS AND COMPOSITE SLABS ................................. 68
4. EXPERIMENTAL PROGRAM ............................................................................ 794.1 SCOPE OF TEST PROGRAM............................................................................ 794.2 SPECIMEN FABRICATION .............................................................................. 804.3 TEST SETUP.................................................................................................. 86
5. RESULTS OF PANEL/SLAB TESTS................................................................... 955.1 PANEL TESTS................................................................................................ 955.2 COMPOSITE SLAB TESTS .............................................................................. 995.3 SUMMARY OF TEST RESULTS ..................................................................... 1025.4 STRAIN RESULTS........................................................................................ 104
6. SUMMARY AND CONCLUSIONS ................................................................... 1196.1 SUMMARY .................................................................................................. 1196.2 CONCLUSIONS ............................................................................................ 120
APPENDIX A: DESIGN OF FRP PRESTRESSED PANELS AND COMPOSITESLABS........................................................................................................................ 125
BIBLIOGRAPHY....................................................................................................... 139


1
1. INTRODUCTION
1.1 Background
Use of fiber reinforced polymers (FRP) for prestressing and reinforcing concrete
structures as an alternative to steel has received increasing attention in the last decade.
The benefits of using FRP tendons and bars are that they are non-corrosive,
lightweight, non-conductive, magnetically neutral, and extremely strong in tension.
The corrosion resistance of FRP reinforcement is highly beneficial to bridges, whose
service life is often limited by the corrosion of the reinforcement. Thus, the use of
FRP may lead to a substantial increase of the lifespan of bridges.
Currently, high prices, lack of standard design specifications, and constructibility
issues limit the use of FRP in prestressed and reinforced concrete structures. Most
applications are limited to situations where the use of FRP is essential. Such
applications include structural flooring to support sensitive magnetic equipment and
structures subject to a corrosive marine environment. However, in recent years, many
state transportation departments in partnership with the Federal Highway
Administration (FHWA) are introducing these new materials to bridge structures with
the intention of gaining design and construction experience and long-term
performance data on FRP. Several bridges using FRP prestressed bars and
reinforcement were constructed in Canada. In 1993, a bridge was built in Calgary
using FRP prestressing tendons (Rizkalla and Tadros, 1994). Another bridge
containing FRP prestressing tendons was built in Headingsley, Manitoba in 1997.

2
The ACI 440H Committee has prepared a draft of code modifications for
concrete structures prestressed and reinforced with FRP. This document can be
perceived as the first attempt in the United States to introduce code provisions for the
use of FRP materials in concrete structures.
Under the Innovative Bridge Research and Construction (IBRC) program of the
FHWA, the Colorado Department of Transportation (CDOT) has introduced FRP
reinforcement in a current bridge project at I-225/Parker Road. The bridge
construction, underway at the time of this report, is shown in Figure 1.1. In this
project, precast prestressed concrete panels are used as stay-in-place forms for a
bridge deck. Some of these panels are prestressed with carbon fiber reinforced
polymer (CFRP) tendons and the rest with regular seven-wire steel strands.
Furthermore, deformed glass fiber reinforced polymer (GFRP) bars are used as
temperature reinforcement in the former panels. GFRP bars are also used in the
railings of a temporary bridge in this project. The primary objective of this project is
to demonstrate the feasibility of using CFRP tendons in place of seven-wire steel
strand for prestressed concrete panels. The precast panels are supported on two cast-
in-place, post-tensioned concrete box girders. The panels are designed to carry
construction loads. A topping slab will be added to the panels to form a composite
bridge deck to carry the traffic. The panel design is extremely conservative. This
ensures the safety of the bridge with the use of the new materials that have not been
well studied. In spite of this, because of the lack of standard design provisions for
FRP reinforced concrete structures, studies must be conducted to validate the load

3
carrying capacity of the deck panels and to examine the long-term performance of the
bridge deck containing FRP reinforcement. Furthermore, the applicability of current
AASHTO provisions to CFRP prestressed panels must be investigated and additional
design requirements for FRP reinforcement must be identified from research results
in the literature. These studies have been conducted at the University of Colorado at
Boulder as part of the IBRC project. The studies include the load tests of simply
supported deck panels in Phase I and the evaluation of the long-term performance of
such decks by testing a 30-ft. long and 16-ft. wide, 2/3-scale three-girder deck under
fatigue loads in Phase II. Furthermore, a rational design methodology that can lead to
a significant reduction of reinforcement in bridge decks has been developed. The use
of this new design method can partly offset the high cost of FRP reinforcement.
1.2 Scope
This report summarizes the work of the Phase I study, which includes the review
of existing literature on FRP reinforcement, evaluation of the bond strength of the
FRP bars used in the bridge project, and the testing of three panels and two composite
slabs to failure. The panels and slabs were simply supported. The panels were 90
mm (3.5 in.) thick and were constructed with steel and CFRP prestressing tendons to
compare their performances. One of the panels that had FRP prestressing bars was
brought from the bridge site for evaluation. This panel was conservatively designed.
The remaining two panels were designed to barely satisfy the minimum requirements
of AASHTO with additional considerations for the FRP reinforcement. The
4
composite slabs had a 125 mm (5 in.) topping cast on top of the 90 mm (3.5 in.)
panels. One had an FRP prestressed panel and the other had a steel prestressed panel.
For the two composite slabs that were tested, the effective widths of the slabs
subjected to the wheel load of a design truck were evaluated from the test results and
compared to the recommendation in the AASHTO LRFD Standard Specifications
(1998).
1.3 Organization of the Report
The contents of this report have been organized in the following fashion. Chapter
2 focuses on the bond strength of FRP and steel bars with concrete. This chapter
presents a literature review of current research on pullout tests and development
lengths for FRP and steel reinforcement, the pullout tests conducted in this study, and
results obtained.
In Chapter 3, the design of the test panels is presented in detail. A brief overview
of the allowable stress design method and a thorough discussion of the calculation of
the nominal moment capacities of steel/FRP prestressed panels and composite slabs
with different reinforcement levels are presented. A discussion of material properties
and the factors affecting FRP performance is also presented.
In Chapter 4, the construction of the test panels and composite slabs are
described, and the test setup developed to evaluate the panels and composite slabs is
presented.

5
In Chapter 5, results of the panel and slab tests are presented. The test results are
analyzed and compared to the design strengths. The performance of the panels
prestressed with CFRP bars and steel strands are compared. The load distribution in
the composite slabs under a wheel load is examined with the strain gage data and
compared to the AASHTO LRFD Specifications.
A summary of this study and the conclusions drawn from it are presented in
Chapter 6.

6
Figure 1.1 I-225/Parker Road Bridge Construction
7
2. BOND STRENGTH AND PULLOUT TESTS
2.1 General
In the I-225/Parker Road project, both FRP and steel prestressing/reinforcing bars
are used for the precast panels. The steel products used by the contractor are
standards of the concrete industry, namely, seven-wire strand and epoxy-coated bars.
However, due to the limited use of FRP products in construction, only a few FRP
product alternatives exist on the market. In spite of this, there are a limited number of
options when looking at both FRP prestressing tendons and FRP reinforcing bars.
For FRP prestressing tendons, the contractor chose Leadline carbon fiber reinforced
polymer (CFRP) tendons. These bars have been studied by other researchers (Dolan
et al., 2000; Lu et al., 2000; Mahmoud et al., 1996) and have proven to be a viable
product. In addition, the manufacturer of Leadline has developed an anchor chuck
that can be used to grip their FRP bars for ease in the prestressing process. For glass
FRP reinforcing rods, the contractors chose C-BAR GFRP bars. Like Leadline, these
bars have also been studied extensively by researchers (Rizkalla, 1991; Karlsson,
1997; Conrad et al., 2000). These bars have surface deformations very similar to that
of regular steel bars.
In order to take full advantage of the high tensile strength of FRP bars, it is
essential to quantify the bond strength between FRP bars and concrete. The
differences in material properties and geometry between FRP and steel bars make it
difficult to apply the established development length equations in the ACI code (ACI

8
Committee 318, 1999) to FRP bars. The ACI 440H draft document (2000) contains
recommendations for FRP use in reinforced concrete and provides development
length equations for mild reinforcement only. Current research has shown that the
development length equation used for steel prestressing strand largely overestimates
the development length required for FRP (Lu et al., 2000). Development length is
normally not a factor in concrete bridge design as bridge girders and structural beams
tend to provide sufficient embedment lengths. However, in applications such as
precast bridge deck panels, development length can be the governing factor. Thus,
for this situation and others similar to it, a good understanding of development length
is imperative.
In view of the importance of development length in bridge panel design, pullout
tests are necessary to quantify the bond strengths of the FRP products used in this
project, in particular, with respect to those of regular steel products. This chapter will
present pullout test results for the materials chosen by the contractor to be used in
panel construction. These materials are: CFRP prestressing tendons (Leadline),
seven-wire steel strand, GFRP reinforcement (C-BAR), and standard reinforcing
steel. Using the pullout results, the bond strengths of the materials can be compared
and an understanding of the failure mechanisms that govern pullout will be attained.
All four bar samples are shown in Figure 2.1. It must be mentioned that for the
pullout tests, only black steel bars are used for comparison with GFRP bars, even
though epoxy-coated bars are used in actual construction.

9
2.2 Development Length
In prestressed concrete, transfer length is the distance required to transmit the
effective prestressing force from the prestressing tendon to the concrete. When a
member is loaded to its ultimate flexural strength, an additional bond length beyond
the transfer length is required to develop the tendon stress at the nominal flexural
strength. This additional bond length is called flexural bond length. Development
length (ld) is considered as the sum of the transfer length and the flexural bond length.
The ACI 318-99 equation for the development length of a prestressed steel tendon is
given by equation 2.1 for use with US customary units where ld is in inches. The
variables include various states of tendon stress, fpe (effective prestress) and fps (stress
in strand at nominal flexural strength) given in ksi, as well as the nominal bar
diameter db, given in inches.
bpepsbped dffdfl )(3
1 −+= (2.1)
In addition to the equation for prestressing strand, ACI 318-99 (1999) has a
development length equation for standard steel reinforcement shown in equation 2.2.
b
trb
c
yd
d
Kcd
f
fl
+⋅= αβγλ
'40
3 (2.2)
where α = bar location factor

10
β = coating factor
γ = bar size factor
λ = lightweight aggregate concrete factor
c = spacing or cover dimension (in.)
Ktr = transverse reinforcement index
fy = yield stress of reinforcement (psi)
f’c = concrete compressive strength at 28 days (psi)
According to the ACI 440H draft document, development length for FRP
reinforcement is given by the larger of equations 2.3a and 2.3b. Each of these
equations is an empirical equation that uses US customary units where ld is in inches.
'
,
17 c
ubarfd
f
fAl = (2.3a)
2700bu
d
dfl = (2.3b)
where Af,bar = cross sectional area of the reinforcing bar (in2)
fu = ultimate strength of the reinforcing bar (psi)
2.3 Pullout Tests
The use of pullout tests to investigate bond strength is fairly common in research
today. They are simple to conduct and have proven to be a reliable indicator of bond

11
quality. However, it must be noted that the conditions in pullout tests do not reflect
the actual conditions that govern bond in both reinforced concrete and prestressed
concrete structures. According to Mahmoud (1999), the bond strengths developed in
a pullout test generally are larger than those developed in a prestressed beam test.
This can be attributed to two factors. First, in a standard pullout test, a rod is pulled
out of a cured concrete specimen. In order to accomplish this, the concrete is
subjected to compression while the rod is subjected to tension. This is different than
what occurs in a prestressed beam test where both the concrete and the reinforcement
are in tension. In the case of the prestressed beam test, the concrete in tension has a
higher probability of being cracked, resulting in lower bond strengths. Second, in
pullout tests, the contact between the loading plate and the concrete specimen will
induce radial friction confinement on the rod near the loaded end. This confinement
will add further resistance to pullout, increasing the bond strength.
An additional factor is noted for prestressing strand that may increase the bond
strength in a prestressed beam test, thus counteracting the trends described in the
previous paragraph. When a strand is prestressed, the diameter decreases. When the
prestressing force is released, the diameter of the strand increases at the unstressed
end, increasing the friction against the concrete surface that surrounds it. This is
termed the Hoyer effect. For prestressing tendons, the tendons are normally not
pretensioned in pullout specimens. Hence, the Hoyer effect is not present reducing
the bond strength for the pullout specimens.

12
In spite of the aforementioned factors, most researchers have found that pullout
tests provide an effective comparison tool for bond strength. By correlating pullout
and beam tests, pullout tests performed at a later time can be used to verify the
adequacy of the development length equation for the particular material.
2.4 Literature Review
2.4.1 Brearley and Johnston – Prestressing Strand
Brearley and Johnston (1990) completed a study to determine the effects of a grit-
impregnated epoxy coating on the bond of prestressing strand. Fifty-two direct
tension pullout tests were performed on specimens made of concrete and prestressing
strand. The strand was 1863 MPa (270 ksi), seven-wire, low relaxation strand made
by Florida Wire and Cable Company. The concrete mix was designed to have a
minimum 28-day strength of 34.5 MPa (5000 psi). The test program considered
variations in strand size and surface conditions. Of particular interest for the research
presented in this report is the bond exhibited by the uncoated, 9.5 mm (3/8 in.)
diameter strand.
The concrete specimens used were 203 mm (8 in.) by 203 mm by 305 mm (12 in.)
prisms with the unprestressed strand embedded concentrically along the entire 305
mm axis. Five tests were performed at 28 days on 9.5 mm (3/8 in.) diameter
uncoated strands. A center-hole hydraulic ram, operated with a manual pump, was
used to pull the strand out of the concrete prism. The strand was concentrically run

13
through the hydraulic ram assembly and anchored with a prestressing chuck.
Washers and steel loading plates were used to minimize the stresses in the concrete
near the strand. Slip measurement was measured at the loaded end and the free end
of the strand with a dial gage. Results showed that the average ultimate bond strength
for the five specimens tested was 3.8 MPa (0.55 ksi) with values ranging from 2.9 to
4.9 MPa (0.42 to 0.71 ksi).
The authors later concluded that the pullout bond strengths did reflect the bond
performance in beam tests that were performed in follow-up experiments.
2.4.2 Cooke, Shing, and Frangopol – Prestressing Strand
Cooke et al. (1998) completed a research report for the Colorado Department of
Transportation and the Federal Highway Administration on transfer and development
length of steel strand in prestressed box girders. The concrete mix had a specified
28-day strength of 69 MPa (10 ksi). In addition to directly testing three box girders,
nine pullout tests were performed. Using a pullout procedure developed by Mostafa
(1977), 15 mm (0.6 in.) diameter prestressing strands were embedded 457 mm (18
in.) in concrete. The block dimension was 2438 mm (96 in.) long by 914 mm (36 in.)
deep by 610 mm (24 in.) wide with 8 strands placed in each block, embedded in the
direction of the 914 mm depth. The specimen contained substantial confining steel
and also had sufficient spacing between each strand so that stresses from one test
would not disturb the concrete in a later test. The high strength concrete was allowed
to cure for 2 days before pullout tests started and the compressive strength was 39
14
MPa (5690 psi) on the day of the tests. A similar setup to that described in the
preceding pullout test was used incorporating a center hole ram, hand pump,
prestressing chuck, and steel block.
Load at first slip and the maximum load were recorded giving average values of
134 and 215 kN (30 and 48 kips), respectively. Using the given 457 mm (18 in.)
embedment, bond strengths were 7.3 and 11.8 MPa (1.1 and 1.7 ksi) for the 134 and
215 kN loads, respectively.
The corresponding beam tests performed showed satisfactory results for the
development length stipulated in ACI 318 (equation 2.1).
2.4.3 Mahmoud, Rizkalla, and Zaghloul – Leadline
In 1999, Mahmoud et al. conducted research on transfer and development lengths
of CFRP prestressing tendons. A total of 52 pretensioned concrete beams and
pretensioned prisms were tested in this study. The beam and prism specimens were
pretensioned with 8 mm (0.315 in.) Leadline tendons, 10.5/12.5/15.2 mm
(0.41/0.49/0.6 in.) carbon fiber composite cables (CFCC), and 12.7 mm (0.5 in.) steel
strand. The prestressing levels varied from 58 to 80 percent of the guaranteed
strength reported by the manufacturers. Furthermore, all specimens were fitted with
strain gages which were fixed to the prestressed strands to monitor strains during
release and loading. The prestressing tendons were debonded over 50 mm or 100 mm
(2 or 4 in.) at each end of the beam to minimize stress disturbances as well as
confinement within the support zone. Some of the beams were fitted with stirrups to
15
provide sufficient reinforcement to avoid premature shear failure. This was done to
compare the effects of confinement versus no confinement.
The prisms varied in cross section based on the size of prestressing reinforcement
used. The intent was to achieve approximately equal stresses in the concrete cross
section after transfer for the different types of the prestressing reinforcement used in
this study. Embedment lengths varied from 750 mm (29.5 in.) to 1900 mm (75 in.).
The method of casting involved positioning a hollow jack and a hollow load cell
between two prism molds. The prestressing tendon was then prestressed and the
prisms were poured. Teflon sheets were placed between the jack and the concrete
surface to permit transverse deformations of the concrete during testing.
Displacement transducers (LVDTs) were positioned at the ends of the tendon and
Demec points were glued to the concrete surface to help monitor concrete strains.
The beams were tested in flexure using a universal testing machine with 1000 kN
(225 kip) capacity to apply a one-point or a two-point static load. The prism tests
were carried out in two steps. Upon release of the jacking force, the stress from the
tendon was transferred to the prisms. The strain gages attached to the prestressed
strands and the Demec points were used to determine the transfer lengths at the two
ends. After these measurements were made, a load was applied by the hollow jack
while slip was measured with the LVDTs.
Based on results from the prism tests, the authors proposed the following equation
for transfer length which is a function of the diameter of the tendon (db), the initial
prestressing level (fpi), and the concrete compressive strength at transfer (f’ci).

16
67.0'
89.1
cit
bpit f
dfL
α= (2.4)
The coefficient αt is determined from a regression analysis of the test data and the
factor 1.89 is used for conversion from metric to US customary units. For Leadline,
αt is 1.9. The equation for flexural bond length was determined in the beam tests. In
this equation, the flexural bond length is a function of the increase of stress from the
effective prestress level (fpe) to the ultimate tensile strength (fpu), the tendon diameter
(db), and the concrete strength at the time of the test (f’c).
( )67.0'
89.1
cf
bpepuf f
dffL
α−
= (2.5)
The coefficient αf is determined from a regression analysis of the test data and the
factor 1.89 is again used for conversion to English units. For Leadline, αf is 1.0. The
summation of equations 2.4 and 2.5 is the development length for Leadline in
pretensioned applications.
2.4.4 Conrad, Bakis, Boothby and Nanni – Leadline / C-BAR
Conrad et al. (2000) completed a report for the Federal Highway Administration
on recommendations for prestressing highway bridges with CFRP tendons. The
17
primary purpose in conducting pullout tests was to compare the effects of tendons
conditioned in high alkaline solutions against those that were not. The specimen
consisted of a 152 mm (6 in.) concrete cube with a tendon penetrating through the
center. Concrete strength was 34 MPa (5000 psi) and pullout was performed by a
hydraulic universal testing machine. With one moving head and one stationary head,
the bar could be simply attached to the moving head while the concrete cube could be
fixed beneath the stationary head. Three to four specimens were replicated for each
different embedment length and material.
For Leadline tendons, 8 mm (0.31 in.) tendons with embedments based on bar
diameters (db) of 5db, 10db, and 15db were used. Their results show that the average
maximum bond stresses decreased from 20.7 to 19 MPa (3 to 2.8 ksi) as the
embedment increased. Leadline tendons performed better than all other FRP tendons
tested, even those with ribbed surfaces. Upon close visual inspection of the bonding
surface between Leadline and concrete, it was noted that there was no visual damage
to the concrete. The shearing of the spiral deformation on the Leadline surface
caused the bond failure.
Twelve-millimeter diameter C-BAR reinforcing bars were used in a pullout setup
identical to that defined for Leadline. The average bond strengths found for the 2.5db
and 5db embedments were 18 and 16.6 MPa (2.6 and 2.4 ksi), respectively. All bars
with 10db embedment failed by rupture in the FRP bar at the grip before maximum
bond strength could be reached.

18
2.4.5 Lu, Boothby, Bakis and Nanni – Leadline
Following up the pullout tests conducted by Conrad et al. (2000), a series of beam
tests were performed to enable the direct evaluation of development length. Results
of this study show significant conservatism in using the ACI development length
equation (equation 2.1) for FRP. Lu et al. (2000) recommend the following changes
to the ACI formula. First, the rupture strength (fu) of the FRP tendons should be used
instead of the stress at the nominal flexural strength of the cross-section (fps) in the
second half of the ACI formula. Second, the higher bond stress developed by FRP
tendons should be taken into account. To account for this, the flexural bond length is
reduced by 25 percent. The equation proposed is as follows:
bpeubped dffdfl )(4
3
3
1 −+= (2.6)
Lastly, the authors found that for different FRP materials, the development length
trend agreed almost perfectly with the bond strength trend in the pullout tests.
2.4.6 Karlsson - C-BAR
Karlsson (1997) completed his Ph.D. thesis at the Chalmers University of
Technology dealing with bond between C-BAR and concrete. The author looked at
various parameters including concrete strength, bar diameter, embedment length, and
concrete cover. The specimen size used was a 203 mm (8 in.) concrete cube with a
19
concentrically placed reinforcing bar. The pullout test setup is very similar to those
presented previously. In order to provide an anchor to grip the specimen with,
Karlsson chose to slide steel tubes over the C-BAR rods. Epoxy was used to fill in
the gaps and to bond the rod to the steel tube. The steel tubes had inner and outer
diameters of 20 and 22 mm (0.79 and 0.87 in.), respectively, and were 254 mm (10
in.) long. Then, grips used in normal tension testing machines were used to grip the
steel tubes.
Of the data obtained by Karlsson, the results that are of interest here are those for
the 13 mm (0.5 in.) diameter bar with concrete strength of 29 and 42.8 MPa (4200
and 6200 psi). Bond lengths of 3db, 5db, and 7db were used for the tests. The three
tests using 29 MPa concrete were somewhat inconclusive as one bar failed in rupture,
and in another test, the load was extremely low. The third test gave a bond strength
of 18.6 MPa (2.7 ksi). For the 42.8 MPa concrete, the bond strength of the three
specimens was very consistent and gave an average of 21.4 MPa (3.1 ksi).
The author drew many conclusions from the data, but most importantly found that
C-BAR had higher bonding capacity than Swedish Ks400 steel bar of the same
diameter with ribs. It also proved comparable to the Swedish Ks600 steel bar with
ribs.
2.4.7 Rizkalla et al. – C-BAR
A research team from the University of Manitoba completed research for
Marshall Industries Composites, Inc., the manufacturer of C-BAR (Rizkalla, 1997).
20
Testing focused on the material properties of C-BAR. Using pullout tests, varying
embedment length and the presence of confinement were explored. The concrete
specimens tested were inverted T-sections with a top width of 152 mm (6 in.) and a
bottom width of 457 mm (18 in.). The specimens were constructed 1524 mm (60 in.)
long so that six C-BAR rods could easily be placed in each. Both the base and the
middle were reinforced with confining steel. A total of 26 C-BARs were tested
including eight bars that were shallowly embedded in the unconfined concrete region
at the top of the specimens. The research team utilized a simple technique to
eliminate the radial friction confinement from the contact between the loading plate
and the concrete surface at the top of the concrete near the bar. A loading frame was
constructed so that it was supported by the base of the inverted T-section rather than
the top of the concrete near the reinforcing bar. For anchorage, the same style steel
pipe as used by Karlsson was filled with epoxy resin and gripped with a standard
tension grip.
The average concrete compressive strength used was 44.2 MPa (6400psi). The
eight unconfined C-BAR specimens had maximum bond stresses of 11 MPa (1.6 ksi)
while the 18 confined C-BAR specimens had average maximum bond stresses of 21.4
MPa (3.1 ksi). The data for the bond strengths all came from rods with embedments
of 2.5db and 5db. All embedment lengths greater than this resulted in failure by C-
BAR rupture. Further data obtained by the authors show that epoxy-coated steel had
a larger ultimate bond strength than that of C-BAR, conflicting with conclusions
drawn by Karlsson.
21
2.4.8 Eligehausen, Popov, and Bertero – Reinforcing Steel
Eligehausen et al. (1983) conducted numerous pullout tests on deformed steel bars
in concrete in an attempt to better understand the bond stress-slip relationship
between the two materials. The authors explored numerous parameters including:
confinement, bar diameter, concrete strength, bar spacing, pullout rate, and cyclic
loading. Special care was taken to make sure that the specimen design would be free
of the effect of additional parameters. All of the 125 pullout specimens tested had
embedment lengths of 5db. With this bond length, the authors felt that the slip
measured at the free end of the bar would represent the local slip in the middle of the
embedment length with sufficient accuracy. At the same time, this length was long
enough that it would reduce the scatter of results observed in tests using shorter
embedment lengths. Specimen size varied based on the type of bar used. The
dimensions of the rectangular test specimens were 305 mm (12 in.) by 15db by 7db,
with 15db being in the direction along which the steel bar was placed. Since the three
bars studied were #6, #8, and #10, this lead to a variety of specimen sizes. Pullout
was performed by a hydraulic universal testing machine.
Only two specimens were tested without confinement. The concrete compressive
strength was approximately 30.7 MPa (4450 psi) and the bar size was #8 (25 mm
diameter). In both cases, the specimens failed by splitting of the concrete along the
longitudinal axis of the bar. The bond strength at failure was 6 MPa (870 psi). Upon
closer examination, the concrete between the lugs (deformations on the steel surface)
22
was found intact and uncrushed. For confined specimens, the average bond strength
was about 13 MPa (1.9 ksi).
2.5 Experimental Program
2.5.1 Material Properties
The FRP bars tested in the pullout tests were chosen by the precaster for the I-
225/Parker Road project as was mentioned in Section 2.1. The steel strand and
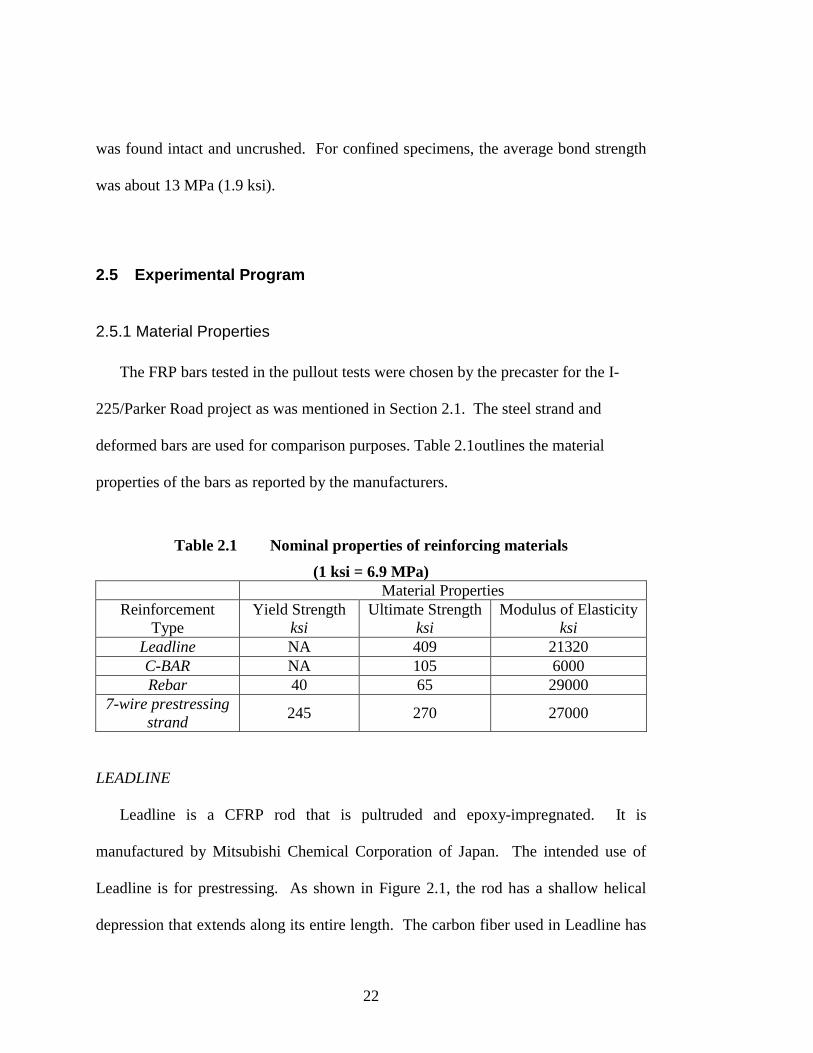
deformed bars are used for comparison purposes. Table 2.1outlines the material
properties of the bars as reported by the manufacturers.
Table 2.1 Nominal properties of reinforcing materials
(1 ksi = 6.9 MPa)Material Properties
ReinforcementType
Yield Strengthksi
Ultimate Strengthksi
Modulus of Elasticityksi
Leadline NA 409 21320C-BAR NA 105 6000Rebar 40 65 29000
7-wire prestressingstrand
245 270 27000
LEADLINE
Leadline is a CFRP rod that is pultruded and epoxy-impregnated. It is
manufactured by Mitsubishi Chemical Corporation of Japan. The intended use of
Leadline is for prestressing. As shown in Figure 2.1, the rod has a shallow helical
depression that extends along its entire length. The carbon fiber used in Leadline has
23
a tensile strength of approximately 4830 MPa (700 ksi). The composition of Leadline
is 65 percent carbon fiber and 35 percent epoxy resulting in a theoretical tensile
strength of 3140 MPa (455 ksi). However, the tensile strength is very much related to
the grip used to apply the tensile force. Currently, the manufacturer has developed a
grip that can provide a guaranteed tensile strength of 2820 MPa (409 ksi). The
grip/anchor is shown in Figure 2.2. The modulus of elasticity of Leadline is 147 GPa
(21320 ksi).
Additional tests were performed on Leadline by Cusson (2001) at the University
of Colorado. Preliminary results from three 10 mm (0.39 in.) Leadline tendons show
a mean tensile strength of 3059 MPa (444 ksi).
Ten millimeter (0.39 in.) Leadline tendons were used for the pullout tests.
C-BAR
C-BAR is a GFRP bar manufactured in a pultrusion process by Marshall
Industries Composites, Inc. C-BAR is used as a replacement for mild reinforcing
steel. The fiberglass used to manufacture C-BAR reinforcing rods has a maximum
tensile strength between 2070 and 3450 MPa (300 and 500 ksi) depending on the
grade used. The rods are composed of 70 percent fiberglass and 30 percent
epoxy/other additives, thus giving a theoretical strength ranging from 1415 to 2415
MPa (210 to 350 ksi) (Karlsson, 1997). In the C-BAR used in the pullout tests for
this research, the guaranteed tensile strength is 725 MPa (105 ksi). The modulus of
elasticity is 41 GPa (6000 ksi). No commercial grips have been developed for this

24
type of bar. The common method used for tension tests is to slide a steel tube over
the C-BAR and fill it with epoxy. After curing, large grips can be used to grasp the
steel tubing directly. The surface deformation on the C-BAR is formed using a
hybrid pultrusion/compression molding process. These raised deformations
effectively develop mechanical interlock with the concrete increasing the bond
strength significantly. Figure 2.1 shows these deformations.
Along with the tests performed on Leadline by Cusson at the University of
Colorado as discussed previously, tests were also performed on C-BAR. Preliminary
results from three 10 mm C-BAR reinforcing rods show a mean tensile strength of
819 MPa (119 ksi).
Thirteen millimeter (0.5 in.) C-BAR reinforcing bars were used for the pullout
tests.
STEEL REBAR
The reinforcing steel used was uncoated #4 bar (13 mm in diameter). It has a
nominal yield strength of 270 MPa (40 ksi) and was manufactured by Fiero Metals in
California. The reinforcing steel met the requirements of ASTM A 615.
SEVEN-WIRE STEEL PRESTRESSING STRAND
The prestressing strand used in testing is standard 9.5 mm (3/8 in.) diameter
seven-wire, low relaxation strand. The nominal yield strength is 1865 MPa (270 ksi)

25
and was manufactured by Florida Wire and Cable. The strand was manufactured to
meet the requirements of ASTM A 416.
CONCRETE
The concrete mix design used in the pullout tests is given in Table 2.2. It is a
special mix developed at the University of Colorado as part of the Innovative Bridge
Research and Construction (IBRC) project with CDOT. It has low cement paste and
high fly ash content to reduce temperature and shrinkage cracks and chloride
permeability. In an attempt to comply with ASTM A 882 standard for pullout tests,
31 MPa (4500 psi) was chosen as the target concrete compressive strength. The
water-cement ratio was 0.41. When considering the water-cement ratio for a mix
design containing fly ash and silica fume, these two ingredients must be added to the
weight of cement. The aggregate had a maximum size of 25 mm (1 in.) and was from
a river bottom, making it rounded and smooth. A high range water reducer was used
to improve workability.
Table 2.2 Concrete mix design
Major components kg/m3 lbs/yd3
Cement 297 500Water 151 254Sand 806 1360
Gravel 946 1595Fly ash 59 100
Silica fume 12 20Additives ml/m3 oz/yd3
High range water reducer 2200 57Micro Air 260 17

26
Four batches were made. Each batch was 0.19 m3 (0.25 yd3). This was enough to
fill five pullout specimens as well as three to four 152 mm (6 in.) by 305 mm (12 in.)
cylinders for compression testing. The pullout specimens were made with 152 mm
by 305 mm cylinder molds with a reinforcing bar or prestressing tendon placed
concentrically in the cylinder. All but one compression test cylinder were tested at 28
days. The measured concrete strengths are shown in Table 2.3.
Table 2.3 Measured concrete strengths
Batch # Curing time(days)
f'c
(psi)Average
(psi)1 3 25181 28 38731 28 4032
3953**
2 28 43152 28 41502 28 4226
4231
3 28 42003 28 41913 28 4050
4147
4 28 42874 28 47134 28 49344 28 4076
4502
**based on 28-day break strength
The average strengths listed in Table 2.3 were all within the desired range. In all
cases, the compressive strengths were reasonably consistent.

27
2.5.1 Test Specimen
There are a variety of methods to conduct pullout tests. Some standards exist, but
most of the time the specimen is altered in order to more effectively attain the results
desired. In the case of this research, it was important to have a simple specimen that
could be used with different reinforcing materials for consistency in comparison. The
main consideration for the specimens was that development lengths chosen for each
material type would result in a similar failure type. Concrete splitting, bar rupture, or
anchor failure would lead to inconclusive results. Thus, special caution was used to
make sure these would not happen.
The bar sizes that were tested were based on the bars used in the design of the
CDOT bridge deck. But more importantly, the comparable materials (Leadline and
prestressing steel; C-BAR and reinforcing steel) were to have approximately the same
dimensions. Thus, 9.5 mm (3/8 in.) prestressing strand and 10 mm (0.39 in.) Leadline
were chosen along with #4 (13 mm) reinforcing steel and 13 mm (0.5 in.) C-BAR.
Literature and testing standards in the prestressing industry were the basis for
specimen design. ASTM A 981 and ASTM A 882 are the standard specifications for
bond tests of uncoated prestressing strand and epoxy-coated prestressing strand,
respectively. However, even though ASTM A 981 is the standard for uncoated
strand, it suggests the use of cement grout and incorporates a steel tube to confine the
grout around the tendon. This setup was determined not suitable for the data desired.
ASTM A 882 recommends the use of a standard 152 mm (6 in.) by 305 mm (12 in.)
concrete cylinder to conduct pullout tests. In addition to the fact that other

28
researchers have followed a similar setup, this specimen would provide an
uncomplicated setup that would be simple to duplicate. Confining reinforcement was
an option that was not recommended by this standard, but has been considered by
other researchers. For the sake of simplicity, it was deemed unnecessary for this
experiment.
The embedment length was carefully chosen so that concrete splitting failure
would be unlikely while still allowing for sufficient development to attain consistent
results. However, an initial consideration for FRP specimens is that although they
have high tensile strength, they are difficult to grip without crushing the transversely
isotropic fibers. Thus, depending on the grip used, it is essential that the strength of
the bond is not stronger than the strength of the grip. In order to prevent crushing in
the FRP bar, a method similar to that used by Rizkalla (1997) and Karlsson (1997)
was used. They proposed the use of a 254 mm (10 in.) long steel tube slightly larger
than the outside diameter of the bar/rod being tested. The space between the bar and
the tube was to be filled with epoxy. In this research, the strength of the epoxy
chosen was unknown, so 356 mm (14 in.) steel tubes were used to provide additional
anchor strength. One tube with respective inner and outer diameters of approximately
19 and 27 mm (0.75 and 1.06 in.) was used for the C-BAR reinforcing bars. The tube
used for the Leadline tendons had inner and outer diameters of 16 and 22 mm (0.63
and 0.87 in.), respectively. Thus, for both anchor tubes, there was about 3-4 mm
(0.12-0.16 in.) of space between the centered FRP bar and the inside of the steel tube.
In order to keep the tubes centered on the FRP bars, properly sized washers were
29
taped to the ends of the tubes. The epoxy used was West Systems 205 Fast Hardener.
This anchor system provided adequate grip without crushing the fibers.
For C-BAR, literature has shown that embedments from 5db to 7db have given
satisfactory results without prominent concrete splitting failure. Because the
embedment for splitting failure is very close to 7db, both lengths were used. For
Leadline, the range used by Conrad (2000) provided satisfactory results so an
embedment of 10db was chosen. In the case of the two steel specimens, standard
prestressing chucks were used for anchoring, thus gripping was not essential in
choosing a bond length. For prestressing tendons, ASTM A 882 recommends an
embedment length of 191 mm (7.5 in.) for a 9.5 mm (3/8 in.) diameter bar. For
reinforcing steel, a similar embedment to that of Eligehausen et al. (1983) was
chosen. They used 5db for each bar and in the unconfined case, failure was governed
by concrete splitting. Although splitting was undesirable, the bars they tested were
#8 bars (25 mm diameter), which are significantly larger than the #4 bars (13 mm
diameter) tested in this setup. It was felt that the smaller #4 bar would not cause
concrete splitting. A small increase from 5db was deemed necessary to improve the
consistency of the results so 6db was chosen.
In order to create the proper bond length, PVC pipe was cut into various lengths,
50 to 200 mm (2 to 8 in.), and placed around the bar similar to the methods of many
other researchers. Where the PVC fit loosely around the bar, tape was wrapped to
keep the bar centered. Non-adhesive sealer was used to seal the ends so concrete
would not seep into the bond free zone during construction. Fifty to one hundred

30
millimeters (2 to 4 in.) of bond free length was introduced at the bottom of a
specimen while 100 to 200 mm (4 to 8 in.) was introduced the top as shown in Figure
2.3.
2.5.2 Test Program
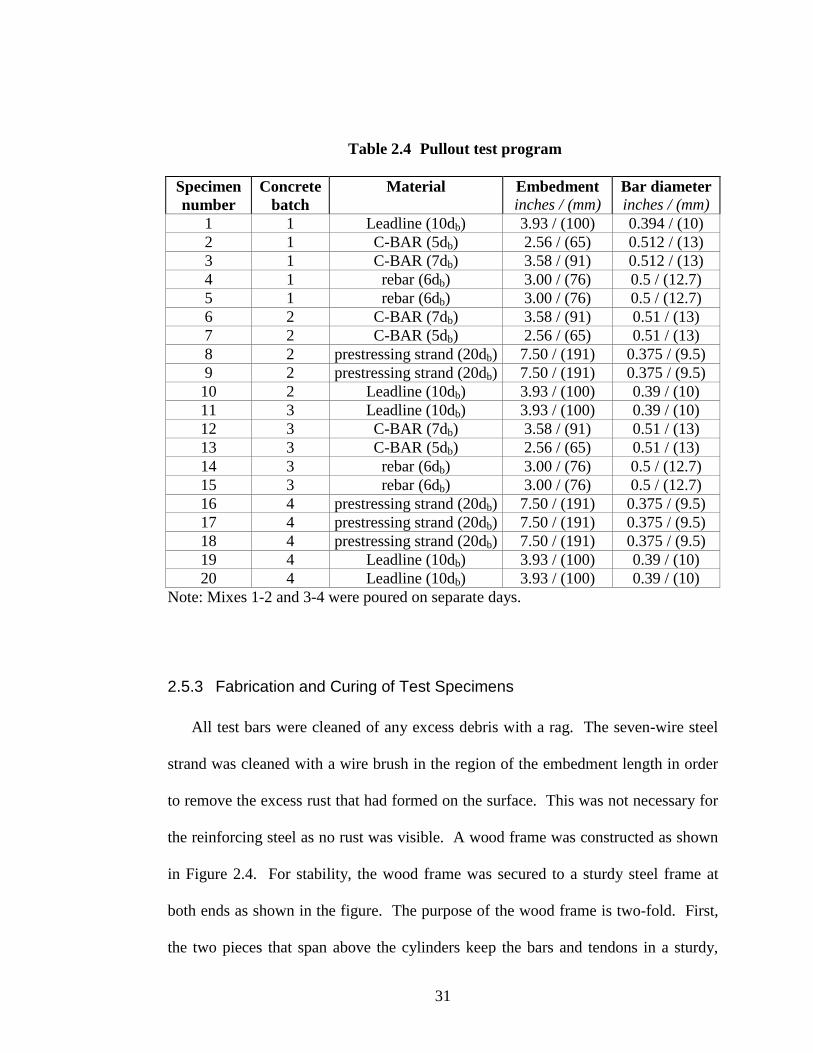
For this study, the primary parameter varied was the bar type. Table 2.4 gives a
summary of the test program. Four to six tests were chosen for each bar type and
embedment length. This was a reasonable number for the scope of the work and still
allowed for statistical significance in the event that some tests had to be discarded.
No automated data acquisition system was used to obtain continuous load-slip data.
The test data taken would be load at 0.025 mm (0.001in.) slip, load at first slip, the
value of the first slip, and the maximum load reached. The load at 0.025 mm slip is
prescribed by ASTM 882 as a load value to compare with tabulated required
minimum values.
31
Table 2.4 Pullout test program
Specimennumber
Concretebatch
Material Embedmentinches / (mm)
Bar diameterinches / (mm)
1 1 Leadline (10db) 3.93 / (100) 0.394 / (10)2 1 C-BAR (5db) 2.56 / (65) 0.512 / (13)3 1 C-BAR (7db) 3.58 / (91) 0.512 / (13)4 1 rebar (6db) 3.00 / (76) 0.5 / (12.7)5 1 rebar (6db) 3.00 / (76) 0.5 / (12.7)6 2 C-BAR (7db) 3.58 / (91) 0.51 / (13)7 2 C-BAR (5db) 2.56 / (65) 0.51 / (13)8 2 prestressing strand (20db) 7.50 / (191) 0.375 / (9.5)9 2 prestressing strand (20db) 7.50 / (191) 0.375 / (9.5)10 2 Leadline (10db) 3.93 / (100) 0.39 / (10)11 3 Leadline (10db) 3.93 / (100) 0.39 / (10)12 3 C-BAR (7db) 3.58 / (91) 0.51 / (13)13 3 C-BAR (5db) 2.56 / (65) 0.51 / (13)14 3 rebar (6db) 3.00 / (76) 0.5 / (12.7)15 3 rebar (6db) 3.00 / (76) 0.5 / (12.7)16 4 prestressing strand (20db) 7.50 / (191) 0.375 / (9.5)17 4 prestressing strand (20db) 7.50 / (191) 0.375 / (9.5)18 4 prestressing strand (20db) 7.50 / (191) 0.375 / (9.5)19 4 Leadline (10db) 3.93 / (100) 0.39 / (10)20 4 Leadline (10db) 3.93 / (100) 0.39 / (10)
Note: Mixes 1-2 and 3-4 were poured on separate days.
2.5.3 Fabrication and Curing of Test Specimens
All test bars were cleaned of any excess debris with a rag. The seven-wire steel
strand was cleaned with a wire brush in the region of the embedment length in order
to remove the excess rust that had formed on the surface. This was not necessary for
the reinforcing steel as no rust was visible. A wood frame was constructed as shown
in Figure 2.4. For stability, the wood frame was secured to a sturdy steel frame at
both ends as shown in the figure. The purpose of the wood frame is two-fold. First,
the two pieces that span above the cylinders keep the bars and tendons in a sturdy,
32
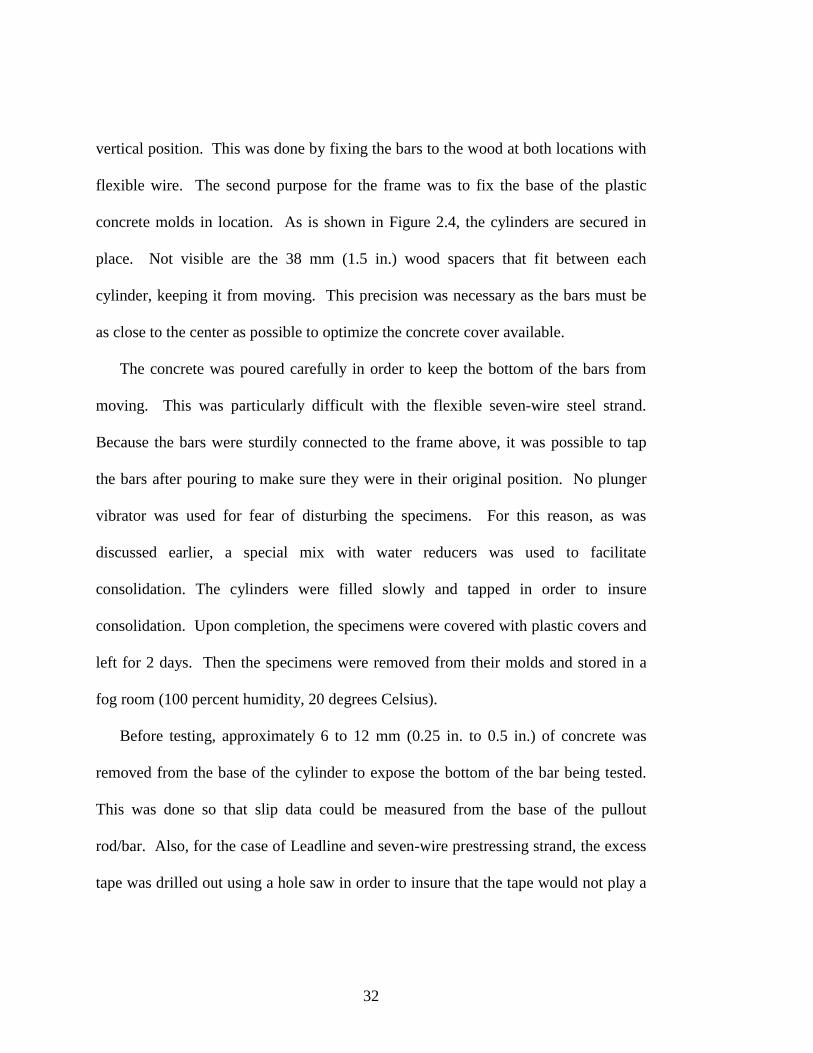
vertical position. This was done by fixing the bars to the wood at both locations with
flexible wire. The second purpose for the frame was to fix the base of the plastic
concrete molds in location. As is shown in Figure 2.4, the cylinders are secured in
place. Not visible are the 38 mm (1.5 in.) wood spacers that fit between each
cylinder, keeping it from moving. This precision was necessary as the bars must be
as close to the center as possible to optimize the concrete cover available.
The concrete was poured carefully in order to keep the bottom of the bars from
moving. This was particularly difficult with the flexible seven-wire steel strand.
Because the bars were sturdily connected to the frame above, it was possible to tap
the bars after pouring to make sure they were in their original position. No plunger
vibrator was used for fear of disturbing the specimens. For this reason, as was
discussed earlier, a special mix with water reducers was used to facilitate
consolidation. The cylinders were filled slowly and tapped in order to insure
consolidation. Upon completion, the specimens were covered with plastic covers and
left for 2 days. Then the specimens were removed from their molds and stored in a
fog room (100 percent humidity, 20 degrees Celsius).
Before testing, approximately 6 to 12 mm (0.25 in. to 0.5 in.) of concrete was
removed from the base of the cylinder to expose the bottom of the bar being tested.
This was done so that slip data could be measured from the base of the pullout
rod/bar. Also, for the case of Leadline and seven-wire prestressing strand, the excess
tape was drilled out using a hole saw in order to insure that the tape would not play a
33
role in the pullout results. Both of these procedures were performed with extreme
caution so as not to disturb any of the specimens.
2.5.4 Experimental Setup and Testing Procedure
Two slightly different testing setups were utilized based on the anchors used. A
large grip was needed to grip the steel tubes that acted as anchors for the FRP bars. A
Baldwin Universal Testing Machine had tension grips that were able to effectively
grab the large steel tubes. In order to use the universal testing machine (UTM), the
pullout setup was suspended beneath the testing machine as is shown in Figure 2.5.
The reinforcing steel and seven-wire strand could be gripped with a prestressing
chuck. A simple setup shown in Figure 2.6 was used by placing two I-beams next to
each other and placing the specimen and hydraulic ram on top. This process is more
efficient for repeated testing.
Figure 2.7 shows the dimensions and schematic of the FRP testing setup using the
UTM. A 19 mm (0.75 in.) thick steel washer with a 38 mm (1.5 in.) hole in the center
and a 3 mm (0.13 in.) thick rubber spacer was placed on top of the specimen to help
eliminate any stress concentrations on the top of the concrete cylinder near the
protruding bar. The ram was an Enerpac center-hole hydraulic ram (model RRH-
306), controlled with a 68.9 MPa (10,000 psi) Enerpac hand pump (model P-84). A
32 mm (1.25 in.) thick steel plate with steel angles welded on each corner was used in
the UTM setup to keep the jack from pushing directly against the grips above it. On
the base of the concrete cylinder, a specially fabricated piece secured with two hose

34
clamps was used to firmly hold a dial gage to measure bar slip during pullout. Figure
2.8 shows a close-up of the setup. The dial gage had 0.025 mm (0.001 in.)
increments and a range of movement of 18 mm (0.7 in.). In the UTM setup, the
cylinder, ram, and steel plate were stacked and placed on the bottom (moving) head
of the UTM. This setup was then raised into position so that the top head (stationary)
could grip the steel tubes. Once this was done, the lower head was lowered and the
dial gage was fixed to the cylinder.
In both setups, the ram was extended until there was a load applied against the
prestressing chucks or the top head of the UTM. The load was applied at a slow rate;
however, there was no way to accurately measure this rate as the load application was
done by hand. The applied loadings were measured with a pressure gage on the hand
pump which had increments of 0.345 MPa (50 psi). With a piston area of 4219 mm2
(6.54 in.2), this provides load increments of 1.5 kN (337 lbs.).
2.7 Results
2.7.1 General
In this section, the experimental results will be presented along with a discussion
of the various failure modes observed. Results are organized by the types of bars
tested so that direct comparisons can be made. Pullout forces (F) were converted to
bond strengths (τ) using equation 2.7.

35
ebld
F
πτ = (2.7)
where le = embedment length (see Table 2.4)
db = nominal bar diameter
The effect of concrete strength is not considered here. As stated in Section 2.3.6,
the concrete strengths were uniform enough that they would not affect the results of
the test. Furthermore, in looking at the bond strength data shown in Table 2.5
through Table 2.9, no clear trend exists with the small variation of concrete strength.
2.7.2 Test Results
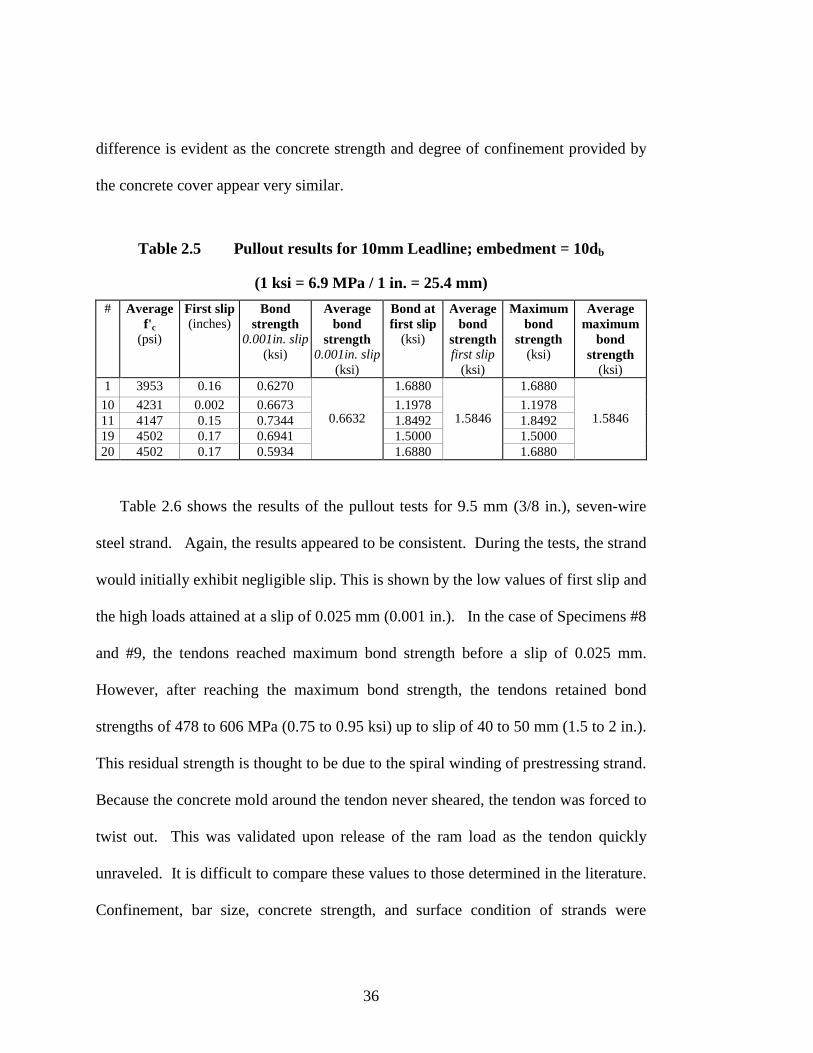
The results for the pullout of Leadline are shown in Table 2.5. All tests were
performed at 28 days unless otherwise noted. Each test gave consistent data except
for Specimen #10. In each of the other cases, loading steadily increased up to a slip
of 3.8 to 4.3 mm (0.15 to 0.17 in.). At this point, there was a sudden loss of load and
the bar began pulling out of the concrete cylinder with minimal additional load
applied. There was no additional load capacity after this. There were problems with
the epoxy anchor on Specimen #1. It had to be re-epoxied and pulled out at a later
date. The final cure time for Specimen #1 was 31 days. The results for this specimen
do not differ from the others significantly enough to discard its data. The average
bond strength found in this study was 10.9 MPa (1.58 ksi). However, Conrad et al.
(2000) attained bond strengths of 20 MPa (2.9 ksi). No clear reasoning for this
36
difference is evident as the concrete strength and degree of confinement provided by
the concrete cover appear very similar.
Table 2.5 Pullout results for 10mm Leadline; embedment = 10db
(1 ksi = 6.9 MPa / 1 in. = 25.4 mm)
# Averagef'c
(psi)
First slip(inches)
Bondstrength
0.001in. slip(ksi)
Averagebond
strength0.001in. slip
(ksi)
Bond atfirst slip
(ksi)
Averagebond
strengthfirst slip
(ksi)
Maximumbond
strength(ksi)
Averagemaximum
bondstrength
(ksi)1 3953 0.16 0.6270 1.6880 1.6880
10 4231 0.002 0.6673 1.1978 1.197811 4147 0.15 0.7344 1.8492 1.849219 4502 0.17 0.6941 1.5000 1.500020 4502 0.17 0.5934
0.6632
1.6880
1.5846
1.6880
1.5846
Table 2.6 shows the results of the pullout tests for 9.5 mm (3/8 in.), seven-wire
steel strand. Again, the results appeared to be consistent. During the tests, the strand
would initially exhibit negligible slip. This is shown by the low values of first slip and
the high loads attained at a slip of 0.025 mm (0.001 in.). In the case of Specimens #8
and #9, the tendons reached maximum bond strength before a slip of 0.025 mm.
However, after reaching the maximum bond strength, the tendons retained bond
strengths of 478 to 606 MPa (0.75 to 0.95 ksi) up to slip of 40 to 50 mm (1.5 to 2 in.).
This residual strength is thought to be due to the spiral winding of prestressing strand.
Because the concrete mold around the tendon never sheared, the tendon was forced to
twist out. This was validated upon release of the ram load as the tendon quickly
unraveled. It is difficult to compare these values to those determined in the literature.
Confinement, bar size, concrete strength, and surface condition of strands were
37
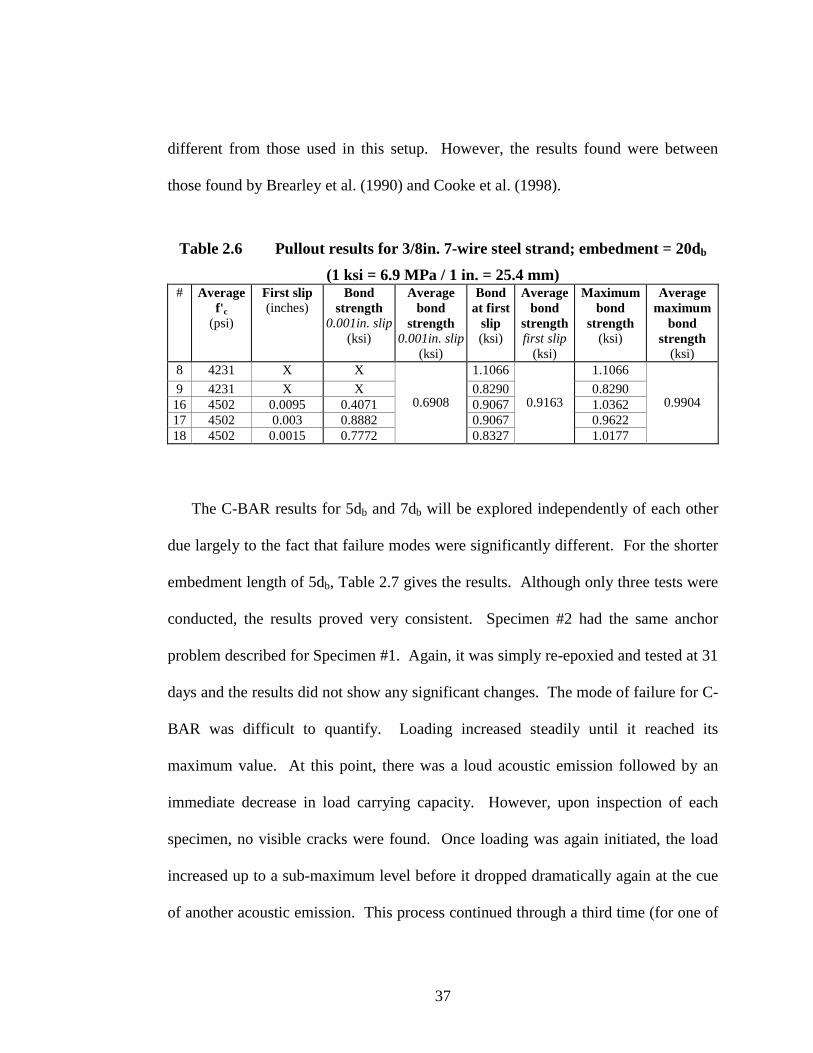
different from those used in this setup. However, the results found were between
those found by Brearley et al. (1990) and Cooke et al. (1998).
Table 2.6 Pullout results for 3/8in. 7-wire steel strand; embedment = 20db
(1 ksi = 6.9 MPa / 1 in. = 25.4 mm)# Average
f'c
(psi)
First slip(inches)
Bondstrength
0.001in. slip(ksi)
Averagebond
strength0.001in. slip
(ksi)
Bondat first
slip(ksi)
Averagebond
strengthfirst slip
(ksi)
Maximumbond
strength(ksi)
Averagemaximum
bondstrength
(ksi)8 4231 X X 1.1066 1.1066
9 4231 X X 0.8290 0.829016 4502 0.0095 0.4071 0.9067 1.036217 4502 0.003 0.8882 0.9067 0.962218 4502 0.0015 0.7772
0.6908
0.8327
0.9163
1.0177
0.9904
The C-BAR results for 5db and 7db will be explored independently of each other
due largely to the fact that failure modes were significantly different. For the shorter
embedment length of 5db, Table 2.7 gives the results. Although only three tests were
conducted, the results proved very consistent. Specimen #2 had the same anchor
problem described for Specimen #1. Again, it was simply re-epoxied and tested at 31
days and the results did not show any significant changes. The mode of failure for C-
BAR was difficult to quantify. Loading increased steadily until it reached its
maximum value. At this point, there was a loud acoustic emission followed by an
immediate decrease in load carrying capacity. However, upon inspection of each
specimen, no visible cracks were found. Once loading was again initiated, the load
increased up to a sub-maximum level before it dropped dramatically again at the cue
of another acoustic emission. This process continued through a third time (for one of

38
the specimens) at which no further significant load was attained. Karlsson (1997)
gives a thorough description of the failure modes pertaining to the bond failure of C-
BAR. The failure routine described is thought to be a result of the shearing off of the
ribs.
The rather large bond strengths attained here compare satisfactorily with studies
done by Conrad et al. (2000) and Karlsson (1997). Compared to the results found by
Rizkalla (1997), the large difference can be attributed to the lack of radial friction
confinement in their test setup. In this test setup, the hydraulic jack was placed
directly on the top surface of the specimen causing a certain amount of radial friction
confinement. For C-BAR, because the ribs on the surface are raised so high,
confinement can make a significant difference when considering overall bond
capacity.
Table 2.7 Pullout results for 13mm C-BAR; embedment = 5db
(1 ksi = 6.9 MPa / 1 in. = 25.4 mm)# Average
f'c
(psi)
First slip(inches)
Bondstrength
0.001in. slip(ksi)
Averagebond
strength0.001in. slip
(ksi)
Bond atfirst slip
(ksi)
Averagebond
strengthfirst slip
(ksi)
Maximumbond
strength(ksi)
Averagemaximum
bondstrength
(ksi)2 3953 0.03 1.0996 3.2850 3.2850
7 4231 0.025 1.2029 2.8082 2.808213 4147 0.03 1.1234
1.1420
3.3645
3.1526
3.3645
3.1526
For C-BAR with a longer embedment length of 7db, Table 2.8 gives the results.
Again, the results proved to be consistent. Each specimen acted similarly to what was
exhibited by the 5db embedment case, except that complete splitting failure of the
concrete cylinder occurred before the maximum bond strength could be reached.

39
Thus, the maximum bond strengths were governed by a mechanism that is different
from that with an embedment length of 5db. Figure 2.9 shows the splitting crack on
the specimen. The tensile stress near the bonded region in the concrete created by the
pullout action of the bar caused immediate splitting failure as shown in Figure 2.9. A
small amount of load capacity was shown by the pullout specimen after the splitting
failure, but this quickly dropped to zero.
Table 2.8 Pullout results for 13mm C-BAR; embedment = 7db
(1 ksi = 6.9 MPa / 1 in. = 25.4 mm)# Average
f'c
(psi)
First slip(inches)
Bondstrength
0.001in. slip(ksi)
Averagebond
strength0.001in. slip
(ksi)
Bond atfirst slip
(ksi)
Averagebond
strengthfirst slip
(ksi)
Maximumbond
strength(ksi)
Averagemaximum
bondstrength
(ksi)
3 3953 0.015 1.3020 2.5451 2.5451
6 4231 0.025 1.2566 2.5168 2.516812 4147 0.02 1.3247
1.29442.7438
2.60192.7438
2.6019
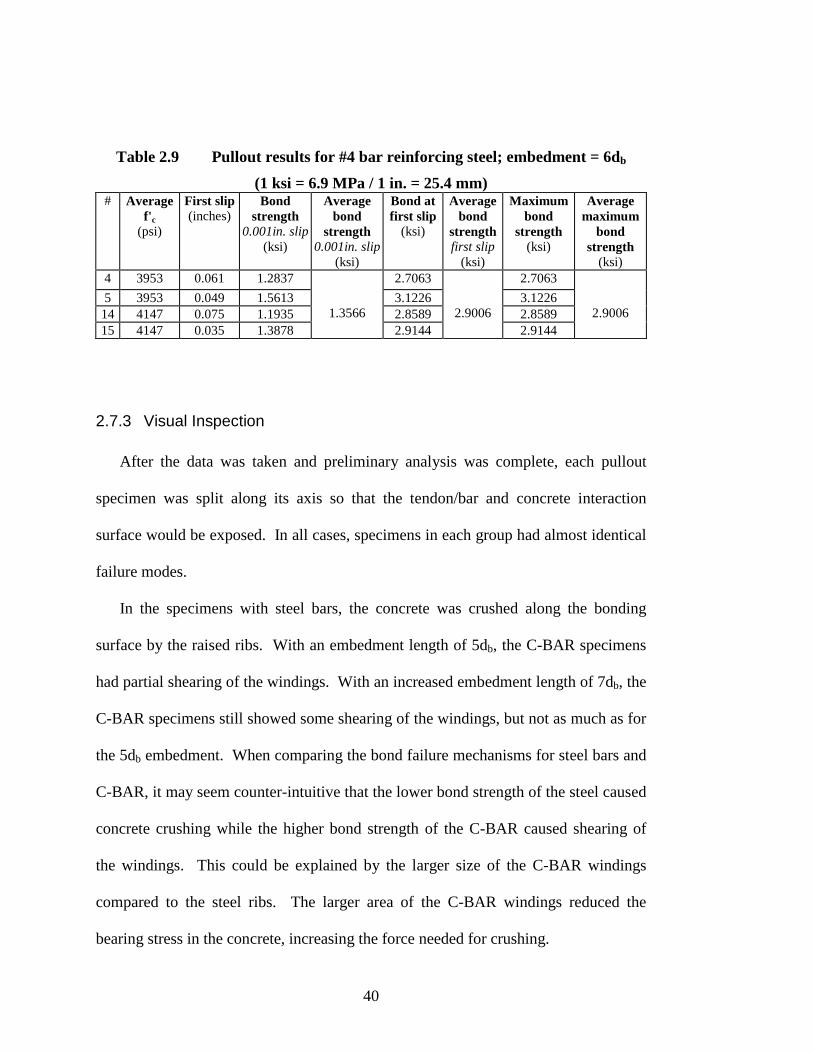
Table 2.9 shows the results for the pullout tests for #4 steel bars. The load
steadily increased up to the first slip where the maximum load was reached.
However, for Specimen #15, the slip remained constant at 0.76 mm (0.03 in.) for a
short while as the load increased. Soon after, the specimen reached its maximum
capacity and the residual bond strength was reduced to almost zero. The results here
do not relate well with those found by Eligehausen et al. (1983). Even in their case
where steel confinement was provided, the bond strength never consistently exceeded
13.8 MPa (2000 psi).
40
Table 2.9 Pullout results for #4 bar reinforcing steel; embedment = 6db
(1 ksi = 6.9 MPa / 1 in. = 25.4 mm)# Average
f'c
(psi)
First slip(inches)
Bondstrength
0.001in. slip(ksi)
Averagebond
strength0.001in. slip
(ksi)
Bond atfirst slip
(ksi)
Averagebond
strengthfirst slip
(ksi)
Maximumbond
strength(ksi)
Averagemaximum
bondstrength
(ksi)4 3953 0.061 1.2837 2.7063 2.7063
5 3953 0.049 1.5613 3.1226 3.122614 4147 0.075 1.1935 2.8589 2.858915 4147 0.035 1.3878
1.35662.9144
2.90062.9144
2.9006
2.7.3 Visual Inspection
After the data was taken and preliminary analysis was complete, each pullout
specimen was split along its axis so that the tendon/bar and concrete interaction
surface would be exposed. In all cases, specimens in each group had almost identical
failure modes.
In the specimens with steel bars, the concrete was crushed along the bonding
surface by the raised ribs. With an embedment length of 5db, the C-BAR specimens
had partial shearing of the windings. With an increased embedment length of 7db, the
C-BAR specimens still showed some shearing of the windings, but not as much as for
the 5db embedment. When comparing the bond failure mechanisms for steel bars and
C-BAR, it may seem counter-intuitive that the lower bond strength of the steel caused
concrete crushing while the higher bond strength of the C-BAR caused shearing of
the windings. This could be explained by the larger size of the C-BAR windings
compared to the steel ribs. The larger area of the C-BAR windings reduced the
bearing stress in the concrete, increasing the force needed for crushing.
41
In the seven-wire prestressing strand specimens, a perfect concrete spiral
remained which formed around the strand during casting. During pullout, the strand
twisted out without any shearing of the concrete. This was exactly as expected. In
the Leadline specimen, the raised portion of the spiral deformation sheared off along
the whole embedment length.
2.7.4 Discussion of Results
A direct comparison of Leadline and prestressing strand shows that Leadline
consistently has higher bond strength. Five Leadline tests give an average bond
strength of 10.9 MPa (1.58 ksi) while five steel strand tests give an average bond
strength of 6.8 MPa (0.99 ksi). The bar chart in Figure 2.10 gives a comparison of
the final bond test results.
Making the same comparison for C-BAR and reinforcing steel, it can be inferred
that C-BAR has a higher bond strength than steel bars. In this case, the results are
only separated by a small difference. Three C-BAR tests with an embedment length
of 5db give an average bond of 21.7 MPa (3.15 ksi) while the #4 bars give an average
bond strength of 20 MPa (2.9 ksi).
Results for C-BAR as shown in section 2.7.2 are similar to what others have
obtained (Karlsson, 1997; Conrad, 2000). The tests performed by Eligehausen et al.
(1983) were inconclusive because concrete splitting was the governing failure
mechanism. Since the tests discussed here did not show any concrete splitting, a
comparison cannot be made.

42
In order to further examine the results, the ultimate bond strength found in the
pullout tests for C-BAR and reinforcing steel is related to the development length
required. Nilson and Winter (1991) have presented this relation. If the tensile stress
reached in the steel is designated as fs, the average bond force per unit length (U) can
be computed:
l
AfU bs= (2.8)
where Ab = area of the bar
If the unit bond force U is smaller than the ultimate value Un which can be estimated
from pullout tests, no bond failure will occur over the length l. Then, in order to
make sure that a bar is anchored with sufficient bond to develop its maximum usable
strength (yield stress, fy), the required development length can be estimated by
equation 2.9.
n
byd U
Afl = (2.9)
Table 2.10 compares the development lengths obtained by the ACI equation for steel
and the equation for FRP bars in the ACI 440H draft document with the development
lengths predicted by equation 2.9 using the average bond strengths obtained in this
study. In using equation 2.9 for C-BAR, fu was used in place of fy. This is due to the

43
fact that FRP materials are brittle with no material nonlinearity. In the calculations,
values for the variables defined in the ACI code (equation 2.2 in this chapter) are as
follows: α = 1.0, β = 1.0, γ = 1.0, λ = 1.0, and (c + Ktr)/db = 2.5.
Table 2.10 Comparison of development lengths (1 in. = 25.4 mm)
Material ACI equationfor steel
(equation 2.2)
ACI 440H draftequation for FRP(equation 2.3a/2.3b)
Calculateddevelopment length
(equation 2.9)C-BAR 20 in. 4.36 in.
Reinforcing Bar 15 in. 1.75 in.
The values in Table 2.10 show an extremely large safety margin in the design
equations.

44
Figure 2.1 Materials used in testing (from left to right): reinforcing steel, C-BAR, prestressing strand, and Leadline

45
Figure 2.2 Leadline anchor pieces (left to right, aluminumsleeve, two grooved wedge pieces, steel socket)

46
Figure 2.3 Debonded areas and embedment length
Figure 2.4 Specimen casting setup

47
Figure 2.5 FRP bar specimen setup using Universal Testing Machine

48
Figure 2.6 Steel bar specimen setup
49
14 - 18
2.5
12
3
setup to holdmeasuring device
concrete specimen
1/8" rubber spacer
1/2" steel washer
dial gage
steel tube anchor
grips
steel piece
centerhole jack
upper head ofloading press
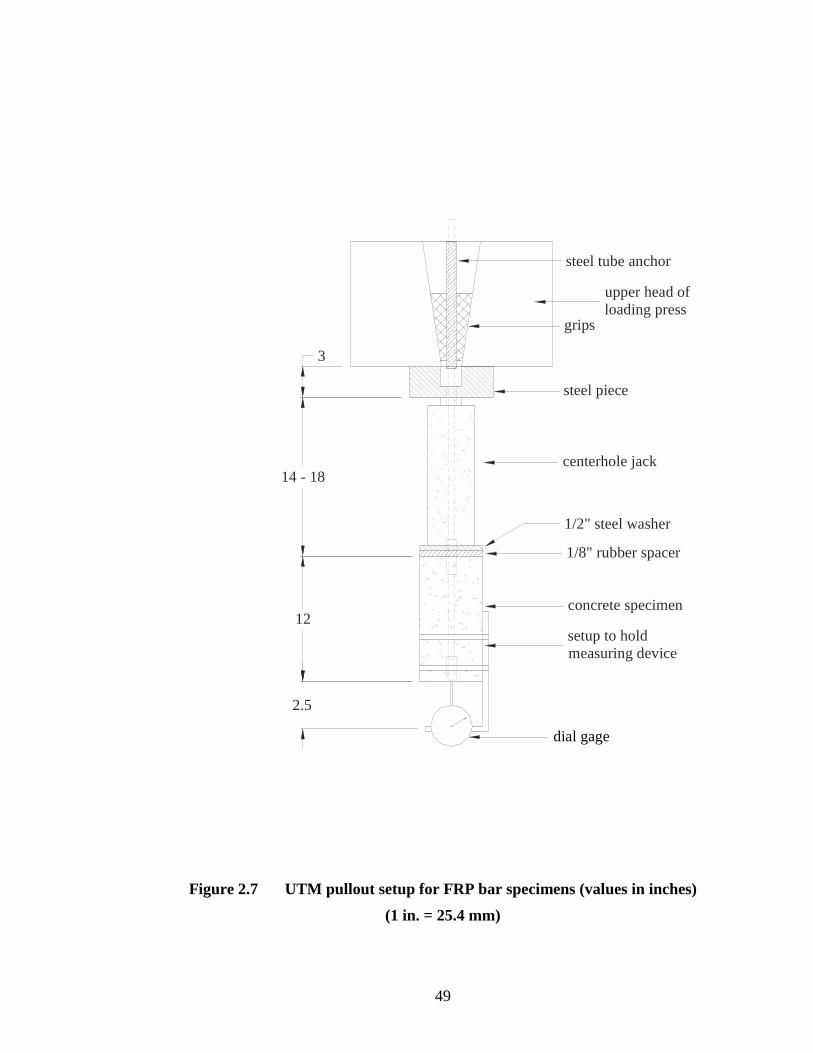
Figure 2.7 UTM pullout setup for FRP bar specimens (values in inches)
(1 in. = 25.4 mm)
50
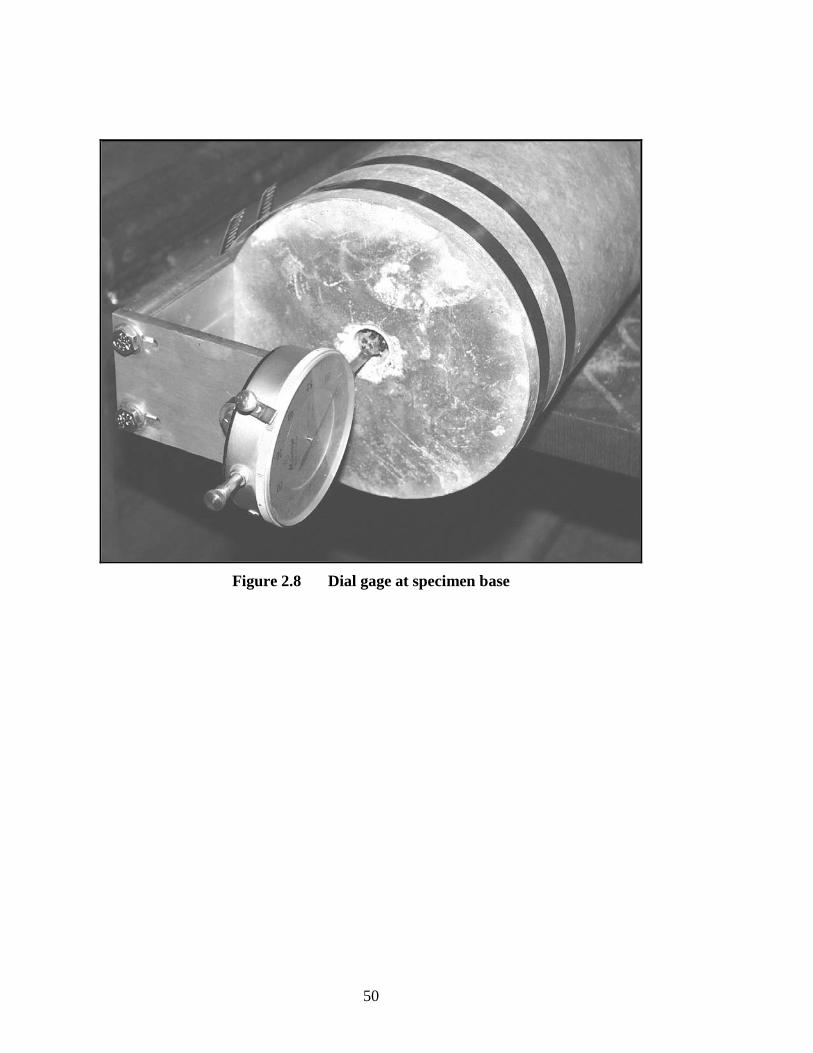
Figure 2.8 Dial gage at specimen base

51
Figure 2.9 Concrete splitting during pullout
0
0.5
1
1.5
2
2.5
3
3.5
4
Leadline Steel Strand C-BAR** Rebar
bo
nd
stre
ng
th(k
si)
material type average pullout specimen result
**5db embedment length
Figure 2.10 Bond strengths for each specimen in pullout tests
(1 ksi = 6.9Mpa)


53
3. DESIGN OF PRECAST PANEL WITH COMPOSITE TOPPING
3.1 General
The panels being investigated in this study are designed to rest on two post-
tensioned cast-in-place box girders as shown in Figure 3.1. They are used as stay-in-
place forms that are later strengthened with the casting of a 125 mm (5 in.) thick
reinforced topping slab.
As will be discussed below, the design of the panels used in the bridge project at
I-225/Parker Road is extremely conservative. It is more interesting to evaluate the
performance of panels designed to barely satisfy the minimum requirements of
AASHTO. For this reason, two sets of panels are designed in this chapter to satisfy
the minimum AASHTO requirements, one with steel strands and the other with CFRP
tendons. The actual bridge panels designed by CDOT are based on the 16th Edition of
AASHTO Standard Specifications (1996). For the sake of consistency, the design
presented here will also follow the same standards.
Design techniques for the use of FRP are still in their development stages.
Research performed by Dolan et al. (2000) has provided a good guidance for design
using Leadline prestressing tendons. Their research will be consulted to supplement
the specifications covered in the 16th Edition of AASHTO.

54
3.2 CDOT Panels
In the bridge project at I-225/Parker Road, a standard panel design used by CDOT
has been adopted. The panel size is about 2950 mm (116 in.) wide and 2438 mm (96
in.) long. The width is defined as the dimension along the span of the panel in the
direction perpendicular to that of traffic. The design is based on 9.5 mm (3/8 in.),
Grade 270, low-relaxation seven-wire strands. Each panel has 20 steel strands at a
center-to-center spacing of 121 mm (4.75 in.). The temperature steel is #3 bars (9.5
mm diameter) at a spacing of 305 mm (12 in.). They also serve as the distribution
reinforcement. They satisfy the AASHTO requirement that a minimum of 71 mm2
(0.11 in2) of reinforcement be provided per 305 mm (12 in.) of panel width. The
design has been used for a variety of span lengths and is very conservative for the
span length used in this project.
Some of the panels in the bridge have CFRP tendons for prestressing and GFRP
bars for the temperature reinforcement. In this case, the 3/8 in. (9.5 mm) steel strands
are replaced by 10 mm (0.39 in.) CFRP tendons on a one-to-one basis, and the #3 (9.5
mm diameter) mild steel reinforcement is replaced by 13 mm (0.5 in.) GFRP bars at a
spacing of 152 mm (6 in.), which is to account for the fact that GFRP bars have a
much lower modulus of elasticity than steel. Since the CFRP tendons have a slightly
larger diameter and significantly higher strength than the steel strands, the panels with
the FRP reinforcement are perceived to be extremely conservative for this
application.

55
The prestressing forces applied to the steel strands and the CFRP tendons are
identical. Each tendon is jacked to 76 kN (17 kips).
The design of a typical panel is illustrated in Figure 3.2. All panels have straight
tendons with an eccentricity of 12 mm (0.47 in.). This eccentricity is required to
provide an additional factor of safety for the construction loads with the given
tolerance for the placement of the tendons.
As mentioned in Chapter 2, Leadline is chosen by the contractor in this project
mainly because it has a well-developed anchoring chuck for the ease of prestressing.
3.3 Strength Evaluation of Panels and Composite Slabs with FRP
Tendons
An allowable stress approach is used for the design of the prestressed panels and
the cast-in-place topping slabs. However, the ultimate strengths of the panels and
composite slabs have to be checked after the design. These checks require the
evaluation of the nominal moment capacities of the panels and the slabs. For
panels/slabs with Leadline tendons, this requires extra attention as CFRP tendons
deform linearly elastically up to rupture as opposed to steel strands which develop a
significant nonlinear behavior before rupture. Even though the composite slabs in
this case are under-reinforced, the panels themselves are over-reinforced. For
members with FRP reinforcement, it is beneficial to be over-reinforced because of the
brittle nature of the FRP bars. However, if the nominal capacity of a member is
substantially higher than the design load, this is not an issue. Hence, in this project
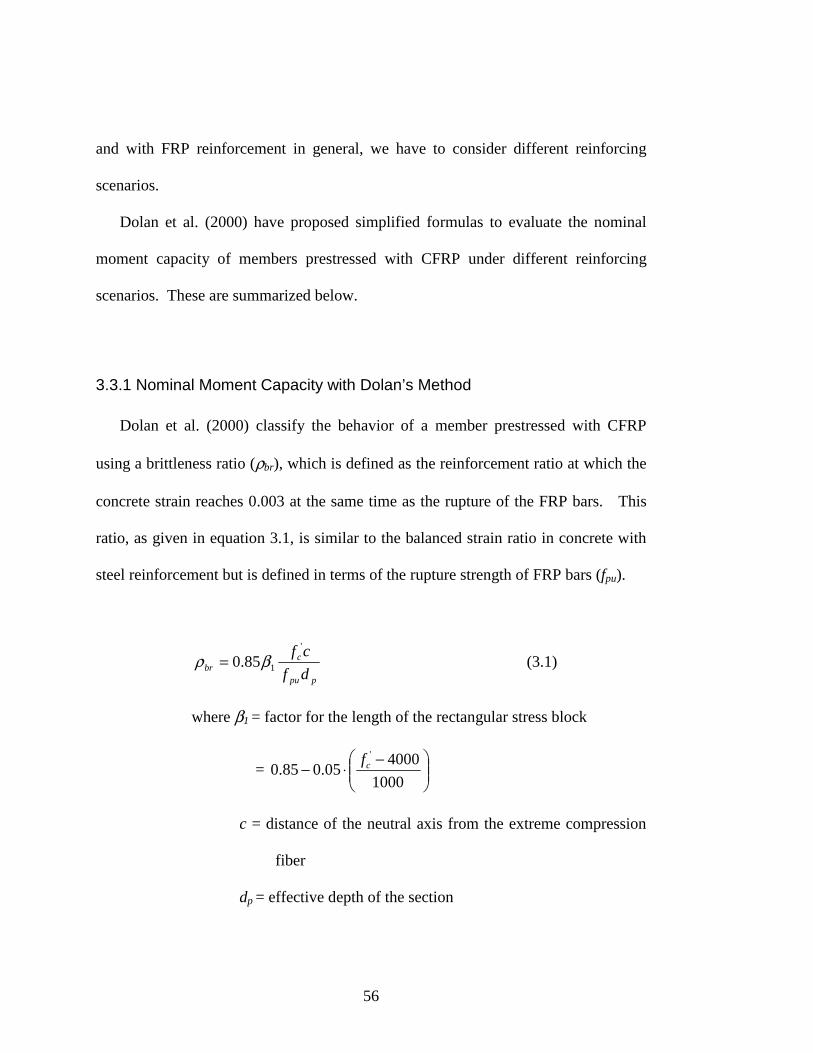
56
and with FRP reinforcement in general, we have to consider different reinforcing
scenarios.
Dolan et al. (2000) have proposed simplified formulas to evaluate the nominal
moment capacity of members prestressed with CFRP under different reinforcing
scenarios. These are summarized below.
3.3.1 Nominal Moment Capacity with Dolan’s Method
Dolan et al. (2000) classify the behavior of a member prestressed with CFRP
using a brittleness ratio (ρbr), which is defined as the reinforcement ratio at which the
concrete strain reaches 0.003 at the same time as the rupture of the FRP bars. This
ratio, as given in equation 3.1, is similar to the balanced strain ratio in concrete with
steel reinforcement but is defined in terms of the rupture strength of FRP bars (fpu).
ppu
cbr df
cf '
185.0 βρ = (3.1)
where β1 = factor for the length of the rectangular stress block
=
−⋅−1000
400005.085.0
'cf
c = distance of the neutral axis from the extreme compression
fiber
dp = effective depth of the section

57
This ratio can also be expressed in terms of strain quantities as shown in equation 3.2.
Note that the decompression strain is normally an order of magnitude less than the
flexural strain and is therefore eliminated to simplify the computation.
−+=
pepucu
cu
pu
cbr f
f
εεεεβρ
'
185.0 (3.2)
where εcu = concrete compressive strain at failure (0.003)
εpu = ultimate tensile strain of tendons
εpe = effective prestress strain
Based on the definition of the brittleness ratio in equations 3.1 and 3.2, Dolan et
al. (2000) define three behavioral scenarios. First, if the reinforcement ratio ρ > ρbr,
the member will fail by the compression of the concrete with no failure of the tendon.
Second, if 0.5ρbr < ρ < ρbr, the tendon will rupture and the concrete compressive
stresses will be significantly non-linear. For this case, an equivalent rectangular
stress distribution can be used to predict the member strength. Third, if ρ < 0.5ρbr,
then the member is under-reinforced and the concrete stress is governed by a linearly
elastic behavior up to tendon rupture. The use of 0.5ρbr as the dividing point for the
above scenarios was selected by Dolan without extensive validation. Further
confirmation by experimental studies is recommended to validate this limit. The
calculation of the nominal moment capacity for each scenario is summarized below.

58
MEMBERS WITH NORMAL REINFORCEMENT RATIO (0.5ρbr < ρ < ρbr)
For this case, the nominal moment capacity can be computed in the same way as
specified in the 16th Edition of AASHTO. The only difference in Dolan’s formula is
that the ultimate strength of the FRP tendons (fpu) is used in place of the computed
stress in the steel strand at ultimate load (fps) as shown in the following equation.
−=
'
2
7.11
c
pupupn f
ffbdM
ρρ (3.3)
UNDER-REINFORCED MEMBERS (ρ < 0.5ρbr)
For an under-reinforced member, the stress in the concrete is given by a linear
stress-strain relation. The neutral axis is located at the centroidal axis of the
transformed section. The distance from the compression face to the neutral axis can
be defined as c = kdp where dp is the depth of tendon in the concrete section. Based
on the fact that the net axial force is zero, k can be calculated as follows.
( ) nnnk ρρρ −+= 22 (3.4)
where n = the ratio of the modulus of elasticity of the tendons to that of the
concrete
The resulting nominal moment is shown in equation 3.5.

59
−=
312 k
fbdM pupn ρ (3.5)
OVER-REINFORCED MEMBERS (ρ > ρbr)
For an over-reinforced member, the tendons will remain elastic and undamaged at
failure. Dolan first defines the neutral axis location as c = kudp, the distance from the
compression face of the section to the neutral axis. The strain in the prestressing
tendon (εp) is equal to the effective prestressing strain (εpe) plus the flexural strain (εf).
Again, the decompression strain is ignored here. Equation 3.6 allows one to calculate
εp based on strain compatibility if the concrete strain at failure (εcu) is known. The
strain εcu is assumed to be 0.003.
u
ucupep k
k−+=
1εεε (3.6)
Knowing that the tendon stress is fps =εpEp, and using the rectangular stress block
assumption, the equilibrium of the forces in the cross section leads to equation 3.7.
pucps dkbfbdf 1'85.0 βρ = (3.7)

60
Defining a material constant λ = (Epεcu)/(0.85f’cβ1) and combining equations 3.6 and
3.7, one arrives at equation 3.8 to obtain ku.
−−
−=
cu
pe
cu
piuk
εερλ
εερλρλ 1
21
2
2
(3.8)
Finally, the nominal moment capacity of the over-reinforced section is determined by
equation 3.9.
−=
21'85.0 12
1u
pucn
kdkbfM
ββ (3.9)
3.3.2 Nominal Moment Capacity of Composite Slabs
For the composite slabs considered here, the ultimate moment capacity is
governed by the rupture of the tendons. In this case, a simple yet rigorous approach
can be used to evaluate the moment capacity based on the strain compatibility
between the tendons and concrete and the nonlinear stress-strain behavior of concrete.
This method can be used to check the accuracy of the formulas proposed by Dolan et
al. (2000) for members that are in the transition zone from under-reinforcement to
normal reinforcement.

61
The incremental strain ∆εps in the tendons from the effective prestress state to
rupture can be calculated by equation 3.10.
p
pepups E
ff −=∆ε (3.10)
With ∆εps from equation 3.10 and assuming that the neutral axis location is known,
one can express the strain in the concrete at the rupture of the tendons as follows.
cd
yy
p
psc −
∆=
εε )( (3.11)
dp = depth of tendon in concrete section
c = location of neutral axis as defined by the distance from the top of
the section
y = distance along the vertical axis measured from the neutral axis
A model proposed by Kent and Park (1971) is used to represent the stress-strain
behavior of concrete. In this model, the following sets of equations are used to define
the compressive stress-strain relation of concrete.
For 0 < εc< 0.002, ( )
−=
2
002.0002.0
2' ccccc ff
εεε (3.12)

62
For 0.002 < εc <1000'
'002.6
−+
c
c
f
f, ( ) ( )
002.01000'
'002.03
002.0'5.0'
−
−
+−
−=
c
c
ccccc
f
f
fff
εε (3.13)
For εc >1000'
'002.6
−+
c
c
f
f, ( ) ccc ff '2.0=ε (3.14)
In the above equations, stress is in psi. The neutral axis location c in equation 3.11
is determined by equating the compressive force in the concrete to the tensile force in
the tendons. This is done in an iterative manner. The tensile stress in the concrete is
assumed zero. By substituting equation 3.11 into equations 3.12, 3.13, and 3.14, the
total force in the concrete can be determined by integration. The iterative procedure
is presented as follows:
1. An initial guess for c is made that is less than half of the total section depth
(d).
2. Based on this value for c, the integration limits for computing the compressive
forces are determined.
3. Once the limits are computed, the force in the concrete is computed by
integrating the stresses given by equations 3.12, 3.13, and 3.14.
4. The difference between the computed force in the concrete and the known
tendon force is computed. This residual error is used to calculate a new value
of c which further minimizes this residual error.
63
5. Repeat steps 2 through 4 until the compressive force in the concrete is equal to
the tensile force in the tendons. Once this occurs, the residual error is zero,
and the value for c is obtained.
Once equilibrium has been established with the correct value for c, the nominal
moment capacity is computed by integration. This procedure is programmed using
Mathcad 2000.
3.3.3 Comparison of Evaluation Methods
As discussed earlier, Dolan et al. (2000) have suggested that a reinforcement ratio
of 0.5ρbr be the transition point from the under-reinforced to normal-reinforced
situation. Given the higher accuracy of the nominal moment capacity evaluated with
the Kent and Park model for concrete presented in the previous section, this more
refined approach is used to evaluate the formulas and the transition point proposed by
Dolan et al. (2000). To this end, three separate methods are used to compute the
nominal moment capacity for a 215 mm (8.5 in.) thick composite slab. They are the
refined method presented in section 3.3.2, and the two formulas proposed by Dolan et
al. for normal-reinforced and under-reinforced members, respectively. All variables
are set equal for each case including the depth of the prestressing tendon dp, the
concrete strength f’c, the ultimate tendon strength fpu, and the effective prestress fpe.
The area of the prestressing tendons used is varied so that ratio of the reinforcement

64
ratio to the brittleness ratio (ρ/ρbr) varies from 0.1 to 1.0. The results are
summarized in Table 3.1. By comparing the results from Dolan et al.’s simplified
formulas to those from the refined method, we can see that the simplified formulas
are sufficiently accurate. However, the transition point for under-reinforcement to
normal reinforcement is between 0.3ρbr and 0.35ρbr.
Table 3.1 Comparison of strength evaluation methods (in-kips)
ρρρρ/ρρρρbr Mn (1)Refined Method
Mn (Dolan) (2)Normal reinforced
Mn (Dolan) (3)Under-reinforced
%Difference(1) & (2)
%Difference(1) & (3)
0.10 32.6 32.9 32.7 1.0 0.40.15 48.8 49.2 49.0 0.8 0.30.20 64.7 65.4 65.1 1.1 0.70.25 80.7 81.4 81.3 0.9 0.70.30 96.4 97.4 97.3 1.0 0.90.35 112.3 113.2 113.4 0.8 1.00.40 127.9 128.9 129.4 0.8 1.20.45 143.6 144.5 145.3 0.6 1.20.50 159.0 160.0 161.3 0.6 1.40.60 189.8 190.6 193.0 0.4 1.70.70 220.3 220.7 224.7 0.2 2.00.80 250.8 250.3 256.2 -0.2 2.10.90 280.6 279.5 287.6 -0.4 2.51.00 309.8 308.3 319.0 -0.5 3.0
3.4 Design Considerations for Panels with FRP Tendons
As stated earlier, the CDOT panels are extremely conservative. Their capacities
are way beyond the AASHTO (1996) requirements. To explore the future use of
Leadline in an economical fashion, panels that are designed to barely satisfy the
minimum AASHTO requirements are evaluated experimentally. For this purpose,
two sets of panel designs are considered here. One is with 9.5 mm (3/8 in.) steel
strands, and the other is with 8 mm (0.315 in.) Leadline bars. Specific design

65
considerations for Leadline bars, namely, the allowable pretensioning stress, the
relaxation losses, and the required development lengths are discussed.
3.4.1 Jacking Stress and Initial Prestress
The maximum allowable initial prestress (fpi) is governed by the creep-rupture
behavior of FRP tendons. As discussed by Dolan et al. (2000), this process has three
stages: primary, secondary, and tertiary. In the primary stage, the strain steadily
increases, but causes no permanent fiber damage. During the secondary stage, large
sustained stresses cause weaker fibers in the tendons to break. Upon the initial fiber
rupture, the excess load is transferred by way of the epoxy matrix to the other fibers
in the tendon. If the stress level is low enough, fiber damage is confined to the
secondary creep level and the tendon has an unlimited service life. However, if the
stress level is too high, the creep process will move into the tertiary stage. As a
result, the remaining fibers are overloaded, continuing this process until complete
tendon failure. Tests reported by Dolan et al. (2000) were performed with the
intention of finding the appropriate stress level that will not cause creep-rupture. In
the tests, a concrete cylinder with a concentrically placed Leadline bar was used.
The Leadline bar was first pretensioned and gripped at both ends with the concrete
cylinder cast later. At one end, a compressed spring is placed between the grip and
the supporting frame in order to apply a continuous load against the grip. This places
a constant stress on the tendon during testing. All tests were performed for 12,000
hours in a sealed environmental chamber to simulate a concrete/alkaline environment
66
typical of prestressing applications. Time and rupture stress data were collected in
the 12,000-hour tests. The rupture stress was plotted as a percent of the ultimate
strength against time on a semi-logarithmic scale. Using this plot, the rupture stress
data was then extrapolated to 1,000,000 hours. The predicted allowable stress level
for CFRP prestressing tendons to achieve 100 years of service life is about 0.7fpu.
Based on these tests, Dolan et al. (2000) recommend a maximum jacking stress of
0.65fpu and a maximum initial prestress of 0.6fpu after transfer.
3.4.2 Initial Prestress Losses
Elastic shortening and tendon relaxation are the main sources of initial prestress
losses for pretensioned concrete. Elastic shortening loss can be computed in the same
way as for normal prestressed concrete. Relaxation loss for CFRP prestressing
tendons has not been clearly understood due to limited research in this area. Dolan et
al. (2000) present a discussion to estimate this loss. The discussion identifies three
sources that constitute tendon relaxation. First, after the jacking stress is applied,
some of the load is carried by the resin matrix. This resin matrix relaxes releasing its
portion of the load. For CFRP, this relaxation loss is estimated to be 0.6 to 1.2
percent of the initial prestress. This value is dependent on the ratio of the modulus of
elasticity of the matrix to that of the carbon fibers. It also depends on the volume
ratio of the epoxy matrix in the tendon. Second, the fibers in the pultruded section are
never completely parallel; given time, the stress in the tendon will likely straighten
the fibers out. This is a function of the quality control of the pultrusion process. A

67
relaxation loss of one to two percent of the initial prestressing force is estimated from
this phenomenon. Third, each of the individual fibers may relax. However, CFRP
tendons have negligible fiber relaxation. Total relaxation is a result of these three
contributions. The study proposes an approximate value of one to three percent for
the total relaxation loss in CFRP tendons.
Dolan et al. (2000) did some tests to quantify the initial losses with different FRP
tendons and steel strands. Jacking stresses of 60 to 65 percent of the ultimate strength
were applied to a series of tendons used in laboratory-scale beams. After the steel
anchors were set and the tendons were allowed to relax for two hours prior to pouring
concrete, prestress losses were noted to be between 9 and 14 percent. If the above
estimates are correct, most of the losses must be contributed by factors other than the
tendon relaxation. Both Leadline and steel strands were at the low end of this
spectrum with Leadline CFRP tendons having the least initial loss. For the purpose
of design in this report, a loss of ten percent will be applied before release of tendons
as identified in the above study.
3.4.3 Development Length
The results of the pullout tests presented in Chapter 2 indicate that the
development length equation in the ACI code will be too conservative for Leadline
bars. Hence, a decision was made to use the equations developed by Mahmoud et al.
(1999) for development length of CFRP tendons. The proposed equations incorporate
the initial and matured strengths of the concrete in addition to the bar diameter. In

68
these respects, they are more refined than the formulas proposed by others. The
development length proposed by Mahmoud et al. (1999) is given as the sum of the
transfer and the flexural bond lengths shown in equations 2.4 and 2.5.
3.5 Design of Precast Panels and Composite Slabs
Two sets of precast panels were designed. One is prestressed with 8 mm (0.315
in.) Leadline CFRP tendons and the other with 9.5 mm (3/8 in.) steel strands. The
minimum concrete strengths specified are 29.6 MPa (4300 psi) at release and 31 MPa
(4500 psi) at 56 days. The design traffic load is a single wheel load given by an
HS25-44 truck with alternate military loading. This AASHTO standard design truck
consists of two 89 kN (20 kip) wheel loads spaced at 1.8 m (6 ft.). To evaluate their
performance, a set of these panels were fabricated for subsequent testing as described
in Chapter 4.
3.5.1 Prestressing Tendons
The design of the CFRP prestressed panels follows the AASHTO Specifications
(1996) as well as the guidelines presented in Section 3.4 and is detailed in Appendix
A. The final design uses fourteen 8 mm (0.315 in.) CFRP tendons symmetrically
placed over the 2438 mm (96 in.) length.
The design of the steel prestressed panels follows AASHTO Specifications
(1996). The design requires fourteen 9.5 mm (3/8 in.) seven-wire steel strands at the

69
same spacing as determined for the CFRP tendons. While the tendon spacing for
both the steel prestressed panels and the CFRP prestressed panels is exactly the same,
the area of a 9.5 mm (3/8 in.) steel strand is 55 mm2 (0.085 in2) while the area of an 8
mm (0.315 in.) Leadline tendon is 46.1 mm2 (0.0715 in2). Even though the total
cross-sectional area of Leadline is smaller than that of steel, the former has a higher
tensile strength. The layout of the tendons for both designs can be viewed in Figure
3.3.
The jacking force of 76 kN (17 kips) is determined based on the AASHTO limit
of 0.75fpu for steel strand. This jacking force is used for both CFRP tendons and steel
strands in the design. However, for the CFRP tendons, this jacking force converts to
a jacking stress of approximately 0.58fpu and is conservative compared to 0.65fpu
recommended by Dolan et al. (2000).
The effective prestressing force for the CFRP tendons accounts for the ten percent
loss before prestress release as discussed in Section 3.4.2, elastic shortening loss and
also a fifteen percent loss after prestress release. This fifteen percent loss takes into
account the low relaxation of FRP as compared to the twenty percent loss assumed
for the steel strand.
It must be pointed out that the CDOT panels described in Section 3.2 use twenty
10 mm (0.39 in.) CFRP tendons placed uniformly as shown in Figure 3.2. The same
jacking force of 76 kN (17 kips) is used for each tendon and since the area of a 10
mm (0.39 in.) CFRP tendon is 71 mm2 (0.11 in2), the initial jacking stress for the
CDOT panel is much lower than that for the panel designed above.
70
3.5.2 Temperature/Shrinkage Reinforcement in Panels and Topping Slabs
The design of the temperature and shrinkage reinforcement in the panels followed
the 16th Edition of AASHTO which requires a minimum of 71 mm2 (0.11 in2) of
reinforcement per 305 mm (12 in.) width of panel. This serves as the
temperature/shrinkage reinforcement requirement as well as the distribution
reinforcement requirement. Hence, #3 (9.5 mm in diameter) epoxy-coated bars were
placed at 305 mm (12 in.) spacing in the panel prestressed with steel.
In the ACI 440H draft document (2000), an adjustment of temperature
reinforcement stipulated in ACI 318 for steel is proposed for FRP. The adjustment
factor is based on the ratio of the yield strength of steel (fy) to the ultimate strength of
FRP (fpu) and the ratio of the modulus of elasticity of steel (Es) to that of FRP (Ef) as
shown in the following equation.
f
s
putsf E
E
f⋅⋅= 60
0018.0,ρ (3.15)
In equation 3.15, 0.0018 is the steel ratio required by ACI 318 for mild reinforcement
and 60 is the yield strength (fy) of standard steel rebar (414 MPa/60 ksi). For this
study, the AASHTO requirement of 71 mm2 (0.11 in2) of reinforcement per 305 mm
(12 in.) of panel width was used in lieu of 0.0018. Based on this modification of

71
equation 3.15 and the C-BAR properties listed in Chapter 2, 13 mm (0.5 in.) C-BAR
GFRP bars were spaced at 305 mm (12 in.) for the CFRP prestressed panels.
A 125 mm (5 in.) topping slab was used as in the original CDOT design as shown
in Figure 3.4. Since the panels would be tested in a simply supported condition, in
which the reinforcement in the topping slab had no load resisting function, the
reinforcement was simply placed to satisfy the temperature/shrinkage requirement. In
this case, 81 mm2 (0.125 in.2) of steel reinforcement per 305 mm (12 in.) width of
panel is prescribed by AASHTO for both directions in the topping slab. This calls for
#3 bars (9.5 mm diameter) at 305 mm (12 in.) spacing in both directions. Epoxy-
coated steel bars were used in the topping slab for all panels as in the actual bridge.
This is to avoid special handling requirements needed for FRP bars in the field.
3.5.3 Design Strengths
The nominal moment capacities, Mn, of the prestressed panels and panels with a
topping slab are evaluated and compared to the factored design moments, Mu. The
results are summarized in Table 3.2. The nominal moment capacities are evaluated
with the methods presented in Section 3.3. For the panels alone, the nominal moment
capacities Mn are governed by the flexural capacity of the section. However, as
shown in Appendix A, the nominal moment capacities for the composite slabs are
limited by the development length. In the case of the bare panels, the flexural
capacity is limited by the compressive crushing of concrete rather than the strength of
the tendons. In Table 3.2, the nominal moment capacities governed by the
72
development length are shown in parentheses. The Mu for the panels is due to the
factored self-weight and construction loads only, while Mu for the composite slabs
includes the factored HS25-44 wheel load in addition to the self-weight. The tendon
stress at Mu, denoted fMu, for the FRP reinforced composite section is computed using
the strain compatibility, equilibrium of the tensile and compressive forces in the slab
cross-section, and elastic concrete behavior. The last assumption is an approximation
stemming from the fact that the composite section is under-reinforced and that Mu is
significantly lower than the nominal moment capacity of the slab governed by tendon
failure. The tendon stress is not computed for the panels alone, as it is not a major
concern under construction loads.
Table 3.2 Panel/slab design comparison
(1 in-kips = 113 N-m / 1 ksi = 6.9 MPa)
Specimen Type Mn
in-kipsMu / Mn fMu
ksifMu / fu
Steel Prestressed Panel 65.9 0.65 NA NAFRP Prestressed Panel 64.3 0.66 NA NA
Steel PrestressedComposite Slab
261.6(255.5)
0.81(0.83)
NA NA
FRP PrestressedComposite Slab
339.7(278.6)
0.62(0.76)
253 0.62
Note: The numbers in parentheses reflect a reduction governed by the development length.
The results show that the panels with steel and CFRP tendons have similar
nominal moment capacities. However, the nominal moment capacities of the panels
with the composite topping slabs are significantly different. The ratio of Mu to Mn is

73
much lower for the CFRP prestressed composite slab than for the steel prestressed
composite slab. The difference is reduced when considering the development length
limitations; however, it still remains significant. Hence, the slabs with CFRP tendons
are extremely conservative. This is mainly because of the low prestressing force used
in comparison to the high tensile strength of the CFRP tendons.
Given that the maximum allowable tensile stress in a Leadline CFRP tendon is
2,822 MPa (409 ksi), the tendon stress at Mu (fMu) for the composite slab prestressed
with CFRP is only 62 percent of the guaranteed ultimate strength fu. A large amount
of reserve capacity exists in the tendon, adding to the safety of the design.

74
Figure 3.1 Cast-in-place, post-tensioned box girders with precast panel(darkened portion)
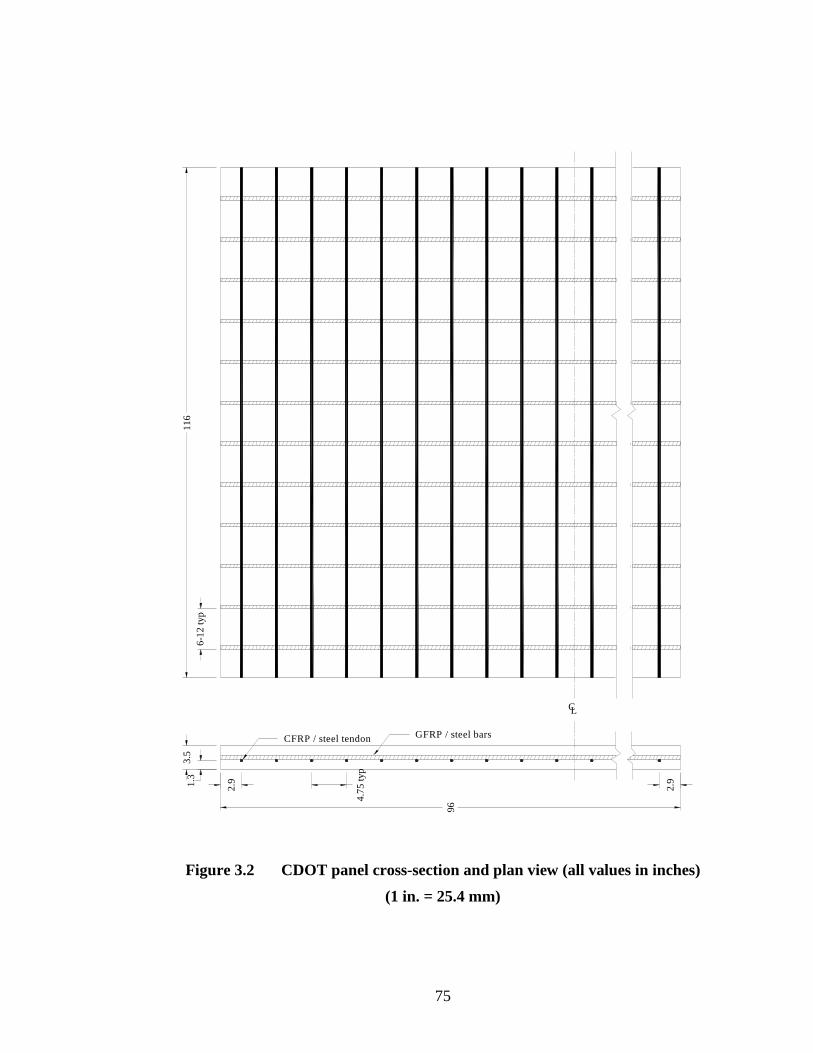
75
2.91.3
4.75
typ
3.5
CFRP / steel tendon GFRP / steel bars
CL
96
2.9
116
6-12
typ
Figure 3.2 CDOT panel cross-section and plan view (all values in inches)
(1 in. = 25.4 mm)

76
4.752.91.3
9.5
4.75 9.5
9.5
4.75
3.5
CFRP / steel tendon GFRP / steel bars
CL
96
116
12ty
p
Figure 3.3 Cross-section and plan view of test panels (all values in inches)
(1 in. = 25.4 mm)
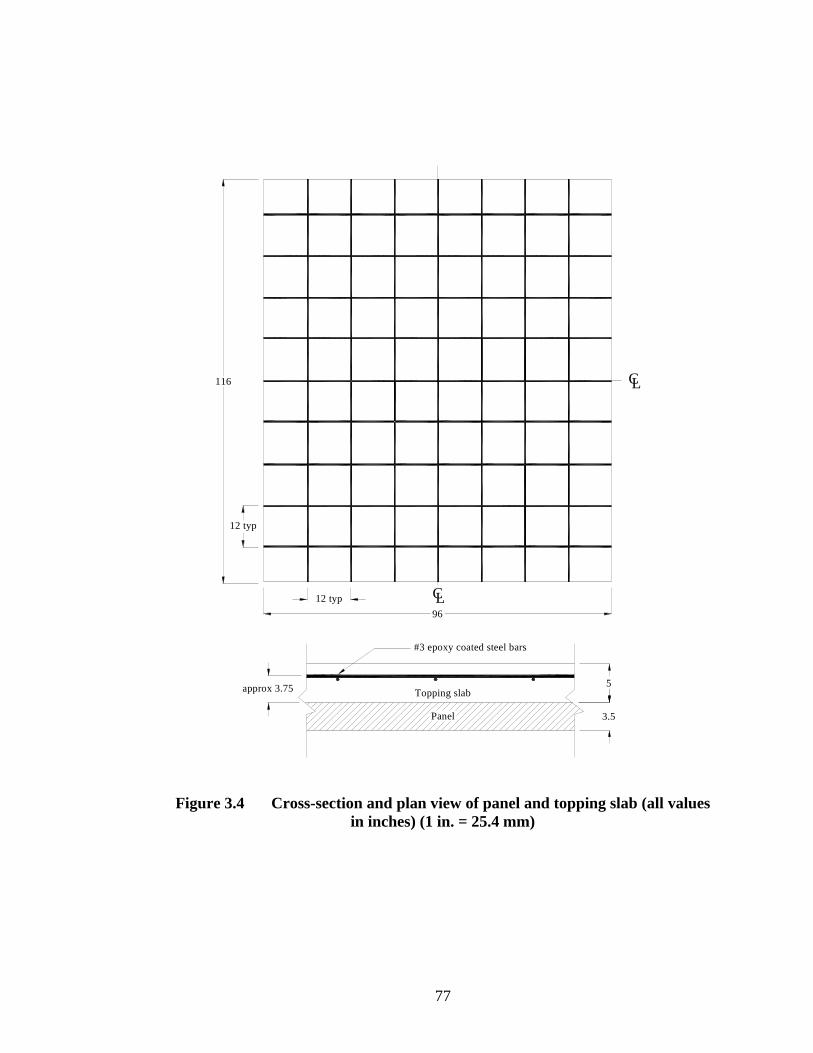
77
96
116
Panel
LC
3.5
5
LC
Topping slabapprox 3.75
12 typ
12 typ
#3 epoxy coated steel bars
Figure 3.4 Cross-section and plan view of panel and topping slab (all valuesin inches) (1 in. = 25.4 mm)


79
4. Experimental Program
4.1 Scope of Test Program
Four pretensioned panels of similar design were fabricated for testing. Two of the
panels were pretensioned with fourteen 8 mm (0.31 in.) Leadline prestressing
tendons, while the other two were pretensioned with fourteen 9.5 mm (3/8 in.) seven-
wire prestressing strands. The design is shown in Figure 3.3. Additionally, a fifth
panel that was designed by CDOT for the actual bridge deck was tested. This panel
was prestressed with twenty 10 mm (0.39 in.) Leadline tendons as shown in Figure
3.2.
One CFRP prestressed panel and one steel prestressed panel were tested as
constructed. The other two were tested with the addition of a 125 mm (5 in.)
reinforced composite topping slab as shown in Figure 3.4.
For the first set of tests on the panels with no composite topping slab, a line load
was applied at the midspan as shown in Figure 4.1a. For the second set of tests on the
composite panels, the load was applied with a 508 mm (20 in.) by 508 mm steel plate
as shown in Figure 4.1b. The intention of these tests was to look at the distribution of
a plate load throughout a panel to evaluate the effective width given by AASHTO
[LRFD] equation 4.6.2.1.3.
This chapter will describe the test setup, instrumentation, and procedures used in
the testing program.

80
4.2 Specimen Fabrication
The panel specimens were fabricated by CSR Hydroconduit in Denver, Colorado.
The two FRP prestressed panels were fabricated six days before the steel prestressed
panels.
4.2.1 Formwork and Tendon Placement
A panel prestressing bed was used with the width set to 2468 mm (96 in.). The
tendon spacing allowed by the bulkhead was in increments of 121 mm (4.75 in.). To
comply with this requirement, the tendon layout for the panels is shown in Figure 3.3.
Each CFRP tendon was encased in a plastic sheath in order to protect the tendon from
damage during placement in the casting bed. The sheaths were removed later before
casting. Figure 4.2 shows the casting bed in which the panels were poured.
4.2.2 Pretensioning Procedure
CSR Hydroconduit had to modify their standard prestressing procedure in
prestressing the panels with Leadline tendons. The manufacturer of Leadline,
Mitsubishi Chemical Corporation, has patented a modified wedge system to anchor
the tendons. Figure 2.2 shows the components of the wedge system. First, an
aluminum sleeve was placed over the end of the Leadline tendon. Then, two wedge
pieces were placed over the aluminum and pushed into a tapered steel socket with a
81
hydraulic jack as shown in Figure 4.3. CSR Hydroconduit used this method to fix the
anchors to the CFRP tendons.
The CFRP tendons cannot be directly jacked without causing damage. Thus, a
coupling device borrowed from The Prestressed Group in Michigan was used to
attach the CFRP tendons to standard steel strand. This device is shown in Figure 4.4.
This way, the hydraulic jack could be applied to the steel strand and used in a
standard fashion.
A further unforeseen problem in the prestressing process resulted from the
tendency of seven-wire steel strand used between the coupler and hydraulic jack to
twist when stressed. For this construction, only two three-meter CFRP prestressed
panels were poured in a bed that extended over thirty meters. With the CFRP coupled
to the steel strand at the end of the panels, the long length of steel strand developed a
certain amount of twist even though restrainers were used to prevent the rotation of
the couplers. As a result, two of the Leadline tendons had surface damage, but the
damage did not appear severe enough to require tendon replacement. However, it
was perceived that this problem would not be an issue if the entire length of the bed
was used for panel construction. This proved to be true in later large-scale pours for
the CDOT bridge panels.
The application of the load to the tendons was done in three stages: 13 kN (3
kips), 49 kN (11 kips), and finally 76 kN (17 kips). These three values approximately
represented 10 percent, 38 percent, and 58 percent of the maximum tensile strength of
Leadline CFRP tendons.
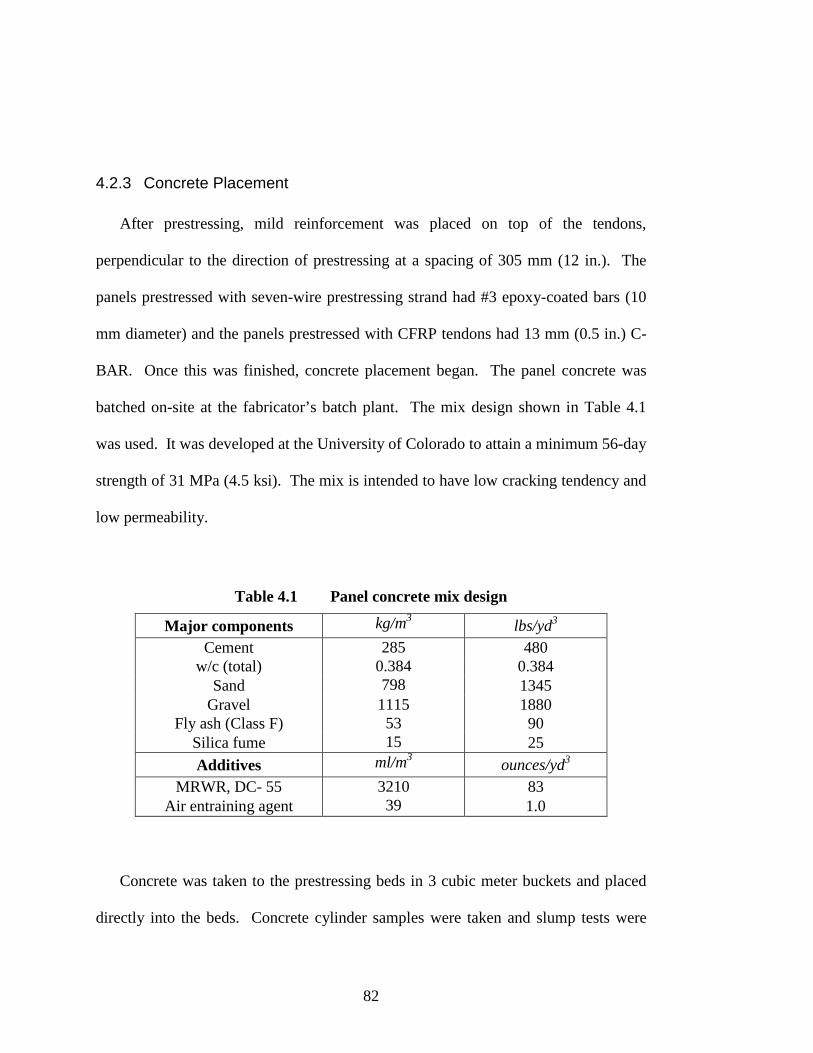
82
4.2.3 Concrete Placement
After prestressing, mild reinforcement was placed on top of the tendons,
perpendicular to the direction of prestressing at a spacing of 305 mm (12 in.). The
panels prestressed with seven-wire prestressing strand had #3 epoxy-coated bars (10
mm diameter) and the panels prestressed with CFRP tendons had 13 mm (0.5 in.) C-
BAR. Once this was finished, concrete placement began. The panel concrete was
batched on-site at the fabricator’s batch plant. The mix design shown in Table 4.1
was used. It was developed at the University of Colorado to attain a minimum 56-day
strength of 31 MPa (4.5 ksi). The mix is intended to have low cracking tendency and
low permeability.
Table 4.1 Panel concrete mix design
Major components kg/m3lbs/yd3
Cement 285 480w/c (total) 0.384 0.384
Sand 798 1345Gravel 1115 1880
Fly ash (Class F) 53 90Silica fume 15 25
Additives ml/m3ounces/yd3
MRWR, DC- 55 3210 83Air entraining agent 39 1.0
Concrete was taken to the prestressing beds in 3 cubic meter buckets and placed
directly into the beds. Concrete cylinder samples were taken and slump tests were
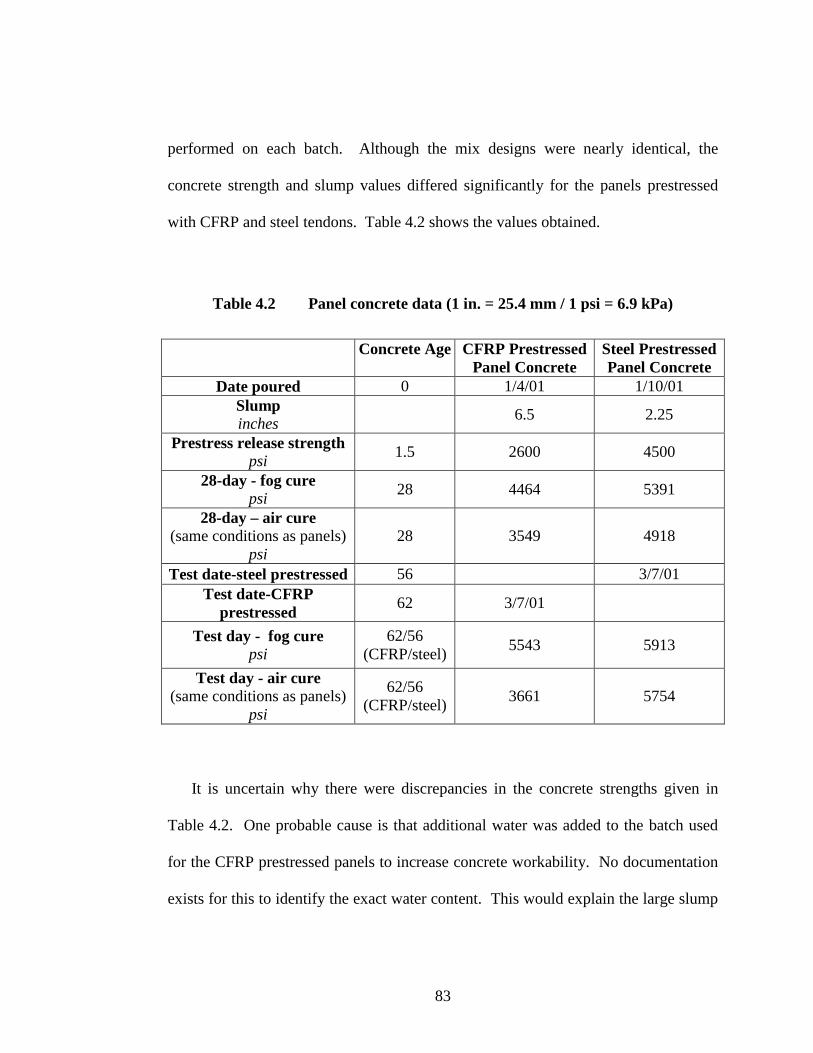
83
performed on each batch. Although the mix designs were nearly identical, the
concrete strength and slump values differed significantly for the panels prestressed
with CFRP and steel tendons. Table 4.2 shows the values obtained.
Table 4.2 Panel concrete data (1 in. = 25.4 mm / 1 psi = 6.9 kPa)
Concrete Age CFRP PrestressedPanel Concrete
Steel PrestressedPanel Concrete
Date poured 0 1/4/01 1/10/01Slumpinches
6.5 2.25
Prestress release strengthpsi
1.5 2600 4500
28-day - fog curepsi
28 4464 5391
28-day – air cure(same conditions as panels)
psi28 3549 4918
Test date-steel prestressed 56 3/7/01Test date-CFRP
prestressed62 3/7/01
Test day - fog curepsi
62/56(CFRP/steel)
5543 5913
Test day - air cure(same conditions as panels)
psi
62/56(CFRP/steel)
3661 5754
It is uncertain why there were discrepancies in the concrete strengths given in
Table 4.2. One probable cause is that additional water was added to the batch used
for the CFRP prestressed panels to increase concrete workability. No documentation
exists for this to identify the exact water content. This would explain the large slump
84
and the much lower strength for the CFRP panels. However, it is difficult to state
whether this alone would account for such a large difference in concrete strengths.
4.2.4 Composite Topping Slab Placement
Both sets of panels were delivered to the laboratory at the University of Colorado
after the steel prestressed panels were poured and partially cured. Forms were built
around two of them to add a 125 mm (5 in.) composite topping slab. In addition,
epoxy-coated #3 bars (10 mm diameter) were placed in the composite topping slab in
a grid as described earlier (See Figure 3.4).
Strain gauges were attached to the reinforcing steel placed in the composite slab.
Knowing that the reinforcing bars would be subject to slight bending, two gauges
were placed on opposite sides of the bar with the intention of averaging out the
bending effect. A smooth surface was ground out on opposite sides of a bar to give
an adequate application area. Once the gauges were applied, an additional layer of
protection was used in order to seal the gauges against water and further damage
during the construction process. The strain gauge wires were pulled through half-
inch plastic tubing to provide protection during construction and testing. Figure 4.5
shows one panel ready for pouring concrete.
The concrete mix design used for the composite topping slab is similar to the
design used in the panel construction. Table 4.3 gives the exact mix design used by
the ready-mix provider. The concrete delivery truck was delayed in getting to the
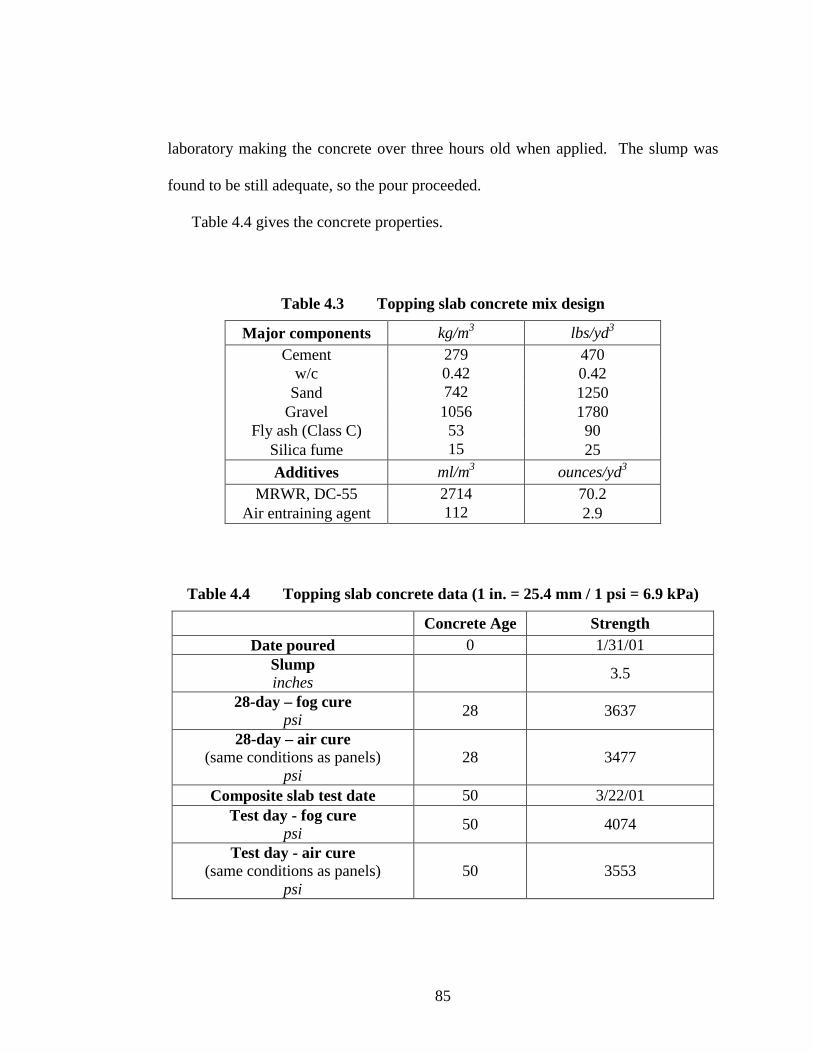
85
laboratory making the concrete over three hours old when applied. The slump was
found to be still adequate, so the pour proceeded.
Table 4.4 gives the concrete properties.
Table 4.3 Topping slab concrete mix design
Major components kg/m3 lbs/yd3
Cement 279 470w/c 0.42 0.42
Sand 742 1250Gravel 1056 1780
Fly ash (Class C) 53 90Silica fume 15 25
Additives ml/m3 ounces/yd3
MRWR, DC-55 2714 70.2Air entraining agent 112 2.9
Table 4.4 Topping slab concrete data (1 in. = 25.4 mm / 1 psi = 6.9 kPa)
Concrete Age StrengthDate poured 0 1/31/01
Slumpinches
3.5
28-day – fog curepsi
28 3637
28-day – air cure(same conditions as panels)
psi28 3477
Composite slab test date 50 3/22/01Test day - fog cure
psi50 4074
Test day - air cure(same conditions as panels)
psi50 3553
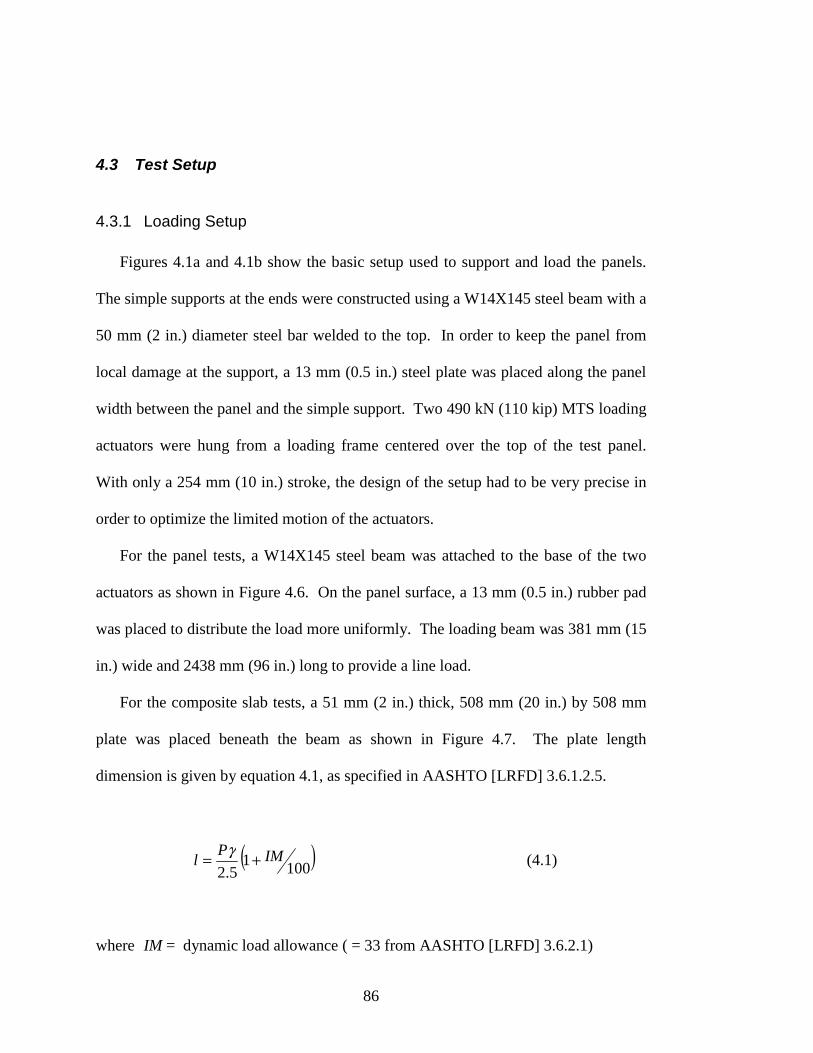
86
4.3 Test Setup
4.3.1 Loading Setup
Figures 4.1a and 4.1b show the basic setup used to support and load the panels.
The simple supports at the ends were constructed using a W14X145 steel beam with a
50 mm (2 in.) diameter steel bar welded to the top. In order to keep the panel from
local damage at the support, a 13 mm (0.5 in.) steel plate was placed along the panel
width between the panel and the simple support. Two 490 kN (110 kip) MTS loading
actuators were hung from a loading frame centered over the top of the test panel.
With only a 254 mm (10 in.) stroke, the design of the setup had to be very precise in
order to optimize the limited motion of the actuators.
For the panel tests, a W14X145 steel beam was attached to the base of the two
actuators as shown in Figure 4.6. On the panel surface, a 13 mm (0.5 in.) rubber pad
was placed to distribute the load more uniformly. The loading beam was 381 mm (15
in.) wide and 2438 mm (96 in.) long to provide a line load.
For the composite slab tests, a 51 mm (2 in.) thick, 508 mm (20 in.) by 508 mm
plate was placed beneath the beam as shown in Figure 4.7. The plate length
dimension is given by equation 4.1, as specified in AASHTO [LRFD] 3.6.1.2.5.
( )10015.2
IMPl += γ
(4.1)
where IM = dynamic load allowance ( = 33 from AASHTO [LRFD] 3.6.2.1)
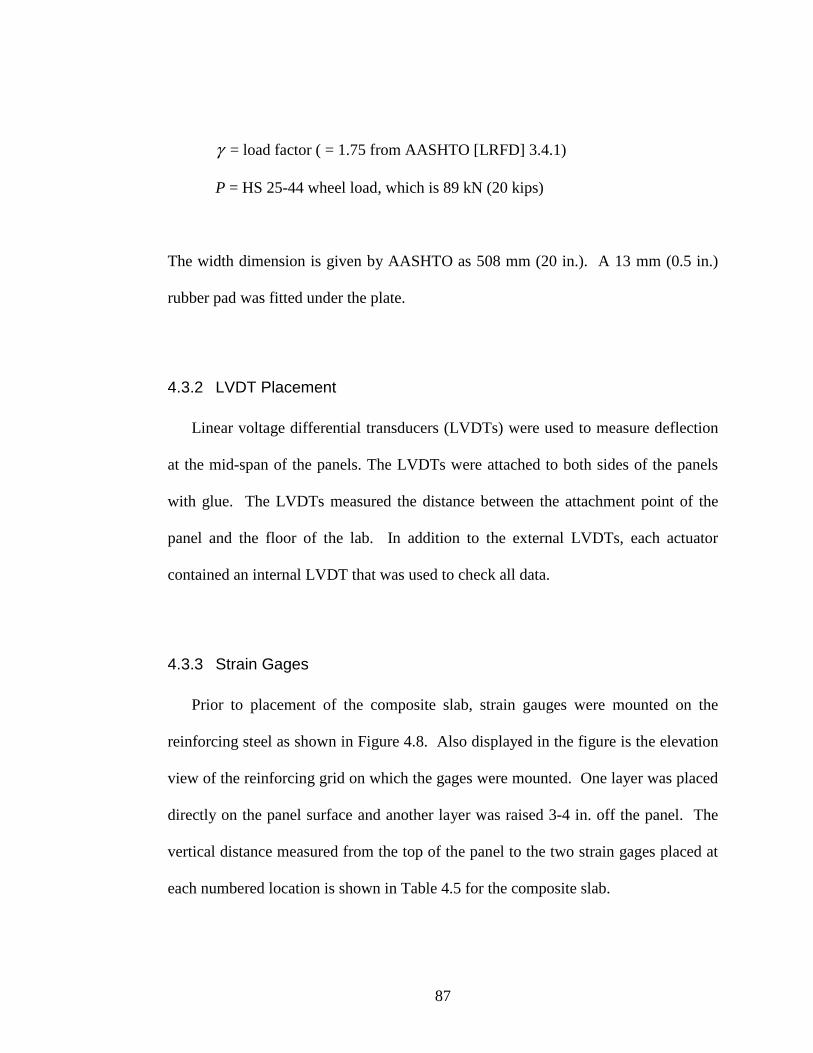
87
γ = load factor ( = 1.75 from AASHTO [LRFD] 3.4.1)
P = HS 25-44 wheel load, which is 89 kN (20 kips)
The width dimension is given by AASHTO as 508 mm (20 in.). A 13 mm (0.5 in.)
rubber pad was fitted under the plate.
4.3.2 LVDT Placement
Linear voltage differential transducers (LVDTs) were used to measure deflection
at the mid-span of the panels. The LVDTs were attached to both sides of the panels
with glue. The LVDTs measured the distance between the attachment point of the
panel and the floor of the lab. In addition to the external LVDTs, each actuator
contained an internal LVDT that was used to check all data.
4.3.3 Strain Gages
Prior to placement of the composite slab, strain gauges were mounted on the
reinforcing steel as shown in Figure 4.8. Also displayed in the figure is the elevation
view of the reinforcing grid on which the gages were mounted. One layer was placed
directly on the panel surface and another layer was raised 3-4 in. off the panel. The
vertical distance measured from the top of the panel to the two strain gages placed at
each numbered location is shown in Table 4.5 for the composite slab.
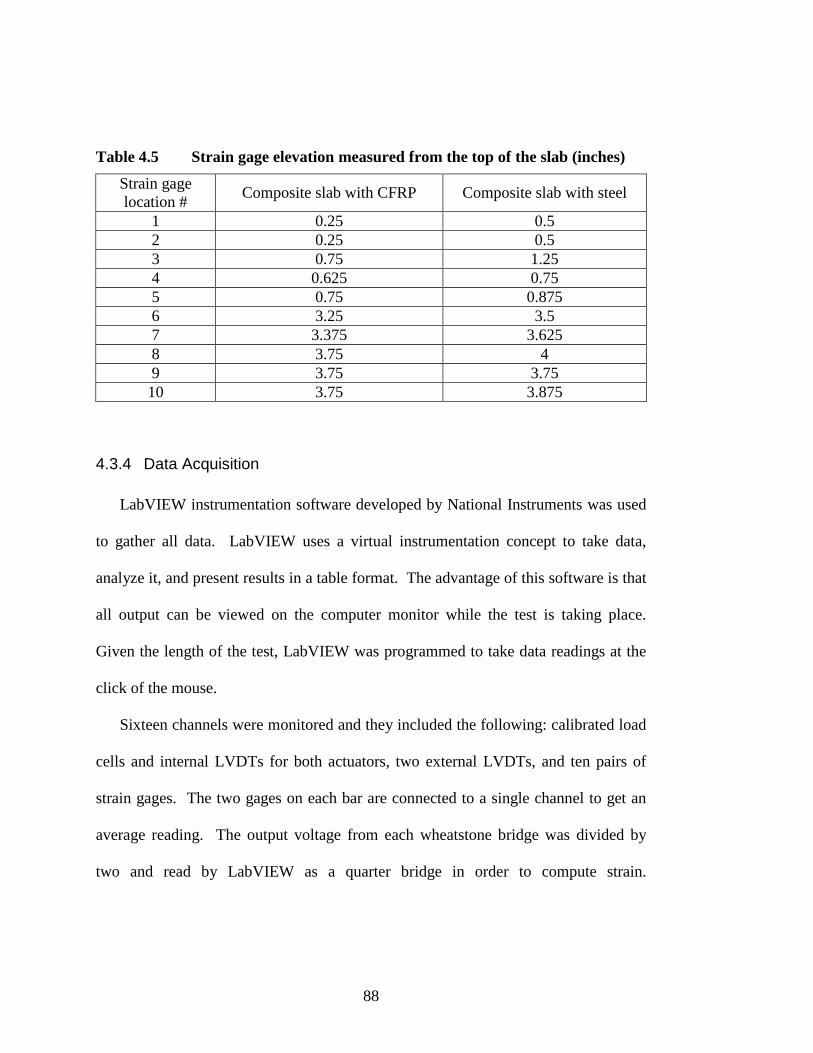
88
Table 4.5 Strain gage elevation measured from the top of the slab (inches)
Strain gagelocation #
Composite slab with CFRP Composite slab with steel
1 0.25 0.52 0.25 0.53 0.75 1.254 0.625 0.755 0.75 0.8756 3.25 3.57 3.375 3.6258 3.75 49 3.75 3.7510 3.75 3.875
4.3.4 Data Acquisition
LabVIEW instrumentation software developed by National Instruments was used
to gather all data. LabVIEW uses a virtual instrumentation concept to take data,
analyze it, and present results in a table format. The advantage of this software is that
all output can be viewed on the computer monitor while the test is taking place.
Given the length of the test, LabVIEW was programmed to take data readings at the
click of the mouse.
Sixteen channels were monitored and they included the following: calibrated load
cells and internal LVDTs for both actuators, two external LVDTs, and ten pairs of
strain gages. The two gages on each bar are connected to a single channel to get an
average reading. The output voltage from each wheatstone bridge was divided by
two and read by LabVIEW as a quarter bridge in order to compute strain.
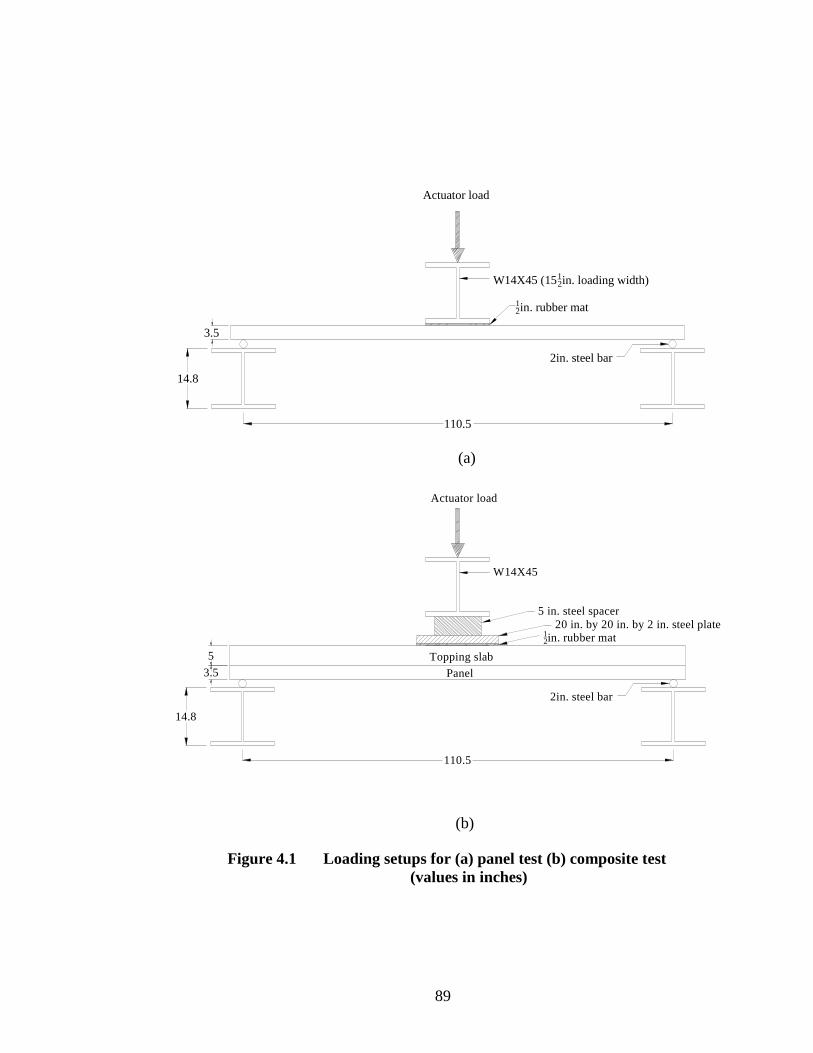
89
110.5
Actuator load
14.8
3.5
2in. steel bar
W14X45 (1512in. loading width)
12in. rubber mat
(a)
5
12in. rubber mat
Topping slab
Panel
2in. steel bar
110.5
14.8
3.5
W14X45
Actuator load
5 in. steel spacer20 in. by 20 in. by 2 in. steel plate
(b)
Figure 4.1 Loading setups for (a) panel test (b) composite test(values in inches)
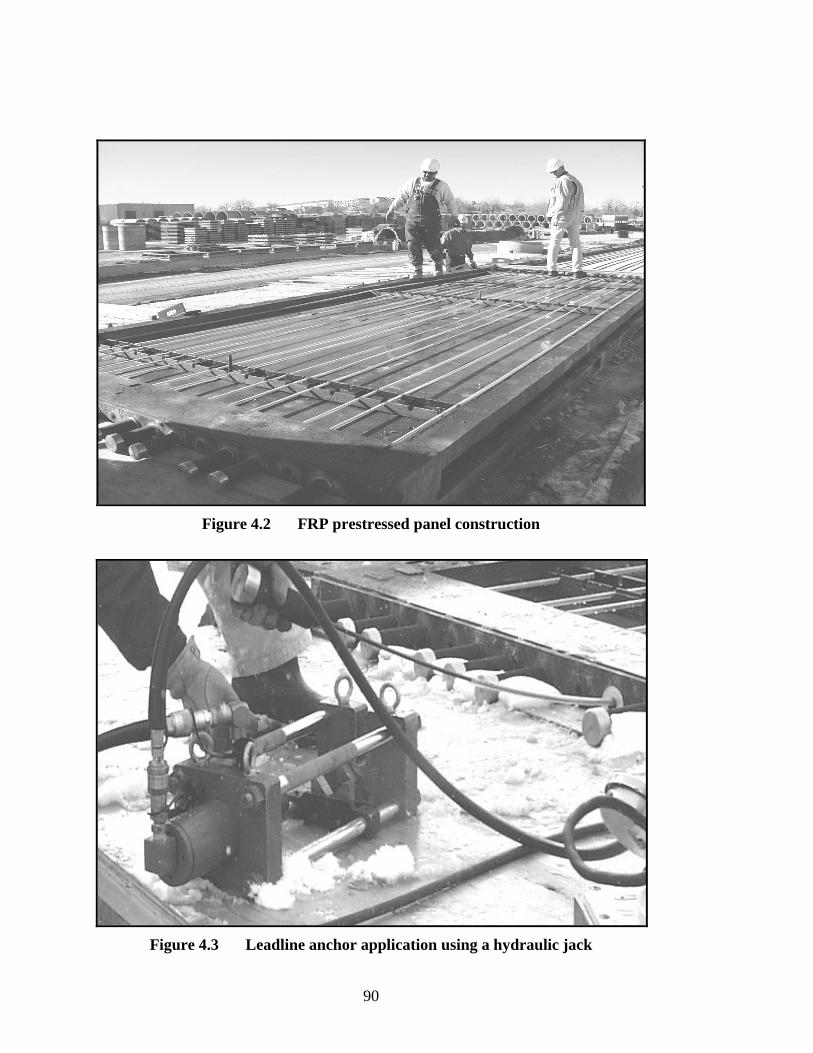
90
Figure 4.2 FRP prestressed panel construction
Figure 4.3 Leadline anchor application using a hydraulic jack

91
Figure 4.4 Coupler application
Figure 4.5 Panel with rebar ready for topping slab pour

92
Figure 4.6 Line load testing setup for panel tests

93
Figure 4.7 Plate load testing setup for composite slab tests
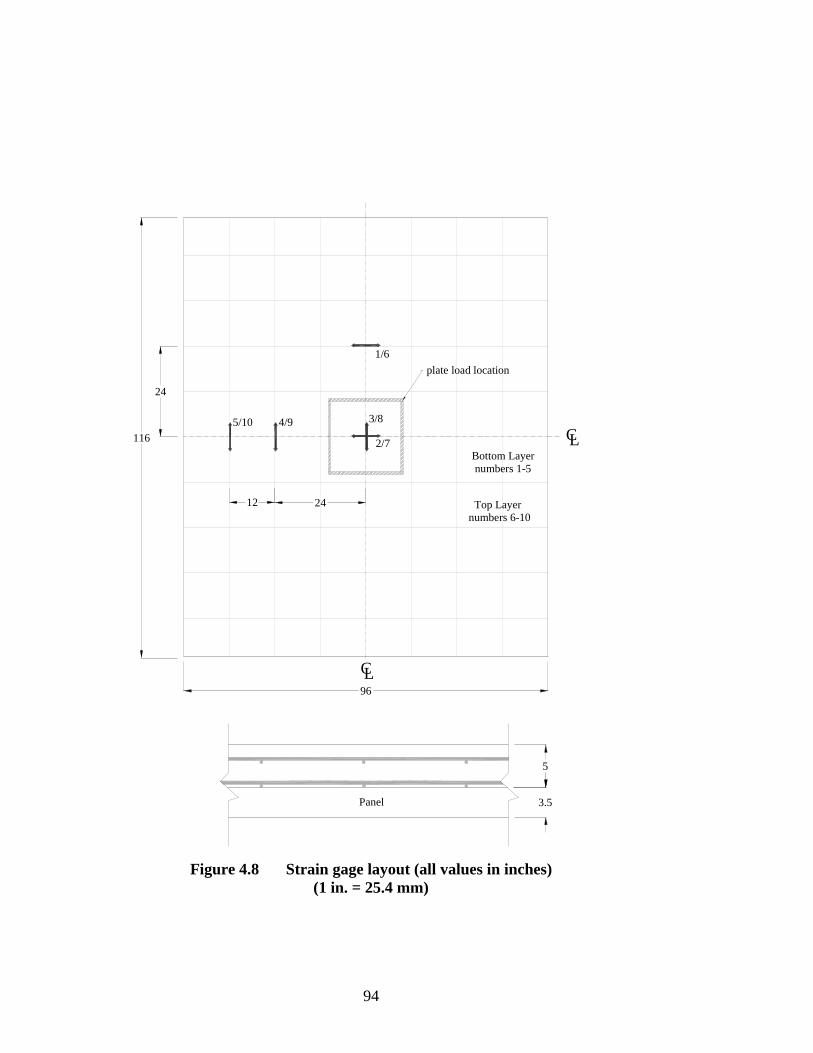
94
96
12
116
5/10
24
Panel
LC
3.5
5
plate load location
Top Layernumbers 6-10
Bottom Layernumbers 1-5
3/84/9
24
2/7
1/6
CL
Figure 4.8 Strain gage layout (all values in inches)(1 in. = 25.4 mm)

95
5. Results of Panel/Slab Tests
5.1 Panel Tests
In the panel tests, the data recorded was load and deflection. In order to compare
the nominal resistance of the panels to the actual load resistance developed in the
tests, it is necessary to calculate the load carrying capacity of the panels from the
nominal moment resistance. The panels were simply supported with a line load at
midspan. The width of the loaded area is b = 381 mm (15 in.). Hence, assuming that
the load within the loaded area is uniform, we can compute the nominal load capacity
Pn from the nominal moment capacity Mn as
( )
2
4b
L
MMP wtselfn
n
−
−⋅= − (5.1)
where L is the span length. Note that the nominal moment capacity is reduced by the
moment Mself-wt induced by the self-weight of the panel.
5.1.1 CFRP Prestressed Panel
Immediately upon delivery of the CFRP prestressed panels, small cracks were
observed originating at each prestressing tendon as shown in Figure 5.1. Many of the
cracks crossed the entire panel as visible on both the top and the bottom surfaces.
96
The cracks are suspected to be caused by the low strength of the concrete (17 MPa /
2500 psi) at stress transfer. When a tendon is prestressed, the diameter reduces due to
Poisson’s effect. Upon prestress release, the bars expand laterally and induce tensile
stresses in the concrete. In this case, the force produced by the tendon expansion
might have been too high for the concrete. These cracks were observed only on the
CFRP prestressed panels. The steel reinforced panels had adequate concrete strength
(31 MPa / 4500 psi) when the prestressing force was released, and no cracks were
observed.
The CFRP prestressed panel failed in a typical over-reinforced fashion in which
the concrete in the top half of the slab crushed before any tendon failure was
observed. However, at some point during the test, the load carrying capacity dropped
significantly because of excessive bond slip. This poor bonding can be attributed to
the cracks in the vicinity of the tendons as mentioned above. No elastic rebound was
observed after release of the load. The load-displacement curve for this test is shown
in Figure 5.2.
Compared to the nominal strength calculated with the design specifications, the
CFRP panel under-performed considerably. The maximum load was 44 kN (9.9
kips). This was considerably less than the expected design load of 80.1 kN (18 kips).
This can be attributed to the several discrepancies between the design specifications
and the actual panel. First, the strength of the concrete on the day of the test was 24.8
MPa (3600 psi) which is considerably lower than the 31 MPa (4500 psi) strength
specified in the design. This has a significant impact on an over-reinforced panel.
97
Second, the depth of the panel was found to be slightly less than the 90 mm (3.54 in.)
specified in the design. The actual depth was 87 mm (3.4 in.). Finally, the location
of the strand was found to be at 43 mm (1.7 in.) from the base on the average. This
essentially eliminates the eccentricity specified in the design. Based on these three
findings, the load carrying capacity of the panel is recomputed and found to be 45.4
kN (10.2 kips). This value could be further reduced by the slip of the tendons. In
any respect, the calculated value is very close to the test result as shown in Figure 5.2.
5.1.2 Steel Prestressed Panel
For the steel prestressed panel, the strength of the concrete on the day of the test
was 40 MPa (5800 psi) which is significantly higher than the design strength of 31
MPa (4500 psi). This increased the load capacity from 81.8 kN (18.4 kips) to 89 kN
(20 kips). The location of the steel strand was fairly precise. The panel failed at a
maximum load value of 96.1 kN (21.6 kips). The failure mode was typical for an
over-reinforced member in that the steel strand never ruptured. Upon reaching the
maximum stroke of the actuators at 152 mm (6 in.), the load was released. This was
followed by an elastic rebound of a few inches. The load-displacement curve is
shown in Figure 5.2.
98
5.1.3 CFRP Prestressed Panel from the Bridge
It was not initially in the test program to test an actual panel from the bridge. The
results of the aforementioned two panels were supposed to have validated the
performance of a CFRP prestressed panel. However, because of the deficiency of the
CFRP prestressed panel, it was deemed necessary to test another panel from the
bridge. Thus, a panel was removed from the I-225/Parker Road construction site and
brought to the laboratory. The design of this panel is presented in Section 3.2. It had
twenty CFRP tendons, whereas the first two panels had only fourteen tendons.
As shown in Figure 5.2, the CDOT panel showed a very high strength and a
brittle failure. Upon reaching the maximum load of 188.2 kN (42.3 kips), the panel
cracked in half with complete rupture of the CFRP tendons and dropped to the floor.
The tendon rupture is suspected to be caused by the excessive bending of the tendons
under a large panel deflection. Unlike the first CFRP prestressed panel, no signs of
tendon-concrete bond failure were observed. Figure 5.3 shows the CDOT panel after
failure.
From theoretical calculations, the concrete strength should have significantly
exceeded 55 MPa (8000 psi) to reach the panel strength obtained in the test.
Unfortunately, the cylinder test result from a field specimen is inconclusive.
Figure 5.2 shows the comparison of the test results to the theoretical load carrying
capacities of the panels. In addition, the uniformly distributed construction load
specified in the design is converted to an equivalent line load. The equivalent load is
99
22.2 kN (5 kips). It is clear that all panels, including the first CFRP prestressed panel,
can adequately meet this construction load requirement.
5.2 Composite Slab Tests
As described in Chapter 4, a plate load was used for the composite slab tests. This
plate load is intended to simulate a wheel load of a design truck and to check the
validity of the Equivalent Width Strip adopted in the AASHTO LRFD Specifications
(1998). The Equivalent Width Strip provides an equivalent width over which a load
is distributed as shown in Figure 5.4. The equivalent width is determined by the
equations in Table 4.6.2.1.3-1 of AASHTO. The value of the equivalent width for the
composite panels tested in this report can be calculated with equation 5.2 below, and
cannot exceed 144 inches under the consideration of multilane loading.
SEW 6.626 += (5.2)
In this empirical formula, the variable S is the center-to-center spacing (ft.) of support
components. The equivalent width (EW) is in inches. Once the equivalent width is
computed, the slab can then be analyzed by classical beam theory with the supporting
components being assumed rigid and the span length taken as the center-to-center
distance between girders. This formula is intended for a load area which satisfies the
tire contact area defined in AASHTO [LRFD] 3.6.1.2.5. The formula to calculate
100
this area is shown in equation 4.1. For the composite slabs, the tire contact area is
computed to be 508 mm (20 in.) by 508 mm (20 in.).
To examine the validity of the Equivalent Width Strip, one can compare the
nominal load resistances of the slabs calculated with the entire slab width and with
the equivalent width, respectively, to the experimental results. Such calculations can
be carried out with equation 5.1. In this case, b = 20 in. This comparison can be
especially meaningful for identifying the conservatism of the equivalent strip if the
actual slab width is larger than the equivalent width. In this case, the composite slab
width is 2438 mm (96 in.) and the calculated equivalent width based on the 2806 mm
(110.5 in.) test span is 2205 mm (86.8 in.).
The nominal moment capacity of the composite slabs is calculated with the
method in Section 3.3.2 based on the concrete strength of the topping slab as the
compression block is expected to be in that region. The concrete strength of the
topping slab on the day of the slab tests was 24.5 MPa (3550 psi) as opposed to the
design specification of 31 MPa (4500 psi). Nevertheless, since the composite slabs
were under-reinforced, this discrepancy in concrete strength was not expected to
affect the nominal moment capacity significantly.
5.2.1 Steel Prestressed Composite Slab
The load-displacement curve for the composite slab with steel strands is shown in
Figure 5.5. The maximum load reached was 429.7 kN (96.6 kips). The theoretical
nominal load capacity is 338.5 kN (76.1 kips) considering the entire width of the slab

101
and is 306 kN (68.8 kips) considering the equivalent width of AASHTO. This
capacity is computed assuming that there is no slip between the steel strands and the
concrete.
The failure of the steel prestressed composite slab was exactly as expected. The
slab was under-reinforced meaning that the steel would yield well before the concrete
reached crushing levels. As shown in Figure 5.5, the steel reached its plastic regime
and retained strength for a considerable duration. Then, without warning, the strands
ruptured and the slab cracked into two halves and fell to the floor. Although
development length was the governing criterion for the design giving nominal load
capacities of 335 kN (75.3 kips) considering the entire width of the slab and 303 kN
(68.1 kips) considering the equivalent width of AASHTO, no bond slip occurred.
5.2.2 CFRP Prestressed Composite Slab
For the CFRP prestressed composite slab, the load-displacement curve is shown
in Figure 5.5. The actual maximum load achieved in testing was 362.1 kN (81.4
kips). The theoretical nominal load carrying capacity is 438.5 kN (98.6 kips)
considering the entire width of the slab and 396.4 kN (89.1 kips) considering the
equivalent width. This capacity is computed assuming that there is no slip between
the CFRP tendons and the concrete. If equations 2.4 and 2.5 (Mahmoud et al., 1999)
are used to estimate the required development length, the stress that can be developed
in the CFRP tendon is significantly reduced because of the limited embedment length
available. The theoretical nominal load carrying capacity based on the reduced
102
tendon stress due to debonding is 369 kN (83 kips) considering the entire width of the
slab and 334 kN (75 kips) considering the equivalent width.
Numerous observations were made during the testing of the CFRP reinforced
composite slab. Once the maximum load was reached, bond slip occurred in a few of
the prestressed tendons. This caused a momentary drop in the load resistance of the
slab. Then the strength increased again slightly until the next pullout occurred. This
process repeated itself. At the end, the panel did not fail completely and was able to
support its self-weight. This is shown in Figure 5.5.
5.3 Summary of Test Results
Table 5.1 compares the calculated load capacities of the panels and composite
slabs with the experimental results and design loads. The nominal design strength in
the second column is calculated according to the design specifications, while the
theoretical strength is based on the as-built conditions with the actual concrete
strengths on the day of testing. In the last column, the design loads are the specified
construction load for the case of panels without a topping slab and the wheel load of
an HS25-44 truck considering only the impact factor for the case of composite slabs.
For the composite slabs, two numbers are listed in the nominal design strength
and the theoretical strength columns. The first number is the equivalent load capacity
using the AASHTO equivalent width. The second number is the equivalent load
capacity using the full panel width. These capacities are calculated without the
consideration of possible bond failure.
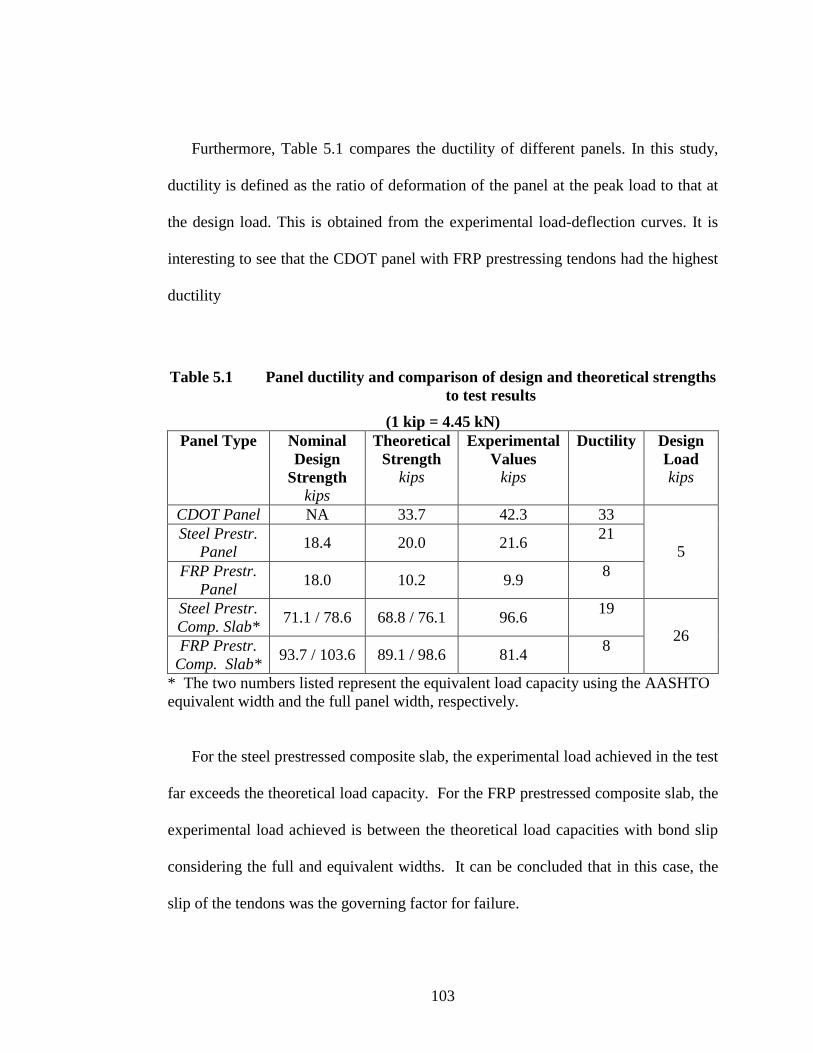
103
Furthermore, Table 5.1 compares the ductility of different panels. In this study,
ductility is defined as the ratio of deformation of the panel at the peak load to that at
the design load. This is obtained from the experimental load-deflection curves. It is
interesting to see that the CDOT panel with FRP prestressing tendons had the highest
ductility
Table 5.1 Panel ductility and comparison of design and theoretical strengthsto test results
(1 kip = 4.45 kN)Panel Type Nominal
DesignStrength
kips
TheoreticalStrength
kips
ExperimentalValues
kips
Ductility DesignLoadkips
CDOT Panel NA 33.7 42.3 33Steel Prestr.
Panel18.4 20.0 21.6
21
FRP Prestr.Panel
18.0 10.2 9.98
5
Steel Prestr.Comp. Slab*
71.1 / 78.6 68.8 / 76.1 96.619
FRP Prestr.Comp. Slab*
93.7 / 103.6 89.1 / 98.6 81.48
26
* The two numbers listed represent the equivalent load capacity using the AASHTOequivalent width and the full panel width, respectively.
For the steel prestressed composite slab, the experimental load achieved in the test
far exceeds the theoretical load capacity. For the FRP prestressed composite slab, the
experimental load achieved is between the theoretical load capacities with bond slip
considering the full and equivalent widths. It can be concluded that in this case, the
slip of the tendons was the governing factor for failure.
104
For all five tests performed, the strengths satisfy the design loads with a large
factor of safety. Furthermore, the results seem to indicate that the Equivalent Width
Strip method of AASHTO is conservative.
5.4 Strain Results
The strain gage data recorded in the two composite slabs were notably consistent
with each other giving an impression of reliable results. With the strain gage
placement diagram in Figure 4.1, it can be seen that the results were consistent with
expectations up to the point of severe cracking. The only strain value that did not
appear to be correct was from strain gage 4 in the composite slab with steel tendons.
It was discovered later that this strain gage had not been functioning. Looking at the
layout of the strain gage grid, it was expected that the strain values predicted by gage
4 would be between those of gages 3 and 5. This was confirmed by the strain results
obtained from the slab with CFRP tendons. The trends established by the slab with
CFRP tendons, in terms of the values of the strains at different locations, were used to
approximate the strain at gage 4 in the slab with steel strands. These approximated
results for gage 4 were used along with the other recorded strain results for further
analysis as described later in this section. Results from all gages, except gage 4 in the
composite slab with steel, up to the maximum load applied are shown in Figures 5.6
and 5.7. It can be seen that results after cracking are difficult to interpret. The strain
values before cracking are shown in Figures 5.8 and 5.9.
105
The strain gage results were used to examine the variation of the transverse
bending moment in the slab with respect to the distance from the plate load. The
transverse moment is the moment acting in a direction perpendicular to the span of
the slab.
In each slab, the strain gages provided values of strains at two elevations for five
separate locations. The transverse moments can be calculated from the strains in
gages 3-8, 4-9, and 5-10, with the numbers shown in Figure 4.8.
The main assumptions used in this analysis are that there is a perfect bond
between the concrete and reinforcement, and that the concrete is linearly elastic.
These are reasonable assumptions since we consider only the strain readings before
cracking and the slabs were under-reinforced. In this range, it is expected that the
compressive stress in concrete is below 0.5f’c.
To estimate a moment value from the strain profile obtained, a simple elastic
analysis is conducted. Knowing the total height of the composite slab and the vertical
locations of the gages as reported in Table 4.5, two strain values are used to create a
strain profile. With the strain profile, the elevation of the neutral axis can be
identified. Knowing that the concrete stress would not exceed the limit of 0.5f’c, an
elastic concrete stress-strain diagram is used based on the modulus of elasticity of the
concrete. The modulus of elasticity is estimated from the load-displacement curves
shown in Figure 5.5. The moment is then computed from the stress in the concrete
and the reinforcement assuming that the concrete in tension is not cracked. The
106
compression reinforcement is also considered. Only the incremental stress due to the
applied load needs to be considered for the prestressing tendons.
The modulus of elasticity determined for the load displacement curves of the
composite slab is 14.5 GPa (2100 ksi). This is low compared to the modulus of
elasticity of 23.4 GPa (3396 ksi) predicted with the ACI 318 equation (ACI 318
8.5.1) using the actual compressive strength of concrete. However, test results
reported by Shing and Abu-Hejleh (1999) show that a low modulus of elasticity can
be expected for a concrete containing a substantial amount of fly ash. Their results
show that at 28 days, the modulus of elasticity of a concrete with 20 percent fly ash
by weight of cement can be considerably lower than that of a concrete that had
comparable compressive strength but no fly ash. This is even true at an age of 90
days where the difference in the modulus of elasticity can be as high as 20 percent.
Before the moments are calculated, a check of the equilibrium between the force
from the concrete and the reinforcing bar in the compression zone and the force from
the concrete and prestressing tendon/strand in the tension zone is made. This is a
preliminary check to determine the accuracy of the strain gage results. It is noted that
the force in the compression zone is consistently higher than in the tension zone. For
the composite slab with CFRP tendons, the compression force is 15 to 25 percent
higher. For the composite slab with steel, the compression force is 20 to 35 percent
higher. This increase in compression could be a result of the axial force induced in
the composite slab by the support restraints. The nominal moment is computed by
taking the moment about the centroid of the slab for each of the four force
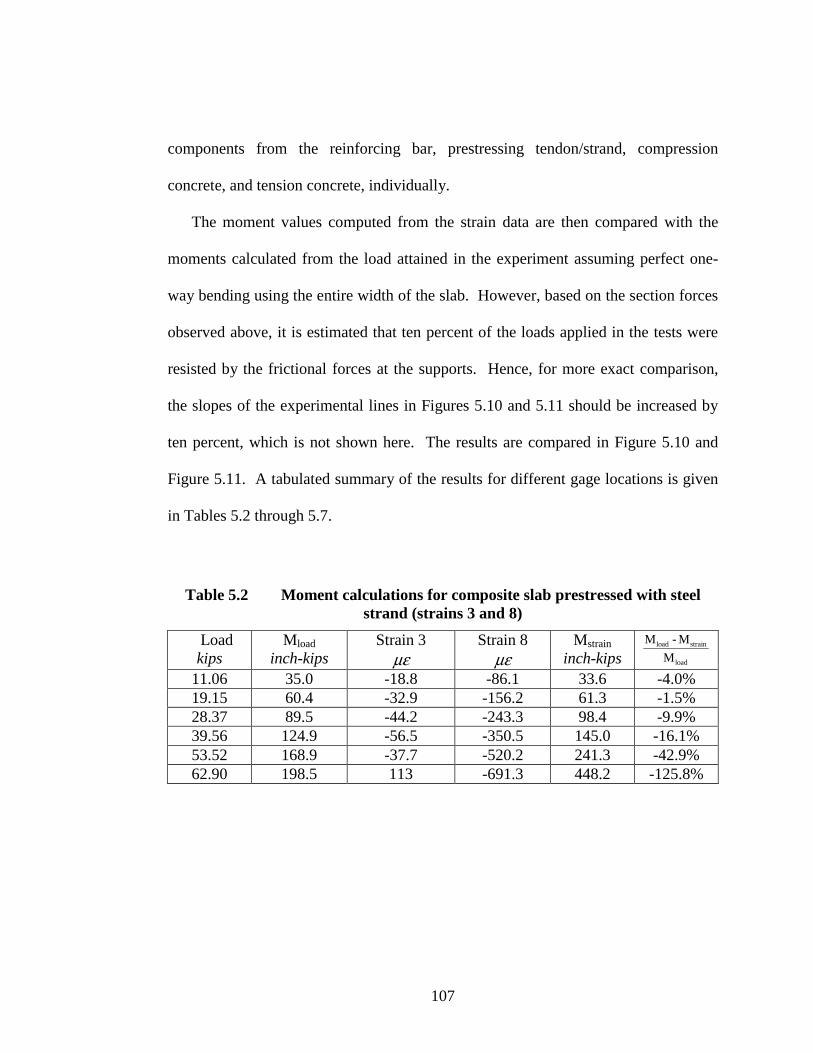
107
components from the reinforcing bar, prestressing tendon/strand, compression
concrete, and tension concrete, individually.
The moment values computed from the strain data are then compared with the
moments calculated from the load attained in the experiment assuming perfect one-
way bending using the entire width of the slab. However, based on the section forces
observed above, it is estimated that ten percent of the loads applied in the tests were
resisted by the frictional forces at the supports. Hence, for more exact comparison,
the slopes of the experimental lines in Figures 5.10 and 5.11 should be increased by
ten percent, which is not shown here. The results are compared in Figure 5.10 and
Figure 5.11. A tabulated summary of the results for different gage locations is given
in Tables 5.2 through 5.7.
Table 5.2 Moment calculations for composite slab prestressed with steelstrand (strains 3 and 8)
Loadkips
Mload
inch-kipsStrain 3
µε Strain 8
µεMstrain
inch-kips load
strainload
M
M-M
11.06 35.0 -18.8 -86.1 33.6 -4.0%19.15 60.4 -32.9 -156.2 61.3 -1.5%28.37 89.5 -44.2 -243.3 98.4 -9.9%39.56 124.9 -56.5 -350.5 145.0 -16.1%53.52 168.9 -37.7 -520.2 241.3 -42.9%62.90 198.5 113 -691.3 448.2 -125.8%
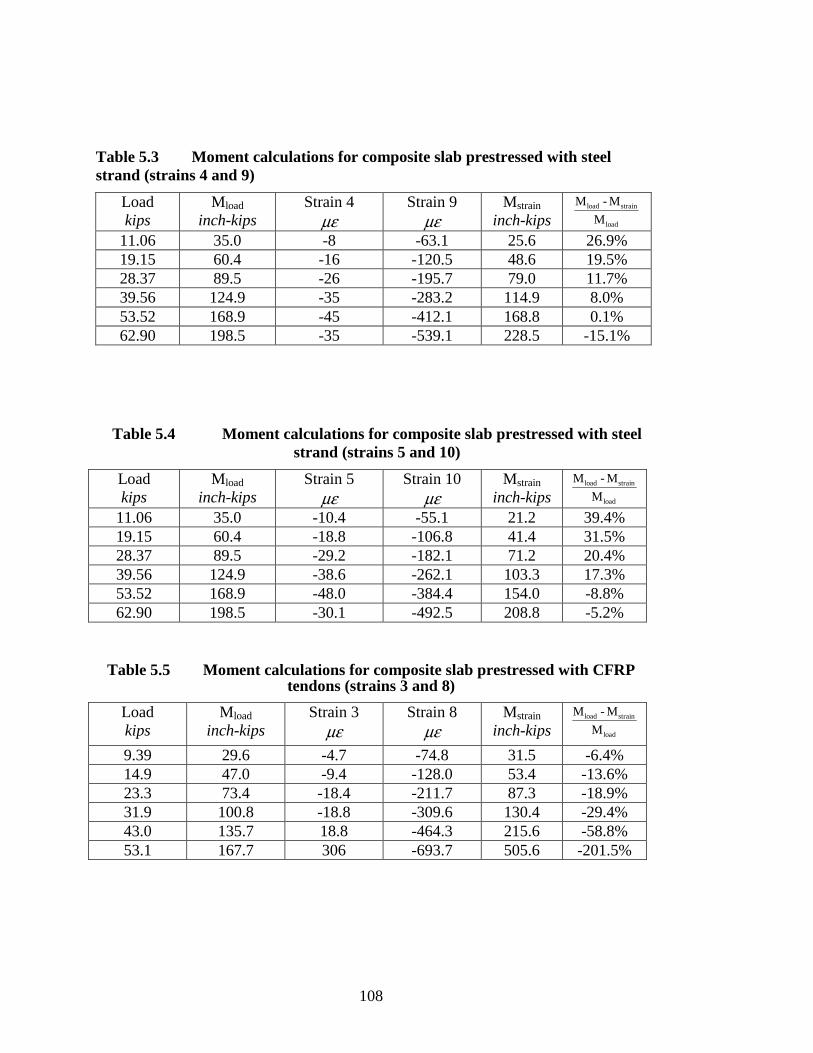
108
Table 5.3 Moment calculations for composite slab prestressed with steelstrand (strains 4 and 9)
Loadkips
Mload
inch-kipsStrain 4
µε Strain 9
µεMstrain
inch-kips load
strainload
M
M-M
11.06 35.0 -8 -63.1 25.6 26.9%19.15 60.4 -16 -120.5 48.6 19.5%28.37 89.5 -26 -195.7 79.0 11.7%39.56 124.9 -35 -283.2 114.9 8.0%53.52 168.9 -45 -412.1 168.8 0.1%62.90 198.5 -35 -539.1 228.5 -15.1%
Table 5.4 Moment calculations for composite slab prestressed with steelstrand (strains 5 and 10)
Loadkips
Mload
inch-kipsStrain 5
µε Strain 10
µεMstrain
inch-kips load
strainload
M
M-M
11.06 35.0 -10.4 -55.1 21.2 39.4%19.15 60.4 -18.8 -106.8 41.4 31.5%28.37 89.5 -29.2 -182.1 71.2 20.4%39.56 124.9 -38.6 -262.1 103.3 17.3%53.52 168.9 -48.0 -384.4 154.0 -8.8%62.90 198.5 -30.1 -492.5 208.8 -5.2%
Table 5.5 Moment calculations for composite slab prestressed with CFRPtendons (strains 3 and 8)
Loadkips
Mload
inch-kipsStrain 3
µε Strain 8
µεMstrain
inch-kips load
strainload
M
M-M
9.39 29.6 -4.7 -74.8 31.5 -6.4%14.9 47.0 -9.4 -128.0 53.4 -13.6%23.3 73.4 -18.4 -211.7 87.3 -18.9%31.9 100.8 -18.8 -309.6 130.4 -29.4%43.0 135.7 18.8 -464.3 215.6 -58.8%53.1 167.7 306 -693.7 505.6 -201.5%

109
Table 5.6 Moment calculations for composite slab prestressed with CFRPtendons (strains 4 and 9)
Loadkips
Mload
inch-kipsStrain 4
µε Strain 9
µεMstrain
inch-kips load
strainload
M
M-M
9.39 29.6 0 -47.1 20.2 31.8%14.9 47.0 -4.0 -80.0 33.0 29.8%23.3 73.4 -8.0 -141.2 57.9 21.1%31.9 100.8 -12.0 -215.2 88.3 12.4%43.0 135.7 0 -315.3 135.2 0.3%53.1 167.7 56.2 -451.7 218.7 -30.4%
Table 5.7 Moment calculations for composite slab prestressed with CFRPtendons (strains 5 and 10)
Loadkips
Mload
inch-kipsStrain 5
µε Strain 10
µεMstrain
inch-kips load
strainload
M
M-M
9.39 29.6 -0.5 -42.4 18.7 36.8%14.9 47.0 -5.2 -70.6 29.4 37.4%23.3 73.4 -9.9 -127.1 52.8 28.1%31.9 100.8 -14.6 -188.2 78.2 22.4%43.0 135.7 -9.9 -277.6 119.5 11.9%53.1 167.7 51.3 -390.5 200.6 -19.6%
Tables 5.2 to 5.7 and Figures 5.10 and 5.11 show that the moments calculated
with the strain values for the two composite slabs are reasonably close to the moment
calculated from the experimentally obtained load assuming perfect one-way bending,
except for load levels that exceed the cracking loads. After cracking, the calculated
moment far exceeds the experimental value. This is probably due to the fact that
concrete is assumed uncracked in the calculations. Hence, the calculated moment
values shown in Figures 5.10 and 5.11 are unreliable after the cracking load is
110
reached. This is especially true for moments calculated with gages 3 and 8, which
were directly under the plate load.
Since the plate load was acting directly in the center, it is expected that the
moment computed from strains 3 and 8 will exceed the theoretical value. Moments
computed from strains 4-9 and 5-10 are expected to be slightly lower as they are
further away from the load application. This is confirmed by the results shown. The
comparison will look better if we increase the slopes of the experimental results by
10% as mentioned previously. The average moment from these locations more or less
coincides with the experimental value assuming uniform moment along the length.
This is an indication of the accuracy of the calculated moments. Figures 5.10 and
5.11 show that the steel reinforced slab slightly better distributes the load in the
transverse direction than the FRP reinforced slab. This could imply that the GFRP
bars might not be as effective as the steel bars in distributing the load. Hence, the
recommendation in the ACI 440H draft report for FRP temperature reinforcement
(equation 3.2) might not be adequate for load distribution purposes in the slab. In
particular, it seems more appropriate to eliminate the strength ratio in equation 3.2
since stiffness of the reinforcement is more relevant to load distribution in a slab.
For the slab with steel reinforcement, the variation of moment with distance
seems small enough to assume that the entire length within the gage location is
uniformly effective in carrying the load. The gages cover a slab length of 1829 mm
(72 in.), considering symmetry, whereas the equivalent width according to AASHTO
is computed to be 2205 mm (86.8 in.). However, with extrapolation of the strain

111
readings, we can see that the AASHTO equivalent width equation is conservative.
This is further assured by the fact that this panel had a load resistance that is
significantly higher than the theoretical strength based on the entire length of the slab.
However, part of this could be due to the support restraints as mentioned before.

112
Figure 5.1 Initial cracking surrounding the prestressed CFRP tendons
0
15
30
45
0 1 2 3 4 5 6Displacement (inches)
Lo
ad(k
ips)
Steel Prestressed Panel FRP Prestressed PanelCDOT FRP Prestressed Panel Steel-theoretical maximumFRP-theoretical maximum CDOT FRP-theoretical maximumEquivalent Constuction Load
f'c = 8000 psi
f'c = 5800 psi
f'c = 3600 psi
Figure 5.2 Load vs. displacement for three panels
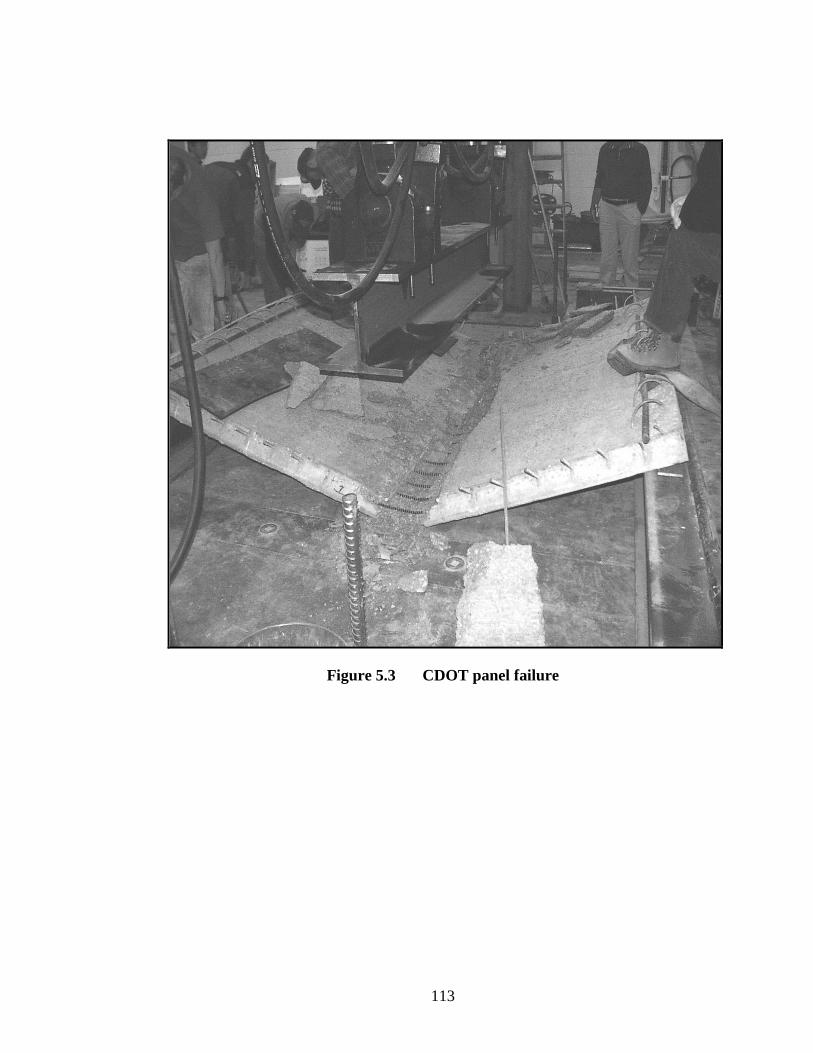
113
Figure 5.3 CDOT panel failure

114
Figure 5.4 Design strip for the Equivalent Strip Method (Barker and Puckett1997)
0
25
50
75
100
0 0.5 1 1.5 2 2.5 3Displacement (inches)
Lo
ad(k
ips)
Steel Composite FRP CompositeSteel-theoretical max load FRP-theoretical max loadEquivalent Truck Load
Figure 5.5 Load vs. displacement curves for the composite slabs (thetheoretical maximum loads are calculated with a full panel width)

115
0
10
20
30
40
50
60
70
80
90
100
-2000 -1000 0 1000 2000 3000 4000 5000 6000 7000 8000
Strain (µεµεµεµε)
Lo
ad(k
ips)
strain 1
strain 2
strain 3
strain 5
strain 6
strain 7
strain 8
strain 9
strain 10
Figure 5.6 Load vs. strain values for composite slab prestressed with steelloaded beyond cracking
0
10
20
30
40
50
60
70
80
90
-1000 0 1000 2000 3000 4000 5000 6000
Strain (µεµεµεµε)
Lo
ad(k
ips)
strain 1strain 2strain 3strain 4strain 5strain 6strain 7strain 8strain 9strain 10
Figure 5.7 Load vs. strain values for composite slab prestressed with CFRPloaded beyond cracking

116
0
10
20
30
40
50
60
70
-800 -600 -400 -200 0 200
Strain (µεµεµεµε)
Lo
ad(k
ips)
strain 1
strain 2
strain 3
strain 5
strain 6
strain 7
strain 8
strain 9
strain 10
Figure 5.8 Load vs. strain values for composite slab prestressed with steelbefore cracking
0
10
20
30
40
50
60
-800 -600 -400 -200 0 200 400
Strain (µεµεµεµε)
Lo
ad(k
ips)
strain 1strain 2strain 3strain 4strain 5strain 6strain 7strain 8strain 9strain 10
Figure 5.9 Load vs. strain values for composite slab prestressed with CFRPbefore cracking

117
0
10
20
30
40
50
60
70
-300 -250 -200 -150 -100 -50 0
Moment (inch-kips)
Lo
ad(k
ips)
Mexperiment strain (3-8) strain (4-9) strain (5-10)
Figure 5.10 Load vs. moment for composite slab prestressed with steel
0
10
20
30
40
50
60
-300 -250 -200 -150 -100 -50 0
Moment (inch-kips)
Lo
ad(k
ips)
Mexperiment strain (3-8) strain (4-9) strain (5-10)
Figure 5.11 Load vs. moment for composite slab prestressed with CFRP

119
6. Summary and Conclusions
6.1 Summary
This study compares the strengths of precast panels and composite slabs
prestressed with CFRP tendons and steel strands. The strengths of individual panels
as well as those constructed with the addition of a 125 mm (5 in.) topping slab are
investigated.
The panels were designed using the 16th Edition of AASHTO (1996) with
additional considerations for CFRP tendons.
The panels were 90 mm (3.5 in.) deep, 2950 mm (116 in.) wide, and 2438 mm (96
in.) long. The panel width of 2950 mm was selected to span two precast, post-
tensioned concrete box girders in a direction perpendicular to the flow of traffic.
Each panel was prestressed with 14 tendons spaced symmetrically over the 2438 mm
length. Perpendicular to the prestressing tendons, reinforcing bars were placed at 305
mm (12 in.) spacing. One set of panels was prestressed with 8 mm (0.315 in.)
Leadline CFRP tendons and reinforced with 13 mm (0.5 in.) C-BAR GFRP
reinforcing rods. The other set was prestressed with 9.5 mm (3/8 in.) seven-wire, low
relaxation prestressing strand and reinforced with #3 steel bars (9.5 mm diameter).
One panel in each set was tested as it was. The other panel in each set had a 125
mm (5 in.) composite topping slab cast with one mat of #3 (9.5 mm) steel reinforcing
bars spaced at 305 mm (12 in.) in each direction. The steel reinforcement in the grid
was fitted with strain gages to obtain load distribution data for the slabs.
120
A third panel type was also tested. This panel was designed by CDOT and used
in the bridge at I-225/Parker Road. The CDOT panel had the same overall
dimensions as the other tested panels. However, the reinforcement was considerably
different. Each panel was prestressed with twenty 10 mm (0.39 in.) diameter CFRP
tendons spaced symmetrically over the 2438 mm (96 in.) length. GFRP reinforcing
bars with a 13 mm (0.5 in.) diameter were placed at 152 mm (6 in.) spacing
perpendicular to the prestressing tendons. Hence, the panel was more conservatively
designed than the others.
The panels were loaded with a beam that spanned the entire 2438 mm (96 in.)
length of the panel. The composite slabs were loaded with a 508 mm (20 in.) by 508
mm steel plate to model the tire contact area recommended by AASHTO.
Furthermore, a series of pullout tests were performed on Leadline CFRP tendons,
seven-wire steel strand, C-BAR GFRP reinforcing rods, and #4 black steel bars to
attain a better understanding of bonding between these materials and concrete.
6.2 Conclusions
The conclusions of this study are as follows:
1. Pullout test results show that 13 mm (0.5 in.) C-BAR reinforcing rods provided
higher bond strength than that of #4 (13 mm diameter) black reinforcing steel.
The average bond strength of the C-BAR with an embedment of 5db was 21.7
MPa (3.15 ksi). The average bond strength of the reinforcing steel with an
embedment of 6db was 20 MPa (2.9 ksi).

121
2. Pullout test results show that 10 mm (0.39 in.) Leadline prestressing tendons
provided higher bond strength than that of 9.5 mm (3/8 in.) steel prestressing
strand. The average bond strength of the Leadline with an embedment of 10db
was 10.9 MPa (1.58 ksi). The average bond strength of the steel strand with an
embedment of 20db was 6.8 MPa (0.99 ksi).
3. The anchor chuck developed by Mitsubishi Chemical Corporation used in the
prestressing of Leadline tendons provided adequate gripping capacity to attain a
prestressing force equal to 60 percent of its maximum strength. Possible
difficulties in the prestress process using this anchor are discussed. If using a
coupler to attach the Leadline anchor to a steel strand, the twist produced by the
steel strand during prestressing may induce large stresses on the CFRP tendons
over long bed lengths. It is important to keep the length of steel strand used to a
minimum in order to reduce the amount of twist that may develop.
4. The panels prestressed with CFRP cannot be directly compared to those
prestressed with steel due to the abnormalities in the construction of the CFRP
prestressed panels. In the construction, the placement of the CFRP tendons in the
panels nearly wiped out all eccentricity specified in design. Also, the panel depth
was reduced by 4 mm (0.1 in.). Finally, the concrete strength on the day of
testing was 24.8 MPa (3600 psi) instead of the specified 56 day strength of 31
122
MPa (4500 psi). Lastly, cracks developed near the CFRP prestressing tendons
before testing. The prestressing force was released while the concrete strength
was at 17.2 MPa (2500 psi) which was very low compared to the specified release
strength of 29.7 MPa (4300 psi). This could be very likely the cause of the
cracks. With all of the above problems, the load carrying capacity of the panel
was 44.0 kN (9.9 kips) which is much lower than expected.
The steel prestressed panels did not have any of the construction problems
discussed for the CFRP prestressed panels. In fact, the concrete strength for the
steel prestressed panels was 40 MPa (5800 psi) on the panel testing day. This was
significantly larger than the 31 MPa (4500 psi) strength specified in design. The
actual load carrying capacity reached was 96.1 kN (21.6 kips) in the panel test.
A careful analysis has indicated that the CFRP panel should have performed
satisfactorily if it was constructed properly.
5. The testing of a CDOT panel added a great deal of confidence in the performance
of a properly constructed CFRP prestressed panel. Unlike the first CFRP panel
discussed above, the load carrying capacity obtained in testing was larger than the
theoretical load carrying capacity.
6. Each panel that was tested showed a load carrying capacity greater than the
equivalent construction load of 22.2 kN (5 kips). The CFRP prestressed panel,
steel prestressed panel and the CDOT CFRP prestressed panel (I-225/Parker Road
123
project) had load carrying capacities of 44 kN (9.9 kips), 96.1 kN (21.6 kips), and
188.2 kN (42.3 kips), respectively.
7. In the case of the two composite slabs, the load carrying capacities attained in the
tests were either greater than or close to the theoretical load carrying capacities.
The load carrying capacities for the steel prestressed composite slab and the
CFRP prestressed composite slab were 429.7 kN (96.6 kips) and 362.1 kN (81.4
kips), respectively. As a result of the problems mentioned above, the failure of
the CFRP prestressed slab was governed by tendon slip, and, therefore, had a
lower resistance than the steel prestressed slab. The wheel load of the HS25-44
AASHTO design truck with alternate military loading and an impact factor is
115.7 kN (26 kips).
8. The results of the moment analysis using the strain data show that the steel
reinforced slab better distributed the loading in the transverse direction than the
FRP reinforced slab. This would imply that the GFRP bars in the panels might
not be as effective as the steel bars for distributing the load. Hence, the
recommendation in the ACI 440H draft report for FRP temperature reinforcement
(equation 3.2) may not be adequate for distribution reinforcement. In particular, it
seems more appropriate to eliminate the strength ratio in equation 3.2 since
stiffness of reinforcement is more relevant to load distribution in the slab.


125
APPENDIX A: DESIGN OF FRP PRESTRESSED PANELS ANDCOMPOSITE SLABS
This appendix documents the detailed design calculations for the FRP prestressed
panels that were tested in this study.
The panel dimensions and tendon eccentricity are the same as the CDOT panel
shown in Figure 3.2. The primary design variables are the spacing and sizing of the
prestressing tendons. For the following calculations, a unit width of 305 mm (12 in.)
is used throughout.
PANEL AND COMPOSITE SLAB DIMENSIONS
Clear span: 2860 mm (9.38 ft.)
Design span: 2905 mm (9.53 ft.)
Panel thickness: 90 mm (3.5 in.)
Topping slab thickness: 125 mm (5 in.)
Panel length: 2438 mm (96 in.)
Panel width: 2950mm (116 in.)
dpp = depth of prestressing tendons in panel: 57 mm (2.33 in.)
dp = depth of prestressing tendons in composite slab: 182 mm (7.17 in.)
ec = eccentricity of tendons in the panel: 12 mm (0.47 in.)
Ac-pan = panel cross-sectional area: 27408 mm2 (42.5 in2)
Ac-com = composite slab cross-sectional area: 65500 mm2 (101.5 in2)
126
LINE LOAD FOR A 305 mm (12 in.) STRIP
Non-composite panel loading (panel only)
Construction loading: 5600 Pa (0.812 psi) = 1.71 kN/m (116.9 plf)
Panel self-weight: 0.65 kN/m (44.3 plf)
Slab self-weight: 0.90 kN/m (61.5 plf)
Moments due to construction loads and self-weight
Mconstr = 0.125(1710 N/m)(2.905 m)2 = 1804 N-m (15.9 inch-kips)
Mpanel = 0.125(650 N/m)(2.905 m)2 = 686 N-m (6.0 inch-kips)
Mslab = 0.125(900 N/m)(2.905 m)2 = 949 N-m (8.4 inch-kips)
Composite slab loading (Assuming no overlay)
HS25-44 and alternate military loading
Mtruck = DF (IF) (CF) (wheel load) [US customary units]
DF = distribution factor = (span + 2)/32 = 0.356 [AASHTO 3.24.3.1]
IF = impact factor = 1.3 [AASHTO 3.8.2.1]
CF = continuity factor = 0.8 [AASHTO 3.24.3.1]
Mtruck = 0.356(1.3)(0.8)(20 kips)(12 in./1 ft.) = 88.8 in-kips (10 kN-m)

127
MATERIAL PROPERTIES
Leadline Prestressing Tendon (as given by Mitsubishi Chemical Corporation)
diameter = 8 mm (0.315 in.)
fpu = 2818 MPa (409 ksi)
Acs = 46.1 mm2 (0.0715 in2)
Ep = 146.9 GPa (21320 ksi)
Concrete
f’ci = 29.6 MPa (4300 psi)
f’c = 31 MPa (4500 psi)
Ec = 57000 4500 psi = 3824 ksi (26.3 GPa) [ACI 8.5.1, units in psi]
Eci = 57000 4300 psi = 3738 ksi (25.7 GPa)
ALLOWABLE STRESSES FOR CONCRETE AND CFRP TENDONS
Note: Positive stresses are in tension and negative stresses are in compression (all
units in equations are in psi). Stress limits for concrete are defined in AASHTO
9.15.2.
In panels after prestress release
-0.6 f’ci = -0.6(4300 psi) = -2580 psi (-17.8 MPa)
3 cif ′ = 3 4300 psi = 197 psi (1.4 MPa)

128
In panels during construction and pouring of topping slab
-0.6 f’c = -0.6(4500 psi) = -2700 psi (-18.6 MPa)
6 cf ′ = 6 4500 psi = 402 psi (2.8 MPa)
In composite after curing of topping slab and subject to full service loads
-0.6 f’c = -0.6(4500 psi) = -2700 psi (-18.6MPa)
6 cf ′ = 6 4500 psi = 402 psi (2.8 MPa)
CFRP tendon jacking limit
For CFRP tendons, Dolan et al. recommend a jacking stress (fpj) of 0.65fpu and an
initial prestress (fpi) of 0.60fpu. To be on the conservative side, a jacking stress of
approximately 0.60fpu is used here.
SECTION PROPERTIES
Panel
Ipanel = bh3/12 = 18.5 x 106 mm4 (44.4 in4)
ct = cb = 90 mm/2 = 45 mm (1.77in.)
St = Sb = 18.5 x 106 mm4/45 mm. = 4.1 x 105 mm3 (25.1 in3)
r2 = Ipanel/Ac-pan = 675 mm2 (1.045 in2)
Composite slab
Icomposite = bh3/12 = 252 x 106 mm4 (605.5 in4)
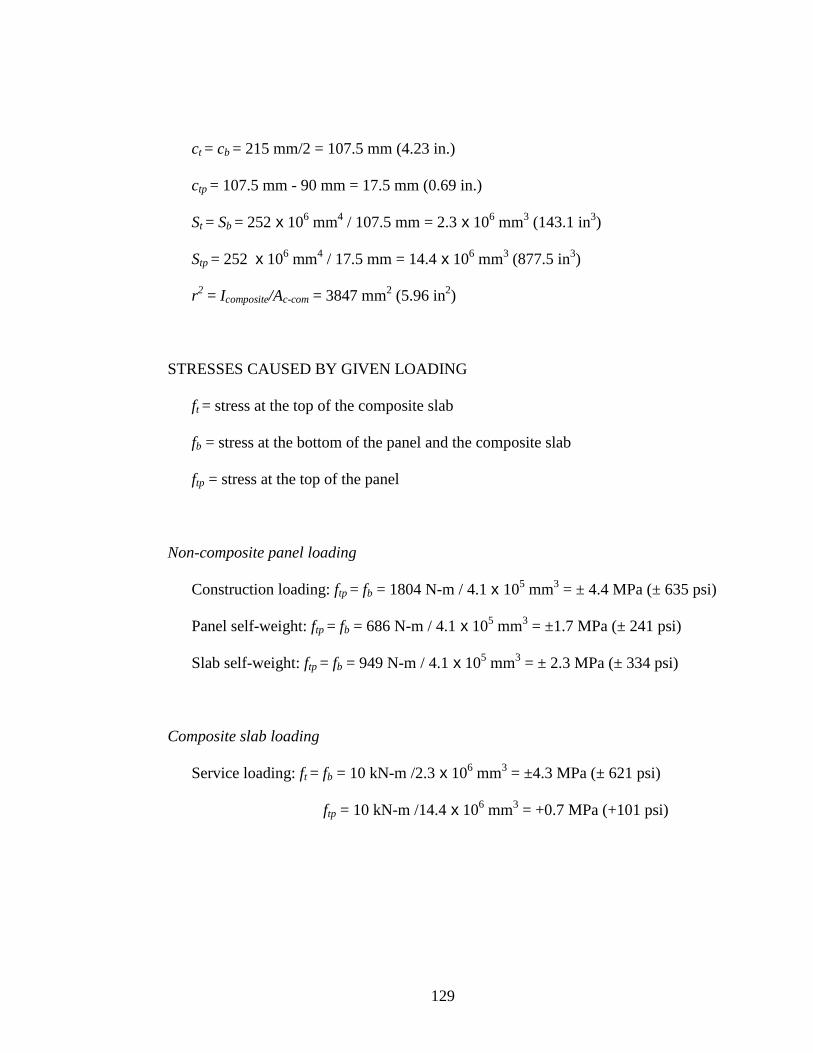
129
ct = cb = 215 mm/2 = 107.5 mm (4.23 in.)
ctp = 107.5 mm - 90 mm = 17.5 mm (0.69 in.)
St = Sb = 252 x 106 mm4 / 107.5 mm = 2.3 x 106 mm3 (143.1 in3)
Stp = 252 x 106 mm4 / 17.5 mm = 14.4 x 106 mm3 (877.5 in3)
r2 = Icomposite/Ac-com = 3847 mm2 (5.96 in2)
STRESSES CAUSED BY GIVEN LOADING
ft = stress at the top of the composite slab
fb = stress at the bottom of the panel and the composite slab
ftp = stress at the top of the panel
Non-composite panel loading
Construction loading: ftp = fb = 1804 N-m / 4.1 x 105 mm3 = ± 4.4 MPa (± 635 psi)
Panel self-weight: ftp = fb = 686 N-m / 4.1 x 105 mm3 = ±1.7 MPa (± 241 psi)
Slab self-weight: ftp = fb = 949 N-m / 4.1 x 105 mm3 = ± 2.3 MPa (± 334 psi)
Composite slab loading
Service loading: ft = fb = 10 kN-m /2.3 x 106 mm3 = ±4.3 MPa (± 621 psi)
ftp = 10 kN-m /14.4 x 106 mm3 = +0.7 MPa (+101 psi)
130
PRESTRESS DESIGN
The selection of the tendon size and spacing is based on an iterative design
procedure. Based on the allowable stresses and the fact that the prestressing bed
used by the panel precaster is set up to space the tendons at 121 mm (4.75 in.)
intervals, a tendon configuration was developed that placed 14 tendons over the
entire 2438 mm (96 in.) width. The configuration is shown in Figure 3.3. The
jacking force was chosen to be at 76 kN (17 kips) per tendon. This results in a
jacking stress of 0.58fpu.
Number of strands per unit width = 1.75
The total jacking force for a unit width (Ppj) is 132.3 kN (29.8 kips).
Total area of prestressing tendon per unit width (Ap) = 80.7 mm2 (0.125 in2)
DETERMINE TENDON STRESSES
Ppj = 132.3 kN (29.8 kips) This is the initial jacking force
applied per unit width.
Ppj-r = 0.9Ppj = 119.2 kN (26.8 kips) This 10 percent reduction in
jacking force is based on
observations made in tests by
Dolan et al. (2000).

131
++
+= −
ppcic
ppcic
cip
pan
pp
rji
AEr
eEA
EAEA
EI
eM
AE
PP
2
2
1
The above equation for Pi accounts for the stress reduction due to elastic
shortening. The following descriptions define the notations used:
Pj-r = jacking stress reduced by relaxation and other factors
Mpan = moment created by the self-weight of the panel alone
ec = eccentricity of the tendon in the panel
Ap, Ac = cross sectional area of the CFRP tendon and the concrete,
respectively (computed with the unit width)
Eci, Ec = Modulus of Elasticity of concrete at initial prestress release
and 28 days, respectively
Ep = Modulus of Elasticity of Leadline tendon
Ip = moment of inertia of the panel using a unit width
r2 = variable defined by the Ip/Ac-pan
The above equation results in:
Pi = 116.9 kN (26.3 kips)
fpi = 116.9 kN / 80.7 mm2 = 1449 MPa (210 ksi)

132
Pe = Pi (0.85) = 99.3 kN (22.4 kips)
fpe = fpi(0.85) = 1232 MPa (178.5 ksi) Relaxation loss in CFRP is
expected to be less than that of
steel, thus a value of 15 percent
is chosen for the total losses.
PANEL STRESSES DUE TO PRESTRESSING
stress in top of panel due to Pi:
−
−
−2
1r
ce
A
P tc
panc
i = -126 psi
stress in bottom of panel due to Pi:
+
−
−2
1r
ce
A
P tc
panc
i = -1113 psi
stress in top of panel due to Pe:
−
−
−2
1r
ce
A
P tc
panc
e = -107 psi
stress in bottom of panel due to Pe:
+
−
−2
1r
ce
A
P tc
panc
e = -960 psi
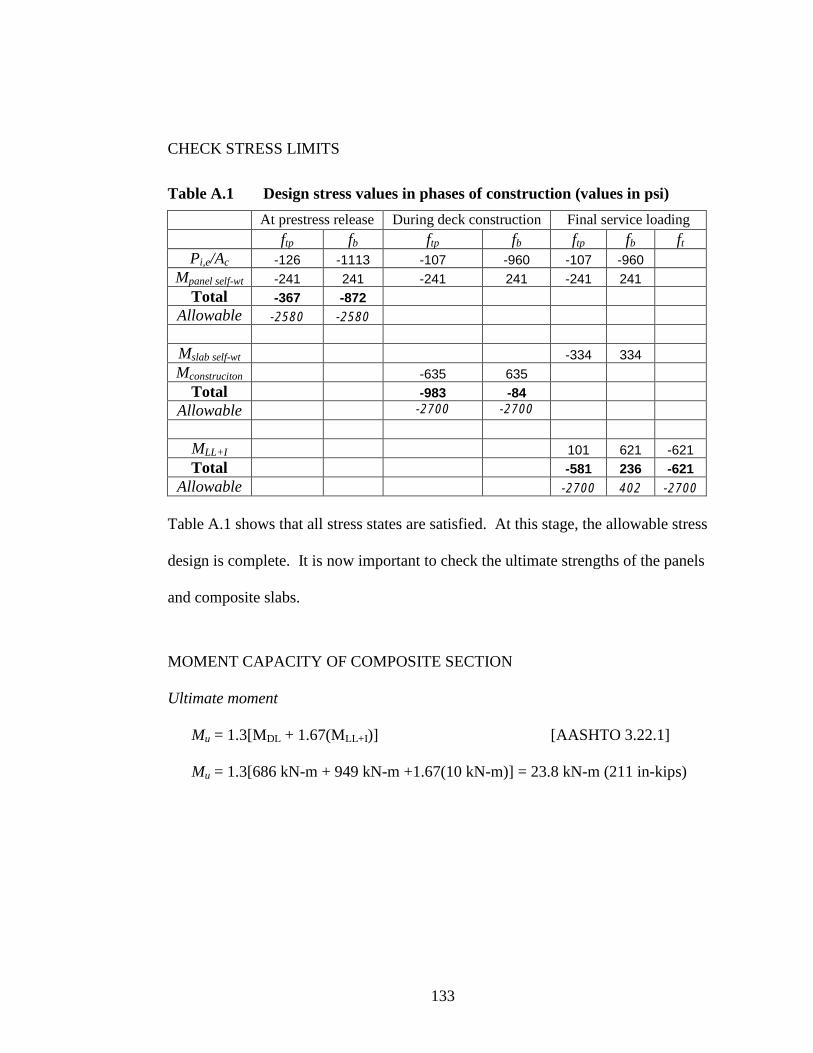
133
CHECK STRESS LIMITS
Table A.1 Design stress values in phases of construction (values in psi)
At prestress release During deck construction Final service loadingftp fb ftp fb ftp fb ft
Pi,e/Ac -126 -1113 -107 -960 -107 -960Mpanel self-wt -241 241 -241 241 -241 241
Total -367 -872Allowable -2580 -2580
Mslab self-wt -334 334Mconstruciton -635 635
Total -983 -84Allowable -2700 -2700
MLL+I 101 621 -621Total -581 236 -621
Allowable -2700 402 -2700
Table A.1 shows that all stress states are satisfied. At this stage, the allowable stress
design is complete. It is now important to check the ultimate strengths of the panels
and composite slabs.
MOMENT CAPACITY OF COMPOSITE SECTION
Ultimate moment
Mu = 1.3[MDL + 1.67(MLL+I)] [AASHTO 3.22.1]
Mu = 1.3[686 kN-m + 949 kN-m +1.67(10 kN-m)] = 23.8 kN-m (211 in-kips)

134
Nominal moment
Use the method presented in Section 3.3.2 to calculate the nominal moment
capacity. With fpu = 2822 MPa (409 ksi), we have
Mn = 38.4 kN-m (339.7 in-kips)
φ = Mu / Mn = 23.8 / 38.4 = 0.62
The moment capacity is recomputed using the method in Section 3.3.1. The
reinforcement ratio is computed and compared with ρbr to determine the
reinforcement scenario.
ρ = 0.00145
ρbr = 0.00169
Hence, the slab is normally reinforced and equation 3.3 is used to compute the
nominal moment capacity.
Mn = 38.1 kN-m (337 in-kips)
φ = Mu / Mn = 23.8 / 38.1 = 0.63

135
DEVELOPMENT LENGTH FOR COMPOSITE SECTION
The equation for development length used here is developed by Mahmoud et al.
(1999) and is shown below. A verification needs to be made to determine
whether the development length governs the nominal moment capacity.
( )67.067.0 '' cf
bpepu
cit
bpid f
dff
f
dfl
αα−
+=
Assume that fps = fpu =2818 MPa (409ksi)
ld =0.67 0.67
(1449 )(8 ) (2818 1232 )(8 )
1.9(29.6 ) 1.0(31 )
MPa mm MPa MPa mm
MPa MPa
−+ = 1901 mm (74.9 in.)
Allowable ld = 0.5 (2950 mm) = 1475 mm (58.1 in.)
Hence, the development length governs the moment capacity. Using the equation
above with ld = 1475 mm, replace fpu with fps and solve for fps.
fps =
0.670.67
pi bd f c
t cipe
b
f dl f
ff
d
αα
− ⋅
+
fps = 2294 MPa (333 ksi)
Now, recompute the nominal moment capacity at maximum tendon stress again
using the nominal moment computation method described in section 3.3.2.

136
Mn = 31.5 kN-m (278.6 in-kips)
φ = Mu / Mn = 23.8 / 31.5 = 0.76
MOMENT CAPACITY OF PANEL
Ultimate moment
Mu = 1.3[MDL + 1.67(MLL+I)] [AASHTO 3.22.1]
Mu = 1.3[686 N-m + 1.67(1804 N-m)] = 4808 N-m (42.6 in-kips)
Nominal moment
The method presented in Section 3.3.1 is used to compute the nominal moment
capacity of the over-reinforced section.
ρ = 0.0046
ρbr = 0.00168
ku =
−−
−+
cu
pe
cu
pe
εερλ
εε
ρλρλ 12
12
12
ku = 0.402
Summing the moments about the tendon gives the nominal moment capacity:
Mn = 0.85fcbβ1kudp2[1- (β1ku/2)]
Mn = 7234 N-m (64 in-kips)
φ = Mu / Mn = 4808 / 7234 = 0.66
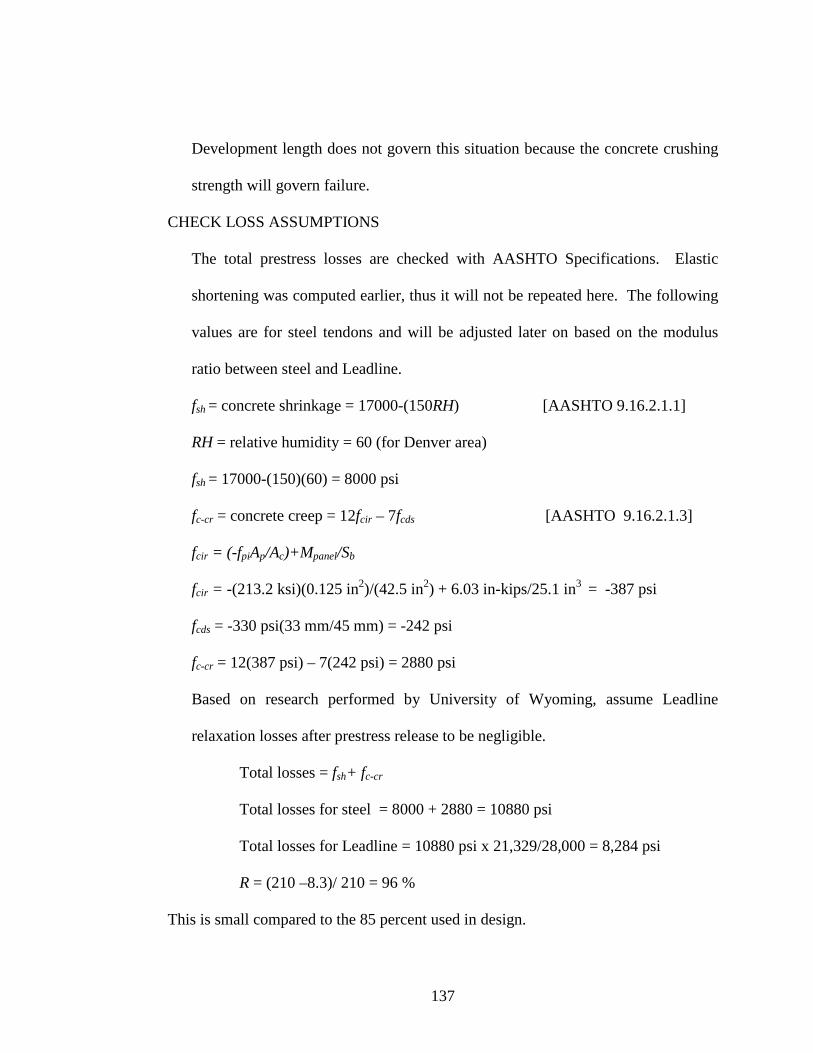
137
Development length does not govern this situation because the concrete crushing
strength will govern failure.
CHECK LOSS ASSUMPTIONS
The total prestress losses are checked with AASHTO Specifications. Elastic
shortening was computed earlier, thus it will not be repeated here. The following
values are for steel tendons and will be adjusted later on based on the modulus
ratio between steel and Leadline.
fsh = concrete shrinkage = 17000-(150RH) [AASHTO 9.16.2.1.1]
RH = relative humidity = 60 (for Denver area)
fsh = 17000-(150)(60) = 8000 psi
fc-cr = concrete creep = 12fcir – 7fcds [AASHTO 9.16.2.1.3]
fcir = (-fpiAp/Ac)+Mpanel/Sb
fcir = -(213.2 ksi)(0.125 in2)/(42.5 in2) + 6.03 in-kips/25.1 in3 = -387 psi
fcds = -330 psi(33 mm/45 mm) = -242 psi
fc-cr = 12(387 psi) – 7(242 psi) = 2880 psi
Based on research performed by University of Wyoming, assume Leadline
relaxation losses after prestress release to be negligible.
Total losses = fsh+ fc-cr
Total losses for steel = 8000 + 2880 = 10880 psi
Total losses for Leadline = 10880 psi x 21,329/28,000 = 8,284 psi
R = (210 –8.3)/ 210 = 96 %
This is small compared to the 85 percent used in design.


139
BIBLIOGRAPHY
[1] AASHTO, Standard Specifications for Highway Bridges, LRFD. USCustomary Units, 2nd ed. (1998). American Association of State Highway andTransportation Officials, Washington D.C.
[2] AASHTO, Standard Specifications for Highway Bridges,16th ed. (1996).American Association of State Highway and Transportation Officials,Washington D.C.
[3] ACI Committee 318, Building Code Requirements for Reinforced Concrete(ACI 318-99), American Concrete Institute, Farmington Hills, MI., 1999.
[4] ACI Committee 440, “Guide for the Design and Construction of ConcreteReinforced With FRP Bars,” American Concrete Institute, Farmington Hills,MI., November, 2000. (Draft)
[5] ASTM A 416 Standard Specification for Steel Strand, Uncoated Seven-WireFor Prestressed Concrete, American Society for Testing and Materials, 1999.
[6] ASTM A 882 Standard Specification for Epoxy-Coated Seven-WirePrestressing Steel Strand, American Society for Testing and Materials, 1996.
[7] ASTM A 981 Standard Test Method for Evaluating Bond Strength for 15.2mm(0.6”) Diameter Prestressing Steel Strand, Grade 270, Uncoated, Used inPrestressed Ground Anchors, American Society for Testing and Materials,1997.
[8] Barker, R. M., and Puckett, J.A. (1997). Design of Highway Bridges, JohnWiley and Sons, Inc.
[9] Brearley, L.M., and Johnston, D.W. (1990). “Pull-out Bond Tests of EpoxyCoated Prestressing Strand,” J. of Structural Engrg., Vol. 116, No. 8, August,pp. 2236-2252.
[10] Conrad, J., Bakis, C., Boothby, T., and Nanni, A. (2000). "Section F-Durabilityof Bond of Various FRP Rods in Concrete," Report Draft produced for FederalHighway Association.
140
[11] Cooke, D., Shing, P.B., and Frangopol, D. (1998). "Colorado Study on Transferand Development Length of Prestressing Strand in High Performance ConcreteBox Girders," Report No. CDOT-DTD-R-98-7, Colorado Department ofTransportation, April.
[12] Dolan, C., Hamilton, H.R., Bakis, C., and Nanni, A. (2000). "DesignRecommendations for Concrete Structures Prestressed with FRP Tendons,"Report No. DTFH61-96-C-00019, Federal Highway Association, May.
[13] Eligehausen, R., Popov, E.P., and Bertero, V.V. (1983). "Local Bond Stress-SlipRelationships of Deformed Bars Under Generalized Excitations." Report No.83/23, Earthquake Engrg. Res. Ctr. (EERC), Univ. of California – Berkely.
[14] Karlsson, M. (1997). “Bond Between C-BAR FRP Reinforcement andConcrete,” Ph.D. Thesis, Division of Building Technology, ChalmersUniversity of Technology, Goteborg, Sweden, March.
[15] Kent, D.C., and Park, R.( 1971). “Flexural Members with Confined Concrete,”Journal of the Structural Division, ASCE, Vol. 97, No. ST7, July, pp. 1969-1990.
[16] Lu, Z., Boothby, T., Bakis, C., and Nanni, A. (2000). "Section I-Transfer andDevelopment Lengths of FRP Prestressing Tendons," Report Draft produced forFederal Highway Association.
[17] Mahmoud, Z., Rizkalla, S.H., and Zaghloul, E. (1999). "Transfer andDevelopment Lengths of Carbon Fiber Reinforced Polymers PrestressingReinforcement," ACI Structural Journal, Vol. 96, No. 4, July-August, pp. 594-602.
[18] Mostofa, T., and Zia, P. (1977). “Development Length of Prestressing Strands,”PCI Journal, Vol. 22, No. 5, September-October, pp. 54-65.
[19] Nanni, A., Bakis, C.E., O’Neal, E.F., and Dixon, T.O. (1996). “Performance ofFRP Tendon-Anchor Systems for Prestressed Concrete Structures,” PCIJournal, Vol. 41, No. 1, January-February, pp. 34-45.
[20] Nilson, A.H. (1987). Design of Prestressed Concrete, 2nd ed., John Wiley andSons, Inc.
[21] Nilson, A.H., and Winter, G. (1991). Design of Concrete Structures, 11th ed.,McGraw-Hill Inc., pp. 177-191.
141
[22] Rizkalla, S. and Tadros, G. (1994). “A Smart Highway Bridge in Canada,”Concrete International, June.
[23] Rizkalla, S. (1997). “Material Properties of C-BAR Reinforcing Rods,”Technical Report produced for Marshall Industries Composites Inc., Publishedby ISIS Canada, University of Manitoba, Winnipeg, Manitoba, Canada, June.
[24] Shing, P.B., and Abu-Hejleh, N. (1999). "Cracking in Bridge Decks: Causes andMitigation," Report No. CDOT-DTD-R-99-8, Colorado Department ofTransportation, August.