Embed Size (px)
Citation preview
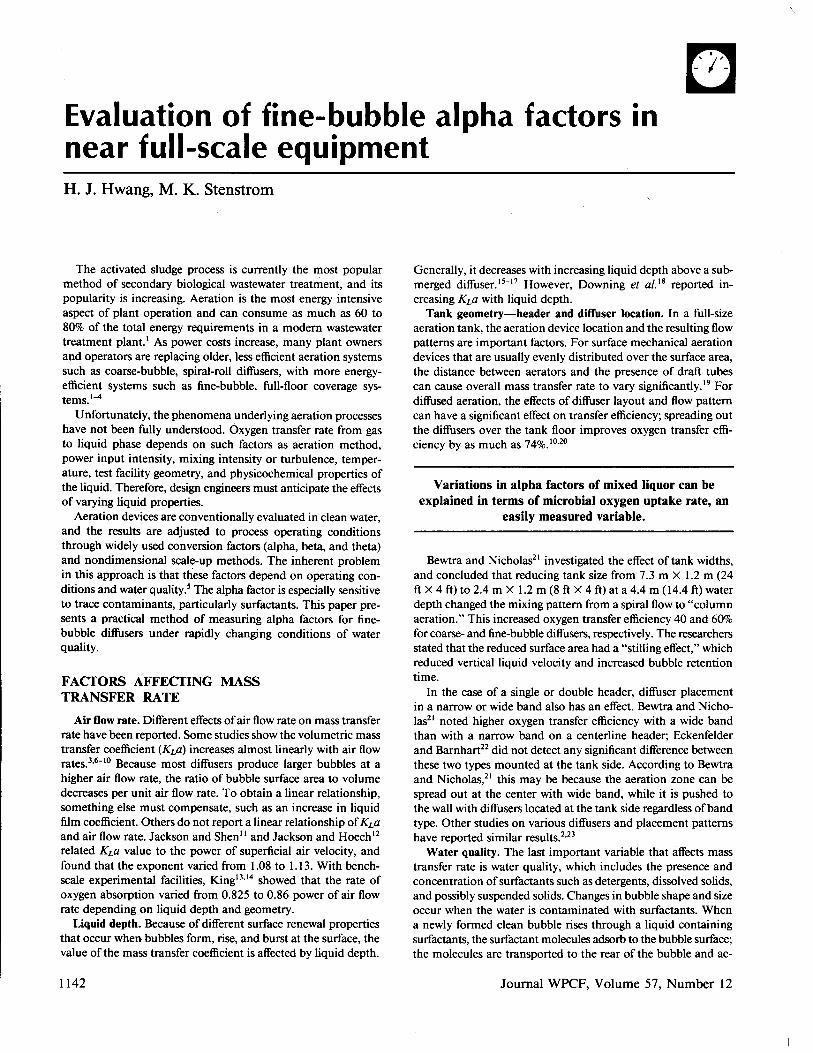
Evaluation of fine-bubble alpha factors innear full-scale equipmentH. J. Hwang, M. K. Stenstrom
© Copyright as part ofthe December 1985, JOURNAL WATER POLLUTION CONTROL
FEDERATION, Washington, D. C. 20037Printed in U. S. A.
Evaluation of fine-bubble alpha factors innear full-scale equipmentH. J. Hwang, M. K. Stenstrom
The activated sludge process is currently the most popularmethod of secondary biological wastewater treatment, and itspopularity is increasing. Aeration is the most energy intensiveaspect of plant operation and can consume as much as 60 to80% of the total energy requirements in a modern wastewatertreatment plant.' As power costs increase, many plant ownersand operators are replacing older, less efficient aeration systemssuch as coarse-bubble, spiral-roll diffusers, with more energy-efficient systems such as fine-bubble, full-floor coverage sys-tems . '-°
Unfortunately, the phenomena underlying aeration processeshave not been fully understood. Oxygen transfer rate from gasto liquid phase depends on such factors as aeration method,power input intensity, mixing intensity or turbulence, temper-ature, test facility geometry, and physicochemical properties ofthe liquid. Therefore, design engineers must anticipate the effectsof varying liquid properties .
Aeration devices are conventionally evaluated in clean water,and the results are adjusted to process operating conditionsthrough widely used conversion factors (alpha, beta, and theta)and nondimensional scale-up methods. The inherent problemin this approach is that these factors depend on operating con-ditions and water quality.' The alpha factor is especially sensitiveto trace contaminants, particularly surfactants. This paper pre-sents a practical method of measuring alpha factors for fine-bubble diffusers under rapidly changing conditions of waterquality.
FACTORS AFFECTING MASSTRANSFER RATE
Air flow rate . Different effects ofair flow rate on mass transferrate have been reported . Some studies show the volumetric masstransfer coefficient (KLa) increases almost linearly with air flowrates. 3,6- '° Because most diffusers produce larger bubbles at ahigher air flow rate, the ratio of bubble surface area to volumedecreases per unit air flow rate. To obtain a linear relationship,something else must compensate, such as an increase in liquidfilm coefficient . Others do not report a linear relationship ofKLaand air flow rate . Jackson and Shen" and Jackson and Hoech12related KLa value to the power of superficial air velocity, andfound that the exponent varied from 1.08 to 1 .13 . With bench-scale experimental facilities, King'3, ` a showed that the rate ofoxygen absorption varied from 0.825 to 0.86 power of air flowrate depending on liquid depth and geometry .
Liquid depth. Because ofdifferent surface renewal propertiesthat occur when bubbles form, rise, and burst at the surface, thevalue ofthe mass transfer coefficient is affected by liquid depth.
1142
Generally, it decreases with increasing liquid depth above a sub-merged diffuser ." -" However, Downing et aL" reported in-creasing KLa with liquid depth.Tank geometry-header and diffuser location . In a full-size
aeration tank, theaeration device location and the resulting flowpatterns are important factors. For surface mechanical aerationdevices that are usually evenly distributed over the surface area,the distance between aerators and the presence of draft tubescan cause overall mass transfer rate to vary significantly." Fordiffused aeration, the effects of diffuser layout and flow patterncan have a significant effect on transfer efficiency ; spreading outthe diffusers over the tank floor improves oxygen transfer effi-ciency by as much as 74%.' °.z°
Variations in alpha factors of mixed liquor can beexplained in terms of microbial oxygen uptake rate, an
easily measured variable .
Bewtra and Nicholas" investigated the effect oftank widths,and concluded that reducing tank size from 7.3 m X 1 .2 m (24ft X4 ft) to2.4mX 1 .2m(8ftX4ft)ata4.4m(14.4ft)waterdepth changed the mixing pattern from a spiral flow to "columnaeration ." This increased oxygen transfer efficiency 40 and 60%for coarse- and fine-bubble diffusers, respectively. The researchersstated that the reduced surface area had a "stilling effect," whichreduced vertical liquid velocity and increased bubble retentiontime .
In the case of a single or double header, diffuser placementin a narrow or wide band also has an effect. Bewtra and Nicho-las" noted higher oxygen transfer efficiency with a wide bandthan with a narrow band on a centerline header; Eckenfelderand Barnhart" did not detect any significant difference betweenthese two types mounted at the tank side. According to Bewtraand Nicholas," this may be because the aeration zone can bespread out at the center with wide band, while it is pushed tothe wall with diffusers located at the tank side regardless ofbandtype . Other studies on various diffusers and placement patternshave reported similar results. 2,Z3Water quality. The last important variable that affects mass
transfer rate is water quality, which includes the presence andconcentration ofsurfactants such as detergents, dissolved solids,and possibly suspended solids . Changes in bubble shape and sizeoccur when the water is contaminated with surfactants. Whena newly formed clean bubble rises through a liquid containingsurfactants, the surfactant molecules adsorb to the bubble surface;the molecules are transported to the rear of the bubble and ac-
Journal WPCF, Volume 57, Number 12
cumulate there to form a "cap." A surface tension gradient,which opposes the tangential shear stress, reduces surface flowover the rear portion ofthe bubble surface. This cap grows withincreasing surfactant concentration until it reaches the maximumsize that the surface tension gradient can support. 24 The adsorbedmolecules make the bubble more rigid and spherical" and reducethe surface renewal rate of air-water interface. As a result, thealpha value in the presence of surfactants is almost always lessthan unity in a diffused aeration system . The effect of a cap ismost significant when the bubble motion is either spiral or zig-zag," which occurs in the fine-bubble aeration systems. This isone reason that fine-bubble diffusers often have reduced alphavalues in comparison to other types of diffusers.
Researchers have reported a wide range ofalpha factors. Hol-royd and Parker 27 reported alpha values of0.63, 0.54, and 0.41for 50 mg/L of the anionic British surfactants Teepol, Lissapol,and Turkey Red Oil, respectively, in a bench-scale diffused aer-ation, and 0.83, 0.93 and 0.85, respectively, with a 30-cm di-ameter disk surface aerator . Baars25 reported that 10 mg/L ofalkylaryl sulphonate, alkyl sulfate, and Lissapol reduced oxy-genation capacity to 56.6, 53 .3, and 42.6%, respectively, ofthatin tap water in bench-scale experiments with a dome diffuser.Stenstrom and Hwang' showed that alpha varied with 1 .85 powerof the ratio of surface tension in surfactant solution and tapwater between 0.75 and 1 .0 to the ratio, using a laboratory-scalediffused aeration system . Carver 28,29 reported that 50 mg/L ofsynthetic detergent reduced oxygen transfer rate by 60% for risingair bubbles and 50% for falling water droplets . Poon and Camp-bell3G reported that soluble starch and glucose reduced alpha to0.7 at 400 mg/L; peptone and nutrient broth gave an alpha valueofapproximately 0.5 at 1000 mg/L, while 4000 mg/L ofsodiumchloride had almost no effect on alpha value. All measurementswere made with a fritted glass diffuser in a 0.14 m X 2.1 m (5 .5in . X 7 ft) water column .The alpha factor is also affected by solids concentration . Baker
et al." reported that the alpha factor decreased from 0.9 to 0.4when total solids concentration of poultry waste was increasedfrom 1 to 5.5% in an oxidation ditch usingcage rotors . Downing`found only a slight increase in KLa as suspended solids concen-tration increased from 2000 to 7000 mg/L ; Lister and Boon 33
reported no variation ofKLa in the same range. Holroyd andParker 27 reported essentially no effect on KLa values with theaddition ofbentonite, a highly colloidal clay, using bench-scalediffused aeration devices. Casey and Karmo3° obtained similarresults with coarse and fine dried peat granules and PVC granulesin concentrations up to 10 g/L, from laboratory-scale experi-ments on surface aeration. However, they also reported that thealpha factor varied from 0.84 to 1 .2 with 0 to 12 .5 g/L activatedsludge . Jackson and Hoech'2 reported that a 0.69 alpha valuefor wastewater containing 600 mg/L ground wood pulp increasedto 0.72 after filter paper was used .These reports indicate that the alpha factor dependsprimarily
on dissolved solids rather than on total or suspended solids con-centration . The minor differences found by some researchersmight be attributed to experimental variability. Many of theresearchers did not actually measure power input for the me-chanical aerators, which can change when surfactants or sus-pended solids are added.Most researchers, however, have reported that alpha factors
increased as treatment was increased . Downing et al . 18 andWheatland and Boon" reported a linear dependence of alpha
December 1985
value on the amount ofoxygen consumed by the microorganismsin a plug-flow aeration basin. Indeed, the results reported byRedmon and Boyle, 36 which showed that alpha increased from0.35 to 0.6 as determined by the offgas method in the full-scale,fine-bubble diffused aeration facility at Whittier Narrows, aretypical of the trends noted by most researchers .
METHODS AND MATERIALS
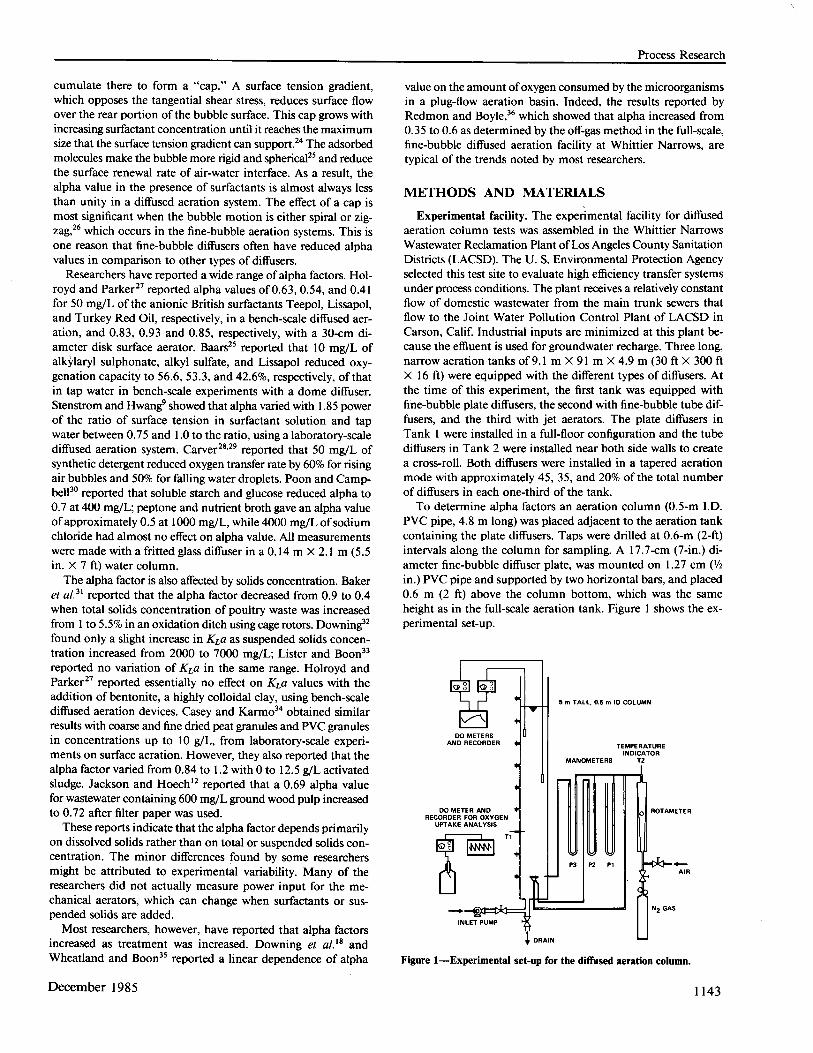
Experimental facility. The experimental facility for diffusedaeration column tests was assembled in the Whittier NarrowsWastewater Reclamation Plant ofLos Angeles County SanitationDistricts (LACSD). The U. S. Environmental Protection Agencyselected this test site to evaluate high efficiency transfer systemsunder process conditions. The plant receives a relatively constantflow of domestic wastewater from the main trunk sewers thatflow to the Joint Water Pollution Control Plant of LACSD inCarson, Calif. Industrial inputs are minimized at this plant be-cause the effluent is used for groundwater recharge. Three long,narrow aeration tanks of 9.1 m X 91 mX 4.9 m (30 ft X 300 ftX 16 ft) were equipped with the different types of diffusers . Atthe time of this experiment, the first tank was equipped withfine-bubble plate diffusers, the second with fine-bubble tube dif-fusers, and the third with jet aerators . The plate diffusers inTank 1 were installed in a full-floor configuration and the tubediffusers in Tank 2 were installed near both side walls to createa cross-roll . Both diffusers were installed in a tapered aerationmode with approximately 45, 35, and 20% of the total numberof diffusers in each one-third of the tank .To determine alpha factors an aeration column (0.5-m I.D .
PVCpipe, 4.8 m long) was placed adjacent to the aeration tankcontaining the plate diffusers. Taps were drilled at 0.6-m (2-ft)intervals along the column for sampling . A 17.7-cm (7-in.) di-ameter fine-bubble diffuser plate, was mounted on 1.27 cm (1/2in .) PVCpipe and supported by two horizontal bars, and placed0.6 m (2 ft) above the column bottom, which was the sameheight as in the full-scale aeration tank . Figure 1 shows the ex-perimental set-up .
DO METER ANDRECORDER FOR OXYGEN
UPTAKE ANALYSIS
INLET PUMP
Process Research
Figure 1-Experimental set-up for the diffused aeration column.
1143
Hyung
& Stenstrom
Dissolved
oxygen (DO) concentration was measured by sub-
merging
two DO probes through the top of the column
.
Two
DO
meters and a continuous strip chart recorder were used to
record
DO concentration versus time
.
To measure the microbial
oxygen
uptake rate for the mixed-liquor tests, an additional DO
probe
and meter were connected to a recording digital voltmeter
that
recorded DO data in 30-second intervals
.
The Winkler pro-
cedure
was used for measuring DO saturation concentration
and
for probe calibration
.
Nitrogen gas was used for deoxygen-
ation
by sparging it through the diffuser
.
Temperature was mea-
sured
with a mercury thermometer in the early series of exper-
iments
and later with thermocouples and D
.C .
voltmeters
.Two
rotameters, three U-tube manometers, and valves were
mounted
on a vertical panel and set beside the column
.
The
measured
air flow rate under the experimental conditions was
corrected
for pressure, moisture content, and temperature
.
The
pressure
drop across the orifice in the diffuser unit was converted
to
standard conditions and used as a second indicator ofair flow
rate.Because
a small quantity of trace contaminants can greatly
influence
the volumetric mass transfer coefficient, the experi-
mental
column was carefully cleaned before a series of clean
water
tests were performed
.
Another series of tests followed,
using
clean water plus dodecyl sodium sulfate, an anionic sur-
factant .
Next mixed liquor was tested
.
The measurements were
taken
between 4
.5
and 7
.5
m (15 and 25 ft) from the inlet end
of
the aeration tank to ensure primary effluent was mixed thor-
oughly
with return sludge
.
The initial oxygen uptake rate was
40
to 70 mg/L
"
h
.
A maximum of seven experiments were per-
formed
with each batch of mixed liquor
.Mathematical
models
.
For clean water tests, a nonsteady-state
adaptation
of the two-film theory is usually used in a batch re-
actor,
so that the oxygen mass balance on the liquid side is ex-
pressed
as
where
KLa
= volumetric mass transfer coefficient,
C
= saturation DO concentration, and
Co
= DO concentration in liquid
.
This
can be integrated to
where
where
1144
C
=
_KLa(C*
- C
(1)
C
= C* - (C* - Co)CKLat
Co
= initial DO concentration in liquid
.
dC
= KLa(C*
.
- C) - R(t) - Q (C - C)
(3)
R(t)
= microbial oxygen uptake rate,
Q
= mixed-liquor flow rate,
V
= liquid volume in the reactor, and
C
= DO concentration in influent
.
For
dirty water tests, a steady- or nonsteady-state test method
can
be used in either a batch or continuous-flow reactor
.
The
oxygen
mass balance equation includes the oxygen consumption
by
microorganisms and DO content in influent and effluent
streams:
When
the microbial oxygen uptake rate can be assumed con-
stant
during the experiment, Equation 3 can be integrated
:
where
In
a batch reactor, the continuity terms in Equation 3 are
zero
and the variables KLa', CR in Equation 4 are replaced
with
KLa and CR
:
and
where
If
the microbial oxygen uptake rate changes with time, Equa-
tion
3 is not readily solvable unless the form of the varying
oxygen
uptake rate can be expressed as a linear function oftime
.In
a batch reaction mode this is possible ifthe microbial oxygen
uptake
rate term is expressed as
R(t)
= a,L(t) + b,S(t)
(9)
L(t)
= substrate concentration,
S(t)
= mixed liquor suspended solids(MLSS) concentration,
anda,,
b, = constants
.
a,L(t)
represents the oxygen consumption caused by substrate
metabolism,
and b,S(t), the oxygen consumption caused by
endogenous
respiration
.
The variation of microbial solids
concentration
can be ignored when compared to the variation
of
substrate over the period of an aeration test so that b,S(t)
can
be replaced by a constant, Rc
.
R(t)
= a,L(t) + R,
(10)If
the rate of biological oxidation of substrate can be assumed
to
be first-order, then
:
A(t)
= -K
�L(t)
(11)dt
Integrating
Equation 11 and substituting into Equation 9, this
form
is obtained
:R(t)
= ROCK" + Rc
(12)Substitution
of Equation 12 into Equation 3 and solving for
C
in batch mode gives
C=CR_iCR_C0_KLaoKu/eKLX-KLRoKuCK~r
(13)In
this expression, the volumetric mass transfer coefficient
is
assumed constant during the test period
;
however, when the
water
quality changes rapidly, such as in the batch reactor
filled
with fresh mixed liquor, the constant mass transfer rate
assumption
can result in significant errors in estimating KLa
Journal
WPCF, Volume 57, Number 12
C
= CR - (CR -
Co)e
Ka,
(4)
KLa'=KLa+Q,and (5)
L
LCR=Ka'-K1,,(X-QCI
. (6)
C
= CR - (CR _ Co)CK-r
(7)
C
R
_ _R
- C
. (8)KLa
and C*. . To allow for changing mass transfer coefficients, alinear dependency of the mass transfer coefficient on dissolvedsolids or substrate concentration can be assumed over a smallrange of variation:
KLa = a3L(t) + b3
By combining Equations 10 and 14, the volumetric masstransfer coefficient can be expressed as
KLa = a4R(t) + b4
(14)
(15)
Substitution of Equation 15 into Equation 3 and dropping theflow term for batch mode, the mass balance equation becomes
dCdt
= (a4R(t) + b4)(Cmo - C) - R(t)
(16)
with R(t) given by Equation 12. By performing a series ofexperiments, the relationship between the volumetric masstransfer coefficient and microbial oxygen uptake rate can beestablished .
Parameter estimation. The parameters, &a, C*., and CO inEquation 2 can be estimated by any ofseveral nonlinearparam-eter estimation techniques, such as the linearization method orBox search method .4.11 In the case ofconstant KLa in a contin-uous-flow reactor, the parameters KLd, C', and Co in Equation4 and KLa and C*. can be obtained from Equations 5 and 6respectively, and in a batch reactor, KLa, CR, and Co are derivedfrom Equation 7 and C*. from Equation 8. These parameterscan be estimated using the computer code in the American So-ciety of Civil Engineers (ASCE) Standard Oxygen Transfer Pro-cedure . 38
If microbial oxygen uptake rate is assumed to decrease ex-ponentially, but the volumetric mass transfer coefficient is as-sumed constant, the values of KLa, CR, and Co are estimatedfrom Equation 13, using the linearization method although newsets of derivatives for the computer code are required for Equa-tions 2, 4, 7, and 13 .39 The same algorithm can be used to es-timate Ro and R, in Equation 12 from microbial uptake rateversus time data in a batch reactor with a slight modification .
Ifthe volumetric mass transfer coefficient is assumed to vary
aE
ZW
8
F
Ff70
0.5
0.4
0.3
0.2
eB
e00
eO
SYMBOL DEPTH
° 4.5 .O
&OmO
1.6 m
0
0
0.00.0 1.0 2.0 3.0 4.0 6.0
AIR FLOW RATE (m 3/hr)
Figure 2-Volumetric mass transfer coefficient versus air flow rate fordifferent depths.
December 1985
00asZW
0V0FQ
FQNW
O0w0
15.0
12.0
9.0
6.0
3.0
0.0. ~0.0
RESULTS AND DISCUSSION
Process Research
° O
°°0
00
00
0 0
o
a
o
DEPTH
° 4.5 mO 3.0 .O 1.5 m
1.0 2.0 3.0 4.0 5.0
AIR FLOW RATE (m3/hr)
Figure 3-Saturation DO concentration for tap water versus air flowrate for different depths .
with time, a4 , b4 , C*o and Co can be estimated from Equation16 with a search method, such as the Box method, and a nu-merical integration technique to solve the differential equations.Although any convenient technique can be used, the ContinuousSystems Modeling Program' was used in this work .
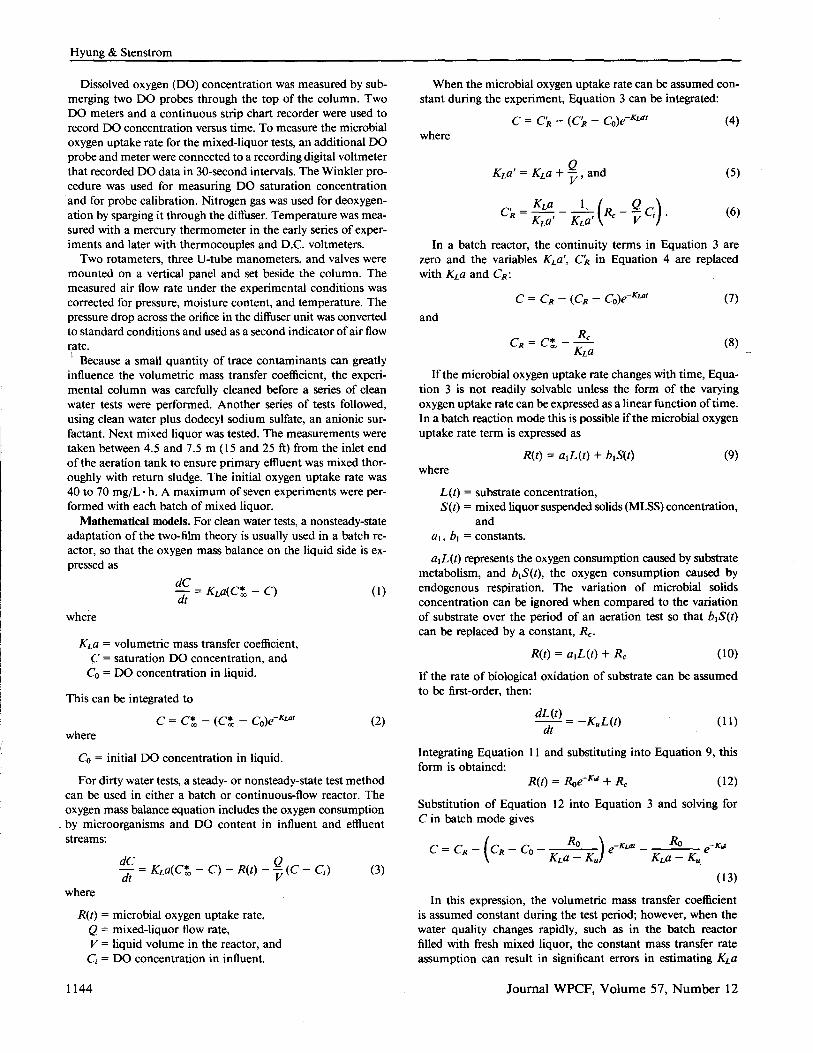
Clean water results. The experiments covered a 1 .5 to 4.3 m(5 to 14 ft, 2 in .) water depth, and a 1.02 to 4.76 m3/h (0 .6 to2.8 scfm) air flow rate . The water temperature varied from 25to 30°C . Volumetric mass transfer coefficients under processconditions were converted to standard condition using the ASCErecommended theta value of 1 .024 . 38 The data show a lineardependence of volumetric mass transfer coefficient on air flowrate at each water depth.The volumetric mass transfer coefficients versus air flow rate
are plotted in Figure 2 for each water depth. KLa generally in-creased with depth as liquid depth changed from 1 .5 m (5 ft) to4.3 m (14 ft, 2 in .) ; this trend contrasts with previous findings.Jackson and Shen" reported that KLa changed with -0.45 to-0.55 power of liquid depth. Yunt,4' Bacon et aL, 3 and Urzaand Jackson' also reported slight decreases of KLa with liquiddepth. However, in all cases the diffusers were located at or veryclose to the tank bottom . In this research, the diffuser was lifted0.6 m (2 ft) above the column bottom, and the "dead zone,"which was as much as 40% ofthe total column volume at a 1.5-m (5-ft) water depth, could have caused this difference. In othertest results not shown in Figure 2, KLa increased slightly as theliquid depth increased to 4.6 m (15 ft).
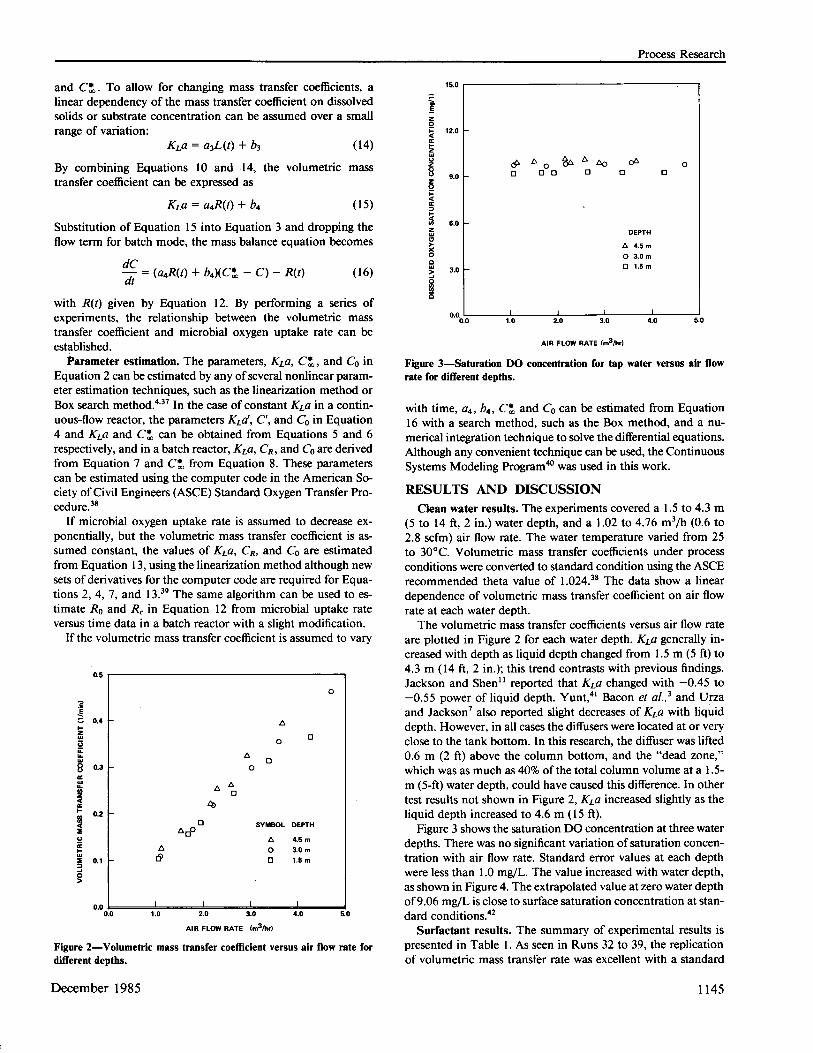
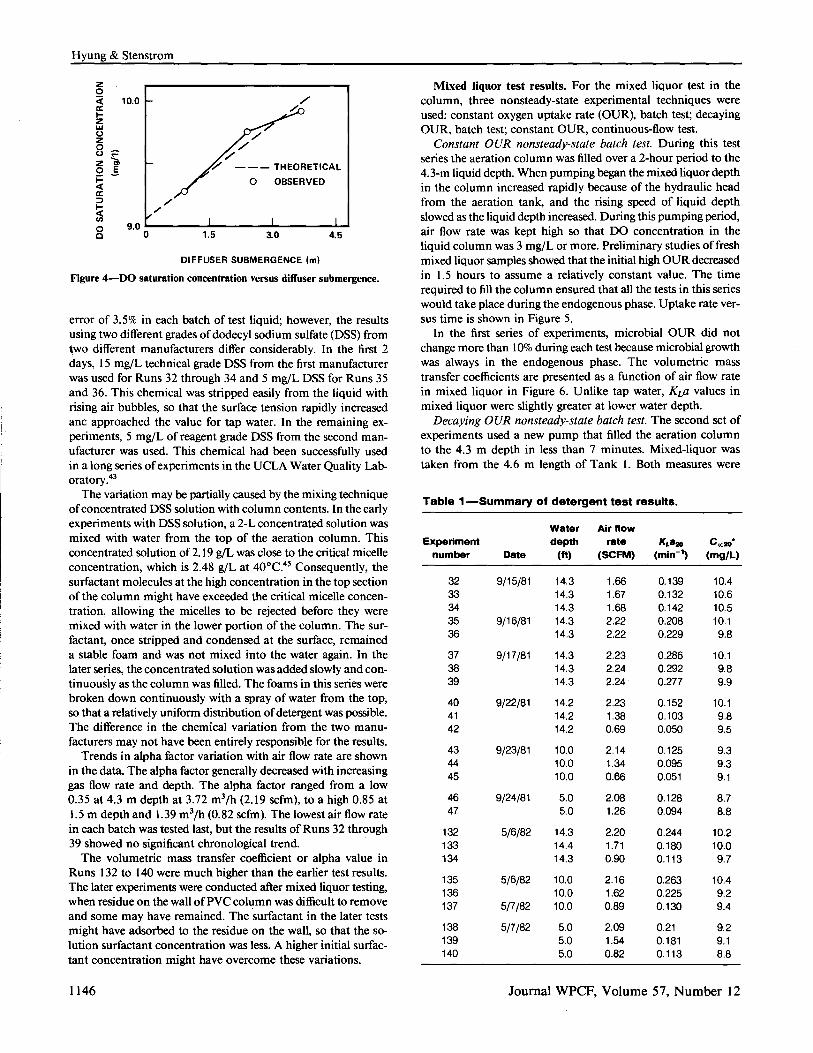
Figure 3 shows the saturation DO concentration at three waterdepths. There was no significant variation of saturation concen-tration with air flow rate . Standard error values at each depthwere less than 1 .0 mg/L . The value increased with water depth,as shown in Figure 4. The extrapolated value at zerowater depthof9.06 mg/L is close to surface saturation concentration at stan-dard conditions.42
Surfactant results. The summary of experimental results ispresented in Table 1 . As seen in Runs 32 to 39, the replicationof volumetric mass transfer rate was excellent with a standard
1145
Hyung & Stenstrom
1)46
zzLIJ0zO0z WO _EFa
a(n
/
Z"--- THEORETICAL
O OBSERVED
O 9.00 0
1.5 3.0 4.5
DIFFUSER SUBMERGENCE (m)
Figure 4-DO saturation concentration versus diffuser submergence .
error of 3.5% in each batch of test liquid ; however, the resultsusing two different grades ofdodecyl sodium sulfate (DSS) fromtwo different manufacturers differ considerably. In the first 2days, 15 mg/L technical grade DSSfrom the first manufacturerwas used for Runs 32 through 34 and 5 mg/L DSS for Runs 35and 36. This chemical was stripped easily from the liquid withrising air bubbles, so that the surface tension rapidly increasedanc approached the value for tap water. In the remaining ex-periments, 5 mg/L of reagent grade DSS from the second man-ufacturer was used . This chemical had been successfully usedin a long series ofexperiments in the UCLA Water Quality Lab-oratory.°3
The variation may be partially caused by the mixing techniqueofconcentrated DSS solution with column contents . In the earlyexperiments with DSS solution, a 2-Lconcentrated solution wasmixed with water from the top of the aeration column . Thisconcentrated solution of2.19 g/L was close to the critical micelleconcentration, which is 2.48 g/L at 40°C ..°s Consequently, thesurfactant molecules at the high concentration in the top sectionofthe column might have exceeded the critical micelle concen-tration, allowing the micelles to be rejected before they weremixed with water in the lower portion of the column . The sur-factant, once stripped and condensed at the surface, remaineda stable foam and was not mixed into the water again. In thelater series, the concentrated solution was added slowly and con-tinuously as the column was filled. The foams in this series werebroken down continuously with a spray ofwater from the top,so that a relatively uniform distribution ofdetergent was possible .The difference in the chemical variation from the two manu-facturers may not have been entirely responsible for the results .
Trends in alpha factor variation with air flow rate are shownin the data. The alpha factor generally decreased with increasinggas flow rate and depth. The alpha factor ranged from a low0.35 at 4.3 m depth at 3.72 M3/h (2.19 scfm), to a high 0.85 at1.5 m depth and 1 .39m3/h (0.82 scfm). The lowest air flow ratein each batch was tested last, but the results ofRuns 32 through39 showed no significant chronological trend.The volumetric mass transfer coefficient or alpha value in
Runs 132 to 140 were much higher than the earlier test results .The later experiments were conducted after mixed liquor testing,when residue on the wall ofPVCcolumn was difficult to removeand some may have remained . The surfactant in the later testsmight have adsorbed to the residue on the wall, so that the so-lution surfactant concentration was less. A higher initial surfac-tant concentration might have overcome these variations .
Mixed liquor test results . For the mixed liquor test in thecolumn, three nonsteady-state experimental techniques wereused : constant oxygen uptake rate (OUR), batch test; decayingOUR, batch test ; constant OUR, continuous-flow test.
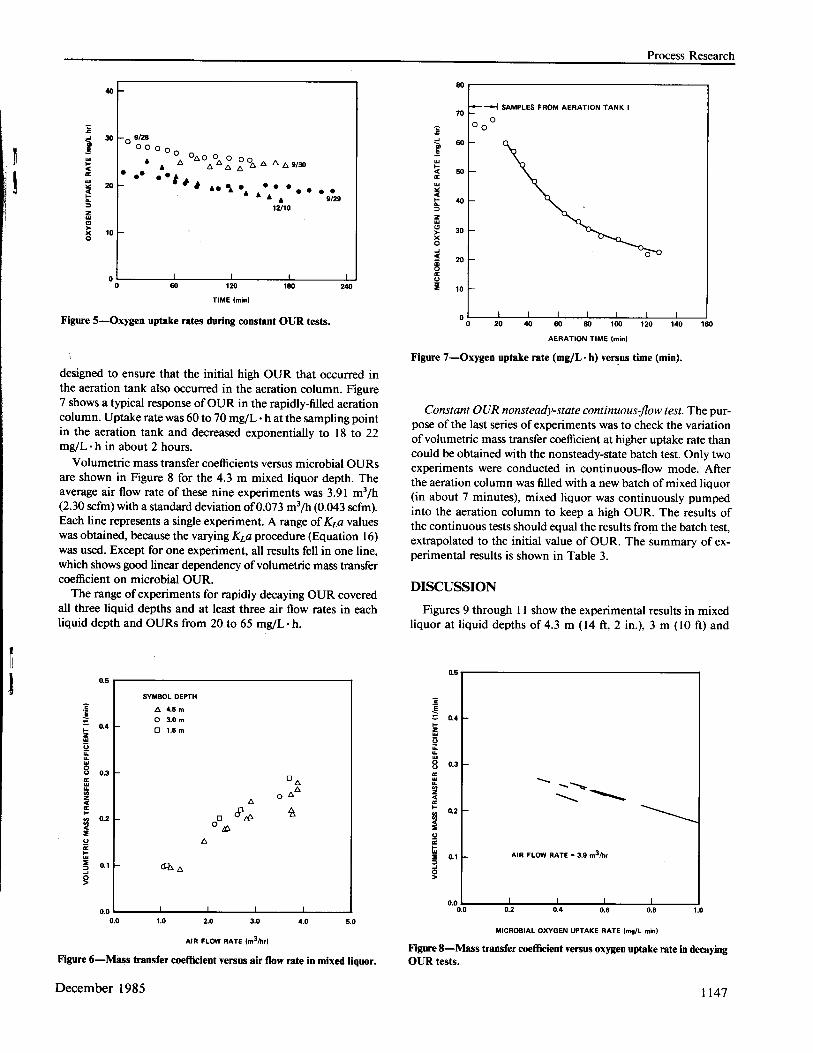
Constant OUR nonsteady-state batch test. During this testseries the aeration column was filled over a 2-hour period to the4.3-m liquid depth. When pumping began the mixed liquor depthin the column increased rapidly because of the hydraulic headfrom the aeration tank, and the rising speed of liquid depthslowed as the liquid depth increased. During this pumping period,air flow rate was kept high so that DO concentration in theliquid column was 3 mg/L or more. Preliminary studies of freshmixed liquor samples showedthat the initial high OURdecreasedin 1 .5 hours to assume a relatively constant value. The timerequired to fill the column ensured that all the tests in this serieswould take place during the endogenous phase. Uptake rate ver-sus time is shown in Figure 5.
In the first series of experiments, microbial OUR did notchange more than 10% during each test because microbial growthwas always in the endogenous phase. The volumetric masstransfer coefficients are presented as a function of air flow ratein mixed liquor in Figure 6. Unlike tap water, &a values inmixed liquor were slightly greater at lower water depth.Decaying OUR nonsteady-state batch test . The second set of
experiments used a new pump that filled the aeration columnto the 4.3 m depth in less than 7 minutes. Mixed-liquor wastaken from the 4.6 m length of Tank 1. Both measures were
Table 1-Summary of detergent test results.
Journal WPCF, Volume 57, Number 12
Experimentnumber Date
Waterdepth
(ft)
Air flowrate
(SCFM)KLa20
(min-')C.w`(mg/L)
32 9/15/81 14.3 1 .66 0.139 10.433 14.3 1 .67 0.132 10.634 14.3 1 .68 0.142 10.535 9/16/81 14.3 2.22 0.208 10.136 14 .3 2.22 0.229 9.8
37 9/17/81 14 .3 2.23 0.286 10.138 14.3 2.24 0.292 9.839 14 .3 2.24 0.277 9.9
40 9/22/81 14 .2 2.23 0.152 10 .141 14 .2 1 .38 0.103 9.842 14 .2 0.69 0.050 9.5
43 9/23/81 10 .0 2.14 0.125 9.344 10 .0 1 .34 0.095 9.345 10 .0 0.66 0.051 9.1
46 9/24/81 5.0 2.08 0.128 8.747 5.0 1 .26 0.094 8.8
132 5/6/82 14 .3 2.20 0.244 10 .2133 14 .4 1 .71 0.180 10 .0134 14 .3 0.90 0.113 9.7
135 5/6/82 10 .0 2.16 0.263 10 .4136 10 .0 1 .62 0.225 9.2137 5/7/82 10.0 0.89 0.130 9.4
138 5/7/82 5.0 2.09 0.21 9.2139 5.0 1 .54 0.181 9.1140 5.0 0.82 0.113 8.8
E
F2VW
WNQ
sU¢WfJ
0.5
0.4
0.3
0.2
0
80 120 190 240
TIME (min)
Figure 5-Oxygen uptake rates during constant OUR tests.
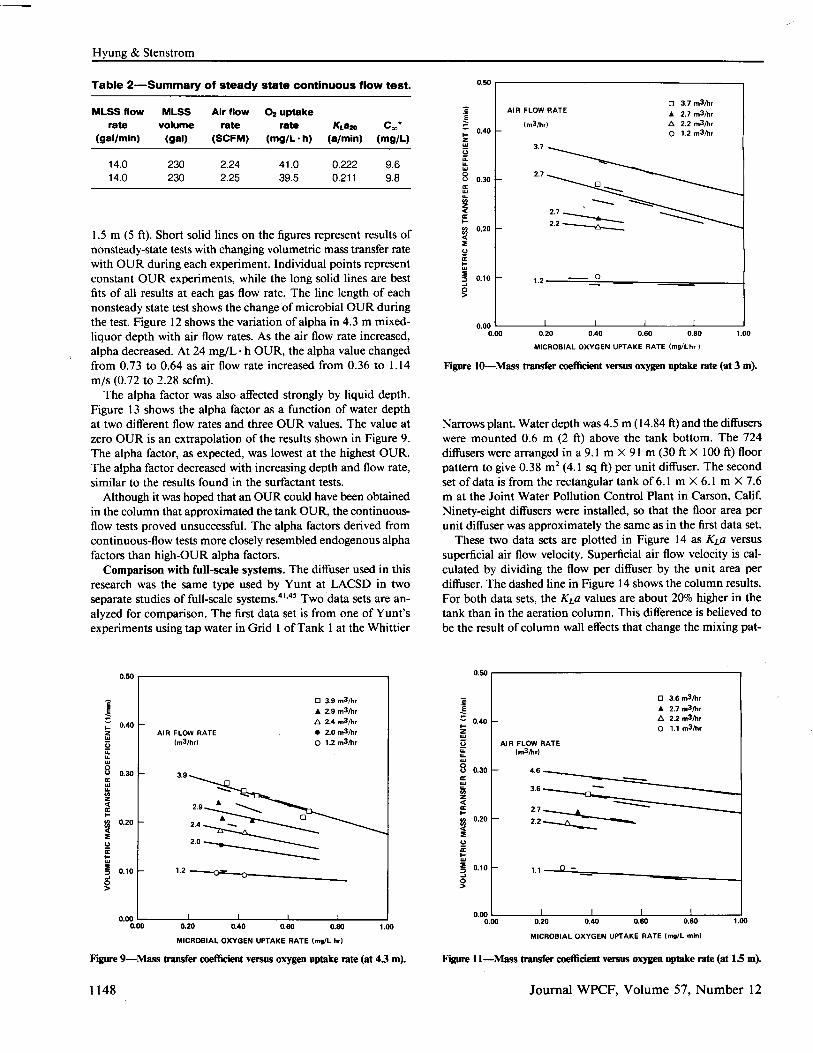
designed to ensure that the initial high OUR that occurred inthe aeration tank also occurred in the aeration column . Figure7 shows a typical response of OUR in the rapidly-filled aerationcolumn . Uptake rate was 60 to 70 mg/L " h at the sampling pointin the aeration tank and decreased exponentially to 18 to 22mg/L " h in about 2 hours.
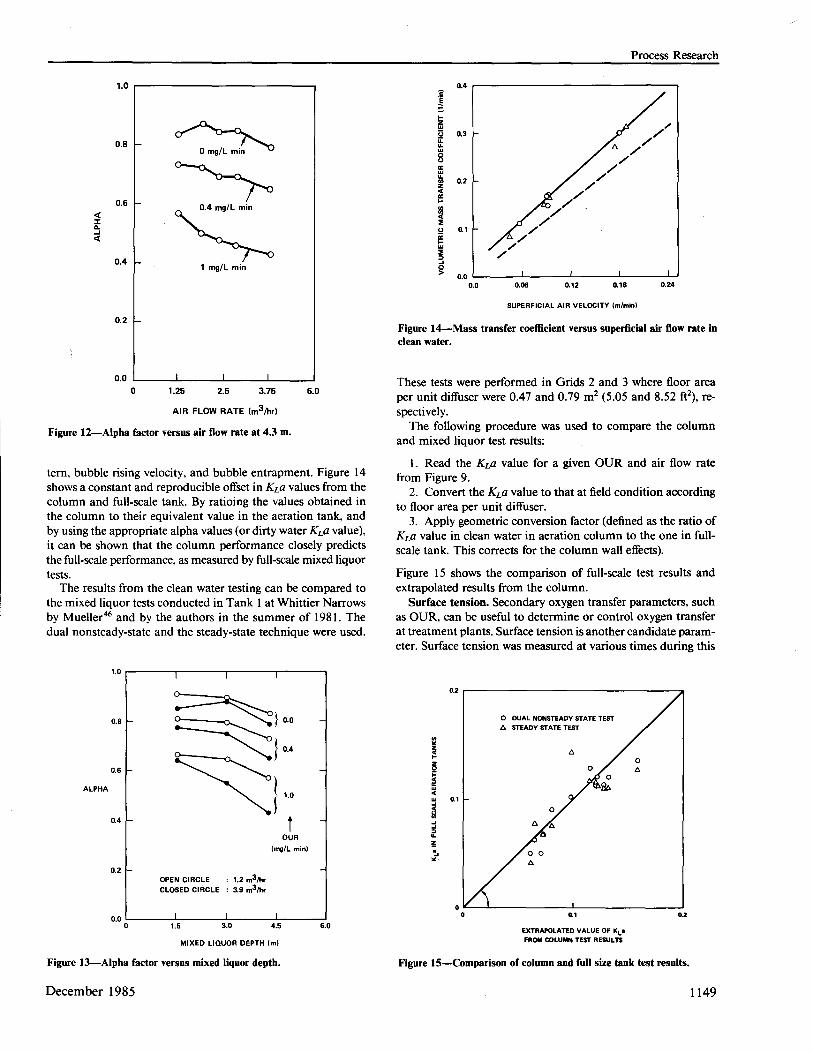
Volumetric mass transfer coefficients versus microbial OURsare shown in Figure 8 for the 4.3 m mixed liquor depth. Theaverage air flow rate of these nine experiments was 3.91 M3/h(2.30 scfm) with a standard deviation of0.073 m3/h (0.043 scfm).Each line represents a single experiment. A range of KLavalueswas obtained, because the varyingKLaprocedure (Equation 16)was used . Except for one experiment, all results fell in one line,which shows good linear dependency ofvolumetric mass transfercoefficient on microbial OUR.The range ofexperiments for rapidly decaying OUR covered
all three liquid depths and at least three air flow rates in eachliquid depth andOURS from 20 to 65 mg/L " h.
SYMBOL DEPTH
A 4.5 mO 3.0 .O 1.5 m
CVA e
oACS
e
e
oeeO
0.00.0 1.0 2.0 3.0 4.0 5.0
AIR FLOW RATE (m3/h,)
Figure 6-Mass transfer coefficient versus air flow rate in mixed liquor .
December 1985
Figure 7-Oxygen uptake rate (mg/L" h) versus time (min) .
Constant OURnonsteady-state continuousflow test. The pur-pose of the last series ofexperiments was to check the variationof volumetric mass transfer coefficient at higher uptake rate thancould be obtained with the nonsteady-state batch test . Only twoexperiments were conducted in continuous-flow mode. Afterthe aeration column was filled with a new batch ofmixed liquor(in about 7 minutes), mixed liquor was continuously pumpedinto the aeration column to keep a high OUR. The results ofthe continuous tests should equal the results from the batch test,extrapolated to the initial value of OUR. The summary of ex-perimental results is shown in Table 3.
DISCUSSION
Figures 9 through 11 show the experimental results in mixedliquor at liquid depths of 4.3 m (14 ft, 2 in.), 3 m (10 ft) and
0.5
WU
0 0.3
ZQ
U¢Wf 0.1nO7
0.2
AIR FLOW RATE - 3.9 m3/h,
L 10.00.0 0.2 0.4
AERATION TIME (min)
Process Research
0.6 0.8 1.0
MICROBIAL OXYGEN UPTAKE RATE Ing/L min)
Figure 8-Mass transfer coefficient versus oxygen uptake rate in decayingOUR tests.
1147
40
a
30 -0 9/2800 00 0
e e0 00eAe&0AAeA9/30
" ""WQ
20 . .A "~ "~:". " " " 9%297ZW
12/10
0 10
0 I 1 I
Hyung & Stenstrom
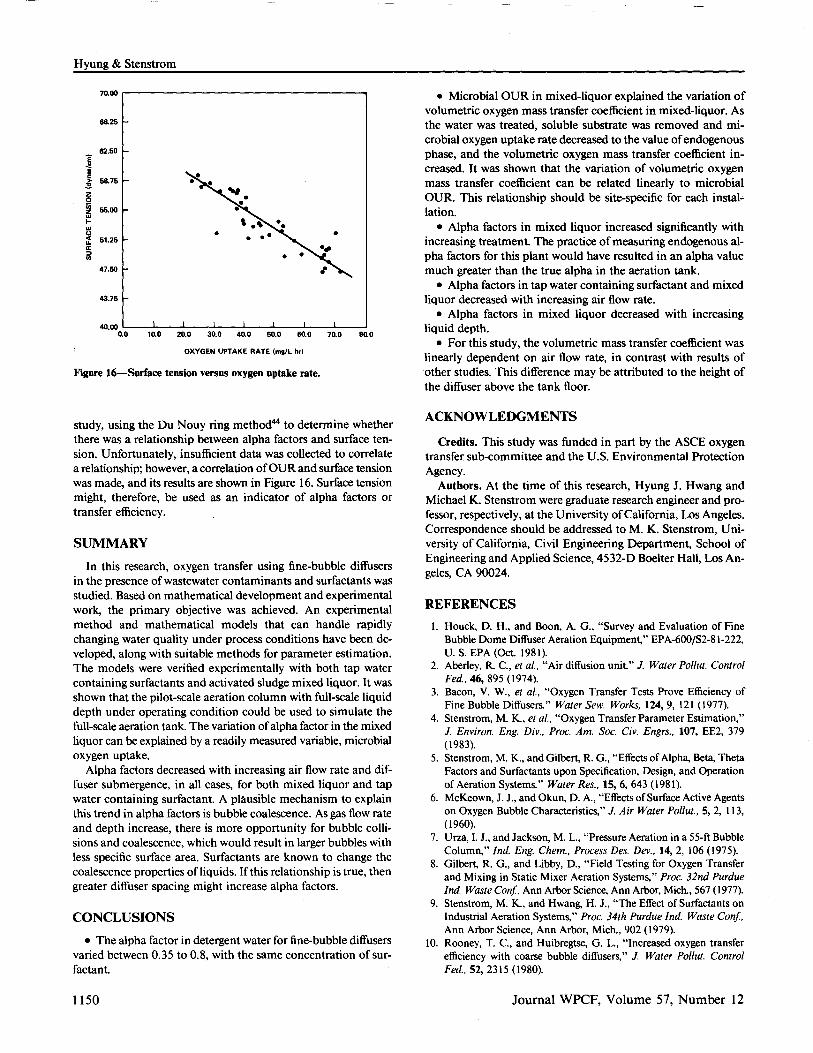
Table 2-Summary of steady state continuous flow test .
MLSS flow
MLSS
Air flow
Oz uptakerate volume rate rate KL820 Cm*
(gal/min)
(gal)
(SCFM)
(mg/L " h)
(a/min)
(mg/L)
cEH2WUWWW
UW
N2QF
fU¢FW
7JO
1148
14 .0 230 2.24 41 .0 0.222 9.614 .0 230 2.25 39.5 0.211 9.8
1 .5 m (5 ft). Short solid lines on the figures represent results ofnonsteady-state tests with changing volumetric mass transfer ratewith OURduring each experiment . Individual points representconstant OUR experiments, while the long solid lines are bestfits of all results at each gas flow rate . The line length of eachnonsteady state test shows the change of microbialOURduringthe test . Figure 12 shows the variation ofalpha in 4.3 m mixed-liquor depth with air flow rates. As the air flow rate increased,alpha decreased. At 24 mg/L " h OUR, the alpha value changedfrom 0.73 to 0.64 as air flow rate increased from 0.36 to 1 .14m/s (0.72 to 2.28 scfm).The alpha factor was also affected strongly by liquid depth.
Figure 13 shows the alpha factor as a function of water depthat two different flow rates and three OUR values. The value atzero OUR is an extrapolation of the results shown in Figure 9.The alpha factor, as expected, was lowest at the highest OUR.The alpha factor decreased with increasing depth and flow rate,similar to the results found in the surfactant tests.
Although it was hoped that an OURcould have been obtainedin the column that approximated the tank OUR, the continuous-flow tests proved unsuccessful . The alpha factors derived fromcontinuous-flow tests more closely resembled endogenous alphafactors than high-OUR alpha factors.Comparison with full-scale systems. The diffuser used in this
research was the same type used by Yunt at LACSD in twoseparate studies of full-scale systems." ," Two data sets are an-alyzed for comparison . The first data set is from one of Yunt'sexperiments using tap water in Grid 1 ofTank 1 at the Whittier
MICROBIAL OXYGEN UPTAKE RATE (mg/L hr)
Figure 9-Mass transfer coefficient versus oxygen uptake rate (at 43 m).
0.00 1
1
1
I
I
I0.00 0.20 0.40 0.60 0.60 1 .00
MICROBIAL OXYGEN UPTAKE RATE (mg/Lhr )
Figure 10-Mass transfer coefficient versus oxygen uptake rate (at 3 m).
Narrows plant. Water depth was4.5 m (14.84 ft) and thediffuserswere mounted 0.6 m (2 ft) above the tank bottom . The 724diffusers were arranged in a9.1 m X 91 m (30 ft X 100 ft) floorpattern to give 0.38 m2 (4 .1 sq ft) per unit diffuser . The secondset of data is from the rectangular tank of 6.1 m X 6.1 m X 7.6m at the Joint Water Pollution Control Plant in Carson, Calif.Ninety-eight diffusers were installed, so that the floor area perunit diffuser was approximately the same as in the first data set.
These two data sets are plotted in Figure 14 as &a versussuperficial air flow velocity. Superficial air flow velocity is cal-culated by dividing the flow per diffuser by the unit area perdiffuser . The dashed line in Figure 14 shows the column results,For both data sets, the &a values are about 20% higher in thetank than in the aeration column. This difference is believed tobe the result ofcolumn wall effects that change the mixing pat-
0.00 0.20 0.40 0.60 0.80 1 .00
MICROBIAL OXYGEN UPTAKE RATE (mg/L min)
Figure 11-Mass transfer coefficient versus oxygen uptake rate (at 1.5 m).
Journal WPCF, Volume 57, Number 12
0.50
O 3.7 m3/hrcE
AIR FLOW RATE A 2.7 m3/hr(m3/hr) A 2.2 m3/hr
F 0.40 O 1.2 m3/hrzW 3.7UuWV 0.30
2.7
N2Q 2.7
Q 0.202.2
fVFWj 0.10J 1.2O
0.50
c 0 3.6 m3/hrE 2.7 m3/hr
0.40 A 2.2 m3/hrF2 O 1.1 m3/hr
U AIR FLOW RATEu.W (m3/hr)W
0.30 - 4.6¢W
N 3.62Q¢ 2.7~_
0.20 2.2
fU¢FW7 0.10 1.1 0-JO
0.00 I 1- I I
axo.Ja
ALPHA
1 .25 2 .5 3.75 5.0
AIR FLOW RATE (m3/hr)
Figure 12-Alpha factor versus air flow rate at 4.3 m.
tern, bubble rising velocity, and bubble entrapment. Figure 14shows a constant andreproducible offset in KLavalues from thecolumn and full-scale tank. By ratioing the values obtained in
the column to their equivalent value in the aeration tank, andby using the appropriate alpha values (or dirty waterKLa value),
it can be shown that the column performance closely predicts
the full-scale performance, as measured by full-scale mixed liquor
tests.The results from the clean water testing can be compared to
the mixed liquor tests conducted in Tank 1 at Whittier Narrowsby Mueller" and by the authors in the summer of 1981 . Thedual nonsteady-state and the steady-state technique were used .
Figure 13-Alpha factor versus mixed liquor depth.
December 1985
aE
0.4
zW5 0.3uWW0U
WH 0.2za
as
0
0.00.0 0.08 0.12 0.18 0.24
SUPERFICIAL AIR VELOCITY (m/min)
Process Research
Figure 14-Mass transfer coefficient versus superficial air flow rate inclean water.
These tests were performed in Grids 2 and 3 where floor areaper unit diffuser were 0.47 and 0.79 m2 (5.05 and 8.52 ft2), re-spectively.The following procedure was used to compare the column
and mixed liquor test results:
1 . Read the Kta value for a given OUR and air flow rate
from Figure 9.2. Convert theKLa value to that at field condition according
to floor area per unit diffuser .
3. Apply geometric conversion factor (defined as the ratio ofKta value in clean water in aeration column to the one in full-scale tank . This corrects for the column wall effects) .
Figure 15 shows the comparison of full-scale test results andextrapolated results from the column .
Surface tension. Secondary oxygen transfer parameters, suchas OUR, can be useful to determine or control oxygen transferat treatment plants . Surface tension is another candidate param-eter. Surface tension was measured at various times during this
OA
EXTRAPOLATED VALUE OF KL-FROM COLUMN TEST RESULTS
Figure 15-Comparison of column and full size tank test results.
1149
0.2
O DUAL NONSTEADY STATE TESTA STEADY STATE TEST
NY2aF
OHQ
O
a0.1
a O
J n7W Oz
O O
Hyung &Stenstrom
0caz0W
Wr
a
N
OXYGEN UPTAKE RATE (mg/L hr)
Figure 16-Surface tension versus oxygen uptake rate .
study, using the Du Nouy ring method" to determine whetherthere was a relationship between alpha factors and surface ten-sion . Unfortunately, insufficient data was collected to correlatea relationship ; however, a correlation ofOURand surface tensionwas made, and its results are shown in Figure 16 . Surface tensionmight, therefore, be used as an indicator of alpha factors ortransfer efficiency.
SUMMARY
In this research, oxygen transfer using fine-bubble diffusersin the presence ofwastewater contaminants and surfactants wasstudied. Based on mathematical development and experimentalwork, the primary objective was achieved. An experimentalmethod and mathematical models that can handle rapidlychanging water quality under process conditions have been de-veloped, along with suitable methods for parameter estimation.The models were verified experimentally with both tap watercontaining surfactants and activated sludge mixed liquor. It wasshown that the pilot-scale aeration column with full-scale liquiddepth under operating condition could be used to simulate thefull-scale aeration tank. The variation ofalpha factor in the mixedliquor can be explained by a readily measured variable, microbialoxygen uptake.Alpha factors decreased with increasing air flow rate and dif-
fuser submergence, in all cases, for both mixed liquor and tapwater containing surfactant. A plausible mechanism to explainthis trend in alpha factors is bubble coalescence . As gas flow rateand depth increase, there is more opportunity for bubble colli-sions and coalescence, which would result in larger bubbles withless specific surface area . Surfactants are known to change thecoalescence properties ofliquids . If this relationship is true, thengreater diffuser spacing might increase alpha factors.
CONCLUSIONS
" The alpha factor in detergent water for fine-bubble diffusersvaried between 0.35 to 0.8, with the same concentration of sur-factant .
1150
" Microbial OUR in mixed-liquor explained the variation ofvolumetric oxygen mass transfer coefficient in mixed-liquor. Asthe water was treated, soluble substrate was removed and mi-crobial oxygen uptake rate decreased tothe value ofendogenousphase, and the volumetric oxygen mass transfer coefficient in-creased. It was shown that the variation of volumetric oxygenmass transfer coefficient can be related linearly to microbialOUR. This relationship should be site-specific for each instal-lation.e Alpha factors in mixed liquor increased significantly with
increasing treatment. The practice ofmeasuring endogenous al-pha factors for this plant would have resulted in an alpha valuemuch greater than the true alpha in the aeration tank ." Alpha factors in tap water containing surfactant and mixed
liquor decreased with increasing air flow rate ." Alpha factors in mixed liquor decreased with increasing
liquid depth." For this study, the volumetric mass transfer coefficient was
linearly dependent on air flow rate, in contrast with results ofother studies. This difference may be attributed to the height ofthe diffuser above the tank floor.
ACKNOWLEDGMENTS
Credits. This study was funded in part by the ASCE oxygentransfer sub-committee and the U.S . Environmental ProtectionAgency .
Authors. At the time of this research, Hyung J. Hwang andMichaelK. Stenstrom were graduate research engineer and pro-fessor, respectively, at the University ofCalifornia, Los Angeles.Correspondence should be addressed to M. K. Stenstrom, Uni-versity of California, Civil Engineering Department, School ofEngineering and Applied Science, 4532-D Boelter Hall, Los An-geles, CA 90024.
REFERENCES
1 . Houck, D. H., and Boon, A. G., "Survey and Evaluation of FineBubble Dome Diffuser Aeration Equipment," EPA-600/S2-81-222,U. S. EPA (Oct. 1981) .
2 . Aberley, R. C., et al., "Air diffusion unit." J. Water Pollut . ControlFed., 46, 895 (1974) .
3 . Bacon, V. W., et al., "Oxygen Transfer Tests Prove Efficiency ofFine Bubble Diffusers." Water Sew. Works, 124, 9, 121 (1977).
4 . Stenstrom, M. K., et al., "Oxygen Transfer Parameter Estimation,"J. Environ. Eng. Div., Proc. Am . Soc. Civ. Engrs., 107, EE2, 379(1983) .
5 . Stenstrom, M. K., and Gilbert, R. G., "Effects of Alpha, Beta, ThetaFactors and Surfactants upon Specification, Design, and Operationof Aeration Systems." Water Res., 15, 6, 643 (1981) .
6. McKeown, J. J., and Okun, D. A., "Effects of Surface Active Agentson Oxygen Bubble Characteristics," J Air Water Pollut., 5, 2, 113,(1960) .
7 . Urza, I. J., and Jackson, M. L., "Pressure Aeration in a 55-ft BubbleColumn," Ind. Eng. Chem ., Process Des. Dev., 14, 2, 106 (1975).
8 . Gilbert, R. G., and Libby, D., "Field Testing for Oxygen Transferand Mixing in Static Mixer Aeration Systems," Proc. 32nd PurdueInd. Waste Conf, Ann Arbor Science, Ann Arbor, Mich., 567 (1977).
9. Stenstrom, M. K., and Hwang, H. J., "The Effect of Surfactants onIndustrial Aeration Systems," Proc. 34th Purdue Ind. Waste Conf,Ann Arbor Science, Ann Arbor, Mich ., 902 (1979) .
10. Rooney, T. C., and Huibregtse, G. L., "Increased oxygen transferefficiency with coarse bubble diffusers," J. Water Pollut. ControlFed., 52, 2315 (1980) .
Journal WPCF, Volume 57, Number 12
11 . Jackson, M. L ., and Shen, C-C ., "Aeration and Mixing in DeepTank Fermentation Systems," J. AIChE, 24, l, 63 (1978).
12. Jackson, M . L., and Hoech, G . W ., "A Comparison ofNine AerationDevices in a 43-Foot Deep Tank," A Report to the Northwest Pulpand Paper Association, Univ. of Idaho, Moscow (1977) .
13 . King, H . R ., "Mechanics of Oxygen Absorption in Spiral Flow Aer-ation Tanks: I . Derivation of Formulas," Sew. Ind. Wastes, 27, 894(1955) .
14 . King, H . R ., "Mechanics ofOxygen Absorption in Spiral Flow Aer-ation Tanks : II . Experimental Work," Sew . Ind. Wastes, 27, 1007(1955) .
15 . Eckenfelder, W . W., "Factors Affecting the Aeration Efficiency ofSewage and Industrial Waste," Sew . Ind. Wastes, 31, 61 (1959) .
16 . Eckenfelder, W . W ., and Barnhart, E . L., "The Effect of OrganicSubstances on the Transfer ofOxygen from Air Bubbles in Water,"J. Am. Ind. Chem . Eng., 7, 631 (1961) .
17 . Khudenko, B. M ., "Postaeration ofWastewater," J. Environ. Eng.Div., Proc. Am. Soc . Civ . Engrs ., 105, EE2, 297 (1979) .
18 . Downing, A . L., et al., "Aeration and Biological Oxidation in theActivated Sludge Process," J. Inst. Sew. Purif,, 66 (1962).
19 . Price, K . S., et al., "Surface Aerator Interactions," J. Environ . Eng.Div. Proc. Am. Soc . Civ . Engrs ., 99, EE3, 283 (1973) .
20 . Von der Emde, W., "Aeration Developments in Europe ." In "Ad-vances in Water Quality Improvement," Gloyna, E . F. and W. W.Eckenfelder (Eds .), Univ . of Texas Press, Austin, 237 (1968) .
21 . Bewtra, J . K ., and Nicholas, W. R., "Oxygenation from diffused airin aeration tanks ." J. Water Pollut. Control Fed., 36, 1195 (1964).
22 . Eckenfelder, W. W., and Barnhart, E. L ., "Designing for OxygenTransfer." Waste Eng., 81, (1963) .
23 . Leary, R . D ., et al., "Full-scale oxygen transfer studies ofseven dif-fusersystems, Part U' J. WaterPollut. ControlFed., 41, 459 (1969) .
24. Davis, R. E ., and Acrivos, A., "The Influence ofSurfactants on theCreeping Motion of Bubbles ." Chem. Eng. Sci., 21, 681 (1966).
25 . Baars, J . K ., "The Effect ofDetergents on Aeration : A PhotographicApproach," J Inst . Sew . Purif, 358 (1955) .
26. Garner, F. H ., and Hammerton, D ., "Circulation Inside Gas Bub-bles ." Chem . Eng. Sci., 3, 1, 1 (1954) .
27 . Holroyd, A., and Parker, H . B ., "Investigation on the Dynamics ofAeration." J Inst. Sew. Purif, 280 (1952).
28 . Carver, C . E ., "Absorption ofOxygen in Bubble Aeration ." In "Bio-logical Treatment of Sewage and Industrial Wastes, Vol . I AerobicOxidation," McCabe, B . J . and W. W . Eckenfelder, Jr. (Eds .), Rein-hold, New York, N . Y., 149 (1956).
29 . Carver, C . E ., "Oxygen Transfer from Falling Water Droplets," J.Sanit . Eng. Div., Proc . Am . Soc. Civ . Engrs ., 95, SA2, 239 (1969) .
December 1985
Process Research
30 . Poon, C. P . C ., and Campbell, H ., "Diffused Aeration in PollutedWater," Water Sew. Works, 114, 461 (1967).
31 . Baker, D . R., et al., "Oxygen Transfer at High Solids Concentrations,"J. Environ . Eng. Div., Proc. Am . Soc. Civ . Engrs., 101, EE5, 759(1975) .
32 . Downing, A . L., et al ., "The Performance ofMechanical Aerators,"J. Inst. Sew. Purif, 231 (1960) .
33 . Lister, A. R ., and Boon, A . G ., "Aeration in Deep Tanks: An Eval-uation of a Fine-Bubble Diffused-Air System," J. Inst. Sew. Purif,3(1973).
34 . Casey, T . J ., and Karmo, O. T ., "The Influence ofSuspended Solidson Oxygen Transfer in Aeration Systems," WaterRes ., 8, 805 (1974) .
35 . Wheatland, A. B ., and Boon, A . G ., "Aeration and Oxygenation inSewage Treatment-Some Recent Developments," Prog. Wat .Technol., 11, 171 (1979).
36 . Redmon, D., and Boyle, W. C ., "Preliminary Findings, Offgas Anal-ysis," Paper presented at ASCE Oxygen Transfer Standard Com-mittee Meeting (Oct . 6, 1981) .
37 . Baillod, C. R ., and Brown, L. C., "Modeling and Data Interpreta-tion," Development ofStandard Procedures for Evaluating OxygenTransfer Devices, EPA-600/2-83-102, (1983) .
38 . "Measurement ofOxygen Transfer in Clean Water ." Am . Soc . Civ.Eng., New York, N . Y. (1984) .
39 . Hwang, H . J ., "Comprehensive Studies of Oxygen Transfer underNonideal Conditions," Ph.D . Dissertation, Univ. ofCalif., Los An-geles (1984).
40 . International Business Machines, Continuous Systems ModelingProgram III (CSMPIII) Program Reference Manual, Program No .5734-X59, Ontario, IBM (1972).
41 . Yunt, F. W ., and Hancuff T. O., "Aeration Equipment Evaluation-Phase I . Clean Water Test Results," Internal Report, County San-itation District of Los Angeles County, Whittier, Calif. (1982) .
42 . "Standard Method for the Examination ofWater and Wastewater ."15th ed ., Am . Public Health Assoc., Washington, D. C . (1980).
43 . Hwang, H . J ., and Stenstrom, M . K-, "The Effect ofSurface ActiveAgents on Oxygen Transfer," UCLA-Eng-7928, Los Angeles, Calif.(1979).
44 . Rosen, M . J ., "Surfactants and Interfacial Phenomena," John Wiley& Sons, New York, N . Y . (1978) .
45 . Yunt, F . W ., Personal Communication (March, 1983).46 . Mueller, J . A ., et al., "Dual Nonsteady State Evaluating Static Aer-
atorsTreating Pharmaceutical Waste," Proc. 37th Purdue IndustrialWaste Conf, Ann Arbor Science, Ann Arbor, Mich ., 271 (1982) .
115 1