Embed Size (px)
Citation preview

United States Office of Pollution Environmental Protection Prevention and Toxics October 2008 Agency
Final Report An EPA Self Assessment
Evaluation of EPA Efforts to Integrate Pollution Prevention Policy throughout EPA and at Other Federal Agencies
Prepared by the Pollution Prevention Division in EPA’s Office of Pollution Prevention and Toxics for the Multimedia Pollution Prevention (M2P2) Office Directors’ Forum

2
3
Pollution Prevention (P2) Integration
Executive Summary
EPA has undertaken a self-evaluation of its efforts, under the Pollution Prevention Act (P2 Act) of 1990, to integrate pollution prevention policy into its environmental programs, including air, water, toxics and hazardous waste. This evaluation also looked at the Agency’s efforts to promote pollution prevention approaches at other Federal agencies, which is also authorized by the P2 Act. The P2 Act established a national policy that pollution should be prevented or reduced at the source whenever feasible. The P2 Act also directs EPA to consider the effects of its existing and proposed programs on source reduction, and to promote source reduction practices at other federal agencies. In this evaluation we focused on P2 Act provisions that address integrating P2 policy into Federal programs, and we use these provisions to shape our evaluation questions. P2 is the basis for many sustainability efforts, whether or not the term is used. This evaluation makes the connections between pollution prevention integration activities and stewardship and sustainability policy developments. Overall, we found that most Agency program activities and efforts to promote P2 at other federal agencies are in basic conformance with Pollution Prevention Act provisions for P2 integration, although there is clearly room for continual improvement. The key areas that could benefit from additional attention to P2 integration are described below. Major Conclusions 1) EPA’s review of regulations and programs for their effect on source reduction efforts is close to conformity with Pollution Prevention Act provisions, although there is clearly room for continuing improvement.
The Agency tracks how often regulatory workgroups consider the effects of individual rulemakings on source reduction efforts, which is nearly a fourth of the time. This may be closer to half the time when two proposed air program actions affecting a broad class of regulatory standards are taken into account. Better quality data are needed to verify the impediments to more routine consideration of P2 in rules.

4
Although the P2 Act does not mandate that the Agency take a particular approach in considering the effect of regulations on source reduction, the Agency uses its review of regulations to identify opportunities to create compliance approaches based on P2 practices. In the past decade, many of the opportunities for developing P2 compliance approaches have been in the air program, which has a large regulatory agenda. To promote P2 approaches, the air program often relies on standards and actions affecting an entire class of rules, rather than a single rule. P2 practices used as a basis for compliance have included:
• Use of greener materials (such as cleaners, coatings, chlorine dioxide) • Process changes (such as fume suppressants, extended cookouts, chemical
recovery) • Work practices (such as a schedule of activities and prohibited practices), and • Controls with lighter environmental footprints (such as baghouses using less
water and energy than wet scrubbers). Current Agency guidance on analyzing the economic impacts of P2 aspects of rules could be more clear in addressing the potential cost-saving aspects of P2. Since 1996, the Agency has continued to emphasize P2 opportunities in permitting, compliance, and enforcement programs. Most major permitting programs have P2 components, except for the underground injection program. Evaluation data on the air program’s pilot approach to integrating P2 in permits is positive, and the air program has developed two rules to implement the piloted approach on a broad basis. Data gaps for the water and waste permitting programs make it difficult to evaluate the effectiveness of their approaches to fostering P2, although limited data are positive for the water office’s pretreatment program.
EPA Regions use strategic co-location of P2 programs with other programs to leverage P2 resources and promote collaboration. One Region uses cross-program teams and P2 planning and reporting for media offices. Non-regulatory programs also take opportunities to integrate P2 into their operations, such as the Office of Research and Development (which has focused on P2 and sustainability for years), the voluntary components of the new chemicals program, and EPA grant programs. Numerous untapped opportunities exist in a variety of non-regulatory programs for fostering pollution prevention.
2) Current Agency coordination on source reduction activities is in general conformance with the relevant Pollution Prevention Act provisions. However, there is room for greater use of coordinated efforts to forge practical P2 integration solutions. Some examples of coordination include:

5
• The Innovations Action Council coordinates environmental stewardship partnership programs across the Agency, many of which address source reduction activities. The IAC produced Everyday Choices, a report for the Administrator earlier this year on environmental stewardship, which cites P2 as an integral part of environmental stewardship and sustainability approaches.
• The Office Directors’ Multimedia and Pollution Prevention Forum coordinates source reduction activities relating to regulations and other programs. The M2P2 Forum has facilitated several multi-office P2 solutions (e.g., mercury switches, unleaded racing fuel), and greater use of the Forum’s problem-solving capacities would be a real plus.
• The Environmental Assistance Network (EAN) coordinates source reduction activities of Agency technical assistance programs. An issue that the EAN could address is some staff’s perception that compliance technical assistance programs could be better coordinated with P2 program technical assistance programs.
• The Office of Research and Development coordinates research activities on source reduction approaches.
To promote source reduction practices in other federal agencies, EPA offices coordinate with each other, and with the Federal Environmental Executive, and with other lead federal departments to assist federal agencies generally in adopting source reduction practices in their operations. Many of these working relationships are structured by Federal Executive Orders 13148 (Greening the Government) and 13423 (Strengthening Federal Environmental Management), and focus on achieving the goals of these directives.
3) Current Agency practices for collecting data under federal environmental statutes help measure the impact of source reduction practices on a national scale, but more can be done to address data gaps and coordinate data collection. Further investigation would be needed to assess Agency performance relating to the P2 Act provision directing the Agency to improve methods of coordinating, streamlining, and ensuring public access to data collected under federal environmental statutes.
Toxic Release Inventory (TRI) waste generation trends show national waste generation rising more slowly than economic growth and population, suggesting that P2 measures have contained the growth in volume of annual total production wastes over time. TRI source reduction data count activities, not quantities of pollution reduced, yet are still informative on trends in use of P2 approaches among states and sectors. Municipal solid waste data show a steadily rising volume in waste generated over four decades; however, recent data suggest that source reduction may finally be making its presence felt. Greenhouse gas (GHG) emissions and energy trends show GHG emissions rising slower than economic growth, and the industrial sector achieving an absolute

6
reduction in GHG emissions. GHG emission reductions achieved from direct Agency interventions are easily correlated to national GHG emission data. EPA national pesticide market surveys from 1982-2001 show a drop then leveling off in quantity used, but may reflect a shift to lower-volume substitutes. Although EPA stopped collecting market data in 2001, California data since then show a trend towards higher quantity use of what may be lower-risk pesticides. USDA fertilizer data show fertilizer use leveling off in the past decade. Some gaps in media-program data exist for wastes generated. The gaps are sometimes due to the delegated nature of the media program and sometimes due to methodological changes that make trends difficult to track. Data gaps also exist for trends in the relative risk of releases.
4) Agency goal setting is partially in accord with the P2 Act provision that directs EPA to identify, where appropriate, measurable goals reflecting P2 policy. The Agency has measurable goals for direct P2 activity, including various partnership activities across the Agency. Yet it would also seem appropriate to have measurable goals for P2 integration activities so EPA can track the total impact of P2 policy within the Agency. In earlier days, the Agency had some P2 integration goals in its published Pollution Prevention Strategy and in Strategic Plans. Now, P2 is discussed as a voluntary-only activity in Strategic Plans. Even though some partnership programs essentially set P2 goals, there is no widely accepted Agency methodology for setting up and tracking P2 goals across programs. Region 4 is an exception, where media programs have been setting P2 goals for a number of years.
The Agency’s high-level planning documents show a trend away from emphasizing or even acknowledging P2 integration activities. The Agency has measurable environmental outcome goals for direct P2 activities, but very few measurable goals related to P2 integration activities. The only measurable goals related to P2 integration activities are in Region 4 (where media programs have been setting P2 targets for years), and in some Federal partnerships in which OSW and OPPT directly intervene. This leaves nearly all programs without P2 goals and targets.
5) The Agency has established standard methods of measuring pollution prevention, which is in conformance with the Pollution Prevention Act.
The Agency’s standard methods for measuring P2 consist of environmental outcome measures and some behavioral change measures tailored to individual project needs. The Agency developed its methodology in consultation with States, so there is basic consistency between Agency and state measurement methodology. The Agency has used its methodology for several years, and reviews it for continuous improvement. The Agency uses this methodology mostly for measuring results of direct P2 activities, although Region 4 and the Federal Electronics Challenge use this same methodology to measure P2 integration activities. The Agency will need to examine
7
which methodologies to employ for measuring its P2 integration results on a broader basis.
Recommendations 1. We recommend that the Agency take short-term actions in several areas to improve the implementation of pollution prevention policy.
Update key Agency policy documents to renew the Agency commitment to integrating pollution prevention across the Agency.
− Update the Agency P2 policy to reaffirm P2 as an Agency priority and to
articulate its relationship to sustainability, environmental stewardship, and chemical security.
− Strengthen the role of P2 integration in the Agency semi-annual Regulatory Agenda, annual Performance Accountability Reports, and annual National Program Manager Guidance for various programs.
Reaffirm existing procedures for prompting regulatory workgroups to consider source reduction during regulatory development and for the way the Agency tracks the P2 aspects of regulatory development. This includes use of a manager’s charge to address source reduction options, workgroup consideration of source reduction in the analytic blueprint for each regulatory development action, and identification of P2 steps in the RAPIDS database, EPA’s regulatory tracking system.
2. Review the Agency’s information collection practices pertaining to P2, with the aim of improving overall ease of data collection, coordination between information systems, and availability of information once collected.
(a) Examine options for removing some constraints on Agency use of surveys to enhance the implementation of pollution prevention policy. (b) Conduct a thorough overview of information collection efforts pertaining to waste generation and pollution prevention to identify options for increasing our understanding or P2 progress. Consider: (i) Why do we have national waste generation trend data for some programs and not for others? (ii) How can EPA create scalability between national data and EPA program data? (iii) Should TRI-style data collection be expanded beyond the industrial sector to provide a fuller picture of chemical releases and reductions?

8
(3) Address the need for meaningful P2 guidance in the Agency’s Economic Impact Analysis Guidance.
It would be helpful to the implementation of pollution prevention policy if economic impact analysis guidance more fully addressed P2 options, and were structured to allow the economic benefits of P2 to be fully accounted for.
(4) We recommend that the Agency begin in the short term two processes for more thoroughly improving the implementation of pollution prevention policy:
(a) Begin an inclusive headquarters and regional Agency process to choose methodologies for measuring P2 integration activities, using tools such as internal behavior change measures, office scorecards, and laying groundwork for tracking P2 results in media programs.
(b) Begin a multi-office consultative process on the development of the Agency 2009-2014 Strategic Plan for the purpose of strengthening the role of P2 integration, and the harmonization of P2 policy with stewardship, sustainability, and chemical site security policies in the 2009 Plan and its strategic goals.
(5) We recommend that the Agency also begin longer-term processes to address more far-reaching positive improvements in the implementation of pollution prevention policy. We recommend taking action on two or more of the following issues.
(a) Explore whether there is a transferability of the air program’s regulatory approaches – that remove at least one regulatory barrier to P2 for a broad class of standards at a time – to the water or waste programs.
(b) Explore options for measuring environmental outcome results from P2 integration efforts Agency-wide. It would be helpful for establishing the relevance of the P2 policy tool if a fuller set of P2 outcome results were available annually to inform Agency planners, to provide important results feedback to state and tribal co-regulators, and to provide a broader basis for assessing the effectiveness of this legislative policy tool unequaled for its attempt to create policy cohesion across Agency programs.
(c) Explore ways to assess the effectiveness of NPDES (National Pollution Discharge Elimination System) Inspection Manual guidance on conducting on-site P2 assessments, and of P2 options in “waste” programs.
(d) Explore whether there are ways to assess the effectiveness of NPDES permitting provision on best management practices for P2 and the effectiveness of the Pretreatment Program in fostering P2 approaches.

9
Chapter 1 Introduction
Why is EPA doing this self-evaluation? − The National Pollution Prevention and Toxics Advisory Committee1 asked the
Agency to re-evaluate its P2 integration efforts. − For the Agency, it is also a matter of good program management. It has been nearly
12 years since our last self-assessment of Agency P2 integration activities, and that assessment covered only a subset of the total activities, albeit a very important subset. It has been nearly seven years since the U.S. Government Accounting Office reported on EPA P2 integration efforts.
− A self-evaluation gives us a needed Agency-wide view of our subject, which is an unusually broad undertaking of policy integration.
What are we evaluating? (scope) − We are evaluating EPA pollution prevention integration activities conducted
internally and with other federal agencies. For this evaluation, we are defining P2 integration activities as efforts to integrate national P2 policy into the implementation of Federal programs and operations authorized under other statutes. The scope of EPA activities affected is not contained within a program, or even several programs, but spans the Agency.
− The authority for these P2 integration efforts is the Pollution Prevention Act, which directs EPA to consider the effects of its existing and proposed programs on source reduction, to promote source reduction practices at other federal agencies, and conduct several other related functions. Our evaluation questions on page 10 and our discussion on pages 12 and 13 provide links to the specific P2 Act provisions that guide our evaluation.
− We are limiting the focus of the evaluation to P2 integration activities as we have defined them to help us reach one of our desired endpoints, which is to examine options for measuring the progress and the effectiveness of these activities. The issues associated with this inquiry are already complex. It will help us in this inquiry if the scope of activities under consideration is sufficiently well defined.
− Activities that we are not evaluating on their own merits fall into two groups. • The first are the direct P2 activities that EPA conducts under just the authority of
the P2 Act, without relying on the authority of another governing statute. These are the activities that foster the adoption of P2 techniques by businesses (through grants, outreach, and technical assistance), distribute P2 information nationally, and give P2 awards. We do evaluate, however, the aspects of direct P2 activities
1 The Office of Pollution Prevention and Toxics obtained a charter for the National Pollution Prevention and Toxics Advisory Committee as a Federal Advisory Committee in 2002. The NPPTAC consulted with and advised OPPT on its pollution prevention and toxics programs from 2003 – 2005.

10
that contribute to EPA P2 integration efforts, or that have aspects of both direct P2 and P2 integration.
• The second are the broad class of activities done in the name of national P2 policy that are undertaken by others with no EPA intervention involved.
What methodology are we using? − We have used a year-long consultation process involving a broad spectrum of EPA
headquarters and regional offices to discuss how they have integrated P2 into their programs and operations, and to solicit their views on the current state of P2 integration. This cross-office group provided many data sources in the form of document links and interviews, and helped draft and review the document, which was aimed at capturing the current state of P2 integration.
− The P2 Program facilitated the cross-office consultation group. After it received comments on the initial draft document, the P2 Program decided to employ program evaluation principles to develop evaluation questions, analyze data sources, and link data sources to responses. The program also provided final editing of the evaluation.
− We analyze our data sources for their utility, their limitations, and their biases, and provide our conclusions on these factors. For transparency, we also describe how we used the data sources to answer evaluation questions. Since we have so many data sources, we briefly summarize this analysis and description in Chapter 2, and provide the full version in tables in Appendices A and B.
− To maintain readability, we summarize our evaluation results in Chapter 3, and provide recommendations in Chapter 4.
What are the evaluation questions? The consultation group focused on the Agency’s current state of P2 integration, so this served as the basis for the evaluation. The evaluation examines the Agency’s current state of P2 integration, whether it aligns well with the P2 integration functions laid out for EPA in the Pollution Prevention Act and, if applicable, whether the current state of P2 integration is consistent with the recommended state described in previous Federal assessments. For a few questions, the scope is a little narrower than the corresponding provision from the P2 Act due to the scope of the consultative process. EVALUATION QUESTIONS 1) How does the Agency currently consider the effect of its programs and regulations on
source reduction efforts?
(a) Does current Agency review of regulations and programs for their effect on source reduction efforts conform with the Pollution Prevention Act provision, “Ensure that the Agency considers the effect of its existing and proposed programs on source reduction efforts and reviews regulations of the Agency prior and subsequent to their proposal to determine their effect on source reduction”? (b) Is current Agency review of regulations for their effect on source reduction efforts consistent with prior federal recommendations in this area?

11
2) What is the current state of internal Agency coordination on source reduction activities? What is the current state of Agency coordination with appropriate offices to promote source reduction practices in other Federal agencies?
(a) Does this current state of Agency coordination on source reduction activities conform with the Pollution Prevention Act provision, “Coordinate source reduction activities in each Agency Office and coordinate with appropriate offices to promote source reduction practices in other Federal agencies, and generic research and development on techniques and processes which have broad applicability”?
3) What is the current status of data collected under Federal environmental statutes and
related sources, and what does current analysis of these data reveal about the impacts of pollution prevention?
(a) Does this evaluation provide the right information for determining whether the Agency’s current activities conform with the Pollution Prevention Act provision, “Develop improved methods of coordinating, streamlining, and assuring public access to data collected under Federal environmental statutes?
4) What is the current status of the Agency’s measurable goals for pollution prevention,
especially pertaining to P2 integration?
(a) Does the current state of Agency goal-setting conform with the PPA provision, “Identify, where appropriate, measurable goals which reflect the policy of this chapter, the tasks necessary to achieve the goals, dates at which the principal tasks are to be accomplished, required resources, organizational responsibilities, and the means by which progress in meeting the goals will be measured”?
5) What is the Agency’s current methodology for measuring P2, especially with respect to P2 integration?
(a) Do Agency methods for measuring P2 conform with the Pollution Prevention Act provision, “Establish standard methods of measurement for source reduction”?
What is the relevance of the evaluation? − P2 remains relevant as an approach to achieving environmental stewardship and
sustainability – P2 is the basis for many sustainability efforts, whether or not the term is used. This evaluation makes the connections between pollution prevention integration activities and stewardship and sustainability policy developments.
− There is a growing demand for assessing the results of government. This evaluation takes a comparative look at Agency-wide P2 performance results and national P2 results, and at national P2 results and total national environmental results.

12
− There is also growing demand for evaluating government programs. This evaluation examines an unusually broad effort at policy integration across an entire agency. This policy integration effort is not contained within a program, or even several agency programs. Earlier assessments of this policy integration effort occurred years ago and were narrower in scope. This evaluation addresses recommendations from these earlier assessments.
Background on the P2 Act and EPA P2 integration activities The Pollution Prevention Act of 1990 establishes a national policy of the United States – that preventing pollution at the source is the option of first choice for protecting the environment.
The Act equates P2 with source reduction, which it defines as, “any practice which reduces the amount of any hazardous substance, pollutant, or contaminant entering any waste stream or otherwise released into the environment (including fugitive emissions) prior to recycling, treatment, or disposal, and reduces the hazards to human health and the environment associated with the release.”2 In 1992, EPA issued a formal definition of P2 which clarified that “in-process” recycling may qualify as P2, that P2 approaches can be applied to all pollution-generating activities, including those found in the energy, agricultural, Federal, consumer, and industrial sectors, and that energy and water efficiency and conservation practices which reduce the creation of pollutants conform to the P2 Act’s definition of source reduction.3 Subsequently, Executive Orders likewise defined energy and water efficiency/conservation as within the definition of source reduction and pollution prevention. The P2 Act directs EPA to develop and implement a strategy to translate this policy mandate (making P2 first among waste management practices) into action. This is a considerable challenge, for while the Act creates a small grant authority, it creates no new regulatory authority except added TRI reporting, offers no provisions to bring EPA’s other governing statutes into conformance with this new policy (with the exception of the TRI reporting), and offers little authority for Congressional appropriation of funds towards implementing this policy. A lot depends on EPA’s ability to improve this situation by its own efforts. This is a demanding task, because prevention is not something that can simply be added on to 2 42 U.S. Code Chapter 133, Section 13102 (5). 3 P2 Policy Statement. http://www.epa.gov/p2/pubs/p2policy/policy.htm
Pollution Prevention Act of 1990 …The Congress hereby declares it to be the national policy of the United States that pollution should be prevented or reduced at the source whenever feasible; pollution that cannot be prevented should be recycled in an environmentally safe manner, whenever feasible; pollution that cannot be prevented or recycled should be treated in an environmentally safe manner whenever feasible; and disposal or other release into the environment should be employed only as a last resort and should be conducted in an environmentally safe manner.

13
existing practices and systems. It involves identifying the root causes of pollution and figuring out ways to minimize its creation, often by using materials and energy more efficiently, and by creating environmentally preferable materials, alternative processes, and considering alternate sources of energy. It also involves using governing statutes to grapple with the synergistic effects of complex environmental problems that are frequently not accounted for by these statutes. It means executing Agency operations in ways that don’t reinforce piecemeal approaches. It involves finding ways to motivate businesses/industries, government programs, and the public at large to change behaviors and adopt these alternative approaches, which can be particularly challenging under prescriptive statutes. One-size-fits-all approaches are not that common in P2. The P2 Act delineates functions for EPA that are more or less of two types. One type are things the Agency can do directly under P2 Act authority, and the other type requires internal Agency coordination to influence the execution of other statutory authorities. Some activities are gray areas, such as direct P2 activities that a program uses to meet its non-P2 Act goals, or using federal procurement opportunities, and some simply apply to both direct and P2 integration activities, like measurement and goal setting. But overall, functions can mostly be classified as one type or the other. We consider the direct P2 functions under the Act to be mostly the following:
− Facilitate the adoption of source reduction techniques by businesses. This strategy shall include the use of the Source Reduction Clearinghouse and State matching grants provided in this chapter to foster the exchange of information regarding source reduction techniques, the dissemination of such information to businesses, and the provision of technical assistance to businesses. The strategy shall also consider the capabilities of various businesses to make use of source reduction techniques;
− Establish an annual award program to recognize a company or companies which operate outstanding or innovative source reduction programs;
− Establish a training program on source reduction opportunities, including workshops and guidance documents, for State and Federal permit issuance, enforcement, and inspection officials working within all agency program offices; and
− Identify opportunities to use Federal procurement to encourage source reduction. We consider these functions to apply to both direct and integration functions:
− Establish standard methods of measurement of source reduction; and, − Identify, where appropriate, measurable goals which reflect the policy of this chapter, the
tasks necessary to achieve the goals, dates at which the principal tasks are to be accomplished, required resources, organizational responsibilities, and the means by which progress in meeting the goals will be measured.
We consider the P2 integration-only functions under the Act to be primarily these:
− Ensure that the Agency considers the effect of its existing and proposed programs on source reduction efforts and [reviews] regulations of the Agency prior and subsequent to their proposal to determine their effect on source reduction;
− Coordinate source reduction activities in each Agency Office and coordinate with appropriate offices to promote source reduction practices in other Federal agencies, and

14
generic research and development on techniques and processes which have broad applicability;
− Develop improved methods of coordinating, streamlining and assuring public access to data collected under Federal environmental statutes.
Short history of P2 integration work at EPA In 1991, pursuant to the P2 Act, EPA established an independent P2 office, wrote an agency-wide P2 Strategy (56 Fed. Reg. 7849 February 1991), and began training personnel on developing P2 guidance for State and Federal permitting and enforcement officials. To further implement the Act, the Administrator directed the P2, media, and research programs to promote P2 through the development and implementation of specific air, water, and hazardous waste rules. Rule development teams were to consider P2 at every stage of the process, and to consider P2 options equally with control options. Mirroring the language of the Act, this collaborative effort was called the Source Reduction Review Project (SRRP). In 1992, the Deputy Administrator issued a clarifying P2 definition memo. In 1993 the Administrator issued a P2 Policy Statement.4 The media, P2, and research programs briefed the Administrator routinely on SRRP progress. In1994, EPA began assessing its integration of P2 into rules, using multi-office consultation and internal media program studies of incentives and barriers to P2 integration.5 In SRRP, P2 was considered at every step of rule development – from initial tiering, charge to the workgroup, budget allocations to some degree, information collection, economic impact analysis, options analysis, to the development of proposed rules – and for the rules furthest along – final rules and implementation guidance and workshops. Appendix C provides a chart of all regulatory development stages where P2 can be considered. In its SRRP findings, EPA found positive lessons as noted in the text box Positive outcomes such as integrated air and water pulp and paper rules were resulting from strong in-the-trench efforts. Yet EPA also found obstacles, as noted in a text box below, and the challenge of implementing a sweeping statutory policy directive without correlative mandates was becoming apparent. The Agency created an Office Directors’ Pollution Prevention Forum to consider the SRRP recommendations. They selected another round of rulemakings for special P2 attention in early 1997. Programs were increasingly self-reliant in creating P2 options in rules, especially where the source category had relatively uniform, proven P2 options that it could switch to (such as switching from volatile
4 http://www.epa.gov/p2/pubs/laws.htm. 5 At the time, these studies included the Compendium of Pollution Prevention Barriers and Incentives (1993), and Industrial Pollution Prevention – Incentives and Disincentives (1994).
Positive SRRP lessons from promoting P2 through air, water, and waste regulations: (1) Focus on multimedia data collection and analysis of regulatory options; (2) Write the standard to be flexible; (3) Test new territory with stakeholders; (4) Coordinate agenda-setting; (5) Use preambles and development documents to explain P2 multimedia approaches; (6) Use statute-specific approaches developed
in SRRP; and (7) Use program-tailored P2 training. 1996 SRRP Assessment
15
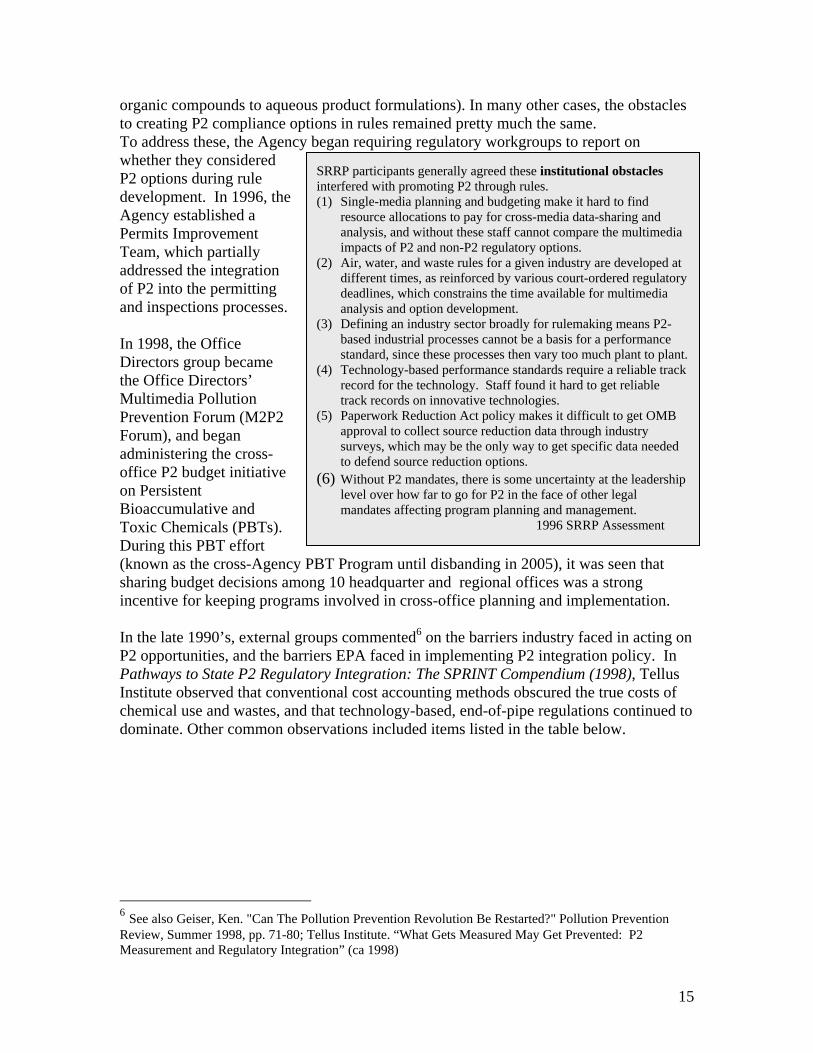
organic compounds to aqueous product formulations). In many other cases, the obstacles to creating P2 compliance options in rules remained pretty much the same. To address these, the Agency began requiring regulatory workgroups to report on whether they considered P2 options during rule development. In 1996, the Agency established a Permits Improvement Team, which partially addressed the integration of P2 into the permitting and inspections processes. In 1998, the Office Directors group became the Office Directors’ Multimedia Pollution Prevention Forum (M2P2 Forum), and began administering the cross-office P2 budget initiative on Persistent Bioaccumulative and Toxic Chemicals (PBTs). During this PBT effort (known as the cross-Agency PBT Program until disbanding in 2005), it was seen that sharing budget decisions among 10 headquarter and regional offices was a strong incentive for keeping programs involved in cross-office planning and implementation. In the late 1990’s, external groups commented6 on the barriers industry faced in acting on P2 opportunities, and the barriers EPA faced in implementing P2 integration policy. In Pathways to State P2 Regulatory Integration: The SPRINT Compendium (1998), Tellus Institute observed that conventional cost accounting methods obscured the true costs of chemical use and wastes, and that technology-based, end-of-pipe regulations continued to dominate. Other common observations included items listed in the table below.
6 See also Geiser, Ken. "Can The Pollution Prevention Revolution Be Restarted?" Pollution Prevention Review, Summer 1998, pp. 71-80; Tellus Institute. “What Gets Measured May Get Prevented: P2 Measurement and Regulatory Integration” (ca 1998)
SRRP participants generally agreed these institutional obstacles interfered with promoting P2 through rules. (1) Single-media planning and budgeting make it hard to find
resource allocations to pay for cross-media data-sharing and analysis, and without these staff cannot compare the multimedia impacts of P2 and non-P2 regulatory options.
(2) Air, water, and waste rules for a given industry are developed at different times, as reinforced by various court-ordered regulatory deadlines, which constrains the time available for multimedia analysis and option development.
(3) Defining an industry sector broadly for rulemaking means P2-based industrial processes cannot be a basis for a performance standard, since these processes then vary too much plant to plant.
(4) Technology-based performance standards require a reliable track record for the technology. Staff found it hard to get reliable track records on innovative technologies.
(5) Paperwork Reduction Act policy makes it difficult to get OMB approval to collect source reduction data through industry surveys, which may be the only way to get specific data needed to defend source reduction options.
(6) Without P2 mandates, there is some uncertainty at the leadership level over how far to go for P2 in the face of other legal mandates affecting program planning and management.
1996 SRRP Assessment

16
Common external observations Authority: There is little in the way of P2 mandates under statutes that address P2 – the P2 Act, the Clean Air Act, and RCRA. Organization: The division of the Agency into single media offices has made it very difficult to adopt the multimedia framework to problem solving that is called for by a P2 approach. Resources: P2 integration activity has remained a fairly small-scale activity at EPA, in terms of budget and staffing. Information: There is a lack of measurement and assessment information by which to gauge what does or doesn’t work well in the P2 arena. Goals and Accountability: There are few targets for P2. P2 is not a measure by which most staff performance is gauged, nor it a measure for program progress. As such, neither EPA staff nor programs are held accountable for P2, which is thereby easily ignored. Leadership: As P2 has filtered through EPA, it is no longer the purview of innovators and leaders, and has thereby lost considerable momentum. This is exacerbated by turnover, unwillingness to take risks or reward risk-takers, and the sheer inertia of the status quo.
In 2001, the U.S. Government Accounting Office published a report on barriers to industry adopting P2 techniques, “EPA Should Strengthen Its Efforts to Measure and Encourage Pollution Prevention.” It found one factor influencing company decisions on P2 to be within the purview of government policy, namely regulatory design. GAO evaluated Agency performance based on the SRRP Assessment and staff interviews in light of the P2 Act’s directive for EPA to review rules before and after proposal for their effect on source reduction. It encouraged the agency to keep better track of whether it was considering the effect on source reduction in all appropriate rulemakings. It is unclear whether GAO knew that EPA entered this information into a tracking database at that time. GAO also encouraged EPA to amend TRI Section 8 for more consistent reporting and new reporting on quantities of emissions reduced. P2 Integration Progress Through it all, offices have taken numerous opportunities to work around some of the institutional obstacles to integrating multimedia pollution prevention into programs, when they couldn’t be addressed head on. Chapter 3 will examine the current state of P2 integration progress in detail.
17
Chapter 2 Data Sources and Evidence for Conclusions This very brief chapter outlines the methodology we are using to characterize the data sources used in this evaluation, and to relate these data sources to the evaluation questions and the report’s conclusions. We have applied this methodology to each of the nearly 100 data sources used in this evaluation, and are providing the details of the applied methodology in Appendices A and B, so as to maintain the readability and flow of the main document. The purpose of characterizing the data sources and relating them to our conclusions is to provide some measure of transparency and quality assurance for readers of our self-evaluation. Appendix A is in table form, and summarizes some key characteristics of the data. The characteristics we focus on for each data source are: • Time frame – when the data were collected; • Number of data points – the number of usable observations in the data. • Biases – any actual or potential biases that will affect the data. • Utility – how the data source can be used in this evaluation; and, • Limitations – any lack of certainty about the completeness or reliability in the data. Appendix B is also in table form, and summarizes how the data sources can be used to answer the evaluation questions. We use one table for each of our conclusions, to list the data sources relevant to the conclusion and identify the elements within the data source that provide evidence in support of the conclusion.

18
Chapter 3 Evaluation Results This chapter of the report summarizes the results for each of the five evaluation questions and their sub-questions. Each main question discusses the current state of an aspect of P2 integration that has a corresponding provision in the Pollution Prevention Act. For each main question, there is a sub-question that directly addresses the relationship between current state as evaluated and the relevant statutory provision. We answer each question with a summary statement followed by a series of conclusions, and take the questions in order. As we begin the evaluation summary, we note as a general reminder that the Agency does not have the means to address every constraint on P2 that flows from its governing statutes. Individual statutes can constrain regulatory design and timing, and collectively they dominate the structure and operations of the Agency. Evaluation Question 1. How does the Agency currently consider the effect of its programs and regulations on source reduction efforts? In comparison to the 1990’s, the current state of P2 integration in Agency regulations and programs is generally one of lower profile but expanding dimensions. There is a variety of P2 integration activity underway, and some offices are using previously untried tools and collaborations to achieve P2 integration. At the same time, there have been no recent high-level Agency endorsements for integrating P2 into regulatory and other non-voluntary programs, and no repeat of the integrated multimedia rulemaking the Agency once accomplished for the pulp and paper industry. Collectively, current P2 integration efforts appear to be expanding their reach, although this evaluation does not attempt to quantify that impression. There is noticeable variability in the extent to which various programs employ the range of P2 integration approaches in use. There is room for continually greater utilization of the full range of these approaches across EPA programs. In this evaluation, we begin with our analysis of available data to characterize Agency compliance with the Pollution Prevention Act’s regulatory review function (noted in the box above), which was the focus of GAO recommendations in 2001. We will then evaluate the fuller range of Agency programs with respect to this statutory provision, making observations about prior Agency recommendations as well as current trends. Conclusion (1) The Agency tracks how often regulatory workgroups consider the effects of individual rulemakings on source reduction efforts, which is nearly a fourth of the time. This may be closer to half the time when two proposed air program actions affecting a broad class of regulatory standards are taken into account. Better quality data are needed to verify what impedes more routine consideration of P2 in rules, to confirm or revise the internal obstacles to promoting P2 through regulations that the Agency identified in 1996.
“Ensure that the Agency considers the effect of its existing and proposed programs on source reduction efforts and review regulations of the Agency prior and subsequent to their proposal to determine their effect on source reduction.” PPA, Section 13103.

19
Regulatory workgroups since 1993 have been using an analytic blueprint process for mapping the stages of regulatory development. In one section they discuss the potential P2 options to be considered (performance-based, technology-based or other), or explain why these are not applicable. Since 1996, the Agency has been using the RAPIDS database to store continuous records of significant rule development decisions by workgroups, including their consideration of P2 during regulatory development. RAPIDS stands for the Rule and Policy Information and Development System. Through RAPIDS, the Agency collects simple Yes/No/N/A responses to the question, “Will source reduction or pollution prevention options be considered in the development of this action?” To illustrate the range of rules that consider P2 options, here are the 12 “yes” rules out of the total 87 rules for 2005. o National Volatile Organic Compound Emission Standards for Aerosol Coatings o NESHAP for Area Sources: Paint Stripping and Misc. Surface Coating Operations o New Source Performance Standards: Equipment Leaks o NESHAP: Acrylic/Modacrylic Fibers, Chemical Manufacturing, Chromium Compounds, Flexible
Foam Fabrication and Foam Production, Carbon Black Production, Lead Acid Battery Manufacturing, Wood Preserving
o Petroleum Refineries - New Source Performance Standards o NESHAP for Area Sources: Polyvinyl Chloride/Copolymers Production, Primary and Secondary
Copper Smelting, Primary Nonferrous Metals o Significant New Use Rule for Mercury Switches in Motor Vehicles o Oil P2; Amendments to Spill Prevention, Control, and Countermeasure Requirements o Criteria for Safe and Environmentally Protective Use of Granular Mine Tailings o 2006 Effluent Guidelines Program Plan o Effluent Limitations Guidelines/Standards for Chlorine/Chlorinated Hydrocarbon Mfg. Process In our data analysis, we considered two data sources – the RAPIDS data from 1996 to 2006, and actions that apply to a broad class of industry standards. The RAPIDS database has quantifiable data with some limitations. We have only begun to estimate the impact on individual standards from actions affecting a class of standards. Our initial analysis of RAPIDS data indicate that the Agency considers the effect of applicable rules on source reduction about 22 % of the time. This is based on taking the data points at face value, accepting workgroup descriptions that source reduction was not applicable to the development of a rule, and eliminating those data points from the total pool of data points. The limitations of this conclusion are that Not Applicable answers do not document their reasons, 34% of the remaining data points were blanks, and the Yes and No data points were not transparent enough to understand the reasons why source reduction could or could not be considered. A greater transparency in these data would allow the Agency to update its understanding of obstacles workgroup face in considering P2 in rulemaking. The Agency’s existing list of obstacles is given in the text box on page 15 of this document, which summarizes Agency findings from its 1996 assessment of P2 in regulations. Our initial analysis of proposed rules applying to a broad class of industry standards began with two data points – a 2007 proposed flexible air permitting rule, and 2003 proposed amendments to the general provisions for national emission standards for
20
hazardous air pollutants (NESHAP). Both of these propose to allow the kind of flexibility that promotes source reduction approaches and eliminates a prescriptive regulatory obstacle to source reduction. But upon considering the additional 2007 proposed amendment to the general provisions for NESHAP, we conclude that it changes the mix of incentives being proposed, and we are no longer sure that the specific source reduction incentive in the 2003 proposal will still have meaning, and are unclear whether incentives counter to source reduction may have unintentionally been created. Thus, we will discount the proposed amendments to the general provisions for the NESHAP, and consider only the 2007 proposed flexible air permitting rule. For this latter proposed rule, we note that it would apply to facilities covered by many individual air emission standards. Further evaluation will be required to assess and quantify the degree to which it will help make these individual standards more conducive to source reduction. A summary of our quantitative analysis of RAPIDS data appears below. From 1996 through August 2006, there were 492 rules in the RAPIDS database, of which 297 were air rules. Appendix C provides the annual results in aggregate and by office, showing yes, no, NA, blank, and total. − Raw aggregate responses to the source reduction question, in rounded percentages.
• 15 % Yes. • 31 % Not Applicable. • 24 % blank. • 30 % No.
− Our review of EPA’s regulatory agendas suggest that the 31 % checked Not
Applicable may be reasonable, given the number of rule subjects that are of a technical or procedural nature that do not set standards for industry (a sample range of these rules is provided in Appendix C). We computed adjusted aggregate responses for the 340 rules remaining (with Not Applicable answers subtracted), shown in rounded percentages. • 22 % Yes. • 44 % No • 34 % blank
− Blank answers account for 24 % of total data entries. Adjusting for blanks would
require more research. Blanks could represent confusion between Not Applicable and No, or represent a bias towards No (lower motivation to answer when not a yes). It would be easier to understand the reasoning of the workgroups if reasons were associated with their answers, and if they increased their overall response rate.
− “No” answers account for 40% of total data entries, and 44% of adjusted responses.
“No” in its present form is not transparent as to the reason No was selected. It would be much more informative if the multiple answers the workgroup chooses from included several No’s, with a different reason provided for each No, and an extra No available for a fill-in-the-blank reason.
21
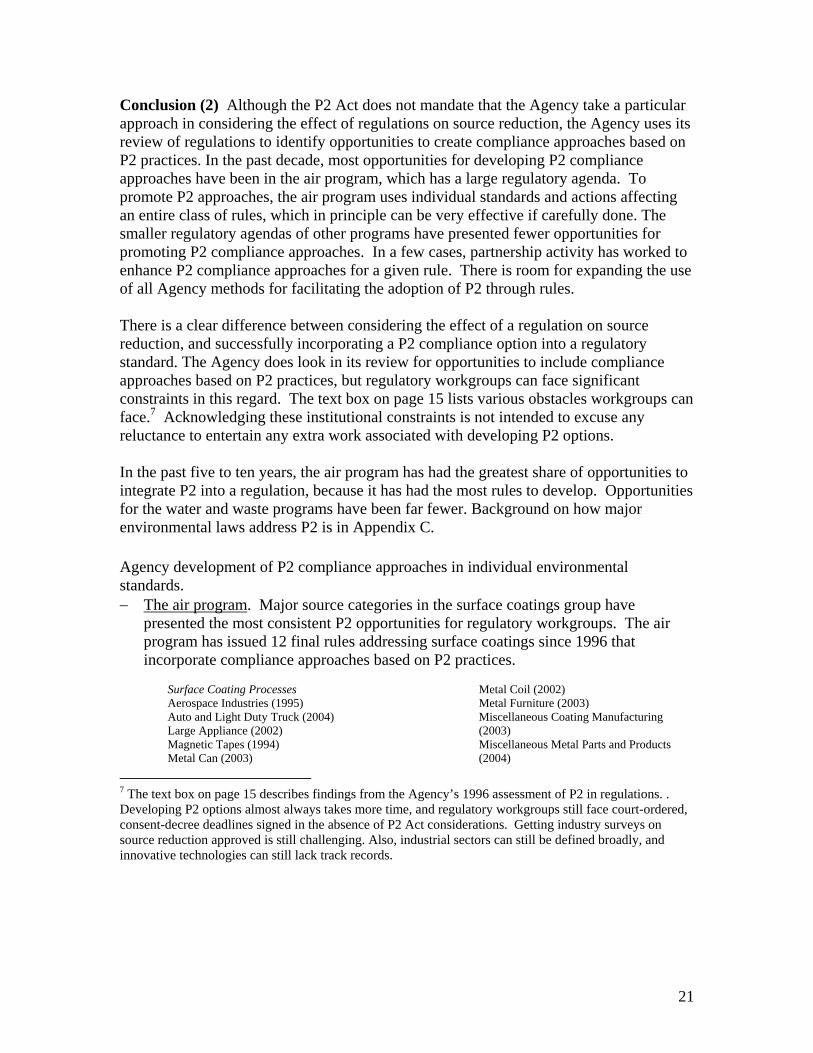
Conclusion (2) Although the P2 Act does not mandate that the Agency take a particular approach in considering the effect of regulations on source reduction, the Agency uses its review of regulations to identify opportunities to create compliance approaches based on P2 practices. In the past decade, most opportunities for developing P2 compliance approaches have been in the air program, which has a large regulatory agenda. To promote P2 approaches, the air program uses individual standards and actions affecting an entire class of rules, which in principle can be very effective if carefully done. The smaller regulatory agendas of other programs have presented fewer opportunities for promoting P2 compliance approaches. In a few cases, partnership activity has worked to enhance P2 compliance approaches for a given rule. There is room for expanding the use of all Agency methods for facilitating the adoption of P2 through rules. There is a clear difference between considering the effect of a regulation on source reduction, and successfully incorporating a P2 compliance option into a regulatory standard. The Agency does look in its review for opportunities to include compliance approaches based on P2 practices, but regulatory workgroups can face significant constraints in this regard. The text box on page 15 lists various obstacles workgroups can face.7 Acknowledging these institutional constraints is not intended to excuse any reluctance to entertain any extra work associated with developing P2 options. In the past five to ten years, the air program has had the greatest share of opportunities to integrate P2 into a regulation, because it has had the most rules to develop. Opportunities for the water and waste programs have been far fewer. Background on how major environmental laws address P2 is in Appendix C. Agency development of P2 compliance approaches in individual environmental standards. − The air program. Major source categories in the surface coatings group have
presented the most consistent P2 opportunities for regulatory workgroups. The air program has issued 12 final rules addressing surface coatings since 1996 that incorporate compliance approaches based on P2 practices.
7 The text box on page 15 describes findings from the Agency’s 1996 assessment of P2 in regulations. . Developing P2 options almost always takes more time, and regulatory workgroups still face court-ordered, consent-decree deadlines signed in the absence of P2 Act considerations. Getting industry surveys on source reduction approved is still challenging. Also, industrial sectors can still be defined broadly, and innovative technologies can still lack track records.
Surface Coating Processes Aerospace Industries (1995) Auto and Light Duty Truck (2004) Large Appliance (2002) Magnetic Tapes (1994) Metal Can (2003)
Metal Coil (2002) Metal Furniture (2003) Miscellaneous Coating Manufacturing (2003) Miscellaneous Metal Parts and Products (2004)

22
Paper and Other Webs (2002) Plastic Parts and Products (2004) Printing, Coating, and Dyeing of Fabrics (2003)
Printing/Publishing (1999) Shipbuilding and Ship Repair (1995) Wood Building Products (2003) Wood Furniture (1995)
Many of these surface coatings for major sources offer a menu of compliance options based either on use of individually compliant materials (P2 product reformulation, typically shifting from volatile organic compound to water-based formulation), collectively compliant materials, or emission rate using add-on controls with work practices (schedules of activities, prohibited practices, etc.). The air program has also developed compliance approaches based at least in part on P2 practices in rules addressing major and area sources in the categories of coke ovens, polymer and resin products, organic chemicals, miscellaneous processes, and categories with area sources only. The air program has issued nine final rules for major sources in these categories since 1996 that offer one or more compliance approaches based on P2.
Boat Manufacturing (2001) (reduces waste) Chromium Electroplating (1995) (uses chemical fume suppressors to stop product volatilization) Combustion sources at Kraft, Soda, and Sulfite Pulp and Paper Mills (2001) Halogenated Cleaning Solvents (1994) (process and work practice changes to reduce solvent consumption) Dry Cleaning (1993) (equivalent P2 technology may be used, replaces perchloroethylene) Friction Material Manufacturing (2002) (solvent recovery, solvent substitution) Iron and Steel Foundries (2004) (work practices to keep mercury switches out of scrap, bag houses reduce
water and energy use) Leather finishing Operations (2002) (can meet HAP loss limit without controls) Miscellaneous Organic Chemical Manufacturing (2003) (can use P2 demonstration plan to reduce
production-indexed HAP consumption factor by 65%)
23
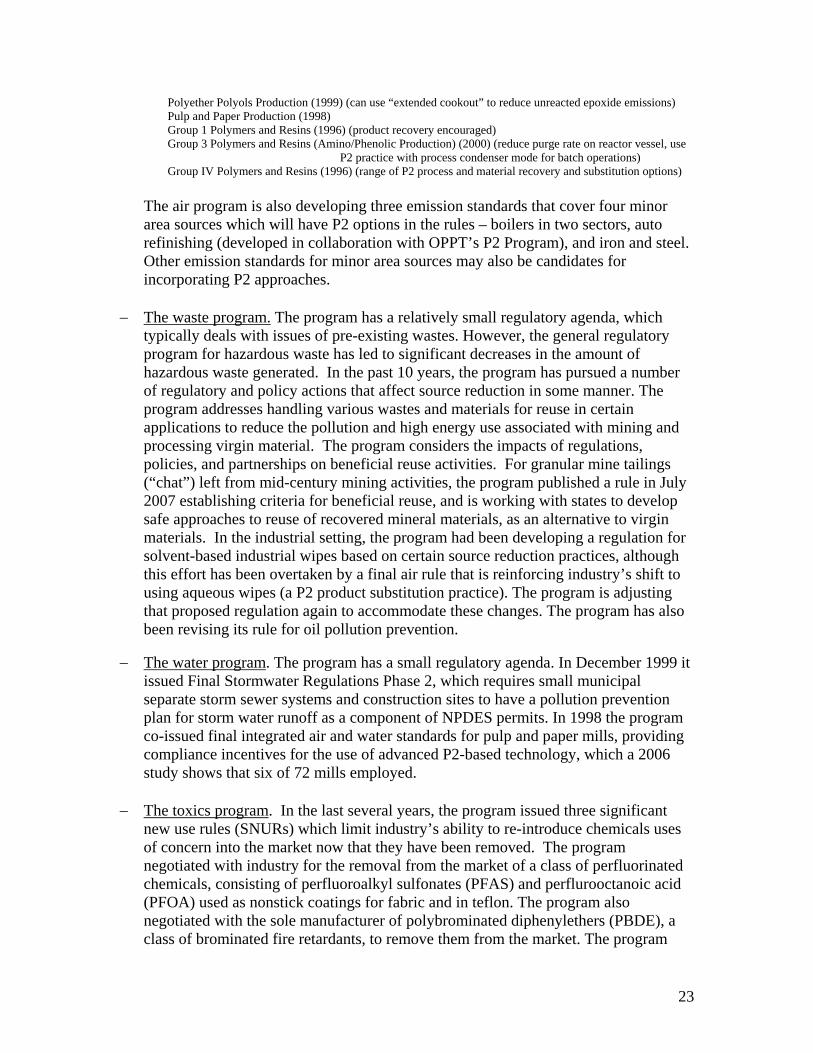
Polyether Polyols Production (1999) (can use “extended cookout” to reduce unreacted epoxide emissions) Pulp and Paper Production (1998) Group 1 Polymers and Resins (1996) (product recovery encouraged) Group 3 Polymers and Resins (Amino/Phenolic Production) (2000) (reduce purge rate on reactor vessel, use
P2 practice with process condenser mode for batch operations) Group IV Polymers and Resins (1996) (range of P2 process and material recovery and substitution options)
The air program is also developing three emission standards that cover four minor area sources which will have P2 options in the rules – boilers in two sectors, auto refinishing (developed in collaboration with OPPT’s P2 Program), and iron and steel. Other emission standards for minor area sources may also be candidates for incorporating P2 approaches.
− The waste program. The program has a relatively small regulatory agenda, which typically deals with issues of pre-existing wastes. However, the general regulatory program for hazardous waste has led to significant decreases in the amount of hazardous waste generated. In the past 10 years, the program has pursued a number of regulatory and policy actions that affect source reduction in some manner. The program addresses handling various wastes and materials for reuse in certain applications to reduce the pollution and high energy use associated with mining and processing virgin material. The program considers the impacts of regulations, policies, and partnerships on beneficial reuse activities. For granular mine tailings (“chat”) left from mid-century mining activities, the program published a rule in July 2007 establishing criteria for beneficial reuse, and is working with states to develop safe approaches to reuse of recovered mineral materials, as an alternative to virgin materials. In the industrial setting, the program had been developing a regulation for solvent-based industrial wipes based on certain source reduction practices, although this effort has been overtaken by a final air rule that is reinforcing industry’s shift to using aqueous wipes (a P2 product substitution practice). The program is adjusting that proposed regulation again to accommodate these changes. The program has also been revising its rule for oil pollution prevention.
− The water program. The program has a small regulatory agenda. In December 1999 it
issued Final Stormwater Regulations Phase 2, which requires small municipal separate storm sewer systems and construction sites to have a pollution prevention plan for storm water runoff as a component of NPDES permits. In 1998 the program co-issued final integrated air and water standards for pulp and paper mills, providing compliance incentives for the use of advanced P2-based technology, which a 2006 study shows that six of 72 mills employed.
− The toxics program. In the last several years, the program issued three significant
new use rules (SNURs) which limit industry’s ability to re-introduce chemicals uses of concern into the market now that they have been removed. The program negotiated with industry for the removal from the market of a class of perfluorinated chemicals, consisting of perfluoroalkyl sulfonates (PFAS) and perflurooctanoic acid (PFOA) used as nonstick coatings for fabric and in teflon. The program also negotiated with the sole manufacturer of polybrominated diphenylethers (PBDE), a class of brominated fire retardants, to remove them from the market. The program

24
followed up with a SNUR affecting 271 PFAS chemicals (2002 as amended through 2007) and a SNUR for the six PBDE chemicals in 2006. The program also issued a SNUR for automotive mercury switches in October 2007, as a follow-up step to the phase out of mercury switches in automobiles at the end of model year 2002..
Agency development of P2 incentives in actions affecting a broad class of rules. − The air program. At the urging of states, the air program took the initiative to
propose an amendment to general provisions affecting all national emission standards for hazardous air pollutants, to change the unintended P2 disincentive in the air program’s “once in, always in” policy.8 The air program proposed an amendment in 2003 that would allow any affected source subject to any national emission standard for hazardous air pollutants to be exempted from the relevant standard in exchange for a facility limiting air emissions from the source to near-zero amounts. In their July 14, 2003 comments, the State air programs (STAPPA/ALAPCO) were very supportive of this proposal as reflecting the principles they had set forth, allowing exemptions only for sources that reduce emissions through pollution prevention. The States made a few suggestions on clarifying the rule’s definition of source reduction, its interface with Title V permits, and its requirements pertaining to resumption of HAP use.
Then, in 2007, the Agency issued another proposal, this time stating that a major source can become a minor source at any time by limiting its emissions to below the major source threshold of 10 tons per year of an individual hazardous air pollutant (HAP) or 25 tons per year of any combination of HAPs. Major sources (which can be made up of multiple affected sources) must meet “maximum achievable” standards, whereas minor sources must meet “generally achievable” standards. This proposal is not supported by State air programs (now NACAA) or by Congress, who moved in January 2007 to block implementation funding for the rule. States oppose the 2007 proposal, disagreeing with the EPA assumption that facilities once controlled by Maximum Achievable standards will always maintain that level of control, and finding nothing in the rule to prevent a facility from letting its emissions drift up just shy of the emission threshold that defines a major source. The States maintain that an exemption from the “once in always in” policy should only be available for facilities that reduce source emissions through pollution prevention.
The progress that the 2003 proposed amendment represented for EPA P2 integration would be hard to overestimate – it provided a strong industry incentive for P2 (the only possibility of earning an exemption from permitting requirements for Maximum Achievable Control Technology was through P2) and affected sources regulated by
8 A facility that must comply with one or more individual national emission standards for hazardous air pollutants which base performance on non-P2 technology must usually comply within a few years of the final standard being issued. The facility may lack time to research and implement a proven alternative P2 approach, which may have broader implications across the whole facility, within that time frame. Once the facility comes into compliance, current Agency policy has the facility always subject to the standard’s permitting requirements. The facility has less incentive to switch to a P2 approach after a control technology is installed if it can never get out of the permitting process.

25
over 180 rules (some of them yet to be written), and applied to many large, medium, and small industrial businesses in the country.
− The air program has also developed a proposed flexible permitting rule that proposes to remove an obstacle to adopting source reduction practices for facilities affected by many air emission standards. We discuss this more fully on page 26 below.
− The pesticides program. The program uses a general policy incentive for source
reduction in its pesticides registration process. Source reduction here involves reducing the hazard or toxicity presented by the pesticide. The program offers expedited review for any pesticide registration that meets the criteria for a reduced risk. Over the past six years, nearly 19% of conventional pesticide registrations have been for reduced risk pesticides, plus use of reduced risk biopesticides.
Partnership agreements used to promote P2-based compliance or P2-based beyond-compliance behavior with respect to a particular rule. − EPA Region 5 started the Hospitals for a Healthy Environment (H2E) partnership
program in 1998 to help medical facilities eliminate their use of mercury and to reduce waste generally. EPA issued an air emission standard for medical waste facilities in 1997 which addresses mercury and other emissions. Some stakeholders were interested in the rule promoting mercury P2 measures for medical facilities. While the rule did not take this approach, the H2E partnership did. The air program’s web site for the rule has a working link to the H2E web site, where technical assistance is made available to support its goal of virtual elimination of mercury at healthcare facilities. Twenty percent of healthcare facilities were members of H2E (and even more participated) by the time the management of H2E transitioned in 2006 from being financially supported by EPA to an independent not-for-profit organization.
− The Offices of Policy, Economics and Innovation, Pollution Prevention and Toxics, Solid Wastes, and Air Quality Planning and Standards collaborated on reaching an agreement in 2006 with the Big Three auto manufacturers, junkyards/recyclers, scrapyard shredders, steel mills, and States, which provides for the removal of mercury switches from junked cars before they are shredded and sold as scrap metal to steel mills. This agreement allows steel mills to satisfy a work practice standard in the Iron and Steel MACT rule, which can be met by certifying the scrap supplier has implemented procedures to remove mercury switches from auto scrap. The regulatory option in the proposed Iron and Steel area source rule refers specifically to this EPA approved agreement.
Conclusion (3) In cases where regulatory workgroups can develop a P2 option for a regulatory standard, current Agency guidance on analyzing economic impacts of P2 regulatory options could be more clear on addressing the possible cost-saving aspects of a P2 option. To encourage the adoption of P2 approaches, it is important to assess any economic benefits of such approaches. In the regulatory setting, where economic analysis of

26
regulatory options is expected, it is important for economic analysis to create an even playing field for P2 options. In the Agency’s guidance on conducting economic impact analysis, the discussion on estimating responses to regulatory policy observes that estimating responses is often the most difficult for P2 policies where options tend to be process- and site-specific. The guidance cautions that detailed information on industrial processes may be needed to predict costs and benefits, and advises that economic analysis should at least include qualitative discussion of potential P2 responses. Perhaps there is an implicit presumption that economists may need to proceed without the more detailed information. Whether the responses are characterized in quantitative or qualitative terms, there is still the issue of how to handle the possible cost-saving aspects of a P2 option in relation to the costs of a P2 option. It would seem legitimate to offset the costs of a P2 option with the savings of a P2 option, but it does not appear that was done in the 2001 Economic Impact Analysis for the Boat Manufacturing NESHAP (air emission standard). In the analysis, costs savings for P2 were counted as zero, on the assumption that a facility would chose to switch to a cost-saving process after capital depreciation. Greater clarity in the guidance on capturing the cost saving aspect of P2 options seems to be needed. Conclusion (4) P2 integration efforts in Agency permitting, enforcement, and compliance programs grew out of training and guidance the Agency developed for EPA and State personnel in the 1990’s. Major permitting programs (except for the underground injection program) have P2 components. Evaluation data from 2001 on the air program’s pilot approach was positive, and the program has developed two rules to implement the pilot approach on a widespread basis. Data gaps for the water and waste permitting programs make them difficult to evaluate, although limited data are positive for the water pretreatment permitting approach to P2. Recent data shows nearly a sixth of enforcement complying actions have a P2 component. The compliance program offers several P2 incentives, and has survey data showing the regulated community takes P2 action based on the Agency’s compliance resources. EPA’s permitting, enforcement and compliance assurance programs at headquarters and in the regions, together with delegated state programs who co-manage permitting, all recognize the considerable opportunity to promote P2 in regulatory implementation activities. P2 integration efforts in these programs grew out of the training and guidance the Agency developed in the 1990’s for EPA and State permitting, compliance, and inspection personnel, in accordance with the P2 Act. Generally, guidance resources continue to be expanded and updated. − The air program. In 1995, the program considered options for encouraging source
reduction through permits, and chose permitting flexibility as its primary approach. Flexibility within proper constraints is seen as a P2 incentive in that facilities are freer to consider process changes without going through permit review. Flexibility also makes change easier even when P2 is not involved, unless flexibility is limited to P2 situations. The program’s currently proposed flexible permitting rule builds on years of effort to harmonize the Clean Air Act permitting policy framework with both

27
market demands and P2 policy. The air program began with a flexible permitting pilot, which it evaluated in 2001. In 2002, it issued a final rule modifying New Source Review requirements, providing for, among other things, use of plantwide applicability limits for triggering New Source Review. Plant-wide applicability limits are a bubble concept which focuses on increases in plant-wide emissions and not emission increases at individual units within the plant. This technique is used as a limit on flexibility in air permitting. The proposed flexible permitting rule would apply to both clean air operating permits (Title V) and new source review programs.
− The water program. The program encourages source reduction in direct discharge
permits through a combination of mandatory P2 planning and best practices for storm water runoff, related sector guidance, and inspection guidance on integrating P2 opportunity assessments into onsite inspections.. There is little data available on how often inspectors use P2 opportunity assessments. The water program also fosters P2 in its pretreatment program for indirect dischargers through guidance to states and the thousands of municipal treatment works who administer the program. The guidance addresses integrating P2 into pretreatment permits, inspections, training, outreach, and recognition. A sample POTW annual report from California indicates the issuance of thousands of P2 permits issued to dischargers into the district sewer system. North Carolina permits collect descriptions of current P2 activities from industrial users of treatment works. A broader sampling of data points would be needed to evaluate the effectiveness of pretreatment guidance for states and municipal treatment works.
No examples of encouraging source reduction in underground injection permits were identified during the course of this evaluation. The Underground Injection Control program in the water office regulates a major pathway for waste disposal in the U.S., with more than 800,000 injection wells covered by the program, and more than nine billion gallons of hazardous waste disposed annually in these underground wells. In conversations with staff and managers in the water office, it was clear that the prevention aspects of underground injection are focused on preventing contamination through leaks, rather than promoting the reduction of pollution at its source.
− The waste program. There is a statutory requirement for certifying that a P2 (waste
minimization under the statute) plan is in place. The program produced an excellent compendium of P2 options in the permitting process in 1998, but the extent to which has been put to use is not clear. No assessment of the effectiveness of the statutory certification requirement was found during this evaluation. In at least one case, regional efforts to strengthen waste minimization provisions of RCRA permits were deemed unenforceable by regional counsel, and not pursued. Instead, OSW has determined that the most effective strategy is to identify the highest generators of priority chemicals in industrial processes and waste, and to work with them individually.
− The Office of Enforcement and Compliance Assurance (OECA). OECA, in
conjunction with all the regulatory programs, has integrated P2 approaches into all its

28
major tools – enforcement, compliance monitoring, compliance incentives, and compliance assistance. They have integrated P2 elements into seven policy and guidance documents, three outreach vehicles, two initiatives and incentives, and four measurement and reporting systems. A table of all these tools with web site, date, and description references appears in Appendix C, along with other supporting materials for the rest of this OECA discussion.
The enforcement office conducts tens of thousands of inspections annually, many of which lead to follow-up actions. Facilities are also encouraged to audit their own activities to identify and correct any environmental noncompliance in the absence of inspection. While OECA has long integrated P2 into the correction of noncompliance situations, in recent years it has modified its data collection systems to actually quantify the application of P2 practices. In FY 2005, 20% of concluded enforcement actions that resulted in a compliance action had a P2 component, and FY 2006 nearly 11% of concluded enforcement actions that resulted in compliance action had a P2 component. Of the enforcement cases that included a negotiated supplemental environmental project (SEP), voluntarily undertaken for possible penalty mitigation, an average of 33% had a P2 component for all years FY 1999 through FY 2006. Details on OECA’s SEP Policy, and tables showing the number and percent of SEPs under each of eight statutes for these eight years, appears in Appendix C. In this evaluation we have not examined the case experiences behind these numbers to assess the nature and quality of the P2 components undertaken. Number of
Concluded Enforcement Actions
# of Concluded Enforcement Actions with Any Complying Actions
# of Concluded Enforcement Actions with P2 Complying Actions
FY 2005 4,845 4,021 (83%) 823 (17%) FY 2006 6,228 5,524 (88%) 648 (10%)
Source: ICIS data, as generated by OECA in July 2007 OECA guidance for compliance monitoring has, since 1998, strongly emphasized the development of coordinated multimedia, whole-facility, and pollution prevention oriented compliance assurance strategies. A 1999 inspection resource guide and 2004 inspection guidance related to the Clean Water Act further that emphasis. Compliance monitoring in EPA’s Federal Facilities Enforcement Program routinely checks for green purchasing. In this evaluation we have not examined experiences in the field to assess the extent to which field inspectors routinely follow up on OECA’s approach to compliance monitoring.
For P2 compliance incentives, OECA points out P2 cost savings in self-audit guidance, gives small businesses longer compliance timeframes when they identify P2 options in self-audits, and gives developers enforcement-related incentives when they take a sustainable approach to cleaning up and redeveloping contaminated sites.
29
For compliance assistance, OECA uses web-based tools and onsite assistance. The electronic compliance assistance clearinghouse established in 2001 has a P2 resource listing. The 15 web based, sector-oriented compliance centers that OECA maintains in partnership with stakeholders each have P2 information. Based on a non-representative sample, 55 % of 2006 survey respondents from the regulated community, and 53% of 2007 survey respondents reported reducing or eliminating a pollutant as a result of a Center resource. Three sectors are especially oriented around P2 – the healthcare center, which can be entered through either a compliance assistance portal or a P2 program portal, the chemical center, which has an interactive facility tour with case studies and best management practices, and the federal center, which maintains online services for enhancing the sustainability of facility operations. OECA’s online Sector Notebook series profiles top P2 opportunities and P2 success stories. There are 35 sector notebooks and each has a P2 chapter. On-site assistance for federal facilities helps them meet obligations under Executive Order 13423, which requires many federal facilities to have environmental management systems in place that incorporate P2 strategies.
Conclusion (5) Agency Regional offices use strategic co-location of P2 programs with other programs to leverage P2 resources and promote collaboration. Regions occasionally reach out beyond their co-located offices to promote P2 integration in other regional offices. One Region uses P2 planning and results reporting for media offices, supported by cross-office P2 teams. There is variability among Regions in the extent to which they coordinate regional multimedia and regional P2 efforts. There is room for expanding the contribution of Regions to P2 integration. In Agency Regional offices, Regional P2 programs are strong advocates for P2 integration. Yet these programs are small, mostly consisting of two full-time staff with substantial direct P2 grant duties, and sometimes direct P2 project duties. Since individual Regions choose where these staff are placed and whether staff can be configured with similarly-oriented staff to coordinate their approaches and leverage their effectiveness, there is regional variation in how much effort P2 regional staff can devote to integrating P2 into other regional programs and how much integration is achieved. Compliance and enforcement staff are more numerous in the regions, and they too place an emphasis on P2. In several regions, P2 and compliance assistance are in a common organizational unit. In other regions, P2 is combined with air, toxics, and/or waste programs. These various configurations have produced such P2 integration results as helping with P2 options on regulatory workgroups, producing a compilation of workable P2 integration techniques (Region 8), encouraging P2 approaches in state implementation plans for non-attainment areas for criteria air pollutants, working on P2 supplemental environmental projects negotiated during enforcement settlements, and joint projects with co-located media programs, such as Region 1’s joint targeting of enforcement and compliance assistance/P2 efforts on the university sector.
30
The most comprehensive approach to P2 integration is in Region 4 which, for the past decade, has had a public P2 Strategy that commits Region 4 to integrating P2 into all major areas of activity. First administered by the Air, Pesticides and Toxics Management Division, and now managed by the Office of Policy and Management, the strategy aims to (1) make P2 the first consideration for all Region 4 media program activities, (2) advance multimedia planning throughout R4, (3) support partners doing P2 with flexible program management and direct assistance, and (4) make R4 a role model for adopting P2 in government operations. The Strategy calls for the air, water, and waste programs to prepare P2 implementation plans and report annual P2 accomplishments. A 2005 P2 Program Logic Model for Region 4 lists media P2 teams and cross-office P2 teams as resources, and organizes activities by the same four goals of the R4 Strategic Plan. Activities include (1) advocating P2 as cross-goal strategy in EPA Strategic Plans, (2) partnering with regional planners to include P2 measures in plans, (3) engaging media and enforcement programs in P2 measurement, and (4) supporting links with P2 and sustainability and stewardship. The Logic Model also lists such short-term results as number of States with environmental leadership programs and such long-term results as P2 becomes the cornerstone in stewardship and sustainability, increasing mention of P2 in EPA Strategic Plans and media programs, and improving air, land, and water metrics. In FY 2005, the Region 4 air and water programs reported quantified P2 outcomes that were counted towards Agency P2 Program targets, and in FY06, of the eight Region 4 States reporting P2 outcome results, six States reported results from environmental leadership programs. To evaluate whether practice in Region 4 lives up to the expectations of its strategy and logic model would involve more work than we have done. Yet the continuity expressed in having a public strategy on its web site and a working logic model that supports it shows in concept what might be done for the Agency as a whole, since a Region is a microcosm of the Agency. Conclusion (6) More programs are using partnerships to work towards some program goals, and this is expanding opportunities for P2 integration. Programs increasingly use partnerships to achieve goals. While EPA has long used partnerships as an important adjunct to non-voluntary programs, such as the Radon Program’s extensive use of voluntary programs since 1985, this trend has accelerated in face of the growing need for EPA to encourage and enable desired behaviors. Narrower limits would constrain the Agency’s ability to promote environmental stewardship, prevention, and sustainability. EPA staff have increasingly found innovative partnership approaches for providing information to technical assistance providers and the public, delivering technical and financial assistance, and recognizing and sharing best practices.
EPA Partnership Programs
OAR 23 OPPT 11 OSWER 7 OW 7 Others 4
31
The Office of Policy, Economics and Innovations made a preliminary standard list of the principle partnership programs, which appears in Appendix C. The appendix shows their relationship to P2 – most actively encourage source reduction. There are now dozens of major, national partnership programs across EPA, and many more with a regional and local community emphasis, that promote taking responsibility for environmental quality. EPA’s statutory programs use partnerships to promote P2 and sustainability, even though EPA’s goal structure leads to Agency web sites and documents categorizing many of these activities as though they were separate from P2 and sustainability. As one example, the Climate Change Program in the air office relies heavily on public/private partnerships – Energy Star works with over 9000 public and private sector organizations to improve energy performance (which reduces greenhouse gas emissions through source reduction), manufacture, sell, and promote Energy Star products, and build Energy Star qualified homes. As another example, the solid waste office relies on various partnerships to achieve waste reduction and sustainable use of resources, including a 2003 partnership with McDonough Braungart Design Chemistry (MBCD) to issue a design challenge for a sustainable packaging system that would recover value and eliminate waste. As a result packaging industry professionals formed the Sustainable Packaging Coalition, which today with 90+ members educates industry decision-makers and distributes design tools for moving toward a fully sustainable packaging system. Agency partnership programs contribute to integrating P2 in other EPA programs and other Federal agencies. The Office of Compliance collaborated with Hospitals for a Healthy Environment (then an Agency partnership program) on an integrated, dual-portal website on P2 and compliance issues for healthcare facilities. The Office of Air Quality Planning and Standards is collaborating with the P2 Program to use voluntary best practice standards in area source rules. OAQPS included P2 best practices promoted by the Design for the Environment Program in the January 9, 2008 area source regulation for miscellaneous surface coatings and auto refinishing operations. OAQPS also included a discussion of P2 opportunities to use safer alternative chemicals in the final area source regulation for iron and steel foundries. Energy Star is a joint effort of EPA and the US Department of Energy, and Energy Star success in affecting procurement influenced the first Executive Order on greening the Federal government (1993), which also emphasized procurement. The Agency’s Coal Combustion Products Partnership is a collaborative effort of four Federal agencies. The Agency’s Green Suppliers Network is a partnership with the National Institute for Standards and Technology (US Department of Commerce), which is also now involving the Department of Energy and States, for the purpose of integrating P2 into, and harmonizing, government technical assistance on helping businesses green and lean their operations. The Federal Electronics Challenge (FEC) partnership, which took direction from the greening the government executive orders, in turn has influenced the most recent such Executive Order, which now makes participation in the FEC virtually mandatory for Federal agencies. Conclusion (7) EPA statutory implementation programs also take opportunities to integrate P2 into operations other than regulations. These include activities in the

32
children’s health, indoor air, pesticides, research, solid waste, toxics, and water programs. There is room for more of these opportunities to be utilized. The Office of Children’s Health and Environmental Education and the Indoor Air Program collaborate on the Healthy School Environments Assessment Tool (HealthySEAT) which helps schools with P2 approaches and directs them to such Agency efforts as the integrated pest management, green chemistry, and clean bus programs. The Office of Pesticide Programs collaborates with the U.S. Department of Agriculture (USDA) to promote the targeted use of biopesticides as environmentally safer substitutes for conventional, broad-spectrum chemical pesticides. Together, EPA and USDA fund biopesticide demonstration projects. Biopesticides include such techniques as phenome-based insect mating disruption, use of common soil bacteria with natural fungicidal properties to combat molds and mildews on a variety of agricultural crops, and use of sesame and other natural oils to combat powdery mildew on pumpkins. The Office of Research and Development published a Pollution Prevention Research Strategy in 1998 as one of its 13 completed research strategies. The P2 Research Strategy represents an important piece of the research focus on sustainable development. The P2 Research Strategy focuses on delivering broadly applicable tools for P2 and sustainability, developing and transferring P2 technologies, verifying specific P2 technologies, and researching economic, social and behavioral aspects of P2. A current internal Draft Sustainability Research Strategy continues some focus areas from the P2 Research Strategy and further develops the areas of: (1) interconnections, resilience, and vulnerabilities over time of natural systems, industrial systems, the built environment, and human society; (2) collaborative decision-making (needed for policy coherence); and, (3) metrics and indicators for sustainability. In its 2006 report on the past decade of cutting-edge sustainability and P2 grant results of broad applicability, ORD observes that sustainability is not possible without innovations in pollution prevention. The Office of Solid Waste has developed a variety of tools to assist managers of municipal and industrial solid waste programs choose source reduction options. These tools include a source reduction manual for solid waste managers, a related free software program called ReduceIt, and a guide for industrial waste management. The new chemicals program within the Office of Pollution Prevention and Toxics, which helps manage the potential risk from chemicals new to the marketplace, offers expedited pre-manufacturing review of new chemical submissions that demonstrate reduced risk (through some combination of reduction in toxicity, persistence, unintended by-products, etc.). The program also shares a set of tools for designing and evaluating chemicals with industry, to help them recognize and avoid problem chemical formulations on their own. Similarly, OPPT has also launched the Chemical Assessment and Management Program (ChAMP) as part of an international commitment to develop broad, screening-level assessment of the risks posed by chemicals in commerce, with the aim of setting

33
priorities for management, and assess the need for action, including pollution prevention, to mitigate these priority risks. The Office of Water has developed an approved P2 option that Tribal Nations can use to administer a water quality program under Clean Water Act Section 106 grants. This option is included in the program’s grant guidance for FY 2007 and beyond. The program has also included a P2 chapter in its 2005 guidance for municipalities and citizens on managing nonpoint source pollution from urban areas. The P2 chapter covers the handling of household chemicals, lawn and garden activities, turf management in recreational areas, and commercial activities such as parking lots and gas stations. Evaluation Q1, sub-question 1. Does current Agency review of regulations and programs for their effect on source reduction conform with the P2 Act provision: “Ensure that the Agency considers the effect of its existing and proposed programs on source reduction efforts and review regulations of the Agency prior and subsequent to their proposal to determine their effect on source reduction”? Conclusion (8) Agency review of regulations and programs for their effect on source reduction efforts is in basic conformity with the relevant Pollution Prevention Act provision, but there is room for continuing improvement. Based on Conclusions 1 through 7, as supported by evidence identified in Appendix B, we conclude that the Agency is in basic conformity with this provision of the Pollution Prevention Act. As noted in the discussions on these conclusions, there is room for continuing improvement in Agency review of programs and regulations for their effect on source reduction, and we make several recommendations in Chapter 4 for continual improvement in this area. There is also clearly room for improving the P2 outcomes achieved from this review. Although the P2 Act does not mandate particular outcomes from the prescribed Agency review, a need for improving those outcomes is nonetheless felt, especially by those who have significant expectations for the feasibility of preventing pollution – the P2 Act establishes a national policy that pollution should be prevented or reduced at the source whenever feasible. Along these lines, it is felt that the review of programs and regulations should result in all programs finding a way to put P2 first, and having that reflected and tracked in their outcome results. We make several recommendations in Chapter 4 that go to improving the P2 outcomes achieved by Agency P2 integration interventions. Evaluation Q1, sub-question 2. Does current Agency review of regulations for their effect on source reduction conform with prior federal recommendations on this topic? Two sets of prior federal recommendations pertained to Agency review of regulations for their effect on source reduction. First were recommendations from the 1996 EPA Assessment of the Source Reduction Review Project, a self-assessment of Agency efforts from 1991-1995 to consider P2

34
during pilot rule developments. The assessment focused on underlying statutory and administrative factors that constrained Agency consideration of P2 options during rule development. Recommendations focused on what the Agency could try on its own to do to overcome the obstacles posed by the media-by-media statutory framework defining its operations. The recommendations were ambitious – no institutional mechanism in the Agency compelled individual programs to consider these broad recommendations when setting their own program goals and targets, and nothing in the P2 Act overrides other statutory, policy, or court mandates affecting regulatory development, making it often difficult to maintain a P2 position. Major recommendations from the SRRP Assessment were:
1. Reinvent the planning and budgeting processes to enhance multimedia and pollution prevention outcomes, and emphasize the link between multimedia and P2 solutions.
2. Continue to place special attention on targeted rules, especially during their implementation phases, and apply some of the positive lessons learned.
3. Broaden the flexibility of regulatory requirements. 4. Address/focus on Paperwork Reduction Act concerns about collecting source
reduction data from industry. (OMB plays a large role.) Second as a source of recommendations was the January 2001 Report of the U.S. General Accounting Office, EPA Should Strengthen Its Efforts to Measure and Encourage Pollution Prevention. GAO stated:
1. “GAO recommends that the Administrator systematically determine the extent of the agency’s compliance with the Pollution Prevention Act’s requirement that EPA ‘review regulations of the Agency prior and subsequent to their proposal to determine their effect on source reduction.’ If warranted by the results of the agency’s analysis, GAO further recommends that the Administrator develop a plan to improve the agency’s compliance.”
Conclusion (9) The two steps of having an Agency system to track regulatory workgroup consideration of source reduction during rule development, and making recommendations for improving the consistency of that consideration (as we do in this evaluation), are in line with the 2001 recommendations of the U.S. General Accounting Office. Based on Conclusion 1, the Agency is tracking the extent to which it considers the effects of its rules on source reduction efforts, which, when counting two proposed rules that each affect a broad class of regulatory standards, may be up to about half the time. Better quality data are needed to verify this conclusion, and to identify what impedes more routine consideration of the effect of rules on source reduction. The combined steps of tracking the extent of regulatory review and making recommendations to improve tracking and regulatory review conform with the 2001 GAO recommendation. Conclusion (10) Currently, high-level planning and budgeting tends to be silent on encouraging multimedia P2 outcomes through regulations, which is not consistent with the Agency’s 1996 Assessment on P2 in Regulations. The current state is strongly
35
influenced by GPRA-related PART program reviews, which place emphasis on individual program planning and budgeting, not on cross-program planning and budgeting. EPA Region 4 has integrated P2 into media office planning for the past ten years, which is consistent with the 1996 recommendations. From 1998-2003, Headquarters placed some emphasis on cross-program planning and budgeting (in the targeted area of persistent, bioaccumulative and toxic chemicals) which, on a limited scale, was consistent with the recommendations of the 1996 Assessment. The SRRP Assessment saw high-level planning and budgeting as influencing the development of P2 regulatory options. Here we rely on our discussion of Conclusion 27 under Question 4 (on goal setting) for concluding that high-level planning and budgeting tend to be silent on encouraging multimedia P2 integration approaches. The two exceptions are Region 4 planning (described in Conclusion 5) and Headquarters planning and budgeting from 1998 to 2003 in the targeted area of persistent bioaccumulative and toxic (PBT) chemicals. For that time interval, for some defined PBT groups of chemicals, 12 agency programs collaborated in planning and budgeting to take a multimedia and whenever possible P2 perspective on regulations, other statutory programs, international activities, voluntary activities, and research and outreach activities. The opportunity to function in this way arose from a multimedia P2 budget initiative on PBTs proposed by multiple offices and accepted by the Administrator. Conclusion (11) The Agency is still using specially targeted rules to promote source reduction, as recommended by the EPA 1996 Assessment on P2 in Regulations. The Agency is paying particular attention to P2 in the regulatory implementation phases of permitting, inspection, enforcement and compliance, consistent with the 1996 recommendations. For this conclusion, we rely on the discussion under Conclusions 2 and 3. Conclusion (12) The Agency’s current emphasis on broadening the flexibility of regulatory requirements is consistent with the 1996 Assessment recommendations, although there is always room for continuing improvement. For this Conclusion, we also rely on the discussion under Conclusions 2 and 3. In particular, we are referring to three air program actions (the plantwide applicability limits of the final new source review rule, and the draft flexible permitting rule and the 2003 draft amendments to the NESHAP general provisions), and the flexibility of the current Enforcement Office guidance on Supplemental Environmental Project Guidance (which, in layman not legal terms, allows alleged violators to conduct P2 SEPs that generate a profit, an exception to the general unacceptability of profitable projects). Conclusion (13) Constraints on Agency use of industry surveys for gathering data needed for regulatory and programmatic performance remain at a level that was of concern in 1996. The current state of data gathering through surveys is not consistent with 1996 Assessment recommendations.

36
In the past decade, the media programs have largely not submitted (due to past experience) or not had success in submitting source reduction questions in Information Collection Requests (ICR’s) to the Office of Management and Budget, as required under the Paperwork Reduction Act for surveys involving more than nine entities. The constraint on Agency use of surveys is affecting voluntary programs as well. Heightened measurement expectations from the GPRA and Program Assessment Rating Tool Guidance have generally made it harder (or at least not any easier) for partnership programs to collect survey information as a way to document outcome results. There is seemingly a need for a voluntary program to establish a satisfactory causal link between its program intervention and the ensuing environmental results in order to get OMB approval for this kind of survey. This ICR issue tends to be a bigger roadblock for voluntary programs whose partners choose diverse P2 approaches than it is for programs whose partners adopt a sector-wide approach, since case studies plus market data can help document results for the latter type of program.
37
Evaluation Question #2. What is the current state of internal Agency coordination on source reduction activities? With appropriate offices to promote source reduction practices in other Federal agencies? The Agency’s source reduction activities are quite diverse, and several working arrangements exist for coordinating groups of these activities. As needed, coordinating bodies also confer with each other, as the M2P2 Forum and the IAC have done. Agency coordination for promoting P2 practices at other Federal agencies involves several parts of EPA working with the Federal Environmental Executive and other lead Federal departments in the implementation of Federal Executive Orders, assisting federal agencies generally to integrate P2 into their daily operations. The Office of Federal Activities also reviews Environmental Impact Statements of Federal agencies. Conclusion (14) The Innovations Action Council (IAC) coordinates environmental stewardship partnership programs across the Agency, many of which address source reduction activities. The IAC produced the report to the Administrator on environmental stewardship, which cites P2 as an integral part of environmental stewardship and sustainability approaches. The Innovations Action Council, comprised of Deputy Assistant Administrators and Deputy Regional Administrators, has overall responsibility for formulating and advancing the Agency’s innovation agenda. Established in the Fall of 1996, the IAC has played an active role in giving new innovative approaches, which includes many addressing source reduction activities, the attention and support they need to flourish, and has provided a venue to share innovation efforts more broadly. Conclusion (15) The Office Directors’ Multimedia and Pollution Prevention (M2P2) Forum coordinates some source reduction activities that relate to regulatory integration and other multimedia program activities. On several occasions, the Forum has brought offices together to forge concrete multi-office P2 solutions to environmental problems. There is room for greater utilization of the M2P2 Forum in this problem-solving capacity. The Office Directors’ Multimedia and Pollution Prevention Forum, comprised of Office Directors and Regional Office Directors, serves to advance multimedia and pollution prevention approaches across a wide range of programs. Established in the Fall of 1996, the same time the Innovations Action Council began, the Forum came into existence to focus on the SRRP Assessment recommendations and coordinate P2 regulatory integration activities. In 1998, it took on a broader coordination role among 12 Agency programs in conjunction with the budget initiative on persistent, bioaccumulative and toxic (PBT) chemicals, described in the discussion under Conclusion 10. Cross-office consultation in the M2P2 Forum during the six-year PBT effort led to a Toxics Release Inventory rule on PBTs, a TSCA new chemicals policy on PBTs, the eventual elimination
“Coordinate source reduction activities in each Agency office and coordinate with appropriate offices to promote source reduction prac-tices in other Federal agencies, and generic research and development on techniques and processes which have broad applicability;” PPA, Section 13103.

38
of lead in car racing fuel through an agreement with NASCAR, the Mercury Roadmap, and a heightened focus on chemical clean-outs in schools, pesticide clean-outs, wood stove change-outs with better technology, and burn barrels projects that promoted local ordinances to stimulate more centralized waste collection. In 2004, the M2P2 Forum brokered the collaboration between the air office and the Design for Environment partnership program on developing a few area source rules. In 2005, the M2P2 Forum brokered a collaboration among the Office of Policy, Economics and Innovation, the Office of Pollution Prevention and Toxics, and the Office of Air Quality Planning and Standards on reaching an agreement in 2006 with the Big Three auto manufacturers, junkyards, scrapyard shredders, steel mills, and environmental organizations, which provides for the removal of mercury switches from junked cars before they are shredded and sold as scrap metal to steel mills. This complements the Iron and Steel MACT rule and will also complement the Iron and Steel Area Source Rule when it is final. Conclusion (16) The Environmental Assistance Network provides a forum for coordinating Agency technical assistance activities, including those with P2 components, of the compliance, prevention, innovation, research, and American Indian programs. There is room for utilizing this forum to continually improve the coordination of compliance and P2 technical assistance. In 2004, programs reporting under Agency Goal 5 established the Environmental Assistance Network to identify collaborative opportunities to improve their collective results. Goal 5 aims to improve environmental performance through compliance, P2, environmental stewardship incentives, and innovative approaches. As its first substantive focal area, the EAN has drafted a strategy for measuring behavior change and environmental outcomes in the construction sector. The strategy focuses on green building practices, environmentally preferable materials, construction and demolition debris management, diesel air emissions, storm water compliance, and energy use and greenhouse gas emissions. During this evaluation, some staff mentioned the desirability of improving the coordination of compliance and P2 technical assistance. The EAN may be an appropriate forum to look into this issue. Conclusion (17) The Office of Research and Development coordinates research activities on source reduction approaches. EPA’s Office of Research and Development consults with other EPA offices on their priorities for P2 research, and consults with various other research-oriented organizations and panels on P2 research, including the EPA Science Advisory Board, the National Science Foundation, and the National Academy of Sciences.

39
Evaluation Q #2, sub-question 1: What is the current state of Agency coordination with appropriate offices to promote source reduction practices in other Federal agencies? Conclusion (18) Currently, Agency offices coordinate with each other, with the Federal Environmental Executive, and with other lead Federal departments to assist Federal agencies generally to adopt source reduction practices in their operations. Many of these working relationships are structured by Federal Executive Order 13423, which consolidates related executive orders that preceded it. Working relationships focus on achieving specific EO 13423 goals and related partnership goals. EPA also reviews the environmental impact statements (EIS) of other Federal agencies; further evaluation would be required to understand the current state of promoting P2 through EIS review. Presidents have issued Federal Executive Orders (EO’s) since 1993 to strengthen the integration of P2 into daily federal operations. The first (EO 12873) required federal agencies to begin using their acquisitions to grow the market for environmentally preferable products, using criteria for waste prevention, multimedia, and life cycle impacts. EO 13101 (1998) required agencies to set environmentally preferable acquisition goals. EO 13123 (1999) set numeric goals for energy and water conservation. In 2000, EO 13148 set numeric goals for reducing releases of various chemicals of concern and directed agencies to advance the national P2 policy, while EO 13149 set numeric goals for reducing fleet consumption of petroleum. EO 13423 (2007) sets numeric goals for greenhouse gas reductions, water consumption intensity, fleets, sustainable buildings, and electronic purchases, and requires agencies to acquire bio-based, environmentally preferable, energy-efficient, water-efficient, and recycled-content products. Four parts of EPA coordinate with the Federal Environmental Executive at the White House Council on Environmental Quality, which oversees implementation of EO 13423 through interagency coordination. These four offices are the Waste program, the P2 program, the Energy Star program, and the Office of Administration and Resources Management. EPA, the Department of Energy, and the Department of Agriculture each have facilitative roles for assisting Federal agencies generally in following the EO mandates. As noted under Conclusion 6, partnership programs sometimes coordinate directly with other Federal agencies on promoting P2 approaches. The Green Suppliers Network (GSN), a partnership program, developed its design around collaborating with the Manufacturing Extension Partnership Centers (MEPs) of the National Institute for Standards and Technology (Dept. of Commerce). GSN has since also invited the involvement of the US Department of Energy and state P2 technical assistance providers, each technical assistance program adding its expertise, further integrating P2 into the governmental network of technical assistance providers, adds more policy coherence to
EO 13148:... Each agency shall advance the national policy that, whenever feasible and cost-effective, pollution should be prevented or reduced at the source. Funding for regulatory compliance programs shall emphasize P2 as a means of compliance.

40
the network, and builds capacity for helping suppliers move forward with sustainable P2 practices. Another aspect of EPA interaction with other Federal agencies is EPA review of environmental impact statements (EIS) prepared by Federal agencies before undertaking a major action that would have a significant impact on the environment. In 1993, EPA’s Office of Federal Activities (now in OECA) prepared guidance for EPA reviewers of EIS submissions on how to promote P2 during EIS review. This guidance was developed pursuant to EPA’s 1991 P2 Strategy and 1992 Draft Federal Sector P2 Strategy. The guidance identifies P2 approaches for a wide variety of federal actions, covering agriculture and land management, airports, dredging, energy and water supply projects, general construction, habitat rehabilitation, highways and mass transit, housing, hydropower generation, mining, natural gas pipelines, oil and gas, rocketry and missile projects, and wetlands. Evaluation Q #2, sub-question 2. How does this current state of Agency coordina-ion on source reduction activities align with the Pollution Prevention Act provision, “Coordinate source reduction activities in each Agency Office and coordinate with appropriate offices to promote source reduction practices in other Federal agencies, and generic research and development on techniques and processes which have broad applicability”? Conclusion (19) Current Agency coordination on source reduction activities is generally aligned with the relevant Pollution Prevention Act provision. Further evaluation of Agency research and development activities would be needed to address the part of the relevant PPA provision that focuses on coordination with appropriate offices to promote generic research and development on P2 techniques of broad applicability.
Evaluation Question #3: What is the current status of data collected under Federal environmental statutes and related sources, and what does current analysis of these data reveal about the impacts of pollution prevention? Among national-level data sets, those that track total waste generation are better suited for evaluating the impact of P2 than those that track post-treatment emissions. We have found at least some usable trend data on pollution generated that is being collected under TRI and RCRA (for solid waste, less so for hazardous waste). We also found usable trend data in EPA’s Greenhouse Gas Inventory and Energy Use Inventory (based on surveys and modeling), in USDA Fertilizer Use Tables, and in EPA market studies on pesticide use (although these were discontinued after 2001). The current picture presented by this combination of data is that of levels of pollution being generated are generally rising, but rising slower than the rise in population and gross domestic product. Generally it is difficult to relate the Agency’s P2 environmental results to national results, except in the case of greenhouse gases, where Agency results can be placed in the context of national results. Some data gaps exist for wastes generated for specific environmental
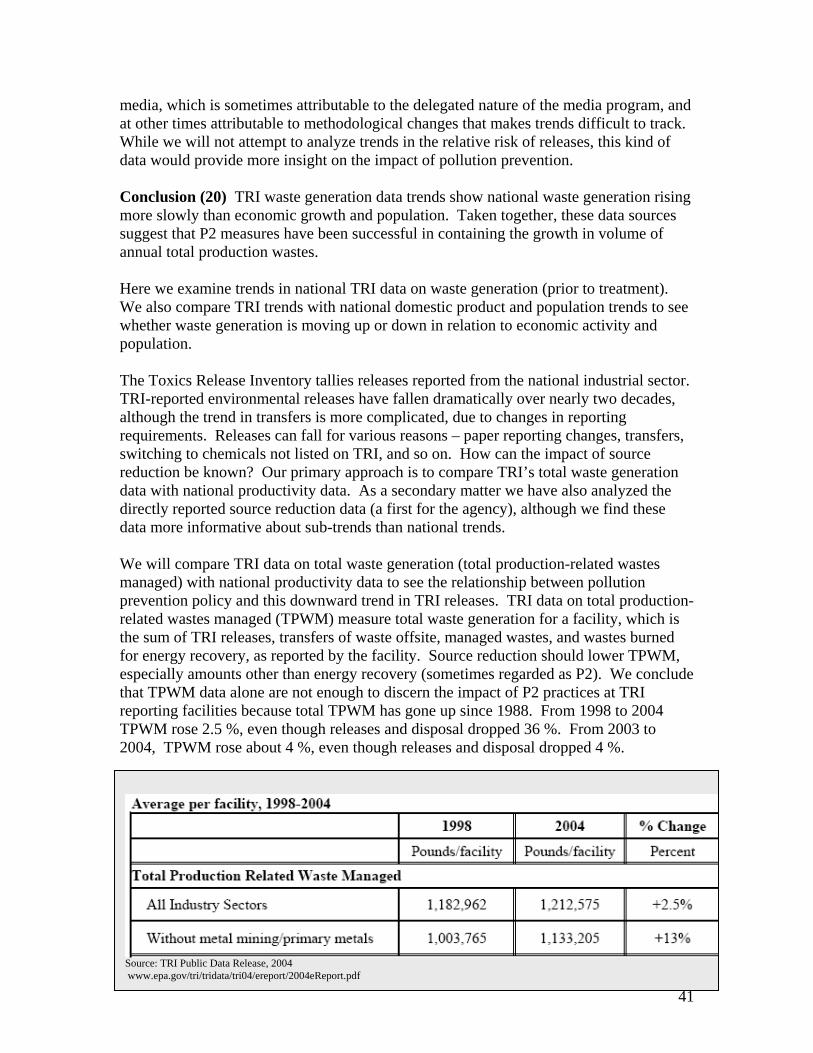
41
media, which is sometimes attributable to the delegated nature of the media program, and at other times attributable to methodological changes that makes trends difficult to track. While we will not attempt to analyze trends in the relative risk of releases, this kind of data would provide more insight on the impact of pollution prevention. Conclusion (20) TRI waste generation data trends show national waste generation rising more slowly than economic growth and population. Taken together, these data sources suggest that P2 measures have been successful in containing the growth in volume of annual total production wastes. Here we examine trends in national TRI data on waste generation (prior to treatment). We also compare TRI trends with national domestic product and population trends to see whether waste generation is moving up or down in relation to economic activity and population. The Toxics Release Inventory tallies releases reported from the national industrial sector. TRI-reported environmental releases have fallen dramatically over nearly two decades, although the trend in transfers is more complicated, due to changes in reporting requirements. Releases can fall for various reasons – paper reporting changes, transfers, switching to chemicals not listed on TRI, and so on. How can the impact of source reduction be known? Our primary approach is to compare TRI’s total waste generation data with national productivity data. As a secondary matter we have also analyzed the directly reported source reduction data (a first for the agency), although we find these data more informative about sub-trends than national trends. We will compare TRI data on total waste generation (total production-related wastes managed) with national productivity data to see the relationship between pollution prevention policy and this downward trend in TRI releases. TRI data on total production-related wastes managed (TPWM) measure total waste generation for a facility, which is the sum of TRI releases, transfers of waste offsite, managed wastes, and wastes burned for energy recovery, as reported by the facility. Source reduction should lower TPWM, especially amounts other than energy recovery (sometimes regarded as P2). We conclude that TPWM data alone are not enough to discern the impact of P2 practices at TRI reporting facilities because total TPWM has gone up since 1988. From 1998 to 2004 TPWM rose 2.5 %, even though releases and disposal dropped 36 %. From 2003 to 2004, TPWM rose about 4 %, even though releases and disposal dropped 4 %.
Source: TRI Public Data Release, 2004 www.epa.gov/tri/tridata/tri04/ereport/2004eReport.pdf
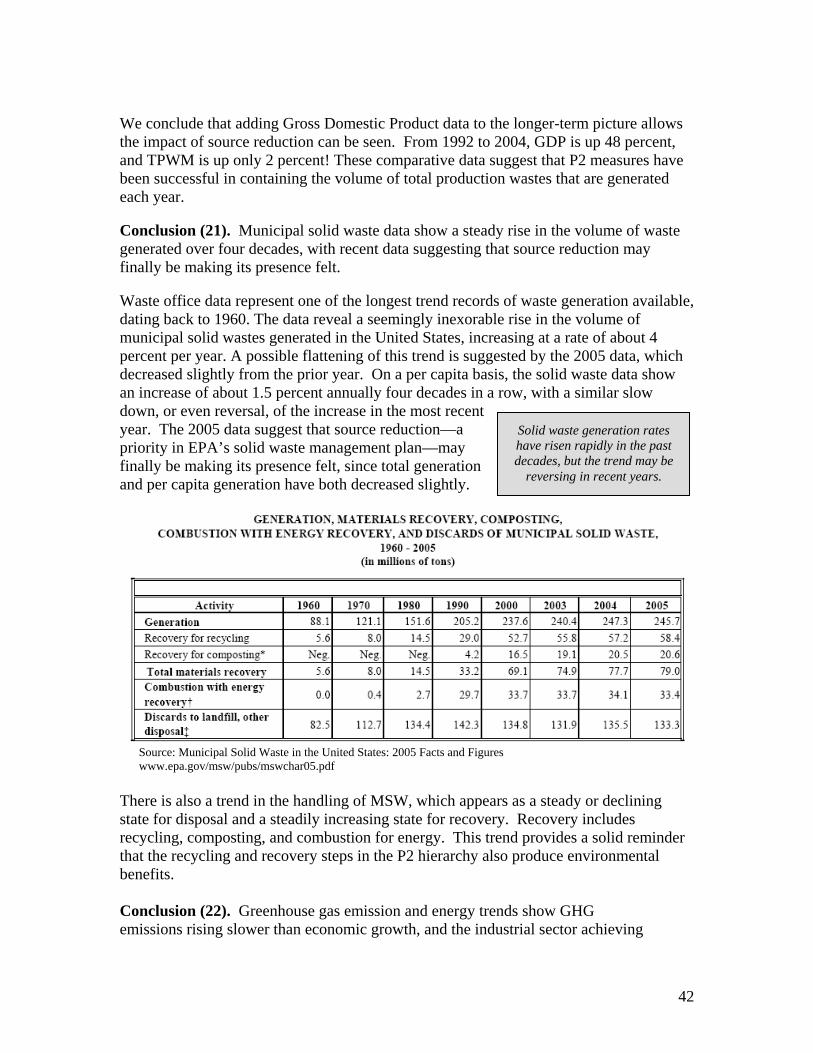
42
We conclude that adding Gross Domestic Product data to the longer-term picture allows the impact of source reduction can be seen. From 1992 to 2004, GDP is up 48 percent, and TPWM is up only 2 percent! These comparative data suggest that P2 measures have been successful in containing the volume of total production wastes that are generated each year. Conclusion (21). Municipal solid waste data show a steady rise in the volume of waste generated over four decades, with recent data suggesting that source reduction may finally be making its presence felt. Waste office data represent one of the longest trend records of waste generation available, dating back to 1960. The data reveal a seemingly inexorable rise in the volume of municipal solid wastes generated in the United States, increasing at a rate of about 4 percent per year. A possible flattening of this trend is suggested by the 2005 data, which decreased slightly from the prior year. On a per capita basis, the solid waste data show an increase of about 1.5 percent annually four decades in a row, with a similar slow down, or even reversal, of the increase in the most recent year. The 2005 data suggest that source reduction—a priority in EPA’s solid waste management plan—may finally be making its presence felt, since total generation and per capita generation have both decreased slightly.
Source: Municipal Solid Waste in the United States: 2005 Facts and Figures www.epa.gov/msw/pubs/mswchar05.pdf
There is also a trend in the handling of MSW, which appears as a steady or declining state for disposal and a steadily increasing state for recovery. Recovery includes recycling, composting, and combustion for energy. This trend provides a solid reminder that the recycling and recovery steps in the P2 hierarchy also produce environmental benefits. Conclusion (22). Greenhouse gas emission and energy trends show GHG emissions rising slower than economic growth, and the industrial sector achieving
Solid waste generation rates have risen rapidly in the past decades, but the trend may be
reversing in recent years.

43
an absolute reduction in GHG emissions. EPA GHG emission reduction data can be correlated to national GHG emission data. In 1990, EPA added an inventory of greenhouse gas emissions that covers all sectors of the economy, not just the industrial sector. EPA also produced a study in 2007 that analyzes trends in energy use since 1970 for many of the same sectors. Both of these data sources can be analyzed at a national and a sector level. Comparing each of these indicators with Gross Domestic Product data gives a sense of whether a sector has reduced GHG emissions and/or energy use relative to GDP. Comparing these data sets to each other could also point to whether a sector is using greener energy sources, as can be inferred from same-year data points showing a trend of GHG emissions down but energy use up. Electricity generation, transportation, and industry have consistently accounted for the bulk of the nation’s GHG emissions. The following two tables shows trends in all greenhouse gases expressed as carbon dioxide equivalents, and comparisons with Gross Domestic Product data. Greenhouse Gas Emissions Allocated to Economic Sectors
Economic Sector Measured in Tg CO2 Eq 1990 1995 2000 2001 2002 2003 2004 2005 Electricity Generation 1859.7 1989.5 2329.9 2292 2300.9 2330.3 2363.5 2429.9 Transportation 1523 1677.2 1903.2 1876.4 1931.2 1928.2 1982.6 2010.5 Industry 1470.9 1478.4 1443.5 1395.5 1380 1372.2 1403.8 1347.6 Agriculture 585.3 589.2 614.3 618.4 602.6 575.5 566.7 600.7 Commercial 417.8 420.5 415.5 406.6 413.7 433.5 432.6 431.4 Residential 351.3 375.1 393.6 383.6 382.7 404.8 391.6 380.7 US Territories 34.1 41.1 47.3 54.5 53.6 60 63.2 61.5 Total Emissions 6242.1 6571 7147.3 7027.1 7064.8 7104.4 7203.9 7262.3
Source: Trends in Greenhouse Gas Emissions, Table 2-14 www.epa.gov/climatechange/emissions/downloads07/07Trends.pdf

44
Comparison of Sector GHG Emissions with GDP 1990 2005 Change GDP 7112.5 GDP 11,003.4 Up 54 % Ind (G) 1470.9 Ind (G) 1,347.6 Down 8 % Com (G) 417.8 Com (G) 431.4 Up 3 % Res (G) 351.3 Res (G) 380.7 Up 8 % Tran (G) 1523.0 Tran (G) 2010.5 Up 32 % Elec (G) 1859.7 Elec (G) 2429.9 Up 31 % Agri (G) 585.3 Agri (G) 600.7 Up 3 % US Ter.(G) 34.1 USTer (G) 61.5 Up 80 % Total (G) fill in Fill in Up 16 %
Source: GDP from x source, GHG emissions from table above. Based on these trends, the industrial sector has the clear lead in lowering GHG emissions, having been the only sector to achieve an absolute reduction in emissions. The commercial and agricultural sectors follow next, having clearly slowed their increase in emissions relative to growth in GDP. Then comes the residential sector, also showing a pace of emission increases slower than economic growth. The transportation and electricity generation sectors show relatively less progress in slowing their rate of emissions. U.S. Territories show an increase in emissions that is greater than the overall growth of the economy. Further research would be needed to evaluate whether economic growth has impacted these sectors differently. Energy use. The following tables show energy use across four of the above sectors from 1970 to 2006, and comparisons with Gross Domestic Product data.
The industrial sector has decreased its greenhouse gas emissions, even as the rest of the economy has increased
emissions. Understanding how these reductions came about
could provide insights to apply to other sectors.
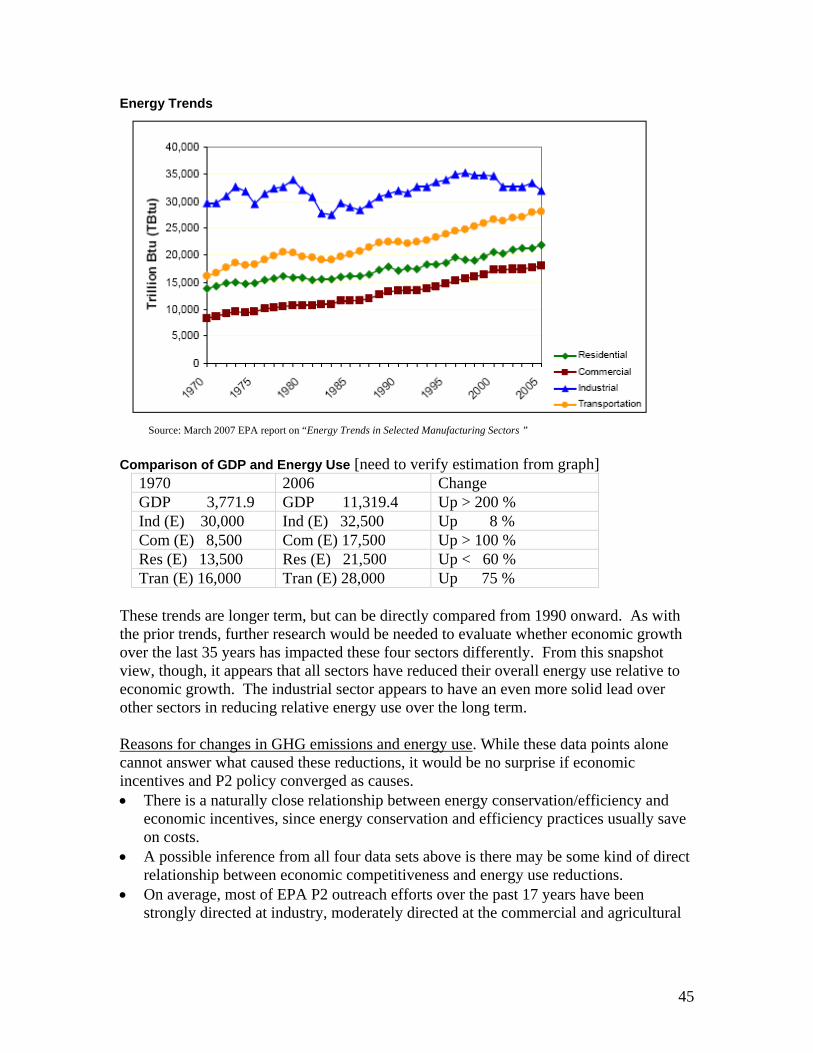
45
Energy Trends
Source: March 2007 EPA report on “Energy Trends in Selected Manufacturing Sectors ”
Comparison of GDP and Energy Use [need to verify estimation from graph]
1970 2006 Change GDP 3,771.9 GDP 11,319.4 Up > 200 % Ind (E) 30,000 Ind (E) 32,500 Up 8 % Com (E) 8,500 Com (E) 17,500 Up > 100 % Res (E) 13,500 Res (E) 21,500 Up < 60 % Tran (E) 16,000 Tran (E) 28,000 Up 75 %
These trends are longer term, but can be directly compared from 1990 onward. As with the prior trends, further research would be needed to evaluate whether economic growth over the last 35 years has impacted these four sectors differently. From this snapshot view, though, it appears that all sectors have reduced their overall energy use relative to economic growth. The industrial sector appears to have an even more solid lead over other sectors in reducing relative energy use over the long term. Reasons for changes in GHG emissions and energy use. While these data points alone cannot answer what caused these reductions, it would be no surprise if economic incentives and P2 policy converged as causes. • There is a naturally close relationship between energy conservation/efficiency and
economic incentives, since energy conservation and efficiency practices usually save on costs.
• A possible inference from all four data sets above is there may be some kind of direct relationship between economic competitiveness and energy use reductions.
• On average, most of EPA P2 outreach efforts over the past 17 years have been strongly directed at industry, moderately directed at the commercial and agricultural
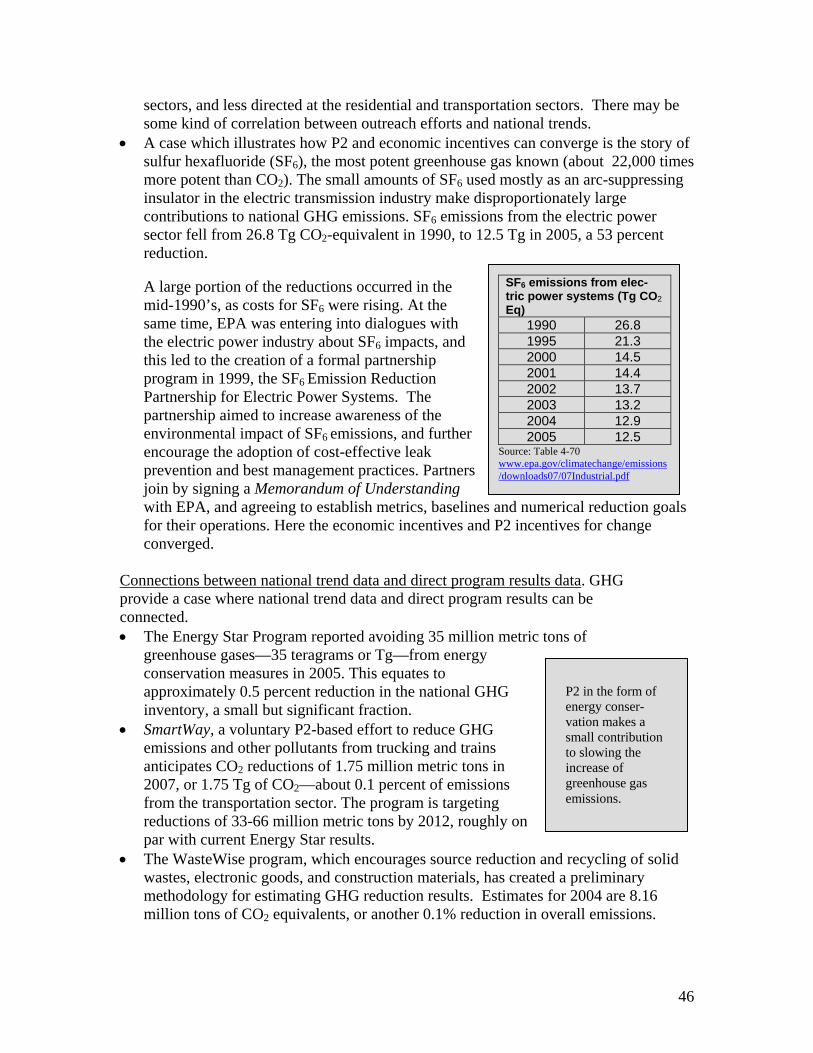
46
sectors, and less directed at the residential and transportation sectors. There may be some kind of correlation between outreach efforts and national trends.
• A case which illustrates how P2 and economic incentives can converge is the story of sulfur hexafluoride (SF6), the most potent greenhouse gas known (about 22,000 times more potent than CO2). The small amounts of SF6 used mostly as an arc-suppressing insulator in the electric transmission industry make disproportionately large contributions to national GHG emissions. SF6 emissions from the electric power sector fell from 26.8 Tg CO2-equivalent in 1990, to 12.5 Tg in 2005, a 53 percent reduction.
A large portion of the reductions occurred in the mid-1990’s, as costs for SF6 were rising. At the same time, EPA was entering into dialogues with the electric power industry about SF6 impacts, and this led to the creation of a formal partnership program in 1999, the SF6 Emission Reduction Partnership for Electric Power Systems. The partnership aimed to increase awareness of the environmental impact of SF6 emissions, and further encourage the adoption of cost-effective leak prevention and best management practices. Partners join by signing a Memorandum of Understanding with EPA, and agreeing to establish metrics, baselines and numerical reduction goals for their operations. Here the economic incentives and P2 incentives for change converged.
Connections between national trend data and direct program results data. GHG provide a case where national trend data and direct program results can be connected. • The Energy Star Program reported avoiding 35 million metric tons of
greenhouse gases—35 teragrams or Tg—from energy conservation measures in 2005. This equates to approximately 0.5 percent reduction in the national GHG inventory, a small but significant fraction.
• SmartWay, a voluntary P2-based effort to reduce GHG emissions and other pollutants from trucking and trains anticipates CO2 reductions of 1.75 million metric tons in 2007, or 1.75 Tg of CO2—about 0.1 percent of emissions from the transportation sector. The program is targeting reductions of 33-66 million metric tons by 2012, roughly on par with current Energy Star results.
• The WasteWise program, which encourages source reduction and recycling of solid wastes, electronic goods, and construction materials, has created a preliminary methodology for estimating GHG reduction results. Estimates for 2004 are 8.16 million tons of CO2 equivalents, or another 0.1% reduction in overall emissions.
P2 in the form of energy conser-vation makes a small contribution to slowing the increase of greenhouse gas emissions.
SF6 emissions from elec-tric power systems (Tg CO2 Eq)
1990 26.8 1995 21.3 2000 14.5 2001 14.4 2002 13.7 2003 13.2 2004 12.9 2005 12.5
Source: Table 4-70 www.epa.gov/climatechange/emissions/downloads07/07Industrial.pdf
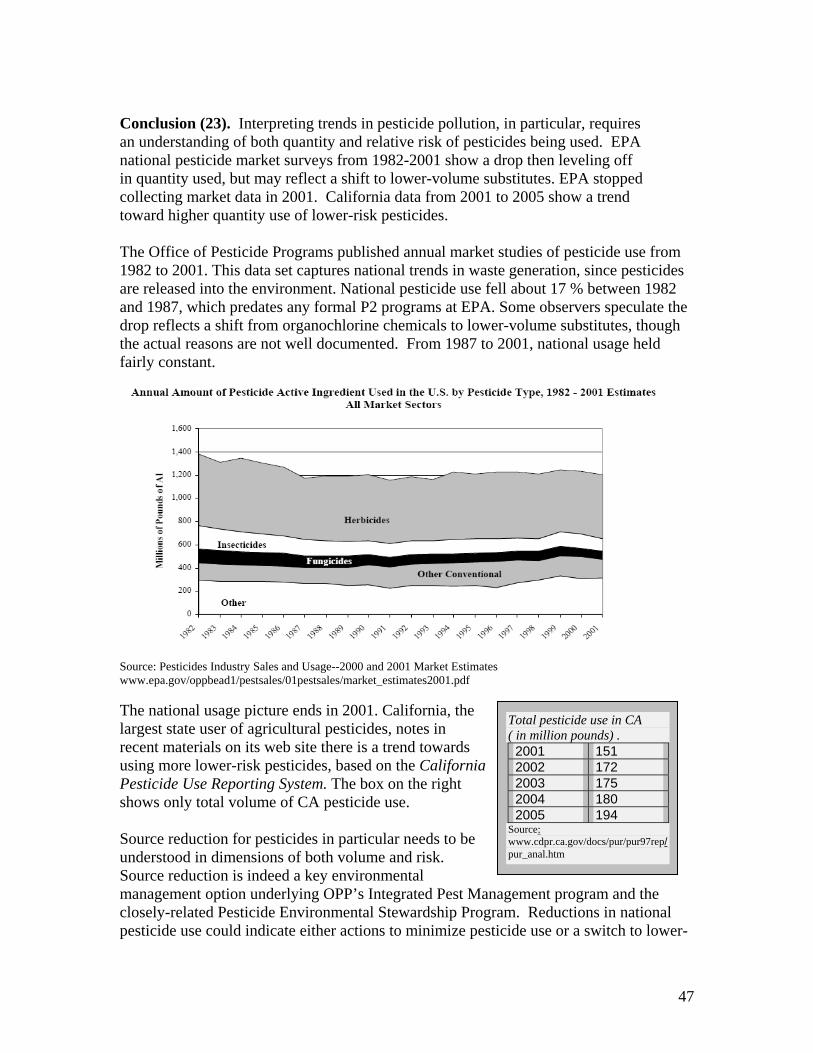
47
Conclusion (23). Interpreting trends in pesticide pollution, in particular, requires an understanding of both quantity and relative risk of pesticides being used. EPA national pesticide market surveys from 1982-2001 show a drop then leveling off in quantity used, but may reflect a shift to lower-volume substitutes. EPA stopped collecting market data in 2001. California data from 2001 to 2005 show a trend toward higher quantity use of lower-risk pesticides. The Office of Pesticide Programs published annual market studies of pesticide use from 1982 to 2001. This data set captures national trends in waste generation, since pesticides are released into the environment. National pesticide use fell about 17 % between 1982 and 1987, which predates any formal P2 programs at EPA. Some observers speculate the drop reflects a shift from organochlorine chemicals to lower-volume substitutes, though the actual reasons are not well documented. From 1987 to 2001, national usage held fairly constant.
Source: Pesticides Industry Sales and Usage--2000 and 2001 Market Estimates www.epa.gov/oppbead1/pestsales/01pestsales/market_estimates2001.pdf The national usage picture ends in 2001. California, the largest state user of agricultural pesticides, notes in recent materials on its web site there is a trend towards using more lower-risk pesticides, based on the California Pesticide Use Reporting System. The box on the right shows only total volume of CA pesticide use. Source reduction for pesticides in particular needs to be understood in dimensions of both volume and risk. Source reduction is indeed a key environmental management option underlying OPP’s Integrated Pest Management program and the closely-related Pesticide Environmental Stewardship Program. Reductions in national pesticide use could indicate either actions to minimize pesticide use or a switch to lower-
Total pesticide use in CA ( in million pounds) . 2001 151 2002 172 2003 175 2004 180 2005 194
Source: www.cdpr.ca.gov/docs/pur/pur97rep/pur_anal.htm

48
volume substitutes with possibly higher risk profiles. Increases in pesticide use might indicate a switch to high-volume substitutes with lower risk profiles. Conclusion (24). Fertilizer data from USDA show fertilizer use leveling off in the past decade. EPA’s Office of Water does not maintain a national database of nutrient budgets from agricultural sources, but USDA data are available to document national trends in fertilizer use since 1991. The USDA data reflect national trends in waste generation since fertilizers, like pesticides, are applied directly to the environment. As such, efforts to minimize pollution from fertilizer use aim for pollution prevention. As stated in the Office of Water’s 2003 publication, National Management Measures to Control Nonpoint Source Pollution from Agriculture:
While the nutrient management plan may have many components, the principle is simple: minimize total losses. . . .Effective nutrient management abates nutrient movement by minimizing the quantity of nutrients available for loss (source reduction). This is usually achieved by developing a nutrient budget for the crop, applying nutrients at the proper time with proper methods, applying only the types and amounts of nutrients necessary to produce a crop, and considering the environmental hazards of the site.
The reasons underlying the leveling-off of fertilizer use are not well-established, but the trends suggest another example of pollution prevention practices contributing to holding the line on overall increases. Conclusion (25). TRI source reduction data are helpful to understand sub-trends in relative use of source reduction among states and sectors, but in their current state are not usable to interpret quantitative national environmental trend data. In its 2001 Report, GAO analyzed TRI source reduction reports filed from 1991–1998. It found that the [slow but] steady decline in the number of facilities reporting P2 activity did not necessarily indicate a decline in the use or impact of P2 measures. GAO noted that companies may have begun with simple activities and moved on to more complex activities, that the amount of emissions reduced through P2 may not have gone down, and that P2 efforts tend to have ongoing emission reduction effects once implemented. GAO observed a decline in source reduction reporting from about a third of facilities reporting P2 activities in 1991 to about a fourth of facilities reporting P2 activities in 1998.
U.S. Fertilizer Consumption (thousands of tons) 1991 47,290 1992 47,794 1993 49,197 1994 52,319 1995 50,744 1996 53,604 1997 55,017 1998 54,954 1999 53,409 2000 53,540 2001 52,258 2002 52,999 2003 53,045 2004 57,830 2005 55,313
Source: USDA Economics Research Service www.ers.usda.gov/Data/FertilizerUse/Tables/Table3.xls

49
We have updated this analysis and can now observe that P2 reporting has continued to become less frequent since 1998, dropping down now to about 10% of facilities reporting annually. Our P2 Integration Assessment workgroup found three possible interpretations: industry is less focused on P2, industry is still focused but the easiest P2 steps have already been taken, or industry is just less avid in reporting P2. We sorted TRI source reduction data by state, chemical, and sector to make some additional observations. Some of the states with the highest rates of source reduction reporting have mandatory P2 reporting/planning programs. Nine of the ten chemicals with the highest reporting frequency are high-volume organic chemicals. For styrene, over 20% of TRI forms indicate source reduction. Only chromium compounds is inorganic. For industry sectors, the range is from a high of 20 % in the instruments sector, to less than 5 % for paper, and for metal and coal mining. Conclusion (26) Some gaps in media-specific environmental data exist for wastes generated, which is sometimes attributable to the delegated nature of the media program, and at other times attributable to methodological changes that makes trends difficult to track. Data gaps also exist for trends in the relative risk of releases. Other data sets from the 1980’s or earlier – inventories of post-treatment air emissions, water discharge data, and water quality data – do not account for total wastes generated. While the National Biennial RCRA Hazardous Waste Report reports nationally on hazardous waste generated, periodic administrative changes to reporting parameters make meaningful comparisons of annual data difficult. As just one example, the substantial change between 1995 and 1997 stems from reclassifying waste waters containing hazardous wastes as materials to be regulated under the Clean Water Act rather than RCRA. While we will not attempt to analyze trends in the relative risk of releases, this kind of data would provide more insight on the impact of pollution prevention. Substituting less hazardous chemicals for more hazardous ones is a pollution prevention activity.
Year Haz Waste (tons)
1991 305,708,881 1993 258,449,001 1995 214,092,505 1997 40,676,075 2001 40,026,050 2003 30,176,118 2005 38,347,011

50
1980 1985 1990 1995 2000 2005
National Trends Summary Between 1990 and 2000: GDP increased 38% Population increased 12.9% MSW increased 15.8% Fertilizer use increased 12.2% GHG emissions increased 14.5% MSW/capita increased 2.9% Pesticide use decreased 1.2% TPWM decreased 1.9% (from 1992-2004) Industrial GHG decreased 2.1% SF6 from electric power industry decreased 53%

51
Evaluation Question #4: What are the Agency’s current measurable goals for pollution prevention, especially pertaining to P2 integration? Agency goal setting is partially in accord with the P2 Act provision that directs EPA to identify, where appropriate, measurable goals reflecting P2 policy. The Agency has measurable goals for direct P2 activity, including various partnership activities across the Agency. Yet it would also seem appropriate to have measurable goals for P2 integration activities so EPA can track the total impact of P2 policy within the Agency. .In earlier days, the Agency had some P2 integration goals in its Pollution Prevention Strategy and in Strategic Plans. Now, P2 is discussed as a voluntary-only activity in Strategic Plans. Even though some partnership-based programs (such as the Climate Change Program) essentially set P2 goals, there is no widely accepted Agency methodology for setting up and tracking P2 goals across programs. Region 4 is an exception, where media programs have been setting P2 goals for a number of years. Conclusion (27) The Agency’s Strategic Plans, where Agency goals are presented, show a trend away from emphasizing or even acknowledging P2 integration. This affects goals relating to P2 integration. Recent Agency Strategic Plans characterize EPA as taking a fundamentally voluntary approach to P2, yet this represents something of a disconnect from the ongoing P2 integration activities that occur within the Agency. Before 2002, there were more explicit endorsements of P2 integration in Strategic Plans. Since then, the explicit endorsements have waned to the point that the Agency has now declared that it meets it P2 Act obligations through voluntary P2 approaches, although effective P2 integration work and further innovation have continued in some measure to enhance multimedia P2 outcomes, expanding into additional realms. The expansion of partnership programs plus the influence of GPRA/PART may be contributing to the Agency depicting in its Strategic Plans that P2 as a voluntary-only activity in the Agency, even at a time when Region 4 is doing planning and reporting for P2 integration.. The partnership programs have a substantial enough presence and provide a simpler planning model for establishing causation between activity and results, simpler than P2 integration would provide, which could involve sharing causation. In 1994, the strategic plan was full of promise for integrating P2 into all Agency programs, and over time that assertion has diminished to its present form, which is a statement that EPA intends to meet its P2 goals through voluntary partnerships. There have been five strategic plans, and the trend is like a straight line that moves in a steady progression from one end of the spectrum to the other. The plans themselves are sufficiently detailed to make this progression tellingly clear. The 1994 plan in particular is rich in detail, which we present here. At one end of the spectrum is the first strategic planning document in response to GPRA, the 1994-1999 Strategic Plan. This plan plainly states the Agency’s intention to integrate P2 into all Agency activities. EPA will work to prevent pollution by: incorporating

52
prevention into the Agency's mainstream environmental programs. . .During the next five years, EPA will lead the nation in reorienting efforts to reduce and eliminate pollution at the source. [P2] will be the first strategy considered for all programs at EPA. The Agency meant “all programs” to be inclusive, as clearly portrayed in the specific headquarter and regional details in the plan. Similar entries to those below appear in the plan for other regions, ORD, OECA, OCEPA (Public Affairs), OIA, OPPE (Policy), OPPTS, OSWER, and OW.
• OAR will emphasize P2 throughout its programs as the first choice in environmental protection, taking into account health and environmental impacts. The CAAA provides opportunities for making P2 a routine consideration in carrying out air programs and reinforcing the major efforts already underway. [Example] a strategy of flexible permits will enable . . .sources to commit to P2 as part of compliance strategy.
• OARM will provide the tools and infrastructure to implement the ecosystem and P2 approaches to environmental protection. [OARM will facilitate removing institutional barriers] in the budget, information systems and data, organizational structures, and assistance programs.
• OGC continues to provide a critical role in identifying the flexibility within EPA's statutory authorities to adopt P2 opportunities in EPA regulations, policies, permits, guidance documents, and compliance activities.
• OPP [will reduce] the use of pesticides by removing higher-risk pesticides from the market, and accelerating regulatory decisions on safer pesticides and promoting increased use of integrated pest management techniques….the pesticides program’s P2 priorities will focus on promoting sustainable agriculture.
• Region 1's P2 strategy mandates annual division workplans of new and ongoing efforts to integrate P2 into all EPA activities, flexible negotiation of state and tribal grants, and development of prevention measures.
• Region 4 will incorporate P2 into its internal regulatory operations through opportunities identified by the Region 4 P2 network. With a separate regional office P2 focus group, Region 4 will build P2 into daily office activities and work with the Government Service Administration to make the new Atlanta Federal Building a model of environmental efficiency.
The trend to the other end of the spectrum began slowly. The 1997-2002 plan still placed P2 prominently as a guiding principle for senior management, and as a specific goal (P2 and reducing risk in communities, homes, workplaces and ecosystems) with a numeric outcome target and a numeric behavioral target (e.g., all states would have strong P2 programs). The 2000-2005 plan maintains Goal 4 on P2 with similar numeric outcome targets and a new behavioral target specifically for P2 integration, emphasizes tackling high-priority pollutants through P2 and other means, and flags “cost-effective P2 options and control options” as ways to address indoor and urban air pollution. The 2003-2008 plan is a turning point, the first to present P2 as primarily a voluntary-only activity, largely limited to a discrete set of P2 programs. It collapses the previous ten goals into five, and P2 is subsumed under the emerging concept of environmental stewardship (which covers both compliance and beyond compliance behavior like source reduction). The disbanding of the high-level P2 Policy Staff in late 2001, which had a strong mission-oriented focus on developing P2 language for high-level planning
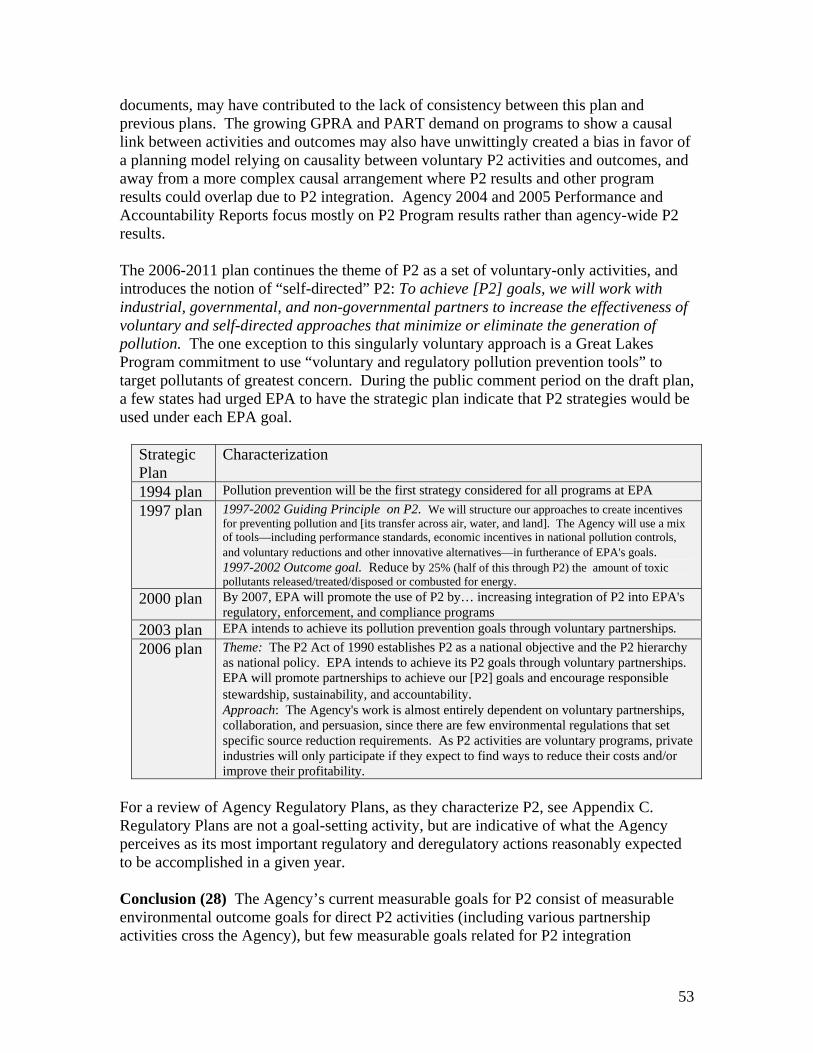
53
documents, may have contributed to the lack of consistency between this plan and previous plans. The growing GPRA and PART demand on programs to show a causal link between activities and outcomes may also have unwittingly created a bias in favor of a planning model relying on causality between voluntary P2 activities and outcomes, and away from a more complex causal arrangement where P2 results and other program results could overlap due to P2 integration. Agency 2004 and 2005 Performance and Accountability Reports focus mostly on P2 Program results rather than agency-wide P2 results. The 2006-2011 plan continues the theme of P2 as a set of voluntary-only activities, and introduces the notion of “self-directed” P2: To achieve [P2] goals, we will work with industrial, governmental, and non-governmental partners to increase the effectiveness of voluntary and self-directed approaches that minimize or eliminate the generation of pollution. The one exception to this singularly voluntary approach is a Great Lakes Program commitment to use “voluntary and regulatory pollution prevention tools” to target pollutants of greatest concern. During the public comment period on the draft plan, a few states had urged EPA to have the strategic plan indicate that P2 strategies would be used under each EPA goal.
Strategic Plan
Characterization
1994 plan Pollution prevention will be the first strategy considered for all programs at EPA 1997 plan 1997-2002 Guiding Principle on P2. We will structure our approaches to create incentives
for preventing pollution and [its transfer across air, water, and land]. The Agency will use a mix of tools—including performance standards, economic incentives in national pollution controls, and voluntary reductions and other innovative alternatives—in furtherance of EPA's goals. 1997-2002 Outcome goal. Reduce by 25% (half of this through P2) the amount of toxic pollutants released/treated/disposed or combusted for energy.
2000 plan By 2007, EPA will promote the use of P2 by… increasing integration of P2 into EPA's regulatory, enforcement, and compliance programs
2003 plan EPA intends to achieve its pollution prevention goals through voluntary partnerships. 2006 plan Theme: The P2 Act of 1990 establishes P2 as a national objective and the P2 hierarchy
as national policy. EPA intends to achieve its P2 goals through voluntary partnerships. EPA will promote partnerships to achieve our [P2] goals and encourage responsible stewardship, sustainability, and accountability. Approach: The Agency's work is almost entirely dependent on voluntary partnerships, collaboration, and persuasion, since there are few environmental regulations that set specific source reduction requirements. As P2 activities are voluntary programs, private industries will only participate if they expect to find ways to reduce their costs and/or improve their profitability.
For a review of Agency Regulatory Plans, as they characterize P2, see Appendix C. Regulatory Plans are not a goal-setting activity, but are indicative of what the Agency perceives as its most important regulatory and deregulatory actions reasonably expected to be accomplished in a given year. Conclusion (28) The Agency’s current measurable goals for P2 consist of measurable environmental outcome goals for direct P2 activities (including various partnership activities cross the Agency), but few measurable goals related for P2 integration
54
activities. Even though several program use a common indicator for greenhouse gas emission reductions, there are generally no other common indicators for use in setting P2 integration goals across the Agency. Region 4 is an exception, where media programs have been setting P2 goals for a number of years. EPA’s 2006-2011 Strategic Plan contains quantified P2 outcome goals for the P2 Program, OSW’s National Partnership for Environmental Priorities, and OECA Supplemental Environmental Projects. (See Sub-objective 5.2 -- Prevent pollution and promote environmental stewardship). Evaluation Question #5. What is the Agency’s current methodology for measuring P2, especially with respect to P2 integration? The current methodology for measuring P2 has been developed primarily for direct P2 activities, and is based on measuring reduced quantities of environmental stressors such as pounds of pollution (to all media), million metric tons of carbon equivalent (MMTCE) reduced (for greenhouse gases, an important sub-category of pollutants), gallons of water saved, and costs saved from the adoption of P2 practices. Of these indicators, only the greenhouse gas indicator (inherently P2-based) is widely used in the Agency. The other indicators are not broadly used in Agency media programs, except in Region 4. Conclusion (29) The methodology for measuring results from direct P2 activities is based on pounds of hazardous pollutants and materials reduced, million metric tons of carbon equivalent reduced, BTUs of energy reduced, gallons of water saved, and dollars saved from P2 practices. The methodology for measuring the results from P2 integration activities is generally not yet established, except for greenhouse gas emission reductions, and in cases where some voluntary programs and Region 4 media programs use the same P2-based measures for certain activities. Environmental results for direct P2 actions are measured as reductions in pollutant releases to all media, and in water and energy conserved. P2 results are basically not measurable in ambient environmental terms, because monitoring costs would be prohibitive. It is generally accepted that the highest available level in EPA’s hierarchy of indicators for measuring P2 results is at the level of measuring changes in quantities of environmental stressors – that is, pounds of pollutants reduced, tons of greenhouse gases reduced, gallons of water saved, and cost savings from the adoption of P2 practices. Relative risk can be factored into pounds of pollution reduced only to the extent of distinguishing between pollutants that are regulated (being the more hazardous) and those that are not (municipal and industrial solid waste). Pounds of pollution prevented are not consistently reported on a chemical-by-chemical basis. An exception to this rule is a list of priority pollutants identified for voluntary reductions by the waste program that are measured as a subset of pollutant reductions. Baselines for measuring environmental results from direct P2 actions are generally accepted as needing to start at zero (zero pounds of pollutants reduced, zero gallons of

55
water conserved, etc.), with each succeeding year adding a quantity of pollutants reduced or cost-savings achieved. The alternative – of trying to quantify total national pollution from which to subtract pollutant reductions – is generally not feasible because current reporting is inadequate for this purpose, modeling costs would be prohibitive, and causality links to Agency P2 efforts would be too indirect. An exception to this conclusion is that total national greenhouse gas (GHG) emissions are modeled and Agency GHG results can easily be correlated to national GHG figures. Turning to P2 integration results, the methodology used for measuring direct P2 results is generally not replicated in programs where P2 integration occurs, and the differing program methodologies make it difficult to identify their P2 integration results. Several exceptions exist where programs do employ methodologies based on reducing quantities of environmental stressors, and this provides some basis for identifying P2 integration results. These exceptions include the broad Agency use of a standard GHG emission reduction measure, the use by various partnership programs of pollutant reduction and water conservation measures (partnership programs sometimes present a gray area between direct P2 activities and P2 integration activities), the use of a solid-waste-generation rate measure by the waste program (although not easily linked to direct P2 integration activities), and the use of pollutant reduction and water gallons conserved by Region 4 air and water programs. But generally speaking, pollutant reductions attributable to media programs’ P2 regulatory options, P2 permitting incentives, P2 guidance materials and tools, and P2-oriented grants are either lumped together with non-P2 emission reductions, or are not reported because program measures are focused on a different level of environmental indicator. An example of the former are air toxics emissions, where the measurement methodology uses a comparable indicator (reduced quantities of environmental stressors), but doesn’t distinguish between control-based and pollution-based emission reductions (total reduced tons of air toxics emissions). An example of the latter is the water program’s general lack of stressor-based indicators (except for nitrogen and phosphorous nutrient loadings) and general use of health-based and ecological-based indicators (e.g., raising the percentages of shellfish-growing acres approved for use, raising the percentage of communities with drinking water meeting health-based standards),and ambient-based indicators (e.g., increasing the number of watersheds whose assessed water segments meet water quality standards). Another example of the latter is the waste program’s administrative indicator for hazardous waste management, which is to increase the number of facilities with hazardous waste permits. Evaluation Q #5a. Do Agency methods for measuring P2 conform with the P2 Act provision, “Establish standard methods of measurement for source reduction”?
Conclusion (30) The Agency has established standard methods of measuring pollution prevention, but they are mostly applied to direct P2 activities, and not P2 integration activities, with the exception of the greenhouse gas reduction measure, and pollutant reduction and water gallons conserved measures used by some partnership programs and the Region 4 air and water programs. The Agency’s measurement methodology for P2 is
56
based on reductions in environmental stressors, with supplemental administrative behavior change measures to solidify the credibility of Agency P2 results. The Agency developed its methodology in consultation with States, which strengthens the standardization of Agency methodology.. The Agency will need to examine which methodologies to employ for measuring its P2 integration results broadly. The Agency has used this methodology for several years, and reviews it for continuous improvement. This methodology has been used by the Agency mostly for measuring the results of direct P2 activities, and the similar State methodology has been used to measure a range of P2 activities, including some that could be characterized as P2 integration.

57
Chapter 4 Recommendations Based on the results of this Agency self-evaluation, we have found a variety of possible recommendations for Agency managers. Any or all of these suggestions could be set in motion now, with some being achievable in the short term, some requiring more steps towards achievement in the longer term. Before going into these recommendations, we would like to underscore the perennial value of pollution prevention in the ongoing evolution of Agency policy goals. As the Agency embraces a stewardship policy, on the path from pollution control to pollution prevention and sustainability, pollution prevention retains its vitality as a policy goal. Stewardship emphasizes the role played by each individual person and organization in bringing about environmental improvements, sustainability emphasizes the importance of simultaneously achieving environmental, social, and economic goals – and there’s also chemical site security, which as a piece of homeland security emphasizes achieving the security of hazardous chemicals stored in large quantities, in part through shifting to less hazardous chemicals – through them all, pollution prevention has a constant and vital policy presence. The environmental challenges that remain, even after the substantial progress achieved in recent decades, appear bigger in scale and scope than challenges of the past. The choices made thus far have taken us a long way towards keeping many waste materials, especially industrial waste, out of our air and water. But these same choices have only tinkered at the margins of the waste generation processes themselves. The focus on chemical security will continue shaping materials handling decisions for years to come. If hazardous materials can be minimized – or even eliminated – from an industrial process through P2 measures, then potential security concerns regarding the material are minimized or eliminated as well. As new and increasingly exotic materials and nano-materials are introduced into commerce, both the opportunities for and the importance of preventing waste at the source will likely increase. Tackling greenhouse gases calls for shifting to green energy sources and using energy more efficiently and, as possible, more conservatively. The G8 group of national leaders recently announced a goal for “substantial cuts” to greenhouse gas emissions by 2050, a goal clearly beyond slowing down the rate of increase or even holding a straight line, a goal that seemingly can only be achieved through very ambitious pollution prevention efforts. Without a large dose of P2, we are unlikely to make substantial enough changes to our “wasteful ways” to bring about a notably more materials-efficient and energy-efficient society.

58
Recommendations 1. We recommend that the Agency take short-term action on several steps to improve the implementation of pollution prevention policy.
(a) Update key Agency policy documents to renew the Agency commitment to integrating pollution prevention across the Agency. An updated expression of why P2 integration matters to not only the implementation of the P2 Act but also to the implementation of stewardship, sustainability, and chemical site security policies would go a long way toward harmonizing Agency policies, and bringing coherence to a set of operating principles. Even a few simple statements in the policy documents easiest to amend now would set the stage for later, more thorough and detailed harmonization of policies.
− Update the Agency P2 policy to reaffirm P2 as an agency priority and to
articulate its relationship to sustainability, environmental stewardship, and chemical security.
− Strengthen the role of P2 integration in the Agency semi-annual Regulatory Agenda, annual Performance Accountability Reports, and annual National Program Manager guidance for various programs.
(b) Reaffirm existing procedures for prompting regulatory workgroups to consider source reduction during regulatory development and to the way the Agency tracks the P2 aspects of regulatory development. This includes use of a manager’s charge to address source reduction options, workgroup consideration of source reduction in the analytic blueprint for each regulatory development action, and identification of P2 steps in the RAPIDS database.
2. Review the Agency’s information collection practices pertaining to P2, with the aim of improving overall ease of data collection, coordination between systems, and availability of information once collected.
(a) Examine options for removing some constraints on Agency use of surveys to enhance the implementation of pollution prevention policy. The hurdles for getting approval of survey questions on source reduction practices are still high for the Agency. In the regulatory setting, inability to gather data on source reduction practices from industry can eliminate the opportunity for developing a P2 option for the performance standard. In the non-regulatory setting, inability to gather measurement data on source reduction outcomes which resulted from Agency intervention inhibits the implementation of pollution prevention policy in program planning and program management. (b) Conduct a thorough overview of information collection efforts pertaining to waste generation and pollution prevention to identify options for increasing our

59
understanding or P2 progress. Consider: (i) Why do we have national waste generation trend data for some programs and not for others? (ii) How can EPA create scalability between national data and EPA program data? (iii) Should TRI-style data collection be expanded beyond the industrial sector to provide a fuller picture of chemical releases and reductions?
3. Address the need for meaningful P2 guidance in the Agency’s Economic Impact Analysis Guidance.
Where P2 regulatory options would lead to highly variable compliance responses based on site-specific, process-specific needs of a facility, predicting compliance responses is difficult for purposes of estimating the economic impacts of a rule. But not all P2 regulatory options would lead to highly variable compliance responses – a less difficult case would be the substitution of flowcoater technology for spray gun technology for applying surface coatings. It would be helpful to the implementation of pollution prevention policy if economic impact analysis guidance addressed the type of P2 regulatory options that will likely have sufficient uniformity of compliance responses to enable their estimation. It would be further helpful to the implementation of P2 policy if these estimated economic impacts of P2 options attributed the economic savings associated with the P2 option to the rule, instead of disregarding them on the assumption that facilities implement all cost-saving options on their own. Counting the P2 option savings would be especially important for offsetting P2 option costs.
4. We recommend that the Agency begin in the short term two processes for more thoroughly improving the implementation of pollution prevention policy.
(a) Begin a multi-office consultative process on the development of the Agency 2009-2014 Strategic Plan, for the purpose of strengthening the role of P2 integration, and the harmonization of P2 policy with stewardship, sustainability, and chemical site security policies, in the 2009 Plan and its strategic goals.
(b) Begin an inclusive headquarters and regional Agency process to choose methodologies for measuring P2 integration activities, since P2 integration is important enough to measure. Given the near-term challenge in measuring P2 outcomes from activities that report to various strategic goals, consider using the PPA provisions on P2 integration as a checklist, using internal behavior change measures, using an office scorecard, and laying groundwork for tracking P2 results in media programs.
5. We recommend that the Agency also begin longer-term processes for addressing more far-reaching positive improvements in the implementation of pollution prevention policy. We recommend taking on two or more of the following issues.
60
(a) Explore whether there is any transferability of the air program’s regulatory
approaches – that remove at least one regulatory barrier to P2 for a broad class of standards at a time – to the water or waste programs. Three rules of the air program, one final and two proposed, apply to broader classes of industry than covered in individual industry-based emission standards. In particular, the proposed flexible permitting rule and the proposed amendments to general provisions of national emission standards for hazardous air pollutants would, when final, remove some degree of regulatory inflexibility, a barrier to P2, for many of the nation’s industrial businesses emitting hazardous air pollutants. The scale of positive impact on source reduction practices will be potentially much greater than the Agency has been able to achieve through individual environmental performance standards. It would be worth exploring whether there is any potential for likewise creating P2 incentives on a broad scale in the water or waste regulatory programs.
(b) Explore options for measuring the environmental outcome results from P2
integration efforts Agency-wide. Environmental outcome measures are more relevant to the public, yet most P2 integration environmental results are currently tracked under Agency goals like Clean Air and Clean Water (and not under the Agency’s Pollution Prevention goal), so they are not distinguishable from the non-P2 integration results also reported under these goals.
− Possible advantages to tracking outcome results for the aggregate of Agency
P2 integration efforts include: (i) better establishing the relevance of the P2 policy tool; (ii) providing a fuller set (in combination with P2 Program results) of EPA P2 outcome results; (iii) providing a basis for comparing P2 integration results and P2 Program results, and comparing P2 integration results and Agency results broadly; (iv)helping establish a basis for assessing the effectiveness of this unequaled legislative policy tool for designing consistent policy across EPA programs; (v) providing cyclical feedback for planning and managing P2 integration, and providing Agency planners a solid reference point for P2 integration for use during high-level and mid-level planning operations; (vi) providing important results feedback to state and tribal co-regulators, and agency partners and stakeholders; (vii) possibly providing a link, depending on other factors, to national environmental outcomes.
(c) Explore ways to assess the effectiveness of NPDES Inspection Manual guidance
on conducting on-site P2 assessments, and P2 options in “waste” programs.
(d) Explore whether there are ways to assess the effectiveness of NPDES permitting provision on best management practices for P2 and the effectiveness of the Pretreatment Program in fostering P2 approaches.

61
Appendix A This appendix lists all data sources used as evidence in the evaluation. Links to web sites or electronic files for these data sources are in Appendix B, whose tables provide more room for these references.
Data Source Time-frame
# of Data Point
s
Potential Bias Utility/Limitations
CONCLUSION 1
Rule and Policy Info. Development System (RAPIDS) database
1996-2006
492
There are a large # of Not Applicable check-off’s and blanks in response to the P2 question. Possible bias towards No’s, from including the N/A’s with No’s.
Allows for a comparison between the number of rule developments that considered P2 and the total number of rule developments, in a relevant time period. Limitation: RAPIDS just provides a simple Yes/No/N/A on whether P2 will be considered during rule development. Potential biases may influence comparison results.
Pollution Prevention in Regulations: The Source Reduction Review Project – An Assessment
1996 1 Potential bias toward internal perspective due to having been conducted internally, although several independent sources have cited its value.
Allows for a baseline understanding of what the Agency has perceived as the obstacles to promoting P2 through regulations. Also allows for a comparison between these 1996 assessment recommendations and the Agency’s subsequent P2 integration performance.
Proposed Flexible Air Permitting Rule
9/12/2007
1 Bias not a factor. Contributes to quantifying how often EPA considers P2 in rulemaking; provides a view on the issue not captured in the RAPIDS database approach of asking how often regulatory workgroups consider source reduction. Also provides a view of a comprehensive way to promote P2 through rules, and contributes to tracking a step-wise progression towards policy coherence between air permitting and P2.
2003 Proposed Amendment to General Provisions of the National Emission Standards for Hazardous Air Pollutants
2003 1
Bias not a factor Similar utility as the 2007 proposed flexible permitting rule in helping to quantify how often EPA considers P2 in rulemaking. Also provides a view of a comprehensive way to promote P2 through rules. Limitation: It is not clear how the P2 incentives in the 2003 proposal would be intact if the 2007 proposal went forward.
2007 Proposed Rule, National Emission Standards for Hazardous Air Pollutants, General Provisions
2007 1 Bias not a factor. Similar utility as the 2003 proposal in helping to quantify how often EPA considers P2 in rulemaking, and in providing a view of proposed comprehensive change.. Limitation: It is not clear how the P2 incentives in the 2003 proposal would be intact if the 2007proposal went forward.
Examples of technical and procedural rule-makings that set no emission standards, extrapolated from the Fall 2006
2006 Potential bias towards Allows initial corroboration of “Not Applicable” answers to tracking question, “Has P2 been considered in this rulemaking?”. Limitations – based on generalized knowledge, not in-depth review of example rules, so may
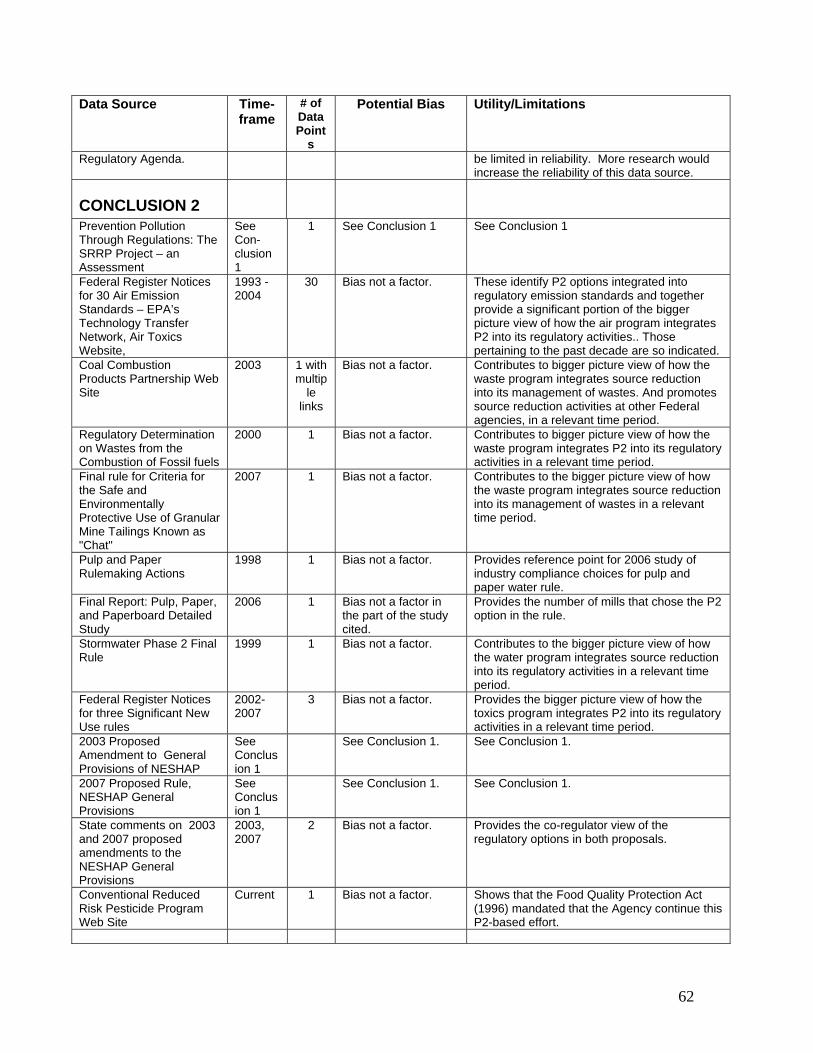
62
Data Source Time-frame
# of Data Point
s
Potential Bias Utility/Limitations
Regulatory Agenda. be limited in reliability. More research would increase the reliability of this data source.
CONCLUSION 2
Prevention Pollution Through Regulations: The SRRP Project – an Assessment
See Con-clusion 1
1 See Conclusion 1 See Conclusion 1
Federal Register Notices for 30 Air Emission Standards – EPA’s Technology Transfer Network, Air Toxics Website,
1993 - 2004
30 Bias not a factor. These identify P2 options integrated into regulatory emission standards and together provide a significant portion of the bigger picture view of how the air program integrates P2 into its regulatory activities.. Those pertaining to the past decade are so indicated.
Coal Combustion Products Partnership Web Site
2003 1 with multip
le links
Bias not a factor. Contributes to bigger picture view of how the waste program integrates source reduction into its management of wastes. And promotes source reduction activities at other Federal agencies, in a relevant time period.
Regulatory Determination on Wastes from the Combustion of Fossil fuels
2000 1 Bias not a factor. Contributes to bigger picture view of how the waste program integrates P2 into its regulatory activities in a relevant time period.
Final rule for Criteria for the Safe and Environmentally Protective Use of Granular Mine Tailings Known as "Chat"
2007 1 Bias not a factor. Contributes to the bigger picture view of how the waste program integrates source reduction into its management of wastes in a relevant time period.
Pulp and Paper Rulemaking Actions
1998 1 Bias not a factor. Provides reference point for 2006 study of industry compliance choices for pulp and paper water rule.
Final Report: Pulp, Paper, and Paperboard Detailed Study
2006 1 Bias not a factor in the part of the study cited.
Provides the number of mills that chose the P2 option in the rule.
Stormwater Phase 2 Final Rule
1999 1 Bias not a factor. Contributes to the bigger picture view of how the water program integrates source reduction into its regulatory activities in a relevant time period.
Federal Register Notices for three Significant New Use rules
2002-2007
3 Bias not a factor. Provides the bigger picture view of how the toxics program integrates P2 into its regulatory activities in a relevant time period.
2003 Proposed Amendment to General Provisions of NESHAP
See Conclusion 1
See Conclusion 1. See Conclusion 1.
2007 Proposed Rule, NESHAP General Provisions
See Conclusion 1
See Conclusion 1. See Conclusion 1.
State comments on 2003 and 2007 proposed amendments to the NESHAP General Provisions
2003, 2007
2 Bias not a factor. Provides the co-regulator view of the regulatory options in both proposals.
Conventional Reduced Risk Pesticide Program Web Site
Current 1 Bias not a factor. Shows that the Food Quality Protection Act (1996) mandated that the Agency continue this P2-based effort.

63
Data Source Timeframe # of Data
Points Potential Bias Utility/Limitations
Multi-Year Workplan for the Registration of Conventional Pesticides
2001, 2003-3006
5 Bias not a factor. Provides the raw data for calculating the percentage of pesticide registrations that are for reduced-risk use of pesticides. This allows the impact of the program’s source reduction incentive for pesticide registrations to be assessed.
D.C. Circuit Court opinion on the Hospital/Medical/ Infectious Waste Incineration Rule.
1999 1 Bias not a factor. Provides an independent view of stakeholders’ interest in having P2 steps for mercury addressed in the medical waste incinerator rule, which tends to verify the relevance of the Hospitals for a Healthy Environment partnership program to the rule.
Air program’s web site for the medical waste incineration rule (linkage to Hospitals for a Healthy Environ-ment (H2E) web site).
Current 1 Bias not a factor. “Related web site” link on the air program’s web site for the medical waste incineration rule goes to the Memorandum of Understanding supporting the H2E partnership program, providing another indication of the relationship of the program to the rule.
Memorandum of Understanding to Establish the National Vehicle Mercury Switch Recovery Program
2006 1 Bias not a factor. Reveals an intention by EPA and other parties to coordinate the agreed-to P2 activity with regulatory requirements.
National Vehicle Mercury Switch Recovery Program web site
Current 1 Demonstrates the maintenance of the agreement achieved by EPA and other parties to jointly conduct a P2 activity that is coordinated with regulatory activity.
CONCLUSION 3
EPA Guidelines for Preparing Economic Analyses
2000 1 Can be compared with the application of these guidelines in the Economic Impact Analysis of the Boat Manufacturing NESHAP.
Environmental Impact Analysis (EIA) for the Boat Manufacturing NESHAP
2001 1 Limited data set may be biased towards not counting P2 cost savings; yet representative of P2-technology-specific data sets.
Demonstrates an interpretation of the 2000 Guidelines on Preparing Economic Analyses. A limitation is the small size of the data set.
CONCLUSION 4
State Experience Integrating Pollution Prevention into Permits
1995 1 No apparent bias, prepared by an EPA contractor.
Provides a view of an early point in the air program’s consideration of how to integrate P2 into permitting. It is not a totally comprehensive study of all state experiences.
Evaluation of Implementation Experiences with
1993-2001
6 Although data may be biased towards better
Shows the air program taking a program evaluation step before writing a rule approving a technique often used in
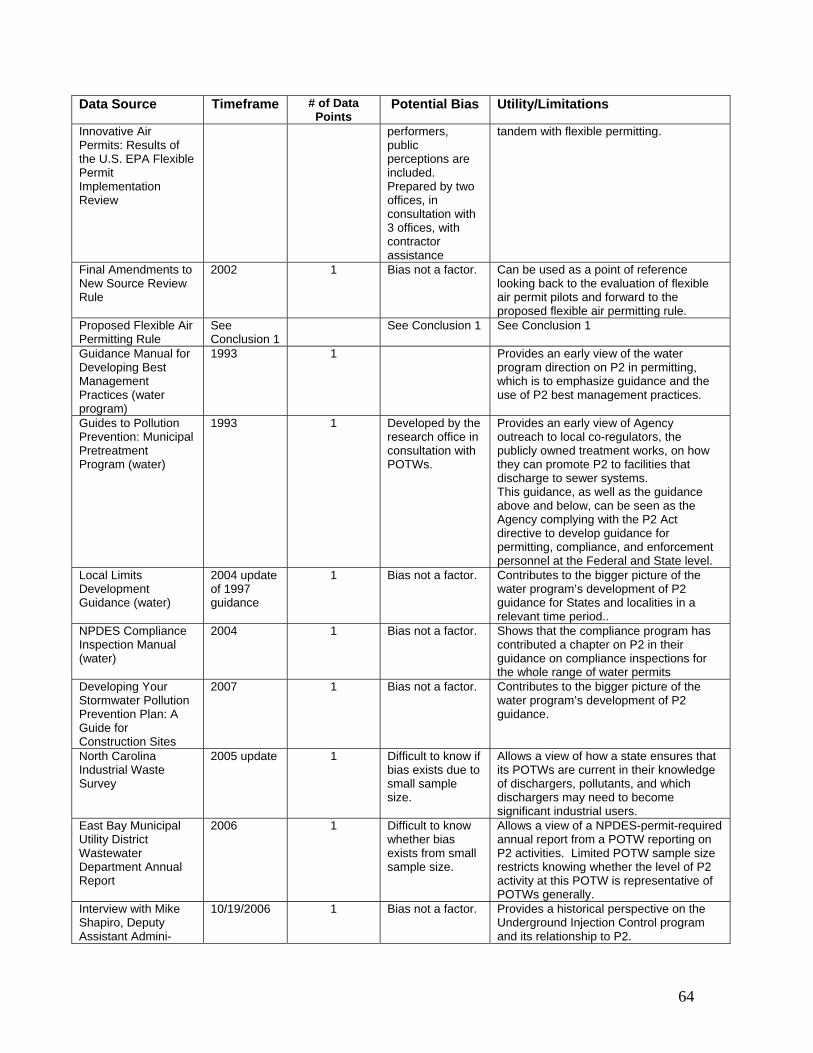
64
Data Source Timeframe # of Data Points
Potential Bias Utility/Limitations
Innovative Air Permits: Results of the U.S. EPA Flexible Permit Implementation Review
performers, public perceptions are included. Prepared by two offices, in consultation with 3 offices, with contractor assistance
tandem with flexible permitting.
Final Amendments to New Source Review Rule
2002 1 Bias not a factor. Can be used as a point of reference looking back to the evaluation of flexible air permit pilots and forward to the proposed flexible air permitting rule.
Proposed Flexible Air Permitting Rule
See Conclusion 1
See Conclusion 1 See Conclusion 1
Guidance Manual for Developing Best Management Practices (water program)
1993 1 Provides an early view of the water program direction on P2 in permitting, which is to emphasize guidance and the use of P2 best management practices.
Guides to Pollution Prevention: Municipal Pretreatment Program (water)
1993 1 Developed by the research office in consultation with POTWs.
Provides an early view of Agency outreach to local co-regulators, the publicly owned treatment works, on how they can promote P2 to facilities that discharge to sewer systems. This guidance, as well as the guidance above and below, can be seen as the Agency complying with the P2 Act directive to develop guidance for permitting, compliance, and enforcement personnel at the Federal and State level.
Local Limits Development Guidance (water)
2004 update of 1997 guidance
1 Bias not a factor. Contributes to the bigger picture of the water program’s development of P2 guidance for States and localities in a relevant time period..
NPDES Compliance Inspection Manual (water)
2004 1 Bias not a factor. Shows that the compliance program has contributed a chapter on P2 in their guidance on compliance inspections for the whole range of water permits
Developing Your Stormwater Pollution Prevention Plan: A Guide for Construction Sites
2007 1 Bias not a factor. Contributes to the bigger picture of the water program’s development of P2 guidance.
North Carolina Industrial Waste Survey
2005 update 1 Difficult to know if bias exists due to small sample size.
Allows a view of how a state ensures that its POTWs are current in their knowledge of dischargers, pollutants, and which dischargers may need to become significant industrial users.
East Bay Municipal Utility District Wastewater Department Annual Report
2006 1 Difficult to know whether bias exists from small sample size.
Allows a view of a NPDES-permit-required annual report from a POTW reporting on P2 activities. Limited POTW sample size restricts knowing whether the level of P2 activity at this POTW is representative of POTWs generally.
Interview with Mike Shapiro, Deputy Assistant Admini-
10/19/2006 1 Bias not a factor. Provides a historical perspective on the Underground Injection Control program and its relationship to P2.
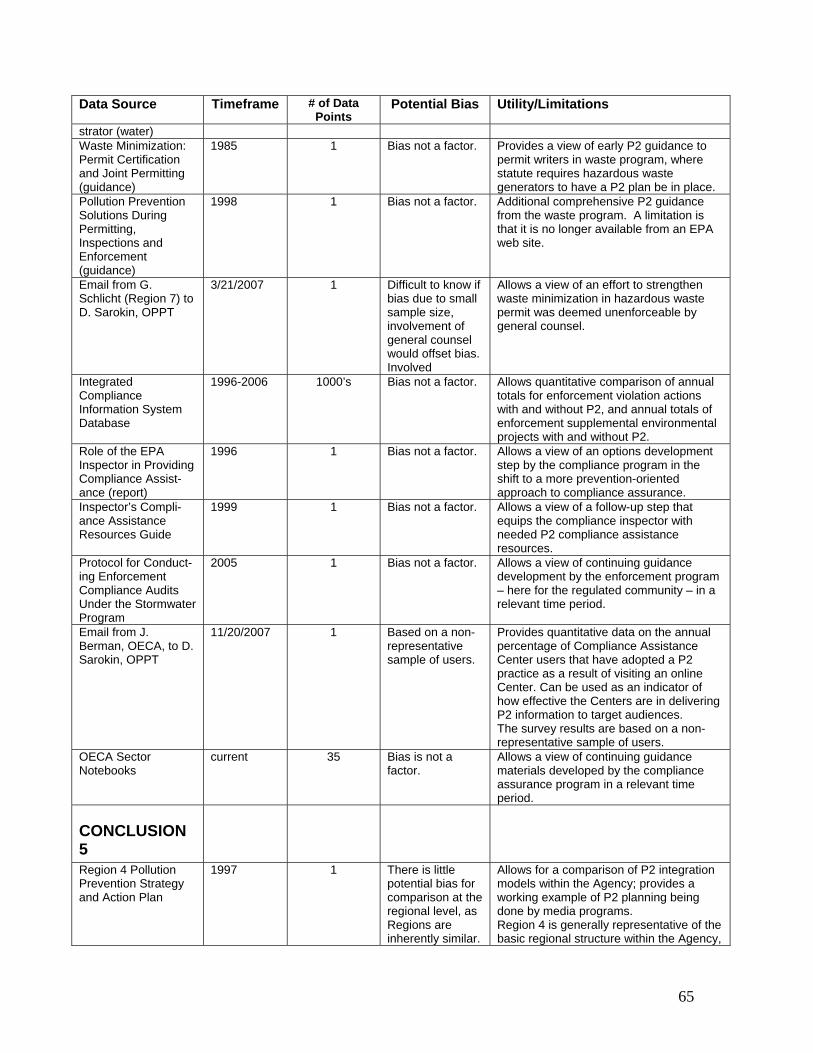
65
Data Source Timeframe # of Data Points
Potential Bias Utility/Limitations
strator (water) Waste Minimization: Permit Certification and Joint Permitting (guidance)
1985 1 Bias not a factor. Provides a view of early P2 guidance to permit writers in waste program, where statute requires hazardous waste generators to have a P2 plan be in place.
Pollution Prevention Solutions During Permitting, Inspections and Enforcement (guidance)
1998 1 Bias not a factor. Additional comprehensive P2 guidance from the waste program. A limitation is that it is no longer available from an EPA web site.
Email from G. Schlicht (Region 7) to D. Sarokin, OPPT
3/21/2007 1 Difficult to know if bias due to small sample size, involvement of general counsel would offset bias. Involved
Allows a view of an effort to strengthen waste minimization in hazardous waste permit was deemed unenforceable by general counsel.
Integrated Compliance Information System Database
1996-2006 1000’s Bias not a factor. Allows quantitative comparison of annual totals for enforcement violation actions with and without P2, and annual totals of enforcement supplemental environmental projects with and without P2.
Role of the EPA Inspector in Providing Compliance Assist-ance (report)
1996 1 Bias not a factor. Allows a view of an options development step by the compliance program in the shift to a more prevention-oriented approach to compliance assurance.
Inspector’s Compli-ance Assistance Resources Guide
1999 1 Bias not a factor. Allows a view of a follow-up step that equips the compliance inspector with needed P2 compliance assistance resources.
Protocol for Conduct-ing Enforcement Compliance Audits Under the Stormwater Program
2005 1 Bias not a factor. Allows a view of continuing guidance development by the enforcement program – here for the regulated community – in a relevant time period.
Email from J. Berman, OECA, to D. Sarokin, OPPT
11/20/2007 1 Based on a non-representative sample of users.
Provides quantitative data on the annual percentage of Compliance Assistance Center users that have adopted a P2 practice as a result of visiting an online Center. Can be used as an indicator of how effective the Centers are in delivering P2 information to target audiences. The survey results are based on a non-representative sample of users.
OECA Sector Notebooks
current 35 Bias is not a factor.
Allows a view of continuing guidance materials developed by the compliance assurance program in a relevant time period.
CONCLUSION 5
Region 4 Pollution Prevention Strategy and Action Plan
1997 1 There is little potential bias for comparison at the regional level, as Regions are inherently similar.
Allows for a comparison of P2 integration models within the Agency; provides a working example of P2 planning being done by media programs. Region 4 is generally representative of the basic regional structure within the Agency,
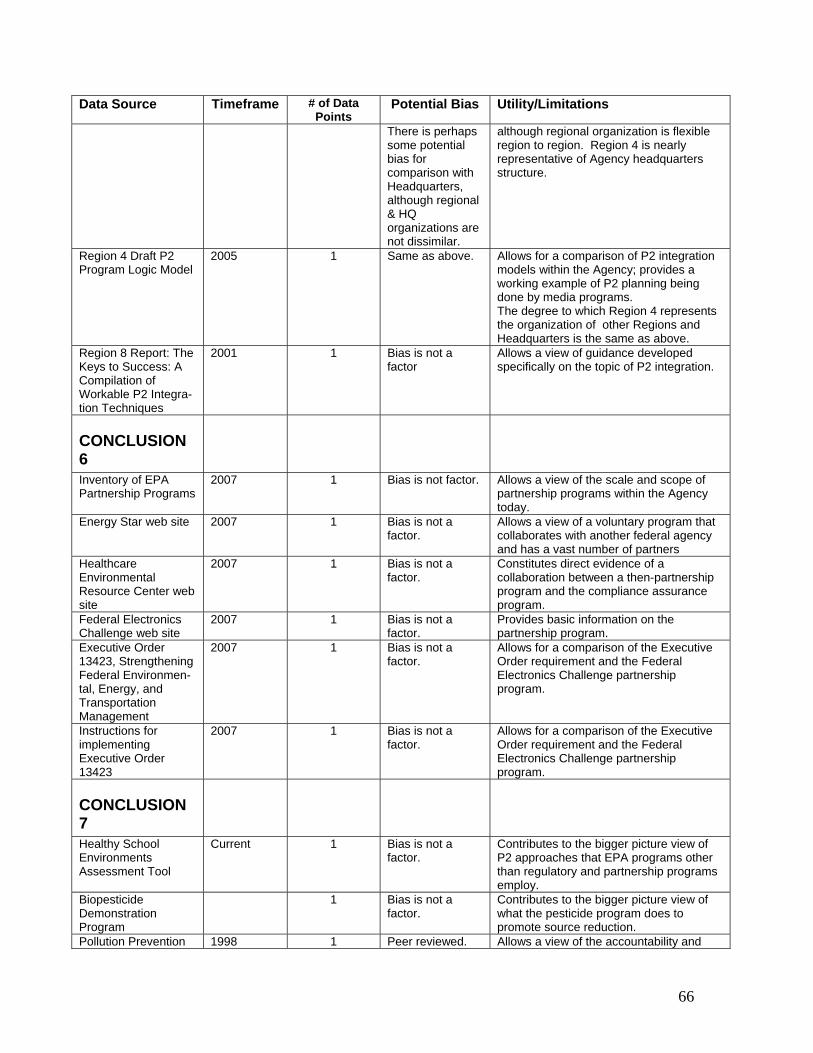
66
Data Source Timeframe # of Data Points
Potential Bias Utility/Limitations
There is perhaps some potential bias for comparison with Headquarters, although regional & HQ organizations are not dissimilar.
although regional organization is flexible region to region. Region 4 is nearly representative of Agency headquarters structure.
Region 4 Draft P2 Program Logic Model
2005 1 Same as above. Allows for a comparison of P2 integration models within the Agency; provides a working example of P2 planning being done by media programs. The degree to which Region 4 represents the organization of other Regions and Headquarters is the same as above.
Region 8 Report: The Keys to Success: A Compilation of Workable P2 Integra-tion Techniques
2001 1 Bias is not a factor
Allows a view of guidance developed specifically on the topic of P2 integration.
CONCLUSION 6
Inventory of EPA Partnership Programs
2007 1 Bias is not factor. Allows a view of the scale and scope of partnership programs within the Agency today.
Energy Star web site 2007 1 Bias is not a factor.
Allows a view of a voluntary program that collaborates with another federal agency and has a vast number of partners
Healthcare Environmental Resource Center web site
2007 1 Bias is not a factor.
Constitutes direct evidence of a collaboration between a then-partnership program and the compliance assurance program.
Federal Electronics Challenge web site
2007 1 Bias is not a factor.
Provides basic information on the partnership program.
Executive Order 13423, Strengthening Federal Environmen-tal, Energy, and Transportation Management
2007 1 Bias is not a factor.
Allows for a comparison of the Executive Order requirement and the Federal Electronics Challenge partnership program.
Instructions for implementing Executive Order 13423
2007 1 Bias is not a factor.
Allows for a comparison of the Executive Order requirement and the Federal Electronics Challenge partnership program.
CONCLUSION 7
Healthy School Environments Assessment Tool
Current 1 Bias is not a factor.
Contributes to the bigger picture view of P2 approaches that EPA programs other than regulatory and partnership programs employ.
Biopesticide Demonstration Program
1 Bias is not a factor.
Contributes to the bigger picture view of what the pesticide program does to promote source reduction.
Pollution Prevention 1998 1 Peer reviewed. Allows a view of the accountability and
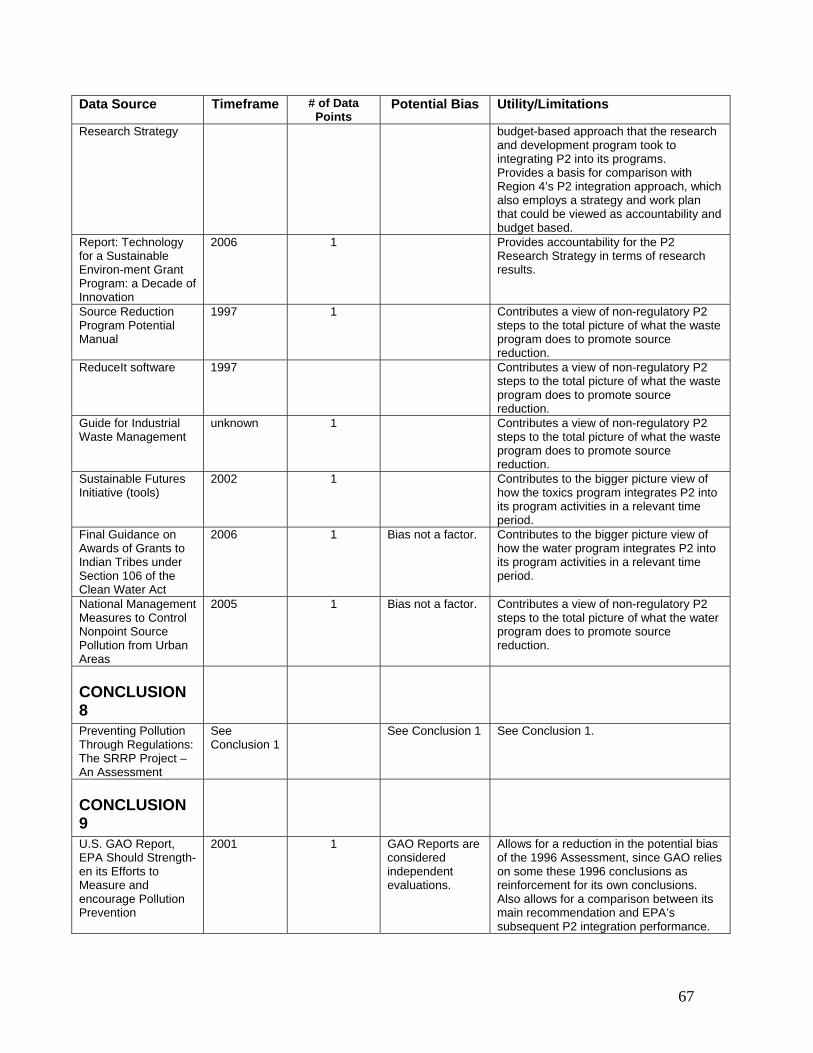
67
Data Source Timeframe # of Data Points
Potential Bias Utility/Limitations
Research Strategy budget-based approach that the research and development program took to integrating P2 into its programs. Provides a basis for comparison with Region 4’s P2 integration approach, which also employs a strategy and work plan that could be viewed as accountability and budget based.
Report: Technology for a Sustainable Environ-ment Grant Program: a Decade of Innovation
2006 1 Provides accountability for the P2 Research Strategy in terms of research results.
Source Reduction Program Potential Manual
1997 1 Contributes a view of non-regulatory P2 steps to the total picture of what the waste program does to promote source reduction.
ReduceIt software 1997 Contributes a view of non-regulatory P2 steps to the total picture of what the waste program does to promote source reduction.
Guide for Industrial Waste Management
unknown 1 Contributes a view of non-regulatory P2 steps to the total picture of what the waste program does to promote source reduction.
Sustainable Futures Initiative (tools)
2002 1 Contributes to the bigger picture view of how the toxics program integrates P2 into its program activities in a relevant time period.
Final Guidance on Awards of Grants to Indian Tribes under Section 106 of the Clean Water Act
2006 1 Bias not a factor. Contributes to the bigger picture view of how the water program integrates P2 into its program activities in a relevant time period.
National Management Measures to Control Nonpoint Source Pollution from Urban Areas
2005 1 Bias not a factor. Contributes a view of non-regulatory P2 steps to the total picture of what the water program does to promote source reduction.
CONCLUSION 8
Preventing Pollution Through Regulations: The SRRP Project – An Assessment
See Conclusion 1
See Conclusion 1 See Conclusion 1.
CONCLUSION 9
U.S. GAO Report, EPA Should Strength-en its Efforts to Measure and encourage Pollution Prevention
2001 1 GAO Reports are considered independent evaluations.
Allows for a reduction in the potential bias of the 1996 Assessment, since GAO relies on some these 1996 conclusions as reinforcement for its own conclusions. Also allows for a comparison between its main recommendation and EPA’s subsequent P2 integration performance.
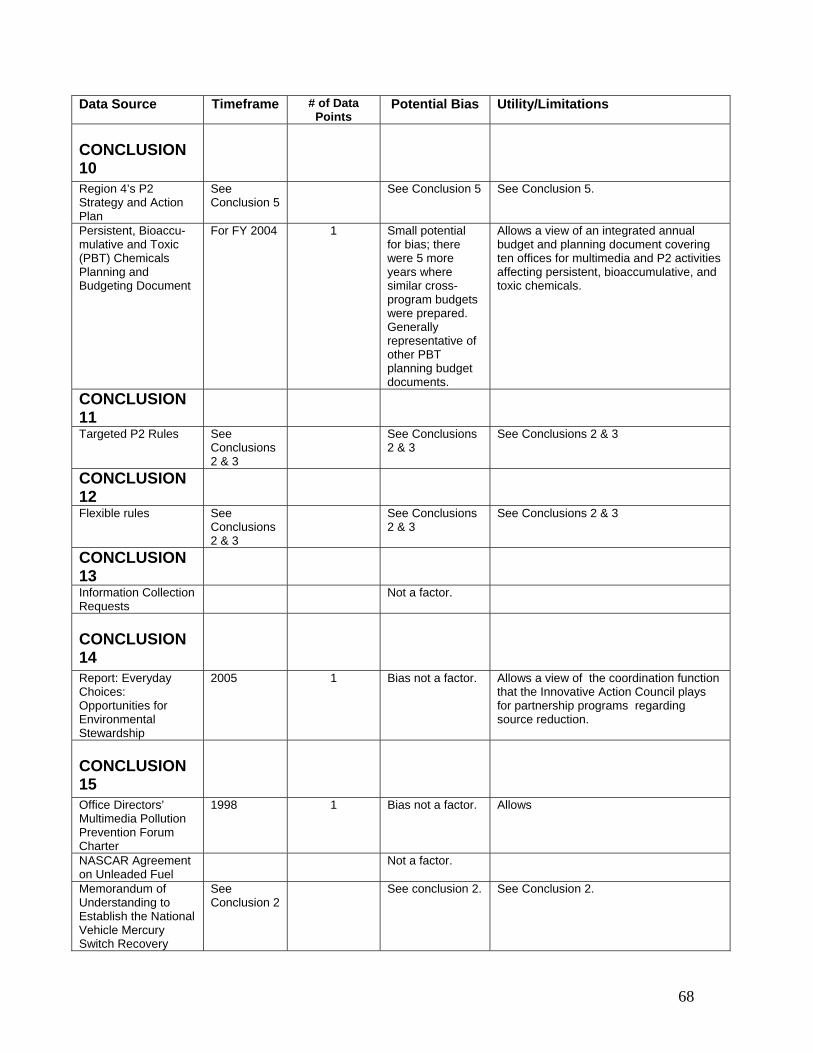
68
Data Source Timeframe # of Data Points
Potential Bias Utility/Limitations
CONCLUSION 10
Region 4’s P2 Strategy and Action Plan
See Conclusion 5
See Conclusion 5 See Conclusion 5.
Persistent, Bioaccu-mulative and Toxic (PBT) Chemicals Planning and Budgeting Document
For FY 2004
1 Small potential for bias; there were 5 more years where similar cross-program budgets were prepared. Generally representative of other PBT planning budget documents.
Allows a view of an integrated annual budget and planning document covering ten offices for multimedia and P2 activities affecting persistent, bioaccumulative, and toxic chemicals.
CONCLUSION 11
Targeted P2 Rules See Conclusions 2 & 3
See Conclusions 2 & 3
See Conclusions 2 & 3
CONCLUSION 12
Flexible rules See Conclusions 2 & 3
See Conclusions 2 & 3
See Conclusions 2 & 3
CONCLUSION 13
Information Collection Requests
Not a factor.
CONCLUSION 14
Report: Everyday Choices: Opportunities for Environmental Stewardship
2005 1 Bias not a factor. Allows a view of the coordination function that the Innovative Action Council plays for partnership programs regarding source reduction.
CONCLUSION 15
Office Directors’ Multimedia Pollution Prevention Forum Charter
1998 1 Bias not a factor. Allows
NASCAR Agreement on Unleaded Fuel
Not a factor.
Memorandum of Understanding to Establish the National Vehicle Mercury Switch Recovery
See Conclusion 2
See conclusion 2. See Conclusion 2.

69
Data Source Timeframe # of Data Points
Potential Bias Utility/Limitations
Program CONCLUSION 16
Email attachment describing Environmental Assistance Network
Not a factor.
CONCLUSION 17
Pollution Prevention Research Strategy
See Conclusion 7
See Conclusion 7.
See Conclusion 7.
CONCLUSION 18
Incorporating EPA’s P2 Strategy into the Environmental Review Process
1993 1 Not a factor.
Executive Order 13423 and Instructions for Implementation
See Conclusion 6
See Conclusion 6.
See Conclusion 6.
CONCLUSION 19
P2 Coordination Not a factor
CONCLUSION 20
Toxics Release Inventory
1998, 2004 2 Bias towards TRI-listed chemicals and sectors and companies with more than 10 employees.
Provides a national view of total production wastes generated, and a basis for comparing wastes generated to economic growth. There are limitations on the data because not all wastes are required to be reported.
Statistical Abstracts of the United States
1992-2004 24 None. Viewed as the authoritative and comprehensive summary of statistics on the social, political, and economic organization of the United States.
Provides the authoritative national statistics on economic growth, which provide a basis for comparing economic growth with total national wastes generated.
CONCLUSION 21
Municipal Solid Waste in the U.S: 2005 Facts, Figures
1960-2005 8 The materials flow methodology used is preferred
The consistency of the Agency’s methodology and scope over time for measuring municipal solid waste makes
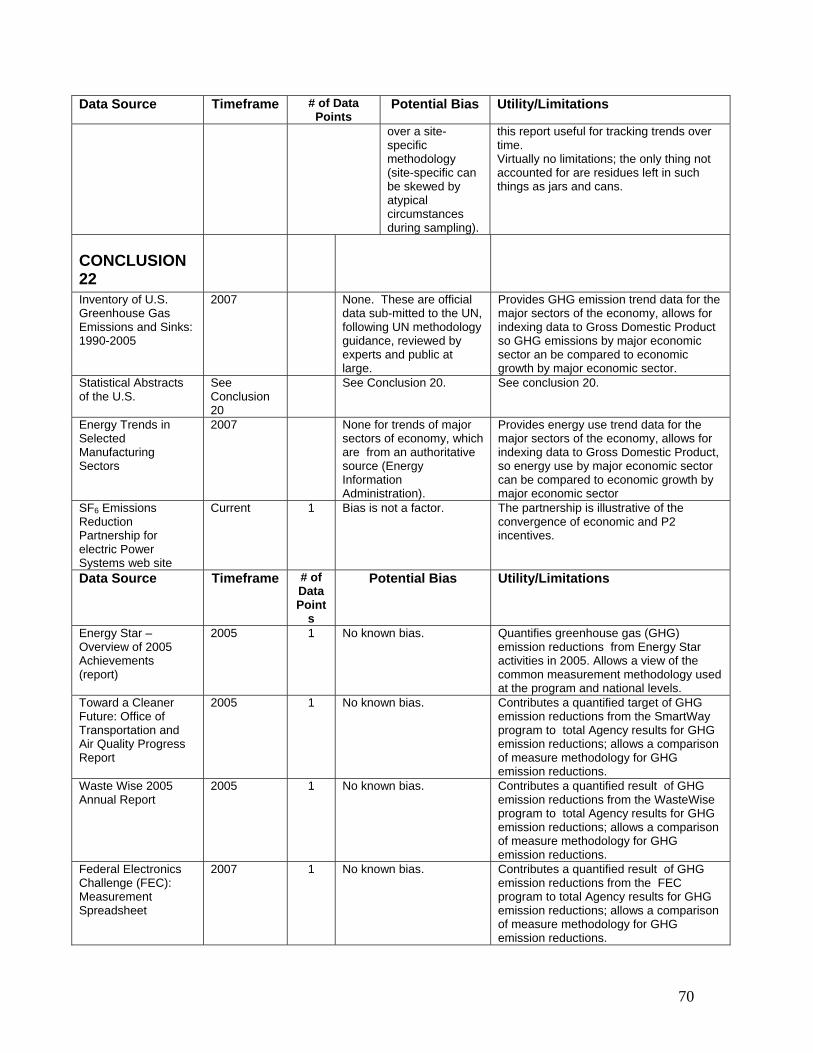
70
Data Source Timeframe # of Data Points
Potential Bias Utility/Limitations
over a site-specific methodology (site-specific can be skewed by atypical circumstances during sampling).
this report useful for tracking trends over time. Virtually no limitations; the only thing not accounted for are residues left in such things as jars and cans.
CONCLUSION 22
Inventory of U.S. Greenhouse Gas Emissions and Sinks: 1990-2005
2007 None. These are official data sub-mitted to the UN, following UN methodology guidance, reviewed by experts and public at large.
Provides GHG emission trend data for the major sectors of the economy, allows for indexing data to Gross Domestic Product so GHG emissions by major economic sector an be compared to economic growth by major economic sector.
Statistical Abstracts of the U.S.
See Conclusion 20
See Conclusion 20. See conclusion 20.
Energy Trends in Selected Manufacturing Sectors
2007 None for trends of major sectors of economy, which are from an authoritative source (Energy Information Administration).
Provides energy use trend data for the major sectors of the economy, allows for indexing data to Gross Domestic Product, so energy use by major economic sector can be compared to economic growth by major economic sector
SF6 Emissions Reduction Partnership for electric Power Systems web site
Current 1 Bias is not a factor. The partnership is illustrative of the convergence of economic and P2 incentives.
Data Source Timeframe # of Data Point
s
Potential Bias Utility/Limitations
Energy Star – Overview of 2005 Achievements (report)
2005 1 No known bias. Quantifies greenhouse gas (GHG) emission reductions from Energy Star activities in 2005. Allows a view of the common measurement methodology used at the program and national levels.
Toward a Cleaner Future: Office of Transportation and Air Quality Progress Report
2005 1 No known bias. Contributes a quantified target of GHG emission reductions from the SmartWay program to total Agency results for GHG emission reductions; allows a comparison of measure methodology for GHG emission reductions.
Waste Wise 2005 Annual Report
2005 1 No known bias. Contributes a quantified result of GHG emission reductions from the WasteWise program to total Agency results for GHG emission reductions; allows a comparison of measure methodology for GHG emission reductions.
Federal Electronics Challenge (FEC): Measurement Spreadsheet
2007 1 No known bias. Contributes a quantified result of GHG emission reductions from the FEC program to total Agency results for GHG emission reductions; allows a comparison of measure methodology for GHG emission reductions.

71
Data Source Timeframe # of Data Points
Potential Bias Utility/Limitations
Electronic Product Environment Assessment Tool (EPEAT): Measurement Spreadsheet
2007 1 No known bias. Contributes a quantified result of GHG emission reductions from the EPEAT program to total Agency results for GHG emission reductions; allows a comparison of measure methodology for GHG emission reductions.
CONCLUSION 23
Pesticide Industry Sales and Usage 2000 and 2001 Market Estimates
1982-2001 19 Difficult to assess bias. Allows a view of national pesticide sales and use (quantities of active ingredient) on an annual basis. Uses best available information from the public domain and proprietary sources. The numbers in the report represent approximate values rather than precise values. Contributes to big picture view of national data that can be assessed for the impact of source reduction practices.
California Department of Pesticide Regulation: Analysis of Pesticide Use Trends
2001-2005 5 Bias as a surrogate stems from limited data set.
Provides a surrogate for national pesticide use trends. Limitations on data methodology are stated in the reports. Contributes to big picture view of national data that can be assessed for the impact of source reduction practices.
CONCLUSION 24
USDA Economic Research Service Data Set – U.S. Fertilizer Use and Price
1990-2005 15 Allows a view of national trends in fertilizer use. Contributes to big picture view of national data that can be assessed for the impact of source reduction practices.
National Management Measures to Control Non-point Source Pollution from Agriculture
2003 1 No known bias. Allows an interpretation of efforts to minimize pollution from fertilizer use necessarily involving a P2 orientation.
Data Source Timeframe # of Data
Points
Potential Bias Utility/Limitations
CONCLUSION 25
US GAO, 2001 Report
2001 8 None. GAO reports are viewed as independent.
Allows for a comparison in analyzing earlier and later reporting trends for TRI source reduction reporting
ics Release Inventory – Source Reduction Data
1991-2005 14 Bias towards TRI-listed chemicals and sectors and companies with more than 10 employees.
Allows for a comparison of year-to-year reporting trends, and sub-trends within sectors and States. There are limitations on the data because not all wastes are required to be reported.
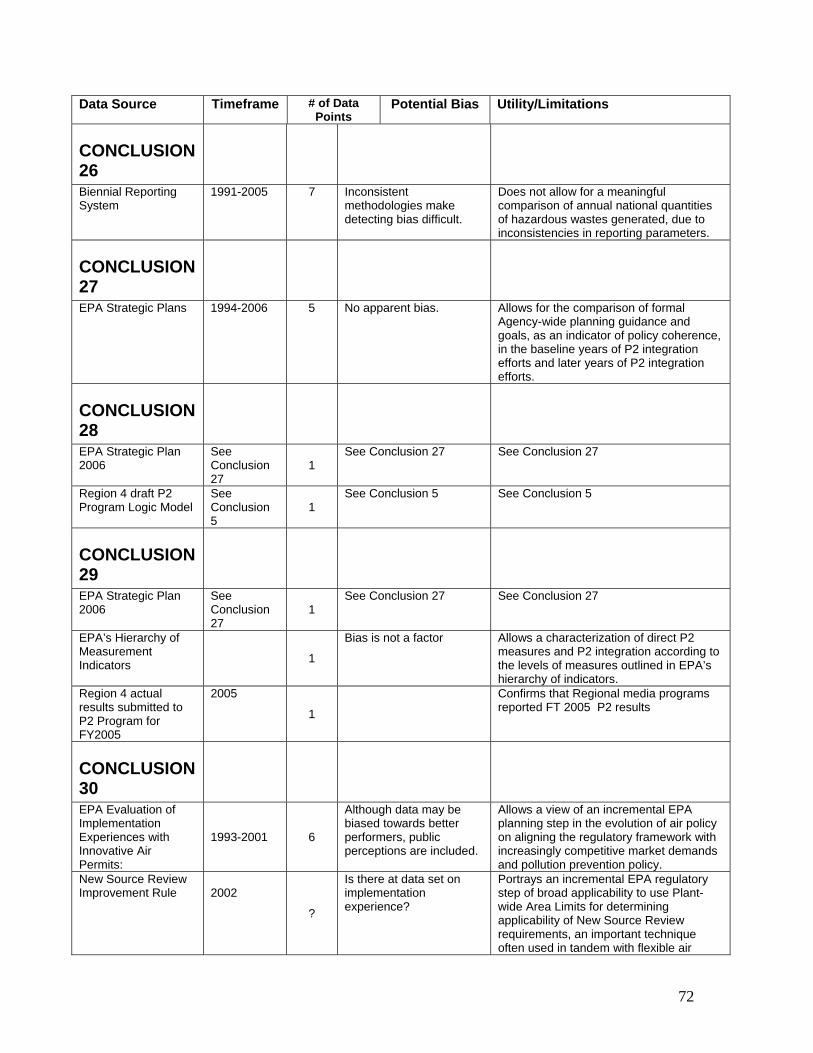
72
Data Source Timeframe # of Data Points
Potential Bias Utility/Limitations
CONCLUSION 26
Biennial Reporting System
1991-2005 7 Inconsistent methodologies make detecting bias difficult.
Does not allow for a meaningful comparison of annual national quantities of hazardous wastes generated, due to inconsistencies in reporting parameters.
CONCLUSION 27
EPA Strategic Plans 1994-2006 5 No apparent bias. Allows for the comparison of formal Agency-wide planning guidance and goals, as an indicator of policy coherence, in the baseline years of P2 integration efforts and later years of P2 integration efforts.
CONCLUSION 28
EPA Strategic Plan 2006
See Conclusion 27
1 See Conclusion 27 See Conclusion 27
Region 4 draft P2 Program Logic Model
See Conclusion 5
1 See Conclusion 5 See Conclusion 5
CONCLUSION 29
EPA Strategic Plan 2006
See Conclusion 27
1 See Conclusion 27 See Conclusion 27
EPA’s Hierarchy of Measurement Indicators
1
Bias is not a factor Allows a characterization of direct P2 measures and P2 integration according to the levels of measures outlined in EPA’s hierarchy of indicators.
Region 4 actual results submitted to P2 Program for FY2005
2005
1
Confirms that Regional media programs reported FT 2005 P2 results
CONCLUSION 30
EPA Evaluation of Implementation Experiences with Innovative Air Permits:
1993-2001 6
Although data may be biased towards better performers, public perceptions are included.
Allows a view of an incremental EPA planning step in the evolution of air policy on aligning the regulatory framework with increasingly competitive market demands and pollution prevention policy.
New Source Review Improvement Rule
2002
?
Is there at data set on implementation experience?
Portrays an incremental EPA regulatory step of broad applicability to use Plant-wide Area Limits for determining applicability of New Source Review requirements, an important technique often used in tandem with flexible air
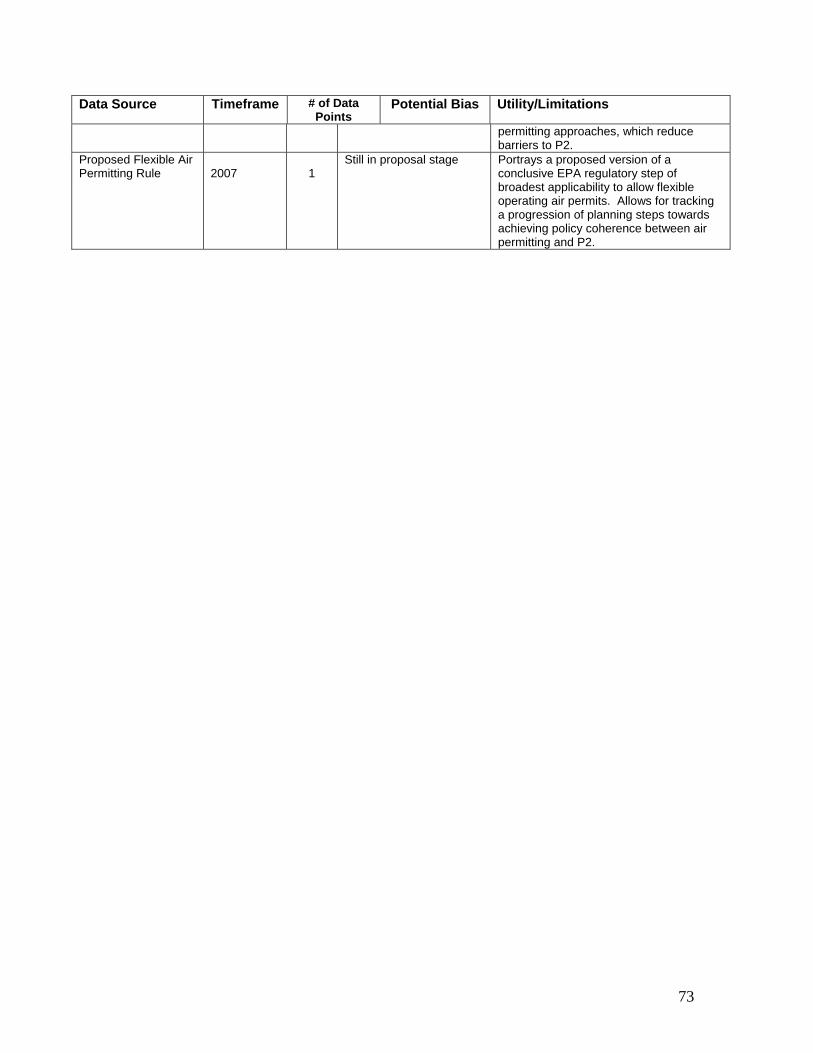
73
Data Source Timeframe # of Data Points
Potential Bias Utility/Limitations
permitting approaches, which reduce barriers to P2.
Proposed Flexible Air Permitting Rule
2007
1
Still in proposal stage Portrays a proposed version of a conclusive EPA regulatory step of broadest applicability to allow flexible operating air permits. Allows for tracking a progression of planning steps towards achieving policy coherence between air permitting and P2.
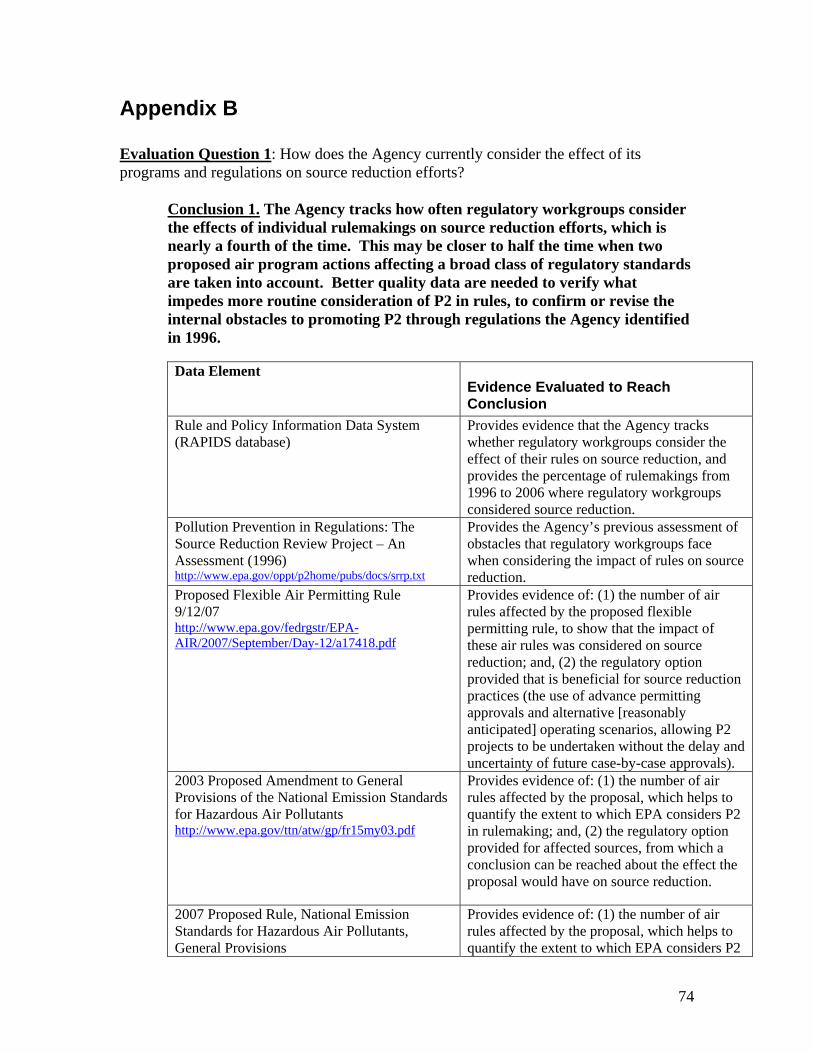
74
Appendix B Evaluation Question 1: How does the Agency currently consider the effect of its programs and regulations on source reduction efforts?
Conclusion 1. The Agency tracks how often regulatory workgroups consider the effects of individual rulemakings on source reduction efforts, which is nearly a fourth of the time. This may be closer to half the time when two proposed air program actions affecting a broad class of regulatory standards are taken into account. Better quality data are needed to verify what impedes more routine consideration of P2 in rules, to confirm or revise the internal obstacles to promoting P2 through regulations the Agency identified in 1996. Data Element
Evidence Evaluated to Reach Conclusion
Rule and Policy Information Data System (RAPIDS database)
Provides evidence that the Agency tracks whether regulatory workgroups consider the effect of their rules on source reduction, and provides the percentage of rulemakings from 1996 to 2006 where regulatory workgroups considered source reduction.
Pollution Prevention in Regulations: The Source Reduction Review Project – An Assessment (1996) http://www.epa.gov/oppt/p2home/pubs/docs/srrp.txt
Provides the Agency’s previous assessment of obstacles that regulatory workgroups face when considering the impact of rules on source reduction.
Proposed Flexible Air Permitting Rule 9/12/07 http://www.epa.gov/fedrgstr/EPA-AIR/2007/September/Day-12/a17418.pdf
Provides evidence of: (1) the number of air rules affected by the proposed flexible permitting rule, to show that the impact of these air rules was considered on source reduction; and, (2) the regulatory option provided that is beneficial for source reduction practices (the use of advance permitting approvals and alternative [reasonably anticipated] operating scenarios, allowing P2 projects to be undertaken without the delay and uncertainty of future case-by-case approvals).
2003 Proposed Amendment to General Provisions of the National Emission Standards for Hazardous Air Pollutants http://www.epa.gov/ttn/atw/gp/fr15my03.pdf
Provides evidence of: (1) the number of air rules affected by the proposal, which helps to quantify the extent to which EPA considers P2 in rulemaking; and, (2) the regulatory option provided for affected sources, from which a conclusion can be reached about the effect the proposal would have on source reduction.
2007 Proposed Rule, National Emission Standards for Hazardous Air Pollutants, General Provisions
Provides evidence of: (1) the number of air rules affected by the proposal, which helps to quantify the extent to which EPA considers P2
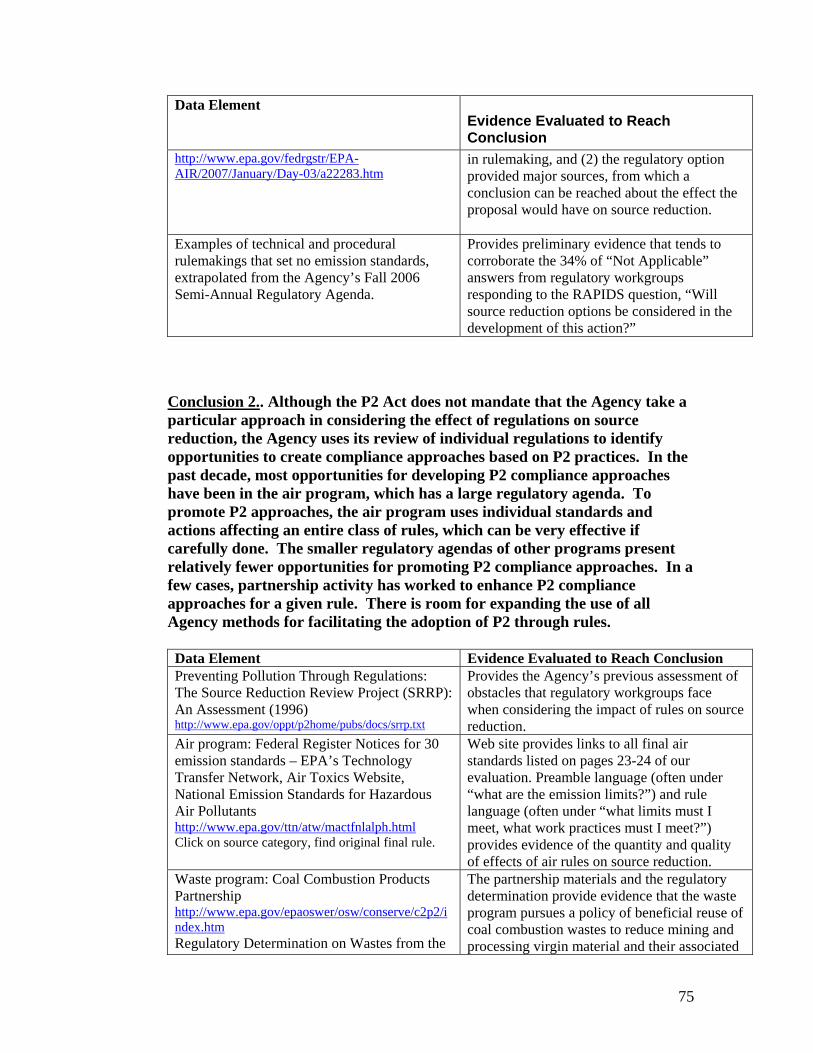
75
Data Element Evidence Evaluated to Reach Conclusion
http://www.epa.gov/fedrgstr/EPA-AIR/2007/January/Day-03/a22283.htm
in rulemaking, and (2) the regulatory option provided major sources, from which a conclusion can be reached about the effect the proposal would have on source reduction.
Examples of technical and procedural rulemakings that set no emission standards, extrapolated from the Agency’s Fall 2006 Semi-Annual Regulatory Agenda.
Provides preliminary evidence that tends to corroborate the 34% of “Not Applicable” answers from regulatory workgroups responding to the RAPIDS question, “Will source reduction options be considered in the development of this action?”
Conclusion 2.. Although the P2 Act does not mandate that the Agency take a particular approach in considering the effect of regulations on source reduction, the Agency uses its review of individual regulations to identify opportunities to create compliance approaches based on P2 practices. In the past decade, most opportunities for developing P2 compliance approaches have been in the air program, which has a large regulatory agenda. To promote P2 approaches, the air program uses individual standards and actions affecting an entire class of rules, which can be very effective if carefully done. The smaller regulatory agendas of other programs present relatively fewer opportunities for promoting P2 compliance approaches. In a few cases, partnership activity has worked to enhance P2 compliance approaches for a given rule. There is room for expanding the use of all Agency methods for facilitating the adoption of P2 through rules. Data Element Evidence Evaluated to Reach Conclusion Preventing Pollution Through Regulations: The Source Reduction Review Project (SRRP): An Assessment (1996) http://www.epa.gov/oppt/p2home/pubs/docs/srrp.txt
Provides the Agency’s previous assessment of obstacles that regulatory workgroups face when considering the impact of rules on source reduction.
Air program: Federal Register Notices for 30 emission standards – EPA’s Technology Transfer Network, Air Toxics Website, National Emission Standards for Hazardous Air Pollutants http://www.epa.gov/ttn/atw/mactfnlalph.html Click on source category, find original final rule.
Web site provides links to all final air standards listed on pages 23-24 of our evaluation. Preamble language (often under “what are the emission limits?”) and rule language (often under “what limits must I meet, what work practices must I meet?”) provides evidence of the quantity and quality of effects of air rules on source reduction.
Waste program: Coal Combustion Products Partnership http://www.epa.gov/epaoswer/osw/conserve/c2p2/index.htm Regulatory Determination on Wastes from the
The partnership materials and the regulatory determination provide evidence that the waste program pursues a policy of beneficial reuse of coal combustion wastes to reduce mining and processing virgin material and their associated
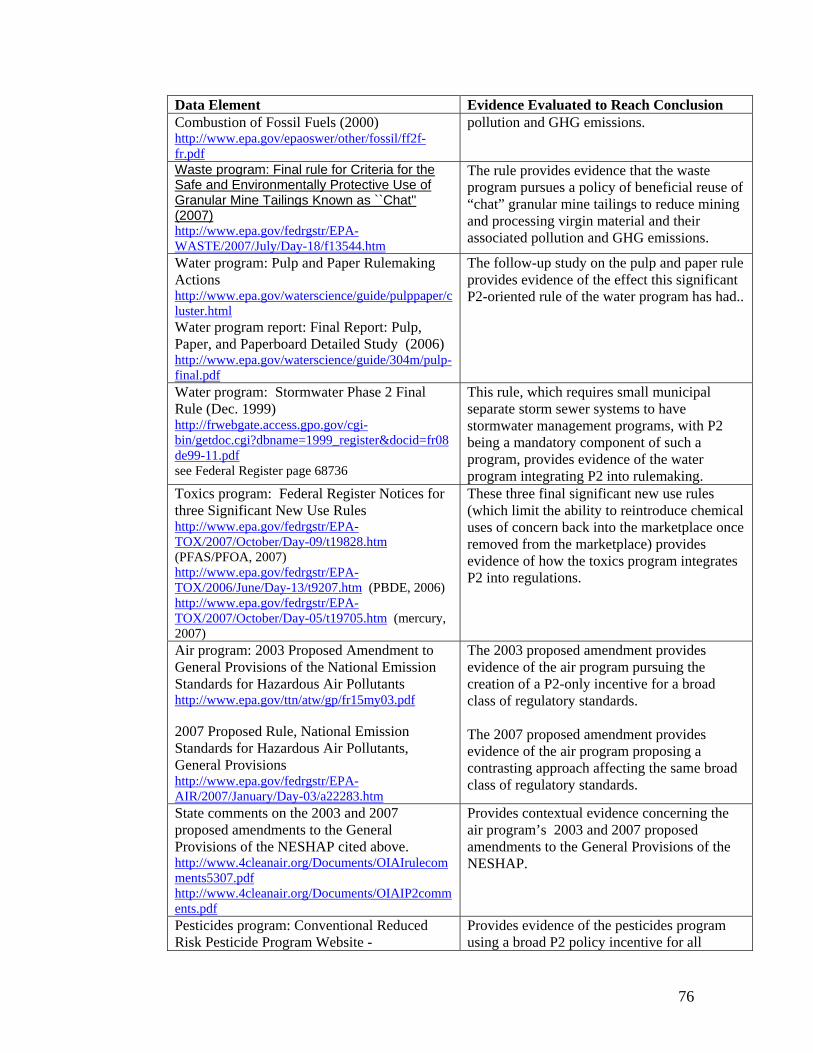
76
Data Element Evidence Evaluated to Reach Conclusion Combustion of Fossil Fuels (2000) http://www.epa.gov/epaoswer/other/fossil/ff2f-fr.pdf
pollution and GHG emissions.
Waste program: Final rule for Criteria for the Safe and Environmentally Protective Use of Granular Mine Tailings Known as ``Chat'' (2007) http://www.epa.gov/fedrgstr/EPA-WASTE/2007/July/Day-18/f13544.htm
The rule provides evidence that the waste program pursues a policy of beneficial reuse of “chat” granular mine tailings to reduce mining and processing virgin material and their associated pollution and GHG emissions.
Water program: Pulp and Paper Rulemaking Actions http://www.epa.gov/waterscience/guide/pulppaper/cluster.html Water program report: Final Report: Pulp, Paper, and Paperboard Detailed Study (2006) http://www.epa.gov/waterscience/guide/304m/pulp-final.pdf
The follow-up study on the pulp and paper rule provides evidence of the effect this significant P2-oriented rule of the water program has had..
Water program: Stormwater Phase 2 Final Rule (Dec. 1999) http://frwebgate.access.gpo.gov/cgi-bin/getdoc.cgi?dbname=1999_register&docid=fr08de99-11.pdf see Federal Register page 68736
This rule, which requires small municipal separate storm sewer systems to have stormwater management programs, with P2 being a mandatory component of such a program, provides evidence of the water program integrating P2 into rulemaking.
Toxics program: Federal Register Notices for three Significant New Use Rules http://www.epa.gov/fedrgstr/EPA-TOX/2007/October/Day-09/t19828.htm (PFAS/PFOA, 2007) http://www.epa.gov/fedrgstr/EPA-TOX/2006/June/Day-13/t9207.htm (PBDE, 2006) http://www.epa.gov/fedrgstr/EPA-TOX/2007/October/Day-05/t19705.htm (mercury, 2007)
These three final significant new use rules (which limit the ability to reintroduce chemical uses of concern back into the marketplace once removed from the marketplace) provides evidence of how the toxics program integrates P2 into regulations.
Air program: 2003 Proposed Amendment to General Provisions of the National Emission Standards for Hazardous Air Pollutants http://www.epa.gov/ttn/atw/gp/fr15my03.pdf 2007 Proposed Rule, National Emission Standards for Hazardous Air Pollutants, General Provisions http://www.epa.gov/fedrgstr/EPA-AIR/2007/January/Day-03/a22283.htm
The 2003 proposed amendment provides evidence of the air program pursuing the creation of a P2-only incentive for a broad class of regulatory standards. The 2007 proposed amendment provides evidence of the air program proposing a contrasting approach affecting the same broad class of regulatory standards.
State comments on the 2003 and 2007 proposed amendments to the General Provisions of the NESHAP cited above. http://www.4cleanair.org/Documents/OIAIrulecomments5307.pdf http://www.4cleanair.org/Documents/OIAIP2comments.pdf
Provides contextual evidence concerning the air program’s 2003 and 2007 proposed amendments to the General Provisions of the NESHAP.
Pesticides program: Conventional Reduced Risk Pesticide Program Website -
Provides evidence of the pesticides program using a broad P2 policy incentive for all

77
Data Element Evidence Evaluated to Reach Conclusion http://www.epa.gov/opprd001/workplan/reducedrisk.html
pesticide registration applications.
Pesticides program: Multi-Year Workplan for the Registration of Conventional Pesticides - http://www.epa.gov/opprd001/workplan/
Provides the total number of registrations for pesticides and reduced-risk pesticides for 2001 and 2003-2006; used to calculate the percentage of registration decisions on reduced-risk pesticides during those years.
DC Circuit Court opinion on the Hospital/ Medical/Infectious Waste Incinerator rule http://www.epa.gov/ttn/atw/129/hmiwi/rihmiwi.html see rule information, litigation update, for court opinion
Provides evidence that stakeholders were interested in having the medical waste incinerator rule adopt a pollution prvention approach to reduce mercury emissions.
Technology Transfer Network, Air Toxics Website (Hospital/Medical/Infectious Waste Incinerators – click “related web sites,” then Memorandum of Understanding, then link to Hospotials for Healthy Environment (H2E) website, About H2E, Goals) http://www.epa.gov/ttn/atw/129/hmiwi/rihmiwi.html
The working web link between the medical waste incinerator rule and the voluntary Hospitals for a Healthy Environment Program (and its goal of virtual elimination of mercury at healthcare facilities) provides evidence of how P2 partnership programs can complement regulatory standards.
Memorandum of Understanding to Establish the National Vehicle Mercury Switch Recovery Program http://www.epa.gov/mercury/pdfs/switchMOU.pdf National Vehicle Mercury Switch Recovery Program website http://www.epa.gov/hg/switchfs.htm
This partnership agreement (on the removal of automotive mercury switches) and the fact sheet explaining the agreement’s relationship to air rules for steel mills provides evidence that partnership programs can be developed to complement regulatory standards.
Conclusion 3. To assist regulatory workgroups that develop P2 options for regulatory standards, Agency guidance on analyzing the economic impacts of regulatory actions could more clearly address how to handle cost savings associated with responses to P2 options. Data Element Evidence Evaluated to Reach Conclusion EPA Guidelines for Preparing Economic Analyses (2000) http://yosemite/epa/gov/ee/epa/eed.nsf/webpages/Guidelines.html/$file/Guidelines.pdf See page 27
The discussion of estimating responses for P2 policy options on page 27 provides evidence of a possible gap in guidance on how to address cost savings associated with responses to P2 policy options.
Environmental Impact Analysis for the Boat Manufacturing NESHAP (2001) http://www.epa.gov/ttnecas1/regdata/EIAs/boateia.pdf See page 3-2, and page 3-5.
The discussion of assumptions indicates that savings from P2 options were counted as zero in this rulemaking on the assumption that facilities change to cost-saving processes on their own once capital depreciation occurs.
Conclusion 4. P2 integration efforts in Agency permitting, enforcement, and compliance programs grew out of training and guidance the Agency developed for EPA and State personnel in the 1990’s. Major permitting programs (except for the underground injection program) have P2 components. Evaluation data from 2001 on the air program’s pilot approach

78
was positive, and the program has developed two rules to implement the pilot approach on a widespread basis. Data gaps for the water and waste permitting programs make them difficult to evaluate, although limited data are positive for the water pretreatment permitting approach to P2. Recent data shows nearly a sixth of enforcement complying actions have a P2 component. The compliance program offers several P2 incentives, and has survey data showing that the regulated community takes P2 action based on Agency compliance resources. Data Element Evidence Evaluated to Reach Conclusion Air program report, State Experience Integrating Pollution Prevention Into Permits (1995) http://www.epa.gov/ttn/oarpg/t5/memoranda/permits.pdf
This report identified various approaches for integrating P2 into permits, including flexible air permits. This provides evidence that the air program scoped out its options for integrating P2 into the air permitting process.
Air program report, Evaluation of Implementation Experiences with Innovative Air Permits: Results of the U.S. EPA Flexible Permit Implementation Review (2001) http://www.epa.gov/ttn/oarpg/t5/memoranda/iap_eier.pdf
This report evaluates a several-year air program pilot in flexible permitting. This provides evidence of continuing steps by the air program to develop its approach to promoting P2 and accommodating market demands in permits.
Final air rule: Prevention of Significant Deterioration and Nonattainment New Source Review Baseline Emissions Determination, Actual-to-Future-Actual Methodology, Plantwide Applicability Limitations, Clean Units, Pollution Control Projects (2002) http://a257.g.akamaitech.net/7/257/2422/14mar20010800/edocket.access.gpo.gov/2002/pdf/02-31899.pdf
This rule amended the New Source Review program to, among other things, allow plant-wide applicability limits (PAL), a bubble approach often used in tandem with flexible permitting. This shows the air program laying part of a regulatory foundation for governing flexible air permit development to facilitate P2. Legal challenges to the rule have not affected the PAL.
Proposed air rule: Proposed Flexible Air Permitting Rule (2007) http://www.epa.gov/fedrgstr/EPA-AIR/2007/September/Day-12/a17418.pdf
This proposed rule would allow the use of advance permitting approvals and alternative operating scenarios by all Clean Air Act Title V permit holders and State new source review programs. This provides evidence that the Agency has followed up on its 1996 recommendations to broaden the flexibility of regulatory requirements to advance P2, and to emphasize permitting as a means of promoting P2.
Water program permitting guidance: Office of Water Guidance Manual for Developing Best Management Practices (1993) http://yosemite.epa.gov/water/owrccatalog.nsf/065ca07e299b464685256ce50075c11a/e563877d0cd4b57785256b0600723b4d!OpenDocument
This early guidance for the regulated community and citizens shows the water program emphasizing early on the use of P2 best management practices as a basis for complying with pretreatment permits..
Water program permitting and inspection guidance: Guides to Pollution Prevention: Municipal Pretreatment Program (1993)
This early guidance for publicly owned treatment works on promoting P2 to industrial dischargers through inspections, outreach, and

79
Data Element Evidence Evaluated to Reach Conclusion http://www.p2pays.org/ref/01/00738.pdf
permits, together with other 1993 guidance above, shows in provides evidence similar to that just above.
Water program permitting guidance: Local Limits Development Guidance (2004) http://www.epa.gov/npdes/pubs/final_local_limits_guidance.pdf (update to 1987 guidance; see section 6.6 for discussion of P2 best management practices as a basis for local limits)
This updated guidance for States and POTWs addresses the development of local limits which, together with national categorical standards, make up pretreatment limits. P2 best management practices are discussed as allowable bases for local limits. Provides evidence that the Agency continues to emphasize permitting as a means to promote P2..
Compliance monitoring guidance: NPDES Compliance Inspection Manual (2004) http://www.epa.gov/compliance/resources/publications/monitoring/cwa/inspections/npdesinspect/npdesmanual.html
Provides evidence that the compliance monitoring program has developed guidance on building a P2 opportunity assessment into NPDES (water) inspection activities, which cover POTWs, stormwater industrial and construction sites, pretreatment facilities, and so on.
Water program permitting guidance: Developing Your Stormwater Pollution Prevention Plan: A Guide for Construction Sites (2007) http://www.epa.gov/npdes/pubs/sw_swppp_guide.pdf
Provides evidence that the water program continues to develop P2 guidance – here, sector-specific guidance on writing a stormwater P2 plan, as required in a construction general permit.
North Carolina Industrial Waste Survey (IWS) http://h2o.enr.state.nc.us/percs/Pretreatment/IndustrialWasteSurvey.htm
Provides limited evidence of the effectiveness of the water program’s 1993 pretreatment guidance in promoting P2 practices.
East Bay Municipal Utility District Wastewater Department 2006 Annual Report http://www.ebmud.com/about_ebmud/publications/annual_reports/default.htm
Provides limited evidence of the effectiveness of the water program’s 1993 pretreatment guidance in promoting P2 practices.
October 19, 2006 Interview with Mike Shapiro, Deputy Assistant Administrator, Office of Water, about underground injection program permits.
Provides confirmation that P2 approaches were not actively integrated into the underground injection program for deep wells (chiefly industrial hazardous waste disposal).
Waste program guidance: Waste Minimization: Permit Certification and Joint Permitting (1985) http://yosemite.epa.gov/osw/rcra.nsf/documents/21AF6AEAD724FFA6852565DA006F09D5
Provides evidence of longstanding waste program guidance to permit writers to ensure that a hazardous waste permit includes a certification that the waste generator has a P2 plan in place.
Waste program guidance: Pollution Prevention Solutions During Permitting, Inspections and Enforcement (1998) http://www.p2pays.org/rf/03/02278.pdf or search document on p2 pays homepage
This thorough compendium of P2 options in the waste permitting process, although no longer available on an EPA web site, provides evidence that the waste program continued to develop P2 guidance.
March 21, 2007 email from Gary Schlicht, Region 7, to David Sarokin, Pollution Prevention Division, Office of Pollution
Documents an instance where efforts to strengthen waste minimization in RCRA permits were deemed unenforceable by
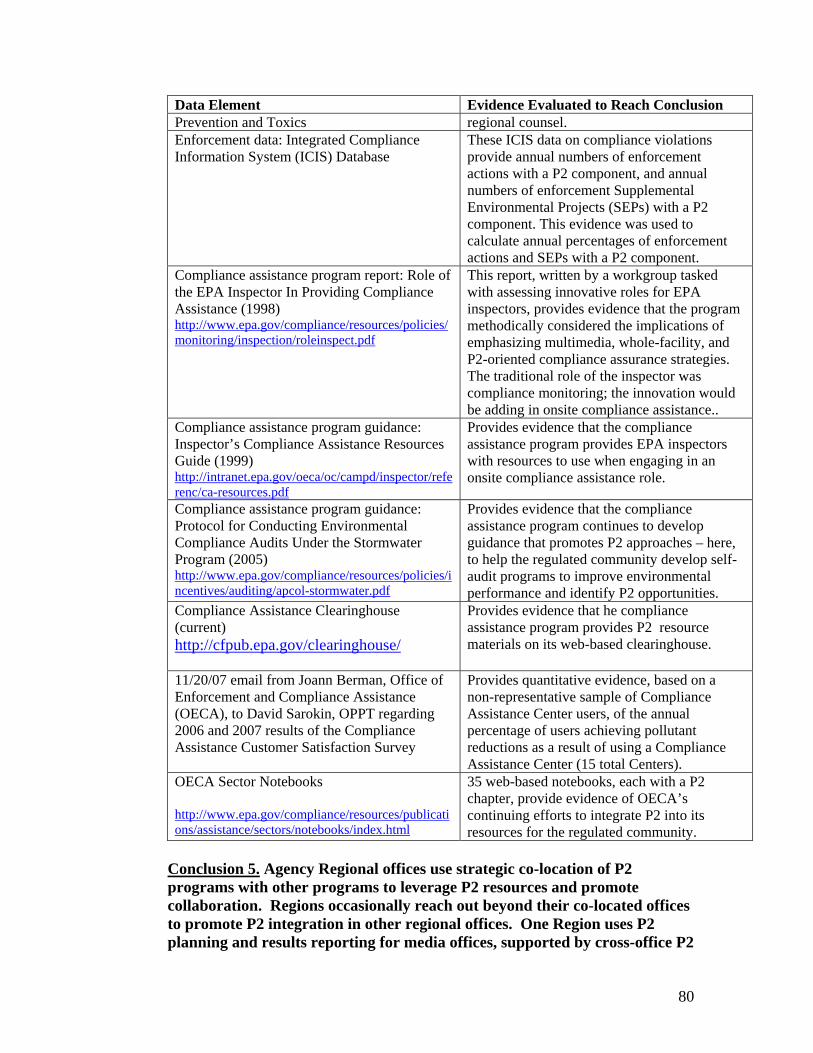
80
Data Element Evidence Evaluated to Reach Conclusion Prevention and Toxics regional counsel. Enforcement data: Integrated Compliance Information System (ICIS) Database
These ICIS data on compliance violations provide annual numbers of enforcement actions with a P2 component, and annual numbers of enforcement Supplemental Environmental Projects (SEPs) with a P2 component. This evidence was used to calculate annual percentages of enforcement actions and SEPs with a P2 component.
Compliance assistance program report: Role of the EPA Inspector In Providing Compliance Assistance (1998) http://www.epa.gov/compliance/resources/policies/monitoring/inspection/roleinspect.pdf
This report, written by a workgroup tasked with assessing innovative roles for EPA inspectors, provides evidence that the program methodically considered the implications of emphasizing multimedia, whole-facility, and P2-oriented compliance assurance strategies. The traditional role of the inspector was compliance monitoring; the innovation would be adding in onsite compliance assistance..
Compliance assistance program guidance: Inspector’s Compliance Assistance Resources Guide (1999) http://intranet.epa.gov/oeca/oc/campd/inspector/referenc/ca-resources.pdf
Provides evidence that the compliance assistance program provides EPA inspectors with resources to use when engaging in an onsite compliance assistance role.
Compliance assistance program guidance: Protocol for Conducting Environmental Compliance Audits Under the Stormwater Program (2005) http://www.epa.gov/compliance/resources/policies/incentives/auditing/apcol-stormwater.pdf
Provides evidence that the compliance assistance program continues to develop guidance that promotes P2 approaches – here, to help the regulated community develop self-audit programs to improve environmental performance and identify P2 opportunities.
Compliance Assistance Clearinghouse (current) http://cfpub.epa.gov/clearinghouse/
Provides evidence that he compliance assistance program provides P2 resource materials on its web-based clearinghouse.
11/20/07 email from Joann Berman, Office of Enforcement and Compliance Assistance (OECA), to David Sarokin, OPPT regarding 2006 and 2007 results of the Compliance Assistance Customer Satisfaction Survey
Provides quantitative evidence, based on a non-representative sample of Compliance Assistance Center users, of the annual percentage of users achieving pollutant reductions as a result of using a Compliance Assistance Center (15 total Centers).
OECA Sector Notebooks http://www.epa.gov/compliance/resources/publications/assistance/sectors/notebooks/index.html
35 web-based notebooks, each with a P2 chapter, provide evidence of OECA’s continuing efforts to integrate P2 into its resources for the regulated community.
Conclusion 5. Agency Regional offices use strategic co-location of P2 programs with other programs to leverage P2 resources and promote collaboration. Regions occasionally reach out beyond their co-located offices to promote P2 integration in other regional offices. One Region uses P2 planning and results reporting for media offices, supported by cross-office P2

81
teams. There is variability among Regions in the extent to which they coordinate regional multimedia and regional P2 efforts. There is room for expanding the contribution of Regions to P2 integration.. Data Element Evidence Evaluated to Reach Conclusion Region 4: Pollution Prevention Strategy and Action Plan (1997) www.epa.gov/Region4/p2
This strategy and action plan of 10-years’ duration provide evidence that Region 4 plans for integrating P2 throughout its programs. This demonstrates a potential roadmap for P2 integration.
Region 4: Draft P2 Program Logic Model (2005) (available as a Powerpoint file)
Provides information on the activities Region 4 is using to achieve its 1997 strategic plan. This demonstrates a potential roadmap for P2 integration.
Region 8 report: The Keys to Success: A Compilation of Workable P2 Integration Techniques (2001) http://www.tellus.org/b&s/publications/Keys%to%Success-P2%20Practices.pdf
This report provides evidence that Region 8 has documented guidance on P2 integration.
Conclusion 6. More programs are using partnerships to work towards some program goal, and this is expanding opportunities for P2 integration. Data Element Evidence Evaluated to Reach Conclusion Inventory of EPA Partnership Programs http://www.epa.gov/partners/programs/index.htm
Provides an inventory and description of the partnership programs at EPA.
Energy Star web site http://www.energystar.gov/
Under “About Energy Star,” partner information is available.
Healthcare Environmental Resource Center Website http://www.hercenter.org/
This integrated compliance and P2 web site provides direct evidence of the collaboration between the compliance program and the P2 program to create an integrated web site for the healthcare sector.
Federal Electronics Challenge Website http://www.federalelectronicschallenge.net/index.htm
Provides general information about the Federal Electronics Challenge and its activities. This demonstrates how EPA partnership programs can be used to promote P2 integration.
Executive Order 13423, Strengthening Federal Environmental, Energy, and Transportation Management http://www.epa.gov/greeningepa/practices/eo13423.htm Instructions for implementing executive Order 13423 http://www.ofee.gov/eo/eo13423_instructions.pdf
Provides information on the executive order and its implementing instructions which requires agencies to meet goals similar to the program goals of the FEC.
Conclusion 7. EPA statutory implementation programs also take opportunities to integrate P2 into operations other than regulations. These
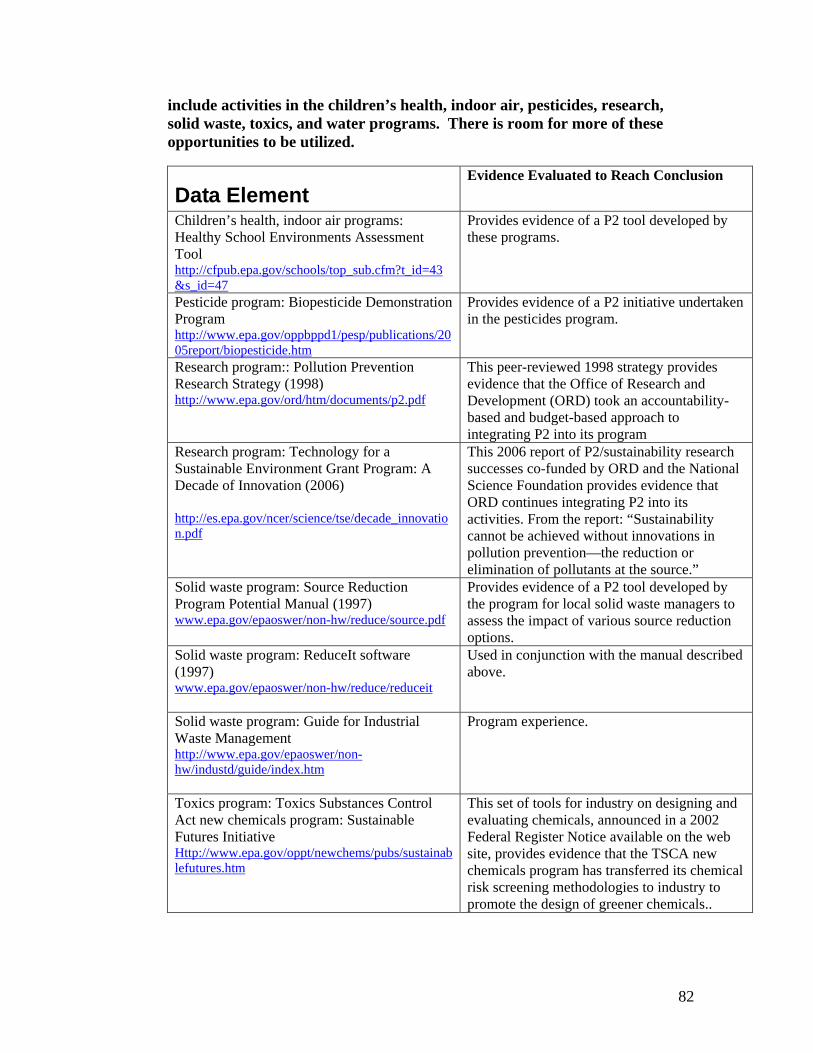
82
include activities in the children’s health, indoor air, pesticides, research, solid waste, toxics, and water programs. There is room for more of these opportunities to be utilized.
Data Element Evidence Evaluated to Reach Conclusion
Children’s health, indoor air programs: Healthy School Environments Assessment Tool http://cfpub.epa.gov/schools/top_sub.cfm?t_id=43&s_id=47
Provides evidence of a P2 tool developed by these programs.
Pesticide program: Biopesticide Demonstration Program http://www.epa.gov/oppbppd1/pesp/publications/2005report/biopesticide.htm
Provides evidence of a P2 initiative undertaken in the pesticides program.
Research program:: Pollution Prevention Research Strategy (1998) http://www.epa.gov/ord/htm/documents/p2.pdf
This peer-reviewed 1998 strategy provides evidence that the Office of Research and Development (ORD) took an accountability-based and budget-based approach to integrating P2 into its program
Research program: Technology for a Sustainable Environment Grant Program: A Decade of Innovation (2006) http://es.epa.gov/ncer/science/tse/decade_innovation.pdf
This 2006 report of P2/sustainability research successes co-funded by ORD and the National Science Foundation provides evidence that ORD continues integrating P2 into its activities. From the report: “Sustainability cannot be achieved without innovations in pollution prevention—the reduction or elimination of pollutants at the source.”
Solid waste program: Source Reduction Program Potential Manual (1997) www.epa.gov/epaoswer/non-hw/reduce/source.pdf
Provides evidence of a P2 tool developed by the program for local solid waste managers to assess the impact of various source reduction options.
Solid waste program: ReduceIt software (1997) www.epa.gov/epaoswer/non-hw/reduce/reduceit
Used in conjunction with the manual described above.
Solid waste program: Guide for Industrial Waste Management http://www.epa.gov/epaoswer/non-hw/industd/guide/index.htm
Program experience.
Toxics program: Toxics Substances Control Act new chemicals program: Sustainable Futures Initiative Http://www.epa.gov/oppt/newchems/pubs/sustainablefutures.htm
This set of tools for industry on designing and evaluating chemicals, announced in a 2002 Federal Register Notice available on the web site, provides evidence that the TSCA new chemicals program has transferred its chemical risk screening methodologies to industry to promote the design of greener chemicals..
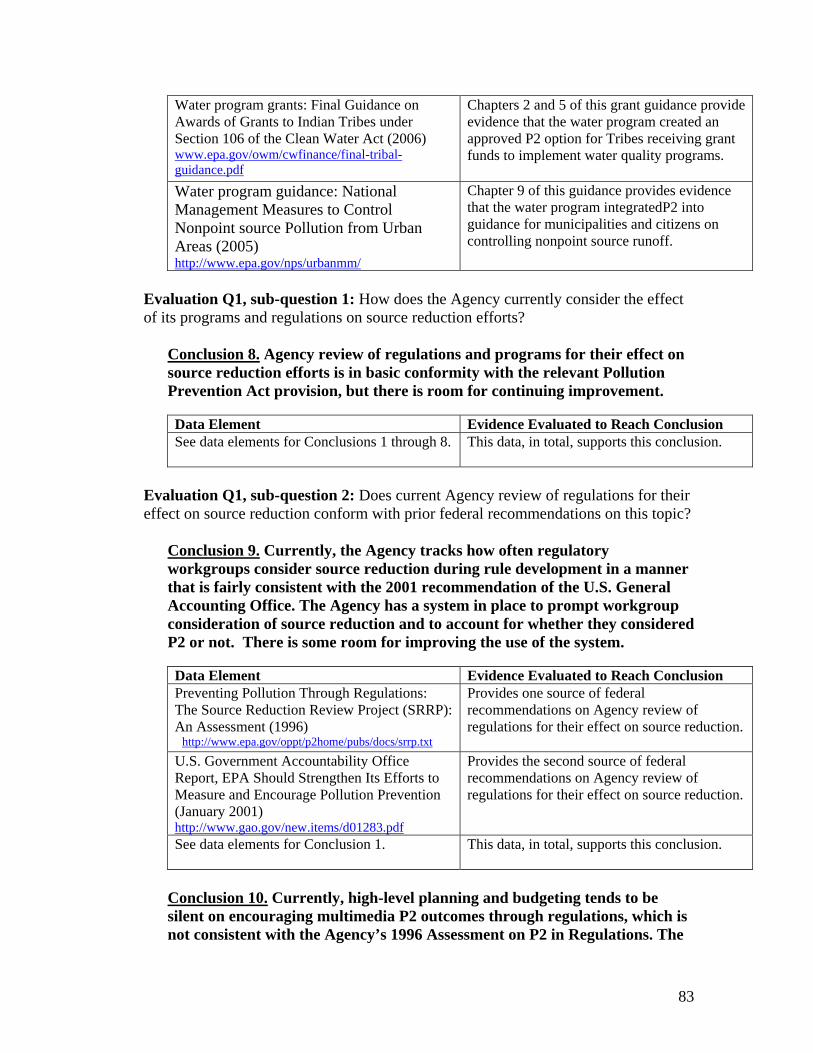
83
Water program grants: Final Guidance on Awards of Grants to Indian Tribes under Section 106 of the Clean Water Act (2006) www.epa.gov/owm/cwfinance/final-tribal-guidance.pdf
Chapters 2 and 5 of this grant guidance provide evidence that the water program created an approved P2 option for Tribes receiving grant funds to implement water quality programs.
Water program guidance: National Management Measures to Control Nonpoint source Pollution from Urban Areas (2005) http://www.epa.gov/nps/urbanmm/
Chapter 9 of this guidance provides evidence that the water program integratedP2 into guidance for municipalities and citizens on controlling nonpoint source runoff.
Evaluation Q1, sub-question 1: How does the Agency currently consider the effect of its programs and regulations on source reduction efforts?
Conclusion 8. Agency review of regulations and programs for their effect on source reduction efforts is in basic conformity with the relevant Pollution Prevention Act provision, but there is room for continuing improvement. Data Element Evidence Evaluated to Reach Conclusion See data elements for Conclusions 1 through 8. This data, in total, supports this conclusion.
Evaluation Q1, sub-question 2: Does current Agency review of regulations for their effect on source reduction conform with prior federal recommendations on this topic?
Conclusion 9. Currently, the Agency tracks how often regulatory workgroups consider source reduction during rule development in a manner that is fairly consistent with the 2001 recommendation of the U.S. General Accounting Office. The Agency has a system in place to prompt workgroup consideration of source reduction and to account for whether they considered P2 or not. There is some room for improving the use of the system. Data Element Evidence Evaluated to Reach Conclusion Preventing Pollution Through Regulations: The Source Reduction Review Project (SRRP): An Assessment (1996) http://www.epa.gov/oppt/p2home/pubs/docs/srrp.txt
Provides one source of federal recommendations on Agency review of regulations for their effect on source reduction.
U.S. Government Accountability Office Report, EPA Should Strengthen Its Efforts to Measure and Encourage Pollution Prevention (January 2001) http://www.gao.gov/new.items/d01283.pdf
Provides the second source of federal recommendations on Agency review of regulations for their effect on source reduction.
See data elements for Conclusion 1. This data, in total, supports this conclusion.
Conclusion 10. Currently, high-level planning and budgeting tends to be silent on encouraging multimedia P2 outcomes through regulations, which is not consistent with the Agency’s 1996 Assessment on P2 in Regulations. The
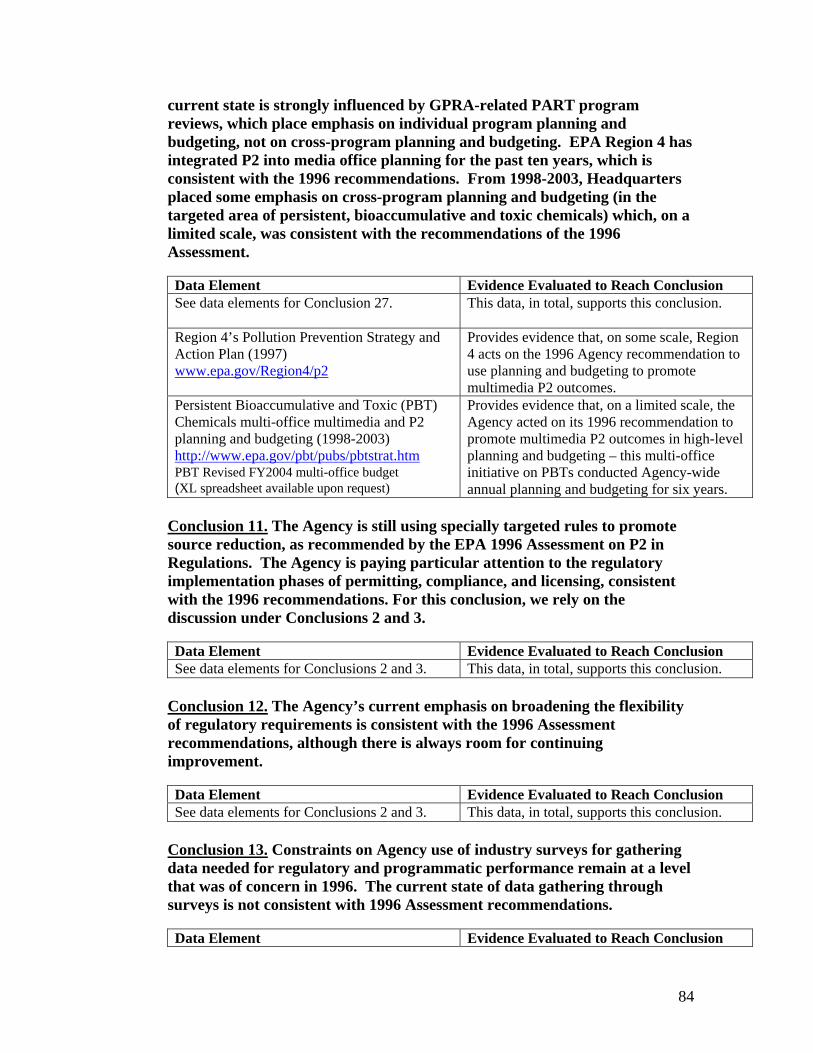
84
current state is strongly influenced by GPRA-related PART program reviews, which place emphasis on individual program planning and budgeting, not on cross-program planning and budgeting. EPA Region 4 has integrated P2 into media office planning for the past ten years, which is consistent with the 1996 recommendations. From 1998-2003, Headquarters placed some emphasis on cross-program planning and budgeting (in the targeted area of persistent, bioaccumulative and toxic chemicals) which, on a limited scale, was consistent with the recommendations of the 1996 Assessment. Data Element Evidence Evaluated to Reach Conclusion See data elements for Conclusion 27. This data, in total, supports this conclusion.
Region 4’s Pollution Prevention Strategy and Action Plan (1997) www.epa.gov/Region4/p2
Provides evidence that, on some scale, Region 4 acts on the 1996 Agency recommendation to use planning and budgeting to promote multimedia P2 outcomes.
Persistent Bioaccumulative and Toxic (PBT) Chemicals multi-office multimedia and P2 planning and budgeting (1998-2003) http://www.epa.gov/pbt/pubs/pbtstrat.htm PBT Revised FY2004 multi-office budget (XL spreadsheet available upon request)
Provides evidence that, on a limited scale, the Agency acted on its 1996 recommendation to promote multimedia P2 outcomes in high-level planning and budgeting – this multi-office initiative on PBTs conducted Agency-wide annual planning and budgeting for six years.
Conclusion 11. The Agency is still using specially targeted rules to promote source reduction, as recommended by the EPA 1996 Assessment on P2 in Regulations. The Agency is paying particular attention to the regulatory implementation phases of permitting, compliance, and licensing, consistent with the 1996 recommendations. For this conclusion, we rely on the discussion under Conclusions 2 and 3. Data Element Evidence Evaluated to Reach Conclusion See data elements for Conclusions 2 and 3. This data, in total, supports this conclusion.
Conclusion 12. The Agency’s current emphasis on broadening the flexibility of regulatory requirements is consistent with the 1996 Assessment recommendations, although there is always room for continuing improvement. Data Element Evidence Evaluated to Reach Conclusion See data elements for Conclusions 2 and 3. This data, in total, supports this conclusion.
Conclusion 13. Constraints on Agency use of industry surveys for gathering data needed for regulatory and programmatic performance remain at a level that was of concern in 1996. The current state of data gathering through surveys is not consistent with 1996 Assessment recommendations. Data Element Evidence Evaluated to Reach Conclusion

85
See data elements for Conclusions 2 and 3. Evaluation Question 2: What is the current state of internal Agency coordination on source reduction activities?
Conclusion 14. The Innovations Action Council coordinates environmental stewardship partnership programs across the Agency, many of which address source reduction activities. The IAC produced the report to the Administrator on environmental stewardship, which cites P2 as an integral part of environmental stewardship and sustainability approaches. Data Element Evidence Evaluated to Reach Conclusion Everyday Choices: Opportunities for Environmental Stewardship (2005) http://www.epa.gov/epainnov/pdf/rpt2admin.pdf
This report provides evidence that the IAC plays a coordinating role for partnership programs that promote source reduction.
Conclusion 15. The Office Directors’ Multimedia and Pollution Prevention (M2P2) Forum commissions and coordinates source reduction activities that relate to regulatory integration and other multimedia program activities. On several occasions, the Forum has successfully shown that it can bring offices together to forge concrete multi-office P2 solutions to environmental problems. There is room for greater utilization of the M2P2 Forum’s problem-solving capabilities. Data Element Evidence Evaluated to Reach Conclusion Office Directors’ Multimedia Pollution Prevention (M2P2) Forum Charter (1996) (available as a Word file)
Provides evidence of the role the M2P2 plays in coordinating source reduction activities in the Agency.
NASCAR agreement on unleaded fuel for racing cars
Memorandum of Understanding to Establish the National Vehicle Mercury Switch Recovery Program http://www.epa.gov/mercury/pdfs/switchMOU.pdf
This partnership agreement (on the removal of automotive mercury switches) provides evidence of the practical solution to an environmental problem that the M2P2 Forum helped bring about.
Conclusion 16. The Environmental Assistance Network coordinates source reduction activities of Agency technical assistance programs. Data Element Evidence Evaluated to Reach Conclusion Email/attachment Provides evidence of the role the EAN plays in
coordinating source reduction activities in the Agency.
Conclusion 17. The Office of Research and Development coordinates research activities on source reduction approaches.
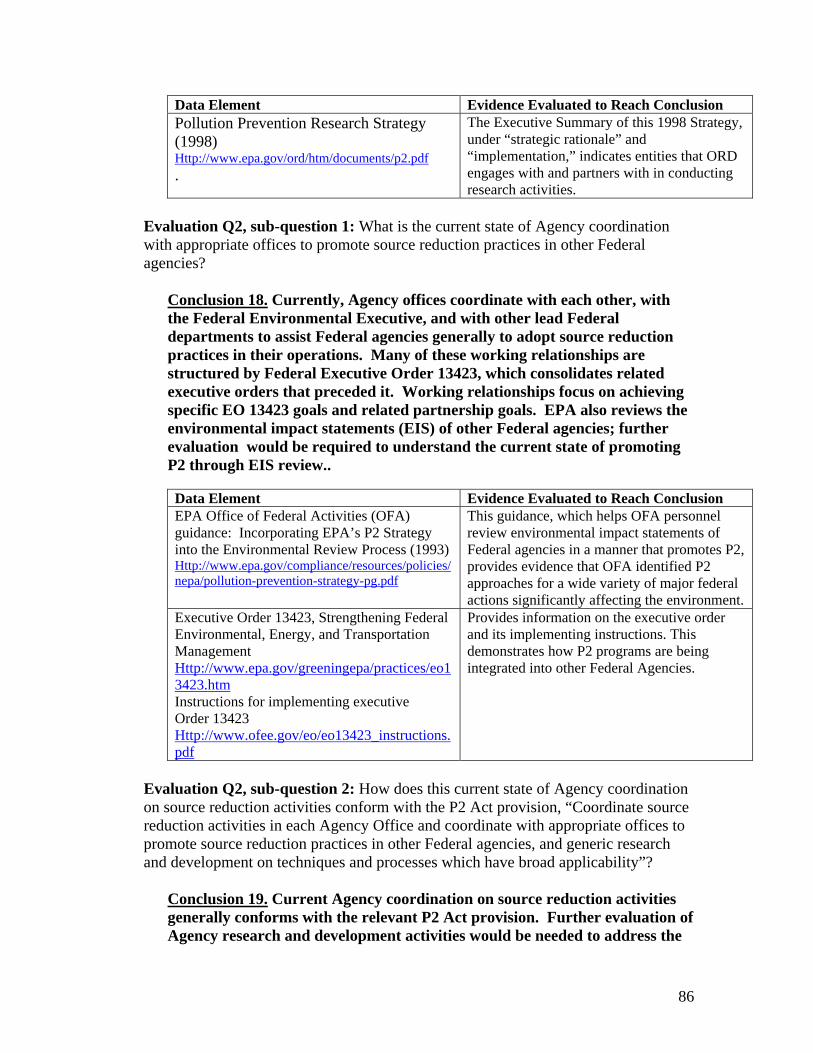
86
Data Element Evidence Evaluated to Reach Conclusion Pollution Prevention Research Strategy (1998) Http://www.epa.gov/ord/htm/documents/p2.pdf .
The Executive Summary of this 1998 Strategy, under “strategic rationale” and “implementation,” indicates entities that ORD engages with and partners with in conducting research activities.
Evaluation Q2, sub-question 1: What is the current state of Agency coordination with appropriate offices to promote source reduction practices in other Federal agencies?
Conclusion 18. Currently, Agency offices coordinate with each other, with the Federal Environmental Executive, and with other lead Federal departments to assist Federal agencies generally to adopt source reduction practices in their operations. Many of these working relationships are structured by Federal Executive Order 13423, which consolidates related executive orders that preceded it. Working relationships focus on achieving specific EO 13423 goals and related partnership goals. EPA also reviews the environmental impact statements (EIS) of other Federal agencies; further evaluation would be required to understand the current state of promoting P2 through EIS review.. Data Element Evidence Evaluated to Reach Conclusion EPA Office of Federal Activities (OFA) guidance: Incorporating EPA’s P2 Strategy into the Environmental Review Process (1993) Http://www.epa.gov/compliance/resources/policies/nepa/pollution-prevention-strategy-pg.pdf
This guidance, which helps OFA personnel review environmental impact statements of Federal agencies in a manner that promotes P2, provides evidence that OFA identified P2 approaches for a wide variety of major federal actions significantly affecting the environment.
Executive Order 13423, Strengthening Federal Environmental, Energy, and Transportation Management Http://www.epa.gov/greeningepa/practices/eo13423.htm Instructions for implementing executive Order 13423 Http://www.ofee.gov/eo/eo13423_instructions.pdf
Provides information on the executive order and its implementing instructions. This demonstrates how P2 programs are being integrated into other Federal Agencies.
Evaluation Q2, sub-question 2: How does this current state of Agency coordination on source reduction activities conform with the P2 Act provision, “Coordinate source reduction activities in each Agency Office and coordinate with appropriate offices to promote source reduction practices in other Federal agencies, and generic research and development on techniques and processes which have broad applicability”?
Conclusion 19. Current Agency coordination on source reduction activities generally conforms with the relevant P2 Act provision. Further evaluation of Agency research and development activities would be needed to address the

87
part of the relevant PPA provision that focuses on coordination with appropriate offices to promote generic research and development on P2 techniques of broad applicability. Data Element Evidence Evaluated to Reach Conclusion See data elements for Conclusions 14 – 18. The data elements for Conclusions 14-18 in
total provide the evidence for Conclusion 19. Evaluation Question 3: What is the current status of data collected under Federal environmental statutes and related sources, and what does current analysis of these data reveal about the impacts of pollution prevention?
Conclusion 20. TRI waste generation data trends show national waste generation rising more slowly than economic growth and population. Taken together, these data sources suggest that P2 measures have been successful in containing the growth in volume of annual total production wastes. Data Element Evidence Evaluated to Reach Conclusion Total Production-Related Wastes Managed (TPWM) in 1998 and 2004 www.epa.gov/triexplorer/trends.htm
This data is a combination of the releases, transfers, waste management, and energy recovery data elements collected as part of the Toxics Release Inventory. This combined figure provides a measure of overall waste generation that is not accounted for by looking at releases and treatment alone.
2006 Statistical Abstracts of the United States www.census.gov/compendia/statab/
Provides information on the U.S. GDP and population from 1992 to 2004. This information provides context to analyze the magnitude of TPWM trends.
Conclusion 21. Municipal solid waste data show a steady rise in the volume of waste generated over four decades, with recent data suggesting that source reduction may finally be making its presence felt.
Data Element Evidence Evaluated to Reach Conclusion Municipal Solid Waste in the United States: 2005 Facts and Figures www.epa.gov/msw/pubs/mswchar05.pdf
Provides quantities of cumulative municipal solid waste generation in 1960, 1970, 1980, 1990, 2000, 2003, 2004 and 2005. These data demonstrate long and short term trends in cumulative waste generation and trends in the handling of municipal solid waste. This data allows for comparison between municipal solid waste disposal and recovery efforts.
Conclusion 22. Greenhouse gas emission and energy trends show GHG emissions rising slower than economic growth, and the industrial sector achieving an absolute reduction in GHG emissions. EPA GHG emission reduction data can be correlated to national GHG emission data.

88
Data Element Evidence Evaluated to Reach Conclusion Inventory of U.S. Greenhouse Gas Emissions and Sinks: 1990-2005 (2007) http://www.epa.gov/climatechange/emissions/usinventoryreport.html
Provides GHG emissions trend data for the electricity, generation, transportation, industry, agriculture, commercial, residential, and US territories in 1990, 1995, 2000, 2001, 2002, 2003, 2004, and 2005. Also provides quantified SF6 emissions levels in 1990, 1995, 2000, 2001, 2002, 2003, 2004, and 2005, which portray a trend reflective of economic incentives and P2 activities.
2006 Statistical Abstracts of the United States www.census.gov/compendia/statab/
Provides information on the U.S. GDP in both 1990 and 2005. This information provides a means to compare greenhouse gas emissions trends to economic growth.
Energy Trends in Selected Manufacturing Sectors (March 2007) http://www.epa.gov/sectors/energy/index.html
Provides quantified energy use by sector (residential, commercial, industrial, and transportation) from 1970 to 2005
SF6 Emissions Reduction Partnership for Electric Power Systems Website http://www.epa.gov/electricpower-sf6/
Provides quantitative and qualitative information about the program’s purpose and membership requirements.
Energy Star – Overview of 2005 Achievements http://www.epa.gov/appdstar/pdf/CPPD2005.pdf
Provides the quantity of greenhouse gas emission reductions from Energy Star activities in 2005, and evidence of a common measurement methodology at the program and national levels.
Toward a Cleaner Future: Office of Transportation and Air Quality Progress Report (2005) www.epa.gov/oms/about/420r05011.pdf
Provides quantitative information on the reduction of CO2 anticipated from 2005 SmartWay Partner commitments. Provides evidence of a common measurement methodology for greenhouse gas emission reductions..
WasteWise 2005 Annual Report http://www.epa.gov/epaoswer/non-hw/reduce/wstewise/pubs/report05.pdf
Provides a 2004 data point of CO2 emission reductions achieved by WasteWise Partners. Provides evidence of a common measurement methodology for greenhouse gas emission reductions..
Federal Electronics Challenge Measurement Spreadsheet (Actuals and Targets)
Provides fiscal year 2005 and 2006 actual environmental results and targets for 2007 through 2011. Provides evidence of a common measurement methodology for greenhouse gas emission reductions..
Electronic Product Environmental Assessment Tool Measurement Spreadsheet (Actuals and Targets)
Provides fiscal year 2006 actual environmental results and targets for 2007 through 2011. Provides evidence of a common measurement methodology for greenhouse gas emission reductions..
Conclusion 23. Interpreting trends in pesticide pollution, in particular, requires an understanding of both quantity and relative risk of pesticides
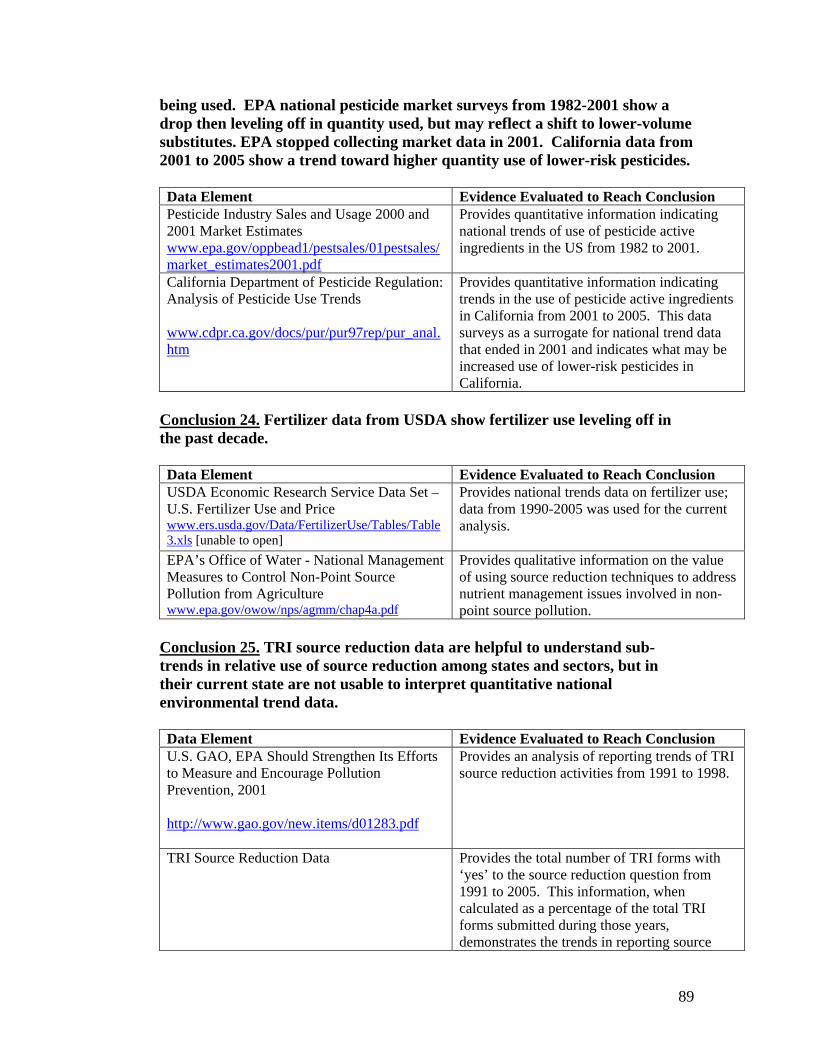
89
being used. EPA national pesticide market surveys from 1982-2001 show a drop then leveling off in quantity used, but may reflect a shift to lower-volume substitutes. EPA stopped collecting market data in 2001. California data from 2001 to 2005 show a trend toward higher quantity use of lower-risk pesticides. Data Element Evidence Evaluated to Reach Conclusion Pesticide Industry Sales and Usage 2000 and 2001 Market Estimates www.epa.gov/oppbead1/pestsales/01pestsales/market_estimates2001.pdf
Provides quantitative information indicating national trends of use of pesticide active ingredients in the US from 1982 to 2001.
California Department of Pesticide Regulation: Analysis of Pesticide Use Trends www.cdpr.ca.gov/docs/pur/pur97rep/pur_anal.htm
Provides quantitative information indicating trends in the use of pesticide active ingredients in California from 2001 to 2005. This data surveys as a surrogate for national trend data that ended in 2001 and indicates what may be increased use of lower-risk pesticides in California.
Conclusion 24. Fertilizer data from USDA show fertilizer use leveling off in the past decade.
Data Element Evidence Evaluated to Reach Conclusion USDA Economic Research Service Data Set – U.S. Fertilizer Use and Price www.ers.usda.gov/Data/FertilizerUse/Tables/Table3.xls [unable to open]
Provides national trends data on fertilizer use; data from 1990-2005 was used for the current analysis.
EPA’s Office of Water - National Management Measures to Control Non-Point Source Pollution from Agriculture www.epa.gov/owow/nps/agmm/chap4a.pdf
Provides qualitative information on the value of using source reduction techniques to address nutrient management issues involved in non-point source pollution.
Conclusion 25. TRI source reduction data are helpful to understand sub-trends in relative use of source reduction among states and sectors, but in their current state are not usable to interpret quantitative national environmental trend data.
Data Element Evidence Evaluated to Reach Conclusion U.S. GAO, EPA Should Strengthen Its Efforts to Measure and Encourage Pollution Prevention, 2001 http://www.gao.gov/new.items/d01283.pdf
Provides an analysis of reporting trends of TRI source reduction activities from 1991 to 1998.
TRI Source Reduction Data Provides the total number of TRI forms with ‘yes’ to the source reduction question from 1991 to 2005. This information, when calculated as a percentage of the total TRI forms submitted during those years, demonstrates the trends in reporting source
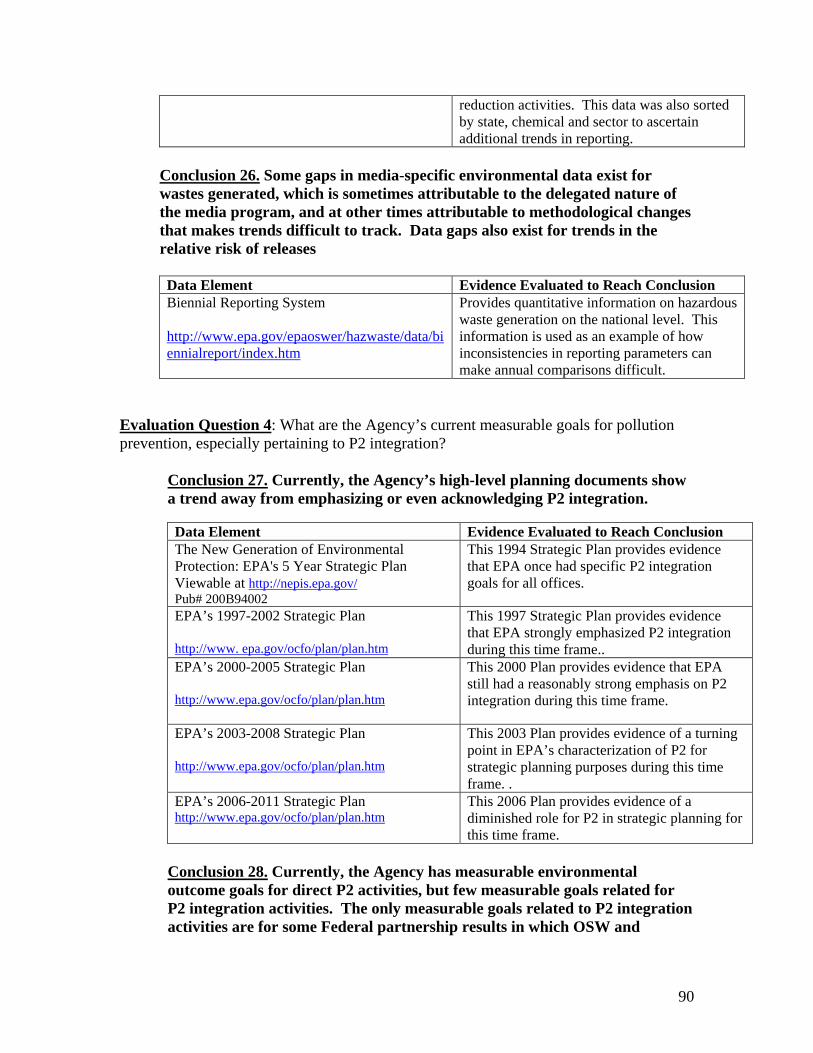
90
reduction activities. This data was also sorted by state, chemical and sector to ascertain additional trends in reporting.
Conclusion 26. Some gaps in media-specific environmental data exist for wastes generated, which is sometimes attributable to the delegated nature of the media program, and at other times attributable to methodological changes that makes trends difficult to track. Data gaps also exist for trends in the relative risk of releases
Data Element Evidence Evaluated to Reach Conclusion Biennial Reporting System http://www.epa.gov/epaoswer/hazwaste/data/biennialreport/index.htm
Provides quantitative information on hazardous waste generation on the national level. This information is used as an example of how inconsistencies in reporting parameters can make annual comparisons difficult.
Evaluation Question 4: What are the Agency’s current measurable goals for pollution prevention, especially pertaining to P2 integration?
Conclusion 27. Currently, the Agency’s high-level planning documents show a trend away from emphasizing or even acknowledging P2 integration. Data Element Evidence Evaluated to Reach Conclusion The New Generation of Environmental Protection: EPA's 5 Year Strategic Plan Viewable at http://nepis.epa.gov/ Pub# 200B94002
This 1994 Strategic Plan provides evidence that EPA once had specific P2 integration goals for all offices.
EPA’s 1997-2002 Strategic Plan http://www. epa.gov/ocfo/plan/plan.htm
This 1997 Strategic Plan provides evidence that EPA strongly emphasized P2 integration during this time frame..
EPA’s 2000-2005 Strategic Plan http://www.epa.gov/ocfo/plan/plan.htm
This 2000 Plan provides evidence that EPA still had a reasonably strong emphasis on P2 integration during this time frame.
EPA’s 2003-2008 Strategic Plan http://www.epa.gov/ocfo/plan/plan.htm
This 2003 Plan provides evidence of a turning point in EPA’s characterization of P2 for strategic planning purposes during this time frame. .
EPA’s 2006-2011 Strategic Plan http://www.epa.gov/ocfo/plan/plan.htm
This 2006 Plan provides evidence of a diminished role for P2 in strategic planning for this time frame.
Conclusion 28. Currently, the Agency has measurable environmental outcome goals for direct P2 activities, but few measurable goals related for P2 integration activities. The only measurable goals related to P2 integration activities are for some Federal partnership results in which OSW and
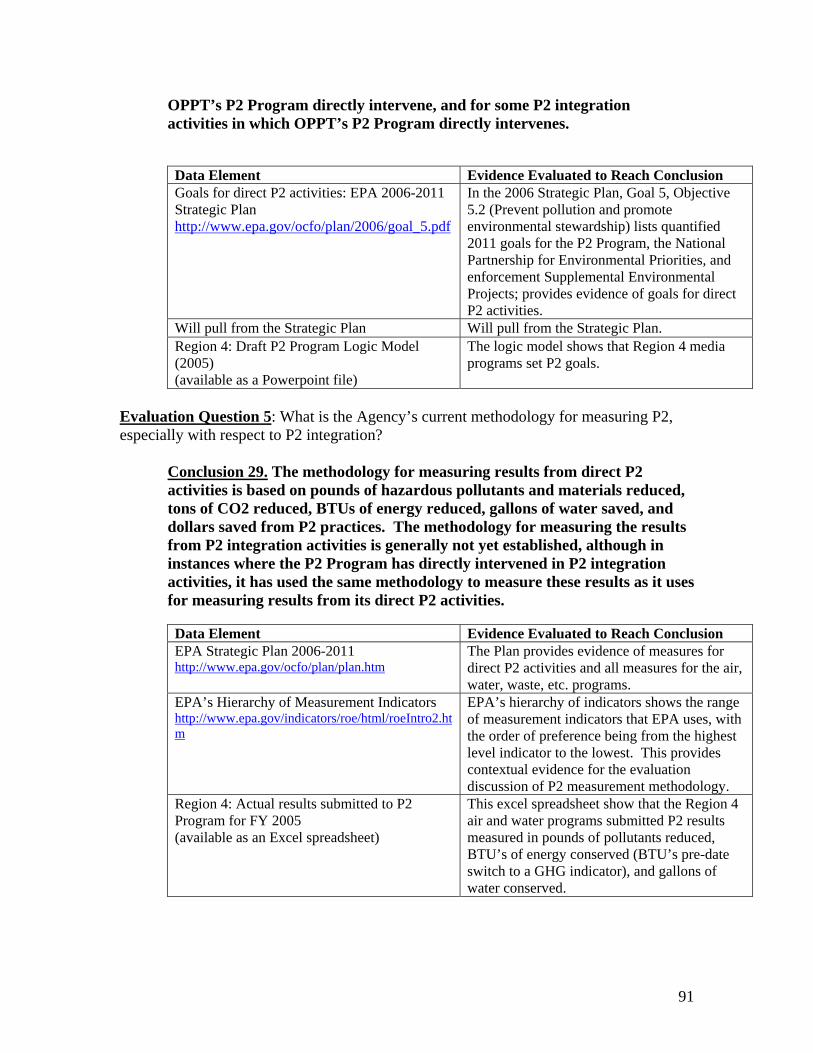
91
OPPT’s P2 Program directly intervene, and for some P2 integration activities in which OPPT’s P2 Program directly intervenes. Data Element Evidence Evaluated to Reach Conclusion Goals for direct P2 activities: EPA 2006-2011 Strategic Plan http://www.epa.gov/ocfo/plan/2006/goal_5.pdf
In the 2006 Strategic Plan, Goal 5, Objective 5.2 (Prevent pollution and promote environmental stewardship) lists quantified 2011 goals for the P2 Program, the National Partnership for Environmental Priorities, and enforcement Supplemental Environmental Projects; provides evidence of goals for direct P2 activities.
Will pull from the Strategic Plan Will pull from the Strategic Plan. Region 4: Draft P2 Program Logic Model (2005) (available as a Powerpoint file)
The logic model shows that Region 4 media programs set P2 goals.
Evaluation Question 5: What is the Agency’s current methodology for measuring P2, especially with respect to P2 integration?
Conclusion 29. The methodology for measuring results from direct P2 activities is based on pounds of hazardous pollutants and materials reduced, tons of CO2 reduced, BTUs of energy reduced, gallons of water saved, and dollars saved from P2 practices. The methodology for measuring the results from P2 integration activities is generally not yet established, although in instances where the P2 Program has directly intervened in P2 integration activities, it has used the same methodology to measure these results as it uses for measuring results from its direct P2 activities. Data Element Evidence Evaluated to Reach Conclusion EPA Strategic Plan 2006-2011 http://www.epa.gov/ocfo/plan/plan.htm
The Plan provides evidence of measures for direct P2 activities and all measures for the air, water, waste, etc. programs.
EPA’s Hierarchy of Measurement Indicators http://www.epa.gov/indicators/roe/html/roeIntro2.htm
EPA’s hierarchy of indicators shows the range of measurement indicators that EPA uses, with the order of preference being from the highest level indicator to the lowest. This provides contextual evidence for the evaluation discussion of P2 measurement methodology.
Region 4: Actual results submitted to P2 Program for FY 2005 (available as an Excel spreadsheet)
This excel spreadsheet show that the Region 4 air and water programs submitted P2 results measured in pounds of pollutants reduced, BTU’s of energy conserved (BTU’s pre-date switch to a GHG indicator), and gallons of water conserved.

92
Evaluation Q5, sub-question 1: Do Agency methods for measuring P2 conform with the P2 Act provision, “Establish standard methods of measurement for source reduction”?
Conclusion 30. The Agency has established standard methods of measuring pollution prevention, but they are mostly applied to direct P2 activities, and not P2 integration activities, with the exception of the measure for reductions in greenhouse gas emissions. . These methods consist of outcome measures and some behavioral change measures tailored to individual project needs. The Agency developed its methodology in consultation with States, which increases the standardization of the Agency methodology. The Agency has used this methodology for several years, and reviews it for continuous improvement. This methodology has been used by the Agency mostly for measuring the results of direct P2 activities, and the similar State methodology has been used to measure a range of P2 activities, including some that could be characterized as P2 integration. The Agency will need to examine which methodologies to employ for measuring its P2 integration results broadly, and would need to tailor any behavioral change measures to meet the needs associated with tracking internal Agency behavior change. Data Element Evidence Evaluated to Reach Conclusion NPPR Results Task Force http://www.p2.org/workgroup/Background.cfm
Provides information about the Agency’s effort to standardize P2 measures.
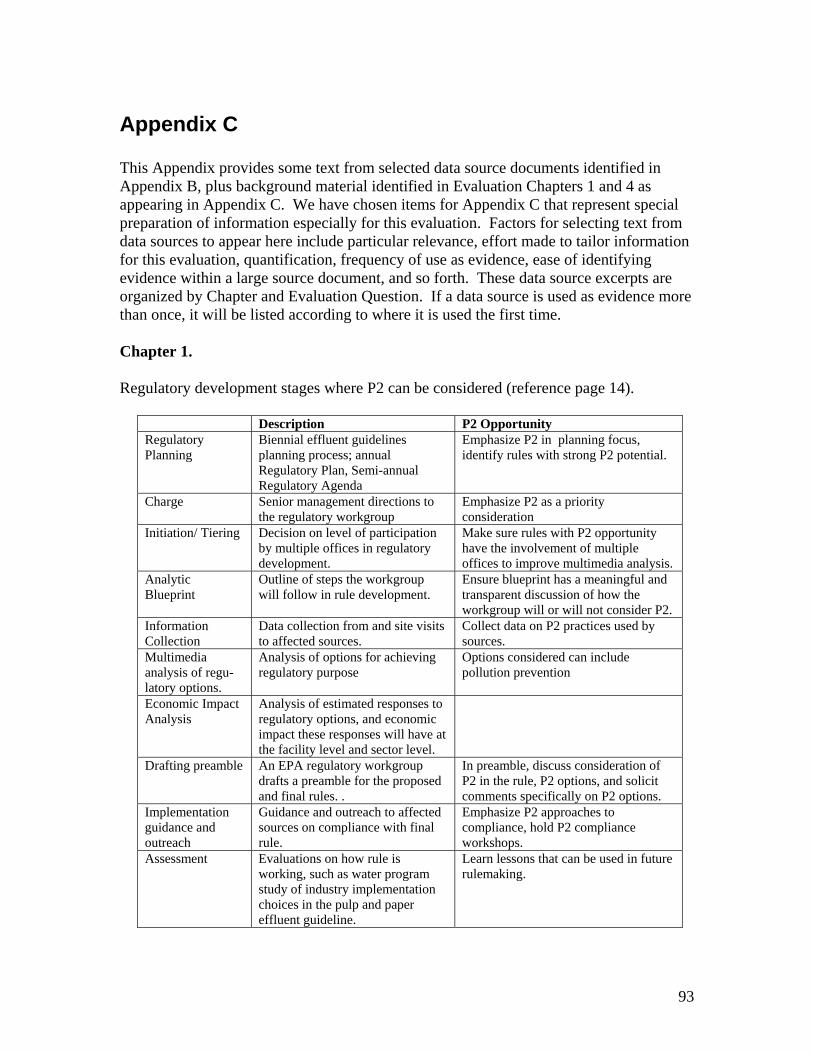
93
Appendix C This Appendix provides some text from selected data source documents identified in Appendix B, plus background material identified in Evaluation Chapters 1 and 4 as appearing in Appendix C. We have chosen items for Appendix C that represent special preparation of information especially for this evaluation. Factors for selecting text from data sources to appear here include particular relevance, effort made to tailor information for this evaluation, quantification, frequency of use as evidence, ease of identifying evidence within a large source document, and so forth. These data source excerpts are organized by Chapter and Evaluation Question. If a data source is used as evidence more than once, it will be listed according to where it is used the first time. Chapter 1. Regulatory development stages where P2 can be considered (reference page 14).
Description P2 Opportunity Regulatory Planning
Biennial effluent guidelines planning process; annual Regulatory Plan, Semi-annual Regulatory Agenda
Emphasize P2 in planning focus, identify rules with strong P2 potential.
Charge Senior management directions to the regulatory workgroup
Emphasize P2 as a priority consideration
Initiation/ Tiering Decision on level of participation by multiple offices in regulatory development.
Make sure rules with P2 opportunity have the involvement of multiple offices to improve multimedia analysis.
Analytic Blueprint
Outline of steps the workgroup will follow in rule development.
Ensure blueprint has a meaningful and transparent discussion of how the workgroup will or will not consider P2.
Information Collection
Data collection from and site visits to affected sources.
Collect data on P2 practices used by sources.
Multimedia analysis of regu-latory options.
Analysis of options for achieving regulatory purpose
Options considered can include pollution prevention
Economic Impact Analysis
Analysis of estimated responses to regulatory options, and economic impact these responses will have at the facility level and sector level.
Drafting preamble An EPA regulatory workgroup drafts a preamble for the proposed and final rules. .
In preamble, discuss consideration of P2 in the rule, P2 options, and solicit comments specifically on P2 options.
Implementation guidance and outreach
Guidance and outreach to affected sources on compliance with final rule.
Emphasize P2 approaches to compliance, hold P2 compliance workshops.
Assessment Evaluations on how rule is working, such as water program study of industry implementation choices in the pulp and paper effluent guideline.
Learn lessons that can be used in future rulemaking.

94
Chapter 4. Evaluation Question 1. How does the Agency currently consider the effect of its programs and regulations on source reduction efforts?
Conclusion 1.
1. Rule and Policy Information Development System RAPIDS Data by Office YES NO NA BLANK TOTAL % YES All Offices
1996 1 6 0 14 21 4.76 1997 3 3 4 7 17 17.65 1998 4 6 11 11 32 12.50 1999 2 3 16 13 34 5.88 2000 3 2 6 5 16 18.75 2001 3 11 23 11 48 6.25 2002 14 11 8 9 42 33.33 2003 7 21 13 5 46 15.22 2004 19 16 23 18 76 25.00 2005 12 28 34 13 87 13.79 2006 6 43 14 10 73 8.22
Total 74 150 152 116 492 15.04 OAR
1996 0 4 0 13 17 0.00 1997 1 3 1 7 12 8.33 1998 3 4 7 9 23 13.04 1999 0 2 9 11 22 0.00 2000 0 2 4 4 10 0.00 2001 2 3 10 4 19 10.53 2002 9 6 5 2 22 40.91 2003 4 11 10 2 27 14.81 2004 15 10 19 3 47 31.91 2005 6 19 22 3 50 12.00 2006 5 24 13 6 48 10.42
Subtotal 45 88 100 64 297 15.15 OW
1996 0 0 0 0 0 ----------- 1997 2 0 0 0 2 100.00 1998 0 0 0 1 1 0.00 1999 2 0 3 0 5 40.00 2000 0 0 1 0 1 0.00 2001 0 1 5 2 8 0.00 2002 4 2 0 2 8 50.00 2003 1 5 1 1 8 12.50 2004 3 0 2 1 6 50.00 2005 3 2 7 3 15 20.00 2006 0 3 1 1 5 0.00
Subtotal 15 13 20 11 59 25.42 OSWER
1996 0 0 0 1 1 0.00 1997 -- -- -- -- -- -- 1998 1 2 0 0 3 33.33

95
RAPIDS Data by Office YES NO NA BLANK TOTAL % YES
1999 0 0 1 0 1 0.00 2000 2 0 0 1 3 66.67 2001 0 1 0 2 3 0.00 2002 1 2 0 5 8 12.50 2003 0 1 0 1 2 0.00 2004 1 1 0 3 5 20.00 2005 2 1 0 3 6 33.33 2006 0 6 0 1 7 0.00
Subtotal 7 14 1 16 38 18.42 OPPTS
1996 1 2 0 0 3 33.33 1997 0 0 2 0 2 0.00 1998 0 0 4 1 5 0.00 1999 0 0 0 1 1 0.00 2000 1 0 0 0 1 100.00 2001 0 3 4 2 9 0.00 2002 0 0 1 0 1 0.00 2003 1 2 1 0 4 25.00 2004 0 1 1 8 10 0.00 2005 1 3 5 1 10 10.00 2006 1 4 0 1 6 16.67
Subtotal 5 15 18 14 52 9.62
2. Preventing Pollution Through Regulations: The Source Reduction Review Project – An Assessment (February, 1996) http://www.epa.gov/p2/pubs/docs/srrp.txt The following excerpt from the Executive Summary identifies the positive lessons learned from the pilot SRRP project, the obstacles identified, the effect of those obstacles, and the recommendations made to EPA leadership.
> The Obstacles. A key contribution of SRRP is identifying Agency-wide obstacles to more effectively integrate multi-media and P2 approaches into regulatory and other mainstream activities, and finding general agreement among SRRP participants that the obstacles should be addressed. The fundamental obstacles that participating programs encountered are: (1) The lack of incentives for inter-office (multi-media) coordination in planning and
budgeting; (2) The piecemeal nature of the statutory framework; (3) Challenges in promoting P2 process changes and innovative technologies; (4) The lack of understanding about cross-media impacts; (5) The lack of resolution about collecting source reduction data through industry
surveys; and (6) Unclear roles for sharing P2 leadership among all parts of the Agency on various
aspects of P2.

96
> Effects of Obstacles. These obstacles have had the following effects: (1) Resource allocations are not conducive to the coordination and cross-media
analysis that is beneficial to the development and evaluation of P2 options, and information sharing among offices is limited;
(2) Deadlines for rules affecting the same industry are generally not synchronized, and regulatory strategies are not developed on an industry-sector basis;
(3) P2 process changes and innovative technologies can be difficult to promote; (4) Potential cross-media impacts sometimes remain unknown; (5) Missing P2 data from surveys sometimes impedes development of source
reduction options; and (6) P2 and cross-media policy issues are not explored as creatively as they might be.
> Recommendations. To make multi-media and P2 perspectives more central in the
development and implementation of EPA rules, the assessment recommends: 1) Emphasizing the key link between cross-media solutions and source reduction; 2) Continuing to place special attention on targeted rules, especially during their
implementation through the permitting and compliance phases; 3) Applying some of the positive SRRP lessons to more rulemakings; 4) Taking steps to start systematically addressing the obstacles to fostering
prevention: − Reinventing the planning and budgeting processes to enhance cross-media and
P2 outcomes; − Developing a cross-media legislative strategy; − Broadening the flexibility of regulatory requirements; − Deepening Agency understanding of cross-media impacts; − Addressing Paperwork Reduction Act concerns about collecting source
reduction data from industry; − Clarifying P2 roles within the Agency; and
5) Linking efforts to address these obstacles to full implementation of the Common Sense approach and reinvention of EPA.
3. Proposed Flexible Air Permitting Rule (9/12/07) http://www.epa.gov/fedrgstr/EPA-AIR/2007/September/Day-12/a17418.pdf The following excerpt shows the breadth of the regulated entities this rule would apply to.
A. What are the regulated entities?
Entities potentially affected by these proposed actions are facilities currently required to obtain title V permits under State, local, tribal, or Federal operating permits programs, and State, local, and tribal governments that are authorized by EPA to issue such operating permits. Other entities potentially affected by this proposed action are facilities required to obtain major NSR permits under State, local, tribal, or Federal major NSR programs, and State, local, and tribal
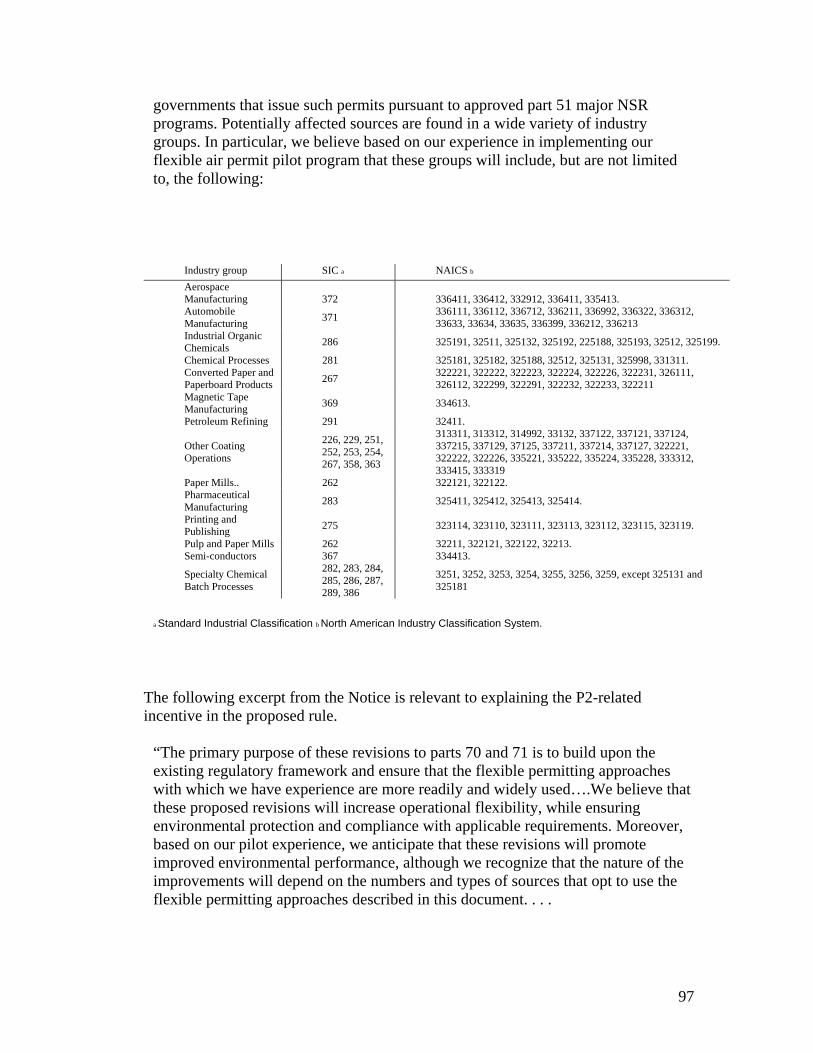
97
governments that issue such permits pursuant to approved part 51 major NSR programs. Potentially affected sources are found in a wide variety of industry groups. In particular, we believe based on our experience in implementing our flexible air permit pilot program that these groups will include, but are not limited to, the following:
Industry group SIC a NAICS b
Aerospace Manufacturing 372 336411, 336412, 332912, 336411, 335413. Automobile Manufacturing 371 336111, 336112, 336712, 336211, 336992, 336322, 336312,
33633, 33634, 33635, 336399, 336212, 336213 Industrial Organic Chemicals 286 325191, 32511, 325132, 325192, 225188, 325193, 32512, 325199.
Chemical Processes 281 325181, 325182, 325188, 32512, 325131, 325998, 331311. Converted Paper and Paperboard Products 267 322221, 322222, 322223, 322224, 322226, 322231, 326111,
326112, 322299, 322291, 322232, 322233, 322211 Magnetic Tape Manufacturing 369 334613.
Petroleum Refining 291 32411.
Other Coating Operations
226, 229, 251, 252, 253, 254, 267, 358, 363
313311, 313312, 314992, 33132, 337122, 337121, 337124, 337215, 337129, 37125, 337211, 337214, 337127, 322221, 322222, 322226, 335221, 335222, 335224, 335228, 333312, 333415, 333319
Paper Mills.. 262 322121, 322122. Pharmaceutical Manufacturing 283 325411, 325412, 325413, 325414.
Printing and Publishing 275 323114, 323110, 323111, 323113, 323112, 323115, 323119.
Pulp and Paper Mills 262 32211, 322121, 322122, 32213. Semi-conductors 367 334413.
Specialty Chemical Batch Processes
282, 283, 284, 285, 286, 287, 289, 386
3251, 3252, 3253, 3254, 3255, 3256, 3259, except 325131 and 325181
a Standard Industrial Classification b North American Industry Classification System.
The following excerpt from the Notice is relevant to explaining the P2-related incentive in the proposed rule.
“The primary purpose of these revisions to parts 70 and 71 is to build upon the existing regulatory framework and ensure that the flexible permitting approaches with which we have experience are more readily and widely used….We believe that these proposed revisions will increase operational flexibility, while ensuring environmental protection and compliance with applicable requirements. Moreover, based on our pilot experience, we anticipate that these revisions will promote improved environmental performance, although we recognize that the nature of the improvements will depend on the numbers and types of sources that opt to use the flexible permitting approaches described in this document. . . .

98
[In our evaluation of the pilot flexible permits] we found that the use of advance approvals and Alternative Operating Scenarios improved operational efficiency at the plants because companies knew in advance what changes were authorized, making resource allocation more efficient and accommodating the typically incremental, iterative nature of industrial process improvements. We also found that P2-related projects became more attractive to the companies when advance approved because such projects could be undertaken without the delay and uncertainty of future case-by-case approvals. In addition, P2-related projects reduced emissions and enabled sources to comply more easily with emissions limits such as plant-wide emissions caps. . . .
“[O]f the five sources that had operated under their flexible permits for 3 or more years, all five achieved 30-to 80-percent reductions in actual plant-wide emissions and/or emissions per unit of production. Actual emissions from the sixth source were reduced by 27 percent in the first year of operation under its flexible permit, but it is difficult to draw conclusions based on a single year of data. One company, using P2, lowered its actual volatile organic compound (VOC) emissions by 70% (from 190 tons per year (tpy) to 56 tpy), while increasing production.
4. Proposed Amendments to the General Provisions of the National Emission Standards for Hazardous Air Pollutants (May 15, 2003)
http://a257.g.akamaitech.net/7/257/2422/14mar20010800/edocket.access.gpo.gov/2002/pdf/02-31899.pdf
The following excerpt from the Federal Register Notice of the proposed amendments shows the breadth of source categories (each with its own regulatory standard) this rule would apply to. The Notice observes that the list is not intended to be exhaustive, but a guide for readers regarding entities likely to be regulated by this action.
Industry Group: Source Categories With Major and Area Sources Fuel Combustion Combustion Turbines Engine Test Facilities Industrial Boilers Process Heaters Reciprocating Internal Combustion Engines Rocket Testing Facilities Non-Ferrous Metals Processing Primary Aluminum Production Primary Copper Smelting Primary Lead Smelting Primary Magnesium Refining Secondary Aluminum Production Secondary Lead Smelting 4E:\FR\FM\15MYP1.SGM 15MYP1 Ferrous Metals Processing Coke By-Product Plants
Coke Ovens: Charging, Top Side, and Door Leaks Coke Ovens: Pushing, Quenching, Battery Stacks Ferroalloys Production: Silicomanganese and Ferromanganese Integrated Iron and Steel Manufacturing Iron Foundries Electric Arc Furnace (EAF) Operation Steel Foundries Steel Pickling—HCl Process Facilities and Hydrochloric Acid Regeneration Mineral Products Processing Alumina Processing Asphalt Concrete Manufacturing Asphalt Processing Asphalt Roofing Manufacturing Asphalt/Coal Tar Application—Metal Pipes

99
Clay Products Manufacturing Lime Manufacturing Mineral Wool Production Portland Cement Manufacturing Refractories Manufacturing Taconite Iron Ore Processing Wool Fiberglass Manufacturing Petroleum and Natural Gas Production and Refining Oil and Natural Gas Production Natural Gas Transmission and Storage Petroleum Refineries—Catalytic Cracking (Fluid and other) Units, Catalytic Reforming Units, and Sulfur Plant Units Petroleum Refineries—Other Sources Not Distinctly Listed Liquids Distribution Gasoline Distribution (Stage 1) Marine Vessel Loading Operations Organic Liquids Distribution (Non- Gasoline) Surface Coating Processes Aerospace Industries Auto and Light Duty Truck Large Appliance Magnetic Tapes Manufacture of Paints, Coatings, and Adhesives Metal Can Metal Coil Metal Furniture Miscellaneous Metal Parts and Products Paper and Other Webs Plastic Parts and Products Printing, Coating, and Dyeing of Fabrics Printing/Publishing Shipbuilding and Ship Repair Wood Building Products Wood Furniture Waste Treatment and Disposal Hazardous Waste Incineration Municipal Landfills Off-Site Waste and Recovery Operations Publicly Owned Treatment Works (POTW) Emissions Sewage Sludge Incineration Site Remediation Solid Waste Treatment, Storage and Disposal Facilities (TSDF) Agricultural Chemicals Production Pesticide Active Ingredient Production Fibers Production Processes Acrylic Fibers/Modacrylic Fibers Production Rayon Production
Spandex Production Food and Agriculture Processes Manufacturing of Nutritional Yeast Cellulose Food Casing Manufacturing Vegetable Oil Production Pharmaceutical Production Processes Pharmaceuticals Production Polymers and Resins Production Acetal Resins Production Acrylonitrile-Butadiene-Styrene Production Alkyd Resins Production Amino Resins Production Boat Manufacturing Butyl Rubber Production Carboxymethylcellulose Production Cellophane Production Cellulose Ethers Production Epichlorohydrin Elastomers Production Epoxy Resins Production Ethylene-Propylene Rubber Production Flexible Polyurethane Foam Production Hypalon (tm) Production Maleic Anhydride Copolymers Production Methylcellulose Production Methyl Methacrylate-Acrylonitrile- Butadiene-Styrene Production Methyl Methacrylate-Butadiene-Styrene Terpolymers Production Neoprene Production Nitrile Butadiene Rubber Production Nitrile Resins Production Non-Nylon Polyamides Production Phenolic Resins Production Polybutadiene Rubber Production Polycarbonates Production Polyester Resins Production Polyether Polyols Production Polyethylene Terephthalate Production Polymerized Vinylidene Chloride Production Polymethyl Methacrylate Resins Production Polystyrene Production Polysulfide Rubber Production Polyvinyl Acetate Emulsions Production Polyvinyl Alcohol Production Polyvinyl Butyral Production Polyvinyl Chloride and Copolymers Production Reinforced Plastic Composites Production Styrene-Acrylonitrile Production Styrene-Butadiene Rubber and Latex Production Production of Inorganic Chemicals Ammonium Sulfate Production—

100
Caprolactam By-Product Plants Carbon Black Production Chlorine Production Cyanide Chemicals Manufacturing Fumed Silica Production Hydrochloric Acid Production Hydrogen Fluoride Production Phosphate Fertilizers Production Phosphoric Acid Manufacturing Uranium Hexafluoride Production Production of Organic Chemicals Ethylene Processes Quaternary Ammonium Compounds Production Synthetic Organic Chemical Miscellaneous Processes Benzyltrimethylammonium Chloride Production Butadiene Dimers Production Carbonyl Sulfide Production Cellulosic Sponge Manufacturing Chelating Agents Production Chlorinated Paraffins Chromic Acid Anodizing Commercial Dry Cleaning (Perchloroethylene)—Transfer Machines Commercial Sterilization Facilities Decorative Chromium Electroplating Dry Cleaning (Petroleum Solvent) Ethylidene Norbornene Production Explosives Production Flexible Polyurethane Foam Fabrication Operations Friction Products Manufacturing Halogenated Solvent Cleaners Hard Chromium Electroplating Hydrazine Production Industrial Cleaning (Perchloroethylene)—Dry-to-dry Machines Industrial Dry Cleaning (Perchloroethylene)—Transfer Machines Industrial Process Cooling Towers Leather Tanning and Finishing Operations
OBPA/1,3-Diisocyanate Production Paint Stripping Operations Photographic Chemicals Production Phthalate Plasticizers Production Plywood and Composite Wood Products Polyether Polyols Production Pulp and Paper Production Rubber Chemicals Manufacturing Rubber Tire Manufacturing Semiconductor Manufacturing Symmetrical Tetrachloropyridine Production ate Jan<31>2003 15:23 May 14, 2003 Jkt 200001 PO Categories With Area Sources Only Agriculture Chemicals & Pesticides Manufacturing Autobody Refinishing Paint Shops Cadmium Refining & Cadmium Oxide Production Cyclic Crude and Intermediate Production Hospital Sterilizers Industrial Inorganic Chemical Manufacturing Industrial Organic Chemical Manufacturing Lead and Acid Battery Manufacturing Medical Waste Incinerators Mercury Cell Chlor-Alkali Plants Miscellaneous Organic Chemical Manufacturing (MON) Municipal Waste Combustors Other Solid Waste Incinerators (Human/ Animal Cremation) Plastic Materials and Resins Manufacturing Plating and Polishing Pressed and Blown Glass & Glassware Manufacturing Secondary Copper Smelting Secondary Nonferrous Metals Stainless and Nonstainless Steel Manufacturing Electric Arc Furnaces Stationary Internal Combustion Engines Synthetic Rubber Manufacturing Wood Preserving

101
The following excerpt from the Notice is relevant to explaining the P2 option in the rule.
“We are proposing to amend the NESHAP General Provisions in 40 CFR part 63, subpart A. The individual NESHAP (which are frequently referred to as MACT standards) are codified as subparts within 40 CFR part 63. We are proposing two options: • Option 1: If a facility completely eliminates all HAP emissions from all sources of emissions regulated by the subpart, it could request to no longer be subject to that subpart. This option would be available only where the subpart does not already require complete elimination of HAP emissions from any of the regulated sources of emissions. • Option 2: If a facility uses P2 to reduce HAP emissions either to the level required by the subpart, or below, it could request ‘‘P2 alternative compliance requirements.’’ The alternative compliance requirements would include monitoring, recordkeeping, reporting, and/or other requirements which match the P2 measures implemented by the facility. Alternative emission limits could not be included. If approved, the alternative compliance requirements would replace specified requirements in the subpart. This option would be available for any regulated portion of the facility; it would not be necessary for the facility to implement P2 on every source of emissions that is subject to the subpart. Under this option, the facility would remain subject to the subpart, but some of the requirements would be changed. Either option would be effective only as long as the facility continued to use the P2 measures and to eliminate or reduce HAP emissions as described in the approved request. If the facility discontinued the P2 measures or failed to eliminate or reduce HAP emissions as approved, all applicable requirements of the subpart would again apply immediately, and the facility would be required to comply beginning on that date. We are also proposing additional incentives for sources at facilities that are members of the Performance Track program.”
5. Proposed Rule, National Emission Standards for Hazardous Air Pollutants; General Provisions (January 3, 2007) http://www.epa.gov/fedrgstr/EPA-AIR/2007/January/Day-03/a22283.htm The proposed amendments provide that a major source may become an area source at any time by limiting its potential to emit hazardous air pollutants (HAP) to below the major source thresholds of 10 tons per year (tpy) of any single HAP or 25 tpy of any combination of HAP. Thus, under the proposed amendments, a major source can become an area source at any time, including after the first substantive compliance date of an applicable MACT standard so long as it limits its potential to emit to below the major source thresholds. It is important to understand the differences in applicability between the p2 amendments, and OIAI and today’s proposal revising that policy. The proposed P2 amendments are targeted at the “affected source” as that term is defined in 40 CFR 63.2. “Affected source” describes the collection of regulated emission points defined as the entity subject to a specific MACT standard. . . .For example, an affected source could be a single production unit or the combination of all production units within a single contiguous area and under common control, or a single emission point or a collection of many related emission points within a
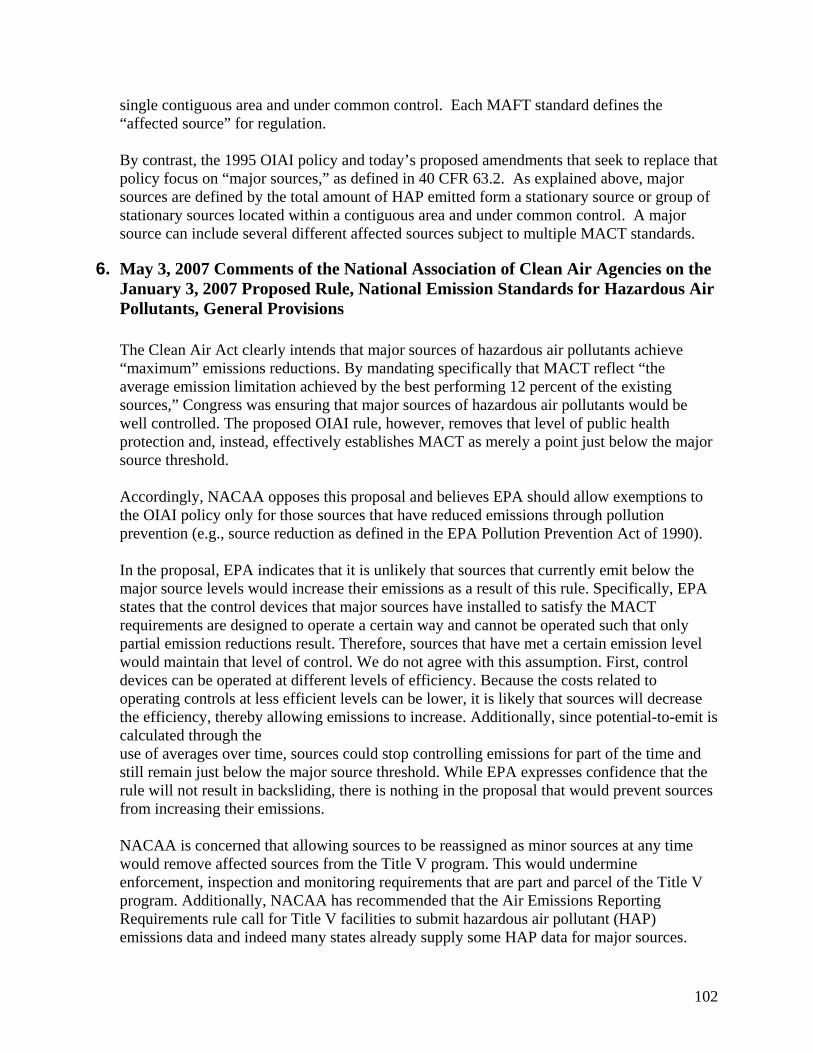
102
single contiguous area and under common control. Each MAFT standard defines the “affected source” for regulation. By contrast, the 1995 OIAI policy and today’s proposed amendments that seek to replace that policy focus on “major sources,” as defined in 40 CFR 63.2. As explained above, major sources are defined by the total amount of HAP emitted form a stationary source or group of stationary sources located within a contiguous area and under common control. A major source can include several different affected sources subject to multiple MACT standards.
6. May 3, 2007 Comments of the National Association of Clean Air Agencies on the January 3, 2007 Proposed Rule, National Emission Standards for Hazardous Air Pollutants, General Provisions
The Clean Air Act clearly intends that major sources of hazardous air pollutants achieve “maximum” emissions reductions. By mandating specifically that MACT reflect “the average emission limitation achieved by the best performing 12 percent of the existing sources,” Congress was ensuring that major sources of hazardous air pollutants would be well controlled. The proposed OIAI rule, however, removes that level of public health protection and, instead, effectively establishes MACT as merely a point just below the major source threshold. Accordingly, NACAA opposes this proposal and believes EPA should allow exemptions to the OIAI policy only for those sources that have reduced emissions through pollution prevention (e.g., source reduction as defined in the EPA Pollution Prevention Act of 1990). In the proposal, EPA indicates that it is unlikely that sources that currently emit below the major source levels would increase their emissions as a result of this rule. Specifically, EPA states that the control devices that major sources have installed to satisfy the MACT requirements are designed to operate a certain way and cannot be operated such that only partial emission reductions result. Therefore, sources that have met a certain emission level would maintain that level of control. We do not agree with this assumption. First, control devices can be operated at different levels of efficiency. Because the costs related to operating controls at less efficient levels can be lower, it is likely that sources will decrease the efficiency, thereby allowing emissions to increase. Additionally, since potential-to-emit is calculated through the use of averages over time, sources could stop controlling emissions for part of the time and still remain just below the major source threshold. While EPA expresses confidence that the rule will not result in backsliding, there is nothing in the proposal that would prevent sources from increasing their emissions. NACAA is concerned that allowing sources to be reassigned as minor sources at any time would remove affected sources from the Title V program. This would undermine enforcement, inspection and monitoring requirements that are part and parcel of the Title V program. Additionally, NACAA has recommended that the Air Emissions Reporting Requirements rule call for Title V facilities to submit hazardous air pollutant (HAP) emissions data and indeed many states already supply some HAP data for major sources.
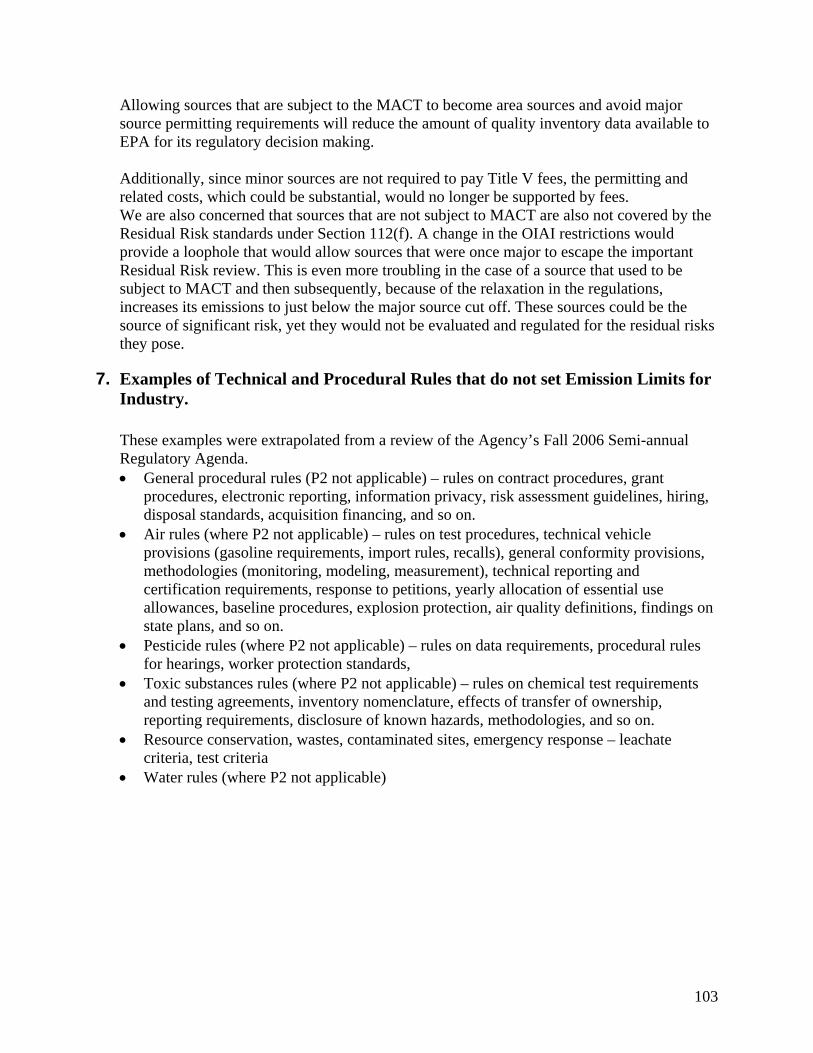
103
Allowing sources that are subject to the MACT to become area sources and avoid major source permitting requirements will reduce the amount of quality inventory data available to EPA for its regulatory decision making. Additionally, since minor sources are not required to pay Title V fees, the permitting and related costs, which could be substantial, would no longer be supported by fees. We are also concerned that sources that are not subject to MACT are also not covered by the Residual Risk standards under Section 112(f). A change in the OIAI restrictions would provide a loophole that would allow sources that were once major to escape the important Residual Risk review. This is even more troubling in the case of a source that used to be subject to MACT and then subsequently, because of the relaxation in the regulations, increases its emissions to just below the major source cut off. These sources could be the source of significant risk, yet they would not be evaluated and regulated for the residual risks they pose.
7. Examples of Technical and Procedural Rules that do not set Emission Limits for Industry.
These examples were extrapolated from a review of the Agency’s Fall 2006 Semi-annual Regulatory Agenda. • General procedural rules (P2 not applicable) – rules on contract procedures, grant
procedures, electronic reporting, information privacy, risk assessment guidelines, hiring, disposal standards, acquisition financing, and so on.
• Air rules (where P2 not applicable) – rules on test procedures, technical vehicle provisions (gasoline requirements, import rules, recalls), general conformity provisions, methodologies (monitoring, modeling, measurement), technical reporting and certification requirements, response to petitions, yearly allocation of essential use allowances, baseline procedures, explosion protection, air quality definitions, findings on state plans, and so on.
• Pesticide rules (where P2 not applicable) – rules on data requirements, procedural rules for hearings, worker protection standards,
• Toxic substances rules (where P2 not applicable) – rules on chemical test requirements and testing agreements, inventory nomenclature, effects of transfer of ownership, reporting requirements, disclosure of known hazards, methodologies, and so on.
• Resource conservation, wastes, contaminated sites, emergency response – leachate criteria, test criteria
• Water rules (where P2 not applicable)

104
Conclusion 2
8. Background on role of P2 in major environmental laws. Pollution Prevention in Major Environmental Laws Law Thematic Specific Pollution Prevention Act of 1990
-P2 is the waste management option of choice, but opportunities are often overlooked by industry and EPA due to institutional barriers
Creates a P2 Office; Directs EPA to establish P2 metrics, create measurable goals, assess pro-gram impacts on P2, and disseminate P2 information and training; Adds P2 section to TRI; Establishes P2 grant program
Clean Air Act (as amended in 1990)
P2 (defined as source reduction) is a primary goal. P2 is largely a state and local government responsibility, based on federal assistance and leadership P2 is a long-range strategy for acid rain and pollution from energy production/use
Directs EPA to emphasize non-regu-latory P2 in R&D and focus on high-risk pollutants; to create a ranking method for P2 technologies; and, to give guidance to States regarding P2 and permits for small businesses.. State programs for P2 assistance for small business stationary sources.
Clean Water Act of 1977 (and subsequent amendments)
No specific recognition of P2, yet repeatedly states need to “prevent, reduce, or eliminate” water pollution P2 is implied requirement for spill prevention planning P2 is appropriate strategy for Great Lakes, Lake Champlain
Advisory board to include P2 focus Create Lake Champlain P2 strategy
Federal Food Drug and Cosmetic Act
No specific mention of P2, but requires EPA to find a reasonable certainty of no harm including using extra safety factors when a full set of data is not available.
EPA’s review of nearly 10,000 tolerances for pesticides in food resulted in numerous revocations and reductions in allowable limit.
Food Quality Protection Act of 1996
-No specific mention of P2, but emphasizes role of “integrated pest management” (IPM), which often has a P2 component aimed at reducing risks of both pests and pesticides
Directs USDA and EPA to jointly implement an R&D and education program for IPM. Requires Federal agencies to adopt IPM via procurement and regulation.
Safe Drinking Water Act of 1974 (and subsequent amendments)
No specific mention of P2, but 1996 amendments emphasize source water protection
N/A
Resource Conservation and Recovery Act of 1976 (and t amendments)
1976 law had no P2 component; 1984 amendments add a substantial P2 (waste minimization) component.
Hazardous waste generators and operators of treatment, storage, and disposal facilities must have a P2 plan in place
Toxic Substances Control Act
-No specific recognition of P2 approaches
N/A
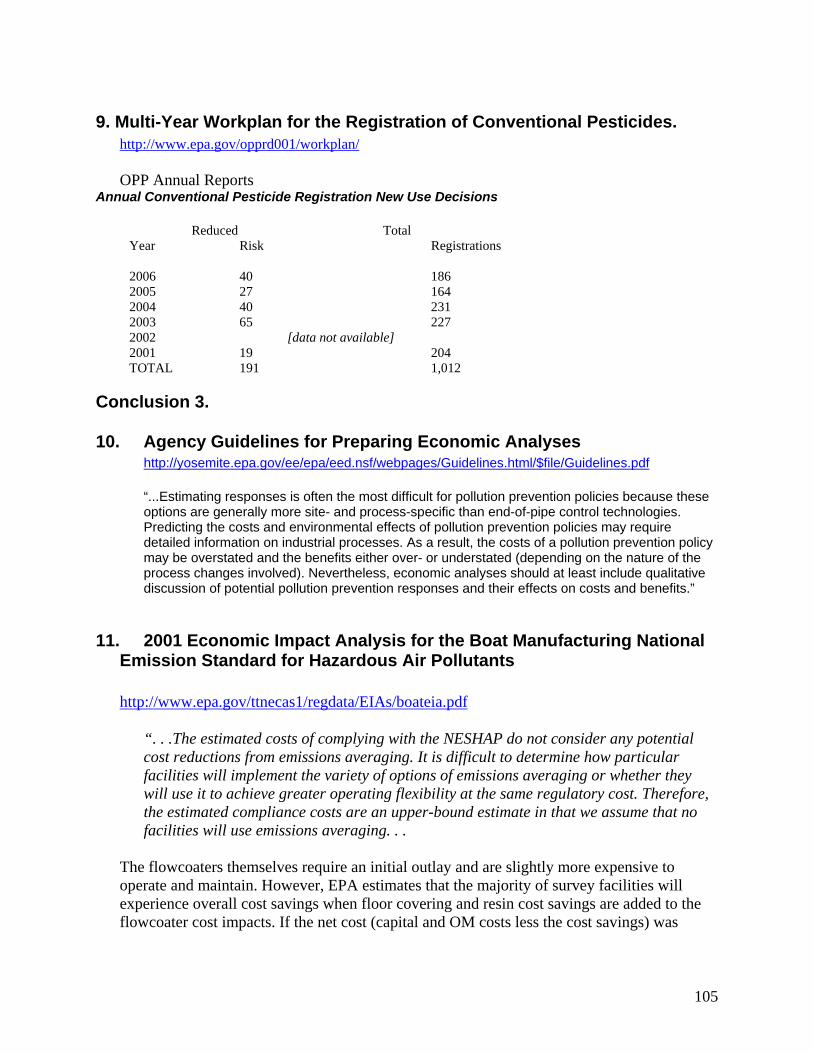
105
9. Multi-Year Workplan for the Registration of Conventional Pesticides. http://www.epa.gov/opprd001/workplan/ OPP Annual Reports
Annual Conventional Pesticide Registration New Use Decisions Reduced Total Year Risk Registrations 2006 40 186 2005 27 164 2004 40 231 2003 65 227 2002 [data not available] 2001 19 204 TOTAL 191 1,012
Conclusion 3.
10. Agency Guidelines for Preparing Economic Analyses http://yosemite.epa.gov/ee/epa/eed.nsf/webpages/Guidelines.html/$file/Guidelines.pdf
“...Estimating responses is often the most difficult for pollution prevention policies because these options are generally more site- and process-specific than end-of-pipe control technologies. Predicting the costs and environmental effects of pollution prevention policies may require detailed information on industrial processes. As a result, the costs of a pollution prevention policy may be overstated and the benefits either over- or understated (depending on the nature of the process changes involved). Nevertheless, economic analyses should at least include qualitative discussion of potential pollution prevention responses and their effects on costs and benefits.”
11. 2001 Economic Impact Analysis for the Boat Manufacturing National Emission Standard for Hazardous Air Pollutants
http://www.epa.gov/ttnecas1/regdata/EIAs/boateia.pdf
“. . .The estimated costs of complying with the NESHAP do not consider any potential cost reductions from emissions averaging. It is difficult to determine how particular facilities will implement the variety of options of emissions averaging or whether they will use it to achieve greater operating flexibility at the same regulatory cost. Therefore, the estimated compliance costs are an upper-bound estimate in that we assume that no facilities will use emissions averaging. . .
The flowcoaters themselves require an initial outlay and are slightly more expensive to operate and maintain. However, EPA estimates that the majority of survey facilities will experience overall cost savings when floor covering and resin cost savings are added to the flowcoater cost impacts. If the net cost (capital and OM costs less the cost savings) was

106
negative for a given surveyed facility, the total cost of switching from spray guns to flowcoaters was assumed to be zero. We assumed that if a facility is expected to see an overall cost saving from changing production processes, the facility will make this change voluntarily when the current capital associated with the process depreciates. Thus, the cost savings are not directly attributable to the regulation and should not be used to offset cost impacts for other regulated materials, such as gel coats or adhesives. . . “
Conclusion 4.
12. 2001 Evaluation of Implementation Experiences with Innovative Air Permits: Results of the U.S. EPA Flexible Permit Implementation Review.
http://www.epa.gov/ttn/oarpg/t5/memoranda/iap_eier.pdf See pages 19-23 for the full discussion under Conclusion 3 of the 2001 evaluation. 2001 Evaluation Conclusion 3: The flexible permits facilitated and encouraged emissions reductions and pollution prevention.
The flexible permits were designed to bring sharper attention to the current level of actual plant-emissions and emissions per unit of production. While the permits generally did not require actual emissions reductions during the permit term, they contained provisions to facilitate and encourage emissions reductions and P2. The permit implementation experience, supported by statements from the sources and permitting authorities, indicates that the permits were effective in facilitating emissions reductions and P2. Of sources which had been operating under their flexible permits for three or more years, all five accomplished a significant lowering of actual plant-wide emissions and/or emissions per unit of production. Achieving environmental benefits was attributed by the companies to several factors, as discussed below. Paraphrased summary observations:
The flexible permits contain mechanisms designed to facilitate and encourage emissions reductions and pollution prevention (P2). Five of the sources with flexible permits lowered actual plant-wide emissions during their permit terms, and the sixth source lowered its emissions per unit of production during the permit term. For example, using pollution prevention (P2), Intel lowered actual emissions of volatile organic compounds (VOCs) from 190 tons/year to 56 tons/year while increasing production. After a substantial voluntary reduction of VOC emissions from 10,000 tons/year, 3M further lowered its actual VOC emissions from 4,300 tons/year to below 1,000 tons/year. This reduction resulted primarily from increased pollution control device performance, greater use of voluntary controls, P2, and reduced production. DaimlerChrysler lowered its
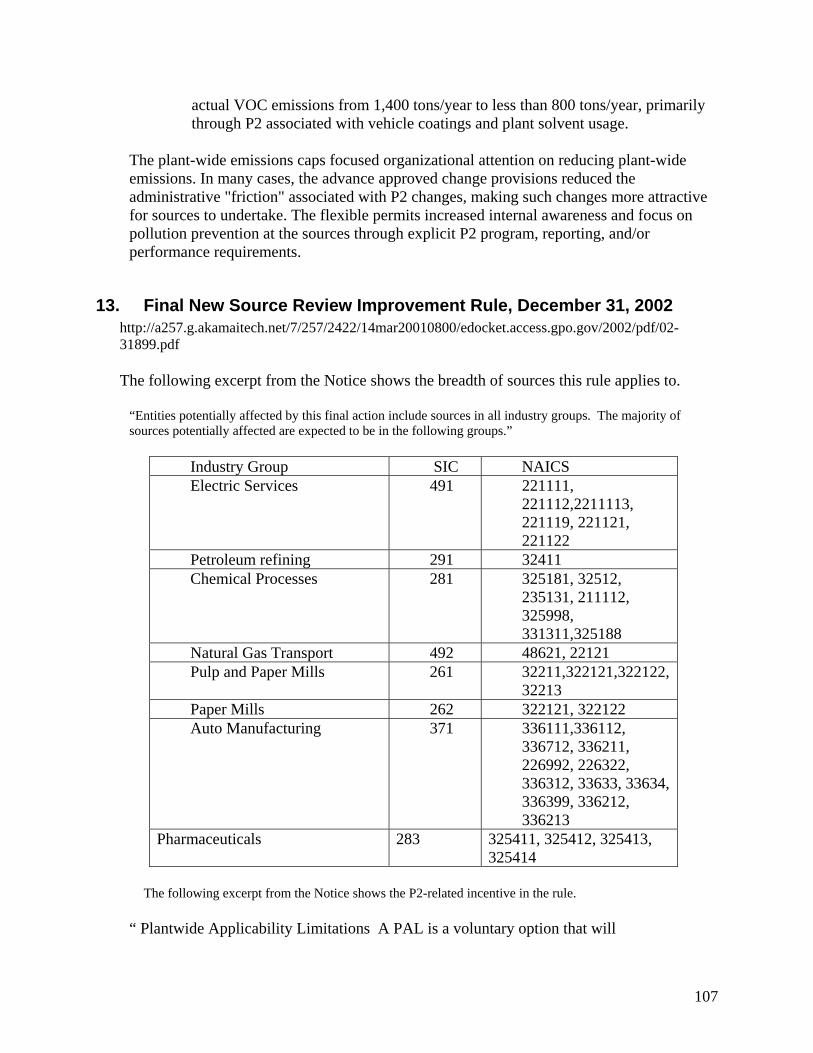
107
actual VOC emissions from 1,400 tons/year to less than 800 tons/year, primarily through P2 associated with vehicle coatings and plant solvent usage.
The plant-wide emissions caps focused organizational attention on reducing plant-wide emissions. In many cases, the advance approved change provisions reduced the administrative "friction" associated with P2 changes, making such changes more attractive for sources to undertake. The flexible permits increased internal awareness and focus on pollution prevention at the sources through explicit P2 program, reporting, and/or performance requirements.
13. Final New Source Review Improvement Rule, December 31, 2002 http://a257.g.akamaitech.net/7/257/2422/14mar20010800/edocket.access.gpo.gov/2002/pdf/02-31899.pdf The following excerpt from the Notice shows the breadth of sources this rule applies to.
“Entities potentially affected by this final action include sources in all industry groups. The majority of sources potentially affected are expected to be in the following groups.”
Industry Group SIC NAICS Electric Services 491 221111,
221112,2211113, 221119, 221121, 221122
Petroleum refining 291 32411 Chemical Processes 281 325181, 32512,
235131, 211112, 325998, 331311,325188
Natural Gas Transport 492 48621, 22121 Pulp and Paper Mills 261 32211,322121,322122,
32213 Paper Mills 262 322121, 322122 Auto Manufacturing 371 336111,336112,
336712, 336211, 226992, 226322, 336312, 33633, 33634, 336399, 336212, 336213
Pharmaceuticals 283 325411, 325412, 325413, 325414
The following excerpt from the Notice shows the P2-related incentive in the rule.
“ Plantwide Applicability Limitations A PAL is a voluntary option that will

108
provide you with the ability to manage facility-wide emissions without triggering major NSR review. We believe that the added flexibility provided under a PAL will facilitate your ability to respond rapidly to changing market conditions while enhancing the environmental protection afforded under the program.
Today we are promulgating a PAL based on plantwide actual emissions. If you keep the emissions from your facility below a plantwide actual emissions cap (that is, an actuals PAL), then these regulations will allow you to avoid the major NSR permitting process when you make alterations to the facility or individual emissions units. In return for this flexibility, you must monitor emissions from all of your emissions units under the PAL. The benefit to you is that you can alter your facility without first obtaining a Federal NSR permit or going through a netting review. A PAL will allow you to make changes quickly at your facility. If you are willing to undertake the necessary recordkeeping, monitoring, and reporting, a PAL offers you flexibility and regulatory certainty.”
14. East Bay Municipal Utility District Wastewater Department (EBMUD, Oakland, CA) 2006 Annual Report http://www.ebmud.com/wastewater/industrial_&_commercial_permits_&_fees/pollution_prevention_program/annual_report/ww_pollution_prevention_annualreport/_2006.pdf [unable to open]
EBMUD is required by its NPDES Permit No. CA0037702.to produce an annual report that includes P2 information. In the 2006 report, Chapter 6 describes accomplishments of its P2 Program. Items mentioned in the report include:
During 2006, more than 3,600 permits were in effect under the Pretreatment and Pollution
Prevention Program including 11 federal categorical minimization permits, 21 Zero Discharge-federal categorical permits, one Zero Discharge-Local permit, 49 non-categorical minimization permits, 34 estimation permits and over 3,500 pollution prevention permits.
The Environmental Services Division performed 249 inspections with sampling to assess compliance by permitted industrial users. District staff also conducted 548 pollution prevention, 1,716 Business Classification Code (BCC) and 26 Zero Discharge inspections, and participated in public outreach activities.
Incorporated a “Pollution Prevention Corner” article into each edition of the District Pipeline, a water bill insert for all 1.2 million District customers.
Expanded implementation of a Regional FOG [fats, oils, grease] program [resulting] in the
issuance of pollution prevention permits to more than 2,000 food handling facilities. Dental Facilities Pollution Prevention Permit…Continue to determine dental facilities’
compliance with permit requirements, including the installation of an ISO 11143 Standard amalgam separator (one-time requirement) and the handling of amalgam waste and spent fixer solution (annual requirement)…More than 96 percent of permitted dental facilities have installed amalgam separators.
15. Characterization of the Underground Injection Control Program for Pollution Prevention
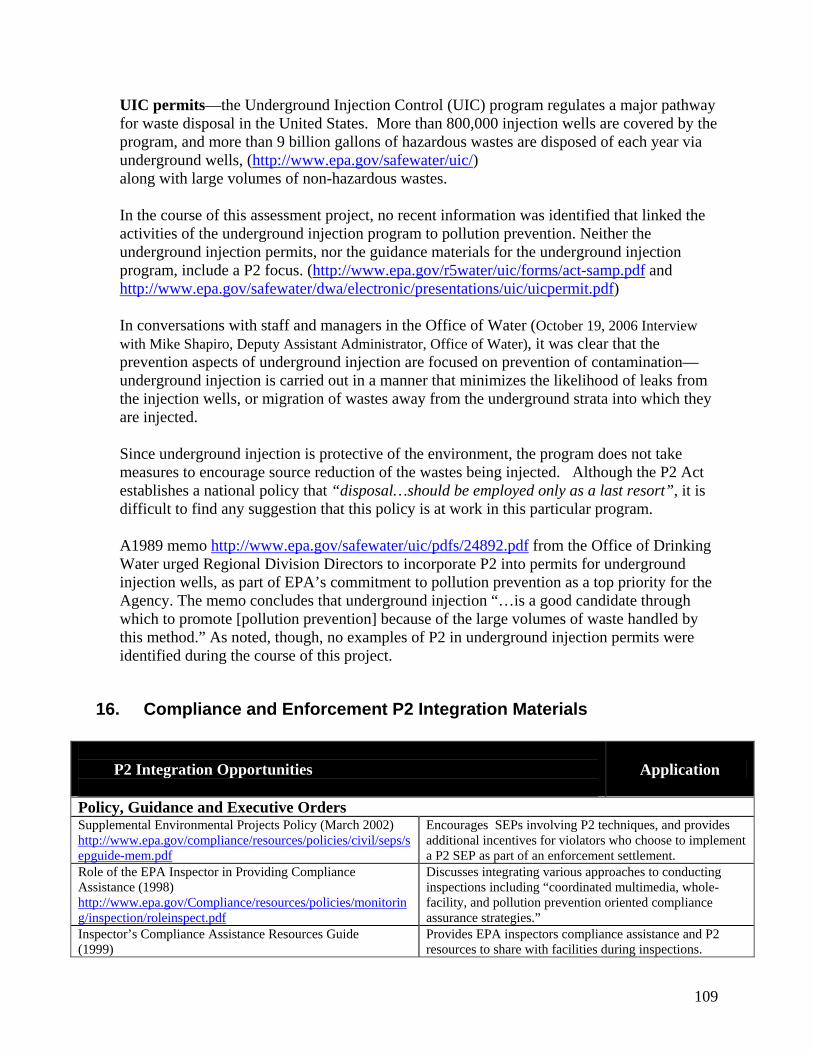
109
UIC permits—the Underground Injection Control (UIC) program regulates a major pathway for waste disposal in the United States. More than 800,000 injection wells are covered by the program, and more than 9 billion gallons of hazardous wastes are disposed of each year via underground wells, (http://www.epa.gov/safewater/uic/) along with large volumes of non-hazardous wastes. In the course of this assessment project, no recent information was identified that linked the activities of the underground injection program to pollution prevention. Neither the underground injection permits, nor the guidance materials for the underground injection program, include a P2 focus. (http://www.epa.gov/r5water/uic/forms/act-samp.pdf and http://www.epa.gov/safewater/dwa/electronic/presentations/uic/uicpermit.pdf) In conversations with staff and managers in the Office of Water (October 19, 2006 Interview with Mike Shapiro, Deputy Assistant Administrator, Office of Water), it was clear that the prevention aspects of underground injection are focused on prevention of contamination—underground injection is carried out in a manner that minimizes the likelihood of leaks from the injection wells, or migration of wastes away from the underground strata into which they are injected. Since underground injection is protective of the environment, the program does not take measures to encourage source reduction of the wastes being injected. Although the P2 Act establishes a national policy that “disposal…should be employed only as a last resort”, it is difficult to find any suggestion that this policy is at work in this particular program.
A1989 memo http://www.epa.gov/safewater/uic/pdfs/24892.pdf from the Office of Drinking Water urged Regional Division Directors to incorporate P2 into permits for underground injection wells, as part of EPA’s commitment to pollution prevention as a top priority for the Agency. The memo concludes that underground injection “…is a good candidate through which to promote [pollution prevention] because of the large volumes of waste handled by this method.” As noted, though, no examples of P2 in underground injection permits were identified during the course of this project.
16. Compliance and Enforcement P2 Integration Materials
P2 Integration Opportunities
Application
Policy, Guidance and Executive Orders Supplemental Environmental Projects Policy (March 2002) http://www.epa.gov/compliance/resources/policies/civil/seps/sepguide-mem.pdf
Encourages SEPs involving P2 techniques, and provides additional incentives for violators who choose to implement a P2 SEP as part of an enforcement settlement.
Role of the EPA Inspector in Providing Compliance Assistance (1998) http://www.epa.gov/Compliance/resources/policies/monitoring/inspection/roleinspect.pdf
Discusses integrating various approaches to conducting inspections including “coordinated multimedia, whole-facility, and pollution prevention oriented compliance assurance strategies.”
Inspector’s Compliance Assistance Resources Guide (1999)
Provides EPA inspectors compliance assistance and P2 resources to share with facilities during inspections.
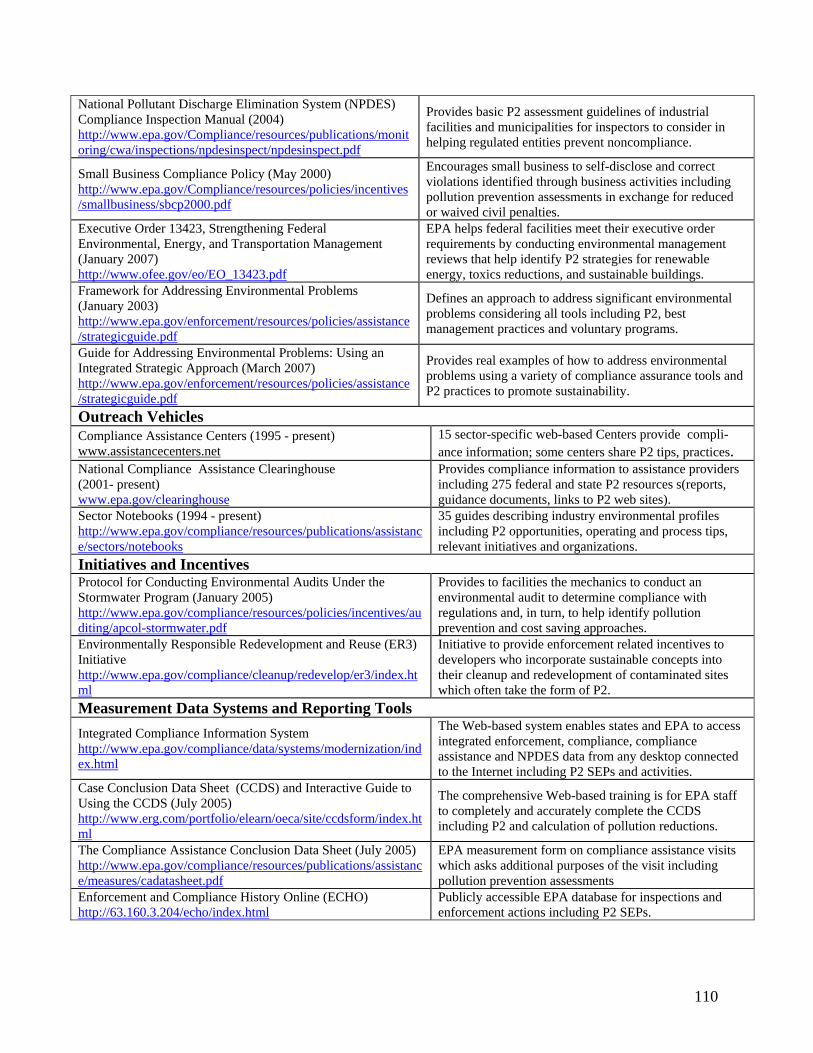
110
National Pollutant Discharge Elimination System (NPDES) Compliance Inspection Manual (2004) http://www.epa.gov/Compliance/resources/publications/monitoring/cwa/inspections/npdesinspect/npdesinspect.pdf
Provides basic P2 assessment guidelines of industrial facilities and municipalities for inspectors to consider in helping regulated entities prevent noncompliance.
Small Business Compliance Policy (May 2000) http://www.epa.gov/Compliance/resources/policies/incentives/smallbusiness/sbcp2000.pdf
Encourages small business to self-disclose and correct violations identified through business activities including pollution prevention assessments in exchange for reduced or waived civil penalties.
Executive Order 13423, Strengthening Federal Environmental, Energy, and Transportation Management (January 2007) http://www.ofee.gov/eo/EO_13423.pdf
EPA helps federal facilities meet their executive order requirements by conducting environmental management reviews that help identify P2 strategies for renewable energy, toxics reductions, and sustainable buildings.
Framework for Addressing Environmental Problems (January 2003) http://www.epa.gov/enforcement/resources/policies/assistance/strategicguide.pdf
Defines an approach to address significant environmental problems considering all tools including P2, best management practices and voluntary programs.
Guide for Addressing Environmental Problems: Using an Integrated Strategic Approach (March 2007) http://www.epa.gov/enforcement/resources/policies/assistance/strategicguide.pdf
Provides real examples of how to address environmental problems using a variety of compliance assurance tools and P2 practices to promote sustainability.
Outreach Vehicles Compliance Assistance Centers (1995 - present) www.assistancecenters.net
15 sector-specific web-based Centers provide compli-ance information; some centers share P2 tips, practices.
National Compliance Assistance Clearinghouse (2001- present) www.epa.gov/clearinghouse
Provides compliance information to assistance providers including 275 federal and state P2 resources s(reports, guidance documents, links to P2 web sites).
Sector Notebooks (1994 - present) http://www.epa.gov/compliance/resources/publications/assistance/sectors/notebooks
35 guides describing industry environmental profiles including P2 opportunities, operating and process tips, relevant initiatives and organizations.
Initiatives and Incentives Protocol for Conducting Environmental Audits Under the Stormwater Program (January 2005) http://www.epa.gov/compliance/resources/policies/incentives/auditing/apcol-stormwater.pdf
Provides to facilities the mechanics to conduct an environmental audit to determine compliance with regulations and, in turn, to help identify pollution prevention and cost saving approaches.
Environmentally Responsible Redevelopment and Reuse (ER3) Initiative http://www.epa.gov/compliance/cleanup/redevelop/er3/index.html
Initiative to provide enforcement related incentives to developers who incorporate sustainable concepts into their cleanup and redevelopment of contaminated sites which often take the form of P2.
Measurement Data Systems and Reporting Tools Integrated Compliance Information System http://www.epa.gov/compliance/data/systems/modernization/index.html
The Web-based system enables states and EPA to access integrated enforcement, compliance, compliance assistance and NPDES data from any desktop connected to the Internet including P2 SEPs and activities.
Case Conclusion Data Sheet (CCDS) and Interactive Guide to Using the CCDS (July 2005) http://www.erg.com/portfolio/elearn/oeca/site/ccdsform/index.html
The comprehensive Web-based training is for EPA staff to completely and accurately complete the CCDS including P2 and calculation of pollution reductions.
The Compliance Assistance Conclusion Data Sheet (July 2005) http://www.epa.gov/compliance/resources/publications/assistance/measures/cadatasheet.pdf
EPA measurement form on compliance assistance visits which asks additional purposes of the visit including pollution prevention assessments
Enforcement and Compliance History Online (ECHO) http://63.160.3.204/echo/index.html
Publicly accessible EPA database for inspections and enforcement actions including P2 SEPs.
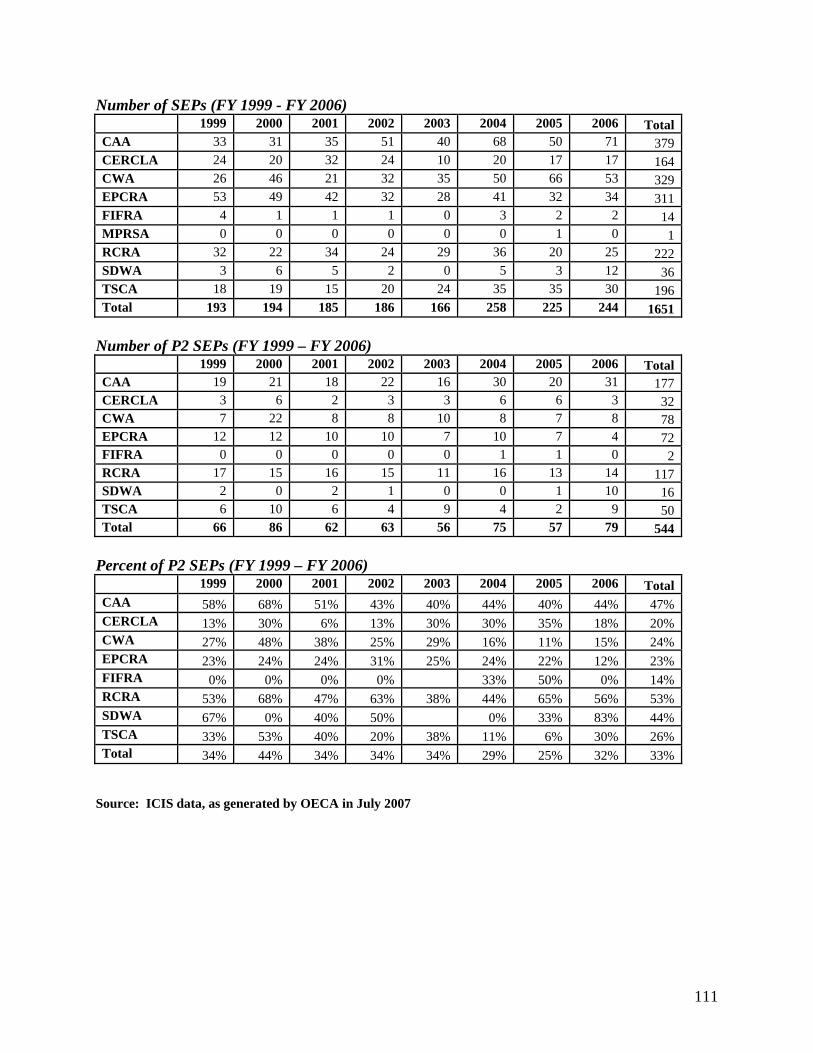
111
Number of SEPs (FY 1999 - FY 2006) 1999 2000 2001 2002 2003 2004 2005 2006 TotalCAA 33 31 35 51 40 68 50 71 379CERCLA 24 20 32 24 10 20 17 17 164CWA 26 46 21 32 35 50 66 53 329EPCRA 53 49 42 32 28 41 32 34 311FIFRA 4 1 1 1 0 3 2 2 14MPRSA 0 0 0 0 0 0 1 0 1RCRA 32 22 34 24 29 36 20 25 222SDWA 3 6 5 2 0 5 3 12 36TSCA 18 19 15 20 24 35 35 30 196Total 193 194 185 186 166 258 225 244 1651
Number of P2 SEPs (FY 1999 – FY 2006) 1999 2000 2001 2002 2003 2004 2005 2006 TotalCAA 19 21 18 22 16 30 20 31 177CERCLA 3 6 2 3 3 6 6 3 32CWA 7 22 8 8 10 8 7 8 78EPCRA 12 12 10 10 7 10 7 4 72FIFRA 0 0 0 0 0 1 1 0 2RCRA 17 15 16 15 11 16 13 14 117SDWA 2 0 2 1 0 0 1 10 16TSCA 6 10 6 4 9 4 2 9 50Total 66 86 62 63 56 75 57 79 544
Percent of P2 SEPs (FY 1999 – FY 2006) 1999 2000 2001 2002 2003 2004 2005 2006 TotalCAA 58% 68% 51% 43% 40% 44% 40% 44% 47%CERCLA 13% 30% 6% 13% 30% 30% 35% 18% 20%CWA 27% 48% 38% 25% 29% 16% 11% 15% 24%EPCRA 23% 24% 24% 31% 25% 24% 22% 12% 23%FIFRA 0% 0% 0% 0% 33% 50% 0% 14%RCRA 53% 68% 47% 63% 38% 44% 65% 56% 53%SDWA 67% 0% 40% 50% 0% 33% 83% 44%TSCA 33% 53% 40% 20% 38% 11% 6% 30% 26%Total 34% 44% 34% 34% 34% 29% 25% 32% 33%
Source: ICIS data, as generated by OECA in July 2007

112
Conclusion 6.
17. List of Partnership Programs
The list of partnership programs compiled by the Office of Policy, Economics, and Innovatioin is as follows.
OAR 23 OPPTS 11 OW 7 OSWER 7
Others 4 Partnership Program Name
Program Office
Program Description Pollution Prevention
Adopt Your Watershed
OW Encourages local citizen to protect watersheds
Focus is largely on monitoring, cleanup and remediation, with little P2 focus
AgStar OAR Biogas (methane) recovery at confined animal feedlots
There is no source reduction from the feedlots, but the program focus on waste-to-energy is sometimes considered P2
Best Workplaces for Commuters
OAR Promotes energy savings through alternative commuting strategies.
P2 via energy conservation
Carpet America Recovery Effort
OSWER MOU between EPA and industry to promote recovered value from used carpets
Promotes reclamation rather than source reduction
Clean Diesel Campaign
OAR Broad strategy to reduce diesel emissions, combining regulatory and partnership approaches
Encourages cleaner fuels, engine retrofit, and reduced idling time as key reduction strategies.
Clean Energy Environment State Partnership Program
OAR Currently works with 15 partner states to develop comprehensive strategies for saving energy and reducing energy-related emissions
Energy efficiency and use of clean fuels are key components of reduction strategies
Climate Leaders OAR Participating companies set voluntary greenhouse gas reduction goals
P2 in the form of energy efficiency is one of the key strategies by which greenhouse gases are being reduced
Coal Combustion Products Partnership
OSWER Beneficial use of coal ash in roadways and other uses
The program has a primary reuse/recovery focus, which reduces raw material and energy demands, leading to source reduction.
Coalbed Methane Outreach Program
OAR Use methane generated during coal mining as an energy source
There is no source reduction from the coal mines, but the program focus on waste-to-energy is sometimes considered P2
Combined Heat and Power Partnership
OAR Encourages simultaneous generation of heat and power from a single source
Promotes P2 via energy efficiency

113
Partnership Program Name
Program Office
Program Description Pollution Prevention
Community-Based Childhood Asthma Programs
OAR Outreach and awareness campaign to lessen the impacts of childhood asthma.
Focus on avoiding exposures to triggers includes advice on P2 approaches for reducing triggers at the source.
Design for the Environment
OPPTS
Incorporates green chemistry into product design and manu-facturing processes
The "benign by design" focus of the program has an inherent P2 focus
Diesel Retrofit Program
OAR Incorporates green chemistry into product design and manufacturing processes
P2 is incorporated in the cleaner engine focus of the program
Energy Star OAR Focuses on reducing energy demand in residential, commercial and industrial settings.
P2 in the form of energy efficiency is an inherent component of the Energy Star program.
Environmental Technology Verification Program
ORD Evaluates new technologies for potential environmental benefit
P2 and energy efficiency technologies are explicitly included in ETV program design
Environmentally Preferable Purchasing
OPPTS Assists federal agencies in complying with “green purchasing” executive order
P2 is one of the central “guiding principles” of EPP
Federal Electronics Challenge
OW Encourages EPP and life-cycle management of federally-purchased electronics
A strong emphasis on recycling and reuse is combined with a P2 focus in terms of energy efficiency and reduced use of toxic chemicals
Great American Woodstove Changeout Campaign
OAR Encourages use of high-efficiency and alternatives to wood stoves as a means of reducing emissions; includes financial incentives (rebates).
Focus on improving efficiency and using lower-emission fuels is inherently P2.
Green Chemistry OPPTS Aims to reduce reliance on hazardous chemicals in designing chemical products
Program is inherently P2, with an emphasis on minimizing reliance on hazardous chemicals, and reducing wastes at source
Green Engineering
OPPTS Life cycle approach to engineering to produce greener products and processes
Program is inherently P2, with an emphasis on minimizing reliance on hazardous chemicals, and reducing wastes at source
Green Suppliers Network
OPPTS Applies the principles of lean manufacturing to manufacturing waste streams
Improving efficiencies of materials handling and energy use can lead to P2 improvements
GreenScapes OSWER Encourages landscaping practices to reduce the overall environmental footprint
A primary focus is the reduction of material and energy inputs, thereby encouraging P2 practices

114
Partnership Program Name
Program Office
Program Description Pollution Prevention
High Production Volume Challenge
OAR [no information available on EPA website]
There is no direct P2 component to this program. Identification of chemical effects may lead to P2 activities, however
High Production Volume Challenge
OPPTS Collects data on health and environmental effects of high-volume chemicals
The program has an inherent P2 focus aimed at reducing wastes at the source
Indoor Air Quality Tools for Schools
OAR Encourages improved indoor air quality in schools through a wide variety of practices.
P2 is included in emissions reduction strategies for improving indoor air

115
Labs 21 OARM Takes a “whole building”
approach to making labs more sustainable, largely focused on energy use
P2 through energy conservation
Landfill Methane Outreach Program
OAR Emphasizes the use of methane gas from decomposition at landfills as an energy source
There is no source reduction from the landfills, but the program focus on waste-to-energy is sometimes considered P2
Mobile Air Conditioning Climate Protection
OAR Focuses on vehicle air conditioners as a source of greenhouse gas emissions
P2 is encouraged via leak prevention, proper maintenance, and new technologies with less greenhouse gas impact
Natural Gas Star OAR Targets the gas distribution sector to reduce losses of methane
Inherently P2, as most of program is leak prevention and improved efficiency of delivery
National Partnership for Environmental Priorities (NPEP)
OSWER Voluntary partnerships with public and private organizations to reduce or eliminate any of 31 targeted priority chemicals.
Promotes an action hierarchy that focuses first on source reduction, and when not feasible, promotes reuse/recycling
Partnership for Safe Water
OW Partners with drinking water treatment facilities to reduce microbial contamination
No conventional P2 components identified
Pesticide Environmental Stewardship Program
OPP Encourages use of techniques that reduce risks of both the pest and pesticides that are based on principles of Integrated Pest Management.
Integrated Pest Management is a sustainable approach to managing pests by combining biological, cultural, physical, and chemical tools to minimize economic, health, and environmental risks. Many IPM approaches are inherently P2.
Plug-In to eCycling
OSWER Education and pilot project program to increase recycling of electronics
Strong focus on reuse, which is inherently P2, and recycling which reduces energy use and GHG emissions
Radon Risk Reduction
OAR Largely focused on reducing risks from radon exposures in the buildings
Little P2, since the focus is remediation, although new construction can be made radon-resistant, a form of source reduction
Reduced Risk for Conventional Pesticides
OPPTS Participants submit extra information on reduced-risk pesticides, in exchange for expedited review
P2 component, in that program encourages faster timelines for using lower-risk pesticides
Schools Chemical Cleanout Campaign
OSWER Seeks to reduce risks from hazardous chemicals at schools by encouraging effective materials management
While largely focused on safe handling and disposal, program also encourages reduced use of hazardous materials.
Sector Strategies OA Promotes the use of Environmental Management Systems, and identifies and removes regulatory burdens to environmental progress
No active P2 component, though EMS may focus attention on source reduction opportunities

116
SF6 Emission Reduction Partnership for Electric Power Systems
OAR Encourages utilities to minimize emissions of sulfur hexafluoride, a potent greenhouse gas
Program relies heavily on source reduction measures—leak prevention and equipment maintenance—as well as recycling. Participants set numerical reduction goals
Smart Way Transport
OAR Works with the freight industry to reduce emissions of greenhouse gases and air pollutants
Program has a substantial P2 focus, based on improving energy efficiency, and reducing idling time, both forms of source reduction
Sustainable Futures
OPPTS Provides expedited review of new chemicals that can demonstrated lower risk
Program adheres to a “Pollution Prevention Framework” that uses risk screening tools to reduce impacts of proposed new chemicals
The SunWise School Program
OAR Education program to teach about protecting oneself from overexposure to the sun
No P2 component
Voluntary Aluminum Industrial Partnership
OAR Aims to reduce emissions of perfluorocarbon (PFC), a greenhouse gas produced during aluminum manufacturing
P2 is inherent in program design, which aims to minimize or eliminate PFC production at the source, through process changes
Voluntary Children's Chemical Evaluation Program
OPPTS Focuses on improving baseline information for 23 chemicals to which children are often exposed
No P2 component to the program, although information availability may lead to actions by producers and consumers than include P2
Volunteer Water Monitoring Program
OW Provides opportunities for citizen involvement in water quality monitoring programs
Program focuses mostly on spotting water quality problems, although P2 is referenced as a potential means of solving problems
WasteWise OSWER Program enlists business and institutional partners to review solid waste generation, and plan steps for reducing wastes
Major focus of the program is recycling, although source reduction of municipal solid waste and greenhouse gases are also encouraged
WaterSense OW Promotes the use of water-efficient products in the home and business
P2 in inherent in efforts to reduce water use.
Watershed/Water Drop Patch Project
OW Watershed and wetlands protections program, in conjunction with the Girl Scouts of America.
While mostly an educational program, P2 is part of the focus of protecting water resources.

117
Evaluation Question 3.
17. Background on TRI
Source: TRI Public Data Release, 2004 www.epa.gov/tri/tridata/tri04/ereport/2004eReport.pdf
How did total production-related waste managed change from 2003 to 2004? The preferred measure of environmental progress is reduction in TRI releases. To the extent that releases are still occurring, another measure of progress may be seen in changes in management practices, in a way that limits potential for human exposure and environmental contamination. We have seen a shift from 2003 to 2004 in how TRI chemical releases are managed. Total production related waste increased by 4% (1.10 billion pounds) from 2003 to 2004. This included an overall decrease in the quantity disposed of or otherwise released of 4% (188 million pounds) and increases in some types of other waste managed. • Treatment on-site increased by 11% (828 million pounds). • Recycling on-site increased by less than 1% (7.8 million pounds). • However, energy recovery onsite decreased by 1% (20 million pounds). • Recycling off-site increased by 22% (419 million pounds) • Treatment off-site increased by 9% (45 million pounds) • Energy recovery off-site decreased by less than 1% (1.4 million pounds)
Source: TRI Public Data Release, 2004 www.epa.gov/tri/tridata/tri04/ereport/2004eReport.pdf

118
Year TPWM GDP (pounds) (billion $, inflation-adjusted) 1992 15,827,869,154 7,337 1993 16,035,677,429 7,533 1994 17,051,677,356 7,836 1995 16,269,888,655 8,032 1996 16,199,740,294 8,329 1997 16,777,938,063 8,704 1998 16,797,221,632 9,067 1999 17,300,772,798 9,470 2000 21,940,500,957 9,817 2001 16,345,659,057 9,891 2002 16,763,964,307 10,075 2003 15,559,571,275 10,381 2004 16,122,640,808 10,842 Source: TRI data from TRI Explorer for 1991 core chemicals www.epa.gov/triexplorer/trends.htm GDP data from 2006 Statistical Abstracts of the United States www.census.gov/compendia/statab/
P2 practices have not reduced TRI total
production wastes…
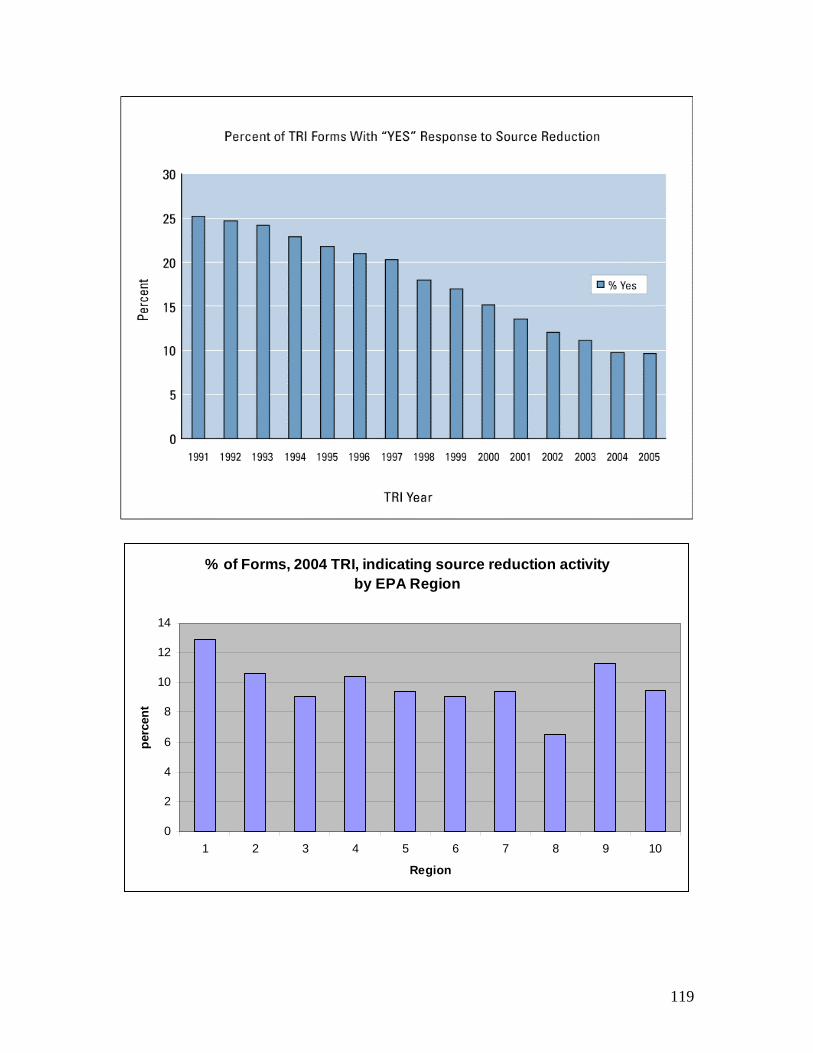
119
% of Forms, 2004 TRI, indicating source reduction activityby EPA Region
0
2
4
6
8
10
12
14
1 2 3 4 5 6 7 8 9 10
Region
perc
ent
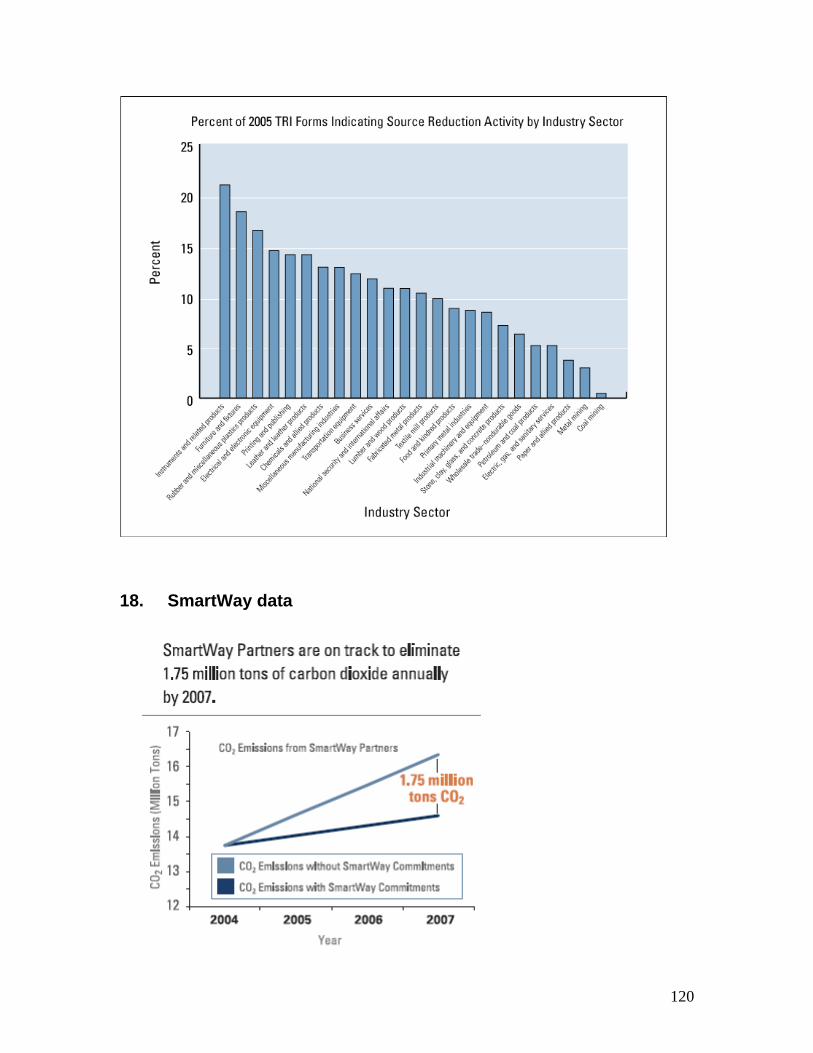
120
18. SmartWay data

121
19. SF6 Emission Reduction Partnership
PARTNER’S RESPONSIBILITIES
1. Establish a base year from which to begin estimating and reporting SF6 emissions. The base year may be the year in which the MOU is signed or up to two years prior; 2. Submit a report each year on system-wide emissions of SF6 and describe technologies and practices implemented to reduce emissions; 3. Develop and distribute a company-wide policy for the proper handling of SF6 within one year of joining the program; 4. Establish an SF6 emissions reduction goal, after careful consideration of all technically and economically feasible options available; and 5. Communicate to employees and cooperate with EPA efforts to publicize the Partnership.
Source: www.epa.gov/highgwp/electricpower-sf6/pdf/finalmou.pdf
20. Municipal Solid Waste Municipal Solid Waste in the United States: 2005 Facts and Figures www.epa.gov/msw/pubs/mswchart05.pdf
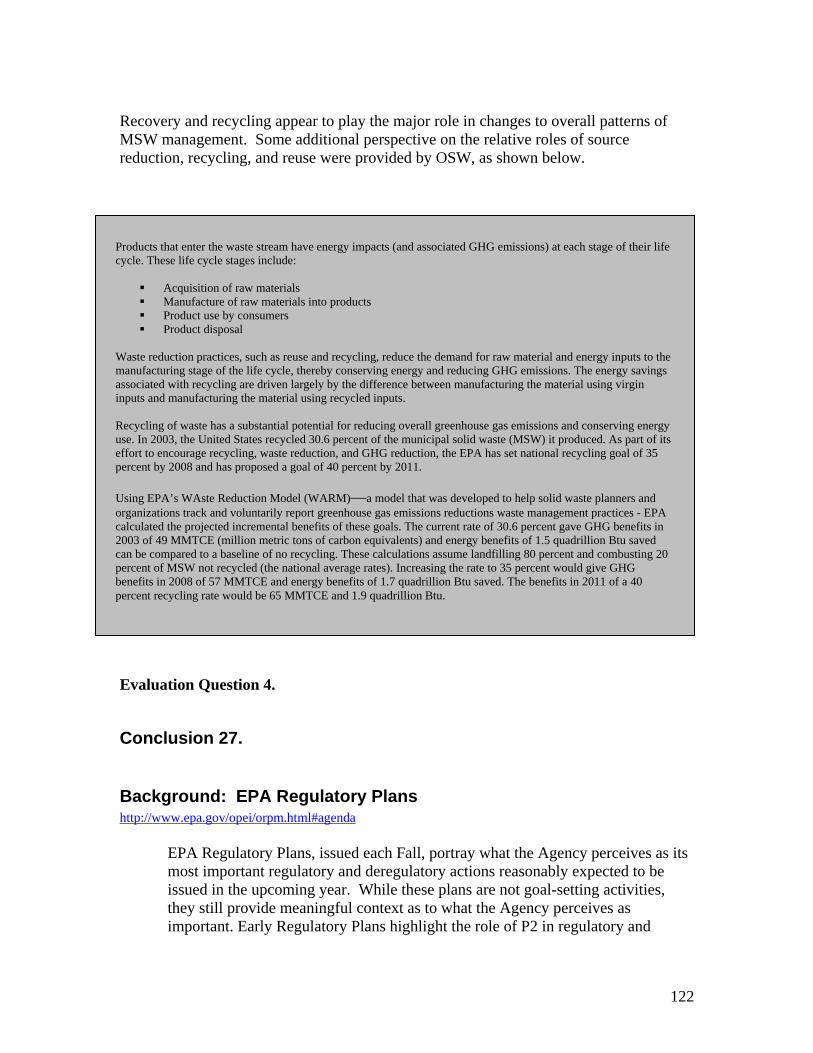
122
Recovery and recycling appear to play the major role in changes to overall patterns of MSW management. Some additional perspective on the relative roles of source reduction, recycling, and reuse were provided by OSW, as shown below.
Evaluation Question 4.
Conclusion 27.
Background: EPA Regulatory Plans http://www.epa.gov/opei/orpm.html#agenda
EPA Regulatory Plans, issued each Fall, portray what the Agency perceives as its most important regulatory and deregulatory actions reasonably expected to be issued in the upcoming year. While these plans are not goal-setting activities, they still provide meaningful context as to what the Agency perceives as important. Early Regulatory Plans highlight the role of P2 in regulatory and
Products that enter the waste stream have energy impacts (and associated GHG emissions) at each stage of their life cycle. These life cycle stages include:
Acquisition of raw materials Manufacture of raw materials into products Product use by consumers Product disposal
Waste reduction practices, such as reuse and recycling, reduce the demand for raw material and energy inputs to the manufacturing stage of the life cycle, thereby conserving energy and reducing GHG emissions. The energy savings associated with recycling are driven largely by the difference between manufacturing the material using virgin inputs and manufacturing the material using recycled inputs. Recycling of waste has a substantial potential for reducing overall greenhouse gas emissions and conserving energy use. In 2003, the United States recycled 30.6 percent of the municipal solid waste (MSW) it produced. As part of its effort to encourage recycling, waste reduction, and GHG reduction, the EPA has set national recycling goal of 35 percent by 2008 and has proposed a goal of 40 percent by 2011. Using EPA’s WAste Reduction Model (WARM)—a model that was developed to help solid waste planners and organizations track and voluntarily report greenhouse gas emissions reductions waste management practices - EPA calculated the projected incremental benefits of these goals. The current rate of 30.6 percent gave GHG benefits in 2003 of 49 MMTCE (million metric tons of carbon equivalents) and energy benefits of 1.5 quadrillion Btu saved can be compared to a baseline of no recycling. These calculations assume landfilling 80 percent and combusting 20 percent of MSW not recycled (the national average rates). Increasing the rate to 35 percent would give GHG benefits in 2008 of 57 MMTCE and energy benefits of 1.7 quadrillion Btu saved. The benefits in 2011 of a 40 percent recycling rate would be 65 MMTCE and 1.9 quadrillion Btu.

123
permit programs. More recent plans emphasize a role for P2 that falls outside the regulatory process:
1995: …permitters are paying more attention to pollution prevention and market mechanisms…EPA also has established a permits improvement team to streamline permit programs, reduce their administrative costs, and enhance pollution prevention. 1996: EPA will propose an integrated rule for the pulp and paper industry that deals with both effluent guidelines and air emission standards to control the release of pollutants to both water and air. The regulations are being developed jointly to provide greater protection to human health and the environment, to promote the concept of pollution prevention… 1997: Currently, chemical manufacturers are required to report the names of the chemicals they produce, the quantity produced, and the locations of manufacturing facilities. EPA plans to propose expanding this to include information on potential exposure to the chemical and how the chemicals are used (e.g., in manufacturing processes). This allows EPA and others to identify the chemicals of highest concern so that the Agency can set goals for chemical assessment, risk management, and prevention programs. The action will also encourage pollution prevention by identifying safer chemical substitutes. 1998-99: [The plans for 1998 and 1999 included a reiteration of much of the above language from the 1995-1997 reports.] 2000: The National Environmental Performance Track Program is being implemented initially with the Achievement Track program… One part of this is changes in the regulations specifying reporting by facilities covered by the MACT provisions of the Clean Air Act. Facilities meeting the criteria for membership in Achievement Track would be eligible for reduced reporting and some other provisions, and facilities that more than meet goals for emissions reductions under MACT via pollution prevention means would qualify for some additional reduced reporting. 2001: We are now changing regulations that set reporting requirements for facilities covered by the MACT provisions of the Clean Air Act. Facilities meeting the criteria for membership in Performance Track would be eligible for reduced reporting and some other provisions, and facilities that more than meet goals for emissions reductions under MACT via pollution prevention means would qualify for some additional reduced reporting. 2002: To encourage the application of pollution prevention principles during the development of new chemicals…EPA has initiated a new and innovative voluntary pilot project entitled Sustainable Futures. The goal of this pilot project is to encourage pollution prevention and the development of inherently low-hazard chemicals. Also, the Agency seeks to gain additional data and experience regarding the pollution prevention, risk reduction, and source reduction benefits of use of hazard, exposure, and risk screening methodologies such as EPA's Pollution Prevention Framework in new product development efforts. …EPA is considering modifying RCRA rules that impact the management of solvent-contaminated shop towels and wipes. This effort would encourage pollution prevention and
1995-1999 plans emphasized P2 in the context of permits, air and water rules, and chemical
reporting.
2000-2001 plans emphasized P2 in air (MACT) permits via
the Performance Track program.
The 2002 Regulatory Plan cites a mix of voluntary and
regulatory activities intended to promote P2.

124
recycling of hazardous solvents, make management standards more consistent with the risks these materials pose, and clarify existing Federal policies regarding these materials. 2003: The science priorities for Compliance and Environmental Stewardship are pollution prevention practices; new technology development; socioeconomics; and decision-making… 2004: The Agency works through its headquarters and regional offices with over 10,000 industries, businesses, non-profit organizations, and state and local governments, on more than 40 voluntary pollution prevention programs and energy conservation efforts. 2005: [ no mention of pollution prevention.] 2006: The Pollution Prevention Act cited as the legal underpinning for the Toxics Release Inventory Reporting Burden Reduction Rule.
2003-2004 Regulatory Plans cite P2 as a science and
voluntary programs priority, while the 2005 plan is silent on
P2.
The 2006 Regulatory Plan cites PPA as the basis for Burden
Reduction under TRI.