Embed Size (px)
Citation preview
South Carolina Department of Natural Resources James A. Waddell Mariculture Center Bluffton, South Carolina
Evaluation of Different Sampling Methods to Monitor Population Size in Biofloc-Based, Intensive Shrimp Culture Systems
Jeffrey F. Brunson, Deliah Arrington, and John W. Leffler
Population Assessment
Efficient feeding strategy Reduce feed costs Improve water quality Reduce solid waste disposal or treatment
Better predict crop size Marketing Satisfied customers
Increased profitability $$$ How many shrimp do I need to feed?
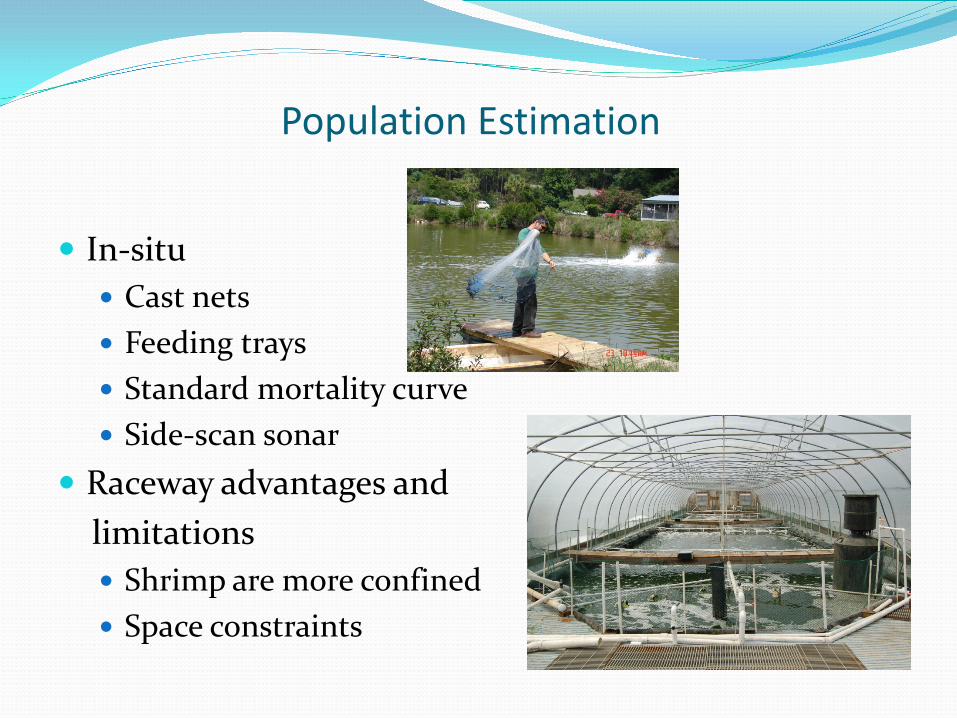
Population Estimation
In-situ Cast nets Feeding trays Standard mortality curve Side-scan sonar
Raceway advantages and limitations
Shrimp are more confined Space constraints
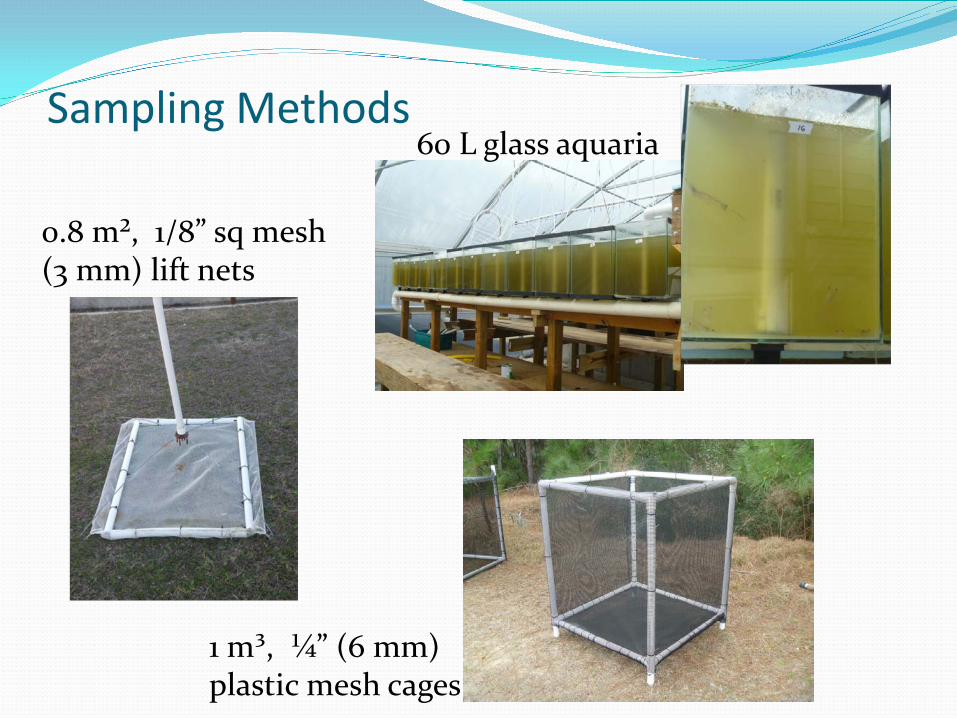
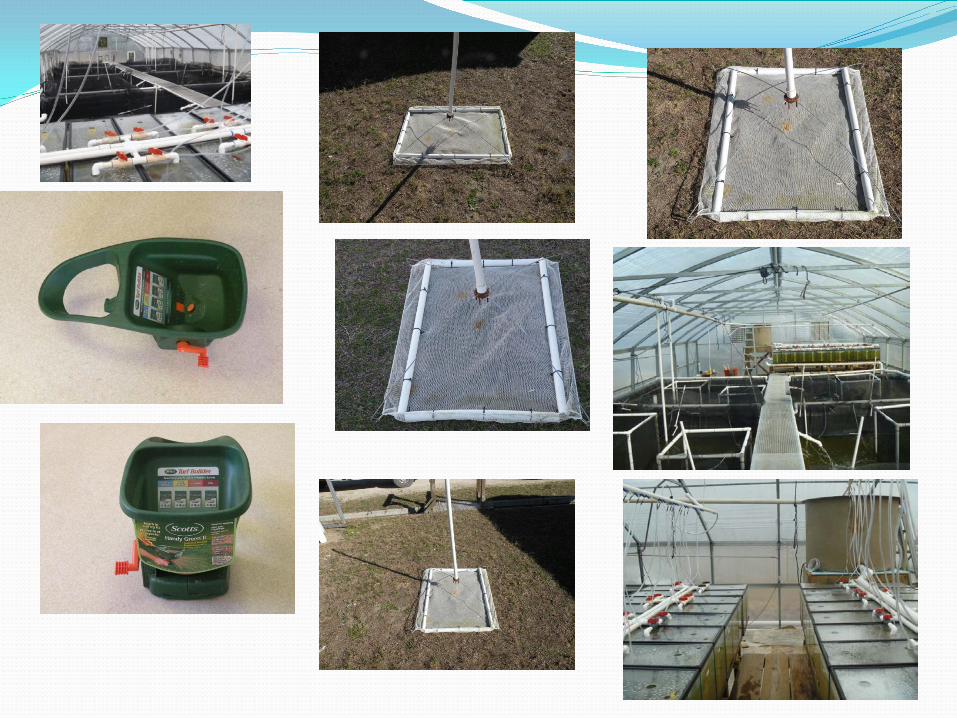
Sampling Methods
1 m³, ¼” (6 mm) plastic mesh cages
0.8 m², 1/8” sq mesh (3 mm) lift nets
60 L glass aquaria
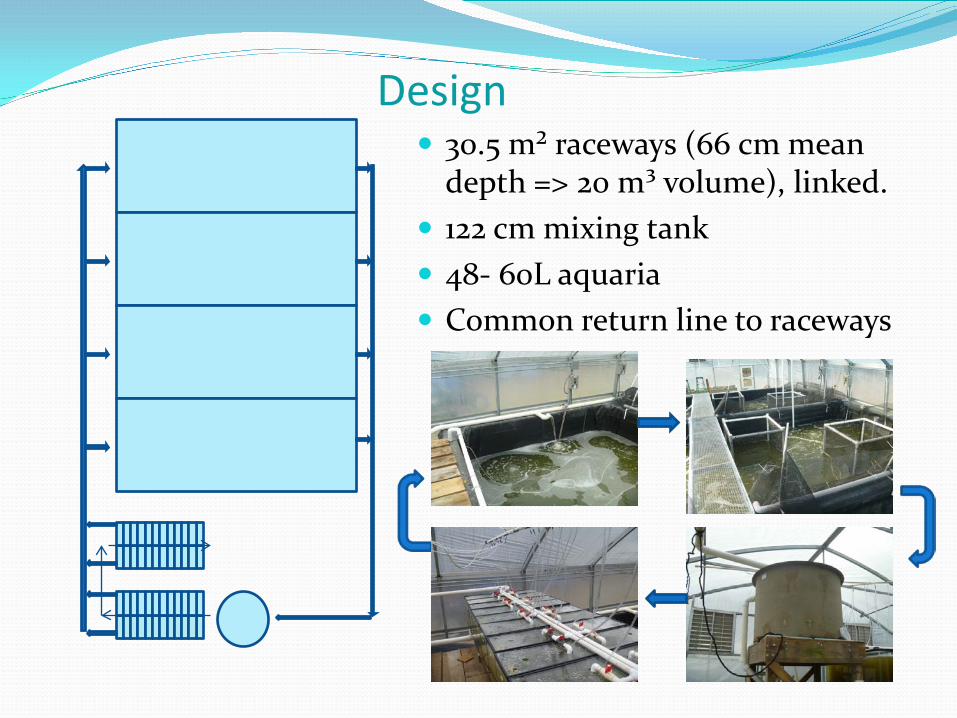
30.5 m² raceways (66 cm mean depth => 20 m³ volume), linked.
122 cm mixing tank 48- 60L aquaria Common return line to raceways
Design
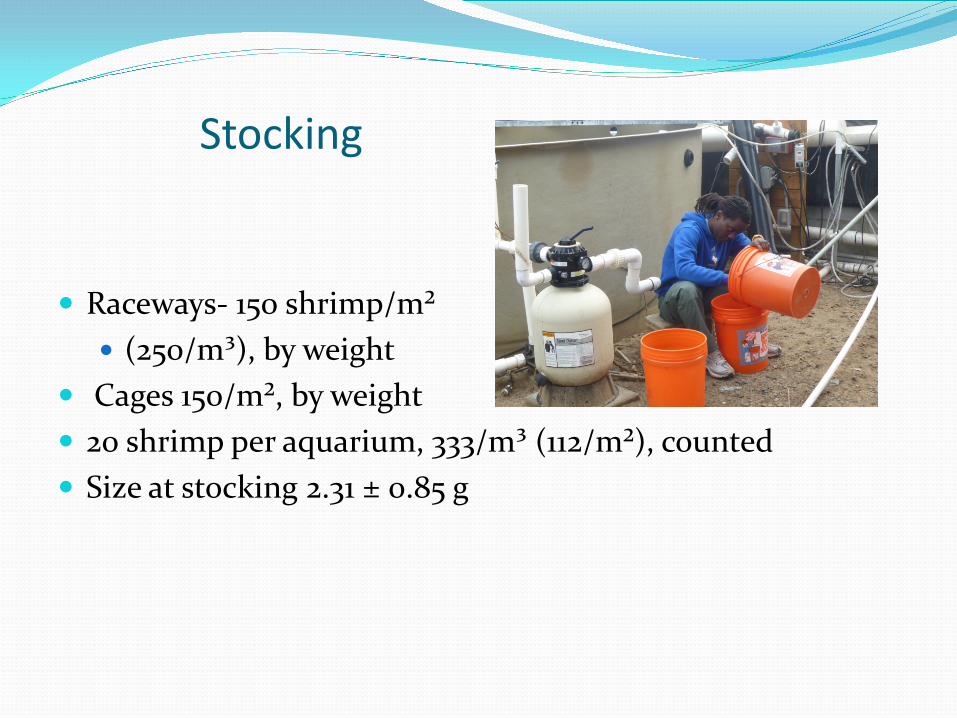
Stocking
Raceways- 150 shrimp/m² (250/m³), by weight
Cages 150/m², by weight 20 shrimp per aquarium, 333/m³ (112/m²), counted Size at stocking 2.31 ± 0.85 g
Management
Shrimp fed Zeigler HyperIntensive 35, three times per day at the same rate
Temperature, DO, pH and salinity checked twice daily Each raceway, 6 aquaria (randomly selected daily)
NH3-N, NO2-N, alkalinity, pH, turbidity, TSS, VSS, PO4, total chlorophyll and chlorophyll a checked weekly.
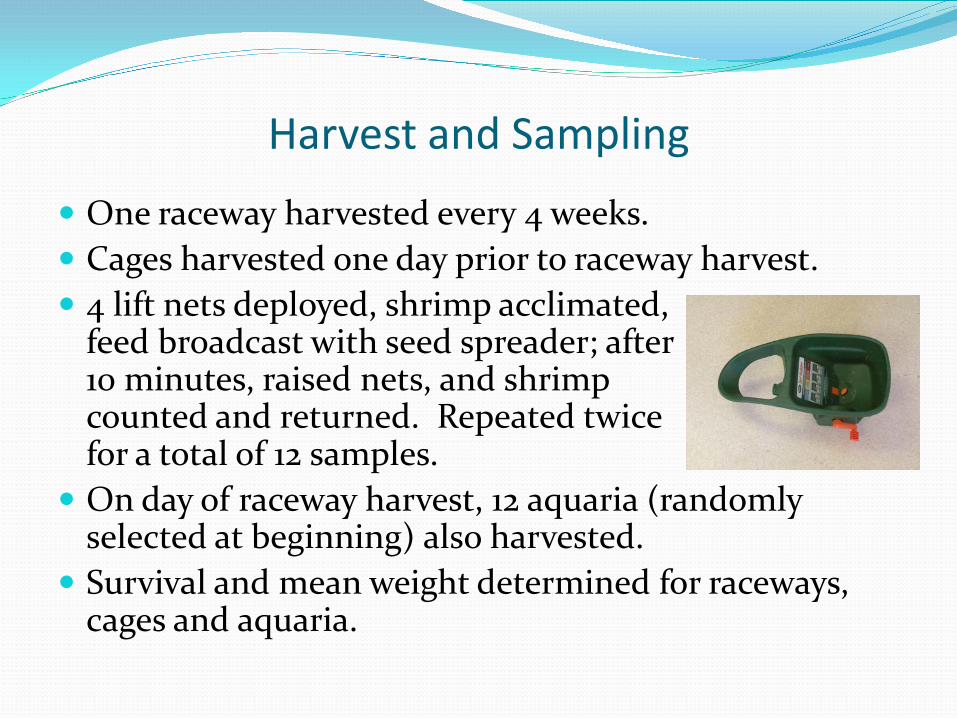
Harvest and Sampling
One raceway harvested every 4 weeks. Cages harvested one day prior to raceway harvest. 4 lift nets deployed, shrimp acclimated,
feed broadcast with seed spreader; after 10 minutes, raised nets, and shrimp counted and returned. Repeated twice for a total of 12 samples.
On day of raceway harvest, 12 aquaria (randomly selected at beginning) also harvested.
Survival and mean weight determined for raceways, cages and aquaria.
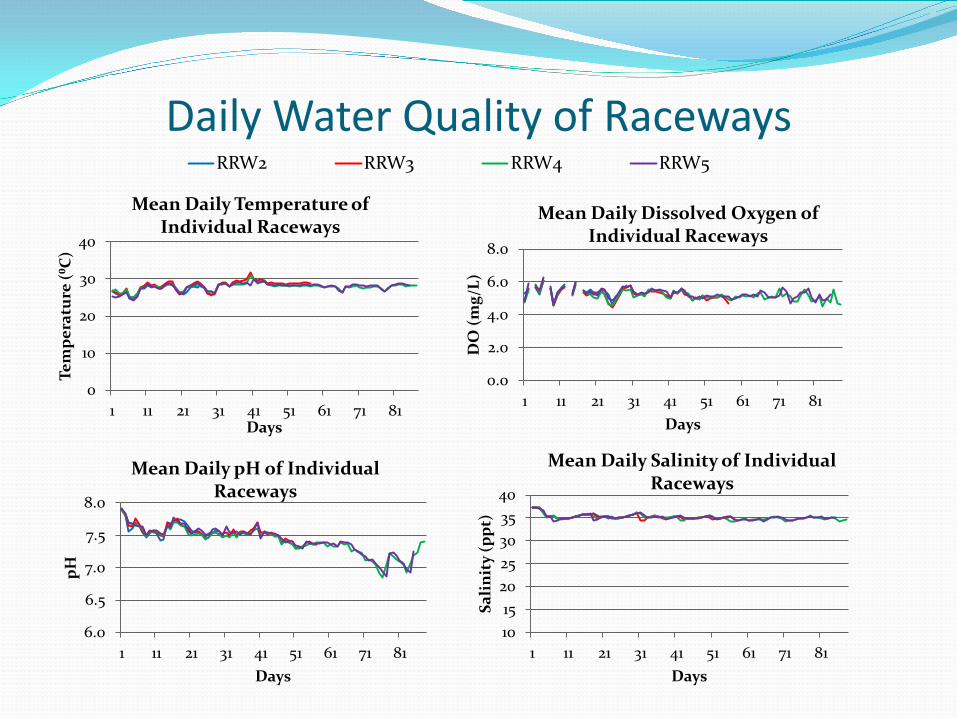
Daily Water Quality of Raceways
0
10
20
30
40
1 11 21 31 41 51 61 71 81
Tem
pera
ture
(⁰C
)
Days
Mean Daily Temperature of Individual Raceways
RRW2 RRW3 RRW4 RRW5
0.0
2.0
4.0
6.0
8.0
1 11 21 31 41 51 61 71 81
DO
(mg/
L)
Days
Mean Daily Dissolved Oxygen of Individual Raceways
6.0
6.5
7.0
7.5
8.0
1 11 21 31 41 51 61 71 81
pH
Days
Mean Daily pH of Individual Raceways
10 15 20 25 30 35 40
1 11 21 31 41 51 61 71 81
Sali
nity
(ppt
)
Days
Mean Daily Salinity of Individual Raceways
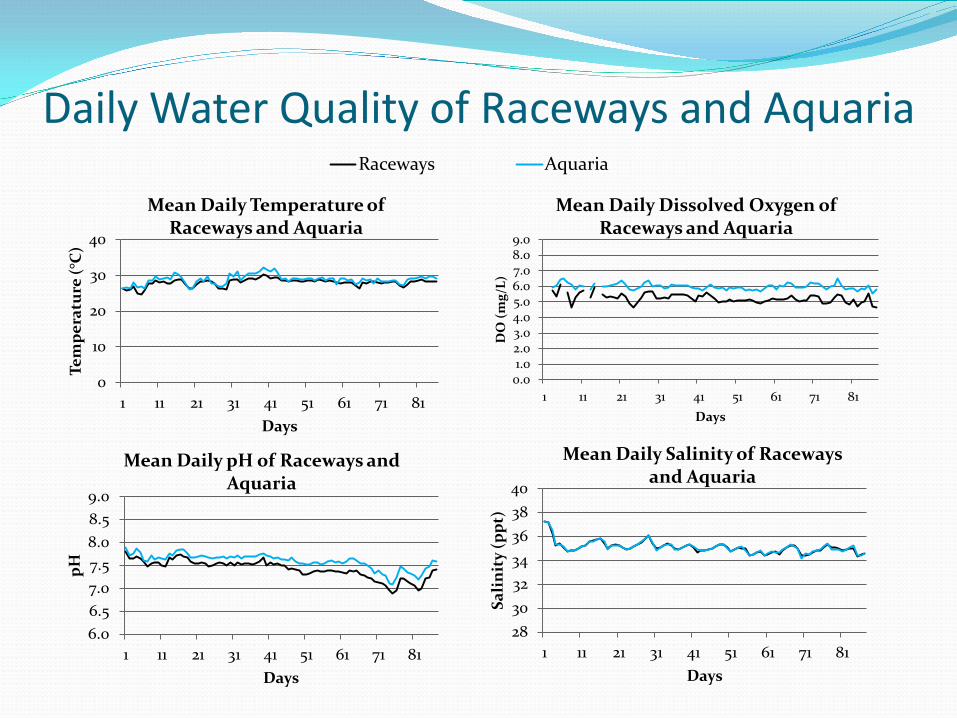
Daily Water Quality of Raceways and Aquaria
0
10
20
30
40
1 11 21 31 41 51 61 71 81
Tem
pera
ture
(°C
)
Days
Mean Daily Temperature of Raceways and Aquaria
Raceways Aquaria
0.0 1.0 2.0 3.0 4.0 5.0 6.0 7.0 8.0 9.0
1 11 21 31 41 51 61 71 81
DO
(mg/
L)
Days
Mean Daily Dissolved Oxygen of Raceways and Aquaria
6.0 6.5 7.0 7.5 8.0 8.5 9.0
1 11 21 31 41 51 61 71 81
pH
Days
Mean Daily pH of Raceways and Aquaria
28 30 32 34 36 38 40
1 11 21 31 41 51 61 71 81
Sali
nity
(ppt
)
Days
Mean Daily Salinity of Raceways and Aquaria
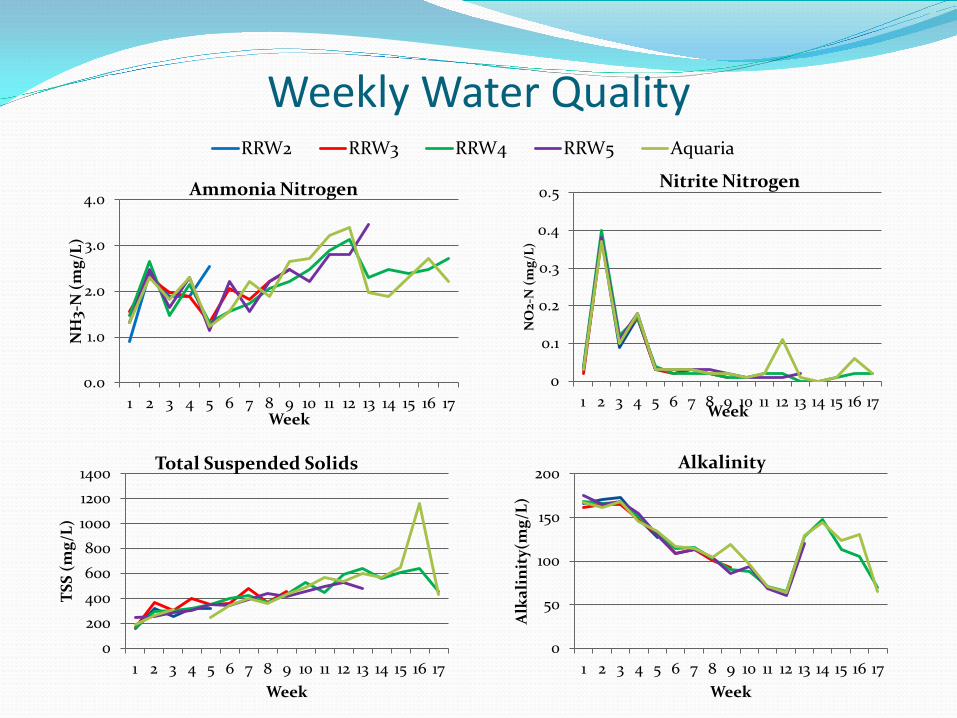
Weekly Water Quality
0
0.1
0.2
0.3
0.4
0.5
1 2 3 4 5 6 7 8 9 10 11 12 13 14 15 16 17
NO
2-N
(mg/
L)
Week
Nitrite Nitrogen
0 200 400 600 800
1000 1200 1400
1 2 3 4 5 6 7 8 9 10 11 12 13 14 15 16 17
TSS
(mg/
L)
Week
Total Suspended Solids
0
50
100
150
200
1 2 3 4 5 6 7 8 9 10 11 12 13 14 15 16 17
Alk
alin
ity(
mg/
L)
Week
Alkalinity
0.0
1.0
2.0
3.0
4.0
1 2 3 4 5 6 7 8 9 10 11 12 13 14 15 16 17
NH
3-N
(mg/
L)
Week
Ammonia Nitrogen
RRW2 RRW3 RRW4 RRW5 Aquaria
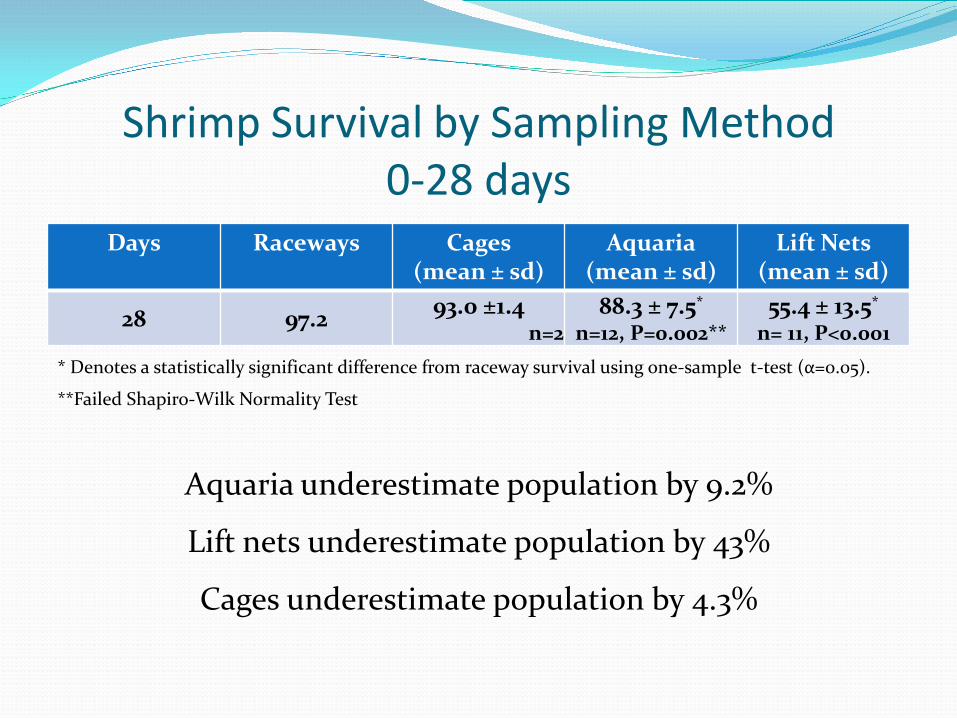
Shrimp Survival by Sampling Method 0-28 days
Days Raceways Cages (mean ± sd)
Aquaria (mean ± sd)
Lift Nets (mean ± sd)
28 97.2 93.0 ±1.4 n=2
88.3 ± 7.5* n=12, P=0.002**
55.4 ± 13.5* n= 11, P<0.001
Aquaria underestimate population by 9.2%
Lift nets underestimate population by 43%
Cages underestimate population by 4.3%
* Denotes a statistically significant difference from raceway survival using one-sample t-test (α=0.05).
**Failed Shapiro-Wilk Normality Test
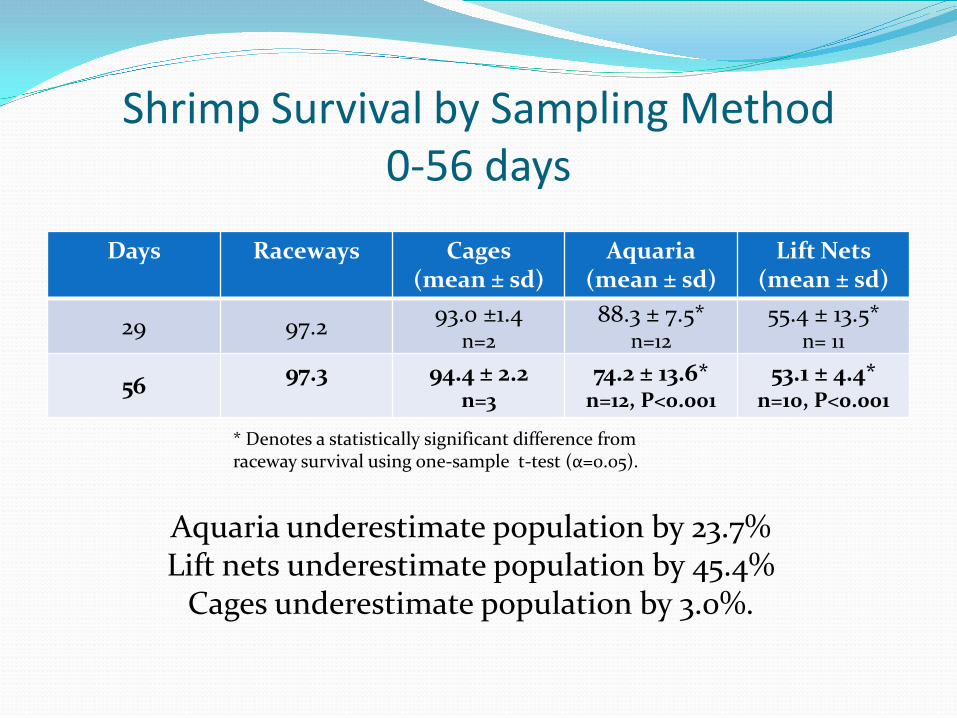
Shrimp Survival by Sampling Method 0-56 days
Days Raceways Cages (mean ± sd)
Aquaria (mean ± sd)
Lift Nets (mean ± sd)
29 97.2 93.0 ±1.4 n=2
88.3 ± 7.5* n=12
55.4 ± 13.5* n= 11
56 97.3 94.4 ± 2.2 n=3
74.2 ± 13.6* n=12, P<0.001
53.1 ± 4.4* n=10, P<0.001
Aquaria underestimate population by 23.7% Lift nets underestimate population by 45.4%
Cages underestimate population by 3.0%.
* Denotes a statistically significant difference from raceway survival using one-sample t-test (α=0.05).
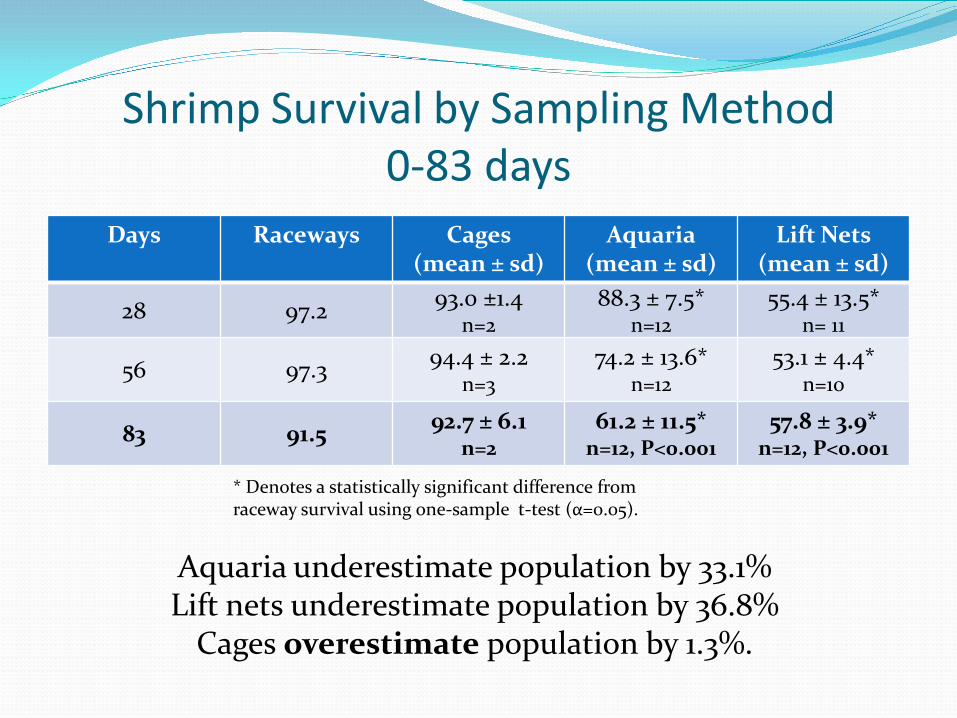
Shrimp Survival by Sampling Method 0-83 days
Days Raceways Cages (mean ± sd)
Aquaria (mean ± sd)
Lift Nets (mean ± sd)
28 97.2 93.0 ±1.4 n=2
88.3 ± 7.5* n=12
55.4 ± 13.5* n= 11
56 97.3 94.4 ± 2.2 n=3
74.2 ± 13.6* n=12
53.1 ± 4.4* n=10
83 91.5 92.7 ± 6.1 n=2
61.2 ± 11.5* n=12, P<0.001
57.8 ± 3.9* n=12, P<0.001
Aquaria underestimate population by 33.1% Lift nets underestimate population by 36.8%
Cages overestimate population by 1.3%.
* Denotes a statistically significant difference from raceway survival using one-sample t-test (α=0.05).
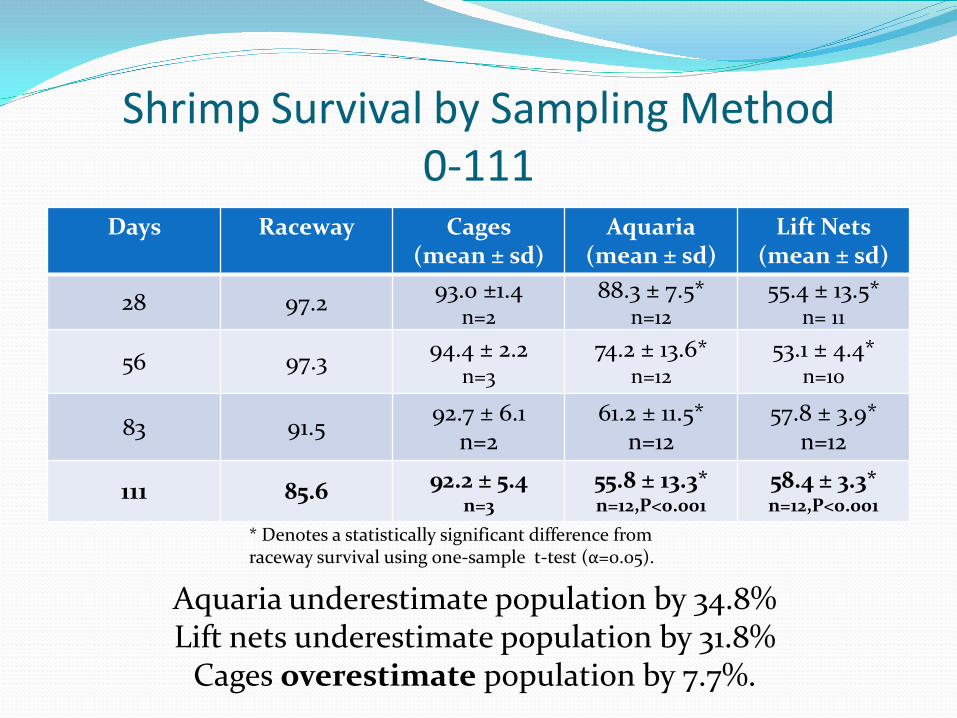
Shrimp Survival by Sampling Method 0-111
Days Raceway Cages (mean ± sd)
Aquaria (mean ± sd)
Lift Nets (mean ± sd)
28 97.2 93.0 ±1.4 n=2
88.3 ± 7.5* n=12
55.4 ± 13.5* n= 11
56 97.3 94.4 ± 2.2 n=3
74.2 ± 13.6* n=12
53.1 ± 4.4* n=10
83 91.5 92.7 ± 6.1 n=2
61.2 ± 11.5* n=12
57.8 ± 3.9* n=12
111 85.6 92.2 ± 5.4 n=3
55.8 ± 13.3* n=12,P<0.001
58.4 ± 3.3* n=12,P<0.001
Aquaria underestimate population by 34.8% Lift nets underestimate population by 31.8%
Cages overestimate population by 7.7%.
* Denotes a statistically significant difference from raceway survival using one-sample t-test (α=0.05).
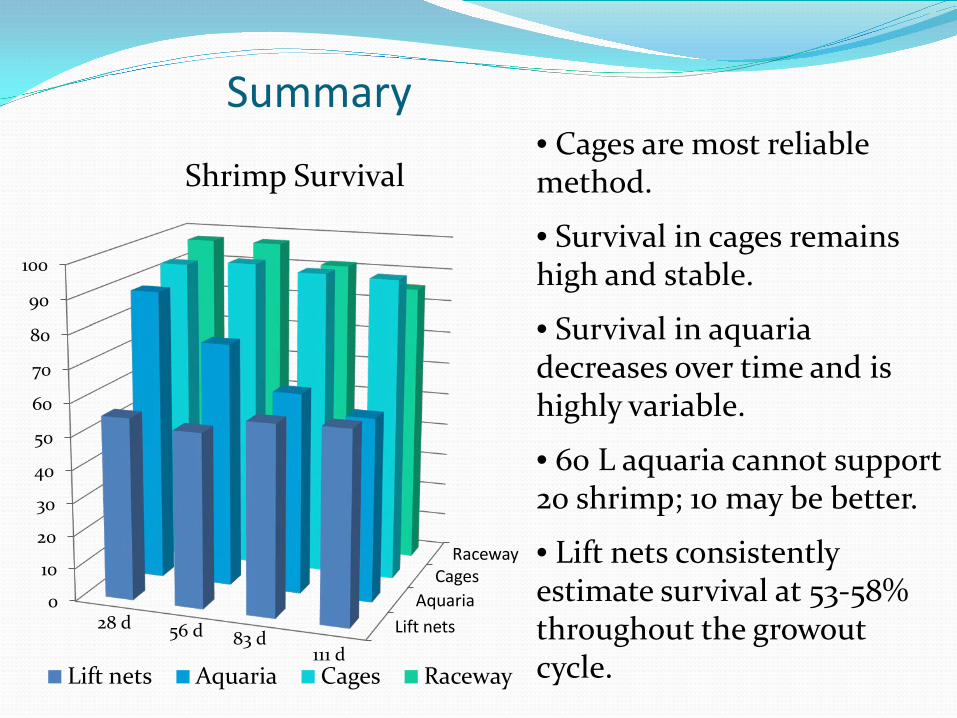
Summary
Lift nets Aquaria
Cages Raceway
0
10
20
30
40
50
60
70
80
90
100
Lift nets Aquaria Cages Raceway
28 d 56 d 83 d 111 d
Shrimp Survival • Cages are most reliable method.
• Survival in cages remains high and stable.
• Survival in aquaria decreases over time and is highly variable.
• 60 L aquaria cannot support 20 shrimp; 10 may be better.
• Lift nets consistently estimate survival at 53-58% throughout the growout cycle.
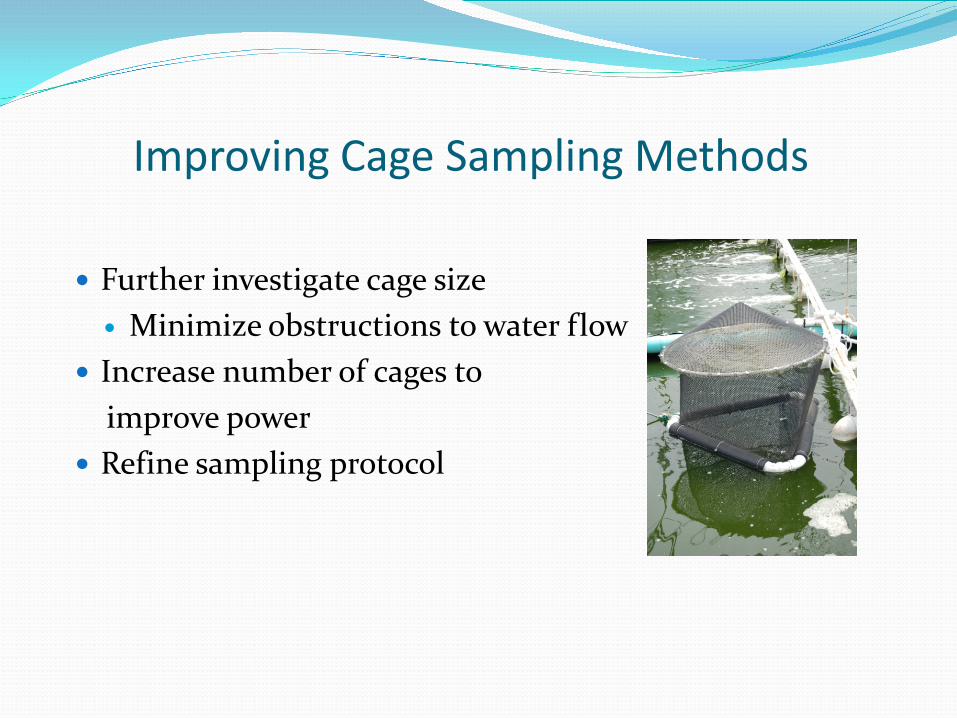
Improving Cage Sampling Methods
Further investigate cage size Minimize obstructions to water flow
Increase number of cages to improve power Refine sampling protocol

Thank you
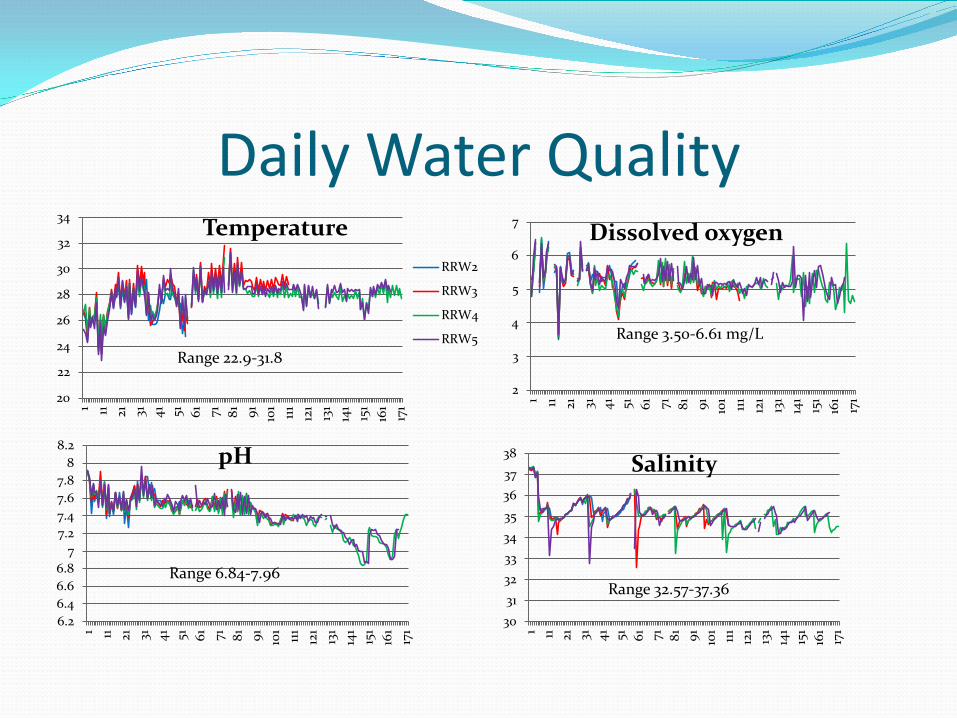
Daily Water Quality
20
22
24
26
28
30
32
34
1 11 21
31
41
51
61
71
81
91
101 111
121
131
141
151
161
171
Temperature RRW2
RRW3
RRW4
RRW5
2
3
4
5
6
7
1 11 21
31
41
51
61
71
81
91
101 111
121
131
141
151
161
171
Dissolved oxygen
6.2 6.4 6.6 6.8
7 7.2 7.4 7.6 7.8
8 8.2
1 11 21
31
41
51
61
71
81
91
101 111
121
131
141
151
161
171
pH
30 31 32 33 34 35 36 37 38
1 11 21
31
41
51
61
71
81
91
101 111
121
131
141
151
161
171
Salinity
Range 22.9-31.8 Range 3.50-6.61 mg/L
Range 6.84-7.96 Range 32.57-37.36
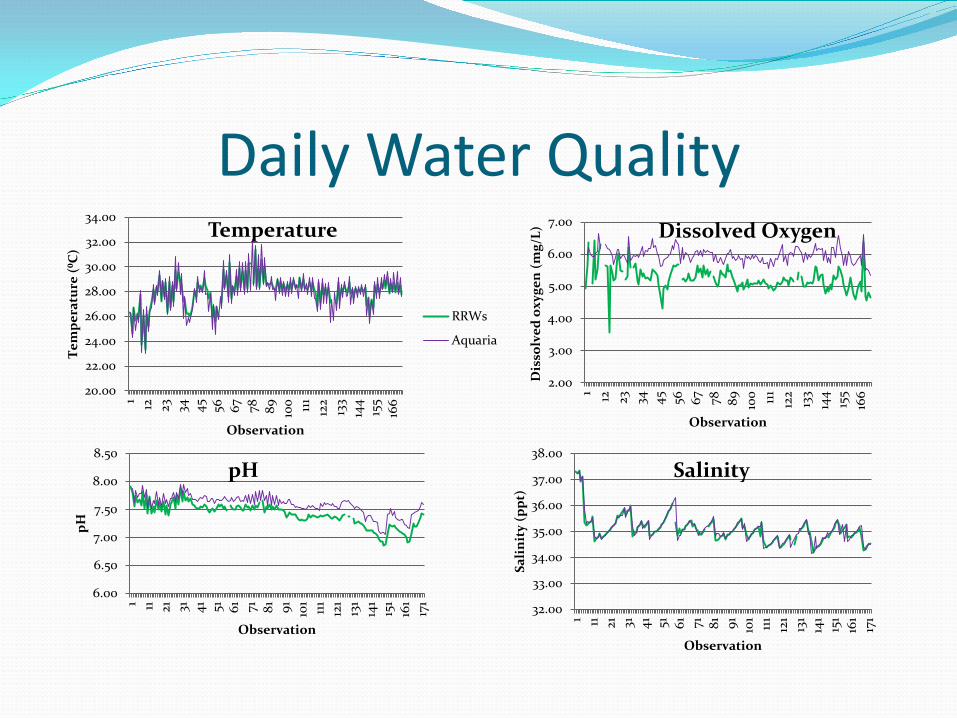
Daily Water Quality
20.00
22.00
24.00
26.00
28.00
30.00
32.00
34.00
1 12
23
34
45
56
67
78
89
100 111
12
2 13
3 14
4 15
5 16
6
Tem
pera
ture
(⁰C
)
Observation
Temperature
RRWs
Aquaria
2.00
3.00
4.00
5.00
6.00
7.00
1 12
23
34
45
56
67
78
89
100 111
12
2 13
3 14
4 15
5 16
6
Dis
solv
ed o
xyge
n (m
g/L)
Observation
Dissolved Oxygen
6.00
6.50
7.00
7.50
8.00
8.50
1 11 21
31
41
51
61
71
81
91
101 111
121
131
141
151
161
171
pH
Observation
pH
32.00
33.00
34.00
35.00
36.00
37.00
38.00
1 11 21
31
41
51
61
71
81
91
101 111
121
131
141
151
161
171
Sali
nity
(ppt
)
Observation
Salinity