Embed Size (px)
Citation preview

FCN Working Paper No. 2/2012
Evaluation of Different Hedging Strategies for Commodity Price Risks of Industrial
Cogeneration Plants
Andreas Palzer, Günther Westner and Reinhard Madlener
March 2012 Revised March 2013
Institute for Future Energy Consumer Needs and Behavior (FCN)
School of Business and Economics / E.ON ERC

FCN Working Paper No. 2/2012 Evaluation of Different Hedging Strategies for Commodity Price Risks of Industrial Cogeneration Plants March 2012 Revised March 2013 Authors’ addresses: Andreas Palzer Division Thermal Systems and Buildings Fraunhofer Institute for Solar Energy Systems ISE Heidenhofstraße 2 79110 Freiburg, Germany E-mail: [email protected] Günther Westner E.ON Energy Projects GmbH Arnulfstrasse 56 80335 Munich, Germany E-mail: [email protected] Reinhard Madlener Institute for Future Energy Consumer Needs and Behavior (FCN) School of Business and Economics / E.ON Energy Research Center RWTH Aachen University Mathieustrasse 10 52074 Aachen, Germany E-mail: [email protected]
Publisher: Prof. Dr. Reinhard Madlener Chair of Energy Economics and Management Director, Institute for Future Energy Consumer Needs and Behavior (FCN) E.ON Energy Research Center (E.ON ERC) RWTH Aachen University Mathieustrasse 10, 52074 Aachen, Germany Phone: +49 (0) 241-80 49820 Fax: +49 (0) 241-80 49829 Web: www.eonerc.rwth-aachen.de/fcn E-mail: [email protected]

1
Evaluation of Different Hedging Strategies for Commodity Price
Risks of Industrial Cogeneration Plants
Andreas Palzera, Günther Westnerb, and Reinhard Madlenerc,*
a Division Thermal Systems and Buildings, Fraunhofer Institute for Solar Energy Systems ISE, Heidenhofstrasse
2, 79110 Freiburg, Germany
b E.ON Energy Projects GmbH, Arnulfstrasse 56, 80335 Munich, Germany
c Institute for Future Energy Consumer Needs and Behavior (FCN), School of Business and Economics / E.ON
Energy Research Center, RWTH Aachen University, Mathieustrasse 10, 52074 Aachen, Germany
March 2012,
Revised March 2013
Abstract In this paper, we design and evaluate eight different strategies for hedging commodity price
risks of industrial cogeneration plants. Price developments are parameterized based on EEX
data from 2008-2011. The probability distributions derived are used to determine the value-at-
risk (VaR) of the individual strategies, which are in a final step combined in a mean-variance
portfolio analysis for determining the most efficient hedging strategy. We find that the strate-
gy adopted can have a marked influence on the remaining price risk. Quarter futures are found
to be particularly well suited for reducing market price risk. In contrast, spot trading of CO2
certificates is found to be preferable compared to forward market trading. Finally, portfolio
optimization shows that a mix of various hedging strategies can further improve the profita-
bility of a heat-based cogeneration plant.
Keywords: Commodity price risk, Cogeneration, Hedging, mean-variance portfolio optimiza-
tion;
JEL Classification Nos.: D22, D81, G11, G32, Q48
* Corresponding author. Tel. +49 241 80 49 820, fax. +49 241 80 49 829, [email protected] (R. Madlener)

2
1 Introduction
In light of the cold wave in Europe in February 2012, it became evident how important it is
for an uninterrupted power supply that sufficient baseload power plants are in operation. The
decommissioning of eight German nuclear power plants in 2011 incurred over the last couple
of weeks of that year considerable challenges, particularly in Southern Germany (Flauger,
2012). In February 2012, here and there emergency reserves had to be called upon1, which for
the power supply sector constitutes an important element to maintain the security of supply
should bottlenecks arise in the electricity supply. In order to avoid such emergency situations
in the future, and at the same time to account for climate change mitigation goals, targeted
expansion of energy-efficient and environmentally benign baseload power plants has to be
effected.
A highly energy-efficient and therefore environmentally sound technology for the con-
stant supply of electrical energy is that of cogeneration (combined heat and power, CHP)
based on the gas and steam combined cycle (CC) (Baehr, 2005). The advantages resulting
from the use of this CC-CHP technology with regard to fuel consumption and CO2 emissions
led already in 2002 to the entering into force of a German federal law for the promotion of
CHP plants (Kraft-Wärme-Kopplungsgesetz; KWKG, 2011). The aim of the CHP Act and
related ordinances is to promote power production with this energy-efficient technology.
If heat demand is guaranteed, for example, by installing such a plant in an industrial en-
terprise which requires process heat throughout the year, then capacity factors of up to 90%
can be realized. At the same time, the obligation to continuously provide heat energy to an
enterprise imposes risks that would not occur in the case of a normal gas-fired power plant.
The continuous operation and the resulting constant fuel demand and CO2 certificate re-
quirements in the case of industrial CHP plants lead to considerable market price risks when
purchasing the commodities (Westner & Madlener, 2011a). Moreover, electricity is produced
independently of the market prices at the electricity exchange, due to the heat-demand-driven
operation of the plant2. Possibly unprofitable operating conditions can therefore not complete-
ly be avoided. The main reason for the occurrence of risks is the high volatility of the price
1 Emergency or so-called “cold reserve” plants are inoperative power plants that can go online in the case of electricity shortages, despite high operating costs. 2 The type of power plant investigated in this study is mainly used for generating process heat for industrial ap-plications. Hence the flexibility in operating the power plant is strongly restricted. For more details see section 3.1.

3
developments at the energy exchange. Electricity in particular, due to its non-storability3, is
subject to marked price variations (Vehviläinen & Keppo, 2003). A reliable estimation of pos-
sible profits or losses is thus very difficult. In order to nevertheless deal with these risks, vari-
ous approaches allow for the valuation and mitigation of risk.
In this paper, we first design eight hedging strategies that offer different possibilities for
hedging the above-mentioned price risks. In a next step, the price developments of electricity,
natural gas, and CO2 certificates are analyzed and the strategies scrutinized ex post with re-
gard to their profitability. In order to support the selection of future strategies on scientific
grounds, price developments of the years 2008-2011 are parameterized on the basis of statisti-
cal testing, and suitable probability distributions are estimated. These distributions serve to
feed a model with data, which in the framework of a Monte Carlo simulation allows the as-
sessing of the Value at Risk (VaR) for the choice of an individual strategy. Finally, the strate-
gies are combined, following Markowitz’ portfolio theory, in order to determine the best
strategy mixes based on the prevailing risk preference of the plant operator concerned.
The remainder of this paper is organized as follows. In section 2, we review the related
literature and introduce the method applied. In section 3, the model is presented in detail and
the assumptions made listed and justified. In section 4.1, a brief historical analysis of the
strategies is undertaken, while in section 4.2, a Monte Carlo simulation and in section 4.3, the
portfolio analysis is performed. Finally, in section 5, the results are summarized and an out-
look on possible further research is provided.
2 Related literature and method adopted
In this study, we first evaluate the prices published by the European Energy Exchange (EEX)
for the commodities electricity, natural gas and European Union Emission Allowances
(EUAs) for a historical consideration of the years 2008-2011. Next, we introduce effective
strategies that enable the hedging of the price risks occurring when operating a CC-CHP
plant. These strategies comprise the purchase of natural gas and EUAs and the sale of electric-
ity at the EEX at different delivery periods, i.e. for instance in the spot and futures markets.
3 In general, electricity is considered to be non-storable in large quantities, in contrast to other commodities such as natural gas or grain. Physically, this is not quite correct, but the very high costs arising when “storing” elec-tricity make this assumption justifiable.

4
Based on this, we calculate the clean spark spread4 summed up over the course of a year of
the respective strategies, and value the latter relative to alternative strategies. Subsequent to
this valuation based on historical values, the modeling of the price developments for electrici-
ty, gas, and EUAs follows, aimed at a risk valuation of the various strategies for a future year.
Energy price modeling has been a popular subject in numerous publications. Especially
for the representation of price mechanisms on the power market, a rich body of literature ex-
ists. In the course of electricity market liberalization, there followed first approaches, in which
attempts were made to model the electricity price developments at the exchange with well-
known capital market models (see e.g. Felder, 1996; Vehviläinen & Keppo, 2003). However,
it soon became apparent that the price formation of electricity due to non-storability5 follows
other rules. Weron et al. (2001) and Guthrie & Videbeck (2007) find that simple finance mod-
els are insufficient to model the high volatilities of the spot market prices of electricity.
Modified models have thus been applied to model the specific characteristics of the elec-
tricity price development at the energy exchanges, e.g. by Escribano et al. (2002). They take
various factors into account for the analysis of the spot market prices, such as seasonality and
GARCH behavior (see also Duan, 1995) or time-dependent jumps, which were analyzed for
their relevance on the basis of the data of different markets. Boubonnais & Méritet (2006)
consider a univariate time series approach and Huisman et al. (2007) develop and apply a
model for the representation of hourly electricity prices. Models for the price formation on the
futures market were proposed and investigated, among others, by Deng (2000), Burger et al.
(2004) and Bauwens et al. (2011).
For the price developments on the EUA market, albeit to a lesser extent, there also exist a
number of publications and models. Benz & Trück (2009), for instance, investigate the use-
fulness of a Markov-switching model and an AR-GARCH model for representing the certifi-
cate price development on the European emissions trading system (EU-ETS). In contrast, El
Hedi Arouri et. al. (2012) investigated the relationship between the prices for CO2 certificates
on the spot and on the futures markets by means of a vector autoregressive (VAR) model and a
switching transition regression-exponential GARCH model (STR-GARCH). Recent studies,
e.g. by Chevallier (2011), deal with the instability of the volatility of EUA prices when using
an EGARCH model. 4 The clean spark spread is computed as the difference between the revenues gained from electricity sales and the expenditures that result from purchasing fuel and CO2 certificates for the amount of electricity produced, cf. eq. (1) (see also Alberola et al., 2008). 5 This particularity of the commodity “electricity” leads to a situation where on the markets there may be short-term scarcity and overflows that cause the prices either to rise or fall markedly. In reality, both price rises of several hundred percent and negative prices could be observed up to now.
5
Apart from these studies, which deal with the forecasting of EUA prices, other studies fo-
cusing on the price development of natural gas exist as well. Price volatility of gas products
was already modeled, for example, by Herbert (1995). Further studies were conducted, e.g.,
by Pindyck (2003) or Geman & Ohana (2009). A detailed analysis of various models for the
simultaneous modeling of gas and electricity spot market prices for a gas-fired power plant is
provided by Heydari & Siddiqui (2010). They conclude that price volatility forecasts from
non-linear stochastic models are the most accurate ones.
Based on these insights, in our study we also pursue the approach of representing the vol-
atility by means of stochastic parameters and simulations.
In contrast to the models published so far, price developments of all commodities (elec-
tricity, natural gas, and EUAs) that are needed to compute a clean spark spread of a CC-CHP
plant, are stochastically analyzed and evaluated by means of a goodness-of-fit test. The com-
bined analysis of these commodities in the context of the special characteristics6 of a heat-
demand-operated CC-CHP plant is an original contribution. To our knowledge, only Rong &
Lahdelma (2007), with a focus on the planning of the CO2 certificate trading for cogeneration
plants, and Masaaki et al. (2007) have a comparable aim in their research focus.
In order to generate a database that is as broad as possible for estimating the probability
distributions, we have used price series of the various commodities published by the EEX,
and delivery periods over three years. First, these are level-adjusted, after which exogenous
structural breaks are corrected by means of an OLS regression7. Subsequently, the data is ana-
lyzed by means of a selected statistical test. For energy market commodities, in particular,
specific characteristics have to be taken into account. Rachev (2005) discusses for the case of
the electricity price distribution the issue of extreme price jumps, and also that the kurtosis
takes a relatively high value. In order to take account of these two criteria, we use two suitable
test procedures for analyzing electricity prices. A standard goodness-of-fit test procedure is
the Kolmogorov-Smirnov test. Massey (1951) showed that this test dominates other tests in
the case of data with extreme price spikes. The high values of the kurtosis, which is also re-
ferred to as fat or heavy tails, and which is characteristic of electricity prices, were investigat-
ed in detail by Huisman & Huurman (2003) and Weron (2005), respectively. Weron (2005) in
this context showed, in addition, that the Anderson-Darling test is especially well suited for
the analysis of heavy tails.
6 Because the plant is operated based on heat demand, it cannot, for instance, be switched off arbitrarily when electricity prices are low. 7 Ordinary least squares (OLS) regression, see e.g. Urban & Mayerl (2011).
6
The price development of the other commodities (natural gas, CO2 certificates) shows
comparable structures, so that we use the Anderson-Darling method for determining a suitable
underlying distribution. As a check and for the data analysis in the case of particularly impre-
cise values obtained with the Anderson-Darling method, we also conducted a goodness-of-fit
test based on the Kolmogorov-Smirnov test procedure.
The goal of our study is to parameterize the volatility of the price development of the var-
ious commodities and products in line with Burger et al. (2004), in order to develop models
for a Monte Carlo simulation that builds on this. The variation between the different models
arises, because all commodities (electricity, natural gas, CO2 certificates), based on their
products on the spot and futures markets, are combined with each other, in order to analyze
different hedging strategies. The models that are based on these strategies are then used for
computing the clean spark spread of a 100 MWel CC-CHP plant. The probability distributions
thus computed for the annual clean spark spread of the various hedging strategies are, then,
following the work of Henney & Keers (1999) and Lui & Wu (2008), contrasted on the basis
of a value-at-risk (VaR) assessment and valued with regard to their risk. For an introduction to
the VaR concept see, e.g., Linsmeier & Pearson (2000).
Following the VaR analyses, we also pursue a portfolio analysis that is based on the gen-
erated distributions of the strategy-dependent spreads, in order to determine the efficient di-
versification of the strategies. The approach followed is the one introduced by Markowitz
(1952); see also (Markowitz, 2008). Originally developed for application to equity share port-
folios, this approach has also increasingly been used for the valuation of non-finance portfoli-
os. For instance, Westner & Madlener (2010, 2011b) show that portfolio theory can yield im-
portant new insights into the valuation of investments in power generation assets.
Our study can also be contrasted with published work due to the technical specificity of
the considered heat-demand-driven power plant. Normally, the risk management of power
plants is concentrated on price risks that arise when selling the electricity produced by the
power plant. Nakamura et al. (2006), for example, investigated strategies for the management
of price risks that are based on the optimal proportion of electricity demand and supply. Since
the rated power output of the power plant considered here can only be reduced by about 30%,
the option to switch off the plant in case of a negative spread is lacking. A diminution of the
losses can thus only be achieved by reducing the rated power of the plant. The relationships
from which the described technical particularities arise and the database used, will be dis-
cussed in more detail in the following section when the model is described.

7
3 The model
The decision to invest in a power plant is decisively dependent on the expected revenues from
the future operation of the power plant. In order to be able to assess the level of price risk aris-
ing at the energy exchange, the VaR assessment is a suitable tool for supporting the decision-
making. In order to apply the VaR approach, however, we first have to develop a model that
enables the representation with sufficient accuracy of the risk to be investigated. To this end,
we first explain the technical framework conditions, followed by a description of the data
used and explanations on how these are prepared for the subsequent stochastic evaluation.
Section 3 concludes with an introduction of the strategies used for mitigating the price risks.
3.1 Technical aspects
The conversion plant scrutinized in our investigation is a fictitious plant. In reality, CC-CHP
plants are nowadays used increasingly in manifold industrial branches for providing process
steam. Apart from steam production the CHP plant is also able to produce electricity. A limi-
tation for the operation of the heat-demand-driven CHP plant is the specification of a prede-
fined amount of process steam for the subsequent industrial processes. Without the provision
of this amount of steam the subsequent process cannot be (sufficiently) sustained. Despite
these restrictions in the case of a heat-driven operation, the coupling of electrical and thermal
energy is a resource-saving and at the same time economically attractive variant of energy
conversion, in comparison with the sole provision of process heat in a boiler.
Exemplarily, in the present study, we consider a plant with a gas turbine as the main ag-
gregate. We assume that the gas turbine converts a certain through flow volume of natural gas
under full load into about 80 MW of electrical and about 125 MW of thermal power output.
The thermal energy is used for producing process steam in a condensing boiler. The steam
produced is then used, on the one hand, for providing the subsequent industrial process with
heat and, on the other hand, in order to additionally produce 20 MW of electricity in a down-
stream steam turbine. In order to ensure that the heat-using industrial enterprise receives a
constant amount of process steam, an additional gas-fuelled auxiliary firing through the hot
exhaust of the gas turbine is operated. The amount of gas required for the additional firing is
dependent on the power level on which the gas turbine is operated. If the gas turbine is oper-
ated under full load, then the additional firing only has to provide 10 MW of thermal power.
8
In contrast, if it is reduced to the minimum of 70% of electrical output, the steam generator
requires an additional thermal power of about 50 MW. As the absolute amount of natural gas
is reduced, depending on the variation of power production in the gas turbines, this offers the
possibility to react to situations with low/negative spreads. The gains or losses depend on the
marginal cost by computing the difference between the electricity sold and the purchased gas
and CO2 certificates.
The operation of a power plant is profitable8 in hours where the revenues from selling the
electricity produced exceed the cost of purchasing the amount of natural gas and CO2 certifi-
cates required. If this is not the case, the plant produces a loss. As industrial enterprises are
dependent on the process steam, the plant cannot easily be switched off. Technically, howev-
er, it is possible to lower the power output of the gas turbine and subsequently to reduce the
amount of natural gas needed for a constant amount of steam production9. Whether or not a
reduction of the power output of the gas turbine has a positive effect on plant economics de-
pends on the price developments at the energy exchange and the plant-specific characteristics,
such as turbine efficiency.
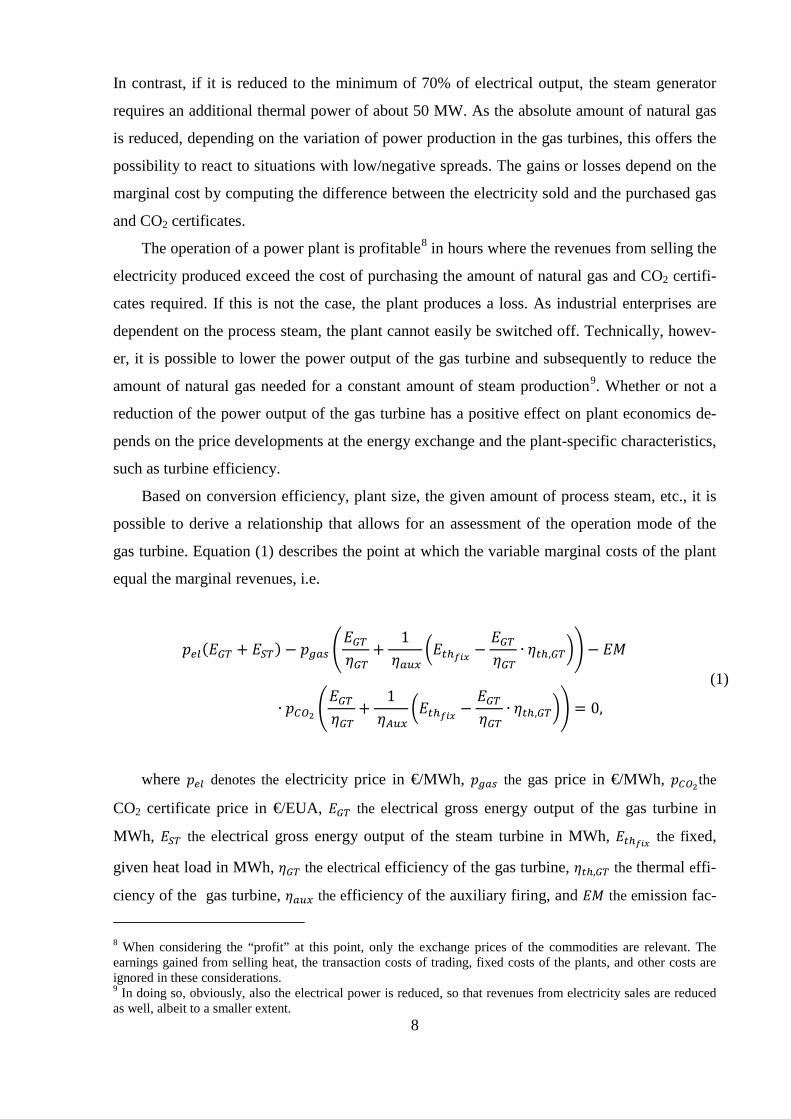
Based on conversion efficiency, plant size, the given amount of process steam, etc., it is
possible to derive a relationship that allows for an assessment of the operation mode of the
gas turbine. Equation (1) describes the point at which the variable marginal costs of the plant
equal the marginal revenues, i.e.
𝑝𝑒𝑙(𝐸𝐺𝑇 + 𝐸𝑆𝑇) − 𝑝𝑔𝑎𝑠 �𝐸𝐺𝑇 𝜂𝐺𝑇
+1
𝜂𝑎𝑢𝑥�𝐸𝑡ℎ𝑓𝑖𝑥 −
𝐸𝐺𝑇 𝜂𝐺𝑇
∙ 𝜂𝑡ℎ,𝐺𝑇�� − 𝐸𝑀
∙ 𝑝𝐶𝑂2 �𝐸𝐺𝑇 𝜂𝐺𝑇
+1
𝜂𝐴𝑢𝑥�𝐸𝑡ℎ𝑓𝑖𝑥 −
𝐸𝐺𝑇 𝜂𝐺𝑇
∙ 𝜂𝑡ℎ,𝐺𝑇�� = 0,
(1)
where 𝑝𝑒𝑙 denotes the electricity price in €/MWh, 𝑝𝑔𝑎𝑠 the gas price in €/MWh, 𝑝𝐶𝑂2the
CO2 certificate price in €/EUA, 𝐸𝐺𝑇 the electrical gross energy output of the gas turbine in
MWh, 𝐸𝑆𝑇 the electrical gross energy output of the steam turbine in MWh, 𝐸𝑡ℎ𝑓𝑖𝑥 the fixed,
given heat load in MWh, 𝜂𝐺𝑇 the electrical efficiency of the gas turbine, 𝜂𝑡ℎ,𝐺𝑇 the thermal effi-
ciency of the gas turbine, 𝜂𝑎𝑢𝑥 the efficiency of the auxiliary firing, and 𝐸𝑀 the emission fac- 8 When considering the “profit” at this point, only the exchange prices of the commodities are relevant. The earnings gained from selling heat, the transaction costs of trading, fixed costs of the plants, and other costs are ignored in these considerations. 9 In doing so, obviously, also the electrical power is reduced, so that revenues from electricity sales are reduced as well, albeit to a smaller extent.

9
tor for the computation of the CO2 emissions in tCO2/MWh. As mentioned above, due to
technical restrictions the load of the gas turbine can only be reduced to 70% of the full load
(see eq. (2)).
𝑝𝑒𝑙(0.7𝐸𝐺𝑇 + 𝐸𝑆𝑇) − 𝑝𝑔𝑎𝑠 �0.7𝐸𝐺𝑇 𝜂𝐺𝑇
+1
𝜂𝑎𝑢𝑥�𝐸𝑡ℎ𝑓𝑖𝑥 − 0.7
𝐸𝐺𝑇 𝜂𝐺𝑇
∙ 𝜂𝑡ℎ,𝐺𝑇��
− 𝐸𝑀 ∙ 𝑝𝐶𝑂2 �0.7𝐸𝐺𝑇 𝜂𝐺𝑇
+1
𝜂𝐴𝑢𝑥�𝐸𝑡ℎ𝑓𝑖𝑥 − 0.7
𝐸𝐺𝑇 𝜂𝐺𝑇
∙ 𝜂𝑡ℎ,𝐺𝑇��
= 0,
(2)
If we now subtract eq. (2) from eq. (1) we obtain the amount of energy that can be varied
flexibly within the technical restrictions of the power plant investigated. Equation (3) illus-
trates the result where the constant values 𝐸𝑡ℎ𝑓𝑖𝑥 and EST are eliminated and where only the
financially relevant 30% load of the gas turbine is left for the further calculations.
𝑝𝑒𝑙 ∙ 0.3 ∙ 𝐸𝐺𝑇 − 𝑝𝑔𝑎𝑠 �0.3 ∙ 𝐸𝐺𝑇 ∙1
𝜂𝐺𝑇− 0.3 ∙ 𝐸𝐺𝑇 ∙
𝜂𝑡ℎ,𝐺𝑇
𝜂𝑎𝑢𝑥 ∙ 𝜂𝐺𝑇� − 𝐸𝑀
∙ 𝑝𝐶𝑂2 �0.3 ∙ 𝐸𝐺𝑇 ∙1
𝜂𝐺𝑇− 0.3 ∙ 𝐸𝐺𝑇 ∙
𝜂𝑡ℎ,𝐺𝑇
𝜂𝑎𝑢𝑥 ∙ 𝜂𝐺𝑇� = 0,
(3)
In order to not only consider the equilibrium, but instead to identify the entire range in
which the plant can be operated profitably, the equation is turned into an inequality. By rear-
ranging the equation and eliminating both the factor 0.3 and EGT, we obtain a simple relation-
ship, where the dependence of the price development of all goods and the specific characteris-
tics of the plant allow for a conclusion about the profitability in the considered time interval
(see eq. (4)). If this inequality is fulfilled, i.e. if the value on the left-hand side of the equation
is smaller than on the right-hand side, then a positive margin results and the plant should be
operated at full load. In contrast, if the inequality is not fulfilled, a negative margin results and
the power of the gas turbine should be reduced to the extent possible in order to mitigate the
losses:
𝑝𝑒𝑙
𝑝𝑔𝑎𝑠 + 0.2016 ∙ 𝑝𝐶𝑂2<
1𝜂𝐺𝑇
−𝜂𝑡ℎ
𝜂𝑎𝑢𝑥 ∙ 𝜂𝐺𝑇. (4)
10
Apart from these plant-specific assumptions, some further economic and technical assump-
tions are made for simplicity reasons10. Also, the efficiency of the plant studied is restricted to
the conversion efficiencies reported here, and to related losses. Price formation for the goods
themselves, however, significantly affects the profitability of the plant so that this has to be
investigated in more detail.
3.2 Data used
The following evaluations and policy recommendations are based on price series for various
commodities in the years 2008-2011, which are available from the EEX database. These price
series differ from each other by the type of commodity (electricity, natural gas, CO2 allow-
ances), by delivery period, which can be traded either on the spot market or on the futures
market in various time periods. In the following, the products used for the analysis are intro-
duced by their EEX nametags, and their characteristics explained.
Spot market
Electricity:
• On the day-ahead market, baseload electricity contracts are traded that oblige to the phys-
ical delivery of 1 MW for 24 hours on the following day. In other words, they guarantee a
constant delivery of at least 1 MW over the entire day and, therefore, cover the baseload11
needs in the electricity sector. This product is referred to as “phelix day base” and the
price is denoted in €/MWh. Price formation takes place one trading day before delivery,
so that per year 365 different price notations result.
• Besides the 24 h-blocks, in our study we also consider products for electricity with an
hourly resolution that oblige for the delivery of 1 MW over one hour each. These prod-
ucts are traded on the so-called intra-day market and the price is formed up to 60 minutes
before delivery is due. The price is also denoted in €/MWh and the volume of the availa-
ble data is thus 24 x 365 = 876012 observations per year (EEX, 2011a).
10 For example, we neglect costs for ramp-up and ramp-down processes that may arise. Furthermore, we assume that no transaction costs arise for the trade of goods at the energy exchange, and that control areas and delivery zones do not have any influence on price formation 11 Industrial CHP plants usually operate in baseload mode, with a duration of 8000 full-load hours. 12 This is the theoretically available value. When evaluating the data, however, it turned out that the documenta-tion had certain gaps.

11
Natural gas:
• For the case of gas, we consider the prices of so-called “Natural Gas Day 1 MW Con-
tracts”. They oblige, similarly to what we have described above, to the constant delivery
of 1 MW of natural gas over the 24 hours of a specific day. In comparison to the trade of
electricity, however, each natural gas contract can be traded on two days before delivery,
which leads to a dataset with 2 x 365 = 730 observations per year. The analysis of the da-
ta has shown that the price is formed for two days, whereas trade does not take place reg-
ularly on both days. Hence, at this point, we assume that the prices that are relevant for a
probability analysis are formed when trade actually takes place. This results in a data vol-
ume that is limited per year to about 400 observations. The delivery on the virtual hub
takes place in the market zone of the NetConnect Germany (NCG) GmbH & Co KG and
the gas traded is exclusively H-gas13 (EEX, 2011b).
CO2 certificates:
• For the CO2 certificates (EU Allowances, EUAs), we also consider spot market data.
However, in contrast to the prices of electricity and natural gas, respectively, these are
only determined on trading days, so that the annual data set is reduced to 250 observa-
tions. The smallest trading unit is 1 EUA, allowing the emission of one metric ton of CO2
or CO2-equivalents. The price is given in €/EUA (EEX, 2011c).
Futures market
Electricity:
The trading of electricity on the futures market can be done by means of different products.
The price series used in this study are related to the so-called German baseload futures. These
are tradable delivery periods, which determine the physical delivery of electricity supplies in
the future at a specified point in time and a specified amount. Specifically, the prices of
monthly, quarterly, and yearly futures are considered here, which at the EEX are named after
their respective periods with their English terms:
• German baseload month future: The contract volume of such a delivery period is com-
posed of the delivered power, the delivery hours, and the delivery days. For example, the
total amount of delivery at 1 MW of power can be calculated as “1 MW x 30 days x 24
h/d = 720 MWh”. Depending on the number of days per month, the time period changes
accordingly. The trade with such a month future starts nine months ahead at maximum
13 H-gas (high-gas) is natural gas with a higher energy density. In Germany, also L-gas (low-gas) is traded, which has a lower energy contents due to the addition of nitrogen (Baehr, 2005).

12
(cf. EEX electricity product brochure). The data analyzed for the years 2008-2011, how-
ever, show that the trade for a month future took place only six months ahead of the start
of the delivery date, so that the price development investigated for this product could only
be observed over six months.
• German baseload quarter future: This product is analogous to the month futures, with the
difference that the delivery period is now three months. Also in this case, the specifica-
tions in the EEX product description deviate from the actually downloadable data. The
specification indicates that the next full eleven quarters are tradable in the future, whereas
the price series are only available for the next full eight quarters. In order to establish a
closer link to the price developments of the years 2008-2011, we only consider at maxi-
mum the price development a year before delivery is due. For example, the price devel-
opment of a quarter future for the months January, February, and March in 2009 is ob-
served from the first trading day in 2008 up to the delivery date of the futures.
• German baseload year future: Also for this product, the same basic principles apply as
for the already described futures contracts; in this case, the next full six years are trada-
ble, but observable is also in this case only the price formation over a year before the de-
livery is due (EEX, 2011a).
Natural gas:
The delivery periods considered here for natural gas from the NCG market area are analogous
to the above-described futures contracts for electricity. Specifically, these are:
• NCG natural gas month future: Just as in the above example, the contract size in this case
is 720 MWh for a month with 30 days. These contracts are tradable for the next six
months in the future and the minimal order quantity is 10 MW. The price is specified in
€/MWh, with two decimals, which is the same as for the other products.
• NCG natural gas quarter future: comprises a contract volume of 2184 MWh if the quar-
ter concerned can be based on 91 delivery days. Tradable are the following seven quarters
and the price is given in €/MWh. As for the electricity futures, a period of one year before
delivery is due forms the data basis for these contracts.
• NCG natural gas year future: comprises a contract volume of 8760 MWh in the case of
365 delivery days. As for electricity, contracts are tradable for the next six years and the
data base is again a period of one year before delivery commences.

13
CO2 certificates:
• Also the EU Emission Allowances are traded on the futures market. Liquidity, howev-
er, is lower in comparison to electricity and natural gas. This leads to a situation where
only annual contracts are offered, which can be traded in each year up to the last trad-
ing day in November. These contracts, which are comparable with the year futures for
electricity and gas, are, for all years, tradable in the second trading period determined
after the National Allocation Plan II (NAP II)14. The smallest contract volume is 1000
EUA and the price is given in €/EUA.
3.3 Data preparation
For the data preparation needed for the subsequent analysis, we distinguish between the data
base for the historical evaluation on the one hand and for the stochastic evaluation on the oth-
er hand. In the case of the historical analysis of the data, the calculation of the hourly and dai-
ly clean spark spreads serves as the basis. To this end, the data have to be matched with each
other. As described in section 3.2, this means that daily available prices for gas and electricity
have to be matched with the prices for CO2 that are formed on trading days only. In order to
determine the daily spread between the electricity, gas, and CO2 certificates on a non-trading
day, the price of the last trading day before trade is interrupted during the trade-free days.
This means, for example, that the prices for CO2 on a weekend (Saturday and Sunday) are the
same as the price on Friday before the weekend concerned. Holidays are treated analogously.
For strategies which compare spot market prices with those at the futures market, the
price of the corresponding futures contract is held constant over its delivery period, whereas
that of the good traded on the spot market varies. For the consideration of the intra-day spot
market, hourly prices are used in an analogous way. The price of the commodities purchased
as 24 h baseload contracts is held constant over 24 h, whereas the price for the commodities
traded on the intra-day market is allowed to vary.
For the stochastic evaluation conducted in the second part of our analysis, we do not fo-
cus on the accounting of the daily prices over the year, but rather on the various price devel-
opments and the volatility of the commodities over the time period considered.
14 The European Emissions Trading System (EU ETS), introduced on January 1, 2005, is divided into three peri-ods. The period considered in our study falls into the second period (2008-2012), for which the framework con-ditions are stipulated in the National Allocations Plan II (NAP II); BMU – Bundesministerium für Umwelt, Na-turschutz und Reaktorsicherheit (2006).

14
In order to allow for some insights about the data-generating process underlying each
price development of a product, the data have to be prepared in different ways. To this end,
the price data obtained from the EEX of the respective commodities are first sorted by year,
after which their mean is calculated. This mean value is then deducted from the actual price.
By computing the differences, it is possible to represent the volatilities of the prices over sev-
eral years independently of level-changing15 influences (Figure 1).
Figure 1: Price development of the EEX gas prices (lower curve: mean-adjusted difference price; upper curve: direct EEX price) on the spot market for 24 h baseload contracts over the years 2009–2011. Source: Own calculations, based on data from www.eex.com
A further measure for the preparation of the data should reduce the impact of the financial
crisis on the market price formation. For instance, for futures contracts of the commodities, a
strong influence of the financial crisis on price formation can be detected for the year 2009.
This is due to the fact that price formation at the exchange, depending on the product to vari-
ous degrees, goes back to the year 2008. Therefore, based on the outcome of the visual in-
spection of the individual price trajectories of all futures contracts, some data going back to
2008 were excluded from the data analysis. For example, in Figure 2 the trajectory of the dif-
ference prices for a German baseload quarter future for the years 2009–2011 is shown.
15 When considering nominal prices, for example, the inflation rate or business cycle impacts (such as the grow-ing demand for energy as a result of increased economic activity), can have a level-shifting effect.
-20
-10
0
10
20
30
40
50
60
01.01.2009 01.07.2009 01.01.2010 01.07.2010 01.01.2011 01.07.2011 01.01.2012
€/MWh
Differenzpreis EEX-PreisEEX gas price mean-adjusted difference gas i
15
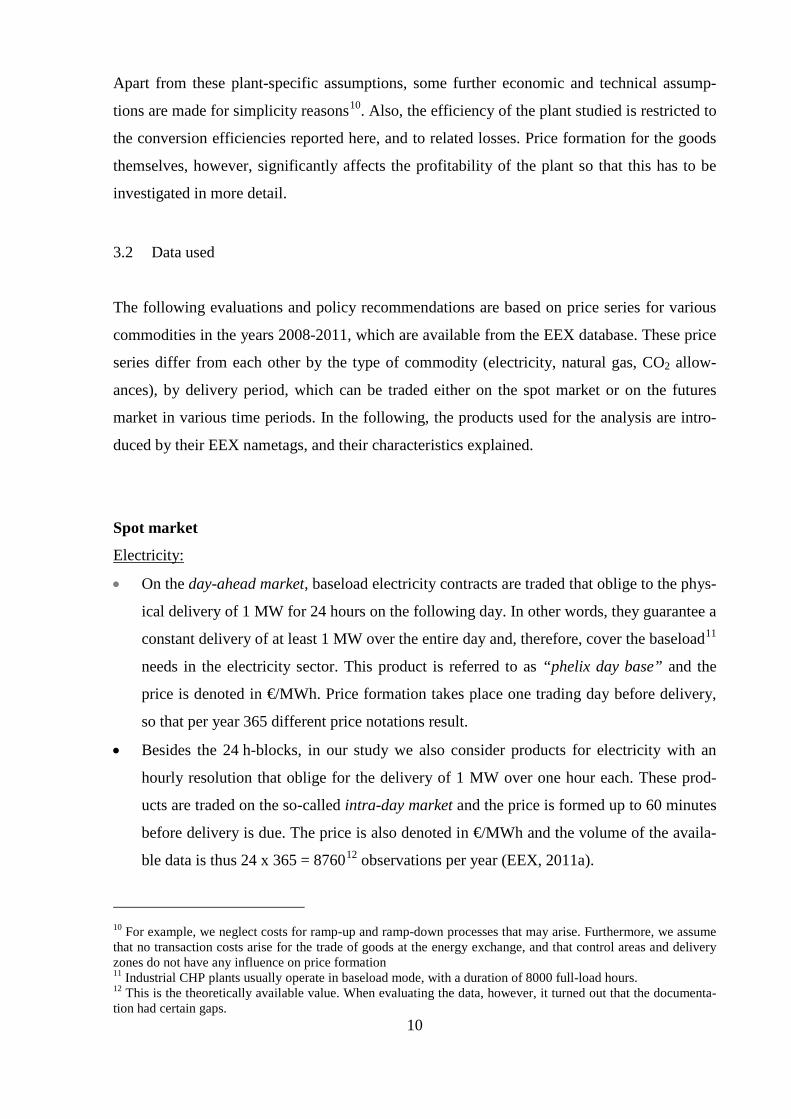
Figure 2: Mean-adjusted difference price development for baseload quarter futures (Jan, Feb, Mar) of the years 2009–2011. Source: Own calculations, based on data from www.eex.com
As the price for the quarter future depicted in Figure 2 (January 2009) was already
formed back in 2008, the influence of the financial crisis and the deviating course to the fol-
lowing years is particularly evident. In order to exclude this deviation from the analysis of the
price series, price formation in 2008 is not considered. Therefore, as a data basis, we only use
the two thirds on the right-hand side of the data depicted in Figure 2. This restriction affects
the month futures for electricity and natural gas from January to May 2009, the quarter futures
for electricity and gas for Q1 to Q4 in 2009, and the year futures for electricity, gas, and CO2
certificates in 2009.
Apart from the long-term disturbances caused by the financial crisis, on March 15, 2011
the moratorium decision of the German government to shut down eight nuclear power plants,
had a massive impact on the electricity price for futures contracts. Consequently, this politi-
cally induced level-shifting of the time series is treated as an exogenous structural break and
depicted in Figure 3 exemplarily for an electricity month future (June 2011).
In order to account for the influence of the structural break on the data-generating process
when doing the mean adjustment, we regress a constant (𝛽0) and a step dummy (𝑆𝐷𝑡) on the
time series (𝐹𝑡) and estimate these coefficients by the ordinary least squares (OLS) method:
𝐹𝑡 = 𝛽0 + 𝛽1 + 𝑆𝐷𝑡 + 𝑢𝑡 , (5)
where 𝑢𝑡 is an error term and 𝑆𝐷𝑡 = 0 for 𝑡 < 15.03.2011 and 𝑆𝐷𝑡 = 1 for 𝑡 ≥ 15.03.2011,
respectively. Once the two coefficients are determined, the part of the time series before
March 15 is adjusted only by the mean value (𝛽0), whereas the part of the time series after
March 15 is adjusted by the mean value plus the effect of the exogenous shocks, (𝛽0 + 𝛽1).
-30
-20
-10
0
10
20
30
02.01.2008 02.07.2008 02.01.2009 02.07.2009 02.01.2010 02.07.2010 02.01.2011
€/MWh
Differenzpreismean-adjusted difference price

16
This correction method is applied to the month futures for electricity for the months April
to September 2011 and for the electricity quarter futures for the 2nd, 3rd, and 4th quarters in
2011. Both for the gas price development as well as for the price of CO2 certificates, the event
on March 15, 2011, had no influence on the price formation. With the data prepared in the
described manner, we can now conduct the analysis of the probability distributions of the
price for each product required for the second part of the valuation.
Figure 3: Difference price of the month electricity future for June and the difference price of the June future, adjusted by an exogenous structural break. Source: Own calculations, based on data from www.eex.com
3.4 Strategy definitions
The following section defines and describes the various strategies considered in some detail.
The main distinction is made according to the strategies that are based on products traded on
the spot and futures market.
3.4.1 Spot market
Strategy 1 – day-ahead: This is the base case. In this strategy, all commodities are traded on
the day-ahead spot market. This implies that electricity, gas, and also CO2 certificates are
traded one day before the delivery day in the form of 24 MWh blocks or corresponding
amounts of certificates, respectively. The prevailing prices are geared towards the EEX daily
price index.
-20
-10
0
10
20
30
28.11.2008 27.02.2009 28.05.2009 23.02.2010 20.05.2010 18.02.2011 17.05.2011
€/MWh
ursprünglicher Differenzpreis bereinigter Differenzpreis
March 15, 2011
adjusted difference price difference price

17
Strategy 2 – intra-day: In this strategy, the possibility to operate the power plant flexibly
within a certain range is exploited (see section 3.1). In order to react flexibly to developments
of the electricity price, the amounts of electricity offered and demanded on the intra-day spot
market are traded, if at all, in 1 MWh blocks. We first assume that all three commodities are
bought or sold a day ahead in 24 h blocks. On the following day, the price development of
electricity on the intra-day market is observed additionally. If this observation yields that the
price ratio undercuts a plant-specific threshold value (see eqs. (1) to (4)), then the electrical
output of the power plant is reduced. In other words, if the price of electricity on the intra-day
spot market is sufficiently low, the plant owner reduces the plant’s electrical output in order to
save fuel and EUAs, and therefore buys electricity on the intra-day market to fulfill the deliv-
ery obligations. The advantage arises from the fact that the reduction in electrical output re-
duces gas consumption over-proportionally and the savings in the purchasing of gas and CO2
certificates exceed the expenditures from electricity procurement.
3.4.2 Futures market
In order to investigate the price developments on the futures market and the possibilities for
risk hedging by forward contracts, in the following strategies – with some exceptions for the
CO2 certificates – we only use the prices of the commodities traded on the futures market. The
limitation for the futures on CO2 certificates arises from the fact that the product range only
covers annual futures, and unlike for electricity and gas, also month and quarter blocks. In
order to mitigate the large, time-dependent impact of year futures, the futures contracts for
electricity and gas are connected to both futures market prices (year futures) as well as to the
spot market price for CO2 certificates. The point in time at which the corresponding futures
contracts are traded is a trading day that is half a period before the trading period concerned.
This means, for instance, that on the 15th of the previous month, a block of electricity or gas is
bought or sold for the entire following month, or that the trading day for a quarter block is
chosen 1.5 months before and that for a yearly block half a year before delivery begins.
Strategy 3 – month future – CO2 future: In this strategy, for one year, twelve monthly blocks
for the commodities gas and electricity are traded, starting on December 15 of the previous
year. The purchase of the corresponding year futures for CO2 certificates is made on June 30
of the previous year.

18
Strategy 4 – month future – CO2 spot: Here, as already mentioned in the introduction, electric-
ity and gas are traded as in the strategy month future – CO2 future; the difference is that CO2
certificates in this strategy are purchased on the spot market instead.
Strategy 5 – quarter future – CO2 future: In this strategy, the prices of electricity and gas, re-
spectively, are determined on the basis of quarter blocks and the CO2 price based on year
blocks.
Strategy 6 – quarter future – CO2 spot: Analogously to section 3.4.1, in this strategy, instead
of year blocks for CO2 certificates, the market price is again determined via the spot market.
The prices for electricity and gas are determined analogously to the strategy month future –
CO2 future.
Strategy 7 – year future – CO2 future: For this strategy, half a year in advance for each of the
three commodities the entire amount for the following year is traded.
Strategy 8 – year future – CO2 spot: In this strategy, the price of the certificates is determined
on the spot market, whereas the price of the other two commodities is analyzed via the futures
market through selling or buying year blocks on June 30 of the previous year.
4 Results
In this section, we first investigate, by retrospection on the basis of EEX prices for electricity,
gas, and CO2 certificates for the years 2009-2011, the profitability of the described fictitious
CC-CHP plants with a total electrical output of 100 MW. The spread results from a plant-
specific relationship between gas consumption and electricity production, which, depending
on the plant efficiencies, can be computed by using eq. (1). The total annual spread is ob-
tained by adding up the hourly computed spreads under the assumption that the plant is oper-
ated at full load for 8000 hours per year. For the computation of the costs arising from CO2
emittance, a factor to compute the emitted amount of CO2 per MWh of gas input, as published
by the German Federal Environment Agency – Umweltbundesamt (UBA) and the German

19
Emission Trading Authority – Deutsche Emissionshandelsstelle (DEHSt)16, respectively, is
used. The free allocation of certificates, as is currently practiced on the basis of the federal
law Zuteilungsgesetz 2012 (BMU, 2007), is not taken into account because of the marginal
cost consideration. The costs arising from the emission of CO2 are thus totally accounted for,
as they constitute a value irrespective of whether they were obtained for free (so-called
“grandfathering”) or via an auction mechanism. The corresponding prices for the demanded
and supplied amounts of gas, CO2 certificates and electricity, respectively, result from the
products concerned (hourly contracts, 24-hour contracts on the spot market, or month, quarter,
and year contracts on the futures market) traded on the EEX or the price forecasts computed
for the second part of this section.
Based on the calculated total annual spreads, the chosen strategies are analyzed with re-
gard to their profitability / their lowest loss value and, in the following subsection 4.1, related
to the global economic developments during the period studied. In subsection 4.2, then, we
first describe what the model for the computation of the VaR looks like and which statistical
distributions result, based on the goodness-of-fit analysis for the products concerned. After
that, the results obtained from a Monte Carlo simulation are reported and analyzed. In the
final subsection 4.3, we use the insights gained from the Monte Carlo simulation, in order to
conduct a portfolio analysis that enables us to identify optimal strategy combinations.
4.1 Retrospective analysis of the years 2009-2011
For all strategies considered in the year 2009, the significant changes on the markets due to
the financial crisis play an important role. Especially the block-wise purchase of futures con-
tracts had an impact on 2009 that was all the stronger the more had been purchased in ad-
vance. The reason is that up to mid-2008, the prices for all commodities peaked. Therefore,
the loss that arises from the purchase of year blocks is larger than the one from purchasing
quarter blocks. The latter in turn is larger than the loss from purchasing month blocks. A fur-
ther strong influence arises from the fact that, due to the assumptions made in the strategies
CO2 future, the amount of CO2 certificates required can only be purchased in year blocks (due
to the lack of subannual futures contracts). This means that the formation of prices for an an-
nual block of CO2 certificates took place already back in mid-2008 when the entire amount of
CO2 certificates required for 2009 were purchased. Since the market prices for CO2 were near
16 The H-gas characteristics used here is given by UBA and the DEHSt with an emission factor of 0.056 t CO2/GJ. This corresponds to 0.2016 t CO2/MWh H-gas (Source: www.umweltbundesamt.de).

20
their peak on June 30, 2008, the influences on the profitability in the year 2009 were accord-
ingly very distinct. This influence is put into perspective if we analyze the trade of CO2 certif-
icates on the spot market, as was done in the strategies CO2 Spot. Table 1 provides an over-
view of the strategies evaluated for the year 2009.
Table 1: Accumulated spread for the years 2009-2011, different strategies.
2009 2009 2010 2010 2011 2011 Spot market
VaR95% 2009 VaR95% 2010 VaR95% 2011
Day-Ahead €1,713,258 €-3,205,400 €-7,642,771
Intra-Day €2,122,957 €-3,025,330 €-7,307,182 Futures market VaR95% 2009 VaR95% 2010 VaR95% 2011 CO2 Future CO2 Spot CO2 Future CO2 Spot CO2 Future CO2 Spot
Month €-4,653,374 €1,714,623 €-987,480 €-1,199,659 €-6,320,293 €-5,318,123
Quarter €-6,482,384 €-113,789 €862,878 €651,478 €-6,603,497 €-5,600,660
Year €-21,302,822 €-14,933,795 €-3,314,786 €-3,527,091 €-7,255,698 €-6,253,210
Source: Own calculations
The economic advantages in 2009 that arise from the trade of all commodities in the spot
market (strategies day-ahead und intra-day) are obvious. The positive balance shown results
mainly from a massive decrease in the gas prices in this year. Due to the worldwide drop in
the economy, the demand for natural gas on the world market dropped so much that the gas
price at the exchanges was sometimes below 10 €/MWh (the maximum price for a 24 h base-
load contract on September 19, 2008, was about 32 €/MWh). Although simultaneously the
price for electricity in Germany also dropped, the effect in the gas prices overcompensated
this decrease, so that, as a consequence, positive revenues could frequently be achieved. By
trading 24 h baseload blocks on the day-ahead market, a profit of about €1.7 million could
have been realized if the power plant had been operated on 8000 of 8760 h per year under
full-load conditions. By operating the power plant in a variable manner, depending on the
hourly intra-day market price, revenues could have been raised by about €400,000, if in each
hour in which optimization was economically advantageous, backward trading was conducted
(cf. Strategy 2 – intra-day). Note, however, that for this intra-day strategy, an additional effort
not quantified here is needed for checking the market prices, as well as increased wear-and-
tear of the plant. Whether or not the extra effort pays off, thus, depends largely on the arising
additional costs and can, therefore, not be judged here in a final manner.
An eye-catching feature of Table 1 is that for all strategies on the futures market the
block-wise purchase of certificates has a negative impact on the balance. The reason is clear

21
and lies in the high CO2 certificate price on June 30, 2008 (trading day chosen for the CO2
year futures) at the exchange. Likewise, a deteriorating balance with increasing contract
length stems from the uncertainties on the market after the breakout of the financial crisis. In
2009, for futures contracts, one had to pay systematically more for trading in advance than in
the spot market. This trend was already changing towards the end of 2009, and reversed in the
following year 2010, when the world economy slowly picked up steam again.
Decisive for the trends in the prices of gas, electricity, and CO2 certificates in 2010 and
2011 is the recovering global economy, in which energy is increasingly demanded again, and
prices continuously rise. Table 1 (center columns) shows the results from our calculations for
2010. Due to the still dampened mood in the markets, positive annual yields can be obtained
with mid-term quarter futures (strategy quarter future – CO2 future and spot). If one had trad-
ed the commodities in this year month-by-month blockwise (strategy month future – CO2 fu-
ture and spot), in comparison to the trading with long-term contracts (strategy year future –
CO2 future and spot), and had traded in the spot market, the minimal loss would have oc-
curred.
It is remarkable that by trading with intra-day products on the spot market, and by ex-
ploiting the plant flexibility as described in section 3.1, the loss in the year 2010 could have
been reduced only by some €180,000. A recommendation of this strategy would, therefore, be
less likely, due to the already mentioned additional expenditures.
In contrast, if one compares the results from the calculation for the year 2010 with the re-
sults obtained for the year 2009, one can see immediately that after the massive slump of the
world economy (here the year 2009), short-term trading periods (spot market) tend to be in a
worse position than month or quarter blocks. The expectations were still low due to the many
uncertainties regarding the economic development. Still, actual trade increasingly became
stronger, so that, for example the electricity prices fixed in advance were too low and the
spread accordingly poor. This tendency changed as soon as the markets regained hope and the
prices for longer-term contracts rose again.
The more the global economy stabilized and the more the demand returned to the level
before the crisis, the worse the results are. Due to the increasing worldwide demand for gas,
the price for natural gas in 2011 temporarily rose to levels close to 30 €/MWh. The resulting
high fuel costs squeezed the spread for the CC-CHP plant into the negative (see Table 1,
right-most columns). Interestingly, it does not seem to make much difference which strategy
would have been chosen: irrespective of whether the trade was done in the spot market or in
the futures market, a loss would be indispensable for all strategies. Note, however, that it was

22
by and large more advantageous to procure the CO2 certificates in the spot market instead of
in the futures market. The reason is that the CO2 certificate price, contrary to the common
expectation, fell strongly in 2011 (the lowest price of 6.50 €/EUA was achieved on December
14, 2011).
In the spot market, by trading in the intra-day market, and through exploitation of the
technical flexibility, the loss could have been reduced by about € 330,000.
In summary, we can state that the arising negative spreads, as already discussed, are often
attributable to the uncertain and high price for CO2 certificates. If one considers the total an-
nual yield of such a plant and the prevailing allocation rules, the CO2 price-dependent trend
will reverse. The reason for this lies in the fact that CHP plants currently still receive the more
favorable allocation of emission rights according to the so-called “double benchmarking prin-
ciple” (BMU, 2007). In order to promote the energy-efficient CHP technologies, they receive
an allocation of certificates both for the electricity and for the heat production. Thus, in the
2nd trading period (2008-2012), this results in an excess amount of certificates. Only with the
beginning of the 3rd trading period in 2013 will the additional promotion of CHP plants
cease, so that profits from excess CO2 certificates will no longer be possible.
From the insights gained from our investigations, we can conclude that the economic via-
bility of a CC-CHP plant strongly depends on the events on the world markets17 and that by
the fully accounting for the value of the CO2 certificates (either in terms of windfall gains for
the case of grandfathering, or true expenditures in the case of auctioning) the operation of
such a plant does not render it economical. However, since the behavior of the markets cannot
be predicted precisely, we can only try to come up with some recommendation for future de-
cision-making, based on the existing information and experiences. In order to support this
policy recommendation, in the following, we will analyze probability distributions derived in
dependence of the risk measures computed.
4.2 Monte Carlo simulation and VaR
Building on the insights gained in the previous section, we now want to undertake a risk as-
sessment for future decision-making. As a basis, we use the VaR approach already described
above. In order to obtain an assessment of the percentage distribution of possible losses, we
first analyze and parameterize the probability distributions of the various commodities. These
17 Of course, in this context, influences such as the weather or political changes also play a decisive role on the market price development. Such effects, however, are neglected in our analysis and left for future research.

23
parameterized distributions then serve as an input for the model that, as described in the pre-
vious section, is based on the same calculation mode. The only difference is that here, we do
not use concrete deterministic values but instead random values that are based on the proba-
bility distributions analyzed of the individual volatilities. With the help of 100,000 runs from
a Monte Carlo simulation on the price developments of the commodities, the distribution of
the accumulated annual spreads is determined. Corresponding to the strategies described in
section 3.4, we then compute the VaR for each strategy.
4.2.1 Data analysis
The data prepared according to the procedure described in section 3.3 are first investigated
with a statistic goodness-of-fit analysis on their individual distribution. To this end, we spe-
cially take account of the shape of the volatilities on the tails of the determined distributions
by using the Anderson-Darling test procedure18. Table 2 shows exemplarily19 the resulting
probability distributions estimated in the analysis and the parameters for the price develop-
ments on the spot markets over the years 2009-2011.
Table 2: Estimated probability distribution and their parameter values for different price trajectories on the spot market, selected on the basis of test results of the Anderson-Darling (A-D) and the Kolmogorov-Smirnov (K-S) test procedures.
Commodity Distribution A-D K-S Parameter values
Electricity, day-ahead Student t 1.14 0.03 Midpoint=0, Scale=7.65358, Deg. Freedom=5.16613
Gas, day-ahead Logistic 13.89 0.07 Mean=-0.31478, Scale=1.82963
CO2, day-ahead Logistic 4.37 0.05 Mean=0.12463, Scale=1.09155
Electricity, intra-day Logistic 64.44 0.04 Mean=-0.11086, Scale=10.92158
Source: Own calculations, based on data from www.eex.com.
Based on a histogram and the best-fitting distributions resulting from the goodness-of-fit test,
in Figure 4 we show as an illustration the graphical representation of the analysis of the intra-
day market price volatility for electricity.
18 As already described in section 2, for cross-checking, we additionally apply the Kolmogorov-Smirnov test procedure, in order to detect strongly deviating results obtained with the Anderson-Darling method, if any, and to correct them if necessary. 19 The remaining distributions analyzed are reported in Tables A1-A4 in the Appendix.

24
Figure 4: Histogram for the electricity price volatility on the intra-day market and graphical representation of the estimated probability distribution (logistic function). Source: Own calculations, based on data from www.eex.com.
In order to obtain a realistic price for the year 2012 from the analysis of the distribution of the
manipulated data20, the price volatility has to be calculated back with an approximated mean
value on the exchange price level. For that purpose, the growth rate of the data used in this
study is analyzed and linearly extrapolated for the year 2012. By doing this, we deliberately
ignore the striking seasonality of the prices also for the case of the futures markets by the lin-
ear extrapolation of the means. This simplification is possible owing to the fact that for the
calculation of the accumulated spreads of the total year, seasonality does not play a role. Fig-
ure 5 shows how the corresponding products traded at the exchange are extrapolated on the
year 2012. Especially the approximated means for the spot market prices and the year-futures
of the corresponding commodities are striking. Due to the insufficient data situation, the com-
putation of the future mean values had to be based on an analysis of a one-time and twofold
price development. This restriction is tolerated here, as the strong influence of the financial
crisis should not be regarded in the average growth rate anyhow21.
20 In order to make the price development free of exogenous influences, the prices of the commodities concerned are adjusted by their annual mean values, as described in section 3.3. 21 This study is restricted only to the price developments after the financial crisis, since only in more recent years (incl. the year 2008) a representative price for the market of the commodities considered here was formed. Due to the splitting of the trading periods, the price development of CO2, for example, is strongly dependent on the regulatory framework conditions. Likewise, the liquidity at the energy exchange has increased strongly over the last three years, and is not comparable anymore with the liquidity before the financial crisis.

25
4.2.2 Monte Carlo simulation
By means of the analyzed and computed data, as described in the previous section, we can
now calculate the model for the future price development based on a Monte Carlo simulation.
To this end, the spreads of the corresponding strategies based on 100,000 randomly selected
prices, which move within the bounds of the analyzed distributions, are computed and shown
in the form of a histogram.
Figure 6a shows the probability distribution of the possible accumulated clean spark
spreads for the day-ahead strategy. The underlying distributions used for this show a compa-
rably high volatility due to the trade on the spot market. This leads to a situation where the
entire distribution shows distinctive characteristics both in terms of positive as well as nega-
tive accumulated spreads. The VaR95% is, at ca. €-28 million, the second-largest loss value
computed among all scenarios considered in the analysis. This loss value, caused by the high
volatility of the prices, can partly be compensated in the considerations by achieving also
marked positive clean spark spreads in this strategy. This effect is reinforced for increasing
volatility of the price developments considered.
Figure 5: Average computed price of the commodities on the various markets (Spot market: top left, Futures market: top right and plots in bottom row, and their linear extrapolation for the year 2012. Source: Own calculations, based on data from www.eex.com
€-
€20
€40
€60
€80
2010 2011 2012
Year futures
Strom Gas CO2
€-
€20
€40
€60
€80
2009 2010 2011 2012
Spot market
Strom Gas CO2
€-
€20
€40
€60
€80
2010 2011 2012
Month futures
Strom Gas
€-
€20
€40
€60
€80
2010 2011 2012
Quarter futures
Strom GasElectricity Electricity
Electricity Electricity
26
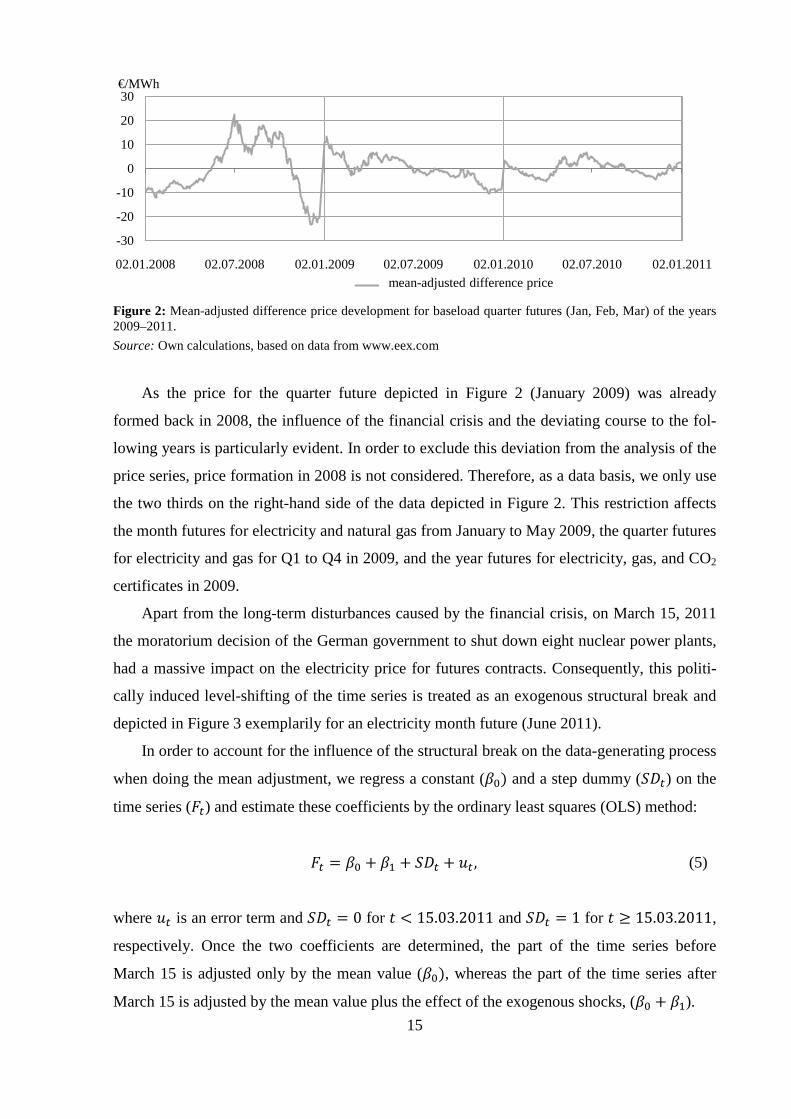
(a) Day-ahead strategy
(b) Intra-day strategy
Figure 6: Simulated probability distribution of the accumulated clean spark spread for 2012 with VaR95% (P95). Source: Own calculations, based on data from von www.eex.com.
By considering Figure 6b, we can see clearly that through the pure trade of electricity on the
intra-day market both the VaR95% is significantly higher (ca. €-39 million), as is the probabil-
ity to achieve a positive spread (P5% ca. €15 million). However, one cannot see from these two
figures that the risk of a loss incurred by the variable operation, which forms the basis of the
intra-day strategy, can be reduced. This effect, however, which is visible for the historical
analysis in Table 1, is overcompensated by the strongly varying intra-day market prices.
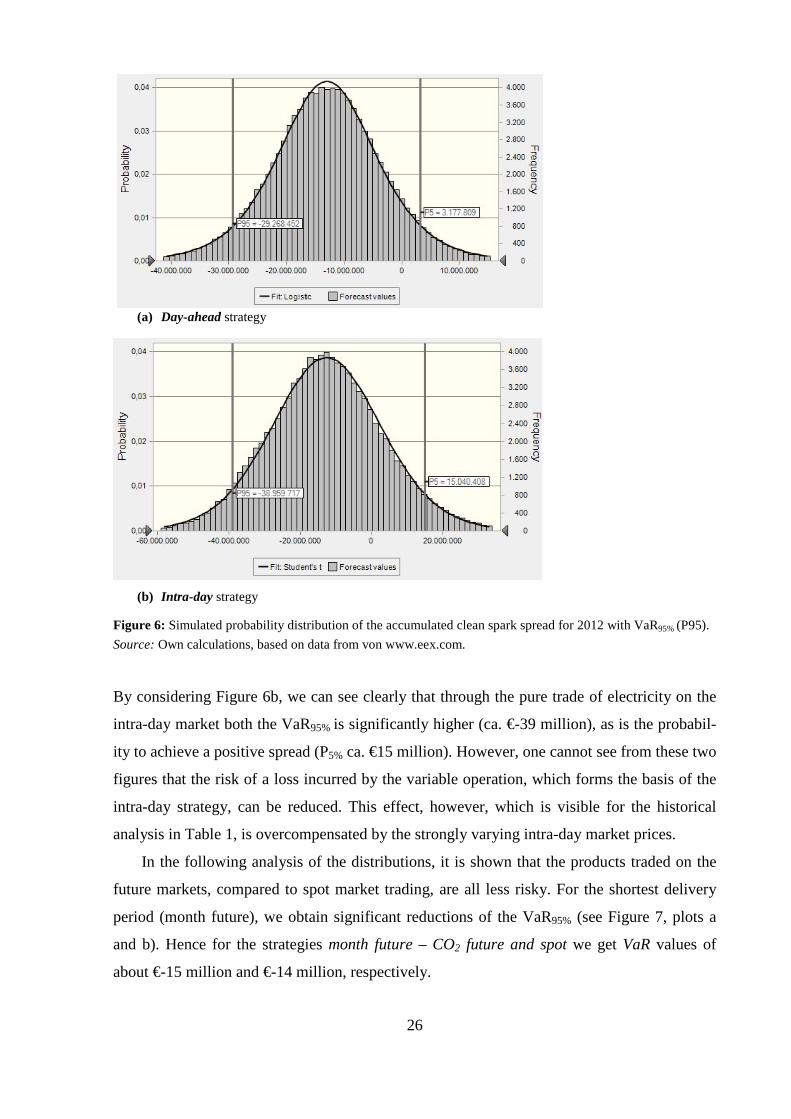
In the following analysis of the distributions, it is shown that the products traded on the
future markets, compared to spot market trading, are all less risky. For the shortest delivery
period (month future), we obtain significant reductions of the VaR95% (see Figure 7, plots a
and b). Hence for the strategies month future – CO2 future and spot we get VaR values of
about €-15 million and €-14 million, respectively.
27
(a) Month future – CO2 futures strategy
(b) Month future – CO2 spot strategy
Figure 7: Simulated probability distribution of the accumulated clean spark spread for 2012 with VaR95% (P95). Source: Own calculations, based on data from www.eex.com.
It is striking that the variance in these two strategies is lower by a factor of about 100,
compared to the strategies day-ahead und intra-day. This leads, on the one hand, to a situation
where the bandwidth of possible price developments is considerably lower and, on the other
hand, that the best case for both strategies that occurs with a 5% probability is (or can be)
negative. The reason for this lies in the lower price fluctuations of the month futures com-
pared to the spot market considerations.
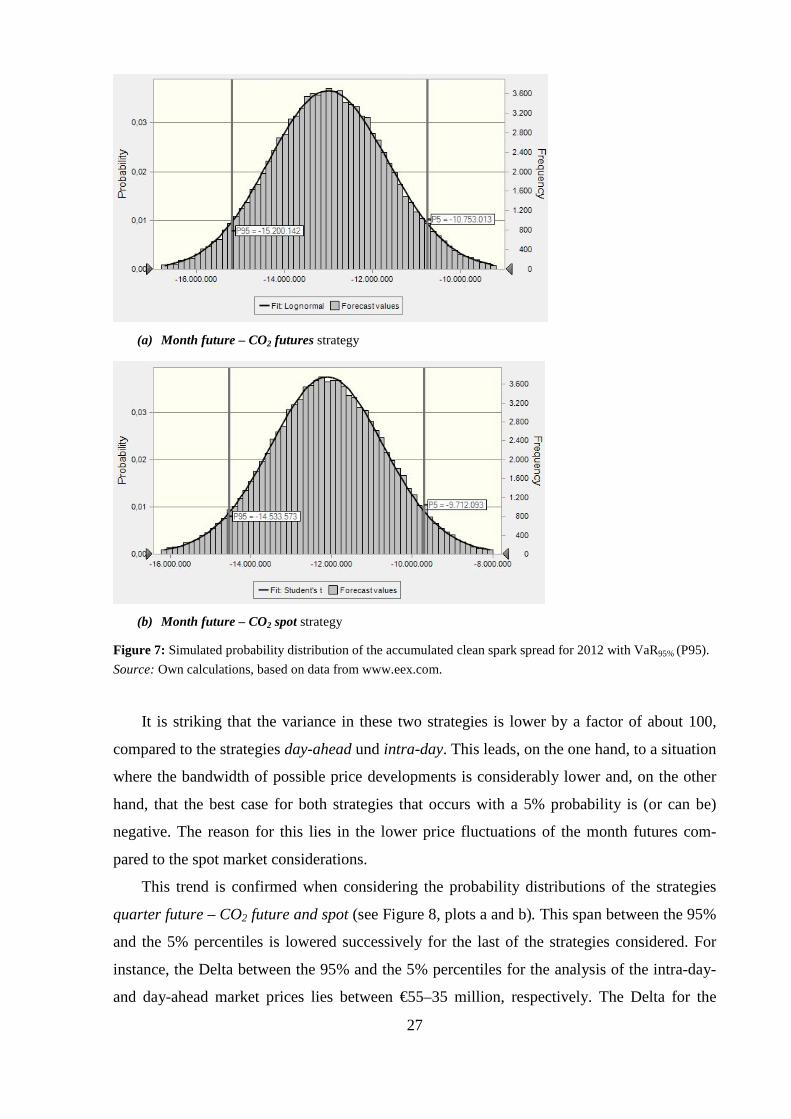
This trend is confirmed when considering the probability distributions of the strategies
quarter future – CO2 future and spot (see Figure 8, plots a and b). This span between the 95%
and the 5% percentiles is lowered successively for the last of the strategies considered. For
instance, the Delta between the 95% and the 5% percentiles for the analysis of the intra-day-
and day-ahead market prices lies between €55–35 million, respectively. The Delta for the

28
consideration of the month futures now lies only at about €25 million and that of the quarter
blocks at only about €8 million. The well-known weaker manifestations of the price variations
from the futures market are thus well represented by the model and corroborate its viability.
(a) Quarter future – CO2 futures strategy
(b) Quarter future – CO2 spot strategy
Figure 8: Simulated probability distributions of the accumulated clean spark spread for 2012 with VaR95% (P95). Source: Own calculations, based on data from www.eex.com.
Worth mentioning about the distribution of the Quarter Future strategies is also that the pos-
sible positive net revenues at €6 and 7 million are relatively high. From this, we can derive
that the concentration in the trade of quarter blocks is a good way to reduce the loss risk and
to not exclude possible gains. Possibly, the trade with quarter blocks offers a good compro-
mise between the loss of flexibility and security, respectively.
29
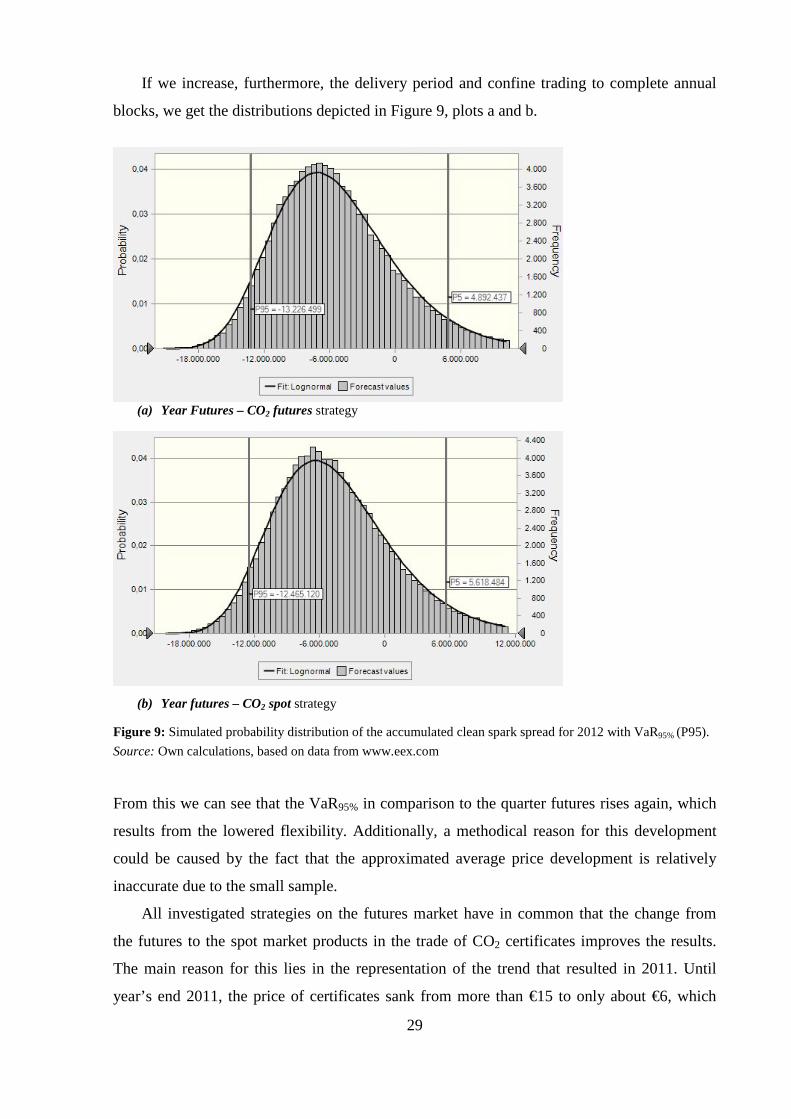
If we increase, furthermore, the delivery period and confine trading to complete annual
blocks, we get the distributions depicted in Figure 9, plots a and b.
(a) Year Futures – CO2 futures strategy
(b) Year futures – CO2 spot strategy
Figure 9: Simulated probability distribution of the accumulated clean spark spread for 2012 with VaR95% (P95). Source: Own calculations, based on data from www.eex.com
From this we can see that the VaR95% in comparison to the quarter futures rises again, which
results from the lowered flexibility. Additionally, a methodical reason for this development
could be caused by the fact that the approximated average price development is relatively
inaccurate due to the small sample.
All investigated strategies on the futures market have in common that the change from
the futures to the spot market products in the trade of CO2 certificates improves the results.
The main reason for this lies in the representation of the trend that resulted in 2011. Until
year’s end 2011, the price of certificates sank from more than €15 to only about €6, which

30
leads to a situation that a rise of only -0.105 was assumed for the linear extrapolation of the
mean value, so that the trade with spot market products is thus more advantageous. A further
commonality that can be taken from the distributions is that also here for increasing risk the
possible profit rises.
Table 3: Simulated VaR95% 2012 for the year 2012.
Strategies for the spot market VaR95% 2012
Day-ahead €-29,268,452
Intra-day €-38,959,717
Strategies for the futures market VaR95% 2012
CO2 future CO2 spot Month €-15,200,142 €-14,533,573
Quarter €-2,511,801 €-1,722,183
Year €-13,226,499 €-12,465,120
Source: Own calculations
Table 3, finally, provides an overview of the VaR95% values of the individual strategies de-
scribed up to now. This table, containing the mean values and the standard deviations of the
distributions analyzed, are used in the following section to determine an optimal combination
of strategies in the framework of a portfolio analysis.
4.3 Combination of different strategies
In this section, based on Markowitz’ portfolio theory, we investigate the diversification of the
various strategies with regard to efficient mixes. Efficient in this context means that the port-
folio for a given risk level cannot yield a higher clean spark spread. For the analysis after
Markowitz, we first define the mean value and the corresponding standard deviation22 of each
strategy, assuming a normally distributed frequency distribution (Table 4). Additionally, we
determine the correlations between the strategies (Table 5).
22 The fact that the distributions of the spreads of the corresponding strategies are not always normally distribut-ed, and that this results in an error, is known and considered in the valuation.

31
Table 4: Mean values (mi) and standard deviations (σi) of the frequency distributions for Strategies 1–8 (in €).
Mean Standard deviation
m1 -12,977,951 σ1 10,089,526
m2 -12,598,221 σ2 16,553,714
m3 -12,989,615 σ3 1,353,674
m4 -12,114,645 σ4 1,466,302
m5 1,905,039 σ5 2,686,234
m6 2,779,616 σ6 2,745,150
m7 -5,381,124 σ7 5,649,795
m8 -4,557,947 σ8 5,657,007
Source: Own calculations
Table 5: Computed correlation coefficients (ρ𝒊,𝒋) of Strategies 1–8.
Correlation ρ𝑖 ,𝑗 ρi,1 ρi,2 ρi,3 ρi,4 ρi,5 ρi,6 ρi,7 ρi,8 ρ1,j 1.00 0.82 0.43 0.59 0.10 0.50 -0.26 -0.24 ρ2,j
1.00 0.41 0.51 0.12 0.42 -0.17 -0.17
ρ3,j
1.00 0.79 0.54 0.56 0.29 0.23 ρ4,j
1.00 0.24 0.67 -0.21 -0.17
ρ5,j
1.00 0.62 0.71 0.68 ρ6,j
1.00 0.02 0.09
ρ7,j
1.00 0.94 ρ8,j
1.00
Source: Own calculations
Based on this, using eq. (6) the mean of the portfolio 𝑚𝑝
𝑚𝑝 = �𝑤𝑖 ∙ 𝑚𝑖,𝑛
𝑖=1
(6)
with 𝑚𝑖 being the mean value of the distribution of the strategy 𝑖 analyzed and 𝑤𝑖 as
weighting coefficient, is computed. The pre-factor 𝑤𝑖 considers here the percentage shares of
the various strategies and in sum yields, following eq. (7), always unity or 100%, i.e.:
𝑚𝑝 = �𝑤𝑖 ∙ 𝑚𝑖,𝑛
𝑖=1
(7)
The variance 𝜎𝑝 (standard deviation) of the portfolio is computed by using the equation
32
𝜎𝑝 = ��𝑤𝑖2 ∙ 𝜎𝑖2
𝑛
𝑖=1
+ ��𝑤𝑖𝑤𝑗 ∙ 𝜎𝑖𝜎𝑗𝜌𝑖,𝑗,𝑛
𝑗=1𝑗≠𝑖
𝑛
𝑖=1
(8)
where 𝜌𝑖,𝑗 is the correlation between different strategies, and 𝜎𝑖 and 𝜎𝑗 are the standard devia-
tions of the respective strategies.
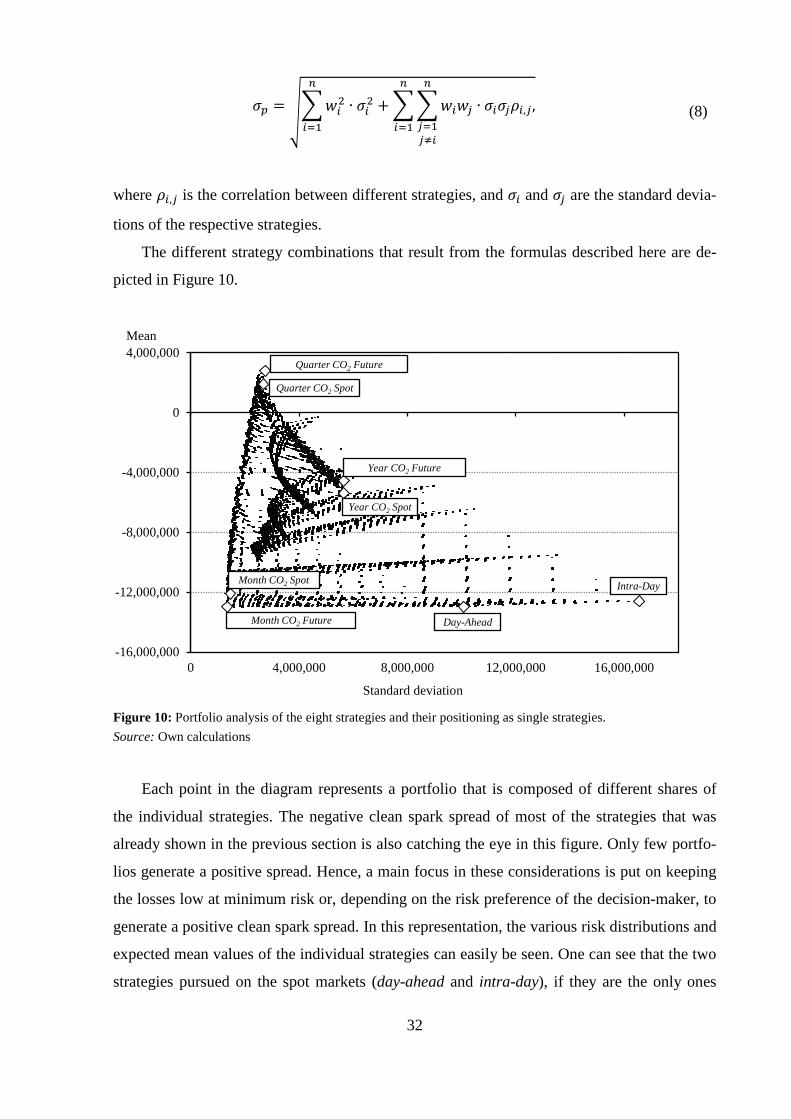
The different strategy combinations that result from the formulas described here are de-
picted in Figure 10.
Figure 10: Portfolio analysis of the eight strategies and their positioning as single strategies. Source: Own calculations
Each point in the diagram represents a portfolio that is composed of different shares of
the individual strategies. The negative clean spark spread of most of the strategies that was
already shown in the previous section is also catching the eye in this figure. Only few portfo-
lios generate a positive spread. Hence, a main focus in these considerations is put on keeping
the losses low at minimum risk or, depending on the risk preference of the decision-maker, to
generate a positive clean spark spread. In this representation, the various risk distributions and
expected mean values of the individual strategies can easily be seen. One can see that the two
strategies pursued on the spot markets (day-ahead and intra-day), if they are the only ones
-16,000,000
-12,000,000
-8,000,000
-4,000,000
0
4,000,000
0 4,000,000 8,000,000 12,000,000 16,000,000
Mean
Standard deviation
Quarter CO2 Future
Quarter CO2 Spot
Year CO2 Future
Year CO2 Spot
Month CO2 Spot
Month CO2 Future Day-Ahead
Intra-Day
33
adopted, lead to a very high risk and at the same time low expected mean values. Very low
mean values are also depicted for the two strategies month CO2 future and spot, which, how-
ever, in contrast to the two spot market strategies, show a very low variance (risk). The two
strategies that are based on yearly contracts, year CO2 future and spot, in comparison to the
strategies discussed so far, have higher expected mean values and thus lead to a lower average
loss. In contrast to the strategies that are based on monthly contracts, this profit at the mean
value results from accepting a higher risk.
As already for the case of the VaR analysis, here also the two strategies based on quarter-
ly contracts show the most favorable properties. Both a positive mean value and a comparably
low risk can be expected for these strategies. They can only be improved by portfolios charac-
terized by points that lie still further to the left. These portfolios have a similar mean value but
at a lower risk.
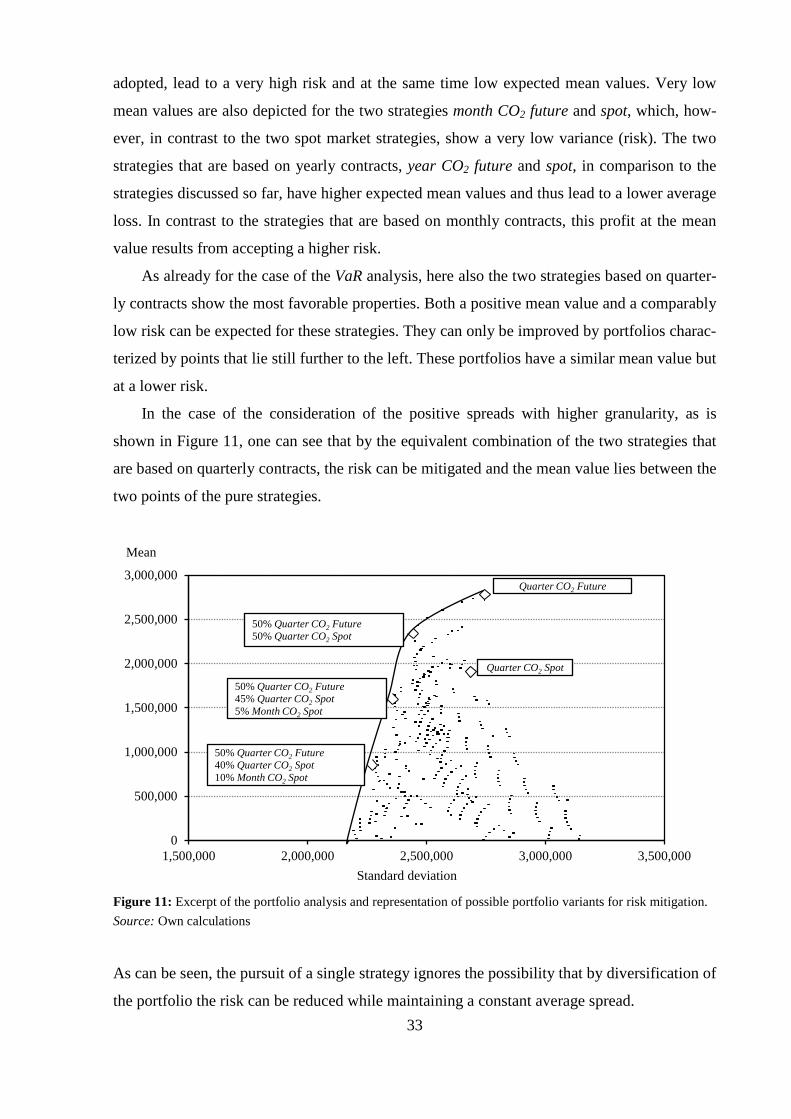
In the case of the consideration of the positive spreads with higher granularity, as is
shown in Figure 11, one can see that by the equivalent combination of the two strategies that
are based on quarterly contracts, the risk can be mitigated and the mean value lies between the
two points of the pure strategies.
Figure 11: Excerpt of the portfolio analysis and representation of possible portfolio variants for risk mitigation. Source: Own calculations
As can be seen, the pursuit of a single strategy ignores the possibility that by diversification of
the portfolio the risk can be reduced while maintaining a constant average spread.
0
500,000
1,000,000
1,500,000
2,000,000
2,500,000
3,000,000
1,500,000 2,000,000 2,500,000 3,000,000 3,500,000
Mean
Standard deviation
Quarter CO2 Future
50% Quarter CO2 Future 50% Quarter CO2 Spot
Quarter CO2 Spot
50% Quarter CO2 Future 40% Quarter CO2 Spot 10% Month CO2 Spot
50% Quarter CO2 Future 45% Quarter CO2 Spot 5% Month CO2 Spot

34
Figure 11, as an illustration, also depicts the shifting of the shares of the various strate-
gies within a portfolio change according to the selected points. For instance, if a portfolio is
chosen with a minimal risk, the month CO2 spot strategy gains more and more in importance,
whereas the influence of the quarter CO2 spot strategy decreases. The level of risk that can be
tolerated, and which average clean spark spread can be expected, eventually depends on the
risk preference of the decision-maker.
In conclusion, we can state that by combining medium- and long-term futures contracts,
the expected mean value can be raised, whereas simultaneously the risk is reduced. We also
find that, by diversification of the strategies, losses can be reduced and the risk exposure di-
minished.
5 Summary and outlook
By hedging against market price risks, the operators of industrial CHP plants are subject to
rising risks as the volatility of price developments on the commodity markets increases. The
partly large risks due to very volatile commodity prices make it necessary to systematically
evaluate and hedge. When operating a heat-driven industrial CHP plant, some special charac-
teristics need to be considered.
In this study, we show that by using the technically feasible flexibilities in plant opera-
tion, economic savings can be achieved. However, due to heat-based operation and the result-
ing limited power reductions possible, these savings are smaller than in the case of electricity-
driven power plants. Hence, it cannot be used without bounds for variable operation, as the
additionally arising costs have to be taken into account and balanced against the additional
revenues that accrue from the variable operation of the plant.
When valuing future operating decisions, we have shown by means of Monte Carlo simu-
lation that the market price risk in dependence of the selected trading product and the result-
ing strategy can be affected drastically, and that the choice of a suitable strategy diminishes
the VaR. More specifically, when trading short-term products on the spot market, these prod-
ucts feature high price volatilities, so that high loss values may result; conversely, however,
there is also the possibility of reaping high gains in case commodity prices move in a favora-
ble direction. Moreover, we could show that the market price risk can be mitigated by trade
on the futures market. In particular, the trade with quarterly products was shown to be advan-
tageous.

35
Fundamentally, we could show that the trade of CO2 certificates on the futures market
always leads to worse results than trade on the spot market. Due to uncertainties on the CO2
market, and due to the still existing overflow of certificates (and resulting low prices) for all
strategies, spot market trading is recommended.
Finally, we could show by means of an analysis of combined strategies borrowed from
Markowitz’ portfolio theory that the diversification of different strategies also for heat-driven
CHP plants can lead to an improvement of the result. This enables decision-makers, depend-
ing on their risk preference, to choose the subjectively best mix of strategies.
All results presented in this paper have to be interpreted as recommendations to support
decision-making that helps to mitigate market price risks. Weaknesses of the approach intro-
duced lie in the partly small sample sizes of the data, which makes the generalization of the
results difficult. In order to improve the precision of such analysis, future analyses in this field
ought to be concentrated on the enlargement of the data sample for raising forecast accuracy.
Moreover, in this study we have also shown the possibility to vary the different trading prod-
ucts amongst each other, which was only exploited to a limited extent, so that a further inves-
tigation on the interdependencies of different delivery periods is recommended. Additionally,
a validation of the models specified, based on historical data, would markedly improve their
explanatory power, and thus also ought to be subject to future research in this field.
References Alberola, E., Chevallier, J., Chèze, B. (2008), Price drivers and structural breaks in European
carbon prices 2005-2007, Energy Policy, 36(2), 787-797.
Baehr, H. (2005). Thermodynamik. Hannover: Springer-Verlag.
Bauwens, L., Hafner, C., Pierret, D. (2011). Multivariate volatility modeling of electricity
futures. Center of Operations Research and Econometrics, Louvain-la-Neuve.
Benz, E., Trück, S. (2009). Modeling the price dynamics of CO2 emission allowances. Energy
Economics, 31(1), 4-15.
BMU - Bundesministerium für Umwelt, Naturschutz und Reaktorsicherheit (2007), Gesetz
über den nationalen Zuteilungsplan für Treibhausgas-Emissionsberechtigungen in der
Zuteilungsperiode 2008 bis 2012. Berlin.
BMU - Bundesministerium für Umwelt, Naturschutz und Reaktorsicherheit (2006),
Nationaler Allokationsplan 2008-2012 für die Bundesrepublik Deutschland. Berlin.
Boubonnais, R., Keppler, J., Girod, J. (2006), The Econometrics of Energy Systems. Paris:
Palgrave Macmillan.

36
Burger, M., Klar, B., Müller A., Schindlmayr, G. (2004). A spot market model for pricing
derivatives in electricity markets. Quantitative Finance, 4(1), 109-122.
Chevallier, J. (2011). Detecting instability in the volatility of carbon prices. Energy
Economics, 33(1), 99-110.
Deng, S.-J. (2000). Pricing electricity derivatives under alternative stochastic spot price
models. Proceeding of the 33rd Hawaii International Conference on System Science.
Duan, J.-C. (1995). The GARCH option pricing model. Mathematical Finance, 5(1), 13-32.
El Hedi Arouri, M., Jawadi, F., Nguyen, D. K. (2012). Nonlinearities in carbon spot-future
price relationships during Phase II of the EU ETS. Economic Modelling 29(3), 884-892.
Escribano, Á., Peña, J., Villaplana, P. (2002). Modelling electricity prices: international
evidence. Working Paper 02-27, Universidad Carlos III de Madrid.
EEX - European Energy Exchange AG (2011a). EEX Produktbroschüre Strom. Leipzig.
EEX - European Energy Exchange AG (2011b). EEX Produktbroschüre Erdgas. Leipzig.
EEX - European Energy Exchange AG (2011c). EEX Produktbroschüre EU-
Emissionsberechtigungen. Leipzig.
Felder, F. (1996). Integrated financial theory and methods in electricity resource planning.
Energy Policy, 24(2), 149-154.
Flauger, J. (2012). Stromnetzbetreiber kämpfen gegen Blackout. Handelsblatt. Online-
Ausgabe vom 8. Februar 2012 (www.handelsblatt.com).
Geman, H., Ohana, S. (2009). Forward curves, scarcity and price volatiility in oil and natural
gas markets. Energy Economics, 31(4), 576-585.
Guthrie, G., Videbeck, S. (2007). Electricity spot price dynamics: Beyond financial models.
Energy Policy, 35(11), 5614-5621.
Henney, A., Keers, G. (1999). Managing Total Corporate Electricity/Energy Market Risks.
The Electricity Journal, 11(8), 36-46.
Herbert, J. (1995). Trading volume, maturity and natural gas future price volaltility. Energy
Economics, 17(4), 293-299.
Heydari, S., Siddiqui, A. (2010). Valuing a gas-fired power plant: A comparison of ordinary
linear models, regime-switching approaches, and models with stochastic volaltility.
Energy Economics, 32(3), 709-725.
Huisman, R., Huurman, C. (2003). Fat Tails in Power Prices. ERIM Report Series Research in
Management.
Huisman, R., Huurman, C., Mahieu, R. (2007). Hourly electricity prices in day-ahead
markets. Energy Economics, 27(2), 240-248.
37
KWKG (2011). Gesetz für die Erhaltung, die Modernisierung und den Ausbau der Kraft-
Wärme-Kopplung – Kraft-Wärme-Kopplungsgesetz vom 19. März 2002 (BGBl. I S.
1092), zuletzt geändert durch Artikel 11 des Gesetzes vom 28. Juli 2011 (BGBl. I S.
1634).
Linsmeier, T. J., Pearson, N. D. (2000). Value at Risk. Financial Analyst Journal, 56(2), 47-
67.
Lui, M., Wu, F. (2008). Risk Management in Competitive Electricity Market. In M. Bazilian
and F. Roques (eds.), Analytical Methods for Energy Diversity & Security - Portfolio
Optimization in the Energy Sector, 247-262.
Markowitz, H. (1952). Portfolio selection. Journal of Finance, 7(1), 77-91.
Markowitz, H. M. (2008). Portfolio Selection. München: FinanzBuch Verlag GmbH.
Masaaki, B., Yasushi, T., Yasushi, I., Takahiko, M., Atsushi, A., Takao, K. (2007). Risk
hedging against the fuel price fluctuation in energy service business. Energy, 32(11),
2051-2060.
Massey, Jr., F. (1951). The Kolmogorov-Smirnov test for Goodness of Fit. Journal of the
American Statistical Association, 46(253), 68-78.
Nakamura, M., Nakashima, T., Niimura, T. (2006). Electricity markets volatility: estimates,
regularities and risk management applications. Energy Policy, 34(14), 1736-1749.
Pindyck, R. (2003). Volatility in natural gas and oil markets. Cambridge: M.I.T. - Center for
Energy and Environmental Policy Research (CEEPR).
Rachev, S. (2005). Vorisicht Hochspannung – Risikomanagement in Energiemärkten (Teil
III). RISKNEWS, 66-71.
Rong, A., Lahdelma, R. (2007). CO2 emission trading planning in combined heat and power
production via multi-period stochastic optimization. European Journal of Operational
Research, 176(3), 1874-1895.
Urban, D., Mayerl, J. (2011). Regressionsanalyse: Theorie, Technik und Anwendung.
Wiesbaden: VS Verlag für Sozialwissenschaften.
Vehviläinen, I., Keppo, J. (2003). Managing electricity market price risk. European Journal
of Operational Research, 145(1), 136-147.
Weron, H. (2005). Heavy Tails and Electricity Prices. The Deutsche Bundesbank’s 2005
Annual Fall Conference.
Weron, R., Kozlowska, B., Nowicka-Zagrajek, J. (2001). Modeling electricity loads in
California: a continous-time approach. Physica A: Statistical Mechanics and its
Applications, 299(1-2), 344-350.

38
Westner, G., Madlener, R. (2010). The benefit of regional diversification of cogenerated
investments in Europe: A mean-variance portfolio analysis. Energy Policy, 38(12),
7911-7920.
Westner, G., Madlener, R. (2011a). Investment in new power generation under uncertainty:
Benefits of CHP vs. condensing plants in a copula-based analysis. Energy Economics,
34(1), 31-44.
Westner, G., Madlener, R. (2011b). Development of cogeneration in Germany: A mean-
variance portfolio analysis of individual technology's prospects in view of the new
regulatory framework. Energy, 36(8), 5301-5313.

39
Appendix: Estimation of the probability distribution Table A1: Estimated probability distributions and their parameter values for different price trajectories and months at the spot market for electricity, natural gas, and CO2.
Commodity Distribution A-D K-S Parameters Electricity, Day-Ahead Student's t 1.14 0.03 Midpoint=0, Scale=7.65358, Deg. Freedom=5.16613 Gas, Day-Ahead Logistic 13.89 0.07 Mean=-0.31478, Scale=1.82963 CO2, Day-Ahead Logistic 4.37 0.05 Mean=0.12463, Scale=1.09155 Electricity, Intra-Day Logistic 64.44 0.04 Mean=-0.11086, Scale=10.92158
Notes: Anderson-Darling (A-D) and Kolmogorov-Smirnov (K-S) test procedures. Source: Own calculations, based on data from www.eex.com Table A2: Estimated probability distributions and their parameter values for different price trajectories and months at the futures market for electricity and natural gas.
Month Distribution A-D K-S Parameters Electricity Month Future: Jan Min Extreme 2.59 0.07 Likeliest=1.4691, Scale=2.49619 Feb Beta 0.36 0.04 Minimum=-7.67577, Maximum=5.57878, Alpha=1.96589, Beta=1.42882 Mar Beta 0.54 0.04 Minimum=-4.67179, Maximum=5.80386, Alpha=1.59371, Beta=1.9799 Apr Beta 0.47 0.04 Minimum=-4.05867, Maximum=7.35096, Alpha=1.62438, Beta=2.94346 May Max Extreme 0.39 0.03 Likeliest=-1.0285, Scale=1.82959 Jun Lognormal 5.10 0.10 Mean=0.00178, Std. Dev.=4.61528, Location=-15.85035 Jul Lognormal 0.71 0.05 Mean=0.01119, Std. Dev.=4.19601, Location=-8.24919 Aug Weibull 0.77 0.05 Location=-9.39715, Scale=10.48361, Shape=3.4796 Sep Min Extreme 1.01 0.05 Likeliest=1.53334, Scale=2.76426 Oct Weibull 0.47 0.03 Location=-16.83904, Scale=17.85984, Shape=8.19619 Nov Gamma 3.61 0.07 Location=-82.66186, Scale=0.08274, Shape=999 Dec Logistic 2.44 0.06 Mean=0.13666, Scale=1.53807 Gas Month Future: Jan Triangular 2.21 0.10 Minimum=-5.76667, Likeliest=-0.8071, Maximum=6.24523 Feb Gamma 0.81 0.06 Location=-5.4896, Scale=0.73421, Shape=7.47684 Mar Min Extreme 0.54 0.05 Likeliest=0.60089, Scale=1.07394 Apr Lognormal 0.64 0.06 Mean=0.00197, Std. Dev.=1.16847, Location=-4.1905 May Beta 0.35 0.04 Minimum=-2.62514, Maximum=4.4736, Alpha=2.81547, Beta=4.79795 Jun Gamma 1.29 0.07 Location=-4.13838, Scale=1.35984, Shape=3.04328 Jul Max Extreme 1.70 0.07 Likeliest=-0.96273, Scale=1.76253 Aug Lognormal 0.92 0.06 Mean=0.01147, Std. Dev.=1.75404, Location=-9.72848 Sep Weibull 0.80 0.06 Location=-5.48555, Scale=6.02296, Shape=4.53664 Oct Logistic 2.05 0.08 Mean=-0.01864, Scale=0.85603 Nov Lognormal 2.25 0.06 Mean=0.0005, Std. Dev.=1.80361, Location=-16.32555 Dec Logistic 0.96 0.05 Mean=-0.0231, Scale=1.23943
Notes: Anderson-Darling (A-D) and Kolmogorov-Smirnov (K-S) test procedures Source: Own calculations, based on data from www.eex.com

40
Table A3: Estimated probability distributions and their parameters for different price developments and quar-ters on the electricity and gas futures market.
Quarter Distribution A-D K-S Parameters Electricity Quarter Future:
Jan-Mar Logistic 1.26 0.04 Mean=0.00239, Scale=2.18294 Apr-Jun Weibull 0.79 0.03 Location=-12.06335, Scale=13.06121, Shape=5.52762 Jul-Sep Weibull 2.13 0.06 Location=-13.70833, Scale=14.68613, Shape=6.72084 Oct-Dec Logistic 1.14 0.05 Mean=0.06771, Scale=1.45254 Gas Quarter Future:
Jan-Mar Weibull 1.92 0.05 Location=-15.81943, Scale=17.05384, Shape=5.98798
Apr-Jun Beta 1.21 0.06 Minimum=-5.94769, Maximum=6.82688, Alpha=2.68774, Be-ta=3.08504
Jul-Sep Triangular 3.59 0.08 Minimum=-3.8928, Likeliest=-1.86846, Maximum=6.17001
Oct-Dec Beta 1.55 0.07 Minimum=-5.21937, Maximum=4.73666, Alpha=2.42559, Be-ta=2.20126
Notes: Anderson-Darling (A-D) and Kolmogorov-Smirnov (K-S) test procedures. Source: Own calculations, based on data from www.eex.com Table A4: Estimated probability distributions and their parameters for different price developments on the elec-tricity, gas and CO2 certificate futures market.
Commodity Distribution A-D K-S Parameters Year Future:
Electricity Logistic 0.75 0.03 Mean=0.00101, Scale=1.52884 Gas Min Extreme 3.54 0.07 Likeliest=1.2134, Scale=2.10149 CO2 Min Extreme 1.55 0.05 Likeliest=0.60352, Scale=1.03397
Notes: Anderson-Darling (A-D) and Kolmogorov-Smirnov (K-S) test procedures. Source: Own calculations, based on data from www.eex.com
List of FCN Working Papers
2012
Ghosh G., Shortle J. (2012). Managing Pollution Risk through Emissions Trading, FCN Working Paper No. 1/2012, Institute for Future Energy Consumer Needs and Behavior, RWTH Aachen University, January.
Palzer A., Westner G., Madlener M. (2012). Evaluation of Different Hedging Strategies for Commodity Price Risks
of Industrial Cogeneration Plants, FCN Working Paper No. 2/2012, Institute for Future Energy Consumer Needs and Behavior, RWTH Aachen University, March (revised March 2013).
2011 Sorda G., Sunak Y., Madlener R. (2011). A Spatial MAS Simulation to Evaluate the Promotion of Electricity from
Agricultural Biogas Plants in Germany, FCN Working Paper No. 1/2011, Institute for Future Energy Consumer Needs and Behavior, RWTH Aachen University, January (revised October 2012).
Madlener R., Hauertmann M. (2011). Rebound Effects in German Residential Heating: Do Ownership and Income
Matter?, FCN Working Paper No. 2/2011, Institute for Future Energy Consumer Needs and Behavior, RWTH Aachen University, February.
Garbuzova M., Madlener R. (2011). Towards an Efficient and Low-Carbon Economy Post-2012: Opportunities
and Barriers for Foreign Companies in the Russian Market, FCN Working Paper No. 3/2011, Institute for Future Energy Consumer Needs and Behavior, RWTH Aachen University, February (revised July 2011).
Westner G., Madlener R. (2011). The Impact of Modified EU ETS Allocation Principles on the Economics of CHP-
Based District Heating Networks. FCN Working Paper No. 4/2011, Institute for Future Energy Consumer Needs and Behavior, RWTH Aachen University, February.
Madlener R., Ruschhaupt J. (2011). Modeling the Influence of Network Externalities and Quality on Market
Shares of Plug-in Hybrid Vehicles, FCN Working Paper No. 5/2011, Institute for Future Energy Consumer Needs and Behavior, RWTH Aachen University, March.
Juckenack S., Madlener R. (2011). Optimal Time to Start Serial Production: The Case of the Direct Drive Wind
Turbine of Siemens Wind Power A/S, FCN Working Paper No. 6/2011, Institute for Future Energy Consumer Needs and Behavior, RWTH Aachen University, March.
Madlener R., Sicking S. (2011). Assessing the Economic Potential of Microdrilling in Geothermal Exploration,
FCN Working Paper No. 7/2011, Institute for Future Energy Consumer Needs and Behavior, RWTH Aachen University, April.
Bernstein R., Madlener R. (2011). Responsiveness of Residential Electricity Demand in OECD Countries: A Panel
Cointegation and Causality Analysis, FCN Working Paper No. 8/2011, Institute for Future Energy Consumer Needs and Behavior, RWTH Aachen University, April.
Michelsen C.C., Madlener R. (2011). Homeowners' Preferences for Adopting Residential Heating Systems: A
Discrete Choice Analysis for Germany, FCN Working Paper No. 9/2011, Institute for Future Energy Consumer Needs and Behavior, RWTH Aachen University, May (revised January 2012).
Madlener R., Glensk B., Weber V. (2011). Fuzzy Portfolio Optimization of Onshore Wind Power Plants. FCN
Working Paper No. 10/2011, Institute for Future Energy Consumer Needs and Behavior, RWTH Aachen University, May.
Glensk B., Madlener R. (2011). Portfolio Selection Methods and their Empirical Applicability to Real Assets in
Energy Markets. FCN Working Paper No. 11/2011, Institute for Future Energy Consumer Needs and Behavior, RWTH Aachen University, May.

Kraas B., Schroedter-Homscheidt M., Pulvermüller B., Madlener R. (2011). Economic Assessment of a Concentrating Solar Power Forecasting System for Participation in the Spanish Electricity Market, FCN Working Paper No. 12/2011, Institute for Future Energy Consumer Needs and Behavior, RWTH Aachen University, May.
Stocker A., Großmann A., Madlener R., Wolter M.I., (2011). Sustainable Energy Development in Austria Until
2020: Insights from Applying the Integrated Model “e3.at”, FCN Working Paper No. 13/2011, Institute for Future Energy Consumer Needs and Behavior, RWTH Aachen University, July.
Kumbaroğlu G., Madlener R. (2011). Evaluation of Economically Optimal Retrofit Investment Options for Energy
Savings in Buildings. FCN Working Paper No. 14/2011, Institute for Future Energy Consumer Needs and Behavior, RWTH Aachen University, September.
Bernstein R., Madlener R. (2011). Residential Natural Gas Demand Elasticities in OECD Countries: An ARDL Bounds Testing Approach, FCN Working Paper No. 15/2011, Institute for Future Energy Consumer Needs and Behavior, RWTH Aachen University, October.
Glensk B., Madlener R. (2011). Dynamic Portfolio Selection Methods for Power Generation Assets, FCN Working Paper No. 16/2011, Institute for Future Energy Consumer Needs and Behavior, RWTH Aachen University, November.
Michelsen C.C., Madlener R. (2011). Homeowners' Motivation to Adopt a Residential Heating System: A Principal-Component Analysis, FCN Working Paper No. 17/2011, Institute for Future Energy Consumer Needs and Behavior, RWTH Aachen University, November (revised January 2013).
Razlaf J., Madlener R. (2011). Performance Measurement of CCS Power Plants Using the Capital Asset Pricing Model, FCN Working Paper No. 18/2011, Institute for Future Energy Consumer Needs and Behavior, RWTH Aachen University, November.
Himpler S., Madlener R. (2011). Repowering of Wind Turbines: Economics and Optimal Timing, FCN Working Paper No. 19/2011, Institute for Future Energy Consumer Needs and Behavior, RWTH Aachen University, November.
Hackbarth A., Madlener R. (2011). Consumer Preferences for Alternative Fuel Vehicles: A Discrete Choice Analysis, FCN Working Paper No. 20/2011, Institute for Future Energy Consumer Needs and Behavior, RWTH Aachen University, December (revised December 2012).
Heuser B., Madlener R. (2011). Geothermal Heat and Power Generation with Binary Plants: A Two-Factor Real Options Analysis, FCN Working Paper No. 21/2011, Institute for Future Energy Consumer Needs and Behavior, RWTH Aachen University, December.
Rohlfs W., Madlener R. (2011). Multi-Commodity Real Options Analysis of Power Plant Investments: Discounting Endogenous Risk Structures, FCN Working Paper No. 22/2011, Institute for Future Energy Consumer Needs and Behavior, RWTH Aachen University, December (revised July 2012).
2010 Lang J., Madlener R. (2010). Relevance of Risk Capital and Margining for the Valuation of Power Plants: Cash
Requirements for Credit Risk Mitigation, FCN Working Paper No. 1/2010, Institute for Future Energy Consumer Needs and Behavior, RWTH Aachen University, February.
Michelsen C., Madlener R. (2010). Integrated Theoretical Framework for a Homeowner’s Decision in Favor of an
Innovative Residential Heating System, FCN Working Paper No. 2/2010, Institute for Future Energy Consumer Needs and Behavior, RWTH Aachen University, February.
Harmsen - van Hout M.J.W., Herings P.J.-J., Dellaert B.G.C. (2010). The Structure of Online Consumer
Communication Networks, FCN Working Paper No. 3/2010, Institute for Future Energy Consumer Needs and Behavior, RWTH Aachen University, March.
Madlener R., Neustadt I. (2010). Renewable Energy Policy in the Presence of Innovation: Does Government Pre-
Commitment Matter?, FCN Working Paper No. 4/2010, Institute for Future Energy Consumer Needs and Behavior, RWTH Aachen University, April (revised June 2010 and December 2011).

Harmsen-van Hout M.J.W., Dellaert B.G.C., Herings, P.J.-J. (2010). Behavioral Effects in Individual Decisions of Network Formation: Complexity Reduces Payoff Orientation and Social Preferences, FCN Working Paper No. 5/2010, Institute for Future Energy Consumer Needs and Behavior, RWTH Aachen University, May.
Lohwasser R., Madlener R. (2010). Relating R&D and Investment Policies to CCS Market Diffusion Through Two-
Factor Learning, FCN Working Paper No. 6/2010, Institute for Future Energy Consumer Needs and Behavior, RWTH Aachen University, June.
Rohlfs W., Madlener R. (2010). Valuation of CCS-Ready Coal-Fired Power Plants: A Multi-Dimensional Real
Options Approach, FCN Working Paper No. 7/2010, Institute for Future Energy Consumer Needs and Behavior, RWTH Aachen University, July.
Rohlfs W., Madlener R. (2010). Cost Effectiveness of Carbon Capture-Ready Coal Power Plants with Delayed
Retrofit, FCN Working Paper No. 8/2010, Institute for Future Energy Consumer Needs and Behavior, RWTH Aachen University, August (revised December 2010).
Gampert M., Madlener R. (2010). Pan-European Management of Electricity Portfolios: Risks and Opportunities of
Contract Bundling, FCN Working Paper No. 9/2010, Institute for Future Energy Consumer Needs and Behavior, RWTH Aachen University, August.
Glensk B., Madlener R. (2010). Fuzzy Portfolio Optimization for Power Generation Assets, FCN Working Paper
No. 10/2010, Institute for Future Energy Consumer Needs and Behavior, RWTH Aachen University, August. Lang J., Madlener R. (2010). Portfolio Optimization for Power Plants: The Impact of Credit Risk Mitigation and
Margining, FCN Working Paper No. 11/2010, Institute for Future Energy Consumer Needs and Behavior, RWTH Aachen University, September.
Westner G., Madlener R. (2010). Investment in New Power Generation Under Uncertainty: Benefits of CHP vs.
Condensing Plants in a Copula-Based Analysis, FCN Working Paper No. 12/2010, Institute for Future Energy Consumer Needs and Behavior, RWTH Aachen University, September.
Bellmann E., Lang J., Madlener R. (2010). Cost Evaluation of Credit Risk Securitization in the Electricity Industry:
Credit Default Acceptance vs. Margining Costs, FCN Working Paper No. 13/2010, Institute for Future Energy Consumer Needs and Behavior, RWTH Aachen University, September (revised May 2011).
Ernst C.-S., Lunz B., Hackbarth A., Madlener R., Sauer D.-U., Eckstein L. (2010). Optimal Battery Size for Serial
Plug-in Hybrid Vehicles: A Model-Based Economic Analysis for Germany, FCN Working Paper No. 14/2010, Institute for Future Energy Consumer Needs and Behavior, RWTH Aachen University, October (revised June 2011).
Harmsen - van Hout M.J.W., Herings P.J.-J., Dellaert B.G.C. (2010). Communication Network Formation with Link
Specificity and Value Transferability, FCN Working Paper No. 15/2010, Institute for Future Energy Consumer Needs and Behavior, RWTH Aachen University, November.
Paulun T., Feess E., Madlener R. (2010). Why Higher Price Sensitivity of Consumers May Increase Average
Prices: An Analysis of the European Electricity Market, FCN Working Paper No. 16/2010, Institute for Future Energy Consumer Needs and Behavior, RWTH Aachen University, November.
Madlener R., Glensk B. (2010). Portfolio Impact of New Power Generation Investments of E.ON in Germany,
Sweden and the UK, FCN Working Paper No. 17/2010, Institute for Future Energy Consumer Needs and Behavior, RWTH Aachen University, November.
Ghosh G., Kwasnica A., Shortle J. (2010). A Laboratory Experiment to Compare Two Market Institutions for
Emissions Trading, FCN Working Paper No. 18/2010, Institute for Future Energy Consumer Needs and Behavior, RWTH Aachen University, November.
Bernstein R., Madlener R. (2010). Short- and Long-Run Electricity Demand Elasticities at the Subsectoral Level:
A Cointegration Analysis for German Manufacturing Industries, FCN Working Paper No. 19/2010, Institute for Future Energy Consumer Needs and Behavior, RWTH Aachen University, November.
Mazur C., Madlener R. (2010). Impact of Plug-in Hybrid Electric Vehicles and Charging Regimes on Power
Generation Costs and Emissions in Germany, FCN Working Paper No. 20/2010, Institute for Future Energy Consumer Needs and Behavior, RWTH Aachen University, November.
Madlener R., Stoverink S. (2010). Power Plant Investments in the Turkish Electricity Sector: A Real Options
Approach Taking into Account Market Liberalization, FCN Working Paper No. 21/2010, Institute for Future Energy Consumer Needs and Behavior, RWTH Aachen University, December (revised July 2011).
Melchior T., Madlener R. (2010). Economic Evaluation of IGCC Plants with Hot Gas Cleaning, FCN Working Paper No. 22/2010, Institute for Future Energy Consumer Needs and Behavior, RWTH Aachen University, December.
Lüschen A., Madlener R. (2010). Economics of Biomass Co-Firing in New Hard Coal Power Plants in Germany,
FCN Working Paper No. 23/2010, Institute for Future Energy Consumer Needs and Behavior, RWTH Aachen University, December.
Madlener R., Tomm V. (2010). Electricity Consumption of an Ageing Society: Empirical Evidence from a Swiss
Household Survey, FCN Working Paper No. 24/2010, Institute for Future Energy Consumer Needs and Behavior, RWTH Aachen University, December.
Tomm V., Madlener R. (2010). Appliance Endowment and User Behaviour by Age Group: Insights from a Swiss
Micro-Survey on Residential Electricity Demand, FCN Working Paper No. 25/2010, Institute for Future Energy Consumer Needs and Behavior, RWTH Aachen University, December.
Hinrichs H., Madlener R., Pearson P. (2010). Liberalisation of Germany’s Electricity System and the Ways
Forward of the Unbundling Process: A Historical Perspective and an Outlook, FCN Working Paper No. 26/2010, Institute for Future Energy Consumer Needs and Behavior, RWTH Aachen University, December.
Achtnicht M. (2010). Do Environmental Benefits Matter? A Choice Experiment Among House Owners in
Germany, FCN Working Paper No. 27/2010, Institute for Future Energy Consumer Needs and Behavior, RWTH Aachen University, December.
2009 Madlener R., Mathar T. (2009). Development Trends and Economics of Concentrating Solar Power Generation
Technologies: A Comparative Analysis, FCN Working Paper No. 1/2009, Institute for Future Energy Consumer Needs and Behavior, RWTH Aachen University, November (revised September 2010).
Madlener R., Latz J. (2009). Centralized and Integrated Decentralized Compressed Air Energy Storage for
Enhanced Grid Integration of Wind Power, FCN Working Paper No. 2/2009, Institute for Future Energy Consumer Needs and Behavior, RWTH Aachen University, November (revised September 2010).
Kraemer C., Madlener R. (2009). Using Fuzzy Real Options Valuation for Assessing Investments in NGCC and
CCS Energy Conversion Technology, FCN Working Paper No. 3/2009, Institute for Future Energy Consumer Needs and Behavior, RWTH Aachen University, November.
Westner G., Madlener R. (2009). Development of Cogeneration in Germany: A Dynamic Portfolio Analysis Based
on the New Regulatory Framework, FCN Working Paper No. 4/2009, Institute for Future Energy Consumer Needs and Behavior, RWTH Aachen University, November (revised March 2010).
Westner G., Madlener R. (2009). The Benefit of Regional Diversification of Cogeneration Investments in Europe:
A Mean-Variance Portfolio Analysis, FCN Working Paper No. 5/2009, Institute for Future Energy Consumer Needs and Behavior, RWTH Aachen University, November (revised March 2010).
Lohwasser R., Madlener R. (2009). Simulation of the European Electricity Market and CCS Development with the
HECTOR Model, FCN Working Paper No. 6/2009, Institute for Future Energy Consumer Needs and Behavior, RWTH Aachen University, November.
Lohwasser R., Madlener R. (2009). Impact of CCS on the Economics of Coal-Fired Power Plants – Why
Investment Costs Do and Efficiency Doesn’t Matter, FCN Working Paper No. 7/2009, Institute for Future Energy Consumer Needs and Behavior, RWTH Aachen University, November.
Holtermann T., Madlener R. (2009). Assessment of the Technological Development and Economic Potential of
Photobioreactors, FCN Working Paper No. 8/2009, Institute for Future Energy Consumer Needs and Behavior, RWTH Aachen University, November.
Ghosh G., Carriazo F. (2009). A Comparison of Three Methods of Estimation in the Context of Spatial Modeling,
FCN Working Paper No. 9/2009, Institute for Future Energy Consumer Needs and Behavior, RWTH Aachen University, November.
Ghosh G., Shortle J. (2009). Water Quality Trading when Nonpoint Pollution Loads are Stochastic, FCN Working
Paper No. 10/2009, Institute for Future Energy Consumer Needs and Behavior, RWTH Aachen University, November.

Ghosh G., Ribaudo M., Shortle J. (2009). Do Baseline Requirements hinder Trades in Water Quality Trading Programs?, FCN Working Paper No. 11/2009, Institute for Future Energy Consumer Needs and Behavior, RWTH Aachen University, November.
Madlener R., Glensk B., Raymond P. (2009). Investigation of E.ON’s Power Generation Assets by Using Mean-
Variance Portfolio Analysis, FCN Working Paper No. 12/2009, Institute for Future Energy Consumer Needs and Behavior, RWTH Aachen University, November.
2008 Madlener R., Gao W., Neustadt I., Zweifel P. (2008). Promoting Renewable Electricity Generation in Imperfect
Markets: Price vs. Quantity Policies, FCN Working Paper No. 1/2008, Institute for Future Energy Consumer Needs and Behavior, RWTH Aachen University, July (revised May 2009).
Madlener R., Wenk C. (2008). Efficient Investment Portfolios for the Swiss Electricity Supply Sector, FCN Working
Paper No. 2/2008, Institute for Future Energy Consumer Needs and Behavior, RWTH Aachen University, August.
Omann I., Kowalski K., Bohunovsky L., Madlener R., Stagl S. (2008). The Influence of Social Preferences on
Multi-Criteria Evaluation of Energy Scenarios, FCN Working Paper No. 3/2008, Institute for Future Energy Consumer Needs and Behavior, RWTH Aachen University, August.
Bernstein R., Madlener R. (2008). The Impact of Disaggregated ICT Capital on Electricity Intensity of Production:
Econometric Analysis of Major European Industries, FCN Working Paper No. 4/2008, Institute for Future Energy Consumer Needs and Behavior, RWTH Aachen University, September.
Erber G., Madlener R. (2008). Impact of ICT and Human Skills on the European Financial Intermediation Sector,
FCN Working Paper No. 5/2008, Institute for Future Energy Consumer Needs and Behavior, RWTH Aachen University, September.
FCN Working Papers are free of charge. They can mostly be downloaded in pdf format from the FCN / E.ON ERC Website (www.eonerc.rwth-aachen.de/fcn) and the SSRN Website (www.ssrn.com), respectively. Alternatively, they may also be ordered as hardcopies from Ms Sabine Schill (Phone: +49 (0) 241-80 49820, E-mail: [email protected]), RWTH Aachen University, Institute for Future Energy Consumer Needs and Behavior (FCN), Chair of Energy Economics and Management (Prof. Dr. Reinhard Madlener), Mathieustrasse 10, 52074 Aachen, Germany.