Embed Size (px)
Citation preview

EVALUATION OF DIAGNOSTIC PERFORMANCE AND FACTORS
AFFECTING MALARIA RAPID TEST KITS IN SEME, KISUMU COUNTY
Celline Atieno Okuta
A thesis Submitted to the School of Public Health Biomedical Sciences and
Technology in Partial Fulfillment for the Requirements of the award of the
Degree of Masters of Medical Laboratory Sciences (Parasitology, Entomology
and Vector Biology option) of Masinde Muliro University of Science and
Technology
June, 2021

ii
DECLARATION
iii
COPYRIGHT STATEMENT
This thesis is a copyright material protected under the Berne Convection, the copyright
Act 1999 and other international and national enactments in that behalf, on intellectual
property. It may not be reproduced by any means in full or in part except for short
extracts in fair dealing for research or private study, critical scholarly review or
discourse with acknowledgment, with written permission of the Dean, School of
Graduate Studies, on behalf of both the author and Masinde Muliro University of
Science and Technology (MMUST).

iv
DEDICATION
This work is dedicated to my parents, Mr. and Mrs. Okuta and my husband Daniel
Ochola for their continued support throughout my study.
v
ACKNOWLEDGEMENT
I would like to express my sincere gratitude to my supervisors Dr. Christine Wanjala
and Mr. Fidelis Mambo for the continuous support of my master’s study and for their
guidance that helped me in the entire time of study and writing of this thesis. Besides
my supervisors, I would like to thank all the Masinde Muliro University academic staff
for their insightful comments. I thank my fellow classmates for the stimulating
discussions, for the sleepless nights we were working together before deadlines. I also
appreciate the Seme Sub County medical officer of health Mr. Nicholus Pule and the
in charges of hospitals who participated in the study for giving me an opportunity to
conduct the study in the Sub County. Last but not least, I would like to thank my God
for giving me life and strength to go through this process, my family and parents for
supporting me throughout writing this thesis.

vi
ABSTRACT
Malaria disease is a global challenge and a major public health threat. Quality
diagnosis of malaria is a key aspect of health care, as it provides an explanation of
patient’s health problem and informs subsequent health care decisions. Microscopy is
the reference test method for malaria diagnosis; however, the availability and
utilization rate of malaria rapid diagnostic tests (mRDTs) has increased with time.
World malaria report documents the evidence of gene deletion of plasmodium
falciparum histidine rich protein 2 and 3 genes (pfhrp2/3), rendering malaria parasite
undetectable with HRP2 based mRDTs that are commonly available. This may cause
delay in treatment, misdiagnosis and in some cases death, hence the need to evaluate
the diagnostic performance of mRDTs and the factors affecting them. The aim of the
study was to evaluate the diagnostic performance and determine factors affecting
mRDTs (histidine-rich protein2 (HRP2) and HRP2 combine with parasite lactate
dehydrogenase (HRP2/pLDH) RDTs. Cross-sectional analytical study design was
conducted in three purposively sampled health facilities (Ratta, Miranga and
Manyuada) in Seme Sub County. The facility selection was based on workload,
prevalence and the diagnostic methods used. Cochran formula was used to calculate
the sample size. Convenience sampling was used to select the health care workers
interviewed and a total of 223mRDTs each were randomly selected. Microscopy was
used as a reference method to demonstrate the diagnostic performance of the different
mRDTs using 223 whole blood sample panels collected from the patients suspected to
have the disease. Structured questionnaire was administered to health care workers to
assess the factors affecting mRDTs. Blood collections from the participants were done
by a trained phlebotomist to minimize harm. Data analysis was done using Cohen
Kappa Coefficient, MCNemar’s test, likelihood ratio, receiver operating characteristic
(ROC) and descriptive statistics used for objective three. Presentation was done in
charts, figures and tables. The results were as follows; for HRP2 RDTs, sensitivity
(99.4%), specificity (85.7%), positive predictive value (81.0%) and negative
predictive value (96.0%) and for pLDH/HRP2RDT,sensitivity (94.4%), specificity
(85.0%), positive predictive value (80.2%), and negative predictive value
(96.0%).HRP2 RDTs and microscopy gave a significant perfect agreement of (P-
value<.001) and between microscopy and pLDH RDT of (P-value<.001).However,
there was a significant disagreement between HRP2 and microscopy of P=.004 and
HRP2/pLDH of P=.002. Further results revealed that both the mRDTs had minimum
parasite density detection limit of 80 parasite/µl of blood and the Factors affecting the
performance of mRDTs were as follows, 47% of health facilities had appropriate
storage area, 18% of the health providers were able to checked and monitor the expiry
dates, 39% reported availability of malaria commodities. Training for the health care
workers in this study were below 60%. There was no evidence of internal and external
quality control in place. In conclusion, the agreement between malaria positivity using
microscopy and mRDTs positivity increased with increase in parasite density, however
the mRDTs performance was below the expected world Health Organization
expectation of ≥ 95%. Storage, quality assurance, end user training and commodity
stock level monitoring in health facilities in Seme sub county were the factors affecting
the performance of mRDTs. The study therefore advocates for more sensitive kit that
can detect parasite at low density level for future use, especially to improve the
sensitivity of mRDTs kits in malaria management where trained microscopist for
malaria diagnosis are not available. Temperature monitoring of the storage areas for
MRDTs, training of staff, quality assurance measures and proficiency testing is
recommended for the effective performance of mRDTs.

vii
TABLE OF CONTENTS
DECLARATION ....................................................................................................... II
COPYRIGHT STATEMENT .................................................................................. II
DEDICATION .......................................................................................................... IV
ACKNOWLEDGEMENT ........................................................................................ V
ABSTRACT .............................................................................................................. VI
LIST OF TABLES .................................................................................................... X
LIST OF FIGURES ................................................................................................. XI
LIST OF ABBREVIATION AND ACRONOMY............................................... XII
OPERATIONALIZATION OF TERMS ............................................................ XIII
CHAPTER ONE:INTRODUCTION ....................................................................... 1
1.1 Background information of the study .................................................................... 1
1.2 Problem Statement of the study ............................................................................. 4
1.3 Objectives of the study ........................................................................................... 4
1.3.1 Broad objective ................................................................................................... 4
1.3.2 Specific objectives .............................................................................................. 5
1.4 Research Questions ................................................................................................ 5
1.5 Justification of the study ...................................................................................... 5
1.6 Significance of the study ........................................................................................ 6
1.7 Scope of the study .................................................................................................. 7
1.7.1 Limitations .......................................................................................................... 7
1.7.2 Delimitations ....................................................................................................... 8
1.8 Theoretical model .................................................................................................. 8
1.9 Conceptual framework ......................................................................................... 10
CHAPTER TWO:LITERATURE REVIEW ........................................................ 12
2.1 The burden of Malaria Disease ............................................................................ 12
2.2 Morphology and life cycle of the malaria parasite .............................................. 13
2.3 Causative agents, pathogenesis and Clinical Presentation of Malaria ................. 15
2.4 Diagnosis of Malaria Disease .............................................................................. 16
2.4.1 Microscopy reference test method .................................................................... 17
2.4.2 Rapid diagnostic test (RDT) ............................................................................. 19
2.5 Types of malaria Rapid Diagnostic Tests kits ..................................................... 19
2.5.1 Advantages and disadvantages of mRDTs........................................................ 22
2.6 Evaluating the performance of mRDTs ............................................................... 23
2.7 Sensitivity, Specificity, and predictive values of Rapid diagnostic tests ............. 24
2.8 Estimation of the quantitative limit of parasite density cut off points ................. 25
2.9 Factors affecting the diagnostic performance of malaria RDTs .......................... 27
2.10 Effects of inaccurate diagnosis of malaria ......................................................... 28
CHAPTER THREE:MATERIALS AND METHODS ........................................ 30
3.1 Study Area ........................................................................................................... 30
3.2 Study Design ........................................................................................................ 31
3.3 Study objects ........................................................................................................ 31
3.3.1 Inclusion criteria ............................................................................................... 31
3.3.2 Exclusion criteria .............................................................................................. 32

viii
3.4 Study Variables .................................................................................................... 32
3.4.1 Dependent variables .......................................................................................... 32
3.4.2 Independent variable ......................................................................................... 32
3.5 Sampling design ................................................................................................... 33
3.6 Sample Size Determination .................................................................................. 33
3.7 Data collection process ........................................................................................ 35
3.7.1 Field assistants’ training ................................................................................... 35
3.7.2 Collection of specimen and quality assurance .................................................. 36
3.7.3 Testing for malaria disease using RDTs ........................................................... 36
3.7.4 Testing for malaria using microscopy ............................................................... 37
3.7.5 Factors affecting the performance of mRDTs .................................................. 39
3.7.6 Reliability and validity ...................................................................................... 40
3.7.7 Quality assurance .............................................................................................. 40
3.7.8 Handling indeterminate/Invalid results ............................................................. 41
3.8 Standard operating procedure for performing reproducibility testing ................. 41
3.9 Pilot phase ............................................................................................................ 41
3.10 Data management and analysis .......................................................................... 41
3.11 Logistical and Ethical Considerations................................................................ 42
CHAPTER FOUR:RESULTS ................................................................................ 44
4.1 Sensitivity, Specificity, and Predictive Values of HRP2 based mRDTs and
HRP2/pLDH based mRDTs .................................................................................. 44
4.2 Quantitative limit of parasite density cut off points detected by the different RDTs
............................................................................................................................ 45
4.3 Factors affecting the performance of RDTs used for diagnosis of malaria ......... 48
4.3.1 Test device-related factors ................................................................................ 48
4.3.2 Factors associated with handling of the rapid diagnostic test kits .................... 49
4.3.3 Factors relating to quality control using mRDTs .............................................. 51
CHAPTER FIVE:DISCUSSION ............................................................................ 53
5.1 Sensitivity, specificity and predictive values of HRP2mRDT and HRP2/ pLDH
mRDTs .................................................................................................................. 53
5.2 Quantitative limit of parasite density cut off points ............................................. 57
5.3 Factors affecting the performance of malaria rapid diagnostic tests ................... 59
CHAPTER SIX:CONCLUSION AND RECOMMENDATION ......................... 63
6.1 Conclusion ........................................................................................................... 63
6.2 Recommendation ................................................................................................. 63
6.2.1 Recommendations for action ............................................................................ 64
6.2.2 Recommendation for further research............................................................... 64
REFERENCES ......................................................................................................... 65
APPENDICES .......................................................................................................... 75
APPENDIX I: A MAP SHOWING THE STUDY AREA ........................................ 75
APPENDIX II: OBSERVATION AND QUESTIONNAIRE CHECKLIST ON RDT
ASSESSMENT .................................................................................................... 76
APPENDIX III : CONSENT FORM ......................................................................... 77
APPENDIX IV: MINOR ASSENT DOCUMENT ................................................... 79

ix
APPENDIX V : STATEMENT OF INTENT TO MAINTAIN CONFIDENTIALITY
.............................................................................................................................. 80
APPENDIX VI: RESULTS TRACKING LOG ........................................................ 81
APPENDIX VII: DIRECTORATE POSTGRADUATE RESEARCH APPROVAL
.............................................................................................................................. 82
APPENDIX VIII: INSTITUTIONAL ETHICS REVIEW COMMITTEE
APPROVAL ........................................................................................................ 83
APPENDIX IX: NACOSTI RESEARCH LICENCE ............................................... 84
APPENDIX X: DIAGNOSTIC STAGES OF MALARIA PARASITE ................... 85
APPENDIX XI : PUBLICATION OF OBJECTIVE TWO ...................................... 86

x
LIST OF TABLES
Table 2. 1 Calculation of quality indicators. .............................................................. 25
Table 3.1 Distributions of the study objects (mRDTs test kits) in the health facilities
................................................................................................................... 34
Table 3.2 Distribution of the study objects as per the diagnostic method ................. 35
Table 4.1 Sensitivity, Specificity, and Predictive Values of mRDTs using microscopy
as a gold standard and their level of agreement ........................................ 45
Table 4.2 Diagnostic performance of the HRP2 RDTs kit compared to microscopy
exploring parasite density cut-off points ................................................... 46
Table 4.3 Diagnostic performance of the HRP2/pLDH RDTs kit compared to
microscopy exploring parasite density cut-off points ............................... 47

xi
LIST OF FIGURES
Figure 1.1 Conceptual frame work ............................................................................ 11
Figure 2.1 Principle of immunochromatographic RDT for malaria .......................... 21
Figure 3.1 Interpretation of malaria rapid diagnostic test results .............................. 37
Figure 3.2 Routine examination of blood films for malaria parasites ....................... 39
Figure 4.1 sensitivity, specificity and predictive values of HRP2 and pLDH mRD . 45
Figure 4.2 Receiver operating characteristic curve of the two malaria RDT
performance with plotted points of parasite densities at selected cut-off points
..................................................................................................................... 48
Figure 4.3 The achievement of test device-related factors………………………….49
Figure 4.4 Factors assessing the quality performance of mRDT ............................... 52

xii
LIST OF ABBREVIATION AND ACRONOMY
EBLM Evidence Based Laboratory Medicine
EBM Evidence –Based Medicine
EDTA Ethylene diamine tetra acetic Acid
IERC Institutional Ethical Research Committee
LDH Lactate Dehydrogenase
MOH Ministry of Health
MRDTs Malaria Rapid Diagnostic Tests
NACOSTI National Commission for Science, Technology & Innovation
pLDH Parasite Lactate Dehydrogenase
RBCs Red blood cells
RDTs Rapid diagnostic tests
SOPS Standard operative procedures
W.H.O World Health Organization

xiii
OPERATIONALIZATION OF TERMS
Diagnostic performance is the ability of a qualitative test to detect a condition when
it is present and detect the absence of a condition when it is absent. It measured by the
sensitivity, specificity and predictive values of a diagnostic test kit.
Evaluation is the process by which a test kit is compared against reference test method
and specifications through testing. The results are evaluated to assess performance.
Immune chromatography assay is the immunological binding assay, employs paper
chromatography to separate immune complexes from free antigen and antibodies.
Monoclonal antibodies this is an antibody produced by a single clone of cells or cell
line and consisting of identical antibody molecules.
Test validity can be described as the extent to which a test accurately measures what
it is supposed to measure.
Specificity (the true negative) rate measure the proportion of actual negatives that are
correctly identified as such.
Sensitivity (the exact positive rate), this is the recall or probability of detection
measures that proportion of exact positives that are correctly identified as such.
Predictive value the positive and negative predictive values (PPV and NPV) are-the
proportion of positive and negative results in diagnostic tests that are true positive and
negative results, respectively. PPV and NPV describe the performance of diagnostic
tests or other statistical measures.
Gold standard is the diagnostic test or benchmark that is the best available under
reasonable condition

xiv
Parasite density is the quantity of asexual stage of malaria parasites counted per
microliter of blood (Parasite/µl of blood).

1
CHAPTER ONE
1.0 INTRODUCTION
1.1 Background information of the study
Malaria is a parasitic disease caused by a protozoan of the genus Plasmodium and is
spread by female Anopheles mosquitoes (Amoah et al., 2019). It is the highest
contributor to morbidity and mortality in the world's developing countries (Kapesa et
al., 2018).Plasmodium falciparum causes a more significant proportion of malaria
disease in Africa (Dalrymple et al., 2017), which also contributes to the highest death
rates in children under five years of age (Weiss et al., 2019).
The recent world malaria report released in December 2019showedthat, about 200
million malaria cases in 2018 below against to 2.3 million patients in 2018. The
approximated malaria deaths was estimated at about 400,000 in 2018, compared with
416 000 deaths in 2017 (Lee et al., 2018).There is a high share of the global malaria
burden in the African region and it accounted for 93% and 94% of the worldwide
malaria morbidity and mortality, respectively in 2018. Kenya reports four million
malaria cases annually. 80-90% of malaria cases in Kenya are attributed to
P.falciparum, even though P.malariae, P.ovale also exist in the county (Kane, 2019).
In Kenya malaria causes a significant public health risk and it remains the leading
cause of morbidity and mortality in the county (Githinji et al., 2017). Approximately
6.7 million new clinical infections are recorded yearly, with about 4000 deaths
occurring, majorly, among children hence making malaria a significant health burden
for Kenya (Kirinyet, 2019).

2
Microscopy is the ‘gold standard’ accepted for malaria diagnosis and is regarded as
the reference test method (Berzosa et al., 2018). However, to minimize challenges
associated with microscopy, various types of RDTs kits have been manufactured to
diagnose malaria in non-endemic and endemic zones as part of malaria diagnosis
(Mukkala et al., 2018). The quality of these malaria rapid diagnostic kits has improved
with time(Adu-Gyasi et al., 2018), however, there is still need to evaluate the
diagnostic performance and determine the factors affecting these test kits in
comparison to the existing reference test method.
In Sub Saharan Africa, the mRDTs have the highest distribution rate of 66% and
accounted for 76 % of all the diagnostic test done in 2017 (Briand et al., 2020; Echodu
et al., 2020). This indicates that they have displaced conventional microscopy in many
endemic areas as a standard practice. The mRDTs commonly available and used
worldwide are based on the detection of parasite Histidine-rich protein 2 (PfHRP2) gene
(Krause et al., 2018). Histidine-rich protein 2 (HRP2) antigen incorporated in most
mRDTs are encoded by hrp2gene. Spontaneous hrp2deletions are documented to
happen, as was seen by (Berhane et al., 2018) and also reported by World malaria report
2020. P.falciparum parasites demonstrating gene deletions cannot be detected using
mRDTs targeting HRP2 proteins (Beshir et al., 2017). Therefore, mRDTs based solely
on HRP2 would give false-negative results when applied to diagnose patients infected
with malaria parasite strains with hrp2 gene deletions. To improve malaria diagnosis and
overcome the false negative in patients infected with parasites harbouring hrp2-deleted
gene, mRDTs that combine multiple parasite protein targets have been developed.
Parasite lactate dehydrogenase (pLDH) is one of these target proteins that can be used
to detect plasmodium parasite with hrp2 gene deletion. Studies indicate that adding
pLDH to HRP2 in mRDTs can enhance their ability in detecting malaria parasites,
3
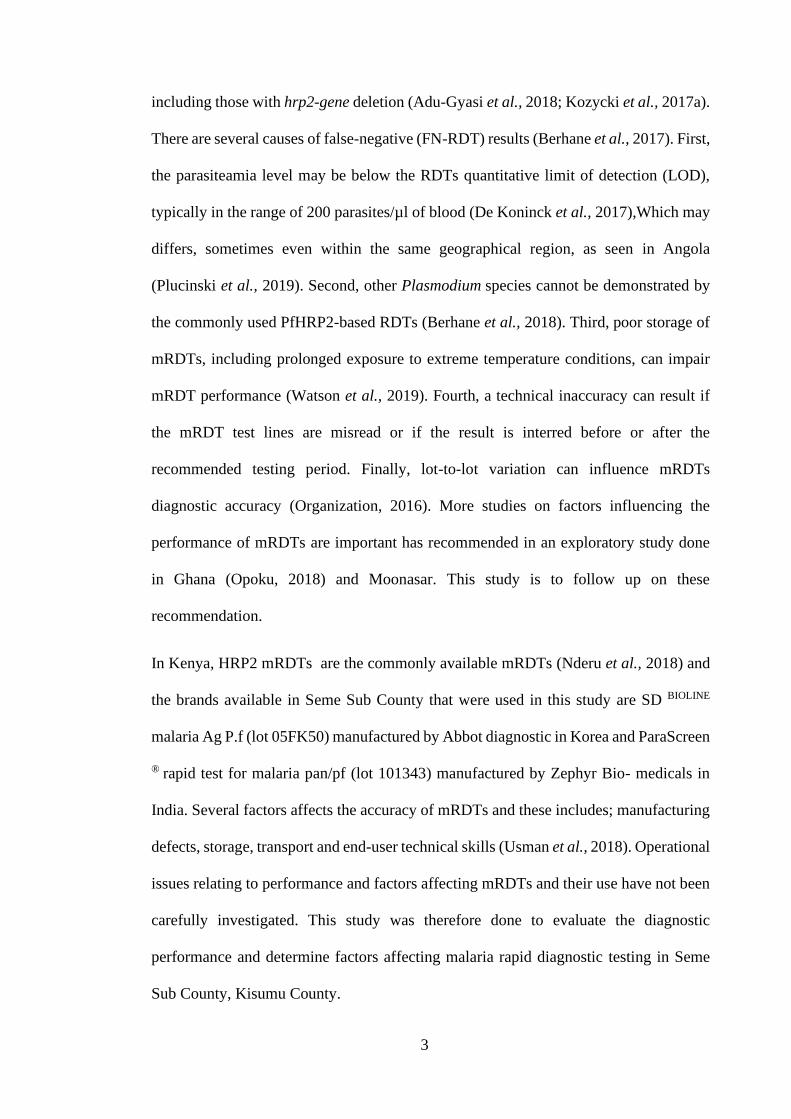
including those with hrp2-gene deletion (Adu-Gyasi et al., 2018; Kozycki et al., 2017a).
There are several causes of false-negative (FN-RDT) results (Berhane et al., 2017). First,
the parasiteamia level may be below the RDTs quantitative limit of detection (LOD),
typically in the range of 200 parasites/µl of blood (De Koninck et al., 2017),Which may
differs, sometimes even within the same geographical region, as seen in Angola
(Plucinski et al., 2019). Second, other Plasmodium species cannot be demonstrated by
the commonly used PfHRP2-based RDTs (Berhane et al., 2018). Third, poor storage of
mRDTs, including prolonged exposure to extreme temperature conditions, can impair
mRDT performance (Watson et al., 2019). Fourth, a technical inaccuracy can result if
the mRDT test lines are misread or if the result is interred before or after the
recommended testing period. Finally, lot-to-lot variation can influence mRDTs
diagnostic accuracy (Organization, 2016). More studies on factors influencing the
performance of mRDTs are important has recommended in an exploratory study done
in Ghana (Opoku, 2018) and Moonasar. This study is to follow up on these
recommendation.
In Kenya, HRP2 mRDTs are the commonly available mRDTs (Nderu et al., 2018) and
the brands available in Seme Sub County that were used in this study are SD BIOLINE
malaria Ag P.f (lot 05FK50) manufactured by Abbot diagnostic in Korea and ParaScreen
® rapid test for malaria pan/pf (lot 101343) manufactured by Zephyr Bio- medicals in
India. Several factors affects the accuracy of mRDTs and these includes; manufacturing
defects, storage, transport and end-user technical skills (Usman et al., 2018). Operational
issues relating to performance and factors affecting mRDTs and their use have not been
carefully investigated. This study was therefore done to evaluate the diagnostic
performance and determine factors affecting malaria rapid diagnostic testing in Seme
Sub County, Kisumu County.

4
1.2 Problem Statement of the study
Malaria disease is one of the global life-threatening diseases and Kisumu county
prevalence rate was at 19% in 2021. Among the available diagnostic methods, rapid
testing is inexpensive and can be done in remote. Kisumu County has adopted the
strategy of mRDTs in all the seven sub-counties with Seme recording the highest
utilization rate of 76%. The types used are HRP2 and HRP2/pLDH antigen based
mRDTs. The manufactures of these mRDTs documents that the sensitivity to be is
100% with >50 parasite/µl of blood. This will lead to missed opportunity which may
impair treatment and prevention strategies. Hence the need to determine the sensitivity,
specificity and predictive values and the exact quantitative limit of parasite density cut
off point of these mRDTs? The mRDTs can be affected by prozone effect and may
cause false negative result and also produce a false positive result for patients with
acute schistomiasis. And being a biological agent, they can also be affected with other
factors not clearly known. The WHO malaria report of 2020 documents evidence of
deletion in the pfhrp2 and pfhrp3 (pfhrp2/3) genes also hindering parasites detection
by mRDTs HRP2, making these mRDTs unreliable (Grignard et al., 2020).This might
lead to misdiagnosis of malaria through generating false-negative results which might
end up delaying malaria treatment and in worst cases cause mortalities. This therefore
calls for the need to evaluate the diagnostic performance and factors affecting the
malaria rapid diagnostic test kits.
1.3 Objectives of the study
1.3.1 Broad objective
To determine the diagnostic performance and the factors affecting malaria rapid
diagnostic tests.

5
1.3.2 Specific objectives
i. To determine sensitivity, specificity, and predictive values of HRP2 and
HRP2/pLDH based mRDTs in Seme, Kisumu county
ii. To estimate the quantitative limit of parasite density cut off points detected by
the different mRDTs
iii. To assess factors affecting the performance of malaria RDTs in Seme Sub
County
1.4 Research Questions
i. What is sensitivity, specificity, predictive values of HRP2 and HRP2 / pLDH based
RDTs in Seme, Kisumu County?
ii. What is the quantitative limit of parasite density cut off points detected by the
different RDTs in Seme, Kisumu County?
iii. What are the factors affecting the performance of malaria RDTs in Seme, Kisumu
County?
1.5 Justification of the study
Malaria remains to be a major burden and the number one out of the ten diseases given
high priority in Seme Sub County. Quality malaria diagnosis, treatment and prevention
are dependent on the application of the right diagnostic technique. World health
organization recommendation on parasite-based diagnosis in regions where expert
microscopy is not available can easy be achieved by use of rapid diagnostic test. It is
important to determine whether these tests are useful in a specific endemic region, as
well as the most appropriate mRDTs to use and the factors affecting their performance.

6
Microscopy is an established, relatively simple technique that is familiar to most
laboratory officers. It can determine that malaria parasites are present in the patient’s
blood, determine the malaria species and the parasitemia level. High-quality malaria
microscopy is not always immediately available in every clinical setting where patients
might seek medical attention. These practices have resulted in long delays in diagnosis.
The facilities not able to use microscopy may now use mRDTs to more rapidly
determine if their patients are infected with malaria. These mRDTs like other
biological test are more prone to deterioration through exposure to unfavorable
conditions. Data on the diagnostic performance and factors affecting the performance
of rapid diagnostic test device is important information to lead in diagnostic test
selection by the relevant authorities.
1.6 Significance of the study
World health organization indicates that the role of laboratory diagnosis is to assist
malaria case management focusing on the use of rapid diagnostic tests in areas
endemic for malaria disease. For this recommendation to be adhered to, the malaria
control unit should establish fast and accurate laboratory findings or malaria parasite
demonstrations. The findings from the study will help the Ministry of Health and the
Malaria control unit to ensure accurate, reliable and timely diagnostic method for
malaria is used. Promote the availability of adequate competent medical laboratory
officers in all health facilities and refresher training on malaria case management done
to them. The findings will facilitate effective monitoring of mRDTs during
transportation, storage and test performance and finally to enhance the availability and
utilization rate of standard operating procedures and WHO guidelines on malaria
diagnosis. Accurate, reliable and timely diagnosis will be cost-effective to the patients

7
by reducing their frequent visits to the hospitals and finally reduce morbidity and
mortality resulting from malaria disease.
1.7 Scope of the study
The purpose of the study was to evaluate the performance of rapid diagnostic tests
using the reference test method. The study also determined the factors affecting the
diagnostic accuracy of these rapid diagnostic tests. The suspected patients referred to
the laboratory for malaria test were bleed and there blood samples formed the sample
panels for mRDT kits evaluation. A total of 223 sample panels each were subjected to
the three tests, microscopy, HRP2 mRDTs and HRP2/pLDH mRDTs. A category of
health care workers were interviewed for factors affecting the diagnostic performance
of mRDTs. The study was carried out for three months where diagnostic performances
of the kits were assessed. The study area was Seme Sub County and three facilities
(Ratta, Miranga and Manyuada) were targeted.
1.7.1 Limitations
The limitation of this study was that the known blood bank samples could not be
obtained to be used to evaluate the kits. We recommend future studies be done on how
to obtain blood bank samples that can be archived to support such studies. However,
this is still challenging because whole blood samples recommended for malaria
diagnosis have a short shelf life. Another limitation was that the malaria diagnostic test
kits evaluated were from the same manufactures and similar lot (batch) number and
expiry date. In future, there is a need for manufactures to think of producing different
batches to allow the batch to batch evaluation to be possible.

8
1.7.2 Delimitations
This study does not cover the entire Seme Sub County health facilities; it covers only
three high volume sites. Data collection took three months to enable us to achieve the
study objectives. The population size which forms the source of the blood samples
used to evaluate the diagnostic test was obtained from the patients suspected to have
malaria and are sent to the laboratory for a malaria diagnostic test.
1.8 Theoretical model
The study adopted Evidence-Based Medicine (EBM) which is the idea that
occupational practice ought to be based on scientific evidence (Thomas et al., 2011).It
aims to provide the most effective care that is available, with the aim of improving
patients’ outcomes. Patients expect to receive the most effective care based on the best
available evidence. The Evidence-based laboratory medicine(EBLM) is a separate
branch of EBM which focuses on the evaluation and use of laboratory tests with an
overall aim of improving patient’s outcomes (Chin et al., 2020). In this theory, a
clinician requesting an investigation had a question and needs to make a decision. The
clinician hopes that the test results will help to answer the question and assist in making
the decision (Diagnostic accuracy).
Price defines EBLM, developed from the definition of EBM (Price, 2012) as ‘the
conscientious, judicious and explicit use of best evidence in the use of laboratory
medicine investigations for assisting in making decisions about the care of individual
patients. It might also be expressed more directly in terms of health outcomes as
"ensuring that the best evidence on testing is made available, and the clinician is
assisted in using the best evidence to ensure that the best decisions are made about the
care of the individual patient and that the probability of improved health outcomes
increases (Price, 2012).The real effect of diagnostic testing on patients outcomes and

9
how the effect can be assessed is the concern of EBLM theory (Price, 2012). The
practice of evidence-based laboratory medicine seeks to answer three key questions,
1. Is it a quality test? 2. If the test is applied properly will it improve patient outcomes?
And 3. Is it worth investigating the test? The theory further explains that a good test is
one that is accurate and precise which is generally known as diagnostic accuracy. This
concurs with Fryback concept that has been adopted as a conceptual framework in this
research. This will enable us to meet the study independent variables. It recommends
that decisions are based on the best available, current, valid and relevant evidence from
research, informed by clinical expertise and patient values. The components of
evidence-based practice includes; Formulating question, Searching for evidence,
Appraising the evidence, Applying the evidence and Assessing the experience
(Badrick, 2013), all are translated into daily clinical and laboratory practice.
If EBLM principle is combined with routine practice, it will help to resolve some
issues such as test cost versus laboratory-generated income and results in an impact on
outcome versus test results which is a key indicator to clinical decision making. The
issues will be solved by detecting (a) where medical laboratory science fits into the
care pathway (b) where diagnostic test is necessary (c) the nature and quality of
evidence required to demonstrate the clinical implementation (e) where changes in the
treatment flow will occur (f) where benefits of the patients can be achieved.
The practice of EBM can be summarized that “An evidence-based practitioner must
understand the patients' circumstances or predicament, identify knowledge gaps and
frame questions to fill gaps. conduct an efficient literature search, critically appraise
the research evidence and apply that evidence to patient care as explained by Guyatta
and colleagues (Law et al., 2008). Hence, the use of this theory in this study.

10
1.9 Conceptual framework
The research adopted a conceptual framework developed from radiology for
evaluating imaging technologies to evaluate laboratory test. The framework addresses
diagnostic efficacy, diagnostic effectiveness, therapeutic efficacy and therapeutic
effectiveness. These answers the questions being raised by EBLM theory. This
conceptual framework was proposed by Dennis Fryback and Jack Thornbury
(Silverstein et al., 1994).
The Fryback and Thornbury frame work for diagnostic efficacy addresses six
hierarchical levels; Technical efficacy (does the laboratory measure the substance it
purports to measure), diagnostic accuracy efficacy (describes the yield- sensitivity,
specificity and positive and negative predictive values of a laboratory test in clinical
settings), Diagnostic thinking (addresses the issue of whether the diagnostic test
changes the thinking of the clinician), therapeutic efficacy (addresses whether a test
result changes the clinical management of the patient), patient outcome (describes the
outcomes that patients actually experience) and societal efficacy (addresses issues such
as the health of the population and the cost of test. Figure 1.1, illustrate the conceptual
framework build up from the EBLM theory.

11
Independent variables Intervening variables
Figure 1.1 Conceptual frame work
Source: Okuta, 2020
Accuracy of the mRDTs
Measured
Sensitivity
Specificity
Predictive values (ppv &NPV)
PARASITE DETECTION
LIMIT
Parasiteamia level in the sample
Level of magnification
FACTORS AFFECTING
PERFORMANCE OF mRDTs
End user ability to correctly
interpret the results
Quality controlled performed at the
health facilities
Availability of mRDTs stock
Storage
End users refresher training
Room temperature
monitoring
Standard operating
procedure and guideline
The quality performance
of rapid diagnostic test
Outcome

12
CHAPTER TWO
2.0 LITERATURE REVIEW
2.1 The burden of Malaria Disease
More than three hundred million severe diseases are caused by malaria and it is killing
at least one million people yearly (Di Gennaro et al., 2020).There were approximately
2.2 million cases of malaria in 87 countries in 2017. Approximately 435 000 malaria
deaths were documented in 2017. Disproportionately high share of the global malaria
burden is found in African region (Agbenyega, 2019). In 2017, the African region was
home to 92% of all malaria cases and 93% of all malaria deaths. In 2017, the total
funding for malaria control and elimination was approximated at US dollar of 3.1
billion. Of this, US dollar 900 million were contributions from governments of
endemic regions, accounting for 28% of total funding (Haakenstad et al., 2019).
Malaria is the major cause of morbidity and deaths in Kenya, with more than 70
percent of the population at risk (Kapesa et al., 2018). The malaria burden in Kenya
depends on the region with the areas around Lake Victoria and the coastal regions
having the highest risk, and children under age five and pregnant women are the mostly
affected (Okiro et al., 2020).
The clinician's physical examination cannot easily distinguish malaria from other
tropical diseases, which are several and can cause potentially harmful effects, but
treatable if appropriate management is given early enough. Even in endemic areas with
high malaria transmission, other treatable acute infections can cause significant
morbidity and mortality (Verjee, 2019). Therefore, it is vital to have an early and
accurate diagnosis of malaria to distinguish it from other febrile illnesses early to allow
prompt and appropriate treatment of all causes of fever. Proper diagnosis reduces

13
morbidity and mortality rates resulting from malaria infection and minimizes the
wastage of antimalarial drugs. Obtaining an accurate diagnosis gives specific figures
on malaria incidence. It enables the following up of malaria disease and targeting
antimalarial resources to areas of greatest need and precise evaluation of the impact of
interventions. Malaria transmission in endemic zones, is so severe to the extent that a
good percentage of the population is infected but do not show clinical symptoms
(Jiram et al., 2019). The carriers have developed enough immune response to protect
them from malarial illness, but not an infection. In such situations, the presence of
malaria parasites in an ill person blood sample does not necessarily mean that it is
caused by a recent parasites infection. Lack of resources is a significant barrier to
quality diagnosis in many malaria endemic countries. Quality malaria diagnosis if
embraced facilitates alleviation of suffering but also minimizes community
transmission (Sori et al., 2018).A study done on the prevalence of malaria parasites in
adults and its determinants in malaria endemic area of Kisumu County, in Maseno
division this was covering Seme Sub County which was the current study side. This
study indicated that adult prevalence of malaria parasites in Maseno was 28% (Jenkins
et al., 2015) indicating high prevalence of malaria disease in the study area and
accurate diagnosis will be very key component of effective treatment and preventive
measures.
2.2 Morphology and life cycle of the malaria parasite
Plasmodia has two host life cycle and passes through many stages. The sexual phase
occurs in the female anopheles’ mosquitoes, whereas the asexual stage occurs in the
vertebrate host. The parasite's sporozoites stage is released by sexual reproduction in
the midgut of vector female Anopheles mosquitoes and migrates to the salivary gland.

14
Sporozoites are injected into small blood vessels when an infected female Anopheles
mosquito takes a blood meal from humans (Howick et al., 2019). Sporozoites enter
liver parenchymal cells within 30 minutes of injection. In the liver cell, the parasite
develops into a spherical, multinucleate liver-stage called schizont, which contains
lancet-shaped sporozoite with an approximate size of 1 × 7 μm 2,000 to 40,000
uninucleate merozoites. The process of enormous amplification of the plasmodium
parasite is called exoerythrocytic schizogony. This exoerythrocytic or liver phase of
the disease usually takes between 5 and 21 days, depending on the Plasmodium'
species. However, in P vivax and P. ovale infections, liver-stage schizonts' maturation
may be prolonged for 1 to 2 years. These quiescent liver-phase parasites are called
hypnozoites. Regardless of the time required for development to occur, the mature
schizonts eventually rupture, releasing thousands of uninucleate merozoites into the
bloodstream. Each merozoite can attack a red blood cell. The merozoite develops to
form either an erythrocytic-stage (blood-stage) schizont (by the process of erythrocytic
schizogony) or a spherical or banana-shaped, uninucleate gametocyte within the red
cell. The mature erythrocytic-stage schizont contains 8 to 36 merozoites, measuring
about 5 to 10 μm long, and are released into the bloodstream when the schizont matures
and ruptures. The merozoites released proceeds to infect another generation of
erythrocytes in the blood. The time required for erythrocytic-schizogony determines
the interval between the releases of successive generations of merozoites-varies with
the types of Plasmodium and is responsible for the classic periodicity of fever in
malaria (Abbas et al., 2019).
Gametocyte, which is the sexual stage, infects mosquitoes that ingest it while feeding
on a blood meal. Within the mosquito, gametocytes develop into female and male
gametes (macrogametes and microgametes respectively), which undergo fertilization

15
and then grow over 2 to 3 weeks into sporozoites infect humans. The delay between
infection of a mosquito and sporozoites' maturation means that female mosquitoes
must live a minimum of 2 to 3 weeks to transmit malaria. This fact is essential in
malaria control efforts (Cowman et al., 2016).
2.3 Causative agents, pathogenesis and Clinical Presentation of Malaria
Malaria results from a single-celled protozoan parasite of the genus Plasmodium. Four
different plasmodium parasite species is capable of causing infection to humans by
entering the blood system when a female Anopheles mosquito takes a blood meal. The
four species includes; Plasmodium falciparum, Plasmodium vivax; Plasmodium ovale;
and Plasmodium malariae (Zambare et al., 2019).
The development of severe malaria may result from mixed reactions of parasite-
specific factors. Such factors include adherence and sequestration in the vasculature
and the release of active biomolecules, together with host inflammatory immune
reactions. Which include cytokine and chemokine production and cellular infiltrates
(Rénia et al., 2016). Cerebral malaria is clinically presented by diffuses symmetrically
to encephalopathy with high temperature and absent or few central neurological signs.
Fever rapidly can develop within a mean of two days in children (Luzolo et al., 2019).
In adults, the subconscious state is gradually developed with a mean duration of five
days with increasing drowsiness; confusion, dullness, and high fevers, and
manifestation of seizures in estimated 15% of adults and 80% of children with severe
malaria and frequently developed into the coma (Plewes et al., 2018) and extramacular
whitening.
Patients may recover full consciousness after a seizure; thus, transient postictal coma
must be excluded. Multiple attacks are frequent, and up to 50% of unconscious
children have subclinical convulsions or status epilepticus. Other clinical

16
manifestation includes; Ocular funduscopic findings which includes vessel color
change, macular and white-centered retinal bleeding. The median time to coma
recovery is roughly 24 hours in children and 48 hours in adults (Seydel et al., 2015).
There is the ability of retinal abnormalities to resolve with no residual visual deficit.
Less than 1% of adults, and about but up to 12% of children in the quinine-therapy era
could develop neurologic sequelae, including spastic paralysis, cortical blindness,
aphasia, and cerebellar ataxia. Post malaria neurological syndrome is self-limiting;
however, long exposure to neurological symptoms , including cognitive deficits and
epilepsy, are reported among children (Plewes et al., 2018). The quite a number of
malaria patients are exposed to risk factors for developing acute kidney injury (AKI),
which includes; volume depletion, hypoalbuminemia, concomitant bacterial sepsis,
black water fever (BWF) co- morbidity, such as diabetes. Although oliguria clinically
indicates decreased function with a pre-renal component, up to 80% of patients with
malaria have nonoliguric AKI. Thus, the clinical symptoms if used will diagnosis
anuric AKI but will under diagnose moderate AKI and delay diagnosis of the disease
(Rocamora et al., 2018). AKI complicating severe malaria are can be categorized into
four; few severity criteria with pre-renal AKI that resolves with fluids, several severity
criteria including AKI that resolves without renal replacement therapy(RRT),
progressive AKI that resolves with antimalarial treatment and RRT, multiorgan
dysfunction, often with anuric AKI and cerebral malaria, and those who die before or
during RRT with hemodynamic shock and respiratory failure (Rudd et al., 2018).
2.4 Diagnosis of Malaria Disease
Quality demonstration of malaria parasite is critical to proper malaria case
management. The worldwide effect of malaria disease has propelled interest in
17
manufacturing successful testing strategies for resource-limited areas where malaria is
a major public health concern in the community and developed countries, where
malaria diagnostic expertise and equipment is often inadequate (Sharma et al., 2017).
Malaria disease is a potential medical emergency and should to be treated urgently.
Delays in diagnosis and treatment are the leading causes of death in many countries
(Parpia et al., 2016). Such delays can be due to many factors such as diagnosis can be
confusing where malaria is no longer endemic for healthcare providers unfamiliar with
the disease and clinicians may forget to consider malaria disease among some patients.
Lack experience and technical skills from the laboratory personnel which can lead to
failure to detect parasites when examining blood smears under a microscope.
Malaria can be diagnosed in the laboratory using various techniques, including
microscopic diagnosis by use of stained thin and thick peripheral blood films (Jan et
al., 2018), concentration techniques, rapid diagnostic tests (mRDTs) and molecular
diagnostic methods (Nijhuis et al., 2018). This study evaluated the diagnostic
performance of malaria rapid diagnostic tests using microscopy as the reference test
method and determines the factors affecting the mRDTs.
2.4.1 Microscopy reference test method
Microscopic examination of stained blood films using Giemsa stains (Lavelle, 2018)
is the gold standard for diagnosis of malaria. Microscopy is important for identification
and detection of Plasmodium species when using thick films, whereas, thin blood films
is useful for species' confirmation (Mukry et al., 2017). In this method, the patient
figure is sterilized with a 70% alcohol swab, leave for a few seconds to air dry, and
then the side of the ring fingertip is pricked with a sterile lancet and a drop of blood is
dropped on a glass slide. A blood spot on the slide is then spread in a circular motion

18
with the corner of another slide or spreader, taking care not to make too thick smear.
A slide preparation template can be used to obtain a standard smear. The smear is
allowed to air-dry. The blood spot is stained with working Giemsa solution (3%) for
30 minutes after it has air dried and rinsed by flooding the slide in buffered water for
3 minutes. The blood slide is then allowed to air-dry in a vertical position and
examined under a microscope. The red cells lyse when a water-based stain is applied
because the slides are not fixed.
A thin blood film is prepared by immediately placing the smooth edge of a spreader
slide in a drop of blood, adjusting the angle between slide and spreader to 45°, and
spreading the blood with a swift and steady sweep along the surface. The film is then
allowed to air-dry and fixed with absolute methanol, stained with working solution
Giemsa (3%) for 30 minutes. The slide is rinsed by briefly dipping the slide in and
out of a staining jar of buffered water. Allow the slide to air dry in a vertical position
and examined under a microscope for the parasite's presence (Paul et al., 2016).
Although the expert microscopist can detect up to 5parasites/µl, the average
microscopist detects only 50-100 parasites/µl (Alnasser et al., 2016). The low
parasitemia level probably underestimated malaria percentage rate of infection,
especially in low parasitemia individuals and asymptomatic malaria cases. The
challenge associated with implementing and sustaining a level of skilled microscopy
appropriate for clinical diagnosis, particularly in the field setting, has prompted the
development of various malaria RDTs devices (Krampa et al., 2017).
2.4.1.1 Advantages and disadvantages of microscopy
Microscopy is the most widely diagnostic tool used to demonstrate malaria at level 2
health facilities. In capable hands it is very sensitive for parasiteamia ≤50parasites/µL
(0.001%) (Ezekiel, 2019) it gives species identification, parasitic stages and

19
parasiteamia level. However, quality of microscopy is difficult to implement and
maintain. It is labor intensive and requires highly skilled personnel and constant
regular quality assurance measures.
2.4.2 Rapid diagnostic test (RDT)
Malaria rapid diagnostic tests are immune-chromatographic tests, which are used to
demonstrate the presence of malaria parasites in suspected malaria cases by detecting
the presence of one or a combination of the following Plasmodium antigens.
Plasmodium Histidine-rich protein (HRP)2 for P. falciparum or a ‘pan-specific’
aldolase to detect other species such as P. vivax or Plasmodium lactate dehydrogenase
(pLDH) (Nyataya et al., 2020).These are antibody base on the ability to capture
circulating antigens from Plasmodium species, making them fast and reliable (Ifeorah
et al., 2017). There is numerous malaria RDTs commercially available, all of which
detect malaria antigens or antibodies in the blood. Most mRDTs that detect P.
falciparum are histidine rich protein-2(HRP2) based. Other tests detect the presence
of parasite enzyme Lactate Dehydrogenase (pLDH), using either monoclonal
antibodies that react with LDH of all species including P. falciparum (Pan or pLDH)
or antibodies specific for P. falciparum LDH (Dayanand et al., 2019).A blood sample
from a patient need to be obtained using a lancet and standard sample collection devise
is used to collect the blood sample and put in a sample well. Drop the reagent buffer
solution on a test cassette, and interprets the results within 20 minutes (Abdalla et al.,
2019).
2.5 Types of malaria Rapid Diagnostic Tests kits
Malaria RDTs detect specific antigens (proteins) produced by malaria parasites that
are present in the blood of infected individuals. Some RDTs detect a single species

20
(either P. falciparum or P. vivax), some detect multiple species (P. falciparum, P.
vivax, P. malariae and P. ovale) and some further distinguish between P.
falciparum and non-P. falciparum infection, or between specific species. Blood for
the test is commonly obtained from a finger-prick and results are available within 15–
30 minutes.
Histidine rich protein (Rock et al., 1987) described how P. falciparum-infected RBC
(IRBC) synthesize three histidine-rich proteins, HRP-1 (the knob-associated HRP),
HRP-2 and HRP-3. HRP-1 (Mr 80,000 to 115,000) was identified in all knob-
positive P. falciparum parasites but small amounts only were present in Gambian
isolates and in several culture-adapted strains. HRP-2 (Mr 60,000 to 105,000) was
identified in all P. falciparum parasites regardless of the knob phenotype and was
recovered from culture supernatants as a secreted water-soluble protein. HRP-2 was
shown to be a surface-exposed protein complex of several close bands. HRP-3
(Mr 40,000 to 55,000) was present at the lowest abundance compared to HRP-1 and
HRP-2. Neither HRP-1 nor HRP-2 was found in a range of other knob-positive and
negative strains of non-P. falciparum malaria.HRP-2 is a water-soluble protein
produced by asexual stages and young gametocytes of P. falciparum (Obeagu et al.,
2018) .It is expressed on the RBC membrane surface, and because of its abundance
in P. falciparum, it was the first antigen to be used to develop an RDT for its detection.
Plasmodium lactate dehydrogenase pLDH an enzyme found in the glycolytic pathway
of the malaria parasite is produced by sexual and asexual stages of the parasite (Kumar
et al., 2020). Different isomers of pLDH for each of the four Plasmodium spp.
infecting humans exist, and their detection constitutes a second approach to mRDTs
development. Several other enzymes of the malaria parasite glycolytic pathway,

21
notably aldolase (Maran et al., 2021) have been suggested as target antigens for RDT
for species other than P. falciparum.
Though there are variations among the more than 200 malaria RDT products on the
market, the principles of the tests are similar. Immunochromatography relies on the
migration of liquid across the surface of a nitrocellulose membrane.
Immunochromatographic tests are based on the capture of parasite antigen from
peripheral blood using monoclonal antibodies prepared against a malaria antigen target
and conjugated to either a liposome containing selenium dye or gold particles in a
mobile phase. A second or third capture monoclonal antibody applied to a strip of
nitrocellulose acts as the immobile phase. The migration of the antigen-antibody
complex in the mobile phase along the strip enables the labeled antigen to be captured
by the monoclonal antibody of the immobile phase, thus producing a visible colored
line. Incorporation of a labeled goat anti-mouse antibody capture ensures that the
system is controlled for migration (Willie, 2018) (Fig 2.1).
Figure 2.1 Principle of immunochromatographic RDT for malaria

22
2.5.1 Advantages and disadvantages of mRDTs
Systematic reviews have shown that mRDTs give high-quality results , reliable and
are cost-effective (Recht et al., 2018). The mRDTs procedure is simple and do not
require high levels of technical expertise enhance the ability to be used by a wide range
of personnel, including community health volunteers, which may constantly reduce
the miss use of antimalarial drugs. Studies have shown rapid test recording the highest
sensitivity (100%) and accuracy (100%) and sensitivity 89.0% and accuracy 91.5%
respectively (Grigg et al., 2014; Jang et al., 2013; Vásquez et al., 2018; Wanja et al.,
2016b). However, performance characteristics decreases as parasitemia level decrease
to less than 500 parasites/µl (Venkatesh et al., 2016). HRP2 RDTs have disadvantages
as their performance has been shown to be affected by product quality and parasite-
related factors such as pfhrp2/3 gene deletion, non-P. falciparum species and prozone
effects that leads to false negative mRDTs (Gendrot et al., 2019). The presence
of pfhrp2 and pfhrp3 gene deletions in P. falciparum parasite populations has been
reported in Uganda (Bosco et al., 2020) and other malaria endemic countries in sub-
Saharan Africa (Agaba et al., 2019). HRP2 RDTs may not detect other species of
Plasmodium parasite this can cause false-negative RDT results, leading to a reduction
in the effectiveness of rapid diagnostic tests (Gatton et al., 2020). Evidence of the
possible contributions of parasite gene deletions, non-P. falciparum species and low-
density infections to false-negative HRP2 RDT results in Seme are limited. As Kisumu
advances towards malaria elimination, it is important to ensure that all malaria
infections are detected by effective diagnostic tools and treated promptly to enhance
case management and surveillance-based interventions.

23
2.6 Evaluating the performance of mRDTs
The development of RDTs has been a significant step forward in attempts of
parasitological diagnosis of malaria. These tests extend malaria diagnosis to
populations with no access to excellent microscopy services. Malaria RDTs make this
possible because of their: ease of use, lower training requirements, lack of provisions
for electricity, or expensive equipment (Beisel et al., 2016). Therefore, the available
RDTs must give accurate results.
The performance of mRDT can be determined using microscopy, which is the gold
standard. It is essential to determine the quality indicators to evaluate how useful the
test can detect a disease or characteristic in the given population. It is essential to know
how the test is likely to be sensitive, its specificity, and how likely someone with a
positive test result is to have the character (positive predictive value). Besides, it’s
possible for someone with a negative test result not to have the attribute (negative
predictive value).
A similar study done by Wanja revealed the following results, the sensitivity and
specificity of RDTs to detect P. falciparum (HRP2-band) against microscopy was
relatively similar across all the eight malaria RDTs tested. The sensitivity was shown
to be >90 % while the specificity was shown to be >73 % when compared to
microscopy. The SD Bioline 05FK50 kit had the highest sensitivity of 94.8 %, while
First Response I16FRC kit had the lowest sensitivity of 90.4 %. The specificity of all
the eight malaria kits was >73 % when compared to microscopy. The Binax NOW
665-025 kit had the highest specificity of 79.3 %.While SD Bioline 05FK50 kit had
the lowest specificity of 73.3 % (Wanja et al., 2016a).

24
The study gap addressed in this particular study was the determination of the accuracy
of mRDTs used for diagnosis of malaria using microscopy as the reference method, in
Seme Sub-County. The various factors affecting the performance of mRDTs and the
quantitative detective limit of malaria parasite density that can be detected by the
multiple mRDTs were also addressed. The mRDTs performance evaluation was
carried out using protocol adopted from the WHO product testing program, which is
part of the WHO-FIND malaria RDT evaluation program (Round 3 2010-2011).
2.7 Sensitivity, Specificity, and predictive values of Rapid diagnostic tests
Microscopy is considered the gold standard for the diagnosis of malaria (Berzosa et
al., 2018). Hence the use of microscopy to determine the specificity, sensitivity and
predictive values of mRDTs. A research done in Cameroon revealed that the
prevalence of malaria by microscopy and RDT was 31% and 45%, respectively. In the
study 23% of individuals had sub-microscopic infections .The results of the study was
as follows; The sensitivity of microscopy-57%, mRDT-78%, and clinical diagnosis-
100%; and the specificity was as follows; 99%, 94%, and 17% respectively; the
positive predictive values for microscopy was 99%,mRDTs- 94%, and clinical
diagnosis -59%; whereas the negative predictive values were 66% for microscopy,
78% for RDTs, and 100% for clinical (Mfuh et al., 2019).
Studies have shown decreasing sensitivity at low parasiteamia. A survey conducted
in four (non-endemic areas) in patients with symptoms suggestive of malaria recorded
100% sensitivity for ≥ 500 P. falciparum parasites/μl, which reduces to ≤ 73% at lower
parasite density (<500 parasites/μl). A study conducted in Port-Harcourt, Nigeria,
Madagascar, and mount Cameroon Region (Obeagu et al., 2018). In the study pLDH,
detecting Pan-specific optimal was used. The sensitivity found was related to the

25
species of the Plasmodium parasite present in the blood sample. In the study done in
London, recorded Performance of OptiMAL malaria antigen capture, 95.3%
sensitivity was or Plasmodium falciparum, Plasmodium vivax (96%), Plasmodium
ovale (57%), and Plasmodium malaria (47%). The research found the last two to be
relatively low (Haider et al., 2020). Previous works elucidated the dependence of
sensitivity on parasite species (Baum et al., 2015; Slater et al., 2019) . The relationship
of sensitivity could be due to defective mRDTs kits and or change in predominant
Plasmodium species studies in Enugu and Ethiopia showed low sensitivity of a
P.falciparum. RDT and para screen RDT irrespective of parasite density or species
variability (Shago et al., 2020). Calculation of quality indicators (table 2.1).
Table 2.1 Calculation of quality indicators.
TEST
RESULTS
Disease
number
Non-disease
number
Total number
Positive number A
True positive
B
False-positive
T
Test positive
Negative number C
False-
negative
C
True negative
T
Test negative
T
Disease
T
Non-disease
Total
2.8 Estimation of the quantitative limit of parasite density cut off points
Microscopy is the gold standard for identifying malaria parasites in blood (Das et al.,
2015). Thick films are performed to detect parasites and measure parasite density
(quantification) and can be used to monitor response to treatment. Parasites are
quantified by counting ring forms (trophozoites) against white blood cells. It is
recommended in routine practice that parasite count be performed against 200 or 500
WBCs (Bosoka et al., 2017). If, after counting 200 WBCs, 100 or more parasites are

26
found, record the results in terms of the number of parasites /200 WBC. If < 100
parasites are found after counting 200 WBCs, parasite quantification should be
continued until 500 WBCs are counted. This method of quantification is essential in
low and moderate parasitemia. Thin films are prepared for parasite species
identification and quantification also. The percentage of parasitized red cells is
determined by counting the numbers of red cells and parasitized red cells. This method
of quantification is useful in high parasitemia.
Process of counting malaria parasites ensures that an adequate number of microscopic
fields are examined (preferably 100 areas or more in a thick blood film). Considering
the 100 areas is essential even if the blood film is positive to detect other malaria
parasites (mixed infection) or any other blood parasites present. To quantify malaria
parasites against Red blood cells, count the infected red blood cells among 500-2,000
RBCs on the thin smear, and express the results as % parasitemia.
% parasitemia = (infected RBCs/total RBCs) × 100 (WHO, 2015)
If the parasiteamia is high (for example> 10%) examine 500 RBCs; if it is low (for
example <1% examine 2,000 RBCs (or more); count asexual blood-stage parasites and
gametocytes separately. Only the former is clinically important, and gametocytes of
P. falciparum can persist after the elimination of asexual stages by drug treatment.
To quantify malaria parasites against white blood cells: on the thick blood film, tally
the parasites against WBCs, until you have counted 500 parasites or 1,000 WBCs,
whichever comes first; express the results as parasites per microliter of blood, using
the WBC count if known, or otherwise assuming 8,000 WBCs per microliter blood.
Parasites/microliter blood= (parasites/WBCs) × WBC count per microliter <or

27
8,000>Results in % parasitized RBCs and parasites per microliter blood can be
converted if the WBC and RBC counts are known, or otherwise (less desirably), by
assuming 8,000 WBCs and 4,000,000 RBCs per microliter blood (Imwong et al.,
2016).
2.9 Factors affecting the diagnostic performance of malaria RDTs
Various factors could affect the diagnostic accuracy of mRDT. These can be broadly
categorized into test device-related factors (quality control/ assurance, storage,
transportation) handling environmental conditions (Obeagu et al., 2018). Preparation
and interpretation of the results, volume of blood and buffer, age and storage of blood
sample, antigen, density, and species. Others include host-related factors such as the
treatment history and effectiveness of treatment. Interpretation of mRDT results
should consider the clinical history of antimalarial treatment because of delayed
parasite clearance (>1 month) for the HRP-2 antigen (Dalrymple et al., 2018b).
Extreme hot temperatures above 30°C is unsuitable for storing mRDTs by the WHO
(Tamiru et al., 2015). Extreme temperatures can interfere with the overall performance
of the mRDTs, and effective temperature-monitoring is essential in all laboratories and
climates. Air-conditioning systems or similar cooling equipment should be considered
in those facility stores that exceed the WHO recommended threshold. Malaria RDT
should be stored in a centralized store as long as possible, and keen monitoring of
temperatures during transportation and storage at the health facilities to minimize
degradation. The use of positive control wells and temperature monitors should be
considered in facilities to assure the quality of the mRDTs and build the confidence of
the users on mRDTs (Bell et al., 2017). There is little information on the
epidemiological factors that influence the specificity of HRP2-and pLDH based tests.

28
In this study, the researcher determined the factors affecting diagnostic performance
of mRDTs.
Although the procedure of using mRDTs may seem simple, the diagnostic efficacy is
subject to many factors, e.g., the different species of malaria parasites, erythrocytic
schizogony, endemicity of different species, the interrelation between levels of
transmission, population movement, parasitemia, immunity, and signs and symptoms
(Bosco et al., 2020). Other factors include drug resistance, the problems of recurrent
malaria, persisting viable or non-viable parasiteamia level, and sequestration of the
Plasmodium parasites in the deeper tissues or organs, and the use of chemoprophylaxis
or even presumptive treatment based on clinical diagnosis, can all influence the
identification and interpretation of malaria parasiteamia in a diagnostic test (Ayogu,
2017).
2.10 Effects of inaccurate diagnosis of malaria
The misdiagnosis of malaria disease can lead to medical, social, and economic effects
(Soofi et al., 2019). Therapeutic effects of misdiagnosis at the individual level include
inappropriate treatment resulting in a prolonged illness (Boyce et al., 2017). Social
effects could consist of a loss of faith in health care services and delayed care-seeking.
Economic effects could include loss of earnings or increased expenditure on transport,
drugs, and consultations.
The effects of false-positive results of malaria could result in higher mortality from
diseases other than malaria (Oleribe et al., 2017). Reyburn and colleagues
demonstrated in Tanzania that clinical diagnosis yielded more false positives than
diagnosis using microscopy (Ravenhall et al., 2018; Reyburn et al., 2007). False-
positive malaria test results can lead to the overuse of antimalarial drugs and may even

29
prevent other diagnoses and treatments of other diseases. On the other hand, false-
negative malaria results could result in a lack of treatment of patients and lead to
malaria-related complications and even death (Recht et al., 2017). A study done in
Eastern Sudan indicates that mRDTs have poor performance in detecting placental P.
falciparum malaria. Malaria RDT had low sensitivity (17.4%) and specificity (81.7)
for diagnosing placental malaria when compared with PCR as the gold standard
(Kashif et al., 2013). This low sensitivity can result to still birth, threaten abortion and
even death of the pregnant women. Therefore, ensuring the diagnostic accuracy of
malaria RDTs is essential to prevent the unnecessary and avoidable consequences of
over-or under-diagnosis of malaria. The evaluation of the diagnostic performance of
RDTs in Seme Sub County and the factors affecting their performance presented in
this study would inform the policymakers on the right diagnostic tool to use.

30
CHAPTER THREE
3.0 MATERIALS AND METHODS
3.1 Study Area
The study was conducted in Seme Sub County, situated approximately 35km West of
Kisumu city, along Kisumu Bondo highway, (Lat 0.103661/long 34.518190).
Kombewa County hospital is the central hub. The study facilities included Miranga,
which is 9.4km from the central hub, Ratta 16.4km, and Manyuada Sub County
hospital 10km. Seme Sub County has a total population of 98,805 with an area of
190.20km2and 25 health facilities. The study facilities had different catchment
population as indicated in the brackets, Miranga (9,864), Manyuada (10,011), and
Ratta (14,059) as obtained from Kenya Health Information System aggregate 2019.
Kisumu West, part of Kisumu central Sub Counties and Rarieda Sub County in Siaya
County, borders Seme. Patients from the neighboring Sub Counties also seek care at
the Hospitals within Seme Sub County. The Hospitals serve the majority of the
malaria-infected patient and it is among the top ten diseases causing morbidity and
mortality within the region as seen Kenya Health information System dashboard.
The hospitals are along the lake region hence the high incidence rate of malaria
infection. There are frequent power outbreak and no backup systems in place in most
of the hospitals. Road infrastructure is good, though problematic during rainy seasons.
Economic activities within the area are majorly fishing because of the lake, beaches,
and surrounding Islands, and small-scale farming is taking place. However, the
majority are also engaged in small-scale businesses to earn a living at the locally
available market centers (Appendix I).

31
3.2 Study Design
Across-sectional analytical design was used. The mRDTs kits evaluated were
ParaScreen rapid test for malaria pan/Pf (Lot 101343) manufactured by Zephyr
Biomedicals in India and SD BIOLINE malaria Ag P.f (lot 05FK50) manufactured by
Abbot standard diagnostic Inc. in Korea. Whole blood sample panels (223) were
subjected to the two different RDTs each and the reference method “microscopy”.
Data was collected through laboratory analytical procedures, observation and by the
use of questionnaires for objective three.
3.3 Study objects
The study objects, were Histidine rich protein2 (HRP2) rapid diagnostic test kits and
parasite lactate dehydrogenase combined with HRP2 based rapid diagnostic test
(HRP2/pLDH). The accessible population were the three health facilities (Ratta,
Miranga and Manyuada) within Seme Sub County.
3.3.1 Inclusion criteria
The study included HRP2 (SD BIOLINE malaria Ag Pf -05FK50) of batch number
05CDF08-3A manufactured by Abbot standard Diagnostic Inc. in Korea and
HRP2/pLDH RDTs (ParaScreen rapid test for malaria pan/Pf)batch 101343
manufactured by Zephyr Biomedicals in India. The mRDTs were of good condition,
free from physical damage and were within the self-life given by the manufacturer.
The sample panels must be from the patients send to the laboratory suspected to have
malaria for the confirmatory parasitological test.

32
3.3.2 Exclusion criteria
The study excluded all the expired and damaged rapid diagnostic tests kits. It also
excluded other types of rapid diagnostic test kits. Sample from other patients who were
not suspected to have malaria and therefore not sent for confirmatory parasitological
test were excluded and not sampled to make part of the sample panel.
3.4 Study Variables
The study had independent, intervening and dependent variables that guided the study
to meet the objectives.
3.4.1 Dependent variables
The dependent variable in this case would be the quality performance of RDTs. This
is because the quality of rapid diagnostic test depends on environmental conditions
and inbuilt test characteristics. Such factors include the sensitivity, specificity and
predictive value and environment factors such as storage conditions, staff training, and
use of quality control wells, standard operating procedures and malaria diagnostic
guidelines.
3.4.2 Independent variable
In this study, the independent variables were the sensitivity, specificity, predictive
values. It also included parasiteamia level, level of magnification and factors affecting
the performance of RDTs such as storage, staff training, quality control measures and
use of standard operating procedures and malaria diagnostic guidelines. All these
independent variables lead to the quality performance of the rapid diagnostic test.

33
3.5 Sampling design
Purposive sampling design to select the health facilities was used. The facilities were
proportionally divided according to the target objects expected to be evaluated. The
rapid diagnostic test kits were randomly sampled. Convenience sampling was also
used to administer the questionnaires to the health care workers.
3.6 Sample Size Determination
The Cochran's formula was used (Israel, 1992) to determine the sample size which
gave us the number of mRDTs to be evaluated. The three health facilities from the 25
were purposively selected. The catchment population per facility were as follows
(Miranga = 9,864, Ratta =14,059 and Manyuada =10,011). Which were used to
determine the sample size giving us the number of mRDTs kits to be evaluated in the
study.
Cochran's formula is
n0=Z2Pq
e2
The initials represent the following:
n= sample size (where the population is more than 10,000)
e is the desired level of precision (i.e., the margin of error),
p is the proportion of the population, which has the attribute in question, (This is the
prevalence of malaria (28%) according to a study done 2015 in Maseno, Kisumu West
Sub County (Jenkins., et al. 2015). The study adopted the prevalence rate because

34
Seme and Kisumu west Sub County initially was Kisumu rural District and regarded
as one; hence the study also covered Seme Sub County by then.
Q Is 1 – p.
The z value is found in the z table.
No= (1.96)2(0.28) (0.72)2
(0.05)2
3.8416×0.28×0.5184
0.0025
no= 223
Sample size = 223
This form sample panels used to evaluate mRDTs using microscopy as the reference
method. The target health population density was used to obtain the study hospitals’
sample size by getting the percentage population of each hospital from the total study
population (33,931) obtained from KHIS aggregate population data. Convenience
sampling was used to select Miranga, Ratta and Manyuada health facilities and the
health care workers to be interviewed were purposively selected. Proportional random
sampling was done in each health facility to achieve the desired sample size.
Table 3.1 Distributions of the study objects (mRDTs test kits) in the health
facilities
Health facility Catchment population Sampled mRDTs
Miranga 9864 9864 𝑥 223
33931= 65
Ratta 14059 14059 𝑥 223
33931= 92
Manyuada 10011 10011 𝑥 223
33931= 66
Total 33931 223

35
Table 3.2 Distribution of the study objects as per the diagnostic method
Diagnostic method Reference method
(microscopy)
HRP2 RDTs HRP2/pLDH RDTs
Sample size 223
Ratta (65)
Miranga(92)
Manyuada(66)
223
Ratta (65)
Miranga(92)
Manyuada(66)
223
Ratta (65)
Miranga(92)
Manyuada(66)
3.7 Data collection process
Data collection instruments used included laboratory procedures, questionnaires and
observations.
3.7.1 Field assistants’ training
The laboratory diagnosis team was composed of six medical laboratory officers with
a minimum diploma in medical laboratory sciences training and previous clinical
laboratory unit experience. The six were divided into two categories. Three medical
laboratory officers were tasked with sample collection, performing malaria rapid
diagnostic tests, and preparing and staining the thick and thin smears. The three had
pre-training on phlebotomy and orientation on safe phlebotomy, malaria microscopy,
and malaria case management training. On job training and orientation was done
according to WHO standard operating procedures used in the study. The second
category of the laboratory officers was responsible for microscopy slide reading. This
group of officers were well trained in malaria microscopy and passed a competency
assessment. All the laboratory officers were supplied with operational procedures
manual regarding laboratory diagnosis procedures.

36
3.7.2 Collection of specimen and quality assurance
Patients' whole blood samples were used to evaluate the diagnostic tests against the
reference method. Using standard phlebotomy procedure, 2mL of venous blood was
drawn and dispensed into ethylenediaminetetraacetic acid anticoagulant (EDTA) tubes
by qualified medical laboratory officer working in the health facility. The sample was
then taken to the laboratory and used for the Rapid Diagnostic Test and microscopy
testing. All collection sites were assessed for competency at conducting routine and
reference malaria diagnosis. Personnel selection was based on experience in routine,
reference and study diagnostic methods. Internal and external quality assurance
programme was in place.
3.7.3 Testing for malaria disease using RDTs
Rapid Diagnostic test was carried out as routinely done without any special attention
given to the samples by medical laboratory officer working in the health facilities
laboratory. All rapid diagnostic tests were done using SDBIOLINE malaria antigen Pf.
Batch number 05CDEF08-3Amanufactured by Abbot standard diagnostic Inc., Korea
and ParaScreen rapid test for malaria pan/ Pf, manufactured by Zephyr Biomedicals in
India.
In brief, all kit components and specimen were assembled together. Using a 5 𝜇l
disposable capillary pipette, whole blood was drawn and transferred into the round
sample well. Four (4) drops of assay diluent was added into the square assay diluent
well holding the diluent bottle vertically. Reading of test was done in 15 minutes for
SD BIOLINE and 20 minutes for ParaScreen. The presence of one colour band (“C”
Control line) within the result window was interpreted as negative results. The
presence of two colour bands (“T” Test line and “C” Control line) within the result
window was interpreted as positive results. In the event where the control line fails to

37
appear within the results window, the test was invalid (repeat the test). Report the
results as “mRDT Negative” or “mRDT Positive” or “mRDT Invalid” (fig 3.1).
POSITIVE
NEGATIVE
INVALID
INVALID
Figure 3.1 Interpretation of malaria rapid diagnostic test results
3.7.4 Testing for malaria using microscopy
An amount of 6 𝜇L and 2 𝜇L of the blood sample was pipetted for the preparation of
thick and thin blood films, respectively. Thin film was fixed with methanol for 5
minutes and both thin and thick film were stained with 3 % Giemsa for 30 minutes.
Stained slides were left to air dry before examination using a 100x objective oil
immersion light microscope. The smears were independently read by two

38
microscopists who were blinded to the results of the mRDT as well as the diagnosis
made by the clinicians and between each other.
3.7.4.1 Quantification of malaria parasite density
Examination of the slides were done and if malaria parasites were present, the asexual
forms were counted without sexual (gametocyte) forms, in mixed infections, all
asexual parasites were counted together. Look for afield with a good number of white
cells and parasites observed together starting at the topmost left part of the film and
start counting. Two tally counters were used one for the WBCs and the other for
parasites. Counting was done for all the parasites and white cells in one field, then
movement was done to the next field following a systemic pattern. The following rules
were followed during the counting, if ≥100 parasites in 200 white cells have been
counted, counting was stopped and results recorded as the number of parasites per 200
white cells. If ≤99 parasites in 500 white cells were counted, counting was stopped and
results recorded as the number of parasites per 500 white cells. All the parasites and
WBCs were counted in the last field, even if the white cell count exceeds 200 or 500.
The actual numbers of parasites and white cells counted were recorded on an
appropriate worksheet. Calculation of the parasite density based on the patient's actual
white cell count was done as follows.
Parasites / μL blood = Number of parasites counted x 8000 white cells/μL
No. of white cells counted
Sensitivity=Number of true positives (TP or A) using the reference method
[Number of true positives (TP or A)] + [Number of false negatives (FN or C)]
Specificity =Number of true negative (TN or C) using the reference method
[Number of true negatives (TN or C)] + [Number of false positives (FN or C)
Predictive Value = True Positive (A) × 100

39
True Positive (A) + False negative (B)
Negative Predictive Value = True Negative (D) × 100
True Negative (D) + False Negative(C)
False positive rate =False positive (FP)
False-positive (FP) +True negative (TN)
The results were recorded and reported after microscopy examination. All the malaria
indicators were reported during smear examination. Record the results in the
laboratory results tracking log. The date, time of examination and parasite species,
stages and count. The reporting was uniformly done. For example, P. vivax
trophozoites seen. P. falciparum trophozoites seen; count, 42 000 parasites/µL. · P.
falciparum gametocytes seen. No malaria parasites were seen (Figure 3.2).
Examination of a thin blood film
Examination of a thick blood film
Figure 3.2 Routine examination of blood films for malaria parasites
3.7.5 Factors affecting the performance of mRDTs
For the purpose of this study, in depth interviews and observation were used to obtain
the factors affecting the performance of mRDTs. Semi-structured questionnaires were
used to interview and observe the health care workers to assess these factors. The
health care workers were purposefully selected and they included clinicians, medical
laboratory officers, nurses and community health volunteers. The interviews were
transcribed, ordered and coded in matrixes using the key categories of commodity

40
storage, stock availability and monitoring, staff training, adherence to standard
operative procedures and end user experiences. (Appendix II).
3.7.6 Reliability and validity
Calibrated pipette was used to obtain a standard amount of blood. To achieve a good
quality of staining and standardization of blood film examination and reporting, the
blood spreader was used to spread the blood film evenly over a specified area of the
slide using a slide preparation template. Each slide was subjected to preliminary
screening using low power objectives, followed by examining at least 100 microscopic
fields using high power objectives×100. Two microscopic experts examined slides,
and a third expert reviewed slides with discrepant results.
For malaria RDTs, the C band's presence was an indicator of the test's validity. The
standard operating procedures (SOPs) were followed before the start of the process
using the manufacturers' instructions available on the reagent insert; the training done
included proper handling of the RDTs, collection of blood with the pipette for testing
on the RDTs, use of the reagent buffer for RDT and the reading and interpretation of
the test from the RDTs.
3.7.7 Quality assurance
The quality assurance officer reviewed methods for preparing both the thin and thick
blood films, staining, species identification, and parasite quantification guideline as
per the WHO 2016 guideline. Uniformity in classifying test results as either ''positive"
or ''negative" as described in the manufacturers' instructions for the mRDTs was
reviewed appropriately. A blinded test sample was used as part of the quality assurance
process. Known positive and negative control slides were prepared and kept for quality

41
control. Known positive and negative blood samples from the previous day's work was
used to internally control the mRDTs.
3.7.8 Handling indeterminate/Invalid results
Indeterminate results were recorded as such. The test was repeated using a new test kit
device and the same whole blood sample. The results for the repeat tests were
documented on the result trucking log.
3.8 Standard operating procedure for performing reproducibility testing
Two microscopic experts independently read and recorded the results of each testing.
In case the results from the two experts were inconclusive, a third microscopic expert
was brought on board to act as a tire breaker. Two similar results were picked to be
the right one.
3.9 Pilot phase
Tests were performed with positive and negative whole blood samples, under
supervision. The diagnostic tests were piloted in parallel with the reference method.
The tests were blinded to the test results. The results were read and when results were
invalid the test was repeated with new devices. The researcher and the assistants
proceeded with the evaluation only when they were confident about each component
of the testing procedure.
3.10 Data management and analysis
Primary data was documented in the results tracking log and keyed in a password-
protected Microsoft Office Excel 2010. Data completeness and consistency was
checked and data queries resolved after data entry. Analysis of data was done using
STATA software version 15.

42
Cohen's Kappa coefficient was used to observe the agreement among the different
diagnostic tests being evaluated and McNemar was used to check the discordance
between the diagnostic tests. Standard WHO procedures were used to calculate
sensitivity, specificity and predictive values.
The likelihood ratio was used to determine the quantitative limit of parasite density cut
off points detected by the different mRDTs compared to microscopy and receiver
operating characteristic (ROC) was used to get the statistical significance of the
quantitative limit of parasite density cut off.
Descriptive data analysis was used to describe factors affecting the performance of
mRDTs and presentation done in frequencies, proportions, percentages, dispersion
measures, and central tendencies in tables.
3.11 Logistical and Ethical Considerations
Ethical approval was sought from the scientific and ethical approvals MMUST IREC,
NACOSTI, and permission obtained from the Sub County Health Management team.
There was respect to the autonomy of all participants and participants with diminished
autonomy were entitled to additional protection. They were allowed to go through the
process as fast as possible to minimize their hospital stay. Participation was voluntary
from respondents and the right to refuse or drop from the study at any phase if they
wish to. Meaning, non-prejudicial treatment of those who decline to participate or
withdraw from the study after agreeing to participate was accepted. Participation was
based on informed written consent and permission from the caretakers for the minors
based on assent (Appendix III and IV). Sufficient information about the purpose and
objectives of the study was provided to the participants. To make participants give
assurances about taking part to allow individuals to understand the implications of

43
participation, agree on informed consent, and willingly decide whether or not to do so,
without any pressure or persuasion.
Counselling was done to the participants before signing the informed consent form.
Use of offensive, discriminatory, or any other unacceptable language to formulate the
questionnaires was avoided. Training of the research assistants on good clinical
practice (GCP) and ethical issues was done to enable the study to achieve the ethical
considerations' expectations. Unique identifier or codes to maintain privacy and
anonymity were used. To ensure adequate study data confidentiality at all levels; the
documents were kept in a lockable cabinet and have a password protected excel sheet
for data storage. The study staff accessing the information signed a statement of intent
(Appendix V). The study objectives were clearly explained to the participants, and no
deception or exaggeration about the study was allowed.
A trained phlebotomist did blood sample collection to avoid harm, and the participants
were treated with respect for dignity. There was no transport of samples from one study
area to another. The findings and feedback was given with honesty and transparency
and there was no provision for the participants' compensation. There was no conflict
of interest in this study. The blood sample disposal was done after use as per the normal
sample disposal protocol for clinical samples, and nobody was allowed access to them,
apart from the study staffs. The study did not allow any misleading information as well
as the representation of primary data findings. There were fair and non-discriminatory
participation and participants’ selection such that any risks and benefits were to be
equitably shared. There was respect to cultural and other forms of human diversity
before, during, and after the study's participants.

44
CHAPTER FOUR
4.0 RESULTS
4.1 Sensitivity, Specificity, and Predictive Values of HRP2 based mRDTs and
HRP2/pLDH based mRDTs
The HRP2 mRDT and HRP2/pLDH mRDT had similar level of sensitivity at 94.4%
(95 % CI = 0.87 – 0.98). The specificity of the two mRDTs kits against microscopy
was found to be 85.7 % (95 % CI = 0.79 - 0.91) and 85.0 % (95 % CI = 0.78 - 0.90)
for HRP2 mRDTs and HRP2/pLDH mRDTs respectively. HRP2 mRDT had a
positive predictive value of 81.0 % (95 % CI = 0.72 - 0.87) and HRP2/pLDH mRDT
had a positive predictive value of 80.2 % (95 % CI = 0.71 – 0.87).The study found the
negative predictive value for HRP2 mRDT to be 96.0 % (95 % CI = 0.91 – 0.98), and
that of HRP2/pLDH mRDT to be 96.0 % (95 %CI = 0.91 – 0.98).
The McNemar χ2 two-sided exact test applied in Table 4.1 shows that there is
significant discordance between the proportions of positive results by HRP2 mRDTs
and positive results by microscopy (P = .004). On the other hand, under pLDH-mRDT,
the McNemar χ2 two-sided exact test has a P-value that is less than 5% (P = .002). This
shows that there is a statistical significant discordance of the proportion of positive
results among diseased (sensitivity) for the pLDH mRDT test against microscopy test.
Cohen’s Kappa was also run to determine if there was a significant agreement between
microscopy test and mRDTs of malaria on whether respondents test positive or
negative. There was a good agreement between microscopy and HRP2 mRDT (k =
0.78, 95% CI = 0.69-0.86, P < .001) and also there was a good agreement between
microscopy and pLDH mRDT (k = 0.77, 95% CI = 0.69-0.84, P < .001)

45
Table 4.1 Sensitivity, Specificity, and Predictive Values of mRDTs using
microscopy as a gold standard and their level of agreement
HRP2-mRDTs pLDH mRDTs
Sensitivity (95%CI) 94.4 (0.87 - 0.98) 94.4 (0.87 - 0.98)
Specificity (95%CI) 85.7 (0.79 - 0.91) 85.0 (0.78 - 0.90)
Positive predictive value (95%CI) 81.0 (0.72 - 0.87) 80.2 (0.71 - 0.87)
Negative predictive value (95%CI) 96.0 (0.91 - 0.98) 96.0 (0.91 - 0.98)
MCNemar’s χ2 P = .004 P = .002
Kappa value (95%CI) 0.8 (0.69 – 0.86) 0.8 (0.69 – 0.84)
Kappa P < .001 P < .001
CI= Confidence interval; P=P-value
Figure 4.1 sensitivity, specificity and predictive values of HRP2 and pLDH mRD
4.2 Quantitative limit of parasite density cut off points detected by the different
RDTs
The performances of mRDTs were considered at cut-off point criteria of 80, 100, 500,
1000, 50000, 10000, 50000, and 100000 parasite/μl of blood. The sensitivity of both
HRP2 mRDT, and HRP2/pLDH mRDT was high at malaria parasite density of 80
94.4
86
96
81
94.4
85
96
80.2
70
75
80
85
90
95
100
SENSITIVITY SPECIFICITY NEGATIVE
PREDICTIVE V
POSITIVE
PREDICTIVE V
PE
RC
EN
TA
GE
SC
OR
E
perfomance indicators
Sensitivity,specificity and predictive values of HRP2&
HRP2/pLDH mRDTs
HRP2 MRDT
HRP2/pLDH mRDT
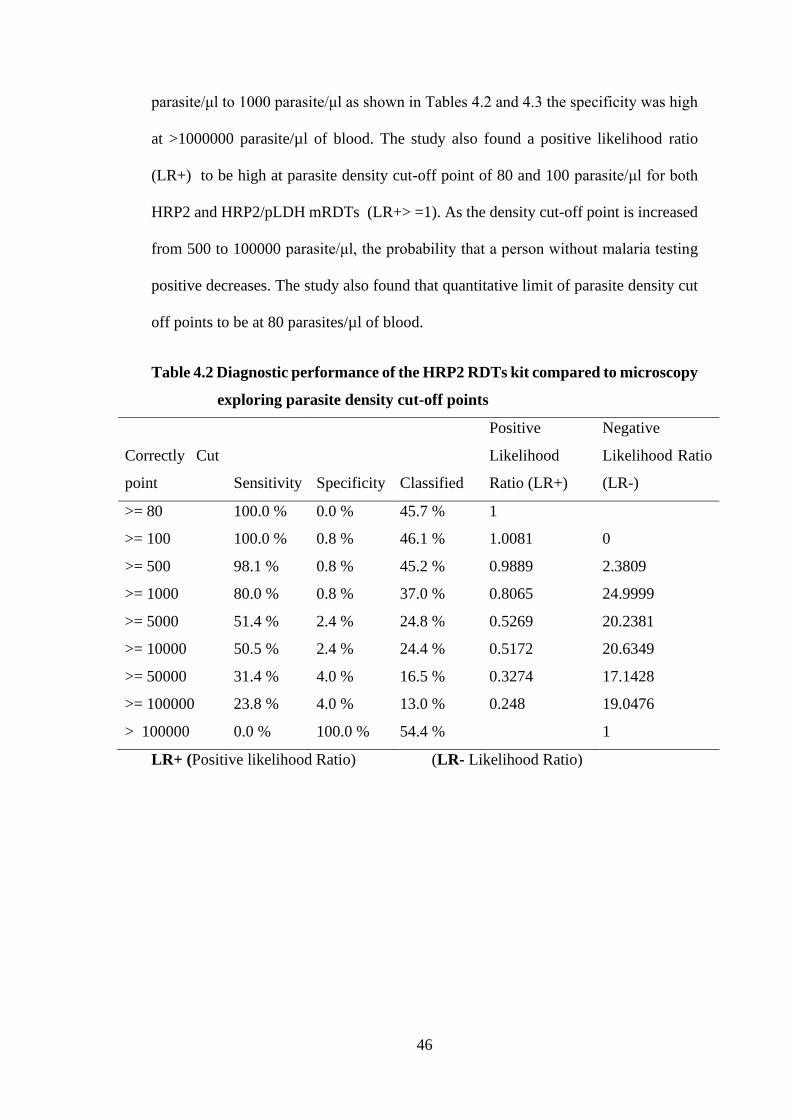
46
parasite/μl to 1000 parasite/μl as shown in Tables 4.2 and 4.3 the specificity was high
at >1000000 parasite/µl of blood. The study also found a positive likelihood ratio
(LR+) to be high at parasite density cut-off point of 80 and 100 parasite/μl for both
HRP2 and HRP2/pLDH mRDTs (LR+> =1). As the density cut-off point is increased
from 500 to 100000 parasite/μl, the probability that a person without malaria testing
positive decreases. The study also found that quantitative limit of parasite density cut
off points to be at 80 parasites/µl of blood.
Table 4.2 Diagnostic performance of the HRP2 RDTs kit compared to microscopy
exploring parasite density cut-off points
Correctly Cut
point Sensitivity Specificity Classified
Positive
Likelihood
Ratio (LR+)
Negative
Likelihood Ratio
(LR-)
>= 80 100.0 % 0.0 % 45.7 % 1
>= 100 100.0 % 0.8 % 46.1 % 1.0081 0
>= 500 98.1 % 0.8 % 45.2 % 0.9889 2.3809
>= 1000 80.0 % 0.8 % 37.0 % 0.8065 24.9999
>= 5000 51.4 % 2.4 % 24.8 % 0.5269 20.2381
>= 10000 50.5 % 2.4 % 24.4 % 0.5172 20.6349
>= 50000 31.4 % 4.0 % 16.5 % 0.3274 17.1428
>= 100000 23.8 % 4.0 % 13.0 % 0.248 19.0476
> 100000 0.0 % 100.0 % 54.4 %
1
LR+ (Positive likelihood Ratio) (LR- Likelihood Ratio)

47
Table 4.3 Diagnostic performance of the HRP2/pLDH RDTs kit compared to
microscopy exploring parasite density cut-off points
Correctly Cut
point Sensitivity Specificity Classified
Positive
Likelihood
Ratio (LR+)
Negative
Likelihood Ratio
(LR-)
>= 80 100.0 % 0.0 % 46.09% 1
>= 100 100.0 % 0.8 % 46.52% 1.0081 0
>= 500 98.1 % 0.8 % 45.65% 0.9891 2.3396
>= 1000 80.2 % 0.8 % 37.39% 0.8084 24.5661
>= 5000 51.9 % 2.4 % 25.22% 0.5317 19.8868
>= 10000 50.9 % 2.4 % 24.78% 0.5221 20.2767
>= 50000 32.1 % 4.0 % 16.96% 0.3342 16.8453
>= 100000 24.5 % 4.0 % 13.48% 0.2556 18.717
> 100000 0.0 % 100.0 % 53.91%
1
LR+ (Positive likelihood Ratio) (LR- Likelihood Ratio)
The receiver operating characteristic (ROC) curve of HRP2 RDTs and HRP2/ pLDH
RDTs performance showed sensitivity against 1-specificity as the cut-off point's value
moves from 0 to 1. ROC of 0.9008 was obtained for HRP2-RDTs and 0.8972 for
HRP2/pLDH-RDTs showing high sensitivity for the two RDTs kits (Figure 4.2).

48
Figure 4.2 Receiver operating characteristic curve of the two malaria RDT
performance with plotted points of parasite densities at selected cut-
off points
4.3 Factors affecting the performance of RDTs used for diagnosis of malaria
4.3.1 Test device-related factors
In all the three sampled health facilities (Ratta, Miranga, and Manyuada), 18 (47.4%)
of the health care providers reported that mRDTs were stored well. That is, the storage
facilities were well ventilated with thermometer and monitoring chart updated. Out of
38 health care providers, 8 (21.1 %) did not achieve the recommended storage
standards for mRDTs since the room temperature was not being monitored. There was
no proper ventilation, and there was a lack of thermometer in these facilities. The
results further show that only 12 (31.6 %) had an excellent storage area for mRDTs.
Meaning they had all the requirements achieved for effective storage.

49
16 (42.1%) of the health care providers checked the expiry date of mRDTs before use,
however, only 7 (18.4%) were able to monitor mRDTs expiry date regularly. Stock
monitoring was reasonably achieved in all the sampled health facilities. 15 (39.5%) of
the interviewed health care providers reported that malaria commodities' were
availability (Figure 4.3).
Figure 4.3 The achievement of test device-related factors
4.3.2 Factors associated with handling of the rapid diagnostic test kits
The results revealed that 12/22 (54.5 %) of community health volunteers (CHVs)
training on malaria case management had been done in the last 2 years. For the facility
health care workers, 2/6 (33.3 %) of the clinicians, 3/6 (50.0 %) of the medical
laboratory officers and 2/4 (50.0 %) of the nurses were trained on malaria case
management in the last two years.
Concerning checking of the expiry date of mRDTs, 12/22 (54.5%), 4/6 (66.7%), 4/6
(66.7%) and 3/6 (75.0%) of CHVs, clinicians, medical laboratory officers and nurses
respectively, were able to routinely check the expiry date of mRDTs before use.
0% 10% 20% 30% 40% 50%
stock out of malaria
Expiry date checked
storage
percentage
Fact
ors
Test device related factors
Excellent
Fairly achieved
Not achieved

50
However, wearing new gloves when making a malaria diagnosis was excellently
achieved by the health care workers.
Look at cleaning of the puncture site with sterilize alcohol swab before sample
collection, 15/22 (68.1%), 6/6 (100.0%), 5/6 (83.3%) and 2/4 (50.0%) of CHVs
clinicians, medical laboratory officers and nurses respectively cleaned the puncture
site as expected before sample collection.
Considering adequate volume of blood collected during sample collection, the results
obtained were as follows, 21/22 (95.5%) of the CHVs were able to collect the required
amount of blood. 6/6 (100%) of the clinicians collected the required amount of blood
during sample collection. Finally, 5/6 (83.3%) and 3/4 (75.0%) of medical laboratory
officers and nurses respectively managed to collect the correct volume of blood during
sample collection.
Finally looking at dispensing the required amount of buffer to cassette well when
running the test showed that, 21/22 (95.5%), 6/6 (100.0 %), 5/6 (83.3%) and 4/4
(100.0%) of the CHVs, clinicians, medical laboratory officers and nurse respectively,
were able to dispense the right amount of buffer as indicator by the manufacturer. On
the other hand, 16/22 (72.7 %), 6/6 (100.0%), 5/6 (83.3%) and 2/4 (50.0%) of the
CHVs, clinicians, medical laboratory officers and nurses respectively were able to
dispense blood at the correct sample well (Figure 4.4).

51
Figure 4.4 Factors associated with handling of mRDTs
4.3.3 Factors relating to quality control using mRDTs
Out of 38 health care workers interviewed, 27 (71.1%) were able to read and interpret
test results correctly (figure 4.4). The study revealed that 18 (47.4%), were able to
record test results correctly. However, the study revealed that no control wells were
available to be used for internal and external quality control (IQC/EQC). It also
revealed that no proficiency testing was being done to the health care workers (figure
4.4).
54.5 54.5 68.1 95.5 72.7 95.533.3 66.7 100 100 100 10050 66.7 83.3 83.3 83.3 83.350 75 50 75 50 1000
20
40
60
80
100
120
staff training expiry datemont
puncture sitecleaned
adequate volblood
blood oncorrect well
correct amountof buffer
Per
cen
tag
e (%
)
FACTORS ASSOCIATED WITH HANDLING OF mRDTs
community HV Clinicians med lab officers Nurses

52
Figure 4.4 Factors assessing the quality performance of mRDT
Besides, the distribution of test kits evaluated per facility were as indicated below. A
total of 223 whole blood sample panels were tested using the two mRDTs kits and
microscopy as a reference method. Out of 223 diagnostic test kits evaluated, 92
(41.3%) were tested in the Ratta health facility, 65 (29.1 %) were tested in Miranga
health facility, and 66 (29.6 %) were tested in Manyuada health facility (figure 4.5).
Figure 4. 5 Distribution of test kits evaluated per facility
0 0
71.1
36.8
0
76.3 78.9
68.4
0
10
20
30
40
50
60
70
80
90
per
cen
tag
% sc
ore
Quality indicators
Factors assessing the quality performance of mRDTs
percentage score
92
66
65
Malaria rapid diagnostic test kits per facility
Ratta HC MIRANGASCH MANYUADA SCH

53
CHAPTER FIVE
5.0 DISCUSSION
Quality diagnosis of Plasmodium species is important not only for establishing the
correct treatment regimen but also for applying effective malaria prevention and
control strategies in endemic regions where the three species of malaria parasites exist,
as in Seme Sub County, Kisumu County. Failure to identify Plasmodium species could
result in severe public health concerns due to inappropriate treatments, leading to
recrudescence and even drug resistance (Kang et al., 2017). Malaria prevention and
control requires a high-quality diagnostic method to detect the parasite before
prescribing antimalarial treatment following the WHO's indications. Malaria
parasitological diagnosis targets treatment supports, the treatment response's
characterization, and enables early identification of the parasite (Falade et al., 2016).
5.1 Sensitivity, specificity and predictive values of HRP2mRDT and HRP2/
pLDH mRDTs
The sensitivity for the malaria rapid diagnostic tests obtained in this study was 94.4%
and the specificity was at 85.7% for HRP2 based mRDTs and 85.0% HRP2/pLDH
based mRDTs. This does not agree with the manufacturer's sensitivity of 98.0% and
specificity of 97.5% for HRP2 and 99.0% sensitivity and 97.0% specificity of
HRP2/pLDH. The possible reason is that like other biological tests, malaria RDTs are
prone to deterioration through exposure to heat and humidity and manufacturing faults.
However, the data from this study are consistent with a published work done in Kenya
when RDTs are compared to microscopy which showed a sensitivity of >90% and
specificity of >73% (Wanja et al., 2016a). The agreement probably may be because
the study took place in the same endemic area for malaria hence the similarity of the

54
study environmental conditions. Sensitivity and specificity differences among mRDTs
can be due to several possible reasons, including exposure to extreme temperature and
humidity that cause denaturation of antibodies, hrp2 gene polymorphisms and
deletions, operational difficulties and human error during test performance. The results
indicate that the mRDTs kits used in the study can detect correctly only with 217 out
of 223 blood samples with malaria infection and will give a negative result in 196 out
of the 223 blood samples without malaria infection. The false-positive may be due to
the persistent antigen of the malaria parasite in the blood even after parasite clearance
following adequate antimalarial treatment of the index cases as reported in the study
done by Dalrymple and Al-Awadhi (Al-Awadhi et al., 2021; Dalrymple et al., 2018a).The
false positives and negatives obtained in the current study can be attributed to low
parasiteamia level, failure to adhere to SOPs, types of mRDTs used and probably due
to test kits deterioration due to inappropriate storage condition.
The sensitivity and specificity reported in this study are yet to attain the ≥ 95%
sensitivity and ≥90% specificity recommended World Health Organization (Berthod
et al., 2017). This low sensitivity is disadvantageous as it will impair control
intervention since a fraction of the infected population will be left untreated especially
if mRDTs is the only available diagnostic tool. The low sensitivity maybe because of
the false negative obtained by mRDTs compared to the microscopy recorded in the
study. The possible explanation for these findings may include a low parasite density
below the threshold of mRDTs positivity (<100 asexual parasites/µl or <0.002% of red
blood cells infected) (Mouatcho et al., 2013). Other studies have also shown some
degree of false-negative results for mRDTs because of Hyperparasiteamia, deletion or
mutation of hrp2 gene, and the prozone effect, which is defined as false negative or
false positive results in immunological reactions because of the excess of either

55
antigens or antibodies (Cheng et al., 2014; Gendrot et al., 2019; Kozycki et al., 2017b).
The effects of antigens and antibodies will eventually affect the test's sensitivity (Gillet
et al., 2009). The sensitivity obtained by this study was higher than for a study done
in Nigeria. Myanmar endemic border in China also found that the HRP2 based rapid
diagnostic test had a sensitivity of 89.7% and specificity of 98.3% compared to the
gold standard microscopy method for the detection of malaria (Ogunfowokan et al.,
2020). Variation in sensitivity between the different studies may be attributed to
differences in the types of mRDTs used or test methodology and skills of the
microscopist.
The different mRDTs tested herein had relatively low specificity (85.7% and 85.0%
for HRP2 and HRP2/pLDH respectively) in comparison to the study done in Ethiopia
and Kenya, which had a specificity of 98.6% and 95.4% respectively (De Oliveira et
al., 2009; Feleke et al., 2017). This was also far much lower compared to a study done
in Kenyatta Hospital which had a specificity of 97% (Ndunda, 2019). The lower
specificity in the current study could be attributed to the detection of HRP2 circulating
antigens, which may persist in the blood several weeks after malarial treatment and
low parasiteamia level. Ezeudu and colleagues also reported a sensitivity and
specificity of 80.0% and 93.8% respectively (Ezeudu et al., 2015). This was lower than
the reports obtained in this current study. This can be attributed to different quality
factors such as failure to follow standard operating procedure and testing guidelines
that are capable of affecting the performance of mRDTs.
The persistent antigenaemia may have contributed to the low specificity recorded in
the study. This also agrees with the work of Batwala in Uganda rural health centers,
which reported that the overall specificity of mRDTs was lower than that of expert
microscopy (Ogunfowokan et al., 2020). The agreement is there probably because the

56
study areas are within the sub-Saharan Africa region where the storage and testing
conditions are almost similar.
The percentage agreement of positive results of mRDTs and microscopy was at the
perfect agreement of 89.1% for HRP2 based mRDTs and 88.7% for HRP2/pLDH
based mRDTs. The expected agreement rate was 51.0% and 50.9%, respectively. This
is consistent with a study done in Kenya which indicated that RDTs had a moderate
measure of agreement (>80.1%) when compared to microscopy (Wanja et al., 2016a).
The agreement may be because this is a high endemic area; hence the parasiteamia
density can be detected by both mRDTs and microscopy. The agreement on the
sensitivity and specificity of the diagnostic test was statistically significant.
The implication of the low sensitivity in this study compared to the WHO set target is
that in areas with low malaria parasiteamia, medical laboratory personnel should cross-
check a negative result with the gold standard 'microscopy' and clinical understanding
of the clinician to rule out possibilities of false negative with the mRDTs. The
specificity of 85% in the study implied that mRDTs might be used in primary
healthcare by community health volunteers to rule out the absence of malaria where
microscopes are hardly seen or where the required expertise is lacking; however, for
the health facilities with laboratory, the gold standard method should be used to ensure
accurate positive results are obtained. The false-negative results can be caused by any
or combination of the following. The procurement and use of poor quality mRDTs,
poor transport and storage conditions for mRDTs with sustained exposure to high-
temperature, operator errors during performance and interpretation of mRDTs results,
and finally, deletion or mutation of hrp2.However, the possibility of the mRDTs
detecting parasites with hrp2 gene deletion needs to be explored. A review of HRP2
mRDTs is required given the reports of hrp2 gene deletion infection in Mali (Agaba et

57
al., 2019) and potentially in Ghana as suggested by Amoah et al. 2016 (Amoah et al.,
2016).
The positive predictive values on this study for HRP2 and HRP2/pLDH mRDTs were
81.0% and 80.2% respectively. The negative predictive values were higher than the
PPV, for HRP2 it was 96.0% and for HRP2/pLDH mRDTs was 96.0%. The PPV
obtained is slightly different from the findings of Falade et al., 2016, who had PPV
and NPV of 65.6% and 86.1%, respectively. The positive predictive value of 81.0%
means that the kit can detect malaria with a precision of 81.0%. In contrast, the
negative predictive value of 96.0% means that the mRDTs are good in ruling out
malaria, thus giving the clinician the confidence that the negative test excluded malaria
in about 96.0% of cases. The differences in predictive values may be attributed to poor
transport and storage conditions for mRDTs, with sustained exposure to high
temperature and operator errors during the performance and/or interpretation of mRDT
results.
5.2 Quantitative limit of parasite density cut off points
The study reveals that the performance of mRDTs was at the different cut off points.
It shows that the minimum parasite density detected by HRP2 and HRP2/pLDH
mRDTs is 80 parasites/µl of blood. This is higher than the detection limit given by the
test kits manufacturer who gave the lower detection limit to be 50 parasites/µl of blood.
The differences in detection limit depends on the accuracy and sensitivity of the
microscopist expert used. The two mRDTs evaluated in this study had acceptable
performance in samples with parasite densities from 80 to >100,000 parasites/μl of
blood. The detection limit obtained is slightly higher than the study done in Ghana,
which revealed a parasite density detection limit from 25 parasites/µl of blood to 96

58
parasites/µl of blood (Adu-Gyasi et al., 2018). Another study recorded sensitivity of
HRP2/pLDH rapid diagnostic tests remained relatively low for P.falciparum, detecting
a lower limit of 200 parasites/µl of blood compared with HRP2 based rapid tests which
detected 50 parasites/µl of blood (Slater et al., 2019). The differences in parasite
density cut off points can be attributed to test procedure, factors affecting biological
tests and the technical competency.
The sensitivity of mRDTs in this study was shown to increase with an increase in
parasite density. This is true because the higher the parasiteamia level the greater the
percentage agreement of positive results of mRDTs with microscopy. It, therefore,
means that the parasite density is related to mRDTs positivity. This implies the
inability of RDTs to reliably detect malaria parasites at low parasite densities.
Therefore, it means that the parasite density is directly related to the mRDTs positivity
rate. The result agrees with a study done in Nigeria (Ogunfowokan et al., 2020). It is
assuring to note that the kits with targets to pLDH detecting antigens in addition to
HRP2 performed well compared with only HRP2 antigen detecting kit at low parasite
densities. The RDT kits, particularly with pLDH detecting antigens, can be considered
for use to screen and detect infections with Plasmodium falciparum. These findings
highlight the importance of treating patients with low-density malaria parasiteamia and
support interventions addressed to eliminate submicroscopic infections (Berzosa et al.,
2018).
The discriminating power of RDTs for the detection of malaria was further
investigated by the area under the receiver operative characteristics (ROC). It was
found that RDT (area under the diagnostic curve –AUC: HRP2 0.9008 and
HRP2/pLDH 0.8972) was more effective in predicting malaria infection, This is in

59
agreement with the work of (Djimde et al., 2016) in Mali, mRDT which recorded a
higher area under the curve ROC curve 0.97.
The implication of this study findings is that these mRDTs are not able to detect
parasites below 80 parasites/µl of blood. This might lead to delay in treatment which
might result to death especially in children under 5 years and pregnant women. The
good agreement between the tests obtained can be attributed to the high malaria
endemic zone where the study took place. Although mRDTs are used as diagnostic
methods, personnel working in the laboratory should never abandon microscopy
because it is the gold standard in endemic areas. Besides, microscopy allows the
calculation of parasitic densities, identifying all species and is cheaper than other
methods.
5.3 Factors affecting the performance of malaria rapid diagnostic tests
It is widely established that the key factor in improving the diagnosis of malaria is the
availability of mRDTs in health facilities. This study found that rapid diagnostic kits
were available in 39.4% of the health facilities this was higher than a study done in
Enugu state where 31% of health facilities had mRDTs and lower than a study done in
Ogun state that reported mRDTs was available in 50.7% of the health facilities(Boyce
et al., 2017). This, however, is less than the WHO average availability which is said
to be inadequate if it falls below76%. Stock out of testing commodities can be due to
erratic supplies from KEMSA, improper documentation and reporting of quantity used
and probably due to inadequate information needed during the forecasting and
quantification period. Planning to have adequate stock, especially over the peak
transmission period, is vital to preventing stock-outs. Liaison with the Sub County
medical laboratory officer is crucial to ensure a steady stream of stock replacement.

60
The manufacturer's recommendations for storage of mRDTs are 2oc to 30oc
(Diagnostic package insert). The study revealed that effective storage was at 50.0%,
which means that temperature monitoring and storage conditions were not effectively
monitored. Poor storage is basically due to the different level of health care systems.
The primary level is not able to offer the expected storage conditions for the mRDTs
and this can only be achieved in level 2 health care. Like other biological tests that rely
on antibody-antigen interactions, current malaria RDTs deteriorate more quickly on
exposure to moisture (humidity) and high temperature. Poor storage might interfere
with the integrity of the test kits leading to the poor performance of the mRDTs.
Increases in temperatures above 30oc can affect the overall performance of mRDTs.
Therefore it, becomes important that room temperatures are maintained below 30oc,
and temperature monitoring is taking place regularly in the mRDTs storage room of
all the health facilities and community testing. Those rooms that exceed temperatures
of 30oc should be cooled with air conditioning or similar cooling equipment, this being
dependent on financial resources available to local health authorities in the study Sub
County, this agrees with the study done by Moody (Obeagu et al., 2018).
There was huge uncertainty in the quality control and accuracy of mRDTs by end-
users. The study revealed that health care workers did not use positive control for wells
for external quality control, and the test kit verification was not being done and there
was no proficiency testing in place for health care workers. The health facilities
depends on the inbuilt internal quality control. It is important to consider the use of
positive control wells and temperature monitoring to assure the quality of the rdts and
to build the confidence of the users on mRDT (Bell et al., 2017). Discrepancies
between microscopy results and end-user findings on mRDTs are a concern. The
discrepancies point to two challenges, either the test kits were not working, or the end-

61
user was not using the kits correctly, as reported by Rennie and Moonasar (Boyce,
2017). Adherence to the standard operating procedures was below the expected
performance target which 100 % and this contributes to the low performance of
mRDTs.
Another factor influencing mRDTs utilization and performance found in this study
was training. This is similar to previous studies that showed that training of health care
workers on mRDTs improves health care workers performance with increased likely
hood of adherence to malaria treatment guidelines (Opoku, 2018). External training
was not being conducted for the end-users regularly as expected. On job training also
was not based on the standard operating procedures using standardized materials and
methods. There is also uncertainty on the quality of existing on the job training for
mRDTs because even the supervisors had not been refreshed. Various studies have
documented significant variation between end-users in both preparation and
interpretation (Boyce et al., 2017; Harvey et al., 2017; Mathison et al., 2017). A
standardized training guide for on job training may need to be considered (Kosack et
al., 2017). Although package inserts are useful, it would be easier for end-users to have
bench job aids so that the test procedures can be easily visible and interpretation of
results easily read, especially during busy periods and late in the night. Preparation
and interpretation can also be affected by manual dexterity, visual acuity and available
lighting. To perform the tests in a realistic test environment the training and previous
experience of the end-users is necessary. The uncertainly about the skills of use of
mRDTs from both the health facilities users and the community health volunteers is a
cause for concern. Proficiency testing should be considered to evaluate the skills of the
end-users of mRDTs scientifically.

62
The key challenges for malaria mRDTs in the health facilities are frequent stock-outs,
the accuracy of the kit, the proficiency of the end-user, and quality control to ensure
that the kits are working well to monitor the diagnostic performance. This conquers
with a study done in Zamfara State on predators of malaria rapid diagnostic tests
utilization among the health care workers (Usman et al., 2018). The implication of this
finding that it may lead to misdiagnosis which might delay treatment and in worse
cases it might lead to death.

63
CHAPTER SIX
6.0 CONCLUSION AND RECOMMENDATION
6.1 Conclusion
(i) The study showed that both HRP2 and HRP2/pLDH mRDTs kits had equal
sensitivity, while the difference in specificity between the two was deemed
insignificant. The HRP2 mRDT had a higher positive and negative
predictive value compared to HRP2/pLDH mRDTs, even though the
mRDTs gave an acceptable agreement with the reference test method.
(ii) The quantitative limit of parasite density cut off points for both HRP2 and
HRP2/pLDH mRDTs was at 80 parasites/µl of blood.
(iii) Factors affecting the performance of mRDTs in Seme Sub County included
unsatisfactory storage, inadequate training for health care workers, and
failure to adhere to standard operating procedures and lack of quality
assurance schemes.
6.2 Recommendation
(i) The study recommends the improvement of the HRP2 based mRDTs to be
done by incorporating other antigens such as Aldolase and plasmodium
lactate dehydrogenase to improve their sensitivity and specificity.
(ii) The study recommends that mRDTs should not be used in low parasite
density endemic zones this is because they are unable to detect low
parasiteamia level.
(iii) Temperature monitoring of the storage areas for MRDTs, regular training
of staff, quality assurance measures and proficiency testing is
64
recommended to ensure that quality results is obtained when mRDTs is
used for malaria diagnosis.
6.2.1 Recommendations for action
(i) We recommend scaling up malaria microscopy diagnostic sites and data on
diagnostic performance of mRDTs test kits is important information to
guide in diagnostic tool selection by the national malaria control programs.
(ii) Evaluation of factors affecting the performance of rapid diagnostic test
needs to be done frequently to ensure that the necessary conditions required
for the effective performance of the RDTs are in place.
(iii) The study recommends provision of proficiency samples panels to be
provided to the mRDTs end users quarterly to assess the competency of the
health care workers.
6.2.2 Recommendation for further research
(i) After the supplying of mRDT from Kenya medical supplies urgency in
health facilities, subsequent studies should be done on their impact and
cost-effectiveness in providing quality diagnosis at the point of care where
these mRDTs are used.
(ii) There is need of further studies on the factors influencing the effective use
of mRDTs and the ways to improve the use of mRDTs are needed in
different areas where RDTs are used.
(iii) The study recommends determination of genetic variation to detect the
existence of hrp2 gene deletion type of plasmodium parasites which cannot
be detected by HRP2 based mRDTs.

65
REFERENCES
Abbas, N., Saba, T., Rehman, A., Mehmood, Z., Kolivand, H., Uddin, M., & Anjum,
A. (2019). Plasmodium life cycle stage classification based quantification of
malaria parasitaemia in thin blood smears. Microscopy research and technique,
82(3), 283-295.
Abdalla, Z. A., Rahma, N. A., Hassan, E. E., Abdallah, T. M., Hamad, H. E., Omer, S.
A., & Adam, I. (2019). The diagnostic performance of rapid diagnostic tests
and microscopy for malaria diagnosis in eastern Sudan using a nested
polymerase chain reaction assay as a reference standard. Transactions of The
Royal Society of Tropical Medicine and Hygiene, 113(11), 701-705.
Adu-Gyasi, D., Asante, K. P., Amoako, S., Amoako, N., Ankrah, L., Dosoo, D., . . .
Amenga-Etego, S. (2018). Assessing the performance of only HRP2 and HRP2
with pLDH based rapid diagnostic tests for the diagnosis of malaria in middle
Ghana, Africa. PloS one, 13(9), e0203524.
Agaba, B. B., Yeka, A., Nsobya, S., Arinaitwe, E., Nankabirwa, J., Opigo, J., . . .
Karamagi, C. (2019). Systematic review of the status of pfhrp2 and pfhrp3 gene
deletion, approaches and methods used for its estimation and reporting in
Plasmodium falciparum populations in Africa: review of published studies
2010–2019. Malaria journal, 18(1), 1-10.
Agbenyega, T. (2019). Malaria Control in Africa: The Story So Far.
Al-Awadhi, M., Ahmad, S., & Iqbal, J. (2021). Current Status and the Epidemiology
of Malaria in the Middle East Region and Beyond. Microorganisms, 9(2), 338.
Alnasser, Y., Ferradas, C., Clark, T., Calderon, M., Gurbillon, A., Gamboa, D., . . .
Sullivan, D. J. (2016). Colorimetric detection of Plasmodium vivax in urine
using MSP10 oligonucleotides and gold nanoparticles. PLoS neglected tropical
diseases, 10(10), e0005029.
Amoah, L. E., Abankwa, J., & Oppong, A. (2016). Plasmodium falciparum histidine
rich protein-2 diversity and the implications for PfHRP 2: based malaria rapid
diagnostic tests in Ghana. Malaria journal, 15(1), 101.
Amoah, L. E., Donu, D., Abuaku, B., Ahorlu, C., Arhinful, D., Afari, E., . . . Koram,
K. A. (2019). Probing the composition of Plasmodium species contained in
malaria infections in the Eastern region of Ghana. BMC public health, 19(1),
1617.
Ayogu, E. E. (2017). Evaluation of Malaria Diagnostic Methods, Efficacy of
Artemether-Lumefantrine Therapy and Genetic Determinants of Plasmodium
Falciparum Resistance.
Badrick, T. (2013). Evidence-based laboratory medicine. The Clinical Biochemist
Reviews, 34(2), 43.
Baum, E., Sattabongkot, J., Sirichaisinthop, J., Kiattibutr, K., Davies, D. H., Jain, A.,
. . . Molina, D. M. (2015). Submicroscopic and asymptomatic Plasmodium
falciparum and Plasmodium vivax infections are common in western Thailand-
molecular and serological evidence. Malaria journal, 14(1), 95.

66
Beisel, U., Umlauf, R., Hutchinson, E., & Chandler, C. I. (2016). The complexities of
simple technologies: re-imagining the role of rapid diagnostic tests in malaria
control efforts. Malaria journal, 15(1), 1-9.
Bell, D., Bwanika, J. B., Cunningham, J., Gatton, M., González, I. J., Hopkins, H., . .
. Ndawula, B. (2017). Prototype positive control wells for malaria rapid
diagnostic tests: Prospective evaluation of implementation among health
workers in Lao People's Democratic Republic and Uganda. The American
journal of tropical medicine and hygiene, 96(2), 319-329.
Berhane, A., Anderson, K., Mihreteab, S., Gresty, K., Rogier, E., Mohamed, S., . . .
Zehaie, A. (2018). Major threat to malaria control programs by Plasmodium
falciparum lacking histidine-rich protein 2, Eritrea. Emerging infectious
diseases, 24(3), 462.
Berhane, A., Russom, M., Bahta, I., Hagos, F., Ghirmai, M., & Uqubay, S. (2017).
Rapid diagnostic tests failing to detect Plasmodium falciparum infections in
Eritrea: an investigation of reported false negative RDT results. Malaria
journal, 16(1), 1-6.
Berthod, D., Rochat, J., Voumard, R., Rochat, L., Genton, B., & D’Acremont, V.
(2017). Self-diagnosis of malaria by travellers: a cohort study on the use of
malaria rapid diagnostic tests provided by a Swiss travel clinic. Malaria
journal, 16(1), 1-8.
Berzosa, P., de Lucio, A., Romay-Barja, M., Herrador, Z., González, V., García, L., .
. . Valladares, B. (2018). Comparison of three diagnostic methods (microscopy,
RDT, and PCR) for the detection of malaria parasites in representative samples
from Equatorial Guinea. Malaria journal, 17(1), 333.
Beshir, K. B., Sepúlveda, N., Bharmal, J., Robinson, A., Mwanguzi, J., Busula, A. O.,
. . . Hopkins, H. (2017). Plasmodium falciparum parasites with histidine-rich
protein 2 (pfhrp2) and pfhrp3 gene deletions in two endemic regions of Kenya.
Scientific reports, 7(1), 1-10.
Bosco, A. B., Nankabirwa, J. I., Yeka, A., Nsobya, S., Gresty, K., Anderson, K., . . .
Opigo, J. (2020). Limitations of rapid diagnostic tests in malaria surveys in
areas with varied transmission intensity in Uganda 2017-2019: Implications for
selection and use of HRP2 RDTs. PloS one, 15(12), e0244457.
Bosoka, S. A., Adjuik, M., Takramah, W., Tarkang, E., & Kweku, M. (2017).
Performance Evaluation of Laboratory Professionals on Malaria Microscopy
in the Volta Region of Ghana. Journal of Public Health, 2(1), 11-22.
Boyce, M. R. (2017). Use and Limitations of Malaria Rapid Diagnostic Testing in
Sub-Saharan Africa. Duke University,
Boyce, M. R., & O’Meara, W. P. (2017). Use of malaria RDTs in various health
contexts across sub-Saharan Africa: a systematic review. BMC public health,
17(1), 1-15.
Briand, V., Cottrell, G., Ndam, N. T., Martiáñez–Vendrell, X., Vianou, B., Mama, A.,
. . . Gbaguidi, E. (2020). Correction to: Prevalence and clinical impact of
malaria infections detected with a highly sensitive HRP2 rapid diagnostic test
in Beninese pregnant women. Malaria journal, 19(1), 1-2.

67
Cheng, Q., Gatton, M. L., Barnwell, J., Chiodini, P., McCarthy, J., Bell, D., &
Cunningham, J. (2014). Plasmodium falciparum parasites lacking histidine-
rich protein 2 and 3: a review and recommendations for accurate reporting.
Malaria journal, 13(1), 1-8.
Chin, A. C., Christenson, R. H., & Kahn, S. E. (2020). Evidence-based laboratory
medicine. In Contemporary Practice in Clinical Chemistry (pp. 265-288):
Elsevier.
Cowman, A. F., Healer, J., Marapana, D., & Marsh, K. (2016). Malaria: biology and
disease. Cell, 167(3), 610-624.
Dalrymple, U., Arambepola, R., Gething, P. W., & Cameron, E. (2018a). How long
do rapid diagnostic tests remain positive after anti-malarial treatment? Malaria
journal, 17(1), 1-13.
Dalrymple, U., Arambepola, R., Gething, P. W., & Cameron, E. (2018b). How long
do rapid diagnostic tests remain positive after anti-malarial treatment? Malaria
journal, 17(1), 228.
Dalrymple, U., Cameron, E., Bhatt, S., Weiss, D. J., Gupta, S., & Gething, P. W.
(2017). Quantifying the contribution of Plasmodium falciparum malaria to
febrile illness amongst African children. Elife, 6, e29198.
Das, D. K., Mukherjee, R., & Chakraborty, C. (2015). Computational microscopic
imaging for malaria parasite detection: a systematic review. Journal of
microscopy, 260(1), 1-19.
Dayanand, K. K., Kishore, P., Chandrashekar, V., Achur, R. N., Ghosh, S. K.,
Kakkilaya, S. B., . . . Devi, R. (2019). Malaria Severity in Mangaluru City in
the Southwestern Coastal Region of India. The American journal of tropical
medicine and hygiene, 100(2), 275-279.
De Koninck, A.-S., Cnops, L., Hofmans, M., Jacobs, J., Van den Bossche, D., &
Philippé, J. (2017). Diagnostic performance of the loop-mediated isothermal
amplification (LAMP) based illumigene® malaria assay in a non-endemic
region. Malaria journal, 16(1), 418.
De Oliveira, A. M., Skarbinski, J., Ouma, P. O., Kariuki, S., Barnwell, J. W., Otieno,
K., . . . Akhwale, W. S. (2009). Performance of malaria rapid diagnostic tests
as part of routine malaria case management in Kenya. The American journal
of tropical medicine and hygiene, 80(3), 470-474.
Di Gennaro, F., Marotta, C., Locantore, P., Pizzol, D., & Putoto, G. (2020). Malaria
and COVID-19: Common and different findings. Tropical medicine and
infectious disease, 5(3), 141.
Djimde, A. A., Maiga, H., Sagara, I., Traore, K., Niangaly, H., Bamadio, A., . . . Kodio,
A. (2016). Field assessment of SD bioline malaria species antigen detection by
rapid diagnostic tests in Mali. Journal of Parasitology and Vector Biology,
8(1), 1-9.
Echodu, R., Oyet, W. S., Iwiru, T., Apili, F., Lutwama, J. J., Opiyo, E. A., & Otim, O.
(2020). Household Predictors of Incidence of Malaria in Northern Uganda: Its
Implication for Future Malaria Control.

68
Ezekiel, O. Z. (2019). Comparison of malaria rapid diagnostic tests at health facilities
and community level in siaya county kenya. Kenyatta University,
Ezeudu, C., Ebenebe, J., Ugochukwu, E., Chukwuka, J., Amilo, G., & Okorie, O.
(2015). The performance of an histidine rich protein-2 rapid diagnostic test
(RDT) against the standard microscopy in the diagnosis of malaria
parasitaemia among febrile under-five children at Nnewi. Nigerian Journal of
Paediatrics, 42(1), 59-63.
Falade, C. O., Ajayi, I. O., Nsungwa-Sabiiti, J., Siribié, M., Diarra, A., Sermé, L., . . .
Jegede, A. S. (2016). Malaria rapid diagnostic tests and malaria microscopy for
guiding malaria treatment of uncomplicated fevers in Nigeria and prereferral
cases in 3 African countries. Clinical infectious diseases, 63(suppl_5), S290-
S297.
Feleke, D. G., Tarko, S., & Hadush, H. (2017). Performance comparison of
CareStart™ HRP2/pLDH combo rapid malaria test with light microscopy in
north-western Tigray, Ethiopia: a cross-sectional study. BMC infectious
diseases, 17(1), 399.
Gatton, M. L., Chaudhry, A., Glenn, J., Wilson, S., Ah, Y., Kong, A., . . . Incardona,
S. (2020). Impact of Plasmodium falciparum gene deletions on malaria rapid
diagnostic test performance. Malaria journal, 19(1), 1-11.
Gendrot, M., Fawaz, R., Dormoi, J., Madamet, M., & Pradines, B. (2019). Genetic
diversity and deletion of Plasmodium falciparum histidine-rich protein 2 and
3: a threat to diagnosis of P. falciparum malaria. Clinical Microbiology and
Infection, 25(5), 580-585.
Gillet, P., Mori, M., Van Esbroeck, M., Van den Ende, J., & Jacobs, J. (2009).
Assessment of the prozone effect in malaria rapid diagnostic tests. Malaria
journal, 8(1), 1-7.
Githinji, S., Oyando, R., Malinga, J., Ejersa, W., Soti, D., Rono, J., . . . Noor, A. M.
(2017). Completeness of malaria indicator data reporting via the District Health
Information Software 2 in Kenya, 2011–2015. Malaria journal, 16(1), 344.
Grigg, M. J., William, T., Barber, B. E., Parameswaran, U., Bird, E., Piera, K., . . .
Anstey, N. M. (2014). Combining parasite lactate dehydrogenase-based and
histidine-rich protein 2-based rapid tests to improve specificity for diagnosis
of malaria due to Plasmodium knowlesi and other Plasmodium species in
Sabah, Malaysia. Journal of clinical microbiology, 52(6), 2053-2060.
Grignard, L., Nolder, D., Sepúlveda, N., Berhane, A., Mihreteab, S., Kaaya, R., . . .
Campino, S. (2020). A novel multiplex qPCR assay for detection of
Plasmodium falciparum with histidine-rich protein 2 and 3 (pfhrp2 and pfhrp3)
deletions in polyclonal infections. EBioMedicine, 55, 102757.
Haakenstad, A., Harle, A. C., Tsakalos, G., Micah, A. E., Tao, T., Anjomshoa, M., . .
. Mestrovic, T. (2019). Tracking spending on malaria by source in 106
countries, 2000–16: an economic modelling study. The Lancet infectious
diseases, 19(7), 703-716.

69
Haider, F., Ahmad, S., Ansari, A., & Singh, M. (2020). Diagnostic performance of
rapid diagnostic test (RDT) and enzyme-linked immunosorbent Assay
(ELISA) in comparison with microscopy, for Malaria.
Harvey, S. A., Incardona, S., Martin, N., Lussiana, C., Streat, E., Dolan, S., . . .
Nakanwagi, G. (2017). Quality issues with malaria rapid diagnostic test
accessories and buffer packaging: findings from a 5-country private sector
project in Africa. Malaria journal, 16(1), 1-9.
Howick, V. M., Russell, A. J., Andrews, T., Heaton, H., Reid, A. J., Natarajan, K., . .
. Rayner, J. C. (2019). The Malaria Cell Atlas: Single parasite transcriptomes
across the complete Plasmodium life cycle. Science, 365(6455).
Ifeorah, I. K., Brown, B. J., & Sodeinde, O. O. (2017). A comparison of rapid
diagnostic testing (by Plasmodium lactate dehydrogenase), and quantitative
buffy coat technique in malaria diagnosis in children. African journal of
infectious diseases, 11(2), 31-38.
Imwong, M., Stepniewska, K., Tripura, R., Peto, T. J., Lwin, K. M., Vihokhern, B., . .
. Snounou, G. (2016). Numerical distributions of parasite densities during
asymptomatic malaria. The Journal of infectious diseases, 213(8), 1322-1329.
Israel, G. D. (1992). Determining sample size.
Jan, Z., Khan, A., Sajjad, M., Muhammad, K., Rho, S., & Mehmood, I. (2018). A
review on automated diagnosis of malaria parasite in microscopic blood smears
images. Multimedia Tools and Applications, 77(8), 9801-9826.
Jang, J. W., Cho, C. H., Han, E. T., An, S. S. A., & Lim, C. S. (2013). pLDH level of
clinically isolated Plasmodium vivax and detection limit of pLDH based
malaria rapid diagnostic test. Malaria journal, 12(1), 181.
Jenkins, R., Othieno, C., Ongeri, L., Sifuna, P., Ongecha, M., Kingora, J., . . . Ogutu,
B. (2015). Common mental disorder in Nyanza province, Kenya in 2013 and
its associated risk factors–an assessment of change since 2004, using a repeat
household survey in a demographic surveillance site. BMC psychiatry, 15(1),
1-12.
Jiram, A. I., Ooi, C. H., Rubio, J. M., Hisam, S., Karnan, G., Sukor, N. M., . . . Alias,
N. W. (2019). Evidence of asymptomatic submicroscopic malaria in low
transmission areas in Belaga district, Kapit division, Sarawak, Malaysia.
Malaria journal, 18(1), 1-12.
Kane, N. F. (2019). Effect of extracts of Artemisia afra collected from five different
regions in Africa (Kenya, Burundi, Tanzania, South Africa and Senegal) on in
vitro and in vivo cultures of Plasmodium Species. Pan African University,
Kang, J.-M., Cho, P.-Y., Moe, M., Lee, J., Jun, H., Lee, H.-W., . . . Myint, M. K.
(2017). Comparison of the diagnostic performance of microscopic examination
with nested polymerase chain reaction for optimum malaria diagnosis in Upper
Myanmar. Malaria journal, 16(1), 1-8.
Kapesa, A., Kweka, E. J., Atieli, H., Afrane, Y. A., Kamugisha, E., Lee, M.-C., . . .
Yan, G. (2018). The current malaria morbidity and mortality in different
transmission settings in Western Kenya. PloS one, 13(8), e0202031.

70
Kashif, A. H., Adam, G. K., Mohmmed, A. A., Elzaki, S. E., AbdelHalim, A. M., &
Adam, I. (2013). Reliability of rapid diagnostic test for diagnosing peripheral
and placental malaria in an area of unstable malaria transmission in Eastern
Sudan. Diagnostic pathology, 8(1), 59.
Kirinyet, J. (2019). An Assessment of Malaria Parasite Density among HIV/AIDS-
Subjects at Different Levels of CD4 T-Cells Prior to Antimalarial Therapy at
Chulaimbo Sub-County Hospital, Western Kenya. Journal of tropical
medicine, 2019.
Kosack, C. S., Page, A.-L., & Klatser, P. R. (2017). A guide to aid the selection of
diagnostic tests. Bulletin of the World Health Organization, 95(9), 639.
Kozycki, C. T., Umulisa, N., Rulisa, S., Mwikarago, E. I., Musabyimana, J. P.,
Habimana, J. P., . . . Krogstad, D. J. (2017a). False-negative malaria rapid
diagnostic tests in Rwanda: impact of Plasmodium falciparum isolates lacking
hrp2 and declining malaria transmission. Malaria journal, 16(1), 123.
Kozycki, C. T., Umulisa, N., Rulisa, S., Mwikarago, E. I., Musabyimana, J. P.,
Habimana, J. P., . . . Krogstad, D. J. (2017b). False-negative malaria rapid
diagnostic tests in Rwanda: impact of Plasmodium falciparum isolates lacking
hrp2 and declining malaria transmission. Malaria journal, 16(1), 1-11.
Krampa, F. D., Aniweh, Y., Awandare, G. A., & Kanyong, P. (2017). Recent progress
in the development of diagnostic tests for malaria. Diagnostics, 7(3), 54.
Krause, R. G., & Goldring, J. D. (2018). Phosphoethanolamine-N-methyltransferase
is a potential biomarker for the diagnosis of P. knowlesi and P. falciparum
malaria. Plos one, 13(3), e0193833.
Kumar, M., Skillman, K., & Duraisingh, M. T. (2020). Linking nutrient sensing and
gene expression in Plasmodium falciparum blood‐stage parasites. Molecular
Microbiology.
Lavelle, A. (2018). Introduction to Part IV: The Party Under Beazley (1996–2001)—
Another Step to the Right. In Opposition Vanishing (pp. 173-183): Springer.
Law, M. C., & MacDermid, J. (2008). Evidence-based rehabilitation: A guide to
practice: Slack Incorporated.
Lee, H., Halverson, S., & Ezinwa, N. (2018). Mosquito-borne diseases. Primary Care:
Clinics in Office Practice, 45(3), 393-407.
Luzolo, A. L., & Ngoyi, D. M. (2019). Cerebral malaria. Brain research bulletin, 145,
53-58.
Maran, S. R., Fleck, K., Monteiro-Teles, N. M., Isebe, T., Walrad, P., Jeffers, V., . . .
Moretti, N. (2021). Protein acetylation in the critical biological processes in
protozoan parasites. Trends in Parasitology.
Mathison, B. A., & Pritt, B. S. (2017). Update on malaria diagnostics and test
utilization. Journal of clinical microbiology, 55(7), 2009-2017.

71
Mfuh, K. O., Achonduh-Atijegbe, O. A., Bekindaka, O. N., Esemu, L. F., Mbakop, C.
D., Gandhi, K., . . . Nerurkar, V. R. (2019). A comparison of thick-film
microscopy, rapid diagnostic test, and polymerase chain reaction for accurate
diagnosis of Plasmodium falciparum malaria. Malaria journal, 18(1), 73.
Mouatcho, J. C., & Goldring, J. D. (2013). Malaria rapid diagnostic tests: challenges
and prospects. Journal of medical microbiology, 62(10), 1491-1505.
Mukkala, A. N., Kwan, J., Lau, R., Harris, D., Kain, D., & Boggild, A. K. (2018). An
update on malaria rapid diagnostic tests. Current infectious disease reports,
20(12), 49.
Mukry, S. N., Saud, M., Sufaida, G., Shaikh, K., Naz, A., & Shamsi, T. S. (2017).
Laboratory diagnosis of malaria: comparison of manual and automated
diagnostic tests. Canadian Journal of Infectious Diseases and Medical
Microbiology, 2017.
Nderu, D., Kimani, F., Thiong'o, K., Akinyi, M., Karanja, E., Meyer, C. G., & Velavan,
T. P. (2018). PfHRP2-PfHRP3 diversity among Kenyan isolates and
comparative evaluation of PfHRP2/pLDH malaria RDT with microscopy and
nested PCR methodologies. Parasitology international, 67(6), 793-799.
Ndunda, T. M. (2019). Prevalence of Transfusion Transmitted Malaria Among Blood
Donors and Evaluation of CarestartTM and Quantitative Buffy Coat
Methodologies at Kenyatta National Hospital, Kenya. JKUAT-COHES,
Nijhuis, R., Van Lieshout, L., Verweij, J., Claas, E., & Wessels, E. (2018). Multiplex
real-time PCR for diagnosing malaria in a non-endemic setting: a prospective
comparison to conventional methods. European Journal of Clinical
Microbiology & Infectious Diseases, 37(12), 2323-2329.
Nyataya, J., Waitumbi, J., Mobegi, V. A., Noreddin, A., & El Zowalaty, M. E. (2020).
Plasmodium falciparum Histidine-Rich Protein 2 and 3 Gene Deletions and
Their Implications in Malaria Control. Diseases, 8(2), 15.
Obeagu, E., Chijioke, U., & Ekelozie, I. (2018). Malaria rapid diagnostic test (RDTs).
Ann Clin Lab Res, 6(4), 275.
Ogunfowokan, O., Ogunfowokan, B. A., & Nwajei, A. I. (2020). Sensitivity and
specificity of malaria rapid diagnostic test (mRDT CareStatTM) compared
with microscopy amongst under five children attending a primary care clinic
in southern Nigeria. African Journal of Primary Health Care & Family
Medicine, 12(1), 1-8.
Okiro, E. A., Joseph, N. K., Gitonga, C. W., & Snow, R. W. (2020). Anaemia among
Kenyan children: a call for improved monitoring and intervention in school-
aged children. Transactions of the Royal Society of Tropical Medicine and
Hygiene, 114(8), 627-631.
Oleribe, O. O., Osita-Oleribe, P., Ekom, E., Ofem, O., Igwesi, C., Chigozie, O. G., . .
. Taylor-Robinson, S. D. (2017). Is malaria over-diagnosed? A world malaria
day 2017 experience by Excellence and Friends Management Care Centre
(EFMC) and partners, Abuja Nigeria. The Pan African Medical Journal, 28.

72
Opoku, R. (2018). Assessment of Factors Influencing the Use of Malaria Rapid
Diagnostic Test in Health Facilities in Obuasi, Ghana. University of Ghana,
Organization, W. H. (2016). World malaria report 2015: World Health Organization.
Parpia, A. S., Ndeffo-Mbah, M. L., Wenzel, N. S., & Galvani, A. P. (2016). Effects of
response to 2014–2015 Ebola outbreak on deaths from malaria, HIV/AIDS,
and tuberculosis, West Africa. Emerging infectious diseases, 22(3), 433.
Paul, K. B., Kumar, S., Tripathy, S., Vanjari, S. R. K., Singh, V., & Singh, S. G. (2016).
A highly sensitive self assembled monolayer modified copper doped zinc oxide
nanofiber interface for detection of Plasmodium falciparum histidine-rich
protein-2: Targeted towards rapid, early diagnosis of malaria. Biosensors and
Bioelectronics, 80, 39-46.
Plewes, K., Turner, G. D., & Dondorp, A. M. (2018). Pathophysiology, clinical
presentation, and treatment of coma and acute kidney injury complicating
falciparum malaria. Current opinion in infectious diseases, 31(1), 69.
Plucinski, M. M., Rogier, E., Dimbu, P. R., Fortes, F., Halsey, E. S., Aidoo, M., &
Smith, T. (2019). Performance of antigen concentration thresholds for
attributing fever to malaria among outpatients in Angola. Journal of clinical
microbiology, 57(3).
Price, C. P. (2012). Evidence-based laboratory medicine: is it working in practice? The
Clinical Biochemist Reviews, 33(1), 13.
Ravenhall, M., Campino, S., Sepúlveda, N., Manjurano, A., Nadjm, B., Mtove, G., . .
. Reyburn, H. (2018). Novel genetic polymorphisms associated with severe
malaria and under selective pressure in North-eastern Tanzania. PLoS genetics,
14(1), e1007172.
Recht, J., Ashley, E. A., & White, N. J. (2018). Use of primaquine and glucose-6-
phosphate dehydrogenase deficiency testing: divergent policies and practices
in malaria endemic countries. PLoS neglected tropical diseases, 12(4),
e0006230.
Recht, J., Siqueira, A. M., Monteiro, W. M., Herrera, S. M., Herrera, S., & Lacerda,
M. V. (2017). Malaria in Brazil, Colombia, Peru and Venezuela: current
challenges in malaria control and elimination. Malaria journal, 16(1), 1-18.
Rénia, L., & Goh, Y. S. (2016). Malaria parasites: the great escape. Frontiers in
immunology, 7, 463.
Reyburn, H., Mbakilwa, H., Mwangi, R., Mwerinde, O., Olomi, R., Drakeley, C., &
Whitty, C. J. (2007). Rapid diagnostic tests compared with malaria microscopy
for guiding outpatient treatment of febrile illness in Tanzania: randomised trial.
Bmj, 334(7590), 403.
Rocamora, F., Zhu, L., Liong, K. Y., Dondorp, A., Miotto, O., Mok, S., & Bozdech,
Z. (2018). Oxidative stress and protein damage responses mediate artemisinin
resistance in malaria parasites. PLoS pathogens, 14(3), e1006930.

73
Rock, E., Marsh, K., Saul, A., Wellems, T., Taylor, D. W., Maloy, W., & Howard, R.
(1987). Comparative analysis of the Plasmodium falciparum histidine-rich
proteins HRP-I, HRP-II and HRP-III in malaria parasites of diverse origin.
Parasitology, 95(2), 209-227.
Rudd, K. E., Seymour, C. W., Aluisio, A. R., Augustin, M. E., Bagenda, D. S., Beane,
A., . . . Day, N. P. (2018). Association of the quick sequential (sepsis-related)
organ failure assessment (qSOFA) score with excess hospital mortality in
adults with suspected infection in low-and middle-income countries. Jama,
319(21), 2202-2211.
Seydel, K. B., Kampondeni, S. D., Valim, C., Potchen, M. J., Milner, D. A., Muwalo,
F. W., . . . Glover, S. J. (2015). Brain swelling and death in children with
cerebral malaria. New England Journal of Medicine, 372(12), 1126-1137.
Shago, M. I., Jiyil, M. K., Sani, N. A., & Suleiman, G. (2020). Evaluation of the
Sensitivity of Rapid Diagnostic Test (RDT) of Malaria in Different Age and
Sex Groups Using Microscopy as a Gold Standard. International Journal of
Infectious Diseases and Therapy, 5(3), 99.
Sharma, S., Crawley, A., & O’Kennedy, R. (2017). Strategies for overcoming
challenges for decentralised diagnostics in resource-limited and catastrophe
settings. Expert review of molecular diagnostics, 17(2), 109-118.
Silverstein, M. D., & Boland, B. J. (1994). Conceptual framework for evaluating
laboratory tests: case-finding in ambulatory patients. Clinical chemistry, 40(8),
1621-1627.
Slater, H. C., Ross, A., Felger, I., Hofmann, N. E., Robinson, L., Cook, J., . . . Morris,
U. (2019). The temporal dynamics and infectiousness of subpatent
Plasmodium falciparum infections in relation to parasite density. Nature
communications, 10(1), 1-16.
Soofi, K., Khanjani, N., & Kamiabi, F. (2019). The challenges of the malaria
elimination program in the South East of Iran: a qualitative study. Journal of
arthropod-borne diseases, 13(1), 94.
Sori, G., Zewdie, O., Tadele, G., & Samuel, A. (2018). External quality assessment of
malaria microscopy diagnosis in selected health facilities in Western Oromia,
Ethiopia. Malaria journal, 17(1), 1-7.
Tamiru, A., Boulanger, L., Chang, M. A., Malone, J. L., & Aidoo, M. (2015). Field
assessment of dried Plasmodium falciparum samples for malaria rapid
diagnostic test quality control and proficiency testing in Ethiopia. Malaria
journal, 14(1), 1-8.
Thomas, A., Saroyan, A., & Dauphinee, W. D. (2011). Evidence-based practice: a
review of theoretical assumptions and effectiveness of teaching and assessment
interventions in health professions. Advances in health sciences education,
16(2), 253-276.
Usman, R., Umar, A. A., Gidado, S., Gobir, A. A., Obi, I. F., Ajayi, I., & Ajumobi, O.
(2018). Predictors of malaria Rapid Diagnostic Tests’ utilisation among
healthcare workers in Zamfara State. PloS one, 13(12), e0200856.

74
Vásquez, A. M., Medina, A. C., Tobón-Castaño, A., Posada, M., Vélez, G. J.,
Campillo, A., . . . Ding, X. (2018). Performance of a highly sensitive rapid
diagnostic test (HS-RDT) for detecting malaria in peripheral and placental
blood samples from pregnant women in Colombia. Plos one, 13(8), e0201769.
Venkatesh, A., Patel, S. K., Ray, S., Shastri, J., Chatterjee, G., Kochar, S. K., . . .
Srivastava, S. (2016). Proteomics of Plasmodium vivax malaria: new insights,
progress and potential. Expert Review of Proteomics, 13(8), 771-782.
Verjee, M. A. (2019). Schistosomiasis: Still a cause of significant morbidity and
mortality. Research and reports in tropical medicine, 10, 153.
Wanja, E. W., Kuya, N., Moranga, C., Hickman, M., Johnson, J. D., Moseti, C., . . .
Ohrt, C. (2016a). Field evaluation of diagnostic performance of malaria rapid
diagnostic tests in western Kenya. Malaria journal, 15(1), 1-10.
Wanja, E. W., Kuya, N., Moranga, C., Hickman, M., Johnson, J. D., Moseti, C., . . .
Ohrt, C. (2016b). Field evaluation of diagnostic performance of malaria rapid
diagnostic tests in western Kenya. Malaria journal, 15(1), 456.
Watson, O. J., Sumner, K. M., Janko, M., Goel, V., Winskill, P., Slater, H. C., . . . Parr,
J. B. (2019). False-negative malaria rapid diagnostic test results and their
impact on community-based malaria surveys in sub-Saharan Africa. BMJ
global health, 4(4), e001582.
Weiss, D. J., Lucas, T. C., Nguyen, M., Nandi, A. K., Bisanzio, D., Battle, K. E., . . .
Rozier, J. A. (2019). Mapping the global prevalence, incidence, and mortality
of Plasmodium falciparum, 2000–17: a spatial and temporal modelling study.
The Lancet, 394(10195), 322-331.
Willie, N. (2018). Plasmodium falciparum Histidine-rich Protein 2 Gene Variation
and Malaria Detection in Madagascar and Papua New Guinea. Case Western
Reserve University,
Zambare, K. K., Thalkari, A. B., & Nagesh, S. (2019). A Overview of Etiology, Life
Cycle of Malarial Parasite, Clinical Signs, Diagnosis and Complications. Asian
Journal of Research in Pharmaceutical Science, 9(3).

75
APPENDICES
APPENDIX I: A MAP SHOWING THE STUDY AREA

76
APPENDIX II: Observation and questionnaire Checklist on RDT Assessment
For each step below, circle one if the Health Care worker performed the step
correctly.
Circle two if the health care worker performed the steps incorrectly.
Circle three if the health care worker skipped the step.
Name of the supervisor-----------------------------------------------------Supervisor phone
number------------------------------------------------
Type of health care provider being observed----------------------------Date of
assessment----------------------------------------------------------
No ITEM SCORES
1 Is the staff trained in malaria Rdts in the last two years? 1 2 3
2 Did the facility experience a stock out of malaria rdts for seven or
more consecutive days during the last three months?
1 2 3
3 Are the mRDTs sops and bench aids available? 1 2 3
4 Are the mRDTs sops and bench being used during testing? 1 2 3
5 Does the facility conduct RDT verification exercise? 1 2 3
6 Does the facility use malaria control wells? 1 2 3
7 Is expiry date of the mRDTs checked before use? 1 2 3
8 Is the cassette labeled with patient’s name/id number? 1 2 3
9 Is cassette labeled with date, start and stop time? 1 2 3
10 Patient identified and identification information recorded in
register?
1 2 3
11 glove worn 1 2 3
12 New gloves worn 1 2 3
13 puncture site cleaned with sterile alcohol swab and allowed to air
dry
1 2 3
14 An adequate volume of blood is collected 1 2 3
15 Blood dispensed in correct well of RDT device 1 2 3
16 buffer applied to correct well of RDT device 1 2 3
17 appropriate amount of buffer dispensed into well 1 2 3
18 were the test results positive or negative Pos Ne
g
IN
19 If negative did the worker wait the recommended amount of time
(according to manufacturer’s instruction) to rule out a positive
test result?
1 2 3
20 control line visible 1 2 3
21 Reads test results correctly (supervisor verifies results) 1 2 3
22 Records results correctly in the register 1 2 3
23 Is the storage area well ventilated? 1 2 3
24 Is the storage area having thermometer and temperature
monitoring chart update?
1 2 3

77
APPENDIX III: Consent Form
TITLE: FIELD EVALUATION OF DIAGNOSTIC PERFORMANCE AND
FACTORS AFFECTING MALARIA RAPID DIAGNOSTIC TEST IN SEME,
KISUMU COUNTY
You are welcomed to take in a research study to be conducted by a master’s student
from the university of Masinde Muliro Kakamega campus. You must be a patient
attending the hospital and suspected to have malaria. Participation is voluntary and
you are expected to take enough time to read the information sheet. You area allowed
to discuss with your family members and friends. A copy will be provided for you to
carry home.
AIM OF THE STUDY
The study is evaluating the diagnostic performance and assessing the factors affecting
rapid diagnostic test in Seme Sub County.
If you complete and return this form it will constitute consent to participate in this
research project.
PROCEDURES: The procedure requires you to donate 2mls of venous blood sample.
This will take 5 minutes and it will take place in the hospital as the normal routine
hospital procedures. Injury and harm will be minimize by using a trained phlebotomist.
POTENTIAL BENEFITS TO RESEARCH PARTICIPANTS/OR COMMUNITY
The research will not attract any benefit from your participation nor will the research
provide a benefit to you.
REWARD FOR PARTICIPATION
The study will not attract any financial reward to the research participants
POTENTIAL CONFLICTS OF INTEREST
The investigators of this research do not have any financial interest in the in the
product or commodities being studied.
CONFIDENTIALITY: Any information that is obtained in connection with this study
that can be identified with you will remain confidential and will be disclosed only with
your permission or as required by law. The information collected about you will be
coded using initial numbers (unique identifiers). The data will be stored in the
investigators password protected computer. When results of the research are
published or discusses in scientific conferences, Information about the participants
will not be revealed.

78
PARTICIPATION AND WITHDRAWAL: Participation is voluntary and You can
choose whether to be part in this study or not, if you volunteer to be in this study, you
may withdraw at any time without consequences of any kind or investigator may
withdraw you from this research if circumstances arise which warrant doing so.
ALTERNATIVES TO PARTICIPATION: Your alternative to participation is not to
participate.
RIGHTS OF RESEARCH SUBJECTS You may withdraw your consent at any time
and discontinue participation without penalty. You are not waiving any legal claims,
rights or remedies because of your participation in this research study. If you have
any questions about your rights in the study. Consult [email protected]
(0722477839)
IDENTIFICATION OF INVESTIGATORS: If you have any questions or concern
about the research, please feel free to contact the investigator and the faculty advisor
Masters candidate Faculty advisor
CELLINE ATIENO OKUTA Dr. CHRISTINE WANJALA
P.O.BOX 60 KOMBEWA MASINDE MULIRO UNIVERSITYOF
SCIENCE AND TECHNOLOGY
[email protected] MEDICAL LABORATORY SCIENCES DEPT
0722477839 [email protected]
0724593853
If you have any questions concerning your rights as a research participant call The
Secretary/Chairperson MMUST – IERC Tel:056-31375 , Email [email protected]

79
APPENDIX IV: Minor Assent Document
Research Title: FIELD EVALUATION OF DIAGNOSTIC PERFORMANCE
AND FACTORS AFFECTING MALARIA RAPID DIAGNOSTIC TEST IN
SEME, KISUMU COUNTY
Investigator: CELLINE ATIENO OKUTA
We are doing a research study about field evaluation of diagnostic performance and
factors affecting rapid diagnostic tests kits commonly used in the Sub County. The
importance of a research is to gives us more information about the target population.
Procedure, if you opt to be part of this study, you will be expected to donate 2mls of
venous blood sample. The procedure will take 5 minutes in the health facility as part
of the normal routine health facility procedures.
Danger and pain, there will be no harm and pain involved, however a trained
phlebotomist will be used to minimize the risks. Little pain may be felt during
sample collection.
This study will not offer any direct benefit, however the results will benefit the entire
community because it will inform the policy makes on the most appropriate diagnostic
tool to use. A benefit means that something good happens.
Voluntary participation. If you opt out of this research study, you are allowed to
withdraw and only benefit from the normal routine medical services that brought you
to the hospital. This study is voluntary and you are not forced to be in it if you don’t
want to. You are allowed to drop at any stage. Your parents have been notified about
the study too.
The report of the study and lessons learnt will be documented. This report will not
reveal your identity or your role in the study.
Please sign your name if you accept to participate in the study.
I, _________________________________, want to be in this research study.
Signature ___________________________________ Date ______
For any question or concerns or complain if not treated well as a research
participant please call, The Secretary/Chairperson MMUST – IERC Tel:056-31375
Email [email protected]

80
APPENDIX V: Statement of Intent to Maintain Confidentiality
Title: FIELD EVALUATION OF DIAGNOSTIC PERFORMANCE AND
FACTORS AFFECTING MALARIA RAPID DIAGNOSTIC TEST IN SEME,
KISUMU COUNTY
Research staff
As a research assistant and a member of this research team, I acknowledge that I may
have access to confidential information about study site and participants. By signing
this statement, am indicating my understanding of my responsibilities to maintain
confidentiality and agree to the following;
1. I acknowledge that names and any other unique identifier information about study
sites and participants are completely confidential.
2. I agree not to divulge or otherwise make known to unauthorized person or to the
public any information obtained in the course of the research project that could
identify the persons who participate in the study.
3. I understand that all information about study sites or participants obtained or
accessed by me in the course of my work is private and confidential.
Name of the research staff ______________________________________________
Signature_________________________DATE______________________________
Witnessed by_________________________________________________________
Signature__________________________DATE_____________________________

81
APPENDIX VI: Results Tracking Log
Facility
STUDY
NO
MICROSCOPY
RESULTS
HRP2
BASED
mRDTs
HRP2
COMBINED
WITH PLDH
BASED
mRDTs
COMMENT

82
APPENDIX VII: Directorate Postgraduate Research Approval

83
APPENDIX VIII: Institutional Ethics Review Committee Approval

84
APPENDIX IX: NACOSTI Research License

85
APPENDIX X: DIAGNOSTIC STAGES OF MALARIA PARASITE

86
APPENDIX XI : PUBLICATION OF OBJECTIVE TWO