Embed Size (px)
Citation preview
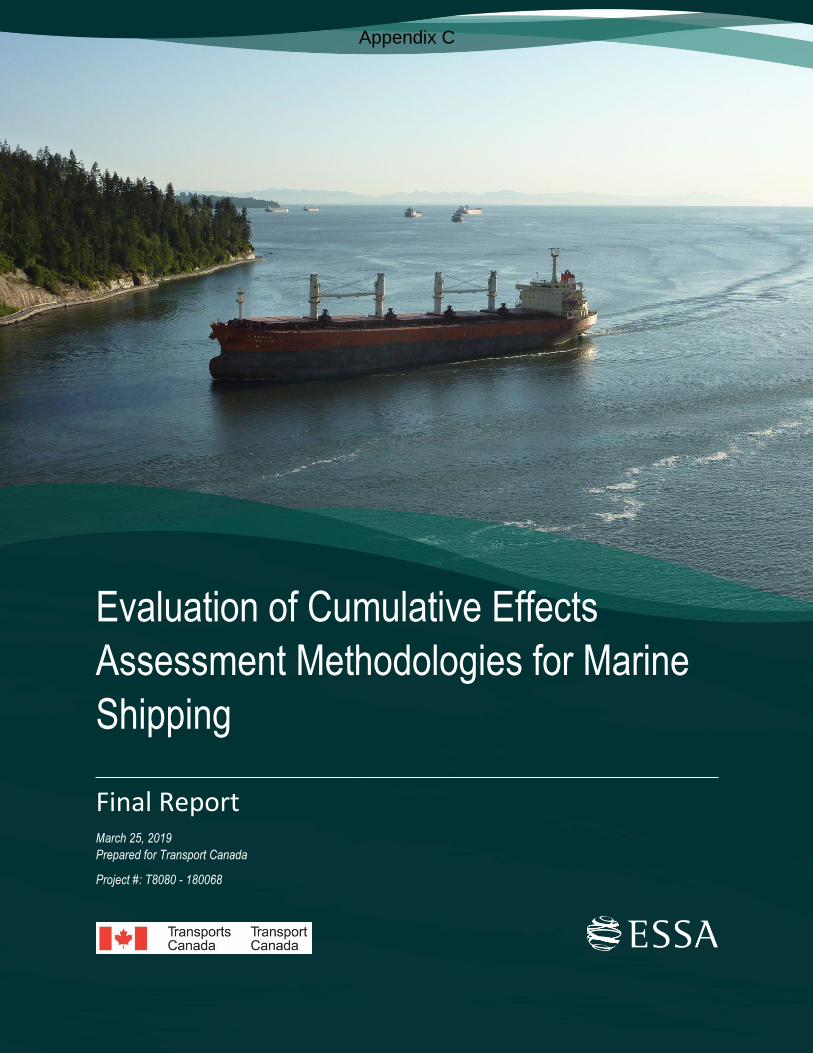
Evaluation of Cumulative Effects Assessment Methodologies for Marine Shipping
Final Report
Evaluation of Cumulative Effects
Assessment Methodologies for Marine
Shipping
Final Report March 25, 2019
Prepared for Transport Canada
Project #: T8080 - 180068
Appendix C
Evaluation of Cumulative Effects
Assessment Methodologies for Marine
Shipping
Prepared for:
Transport Canada
Final Report
March 25, 2019
Contact:
Jeff Campagnola
1.613.990.5796
Contact:
Darcy Pickard
(613) 376-9903
Suggested Citation:
Pickard, D., P. de la Cueva Bueno, E. Olson, and C. Semmens. 2019. Evaluation of
Cumulative Effects Assessment Methodologies for Marine Shipping. Report
prepared by ESSA Technologies Ltd. for Transport Canada. 118pp + appendices.
Cover Photo: One of the many Freighters, Vancouver © 2010 Mat Hampton (CC BY-
SA 2.0)
© 2019 Transport Canada
ESSA Technologies Ltd.
Vancouver, BC Canada V6H 3H4
www.essa.com
Appendix C
Evaluation of Cumulative Effects Assessment Methodologies for Marine Shipping
Final Report
3 | P a g e
Table of Contents List of Figures .................................................................................................................................................. 5
List of Tables ................................................................................................................................................... 8
Acknowledgements........................................................................................................................................... 9
1 Introduction ......................................................................................................................................... 10
1.1 Purpose ................................................................................................................................... 10
1.2 Background.............................................................................................................................. 10
1.3 What is Cumulative Effects Assessment? ............................................................................... 11
1.3.1 Scoping ........................................................................................................................... 13
1.3.2 Assessment ..................................................................................................................... 14
1.3.3 Management ................................................................................................................... 14
1.3.4 Thresholds ....................................................................................................................... 15
1.3.5 Monitoring ........................................................................................................................ 15
1.3.6 Iterative learning .............................................................................................................. 15
1.4 Report Structure ...................................................................................................................... 16
2 Methods ............................................................................................................................................... 17
2.1 Overview .................................................................................................................................. 17
2.2 Screening Phase ..................................................................................................................... 18
2.3 Detailed Evaluation .................................................................................................................. 20
2.4 Challenges ............................................................................................................................... 22
3 Screening of Assessment Methodologies ....................................................................................... 24
3.1 Overview .................................................................................................................................. 24
3.2 Overall Findings ....................................................................................................................... 25
4 Detailed Evaluation of Assessment Methodologies ....................................................................... 27
4.1 Organizational Structure .......................................................................................................... 27
4.2 Spatial Methods ....................................................................................................................... 28
4.2.1 Overview ......................................................................................................................... 28
4.2.2 Evaluation Criteria ........................................................................................................... 31
4.3 Analytical Methods .................................................................................................................. 36
4.3.1 Overview ......................................................................................................................... 36
4.3.2 Evaluation Criteria ........................................................................................................... 43
4.4 Modeling Methods ................................................................................................................... 45
4.4.1 Overview ......................................................................................................................... 45
4.4.2 Evaluation Criteria ........................................................................................................... 63
5 Comparative Analysis ........................................................................................................................ 70
5.1 Comparison across assessment methods .............................................................................. 70
Appendix C
ESSA Technologies Ltd.
4 | P a g e
5.2 Application to the Cumulative Effects of Marine Shipping Initiative ........................................ 75
5.2.1 Overview ......................................................................................................................... 75
5.2.2 Case-studies ................................................................................................................... 79
6 Crosscutting methods ....................................................................................................................... 84
6.1 Indigenous Knowledge ............................................................................................................ 85
6.1.1 Overview ......................................................................................................................... 85
6.1.2 Relevance for the CEMS initiative ................................................................................... 86
6.2 Expert Elicitation ...................................................................................................................... 87
6.2.1 Overview ......................................................................................................................... 87
6.2.2 Relevance for the CEMS initiative ................................................................................... 87
6.3 Decision Support Tools ........................................................................................................... 88
6.3.1 Overview ......................................................................................................................... 88
6.3.2 Relevance for the CEMS initiative ................................................................................... 89
7 Organizing methods: CEA Frameworks ........................................................................................... 93
7.1 Overview .................................................................................................................................. 93
7.2 Examples of CEA frameworks ................................................................................................. 93
7.2.1 EU Marine Strategy Directive .......................................................................................... 93
7.2.2 BC Cumulative Effects Framework ................................................................................. 94
7.2.3 Risk Assessment ............................................................................................................. 96
8 Conclusions ...................................................................................................................................... 100
8.1 Key insights from the evaluation of CE assessment methodologies..................................... 100
8.1.1 Overarching insights ..................................................................................................... 100
8.1.2 Spatial insights .............................................................................................................. 101
8.1.3 Analytical insights .......................................................................................................... 101
8.1.4 Modeling insights........................................................................................................... 102
8.2 Selection of Assessment Methods ........................................................................................ 103
8.3 Technical Workshop Insights................................................................................................. 105
8.3.1 Workshop Summary ...................................................................................................... 105
8.3.2 Workshop Insights ......................................................................................................... 105
8.3.3 Additional information .................................................................................................... 107
8.4 Path Forward ......................................................................................................................... 112
8.4.1 ESSA Recommendations .............................................................................................. 112
8.4.2 Guiding Principles ......................................................................................................... 117
9 Literature Cited ................................................................................................................................. 118
Appendix A: Cumulative Effects and Marine Shipping in Canada: Overall Context........................ 126
Appendix C
Evaluation of Cumulative Effects Assessment Methodologies for Marine Shipping
Final Report
5 | P a g e
Marine Shipping Pathways of Effects.............................................................................................. 126
Regional Context ............................................................................................................................. 128
Arctic ...................................................................................................................................... 128
Newfoundland ........................................................................................................................ 131
New Brunswick ...................................................................................................................... 133
Quebec .................................................................................................................................. 135
Southern BC .......................................................................................................................... 137
Northern BC ........................................................................................................................... 139
Summary of available data .............................................................................................................. 142
Appendix B: Summary of Review Papers ............................................................................................. 145
Appendix C: Additional Insights from the Technical Workshop ....................................................... 150
Appendix D: Technical Workshop (February 20-21, 2019) Backgrounder ........................................ 156
List of Figures Figure 1.1. Phases in the process to develop a cumulative assessment framework as outlined in
the Transport Canada Ocean Protection Plan Cumulative Effects of Marine Shipping
presentation. ........................................................................................................................... 11
Figure 1.2. This figure shows how the assessment step fits within a broader CEA framework. The
Scoping step is underway concurrently, led by Transport Canada and informed by
regional workshops. This report focuses on potential methods for the Assessment
step. The Management step is will be addressed in Phase 4 of the CEMS initiative. ........... 13
Figure 2.1. Evaluation framework showing the flow of information and key outputs. ................................. 17
Figure 3.1. Distribution of literature reviewed per theme. ........................................................................... 24
Figure 3.2. Examples of categorizations of cumulative effects assessment methods from the
literature ................................................................................................................................. 25
Figure 4.1. Organizational structure for the evaluation of cumulative effects assessment methods.......... 27
Figure 4.2. Heat map illustrating intensity of vessel traffic from The Scotian Shelf: An Atlas of
Human Activities (DFO 2005). ............................................................................................... 29
Figure 4.3. Part of the Haida Ocean & Way of Life Map produced as part of the Haida Marine
Traditional Knowledge Study. ................................................................................................ 30
Figure 4.4. (A) Map of global cumulative human impact across 20 ocean ecosystem types as well
as four maps of highly impacted regions (from Halpern et al. 2008), and (B) impact
scores for areas along the British Columbia coastline (from Ban et al. 2010). ..................... 32
Figure 4.5. Coefficient of variation (CV) resulting from the Monte Carlo simulation of the four input
factors used in the uncertainty analysis in Gissi et al. (2017). ............................................... 34
Appendix C
ESSA Technologies Ltd.
6 | P a g e
Figure 4.6. Example of the summer core habitat of Southern Resident Killer Whales estimated
using kernel density estimation, a non-parametric method (Worton 1989), to
estimate utilization distributions (Figure replicated from Cominelli et al. 2018). .................... 37
Figure 4.7. This flow diagram shows the weight of evidence approach used to determine the
relative likelihood each particular stressor was responsible for the decline of Fraser
River sockeye. This is replicated from Marmorek et al. 2010. ............................................... 42
Figure 4.8. Modeling methods as they apply to the Pathways of Effects model. ....................................... 46
Figure 4.9. Output of the cumulative noise model developed by JASCO Applied Sciences. The
map shows the cumulative Leq - equivalent sound level in decibels - values relative
to the ship categories combined (Source: Cominelli et al. 2018). .......................................... 47
Figure 4.10. Example of MEDSLIK oil spill simulations (Source: Alves et al. 2015). ................................. 48
Figure 4.11. Anchor arcs based on AIS vessel tracking data near the Port of Newcastle
(Australia). Different shades denote individual vessels (Source: Davis et al. 2016). ............ 49
Figure 4.12. Location of EwE model applications in Canada. .................................................................... 51
Figure 4.13. Ecopath model used in Harvey 2018. Nodes represent functional groups or
organisms in the model, scaled to the biomass of the organism within the
ecosystem. Trophic levels are shown on the y-axis (Source: Harvey 2018). ........................ 52
Figure 4.14. Density (left) and intensity surface (right; a result of whale density x marine traffic
vessel intensity) for fin whale (Source: Adapted from Williams and O’Hara 2009). .............. 53
Figure 4.15. Example of a single activity Pathways of Effects diagram for marine transportation
(Source: Stephenson and Hartwig 2009). .............................................................................. 55
Figure 4.16: Conceptualizations of the DPSIR model: A) original DPSIR model, redrawn from the
original EU framework (EC 1999), B) recent DAPSI (W)R(M) model (Elliott et al.
2017), and C) timeline and development/relationship of DPSIR and derivatives
(Source: Adapted from Patrício et al. 2016). .......................................................................... 56
Figure 4.17. Conceptual model of stressors and valued components, and their identified linkages.
This model is used to inform the risk assessment method (Source: Furlan 2017) ................ 57
Figure 4.18. Conceptual model and baseline scenario showing the key variables used to predict
the overall level of vulnerability of UK marine landscapes and the values for the
probabilities (%) for defined categories of the respective nodes. Source:
Stelzenmüller et al. 2010. ....................................................................................................... 59
Figure 4.19: Example of biomass distribution maps predicted by Ecospace for the coast of Brunei
Darussalam, Southeast Asia, with red indicating high and blue indicating low
deviations from the Ecopath baseline for each functional group (Source: Walters et
al. 1999). ................................................................................................................................ 60
Figure 4.20: Graphic model outputs from SPRAT showing biomass distributions for the predator
(left) and forage fish (right) functional groups (Source: Johanson et al. 2017). ..................... 60
Figure 4.21: Mean predicted density of agents (km2) in comparison to observed values
represented by catch per unit effort (CPUE, [kg nmi−1]) for the same period (Source:
Heinänen et al. 2018). ............................................................................................................ 61
Figure 4.22: Conceptual diagram of MARAMBS (Source: Frank Thomsen, DHI) ...................................... 62
Appendix C
Evaluation of Cumulative Effects Assessment Methodologies for Marine Shipping
Final Report
7 | P a g e
Figure 4.23. Multispace DPSIR cycles: A) Separate DPSIR cycles linked through a common
Pressure element (e.g., abrasion pressure from the activities of benthic trawling,
anchoring, dredging, etc.); B) Example of linked DPSIR cycles in a particular
ecosystem with individual separate Pressures (P1-P3), each associated with
discrete Activity types (A1-A4) (Source: Adapted from Smith et al. 2016). ........................... 64
Figure 4.24. Example of a single-species model output. Mean projected Southern Resident Killer
Whale (SRKW) population sizes for scenarios with (from top to bottom): no
anthropogenic noise or contaminants; current Chinook abundance, noise, and
PCBs; reduced Chinook, increased noise, and additional threats of oil spills and ship
strikes as estimated for low level impacts of future industrial development; and these
increased and additional threats with higher level impacts of development (Source:
Lacy et al. 2017). .................................................................................................................... 69
Figure 6.1. A conceptual diagram, highlighting how a framework can help organize how we
assemble information, assess information, and use information to arrive at
management decisions. Cumulative effects frameworks encompass all of these
steps, and more. ..................................................................................................................... 84
Figure 6.2. Indigenous knowledge encompasses local knowledge, management systems, social
institutions, and worldviews (Berkes 2018). ........................................................................... 85
Figure 6.3: Example of hive diagrams representing networks of pathways of impact from a)
climate change and b) commercial fishing commercial fishing. These plots show
drivers of impact (top axis) leading to various stressors (lower right axis, connected
with orange lines) and impacting ecosystem services (lower left axis, connected with
blue lines). The thickness of each line represents how many experts mentioned
each link. The nodes along each axis are organized by ranking the nodes with the
highest number of linkages to the lowest (highest number of links on the outside).
Source: Singh et al. 2017 ....................................................................................................... 88
Figure 6.4. Expertise required for use of various decision support tools. Figure taken from Center
for Ocean Solutions (2011)). .................................................................................................. 89
Figure 6.5. Example output from the "Marine Planning Portal" showing both the SeaSketch map,
and the integrated Marxan analysis report. Image taken from
https://www.seasketch.org/case-studies/2013/04/05/mapp.html. .......................................... 92
Figure 7.1. The cumulative effects framework (Government of British Columbia 2017). ........................... 95
Figure 7.2. Illustration of Management Triggers as defined by the BC Cumulative Effects
Framework, interim policy (Government of British Columbia 2017). ..................................... 96
Figure 7.3. A conceptual diagram of how cumulative effects assessments can be embedded into
a standard risk assessment framework. Figure taken from Stelzenmuller et al. 2018. ......... 97
Figure 7.4. Example conceptual diagram of the "bow-tie" approach. Image taken from Cormier et
al. 2018. .................................................................................................................................. 98
Figure 8.1. Conceptual representation of the multiple pressures, land and marine-based, affecting
the coastal and marine ecosystems under the jurisdiction of the European Marine
Strategy Framework Directive (Source: Elliott et al. 2018) .................................................. 108
Figure 8.2. Representation of a bow-tie analysis framework to study the influence of endogenic
managed and exogenic unmanaged pressures (Cormier et al. 2019) ................................. 110
Appendix C
ESSA Technologies Ltd.
8 | P a g e
Figure 8.3. Examples of use of satellite images for the study of a sediment plume originating from
a river after a heavy rainfall (left) and the characterization of marine habitats (right).
Source: DHI GRAS ............................................................................................................... 111
Figure 8.4. Possible path forward for the assessment phase of the CEMS initiative. .............................. 116
List of Tables Table 2.1. An excerpt from the preliminary Tier 1 summary spreadsheet is shown here to illustrate
the organizational structure of the Tier 1 evaluation. ............................................................. 19
Table 2.2. Evaluation criteria. ..................................................................................................................... 20
Table 5.1. Qualitative ranking of methods according to the evaluation criteria. ......................................... 70
Table 5.2. Comparative evaluation of assessment methods (coloring indicates low = red, medium
= orange, and high = green) ................................................................................................... 71
Table 5.3. Overview of the application of the evaluated assessment methods .......................................... 76
Table 5.4. Selected case studies relevant for the CEMS initiative ............................................................. 80
Table 8.1. Guiding principles for implementation of the assessment step of the CEMS initiative. ........... 117
Appendix C

Evaluation of Cumulative Effects Assessment Methodologies for Marine Shipping
Final Report
9 | P a g e
Acknowledgements This report was prepared by ESSA Technologies Ltd. with guidance and support from individuals at Transport Canada. Valuable contributions were made by numerous individuals who took the time to speak with us and provide insights or documents related to cumulative effects assessment and assessment methodologies. In addition, we would like to thank all of the participants of the Technical Workshop in Ottawa (20-21st February 2019), for their feedback and perspectives which helped to shape this report.
We would sincerely like to thank everyone who contributed.
Appendix C
ESSA Technologies Ltd.
1 0 | P a g e
1 Introduction
1.1 Purpose
The purpose of this project is to evaluate and compare potential assessment methodologies for cumulative
effects assessment in the context of the Transport Canada led Cumulative Effects of Marine Shipping
initiative (CEMS) under Canada’s Ocean Protection Plan. The report provides recommendations as to
which categories of methodology are most applicable under different scenarios. This information will help
inform the assessment step within the CEMS initiative.
1.2 Background
On November 7, 2016, the Prime Minister launched a $1.5 billion national Oceans Protection Plan that
improves marine safety and responsible shipping, protects Canada's marine environment, and offers new
possibilities for Indigenous and coastal communities. The Oceans Protection Plan has four main priority
areas:
Creating a world-leading marine safety system that improves responsible shipping and protects
Canada’s waters, including new preventive and response measures;
Restoring and protecting the marine ecosystems and habitats, using new tools and research, as
well as taking measures to address abandoned boats and wrecks;
Strengthening partnerships and launching co-management practices with Indigenous communities,
including building local emergency response capacity; and,
Investing in oil spill cleanup research and methods to ensure that decisions taken in emergencies
are evidence based.
The CEMS initiative is under the restoring and protecting the marine ecosystem pillar of the Oceans
Protection Plan. The goal of the initiative is to develop a cumulative effects assessment framework focused
on current and potential marine vessel activity. The initiative has prioritized six pilot sites1 covering all three
of Canada’s coasts. The first year of the initiative has involved scoping the concerns related to marine
vessel activities as well as identifying the stressors of concern for each pilot site.
Outreach and engagement are core principles of this initiative, and Indigenous peoples, local stakeholders,
and coastal communities are involved in all aspects of the initiative. Regional workshops have been used
to identify the specific activities of concern and the ways that those activities are affecting the marine
environment and traditional use. Identification of Valued Components (VCs), linkages between the
stressors and VCs (i.e., pathways of effect), and indicators to inform the relative impact of different pathways
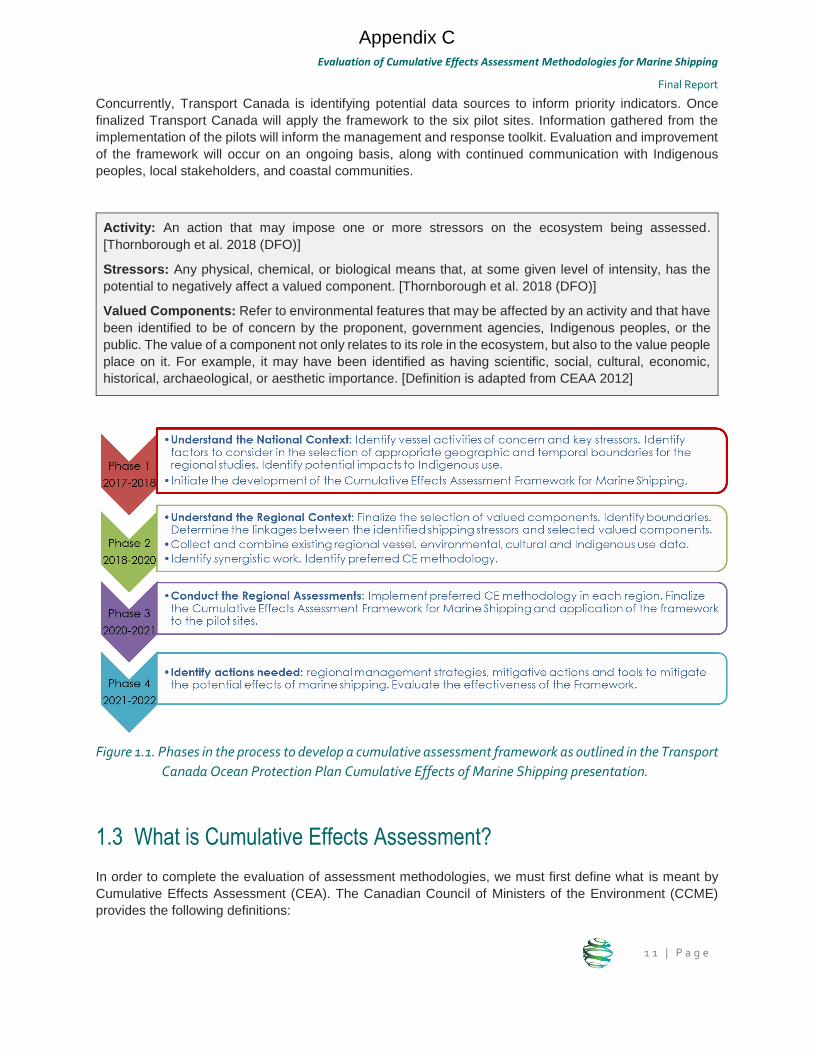
is currently underway. This report is part of Phase 2 (Figure 1.1) and was recommended by Lerner 2018 to
’develop an assessment toolkit’ which will inform the assessment step within the overall CEMS initiative.
1 Northern, British Columbia; Southern, British Columbia; St. Lawrence River, Quebec; Bay of Fundy, New Brunswick; Placentia Bay,
Newfoundland; Cambridge Bay, Nunavut
Appendix C
Evaluation of Cumulative Effects Assessment Methodologies for Marine Shipping
Final Report
1 1 | P a g e
Concurrently, Transport Canada is identifying potential data sources to inform priority indicators. Once
finalized Transport Canada will apply the framework to the six pilot sites. Information gathered from the
implementation of the pilots will inform the management and response toolkit. Evaluation and improvement
of the framework will occur on an ongoing basis, along with continued communication with Indigenous
peoples, local stakeholders, and coastal communities.
Activity: An action that may impose one or more stressors on the ecosystem being assessed.
[Thornborough et al. 2018 (DFO)]
Stressors: Any physical, chemical, or biological means that, at some given level of intensity, has the
potential to negatively affect a valued component. [Thornborough et al. 2018 (DFO)]
Valued Components: Refer to environmental features that may be affected by an activity and that have
been identified to be of concern by the proponent, government agencies, Indigenous peoples, or the
public. The value of a component not only relates to its role in the ecosystem, but also to the value people
place on it. For example, it may have been identified as having scientific, social, cultural, economic,
historical, archaeological, or aesthetic importance. [Definition is adapted from CEAA 2012]
Figure 1.1. Phases in the process to develop a cumulative assessment framework as outlined in the Transport
Canada Ocean Protection Plan Cumulative Effects of Marine Shipping presentation.
1.3 What is Cumulative Effects Assessment?
In order to complete the evaluation of assessment methodologies, we must first define what is meant by
Cumulative Effects Assessment (CEA). The Canadian Council of Ministers of the Environment (CCME)
provides the following definitions:
Appendix C
ESSA Technologies Ltd.
1 2 | P a g e
Cumulative effect is a change in the environment caused by multiple interactions among human
activities and natural processes that accumulate across space and time.
Cumulative effects assessment is a systematic process of identifying, analyzing, and
evaluating cumulative effects.
Cumulative effects management is the identification and implementation of measures to
control, minimize or prevent the adverse consequences of cumulative effects.
Although these definitions are useful for making clear what is meant by these foundational terms, the
definitions alone do not provide sufficient detail about what the assessment steps entail. Similarly, Transport
Canada’s five phase process and Lerner (2018)’s eight steps do not provide detail about what occurs within
an ‘assessment’ step.
Ideally, CEA involves a series of methods that assess the condition of the environment, describe the causal
pathways that link stressors and cumulative effects, and predict the risks and benefits associated with
alternative scenarios (Jones 2016). Although there is consensus on the general steps of the CEA process
(Jones 2016), there is debate in terms of the methods that should be used at each of these stages (Jones
2016, Stelzenmüller et al. 2018). It is important to understand the structure of the overall cumulative effects
framework within which the method will be applied (Greig et al. 2013). In other words, what is the scope of
the assessment and what management strategies are being informed by the outcome of the assessment?
No single method is sufficient to address all aspects of cumulative effects assessment (Canter 2008,
Stelzenmüller et al. 2018). Ultimately, the selection of a method depends on data availability, ease of use,
and, fundamentally, on the questions that the assessment seeks to answer (Greig et al. 2013). In practice,
various methods and associated tools are usually applied in combination through the cumulative effects
assessment process (CEQ 1997) so that specific questions can be addressed (Greig et al. 2013).
There are multiple worldviews that can influence the selection of methods and associated tools and how
they are applied. CEA inherently acknowledges the holistic and interconnected nature of complex socio-
ecological systems; however, assessment methods can be applied differently based on different
worldviews. This report summarizes the range of assessment methodologies available and considerations
in selecting different methods. It does not include details about how different types of knowledge should
inform those methods or how methods should be applied based on different worldviews.
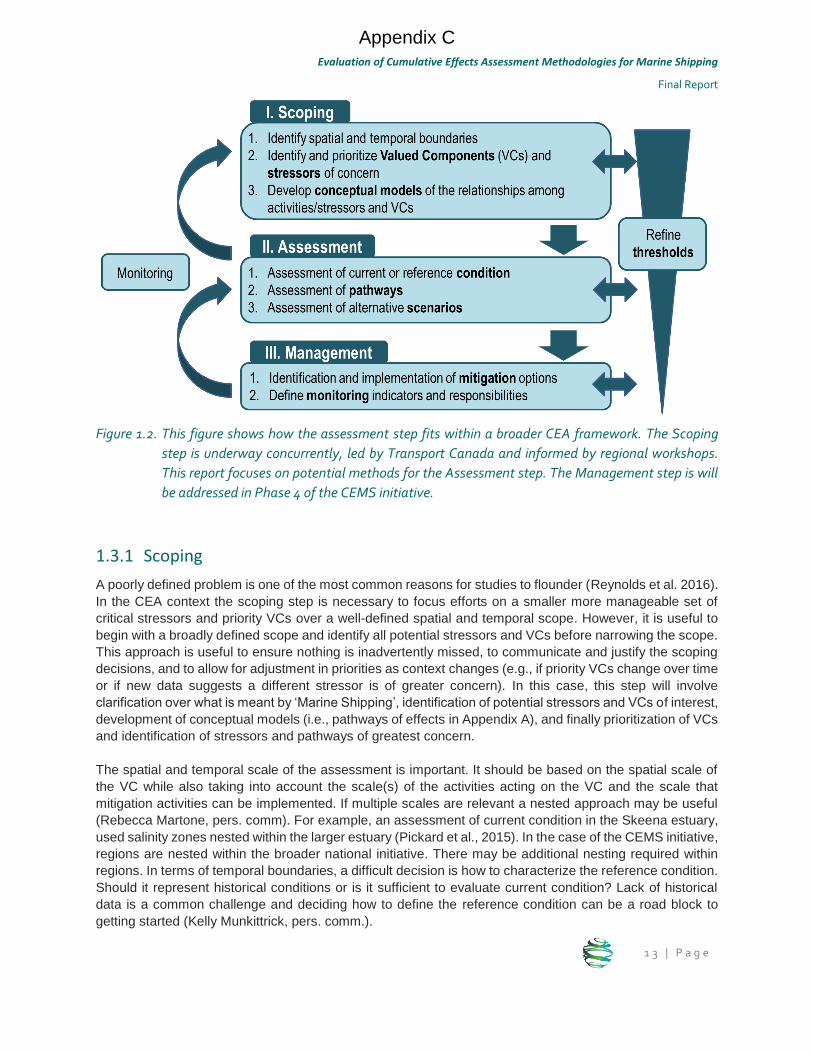
We created a diagram that displays important elements in a CEA framework in order to show our
understanding of how the assessment step supports the broader framework in the context of the Transport
Canada led CEMS initiative (Figure 1.2). This figure builds on the general stages identified by Jones (2016)
as well as the more detailed good practice handbook provided by the International Finance Corporation
(IFC, 2013). Sections 1.3.1 to 1.3.5 provide a brief discussion of each of the components in the generic
CEA framework.
Appendix C
Evaluation of Cumulative Effects Assessment Methodologies for Marine Shipping
Final Report
1 3 | P a g e
Figure 1.2. This figure shows how the assessment step fits within a broader CEA framework. The Scoping
step is underway concurrently, led by Transport Canada and informed by regional workshops.
This report focuses on potential methods for the Assessment step. The Management step is will
be addressed in Phase 4 of the CEMS initiative.
1.3.1 Scoping
A poorly defined problem is one of the most common reasons for studies to flounder (Reynolds et al. 2016).
In the CEA context the scoping step is necessary to focus efforts on a smaller more manageable set of
critical stressors and priority VCs over a well-defined spatial and temporal scope. However, it is useful to
begin with a broadly defined scope and identify all potential stressors and VCs before narrowing the scope.
This approach is useful to ensure nothing is inadvertently missed, to communicate and justify the scoping
decisions, and to allow for adjustment in priorities as context changes (e.g., if priority VCs change over time
or if new data suggests a different stressor is of greater concern). In this case, this step will involve
clarification over what is meant by ‘Marine Shipping’, identification of potential stressors and VCs of interest,
development of conceptual models (i.e., pathways of effects in Appendix A), and finally prioritization of VCs
and identification of stressors and pathways of greatest concern.
The spatial and temporal scale of the assessment is important. It should be based on the spatial scale of
the VC while also taking into account the scale(s) of the activities acting on the VC and the scale that
mitigation activities can be implemented. If multiple scales are relevant a nested approach may be useful
(Rebecca Martone, pers. comm). For example, an assessment of current condition in the Skeena estuary,
used salinity zones nested within the larger estuary (Pickard et al., 2015). In the case of the CEMS initiative,
regions are nested within the broader national initiative. There may be additional nesting required within
regions. In terms of temporal boundaries, a difficult decision is how to characterize the reference condition.
Should it represent historical conditions or is it sufficient to evaluate current condition? Lack of historical
data is a common challenge and deciding how to define the reference condition can be a road block to
getting started (Kelly Munkittrick, pers. comm.).
Appendix C
ESSA Technologies Ltd.
1 4 | P a g e
1.3.2 Assessment
The assessment phase of any CEA framework involves three main steps: (1) assessment of the current or
reference condition; (2) assessment of the impact pathways; and (3) assessment of alternative scenarios.
Each of these stages is important and a combination of methods and associated tools may be necessary
to address all stages.
Assessment of current or reference condition:
This step begins with compiling and evaluating the quality and spatial/temporal extent of the best available
data. In some cases, Indigenous Knowledge may be available to support the assessment. Expert elicitation
may also be used where no empirical2 information exists. Indicators need to be developed to represent both
stressors and VCs. Indicator selection generally involves evaluating alternative indicators against a set of
criteria such as: relevance, responsiveness, and feasibility (Pickard et al. 2018). Finally, the current or
reference condition of priority VCs and stressors of concern are summarized using the best available data
for each indicator selected. Information gaps are often identified at this stage.
Assessment of pathways
The purpose of this step is to understand the cause-effect relationships between stressors and VCs. This
includes understanding the magnitude of effects as well as the shape of the functional relationship between
stressors and VCs (e.g., linear, exponential, optimum range). Additionally, it is useful to understand which
pathways are most important (i.e., what are the relative drivers of the system?).
In most CEA frameworks this step isn’t broken out separately but is an implied necessary step to evaluate
alternative scenarios and to enable threshold definition. It can also be useful to iteratively refine the scope
of the assessment to focus on the primary drivers of the system. For the purpose of this report we felt it
was useful to explicitly discuss this step as different methods will be relevant depending on whether the
task involves quantifying relationships or evaluating alternative scenarios.
Assessment of alternative scenarios
Given an understanding of the current or reference condition and the relationships among stressors and
VCs, it is possible to evaluate alternative future scenarios. This step can be difficult but is what makes CEA
valuable to informing decisions. This step also requires an understanding of the management context which
defines relevant future scenarios. These may include management levers which are available to mitigate
impacts of stressors as well as future development or climate scenarios.
1.3.3 Management
It is important to understand the management context as one designs the assessment step. What are the
management objectives? What management decisions will be informed by the assessment? For example,
decisions around alternative development scenarios (e.g., port expansions) or decisions around how to
mitigate current activities (e.g., oil spill response, timing/location of vessel movement). If one objective is to
minimize cumulative effects on VCs resulting from marine shipping, it makes sense to focus on those effects
where there is the greatest potential to make a change. This may differ depending on who is implementing
2 Empirical: “originating in or based on observation or experience” Merriam-Webster [https://www.merriam-
webster.com/dictionary/empirical]
Appendix C
Evaluation of Cumulative Effects Assessment Methodologies for Marine Shipping
Final Report
1 5 | P a g e
the initiative. A common challenge of CEA is that VCs are affected by stressors that fall under a variety of
jurisdictional authorities (e.g., DFO, Transport Canada, Provincial or Territorial, or local governments). In
this case, mitigation opportunities will be collaboratively identified in partnership with all levels of jurisdiction.
Clearly defined management objectives will help to scope the assessment and will help to inform the
selection of assessment methodologies. Identifying management decisions up front will help to characterize
alternative scenarios of interest. Likewise, the assessment step will help us to better understand the current
condition, cause-effect relationship between stressors and VCs, relative drivers of the system, and potential
outcomes of alternative scenarios, thus informing management decisions.
Finally, there is another link between management decisions and what society determines is acceptable.
This is discussed further in the following section on thresholds.
1.3.4 Thresholds
We define thresholds to be levels at which a particular stressor or VC exceeds a level of concern resulting
in an alternative management regime. Thresholds are informed by a combination of technical understanding
and a socially defined level of acceptable change (Hegmann et al. 1999). Pressures (e.g., noise) resulting
from activities (movement underway) cannot be interpreted as stressors without first defining thresholds.
Assessment of impact pathways is a critical scientific input to developing meaningful thresholds.
In practice, thresholds are often best guesses to start and are refined throughout the CEA process. In
absence of thresholds, it may be possible to first identify whether the current condition is ‘acceptable or
unacceptable’. As functional relationships are quantified, thresholds can be informed by these empirical
relationships. Models can also be used to inform thresholds by evaluating likelihood of survival under
different conditions.
1.3.5 Monitoring
Monitoring is necessary to inform cumulative effects assessment and enable good cumulative effects
management (CCME unpublished). One of the outcomes of initial scoping and subsequent assessment is
to identify knowledge gaps. While preliminary assessments may be completed based on expert knowledge,
it is important to verify hypotheses with empirical evidence. Monitoring should be used to address the
greatest uncertainties for the most important pathways. In this way monitoring enables continuous
improvement within the framework.
1.3.6 Iterative learning
While there is a natural sequence to the generic CEA framework described in Figure 1.2, in practice,
implementation is iterative. Selection of an assessment methodology depends on the outputs from other
components within the framework and may also change with future iterations through the framework (i.e.,
as we refine scope or as new data become available).
The first iteration through the assessment step may involve limited empirical information. The first iteration
helps to define the scope using best available data or expert opinion and may identify information gaps and
critical uncertainties. As these uncertainties are addressed the level of understanding improves and the
scope may be adjusted or refined. Selection of methodologies will tend to shift from simple to complex as
the scope is refined and more data are available.
Appendix C
ESSA Technologies Ltd.
1 6 | P a g e
1.4 Report Structure
There are a large variety of methodologies which have been applied to CEA. Most of these are not sufficient
on their own to accomplish a CEA but are useful for supporting a CEA. Usually a suite of methods and
associated tools are needed to accomplish a CEA, with selection depending on context. In conducting this
evaluation, we do not provide a comprehensive review of all possible methods but rather discuss higher
level categories of methods with information on specific methods and associated tools provided to support
the discussion. The report includes 8 sections plus a series of appendices:
Section 1 provides important background context which clarifies the nature of this report.
Section 2 describes our approach to completing the evaluation.
Section 3 describes the screening phase of our evaluation.
Section 4 provides the detailed evaluation, including a description of possible methods and
associated tools and an evaluation of their relevance, rigour, and feasibility.
Section 5 presents a comparative analysis across methods and introduces a number of case
studies that illustrate the application of these methods and how they could be used in the context
of the Cumulative Effects of Marine Shipping initiative.
Section 6 discusses crosscutting methods relevant to CEA, including: Indigenous knowledge,
expert elicitation, and decision support tools.
Section 7 introduces examples of CEA frameworks and how the assessment step fits into the
broader context.
Section 8 provides overall conclusions, including insights from the evaluation and the Technical
Workshop, how to use the assessment toolkit, and next steps for the CEMS.
Appendix A describes additional context that has informed our evaluation. In particular, we provide
a brief summary of the: status of marine shipping pathways of effects model development, regional
context in the pilot sites, and data availability.
Appendix B includes short summaries of key review papers on cumulative effects assessment
methods and tools.
Appendix C provides additional detailed feedback from participants of the Technical Workshop
(Ottawa, 20-21 February 2019).
Appendix D is the Technical Backgrounder that was shared with participants, as a brief summary
of this report, prior to the Technical Workshop.
Appendix C
Evaluation of Cumulative Effects Assessment Methodologies for Marine Shipping
Final Report
1 7 | P a g e
2 Methods
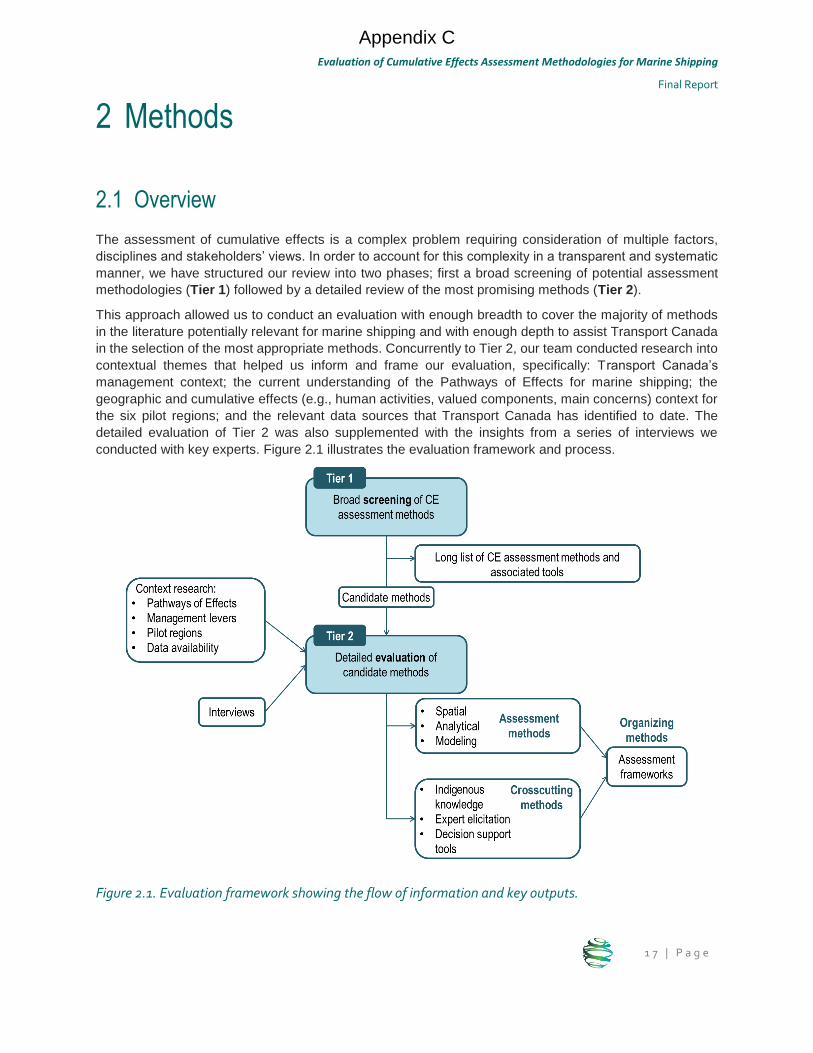
2.1 Overview
The assessment of cumulative effects is a complex problem requiring consideration of multiple factors,
disciplines and stakeholders’ views. In order to account for this complexity in a transparent and systematic
manner, we have structured our review into two phases; first a broad screening of potential assessment
methodologies (Tier 1) followed by a detailed review of the most promising methods (Tier 2).
This approach allowed us to conduct an evaluation with enough breadth to cover the majority of methods
in the literature potentially relevant for marine shipping and with enough depth to assist Transport Canada
in the selection of the most appropriate methods. Concurrently to Tier 2, our team conducted research into
contextual themes that helped us inform and frame our evaluation, specifically: Transport Canada’s
management context; the current understanding of the Pathways of Effects for marine shipping; the
geographic and cumulative effects (e.g., human activities, valued components, main concerns) context for
the six pilot regions; and the relevant data sources that Transport Canada has identified to date. The
detailed evaluation of Tier 2 was also supplemented with the insights from a series of interviews we
conducted with key experts. Figure 2.1 illustrates the evaluation framework and process.
Figure 2.1. Evaluation framework showing the flow of information and key outputs.
Appendix C
ESSA Technologies Ltd.
1 8 | P a g e
2.2 Screening Phase
2.2.1.1 Literature review
As a first step in the development of the evaluation framework, our team undertook a broad desktop search
of cumulative effects assessment methodologies and associated tools. In addition to the references
included in key background material, such as the literature review by Lerner (2018), we conducted a high-
level desktop and web search to identify cumulative effects assessment approaches which have been
applied in a context relevant for marine shipping. Specifically, we searched academic sources (e.g., Google
Scholar, Science Direct) and other thematic and grey literature databases (e.g., Fisheries and Oceans
Canada, International Association of Impact Assessment) for the following key words:
“Cumulative effects/impacts assessment” + “(marine) shipping”
“Cumulative effects/impacts assessment” + “marine environment/ecosystems/habitats”
“Cumulative effects/impacts” + “(marine) shipping” + “modeling”
“Cumulative effects/impacts assessment” + “(marine) shipping” + “tools”
“Cumulative effects/impacts” + “assessment toolkit” + “marine environment/ecosystems/habitats”
“(marine) shipping” + “impacts/effects assessment”
The purpose at this stage was not to research and document in depth any specific approach but to get an
understanding of the range and types of existing cumulative effects assessment methodologies and tools.
These initial searches were supplemented by literature summarized in review papers, provided by experts,
or familiar to our team.
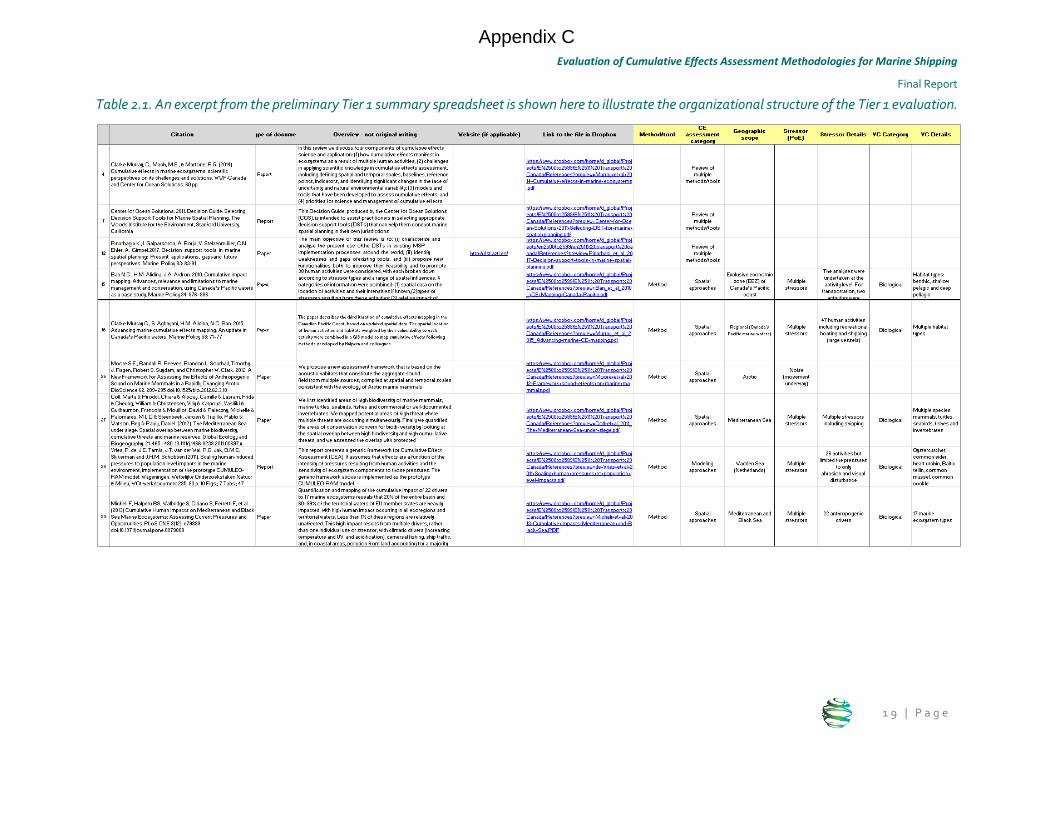
2.2.1.2 Tabular summary
The outcome of the preliminary screening was a long list of cumulative effects assessment methods and
associated tools, as well as relevant review papers or reports dealing with multiple approaches. This
preliminary list has been documented in an Excel spreadsheet (Table 2.1). The spreadsheet organizes the
information for each entry using the following headings:
Citation: Full citation
Type of document: Paper, report, case study or tool
Overview: Brief description of the content of the document
CE method/tool: we grouped the table entries into the three main categories evaluated in Tier 2: (i)
spatial, (ii) analytical, (iii) modeling approaches
Geographic scope: Scale and place at which the assessment was conducted (e.g., Pacific North-
BC)
Stressors: Specific marine shipping stressors that were included in the analysis
VCs: valued components that were addressed in the analysis.
Appendix C
Evaluation of Cumulative Effects Assessment Methodologies for Marine Shipping
Final Report
1 9 | P a g e
Table 2.1. An excerpt from the preliminary Tier 1 summary spreadsheet is shown here to illustrate the organizational structure of the Tier 1 evaluation.
Appendix C
ESSA Technologies Ltd.
2 0 | P a g e
2.2.1.3 Review papers
Besides literature on specific methods and tools, we included in our screening 14 review papers that
document and compare multiple cumulative effects assessment methods or tools. Although the purpose of
these reviews differs from the focus of this evaluation (i.e., cumulative assessment methodologies
applicable to marine shipping), reviewing and comparing various organizing structures of review papers
helped us in defining our evaluation framework, as well as providing an overview on the state of practice of
cumulative effects assessment methodologies.
2.3 Detailed Evaluation
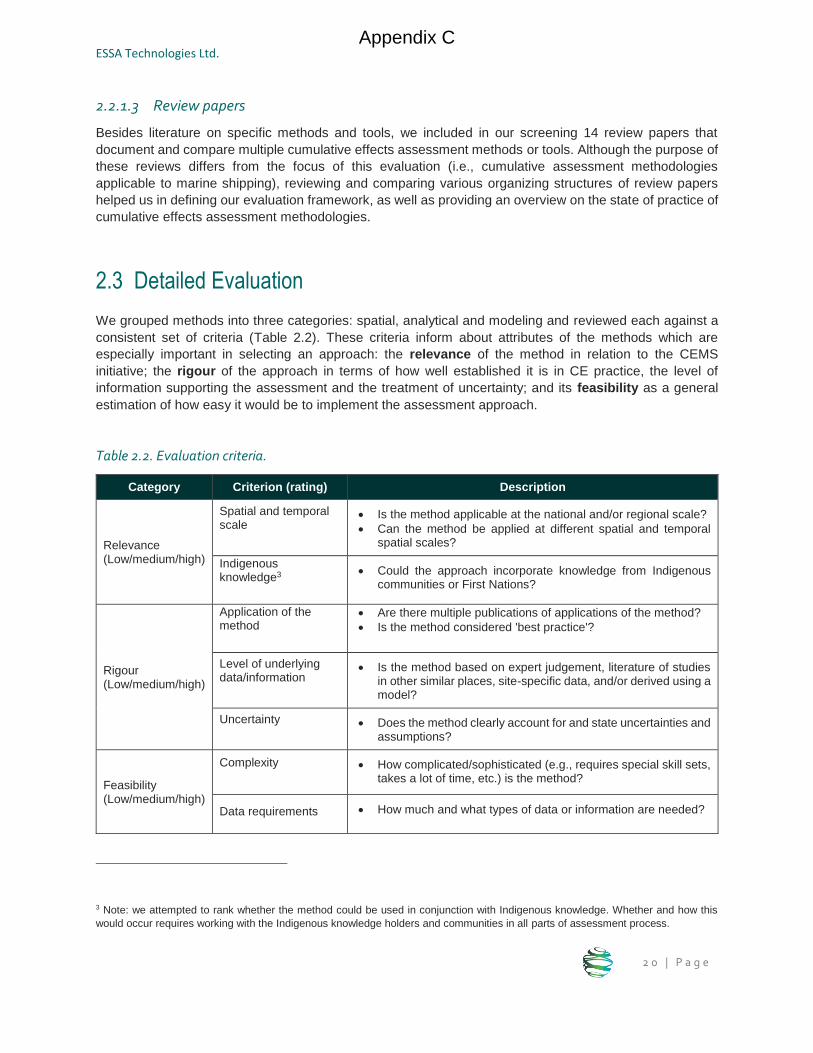
We grouped methods into three categories: spatial, analytical and modeling and reviewed each against a
consistent set of criteria (Table 2.2). These criteria inform about attributes of the methods which are
especially important in selecting an approach: the relevance of the method in relation to the CEMS
initiative; the rigour of the approach in terms of how well established it is in CE practice, the level of
information supporting the assessment and the treatment of uncertainty; and its feasibility as a general
estimation of how easy it would be to implement the assessment approach.
Table 2.2. Evaluation criteria.
Category Criterion (rating) Description
Relevance (Low/medium/high)
Spatial and temporal scale
Is the method applicable at the national and/or regional scale?
Can the method be applied at different spatial and temporal spatial scales?
Indigenous knowledge3
Could the approach incorporate knowledge from Indigenous communities or First Nations?
Rigour (Low/medium/high)
Application of the method
Are there multiple publications of applications of the method?
Is the method considered 'best practice'?
Level of underlying data/information
Is the method based on expert judgement, literature of studies in other similar places, site-specific data, and/or derived using a model?
Uncertainty
Does the method clearly account for and state uncertainties and assumptions?
Feasibility (Low/medium/high)
Complexity
How complicated/sophisticated (e.g., requires special skill sets, takes a lot of time, etc.) is the method?
Data requirements How much and what types of data or information are needed?
3 Note: we attempted to rank whether the method could be used in conjunction with Indigenous knowledge. Whether and how this
would occur requires working with the Indigenous knowledge holders and communities in all parts of assessment process.
Appendix C
Evaluation of Cumulative Effects Assessment Methodologies for Marine Shipping
Final Report
2 1 | P a g e
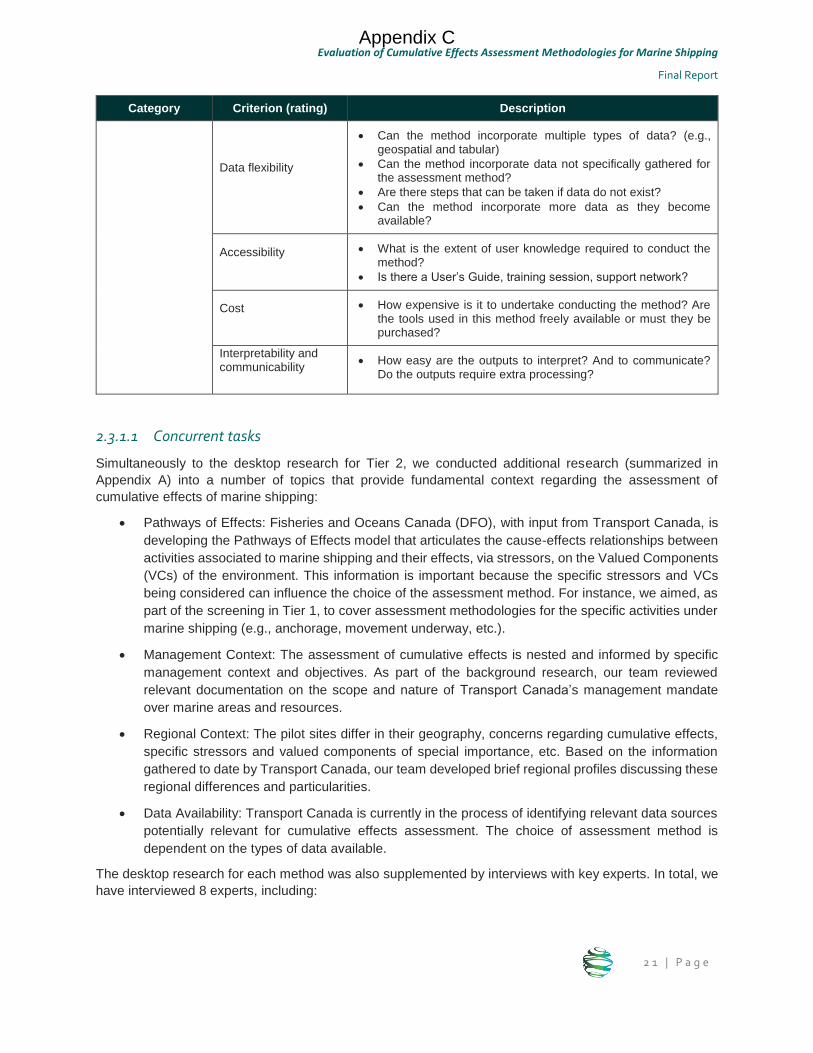
Category Criterion (rating) Description
Data flexibility
Can the method incorporate multiple types of data? (e.g., geospatial and tabular)
Can the method incorporate data not specifically gathered for the assessment method?
Are there steps that can be taken if data do not exist?
Can the method incorporate more data as they become available?
Accessibility
What is the extent of user knowledge required to conduct the method?
Is there a User’s Guide, training session, support network?
Cost
How expensive is it to undertake conducting the method? Are the tools used in this method freely available or must they be purchased?
Interpretability and communicability
How easy are the outputs to interpret? And to communicate? Do the outputs require extra processing?
2.3.1.1 Concurrent tasks
Simultaneously to the desktop research for Tier 2, we conducted additional research (summarized in
Appendix A) into a number of topics that provide fundamental context regarding the assessment of
cumulative effects of marine shipping:
Pathways of Effects: Fisheries and Oceans Canada (DFO), with input from Transport Canada, is
developing the Pathways of Effects model that articulates the cause-effects relationships between
activities associated to marine shipping and their effects, via stressors, on the Valued Components
(VCs) of the environment. This information is important because the specific stressors and VCs
being considered can influence the choice of the assessment method. For instance, we aimed, as
part of the screening in Tier 1, to cover assessment methodologies for the specific activities under
marine shipping (e.g., anchorage, movement underway, etc.).
Management Context: The assessment of cumulative effects is nested and informed by specific
management context and objectives. As part of the background research, our team reviewed
relevant documentation on the scope and nature of Transport Canada’s management mandate
over marine areas and resources.
Regional Context: The pilot sites differ in their geography, concerns regarding cumulative effects,
specific stressors and valued components of special importance, etc. Based on the information
gathered to date by Transport Canada, our team developed brief regional profiles discussing these
regional differences and particularities.
Data Availability: Transport Canada is currently in the process of identifying relevant data sources
potentially relevant for cumulative effects assessment. The choice of assessment method is
dependent on the types of data available.
The desktop research for each method was also supplemented by interviews with key experts. In total, we
have interviewed 8 experts, including:
Appendix C
ESSA Technologies Ltd.
2 2 | P a g e
Natalie Ban, Associate Professor in the School of Environmental Studies of the University of
Victoria (British Columbia)
Claude Comtois, Professor of Geography at the University of Montreal
Roland Cormier, President of Ecorisk Mgmt Inc.
Peter Duinker, Professor in the School for Resource and Environmental Studies of Dalhousie
University
Mike Elliott, Professor of Estuarine and Coastal Sciences at the Institute of Estuarine and Coastal
Studies of the University of Hull
Rebecca Martone, Marine Biologist with Marine and Coastal Resources, government of British
Columbia
Robert Stephenson, scientist with DFO͛s St. Andrews Biological Station and a visiting Professor at
the University of New Brunswick
Villy Christensen, lead developer of Ecopath/Ecosim/Ecospace software for modeling food web
interactions.
2.4 Challenges
There are several challenges we encountered during the implementation of this project:
Apples to oranges. The suite of candidate assessment methodologies we were asked to consider included a combination of methods, tools, and case studies, making it difficult to compare directly. For the purpose of this report we defined these terms as follows:
Methodology: The collective body of methods employed by a particular field, in this case
cumulative effects assessment.
Method: A procedure or process for attaining an object, in this case the assessment of
cumulative effects. In some cases, tools may exist to support the method, but a method
may exist in absence of a tool.
Tool: A means to an end, an instrument or apparatus used in performing an operation. In
this case tools are designed to support one or more cumulative effects assessment
methods. Tools range in specificity from specific applications (e.g., ECCC’s Marine
Emission Inventory Tool) to generic software (e.g., ArcGIS).
Case study: The specific application of one or more methods and associated tools. These
tend to be one-off examples which employ a combination of the methods discussed in this
report to achieve a particular end.
Another challenge was that methodologies varied in terms of their function, i.e., how they could support CEA. Through the course of the screening phase, we developed a consistent organizing structure that we believe helps to address this challenge and distinguish among methods (Section 4.1). We also narrowed
Appendix C
Evaluation of Cumulative Effects Assessment Methodologies for Marine Shipping
Final Report
2 3 | P a g e
our detailed evaluation to focus on methods using examples of associated tools or case-studies where helpful.
National versus regional. A common challenge for national initiatives is the need to develop a national approach which is still relevant at the regional scale, and ideally is flexible enough to account for regional context. Finding a balance is difficult. A compromise may be to develop a national approach focused on aspects that are broadly applicable and can also be readily integrated with regional initiatives.
Data availability. Transport Canada is currently in the process of collecting existing coastal environmental data and regional marine shipping data for the six pilot sites. Data availability will influence the selection of assessment methodologies. Given that this task is still underway it is not possible to make specific recommendations at this time.
Timing of scoping. Development and implementation of the national Cumulative Effects of Marine
Shipping initiative is being informed by engagement with Indigenous peoples and stakeholders in each of
the six pilot sites across Canada. As with any work requiring engagement, this will take time. Since
Transport Canada is using a collaborative process in choosing valued components, priority VC’s have not
yet been solidified at the time of writing this report. This inhibits making specific recommendations about
which methods may be most appropriate. Instead we provide general guidance about what methods are
appropriate under different conditions.
Appendix C
ESSA Technologies Ltd.
2 4 | P a g e
3 Screening of Assessment Methodologies
3.1 Overview
This section presents the main findings of Tier 1 of the evaluation process, which consisted of a high-level
screening of cumulative effects assessment methods relevant for marine shipping. We reviewed in total
181 references including papers about specific methods/tools, review papers, assessment frameworks, key
background documents, etc. The documents reviewed cover a variety of types of sources, from academic
papers, reports, texts, case studies, websites and presentations. Figure 3.1 shows the distribution of
references according to the theme or aspect of the evaluation that they inform. Half (50%) of the references
are papers related to one of the assessment categories (i.e., spatial, analytical and modeling approaches).
It should be noted that the distinction between methods is not always obvious and there are some methods
described in the references that include elements of multiple approaches. However, we decided to classify
the references based on their predominant assessment methodology (e.g., if a modeling method includes
a spatial analysis component we would still classify it under the ‘modeling approaches’ category).
Figure 3.1. Distribution of literature reviewed per theme.
This screening phase was used to help identify the most relevant methods for Transport Canada. Insights
from this review also helped form the organizational structure employed in the more detailed Tier 2
evaluation (Section 2.3).
20 (11%)
32 (18%)
23 (13%)
35 (19%)
9 (5%)7 (4%)
20 (11%)
35 (19%)
0%
5%
10%
15%
20%
25%
Reviewpapers
Spatialmethods
Analyticalmethods
Modelingmethods
Indiugenousknowledgeand expertelicitation
Decisionsupport tools
Assessmentframeworks
Otherreferences
Per
cen
tag
e (%
) o
f re
fere
nce
s
Appendix C
Evaluation of Cumulative Effects Assessment Methodologies for Marine Shipping
Final Report
2 5 | P a g e
3.2 Overall Findings
This section summarizes the main findings from the review papers looking into cumulative effects
assessment methodologies. Appendix B presents a set of summaries of the most relevant review papers
for this report.
In general, authors group the methods according to either the methodological nature of method or the
function that the method and associated tool supports in the assessment process. Figure 3.2 shows various
categorizations of CEA methods that we have found in the literature.
Figure 3.2. Examples of categorizations of cumulative effects assessment methods from the literature
Some authors have specifically looked at the methods used for CEA in marine environments. Willsteed et
al. (2017) found a high variability, both conceptually and methodologically, in the approaches that have
been used. The authors found that this disparity in methodological approaches does not contribute to
improving regional understandings of cumulative environmental change.
Other specific challenges of CEA in marine environments (Stelzenmüller et al. 2018) are a consequence of
the openness and high connectivity of marine ecosystems and the heterogeneity and uncertainty in
biophysical processes, which are in some cases less well understood than in terrestrial ecosystems.
Main challenges and limitations in the practice of CEA include: limited scope of the studies (Korpinen and
Andersen 2016) that does not include all pathways, lack of benchmark or thresholds for stressors (Korpinen
and Andersen 2016) and ecosystem components (Jones 2016), uncertainty (Clarke Murray et al. 2014),
and identifying baselines (Clarke Murray et al. 2014, Foley et al. 2017).
Appendix C
ESSA Technologies Ltd.
2 6 | P a g e
Uncertainty is unavoidable in CEA (Jones 2016). Although uncertainty is acknowledged in most CEAs, it is
rarely addressed in terms of how it affects the result of the assessment (Stelzenmüller et al. 2018). Usual
methods to address uncertainty in the context of these assessments include the use of Bayesian Belief
Networks and expert elicitation (later discussed in Section 4.4).
CEAs are complex assessments and defining impacts, baseline, scale, and significance are still major
challenges in CEA practice according to Foley et al. (2017). Despite the recent advances in CEA science
and in the tools and methods available, practitioners are still struggling to put scientific approaches (e.g.,
quantitative assessments, use of numerical models, etc.) in practice. There is also inconsistency in how
baselines are defined and how the effects and their significance are assessed.
To date, the predominant method for cumulative effects assessment has been some variation of spatial
analysis (Korpinen and Andersen 2016). This type of approach involves combining spatial information on
the intensity of the pressures/stressors with data on the distribution and characteristics of the valued
components under study. Although spatial approaches can help with the formulation of the problem (Judd
et al. 2015), this type of analysis alone does not provide an assessment (quantification) of the impacts.
CEQ (1997) points to two aspects of CEA that require special analysis, and therefore special methods: the
need to address resource sustainability and the focus on both ecosystems and human communities.
Appendix C

Evaluation of Cumulative Effects Assessment Methodologies for Marine Shipping
Final Report
2 7 | P a g e
4 Detailed Evaluation of Assessment
Methodologies
4.1 Organizational Structure
At the outset of this exercise we used the four categories defined by Lerner (2018) in her review of
cumulative effects frameworks: causal frameworks, ecological risk assessment frameworks (ERAFs),
ecosystem models, cumulative impact mapping. As we progressed with the screening we found it useful to
group the methods from the literature into three new categories in terms of the nature of the assessment:
spatial, analytical and modeling methods. These categories roughly align with the steps described in the
assessment step (Section 1.3): spatial methods are often used to evaluate the condition of VCs and
stressors, analytical methods aim to quantify the functional relationships for impact pathways, and
modeling methods enable the evaluation of alternative scenarios. Using the Pathways of Effects model
(Appendix A) as a reference, we have further divided the methods according to the portion of the system
that the assessment focuses on (Figure 4.1); e.g., stressors, VCs or pathways.
Methods do not divide perfectly into mutually exclusive categories. In some cases, one method may be an
input for another method. In other cases, there is some overlap in approaches discussed in two different
methods (e.g., many methods have a spatial component). We have divided methods based on their primary
characteristics acknowledging that there is some overlap among methods. In addition, several supporting
methods were identified (i.e., Indigenous knowledge, expert elicitation, and decision support tools) and are
documented in Section 6.
Figure 4.1. Organizational structure for the evaluation of cumulative effects assessment methods
Appendix C
ESSA Technologies Ltd.
2 8 | P a g e
4.2 Spatial Methods
4.2.1 Overview
Spatial methods to assessing cumulative effects involve identifying the locations of stressors and VCs to
understand how VCs are being exposed to stressors (i.e., geographical overlap) and the way that exposure
results in different levels of effect. Spatial approaches can entail simply mapping locations to understand
where there are different types of stressors and VCs as well as using characteristics about the stressors
and VCs along with analytical approaches or modeling to better understand the magnitudes of effect. In
this way, spatial approaches are not distinct from analytical and modeling methods but rather
complementary.
Spatial methods are often conducted early in a CEA process as they can highlight geographical areas to
focus on (e.g., areas with many stressors acting on VCs) and priority pathways (e.g., a pathway where the
stressor and VC are often interacting). In this section, we focus on spatial approaches related to mapping,
which is essentially one method that can be used alone or with other analytical or modeling methods,
described in Sections 4.3 and 4.4.
Mapping human activities and VCs involves identifying locations and associated characteristics (i.e., a
spatial representation of the stressor or VC condition). For example, for an ecological VC, this can include
identifying areas in which the species has been observed and the population levels within each of those
areas. Mapping multiple activities and/or VCs brings together single activity and single VC maps by
overlaying activities and values to highlight areas where different VCs are exposed to different activities.
4.2.1.1 Stressors
Identifying locations for human activities is often easier than for VCs because data collection can be built
into the activity. For example, the Automatic Identification System (AIS) is a tracking system that collects
vessel movement information while vessels are operational using a global positioning system receiver
(GPS) (Marine Traffic 2018). With data collection occurring while vessels are underway, AIS data are
constantly being gathered and can easily be used for a variety of purposes. One way in which AIS data are
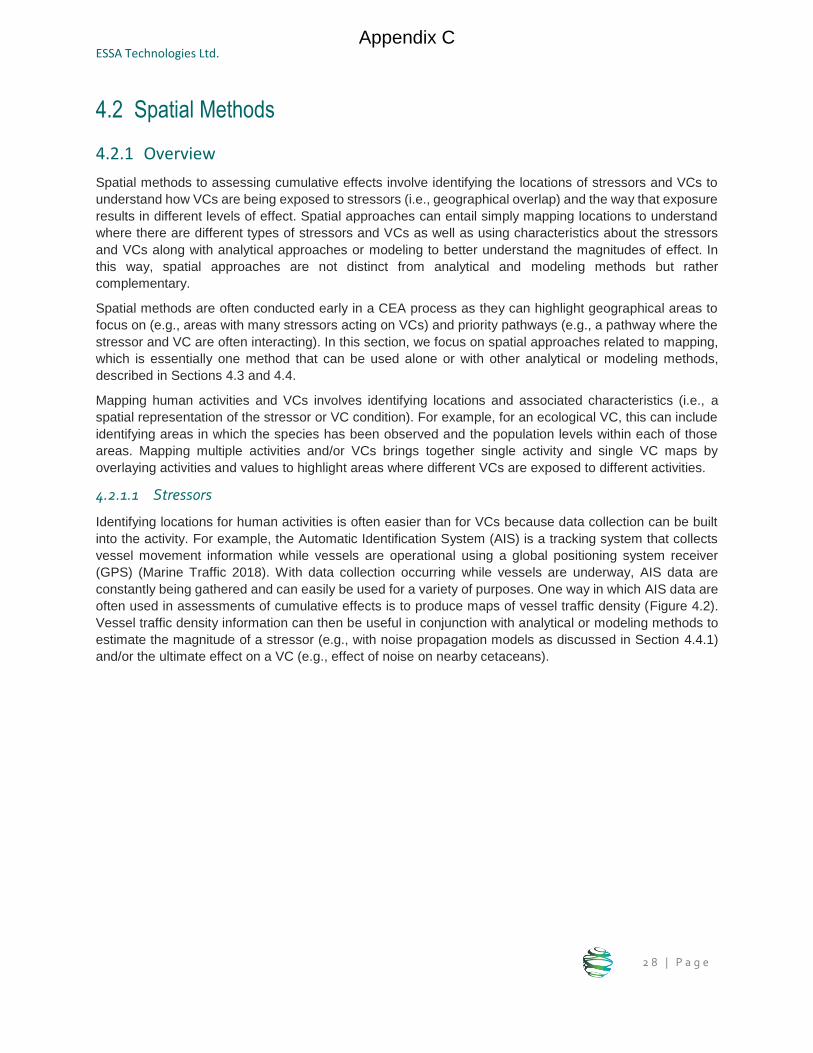
often used in assessments of cumulative effects is to produce maps of vessel traffic density (Figure 4.2).
Vessel traffic density information can then be useful in conjunction with analytical or modeling methods to
estimate the magnitude of a stressor (e.g., with noise propagation models as discussed in Section 4.4.1)
and/or the ultimate effect on a VC (e.g., effect of noise on nearby cetaceans).
Appendix C
Evaluation of Cumulative Effects Assessment Methodologies for Marine Shipping
Final Report
2 9 | P a g e
Figure 4.2. Heat map illustrating intensity of vessel traffic from The Scotian Shelf: An Atlas of Human
Activities (DFO 2005).
For cases in which it is not possible to build data collection into the activity, data can be collected in the
field. Data collection in the field requires monitoring using appropriate methodologies (i.e., how to collect
the data) and sampling designs (i.e., where, when and how often to collect the data). A methodology often
useful for human activities is surveys, whereby observations of activities are recorded in a systematic way
by repeatedly recording observations along specific transects. In designing this type of monitoring, a
statistician should be consulted to ensure a robust design.
However, field monitoring can be costly and so it may be more efficient to compile estimates through
engaging people involved in the activity. This is often done using surveys to ask individuals about where
and when they were in different places and what they were doing. An example of this is creel surveys that
are conducted with fishers as they return from fishing. In these surveys, fishers are asked where they were
fishing, how long they were fishing, and what they caught, which provides location and magnitude data
related to the fishing stressor (i.e., location and magnitude).
Additionally, locations and characteristics of human activities can be estimated based on Indigenous
knowledge or expert opinion, both of which are further discussed in Section 6.
4.2.1.2 Valued components
Mapping ecological, cultural, and socioeconomic VCs can be conducted using multiple methods, including
field-based monitoring, eliciting expert opinion, and engaging with Indigenous knowledge holders.
Mapping ecological VCs can be difficult, especially in aquatic environments, because they can be difficult
to detect thereby requiring sampling techniques to determine their locations. The type of sampling method
to employ depends on the VC. Although it is out of scope to identify the monitoring methods for all potentially
relevant VCs, some examples include: Monitoring for cetaceans by conducting surveys along
Appendix C
ESSA Technologies Ltd.
3 0 | P a g e
predetermined transects; and monitoring for crabs through deployment of crab traps. In addition, some
methods may allow for monitoring multiple VCs (e.g., underwater SCUBA surveys can be used to collect
data related to multiple different species).
Locations and characteristics of ecological, cultural, and socioeconomic VCs can also be estimated through
engaging with Indigenous knowledge holders (further discussed in Section 6.1). In some cases, Indigenous
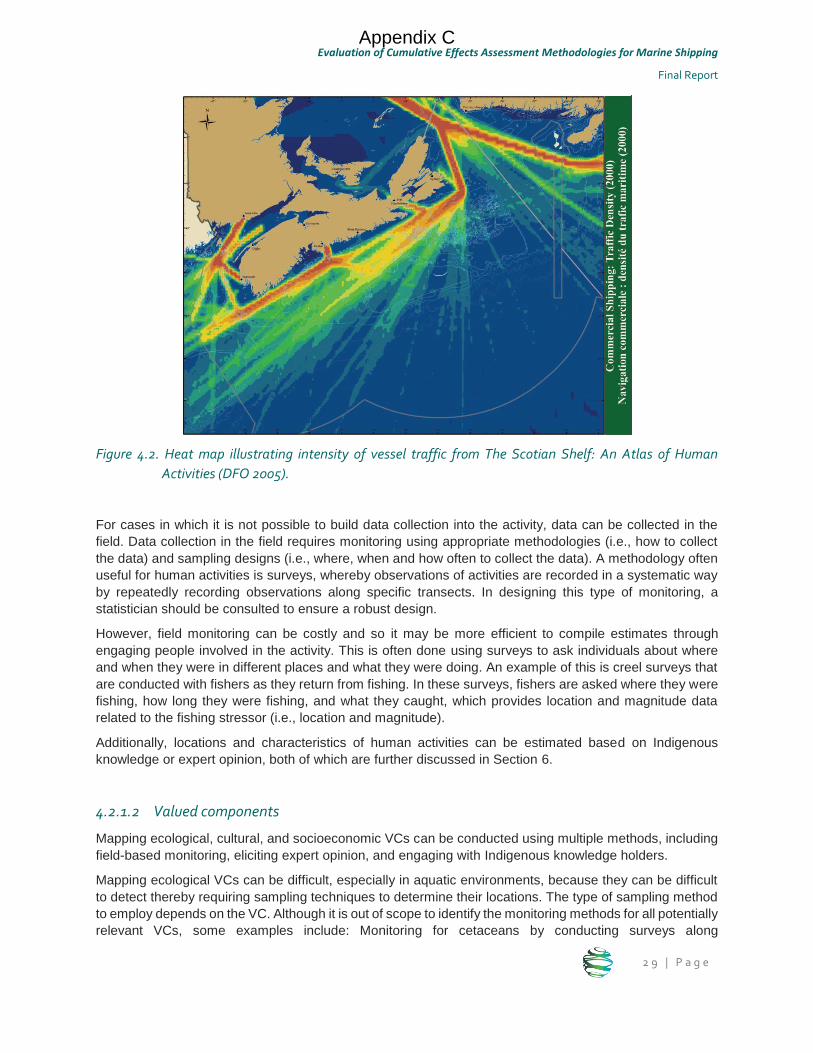
communities may have already undertaken initiatives to document this information. For example, in Haida
Gwaii, British Columbia, the Haida Marine Traditional Knowledge (HMTK) project was initiated in 2007 by
the Haida Fisheries Program to research and document Haida culture, traditions and knowledge related to
the Haida Gwaii marine area (CHN 2011a). As part of this project, interviews were conducted with
community members and significant sites, fishing areas, and ecological features were mapped. Figure 4.3
displays part of a large map that was produced to complement multiple reports (CHN 2011b).
Locations and characteristics of ecological and socioeconomic VCs can also be estimated using expert
opinion. This method is further discussed in Section 6.2.
Upon mapping the locations and characteristics of VCs, maps can be overlaid with maps of stressors to
identify priority pathways (e.g., ones in which a VC is highly exposed to a specific stressor) and priority
geographical areas (e.g., where VCs are exposed to multiple stressors). Risk assessment discussed in
Section 4.3 builds on this kind of spatial analysis. This information can then be used to support analytical
and modeling methods which further explore the magnitude and nature of the effects on different identified
VCs.
Figure 4.3. Part of the Haida Ocean & Way of Life Map produced as part of the Haida Marine Traditional
Knowledge Study.
4.2.1.3 Pathways
One method that has connected stressors and VCs and is heavily focused on mapping is cumulative impact
mapping (Halpern 2008 Ban et al. 2010, Micheli et al. 2013, Clarke Murray et al. 2015, Depellegrin et al.
2017, Mach et al. 2017, Andersen and Stock 2013, Korpinen et al. 2012). At its most basic level, cumulative
impact mapping is stressor focused as it involves identifying the multiple activities occurring across a space
Appendix C
Evaluation of Cumulative Effects Assessment Methodologies for Marine Shipping
Final Report
3 1 | P a g e
and using information about the activities (i.e., types and levels of stressors) to make inferences about the
levels of cumulative pressures occurring in the space. However, cumulative impact mapping builds upon
that, using information about the sensitivity and vulnerability of VCs from expert elicitation to assess how
the cumulative pressures in the space may be affecting the VCs (Halpern et al. 2008). Ban et al (2010)
applied this approach on the western coast of Canada.
4.2.2 Evaluation Criteria
4.2.2.1 Relevance
Usefulness
Type and intensity of vessel traffic differs spatially along Canadian coasts. These differences result in
different types and intensities of stressors, which then act on different suites of values. Identifying and
mapping the suites of stressors occurring in different spaces allows for identifying hotspots of concern or
areas where management efforts can be focused (Ban et al. 2010). Further identifying and mapping suites
of VCs allow for highlighting spaces where specific management actions may be applied to reduce effects
on specific values. In addition, mapping activities and VCs can be used along with other methods to either
highlight areas where more detailed methods should be used, or to make spatially explicit the inferences
that result from the other methods.
Spatial & temporal scale
Mapping locations and characteristics of stressors and VCs has been undertaken at global, regional, and
local scales. Mapping has occurred for particular stressors (e.g., PSF 2015), for specific valued components
(e.g., CHN 2011a), and for examining how stressors can cumulatively impact the ecosystem using the
cumulative impact mapping approach developed by Halpern et al. (2008) (Ban et al. 2010, Mach et al.
2017). Smaller scale assessments are able to present results with more geographical specificity. For
example, Halpern et al. (2008) conducted a global assessment and highlighted global areas of concern,
whereas Ban et al. (2010) focused specifically on the British Columbia coastline and highlighted areas
specific to British Columbia (Figure 4.4).
Although mapping cumulative impacts can be conducted at multiple spatial scales, it is important to note
the spatial scale of the data being used and assumptions embedded within those datasets, so that
inferences are not made at scales that are finer than the datasets allow. In determining the best spatial
scale to conduct an assessment, consideration should be given to the scale of the different types of human
activities and VCs as well as the spatial scale of how management activities can be implemented. When
these considerations lead to multiple relevant scales (e.g., different VCs require different scales),
assessments need to be conducted at multiple scales, which can be undertaken using a nested approach
(R. Martone, pers. comm.).
Appendix C
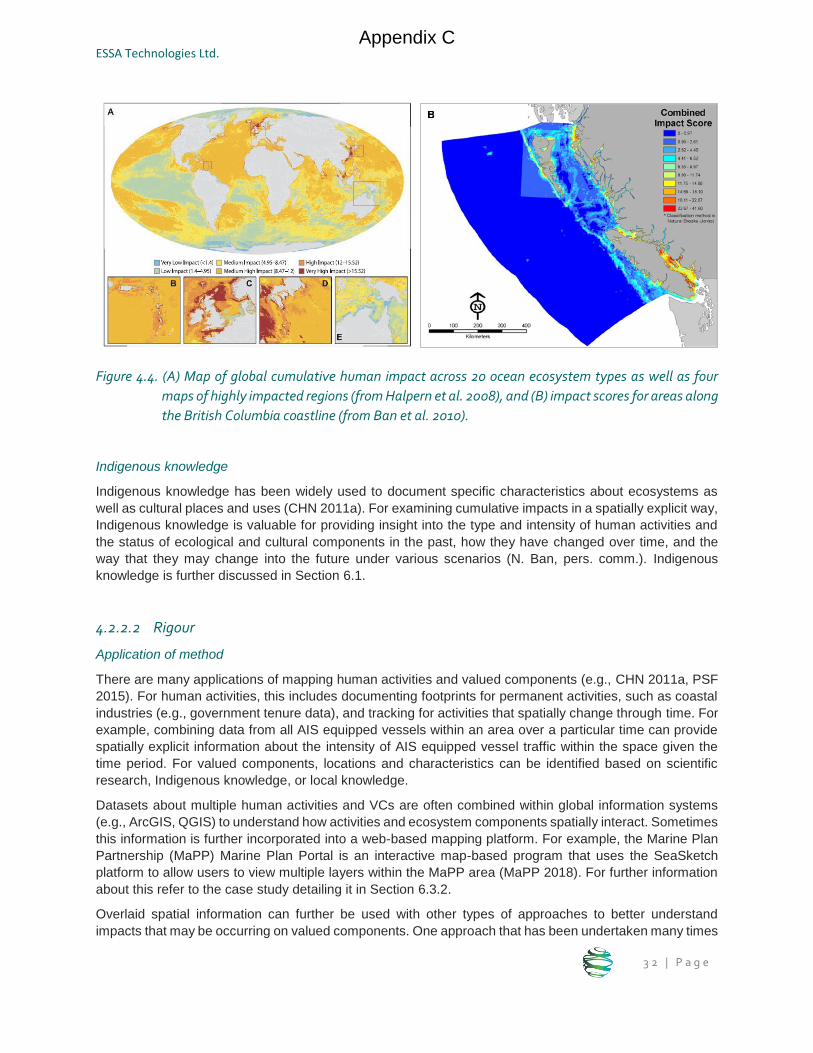
ESSA Technologies Ltd.
3 2 | P a g e
Figure 4.4. (A) Map of global cumulative human impact across 20 ocean ecosystem types as well as four
maps of highly impacted regions (from Halpern et al. 2008), and (B) impact scores for areas along
the British Columbia coastline (from Ban et al. 2010).
Indigenous knowledge
Indigenous knowledge has been widely used to document specific characteristics about ecosystems as
well as cultural places and uses (CHN 2011a). For examining cumulative impacts in a spatially explicit way,
Indigenous knowledge is valuable for providing insight into the type and intensity of human activities and
the status of ecological and cultural components in the past, how they have changed over time, and the
way that they may change into the future under various scenarios (N. Ban, pers. comm.). Indigenous
knowledge is further discussed in Section 6.1.
4.2.2.2 Rigour
Application of method
There are many applications of mapping human activities and valued components (e.g., CHN 2011a, PSF
2015). For human activities, this includes documenting footprints for permanent activities, such as coastal
industries (e.g., government tenure data), and tracking for activities that spatially change through time. For
example, combining data from all AIS equipped vessels within an area over a particular time can provide
spatially explicit information about the intensity of AIS equipped vessel traffic within the space given the
time period. For valued components, locations and characteristics can be identified based on scientific
research, Indigenous knowledge, or local knowledge.
Datasets about multiple human activities and VCs are often combined within global information systems
(e.g., ArcGIS, QGIS) to understand how activities and ecosystem components spatially interact. Sometimes
this information is further incorporated into a web-based mapping platform. For example, the Marine Plan
Partnership (MaPP) Marine Plan Portal is an interactive map-based program that uses the SeaSketch
platform to allow users to view multiple layers within the MaPP area (MaPP 2018). For further information
about this refer to the case study detailing it in Section 6.3.2.
Overlaid spatial information can further be used with other types of approaches to better understand
impacts that may be occurring on valued components. One approach that has been undertaken many times
Appendix C
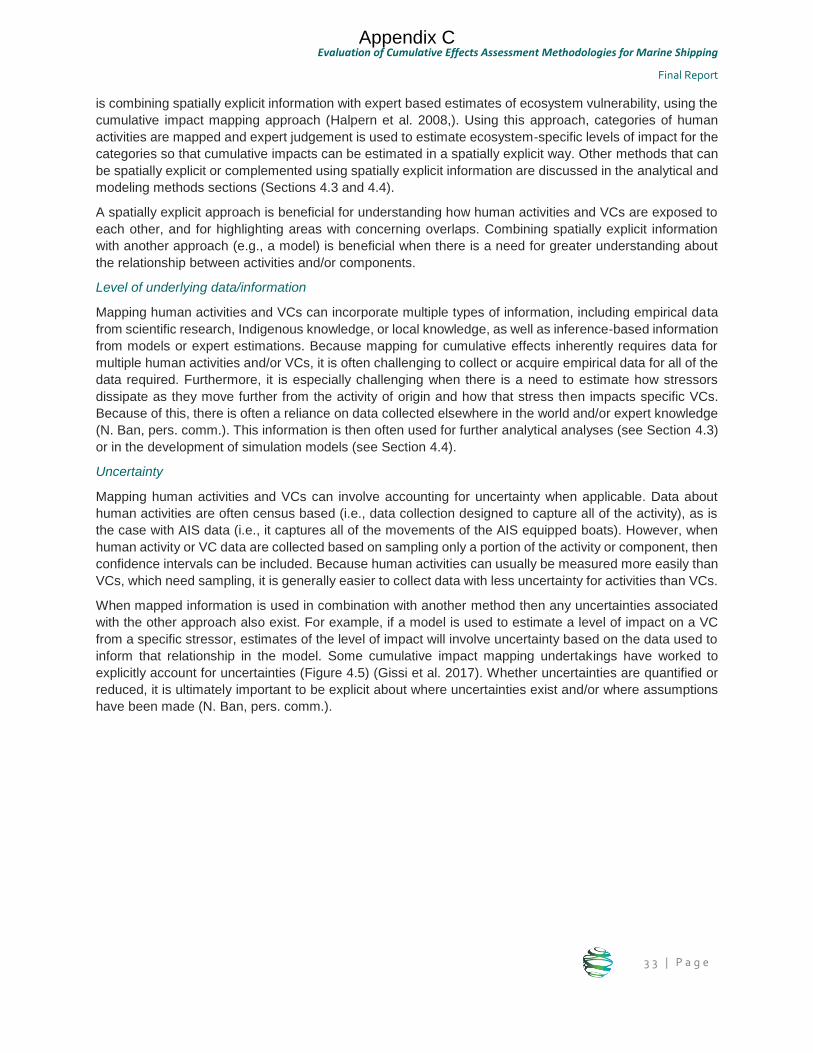
Evaluation of Cumulative Effects Assessment Methodologies for Marine Shipping
Final Report
3 3 | P a g e
is combining spatially explicit information with expert based estimates of ecosystem vulnerability, using the
cumulative impact mapping approach (Halpern et al. 2008,). Using this approach, categories of human
activities are mapped and expert judgement is used to estimate ecosystem-specific levels of impact for the
categories so that cumulative impacts can be estimated in a spatially explicit way. Other methods that can
be spatially explicit or complemented using spatially explicit information are discussed in the analytical and
modeling methods sections (Sections 4.3 and 4.4).
A spatially explicit approach is beneficial for understanding how human activities and VCs are exposed to
each other, and for highlighting areas with concerning overlaps. Combining spatially explicit information
with another approach (e.g., a model) is beneficial when there is a need for greater understanding about
the relationship between activities and/or components.
Level of underlying data/information
Mapping human activities and VCs can incorporate multiple types of information, including empirical data
from scientific research, Indigenous knowledge, or local knowledge, as well as inference-based information
from models or expert estimations. Because mapping for cumulative effects inherently requires data for
multiple human activities and/or VCs, it is often challenging to collect or acquire empirical data for all of the
data required. Furthermore, it is especially challenging when there is a need to estimate how stressors
dissipate as they move further from the activity of origin and how that stress then impacts specific VCs.
Because of this, there is often a reliance on data collected elsewhere in the world and/or expert knowledge
(N. Ban, pers. comm.). This information is then often used for further analytical analyses (see Section 4.3)
or in the development of simulation models (see Section 4.4).
Uncertainty
Mapping human activities and VCs can involve accounting for uncertainty when applicable. Data about
human activities are often census based (i.e., data collection designed to capture all of the activity), as is
the case with AIS data (i.e., it captures all of the movements of the AIS equipped boats). However, when
human activity or VC data are collected based on sampling only a portion of the activity or component, then
confidence intervals can be included. Because human activities can usually be measured more easily than
VCs, which need sampling, it is generally easier to collect data with less uncertainty for activities than VCs.
When mapped information is used in combination with another method then any uncertainties associated
with the other approach also exist. For example, if a model is used to estimate a level of impact on a VC
from a specific stressor, estimates of the level of impact will involve uncertainty based on the data used to
inform that relationship in the model. Some cumulative impact mapping undertakings have worked to
explicitly account for uncertainties (Figure 4.5) (Gissi et al. 2017). Whether uncertainties are quantified or
reduced, it is ultimately important to be explicit about where uncertainties exist and/or where assumptions
have been made (N. Ban, pers. comm.).
Appendix C
ESSA Technologies Ltd.
3 4 | P a g e
Figure 4.5. Coefficient of variation (CV) resulting from the Monte Carlo simulation of the four input factors
used in the uncertainty analysis in Gissi et al. (2017).
4.2.2.3 Feasibility
Complexity
Spatial approaches can vary in complexity. Mapping that makes explicit the locations and characteristics
of human activities or VCs can be relatively low in complexity. This type of mapping and analyzing overlaid
information requires GIS capabilities (e.g., ArcGIS or QGIS) and knowledge related to analyzing different
types of datasets (e.g., boat tracks, species habitat use, etc.). Complexity can increase when combining
mapped information with other assessment methods (e.g., modeling) depending on the complexity of the
other approach.
Data/information requirements
Data or information requirements depend on the number of human activities and/or VCs that are included
in the scope of the assessment. The more human activities or VCs in the assessment, the greater the data
requirements.
In order to assess the cumulative pressure from the comprehensive suite of human activities within a space,
spatially explicit data are required related to all of the human activities within the space of interest. To
subsequently assess the stressors that are produced by those human activities, information is required
about which activities produce which stressors and in what ways (e.g., information about noise dissipates
with distance from the source vessel; see Section 4.4 for how single stressor model can be used to simulate
this type of information). To assess the exposure of VCs to activities and stressors, spatially explicit data
Appendix C
Evaluation of Cumulative Effects Assessment Methodologies for Marine Shipping
Final Report
3 5 | P a g e
are required about the distribution of VCs within the space of interest (see Section 4.3 for analytical methods
to estimating distributions).
A complimentary analytical or modeling method can be beneficial for estimating how the VCs are affected
by the stressors. In doing so, information is required about how stressors affect components of the system
and how multiple stressors and components interact (e.g., whether the effect from two stressors on a
component is additive, synergistic, or antagonistic). Data and information requirements associated with
analytical and modeling methods are further discussed in Sections 4.3 and 4.4.
In the absence of quantitative data, Indigenous knowledge (Section 6.1) or expert judgement (Section 6.2)
may be useful for filling data gaps. Alternatively, assumptions may be used, so long as the assumptions
are made explicit (N. Ban, pers. comm.).
Data flexibility
Because mapping human activities and VCs inherently incorporates multiple types of information, including
empirical data and inference-based information, there is a large degree in the flexibility related to
incorporating data not specifically gathered for a cumulative effects assessment and for using data from
expert judgement in the absence of empirical data. In fact, cumulative impact mapping often relies on
datasets collected for other purposes (Halpern et al. 2008, Ban et al. 2010), which can include human
activity data tracked on an ongoing basis (e.g., AIS data) or as part of a specific research project (e.g.,
species population data gathered for a PhD thesis). If mapping of activities and VCs is combined with
another approach, further data limitations may exist according to the flexibility of the other approach.
Accessibility
Because mapping of locations of human activities and VCs has been conducted many times, information
about methods for doing so are accessible. Furthermore, GIS software systems (i.e., ArcGIS, QGIS) used
to undertake mapping are commonly used and there is a wide support network of people to support the use
of these systems.
Cost
Undertaking mapping activities varies depending on the scope of the assessment, availability of data, and
availability of software and human resources. Undertakings can be scoped based on gathering specific
human activity and/or specific VC data (e.g., only examining vessel traffic related to ferries as opposed to
multiple types of vessels) and scoped based on different spatial and temporal scales. In addition, cost will
vary depending on data availability, as cost will greatly increase with the need to gather empirical data,
conduct expert elicitation exercises, or engage Indigenous knowledge holders.
Interpretability & communicability
Maps are beneficial for communicating and interpreting information, and this includes maps of locations of
human activities and VCs. When combining mapped information with other methods, results may become
more complicated to communicate depending on the complexity of the other method. In general, if ease of
communication and interpretability is important, using a spatially explicit approach will allow for presenting
results on maps, which aids communication.
Appendix C
ESSA Technologies Ltd.
3 6 | P a g e
4.3 Analytical Methods
4.3.1 Overview
This section does not capture the vast literature on statistical methods. Rather it identifies a few key
methods that are relevant in the context of the CEMS initiative. This section differs from the other sections
in that the methods focus on how to use empirical information4. Specifically, we describe how to evaluate
the spatial distribution of Valued Components, characterize risk, and quantify functional relationships for
hypothesized pathways.
4.3.1.1 Stressors
The condition or magnitude of activities (e.g., movement underway) can usually be measured directly and
relatively easily as it is the thing we are actually in control of. Quantifying the stressors (e.g., noise) resulting
from a given activity is more difficult. In general, the stressors are quantified using mechanistic models
(refer to Stressor models Section 4.4.1) based on empirical data for the related activity. While there may
be some exceptions, there is limited value in further exploring analytical methods for quantifying stressors.
4.3.1.2 Valued Components
Methods for monitoring and evaluating the condition of VCs (e.g., abundance of whales) are more complex
than for activities. This is because VCs are not directly within our control, they tend to be found across
broad spatial scales making a sampling approach necessary, and they are often difficult to detect. There
are a variety of methods which may be applicable including: capture-recapture studies, radio-tracking, or
visual surveys. Collectively the combination of sampling design and field methodologies can be referred to
as monitoring design, which is beyond the scope of this report. In general, a statistician should be consulted
to design a robust monitoring program.
There are, however, a few analytical methods associated with identifying the spatial distribution of VCs
which are likely to be of particular use to the CEMS initiative and are discussed further in this section.
Home-range Estimation
Summary
Identification of home-ranges or areas which are most important to VCs during different life-stages or times
of year. These distributions could be overlaid with corresponding maps of stressors to identify exposure
hotspots.
4 Empirical: “originating in or based on observation or experience” Merriam-Webster [https://www.merriam-
webster.com/dictionary/empirical]
Appendix C
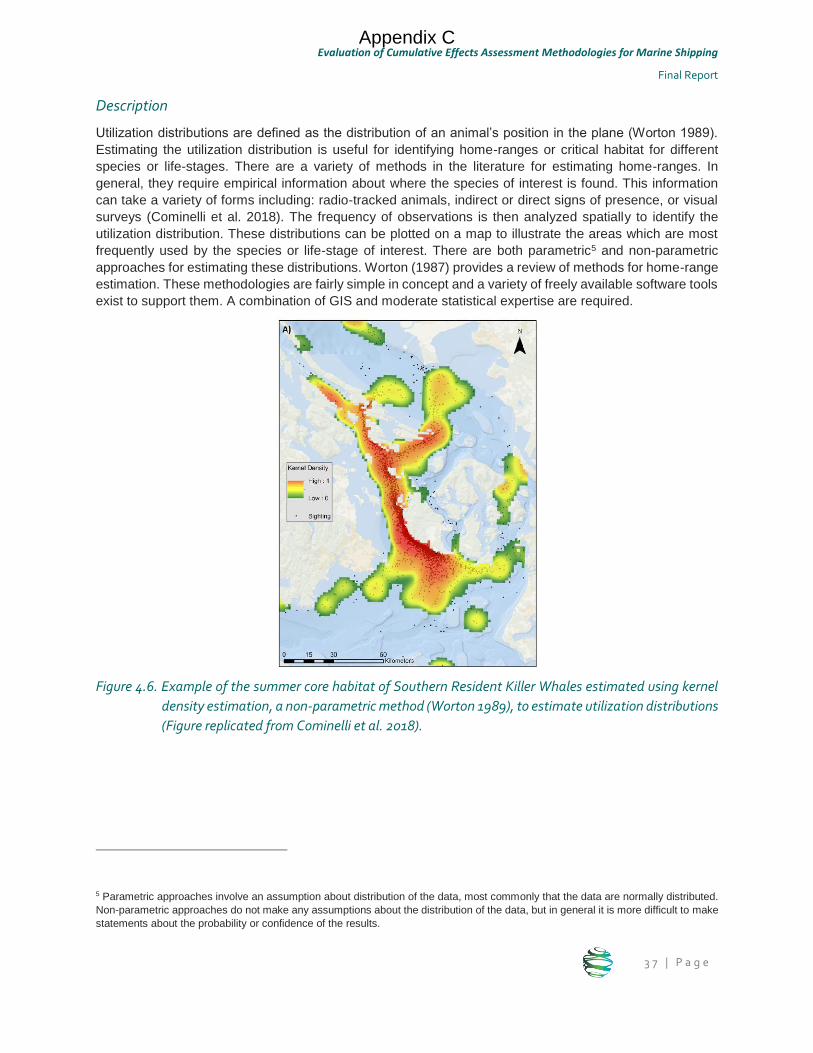
Evaluation of Cumulative Effects Assessment Methodologies for Marine Shipping
Final Report
3 7 | P a g e
Description
Utilization distributions are defined as the distribution of an animal’s position in the plane (Worton 1989).
Estimating the utilization distribution is useful for identifying home-ranges or critical habitat for different
species or life-stages. There are a variety of methods in the literature for estimating home-ranges. In
general, they require empirical information about where the species of interest is found. This information
can take a variety of forms including: radio-tracked animals, indirect or direct signs of presence, or visual
surveys (Cominelli et al. 2018). The frequency of observations is then analyzed spatially to identify the
utilization distribution. These distributions can be plotted on a map to illustrate the areas which are most
frequently used by the species or life-stage of interest. There are both parametric5 and non-parametric
approaches for estimating these distributions. Worton (1987) provides a review of methods for home-range
estimation. These methodologies are fairly simple in concept and a variety of freely available software tools
exist to support them. A combination of GIS and moderate statistical expertise are required.
Figure 4.6. Example of the summer core habitat of Southern Resident Killer Whales estimated using kernel
density estimation, a non-parametric method (Worton 1989), to estimate utilization distributions
(Figure replicated from Cominelli et al. 2018).
5 Parametric approaches involve an assumption about distribution of the data, most commonly that the data are normally distributed.
Non-parametric approaches do not make any assumptions about the distribution of the data, but in general it is more difficult to make
statements about the probability or confidence of the results.
Appendix C
ESSA Technologies Ltd.
3 8 | P a g e
Habitat Suitability Models (HSM)
Summary
Similar to home-range estimation, habitat suitability models are useful for estimating spatial distributions of
VCs. The additional benefit of habitat suitability models is that future distributions may be predicted under
different habitat scenarios. HSM are a useful tool to support spatially explicit simulation models (Section
4.4).
Description
Habitat suitability modeling (HSM) is a method for predicting the quality or suitability of habitat for a given
species based on known affinities with habitat attributes such as habitat structure, habitat type and spatial
arrangements between habitat features (e.g., depth, substrate, cover type, etc.). This information can be
combined with maps of those same habitat attributes to produce maps of expected distributions of species
and life stages. Unlike home-range estimation HSM requires information about both habitat and species
occurrence or abundance and habitat data must be collected at locations where the species does not
occur as well as where it does. The basic idea is that when habitat resources are used disproportionately
to their availability, the species is preferentially selecting the resource (Manly et al. 2002).
HSM typically relies on regression techniques to quantify the relationship between habitat and species
occurrence or abundance. In data-poor situations, a literature review of the available information or expert
opinion may be used to develop the initial models. Once suitability index values have been calculated for
the habitat characteristics, by one or another of the methods described above, they can be mapped
individually and combined into a composite map. The resultant map will show the expected distribution of
habitat suitability for each species and/or life stage included in the analysis. HSM vary in generality and
precision, due in part to the sometimes limited quantitative and often qualitative nature of existing
information. Once the relationship between habitat and the species of interest is quantified, that relationship
can be used to predict distributions in places where no direct observations of the species exist or to predict
distributions under alternative future scenarios.
These methodologies are still simple in concept although the analysis is slightly more involved. Like home-
range estimation there are a variety of freely available software tools to support HSM (Guisan et al. 2017).
A combination of GIS and moderate statistical expertise are required.
4.3.1.3 Pathways
This section describes methods for quantifying the functional relationships between stressors and VCs (i.e.,
the pathways in the PoE model, Appendix A) and determining the relative importance of different pathways.
Functional relationships between one stressor and one VC may take a variety of forms (e.g., linear or
exponential). Analysis may be completed for a single pathway but also for multiple pathways
simultaneously. Effects of multiple stressors may be additive or synergistic. Understanding the nature,
magnitude, and relative importance of different pathways can help to focus the scope of the assessment,
inform thresholds, parameterize models, and ultimately inform management actions.
Appendix C
Evaluation of Cumulative Effects Assessment Methodologies for Marine Shipping
Final Report
3 9 | P a g e
Risk Assessment
Summary
Risk assessment may be useful to the CEMS initiative as a way of identifying locations where exposure to
stressors may be the greatest in each region and also which impacts (e.g., stressor-VC pathways) are most
likely.
Description
Risk assessments evaluate the exposure of some entity (e.g., VC) to a stressor (or multiple stressors), and
determine the consequence of this adverse exposure. For example, an analysis involving risk assessment
may examine the overlap of a species’ range with a particular stressor and, therefore, its exposure to that
stressor (Murray et al. 2014). Risk is typically defined as the probability of occurrence of a stressor, or
hazard, and the magnitude of its consequences; hazard is defined as something that has the potential to
cause harm (Manuilova 2003). Risk is often portrayed along two axes, with the exposure of a valued
component (VC) to a stressor on the x-axis, and its sensitivity to that stressor on the y-axis.
Some studies estimate the severity of a list of potential stressors of relevance by consulting with experts in
the field, often through the use of surveys (Halpern et al. 2007, Grech et al. 2008, Stelzenmuller et al. 2010).
Similarly, some studies made use of a phased, screening framework to iteratively assess the risk to VCs
given under different stressor scenarios. The screening approach can be in the form of a multi-criteria
analysis6 (Stelzenmuller et al. 2010, Hobday et al. 2011, Furlan 2017), or a computer-based programs
(Manuilova 2003, DFO 2012, DFO 2014).
Impact scores may be generated for VCs through application of stringent criteria with threshold values
(Wood et al. 2012, Lawson and Lesage 2013, O et al. 2015, and Herkul et al. 2017). The risk impact scores
are the product of exposure and consequence scores, determined through analysis of quantitative data
within a qualitative criteria framework.
Several studies have applied a geospatial analysis of the distribution of activities, stressors, and valued
components of concern to graphically depict areas of highest risk, and aid management decisions (Halpern
et al. 2007, Grech et al. 2008, Stelzenmuller et al. 2010, Parravicini et al. 2012). An advantage of
geospatially-focused assessments is that larger areas can be analyzed at the synoptic level, allowing data-
scarce systems to still be broadly assessed. However, one issue with geospatial analyses is that stressors
are typically site-specific, and broad extrapolation of their effects at larger spatial scales can be difficult
(Parravicini et al. 2012).
Regression Analysis
Summary
Regression analysis is a general class of analysis which can be used to quantify the relationships between
stressors and VCs based on empirical data. This approach can be used to determine the direction, shape
and magnitude of the functional relationship between a given stressor and a VC. It can also be used to help
determine the relative importance of different pathways for a given VC. Additional environmental covariates
6 GIS-based multi-criteria analysis (MCA) is a tool that generates alternate outcomes based on how input parameters, such as the
rank order of the stressor, are altered. Any simulated outcome from the MCA that is considered to have a higher level of risk associated
with it should flag for decision makers that alternate human-activity scenarios should be considered.
Appendix C
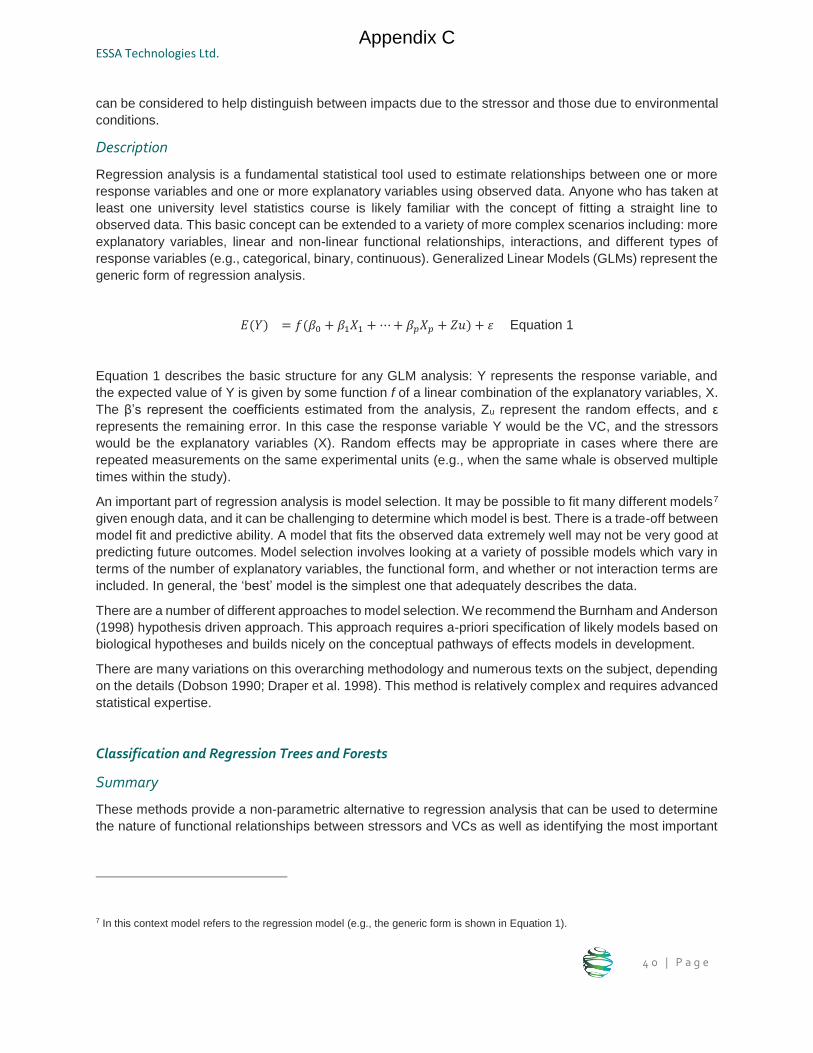
ESSA Technologies Ltd.
4 0 | P a g e
can be considered to help distinguish between impacts due to the stressor and those due to environmental
conditions.
Description
Regression analysis is a fundamental statistical tool used to estimate relationships between one or more
response variables and one or more explanatory variables using observed data. Anyone who has taken at
least one university level statistics course is likely familiar with the concept of fitting a straight line to
observed data. This basic concept can be extended to a variety of more complex scenarios including: more
explanatory variables, linear and non-linear functional relationships, interactions, and different types of
response variables (e.g., categorical, binary, continuous). Generalized Linear Models (GLMs) represent the
generic form of regression analysis.
𝐸(𝑌) = 𝑓(𝛽0 + 𝛽1𝑋1 +⋯+ 𝛽𝑝𝑋𝑝 + 𝑍𝑢) + 𝜀 Equation 1
Equation 1 describes the basic structure for any GLM analysis: Y represents the response variable, and
the expected value of Y is given by some function f of a linear combination of the explanatory variables, X.
The β’s represent the coefficients estimated from the analysis, Zu represent the random effects, and ε
represents the remaining error. In this case the response variable Y would be the VC, and the stressors
would be the explanatory variables (X). Random effects may be appropriate in cases where there are
repeated measurements on the same experimental units (e.g., when the same whale is observed multiple
times within the study).
An important part of regression analysis is model selection. It may be possible to fit many different models7
given enough data, and it can be challenging to determine which model is best. There is a trade-off between
model fit and predictive ability. A model that fits the observed data extremely well may not be very good at
predicting future outcomes. Model selection involves looking at a variety of possible models which vary in
terms of the number of explanatory variables, the functional form, and whether or not interaction terms are
included. In general, the ‘best’ model is the simplest one that adequately describes the data.
There are a number of different approaches to model selection. We recommend the Burnham and Anderson
(1998) hypothesis driven approach. This approach requires a-priori specification of likely models based on
biological hypotheses and builds nicely on the conceptual pathways of effects models in development.
There are many variations on this overarching methodology and numerous texts on the subject, depending
on the details (Dobson 1990; Draper et al. 1998). This method is relatively complex and requires advanced
statistical expertise.
Classification and Regression Trees and Forests
Summary
These methods provide a non-parametric alternative to regression analysis that can be used to determine
the nature of functional relationships between stressors and VCs as well as identifying the most important
7 In this context model refers to the regression model (e.g., the generic form is shown in Equation 1).
Appendix C
Evaluation of Cumulative Effects Assessment Methodologies for Marine Shipping
Final Report
4 1 | P a g e
pathways. They don’t have the same restrictive assumptions about distribution and may be better able to
address large numbers of potential stressor pathways.
Description
Classification and Regression Trees (CART) are a non-parametric alternative to regression analysis.
Classification refers to the case where the response variable is categorical and regression trees are used
otherwise. They are a form of binary recursive partitioning. Beginning with the full data set, the software
determines which variable is the best to split the dataset and at what value of the variable. Now the data is
split into two nodes based on a rule for a single variable. Then for each of the nodes the best splitting
variable is chosen until the full tree is built and no more splits are possible. There are generally options
available to limit the extent of the tree. The splitting criteria are chosen to maximize the reduction in
heterogeneity, in other words to split the data so that the response variables within each node are similar.
A weakness of simple regression trees is that they can be unstable (i.e., highly dependent on the particular
set of observations). Regression Forests essentially replicate the regression tree process many times using
a new subset of the data every time. Final predictions use the average findings across all observed trees.
This method may be useful when there is a lot of data and limited prior knowledge about the system.
These methods are relatively easy to implement using freely available canned software tools such as: rpart
or randomForestSRC (R Core Team). Brieman et al. (1984) provides detailed guidance on implementation.
Principal Components Analysis
Summary
Principal Components Analysis (PCA) could be a useful method for determining which stressors or
combinations of stressors are most important for a particular VC. This would provide valuable focus for
subsequent analysis and modeling efforts.
Description
Data reduction and interpretability are the primary goals of a PCA. This is particularly useful when there are
a large number of potential explanatory variables (stressors in this case) some of which may be correlated.
PCA is a mathematical procedure which transforms the larger number of possibly correlated variables into
a smaller number of uncorrelated variables called ‘principal components’. Components are linear
combinations of the original variables. The nature of the linear combination can give insight into the
combined effect of multiple variables. The idea is to try and determine which components explain the
majority of the total system variability. Although you may need many variables to describe all of the
variability, it is often the case that only a few principal components are needed to account for most of the
variability in the system (Johnson and Wichern 2002). This method is often used in exploratory analysis
and may provide inputs to a multiple regression or cluster analysis.
Weight of evidence
Relevance
Understanding the relative importance of different pathways on a VC helps to focus research and
management strategies. In practice however, it is difficult to quantify the functional relationships of one
pathway let alone the relative importance of many. This is particularly true when data are limited or varied
in nature as is often the case in Cumulative Effects Assessments. Weight of evidence methodologies use
Appendix C
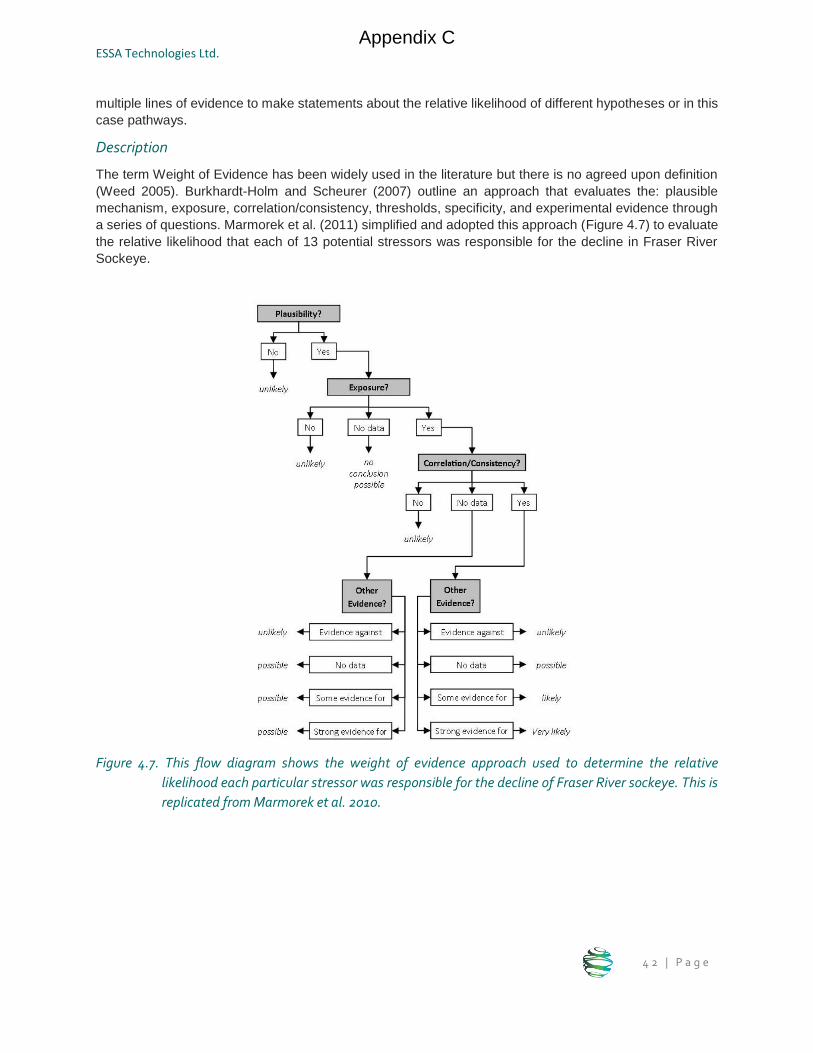
ESSA Technologies Ltd.
4 2 | P a g e
multiple lines of evidence to make statements about the relative likelihood of different hypotheses or in this
case pathways.
Description
The term Weight of Evidence has been widely used in the literature but there is no agreed upon definition
(Weed 2005). Burkhardt-Holm and Scheurer (2007) outline an approach that evaluates the: plausible
mechanism, exposure, correlation/consistency, thresholds, specificity, and experimental evidence through
a series of questions. Marmorek et al. (2011) simplified and adopted this approach (Figure 4.7) to evaluate
the relative likelihood that each of 13 potential stressors was responsible for the decline in Fraser River
Sockeye.
Figure 4.7. This flow diagram shows the weight of evidence approach used to determine the relative
likelihood each particular stressor was responsible for the decline of Fraser River sockeye. This is
replicated from Marmorek et al. 2010.
Appendix C
Evaluation of Cumulative Effects Assessment Methodologies for Marine Shipping
Final Report
4 3 | P a g e
4.3.2 Evaluation Criteria
4.3.2.1 Relevance
Usefulness for the CEMS initiative
The marine ecosystem is incredibly complex and there are many unknowns. A critical component of the
assessment step (Figure 1.2) is to quantify and validate hypotheses about impact pathways using empirical
information. These empirically based assessments can then be used to support evaluation of alternative
scenarios using a variety of modeling methodologies (Section 4.4). The analytical methods described in
this section describe how the CEMS initiative can:
Determine the spatial distribution of VCs of interest.
Develop habitat suitability models so distributions can be predicted based on habitat
characteristics.
Complete risk assessments to identify high priority areas or pathways where the exposure and
consequence are high.
Quantify the magnitude and nature of the functional relationships between stressors and VCs (i.e.,
pathways).
Identify the relative importance of different pathways (i.e., the drivers of the system).
Spatial & temporal scale
While the methods described here are broadly applicable, analytical efforts are likely best applied at
regional or local scales. It may be possible to analyze data from different regions simultaneously, but it is
likely not useful given the regional differences in VCs. In addition, data availability differs greatly by region.
It would be easier to tailor the analytical details to the available data.
Indigenous knowledge
Indigenous knowledge (IK) can comprise empirical information that can be used in conjunction with
analytical approaches. Potential applications of IK with analytical approaches include informing the location
of species generating an index of relative abundance, conducting home-range estimation, undertaking
regression analysis, and informing risk assessment. Additionally, weight of evidence approaches are
particularly well suited to incorporating multiple lines of evidence as may be provided when using
Indigenous knowledge alongside other types information. Any application of IK must be done by or with IK
holders and communities. Indigenous knowledge is further discussed in Section 6.1.
4.3.2.2 Rigour
Application of method
In general, the analytical methodologies are well established and have a strong technical foundation. There
is extensive literature on both the theory and practice of quantitative methods. In terms of their application
to cumulative effects assessment, there are quite a few examples which involve determining the spatial
distribution of VCs and assessing risk. However, there are relatively few examples of pure quantitative
methods being applied to quantify the functional relationships between stressors and VCs. This is likely
because the methods can be intimidating, the underlying relationships are likely very complex (particularly
when multiple pathways are considered), and data are often limited making it difficult to draw concrete
conclusions. Weight of evidence approaches which enable multiple lines of evidence to be considered (e.g.,
risk assessment, correlation analysis, and Indigenous knowledge) are a possible compromise.
Appendix C
ESSA Technologies Ltd.
4 4 | P a g e
Level of underlying data/information
These methods rely on empirical information. If data do not exist, then spatial methods (Section 4.2) based
on expert elicitation (Section 6.1) or models may be generated based on current hypotheses (Section 4.4),
but ultimately some form of observed data are necessary to validate our understanding of the system.
Uncertainty
An advantage of traditional parametric statistical methods is the fact that findings always include a measure
of confidence or uncertainty. Non-parametric methods do not make assumptions about the underlying
distribution and therefore do not directly generate estimates of uncertainty. However, with advances in
computing power, bootstrap8 methods can easily be used to generate confidence intervals. Risk
assessment and Weight of Evidence methods do not explicitly address uncertainty although some authors
may use ad-hoc approaches to account for uncertainty.
4.3.2.3 Feasibility
Complexity
The methods discussed here can be relatively complex for the lay person. There are a number of details
that depend on the specifics of the particular dataset. In general, a statistician should be consulted when
analyzing quantitative data. The simplest concept is likely the idea of estimating exposure (i.e., where the
stressor and the VC overlap). Evaluating a single pathway (i.e., the correlation between one stressor and
one VC) should also be familiar to anyone who has taken a university statistics class. The weight of
evidence approach has intuitive appeal and is conceptually simple. The rest of the methods are likely new
to someone who has limited analytical background.
Data/information requirements
In general, these methods are very data intensive, as they strictly rely on empirical information. The
modeling methods may also be data intensive, but we often rely on expert opinion to initially parameterize
models until we have a better understanding of the quantitative relationships. In this context of the CEMS
initiative, there is likely to be more information about the stressors than the VCs. This will limit which
analyses are possible in each region.
Data flexibility
As described in the previous paragraph, these methods are limited to the available data. There may be
methods that could utilize expert opinion, but for the purpose of this report, the focus of this category of
methods is specifically on making use of empirical information. Different analyses are possible if you have
information on: stressor only, VC only, or both. Spatial information enables additional options. Caution
should be employed when combining information from different studies, particularly when evaluating the
pathways. Methods for estimating spatial distributions are the most flexible in terms of data inputs.
Accessibility
As described in the complexity section, these methods are less accessible than some of the others
discussed in the report. Risk assessment may be an exception as there are a number of tools that have
8 The term bootstrap is derived from the idea of ‘pulling oneself up by the bootstraps’. This methodology relies on computing power to
do the ‘heavy lifting’ and is a relatively recent development [Efron and Tibshurani, 1994]. Bootstrapping essentially involves simulating
the findings many times to produce a distribution of outcomes from which confidence intervals can be extracted.
Appendix C
Evaluation of Cumulative Effects Assessment Methodologies for Marine Shipping
Final Report
4 5 | P a g e
been developed to support this approach (e.g., EcoFate and EUSUS). For moderately experienced
analysts, R (https://www.r-project.org/) is a free open source statistical package which provides tools for all
of the statistical methods discussed here. Weight of evidence methodologies are in their own class as they
require human integration of ideas, difficult for a computer to implement but relatively intuitive for a human.
Cost
The most expensive aspect of utilizing these methods is collecting the data in the first place. A relatively
small investment in analytical support to help set up the analyses also makes sense. We strongly
recommend using R, for implementation of statistical analyses. Where necessary, R is able to interact with
other software (e.g., ArcGIS, QGIS, or MS Access).
Interpretability & communicability
The results for the spatial methodologies are likely easiest to communicate. Presenting spatial distributions
or exposure in the form of a map is extremely intuitive and is appealing to many audiences. The rest of the
methods are more difficult to communicate effectively, and the results of the quantitative analyses will often
require additional processing to help the reader digest.
4.4 Modeling Methods
4.4.1 Overview
The common characteristic of the methods discussed in this section is that they all address cumulative
effects assessment from a modeling perspective. Models can be defined as tools for the abstraction and
simplification of natural systems (USGS) which allow for the analysis of the system and making predictions
about its behaviour. Models vary widely in their purpose, format (e.g., software tools), level of complexity,
data requirements, predictive capacity, etc.
Specifically, for the marine environment, a broad range of modeling approaches have been used to model
cumulative effects (Clarke Murray et al. 2014); from conceptual models describing the system and the
interactions among stressors and Valued Components (VCs) to complex quantitative predictive models
assessing the effects of specific pathways or stressors. As part of the cumulative assessment process,
models can be used for a variety of purposes and at various stages; from conceptual models that articulate
the cause-effects linkages of the system and help identify key components or pathways to quantitative
models that provide an estimation of the magnitude of the impacts and that can be used to explore
management scenarios. A key functionality of modeling methods is their ability to test ‘what if’ scenarios
(Heinänen et al. 2018) and thus link the evaluation of cumulative effects to management or mitigation
actions.
This section covers relevant methods that use a modeling approach for this range of functions by providing
insights into one component of a system (i.e., a stressor or a valued component), multiple components, or
one or multiple pathways (Figure 4.8).
Appendix C
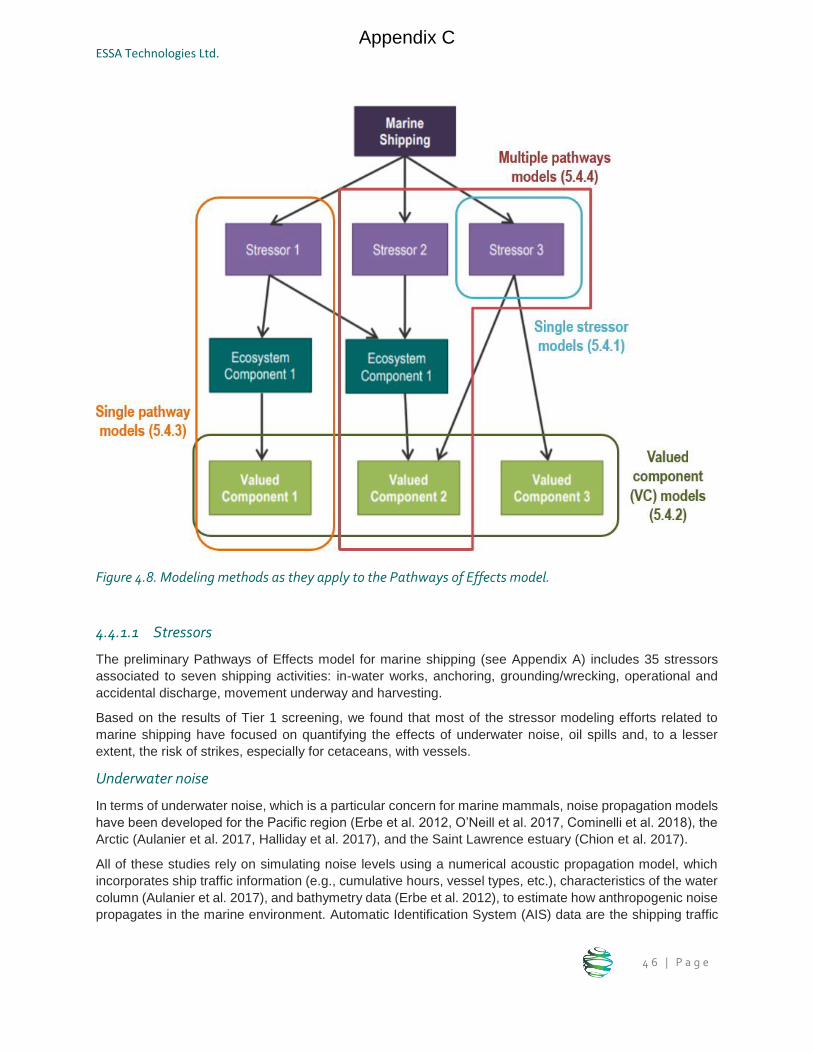
ESSA Technologies Ltd.
4 6 | P a g e
Figure 4.8. Modeling methods as they apply to the Pathways of Effects model.
4.4.1.1 Stressors
The preliminary Pathways of Effects model for marine shipping (see Appendix A) includes 35 stressors
associated to seven shipping activities: in-water works, anchoring, grounding/wrecking, operational and
accidental discharge, movement underway and harvesting.
Based on the results of Tier 1 screening, we found that most of the stressor modeling efforts related to
marine shipping have focused on quantifying the effects of underwater noise, oil spills and, to a lesser
extent, the risk of strikes, especially for cetaceans, with vessels.
Underwater noise
In terms of underwater noise, which is a particular concern for marine mammals, noise propagation models
have been developed for the Pacific region (Erbe et al. 2012, O’Neill et al. 2017, Cominelli et al. 2018), the
Arctic (Aulanier et al. 2017, Halliday et al. 2017), and the Saint Lawrence estuary (Chion et al. 2017).
All of these studies rely on simulating noise levels using a numerical acoustic propagation model, which
incorporates ship traffic information (e.g., cumulative hours, vessel types, etc.), characteristics of the water
column (Aulanier et al. 2017), and bathymetry data (Erbe et al. 2012), to estimate how anthropogenic noise
propagates in the marine environment. Automatic Identification System (AIS) data are the shipping traffic
Appendix C
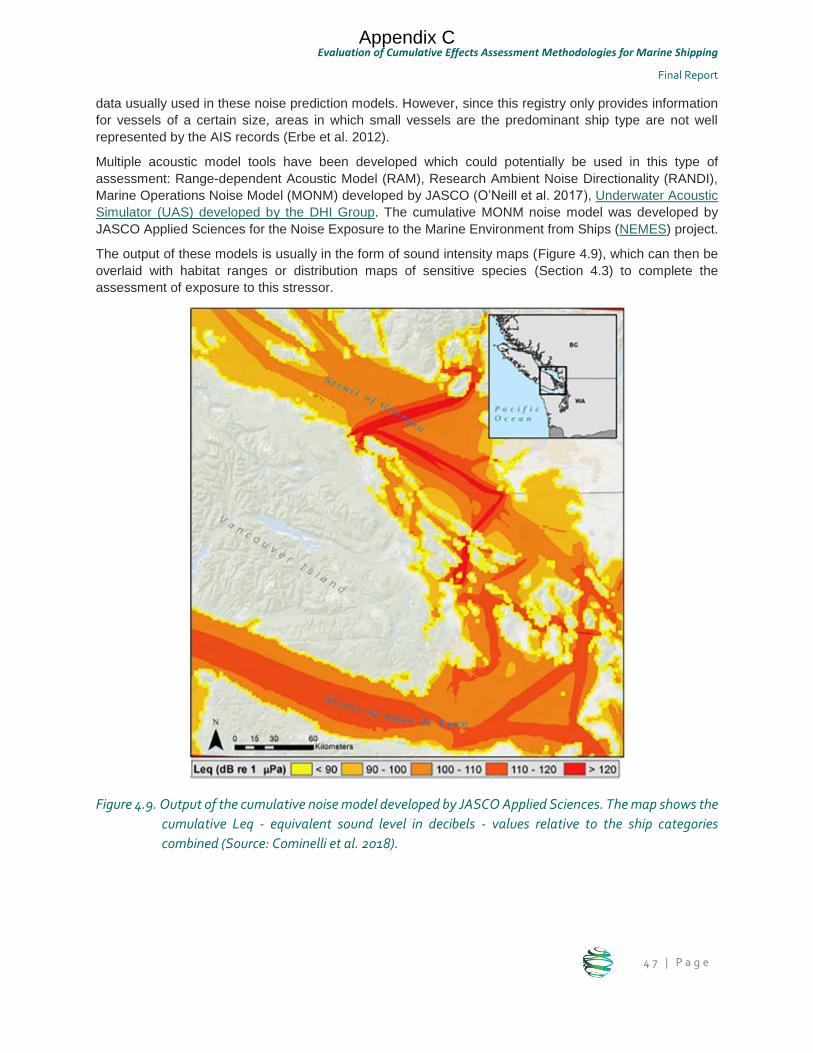
Evaluation of Cumulative Effects Assessment Methodologies for Marine Shipping
Final Report
4 7 | P a g e
data usually used in these noise prediction models. However, since this registry only provides information
for vessels of a certain size, areas in which small vessels are the predominant ship type are not well
represented by the AIS records (Erbe et al. 2012).
Multiple acoustic model tools have been developed which could potentially be used in this type of
assessment: Range-dependent Acoustic Model (RAM), Research Ambient Noise Directionality (RANDI),
Marine Operations Noise Model (MONM) developed by JASCO (O’Neill et al. 2017), Underwater Acoustic
Simulator (UAS) developed by the DHI Group. The cumulative MONM noise model was developed by
JASCO Applied Sciences for the Noise Exposure to the Marine Environment from Ships (NEMES) project.
The output of these models is usually in the form of sound intensity maps (Figure 4.9), which can then be
overlaid with habitat ranges or distribution maps of sensitive species (Section 4.3) to complete the
assessment of exposure to this stressor.
Figure 4.9. Output of the cumulative noise model developed by JASCO Applied Sciences. The map shows the
cumulative Leq - equivalent sound level in decibels - values relative to the ship categories
combined (Source: Cominelli et al. 2018).
Appendix C
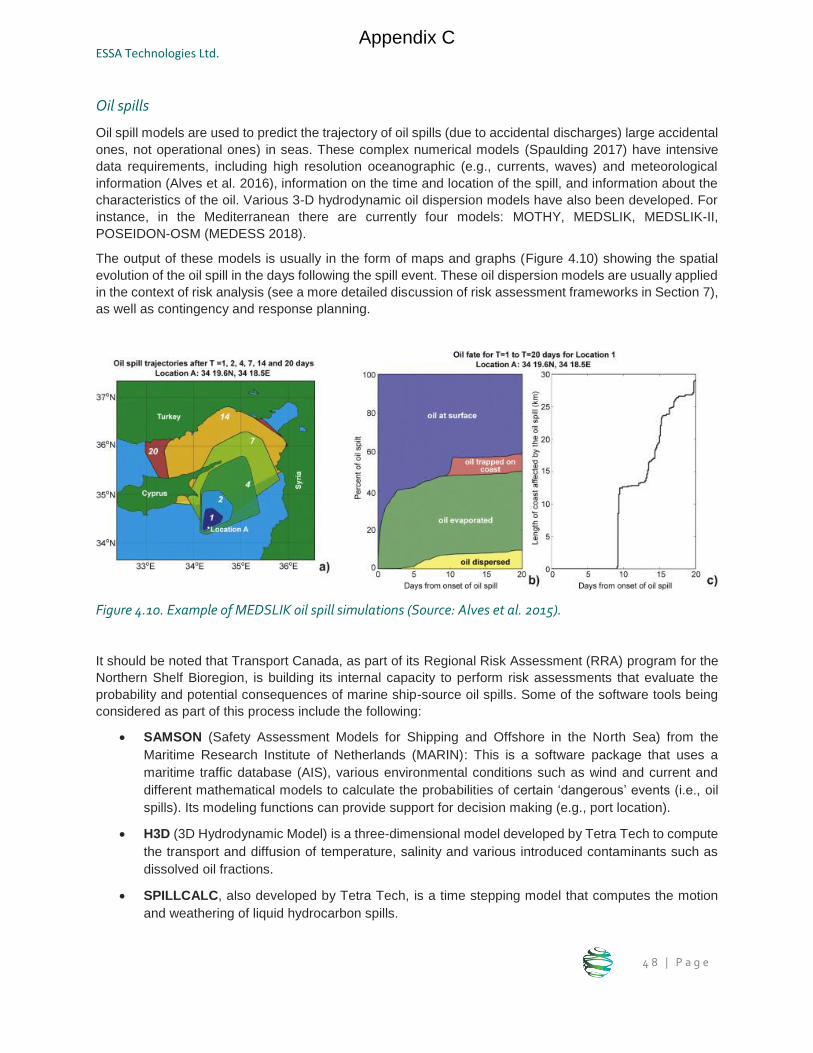
ESSA Technologies Ltd.
4 8 | P a g e
Oil spills
Oil spill models are used to predict the trajectory of oil spills (due to accidental discharges) large accidental
ones, not operational ones) in seas. These complex numerical models (Spaulding 2017) have intensive
data requirements, including high resolution oceanographic (e.g., currents, waves) and meteorological
information (Alves et al. 2016), information on the time and location of the spill, and information about the
characteristics of the oil. Various 3-D hydrodynamic oil dispersion models have also been developed. For
instance, in the Mediterranean there are currently four models: MOTHY, MEDSLIK, MEDSLIK-II,
POSEIDON-OSM (MEDESS 2018).
The output of these models is usually in the form of maps and graphs (Figure 4.10) showing the spatial
evolution of the oil spill in the days following the spill event. These oil dispersion models are usually applied
in the context of risk analysis (see a more detailed discussion of risk assessment frameworks in Section 7),
as well as contingency and response planning.
Figure 4.10. Example of MEDSLIK oil spill simulations (Source: Alves et al. 2015).
It should be noted that Transport Canada, as part of its Regional Risk Assessment (RRA) program for the
Northern Shelf Bioregion, is building its internal capacity to perform risk assessments that evaluate the
probability and potential consequences of marine ship-source oil spills. Some of the software tools being
considered as part of this process include the following:
SAMSON (Safety Assessment Models for Shipping and Offshore in the North Sea) from the
Maritime Research Institute of Netherlands (MARIN): This is a software package that uses a
maritime traffic database (AIS), various environmental conditions such as wind and current and
different mathematical models to calculate the probabilities of certain ‘dangerous’ events (i.e., oil
spills). Its modeling functions can provide support for decision making (e.g., port location).
H3D (3D Hydrodynamic Model) is a three-dimensional model developed by Tetra Tech to compute
the transport and diffusion of temperature, salinity and various introduced contaminants such as
dissolved oil fractions.
SPILLCALC, also developed by Tetra Tech, is a time stepping model that computes the motion
and weathering of liquid hydrocarbon spills.
Appendix C
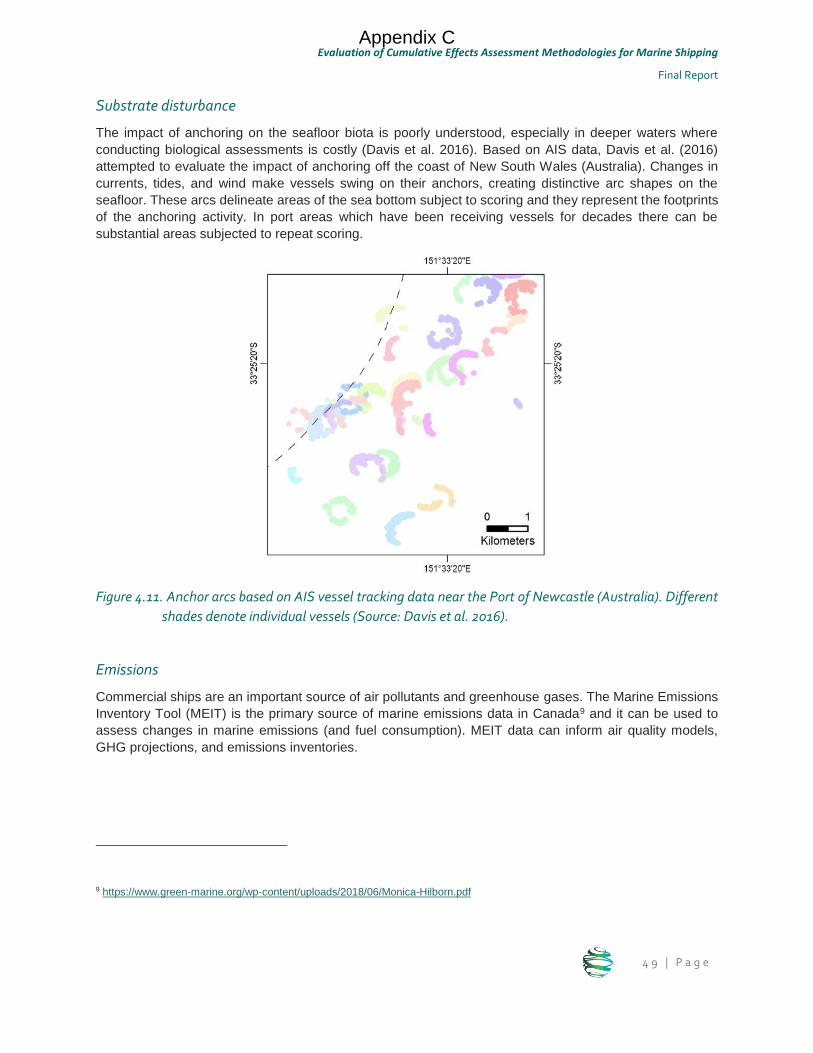
Evaluation of Cumulative Effects Assessment Methodologies for Marine Shipping
Final Report
4 9 | P a g e
Substrate disturbance
The impact of anchoring on the seafloor biota is poorly understood, especially in deeper waters where
conducting biological assessments is costly (Davis et al. 2016). Based on AIS data, Davis et al. (2016)
attempted to evaluate the impact of anchoring off the coast of New South Wales (Australia). Changes in
currents, tides, and wind make vessels swing on their anchors, creating distinctive arc shapes on the
seafloor. These arcs delineate areas of the sea bottom subject to scoring and they represent the footprints
of the anchoring activity. In port areas which have been receiving vessels for decades there can be
substantial areas subjected to repeat scoring.
Figure 4.11. Anchor arcs based on AIS vessel tracking data near the Port of Newcastle (Australia). Different
shades denote individual vessels (Source: Davis et al. 2016).
Emissions
Commercial ships are an important source of air pollutants and greenhouse gases. The Marine Emissions
Inventory Tool (MEIT) is the primary source of marine emissions data in Canada9 and it can be used to
assess changes in marine emissions (and fuel consumption). MEIT data can inform air quality models,
GHG projections, and emissions inventories.
9 https://www.green-marine.org/wp-content/uploads/2018/06/Monica-Hilborn.pdf
Appendix C
ESSA Technologies Ltd.
5 0 | P a g e
4.4.1.2 Valued Components
These models focus on assessing the state and the interactions among ecological10 components of the
environment. The main application of these models is to understand the status and potential responses of
ecological VCs to changes in their environment.
It is important to note that ecological VCs can be conceptualized and modeled at different levels; single
species (e.g., sea otter), multiple species (e.g., marine mammals in a given area) or whole ecosystems
(e.g., estuaries). This section discusses these modeling options.
Single-species models
Single-species models have been the predominant modeling approach in fisheries assessments (Plagányi
2007). Individual-based models (IBMs) and OSMOSE are single-species model examples that study trophic
or predation rules at the individual level with implications at the population level.
Another example which has been used outside of the fisheries sector is Population Viability Analysis
(PVA), which uses demographic models to assess population level effects as one or more demographic
parameters (e.g., fecundity) are varied (Lacy et al. 2017). Detailed PVA models depend on: availability of
estimates for demographic rates (e.g., fecundity, survival, and the variability in such rates); confidence that
observed past rates are predictors of ongoing demography, or that trends can be foreseen; data for
quantifying effects of threats on demographic rates; and a population model that adequately captures the
key demographic, social, genetic, and environmental processes that drive the dynamics of the population
of concern.
PVA can be used to explore how multiple stressors affect a wildlife population. Where stressors can be
linked to specific demographic variables, PVA can be used to evaluate the risks from one or more stressors
to wildlife populations. Lacy et al. (2017) applied a PVA method to the southern resident killer whale
population to explore the cumulative effect of multiple human stressors, including noise, ship strikes and oil
spills from shipping.
Multi-species models
Multispecies models focus on understanding the trophic interactions among species or functional groups
(Piroddi et al. 2015). Specifically, they address predator–prey interactions in marine communities. These
models have often been developed in the context of fisheries management although some have also been
used to simulate environmental changes (e.g., water temperature and pH, nutrient concentration, etc.).
Numerous multi-species models have been developed (Plagányi 2007, Piroddi et al. 2015) covering
different species groups and trophic interactions. Some of these include Spatial Multi-species Operating
Model (SMOM), Stochastic Multi-Species model (SMS), and Population-Dynamical Matching Model
(PDMM).
Ecosystem models
Ecosystem models address the whole ecosystem and describe the relationships between functional groups
in a system using fundamental assumptions about the mass-balance of a system over a period of time. In
10 It is important to note that although this section is focused on ecological models, valued components can also be cultural or
socioeconomic.
Appendix C
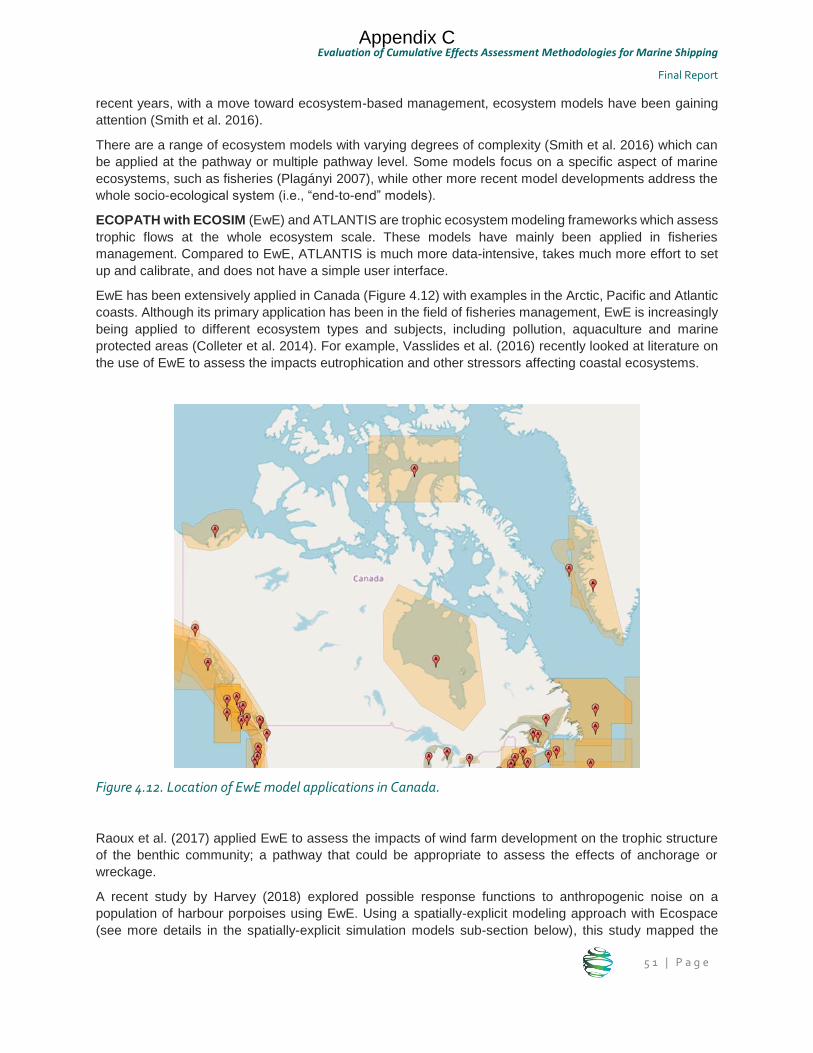
Evaluation of Cumulative Effects Assessment Methodologies for Marine Shipping
Final Report
5 1 | P a g e
recent years, with a move toward ecosystem-based management, ecosystem models have been gaining
attention (Smith et al. 2016).
There are a range of ecosystem models with varying degrees of complexity (Smith et al. 2016) which can
be applied at the pathway or multiple pathway level. Some models focus on a specific aspect of marine
ecosystems, such as fisheries (Plagányi 2007), while other more recent model developments address the
whole socio-ecological system (i.e., “end-to-end” models).
ECOPATH with ECOSIM (EwE) and ATLANTIS are trophic ecosystem modeling frameworks which assess
trophic flows at the whole ecosystem scale. These models have mainly been applied in fisheries
management. Compared to EwE, ATLANTIS is much more data-intensive, takes much more effort to set
up and calibrate, and does not have a simple user interface.
EwE has been extensively applied in Canada (Figure 4.12) with examples in the Arctic, Pacific and Atlantic
coasts. Although its primary application has been in the field of fisheries management, EwE is increasingly
being applied to different ecosystem types and subjects, including pollution, aquaculture and marine
protected areas (Colleter et al. 2014). For example, Vasslides et al. (2016) recently looked at literature on
the use of EwE to assess the impacts eutrophication and other stressors affecting coastal ecosystems.
Figure 4.12. Location of EwE model applications in Canada.
Raoux et al. (2017) applied EwE to assess the impacts of wind farm development on the trophic structure
of the benthic community; a pathway that could be appropriate to assess the effects of anchorage or
wreckage.
A recent study by Harvey (2018) explored possible response functions to anthropogenic noise on a
population of harbour porpoises using EwE. Using a spatially-explicit modeling approach with Ecospace
(see more details in the spatially-explicit simulation models sub-section below), this study mapped the
Appendix C
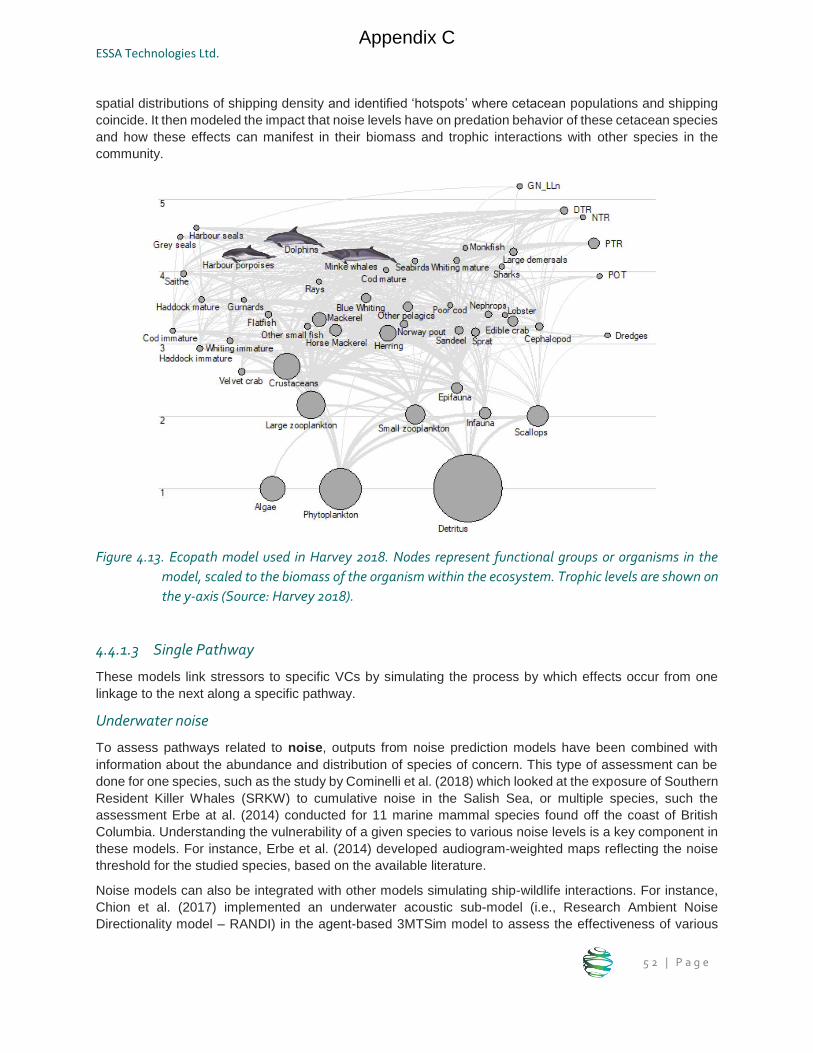
ESSA Technologies Ltd.
5 2 | P a g e
spatial distributions of shipping density and identified ‘hotspots’ where cetacean populations and shipping
coincide. It then modeled the impact that noise levels have on predation behavior of these cetacean species
and how these effects can manifest in their biomass and trophic interactions with other species in the
community.
Figure 4.13. Ecopath model used in Harvey 2018. Nodes represent functional groups or organisms in the
model, scaled to the biomass of the organism within the ecosystem. Trophic levels are shown on
the y-axis (Source: Harvey 2018).
4.4.1.3 Single Pathway
These models link stressors to specific VCs by simulating the process by which effects occur from one
linkage to the next along a specific pathway.
Underwater noise
To assess pathways related to noise, outputs from noise prediction models have been combined with
information about the abundance and distribution of species of concern. This type of assessment can be
done for one species, such as the study by Cominelli et al. (2018) which looked at the exposure of Southern
Resident Killer Whales (SRKW) to cumulative noise in the Salish Sea, or multiple species, such the
assessment Erbe at al. (2014) conducted for 11 marine mammal species found off the coast of British
Columbia. Understanding the vulnerability of a given species to various noise levels is a key component in
these models. For instance, Erbe et al. (2014) developed audiogram-weighted maps reflecting the noise
threshold for the studied species, based on the available literature.
Noise models can also be integrated with other models simulating ship-wildlife interactions. For instance,
Chion et al. (2017) implemented an underwater acoustic sub-model (i.e., Research Ambient Noise
Directionality model – RANDI) in the agent-based 3MTSim model to assess the effectiveness of various
Appendix C
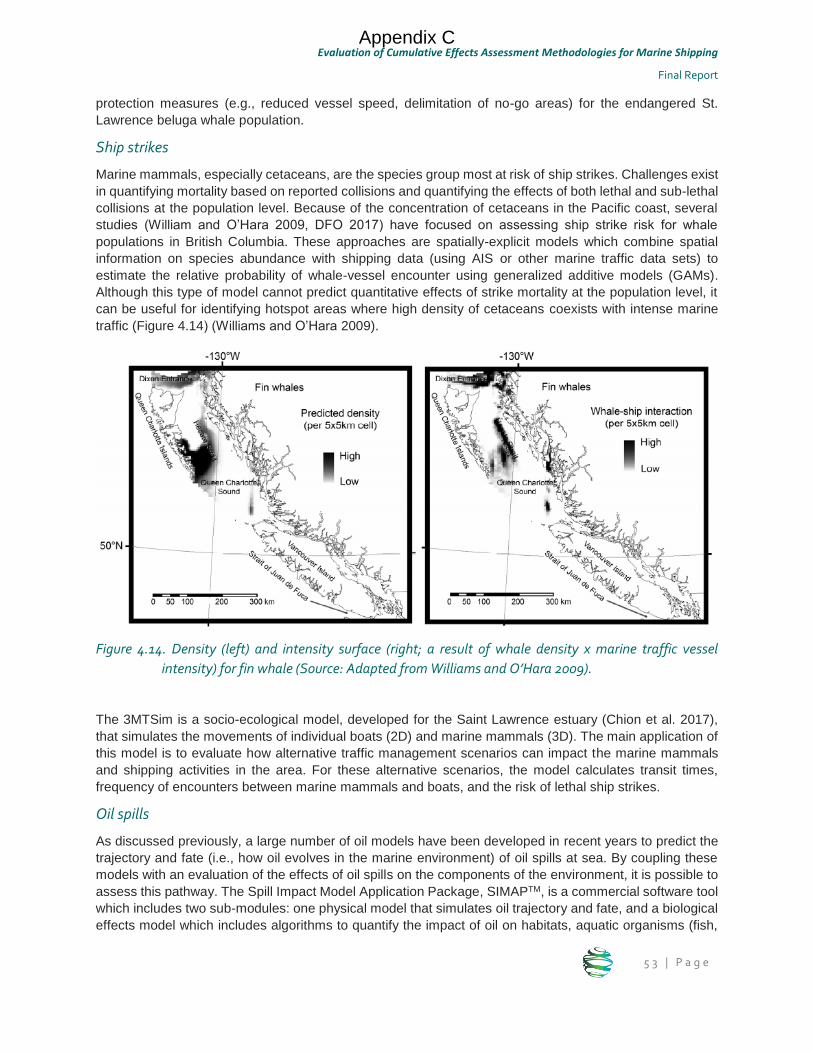
Evaluation of Cumulative Effects Assessment Methodologies for Marine Shipping
Final Report
5 3 | P a g e
protection measures (e.g., reduced vessel speed, delimitation of no-go areas) for the endangered St.
Lawrence beluga whale population.
Ship strikes
Marine mammals, especially cetaceans, are the species group most at risk of ship strikes. Challenges exist
in quantifying mortality based on reported collisions and quantifying the effects of both lethal and sub-lethal
collisions at the population level. Because of the concentration of cetaceans in the Pacific coast, several
studies (William and O’Hara 2009, DFO 2017) have focused on assessing ship strike risk for whale
populations in British Columbia. These approaches are spatially-explicit models which combine spatial
information on species abundance with shipping data (using AIS or other marine traffic data sets) to
estimate the relative probability of whale-vessel encounter using generalized additive models (GAMs).
Although this type of model cannot predict quantitative effects of strike mortality at the population level, it
can be useful for identifying hotspot areas where high density of cetaceans coexists with intense marine
traffic (Figure 4.14) (Williams and O’Hara 2009).
Figure 4.14. Density (left) and intensity surface (right; a result of whale density x marine traffic vessel
intensity) for fin whale (Source: Adapted from Williams and O’Hara 2009).
The 3MTSim is a socio-ecological model, developed for the Saint Lawrence estuary (Chion et al. 2017),
that simulates the movements of individual boats (2D) and marine mammals (3D). The main application of
this model is to evaluate how alternative traffic management scenarios can impact the marine mammals
and shipping activities in the area. For these alternative scenarios, the model calculates transit times,
frequency of encounters between marine mammals and boats, and the risk of lethal ship strikes.
Oil spills
As discussed previously, a large number of oil models have been developed in recent years to predict the
trajectory and fate (i.e., how oil evolves in the marine environment) of oil spills at sea. By coupling these
models with an evaluation of the effects of oil spills on the components of the environment, it is possible to
assess this pathway. The Spill Impact Model Application Package, SIMAPTM, is a commercial software tool
which includes two sub-modules: one physical model that simulates oil trajectory and fate, and a biological
effects model which includes algorithms to quantify the impact of oil on habitats, aquatic organisms (fish,
Appendix C
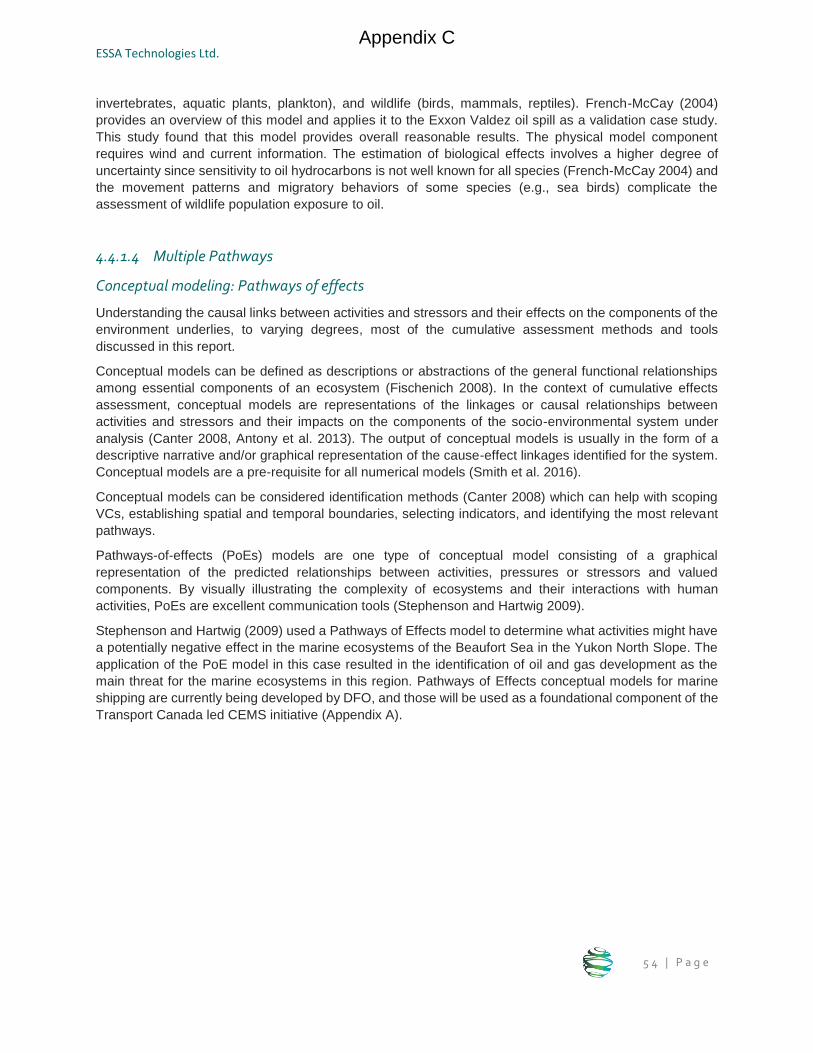
ESSA Technologies Ltd.
5 4 | P a g e
invertebrates, aquatic plants, plankton), and wildlife (birds, mammals, reptiles). French-McCay (2004)
provides an overview of this model and applies it to the Exxon Valdez oil spill as a validation case study.
This study found that this model provides overall reasonable results. The physical model component
requires wind and current information. The estimation of biological effects involves a higher degree of
uncertainty since sensitivity to oil hydrocarbons is not well known for all species (French-McCay 2004) and
the movement patterns and migratory behaviors of some species (e.g., sea birds) complicate the
assessment of wildlife population exposure to oil.
4.4.1.4 Multiple Pathways
Conceptual modeling: Pathways of effects
Understanding the causal links between activities and stressors and their effects on the components of the
environment underlies, to varying degrees, most of the cumulative assessment methods and tools
discussed in this report.
Conceptual models can be defined as descriptions or abstractions of the general functional relationships
among essential components of an ecosystem (Fischenich 2008). In the context of cumulative effects
assessment, conceptual models are representations of the linkages or causal relationships between
activities and stressors and their impacts on the components of the socio-environmental system under
analysis (Canter 2008, Antony et al. 2013). The output of conceptual models is usually in the form of a
descriptive narrative and/or graphical representation of the cause-effect linkages identified for the system.
Conceptual models are a pre-requisite for all numerical models (Smith et al. 2016).
Conceptual models can be considered identification methods (Canter 2008) which can help with scoping
VCs, establishing spatial and temporal boundaries, selecting indicators, and identifying the most relevant
pathways.
Pathways-of-effects (PoEs) models are one type of conceptual model consisting of a graphical
representation of the predicted relationships between activities, pressures or stressors and valued
components. By visually illustrating the complexity of ecosystems and their interactions with human
activities, PoEs are excellent communication tools (Stephenson and Hartwig 2009).
Stephenson and Hartwig (2009) used a Pathways of Effects model to determine what activities might have
a potentially negative effect in the marine ecosystems of the Beaufort Sea in the Yukon North Slope. The
application of the PoE model in this case resulted in the identification of oil and gas development as the
main threat for the marine ecosystems in this region. Pathways of Effects conceptual models for marine
shipping are currently being developed by DFO, and those will be used as a foundational component of the
Transport Canada led CEMS initiative (Appendix A).
Appendix C
Evaluation of Cumulative Effects Assessment Methodologies for Marine Shipping
Final Report
5 5 | P a g e
Figure 4.15. Example of a single activity Pathways of Effects diagram for marine transportation (Source:
Stephenson and Hartwig 2009).
Drivers-Pressures-State-Impact-Response (DPSIR) models
The DPSIR (Drivers-Pressures-State-Impact-Response) approach is a problem-structuring framework
which can be used to assess the causes, consequences and responses to change (Elliott et al. 2017). This
approach derives from the Pressure-State-Response (PSR) conceptualizing frameworks, which have been
used in marine ecosystems risk analysis and management since the 1990s (Patrício et al. 2016).
The DPSIR model is policy-oriented (Patrício et al. 2016) since it describes the system in terms of drivers
(e.g., development and economic activities) which cause pressures (e.g., abrasion, increase in marine
noise, over-fishing) that, in turn, affect the state of the ecosystems (e.g., habitat quality, population size,
etc.) and require a response in the form of a management action.
For use in coastal and marine ecosystems, the original DPSIR has been adapted and modified into 23
derivative approaches (Figure 4.16) (Patrício et al. 2016). Some of these modified approaches seek to
include the evaluation of ecosystems services in the DPSIR framework. Kelble et al. (2013) developed a
Driver, Pressure, State, Ecosystem service, and Response (EBM-DPSER) conceptual model and applied
it to the Florida Keys and Dry Tortugas marine ecosystem.
Appendix C
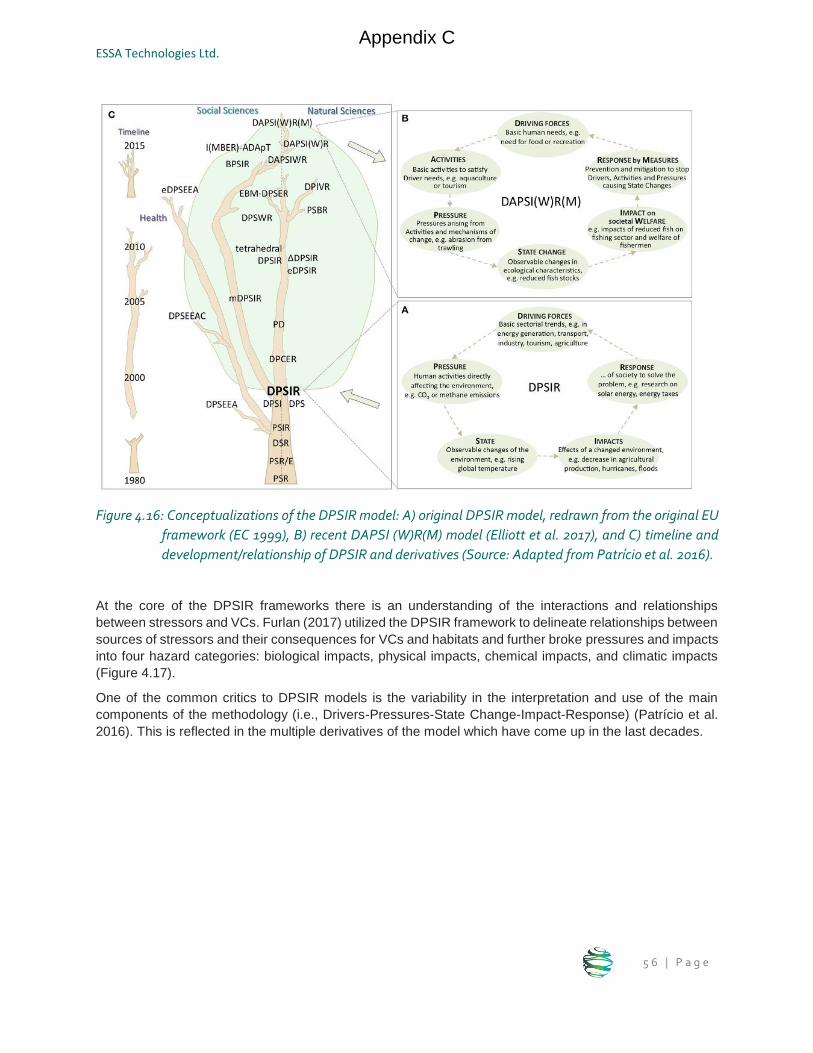
ESSA Technologies Ltd.
5 6 | P a g e
Figure 4.16: Conceptualizations of the DPSIR model: A) original DPSIR model, redrawn from the original EU
framework (EC 1999), B) recent DAPSI (W)R(M) model (Elliott et al. 2017), and C) timeline and
development/relationship of DPSIR and derivatives (Source: Adapted from Patrício et al. 2016).
At the core of the DPSIR frameworks there is an understanding of the interactions and relationships
between stressors and VCs. Furlan (2017) utilized the DPSIR framework to delineate relationships between
sources of stressors and their consequences for VCs and habitats and further broke pressures and impacts
into four hazard categories: biological impacts, physical impacts, chemical impacts, and climatic impacts
(Figure 4.17).
One of the common critics to DPSIR models is the variability in the interpretation and use of the main
components of the methodology (i.e., Drivers-Pressures-State Change-Impact-Response) (Patrício et al.
2016). This is reflected in the multiple derivatives of the model which have come up in the last decades.
Appendix C
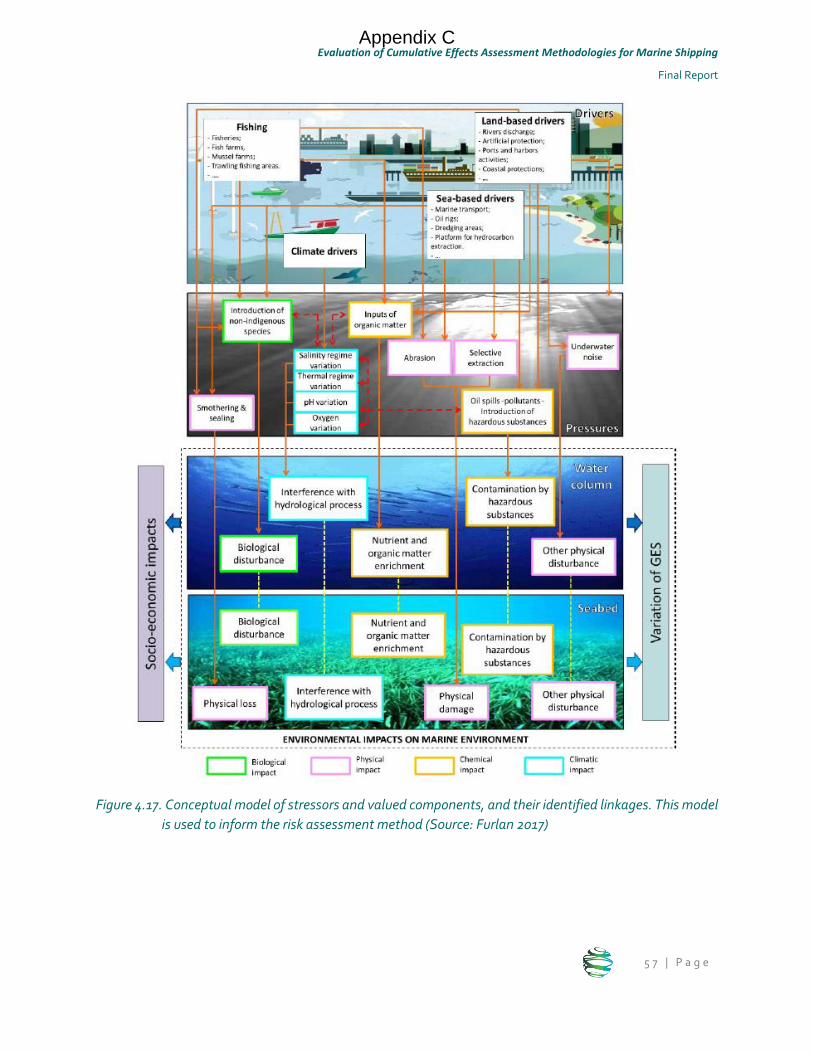
Evaluation of Cumulative Effects Assessment Methodologies for Marine Shipping
Final Report
5 7 | P a g e
Figure 4.17. Conceptual model of stressors and valued components, and their identified linkages. This model
is used to inform the risk assessment method (Source: Furlan 2017)
Appendix C
ESSA Technologies Ltd.
5 8 | P a g e
Bayesian Belief Networks
Bayesian Belief Networks (BBNs) are graphical and probabilistic models that represent the correlative and
causal relationships among variables (McCann et al. 2006). In the context of environmental and ecological
analysis, this type of model is usually applied to situations where there are substantial uncertainties about
the system under study (Smith et al. 2016). Common uncertainties in cumulative effects assessment include
absence or incomplete knowledge of the stressors-VCs relationships and uncertainty about the combined
effect of multiple stressors (Ban et al. 2014).
Especially relevant for natural resources management, BBNs can predict the response of ecological
variables to different management alternatives (McCann et al. 2006). This feature makes this modeling
method especially suitable for its application in the adaptive management of complex socio-ecological
systems (Ban et al. 2014, Smith et al. 2016).
Unlike mechanistic modeling approaches, BBNs do not require explicit understanding of the process linking
two variables in the system because they calculate the likelihood of change in the state of a given variable
based solely on probabilities (Langmead et al. 2007). Additionally, BBNs are flexible in terms of the input
data and can perform calculations based on expert opinion if empirical data are not available. They can
model uncertainty while also accounting for sensitivity in the system (Lawson and Lesage 2013, Goerlandt
and Montewka 2015).
Graphically, BBNs are networks which represent the causal relationships among nodes (state variables)
and other components of the system through a box and arrows scheme. The links between components
are based on the understanding of the underlying processes (Smith et al. 2016). Each node is associated
with a function that gives the probability of the variable dependent on the upstream/parent nodes (Smith et
al. 2016). To date, the application of BBNs to marine assessments has been limited (e.g., Langmead et al.,
2007; Ban et al. 2014; Stelzenmüller et al. 2010 and 2015; Uusitalo et al., 2015). Ban et al. (2014) applied
a BBNs approach to study the effects of multiple stressors, and multiple water management alternatives,
to coral reefs in the Australian Great Barrier Reef. The main interest in this study was to understand the
relative effects of the stressors.
Stelzenmüller et al. (2010) combined BBNs and Geographical Information Systems (GIS) in order to
generate a spatial representation of the model-based management scenarios. The BBN model (Figure
4.18) represents the overall level of vulnerability within the study area as a function of the intensity of three
example human activities, and the type of marine landscapes and their sensitivity to those activities.
Appendix C
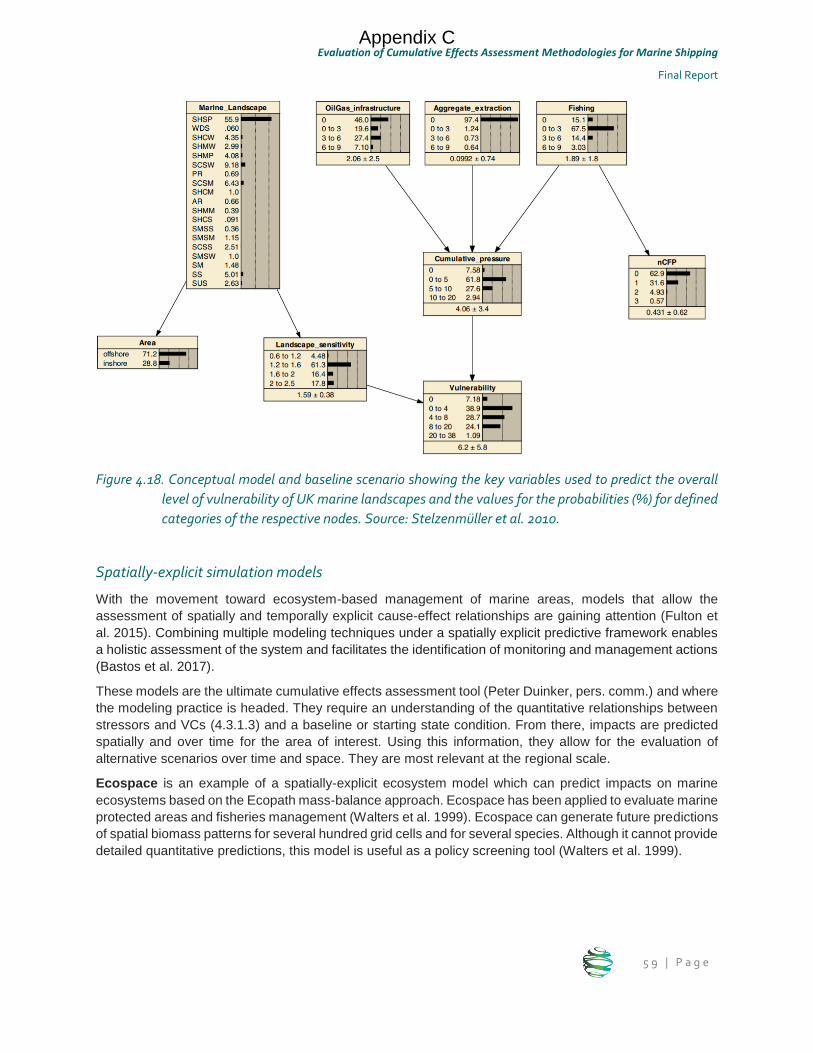
Evaluation of Cumulative Effects Assessment Methodologies for Marine Shipping
Final Report
5 9 | P a g e
Figure 4.18. Conceptual model and baseline scenario showing the key variables used to predict the overall
level of vulnerability of UK marine landscapes and the values for the probabilities (%) for defined
categories of the respective nodes. Source: Stelzenmüller et al. 2010.
Spatially-explicit simulation models
With the movement toward ecosystem-based management of marine areas, models that allow the
assessment of spatially and temporally explicit cause-effect relationships are gaining attention (Fulton et
al. 2015). Combining multiple modeling techniques under a spatially explicit predictive framework enables
a holistic assessment of the system and facilitates the identification of monitoring and management actions
(Bastos et al. 2017).
These models are the ultimate cumulative effects assessment tool (Peter Duinker, pers. comm.) and where
the modeling practice is headed. They require an understanding of the quantitative relationships between
stressors and VCs (4.3.1.3) and a baseline or starting state condition. From there, impacts are predicted
spatially and over time for the area of interest. Using this information, they allow for the evaluation of
alternative scenarios over time and space. They are most relevant at the regional scale.
Ecospace is an example of a spatially-explicit ecosystem model which can predict impacts on marine
ecosystems based on the Ecopath mass-balance approach. Ecospace has been applied to evaluate marine
protected areas and fisheries management (Walters et al. 1999). Ecospace can generate future predictions
of spatial biomass patterns for several hundred grid cells and for several species. Although it cannot provide
detailed quantitative predictions, this model is useful as a policy screening tool (Walters et al. 1999).
Appendix C
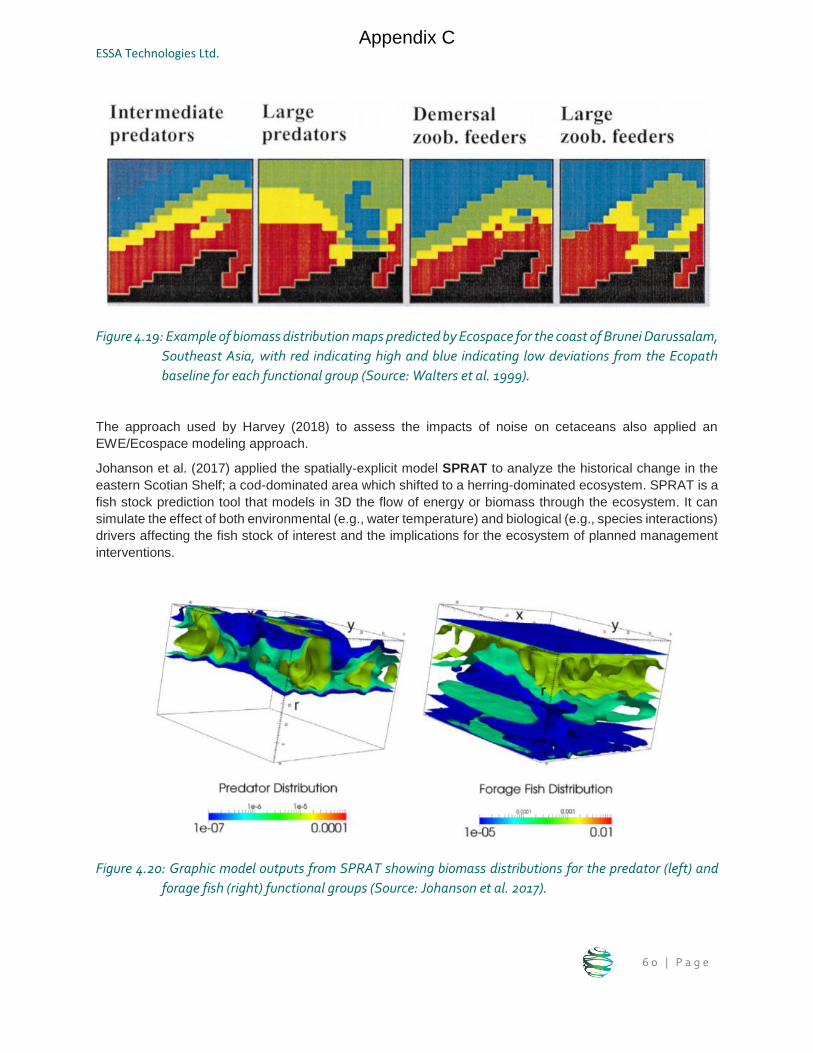
ESSA Technologies Ltd.
6 0 | P a g e
Figure 4.19: Example of biomass distribution maps predicted by Ecospace for the coast of Brunei Darussalam,
Southeast Asia, with red indicating high and blue indicating low deviations from the Ecopath
baseline for each functional group (Source: Walters et al. 1999).
The approach used by Harvey (2018) to assess the impacts of noise on cetaceans also applied an
EWE/Ecospace modeling approach.
Johanson et al. (2017) applied the spatially-explicit model SPRAT to analyze the historical change in the
eastern Scotian Shelf; a cod-dominated area which shifted to a herring-dominated ecosystem. SPRAT is a
fish stock prediction tool that models in 3D the flow of energy or biomass through the ecosystem. It can
simulate the effect of both environmental (e.g., water temperature) and biological (e.g., species interactions)
drivers affecting the fish stock of interest and the implications for the ecosystem of planned management
interventions.
Figure 4.20: Graphic model outputs from SPRAT showing biomass distributions for the predator (left) and
forage fish (right) functional groups (Source: Johanson et al. 2017).
Appendix C
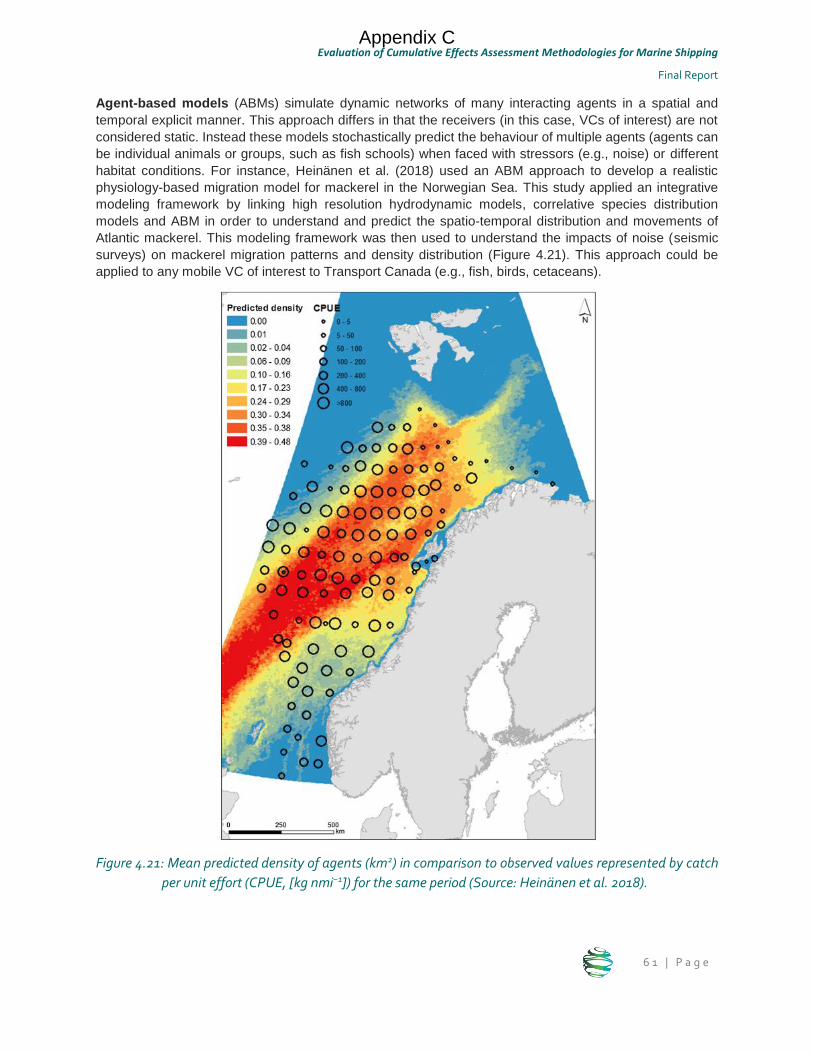
Evaluation of Cumulative Effects Assessment Methodologies for Marine Shipping
Final Report
6 1 | P a g e
Agent-based models (ABMs) simulate dynamic networks of many interacting agents in a spatial and
temporal explicit manner. This approach differs in that the receivers (in this case, VCs of interest) are not
considered static. Instead these models stochastically predict the behaviour of multiple agents (agents can
be individual animals or groups, such as fish schools) when faced with stressors (e.g., noise) or different
habitat conditions. For instance, Heinänen et al. (2018) used an ABM approach to develop a realistic
physiology-based migration model for mackerel in the Norwegian Sea. This study applied an integrative
modeling framework by linking high resolution hydrodynamic models, correlative species distribution
models and ABM in order to understand and predict the spatio-temporal distribution and movements of
Atlantic mackerel. This modeling framework was then used to understand the impacts of noise (seismic
surveys) on mackerel migration patterns and density distribution (Figure 4.21). This approach could be
applied to any mobile VC of interest to Transport Canada (e.g., fish, birds, cetaceans).
Figure 4.21: Mean predicted density of agents (km2) in comparison to observed values represented by catch
per unit effort (CPUE, [kg nmi−1]) for the same period (Source: Heinänen et al. 2018).
Appendix C
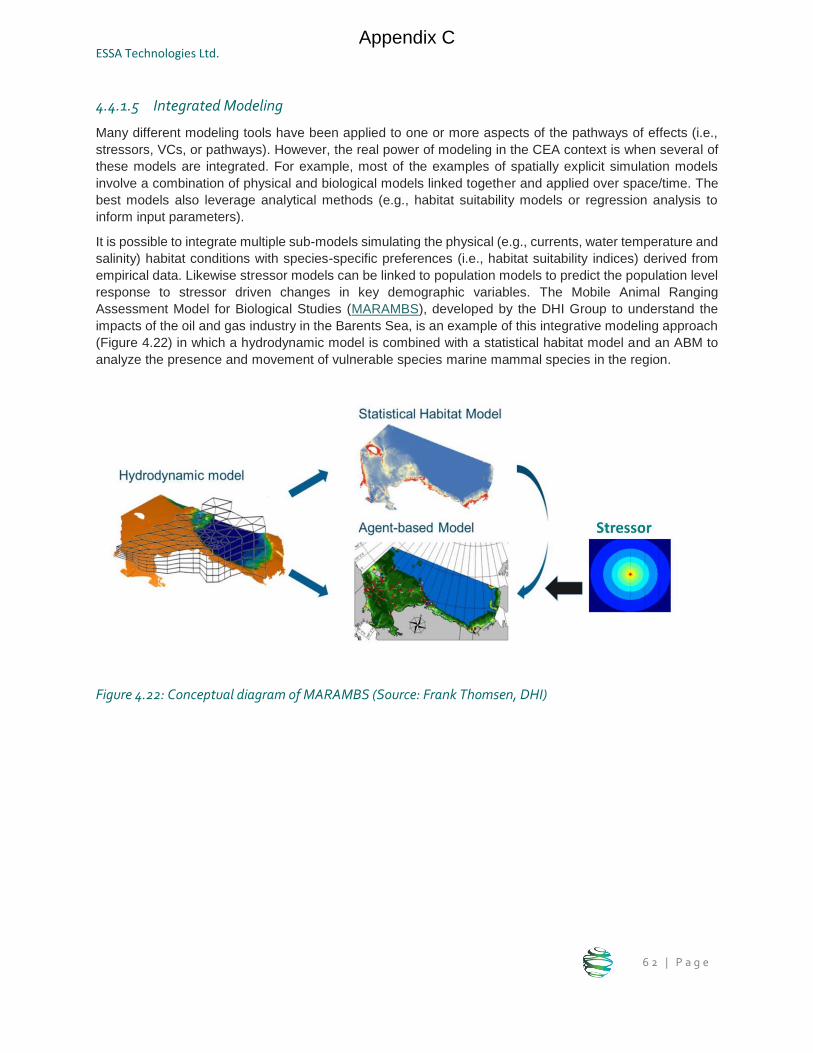
ESSA Technologies Ltd.
6 2 | P a g e
4.4.1.5 Integrated Modeling
Many different modeling tools have been applied to one or more aspects of the pathways of effects (i.e.,
stressors, VCs, or pathways). However, the real power of modeling in the CEA context is when several of
these models are integrated. For example, most of the examples of spatially explicit simulation models
involve a combination of physical and biological models linked together and applied over space/time. The
best models also leverage analytical methods (e.g., habitat suitability models or regression analysis to
inform input parameters).
It is possible to integrate multiple sub-models simulating the physical (e.g., currents, water temperature and
salinity) habitat conditions with species-specific preferences (i.e., habitat suitability indices) derived from
empirical data. Likewise stressor models can be linked to population models to predict the population level
response to stressor driven changes in key demographic variables. The Mobile Animal Ranging
Assessment Model for Biological Studies (MARAMBS), developed by the DHI Group to understand the
impacts of the oil and gas industry in the Barents Sea, is an example of this integrative modeling approach
(Figure 4.22) in which a hydrodynamic model is combined with a statistical habitat model and an ABM to
analyze the presence and movement of vulnerable species marine mammal species in the region.
Figure 4.22: Conceptual diagram of MARAMBS (Source: Frank Thomsen, DHI)
Appendix C
Evaluation of Cumulative Effects Assessment Methodologies for Marine Shipping
Final Report
6 3 | P a g e
4.4.2 Evaluation Criteria
4.4.2.1 Relevance
Usefulness for the CEMS initiative
Modeling methods can support the assessment of cumulative effects in various ways. Models can assist in
articulating hypotheses, scoping, quantifying the intensity of stressors (stressor models), assessing the
state and interactions among the components of the environment (valued component models), linking the
stressors with their effects on valued components (single pathway models) and in studying how multiple
pathways can have impacts on one or more valued components (multiple pathways models).
Stressor Stressor models are useful for quantifying spatial scale and magnitude of a specific stressor
based on information about the related activity. However, it should be noted that modeling
stressors is not enough to assess cumulative effects and the outputs of these models need to
be compared to thresholds or combined with other models that assess the impacts of these
stressors on valued components. The development of these models has focused on certain
stressors (i.e., underwater noise and oil spills) for which there are a variety of tools and options
available. For other stressors associated with shipping, such as substrate disturbance, there
are relatively few examples.
Valued
Component
Single-species models are relevant to understand how specific species might respond to
cumulative stressors to project population changes (Lacy et al. 2017) and explore management
scenarios. Multi-species models have a narrower focus on simulating trophic/predation
interactions and their use to study anthropogenic stressors has been very limited. Ecosystem
models expand the scale to study trophic interactions at the ecosystem level. Although
ecosystem models have been primarily applied to answer questions pertaining to fisheries
management, they are increasingly applied to study the response of ecosystems to other types
of stressors (e.g., impact of noise on marine mammals as studied by Harvey 2018) and show a
good potential as a regional modeling tool.
Pathway These models provide an opportunity to gain a more in-depth understanding of a pathway of
interest (i.e., effects of given stressor on a priority VC). Most importantly, they can be used to
test alternative scenarios or management actions and their effects on the interactions between
stressors and valued components. For instance, Chion et al. (2017) used the 3MTSim model to
estimate how shipping restriction measures affect the beluga population in the St. Lawrence.
Multiple
pathways
Multiple pathways models are problem-structuring frameworks and can be applied to any
combination of stressors and valued components (Patrício et al. 2016). Their application to
marine environments has been limited (Smith et al. 2016). However, as conceptual models they
can be adapted to the specific problem and system under study. These models can also be part
of broader decision support frameworks.
Spatial & temporal scale
Model methods are best applied at the regional scale because they are precise enough at finer scales and
at larger than regional scales the uncertainty in the processes modeled and the outputs increases
significantly. Multiple pathways methods used in marine policy, such as DPSIR, have also been applied at
a larger scale by linking various marine systems.
Stressor Regarding spatial and temporal scale, stressor models are best suited to be applied at the
regional scale because predictive ability decreases significantly at finer (local) and broader
Appendix C
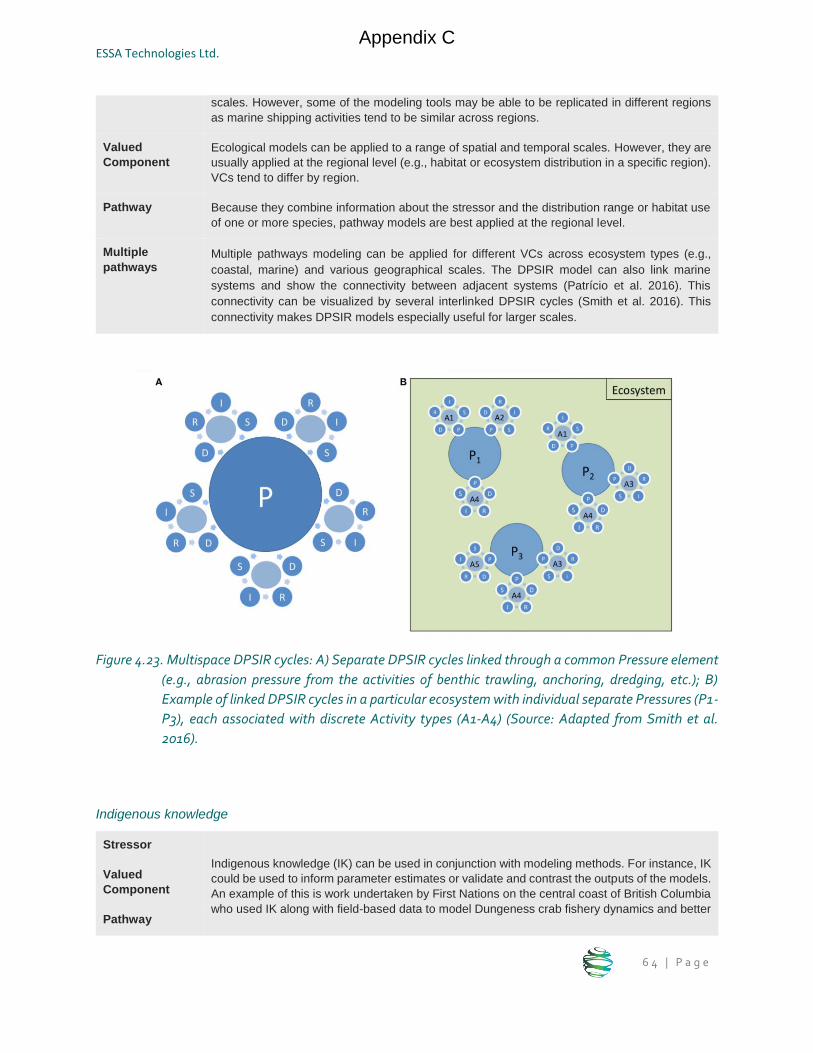
ESSA Technologies Ltd.
6 4 | P a g e
scales. However, some of the modeling tools may be able to be replicated in different regions
as marine shipping activities tend to be similar across regions.
Valued
Component
Ecological models can be applied to a range of spatial and temporal scales. However, they are
usually applied at the regional level (e.g., habitat or ecosystem distribution in a specific region).
VCs tend to differ by region.
Pathway Because they combine information about the stressor and the distribution range or habitat use
of one or more species, pathway models are best applied at the regional level.
Multiple
pathways Multiple pathways modeling can be applied for different VCs across ecosystem types (e.g.,
coastal, marine) and various geographical scales. The DPSIR model can also link marine
systems and show the connectivity between adjacent systems (Patrício et al. 2016). This
connectivity can be visualized by several interlinked DPSIR cycles (Smith et al. 2016). This
connectivity makes DPSIR models especially useful for larger scales.
Figure 4.23. Multispace DPSIR cycles: A) Separate DPSIR cycles linked through a common Pressure element
(e.g., abrasion pressure from the activities of benthic trawling, anchoring, dredging, etc.); B)
Example of linked DPSIR cycles in a particular ecosystem with individual separate Pressures (P1-
P3), each associated with discrete Activity types (A1-A4) (Source: Adapted from Smith et al.
2016).
Indigenous knowledge
Stressor
Indigenous knowledge (IK) can be used in conjunction with modeling methods. For instance, IK
could be used to inform parameter estimates or validate and contrast the outputs of the models.
An example of this is work undertaken by First Nations on the central coast of British Columbia
who used IK along with field-based data to model Dungeness crab fishery dynamics and better
Valued
Component
Pathway
Appendix C
Evaluation of Cumulative Effects Assessment Methodologies for Marine Shipping
Final Report
6 5 | P a g e
Multiple
pathways
understand the status of both the population and fishery (case further detailed in Section
6.1.2.1).
IK is particularly helpful for informing conceptual modeling approaches (i.e., PoE, DPSIR and
BBN) . Antony et al. (2013) developed conceptual and BBNs models for the Great Barrier Reef
in Australia using results from an extensive participatory process that included experts and
stakeholders. In doing so, use of IK needs to be done with IK holders. Indigenous knowledge is
further discussed in Section 6.1.
4.4.2.2 Rigour
Application of method
Model methods are well documented in the academic literature. In the case of multiple pathways models,
one shortcoming is the fact that many of these models have only been applied conceptually.
Stressor Stressor models have frequently been applied in research studies, impact assessments, and
other instances. Applications have been documented in the literature (multiple papers). Noise
models have been developed and studied extensively in Canada. There are multiple examples
of their applications across regions (e.g., Arctic, Pacific and Atlantic regions). There is a range
of choices in terms of specific tools and applications for each stressor.
Valued
Component
The development and application of these models is well established in the literature with
multiple academic papers describing the use of these models in different geographic and
ecological contexts.
Pathway The development and application of pathway models is well established in the literature,
especially for pathways that have received more attention, such as the effects of underwater
noise on marine mammals.
Multiple
pathways
Many of these models are applied at a conceptual level. For instance, Patrício et al. (2016)
found in their review that the links between pressures and state changes are not usually
quantified in DPSIR frameworks but analyzed conceptually. Spatially-explicit models are usually
documented in applications or case studies.
Level of underlying data/information
Models tend to rely on quantitative empirical information as input data however preliminary models can be
developed in absence of empirical information. More policy-oriented and scenario-based models such as
DPSIR or BBN are particularly well suited to incorporating other types of information, including qualitative
data and expert opinion.
Stressor Stressor models are based on research and the current scientific understanding of the
processes and mechanisms by which the stressors manifest (e.g., underwater noise models are
based by the physics involved in noise propagation under the sea). The output of these models
is generally quantitative data displaying the results of simulations
Appendix C
ESSA Technologies Ltd.
6 6 | P a g e
Valued
Component
For the modeling of species or functional groups, these models rely on the scientific knowledge
available (e.g., life cycle, population dynamics, predation behavior, etc.) and also on
observational data (e.g., spatial distribution of a certain species).
Pathway These methods rely on the scientific knowledge about the species or ecosystems being
modeled, as well as on the understanding of the cause-effect relationships by which stressors
impact these components (Section 4.3). In the absence of empirical data (e.g., for the
distribution of a certain species), input data can be complemented with expert knowledge but,
to a large extent, these models rely on scientific data.
Multiple
pathways
These models rely on a variety of data sources; from quantitative empirical data to qualitative
information or expert judgement (Smith et al. 2016).
Uncertainty
Most modeling methods document the uncertainty associated with their simulations, at least in terms of
data input quality and information gaps.
Stressor Uncertainty is explicitly captured and accounted for as part of the model calculations.
Valued
Component
The application of these methods is usually documented in a systematic manner, including
uncertainties in the knowledge base of the model (e.g., uncertainties about certain parameters)
or the prediction scenarios.
Pathway Uncertainty associated with the sources of data and model outputs are usually formally
documented in the case studies or applications.
Multiple
pathways
Bayesian Belief Networks treat uncertainty explicitly (Ban et al. 2014) and systematically as part
of the evaluation of probabilities. The rigour in treatment of uncertainty is more variable in the
other methods. For instance, DPSIR models usually incorporate many types of data and this
can lead to uncertainty not being systematically accounted for (Smith et al. 2016).
4.4.2.3 Feasibility
Complexity
Models are complex assessment methods that require specific, and often expert, knowledge about the
processes and VCs under study.
Stressor The complexity of stressor models requires model users to have a good level of understanding
of the science of the processes simulated by the model (e.g., noise propagation, oil spills), good
quantitative skills, and capacity to interpret numerical and graphical outputs.
Valued
Component
Ecological models are complex and require specific skills, most notably knowledge about the
ecology of the target species. The implementation of these models can be a long process
involving: the set of the model (defining boundaries, selecting parameters and indicators, etc.),
collecting the necessary data sets, calibration and running the model for multiple scenarios.
Pathway These models are complex and require users with expert knowledge on multiple disciplines.
They can involve, and therefore require knowledge about how to implement, a sequence of sub-
Appendix C
Evaluation of Cumulative Effects Assessment Methodologies for Marine Shipping
Final Report
6 7 | P a g e
models in which the stressor is modeled first and then outputs are incorporated in an ecological
or biological model to assess the effects on the valued component.
Multiple
pathways
There is a wide range of complexity in these models. Depending on the specific objectives of
the assessment and the characteristics of the system, the models can be simple or complex
and part of a nested modeling approach.
Data/information requirements
Data requirements are significant for all model methods with the exception of pathways of effects.
Stressor In regard to data/information requirements, development of stressor models requires
extensive data sets and specific site-specific data for their calibration and validation.
Valued
Component
In general, these models are intensive in terms of data requirements. PVA models, for
instance, require a sound understanding of the life cycle and population dynamics of the target
species (Lacy et al. 2017). Ecopath models require input data of six key parameters (Harvey
2018): biomass, production/biomass ratio, consumption/biomass ratio, ‘other mortality’, diet
composition, and catches. Although they can rely on estimates for these parameters, Ecopath
and other ecosystem models are data intensive.
Pathway Data requirements are substantial and specific. Because they address different processes
along the pathway of effects, both information on the stressor and on the valued component
needs to be collected to run these models.
Multiple pathways Data requirements vary widely for these models. The application of DPSIR models relies on
having not only indices of change but also baselines, thresholds and targets against which to
judge that change (Smith et al. 2016). Spatially-explicit models are more demanding in terms
of data than the other approaches.
Data flexibility
Models are generally not flexible in terms of their data needs. Some of the multiple pathways models, such
as DPSIR, allow for certain flexibility in terms of the quantity and quality of information needed for running
them.
Stressor These models have specific data requirements and cannot run on types of data other than
what they are designed for.
Valued
Component
As more data become available, specific interactions in the ecosystems can be better
quantified (Lacy et al. 2017). In the absence of empirical data, models can use expert
elicitation to estimate parameter values, or can use sensitivity analysis11 to bound the problem.
However, the parameters themselves are fixed (e.g., biomass, growth and predation rates,
etc.).
11 “Sensitivity analysis is the study of how the uncertainty in the output of a mathematical model or system can be apportioned to
different sources of uncertainty in its inputs.” [Wikipedia accessed Jan 12, 2019] When data are limited, the model may be manipulated
to evaluate the outcome under alternative hypothetical scenarios.
Appendix C
ESSA Technologies Ltd.
6 8 | P a g e
Pathway The combination of different sub-models restricts the data flexibility of the models. They
require specific ecological information and data about the stressor and the mechanism of
impact.
Multiple pathways One of the strengths of BBNs is that probabilities in the model can be combined and quantified
using different types of data: empirical data, statistical associations, mathematical
representations, and probabilistic quantities derived from expert knowledge (Stelzenmüller et
al. 2010). In general models allow the information to be easily updated with improved data
(Smith et al. 2016)
Accessibility
Stressor Stressor model accessibility (medium) depends on the model. There are some publicly
available simulation tools (e.g., MEDSLIK-II) for which case studies and user manuals may
exist. However, many models are not provided in a way that allows for the public to easily use.
Valued
Component
Users of ecological models need specific knowledge and training. Most of their applications
are carried out in academic contexts or by scientists working for entities involved in the
management of marine resources. There is ample documentation (e.g., technical and
academic references) for these models. For instance, Ecobase is a publicly available
database developed by EwE users which includes over 400 EwE models with their metadata
and over 190 models available for download.
Pathway Implementing these models requires knowledgeable users with technical expertise in different
fields (e.g., underwater noise and ecology of cetaceans).
Multiple pathways Conceptual models are easily accessible by stakeholders with various levels of technical and
expert knowledge. Spatially-explicit simulation models require users with extensive modeling
expertise.
Cost
Stressor Costs may involve purchasing software licenses and/or datasets and might also involve the
collection of site-specific data for validation. Implementation costs also include the time effort
of multidisciplinary teams of experts.
Valued
Component
Implementation costs of these models can be substantial. Personnel with specific skills and
knowledge are required, often in a multi-disciplinary context, and the process of setting up
and running the model takes time.
Pathway Implementation of these models can be costly as they tend to involve setting up and running
several sub-models.
Multiple pathways The costs in developing and implementing these models can vary significantly depending on
the type of model. Compared to the other modeling approaches discussed in this section,
implementation of conceptual models is less costly. Spatially-explicit models might have
additional costs for things such as specific software and data requirements.
Appendix C
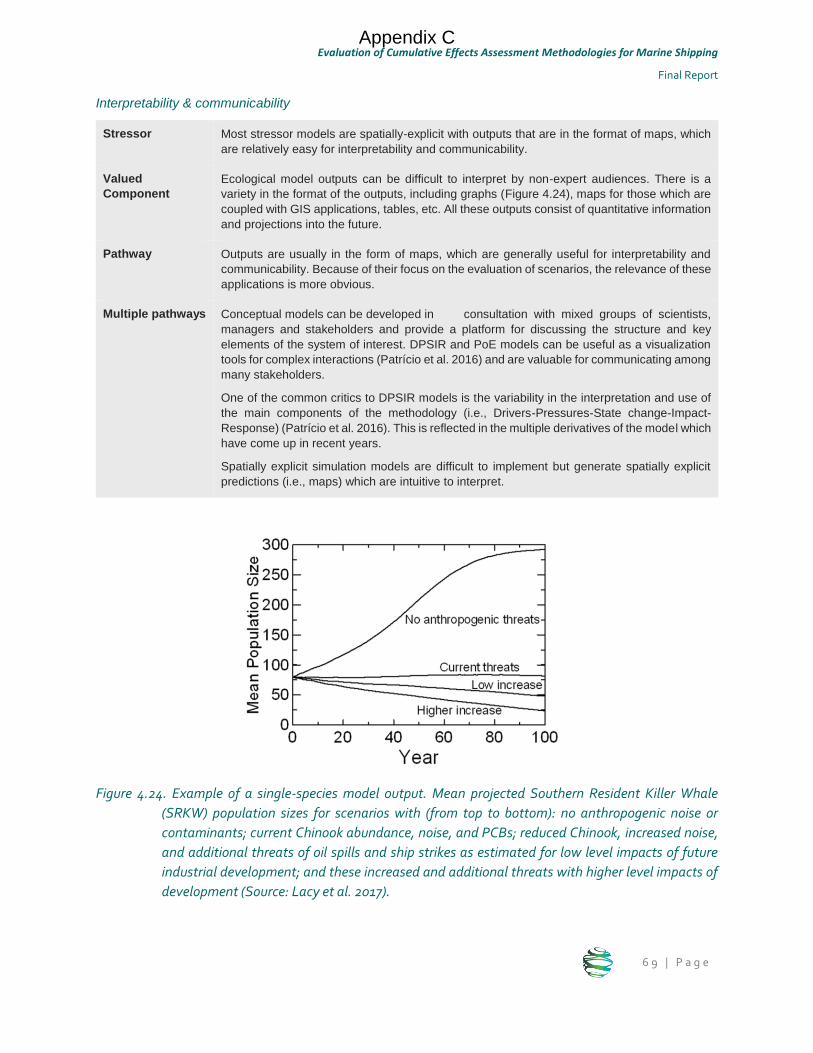
Evaluation of Cumulative Effects Assessment Methodologies for Marine Shipping
Final Report
6 9 | P a g e
Interpretability & communicability
Stressor Most stressor models are spatially-explicit with outputs that are in the format of maps, which
are relatively easy for interpretability and communicability.
Valued
Component
Ecological model outputs can be difficult to interpret by non-expert audiences. There is a
variety in the format of the outputs, including graphs (Figure 4.24), maps for those which are
coupled with GIS applications, tables, etc. All these outputs consist of quantitative information
and projections into the future.
Pathway Outputs are usually in the form of maps, which are generally useful for interpretability and
communicability. Because of their focus on the evaluation of scenarios, the relevance of these
applications is more obvious.
Multiple pathways Conceptual models can be developed in consultation with mixed groups of scientists,
managers and stakeholders and provide a platform for discussing the structure and key
elements of the system of interest. DPSIR and PoE models can be useful as a visualization
tools for complex interactions (Patrício et al. 2016) and are valuable for communicating among
many stakeholders.
One of the common critics to DPSIR models is the variability in the interpretation and use of
the main components of the methodology (i.e., Drivers-Pressures-State change-Impact-
Response) (Patrício et al. 2016). This is reflected in the multiple derivatives of the model which
have come up in recent years.
Spatially explicit simulation models are difficult to implement but generate spatially explicit
predictions (i.e., maps) which are intuitive to interpret.
Figure 4.24. Example of a single-species model output. Mean projected Southern Resident Killer Whale
(SRKW) population sizes for scenarios with (from top to bottom): no anthropogenic noise or
contaminants; current Chinook abundance, noise, and PCBs; reduced Chinook, increased noise,
and additional threats of oil spills and ship strikes as estimated for low level impacts of future
industrial development; and these increased and additional threats with higher level impacts of
development (Source: Lacy et al. 2017).
Appendix C
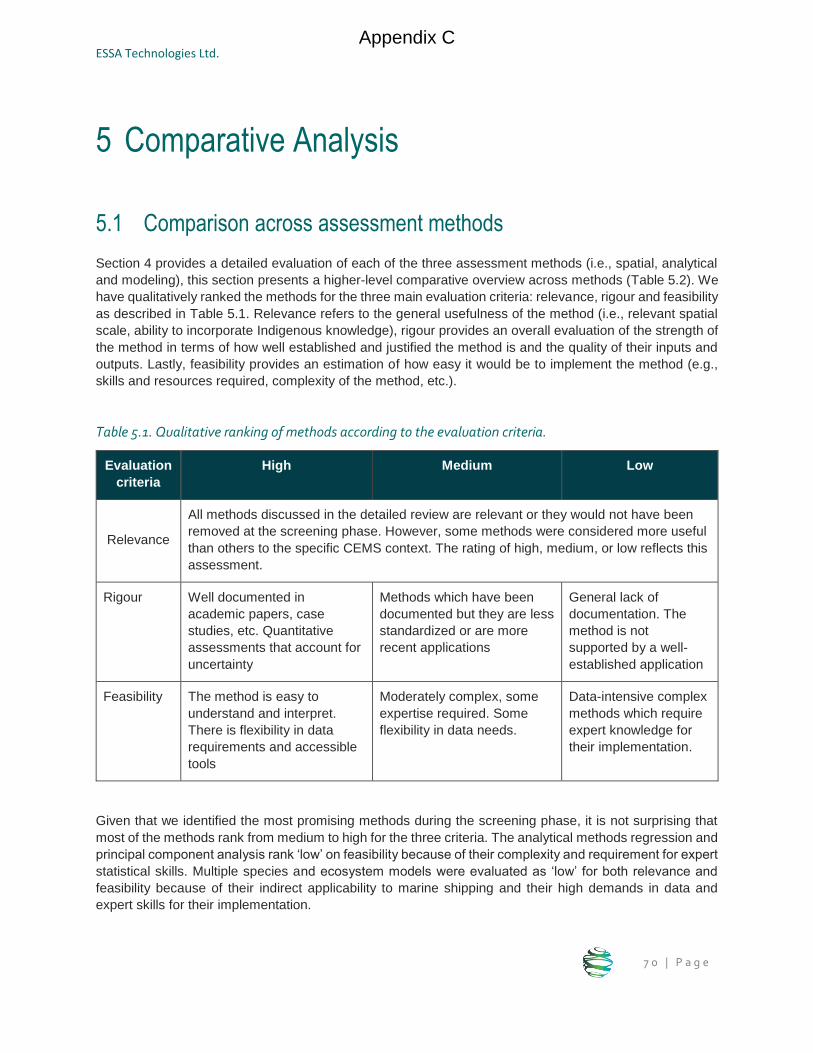
ESSA Technologies Ltd.
7 0 | P a g e
5 Comparative Analysis
5.1 Comparison across assessment methods
Section 4 provides a detailed evaluation of each of the three assessment methods (i.e., spatial, analytical
and modeling), this section presents a higher-level comparative overview across methods (Table 5.2). We
have qualitatively ranked the methods for the three main evaluation criteria: relevance, rigour and feasibility
as described in Table 5.1. Relevance refers to the general usefulness of the method (i.e., relevant spatial
scale, ability to incorporate Indigenous knowledge), rigour provides an overall evaluation of the strength of
the method in terms of how well established and justified the method is and the quality of their inputs and
outputs. Lastly, feasibility provides an estimation of how easy it would be to implement the method (e.g.,
skills and resources required, complexity of the method, etc.).
Table 5.1. Qualitative ranking of methods according to the evaluation criteria.
Evaluation
criteria
High Medium Low
Relevance
All methods discussed in the detailed review are relevant or they would not have been
removed at the screening phase. However, some methods were considered more useful
than others to the specific CEMS context. The rating of high, medium, or low reflects this
assessment.
Rigour Well documented in
academic papers, case
studies, etc. Quantitative
assessments that account for
uncertainty
Methods which have been
documented but they are less
standardized or are more
recent applications
General lack of
documentation. The
method is not
supported by a well-
established application
Feasibility The method is easy to
understand and interpret.
There is flexibility in data
requirements and accessible
tools
Moderately complex, some
expertise required. Some
flexibility in data needs.
Data-intensive complex
methods which require
expert knowledge for
their implementation.
Given that we identified the most promising methods during the screening phase, it is not surprising that
most of the methods rank from medium to high for the three criteria. The analytical methods regression and
principal component analysis rank ‘low’ on feasibility because of their complexity and requirement for expert
statistical skills. Multiple species and ecosystem models were evaluated as ‘low’ for both relevance and
feasibility because of their indirect applicability to marine shipping and their high demands in data and
expert skills for their implementation.
Appendix C
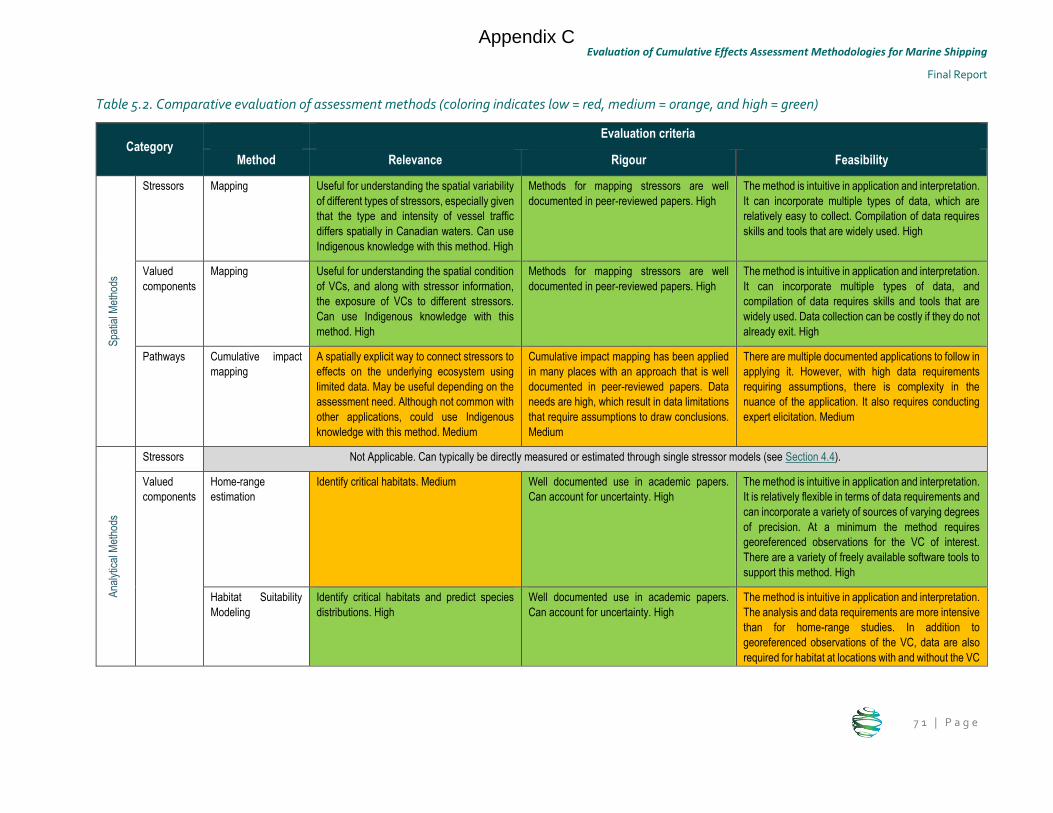
Evaluation of Cumulative Effects Assessment Methodologies for Marine Shipping
Final Report
7 1 | P a g e
Table 5.2. Comparative evaluation of assessment methods (coloring indicates low = red, medium = orange, and high = green)
Category Evaluation criteria
Method Relevance Rigour Feasibility
Spa
tial M
etho
ds
Stressors Mapping Useful for understanding the spatial variability
of different types of stressors, especially given
that the type and intensity of vessel traffic
differs spatially in Canadian waters. Can use
Indigenous knowledge with this method. High
Methods for mapping stressors are well
documented in peer-reviewed papers. High
The method is intuitive in application and interpretation.
It can incorporate multiple types of data, which are
relatively easy to collect. Compilation of data requires
skills and tools that are widely used. High
Valued
components
Mapping Useful for understanding the spatial condition
of VCs, and along with stressor information,
the exposure of VCs to different stressors.
Can use Indigenous knowledge with this
method. High
Methods for mapping stressors are well
documented in peer-reviewed papers. High
The method is intuitive in application and interpretation. It can incorporate multiple types of data, and
compilation of data requires skills and tools that are
widely used. Data collection can be costly if they do not
already exit. High
Pathways Cumulative impact
mapping
A spatially explicit way to connect stressors to
effects on the underlying ecosystem using
limited data. May be useful depending on the
assessment need. Although not common with
other applications, could use Indigenous
knowledge with this method. Medium
Cumulative impact mapping has been applied
in many places with an approach that is well
documented in peer-reviewed papers. Data
needs are high, which result in data limitations
that require assumptions to draw conclusions.
Medium
There are multiple documented applications to follow in
applying it. However, with high data requirements
requiring assumptions, there is complexity in the
nuance of the application. It also requires conducting
expert elicitation. Medium
Ana
lytic
al M
etho
ds
Stressors Not Applicable. Can typically be directly measured or estimated through single stressor models (see Section 4.4).
Valued
components
Home-range
estimation
Identify critical habitats. Medium Well documented use in academic papers.
Can account for uncertainty. High
The method is intuitive in application and interpretation.
It is relatively flexible in terms of data requirements and
can incorporate a variety of sources of varying degrees
of precision. At a minimum the method requires
georeferenced observations for the VC of interest.
There are a variety of freely available software tools to
support this method. High
Habitat Suitability
Modeling
Identify critical habitats and predict species
distributions. High
Well documented use in academic papers.
Can account for uncertainty. High
The method is intuitive in application and interpretation.
The analysis and data requirements are more intensive
than for home-range studies. In addition to
georeferenced observations of the VC, data are also
required for habitat at locations with and without the VC
Appendix C
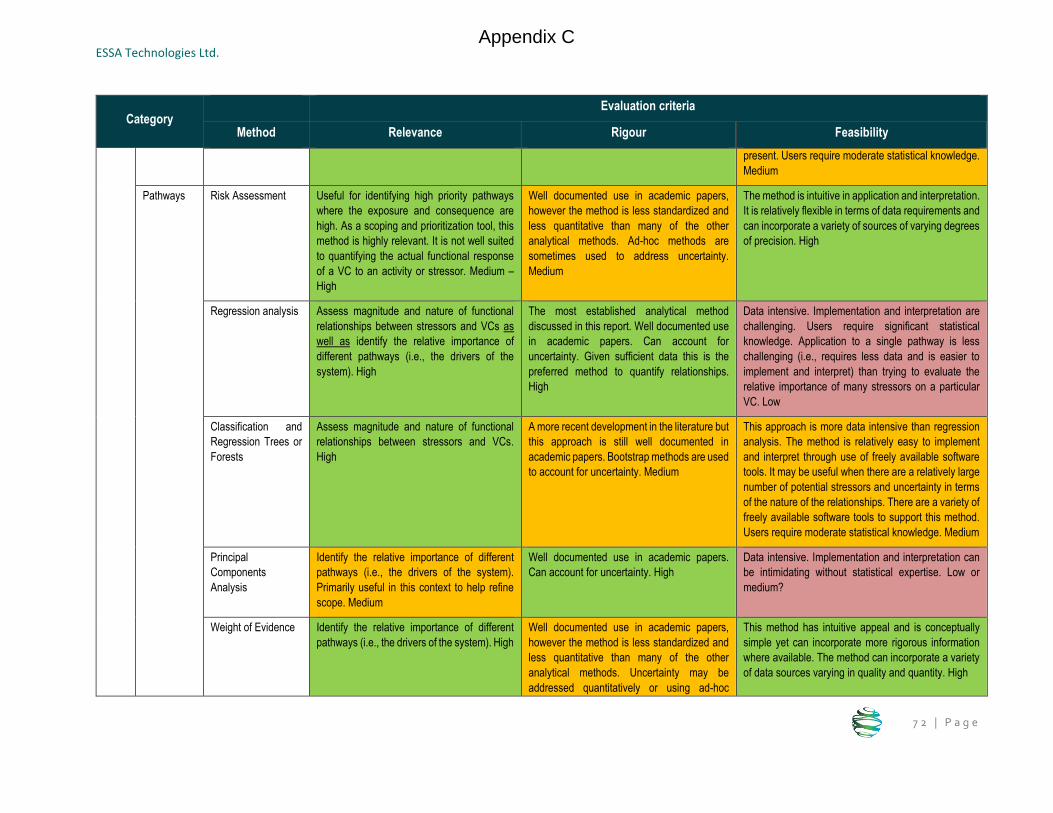
ESSA Technologies Ltd.
7 2 | P a g e
Category Evaluation criteria
Method Relevance Rigour Feasibility
present. Users require moderate statistical knowledge.
Medium
Pathways Risk Assessment Useful for identifying high priority pathways
where the exposure and consequence are
high. As a scoping and prioritization tool, this
method is highly relevant. It is not well suited
to quantifying the actual functional response
of a VC to an activity or stressor. Medium –
High
Well documented use in academic papers,
however the method is less standardized and
less quantitative than many of the other
analytical methods. Ad-hoc methods are
sometimes used to address uncertainty.
Medium
The method is intuitive in application and interpretation.
It is relatively flexible in terms of data requirements and
can incorporate a variety of sources of varying degrees
of precision. High
Regression analysis Assess magnitude and nature of functional
relationships between stressors and VCs as
well as identify the relative importance of
different pathways (i.e., the drivers of the
system). High
The most established analytical method
discussed in this report. Well documented use
in academic papers. Can account for
uncertainty. Given sufficient data this is the
preferred method to quantify relationships.
High
Data intensive. Implementation and interpretation are
challenging. Users require significant statistical
knowledge. Application to a single pathway is less
challenging (i.e., requires less data and is easier to
implement and interpret) than trying to evaluate the
relative importance of many stressors on a particular
VC. Low
Classification and
Regression Trees or
Forests
Assess magnitude and nature of functional
relationships between stressors and VCs.
High
A more recent development in the literature but
this approach is still well documented in
academic papers. Bootstrap methods are used
to account for uncertainty. Medium
This approach is more data intensive than regression
analysis. The method is relatively easy to implement
and interpret through use of freely available software
tools. It may be useful when there are a relatively large
number of potential stressors and uncertainty in terms
of the nature of the relationships. There are a variety of
freely available software tools to support this method.
Users require moderate statistical knowledge. Medium
Principal
Components
Analysis
Identify the relative importance of different
pathways (i.e., the drivers of the system).
Primarily useful in this context to help refine
scope. Medium
Well documented use in academic papers.
Can account for uncertainty. High
Data intensive. Implementation and interpretation can
be intimidating without statistical expertise. Low or
medium?
Weight of Evidence Identify the relative importance of different
pathways (i.e., the drivers of the system). High
Well documented use in academic papers,
however the method is less standardized and
less quantitative than many of the other
analytical methods. Uncertainty may be
addressed quantitatively or using ad-hoc
This method has intuitive appeal and is conceptually
simple yet can incorporate more rigorous information
where available. The method can incorporate a variety
of data sources varying in quality and quantity. High
Appendix C
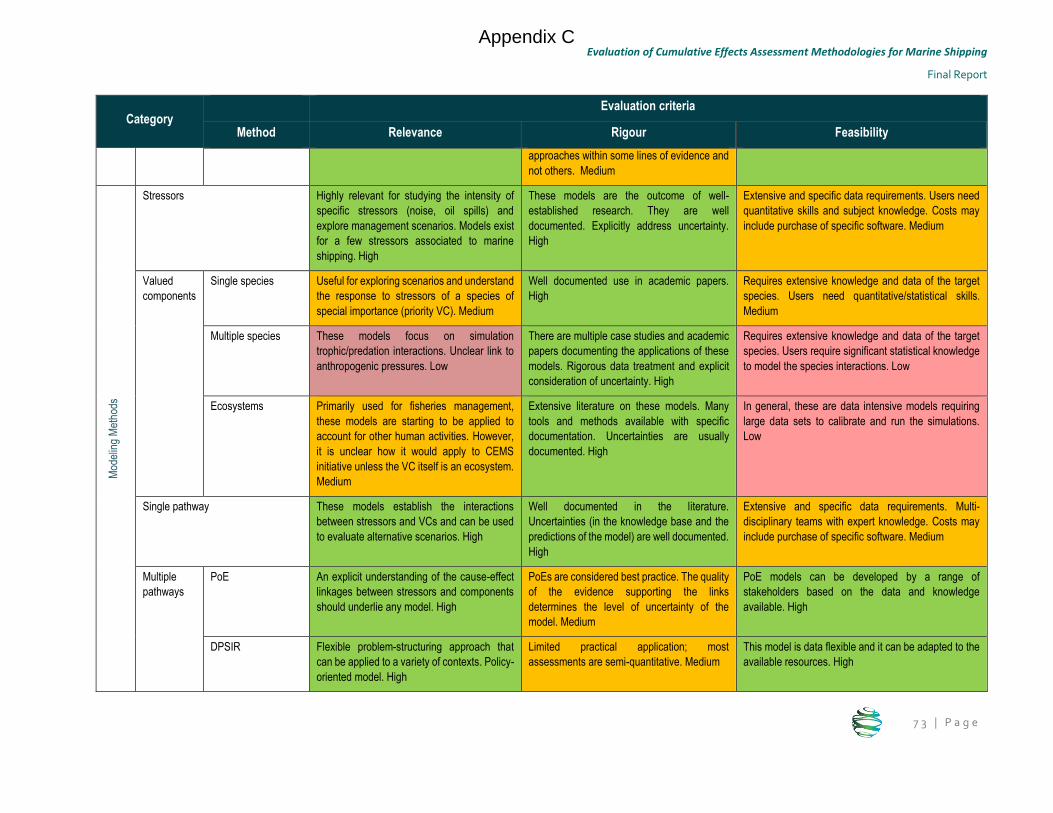
Evaluation of Cumulative Effects Assessment Methodologies for Marine Shipping
Final Report
7 3 | P a g e
Category Evaluation criteria
Method Relevance Rigour Feasibility
approaches within some lines of evidence and
not others. Medium
Mod
elin
g M
etho
ds
Stressors
Highly relevant for studying the intensity of
specific stressors (noise, oil spills) and
explore management scenarios. Models exist
for a few stressors associated to marine
shipping. High
These models are the outcome of well-
established research. They are well
documented. Explicitly address uncertainty.
High
Extensive and specific data requirements. Users need
quantitative skills and subject knowledge. Costs may
include purchase of specific software. Medium
Valued
components
Single species Useful for exploring scenarios and understand
the response to stressors of a species of
special importance (priority VC). Medium
Well documented use in academic papers.
High
Requires extensive knowledge and data of the target
species. Users need quantitative/statistical skills.
Medium
Multiple species These models focus on simulation
trophic/predation interactions. Unclear link to
anthropogenic pressures. Low
There are multiple case studies and academic
papers documenting the applications of these
models. Rigorous data treatment and explicit
consideration of uncertainty. High
Requires extensive knowledge and data of the target
species. Users require significant statistical knowledge
to model the species interactions. Low
Ecosystems Primarily used for fisheries management,
these models are starting to be applied to
account for other human activities. However,
it is unclear how it would apply to CEMS
initiative unless the VC itself is an ecosystem.
Medium
Extensive literature on these models. Many
tools and methods available with specific
documentation. Uncertainties are usually
documented. High
In general, these are data intensive models requiring
large data sets to calibrate and run the simulations.
Low
Single pathway These models establish the interactions
between stressors and VCs and can be used
to evaluate alternative scenarios. High
Well documented in the literature.
Uncertainties (in the knowledge base and the
predictions of the model) are well documented.
High
Extensive and specific data requirements. Multi-
disciplinary teams with expert knowledge. Costs may
include purchase of specific software. Medium
Multiple
pathways
PoE An explicit understanding of the cause-effect
linkages between stressors and components
should underlie any model. High
PoEs are considered best practice. The quality
of the evidence supporting the links
determines the level of uncertainty of the
model. Medium
PoE models can be developed by a range of
stakeholders based on the data and knowledge
available. High
DPSIR Flexible problem-structuring approach that
can be applied to a variety of contexts. Policy-
oriented model. High
Limited practical application; most
assessments are semi-quantitative. Medium
This model is data flexible and it can be adapted to the
available resources. High
Appendix C
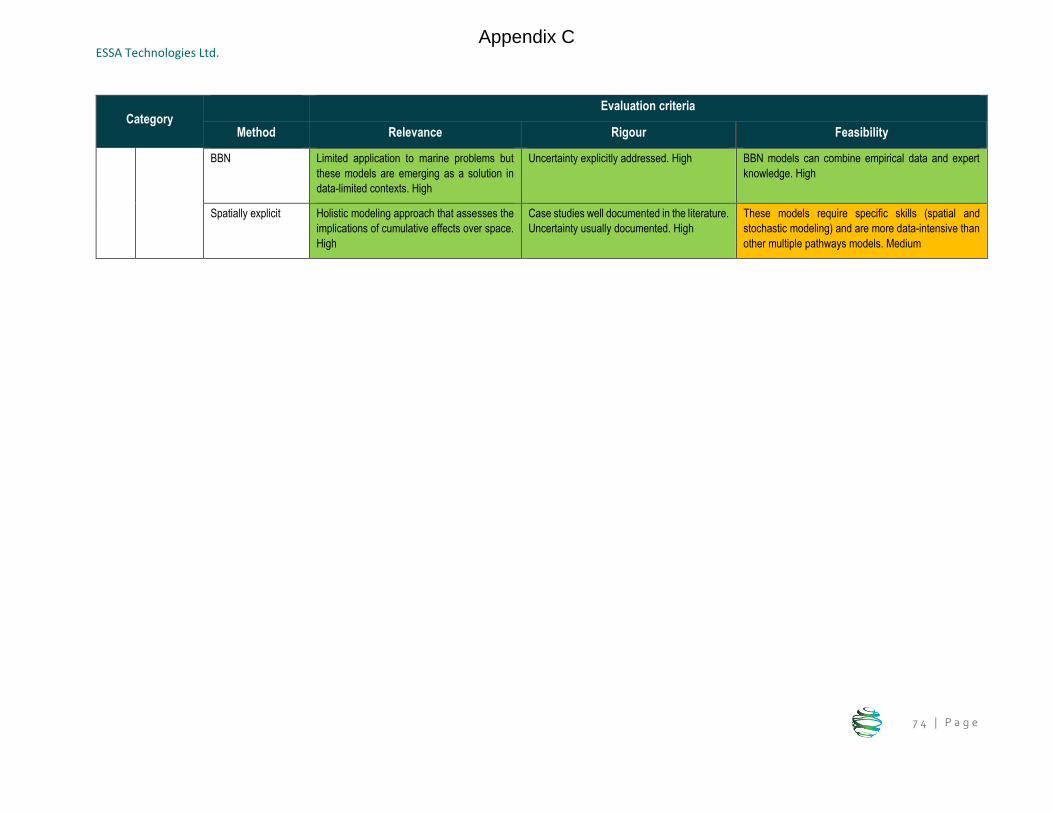
ESSA Technologies Ltd.
7 4 | P a g e
Category Evaluation criteria
Method Relevance Rigour Feasibility
BBN Limited application to marine problems but
these models are emerging as a solution in
data-limited contexts. High
Uncertainty explicitly addressed. High BBN models can combine empirical data and expert
knowledge. High
Spatially explicit Holistic modeling approach that assesses the
implications of cumulative effects over space.
High
Case studies well documented in the literature.
Uncertainty usually documented. High
These models require specific skills (spatial and
stochastic modeling) and are more data-intensive than
other multiple pathways models. Medium
Appendix C
Evaluation of Cumulative Effects Assessment Methodologies for Marine Shipping
Final Report
7 5 | P a g e
5.2 Application to the Cumulative Effects of Marine Shipping Initiative
5.2.1 Overview
This section describes how methods could be applied to the Cumulative Effects of Marine Shipping (CEMS)
initiative. Table 5.3 provides an overview of the application of the evaluation methods. Under the column
‘Generic Application’ we have documented the general intended use of the method. In order to provide more
concrete and relevant examples of application for Transport Canada we have included a ‘Specific example of
how the CEMS initiative might use methods in each category’. These are hypothetical instances in which
methods could be applied in the assessment of cumulative effects of shipping in Canada. Finally, the last
column to the right provides examples of specific methods and associated tools.
Appendix C
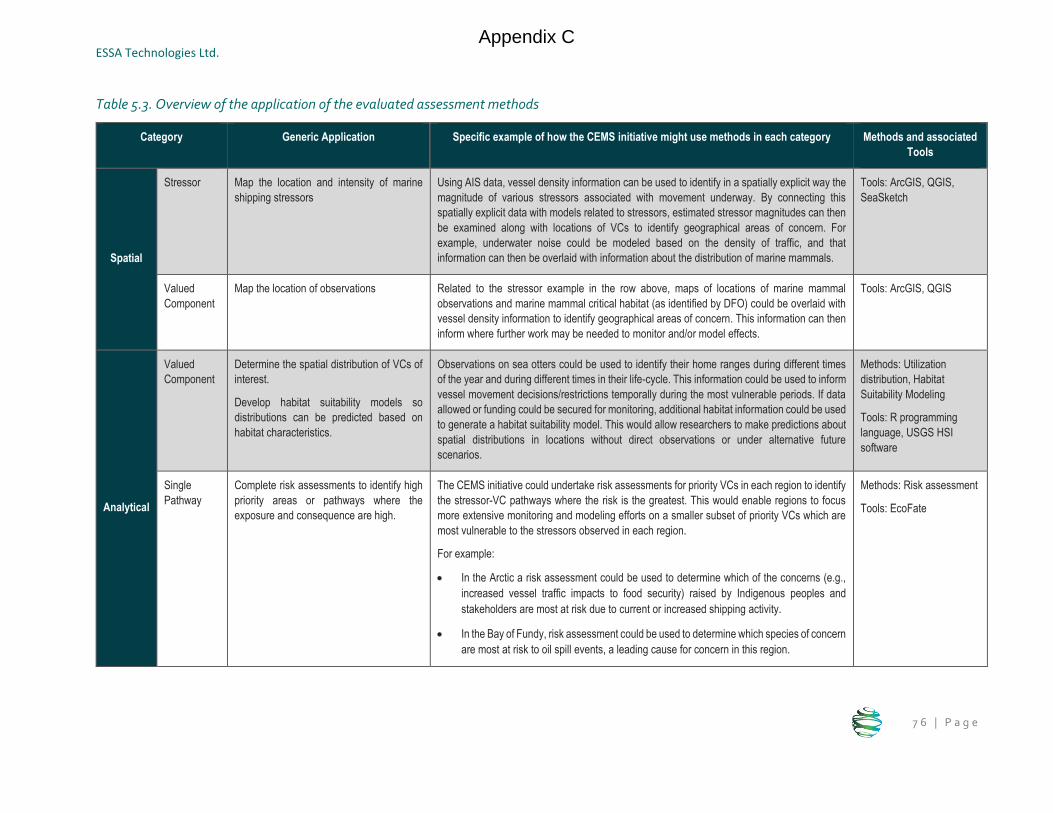
ESSA Technologies Ltd.
7 6 | P a g e
Table 5.3. Overview of the application of the evaluated assessment methods
Category Generic Application Specific example of how the CEMS initiative might use methods in each category Methods and associated
Tools
Spatial
Stressor Map the location and intensity of marine
shipping stressors
Using AIS data, vessel density information can be used to identify in a spatially explicit way the
magnitude of various stressors associated with movement underway. By connecting this
spatially explicit data with models related to stressors, estimated stressor magnitudes can then
be examined along with locations of VCs to identify geographical areas of concern. For
example, underwater noise could be modeled based on the density of traffic, and that
information can then be overlaid with information about the distribution of marine mammals.
Tools: ArcGIS, QGIS,
SeaSketch
Valued
Component
Map the location of observations Related to the stressor example in the row above, maps of locations of marine mammal
observations and marine mammal critical habitat (as identified by DFO) could be overlaid with
vessel density information to identify geographical areas of concern. This information can then
inform where further work may be needed to monitor and/or model effects.
Tools: ArcGIS, QGIS
Analytical
Valued
Component
Determine the spatial distribution of VCs of
interest.
Develop habitat suitability models so
distributions can be predicted based on
habitat characteristics.
Observations on sea otters could be used to identify their home ranges during different times
of the year and during different times in their life-cycle. This information could be used to inform
vessel movement decisions/restrictions temporally during the most vulnerable periods. If data
allowed or funding could be secured for monitoring, additional habitat information could be used
to generate a habitat suitability model. This would allow researchers to make predictions about
spatial distributions in locations without direct observations or under alternative future
scenarios.
Methods: Utilization
distribution, Habitat
Suitability Modeling
Tools: R programming
language, USGS HSI
software
Single
Pathway
Complete risk assessments to identify high
priority areas or pathways where the
exposure and consequence are high.
The CEMS initiative could undertake risk assessments for priority VCs in each region to identify
the stressor-VC pathways where the risk is the greatest. This would enable regions to focus
more extensive monitoring and modeling efforts on a smaller subset of priority VCs which are
most vulnerable to the stressors observed in each region.
For example:
In the Arctic a risk assessment could be used to determine which of the concerns (e.g.,
increased vessel traffic impacts to food security) raised by Indigenous peoples and
stakeholders are most at risk due to current or increased shipping activity.
In the Bay of Fundy, risk assessment could be used to determine which species of concern
are most at risk to oil spill events, a leading cause for concern in this region.
Methods: Risk assessment
Tools: EcoFate
Appendix C
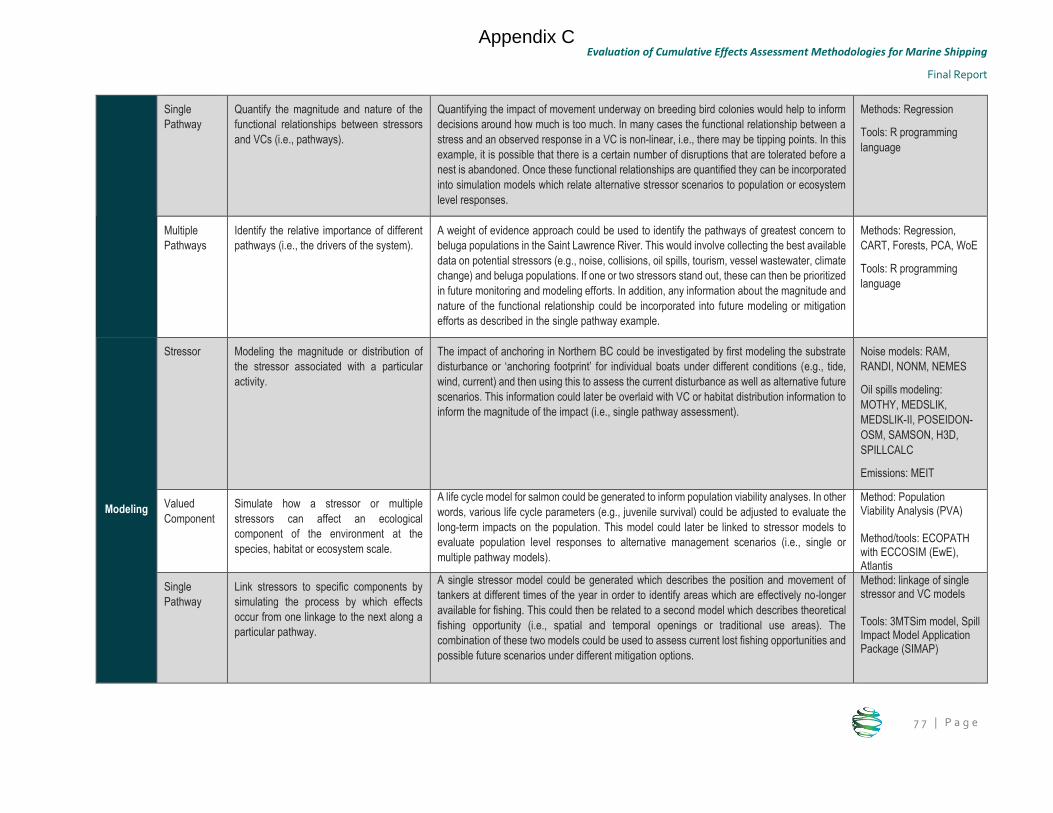
Evaluation of Cumulative Effects Assessment Methodologies for Marine Shipping
Final Report
7 7 | P a g e
Single
Pathway
Quantify the magnitude and nature of the
functional relationships between stressors
and VCs (i.e., pathways).
Quantifying the impact of movement underway on breeding bird colonies would help to inform
decisions around how much is too much. In many cases the functional relationship between a
stress and an observed response in a VC is non-linear, i.e., there may be tipping points. In this
example, it is possible that there is a certain number of disruptions that are tolerated before a
nest is abandoned. Once these functional relationships are quantified they can be incorporated
into simulation models which relate alternative stressor scenarios to population or ecosystem
level responses.
Methods: Regression
Tools: R programming
language
Multiple
Pathways
Identify the relative importance of different
pathways (i.e., the drivers of the system).
A weight of evidence approach could be used to identify the pathways of greatest concern to
beluga populations in the Saint Lawrence River. This would involve collecting the best available
data on potential stressors (e.g., noise, collisions, oil spills, tourism, vessel wastewater, climate
change) and beluga populations. If one or two stressors stand out, these can then be prioritized
in future monitoring and modeling efforts. In addition, any information about the magnitude and
nature of the functional relationship could be incorporated into future modeling or mitigation
efforts as described in the single pathway example.
Methods: Regression,
CART, Forests, PCA, WoE
Tools: R programming
language
Modeling
Stressor Modeling the magnitude or distribution of
the stressor associated with a particular
activity.
The impact of anchoring in Northern BC could be investigated by first modeling the substrate
disturbance or ‘anchoring footprint’ for individual boats under different conditions (e.g., tide,
wind, current) and then using this to assess the current disturbance as well as alternative future
scenarios. This information could later be overlaid with VC or habitat distribution information to
inform the magnitude of the impact (i.e., single pathway assessment).
Noise models: RAM,
RANDI, NONM, NEMES
Oil spills modeling:
MOTHY, MEDSLIK,
MEDSLIK-II, POSEIDON-
OSM, SAMSON, H3D,
SPILLCALC
Emissions: MEIT
Valued
Component
Simulate how a stressor or multiple
stressors can affect an ecological
component of the environment at the
species, habitat or ecosystem scale.
A life cycle model for salmon could be generated to inform population viability analyses. In other
words, various life cycle parameters (e.g., juvenile survival) could be adjusted to evaluate the
long-term impacts on the population. This model could later be linked to stressor models to
evaluate population level responses to alternative management scenarios (i.e., single or
multiple pathway models).
Method: Population Viability Analysis (PVA) Method/tools: ECOPATH with ECCOSIM (EwE), Atlantis
Single
Pathway
Link stressors to specific components by
simulating the process by which effects
occur from one linkage to the next along a
particular pathway.
A single stressor model could be generated which describes the position and movement of
tankers at different times of the year in order to identify areas which are effectively no-longer
available for fishing. This could then be related to a second model which describes theoretical
fishing opportunity (i.e., spatial and temporal openings or traditional use areas). The
combination of these two models could be used to assess current lost fishing opportunities and
possible future scenarios under different mitigation options.
Method: linkage of single stressor and VC models Tools: 3MTSim model, Spill Impact Model Application Package (SIMAP)
Appendix C
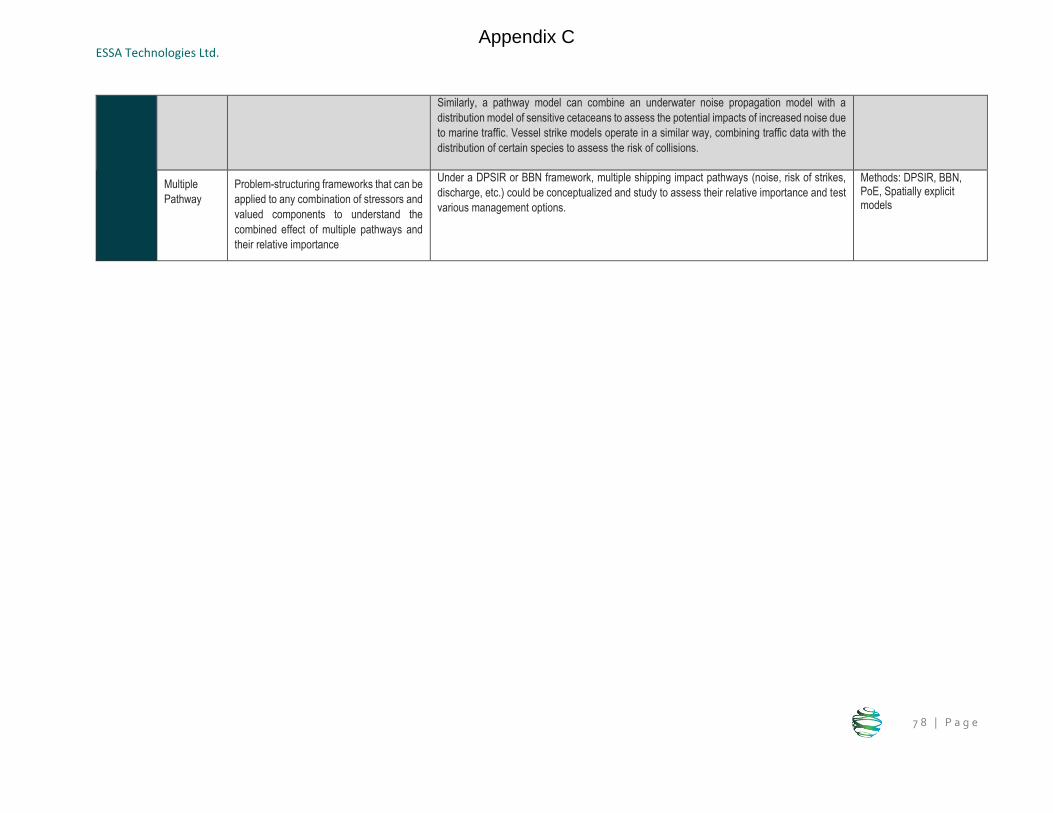
ESSA Technologies Ltd.
7 8 | P a g e
Similarly, a pathway model can combine an underwater noise propagation model with a
distribution model of sensitive cetaceans to assess the potential impacts of increased noise due
to marine traffic. Vessel strike models operate in a similar way, combining traffic data with the
distribution of certain species to assess the risk of collisions.
Multiple
Pathway
Problem-structuring frameworks that can be
applied to any combination of stressors and
valued components to understand the
combined effect of multiple pathways and
their relative importance
Under a DPSIR or BBN framework, multiple shipping impact pathways (noise, risk of strikes,
discharge, etc.) could be conceptualized and study to assess their relative importance and test
various management options.
Methods: DPSIR, BBN, PoE, Spatially explicit models
Appendix C

Evaluation of Cumulative Effects Assessment Methodologies for Marine Shipping
Final Report
7 9 | P a g e
5.2.2 Case-studies
We have selected relevant examples from the literature that illustrate the application of the assessment
methods in a context relevant for Transport Canada. Table 5.4 provides a list with a short description of these
30 cases studies. Most case-studies use a combination of methods to achieve their objectives. This is not
meant to be a comprehensive list but rather a list of relevant examples provided to help clarify how the methods
could be applied in practice.
Appendix C
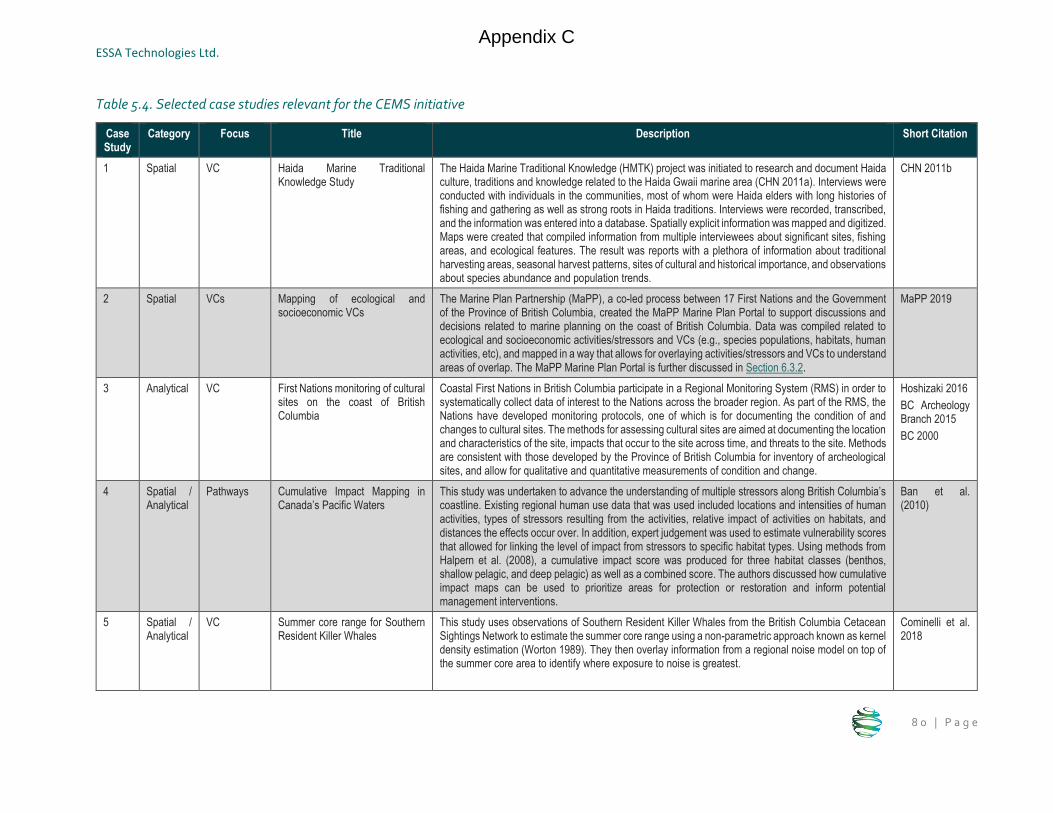
ESSA Technologies Ltd.
8 0 | P a g e
Table 5.4. Selected case studies relevant for the CEMS initiative
Case Study
Category Focus Title Description Short Citation
1 Spatial VC Haida Marine Traditional Knowledge Study
The Haida Marine Traditional Knowledge (HMTK) project was initiated to research and document Haida culture, traditions and knowledge related to the Haida Gwaii marine area (CHN 2011a). Interviews were conducted with individuals in the communities, most of whom were Haida elders with long histories of fishing and gathering as well as strong roots in Haida traditions. Interviews were recorded, transcribed, and the information was entered into a database. Spatially explicit information was mapped and digitized. Maps were created that compiled information from multiple interviewees about significant sites, fishing areas, and ecological features. The result was reports with a plethora of information about traditional harvesting areas, seasonal harvest patterns, sites of cultural and historical importance, and observations about species abundance and population trends.
CHN 2011b
2 Spatial VCs Mapping of ecological and socioeconomic VCs
The Marine Plan Partnership (MaPP), a co-led process between 17 First Nations and the Government of the Province of British Columbia, created the MaPP Marine Plan Portal to support discussions and decisions related to marine planning on the coast of British Columbia. Data was compiled related to ecological and socioeconomic activities/stressors and VCs (e.g., species populations, habitats, human activities, etc), and mapped in a way that allows for overlaying activities/stressors and VCs to understand areas of overlap. The MaPP Marine Plan Portal is further discussed in Section 6.3.2.
MaPP 2019
3 Analytical VC First Nations monitoring of cultural sites on the coast of British Columbia
Coastal First Nations in British Columbia participate in a Regional Monitoring System (RMS) in order to systematically collect data of interest to the Nations across the broader region. As part of the RMS, the Nations have developed monitoring protocols, one of which is for documenting the condition of and changes to cultural sites. The methods for assessing cultural sites are aimed at documenting the location and characteristics of the site, impacts that occur to the site across time, and threats to the site. Methods are consistent with those developed by the Province of British Columbia for inventory of archeological sites, and allow for qualitative and quantitative measurements of condition and change.
Hoshizaki 2016
BC Archeology Branch 2015
BC 2000
4 Spatial / Analytical
Pathways Cumulative Impact Mapping in Canada’s Pacific Waters
This study was undertaken to advance the understanding of multiple stressors along British Columbia’s coastline. Existing regional human use data that was used included locations and intensities of human activities, types of stressors resulting from the activities, relative impact of activities on habitats, and distances the effects occur over. In addition, expert judgement was used to estimate vulnerability scores that allowed for linking the level of impact from stressors to specific habitat types. Using methods from Halpern et al. (2008), a cumulative impact score was produced for three habitat classes (benthos, shallow pelagic, and deep pelagic) as well as a combined score. The authors discussed how cumulative impact maps can be used to prioritize areas for protection or restoration and inform potential management interventions.
Ban et al. (2010)
5 Spatial / Analytical
VC Summer core range for Southern Resident Killer Whales
This study uses observations of Southern Resident Killer Whales from the British Columbia Cetacean Sightings Network to estimate the summer core range using a non-parametric approach known as kernel density estimation (Worton 1989). They then overlay information from a regional noise model on top of the summer core area to identify where exposure to noise is greatest.
Cominelli et al. 2018
Appendix C
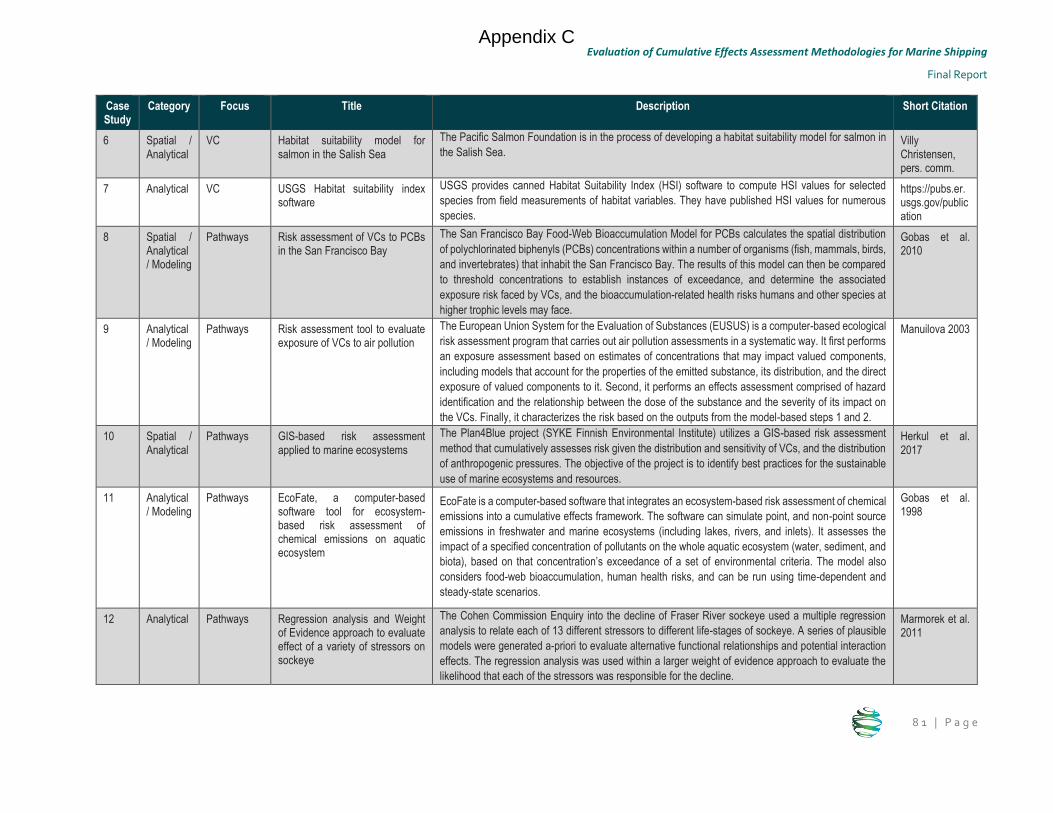
Evaluation of Cumulative Effects Assessment Methodologies for Marine Shipping
Final Report
8 1 | P a g e
Case Study
Category Focus Title Description Short Citation
6 Spatial / Analytical
VC Habitat suitability model for salmon in the Salish Sea
The Pacific Salmon Foundation is in the process of developing a habitat suitability model for salmon in
the Salish Sea. Villy Christensen, pers. comm.
7 Analytical VC USGS Habitat suitability index software
USGS provides canned Habitat Suitability Index (HSI) software to compute HSI values for selected
species from field measurements of habitat variables. They have published HSI values for numerous
species.
https://pubs.er.usgs.gov/publication
8 Spatial / Analytical / Modeling
Pathways Risk assessment of VCs to PCBs in the San Francisco Bay
The San Francisco Bay Food-Web Bioaccumulation Model for PCBs calculates the spatial distribution
of polychlorinated biphenyls (PCBs) concentrations within a number of organisms (fish, mammals, birds,
and invertebrates) that inhabit the San Francisco Bay. The results of this model can then be compared
to threshold concentrations to establish instances of exceedance, and determine the associated
exposure risk faced by VCs, and the bioaccumulation-related health risks humans and other species at
higher trophic levels may face.
Gobas et al. 2010
9 Analytical / Modeling
Pathways Risk assessment tool to evaluate exposure of VCs to air pollution
The European Union System for the Evaluation of Substances (EUSUS) is a computer-based ecological
risk assessment program that carries out air pollution assessments in a systematic way. It first performs
an exposure assessment based on estimates of concentrations that may impact valued components,
including models that account for the properties of the emitted substance, its distribution, and the direct
exposure of valued components to it. Second, it performs an effects assessment comprised of hazard
identification and the relationship between the dose of the substance and the severity of its impact on
the VCs. Finally, it characterizes the risk based on the outputs from the model-based steps 1 and 2.
Manuilova 2003
10 Spatial / Analytical
Pathways GIS-based risk assessment applied to marine ecosystems
The Plan4Blue project (SYKE Finnish Environmental Institute) utilizes a GIS-based risk assessment
method that cumulatively assesses risk given the distribution and sensitivity of VCs, and the distribution
of anthropogenic pressures. The objective of the project is to identify best practices for the sustainable
use of marine ecosystems and resources.
Herkul et al. 2017
11 Analytical / Modeling
Pathways EcoFate, a computer-based software tool for ecosystem-based risk assessment of chemical emissions on aquatic ecosystem
EcoFate is a computer-based software that integrates an ecosystem-based risk assessment of chemical
emissions into a cumulative effects framework. The software can simulate point, and non-point source
emissions in freshwater and marine ecosystems (including lakes, rivers, and inlets). It assesses the
impact of a specified concentration of pollutants on the whole aquatic ecosystem (water, sediment, and
biota), based on that concentration’s exceedance of a set of environmental criteria. The model also
considers food-web bioaccumulation, human health risks, and can be run using time-dependent and
steady-state scenarios.
Gobas et al. 1998
12 Analytical Pathways Regression analysis and Weight of Evidence approach to evaluate effect of a variety of stressors on sockeye
The Cohen Commission Enquiry into the decline of Fraser River sockeye used a multiple regression
analysis to relate each of 13 different stressors to different life-stages of sockeye. A series of plausible
models were generated a-priori to evaluate alternative functional relationships and potential interaction
effects. The regression analysis was used within a larger weight of evidence approach to evaluate the
likelihood that each of the stressors was responsible for the decline.
Marmorek et al. 2011
Appendix C
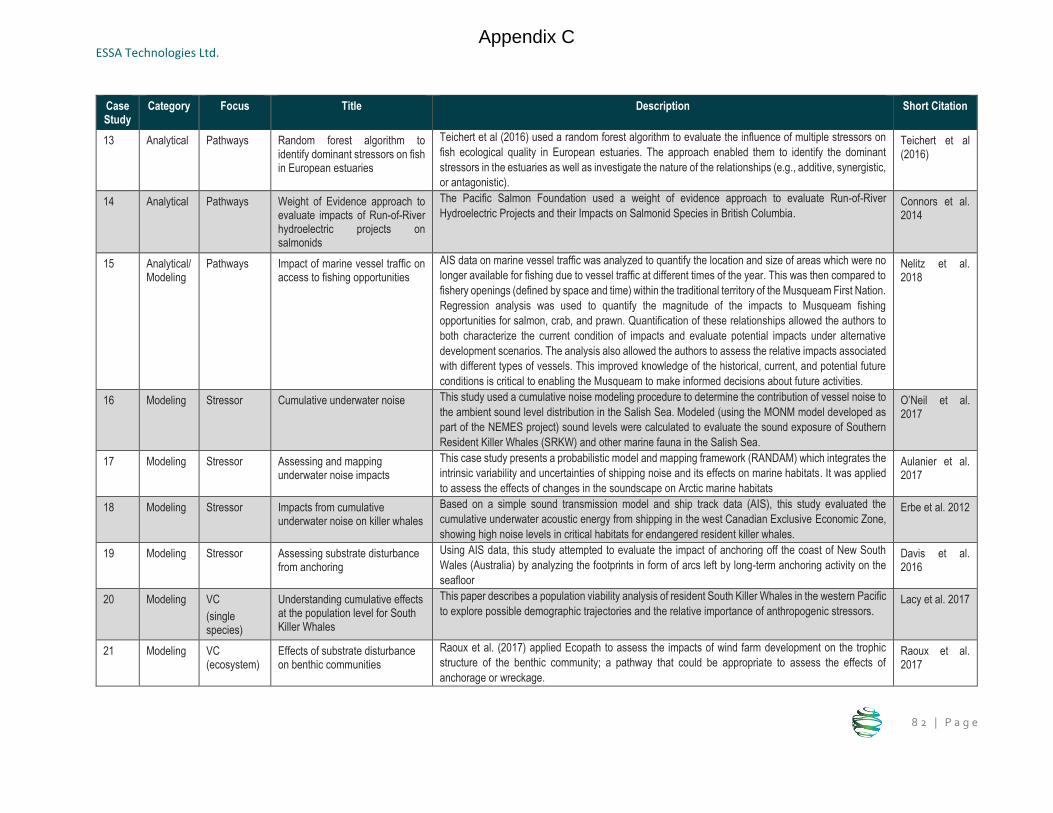
ESSA Technologies Ltd.
8 2 | P a g e
Case Study
Category Focus Title Description Short Citation
13 Analytical Pathways Random forest algorithm to identify dominant stressors on fish in European estuaries
Teichert et al (2016) used a random forest algorithm to evaluate the influence of multiple stressors on
fish ecological quality in European estuaries. The approach enabled them to identify the dominant
stressors in the estuaries as well as investigate the nature of the relationships (e.g., additive, synergistic,
or antagonistic).
Teichert et al (2016)
14 Analytical Pathways Weight of Evidence approach to evaluate impacts of Run-of-River hydroelectric projects on salmonids
The Pacific Salmon Foundation used a weight of evidence approach to evaluate Run-of-River
Hydroelectric Projects and their Impacts on Salmonid Species in British Columbia. Connors et al. 2014
15 Analytical/Modeling
Pathways Impact of marine vessel traffic on access to fishing opportunities
AIS data on marine vessel traffic was analyzed to quantify the location and size of areas which were no
longer available for fishing due to vessel traffic at different times of the year. This was then compared to
fishery openings (defined by space and time) within the traditional territory of the Musqueam First Nation.
Regression analysis was used to quantify the magnitude of the impacts to Musqueam fishing
opportunities for salmon, crab, and prawn. Quantification of these relationships allowed the authors to
both characterize the current condition of impacts and evaluate potential impacts under alternative
development scenarios. The analysis also allowed the authors to assess the relative impacts associated
with different types of vessels. This improved knowledge of the historical, current, and potential future
conditions is critical to enabling the Musqueam to make informed decisions about future activities.
Nelitz et al. 2018
16 Modeling Stressor Cumulative underwater noise This study used a cumulative noise modeling procedure to determine the contribution of vessel noise to
the ambient sound level distribution in the Salish Sea. Modeled (using the MONM model developed as
part of the NEMES project) sound levels were calculated to evaluate the sound exposure of Southern
Resident Killer Whales (SRKW) and other marine fauna in the Salish Sea.
O’Neil et al. 2017
17 Modeling Stressor Assessing and mapping underwater noise impacts
This case study presents a probabilistic model and mapping framework (RANDAM) which integrates the
intrinsic variability and uncertainties of shipping noise and its effects on marine habitats. It was applied
to assess the effects of changes in the soundscape on Arctic marine habitats
Aulanier et al. 2017
18 Modeling Stressor Impacts from cumulative underwater noise on killer whales
Based on a simple sound transmission model and ship track data (AIS), this study evaluated the
cumulative underwater acoustic energy from shipping in the west Canadian Exclusive Economic Zone,
showing high noise levels in critical habitats for endangered resident killer whales.
Erbe et al. 2012
19 Modeling Stressor Assessing substrate disturbance from anchoring
Using AIS data, this study attempted to evaluate the impact of anchoring off the coast of New South
Wales (Australia) by analyzing the footprints in form of arcs left by long-term anchoring activity on the
seafloor
Davis et al. 2016
20 Modeling VC
(single species)
Understanding cumulative effects at the population level for South Killer Whales
This paper describes a population viability analysis of resident South Killer Whales in the western Pacific
to explore possible demographic trajectories and the relative importance of anthropogenic stressors.
Lacy et al. 2017
21 Modeling VC (ecosystem)
Effects of substrate disturbance on benthic communities
Raoux et al. (2017) applied Ecopath to assess the impacts of wind farm development on the trophic
structure of the benthic community; a pathway that could be appropriate to assess the effects of
anchorage or wreckage.
Raoux et al. 2017
Appendix C
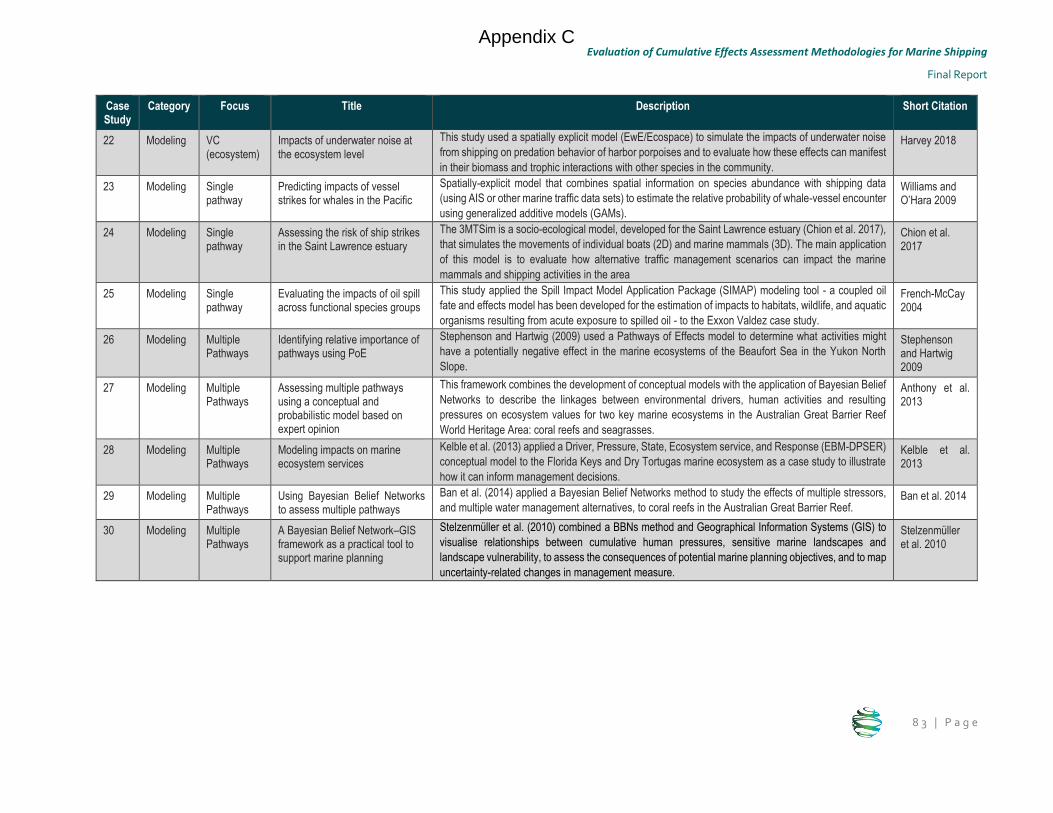
Evaluation of Cumulative Effects Assessment Methodologies for Marine Shipping
Final Report
8 3 | P a g e
Case Study
Category Focus Title Description Short Citation
22 Modeling VC (ecosystem)
Impacts of underwater noise at the ecosystem level
This study used a spatially explicit model (EwE/Ecospace) to simulate the impacts of underwater noise
from shipping on predation behavior of harbor porpoises and to evaluate how these effects can manifest
in their biomass and trophic interactions with other species in the community.
Harvey 2018
23 Modeling Single pathway
Predicting impacts of vessel strikes for whales in the Pacific
Spatially-explicit model that combines spatial information on species abundance with shipping data
(using AIS or other marine traffic data sets) to estimate the relative probability of whale-vessel encounter
using generalized additive models (GAMs).
Williams and O’Hara 2009
24 Modeling Single pathway
Assessing the risk of ship strikes in the Saint Lawrence estuary
The 3MTSim is a socio-ecological model, developed for the Saint Lawrence estuary (Chion et al. 2017),
that simulates the movements of individual boats (2D) and marine mammals (3D). The main application
of this model is to evaluate how alternative traffic management scenarios can impact the marine
mammals and shipping activities in the area
Chion et al. 2017
25 Modeling Single pathway
Evaluating the impacts of oil spill across functional species groups
This study applied the Spill Impact Model Application Package (SIMAP) modeling tool - a coupled oil
fate and effects model has been developed for the estimation of impacts to habitats, wildlife, and aquatic
organisms resulting from acute exposure to spilled oil - to the Exxon Valdez case study.
French-McCay 2004
26 Modeling Multiple Pathways
Identifying relative importance of pathways using PoE
Stephenson and Hartwig (2009) used a Pathways of Effects model to determine what activities might
have a potentially negative effect in the marine ecosystems of the Beaufort Sea in the Yukon North
Slope.
Stephenson and Hartwig 2009
27 Modeling Multiple Pathways
Assessing multiple pathways using a conceptual and probabilistic model based on expert opinion
This framework combines the development of conceptual models with the application of Bayesian Belief
Networks to describe the linkages between environmental drivers, human activities and resulting
pressures on ecosystem values for two key marine ecosystems in the Australian Great Barrier Reef
World Heritage Area: coral reefs and seagrasses.
Anthony et al. 2013
28 Modeling Multiple Pathways
Modeling impacts on marine ecosystem services
Kelble et al. (2013) applied a Driver, Pressure, State, Ecosystem service, and Response (EBM-DPSER)
conceptual model to the Florida Keys and Dry Tortugas marine ecosystem as a case study to illustrate
how it can inform management decisions.
Kelble et al. 2013
29 Modeling Multiple Pathways
Using Bayesian Belief Networks to assess multiple pathways
Ban et al. (2014) applied a Bayesian Belief Networks method to study the effects of multiple stressors,
and multiple water management alternatives, to coral reefs in the Australian Great Barrier Reef. Ban et al. 2014
30 Modeling Multiple Pathways
A Bayesian Belief Network–GIS framework as a practical tool to support marine planning
Stelzenmüller et al. (2010) combined a BBNs method and Geographical Information Systems (GIS) to
visualise relationships between cumulative human pressures, sensitive marine landscapes and
landscape vulnerability, to assess the consequences of potential marine planning objectives, and to map
uncertainty-related changes in management measure.
Stelzenmüller et al. 2010
Appendix C
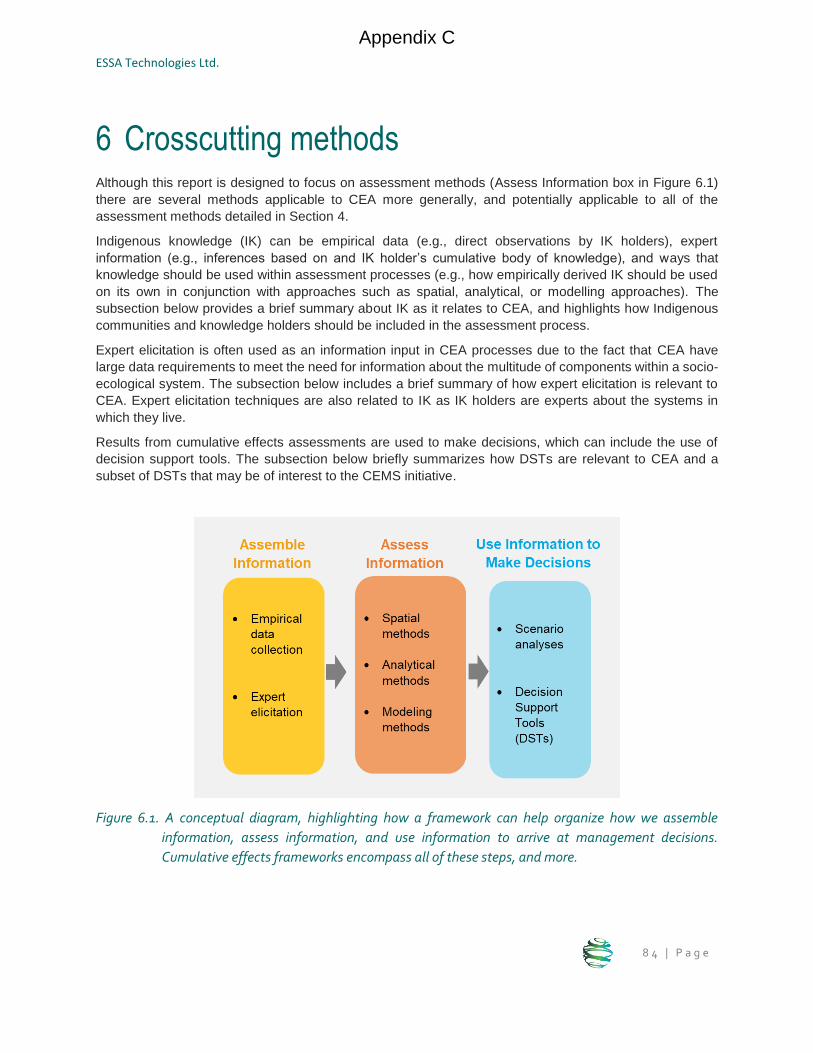
ESSA Technologies Ltd.
8 4 | P a g e
6 Crosscutting methods Although this report is designed to focus on assessment methods (Assess Information box in Figure 6.1)
there are several methods applicable to CEA more generally, and potentially applicable to all of the
assessment methods detailed in Section 4.
Indigenous knowledge (IK) can be empirical data (e.g., direct observations by IK holders), expert
information (e.g., inferences based on and IK holder’s cumulative body of knowledge), and ways that
knowledge should be used within assessment processes (e.g., how empirically derived IK should be used
on its own in conjunction with approaches such as spatial, analytical, or modelling approaches). The
subsection below provides a brief summary about IK as it relates to CEA, and highlights how Indigenous
communities and knowledge holders should be included in the assessment process.
Expert elicitation is often used as an information input in CEA processes due to the fact that CEA have
large data requirements to meet the need for information about the multitude of components within a socio-
ecological system. The subsection below includes a brief summary of how expert elicitation is relevant to
CEA. Expert elicitation techniques are also related to IK as IK holders are experts about the systems in
which they live.
Results from cumulative effects assessments are used to make decisions, which can include the use of
decision support tools. The subsection below briefly summarizes how DSTs are relevant to CEA and a
subset of DSTs that may be of interest to the CEMS initiative.
Figure 6.1. A conceptual diagram, highlighting how a framework can help organize how we assemble
information, assess information, and use information to arrive at management decisions.
Cumulative effects frameworks encompass all of these steps, and more.
Appendix C
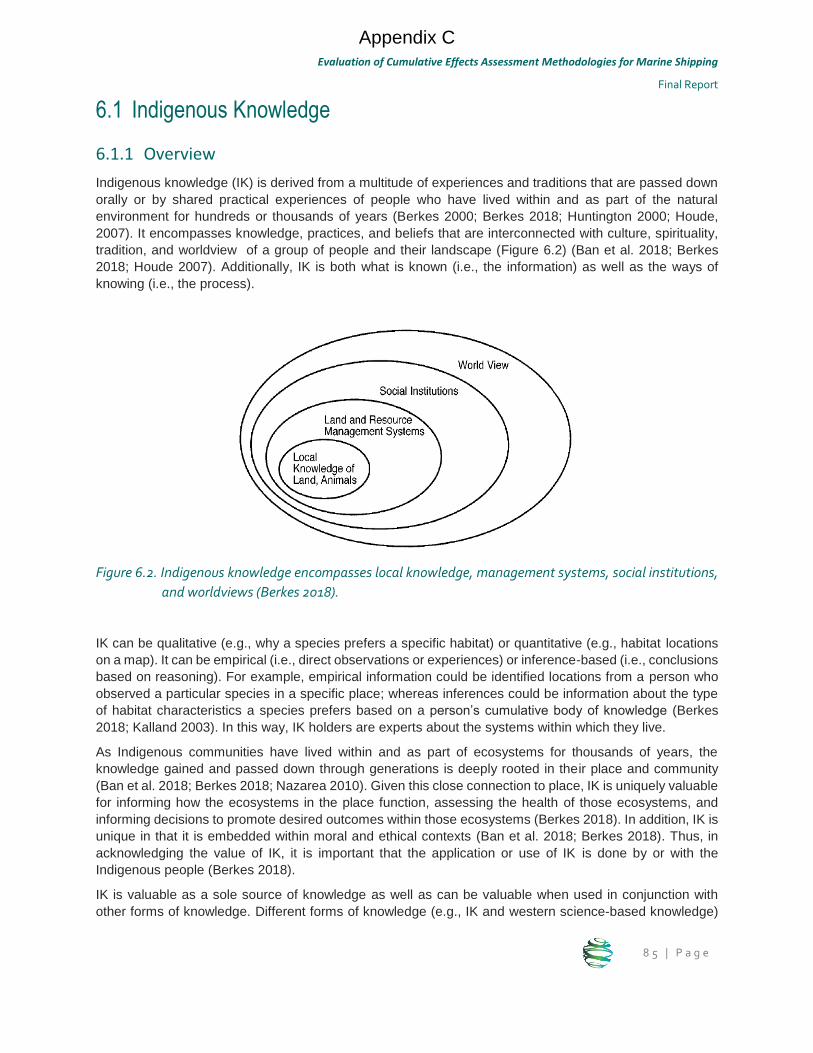
Evaluation of Cumulative Effects Assessment Methodologies for Marine Shipping
Final Report
8 5 | P a g e
6.1 Indigenous Knowledge
6.1.1 Overview
Indigenous knowledge (IK) is derived from a multitude of experiences and traditions that are passed down
orally or by shared practical experiences of people who have lived within and as part of the natural
environment for hundreds or thousands of years (Berkes 2000; Berkes 2018; Huntington 2000; Houde,
2007). It encompasses knowledge, practices, and beliefs that are interconnected with culture, spirituality,
tradition, and worldview of a group of people and their landscape (Figure 6.2) (Ban et al. 2018; Berkes
2018; Houde 2007). Additionally, IK is both what is known (i.e., the information) as well as the ways of
knowing (i.e., the process).
Figure 6.2. Indigenous knowledge encompasses local knowledge, management systems, social institutions,
and worldviews (Berkes 2018).
IK can be qualitative (e.g., why a species prefers a specific habitat) or quantitative (e.g., habitat locations
on a map). It can be empirical (i.e., direct observations or experiences) or inference-based (i.e., conclusions
based on reasoning). For example, empirical information could be identified locations from a person who
observed a particular species in a specific place; whereas inferences could be information about the type
of habitat characteristics a species prefers based on a person’s cumulative body of knowledge (Berkes
2018; Kalland 2003). In this way, IK holders are experts about the systems within which they live.
As Indigenous communities have lived within and as part of ecosystems for thousands of years, the
knowledge gained and passed down through generations is deeply rooted in their place and community
(Ban et al. 2018; Berkes 2018; Nazarea 2010). Given this close connection to place, IK is uniquely valuable
for informing how the ecosystems in the place function, assessing the health of those ecosystems, and
informing decisions to promote desired outcomes within those ecosystems (Berkes 2018). In addition, IK is
unique in that it is embedded within moral and ethical contexts (Ban et al. 2018; Berkes 2018). Thus, in
acknowledging the value of IK, it is important that the application or use of IK is done by or with the
Indigenous people (Berkes 2018).
IK is valuable as a sole source of knowledge as well as can be valuable when used in conjunction with
other forms of knowledge. Different forms of knowledge (e.g., IK and western science-based knowledge)
Appendix C
ESSA Technologies Ltd.
8 6 | P a g e
entail unique strengths and limitations. For example, IK can provide information across long time scales but
may be limited by human memory (e.g., things deemed more important or significant events may be more
likely to be remembered and passed on), whereas western scientific information from oceanographic
devices may be shorter-term but operate 24 hours a day to collect fine-scaled data (Ban et al. 2018; Lewis
et al. 2009). Information from multiple methodologies with differing and potentially complementary strengths
and limitations can provide stronger insights than from one method alone, ultimately increasing the weight
of evidence for findings (Gadgil et al. 1993; Huntington et al. 2004; Salomon et al. 2007; Tengö et al. 2014;
and refer to Section 4.3.1.3 for details about weight of evidence methods) When IK is combined or braided
with western science information and/or methodologies, differing strengths can be used in complementary
ways to improve inferences (Ban et al. 2017). However, there is a risk of institutionalizing IK into existing
western scientific structures and so it is important that these processes are conducted with IK holders and
communities (Berkes 2018; Mistry and Berardi 2016).
6.1.2 Relevance for the CEMS initiative
Coastal Indigenous communities have lived along Canada’s shores since time immemorial. Over this long
period of time, they have acquired a rich historical knowledge about the places in which they have been a
part and developed locally-relevant marine resource management practices (Ban et al. 2017, Ban et al.
2018). This IK entails uniquely valuable information relevant to identifying valued components of the
ecosystem and determining how marine shipping may be connected to those components. How this IK
should be applied as a sole source of information or how it could be used in conjunction with other forms
of knowledge will be dependent on the type of IK that exists within the communities and how they see it
best being applied.
When working with Indigenous communities to determine how to assess cumulative effects and the ways
IK could be applied, one example of a potential application is identifying VCs and understanding how
different components of the system are connected. Another example relevant to examining the relationship
between components is as part of a Bayesian Belief Network (BBN) approach (Section 4.4.1.4). BBNs allow
for integrating Indigenous and expert knowledge (as priors) with field-based data to determine predictions
about system behavior, which allows for more informed results than using field-based data alone (Ban et
al. 2014). An example that relates to the use of CEA in decision making is the Mauri Model, which is a DST
developed with an Indigenous worldview, and further discussed in Section 6.3. Another example related to
understanding the status of components is a specific case undertaken on the central coast of British
Columbia by Ban et al. (2017) (detailed below).
6.1.2.1 Case Study
In response to concerns about declines in First Nations Dungeness crab catches and Fisheries and Oceans
Canada requests that First Nations provide evidence of a problem in satisfying their food, social, and
ceremonial (FSC) needs, First Nations on the central coast of British Columbia undertook a study to
document IK with Indigenous fishers and model the probabilities of experiencing successful FSC harvests
(Ban et al. 2017).
Interviews were conducted with Indigenous fishers, within which they were asked about crab catches and
abundance across their lifetime, gear types used, the number of crabs they desire to eat per year, and the
catch rate necessary for them to consider a FSC trip successful. Responses were then used along with
local abundance data derived from recently collected field-based data to conduct computer simulations and
estimate the probabilities of experiencing successful FSC trips at different sites under current levels of
abundance. Results indicated that fishers have experienced changes in abundance across their lifetime
and that the probabilities of experiencing a successful FSC trip were low at all sites except one.
Appendix C
Evaluation of Cumulative Effects Assessment Methodologies for Marine Shipping
Final Report
8 7 | P a g e
This study provides an example of working with Indigenous knowledge holders to apply their IK in a way
that can inform improving management. Specific to assessing cumulative effects, it provides an example of
how IK can be used to better understand the status of a VC (i.e., Dungeness crab) and where important
thresholds exist (i.e., number of crabs needed for FSC fishery).
6.2 Expert Elicitation
6.2.1 Overview
In the absence of empirical evidence on how different ecosystems respond to multiple stressors, marine
managers have looked to the use of expert elicitation methods in order to estimate both the absolute and/or
relative impacts of stressors on Valued Components (VCs). In doing so, approaches have used expert
elicitation to identify components important for inclusion in assessment, including what human activities
should be included, what stressors result from which activities, and what components of the socio-
ecological system are important to include. Expert elicitation has also been used to quantify the relationship
between the different components within the system. For example, the cumulative impact mapping
approach developed by Halpern et al. (2008) involves eliciting expert judgement to estimate ecosystem-
specific levels of impact for multiple anthropogenic drivers of ecological change.
The use of expert elicitation allows for identifying key knowledge gaps (e.g., where priority VCs have limited
data), comparing estimates of impacts across different stressors and VCs, and prioritizing areas where
management efforts should be focused.
Methods of documenting expert knowledge include hosting workshops, conducting interviews, and
performing surveys (Longhurst 2003, Halpern 2007).
6.2.2 Relevance for the CEMS initiative
Cumulative effects assessments require data related to multiple human activities and how they relate to the
multiple components within the system. With these multiple dataset requirements assessments frequently
encounter the issue of data availability and paucity. Expert knowledge derived from elicitation can
supplement temporally-restricted data by providing a proxy for long-term field data (Singh et al. 2017).
In the absence of data collected from scientific studies or Indigenous knowledge, expert knowledge has
been used to identify important elements in a socio-ecological system and estimate how they are related.
Because cumulative effects assessments inherently involve examining multiple stressors and multiple
valued components, there are often large data needs, and associated data gaps, which lead to reliance on
expert knowledge.
6.2.2.1 Case Study
An expert elicitation procedure has been applied to understand the impact of human activities on marine
ecosystem services (Singh et al. 2017) in the coastal areas of Tasman and Golden Bays (New Zealand).
Through an iterative interview procedure, experts on each of the ecosystem services under analysis were
asked to derive impact scores and pathways for each designated activity or stressor, characterizing
uncertainty parameters for each resulting ‘impact profiles’.
One of the outcomes of this analysis was the mapping of the mechanistic pathways by which drivers and
stressors impact ecosystem services. The information provided by experts through interviews was
organized in the following way to create the pathways: Driver → Stressor → Impact on Ecosystem Service.
Appendix C
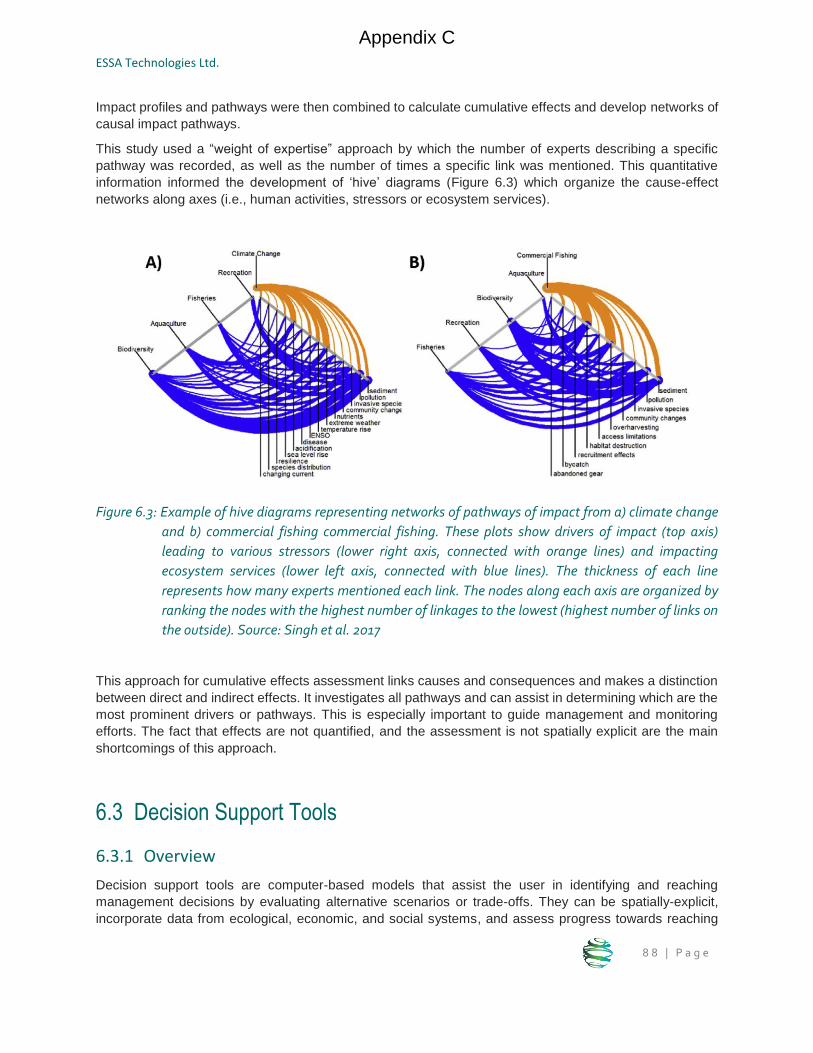
ESSA Technologies Ltd.
8 8 | P a g e
Impact profiles and pathways were then combined to calculate cumulative effects and develop networks of
causal impact pathways.
This study used a “weight of expertise” approach by which the number of experts describing a specific
pathway was recorded, as well as the number of times a specific link was mentioned. This quantitative
information informed the development of ‘hive’ diagrams (Figure 6.3) which organize the cause-effect
networks along axes (i.e., human activities, stressors or ecosystem services).
Figure 6.3: Example of hive diagrams representing networks of pathways of impact from a) climate change
and b) commercial fishing commercial fishing. These plots show drivers of impact (top axis)
leading to various stressors (lower right axis, connected with orange lines) and impacting
ecosystem services (lower left axis, connected with blue lines). The thickness of each line
represents how many experts mentioned each link. The nodes along each axis are organized by
ranking the nodes with the highest number of linkages to the lowest (highest number of links on
the outside). Source: Singh et al. 2017
This approach for cumulative effects assessment links causes and consequences and makes a distinction
between direct and indirect effects. It investigates all pathways and can assist in determining which are the
most prominent drivers or pathways. This is especially important to guide management and monitoring
efforts. The fact that effects are not quantified, and the assessment is not spatially explicit are the main
shortcomings of this approach.
6.3 Decision Support Tools
6.3.1 Overview
Decision support tools are computer-based models that assist the user in identifying and reaching
management decisions by evaluating alternative scenarios or trade-offs. They can be spatially-explicit,
incorporate data from ecological, economic, and social systems, and assess progress towards reaching
Appendix C
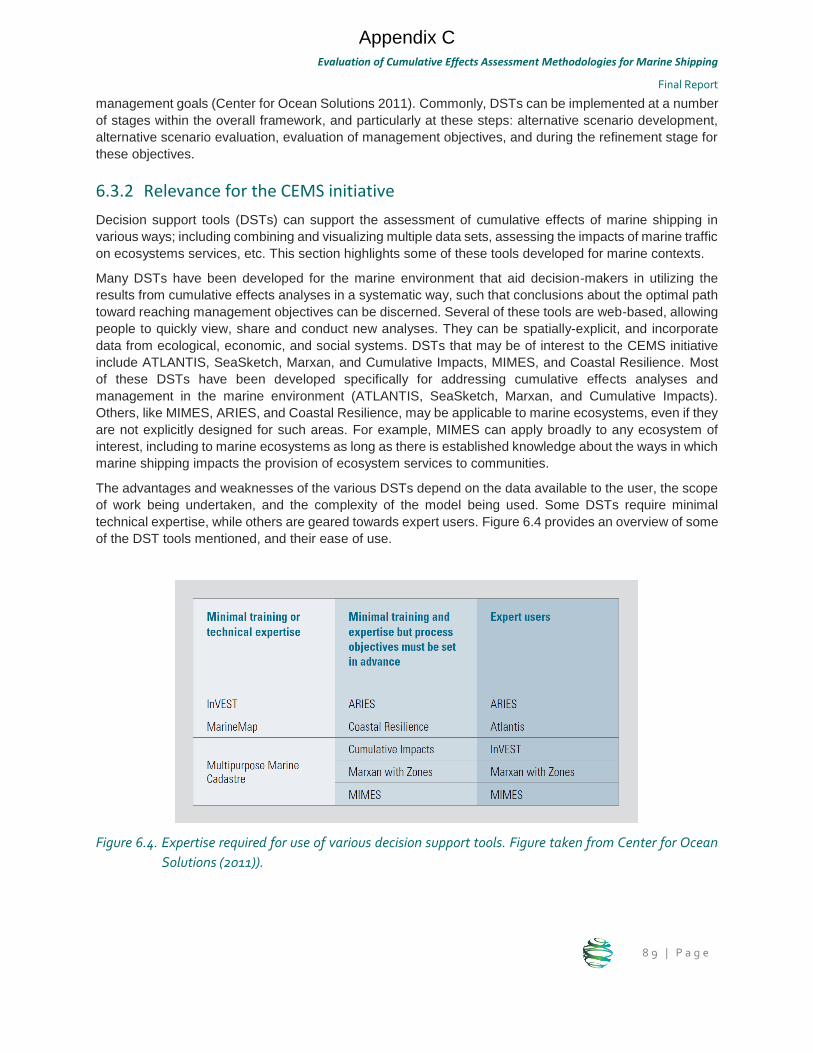
Evaluation of Cumulative Effects Assessment Methodologies for Marine Shipping
Final Report
8 9 | P a g e
management goals (Center for Ocean Solutions 2011). Commonly, DSTs can be implemented at a number
of stages within the overall framework, and particularly at these steps: alternative scenario development,
alternative scenario evaluation, evaluation of management objectives, and during the refinement stage for
these objectives.
6.3.2 Relevance for the CEMS initiative
Decision support tools (DSTs) can support the assessment of cumulative effects of marine shipping in
various ways; including combining and visualizing multiple data sets, assessing the impacts of marine traffic
on ecosystems services, etc. This section highlights some of these tools developed for marine contexts.
Many DSTs have been developed for the marine environment that aid decision-makers in utilizing the
results from cumulative effects analyses in a systematic way, such that conclusions about the optimal path
toward reaching management objectives can be discerned. Several of these tools are web-based, allowing
people to quickly view, share and conduct new analyses. They can be spatially-explicit, and incorporate
data from ecological, economic, and social systems. DSTs that may be of interest to the CEMS initiative
include ATLANTIS, SeaSketch, Marxan, and Cumulative Impacts, MIMES, and Coastal Resilience. Most
of these DSTs have been developed specifically for addressing cumulative effects analyses and
management in the marine environment (ATLANTIS, SeaSketch, Marxan, and Cumulative Impacts).
Others, like MIMES, ARIES, and Coastal Resilience, may be applicable to marine ecosystems, even if they
are not explicitly designed for such areas. For example, MIMES can apply broadly to any ecosystem of
interest, including to marine ecosystems as long as there is established knowledge about the ways in which
marine shipping impacts the provision of ecosystem services to communities.
The advantages and weaknesses of the various DSTs depend on the data available to the user, the scope
of work being undertaken, and the complexity of the model being used. Some DSTs require minimal
technical expertise, while others are geared towards expert users. Figure 6.4 provides an overview of some
of the DST tools mentioned, and their ease of use.
Figure 6.4. Expertise required for use of various decision support tools. Figure taken from Center for Ocean
Solutions (2011)).
Appendix C

ESSA Technologies Ltd.
9 0 | P a g e
The Multi-scale Integrated Models of Ecosystem Services tool (MIMES), developed by AFORDable
Futures, is a GIS-based model that valuates ecosystem services and quantifies the flow of benefits to
communities who are provisioned by those services. Once ecosystem services have been valuated, it is
then possible to quantify the extent to which adverse impacts to the ecosystem, such as land and sea-use
changes, will culminate in impacts to the community, in a trade-off style analysis. MIMES can be applied to
ecosystems at any scale between local and global.
Marxan with Zones, developed by The Ecology Centre (University of Queensland), is a popular DST, and
an extension of the widely-used Marxan software. The main use of the tool is for identifying priority marine
conservation areas from a suite of potential sites and meeting user-defined biodiversity targets based on
multiple ecological, social, and economic values, and at the lowest possible cost (Game and Grantham
2008). It does so by assessing “reserve design” problems via exact algorithms and non-exact algorithms
(heuristics) to produce optimal and near-optimal solutions. The Marxan with Zones extends the analysis by
allowing for various levels of protection to be allocated to identified conservation areas (Watts et al. 2008).
SeaSketch is a participatory, web-based marine mapping tool that allows users to generate, share, and
discuss several spatially-explicit alternative management plans or conservation zones. The tool has the
ability to integrate other decision support tools such as Marxan analyses and Cumulative Impacts models
(Section 4.2) so that the spatial distribution of priority areas can be assessed with regard to cumulative
effects. Feedback reports generated from maps of user-defined zones of interest provide information on
protected habitats, socio-cultural and economic cost-benefit analyses, and more (www.SeaSketch.org).
The ATLANTIS ecosystem model, developed by Commonwealth Scientific and Industrial Research
Organization (CSIRO), is a sophisticated simulation model that can assess different environmental
scenarios such as climate change, human impacts, land use changes, pollution distributions, and the effects
of wind and wave farms on marine ecosystems (Kaplan et al. 2014). It uses spatially-explicit information on
physical, chemical, biological, and socio-economic data to simulate food-web relationships, hydrographic
processes, habitat interactions, and more. It is intended to be used as a long-term decision-making tool
(Center for Ocean Solutions 2011).
The Mauri Model is a decision-making tool that quantitatively assesses the impact of stressors on four
dimensions of ‘mauri’, or, an entity’s inherent value. The model has been developed under the belief that
decisions regarding the value of an entity are not sustainable if only economic valuation is considered.
Instead, it assigns values based on a combination of ecosystem, community, cultural, and economic mauri
(Peacock et al. 2012). These categories may be equally weighted or allow for a redistribution of weight
depending on the perspectives or biases of the stakeholders. The model is capable of addressing some of
the typical issues identified in CEAs such as comparison of indicators in the absence of complete datasets
and can be implemented to assess current and future scenarios.
Other examples of decision support tools of relevance for the marine environment include:
The Coastal Resilience DST is another web-based mapping tool, developed by The Nature
Conservancy. It provides users with spatially-explicit information on coastal ecosystems, socio-
economic considerations, and community vulnerabilities for current and future scenarios (Centre
for Ocean Solutions 2011).
Artificial Intelligence for Ecosystem Services (ARIES) is a tool that maps and quantifies
environmental assets, as well as impacts to these assets arising from climate change, or land
use/cover changes (Center for Ocean Solutions 2011). Ecosystem service flows and pathways are
spatially and temporally modeled, which enables users to identify critical intersections between
pathways. The model works by using a suite of approaches including Bayesian networks (Section
5.4), machine learning, and pattern recognition (Center for Ocean Solutions 2011).
Appendix C
Evaluation of Cumulative Effects Assessment Methodologies for Marine Shipping
Final Report
9 1 | P a g e
InVEST, developed by the Natural Capital Project, is a set of open-source, GIS-based models that
map the value of ecosystem services, and performs a trade-off analysis to evaluate how proposed
developments might impact the ecosystem and alter the flow of ecosystem-derived values. Outputs
from this tool are provided in biophysical or economic terms.
6.3.2.1 Case Study
The Marine Plan Partnership for the North Pacific Coast (MaPP) is a project aimed at developing and
implementing marine use plans for the North Coast of Canada, through collaborative work between 18 First
Nations and the Government of British Columbia (www.mappocean.org, Marine Plan Partnership Initiative
2015). The goal is to provide recommendations for achieving healthy ecosystems, socio-cultural wellbeing,
and economic development using a marine ecosystem-based management (EBM) framework (Marine Plan
Partnership Initiative 2015).
MaPP uses the SeaSketch decision support tool by first integrating a Marxan analysis to inform the
placement of areas of high conservation value within the maps generated through SeaSketch
(www.seasketch.org). The resulting “marine planning portal” was used to assess multiple layers of data to
provide a holistic view of planning options, given valued components such as species, habitats, First
Nations cultural sites, and more (www.coastalfirstnations.ca).
Using data assembled from literature reviews, workshops, and expert elicitation, Marxan was run offline for
over 170 spatially-explicit datasets of relevant ecological information to produce maps which provide
solutions to the identified management problem. The results were uploaded to the web-based SeaSketch
tool. Users of the online SeaSketch tool were then able to establish and prioritize candidate conservation
areas based on the level of protection, assigned through the Marxan analysis, of the underlying layers
Marxan. The output of this integration is both a map of priority-ranked conservation areas, and quantitative
scores for user-defined zones, based on the level of protection assigned to the areas.
Appendix C
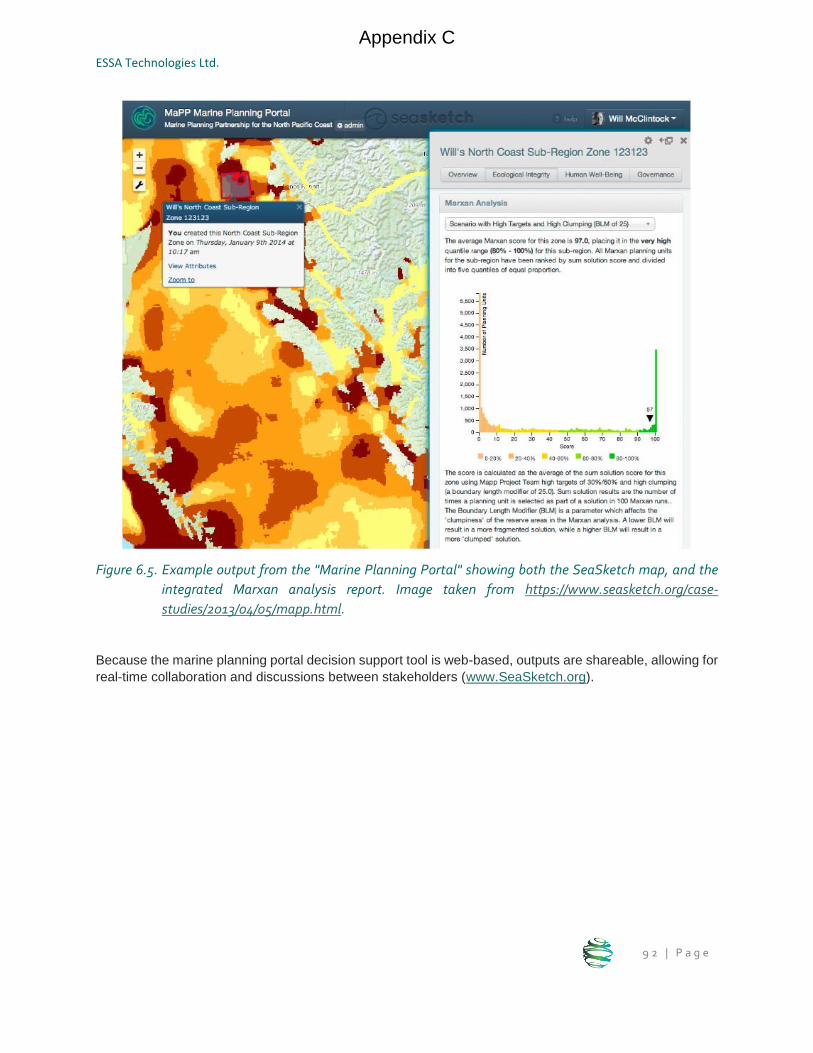
ESSA Technologies Ltd.
9 2 | P a g e
Figure 6.5. Example output from the "Marine Planning Portal" showing both the SeaSketch map, and the
integrated Marxan analysis report. Image taken from https://www.seasketch.org/case-
studies/2013/04/05/mapp.html.
Because the marine planning portal decision support tool is web-based, outputs are shareable, allowing for
real-time collaboration and discussions between stakeholders (www.SeaSketch.org).
Appendix C
Evaluation of Cumulative Effects Assessment Methodologies for Marine Shipping
Final Report
9 3 | P a g e
7 Organizing methods: CEA Frameworks
7.1 Overview
Frameworks bring together the various spatial, analytical, and modeling strategies discussed throughout
this report, and assemble them in a way to address the objectives of a given initiative (see Figure 6.1). The
CEA framework for the CEMS initiative should help to clarify which tools to use, when, and at what stage
of the analysis. While analysis of potentially useful frameworks is technically beyond scope of the project,
it is helpful to think about how the methods discussed in this report may be used in combination. Some
examples of frameworks which could be incorporated into the cumulative effects analysis (CEA) include
scenario analysis, management strategy evaluation, and risk assessment (Rebecca Martone pers. comm).
Scenario analysis is a process that identifies and analyses several potential future outcomes, rather than
identifying a single, precise future outcome. It utilizes one set of assumptions to arrive at multiple alternative
scenarios (Hassani 2016). Scenario analysis is incorporated in assessment Step 3 (Figure 1.2).
Management strategy evaluation (MSE) assesses the effectiveness of different combinations of data
collection approaches, analysis methods, and processing in achieving desired management goals (Punt et
al., 2014). Decision support tools (DSTs) may be of use when evaluating management strategies (Figure
7.1). This approach is useful in determining which management strategy, from a set of candidate strategies,
best meets the established objectives. This concept becomes relevant as Transport Canada moves into
phase 4 of the initiative and starts to consider explicit linkages to management levers.
The following subsections outline several examples of frameworks that may be considered in development
of a framework for the CEMS initiative. The first two examples, the “EU Marine Strategy Directive” and the
“BC Cumulative Effects Framework”, may provide useful templates. The third example, “risk assessment”
is a generic framework.
7.2 Examples of CEA frameworks
7.2.1 EU Marine Strategy Directive
The Marine Strategy Directive outlines a framework, called The Marine Strategy Framework, which seeks
to protect, preserve, and restore marine environments under the jurisdiction of the European Union
(European Commission 2010). The Directive (2008) defines the objectives and approaches by which the
framework operates including consultation, monitoring, program of measures, and reporting (European
Parliament 2008). A series of descriptors of “good environmental status” for marine ecosystems is provided,
with broadly applicable indicators such as species distribution and population size, outlined. The framework
directly addresses cumulative effects within Article 8 (Assessment). Provided below is an overview of the
framework, broken into its constituent chapters, and with emphasis placed on specific Articles of relevance
to this project:
Chapter 1: General Provisions (Articles 1-7)
Articles 1-4 within this chapter focus on collecting data, defining the scope, and identifying the regions
of study. Articles 5-7 set out to develop regional marine strategies, garner regional cooperation, and
designate regional authorities to oversee progress. Article 5 is particularly useful, as it aims to
delineate the overall strategy of the initiative, including environmental assessment, the establishment
Appendix C
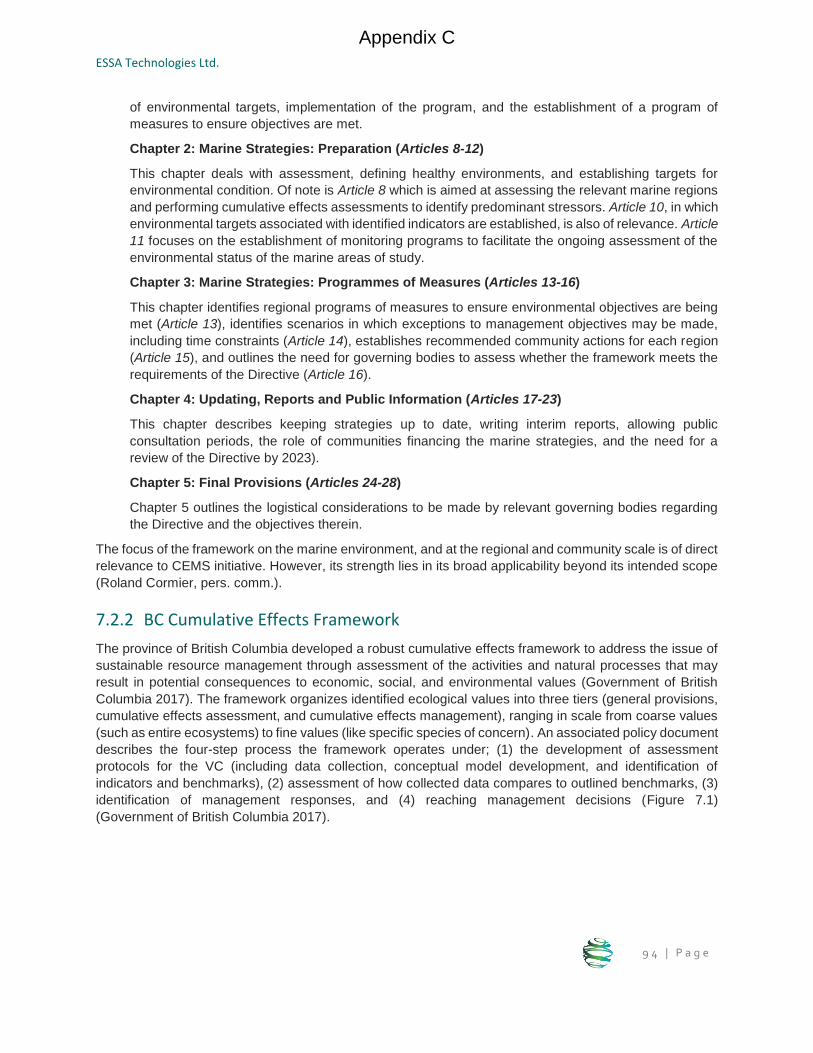
ESSA Technologies Ltd.
9 4 | P a g e
of environmental targets, implementation of the program, and the establishment of a program of
measures to ensure objectives are met.
Chapter 2: Marine Strategies: Preparation (Articles 8-12)
This chapter deals with assessment, defining healthy environments, and establishing targets for
environmental condition. Of note is Article 8 which is aimed at assessing the relevant marine regions
and performing cumulative effects assessments to identify predominant stressors. Article 10, in which
environmental targets associated with identified indicators are established, is also of relevance. Article
11 focuses on the establishment of monitoring programs to facilitate the ongoing assessment of the
environmental status of the marine areas of study.
Chapter 3: Marine Strategies: Programmes of Measures (Articles 13-16)
This chapter identifies regional programs of measures to ensure environmental objectives are being
met (Article 13), identifies scenarios in which exceptions to management objectives may be made,
including time constraints (Article 14), establishes recommended community actions for each region
(Article 15), and outlines the need for governing bodies to assess whether the framework meets the
requirements of the Directive (Article 16).
Chapter 4: Updating, Reports and Public Information (Articles 17-23)
This chapter describes keeping strategies up to date, writing interim reports, allowing public
consultation periods, the role of communities financing the marine strategies, and the need for a
review of the Directive by 2023).
Chapter 5: Final Provisions (Articles 24-28)
Chapter 5 outlines the logistical considerations to be made by relevant governing bodies regarding
the Directive and the objectives therein.
The focus of the framework on the marine environment, and at the regional and community scale is of direct
relevance to CEMS initiative. However, its strength lies in its broad applicability beyond its intended scope
(Roland Cormier, pers. comm.).
7.2.2 BC Cumulative Effects Framework
The province of British Columbia developed a robust cumulative effects framework to address the issue of
sustainable resource management through assessment of the activities and natural processes that may
result in potential consequences to economic, social, and environmental values (Government of British
Columbia 2017). The framework organizes identified ecological values into three tiers (general provisions,
cumulative effects assessment, and cumulative effects management), ranging in scale from coarse values
(such as entire ecosystems) to fine values (like specific species of concern). An associated policy document
describes the four-step process the framework operates under; (1) the development of assessment
protocols for the VC (including data collection, conceptual model development, and identification of
indicators and benchmarks), (2) assessment of how collected data compares to outlined benchmarks, (3)
identification of management responses, and (4) reaching management decisions (Figure 7.1)
(Government of British Columbia 2017).
Appendix C
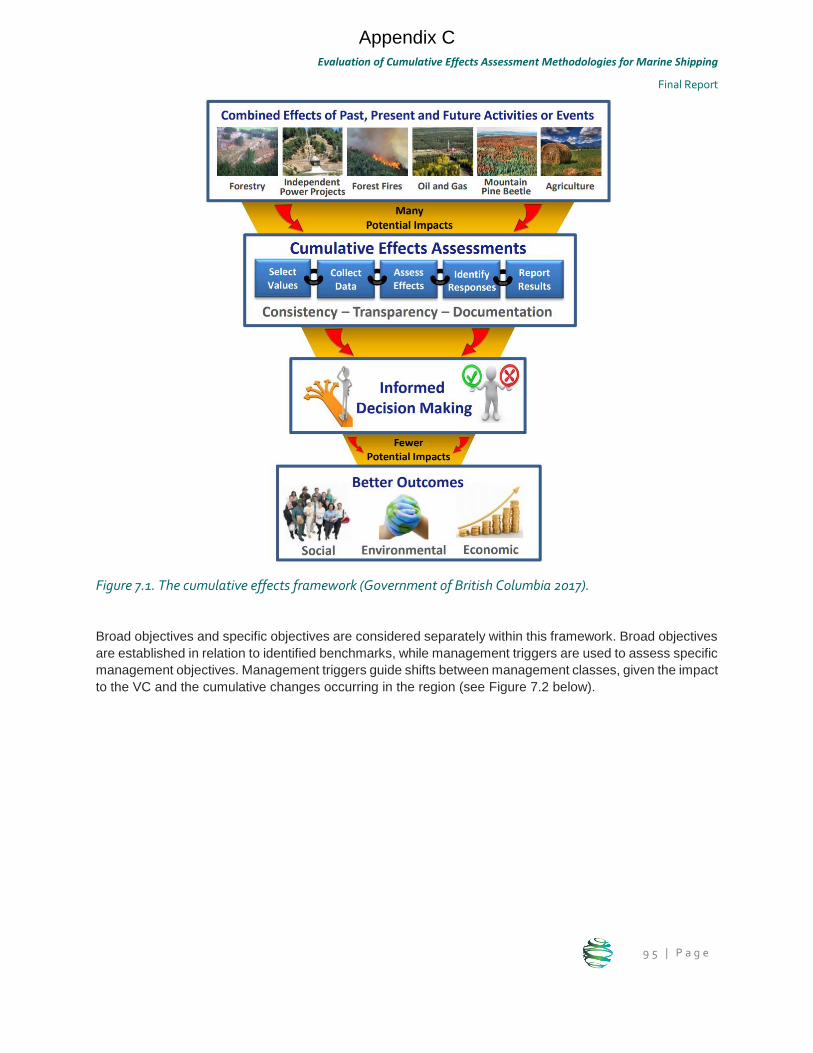
Evaluation of Cumulative Effects Assessment Methodologies for Marine Shipping
Final Report
9 5 | P a g e
Figure 7.1. The cumulative effects framework (Government of British Columbia 2017).
Broad objectives and specific objectives are considered separately within this framework. Broad objectives
are established in relation to identified benchmarks, while management triggers are used to assess specific
management objectives. Management triggers guide shifts between management classes, given the impact
to the VC and the cumulative changes occurring in the region (see Figure 7.2 below).
Appendix C
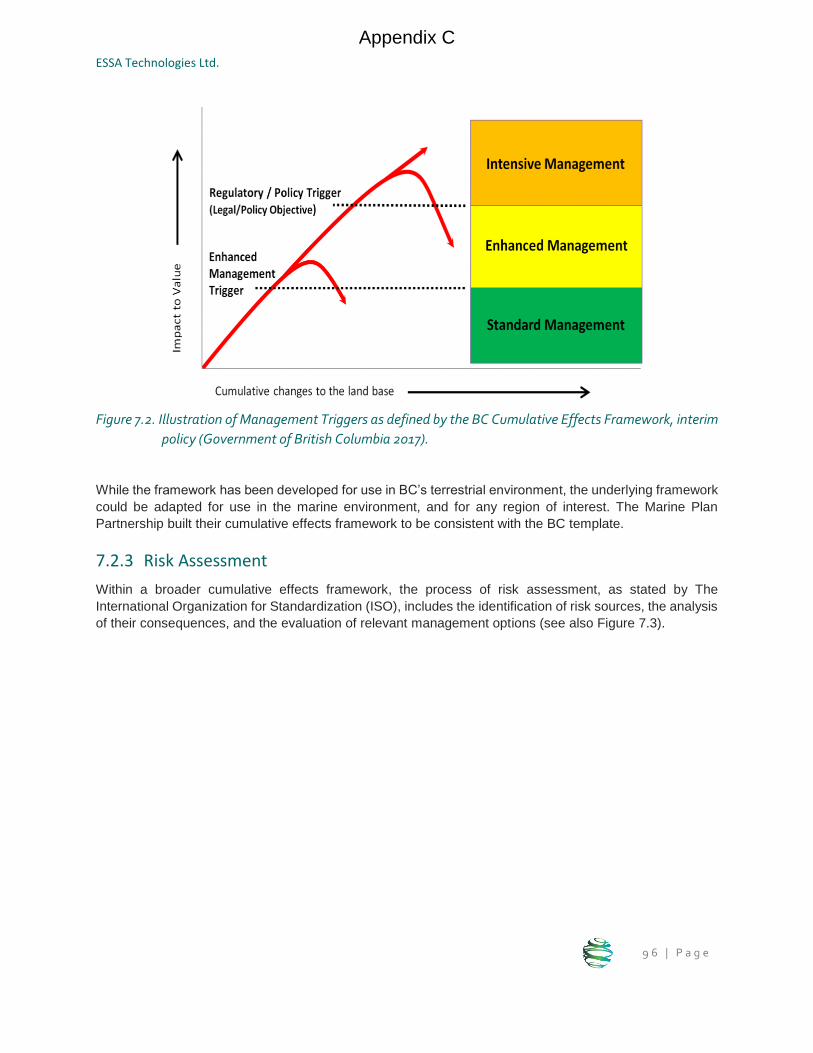
ESSA Technologies Ltd.
9 6 | P a g e
Figure 7.2. Illustration of Management Triggers as defined by the BC Cumulative Effects Framework, interim
policy (Government of British Columbia 2017).
While the framework has been developed for use in BC’s terrestrial environment, the underlying framework
could be adapted for use in the marine environment, and for any region of interest. The Marine Plan
Partnership built their cumulative effects framework to be consistent with the BC template.
7.2.3 Risk Assessment
Within a broader cumulative effects framework, the process of risk assessment, as stated by The
International Organization for Standardization (ISO), includes the identification of risk sources, the analysis
of their consequences, and the evaluation of relevant management options (see also Figure 7.3).
Appendix C
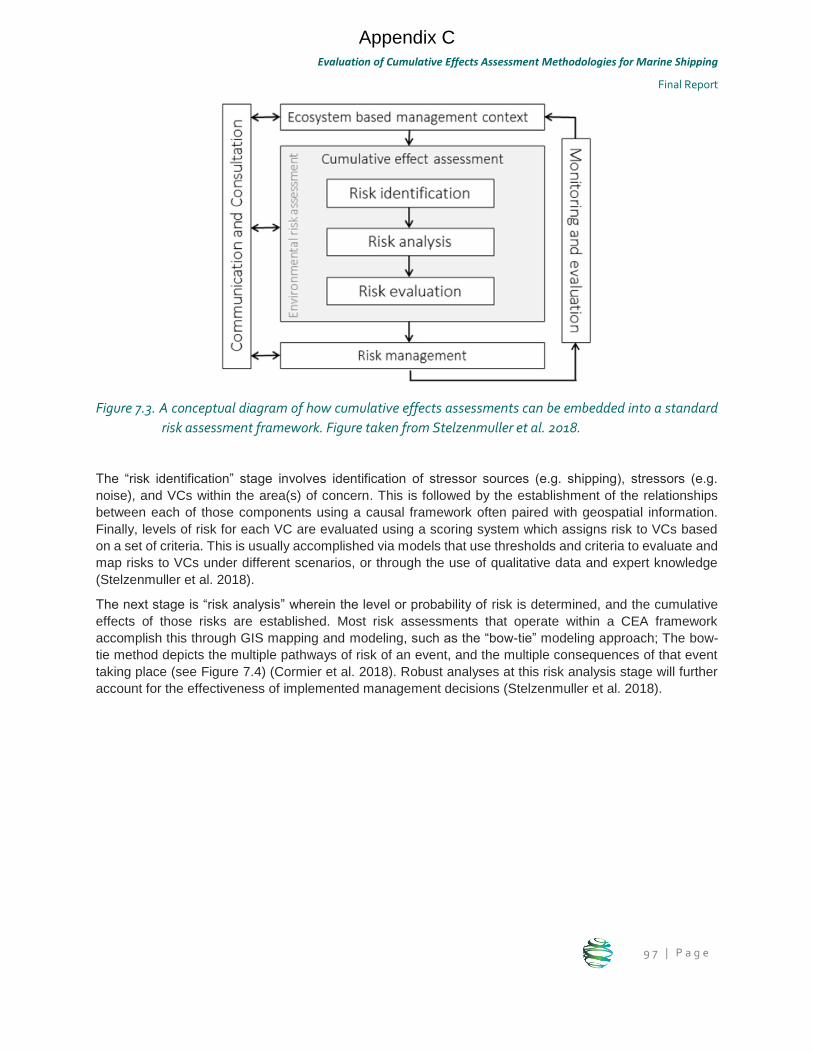
Evaluation of Cumulative Effects Assessment Methodologies for Marine Shipping
Final Report
9 7 | P a g e
Figure 7.3. A conceptual diagram of how cumulative effects assessments can be embedded into a standard
risk assessment framework. Figure taken from Stelzenmuller et al. 2018.
The “risk identification” stage involves identification of stressor sources (e.g. shipping), stressors (e.g.
noise), and VCs within the area(s) of concern. This is followed by the establishment of the relationships
between each of those components using a causal framework often paired with geospatial information.
Finally, levels of risk for each VC are evaluated using a scoring system which assigns risk to VCs based
on a set of criteria. This is usually accomplished via models that use thresholds and criteria to evaluate and
map risks to VCs under different scenarios, or through the use of qualitative data and expert knowledge
(Stelzenmuller et al. 2018).
The next stage is “risk analysis” wherein the level or probability of risk is determined, and the cumulative
effects of those risks are established. Most risk assessments that operate within a CEA framework
accomplish this through GIS mapping and modeling, such as the “bow-tie” modeling approach; The bow-
tie method depicts the multiple pathways of risk of an event, and the multiple consequences of that event
taking place (see Figure 7.4) (Cormier et al. 2018). Robust analyses at this risk analysis stage will further
account for the effectiveness of implemented management decisions (Stelzenmuller et al. 2018).
Appendix C
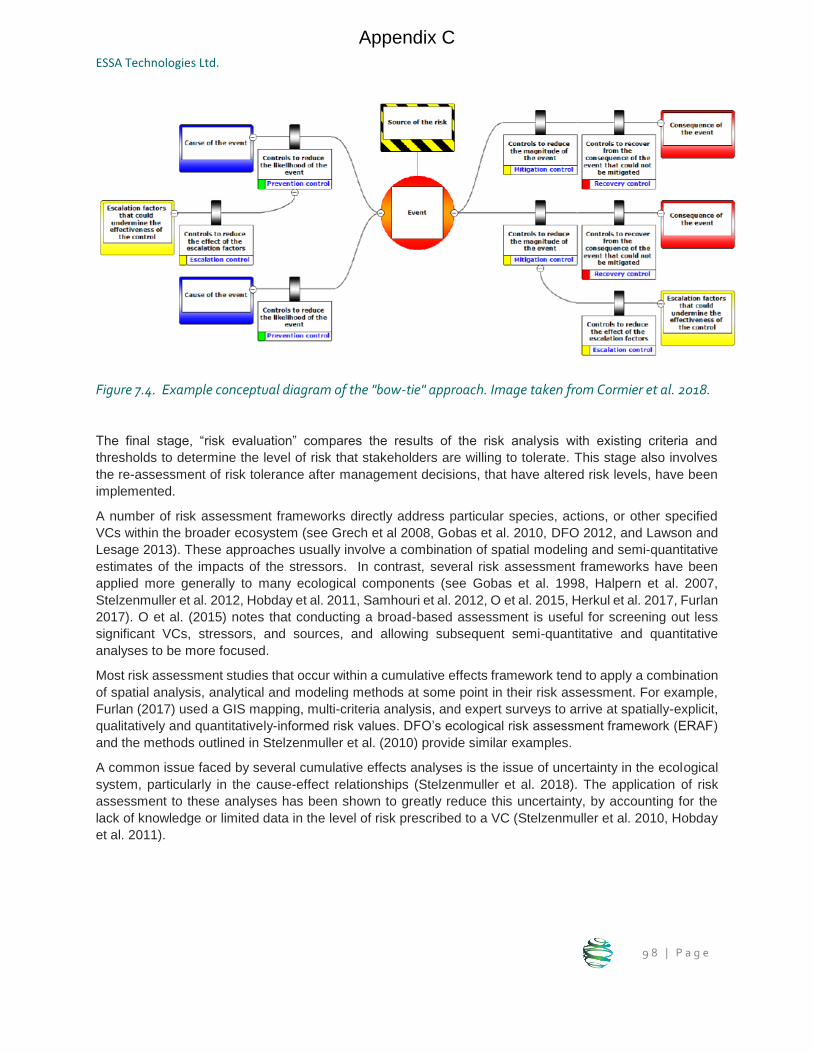
ESSA Technologies Ltd.
9 8 | P a g e
Figure 7.4. Example conceptual diagram of the "bow-tie" approach. Image taken from Cormier et al. 2018.
The final stage, “risk evaluation” compares the results of the risk analysis with existing criteria and
thresholds to determine the level of risk that stakeholders are willing to tolerate. This stage also involves
the re-assessment of risk tolerance after management decisions, that have altered risk levels, have been
implemented.
A number of risk assessment frameworks directly address particular species, actions, or other specified
VCs within the broader ecosystem (see Grech et al 2008, Gobas et al. 2010, DFO 2012, and Lawson and
Lesage 2013). These approaches usually involve a combination of spatial modeling and semi-quantitative
estimates of the impacts of the stressors. In contrast, several risk assessment frameworks have been
applied more generally to many ecological components (see Gobas et al. 1998, Halpern et al. 2007,
Stelzenmuller et al. 2012, Hobday et al. 2011, Samhouri et al. 2012, O et al. 2015, Herkul et al. 2017, Furlan
2017). O et al. (2015) notes that conducting a broad-based assessment is useful for screening out less
significant VCs, stressors, and sources, and allowing subsequent semi-quantitative and quantitative
analyses to be more focused.
Most risk assessment studies that occur within a cumulative effects framework tend to apply a combination
of spatial analysis, analytical and modeling methods at some point in their risk assessment. For example,
Furlan (2017) used a GIS mapping, multi-criteria analysis, and expert surveys to arrive at spatially-explicit,
qualitatively and quantitatively-informed risk values. DFO’s ecological risk assessment framework (ERAF)
and the methods outlined in Stelzenmuller et al. (2010) provide similar examples.
A common issue faced by several cumulative effects analyses is the issue of uncertainty in the ecological
system, particularly in the cause-effect relationships (Stelzenmuller et al. 2018). The application of risk
assessment to these analyses has been shown to greatly reduce this uncertainty, by accounting for the
lack of knowledge or limited data in the level of risk prescribed to a VC (Stelzenmuller et al. 2010, Hobday
et al. 2011).
Appendix C
Evaluation of Cumulative Effects Assessment Methodologies for Marine Shipping
Final Report
9 9 | P a g e
7.2.3.1 Examples
Attribution of risk is generally achieved via computer-based tools and models, criteria-based qualitative
assessment, or a combination of the two. This section lists a number of candidate tools and methods.
The Ecological Risk Assessment Framework (ERAF) (DFO 2012, DFO 2014, O et al. 2015)
systematically and thoroughly identifies cumulative risks to VCs. It operates within a broader Adaptive
Management (AM) framework in place in Canada. It applies a tiered approach, adopted from Hobday et al.
(2011), that progressively arrives at risk estimates through qualitative, semi-quantitative, and highly
quantitative stages. While the ERAF was developed for biological VCs, non-biological VCs are suitable for
analysis, so that risks to socio-cultural components can be assessed (O et al. 2015).
The bow-tie approach takes into account all of the stressor sources, stressors, and VCs, their spatio
temporal distributions, and the exposure, status, and sensitivities of VCs and habitats to assess the extent
to which a hazard scenario would impact those VCs and habitats, and their compounding effects (based
on links established in the causal framework stage). It aims to identify preventative measures to reduce the
risk of an event occurring (on the left side of the bow-tie), and the mitigation and recovery strategies that
can take place if the event occurs (right side of the bow-tie) (see Figure 7.4 above) (Cormier et al. 2018).
The approach can be implemented through the use of software such as BowTieXP (Cormier et al. 2018).
7.2.3.2 Relevance to Marine Shipping
Gimpel et al. (2013) notes that given the spatial context of marine shipping and its impacts on VCs, methods
that examine risk from a geospatial prospective are needed to accurately characterize linkages between
vessel activity and VCs of interest. Most of the methods and associated tools presented in Sections 4.2,
4.3, and 4.4 could potentially be applied in a marine shipping context, and a few examples have been
developed to consider shipping-related risks.
The method outlined in Furlan (2017) explicitly considered marine shipping as one stressor source. Lawson
and Lesage (2013) also specifically considered marine shipping in their risk assessment; they developed a
cumulative risk assessment framework to determine the risk of impact to marine mammals from marine
development-related noise, strikes, and invasive species. The framework employs a ‘probability of impact’
analysis which considers marine mammal population size, seasonal densities in the specified region,
conservation status, habitat use, and sensitivity to the stressors. Gimpel et al. 2013 analyzed risk of conflicts
between vessel traffic, marine protected areas, fisheries, and off-shore wind development under current
and future management scenarios in the German waters of the North Sea. Goerlandt and Montewka 2015
used Bayesian Belief Network (BBN) modeling to probabilistically assign risk to different tanker collision-
related oil spill scenarios in the Gulf of Finland.
While not directly addressing shipping-related risk, many analyses consider risk assessment in the marine
environment, more generally: Grech et al. 2008, Stelzenmuller et al. 2010, Hobday et al. 2011, DFO 2012,
Samhouri et al. 2012, Wood et al. 2012, Cormier et al. 2013, Lawson and Lesage 2013, DFO 2014, O et
al. 2015, and Herkul et al. 2017.
Appendix C
ESSA Technologies Ltd.
1 0 0 | P a g e
8 Conclusions
8.1 Key insights from the evaluation of CE assessment
methodologies
8.1.1 Overarching insights
The CEMS initiative will require a combination of assessment methods. Section 4 summarizes
a variety of methodologies which have been applied to CEA. On their own, most of these methods
are insufficient to complete a full assessment; however, most of them have potential to be useful
to the CEMS initiative. Our review suggests that all three categories of methodologies (spatial,
analytical, and modeling) play an important role, and can be linked to one of the assessment steps
identified in Figure 1.2.
o Spatial methods are most useful for evaluating the reference condition of either
activities/stressors or VCs as well as understanding how VCs are spatially exposed to
activities/stressors [assessment step 1, in Figure 1.2].
o Analytical methods based on empirical data are useful for interpreting spatial data to
inform our understanding of key habitat requirements, evaluating risk, and quantifying the
relationships between stressors and VCs (i.e., pathways) [assessment step 2, in Figure
1.2].
o Modeling methods build on the previous two categories and are necessary for evaluating
alternative scenarios [assessment step 3, in Figure 1.2].
Several crosscutting methods will also be useful to the CEMS initiative
o Indigenous knowledge is invaluable in conducting a CEA. It is important to work with
communities during all steps in the process of conducting a CEA.
o Expert elicitation methods will be critical to the initiative, particularly where data are
limited.
o Decision support tools, which make use of the outcome of the assessment step, are
beyond the scope of this project but will need to be considered in later steps of the initiative.
Existing CEA frameworks may provide useful templates for the CEMS initiative. In general,
frameworks allow decision-makers to integrate a suite of assessment methods and tools to
thoroughly evaluate the cumulative effects of stressors and link the CEA to management contexts.
o Risk assessment frameworks provide a means of qualitatively and quantitatively
evaluating the exposure of a valued component to a stressor, and its sensitivity. The
framework can utilize spatial and analytical assessments, Indigenous knowledge, expert
elicitation, causal relationships, and model outputs to assess the relative impact of various
stressors on valued components.
o Frameworks such as the EU Marine Strategy Framework and the BC Cumulative
Effects Framework permit CEA’s to explicitly address management concerns by clearly
Appendix C
Evaluation of Cumulative Effects Assessment Methodologies for Marine Shipping
Final Report
1 0 1 | P a g e
defining objectives and thresholds (i.e., what is considered “good environmental status”),
and allow analyses to occur at broad or fine scale resolution by introducing scale-specific
objectives.
Examples addressing social VCs were less prevalent in the evaluation however many of the
insights apply to both ecological and social VCs. Although applications of assessment methods
have largely focused on ecological VCs, the three categories are relevant for assessing cultural
and socioeconomic VCs. For example, the Haida Marine Traditional Knowledge Study (Table 5.4)
involved spatially identifying locations of culturally valued components (e.g., traditional harvest
sites). Indigenous communities on the Coast of British Columbia use analytical methods as part of
their Regional Monitoring System (Table 5.4) to document changes to cultural sites. In addition,
there are decision support tool models, such as MIMES, the Mauri Model, AIRES and InVEST
(Section 6.3.2), that consider social values related to ecosystem services and provide outputs in
economic terms. Cultural and socioeconomic effects are also often associated with ecological VCs.
For example, culturally important traditional harvesting can be affected by changes in the
population of the species being harvested. In these cases, results from assessment of ecological
VCs may be inputs into assessments of cultural or economic VCs.
Marine shipping activities are relevant nationally, whereas VCs and impact pathways may
differ by region. It may be possible to select a single modeling tool for stressors of concern (e.g.,
oil or noise) and replicate these across multiple regions. This would improve efficiency, build
capacity, and enable results to be more easily compared across regions. However, it is likely that
different methods will be required to assess VCs and impact pathways in each region depending
on the nature of the VCs, the intensity of stressors, the local data availability and capacity.
8.1.2 Spatial insights
Spatial methods are one of the most common approaches observed in our evaluation and are
expected to be a key method for the CEMS initiative.
Spatial assessments may be particularly useful during early iterations to refine scope (e.g.,
identify geographical hotspots) and to identify information gaps.
Although there are many ways to collect spatial data, and many ways resulting spatial information
can be used, at the foundation of spatial approaches is a single conceptually simple method:
Mapping locations and characteristics of activities/stressors and VCs.
Inferences should not be made at spatial scales that are finer than the datasets allow.
Data related to activities/stressors are often easier to gather/collect than data related to VCs, which
can result in greater uncertainties for inferences related to VCs.
In light of large data requirements, assessments often require assumptions where little or no
information is available. When spatial assessment involves complementary analytical or
modeling approaches, assumptions related to those methods also apply.
8.1.3 Analytical insights
Assessment of the functional relationships between stressors and VCs using empirical evidence
is a critical component of cumulative effects assessment. This step is essential to: validate the
nature of hypothesized pathways, refine the scope by identifying the most important pathways,
Appendix C
ESSA Technologies Ltd.
1 0 2 | P a g e
improve the accuracy of models used to evaluate alternative scenarios, inform development of
meaningful thresholds, prioritize mitigation activities, and quantify uncertainty.
The analytical methods described in this report are highly dependent on data availability and data
quality.
Risk assessment is anticipated to be a useful scoping method for the CEMS initiative to help refine
the priorities in each region.
Weight of evidence is anticipated to be a useful method for the CEMS initiative to evaluate the
relative importance of different pathways in each region. This is particularly expected to be the case
in early iterations of the initiative assuming that the data are limited and varied in nature as is typical
for any new initiative.
More complex and data rich methods should be invested in for priority pathways where
uncertainties and potential benefits are high. This includes supporting monitoring to address
critical data gaps.
R statistical software is freely available, well documented, accepted in academic setting, and has
readily available tools to support most of the analytical methods discussed.
8.1.4 Modeling insights
A key distinction of modeling methods is that they can be used to test alternative scenarios or
management options, the third component of the assessment step (Figure 1.2).
Unlike analytical methods, models can be developed in absence of empirical data. This usage
can test alternatives using expert knowledge and current hypotheses about the system. Sensitivity
analysis can help to bound the problem and identify the most sensitive parts of the system.
Pathways with the greatest influence or uncertainty in terms of their impact on the VC can then be
prioritized in terms of data collection.
Stressor models, such as underwater noise or oil spill models, are well-established methods and
extremely useful in predicting the intensity of the stressor of concern. Where possible, existing
stressor models should be leveraged to support the CEMS initiative.
Single species models that evaluate population level effects resulting from changes to various
life-cycle parameters are expected to be very useful to the CEMS initiative and should be developed
for at least a small set of top priority VCs in each region. If the VC is the whole ecosystem,
ecosystem models may be appropriate.
Spatially explicit simulation models which relate stressors to VCs and enable evaluation of
alternative scenarios are the ultimate CEA method. However, the level of data, effort, and
expertise required for their implementation, makes spatially explicit models best suited at regional
scales for a sub-set of highest priority VCs and pathways of greatest impact and potential for
improvement.
Integrated modeling, involves linking one or more sub-models together (e.g., linking physical and
biological models) and is the preferred approach for more complex models such as spatially explicit
simulation models.
Appendix C
Evaluation of Cumulative Effects Assessment Methodologies for Marine Shipping
Final Report
1 0 3 | P a g e
8.2 Selection of Assessment Methods
Selecting specific methods and associated tools within each category depends on the: relevance (e.g.,
priority VCs), rigour (e.g., data availability), and feasibility (e.g., capacity/funding) of different options within
the category (Table 5.2). Section 5.2 provides detailed examples of how each category of method could be
applied to the CEMS initiative (Table 5.3), as well as a list of relevant case studies (Table 5.4) that
demonstrate how multiple methods can be used in combination to achieve a particular objective. We
propose a series of guiding questions for consideration when selecting assessment method(s). These
should be used along with the tables in Section 5. The questions are not meant to be prescriptive in their
application as there is not one ‘correct’ method or combination of methods for each possible scenario. Some
questions may depend on the regional context. Preliminary information for each pilot region is provided in
Appendix A: Regional Context.
In general, early iterations of the assessment step tend to use simpler less data intensive methods and are
more focused on refining scope and identifying knowledge gaps. Whereas later iterations involve more
complex methods applied to a narrower scope (e.g., the most important pathways).
8.2.1.1 Relevance
What stage of the assessment process are you in?
Different methods apply to different stages of the assessment process (Figure 1.2). In general, spatial
methods are used to assess current or reference condition, analytical methods are used to quantify impact
pathways, and modeling methods are used to evaluate alternative scenarios. Initial iterations will tend to
use simpler methods and later iterations will increase in complexity as the scope is refined and new
information is acquired.
Have the most important pathways been identified?
If starting from scratch, risk assessment (informed by spatial analyses of stressors and VCs) should be
considered to help identify the most important pathways. Indigenous knowledge and expert elicitation may
be used to support a risk assessment. If sufficient data are available this should be followed up with
analytical assessments to quantitatively assess the relative importance of pathways identified in the risk
assessment for each priority VC. If the most important pathways have already been identified, then selected
methods can focus on evaluation of those pathways using both analytical and modeling methods.
What management decisions are informed by the CEA?
Identifying the management objectives and levers that scope the CEA process is an important consideration
for prioritizing VCs and pathways as well for determining what alternative scenarios should be evaluated in
step 3 of the assessment step. Although beyond the scope of this report, this will be important because it
can be more useful to further analyze and develop predictive models for impact pathways with clear
mitigation opportunities.
8.2.1.2 Rigour
What level of information is available for priority VCs and stressors?
How much information is available over space and time? What are the strengths and limitations of the
available information (e.g., different spatial/temporal resolution)? Information can be in various forms
including Indigenous knowledge and scientific data. Knowledge and information availability vary across the
Appendix C
ESSA Technologies Ltd.
1 0 4 | P a g e
different regions and communities. Methods vary widely in their data requirements and flexibility (see
discussions on ‘Data requirements’ in Sections 4.2.2, 4.3.2 and 4.4.2).
Ideally, there is empirical information about the VCs and the stressors so more sophisticated quantitative
spatial, analytical, and modeling methods can be used. In absence of quantitative data spatial methods
leveraging qualitative information is a good place to start. Risk assessment and weight of evidence methods
are well suited to using qualitative information.
Is it possible to supplement the available information with expert knowledge?
Section 6.2 provides insights on how to use and integrate expert knowledge in CEAs. These methods are
particularly valuable early in the process in absence of empirical information. For example, models may be
used to articulate the current understanding of the system using expert knowledge and complete preliminary
sensitivity analyses.
Is it possible to collect new data?
Monitoring is one of the costlier elements of CEAs however it is a valuable tool for reducing uncertainties.
It is important to identify if there are opportunities to supplement existing information (e.g., collaborate with
others to collect data). If not, methods will be limited by current data availability.
8.2.1.3 Feasibility
What is the general knowledge and skill level of the team conducting the CEA?
The skills of the team conducting the CEA are critical for the selection of a method as when all else is equal
it is more efficient to use methods that the team already has the capacity to conduct. Likewise, if input from
experts outside the team is needed, it is best to identify these requirements early in the CEA process. Some
methods require the use of specific modeling software or an expert level of knowledge about a VC or area.
The ‘feasibility’ column in Table 5.1 and, in more detail, the discussion of the ‘complexity’ and ‘accessibility’
evaluation criteria for the different methods in Sections 4.2.2, 4.3.2 and 4.4.2 provide useful context for
answering this question.
What are the resources (e.g., time, money) available for conducting the CEA?
Costs vary across methods. Collecting new data is usually the most expensive cost for all method.
Additionally, conducting expert elicitation exercises, engaging Indigenous knowledge holders or purchasing
specific software or analytical tools will add to the costs. More complex methods with higher costs may be
required as priorities are explored in deeper detail. A brief discussion on costs for the different methods can
be found under the ‘cost’ criterion in Sections 4.2.2, 4.3.2 and 4.4.2.
Are there existing applications of methods or tools for priority VCs, stressors of concern, or impact
pathways?
In cases where there are existing applications of methods or associated tools these should be leveraged
rather than starting from scratch. Potential examples of existing applications of methods or tools include:
there are a number of existing models to quantify stressors associated with marine shipping such
as noise, oil, and emissions;
there is a recent paper documenting the summer range of Southern Resident Killer Whales;
a series of habitat suitability models are under development by DFO through related OPP
initiatives
Appendix C
Evaluation of Cumulative Effects Assessment Methodologies for Marine Shipping
Final Report
1 0 5 | P a g e
Who are the key stakeholders and what is the best way to communicate the results?
It is important to foresee how the results of the CEA will be communicated, depending on the needs and
preferences of the stakeholders involved. Spatially-explicit methods that generate maps are usually easier
to interpret than graphs or numerical outputs of quantitative analyses. The discussion under ‘Interpretability
and communicability’ for the various methods in Sections 4.2.2, 4.3.2 and 4.4.2 provides more information
for this consideration.
8.3 Technical Workshop Insights
8.3.1 Workshop Summary
As part of the CEMS initiative, Transport Canada held a two-day technical workshop (20-21 February 2019)
in Ottawa with the following objectives:
Share the results of this report;
Gather input from participants on the assessment methods and tools and on recommendations for
regional work and path forward.
Provide an opportunity to build and strengthen relationships and learning between federal
governments and Indigenous Nations, territorial and provincial government departments,
environmental non-government organizations, academia and marine industry stakeholders.
Representatives from all six pilot sites were present at the workshop, including Indigenous representatives,
subject matter experts, academic representatives, personnel from provincial government, environmental
non-government organizations, marine industry, and a number of federal government representatives from
Transport Canada, Fisheries and Oceans Canada, and the Canadian Environmental Assessment Agency
(CEAA), and Crown-Indigenous Relations and Northern Affairs Canada (CIRNAC).
The workshop report (Stratos 2019) summarizes the main outputs and ideas discussed during the two-day
event. This section provides additional insights and information generated through the workshop
discussions that complement this report.
8.3.2 Workshop Insights
Overarching Feedback
Transport Canada should prioritize creation of a first draft national framework for CEA of
marine shipping using a small group of experts. This draft could then be refined using a group
similar to those at the Feb workshop.
There is a need to acknowledge and incorporate different worldviews and types of knowledge
in all aspects of the initiative. Indigenous communities need to be involved at all stages of the
CEA. It is important Indigenous knowledge is not simply forced into western science methods.
Having communities and knowledge holders as part of the process at all stages ensures that
relevant knowledge is identified, assessment methods are informed by Indigenous worldviews, and
Indigenous knowledge is used appropriately.
Appendix C
ESSA Technologies Ltd.
1 0 6 | P a g e
There were concerns raised about the focus of this initiative being limited to a single sector.
Practitioners should consider Ecosystems as VCs as well as or instead of single species VCs.
Activities do not necessarily imply stresses and so we need to use caution when using measures
of the intensity of the activity rather than the stressor (E.g., vessel traffic instead of noise).
Uncertainty in CEA is a critical concept. Decisions get made with or without data and with or
without information about uncertainty. Decisions can be improved if uncertainty is clearly
addressed. There are many sources of uncertainty including: spatial and temporal variability,
sampling error, measurement error, modeling assumptions etc. These errors can propagate
through the methods described in this report and if not explicitly accounted for can result in poor
decisions. Sections 4.2.2.2, 4.3.2.2 and 4.4.2.2 discuss uncertainty with respect to each of the
methods.
A suggestion from the workshop was that it would be helpful for the National Framework to provide
some guidance on setting baselines and thresholds and that this should be done through some
form of co-development.
o How to define baselines? There was extensive discussion on this topic at the workshop.
Typical options include comparing to current condition or comparing to some historical
condition. Evaluating current condition is generally considered a useful exercise to help
determine what changes from current are acceptable. This does NOT necessarily imply
that current condition should be used as the baseline or target. This discussion is a
common road block to CEA (Section 1.3.1). Ultimately, what is considered acceptable is a
social decision.
o How much is too much? While this question is informed by the assessment methods,
setting thresholds depends on what is considered socially acceptable (Section 1.3.4). This
question leads to questions about what management levers are available to Transport
Canada (e.g., could you run more ships through the Strait of Georgia if they were all
quieter?). These issues are outside the scope of this report but must be addressed in the
framework.
Methods
A key outcome of the workshop was that participants agreed with the report conclusion that a
combination of all three categories of methods will be necessary and that selection of said
methods will depend on context.
There was consensus on the value of spatial methods particularly in early stages of the
assessment. Maps were considered useful for evaluating exposure but their limitations were
acknowledged: limited ability to illustrate effects which are more complex than a simple overlay of
VCs and stressors; varied scales of information (e.g., points, polygons, grids of different sizes); lack
a temporal component; and reliance on data availability.
Modeling methods were acknowledged to be a powerful tool when used appropriately but
there was also concern that models are only as good as the data and assumptions going into them
and so that there needs to be open and transparent development and communication of models to
avoid competing models or distrust from stakeholders. Other comments included:
Appendix C
Evaluation of Cumulative Effects Assessment Methodologies for Marine Shipping
Final Report
1 0 7 | P a g e
o The need for clearly communicated information on uncertainty of both input parameters
and assumptions.
o The need for models to be co-developed with impacted communities to ensure
sufficiency and relevance of models, for example ‘modeling with a participatory approach’
Diana Lewis (Indigenous Studies, University of Dalhousie).
o There were questions about how to incorporate socio-cultural aspects in models.
National Framework
Development of a National Framework is outside the scope of this report but was the subject of extensive
discussions at the workshop. Development of such a framework to provide consistent guidance at a
National level was a clear recommendation from the workshop. The workshop report (Stratos 2019)
summarizes these findings in detail. In particular, they provide a useful list of “Considerations” and they
provide a “Summary of common VCs and Stressors across Canada”. This section provides a few additional
thoughts from workshop participants:
While there are regional differences, there was a long list of common stressors and VCs
identified across Canada which provides a potential focus for the National Framework.
There was consensus that the framework should involve an iterative approach. Adaptive
management was discussed as a potential approach and received general support with the caveat
that it was actually implemented, not just used to ‘check a box’.
Some participants advocated for a tiered approach to ensure at least a minimum common level
of information is collected across all components. With the potential to dig deeper where
necessary.
The framework should consider alternative governance strategies to facilitate the collaborative development of the initiative. Section 8.3.3 provides some examples for consideration.
8.3.3 Additional information
During and after the workshop, participants shared additional information and suggested relevant case
studies based on their experience. This section highlights these additional examples that complement those
presented in Section 5.2.2.
Marine spatial planning
Planning in the marine environment involves making management decisions (e.g., zoning) for marine areas
with multiple uses and users in order to achieve certain sustainability or ecological status goals, such as
the case of the European Marine Strategy Framework Directive (Elliott et al. 2018). Cumulative impacts are
a core element of marine spatial planning although their consideration is multi-sectoral and, therefore,
broader in scope than the assessment of cumulative effects associated exclusively to marine shipping.
Methods and approaches used for marine planning can be relevant for cumulative effects assessment in
the context of the CEMS initiative. These additional case studies document the use of expert judgement
and spatial analysis to support the assessment of multiple stressors in a planning context.
Elliott M., S.J. Boyes, S. Barnard, Á Borja. 2018. Using best expert judgement to harmonise marine
environmental status assessment and maritime spatial planning. Mar Pollut Bull. 133:367-377.
https://doi: 10.1016/j.marpolbul.2018.05.029
Appendix C
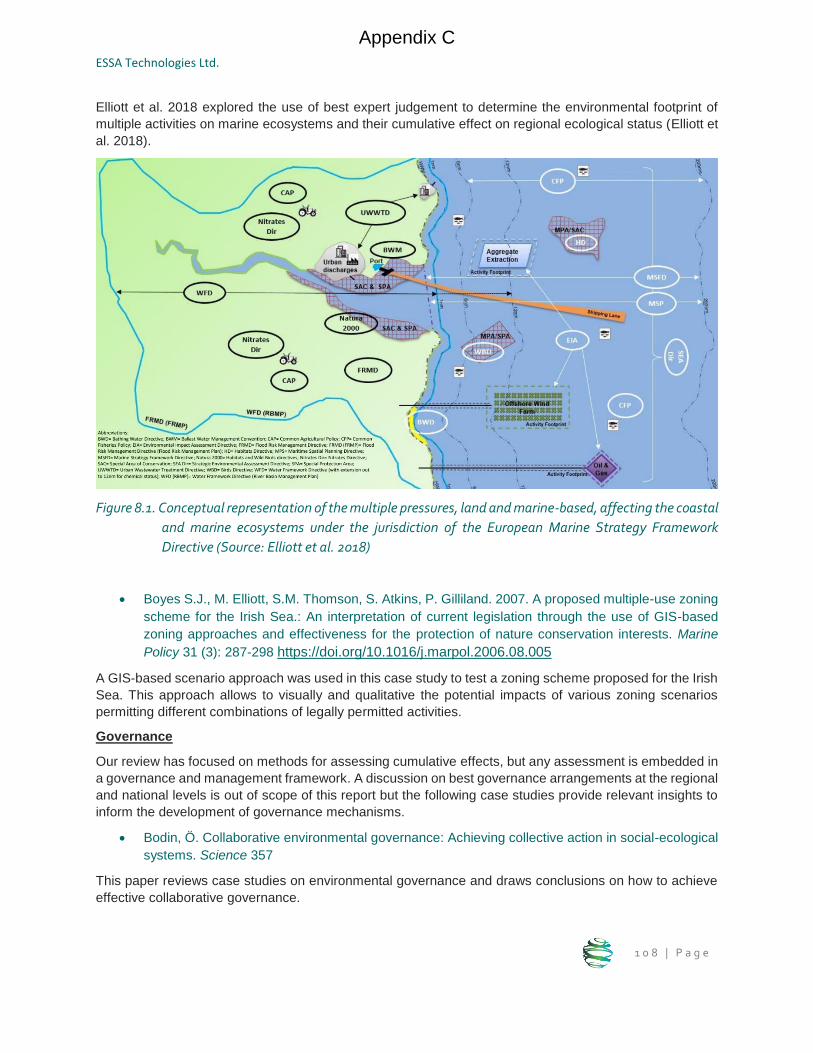
ESSA Technologies Ltd.
1 0 8 | P a g e
Elliott et al. 2018 explored the use of best expert judgement to determine the environmental footprint of
multiple activities on marine ecosystems and their cumulative effect on regional ecological status (Elliott et
al. 2018).
Figure 8.1. Conceptual representation of the multiple pressures, land and marine-based, affecting the coastal
and marine ecosystems under the jurisdiction of the European Marine Strategy Framework
Directive (Source: Elliott et al. 2018)
Boyes S.J., M. Elliott, S.M. Thomson, S. Atkins, P. Gilliland. 2007. A proposed multiple-use zoning
scheme for the Irish Sea.: An interpretation of current legislation through the use of GIS-based
zoning approaches and effectiveness for the protection of nature conservation interests. Marine
Policy 31 (3): 287-298 https://doi.org/10.1016/j.marpol.2006.08.005
A GIS-based scenario approach was used in this case study to test a zoning scheme proposed for the Irish
Sea. This approach allows to visually and qualitative the potential impacts of various zoning scenarios
permitting different combinations of legally permitted activities.
Governance
Our review has focused on methods for assessing cumulative effects, but any assessment is embedded in
a governance and management framework. A discussion on best governance arrangements at the regional
and national levels is out of scope of this report but the following case studies provide relevant insights to
inform the development of governance mechanisms.
Bodin, Ö. Collaborative environmental governance: Achieving collective action in social-ecological
systems. Science 357
This paper reviews case studies on environmental governance and draws conclusions on how to achieve
effective collaborative governance.
Appendix C
Evaluation of Cumulative Effects Assessment Methodologies for Marine Shipping
Final Report
1 0 9 | P a g e
Boyes S.J. and M. Elliott. 2015. Marine legislation--the ultimate 'horrendogram': international law,
European directives & national implementation. Mar Pollut Bull. 2014 Sep 15;86(1-2):39-47. doi:
10.1016/j.marpolbul.2014.06.055
This study discusses the problem of compartmentalisation as created by superimposed legislation that
affects the management of marine areas. Taking the example of EU marine legislation, the authors analyze
the complexity of the legal landscape and its consequences for marine management.
Weber, M., N. Krogman, and T. Antoniuk. 2012. Cumulative Effects Assessment: Linking Social,
Ecological, and Governance Dimensions. Ecology and Society 17(2): 22
This study proposes a multidisciplinary framework for the use of cumulative effects assessment in land use
planning. Specifically, the authors explore the application of a scenario analysis approach in data-limited
regions and how to incorporate social dimensions and Indigenous knowledge.
Appendix C provides additional insights into governance, specifically on examples of Government to
Government (i.e., G2G) arrangements.
Management context
The assessment of cumulative effects happens within a management framework and is influenced by the
specific management levers available to mitigate impacts. The selection of CE assessment methods and
tools depends on the management goals for marine ecosystems in a given region. Our review did not
consider in detail the management context. The following case studies provide useful insights to take into
consideration for the development of the Framework.
Clarke Murray C., J. Wong, G.G. Singh, M. Mach, J. Lerner, B. Ranieri, G. Peterson St-Laurent, A.
Guimaraes, K.M.A. Chan. 2017. The Insignificance of Thresholds in Environmental Impact
Assessment: An Illustrative Case Study in Canada. Environmental Management 61: 1062–1071
Determining the significance of impacts is a key outcome of environmental impact assessments. This paper
reviews the approaches taken to assess significance in a number of impact assessments from British
Columbia. The authors conclude there is a need for clear and defensible significance determinations,
including collaborative approaches.
Elliott M. 2013. The 10-tenets for integrated, successful and sustainable marine management. Mar
Pollut Bull. 74(1):1-5. doi: 10.1016/j.marpolbul.2013.08.001
The multiplicity of stressors, users, agencies, etc., as well as the large spatial scales and moving baselines
for marine ecosystems make marine management extremely complex. Drawing from the business
literature, Elliott (2013) proposes in this paper ten tenets for the management of any marine environmental
stressor or combination of stressors.
CEA frameworks
Assessment of cumulative effects happens within a framework that also includes scoping and management
considerations. These case studies complement the examples of organization methods discussed in
Section 7.
Cormier R. M. Elliott and J. Rice. 2019. Putting on a bow-tie to sort out who does what and why in
the complex arena of marine policy and management. Science of The Total Environment 648: 293-
305
Appendix C
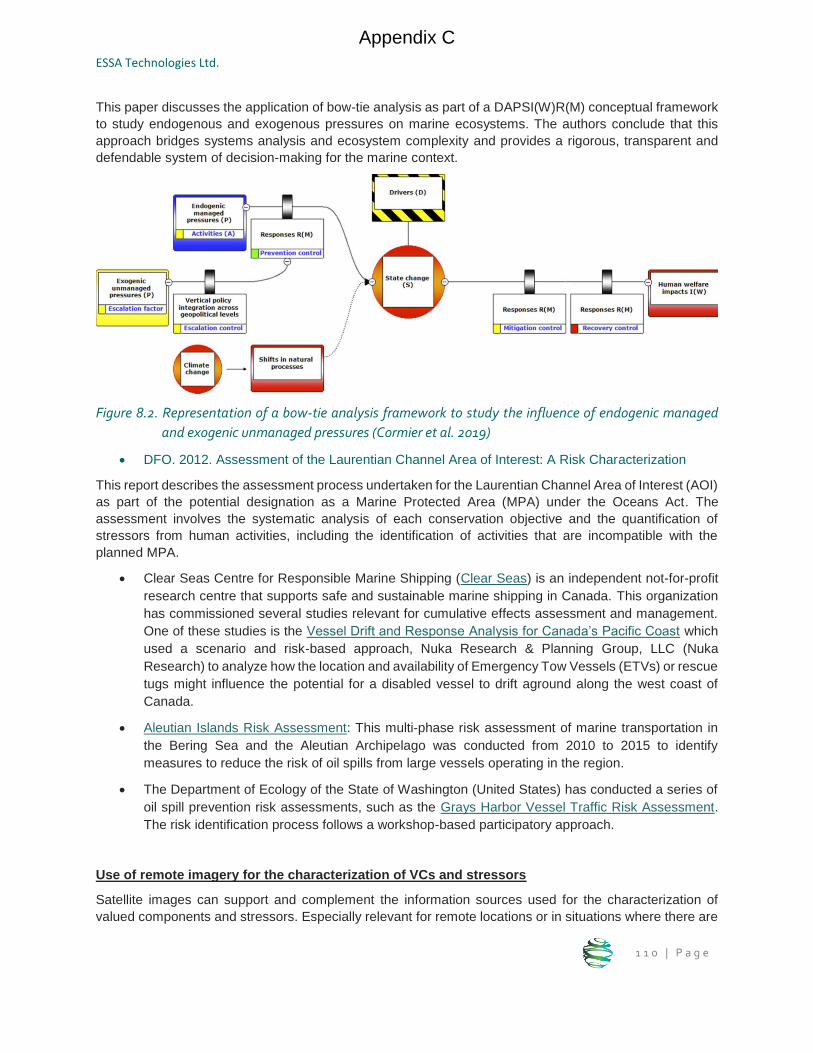
ESSA Technologies Ltd.
1 1 0 | P a g e
This paper discusses the application of bow-tie analysis as part of a DAPSI(W)R(M) conceptual framework
to study endogenous and exogenous pressures on marine ecosystems. The authors conclude that this
approach bridges systems analysis and ecosystem complexity and provides a rigorous, transparent and
defendable system of decision-making for the marine context.
Figure 8.2. Representation of a bow-tie analysis framework to study the influence of endogenic managed
and exogenic unmanaged pressures (Cormier et al. 2019)
DFO. 2012. Assessment of the Laurentian Channel Area of Interest: A Risk Characterization
This report describes the assessment process undertaken for the Laurentian Channel Area of Interest (AOI)
as part of the potential designation as a Marine Protected Area (MPA) under the Oceans Act. The
assessment involves the systematic analysis of each conservation objective and the quantification of
stressors from human activities, including the identification of activities that are incompatible with the
planned MPA.
Clear Seas Centre for Responsible Marine Shipping (Clear Seas) is an independent not-for-profit
research centre that supports safe and sustainable marine shipping in Canada. This organization
has commissioned several studies relevant for cumulative effects assessment and management.
One of these studies is the Vessel Drift and Response Analysis for Canada’s Pacific Coast which
used a scenario and risk-based approach, Nuka Research & Planning Group, LLC (Nuka
Research) to analyze how the location and availability of Emergency Tow Vessels (ETVs) or rescue
tugs might influence the potential for a disabled vessel to drift aground along the west coast of
Canada.
Aleutian Islands Risk Assessment: This multi-phase risk assessment of marine transportation in
the Bering Sea and the Aleutian Archipelago was conducted from 2010 to 2015 to identify
measures to reduce the risk of oil spills from large vessels operating in the region.
The Department of Ecology of the State of Washington (United States) has conducted a series of
oil spill prevention risk assessments, such as the Grays Harbor Vessel Traffic Risk Assessment.
The risk identification process follows a workshop-based participatory approach.
Use of remote imagery for the characterization of VCs and stressors
Satellite images can support and complement the information sources used for the characterization of
valued components and stressors. Especially relevant for remote locations or in situations where there are
Appendix C
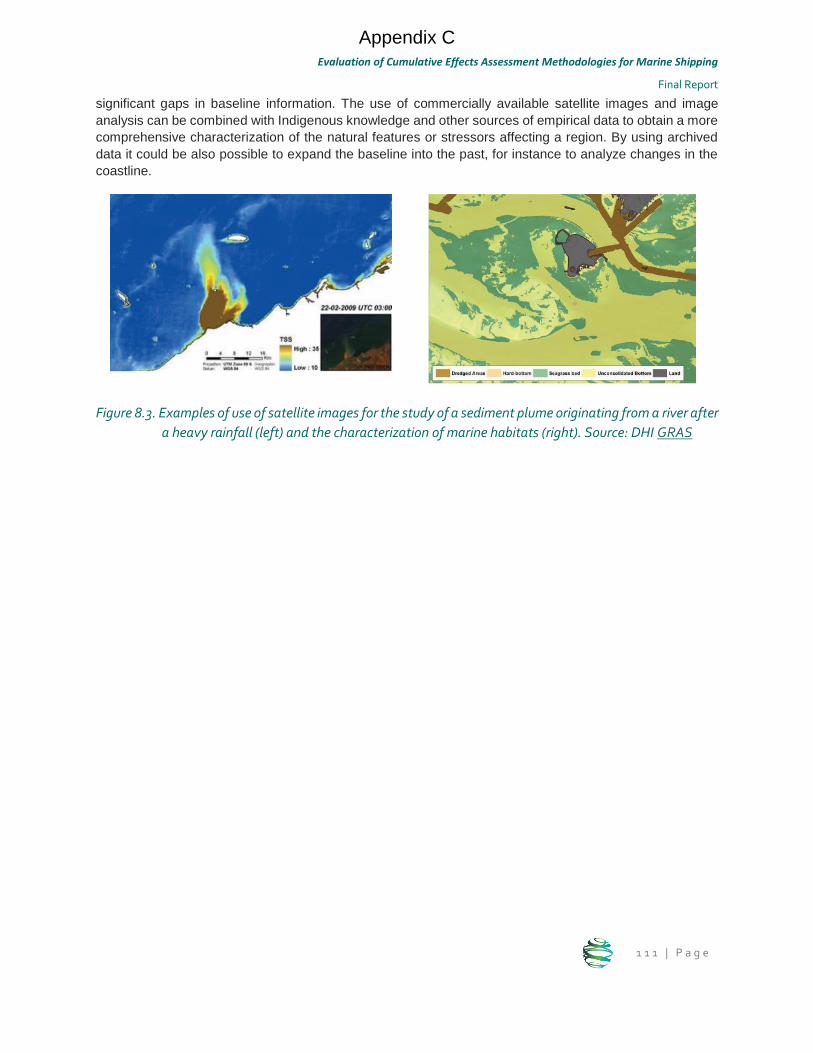
Evaluation of Cumulative Effects Assessment Methodologies for Marine Shipping
Final Report
1 1 1 | P a g e
significant gaps in baseline information. The use of commercially available satellite images and image
analysis can be combined with Indigenous knowledge and other sources of empirical data to obtain a more
comprehensive characterization of the natural features or stressors affecting a region. By using archived
data it could be also possible to expand the baseline into the past, for instance to analyze changes in the
coastline.
Figure 8.3. Examples of use of satellite images for the study of a sediment plume originating from a river after
a heavy rainfall (left) and the characterization of marine habitats (right). Source: DHI GRAS
Appendix C

ESSA Technologies Ltd.
1 1 2 | P a g e
8.4 Path Forward
In this section we provide a suggested path forward based on the combined findings of the evaluation and
the February 20-21, 2019 workshop.
8.4.1 ESSA Recommendations
Appendix C
Evaluation of Cumulative Effects Assessment Methodologies for Marine Shipping
Final Report
1 1 3 | P a g e
Develop the CEMS Framework
We agree with the workshop recommendation to formally develop the CEMS Framework in the near future.
As noted in the outset of this report, it will be difficult to move forward with the assessment step without a
clear understanding of the broader context. We also agree that the most efficient approach is likely to have
a small group of experts draft a broad framework and then to collaboratively refine this draft with the regions.
Completion of a ‘straw dog’ is expected to be a relatively quick exercise. There is substantial information
summarized in this report to support this effort:
ESSA’s draft framework presented in Figure 1.2;
Section 7 which provides a brief overview of frameworks applied elsewhere;
The workshop report (Stratos 2019) which summarizes participant thoughts around a National
Framework;
A series of additional references provided by workshop participants (Section 8.3.3);
And the draft checklist provided by Mike Elliott and Roland Cormier (Appendix C).
Complete first iteration of the scoping phase in collaboration with the regions
Transport Canada is moving into Phase 2 of the CEMS initiative (Figure 1.1) which involves working with
the pilot regions to refine the scope of the assessment. This step is necessary to inform the selection of
methodologies in each region and to identify opportunities where Transport Canada can make the most
beneficial contributions (e.g., investing in a methodology or tool to assess a common pathway across
regions). Key outcomes of this scoping phase include:
Setting clear objectives
Defining the spatial and temporal boundaries
Scoping down to a smaller set of priority VCs and stressors of most concern (reduce from the 100s
of candidate VCs to 10s of priority VCs)
Develop pathways of effects conceptual models for the priority VCs (Section 4.4.1.4)
Identify and assemble the best available information
NOTE: It is important for all involved to recognize that this is an iterative process. Choices made at this
stage can be revisited. Trying for perfection in early iterations can severely impede progress. It is our
recommendation to focus on the areas of agreement and then proceed through the next phases using the
best available information before circling back and addressing information gaps.
Identify most promising management levers
Phase 4 of the CEMS initiative includes identification of potential actions to mitigate the potential effects of
marine shipping. We recommend that a preliminary review of potential management levers occurs earlier
in the process. The intent of an earlier review would be to identify how different activities could be managed
or mitigated to reduce the stressor to VC effect. Potential management levers will differ in their effectiveness
and feasibility (e.g., cost and legislative authority). The most promising management levers can then be
formally explored using modeling methods to evaluate alternative scenarios. Given that such modeling
methods are relatively complex and may be too costly to implement for all pathways, it will be important to
focus on the most promising management levers.
Appendix C
ESSA Technologies Ltd.
1 1 4 | P a g e
Some management levers will be Nationally relevant (e.g., through National or International legislation)
others will be regionally specific and may differ depending on the governance structure of the region.
Key questions to consider when evaluating management levers:
How effective would the management lever be in reducing the impact?
How feasible is it to ‘turn the dial’ on the management lever?
There is Canadian legislation or International agreements already in place for a number of activities and
associated stressors (e.g., oil spills, ballast water, biofouling, discharge, air emissions, grounding/wrecking,
and anchoring). Our preliminary findings suggest that the management lever with the greatest untapped
potential is associated with vessel movement (e.g., where and when vessels of different types travel, and
how many are allowed over what period).
Identify thresholds
The CEMS initiative does not explicitly address when and how they will define thresholds for acceptable
levels of impact to VCs. This is a very complex task which can be informed by the assessment step which
will help to quantify the functional relationships between stressors and VCs and which will ideally enable
evaluation of alternative scenarios. However, determining what is the preferred scenario and what level of
impact is acceptable is a social decision (Section 1.3.4). Setting thresholds is also expected to be an
iterative process as illustrated in Figure 1.2. Our recommendation would be to begin this discussion during
the scoping phase by asking the regions whether or not the current level of impact is considered acceptable.
From there thresholds can be revisited with regions as the assessment step proceeds and a better
understanding of the exposure, functional impact relationships, and alternative scenarios are achieved. It
may be helpful for the CEMS framework to include some general guidance about how to develop and
incorporate thresholds or management triggers into the overall initiative. The British Columbia Cumulative
Effects Framework and the European Union Marine Strategy Directive may provide useful templates
(Section 7).
Address key information gaps
The initial iteration of the CEMS initiative will proceed using the best available information. However, it is
likely that a variety of information gaps will be identified for stressors, VCs, and pathways (e.g., outright
gaps in space/time, information that is not readily available, poor quality information). Uncertainties may be
reduced by addressing key information gaps in later iterations. Collecting new data is generally quite costly
and efforts should be focused on those gaps which are most critical to informing management decisions.
In some cases, it may be possible to obtain new information without on the ground field monitoring. Other
information sources include Indigenous knowledge as described in Section 6.1 and privately held datasets
(e.g. industry or research organizations). In addition, there may be opportunities to further mine available
data using emerging remote sense approaches (Section 8.3.3).
How to proceed with the Assessment step?
In order to determine which combination of methods and associated tools are most appropriate nationally
as well as within each region, it is necessary to complete a first iteration of the scoping phase as described
above. In this section we propose a possible approach for implementation of the Assessment phase of the
CEMS initiative, assuming the initial iteration of the scoping phase is complete. However, these steps
should not be taken as prescriptive and are instead provided as a starting point for discussion with the
Appendix C
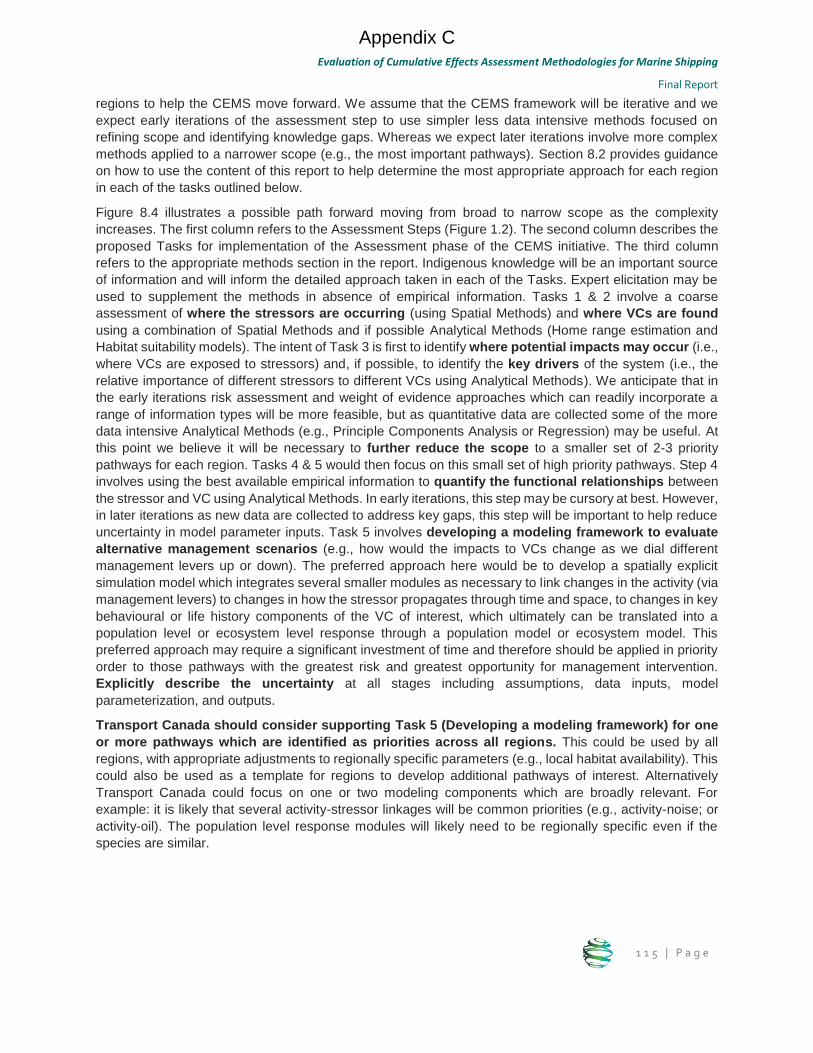
Evaluation of Cumulative Effects Assessment Methodologies for Marine Shipping
Final Report
1 1 5 | P a g e
regions to help the CEMS move forward. We assume that the CEMS framework will be iterative and we
expect early iterations of the assessment step to use simpler less data intensive methods focused on
refining scope and identifying knowledge gaps. Whereas we expect later iterations involve more complex
methods applied to a narrower scope (e.g., the most important pathways). Section 8.2 provides guidance
on how to use the content of this report to help determine the most appropriate approach for each region
in each of the tasks outlined below.
Figure 8.4 illustrates a possible path forward moving from broad to narrow scope as the complexity
increases. The first column refers to the Assessment Steps (Figure 1.2). The second column describes the
proposed Tasks for implementation of the Assessment phase of the CEMS initiative. The third column
refers to the appropriate methods section in the report. Indigenous knowledge will be an important source
of information and will inform the detailed approach taken in each of the Tasks. Expert elicitation may be
used to supplement the methods in absence of empirical information. Tasks 1 & 2 involve a coarse
assessment of where the stressors are occurring (using Spatial Methods) and where VCs are found
using a combination of Spatial Methods and if possible Analytical Methods (Home range estimation and
Habitat suitability models). The intent of Task 3 is first to identify where potential impacts may occur (i.e.,
where VCs are exposed to stressors) and, if possible, to identify the key drivers of the system (i.e., the
relative importance of different stressors to different VCs using Analytical Methods). We anticipate that in
the early iterations risk assessment and weight of evidence approaches which can readily incorporate a
range of information types will be more feasible, but as quantitative data are collected some of the more
data intensive Analytical Methods (e.g., Principle Components Analysis or Regression) may be useful. At
this point we believe it will be necessary to further reduce the scope to a smaller set of 2-3 priority
pathways for each region. Tasks 4 & 5 would then focus on this small set of high priority pathways. Step 4
involves using the best available empirical information to quantify the functional relationships between
the stressor and VC using Analytical Methods. In early iterations, this step may be cursory at best. However,
in later iterations as new data are collected to address key gaps, this step will be important to help reduce
uncertainty in model parameter inputs. Task 5 involves developing a modeling framework to evaluate
alternative management scenarios (e.g., how would the impacts to VCs change as we dial different
management levers up or down). The preferred approach here would be to develop a spatially explicit
simulation model which integrates several smaller modules as necessary to link changes in the activity (via
management levers) to changes in how the stressor propagates through time and space, to changes in key
behavioural or life history components of the VC of interest, which ultimately can be translated into a
population level or ecosystem level response through a population model or ecosystem model. This
preferred approach may require a significant investment of time and therefore should be applied in priority
order to those pathways with the greatest risk and greatest opportunity for management intervention.
Explicitly describe the uncertainty at all stages including assumptions, data inputs, model
parameterization, and outputs.
Transport Canada should consider supporting Task 5 (Developing a modeling framework) for one
or more pathways which are identified as priorities across all regions. This could be used by all
regions, with appropriate adjustments to regionally specific parameters (e.g., local habitat availability). This
could also be used as a template for regions to develop additional pathways of interest. Alternatively
Transport Canada could focus on one or two modeling components which are broadly relevant. For
example: it is likely that several activity-stressor linkages will be common priorities (e.g., activity-noise; or
activity-oil). The population level response modules will likely need to be regionally specific even if the
species are similar.
Appendix C
ESSA Technologies Ltd.
1 1 6 | P a g e
Figure 8.4. Possible path forward for the assessment phase of the CEMS initiative.
Appendix C
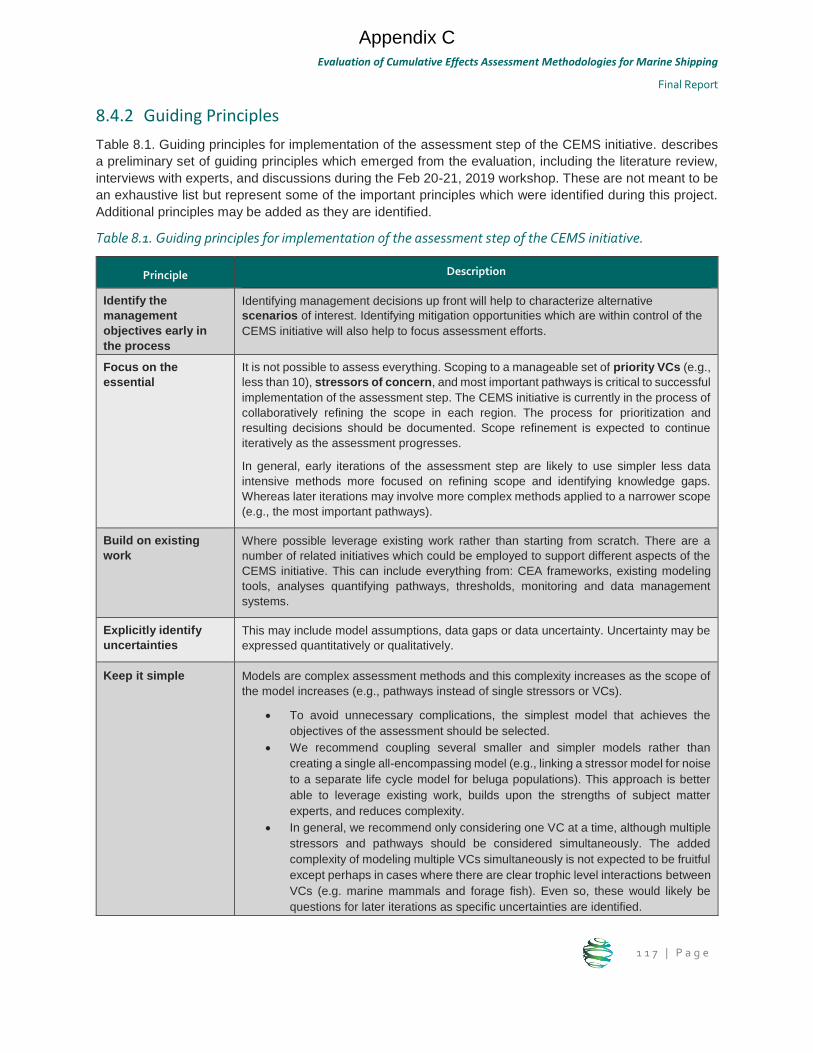
Evaluation of Cumulative Effects Assessment Methodologies for Marine Shipping
Final Report
1 1 7 | P a g e
8.4.2 Guiding Principles
Table 8.1. Guiding principles for implementation of the assessment step of the CEMS initiative. describes
a preliminary set of guiding principles which emerged from the evaluation, including the literature review,
interviews with experts, and discussions during the Feb 20-21, 2019 workshop. These are not meant to be
an exhaustive list but represent some of the important principles which were identified during this project.
Additional principles may be added as they are identified.
Table 8.1. Guiding principles for implementation of the assessment step of the CEMS initiative.
Principle Description
Identify the
management
objectives early in
the process
Identifying management decisions up front will help to characterize alternative
scenarios of interest. Identifying mitigation opportunities which are within control of the
CEMS initiative will also help to focus assessment efforts.
Focus on the
essential
It is not possible to assess everything. Scoping to a manageable set of priority VCs (e.g.,
less than 10), stressors of concern, and most important pathways is critical to successful
implementation of the assessment step. The CEMS initiative is currently in the process of
collaboratively refining the scope in each region. The process for prioritization and
resulting decisions should be documented. Scope refinement is expected to continue
iteratively as the assessment progresses.
In general, early iterations of the assessment step are likely to use simpler less data
intensive methods more focused on refining scope and identifying knowledge gaps.
Whereas later iterations may involve more complex methods applied to a narrower scope
(e.g., the most important pathways).
Build on existing
work
Where possible leverage existing work rather than starting from scratch. There are a
number of related initiatives which could be employed to support different aspects of the
CEMS initiative. This can include everything from: CEA frameworks, existing modeling
tools, analyses quantifying pathways, thresholds, monitoring and data management
systems.
Explicitly identify
uncertainties
This may include model assumptions, data gaps or data uncertainty. Uncertainty may be
expressed quantitatively or qualitatively.
Keep it simple Models are complex assessment methods and this complexity increases as the scope of
the model increases (e.g., pathways instead of single stressors or VCs).
To avoid unnecessary complications, the simplest model that achieves the
objectives of the assessment should be selected.
We recommend coupling several smaller and simpler models rather than
creating a single all-encompassing model (e.g., linking a stressor model for noise
to a separate life cycle model for beluga populations). This approach is better
able to leverage existing work, builds upon the strengths of subject matter
experts, and reduces complexity.
In general, we recommend only considering one VC at a time, although multiple
stressors and pathways should be considered simultaneously. The added
complexity of modeling multiple VCs simultaneously is not expected to be fruitful
except perhaps in cases where there are clear trophic level interactions between
VCs (e.g. marine mammals and forage fish). Even so, these would likely be
questions for later iterations as specific uncertainties are identified.
Appendix C
ESSA Technologies Ltd.
1 1 8 | P a g e
9 Literature Cited Alves T.M., E. Kokinou, G. Zodiatis, H. Radhakrishnan, C. Panagiotakis and R. Lardner. 2016.
Multidisciplinary oil spill modeling to protect coastal communities and the environment of the
Eastern Mediterranean Sea. Scientific Reports volume 6, Article number: 36882
Andersen, J.H. & Stock, A. (eds.), Mannerla, M., Heinänen, S. & M. Vinther, M. 2013. Human uses,
pressures and impacts in the eastern North Sea. Aarhus University, DCE – Danish Centre for
Environment and Energy. 136 pp. Technical Report from DCE – Danish Centre for Environment
and Energy No. 18. http://www.dmu.dk/Pub/TR18.pdf
Anthony, K.R.N.; Dambacher, J.M.; Walshe, T.; Beeden, R. Australian Institute of Marine Science,
Townsville; CSIRO, Hobart ; NERP Decisions Hub, University of Melbourne and Great Barrier Reef
Marine Park Authority, Townsville. 2013. A framework for understanding cumulative impacts,
supporting environmental decisions and informing resilience-based management of the Great
Barrier Reef World Heritage Area
Ban, N.C., H.M. Alidina, J.A. Ardron. 2010. Cumulative impact mapping: Advances, relevance and
limitations to marine management and conservation, using Canada’s Pacific waters as a case
study. Marine Policy 34,876–886.
Ban S.S., R.L. Pressey, N.A.J. Graham. 2014. Assessing interactions of multiple stressors when data are
limited: A Bayesian belief network applied to coral reefs. Global Environmental Change 27: 64–72
Ban N.C., Lauren Eckert, Madeleine McGreer & Alejandro Frid (2017) Indigenous knowledge as data for
modern fishery management: a case study of Dungeness crab in Pacific Canada, Ecosystem
Health and Sustainability, 3:8, 1379887.
Ban, N.C., A. Frid, M. Reid, B. Edgar, D. Shaw and P. Siwallace. 2018. Incorporate Indigenous perspectives
for impactful research and effective management. Nature Ecology & Evolution 2:1680–1683.
Berkes. F., Colding, J., and Folke C. (2000). Rediscovery of Traditional Ecological Knowledge as Adaptive
Management. Ecological Applications, 10(5), 1251–1262.
Berkes, F. 2018. Sacred Ecology: Fourth Edition. Routeledge, New York, NY.
Breiman L, J.H. Friedman, R.A. Olshen and C.J. Stone. Classification and Regression Trees. Chapman &
Hall (Wadsworth, Inc.): New York, 1984.
British Columbia (BC) Archaeology Branch. 2015. Site Form Guide The Province of British Columbia (BC).
2000. British Columbia Archaeological Inventory Guidelines v1.0. Resources Inventory Committee,
BC, Canada.
Burnham, Kenneth P and David R. Anderson. 1998. Model Selection and Inference: A Practical Information-
Theoretic Approach. Springer-Verlag. New York, NY.
Burkhardt-Holm, P. and K. Scheurer. 2007. Application of the weight-of-evidence approach to assess the
decline of brown trout (Salmo trutta) in Swiss Rivers. Aquatic Sciences. 69: 51-70.
Canadian Environmental Assessment Agency (CEAA), & Canadian Government, 2014. Technical guidance
for assessing cumulative environmental effects under the canadian environmental assessment act,
2012. Ottawa: Canadian Environmental Assessment Agency. Pg. 60.
Canter L.W. 2008. Conceptual Models, Matrices, Networks, and Adaptive Management – Emerging
Methods for CEA. Presented at Assessing and Managing Cumulative Environmental Effects,
Appendix C
Evaluation of Cumulative Effects Assessment Methodologies for Marine Shipping
Final Report
1 1 9 | P a g e
Special Topic Meeting, International Association for Impact Assessment, November 6-9, 2008,
Calgary, Alberta, Canada.
Center for Ocean Solutions. 2011. Decision Guide: Selecting Decision Support Tools for Marine Spatial
Planning. The Woods Institute for the Environment, Stanford University, California
Chion C., D. Lagrois, J. Dupras, S. Turgeon, I.H. McQuinn, R. Michaud, N. Ménard, L. Parrott. 2017.
Underwater acoustic impacts of shipping management measures: Results from a social-ecological
model of boat and whale movements in the St. Lawrence River Estuary (Canada). Ecological
Modeling 354:72-87
Clarke Murray, C., Mach, M.E., & Martone, R.G. 2014. Cumulative effects in marine ecosystems: scientific
perspectives on its challenges and solutions. WWF-Canada and Center for Ocean Solutions. 60
pp.
Clarke Murray C., S. Agbayani, H.M. Alidina, N.C. Ban. 2015. Advancing marine cumulative effects
mapping: An update in Canada’s Pacific waters. Marine Policy 58,71-77.
Cominelli S., R. Devillers, H. Yurk, A. MacGillivray, L. McWhinnie, and R. Canessa. 2017. Noise exposure
from commercial shipping for the southern resident killer whale population. Marine Pollution Bulletin
136:177-220
Cormier, R., et al. 2013. Marine and coastal ecosystem-based risk management handbook. ICES
Cooperative Research Report No. 317. 60 pp.
Council on Environmental Quality, “Considering Cumulative Effects under the National Environmental
Policy Act”, January 1997, Executive Office of the President, Washington, D.C., pp. 49-57
Council of the Haida Nation (CHN). 2011a. Haida Marine Traditional Knowledge Study Volume 1: Methods
and Results Summary. Prepared for Council of the Haida Nation by Haida Marine Traditional
Knowledge Study Participants, Janet Winbourne, Haida Oceans Technical Team, and Haida
Fisheries Program. https://haidamarineplanning.com/wp-
content/uploads/2016/08/Haida_Marine_Traditional_Knowledge_vol.1.pdf
Council of the Haida Nation (CHN). 2011b. Haida Ocean & Way of Life Brochure.
https://haidamarineplanning.com/wp-content/uploads/2016/08/OceanWay_LR.pdf
Davis A.R., A. Broad, W. Gullett, J. Reveley, C. Steele, and C. Schofield. 2016. Anchors away? The impacts
of anchor scour by ocean-going vessels and potential response options. Marine Policy (73): 1-7
Depellegrin D., S. Menegon, G. Farella, M. Ghezzo, E. Gissi, A. Sarretta, C. Venier, A. Barbanti .2017.
Multi-objective spatial tools to inform maritime spatial planning in the Adriatic Sea. Science of the
Total Environment 609,1627-1639.
DFO. 2012. Risk-based Assessment Framework to Identify Priorities for Ecosystem-based Oceans
Management in the Pacific Region. DFO Can. Sci. Advis. Sec. Sci. Advis. Rep. 2012/044.
DFO. 2014. Pilot application of an ecological risk assessment framework to inform ecosystem-based
management in the Pacific North Coast Integrated Management Area. DFO Can. Sci. Advis. Sec.
Sci. Advis. Rep. 2014/026.
DFO. 2015. Pathways of Effects for Shipping: An Overview. DFO Can. Sci. Advis. Sec. Sci. Advis. Rep.
2014/059.
DFO. 2017. Assessing the risk of ship strikes to humpback (Megaptera novaeangliae) and fin (Balaenoptera
physalus) whales off the west coast of Vancouver Island, Canada. DFO Can. Sci. Advis. Sec. Sci.
Advis. Rep. 2017/038.
Appendix C
ESSA Technologies Ltd.
1 2 0 | P a g e
Dobson, J. Annette. 1990. An Introduction to Generalized Linear Models. Chapman & Hall. Boca Raton,
FL.
Draper, Norman R. and Harry Smith. 1998 Applied Regression Analysis 3rd Edition. John Wiley & Sons.
Toronto, ON.
Elliott M., D. Burdon, J.P. Atkins, A. Borja, R. Cormier, V.N. de Jonge, R.K. Turner. 2017. "And DPSIR
begat DAPSI(W)R(M)!" - A unifying framework for marine environmental management. Marine
Pollution Bulletin 118(1-2):27-40
Erbe C., A. MacGillivray, and R. Williams. 2012. Mapping cumulative noise from shipping to inform marine
spatial planning. J. Acoust. Soc. Am. 132 (5): 423-428
Erbe C., R. Williams, D. Sandilands, and E. Ashe. 2014. Identifiying modeled ship noise hotspots for marine
mammals of Canada's Pacific Region. PLOS ONE 9(11)
Fischenich, J.C., “The Application of Conceptual Models to Ecosystem Restoration”, ERDC/EBA TN-08-1,
February 2008, Ecosystem Management and Restoration Research Program, U.S. Army Engineer
Research and Development Center, Vicksburg, Mississippi.
Foley, M. M., Mease, L. A., Martone, R. G., Prahler, E. E., Morrison, T. H., Murray, C. C., & Wojcik, D. 2017.
The challenges and opportunities in cumulative effects assessment. Environmental Impact
Assessment Review, 62, 122-134. doi:10.1016/j.eiar.2016.06.008
French-McCay D.2003. Development and application of damage assessment modeling: example
assessment for the North Cape oil spill. Marine Pollution Bulletin (47): 341-359
Furlan, E. 2017. Cumulative impacts assessment in marine areas. A multi-disciplinary approach setting the
scene for the adaptive management of the Adriatic Sea.
Gadgil, M., F. Berkes, and C. Folke. 1993. Indigenous knowledge for biodiversity conservation. Ambio
22:151-156.
Game, E. T. and H. S. Grantham. (2008). Marxan User Manual: For Marxan version 1.8.10. University of
Queensland, St. Lucia, Queensland, Australia, and Pacific Marine Analysis and Research
Association, Vancouver, British Columbia, Canada.
Gimpel A., V. Stelzenmüller, R. Cormier, J. Floeter, and A. Temming. 2013. A spatially explicit risk approach
to support marine spatial planning in the German EEZ. Marine Environmental Research 86: 56-69
Gissi E, Menegon S, Sarretta A, Appiotti F, Maragno D, Vianello A, et al. (2017) Addressing uncertainty in
modeling cumulative impacts within maritime spatial planning in the Adriatic and Ionian region.
PLoS ONE 12(7): e0180501. https://doi.org/10.1371/journal.pone.0180501
Government of Canada 2017a. Oceans Protection Plan Workshop Oceans Innovation Conference St.
John’s, Newfoundland - October 16, 2017 Summary Engagement Report. p. 12.
Government of Canada, 2017b. Oceans Protection Plan Engagement Session: Quebec City, Quebec
November 8, 2017. p. 12.
Government of Canada, 2018a. OPP Initiative Engagement Proactive Vessel Management, Marine
Awareness Information System, Cumulative Effects of Marine Shipping - May 2, 2018, Cambridge
Bay, NU. p. 5.
Government of Canada, 2018b. Draft Agreement to Conduct a Regional Assessment of Offshore Oil and
Gas Exploratory Drilling East of Newfoundland and Labrador. Available: https://ceaa-
acee.gc.ca/050/evaluations/document/125194?culture=en-CA
Appendix C
Evaluation of Cumulative Effects Assessment Methodologies for Marine Shipping
Final Report
1 2 1 | P a g e
Government of Canada, 2018c. Oceans Protection Plan Workshop Oceans Atlantic Policy Congress of
First Nations Chiefs – Fisheries Conference, Moncton, NB -January 25, 2018. p. 7.
Government of Canada, 2018d. Oceans Protection Plan Engagement Session with Indigenous
Communities: June 12 and 13, 2018 at Hotel Plaza Quebec. p. 30.
Greig, L., C. Wedeles and S. Beukema. 2013. Evaluation of Tools Available for Cumulative Effects
Assessment for the Northwest Territories – Literature Reviews: Models and Management.
Prepared for Government of the Northwest Territories, Department of Environment and Natural
Resources Wildlife Research and Management, Wildlife Division. 101 pp.
Guisan, Antoine, Wilfried T Huiller, Niklaus E. Zimmermann. 2017. Habitat Suitability and Distribution
Models. Cambridge University Press. Cambridge, United Kingdom.
Halpern, B. S., Selkoe, K. A., Micheli, F., & Kappel, C. V. (2007). Evaluating and ranking the vulnerability
of global marine ecosystems to anthropogenic threats. Conservation Biology, 21(5), 1301-1315.
Halpern, B.S., S. Walbridge, K.A. Selkoe, C.V. Kappel, F. Micheli, C. D’Agrosa, J.F. Bruno, K.S. Casey, C.
Ebert, H.E. Fox, R. Fujita, D. Heinemann, H.S. Lenihan, E.M.P. Madin, M.T. Perry, E.R. Selig, M.
Spalding, R. Steneck, R. Watson. 2008. A global map of human impact on marine ecosystems.
Science 319, 948-952.
Harvey B.J. 2018. Exploring impacts of noise from shipping and acoustic deterrent devices on cetaceans
on the west coast of Scotland using an ecosystem modeling approach. Thesis presented MSc.
Ecosystem-based Management of Marine Systems
Heinänen S., M.E. Chudzinska, J. B. Mortensen, T. Zhi En Teo, K. Rong Utne, L. Doksæter Sivle, and F.
Thomsen. 2018. Integrated modelling of Atlantic mackerel distribution patterns and movements: A
template for dynamic impact assessments. Ecological Modelling 387: 118-133
Hobday, A.J., Smith, A.D.M., Stobutzki, I.C., Bulman, C., Daley, R., Dambacher, J.M., Deng, R.A.,
Dowdney, J., Fuller, M. & Furlani, D. (2011) Ecological risk assessment for the effects of fishing.
Fisheries Research, 108, 372-384.
Hoshizaki, L. 2016. The Coastal First Nations’ Regional Monitoring System. Presentation For: Marine
Biotoxin Workshop North Vancouver, BC October 25th, 2016.
Houde, N. (2007). The six faces of traditional ecological knowledge: challenges and opportunities for
Canadian co-management arrangements. Ecology and Society 12(2), 34.
Huntington, H.P. 2000. Using Traditional Ecological Knowledge in Science: Methods and Applications.
Ecological Applications, 10(5), 1270-1274.
Huntington, H.P., Suydam, R.S., and Rosenberg, D.H. (2004). Traditional knowledge and satellite tracking
as complementary approaches to ecological understanding. Environmental Conservation
31(3):177-180.
IDDPNQL, 2017. Oceans Protection Plan: Report of the Engagement Session held on November 7, 2017
in Quebec City. p. 20.
Johanson, A. N., Oschlies, A., Hasselbring, W., & Worm, B. (2017). SPRAT: A spatially-explicit marine
ecosystem model based on population balance equations. Ecological Modelling, 349, 11-25.
doi:10.1016/j.ecolmodel.2017.01.020
Johnson, R.A. and D.W. Wichern. 2002. Applied Multivariate Statistical Analysis. Fifth Edition. Prentice
Hall, Upper Saddle River New Jersey.
Appendix C
ESSA Technologies Ltd.
1 2 2 | P a g e
Jones, F.C. 2016. Cumulative effects assessment: theoretical underpinnings and big problems. Environ.
Rev. 24: 187–204
Judd A.D., T. Backhaus, F. Goodsir. 2015. An effective set of principles for practical implementation of
marine cumulative effects assessment. Environmental Science & Policy 54: 254–262
Kalland, A. 2003. Indigenous Knowledge: Prospects and Limitations, Chapter 11 in Indigenous
Environmental Knowledge and its Transformations: Critical Anthropological Perspectives.
Routledge.
Kelble CR, Loomis DK, Lovelace S, Nuttle WK, Ortner PB, et al. (2013) The EBM-DPSER Conceptual
Model: Integrating Ecosystem Services into the DPSIR Framework. PLoS ONE 8(8): e70766.
doi:10.1371/journal.pone.0070766
Korpinen S., L. Meski, J.H. Andersen and M. Laamanen. 2012. Human pressures and their potential impact
on the Baltic Sea ecosystem. Ecological Indicators 15: 105-114
Korpinen S. and Andersen J.H. 2016. A Global Review of Cumulative Pressure and Impact Assessments
in Marine Environments. Front.Mar.Sci. 3 (153) doi:10.3389/fmars.2016.00153
Lacy, R. C., Williams, R., Ashe, E., Balcomb Iii, K. C., Brent, L. J. N., Clark, C. W., . . . Paquet, P. C. (2017).
Evaluating anthropogenic threats to endangered killer whales to inform effective recovery plans.
Scientific Reports, 7(1), 14119-12. doi:10.1038/s41598-017-14471-0
Lerner, J. 2018. Review of cumulative effects management concepts and international frameworks.
Prepared for Transport Canada under Contract T8080-170062
Lewis, A.E., Hammill, M.O., Power, M., Doidge, D.W., and Lesage, V. 2009. Movement and aggregation of
eastern Hudson Bay beluga whales (Delphinapterus leucas): a comparison of patterns found
through satellite telemetry and Nunavik traditional ecological knowledge. Arctic 62(1):13-24.
Longhurst, R. 2003. “Semi-Structured Interviews and Focus Groups.” In Key Methods in Geography, editors
N. Clifford, M. Cope, T. Gillespie, and S. French, 117–132. London: Sage Publications.
Lorne Pike & Associates 2018. Oceans Protection Plan (OPP) Transport Canada Engagement Session,
St. John’s, NL: Summary Report. p. 16.
Marine Planning Partnership Initiative, 2015. North Coast Marine Plan. p. 168.
Marine Plan Partnership (MaPP). 2019. MaPP Marine Plan Portal.
http://mappocean.org/resources/marine-planning-portal/
Marmorek, D., D. Pickard, A. Hall, K. Bryan, L. Martell, C. Alexander, K. Wieckowski, L. Greig and C.
Schwarz. 2011. Fraser River sockeye salmon: data synthesis and cumulative impacts. ESSA
Technologies Ltd. Cohen Commission Tech. Rep. 6. 273p. Vancouver, B.C.
www.cohencommission.ca
Manly, Bryan F.J., Lyman L. McDonald, Dana L. Thomas, Trent L. McDonald, and Wallace P. Erickson.
2002. Resource Selection by Animals: Statistical Design and Analysis for Field Studies. 2nd
Edition. Kluwer Academic Publishers. Norwell, MA.
Manuilova, A. 2003. Methods and tools for assessment of environmental risk. Akzo Nobel Surface
Chemistry AB. Available at:
http://citeseerx.ist.psu.edu/viewdoc/download;jsessionid=F3B89AD0A0E9F1156DE3E802B5657
CF8?doi=10.1.1.455.4807&rep=rep1&type=pdf, p. 21.
Appendix C
Evaluation of Cumulative Effects Assessment Methodologies for Marine Shipping
Final Report
1 2 3 | P a g e
Mach M.E., L.M. Wedding, S.M. Reiter, F. Micheli, R.M. Fujita, R.G. Martone. 2017. Assessment and
management of cumulative impacts in California’s network of marine protected areas. Ocean &
Coastal Management 137,1-11.
Marine Traffic. 2018. What is the Automatic Identification System (AIS)?
https://help.marinetraffic.com/hc/en-us/articles/204581828-What-is-the-Automatic-Identification-
System-AIS-
Marine Plan Partnership (MaPP). 2018. Marine Plan Portal. http://mappocean.org/resources/marine-
planning-portal/
McCann, R. K., Marcot, B. G., and Ellis, R. (2006). Bayesian belief networks: applications in ecology and
natural resource management. Can. J. For. Res. 36, 3053–3062. doi: 10.1139/x06-238
MEDESS. 2018. Mediterranean Decision Support System for Marine Safety. Oil Spill Models
http://www.medess4ms.eu/oil-spill-models
Micheli F, Halpern BS, Walbridge S, Ciriaco S, Ferretti F, et al. (2013) Cumulative Human Impacts on
Mediterranean and Black Sea Marine Ecosystems: Assessing Current Pressures and
Opportunities. PLoS ONE 8(12): e79889. doi:10.1371/journal.pone.0079889
Mistry, J. and A. Berardi. 2016. Bridging indigenous and scientific knowledge. Science 352(6291):1274-
1275.
Nazarea, V.D. 2010. Ethonoecology: Situated Knowledge/Located Lives. University of Arizona Press.
Nelitz, M., H. Stimson, C. Semmens, B. Ma, and D. Robinson. 2018. Impacts of marine vessel traffic on
access to fishing opportunities of the Musqueam Indian Band. Prepared for the Musqueam Indian
Band
North Coast-Skeen First Nations Stewardship Society 2015. North Coast Marine Plan. Prepared by the
Province of British Columbia and the North Coast-Skeen First Nations Stewardship Society.
Available at: http://mappocean.org/wp-
content/uploads/2016/07/MarinePlan_NorthCoast_WebVer_20151207_corrected.pdf. p. 166.
NWT 2018a. NWT Cumulative Impact Monitoring Program North and South Slave Region 2018-2019
Summary. p. 2.
NWT 2018b. Northern Voices, Northern Waters - NWT Water Stewardship Strategy. Available:
https://www.enr.gov.nt.ca/sites/enr/files/resources/nwt_water_stewartship_strategy_web.pdf
O, Miriam, Rebecca Martone, Lucie Hannah, Lorne Greig, Jim Boutillier, and Sarah Patton. 2015. An
Ecological Risk Assessment Framework (ERAF) for Ecosystem-Based Oceans Management in the
Pacific Region. Ottawa, Ontario: DFO Canadian Science Advisory Secretariat Research Document
2014/072
O’Neill, C., J. Wladichuk, Z. Li, A.S. Allen, H. Yurk, and D. Hannay. 2017. Cumulative Noise Modeling in
the Salish Sea. Document 01369, Version 1.0. Technical report by JASCO Applied Sciences for
Noise Exposure to the Marine Environment from Ships (NEMES), University of Victoria.
One World Inc., 2017a. Oceans Protection Plan – Pacific Region Dialogue Forums, Summary Report
(Vancouver) – November 2, 2017. Prepared by Lynn Chiarelli and Jacquie Dale. p. 58.
One World Inc., 2017b. Oceans Protection Plan – North Coast Dialogue Forum, Summary Report (Prince
Rupert) – November 17, 2017. Prepared by Lynn Chiarelli and Jacquie Dale. p. 55.
Appendix C
ESSA Technologies Ltd.
1 2 4 | P a g e
One World Inc., 2018. Oceans Protection Plan – Pacific Region Dialogue Forums, Draft Summary Report
(Vancouver) – March 20-21, 2018. Prepared by Lynn Chiarelli and Jacquie Dale. p. 87.
OPP 2018a. Facilitator’s Summary Notes – DFO Coastal Environmental Baseline (Port of Prince Rupert)
and TC Cumulative Effects of Marine Shipping: Prince Rupert Technical Workshop – April 12-13,
2018. p. 15.
The Pacific Salmon Foundation (PSF). 2015. Skeena River Estuary: A Snapshot of Current Status and
Condition. Prepared for The Pacific Salmon Foundation by ESSA Technologies Ltd.
https://salmonwatersheds.ca/libraryfiles/lib_432.pdf
Patrício J., Elliott M., Mazik K., Papadopoulou K.N. and Smith C.J. 2016. DPSIR—Two Decades of Trying
to Develop a Unifying Framework for Marine Environmental Management? Front.Mar.Sci.3:177.
doi: 10.3389/fmars.2016.00177
Pickard, D., M. Porter, E. Olson, B. Connors, K. Kellock, E. Jones, and K. Connors. 2015. Skeena River
Estuary Assessment: Technical Report. Pacific Salmon Foundation, Vancouver, BC.
Piroddi, C., Teixeira, H., Lynam, C. P., Smith, C., Alvarez, M. C., Mazik, K., . . . Uyarra, M. C. (2015). Using
ecological models to assess ecosystem status in support of the european marine strategy
framework directive. Ecological Indicators, 58, 175-191. doi:10.1016/j.ecolind.2015.05.037
Plagányi, É.E. 2007. Models for an ecosystem approach to fisheries. FAO Fisheries Technical Paper. No.
477. Rome, FAO. 2007. 108p.
R Core Team: “rpart” or “randomForestSRC” packages (http://www.r-project.org/)
Raoux, A., Tecchio, S., Pezy, J., Lassalle, G., Degraer, S., Wilhelmsson, D., …Niquil, N. (2017). Benthic
and fish aggregation inside an offshore wind farm: Which effects on the trophic web functioning?
Ecological Indicators, 72, 33-46. doi:10.1016/j.ecolind.2016.07.037
Reynolds, J. H., Knutson, M. G., Newman, K. B., Silverman, E. D., & Thompson, W. L. (2016). A road map
for designing and implementing a biological monitoring program. Environmental Monitoring and
Assessment, 188(7), 1-25. doi:10.1007/s10661-016-5397-x
Singh G.G., J. Sinner, J. Ellis, M. Kandlikar, B.S. Halpern, T. Satterfield, and K.M.A. Cha. 2017.
Mechanisms and risk of cumulative impacts to coastal ecosystem services: An expert elicitation
approach. Journal of Environmental Management 199:229-241
Smith C.J., Papadopoulou K.N., Barnard S., Mazik K., Elliott M., Patrício J., Solaun O., Little S., Bhatia
N.and Borja A. 2016. Managing the Marine Environment, Conceptual Models and Assessment
Considerations for the European Marine Strategy Framework Directive. Front. Mar.Sci.3:144. doi:
10.3389/fmars.2016.00144
Salomon, A.K., Tanape, N.M., and Huntington, H.P. (2007). Serial depletion of marine invertebrates leads
to the decline of a strongly interacting grazer. Ecological Applications 17(6):1752-1770.
Stelzenmüller, V., Lee, J., South, A. & Rogers, S.I. (2010) Quantifying cumulative impacts of human
pressures on the marine environment: a geospatial modeling framework. Marine Ecology Progress
Series, 398, 19-32.
Stelzenmüller, V., Coll, M., Mazaris, A. D., Giakoumi, S., Katsanevakis, S., Portman, M. E., Ojaveer, H.
2018. A risk-based approach to cumulative effect assessments for marine management. Science
of the Total Environment, 612, 1132-1140
Appendix C
Evaluation of Cumulative Effects Assessment Methodologies for Marine Shipping
Final Report
1 2 5 | P a g e
Stephenson, S.A., and L. Hartwig. 2009. The Yukon North Slope Pilot Project: An Environmental Risk
Characterization using a Pathways of Effects Model. Can. Manuscr. Rep. Fish. Aquat. Sci. 2896:
vi+57p.
Teck S.J., B.S. Halpern, C.V. Kappel, F. Micheli, K.A. Selkoe, C.M. Crain, R. Martone, C. Shearer, J. Arvai,
B. Fischhoff, G. Murray, R. Neslo, and R. Cooke. 2010. Using expert judgment to estimate marine
ecosystem vulnerability in the California Current. Ecological Applications, 20(5), 2010, pp. 1402–
1416.
Teichert, N., Borja, A., Chust, G., Uriarte, A., & Lepage, M. (2016). Restoring fish ecological quality in
estuaries: Implication of interactive and cumulative effects among anthropogenic stressors.
Science of the Total Environment, 542(Pt A), 383-393. doi:10.1016/j.scitotenv.2015.10.068
Tengö, M., E.S. Brondizio, T. Elmqvist, P. Malmer, M. Spierenburg. 2014. Connecting Diverse Knowledge
Systems for Enhanced Ecosystem Governance: The Multiple Evidence Base Approach. Ambio
43:579–591.
Thornborough, K., Rubidge, E., and O, M. 2018. Ecological Risk Assessment for the Effects of Human
Activities at the Endeavour Hydrothermal Vents Marine Protected Area. DFO Can. Sci. Advis. Sec.
Res. Doc. 2017/068. ix + 69 p.
Transport Canada, 2018. Quebec: What we’ve heard so far – November 6, 2018.
United States Geological Services (USGS). Data Management. Modeling
https://www.usgs.gov/products/data-and-tools/data-management/analyze?qt-
science_support_page_related_con=0#modeling
Watts, M. E., C. K. Klein, R. Stewart, I. R. Ball, and H. P. Possingham, 2008. Marxan with Zones (V1.0.1):
Conservation Zoning using Spatially Explicit Annealing, a Manual. p. 1-41.
Weed, D.L. 2005. Weight of Evidence: A Review of Concepts and Methods. Risk Analysis 25(6): 1545-
1557.
Williams, R. and P. O’Hara. 2009. Modeling ship strike risk to fin, humpback and killer whales in British
Columbia, Canada. J. CETACEAN RES. MANAGE. 423
Willsteed E, A.B Gill, S.N.R. Birchenough, S. Jude. 2017. Assessing the cumulative environmental effects
of marine renewable energy developments: Establishing common ground, Science of The Total
Environment, Volume 577, 2017, Pages 19-32, doi.org/10.1016/j.scitotenv.2016.10.152.
Worton, B. J. 1987. A review of models of home range for animal movement. Ecological Modeling 38: 277-
298.
Worton, B.J., 1989. Kernel methods for estimating the utilization distribution in home range studies. Ecology
70 (1), 164–168. https://doi.org/10.2307/1938423.
Appendix C
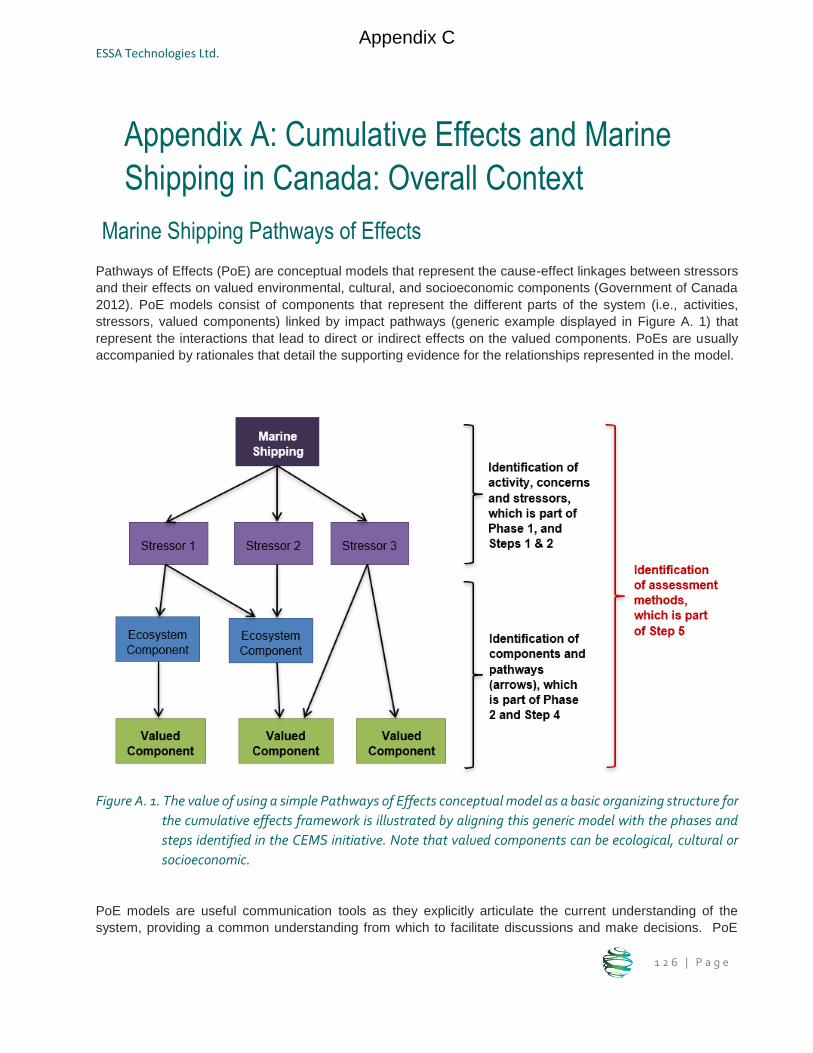
ESSA Technologies Ltd.
1 2 6 | P a g e
Appendix A: Cumulative Effects and Marine
Shipping in Canada: Overall Context
Marine Shipping Pathways of Effects
Pathways of Effects (PoE) are conceptual models that represent the cause-effect linkages between stressors
and their effects on valued environmental, cultural, and socioeconomic components (Government of Canada
2012). PoE models consist of components that represent the different parts of the system (i.e., activities,
stressors, valued components) linked by impact pathways (generic example displayed in Figure A. 1) that
represent the interactions that lead to direct or indirect effects on the valued components. PoEs are usually
accompanied by rationales that detail the supporting evidence for the relationships represented in the model.
Figure A. 1. The value of using a simple Pathways of Effects conceptual model as a basic organizing structure for
the cumulative effects framework is illustrated by aligning this generic model with the phases and
steps identified in the CEMS initiative. Note that valued components can be ecological, cultural or
socioeconomic.
PoE models are useful communication tools as they explicitly articulate the current understanding of the
system, providing a common understanding from which to facilitate discussions and make decisions. PoE
Appendix C
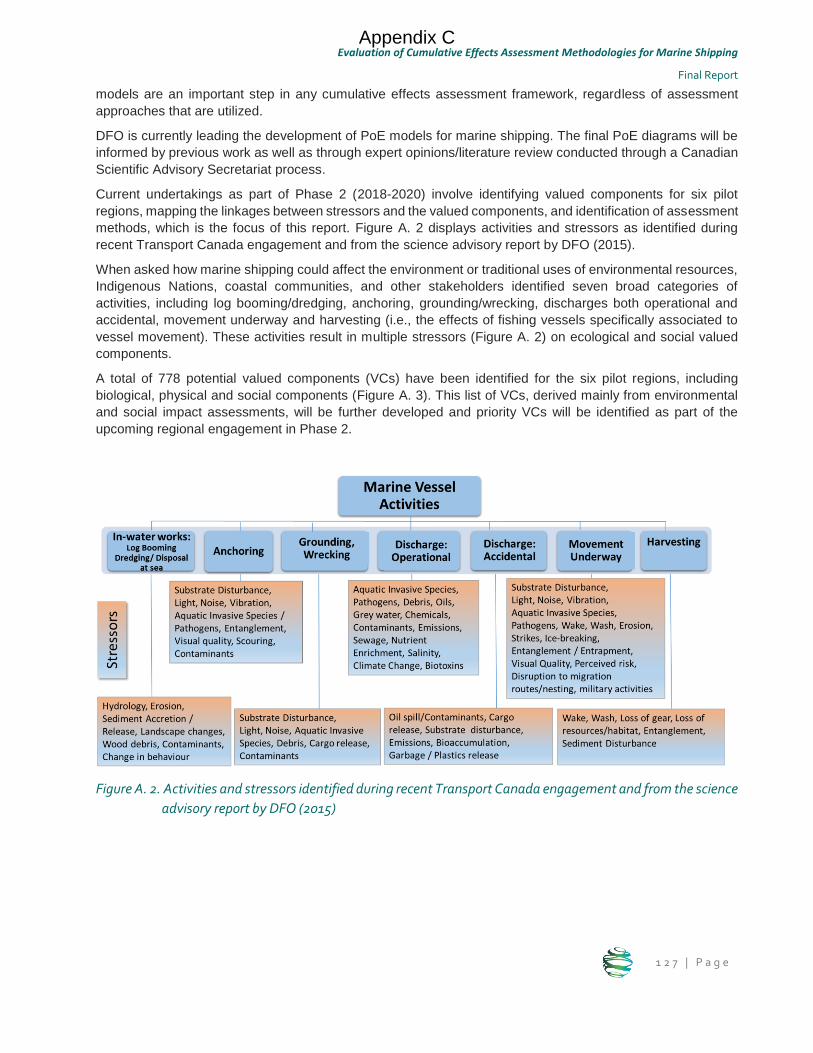
Evaluation of Cumulative Effects Assessment Methodologies for Marine Shipping
Final Report
1 2 7 | P a g e
models are an important step in any cumulative effects assessment framework, regardless of assessment
approaches that are utilized.
DFO is currently leading the development of PoE models for marine shipping. The final PoE diagrams will be
informed by previous work as well as through expert opinions/literature review conducted through a Canadian
Scientific Advisory Secretariat process.
Current undertakings as part of Phase 2 (2018-2020) involve identifying valued components for six pilot
regions, mapping the linkages between stressors and the valued components, and identification of assessment
methods, which is the focus of this report. Figure A. 2 displays activities and stressors as identified during
recent Transport Canada engagement and from the science advisory report by DFO (2015).
When asked how marine shipping could affect the environment or traditional uses of environmental resources,
Indigenous Nations, coastal communities, and other stakeholders identified seven broad categories of
activities, including log booming/dredging, anchoring, grounding/wrecking, discharges both operational and
accidental, movement underway and harvesting (i.e., the effects of fishing vessels specifically associated to
vessel movement). These activities result in multiple stressors (Figure A. 2) on ecological and social valued
components.
A total of 778 potential valued components (VCs) have been identified for the six pilot regions, including
biological, physical and social components (Figure A. 3). This list of VCs, derived mainly from environmental
and social impact assessments, will be further developed and priority VCs will be identified as part of the
upcoming regional engagement in Phase 2.
Figure A. 2. Activities and stressors identified during recent Transport Canada engagement and from the science
advisory report by DFO (2015)
Appendix C
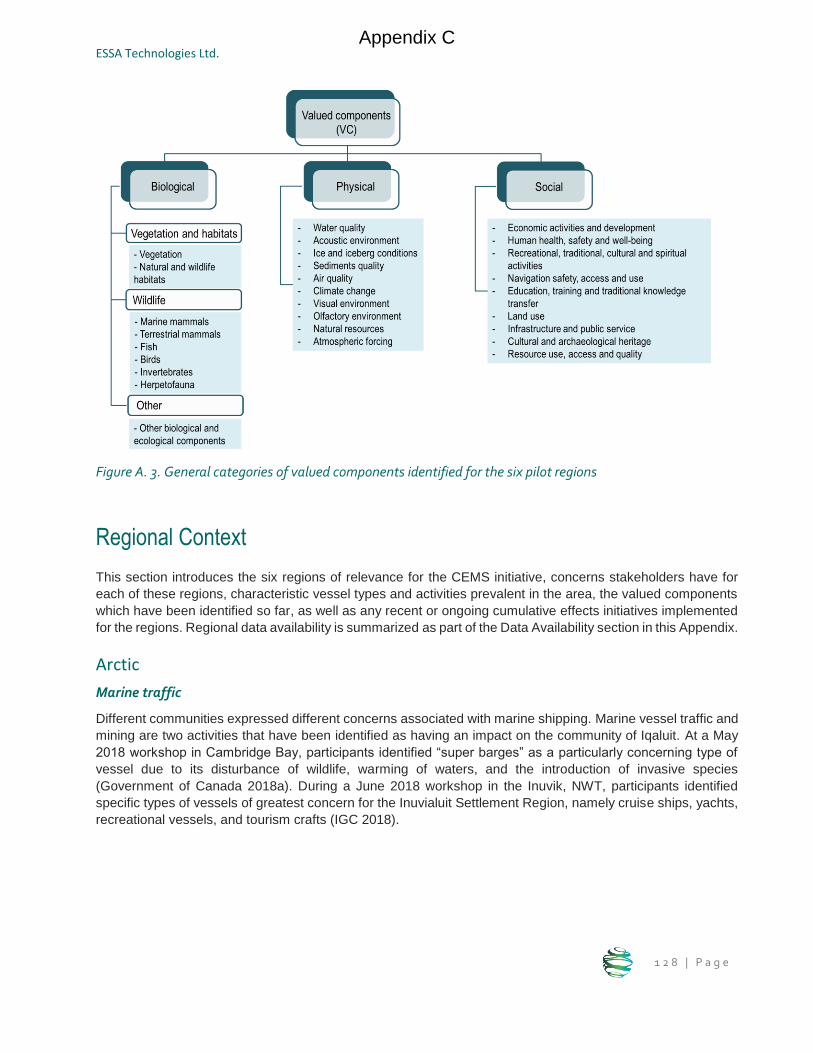
ESSA Technologies Ltd.
1 2 8 | P a g e
Figure A. 3. General categories of valued components identified for the six pilot regions
Regional Context
This section introduces the six regions of relevance for the CEMS initiative, concerns stakeholders have for
each of these regions, characteristic vessel types and activities prevalent in the area, the valued components
which have been identified so far, as well as any recent or ongoing cumulative effects initiatives implemented
for the regions. Regional data availability is summarized as part of the Data Availability section in this Appendix.
Arctic
Marine traffic
Different communities expressed different concerns associated with marine shipping. Marine vessel traffic and
mining are two activities that have been identified as having an impact on the community of Iqaluit. At a May
2018 workshop in Cambridge Bay, participants identified “super barges” as a particularly concerning type of
vessel due to its disturbance of wildlife, warming of waters, and the introduction of invasive species
(Government of Canada 2018a). During a June 2018 workshop in the Inuvik, NWT, participants identified
specific types of vessels of greatest concern for the Inuvialuit Settlement Region, namely cruise ships, yachts,
recreational vessels, and tourism crafts (IGC 2018).
Appendix C
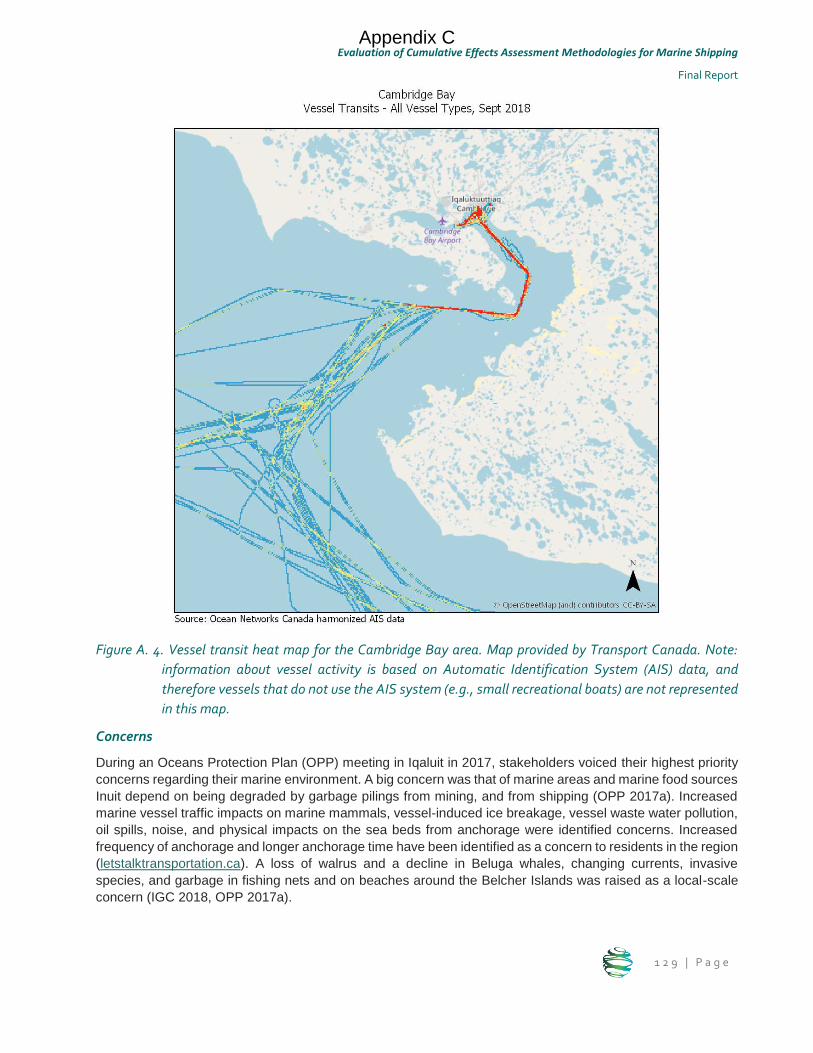
Evaluation of Cumulative Effects Assessment Methodologies for Marine Shipping
Final Report
1 2 9 | P a g e
Figure A. 4. Vessel transit heat map for the Cambridge Bay area. Map provided by Transport Canada. Note:
information about vessel activity is based on Automatic Identification System (AIS) data, and
therefore vessels that do not use the AIS system (e.g., small recreational boats) are not represented
in this map.
Concerns
During an Oceans Protection Plan (OPP) meeting in Iqaluit in 2017, stakeholders voiced their highest priority
concerns regarding their marine environment. A big concern was that of marine areas and marine food sources
Inuit depend on being degraded by garbage pilings from mining, and from shipping (OPP 2017a). Increased
marine vessel traffic impacts on marine mammals, vessel-induced ice breakage, vessel waste water pollution,
oil spills, noise, and physical impacts on the sea beds from anchorage were identified concerns. Increased
frequency of anchorage and longer anchorage time have been identified as a concern to residents in the region
(letstalktransportation.ca). A loss of walrus and a decline in Beluga whales, changing currents, invasive
species, and garbage in fishing nets and on beaches around the Belcher Islands was raised as a local-scale
concern (IGC 2018, OPP 2017a).
Appendix C
ESSA Technologies Ltd.
1 3 0 | P a g e
At an October 16-18, 2017 Transport Canada-hosted workshop in St. John’s, Newfoundland focused on
shipping through Arctic corridors, participants expressed apprehension about several marine-shipping related
possibilities. These included oil spill response capacity (including equipment, legal gaps, irregular maintenance
and access to equipment, and storage and disposal resources), mass rescue capabilities, and the effects of
climate change on increased marine shipping and sailing traffic through the arctic regions potentially impacting
haul outs and feeding areas of narwhals, belugas, and seals (Government of Canada 2017a). Community
access to hunting of narwhal through the Mary River where voyager and tanker traffic is high was also a
concern. Several of these concerns were also echoed at a June 2018 workshop in the Inuvik, NWT (IGC 2018).
During a May 2, 2018 workshop in Cambridge Bay, participants identified food security, increased tourism-
related vessels traffic, interference of ships during the hunting season, pollution, oil spills, noise, grey water,
changing migration patterns of marine mammals, effects of ice-breakers on hunting access and caribou
migration, and an inability to track smaller vessels around the community to be of concern (Government of
Canada 2018a).
Valued Components
Several biological VCs have been identified for this region: 19 marine mammals (including walruses, narwhals,
Beluga and Bowhead whales), 12 terrestrial mammals (including polar bears, muskox, Arctic hares, and
moose), 25 fish species, 11 birds, 13 invertebrates, 5 plants, 16 habitats, and 5 other ecological components
are included under this category.
Physical VCs include water quality (6), acoustic environment (3), ice conditions (1), sediment quality (4), air
quality (3), climate change (1), and visual environment (1).
The Arctic region has a significant number of socio-economic VCs of relevance. These include economic
activities and development (7), human health, safety and well-being (9), recreational, traditional, cultural and
spiritual activities (7), navigation safety, access and use (4), education, training and traditional knowledge
transfer (3), land use (2), infrastructure and public service (2), and cultural and archeological heritage (2).
Current state of CE practice within the region
Cumulative effects work has been undertaken for the Arctic region in and around Cambridge Bay by several
groups including the Beaufort Sea Partnership, the Northwest Territories Cumulative Impacts Monitoring
Program (CIMP), the Inuvialuit Game Council (IGC), and the World Wildlife Fund (WWF) (Beaufort Sea
Partnership 2009, Campagnola, J. pers. comm, IGC 2018, NWT 2018a). Since 2008, The Northwest Territories
Water Stewardship Strategy has been working on an initiative to outline a water strategy, including the
assessment of the cumulative effect of anthropogenic water and land use, and waste deposits on the
watershed (NWT 2018b). The Arctic Corridors group (www.arcticcorridors.ca), in partnership with Northern
Voices has studied and written many reports about subjects such as climate change, the effects of pleasure
craft tourism, and the cumulative effects of marine shipping (Arctic Corridors and Northern Voices 2018).
Environmental assessment studies have been performed by the Nunavut Impact Review Board and
collaborative efforts through the Beaufort Regional Strategic Environmental Assessment initiative
(https://rsea.inuvialuit.com/).
Appendix C
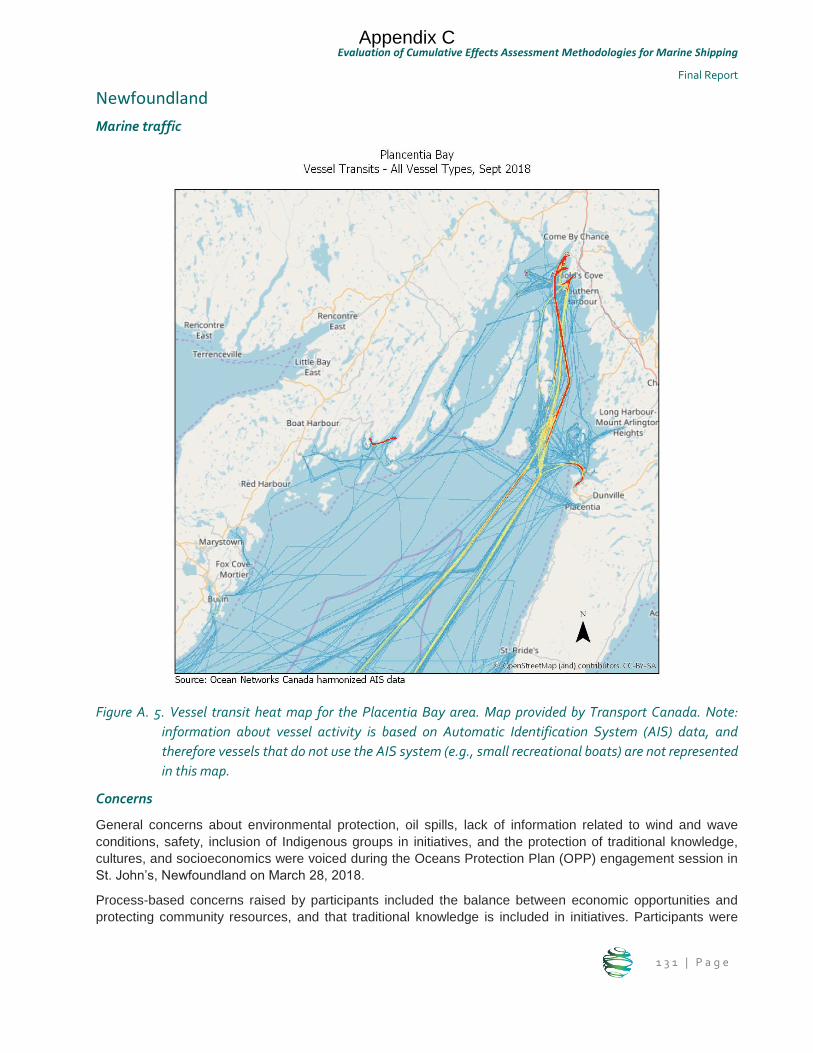
Evaluation of Cumulative Effects Assessment Methodologies for Marine Shipping
Final Report
1 3 1 | P a g e
Newfoundland
Marine traffic
Figure A. 5. Vessel transit heat map for the Placentia Bay area. Map provided by Transport Canada. Note:
information about vessel activity is based on Automatic Identification System (AIS) data, and
therefore vessels that do not use the AIS system (e.g., small recreational boats) are not represented
in this map.
Concerns
General concerns about environmental protection, oil spills, lack of information related to wind and wave
conditions, safety, inclusion of Indigenous groups in initiatives, and the protection of traditional knowledge,
cultures, and socioeconomics were voiced during the Oceans Protection Plan (OPP) engagement session in
St. John’s, Newfoundland on March 28, 2018.
Process-based concerns raised by participants included the balance between economic opportunities and
protecting community resources, and that traditional knowledge is included in initiatives. Participants were
Appendix C
ESSA Technologies Ltd.
1 3 2 | P a g e
concerned about ensuring that adequate time is allocated to any initiatives such that thorough analyses can
be achieved, that privacy be considered, and that risks of marine traffic are properly considered (Lorne Pike &
Associates 2018).
Valued Components
Four marine mammals including cetaceans, otters, and pinnipeds, 1 terrestrial mammal, 11 fish species
including bluefin tuna, and Atlantic cod, 14 birds, 10 invertebrates, 1 herpetile (sea turtles), 4 aquatic and
terrestrial plants species, and 7 aquatic and terrestrial habitats have been identified so far as biological valued
components category for Newfoundland.
Physical VCs include 4 water quality considerations, and 1 each of acoustic environmental, sediment quality,
air quality, climate change, and visual environmental considerations.
Social VCs include 1 economic activity (commercial fisheries), recreational, traditional, cultural and spiritual
activities (3), navigation safety, access and use (1), land use (1), infrastructure and public service (1), and
cultural and archeological heritage (1).
Current state of CE practice within the region
A recent draft plan for a regional assessment of offshore oil and gas exploration drilling East of Newfoundland
and Labrador has been released, which will seek to assess the current and anticipated cumulative effects of
such operations in combination with other physical disturbances that may result (Government of Canada
2018b).
Appendix C
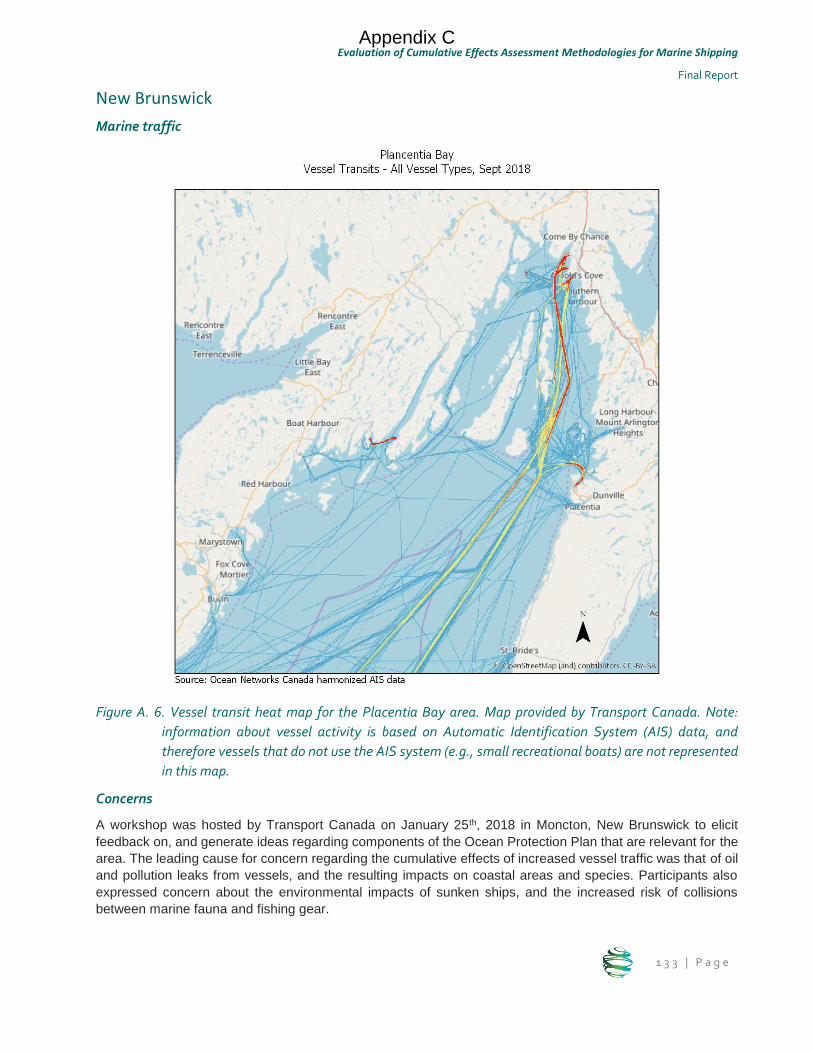
Evaluation of Cumulative Effects Assessment Methodologies for Marine Shipping
Final Report
1 3 3 | P a g e
New Brunswick
Marine traffic
Figure A. 6. Vessel transit heat map for the Placentia Bay area. Map provided by Transport Canada. Note:
information about vessel activity is based on Automatic Identification System (AIS) data, and
therefore vessels that do not use the AIS system (e.g., small recreational boats) are not represented
in this map.
Concerns
A workshop was hosted by Transport Canada on January 25th, 2018 in Moncton, New Brunswick to elicit
feedback on, and generate ideas regarding components of the Ocean Protection Plan that are relevant for the
area. The leading cause for concern regarding the cumulative effects of increased vessel traffic was that of oil
and pollution leaks from vessels, and the resulting impacts on coastal areas and species. Participants also
expressed concern about the environmental impacts of sunken ships, and the increased risk of collisions
between marine fauna and fishing gear.
Appendix C
ESSA Technologies Ltd.
1 3 4 | P a g e
Valued Components
Seven plant species/communities, 9 habitats, 3 marine mammals including the Northern Right Whale, 10
terrestrial mammals including moose and lynx, 12 fish including halibut, 5 birds, and 5 invertebrates have been
identified as biological VCs for this region.
Physical VCs of focus for the region include 4 water quality considerations, and one each of acoustic
environmental, ice conditions, sediment quality, air quality, climate change, and visual environmental
considerations.
Social VCs include 1 economic activity/development (commercial fisheries), 6 human health, safety and well-
being, 5 recreational, traditional, cultural, and spiritual activities, 1 land use activity, and 1 cultural and
archaeological heritage consideration.
Current state of CE practice within the region
The Canadian Government’s Area Response Planning (ARP) initiative, which ran between 2014 and 2017,
sought to help the Bay of Fundy develop oil spill response plans for four pilot areas using a risk assessment
methodology. The program included an evaluation of environmental sensitivities
(https://www.tc.gc.ca/eng/marinesafety/oep-ers-arp-4473.html).
Appendix C
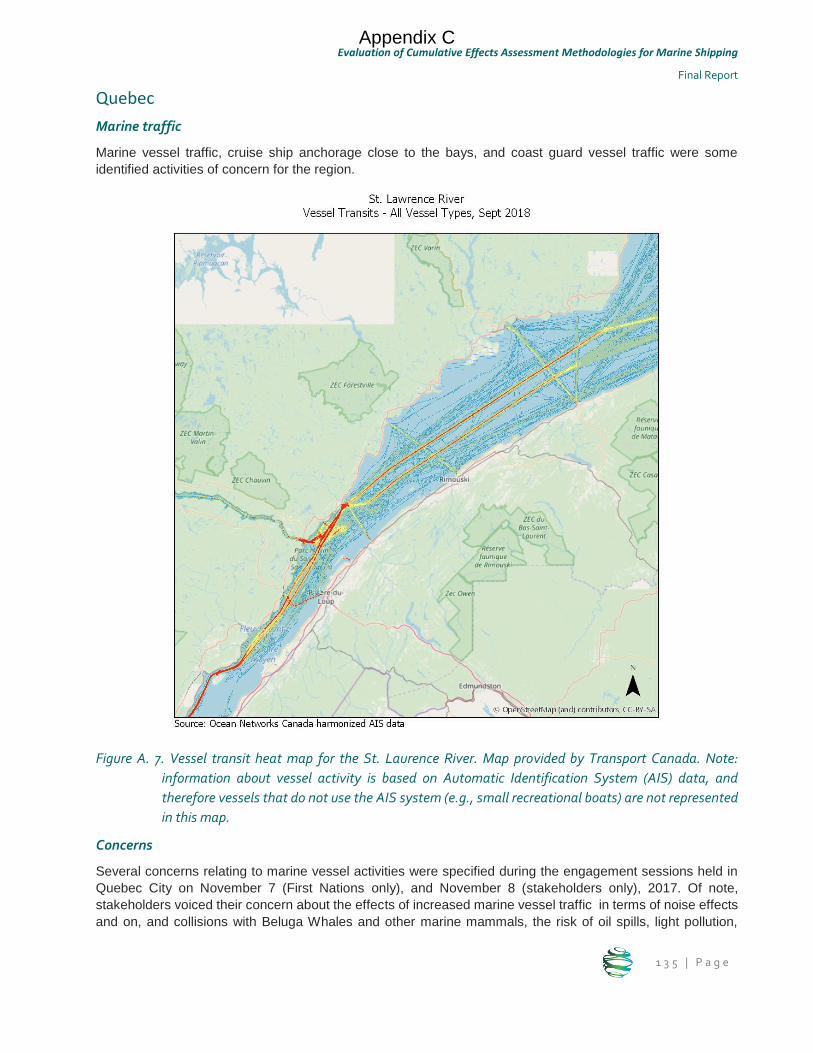
Evaluation of Cumulative Effects Assessment Methodologies for Marine Shipping
Final Report
1 3 5 | P a g e
Quebec
Marine traffic
Marine vessel traffic, cruise ship anchorage close to the bays, and coast guard vessel traffic were some
identified activities of concern for the region.
Figure A. 7. Vessel transit heat map for the St. Laurence River. Map provided by Transport Canada. Note:
information about vessel activity is based on Automatic Identification System (AIS) data, and
therefore vessels that do not use the AIS system (e.g., small recreational boats) are not represented
in this map.
Concerns
Several concerns relating to marine vessel activities were specified during the engagement sessions held in
Quebec City on November 7 (First Nations only), and November 8 (stakeholders only), 2017. Of note,
stakeholders voiced their concern about the effects of increased marine vessel traffic in terms of noise effects
and on, and collisions with Beluga Whales and other marine mammals, the risk of oil spills, light pollution,
Appendix C
ESSA Technologies Ltd.
1 3 6 | P a g e
marine heritage sites, vessel wastewater, climate change, the capacity of the St. Lawrence, dredging, effects
of anchorage on wildlife, issues relating to abandoned vessels, invasive species introductions, and shoreline
erosion from vessel wakes, among others (Government of Canada 2017b, IDDPNQL 2017). Overfishing of
lobster with the onset of more visiting vessels to the Gaspe Peninsula is of worry (Government of Canada
2017b). The fact that different stressors would pertain to different valued components in distinct areas within
the region was raised; For example, vessel traffic may predominantly affect fisheries in one area, while
shoreline erosion is of priority concern in another area. Participants were also concerned about ensuring
cumulative effects studies consider existing regional studies, and follow the framework of the Environmental
Assessment Act (IDDPNQL 2017). Stakeholders asserted that water intakes, wastewater discharges, and their
effects of erosion be considered (Government of Canada 2017b).
There was concern that increased vessel traffic through the Seaway would lead in increased conflicts, safety,
and access issues with the First Nations that utilize the areas near the river for fishing and recreation. Ensuring
a balance is struck between mitigation efforts, like reduced vessel speed, and the ability of First Nations to
engage in activities like fishing was raised. Impacts on First Nations’ crab fishing was also highlighted. It was
recommended that information and data be collected with engagement of First Nations, and from several
different communities to ensure varying points of view are accounted for (IDDPNQL 2017).
Stakeholders were concerned about the spatial extent of the region of focus, suggesting that the fluvial areas
of the St. Lawrence and Lake Saint-Pierre be included in analyses as these are areas in which significant port
development is occurring, and that years prior to the construction of the St. Lawrence Seaways (1954) also be
included in any temporal analyses. It was also suggested that a site in the Nunavik and/or Eeyou-Istchee Baie-
James areas be added to the roster of sites, but not included with the St. Lawrence site. They also
recommended that the entire system be considered rather than just a portion of it (IDDPNQL 2017,
Government of Canada 2017b, Transport Canada 2018).
Valued Components
Biological VCs identified for this region include: 14 aquatic and terrestrial plant species/communities, 16
habitats including salt marshes, eelgrass beds, and protected areas, 4 marine mammals including Beluga
whales, 5 terrestrial mammals including caribou, the rock vole, and the least weasel, 17 fish, 8 birds, 8
invertebrates including coral and sponges, and 7 herpetiles including different species of turtles.
One each of water quality, acoustic environment, ice conditions, air quality, and climate change, as well as 3
sediment quality, and 3 visual environment valued components make up the physical VC category.
Various social VCs are of relevance for this region, namely: 3 economic activities and development including
tourism and commercial fisheries, 5 human health, safety and well-being considerations, 7 recreational,
traditional, cultural and spiritual activities including birdwatching and recreational fisheries, 2 navigation safety,
access, and use considerations, education, training and traditional knowledge transfer (1), land use (1),
infrastructure and public service (1), cultural and archeological heritage (2), resource use, access, and quality
(1).
Current state of CE practice within the region
Cumulative effects initiatives that have been or are currently being implemented in Quebec include phase 1 of
the multi-year characterization of coastal ecosystems work, which focuses on data collection in the marine
estuary pilot zone, and the Canadian National Action Plan’s initiative to reduce the impacts of vessel noise and
collisions with whales in the Gulf of St. Lawrence (Government of Canada 2017b, Government of Canada
2018d).
Appendix C
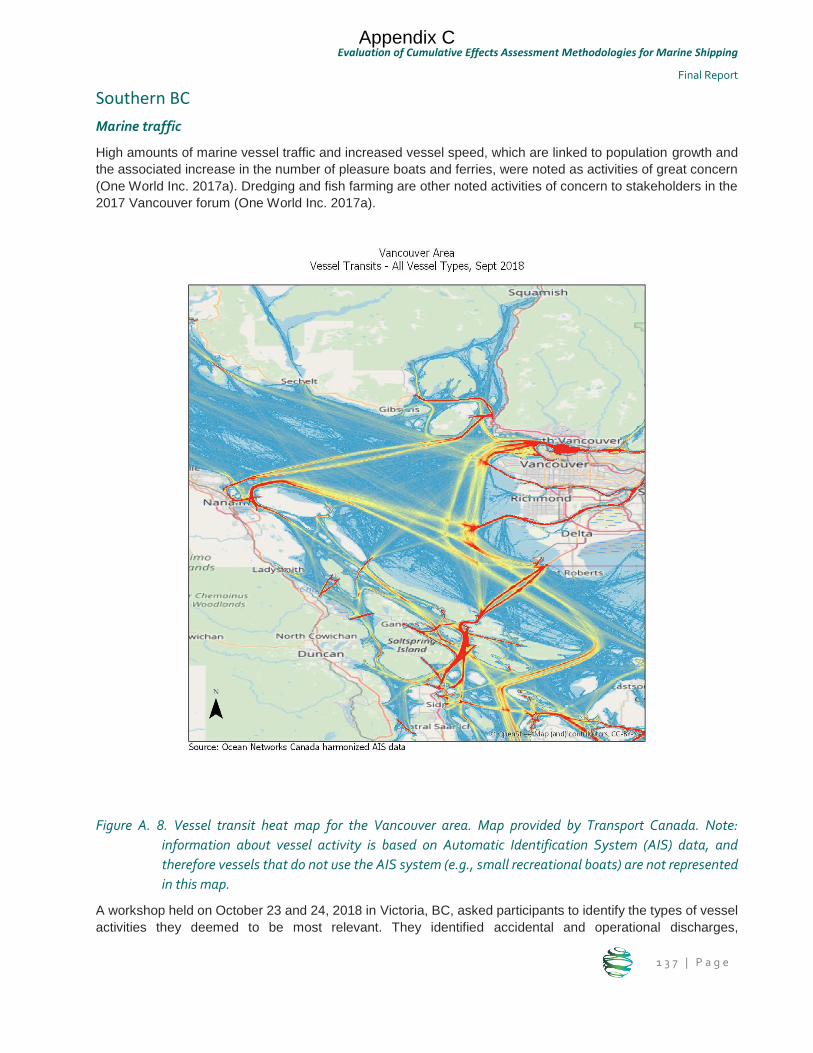
Evaluation of Cumulative Effects Assessment Methodologies for Marine Shipping
Final Report
1 3 7 | P a g e
Southern BC
Marine traffic
High amounts of marine vessel traffic and increased vessel speed, which are linked to population growth and
the associated increase in the number of pleasure boats and ferries, were noted as activities of great concern
(One World Inc. 2017a). Dredging and fish farming are other noted activities of concern to stakeholders in the
2017 Vancouver forum (One World Inc. 2017a).
Figure A. 8. Vessel transit heat map for the Vancouver area. Map provided by Transport Canada. Note:
information about vessel activity is based on Automatic Identification System (AIS) data, and
therefore vessels that do not use the AIS system (e.g., small recreational boats) are not represented
in this map.
A workshop held on October 23 and 24, 2018 in Victoria, BC, asked participants to identify the types of vessel
activities they deemed to be most relevant. They identified accidental and operational discharges,
Appendix C
ESSA Technologies Ltd.
1 3 8 | P a g e
grounding/wrecking, movement underway and monitoring/sampling as the activities vessels contributed to the
most across all the sectors of discussion (ferries, government and research vessels, shipping, military, tug and
barges, commercial fishing, sports fishing, cruise ships, whale watching vessels, and recreational boats)
(McWhinnie et al. 2018).
Concerns
During the South Coast Dialogue Forum in Vancouver (One World Inc. 2017a), stakeholders were most
concerned about pollution from vessel emissions and vessel accidents (air emissions, oil spills, waste water
discharges, vessel paint residuals, and natural disaster-related pollution from vessels), noise and light pollution,
and physical disturbances of the shoreline and sea beds (shoreline erosion from vessel wakes) on human,
environment, and endangered species health. Physical disturbances and pollution from dredging and
commercial development, viral transmissions from fish farms, invasive species, litter from vessels, climate
change, Southern Resident Killer Whale impacts from vessel strikes and effects to their food sources, and
impacts of heightened vessel traffic on whale watching tours were also highlighted (One World Inc. 2017a).
Concern about the spatial extent of the Port of Vancouver pilot site was also mentioned, and it was
recommended that spatial boundaries extend beyond administrative boundaries, to include northern and
southern coasts or even encompass the range of the Southern Resident Killer Whale (One World Inc. 2017a).
Ensuring First Nations maintain traditional territories and fishing rights, and reducing any economic impacts on
First Nations and commercial fisheries were also mentioned.
Process-related concerns voiced during the Vancouver forum included ensuring that coastal community
knowledge is incorporated during data collection, that areas beyond Vancouver’s port be included in any
baseline data collection to account for pollution levels already present in the area, and that the climate change
effects might obscure interpretation of baseline measures made. Ensuring seasonality is reflected in collected
data was also voiced (One World Inc. 2017a).
Activities
Valued Components
A total of 140 individual biological valued components have been identified for Southern BC, the largest number
of all six regions of focus. 40 fish including salmonids, 15 birds, 13 invertebrates including corals, sponges,
and echinoderms, 32 plants, and 22 habitats contribute significantly to this number. Marine mammals (6)
including several species of whale such as the Southern Resident Killer Whale, terrestrial mammals (3), and
herpetiles (4) make up the rest.
Physical VCs include water quality (6), acoustic environment (3) including vibrations and underwater/airborne
noise, sediment quality (3), air quality (1), visual environment (4) including the visual effects of shipping, and
landscape beauty, and natural resources (1).
Six economic activities and development including tourism and commercial fisheries, 5 human health, safety
and well-being considerations, 5 recreational, traditional, cultural and spiritual activities including recreational
fisheries, 4 navigation safety, access, and use considerations, 1 education, training and traditional knowledge
transfer, 3 land use, 8 infrastructure and public service, and 4 cultural and archeological heritage social valued
components are of relevance for this region.
Current state of CE practice within the region
The Tsleil-Waututh Nation has performed cumulative effect assessments for the region, and have also
commented on the adequacy of CE work and Marine Shipping Addendum (MSA) proposed for the Robert’s
Bank Terminal 2 Project (Smith 2016) as well as the TransMountain Pipeline project. The Musqueam Indian
Band have recently completed an assessment of the impacts of marine vessel traffic on access to fishing
Appendix C
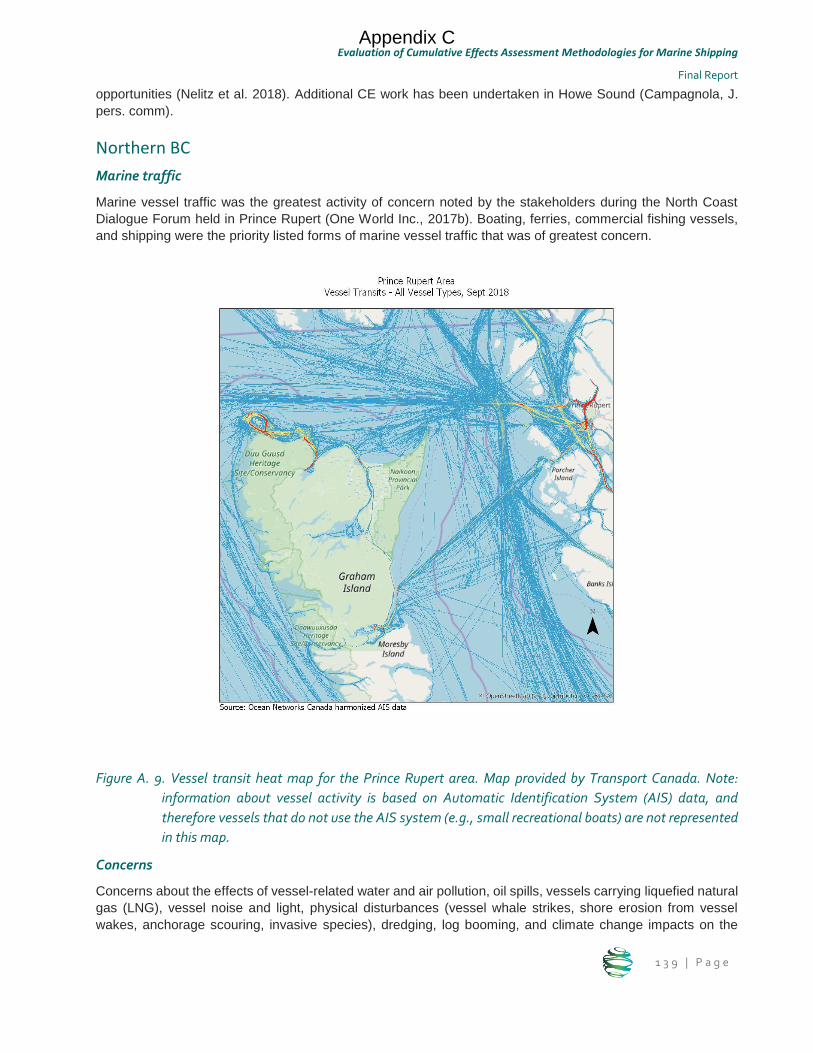
Evaluation of Cumulative Effects Assessment Methodologies for Marine Shipping
Final Report
1 3 9 | P a g e
opportunities (Nelitz et al. 2018). Additional CE work has been undertaken in Howe Sound (Campagnola, J.
pers. comm).
Northern BC
Marine traffic
Marine vessel traffic was the greatest activity of concern noted by the stakeholders during the North Coast
Dialogue Forum held in Prince Rupert (One World Inc., 2017b). Boating, ferries, commercial fishing vessels,
and shipping were the priority listed forms of marine vessel traffic that was of greatest concern.
Figure A. 9. Vessel transit heat map for the Prince Rupert area. Map provided by Transport Canada. Note:
information about vessel activity is based on Automatic Identification System (AIS) data, and
therefore vessels that do not use the AIS system (e.g., small recreational boats) are not represented
in this map.
Concerns
Concerns about the effects of vessel-related water and air pollution, oil spills, vessels carrying liquefied natural
gas (LNG), vessel noise and light, physical disturbances (vessel whale strikes, shore erosion from vessel
wakes, anchorage scouring, invasive species), dredging, log booming, and climate change impacts on the
Appendix C
ESSA Technologies Ltd.
1 4 0 | P a g e
wellbeing of human and marine life, as well as the health of the ecosystem as a whole were of highest priority
for Prince Rupert (One World Inc., 2017b, OPP 2018a).
Interactions between increased large vessel anchorage and First Nations fishing harvest and salmon wellbeing,
abandoned vessels, and interactions of large vessels with smaller vessels, like fishing vessels, was also
outlined as a concern for the region. Similarly, large vessel interference with First Nations Food, Social, and
Ceremonial (FSC) fisheries near the Skeena estuary was articulated as an issue (One World Inc., 2017b).
Another notable concern for the region was that cumulative effects analyses should encompass a greater
geographic area, following the ecological boundaries rather than administrative boundaries, including the
Skeena estuary, and extending to Haida Gwaii, the Southern tip of Alaska, and inland to lakes and rivers (One
World Inc., 2017b).
In addition to ecological and social concerns, process-related concerns regarding collecting data in a manner
that is reproducible, engages First Nations, considers seasonality, and considers different community priorities
for collection were also raised. It was also noted that historically collected data be included in cumulative effects
assessments (One World Inc., 2017b). First Nations raised concerns regarding sensitivities when considering
socio-economic aspects of studies in which they are engaged (OPP 2018a).
Valued Components
114 Biological VCs have been identified for northern BC, including the following: 38 aquatic and terrestrial plant
species/communities including liquorice fern, bog cranberry, and several evergreen tree species, 18 habitats,
4 marine mammals, 5 terrestrial mammals including grizzly bears and moose, 9 fish, 9 birds, 18 invertebrates,
and 9 reptiles.
Physical VCs include water quality (4), acoustic environment (1), sediments quality (3), air quality (3), visual
environment (2), and atmospheric forcing (2).
In terms of social VCs, 3 economic activities and development, 4 human health, safety and well-being
considerations including disease and drug consumption, 4 recreational, traditional, cultural and spiritual
activities including shellfish farms, 2 navigation safety, access, and use considerations, 3 land use, 9
infrastructure and public services such as power infrastructure and waste management services, and 1 cultural
and archeological heritage consideration are of relevance.
Current state of CE practice within the region
There are multiple cumulative effects initiatives that have been undertaken or are currently being undertaken
along British Columbia’s north coast.
The Marine Plan Partnership (MaPP) developed a MaPP cumulative effects framework, and is working to
continue to develop and refine it in the MaPP North Coast sub-region (MaPP 2017). As part of this work, the
MaPP cumulative effects coordinator has worked within other cumulative effects initiatives, including the
Cumulative Effects Monitoring Initiative (CEMI), the Metlakatla Cumulative Effects Management Initiative, and
the Environmental Stewardship Initiative (ESI) - North Coast Cumulative Effects Demonstration Project (MaPP
2017). Also as part of this work, in 2018 a North Coast water quality monitoring strategy was developed, which
is in the initiation and implementation stage (OPP 2018a).
Through the federally initiated Cumulative Effects Monitoring Initiative (CEMI) in the Prince Rupert area, a 2016
draft interim plan, and a detailed monitoring proposal were developed for the region (OPP 2018a). Beginning
in 2014, the Metlakatla First Nation began the Metlakatla Cumulative Effects Management Initiative, which has
involved characterizing priority values and associated indicators, establishing management benchmarks, and
monitoring for the 10 identified values.
Appendix C
Evaluation of Cumulative Effects Assessment Methodologies for Marine Shipping
Final Report
1 4 1 | P a g e
The North Coast ESI project is focused on priority values within the Skeena region. It is one of five pilot ESI
projects across the Province of BC, and the only one focused on the marine environment. It is a collaboration
that includes North Coast First Nations, the Provincial government (Ministry of Energy, Mines and Petroleum
Resources, and the Ministry of Forests, Lands, Natural Resource Operations and Rural Development), and
the Marine Plan Partnership. To date they have developed pathways of effects models, indicators based on
management goals, preliminary approach to assessment (including identification of thresholds) and have
begun data collection using a preliminary monitoring plan.
Previous initiatives to assess cumulative effects in the Skeena estuary include the Pacific Salmon Foundation’s
Skeena River Estuary Assessment (Pickard et al. 2015), and the World Wildlife Foundation Skeena Cumulative
Effects Assessment (WWF 2018).
Appendix C
ESSA Technologies Ltd.
1 4 2 | P a g e
Summary of available data
Types of data used in Cumulative Effects Assessments
The assessment of cumulative effects requires data connecting the activities and stressors to the Valued
Components (VCs). Data requirements depend mainly on the type of assessment method being used. Data
availability thus influences the choice of the assessment method. Strongly quantitative CEAs, such as those
involving complex statistical models, require large and complex input datasets (Jones 2016). In addition, these
datasets might need to be analyzed from various spatial and temporal scales.
A wide range of types of data can be used in cumulative effects assessments, including quantitative or
qualitative information, georeferenced data, traditional knowledge data, etc. These various data types come
from a variety of sources, including: studies and reports, workshops, monitoring programs, field studies, outputs
of modeling exercises, etc.
Spatial data (i.e., points, lines and polygons) in the form of georeferenced information on the location and
intensity of pressures (e.g., density of vessel traffic) and on the occurrence of ecosystem components (e.g.,
polygons representing the habitat distribution of a given species) are routinely used in spatial cumulative effects
assessments (Korpinen and Andersen 2016). Even if the assessment is not spatially-explicit, some form of
spatial data is usually included in most assessment methods.
Lack of empirical information on stressors-receptors interactions is a common problem in cumulative effects
assessments. One way to overcome this lack of data is by eliciting expert knowledge on certain aspects of the
assessment; such as determining the vulnerability of marine ecosystems to multiple anthropogenic stressors
(Teck et al. 2010) or analyzing the pathways of effects and assigning impact scores (Singh et al. 2017). Expert
knowledge is usually collected through surveys and/or technical workshops; usually in an iterative manner
(refer to Section 6.2)
Indigenous knowledge (IK), refers to the knowledge held by Indigenous groups who have a long relationship
with the territories where they live, and the resources found in these areas. This type of knowledge is valuable,
especially for providing a historic perspective in the absence of long-term scientific data. Specifically, one of
the shortcomings of the ecological baselines in cumulative assessments is that the available data are usually
recent and reflect the environment in a degraded condition as affected by historical impacts (Clarke Murray et
al. 2014, Korpinen and Andersen 2016). In this context, traditional and local ecological knowledge can
contribute to understanding ecological trends or define the reference or pre-development conditions of the VCs
(Clarke Murray et al. 2014).
Data available for the CEMS Initiative
Transport Canada is currently in the process of identifying data sources and collecting data sets that will inform
and support the development and implementation of the CEMS initiative. This process is at a preliminary stage
and the final data sets will be defined once the spatial and temporal boundaries and the priority Valued
Components (VCs) have been established for each pilot region.
So far Transport Canada has compiled a list of potential data sources based on a preliminary screening of
available information (e.g., reports, contacts, other government departments and initiatives, etc.), data sources
lists which have been compiled for other initiatives under the Ocean Protection Plan, such as the Marine
Regional Response Planning (RRP) initiative; a regional strategy for marine pollution incident response
planning and preparedness implemented by MaPP in the Pacific region. This preliminary list includes
information sources potentially relevant for characterizing the VCs (e.g., habitat ranges, wildlife studies,
protected areas, data sets on physical attributes such as ice cover and tides, etc.) and stressors (mainly vessel
traffic data).
Appendix C
Evaluation of Cumulative Effects Assessment Methodologies for Marine Shipping
Final Report
1 4 3 | P a g e
Some of the data sources identified for the Arctic include information on shipping trends and culturally
significant marine areas, as well as socio-economic values from the monitoring committees. The Ocean
Networks Canada has a monitoring station in Cambridge Bay from which data are made available online
(Campagnola, J. pers. comm.).
There are some initiatives at the national level that could provide data related to marine shipping, such as the
Clear Seas Center for Responsible Marine Shipping, the Marine Environmental Observation, Prediction and
Response Network (MEOPAR), or Ocean Networks Canada, which monitors ecological, physical and marine
use parameters in both the East and Western coasts and in the Arctic.
In general, data sources on social VCs are not well represented across regions as compared to biological or
physical VCs.
Through the engagement process with stakeholders in the pilot regions, potential additional sources of data
are being identified. For example, the Green Marine Initiative in Quebec and the Working Group on Marine
Traffic and Protection of Marine Mammals in the Gulf of the St. Lawrence (G2T3M) could provide useful insights
related to the effects of underwater noise. The coastal ecosystem data collected through the current
“characterization of coastal ecosystem” study will be available on the St. Lawrence Global Observatory website
(https://ogsl.ca/en).
Stakeholders from the Pacific region identified a number of entities that could have relevant data for the South
Coast of BC during a South Coast Dialogue Forum in Vancouver (One World Inc. 2017a). These entities include
the Canadian government, the British Columbian government, the United States Coast Guard, Islands Trust,
the Port of Vancouver, the David Suzuki Foundation, Streamkeepers, the Vancouver Aquarium, Universities,
and Indigenous stewardship groups, among others (One World Inc. 2017a). Potential data sets from these
sources include water quality data, vessel incidents, fish, wind and tides, climate change, and watercraft
effects.
For the Northern BC Coast, a number of data sources were identified during the North Coast Dialogue Forum
held in Prince Rupert (2017). Data from the Canadian government, the British Columbian government, First
Nations fisheries departments and traditional knowledge, the Tsimshian Environmental Stewardship Authority,
the Marine Plan Partnership for North Pacific Coast (MaPP), the T Buck Suzuki Foundation, and other NGO’s
are included on this list (One World Inc., 2017b). A long-term Port of Prince Rupert initiative to collect water,
air, wind, and noise data in 31 areas using emission stations around the Port, and through a partnership with
ONC has been ongoing for some years (One World Inc., 2017b). Many of the data sources identified during
this forum pertained to water and air pollution, fish stocks, noise, and historical data.
Vessel traffic data
Vessel traffic data are essential for assessing cumulative effects. This type of information is used as a measure
of marine shipping activity in many assessment methods. It is also a critical input for various modeling
approaches, such as for models predicting underwater noise propagation, oil spills or strikes with wildlife.
The automatic identification system (AIS) is a global tracking system that allows vessels to view traffic in
their area and also to be seen by other ships. The information automatically transmitted by the vessels includes
their location, speed and dimensions. Terrestrial and space-based receivers can also record AIS data.
Canadian Coast Guard has a network of terrestrial stations for live vessel tracking within a distance of a few
nautical miles. Current and historical AIS data can also be purchased from corporations who own constellations
of satellites that record this information.
Appendix C
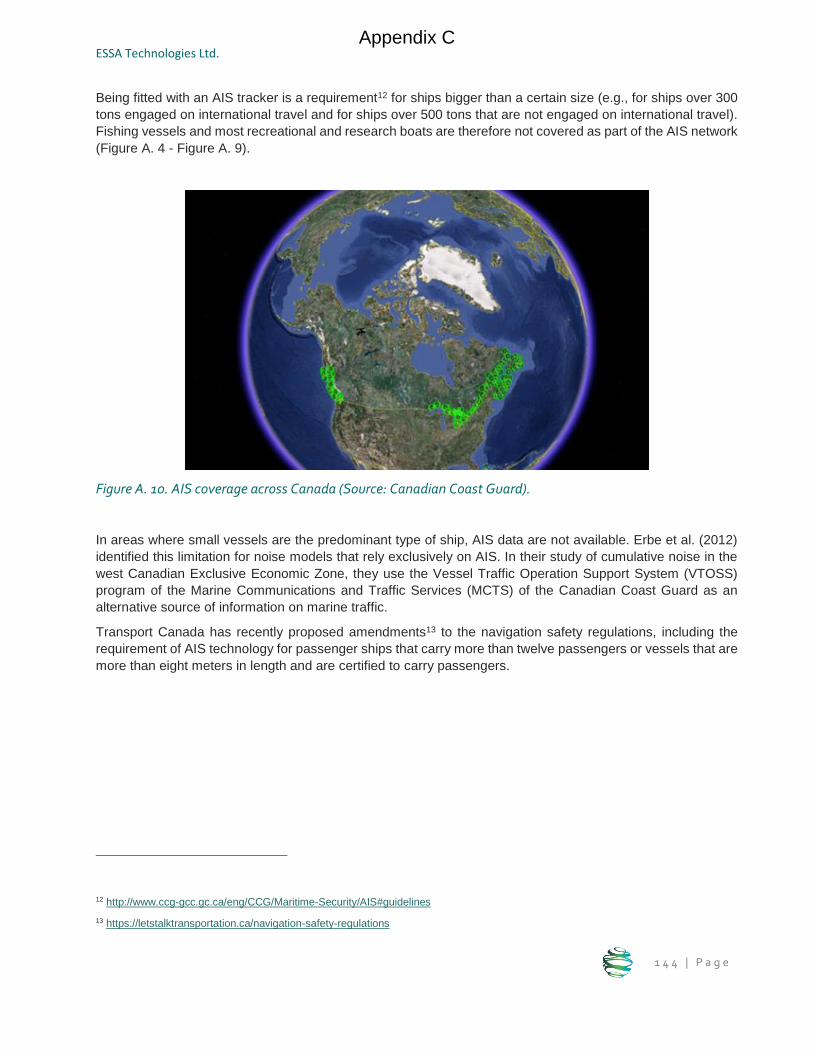
ESSA Technologies Ltd.
1 4 4 | P a g e
Being fitted with an AIS tracker is a requirement12 for ships bigger than a certain size (e.g., for ships over 300
tons engaged on international travel and for ships over 500 tons that are not engaged on international travel).
Fishing vessels and most recreational and research boats are therefore not covered as part of the AIS network
(Figure A. 4 - Figure A. 9).
Figure A. 10. AIS coverage across Canada (Source: Canadian Coast Guard).
In areas where small vessels are the predominant type of ship, AIS data are not available. Erbe et al. (2012)
identified this limitation for noise models that rely exclusively on AIS. In their study of cumulative noise in the
west Canadian Exclusive Economic Zone, they use the Vessel Traffic Operation Support System (VTOSS)
program of the Marine Communications and Traffic Services (MCTS) of the Canadian Coast Guard as an
alternative source of information on marine traffic.
Transport Canada has recently proposed amendments13 to the navigation safety regulations, including the
requirement of AIS technology for passenger ships that carry more than twelve passengers or vessels that are
more than eight meters in length and are certified to carry passengers.
12 http://www.ccg-gcc.gc.ca/eng/CCG/Maritime-Security/AIS#guidelines
13 https://letstalktransportation.ca/navigation-safety-regulations
Appendix C
Evaluation of Cumulative Effects Assessment Methodologies for Marine Shipping
Final Report
1 4 5 | P a g e
Appendix B: Summary of Review Papers As previously discussed, as part of Tier 1 we screened 20 review papers which compare and contrast specific
methods and tools. Although these reviews have a different scope and goal than the present evaluation, it was
informative to understand how other studies have framed and analyzed cumulative effects assessment
methods and tools and the lessons that emerge from the literature. This section presents the key findings from
the thirteen papers most relevant for this evaluation.
Reference: Lerner, J. 2018. Review of cumulative effects management concepts and international
frameworks. Prepared for Transport Canada under Contract T8080-170062.
Overview: At the request of Transport Canada, Lerner (2018) conducted a literature review of international
cumulative effects management frameworks, including the assessment of CE, with a focus on marine
shipping and coastal contexts. The literature review covered 262 documents, including academic papers,
grey literature and seven case studies of implemented cumulative effects management systems (3 Canadian
and 4 international).
Key insights: This study groups models and tools usually applied to analyze the cause-effect linkages
between activities and valued components into four categories: causal frameworks (e.g., DPSIR, Pathways
of Effects); ecological risk assessment frameworks (ERAFs); ecosystem models (e.g., Ecopath with Ecosim,
Atlantis) and cumulative impact mapping. These four categories are not explicitly evaluated, but Lerner
provides a set of qualitative criteria for assisting in the selection of a specific assessment method. These
criteria include: resources available (i.e., data, time and cost), manageability, generality, realism and
precision.
Reference: Stelzenmüller, V., Coll, M., Mazaris, A. D., Giakoumi, S., Katsanevakis, S., Portman, M. E.,
Ojaveer, H. 2018. A risk-based approach to cumulative effect assessments for marine management.
Science of the Total Environment, 612, 1132-1140
Description: The authors review the common shortcomings and the challenges of cumulative effects
assessments undertaken in marine environments, focusing specifically on the treatment of uncertainty in
these studies. The authors reviewed 154 studies regarding their input data, methods and tools applied in
the respective risk management process. They proposed a modified risk-based approach for CEA.
Key insights: Each step of the CEA process demands different scientific analyses and expertise and,
therefore, CEA studies usually involve a selection of methods adequate for each of the steps.
Reference: Foley, M. M., Mease, L. A., Martone, R. G., Prahler, E. E., Morrison, T. H., Murray, C. C., &
Wojcik, D. 2017. The challenges and opportunities in cumulative effects assessment. Environmental
Impact Assessment Review, 62, 122-134.
Description: Foley et al. (2017) conducted a comparative study, through expert survey, to assess the state
of CEA practice in marine and coastal environments in four jurisdictions with advanced environmental
regulatory frameworks: California (USA), British Columbia, (Canada), Queensland (Australia) and New
Zealand. The premise of the authors is that even though there have been significant scientific advances in
tools and methods for cumulative effects analysis, practitioners are still faced with significant challenges
Appendix C
ESSA Technologies Ltd.
1 4 6 | P a g e
when implementing CEAs. The purpose of this review is to identify the main challenges and point to ways in
which CEA practice could align with the best available science.
Key insights: The main shortcomings affecting current CEA practice are, according to Foley et al. (2017):
scoping impact metrics, identifying baselines, defining spatial and temporal boundaries and determining
significance of the effects. The results of the expert survey indicate that CEA processes are complex across
the four jurisdictions and practitioners struggle to find the data and tools they need to complete thorough
assessments.
Reference: Korpinen S. and Andersen J.H. 2016. A Global Review of Cumulative Pressure and
Impact Assessments in Marine Environments. Front.Mar.Sci. 3 (153).
Overview: This review aims to provide an overview of the methods and practices used in cumulative effects
assessment in marine environments. The authors analyzed the similarities among approaches, the emerging
best practices, and the ways in which these studies addressed common CEA criticisms. The review covered
40 international cumulative effects assessments which had been published after 2000 and included, at least,
two stressors.
Key insights: The predominant assessment method of cumulative effects is spatial analysis based on the
approach developed by Halpern et al. (2008) and involving the combination of spatial information on the
intensity of the pressures/stressors with data on the distribution and characteristics of the ecosystem
components. According to Kornipen and Andersen (2016) some of the key limitations in the current practice
include the lack of benchmarks or thresholds for the pressures, which prevents adequate estimation of
impacts, and the limited scope of the studies which do not cover the full array of pressures on marine
ecosystems. 25% of the reviewed studies build on a conceptual model that systematically identifies all the
linkages between human activities and impact on ecosystem components.
Reference: Jones, F.C. 2016. Cumulative effects assessment: theoretical underpinnings and big
problems. Environ. Rev. 24: 187–204.
Overview: In this review paper Jones (2016) assesses current practice in cumulative effects assessment
(CEA) and documents with evidence from the literature the theories supporting (CEA) and the main
challenges and problems found in implementation.
Key insights: Jones (2016) argues that there is consensus on the steps of the CEA process. However,
there is no agreement in terms of the best methods and tools to complete those steps. Science has advanced
significantly in the CEA space. There are numerical models available for the assessment of effects. The
reasons why CEA studies are still, for the most part, qualitative are not related to the state of the science
but perhaps to the regulatory and administrative frames in which these studies are undertaken.
Reference: Smith C.J., Papadopoulou K.N., Barnard S., Mazik K., Elliott M., Patrício J., Solaun O.,
Little S., Bhatia N.and Borja A. 2016. Managing the Marine Environment, Conceptual Models and
Assessment Considerations for the European Marine Strategy Framework Directive. Front.
Mar.Sci.3:144.
Overview: Smith et al. (2016) reviewed the use of conceptual models as part of the studies done under the
European Marine Strategy Framework Directive. They focused specifically on the Driver-Pressure-State-
Appendix C
Evaluation of Cumulative Effects Assessment Methodologies for Marine Shipping
Final Report
1 4 7 | P a g e
Impact-Response (DPSIR) framework, which has been extensively used in Europe, and analyzed if this
approach is relevant to organize and focus assessments in real marine situations.
Key insights: The authors identified a number of challenges that prevent conceptual models turning into
actual assessments: lack of data to validate the causal links between stressors and components, accounting
for the interactions among stressors (e.g., synergistic, antagonistic, additive, etc.), pervasive uncertainty and
low level of confidence in the predictions. The paper discusses other assessment approaches
complementary to DPSIR: matrices, ecosystem models, Bayesian Belief Networks, and bow-tie approaches.
Reference: Judd A.D., T. Backhaus, F. Goodsir. 2015. An effective set of principles for practical
implementation of marine cumulative effects assessment. Environmental Science & Policy 54: 254–
262.
Overview: Judd et al. (2015) discussed the various definitions and conceptual framings of cumulative effects
assessments and proposed an assessment framework based on the principles of environmental risk
assessment. This risk-based approach involves screening the pathways according to their likelihood of
exposure.
Key insights: Methods based on spatial analysis or the mapping of cumulative pressures can help with the
formulation of the problem, but they are not in themselves comprehensive cumulative effects assessments.
The output of CE assessments should include the identification and evaluation of management options to
address cumulative risks.
Reference: Clarke Murray, C., Mach, M.E., & Martone, R.G. 2014. Cumulative effects in marine
ecosystems: scientific perspectives on its challenges and solutions. WWF-Canada and Center for
Ocean Solutions. 60 pp.
Purpose: This review of the state-of-the-art knowledge and practice of cumulative effects assessment and
management in marine ecosystems explores common challenges in cumulative effects assessment and
discusses the models and tools developed to conduct this type of assessments.
Key insights: The authors distinguish between models, which are specialized and more science-focused,
and tools, which are designed for a broader audience and generally applied to management decisions. Both
are used to estimate changes in ecosystems based on known relationships between stressors and
components. Depending on the main function they provide, Clarke Murray et al. (2014) distinguish among
three categories of models and tools: i) visualization, including pathways of effects and spatial analysis
methods; ii) assessment, as used to evaluate how stressors affect the valued components (e.g., oil spill
models, ecological models, simulation tools, etc.); and iii) management tools and models, including tools
that enable the assessment of alternative scenarios (e.g., EcoPath with Ecosim, MIMES, InVEST, etc.).
Pervasive uncertainty and dynamic baselines are two of the main challenges in cumulative effects
assessment. All assessments involve uncertainty, especially in terms of how stressors interact with each
other (e.g., synergistic effects) and in distinguishing the relative contribution of stressors/activities to the
impacts on receptors. There is a need for more research and systematic analyses at multiple scales to
reduce or quantify this uncertainty.
Setting the baseline according to current conditions is also problematic since it can lead to measuring change
against an already degraded system. Clarke Murray et al. (2014) suggest eliciting traditional and local
knowledge to define the pre-development or reference state of the ecosystem.
Appendix C
ESSA Technologies Ltd.
1 4 8 | P a g e
Reference: Center for Ocean Solutions. 2011. Decision Guide: Selecting Decision Support Tools for
Marine Spatial Planning. The Woods Institute for the Environment, Stanford University, California
Overview: This report is a decision guide to help in the selection of spatially explicit decision-support tools
for marine planning. The guide is the result of a series of workshops by the Center for Ocean Solutions and
presents a selection of available marine planning spatial decision support tools.
Key insights: The guide describes 9 decision support tools which can support marine planning. The tools
are classified based on their functions as they relate to the cycle of marine spatial planning (e.g., mapping
and visualization, alternative scenario development and analysis, stakeholder participation, adaptive
management and assessment, etc.). The authors argue that better accessibility for these tools is needed to
promote their use in marine planning and assessment processes.
Some of these tools can support the assessment of cumulative effects. One of the tools discussed is the
Cumulative Impacts model; a tool developed by the National Center for Ecological Analysis and Synthesis
(NCEAS) which uses spatial data and weighted expert opinion to predict cumulative impact scores across a
region.
Reference: Greig, L., C. Wedeles and S. Beukema. 2013. Evaluation of Tools Available for Cumulative
Effects Assessment for the Northwest Territories – Literature Reviews: Models and Management.
Prepared for Government of the Northwest Territories, Department of Environment and Natural
Resources Wildlife Research and Management, Wildlife Division. 101 pp.
Description: This review evaluates 12 models for the assessment of cumulative effects to caribou herds in
the Northwestern Territories (Canada). The models were reviewed against nine questions, including
considerations such as data needs, ease of use, interpretation of results, etc. Greig et al. (2013) also provide
a comprehensive literature review of the variety of factors contributing to cumulative effects on the four
caribou ecotypes in the NWT.
Key insights: Model selection is linked to the management questions that the cumulative study seeks to
answer. The best strategy to address questions related to cumulative effects on caribou in the NWT is a
multi-tool/model approach that combines as necessary the best elements of models appropriate to a specific
question.
Reference: IFC (International Finance Corporation). 2013. Good Practice Handbook Cumulative
Impact Assessment and Management: Guidance for the Private Sector in Emerging Markets
Description: This guidebook proposes a six-step approach for conducting cumulative effects assessments
according to best practice in developing countries. The guide is not exhaustive and acknowledges that CEA
is an evolving field. Rather than prescriptive, the authors describe each step and provide case studies,
literature and resources to help users with the implementation of their studies.
Key insights: According to this guide, assessment of cumulative impacts involves predicting the future
state of the valued components as a result of the impacts from current, past and reasonably foreseen future
developments. This assessment requires understanding the thresholds of the valued components; limits in
their condition beyond which impacts can compromise the sustainability or survival of the components. In
terms of types of assessment approaches, the authors identify four distinct groups: impact models,
numerical models, spatial analysis using geographical information systems (GIS), and indicator-based
approaches.
Appendix C
Evaluation of Cumulative Effects Assessment Methodologies for Marine Shipping
Final Report
1 4 9 | P a g e
Reference: Canter L.W. 2008. Conceptual Models, Matrices, Networks, and Adaptive Management –
Emerging Methods for CEA. Presented at Assessing and Managing Cumulative Environmental
Effects, Special Topic Meeting, International Association for Impact Assessment, November 6-9,
2008, Calgary, Alberta, Canada.
Overview: Canter (2008) discusses four types of methods (i.e., conceptual models, modified matrices,
networks and adaptive management) that can assist with cumulative effects assessment (CEA). The author
argues for the use of these methods as part of the CEA process and describes case studies in which these
approaches have been used and the lessons learned from these examples.
Key insights: The author distinguishes two broad categories of CEA methods according to their main
purpose: identification and prediction methods. Identification methods are useful for scoping VCs, setting
spatial and temporal boundaries, selecting VC-related indicators, and in communicating the results of the
assessment. Prediction methods are critical to actually assessing the effects and determining their
significance. The outcomes of these two processes (i.e., identification and prediction) can be integrated
within a decision-making framework. A typical CEA study requires the selection of one or more methods to
meet the study needs.
Reference: Council on Environmental Quality, “Considering Cumulative Effects under the National
Environmental Policy Act”, January 1997, Executive Office of the President, Washington, D.C., pp.
49-57
Overview: This guide discusses cumulative effects assessment under the United States National
Environmental Policy Act. This reference provides guidance on how to conduct cumulative effects
assessment, from scoping, describing the affected environment, and determining the consequences of the
effects.
Key insights: One of the sections of the guide discusses the methods, tools and techniques used for
cumulative effects analysis. The authors group the methods into three functional groups: those that describe
the cause-effect relationships between stressors and components (e.g., matrices, flow diagrams); those that
analyze the trends in resources or stressors over time; and those that overlay landscape features to identify
sensitive areas, distribution of components or features, etc.
Appendix C
ESSA Technologies Ltd.
1 5 0 | P a g e
Appendix C: Additional Insights from the
Technical Workshop This section captures additional detailed feedback and comments shared by some participants after the
Technical Workshop hosted by Transport Canada on 20-21 February 2019 in Ottawa. These additional insights
complement the review presented in this report and can inform next steps of the initiative.
Challenges for Marine Cumulative Effects Assessment and a Potential
Framework
Mike Elliott – Professor at the Institute of Estuarine and Coastal Studies (IECS), University of Hull, Hull, UK
Roland Cormier – Institute for Coastal Research, Helmholtz-Zentrum Geesthacht, Centre for Materials and
Coastal Research (HZG), Germany
Challenges
The biggest challenges, and perhaps the greatest drawback with current methods, are a set of 10 aspects –
as a checklist will the chosen CEA cope with these:
1. Increasing our poor ability to measure the spatial and temporal effects-footprints of pressures from
named activities
2. Determining the extent, duration and frequency of the pressures from an activity, not just the activity
itself in a place at a given time (not assuming an activity = a pressure)
3. Determining the relative effects of endogenic managed pressures overlaid by exogenic unmanaged
ones
4. Giving a weighting to the different effects-footprints in space and time, not just assuming they are
added linearly and arithmetically (may be antagonistic or even exponential)
5. Knowing what is in an area, what activities, what receptors or relevance (at which area, when)
6. Tackling the effects-footprints on the mobile receptors (mostly species) not just the sedentary ones
(habitats and species)
7. Accepting the assumption that CEA relates to ‘all impacts of all activities’ not just ‘all impacts of one
activity/sector’ (the latter is just an EIA carried out properly – if we say ‘a CEA or offshore wind’ then
this is a misnomer)
8. Determining if there is a tipping point or threshold when all impacts are taken together and effects-
footprints overlap
9. Moving from an impact on the natural receptors to those on the human receptors (thus moving along
the continuum from ecosystem structure and functioning, to ecosystem services, to societal goods and
benefits)
10. Tackling the conceptual difficulties in the continuum from EIA to CEA to SEA
Appendix C
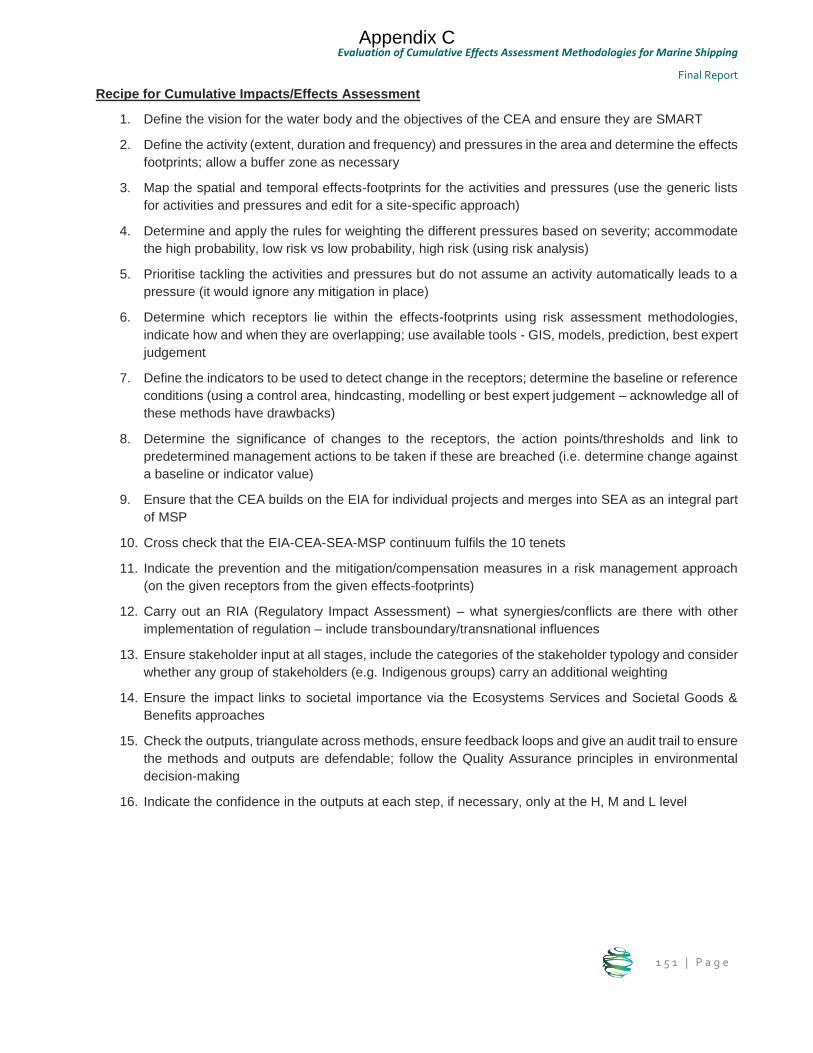
Evaluation of Cumulative Effects Assessment Methodologies for Marine Shipping
Final Report
1 5 1 | P a g e
Recipe for Cumulative Impacts/Effects Assessment
1. Define the vision for the water body and the objectives of the CEA and ensure they are SMART
2. Define the activity (extent, duration and frequency) and pressures in the area and determine the effects
footprints; allow a buffer zone as necessary
3. Map the spatial and temporal effects-footprints for the activities and pressures (use the generic lists
for activities and pressures and edit for a site-specific approach)
4. Determine and apply the rules for weighting the different pressures based on severity; accommodate
the high probability, low risk vs low probability, high risk (using risk analysis)
5. Prioritise tackling the activities and pressures but do not assume an activity automatically leads to a
pressure (it would ignore any mitigation in place)
6. Determine which receptors lie within the effects-footprints using risk assessment methodologies,
indicate how and when they are overlapping; use available tools - GIS, models, prediction, best expert
judgement
7. Define the indicators to be used to detect change in the receptors; determine the baseline or reference
conditions (using a control area, hindcasting, modelling or best expert judgement – acknowledge all of
these methods have drawbacks)
8. Determine the significance of changes to the receptors, the action points/thresholds and link to
predetermined management actions to be taken if these are breached (i.e. determine change against
a baseline or indicator value)
9. Ensure that the CEA builds on the EIA for individual projects and merges into SEA as an integral part
of MSP
10. Cross check that the EIA-CEA-SEA-MSP continuum fulfils the 10 tenets
11. Indicate the prevention and the mitigation/compensation measures in a risk management approach
(on the given receptors from the given effects-footprints)
12. Carry out an RIA (Regulatory Impact Assessment) – what synergies/conflicts are there with other
implementation of regulation – include transboundary/transnational influences
13. Ensure stakeholder input at all stages, include the categories of the stakeholder typology and consider
whether any group of stakeholders (e.g. Indigenous groups) carry an additional weighting
14. Ensure the impact links to societal importance via the Ecosystems Services and Societal Goods &
Benefits approaches
15. Check the outputs, triangulate across methods, ensure feedback loops and give an audit trail to ensure
the methods and outputs are defendable; follow the Quality Assurance principles in environmental
decision-making
16. Indicate the confidence in the outputs at each step, if necessary, only at the H, M and L level
Appendix C
ESSA Technologies Ltd.
1 5 2 | P a g e
Considerations for a National Framework on Cumulative Effects of Marine
Shipping
Edward Gregr – Nuu-chah-nulth Nation
Structure of the National Framework
1. I recommend adoption of a tiered approach similar to that used by the InVEST tool (and also,
apparently adopted by MaPP for the Skeena assessment). This is critical for a number of reasons
including:
a. Getting to the end is critical, at a "Tier 1" level, there is a chance of getting to the end. In my
experience, "frameworks" are notoriously difficult to operationalize because of unforeseen
complications. Working thru a high-level overview will help avoid getting caught in the details
at any particular step.
b. Iteration in any modelling effort is really useful to understanding the methods and results, and
to communicating same to partners. It is important because the overall assessment will often
be only as good as its weakest piece. By iterating, a Tier 1 assessment can then be used to
prioritize data gaps and determine where there might be enough information (it is tempting but
distracting and unnecessary to work on what is tractable instead of facing the harder questions
head on).
c. By helping ensure a more even analysis (i.e., one that has a similar level of complexity/detail
across all components), or by identifying a minimum necessary complexity, it will be easier to
understand and present the uncertainties associated with the analysis. This will be critical, in
my view, to developing a credible CEA.
2. I recommend a more thorough consideration of adaptive management. My understanding is that this
is fundamentally how traditional knowledge is developed (i.e., Berkes et al. 2000), and will thus likely
generate the most buy-in from community groups. You will likely need to distinguish the true Adaptive
Management methodology (see e.g., Williams & Brown 2016 for a recent review) from the co-option
of the term to describe an approach to mitigation used by proponents of development projects.
There are a variety of frameworks (e.g., re adapting to a changing climate, Tanner-McAllister 2017)
and efforts to addressing inequalities (e.g., Specht et al. 2019) that you could mine to build a pretty
solid bridge between the 'Newtonian' science perspective and the more holistic FN view on cumulative
impacts.
3. The framework will need to address how benefits to people are impacted, not just the things that
produce the benefits (the ecosystem service literature distinguishes between services to people, and
the underlying ecosystem service providers). Natural scientists tend to give this part of the analysis a
wide berth, because it involves messy questions around values and prioritization of benefits. I realize
this is verging towards risk assessment, but it will not be enough, in my view, to stop at impacts on
'things'. Because this is hard and depends on local context, I would recommend co-developing this
piece regionally, with impacted communities, but providing space for it in the National Framework.
4. Technically, I would suggest you consider the differences in interpretation of raster vs. vector
representations of the various analyses and results. Many of the tools in your toolbox are raster-based.
This makes sense technically, as it facilitates data processing. However, people will want to see how
Appendix C
Evaluation of Cumulative Effects Assessment Methodologies for Marine Shipping
Final Report
1 5 3 | P a g e
their local areas of interest are impacted. And if these areas are described by grid cells that are 2
kilometers in size, it will cause confusion and raise questions, particularly for coastal areas.
Polygons and points seem to be the primary method whereby FNs are collecting their local ecological
data. I would strongly suggest that any analysis - even if conducted in raster space - be translated and
presented in vector space (points and polygons) for ease of communication and understanding.
Collection and representation of Indigenous Knowledge
There was a general feeling among the FN representatives in the room that the Framework will need to be
bolstered with rigorous social science methods (which may include qualitative, quantitative or participatory
methods) to support FN/community perspectives on social and ecological impacts.
In the interests of efficiency and effectiveness, I would recommend contracting the services of a social scientist
with demonstrated expertise in this area to do the necessary literature review. Dr. Nathan Bennett is a
colleague from UBC who may be willing to write a companion report/section from a social science perspective.
Nathan is a marine conservation social scientist who has been thinking a lot in recent years about the
measurement and management of the types of social impacts that were discussed at the meeting (e.g., access
to resources, social benefits from marine systems, etc.). Examples of Nathan’s work includes Bennett (2019),
Bennett et al. 2018, and Kaplan-Hallam et al. (2017).
General challenges and comments
Baselines and reference points
I suspect the regional CEAs will have trouble settling on values for baselines and reference points. While I
understand why TC is focused on shipping, the fact remains that shipping typically takes place in already
heavily impacted seascapes is inescapable.
While it is reasonable from TC's perspective to begin by estimating the effects of stressors related to shipping
in isolation, the question of what baseline cumulative effects will be assessed against is likely to be contentious.
Consider how people may react to additional stress applied to killer whale or herring populations in BC. Or to
the cumulative effect of ice-breaking and ice loss due to climate change in the Arctic. People are unlikely to be
happy if the effects of shipping are considered in isolation.
It may be worthwhile for the National Framework to provide some guidance here instead of punting it all to
the regions. Some form of co-development is the only way forward I can see for baselines and thresholds.
TC needs to ask itself if there is space here to say 'no more'? This may lead to questions about whether
shipping in heavily impacted areas might be prioritized? (e.g., you could run a lot more ships through the
Strait of Georgia if they were all quieter; or Canada could choose to restrict shipments of say, US coal to
Asia, making space for traffic that is more in line with Canada's national interest
Modelling methods
One of the key challenges here will again be the clash between the Newtonian view of a world that can be
decomposed and analysed, and the common FN perspective that all things are connected.
The typical 'Western' approach to CEA and other types of models is to take systems apart to examine and
understand the components, and then re-assemble them in a model of the system of interest. By definition,
building a model means including only those pieces thought to be the 'most important'.
Appendix C
ESSA Technologies Ltd.
1 5 4 | P a g e
My sense is that while FNs may have come to terms with the taking apart activity, they are much less
comfortable with the re-assembly of things in a way that is both conceptually and analytically incomplete.
The most common questions I hear at review meetings, especially from FNs, begin with "What about ... ".
The CEA framework will need to address the question of sufficiency. The degree to which the assessments
are co-developed with impacted communities will be a key determinant of both this sufficiency and the
subsequent relevance of the results
References
Bennett NJ. Marine Social Science for the Peopled Seas. Coastal Management. 2019 Jan 21:1-9.
Bennett NJ, Kaplan-Hallam M, Augustine G, Ban N, Belhabib D, Brueckner-Irwin I, Charles A,
Couture J, Eger S, Fanning L, Foley P. Coastal and Indigenous community access to marine
resources and the ocean: a policy imperative for Canada. Marine Policy. 2018 Jan 1; 87:186-93.
Kaplan‐Hallam M, Bennett NJ. Adaptive social impact management for conservation and
environmental management. Conservation Biology. 2018 Apr;32(2):304-14.
Specht MJ, Santos BA, Marshall N, Melo FP, Leal IR, Tabarelli M, Baldauf C. Socioeconomic
differences among resident, users and neighbour populations of a protected area in the
Brazilian dry forest. Journal of environmental management. 2019 Feb 15; 232:607-14.
Tanner-McAllister SL, Rhodes J, Hockings M. Managing for climate change on protected areas: An
adaptive management decision making framework. Journal of environmental management.
2017 Dec 15; 204:510-8.
Williams BK, Brown ED. Technical challenges in the application of adaptive management. Biological
Conservation. 2016 Mar 1;1 95:255-63.
Appendix C
Evaluation of Cumulative Effects Assessment Methodologies for Marine Shipping
Final Report
1 5 5 | P a g e
Governance Considerations for a Regional Cumulative Effects
Framework
To understand the context from which methods are selected, the following references provide guidance to
Indigenous, federal, and provincial governments on establishing more collaborative, shared, or
joint governance arrangements to set terms of engagement around a regional cumulative effects assessment
for shipping:
Tsleil Watuth EA Report, using UVic’s Indigenous law methodology (Val Napolean’s group) to develop appropriate framework from which to develop criteria for assessment, then used secondary sources and TK to collate data for assessment. https://twnsacredtrust.ca/assessment-report-download/
Overview of the Indigenous-led EA model – report from the Gwich’in Council on Impact Assessment in the Arctic – Emerging Practices of Indigenous-Led Review: https://gwichincouncil.com/sites/default/files/Firelight%20Gwich%27in%20Indigenous%20led%20review_FINAL_web_0.pdf
Any long-term, established G2G approach is the likely preferred collaborative approach in this context, given that when any new governance arrangement is established for a project, it takes a very long time and lots of resources to develop and implement.
BC EAO is emerging with collaborative EAs, but these are very new (e.g. Taku River Tlingit Shared Decision-Making agreement with BC on EAs (attached, you can download it online).
Canada’s new IA legislation, now in Senate, creates option for agreements with other governments, including Indigenous and Provincial governments, to establish a collaborative EAs process. Similarly, Canada has established a new Indigenous Advisory Committee, but focused on project-specific EA https://www.canada.ca/en/environmental-assessment-agency/advisory/advisory-groups/Indigenous-advisory-committee.html and the workshop participants were more interested in seeing longer-term, regional cumulative assessment that would inform project-specific CEAs.
MVEIRB, NIRB, YESAB, and James Bay Cree, etc. are established through modern treaties and create long-standing EA co-management boards and some? Have parallel cumulative effects programs (e.g. https://www.enr.gov.nt.ca/en/services/cumulative-impact-monitoring-program-cimp)
Appendix C
ESSA Technologies Ltd.
1 5 6 | P a g e
Appendix D: Technical Workshop (February 20-
21, 2019) Backgrounder
Introduction
As part of the national Oceans Protection Plan, Transport Canada is currently leading the Cumulative Effects
of Marine Shipping (CEMS) initiative with the goal of developing a Cumulative Effects Assessment Framework
focused on current and potential marine vessel activity. This initiative, which is being implemented through a
collaborative process with Indigenous peoples, local stakeholders, and coastal communities in six pilot sites14
covering all three of Canada’s coasts, involves the following phases:
Phase 1 (2017-2018) Understand the National Context: The first year of the initiative involved scoping
the concerns related to marine vessel activities as well as identifying the stressors1 of concern for
each pilot site.
Phase 2 (2018-2020) Understand the Regional Context: This ongoing phase includes the selection of
valued components2 (VCs) for each site and the identification of the linkages between stressors and
VCs (i.e., pathways of effect). It also involves the collection of existing regional data and the
identification of the preferred methodology for cumulative effects assessment.
Phase 3 (2020-2021) Conduct the Regional Assessments: The selected assessment methodology will
be implemented in the six pilot sites. The Cumulative Effects Assessment Framework, which
encompasses this assessment, will be finalized based on these pilot experiences.
Phase 4 (2021-2022) Identify actions needed: Based on the results of implementing the Cumulative
Effects Assessment Framework, regional management strategies and actions and tools to mitigate the
potential effects of marine shipping will be identified.
The purpose of this evaluation process was to evaluate and compare potential assessment methodologies
relevant for the assessment of cumulative effects3 associated to marine shipping (Phase 2). This workshop
backgrounder provides a summary of the evaluation. Detailed information and discussion can be found in the
full report which includes eight sections and two appendices:
Section 1 provides important background context which clarifies the nature of this report.
Section 2 describes our approach to completing the evaluation.
Section 3 describes the screening phase of our evaluation.
Section 4 provides the detailed evaluation, including a description of possible methods and associated
tools and an evaluation of their relevance, rigour, and feasibility.
14 Northern, British Columbia; Southern, British Columbia; St. Lawrence River, Quebec; Bay of Fundy, New Brunswick; Placentia Bay,
Newfoundland; Cambridge Bay, Nunavut
Appendix C
Evaluation of Cumulative Effects Assessment Methodologies for Marine Shipping
Final Report
1 5 7 | P a g e
Section 5 presents a comparative analysis across methods and introduces a number of case studies
that illustrate the application of these methods and how they could be used in the context of the
Cumulative Effects of Marine Shipping initiative.
Section 6 discusses supporting methods frequently applied in CEA, including: Indigenous knowledge,
expert elicitation and decision support tools.
Section 7 introduces examples of CEA frameworks and how the assessment step fits into the broader
context.
Section 8 provides overall conclusions, including insights from the evaluation, how to use the
assessment toolkit, and next steps for the CEMS.
Appendix A describes additional context that has informed our evaluation. In particular, we provide a
brief summary of the: status of marine shipping pathways of effects model development, regional
context in the pilot sites, and data availability.
Appendix B provides a summary of key review papers on cumulative effects assessment methods and
tools.
What is cumulative effects assessment?
The Canadian Council of Ministers of the Environment (CCME) defines cumulative effects assessment (CEA)
as the systematic process of identifying, analyzing, and evaluating cumulative effects. Ideally, CEA involves a
series of methods that assess the condition of the environment, describe the causal pathways that link
stressors and cumulative effects, and predict the risks and benefits associated with alternative scenarios
(Jones 2016). Although there is consensus on the general steps of the CEA process (Jones 2016), there is
debate in terms of the methods that should be used at each of these stages (Jones 2016, Stelzenmüller et al.
2018). It is important to understand the structure of the overall cumulative effects framework within which the
method will be applied (Greig et al. 2013). In other words, what is the scope of the assessment and what
management strategies are being informed by the outcome of the assessment?
We created a diagram that displays important elements in a CEA framework in order to show our understanding
of how the assessment step supports the broader framework in the context of the Transport Canada led CEMS
initiative. While there is a natural sequence to the generic CEA framework described in Figure D.1.,
implementation in practice is iterative.
Appendix C
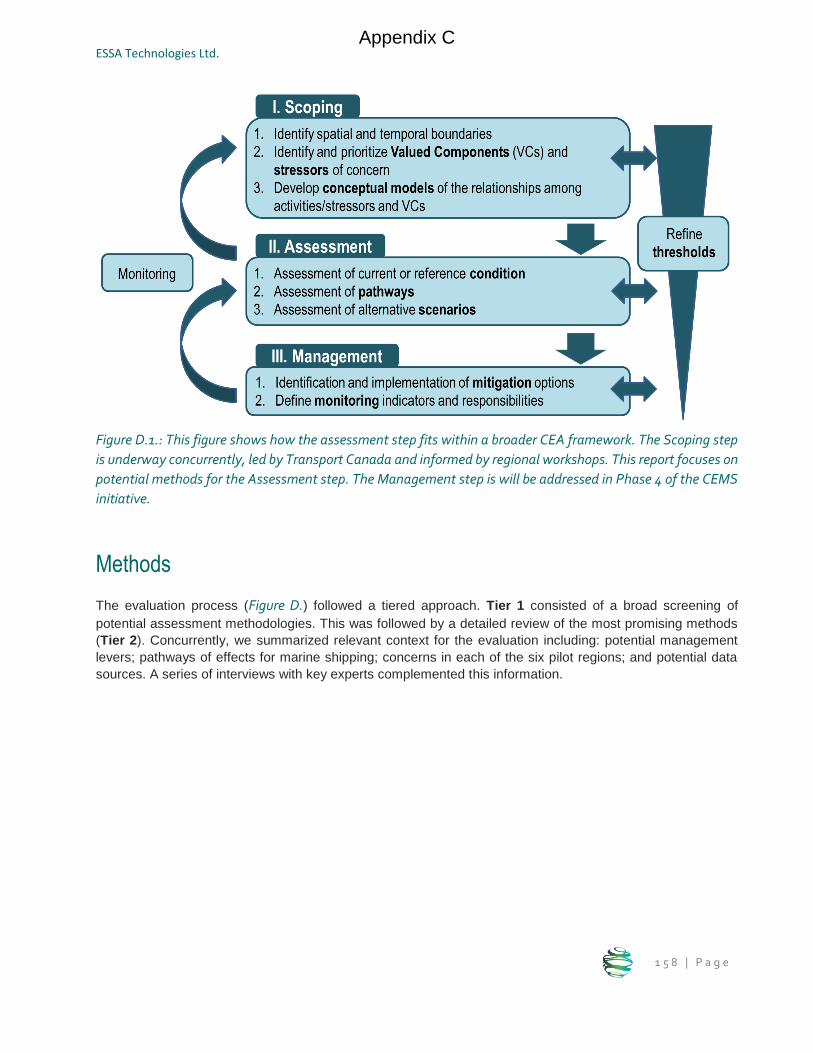
ESSA Technologies Ltd.
1 5 8 | P a g e
Figure D.1.: This figure shows how the assessment step fits within a broader CEA framework. The Scoping step
is underway concurrently, led by Transport Canada and informed by regional workshops. This report focuses on
potential methods for the Assessment step. The Management step is will be addressed in Phase 4 of the CEMS
initiative.
Methods
The evaluation process (Figure D.) followed a tiered approach. Tier 1 consisted of a broad screening of
potential assessment methodologies. This was followed by a detailed review of the most promising methods
(Tier 2). Concurrently, we summarized relevant context for the evaluation including: potential management
levers; pathways of effects for marine shipping; concerns in each of the six pilot regions; and potential data
sources. A series of interviews with key experts complemented this information.
Appendix C
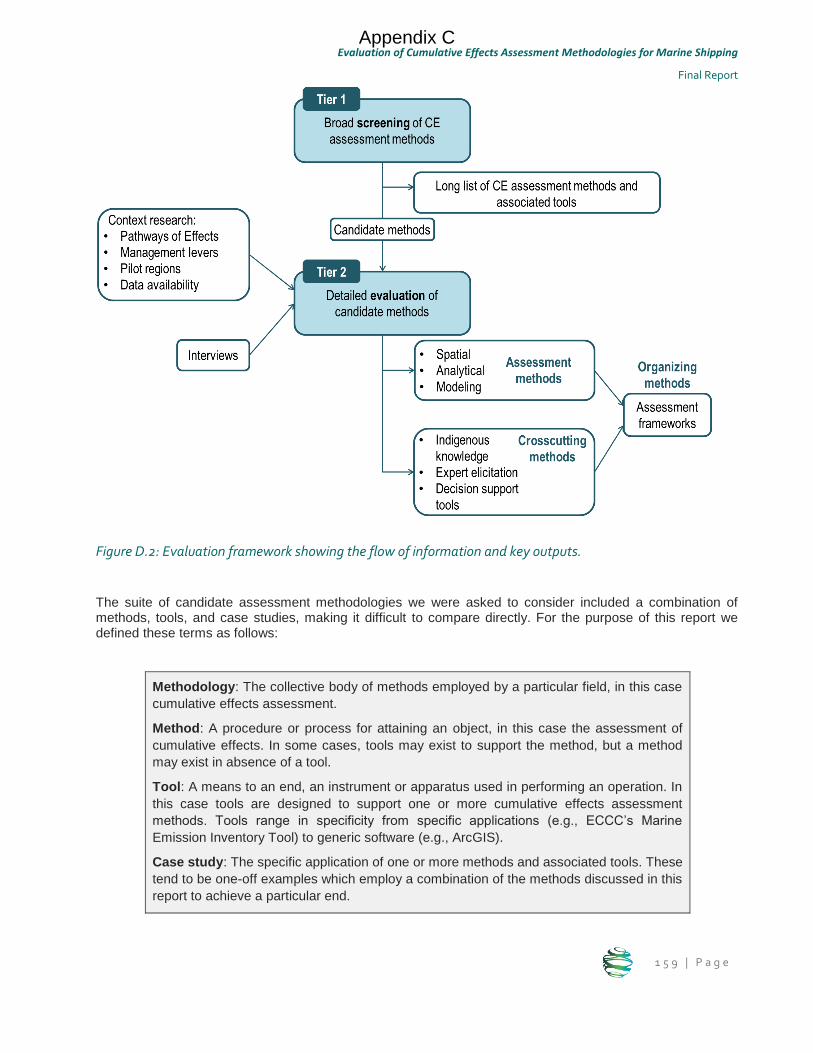
Evaluation of Cumulative Effects Assessment Methodologies for Marine Shipping
Final Report
1 5 9 | P a g e
Figure D.2: Evaluation framework showing the flow of information and key outputs.
The suite of candidate assessment methodologies we were asked to consider included a combination of methods, tools, and case studies, making it difficult to compare directly. For the purpose of this report we defined these terms as follows:
Methodology: The collective body of methods employed by a particular field, in this case
cumulative effects assessment.
Method: A procedure or process for attaining an object, in this case the assessment of
cumulative effects. In some cases, tools may exist to support the method, but a method
may exist in absence of a tool.
Tool: A means to an end, an instrument or apparatus used in performing an operation. In
this case tools are designed to support one or more cumulative effects assessment
methods. Tools range in specificity from specific applications (e.g., ECCC’s Marine
Emission Inventory Tool) to generic software (e.g., ArcGIS).
Case study: The specific application of one or more methods and associated tools. These
tend to be one-off examples which employ a combination of the methods discussed in this
report to achieve a particular end.
Appendix C
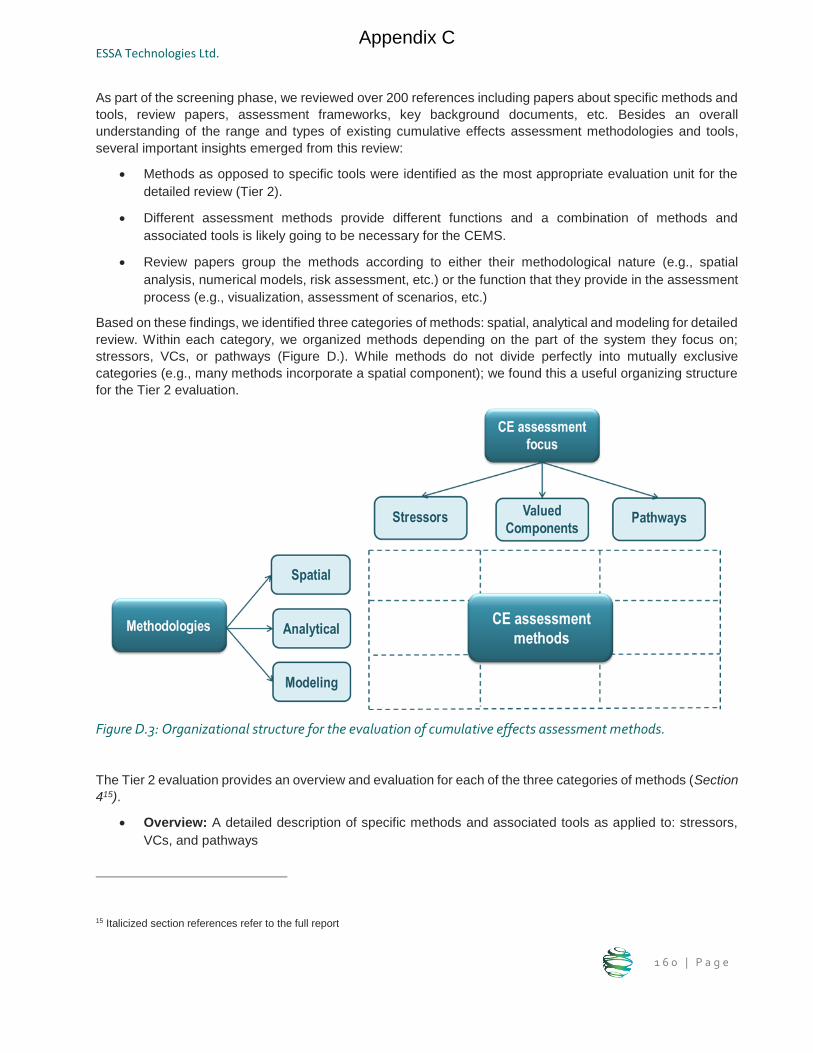
ESSA Technologies Ltd.
1 6 0 | P a g e
As part of the screening phase, we reviewed over 200 references including papers about specific methods and
tools, review papers, assessment frameworks, key background documents, etc. Besides an overall
understanding of the range and types of existing cumulative effects assessment methodologies and tools,
several important insights emerged from this review:
Methods as opposed to specific tools were identified as the most appropriate evaluation unit for the
detailed review (Tier 2).
Different assessment methods provide different functions and a combination of methods and
associated tools is likely going to be necessary for the CEMS.
Review papers group the methods according to either their methodological nature (e.g., spatial
analysis, numerical models, risk assessment, etc.) or the function that they provide in the assessment
process (e.g., visualization, assessment of scenarios, etc.)
Based on these findings, we identified three categories of methods: spatial, analytical and modeling for detailed
review. Within each category, we organized methods depending on the part of the system they focus on;
stressors, VCs, or pathways (Figure D.). While methods do not divide perfectly into mutually exclusive
categories (e.g., many methods incorporate a spatial component); we found this a useful organizing structure
for the Tier 2 evaluation.
Figure D.3: Organizational structure for the evaluation of cumulative effects assessment methods.
The Tier 2 evaluation provides an overview and evaluation for each of the three categories of methods (Section
415).
Overview: A detailed description of specific methods and associated tools as applied to: stressors,
VCs, and pathways
15 Italicized section references refer to the full report
Appendix C
Evaluation of Cumulative Effects Assessment Methodologies for Marine Shipping
Final Report
1 6 1 | P a g e
Evaluation: An evaluation of the methodologies against a fixed set of criteria. These criteria inform
about attributes of the methods which are especially important in selecting an approach: the relevance
of the method in relation to the CEMS initiative; the rigour of the approach in terms of how well
established it is in CE practice, the level of information supporting the assessment and the treatment
of uncertainty; and its feasibility as a general estimation of how easy it would be to implement the
assessment approach.
In order to help determine which methods might be appropriate under different scenarios, the Tier 2 evaluation
also:
Provides a qualitative ranking (high, medium, low) for each of the methods x criteria (Section 5.2).
Documents the generic application of the methods, provides hypothetical examples of their use under
the CEMS initiative and identifies specific methods and tools relevant for each method category
(Section 5.3).
Describes 30 cases studies (Section 5.4) that illustrate the application of the assessment methods in
a context relevant for Transport Canada. In general, the case studies use more than one method or
tool in combination to achieve their study objectives. These case studies are not included in this
workshop backgrounder.
Detailed evaluation of candidate methods
Spatial methods
Overview
Spatial methods to assessing cumulative effects involve identifying the locations of stressors and VCs to
understand how VCs are being exposed to stressors (i.e., geographical overlap) and the way that exposure
results in different levels of effect. Spatial approaches can entail simply mapping locations to understand where
there are different types of stressors and VCs as well as using characteristics about the stressors and VCs
along with analytical approaches or modeling to better understand the magnitudes of effect. In this way, spatial
approaches are not distinct from analytical and modeling methods but rather complementary.
The most relevant characteristics of spatial methods include the following:
Spatial methods are one of the most common approaches observed in our evaluation and are
expected to be a key method for the CEMS initiative.
Spatial assessments may be particularly useful during early iterations to refine scope (e.g., identify
geographical hotspots) and to identify information gaps.
Although there are many ways to collect spatial data, and many ways resulting spatial information can
be used, at the foundation of spatial approaches is a single conceptually simple method: Mapping
locations and characteristics of activities/stressors and VCs.
Inferences should not be made at spatial scales that are finer than the datasets allow.
Data related to activities/stressors are often easier to gather/collect than data related to VCs, which
can result in greater uncertainties for inferences related to VCs.
Appendix C
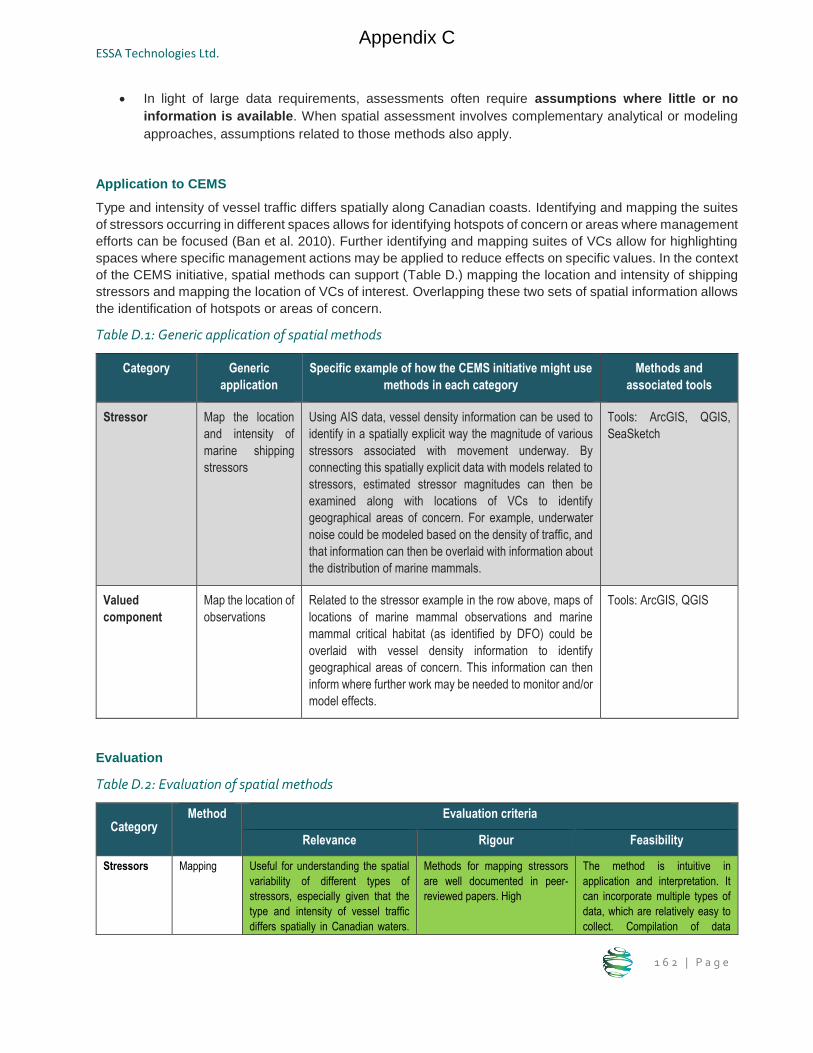
ESSA Technologies Ltd.
1 6 2 | P a g e
In light of large data requirements, assessments often require assumptions where little or no
information is available. When spatial assessment involves complementary analytical or modeling
approaches, assumptions related to those methods also apply.
Application to CEMS
Type and intensity of vessel traffic differs spatially along Canadian coasts. Identifying and mapping the suites
of stressors occurring in different spaces allows for identifying hotspots of concern or areas where management
efforts can be focused (Ban et al. 2010). Further identifying and mapping suites of VCs allow for highlighting
spaces where specific management actions may be applied to reduce effects on specific values. In the context
of the CEMS initiative, spatial methods can support (Table D.) mapping the location and intensity of shipping
stressors and mapping the location of VCs of interest. Overlapping these two sets of spatial information allows
the identification of hotspots or areas of concern.
Table D.1: Generic application of spatial methods
Category Generic
application
Specific example of how the CEMS initiative might use
methods in each category
Methods and
associated tools
Stressor Map the location
and intensity of
marine shipping
stressors
Using AIS data, vessel density information can be used to
identify in a spatially explicit way the magnitude of various
stressors associated with movement underway. By
connecting this spatially explicit data with models related to
stressors, estimated stressor magnitudes can then be
examined along with locations of VCs to identify
geographical areas of concern. For example, underwater
noise could be modeled based on the density of traffic, and
that information can then be overlaid with information about
the distribution of marine mammals.
Tools: ArcGIS, QGIS,
SeaSketch
Valued
component
Map the location of
observations
Related to the stressor example in the row above, maps of
locations of marine mammal observations and marine
mammal critical habitat (as identified by DFO) could be
overlaid with vessel density information to identify
geographical areas of concern. This information can then
inform where further work may be needed to monitor and/or
model effects.
Tools: ArcGIS, QGIS
Evaluation
Table D.2: Evaluation of spatial methods
Category Method Evaluation criteria
Relevance Rigour Feasibility
Stressors Mapping Useful for understanding the spatial
variability of different types of
stressors, especially given that the
type and intensity of vessel traffic
differs spatially in Canadian waters.
Methods for mapping stressors
are well documented in peer-
reviewed papers. High
The method is intuitive in
application and interpretation. It
can incorporate multiple types of
data, which are relatively easy to
collect. Compilation of data
Appendix C
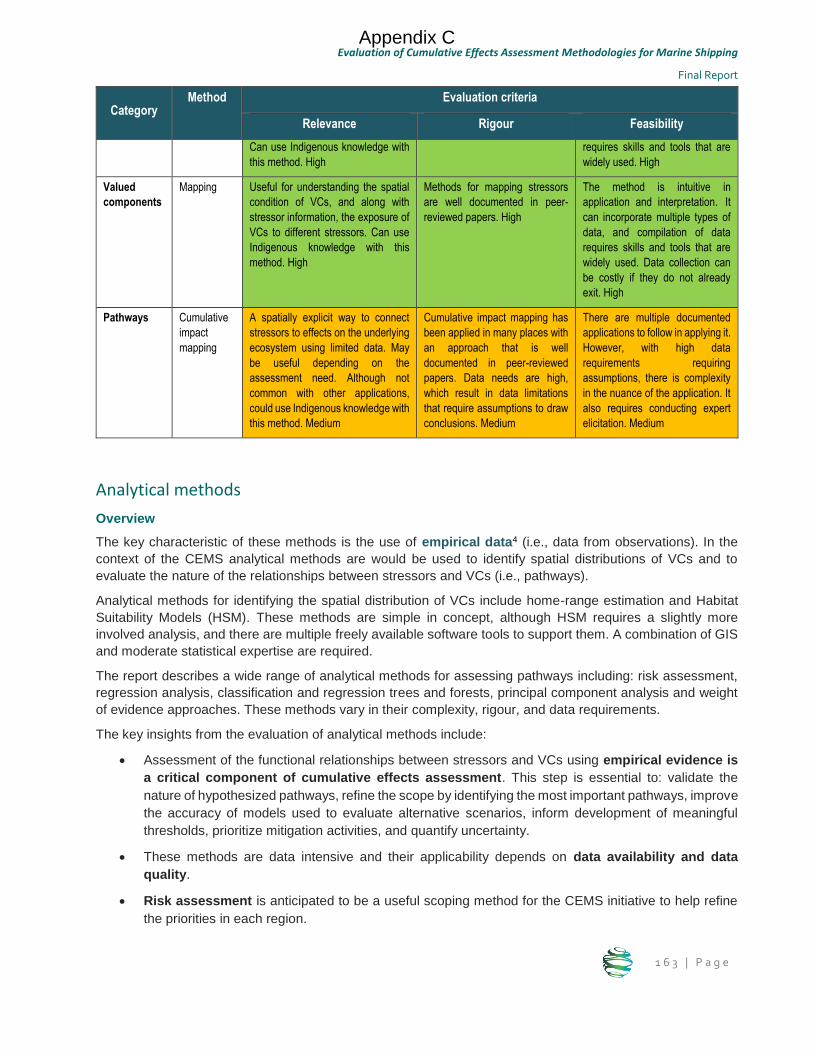
Evaluation of Cumulative Effects Assessment Methodologies for Marine Shipping
Final Report
1 6 3 | P a g e
Category Method Evaluation criteria
Relevance Rigour Feasibility
Can use Indigenous knowledge with
this method. High
requires skills and tools that are
widely used. High
Valued
components
Mapping Useful for understanding the spatial
condition of VCs, and along with
stressor information, the exposure of
VCs to different stressors. Can use
Indigenous knowledge with this
method. High
Methods for mapping stressors
are well documented in peer-
reviewed papers. High
The method is intuitive in
application and interpretation. It
can incorporate multiple types of
data, and compilation of data
requires skills and tools that are
widely used. Data collection can
be costly if they do not already
exit. High
Pathways Cumulative
impact
mapping
A spatially explicit way to connect
stressors to effects on the underlying
ecosystem using limited data. May
be useful depending on the
assessment need. Although not
common with other applications,
could use Indigenous knowledge with
this method. Medium
Cumulative impact mapping has
been applied in many places with
an approach that is well
documented in peer-reviewed
papers. Data needs are high,
which result in data limitations
that require assumptions to draw
conclusions. Medium
There are multiple documented
applications to follow in applying it.
However, with high data
requirements requiring
assumptions, there is complexity
in the nuance of the application. It
also requires conducting expert
elicitation. Medium
Analytical methods
Overview
The key characteristic of these methods is the use of empirical data4 (i.e., data from observations). In the
context of the CEMS analytical methods are would be used to identify spatial distributions of VCs and to
evaluate the nature of the relationships between stressors and VCs (i.e., pathways).
Analytical methods for identifying the spatial distribution of VCs include home-range estimation and Habitat
Suitability Models (HSM). These methods are simple in concept, although HSM requires a slightly more
involved analysis, and there are multiple freely available software tools to support them. A combination of GIS
and moderate statistical expertise are required.
The report describes a wide range of analytical methods for assessing pathways including: risk assessment,
regression analysis, classification and regression trees and forests, principal component analysis and weight
of evidence approaches. These methods vary in their complexity, rigour, and data requirements.
The key insights from the evaluation of analytical methods include:
Assessment of the functional relationships between stressors and VCs using empirical evidence is
a critical component of cumulative effects assessment. This step is essential to: validate the
nature of hypothesized pathways, refine the scope by identifying the most important pathways, improve
the accuracy of models used to evaluate alternative scenarios, inform development of meaningful
thresholds, prioritize mitigation activities, and quantify uncertainty.
These methods are data intensive and their applicability depends on data availability and data
quality.
Risk assessment is anticipated to be a useful scoping method for the CEMS initiative to help refine
the priorities in each region.
Appendix C
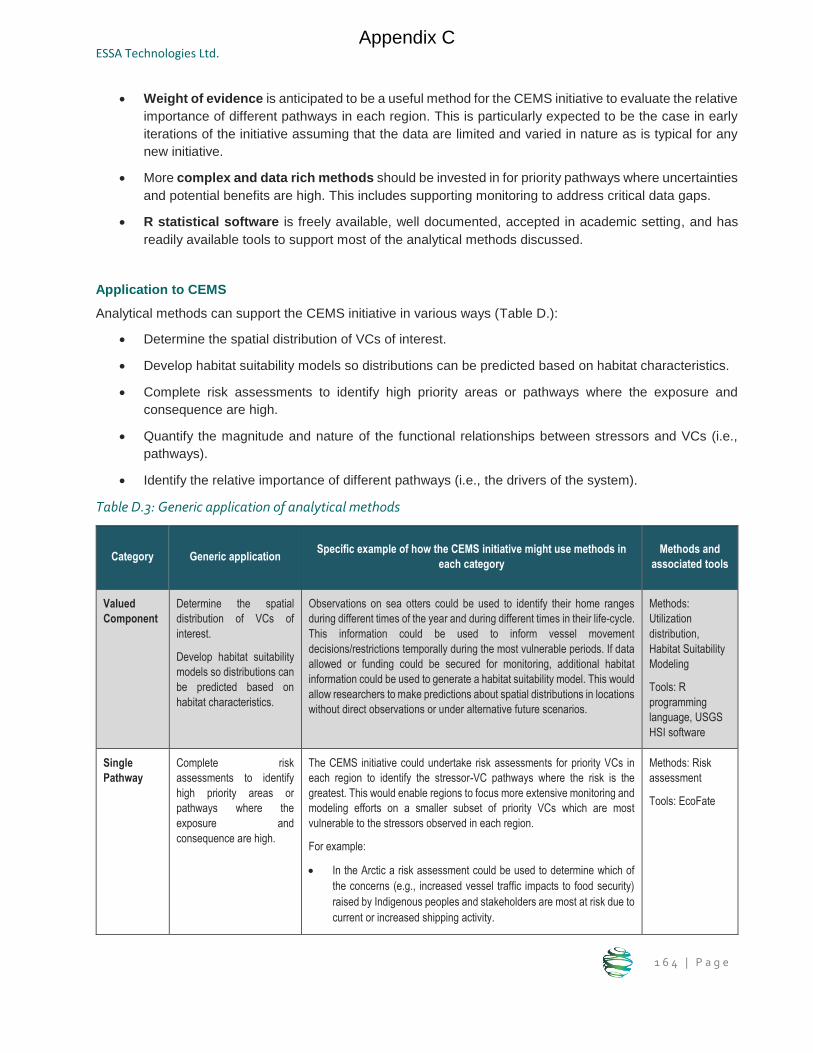
ESSA Technologies Ltd.
1 6 4 | P a g e
Weight of evidence is anticipated to be a useful method for the CEMS initiative to evaluate the relative
importance of different pathways in each region. This is particularly expected to be the case in early
iterations of the initiative assuming that the data are limited and varied in nature as is typical for any
new initiative.
More complex and data rich methods should be invested in for priority pathways where uncertainties
and potential benefits are high. This includes supporting monitoring to address critical data gaps.
R statistical software is freely available, well documented, accepted in academic setting, and has
readily available tools to support most of the analytical methods discussed.
Application to CEMS
Analytical methods can support the CEMS initiative in various ways (Table D.):
Determine the spatial distribution of VCs of interest.
Develop habitat suitability models so distributions can be predicted based on habitat characteristics.
Complete risk assessments to identify high priority areas or pathways where the exposure and
consequence are high.
Quantify the magnitude and nature of the functional relationships between stressors and VCs (i.e.,
pathways).
Identify the relative importance of different pathways (i.e., the drivers of the system).
Table D.3: Generic application of analytical methods
Category Generic application Specific example of how the CEMS initiative might use methods in
each category
Methods and
associated tools
Valued
Component
Determine the spatial
distribution of VCs of
interest.
Develop habitat suitability
models so distributions can
be predicted based on
habitat characteristics.
Observations on sea otters could be used to identify their home ranges
during different times of the year and during different times in their life-cycle.
This information could be used to inform vessel movement
decisions/restrictions temporally during the most vulnerable periods. If data
allowed or funding could be secured for monitoring, additional habitat
information could be used to generate a habitat suitability model. This would
allow researchers to make predictions about spatial distributions in locations
without direct observations or under alternative future scenarios.
Methods:
Utilization
distribution,
Habitat Suitability
Modeling
Tools: R
programming
language, USGS
HSI software
Single
Pathway
Complete risk
assessments to identify
high priority areas or
pathways where the
exposure and
consequence are high.
The CEMS initiative could undertake risk assessments for priority VCs in
each region to identify the stressor-VC pathways where the risk is the
greatest. This would enable regions to focus more extensive monitoring and
modeling efforts on a smaller subset of priority VCs which are most
vulnerable to the stressors observed in each region.
For example:
In the Arctic a risk assessment could be used to determine which of
the concerns (e.g., increased vessel traffic impacts to food security)
raised by Indigenous peoples and stakeholders are most at risk due to
current or increased shipping activity.
Methods: Risk
assessment
Tools: EcoFate
Appendix C
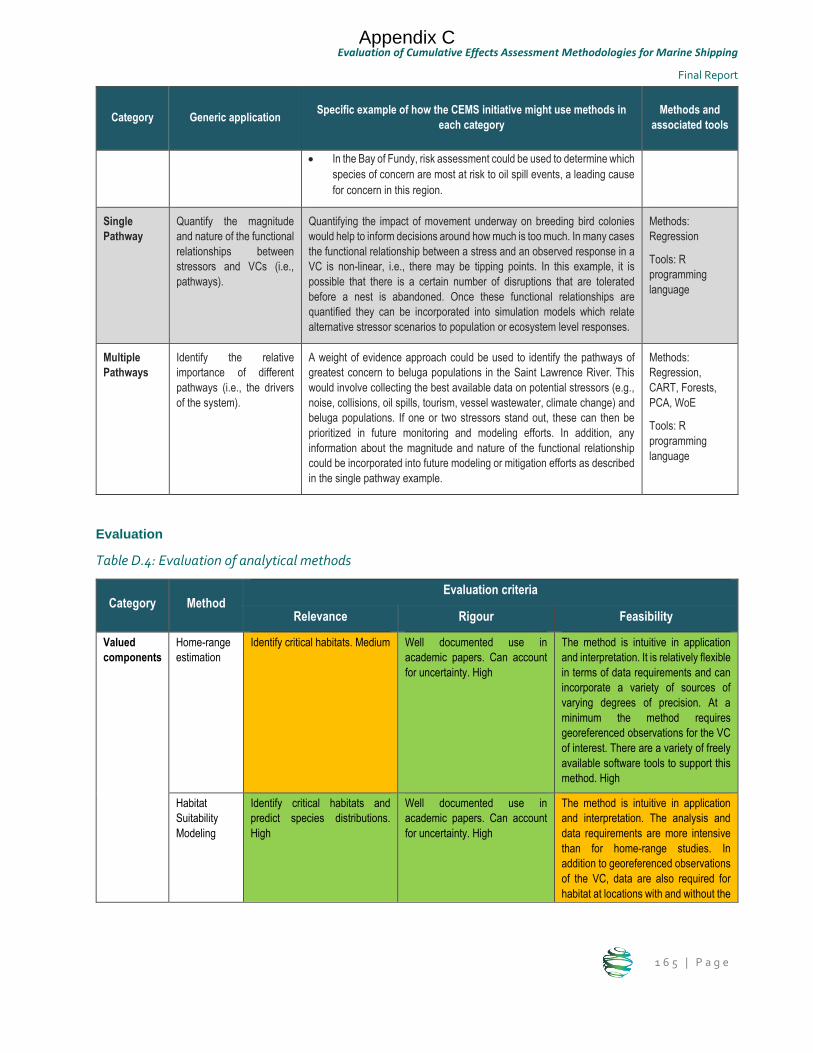
Evaluation of Cumulative Effects Assessment Methodologies for Marine Shipping
Final Report
1 6 5 | P a g e
Category Generic application Specific example of how the CEMS initiative might use methods in
each category
Methods and
associated tools
In the Bay of Fundy, risk assessment could be used to determine which
species of concern are most at risk to oil spill events, a leading cause
for concern in this region.
Single
Pathway
Quantify the magnitude
and nature of the functional
relationships between
stressors and VCs (i.e.,
pathways).
Quantifying the impact of movement underway on breeding bird colonies
would help to inform decisions around how much is too much. In many cases
the functional relationship between a stress and an observed response in a
VC is non-linear, i.e., there may be tipping points. In this example, it is
possible that there is a certain number of disruptions that are tolerated
before a nest is abandoned. Once these functional relationships are
quantified they can be incorporated into simulation models which relate
alternative stressor scenarios to population or ecosystem level responses.
Methods:
Regression
Tools: R
programming
language
Multiple
Pathways
Identify the relative
importance of different
pathways (i.e., the drivers
of the system).
A weight of evidence approach could be used to identify the pathways of
greatest concern to beluga populations in the Saint Lawrence River. This
would involve collecting the best available data on potential stressors (e.g.,
noise, collisions, oil spills, tourism, vessel wastewater, climate change) and
beluga populations. If one or two stressors stand out, these can then be
prioritized in future monitoring and modeling efforts. In addition, any
information about the magnitude and nature of the functional relationship
could be incorporated into future modeling or mitigation efforts as described
in the single pathway example.
Methods:
Regression,
CART, Forests,
PCA, WoE
Tools: R
programming
language
Evaluation
Table D.4: Evaluation of analytical methods
Category Method Evaluation criteria
Relevance Rigour Feasibility
Valued
components
Home-range
estimation
Identify critical habitats. Medium Well documented use in
academic papers. Can account
for uncertainty. High
The method is intuitive in application
and interpretation. It is relatively flexible
in terms of data requirements and can
incorporate a variety of sources of
varying degrees of precision. At a
minimum the method requires
georeferenced observations for the VC
of interest. There are a variety of freely
available software tools to support this
method. High
Habitat
Suitability
Modeling
Identify critical habitats and
predict species distributions.
High
Well documented use in
academic papers. Can account
for uncertainty. High
The method is intuitive in application
and interpretation. The analysis and
data requirements are more intensive
than for home-range studies. In
addition to georeferenced observations
of the VC, data are also required for
habitat at locations with and without the
Appendix C
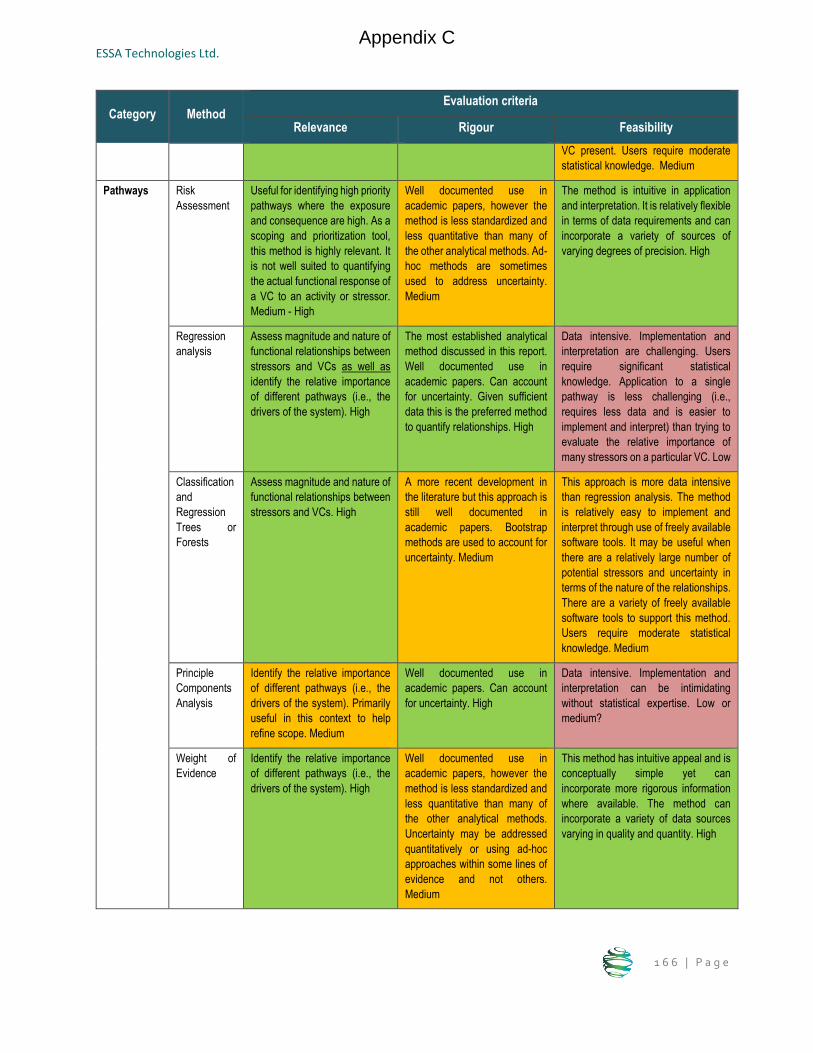
ESSA Technologies Ltd.
1 6 6 | P a g e
Category Method Evaluation criteria
Relevance Rigour Feasibility
VC present. Users require moderate
statistical knowledge. Medium
Pathways Risk
Assessment
Useful for identifying high priority
pathways where the exposure
and consequence are high. As a
scoping and prioritization tool,
this method is highly relevant. It
is not well suited to quantifying
the actual functional response of
a VC to an activity or stressor.
Medium - High
Well documented use in
academic papers, however the
method is less standardized and
less quantitative than many of
the other analytical methods. Ad-
hoc methods are sometimes
used to address uncertainty.
Medium
The method is intuitive in application
and interpretation. It is relatively flexible
in terms of data requirements and can
incorporate a variety of sources of
varying degrees of precision. High
Regression
analysis
Assess magnitude and nature of
functional relationships between
stressors and VCs as well as
identify the relative importance
of different pathways (i.e., the
drivers of the system). High
The most established analytical
method discussed in this report.
Well documented use in
academic papers. Can account
for uncertainty. Given sufficient
data this is the preferred method
to quantify relationships. High
Data intensive. Implementation and
interpretation are challenging. Users
require significant statistical
knowledge. Application to a single
pathway is less challenging (i.e.,
requires less data and is easier to
implement and interpret) than trying to
evaluate the relative importance of
many stressors on a particular VC. Low
Classification
and
Regression
Trees or
Forests
Assess magnitude and nature of
functional relationships between
stressors and VCs. High
A more recent development in
the literature but this approach is
still well documented in
academic papers. Bootstrap
methods are used to account for
uncertainty. Medium
This approach is more data intensive
than regression analysis. The method
is relatively easy to implement and
interpret through use of freely available
software tools. It may be useful when
there are a relatively large number of
potential stressors and uncertainty in
terms of the nature of the relationships.
There are a variety of freely available
software tools to support this method.
Users require moderate statistical
knowledge. Medium
Principle
Components
Analysis
Identify the relative importance
of different pathways (i.e., the
drivers of the system). Primarily
useful in this context to help
refine scope. Medium
Well documented use in
academic papers. Can account
for uncertainty. High
Data intensive. Implementation and
interpretation can be intimidating
without statistical expertise. Low or
medium?
Weight of
Evidence
Identify the relative importance
of different pathways (i.e., the
drivers of the system). High
Well documented use in
academic papers, however the
method is less standardized and
less quantitative than many of
the other analytical methods.
Uncertainty may be addressed
quantitatively or using ad-hoc
approaches within some lines of
evidence and not others.
Medium
This method has intuitive appeal and is
conceptually simple yet can
incorporate more rigorous information
where available. The method can
incorporate a variety of data sources
varying in quality and quantity. High
Appendix C
Evaluation of Cumulative Effects Assessment Methodologies for Marine Shipping
Final Report
1 6 7 | P a g e
Modeling methods
Overview
Models are tools that enable the abstraction and representation of natural systems and the prediction of their
behavior. In this sense, a key characteristic of modeling approaches is that they can be used to test alternative
scenarios or management options. By adjusting the model parameters, we can investigate how the system
reacts to changes in the stressors or to the implementation of mitigation measures.
Specifically, for the marine environment, a broad range of modeling approaches have been used to model
cumulative effects (Clarke Murray et al. 2014); from conceptual models describing the system and the
interactions among stressors and VCs to complex quantitative predictive models assessing the effects of
specific pathways or stressors.
Unlike analytical methods, models can be developed in absence of empirical data. This usage can test
alternatives using expert knowledge and current hypotheses about the system. Sensitivity analysis can help to
bound the problem and identify the most sensitive parts of the system. Pathways with the greatest influence or
uncertainty in terms of their impact on the VC can then be prioritized in terms of data collection.
Single-stressor models, such as underwater noise or oil spill models, are extremely useful in predicting the
intensity of a specific stressor in a region. These models are well established by decades of research and case
studies and applications can be found for different geographic contexts. For instance, noise propagation
models have been developed for the Pacific region (Erbe et al. 2012, O’Neill et al. 2017, Cominelli et al. 2018),
the Arctic (Aulanier et al. 2017, Halliday et al. 2017), and the Saint Lawrence estuary (Chion et al. 2017).
Ecological models, focusing on a single-species, multiple species on a whole ecosystem, have been mostly
applied to fisheries management. There are single species models, such as Population Viability Analysis, which
can be combined with information about anthropogenic stressors to assess how human activities can impact
a species at the population level (Lacy et al. 2017). Trophic ecosystem modeling frameworks, such as Ecosim
with Ecopath (EwE) are increasingly being applied to environmental and management problems other than
fisheries. Harvey (2018) has recently studied the effects of underwater noise on cetacean populations off the
coast of Scotland using a EwE modeling framework.
Single pathway models provide an opportunity to gain a more in-depth understanding of a pathway of interest
(i.e., effects of given stressor on a priority VC). Most importantly, they can be used to test alternative scenarios
or management actions and their effects on the interactions between stressors and valued components. For
instance, Chion et al. (2017) used the 3MTSim model to estimate how shipping restriction measures affect the
beluga population in the St. Lawrence.
Multiple pathways models are problem-structuring frameworks and can be applied to any combination of
stressors and valued components (Patrício et al. 2016). These models vary in their complexity from simple
conceptual models (e.g., pathways of effects) to spatially-explicit models which combine multiple modeling
techniques under a spatially explicit predictive framework enables a holistic assessment of the system and
facilitates evaluation of alternative monitoring and management actions (Bastos et al. 2017).
General insights about modeling methods emerging from the evaluation include the following:
A key distinction of modeling methods is that they can be used to test alternative scenarios or
management options, the third component of the assessment step (Figure D.).
Unlike analytical methods, models can be developed in absence of empirical data. This usage can test alternatives using expert knowledge and current hypotheses about the system. Sensitivity analysis can help to bound the problem and identify the most sensitive parts of the system. Pathways with the greatest influence or uncertainty in terms of their impact on the VC can then be prioritized in terms of data collection.
Appendix C
ESSA Technologies Ltd.
1 6 8 | P a g e
Spatially explicit simulation models which relate stressors to VCs and enable evaluation of alternative scenarios are the ultimate CEA method. However, the level of data, effort, and expertise required for their implementation, makes spatially explicit models best suited at regional scales for a sub-set of highest priority VCs and pathways of greatest impact and potential for improvement.
Application to CEMS
Our review has identified a wide range of modeling methods that could support the CEMS initiative. These
methods can assist in articulating hypotheses and scoping (i.e., conceptual models), quantifying the intensity
of stressors (stressor models), assessing the state and interactions among the components of the environment
(valued component models), linking the stressors with their effects on valued components (single pathway
models) and in studying how multiple pathways can have impacts on one or more valued components (multiple
pathways models).
Table D.5: Generic application of modeling methods
Category Generic application Specific example of how the CEMS initiative might use
methods in each category
Methods and
associated tools
Stressor Modeling the magnitude or
distribution of the stressor
associated with a particular
activity.
The impact of anchoring in Northern BC could be investigated by
first modeling the substrate disturbance or ‘anchoring footprint’ for
individual boats under different conditions (e.g., tide, wind, current)
and then using this to assess the current disturbance as well as
alternative future scenarios. This information could later be
overlaid with VC or habitat distribution information to inform the
magnitude of the impact (i.e., single pathway assessment).
Noise models: RAM,
RANDI, NONM,
NEMES
Oil spills modeling:
MOTHY, MEDSLIK,
MEDSLIK-II,
POSEIDON-OSM,
SAMSON, H3D,
SPILLCALC
Emissions: MEIT
Valued
Component
Simulate how a stressor or
multiple stressors can affect an
ecological component of the
environment at the species,
habitat or ecosystem scale.
A life cycle model for salmon could be generated to inform
population viability analyses. In other words, various life cycle
parameters (e.g., juvenile survival) could be adjusted to evaluate
the long-term impacts on the population. This model could later be
linked to stressor models to evaluate population level responses to
alternative management scenarios (i.e., single or multiple pathway
models).
Method: Population Viability Analysis (PVA) Method/tools: ECOPATH with ECCOSIM (EwE), Atlantis
Single
Pathway
Link stressors to specific
components by simulating the
process by which effects occur
from one linkage to the next
along a particular pathway.
A single stressor model could be generated which describes the
position and movement of tankers at different times of the year in
order to identify areas which are effectively no-longer available for
fishing. This could then be related to a second model which
describes theoretical fishing opportunity (i.e., spatial and temporal
openings or traditional use areas). The combination of these two
models could be used to assess current lost fishing opportunities
and possible future scenarios under different mitigation options.
Similarly, a pathway model can combine an underwater noise
propagation model with a distribution model of sensitive cetaceans
to assess the potential impacts of increased noise due to marine
traffic. Vessel strike models operate in a similar way, combining
traffic data with the distribution of certain species to assess the risk
of collisions.
Method: linkage of single stressor and VC models Tools: 3MTSim model, Spill Impact Model Application Package (SIMAP)
Appendix C
Evaluation of Cumulative Effects Assessment Methodologies for Marine Shipping
Final Report
1 6 9 | P a g e
Category Generic application Specific example of how the CEMS initiative might use
methods in each category
Methods and
associated tools
Multiple
Pathway
Problem-structuring frameworks
that can be applied to any
combination of stressors and
valued components to
understand the combined effect
of multiple pathways and their
relative importance
Under a DPSIR or BBN framework, multiple shipping impact
pathways (noise, risk of strikes, discharge, etc.) could be
conceptualized and study to assess their relative importance and
test various management options.
Methods: DPSIR, BBN, PoE, Spatially explicit models
Evaluation
Table D.6: Evaluation of modeling methods
Category Method Evaluation criteria
Relevance Rigour Feasibility
Stressors
Highly relevant for studying the
intensity of specific stressors
(noise, oil spills) and explore
management scenarios.
Models exist for a few stressors
associated to marine shipping.
High
These models are the outcome
of well-established research.
They are well documented.
Explicitly address uncertainty.
High
Extensive and specific data
requirements. Users need quantitative
skills and subject knowledge. Costs
may include purchase of specific
software. Medium
Valued
components
Single
species
Useful for exploring scenarios
and understand the response to
stressors of a species of special
importance (priority VC).
Medium
Well documented use in
academic papers. High
Requires extensive knowledge and
data of the target species. Users need
quantitative/statistical skills. Medium
Multiple
species
These models focus on
simulation trophic/predation
interactions. Unclear link to
anthropogenic pressures. Low
There are multiple case studies
and academic papers
documenting the applications of
these models. Rigorous data
treatment and explicit
consideration of uncertainty.
High
Requires extensive knowledge and
data of the target species. Users
require significant statistical
knowledge to model the species
interactions. Low
Ecosystems Primarily used for fisheries
management, these models are
starting to be applied to account
for other human activities.
However, it is unclear how it
would apply to CEMS initiative
unless the VC itself is an
ecosystem. Medium
Extensive literature on these
models. Many tools and
methods available with specific
documentation. Uncertainties
are usually documented. High
In general, these are data intensive
models requiring large data sets to
calibrate and run the simulations. Low
Single pathway These models establish the
interactions between stressors
and VCs and can be used to
evaluate alternative scenarios.
High
Well documented in the
literature. Uncertainties (in the
knowledge base and the
predictions of the model) are
well documented. High
Extensive and specific data
requirements. Multi-disciplinary teams
with expert knowledge. Costs may
include purchase of specific software.
Medium
Appendix C
ESSA Technologies Ltd.
1 7 0 | P a g e
Category Method Evaluation criteria
Relevance Rigour Feasibility
Multiple
pathway
PoE An explicit understanding of the
cause-effect linkages between
stressors and components
should underlie any model.
High
PoEs are considered best
practice. The quality of the
evidence supporting the links
determines the level of
uncertainty of the model.
Medium
PoE models can be developed by a
range of stakeholders based on the
data and knowledge available. High
DPSIR Flexible problem-structuring
approach that can be applied to
a variety of contexts. Policy-
oriented model. High
Limited practical application;
most assessments are semi-
quantitative. Medium
This model is data flexible and it can
be adapted to the available resources.
High
BBN Limited application to marine
problems but these models are
emerging as a solution in data-
limited contexts. High
Uncertainty explicitly
addressed. High
BBN models can combine empirical
data and expert knowledge. High
Spatially
explicit
Holistic modeling approach that
assesses the implications of
cumulative effects over space.
High
Case studies well documented
in the literature. Uncertainty
usually documented. High
These models require specific skills
(spatial and stochastic modeling) and
are more data-intensive than other
multiple pathways models. Medium
Supporting and organizing methods
Apart from the three categories of assessment methods (i.e., spatial, analytical and modeling) evaluated in
detail, we identified and summarized several other methods that may be useful for the CEMS initiative.
Supporting methods
Indigenous knowledge and expert elicitation methods can support the assessment of cumulative effects in
various ways, especially in terms of complementing limited data on the socio-ecological systems under study.
For example, Indigenous knowledge held by individuals within coastal communities includes a wealth of
information that can be useful for better understanding the dynamics of complex systems, provide insights the
connections between traditional management practices and cultural beliefs, inform marine management
decisions, and support resilience in the face of changing ecosystems.
Similarly, different methods have used expert elicitation to identify components important for inclusion in
assessment, including what human activities should be included, what stressors result from which activities,
and what components of the socio-ecological system are important to include. Expert elicitation has also been
used to quantify the relationship between the different components within the system. For example, the
cumulative impact mapping approach developed by Halpern et al. (2008) involves eliciting expert judgement
to estimate ecosystem-specific levels of impact for multiple anthropogenic drivers of ecological change.
Organizing methods
Our evaluation also identified organizing frameworks that integrate a suite of assessment methods and tools
in a way that allows decision-makers to utilize the information generated through the assessment process
(Figure D.).
Appendix C
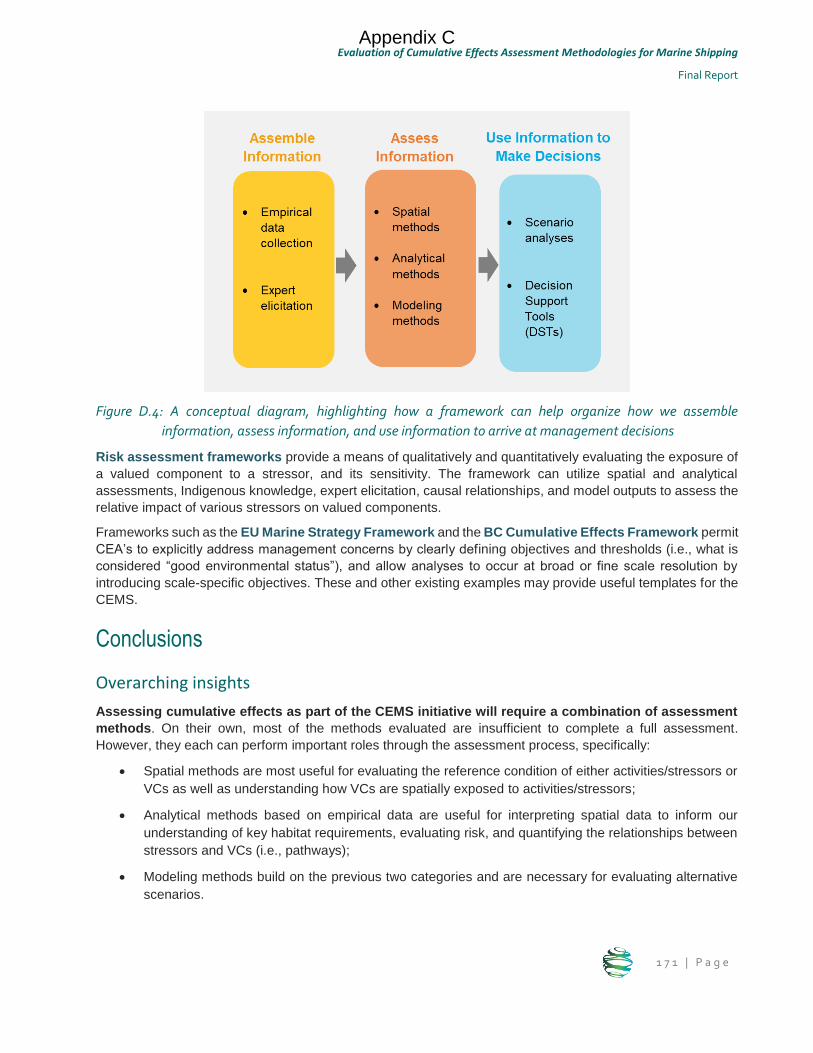
Evaluation of Cumulative Effects Assessment Methodologies for Marine Shipping
Final Report
1 7 1 | P a g e
Figure D.4: A conceptual diagram, highlighting how a framework can help organize how we assemble
information, assess information, and use information to arrive at management decisions
Risk assessment frameworks provide a means of qualitatively and quantitatively evaluating the exposure of
a valued component to a stressor, and its sensitivity. The framework can utilize spatial and analytical
assessments, Indigenous knowledge, expert elicitation, causal relationships, and model outputs to assess the
relative impact of various stressors on valued components.
Frameworks such as the EU Marine Strategy Framework and the BC Cumulative Effects Framework permit
CEA’s to explicitly address management concerns by clearly defining objectives and thresholds (i.e., what is
considered “good environmental status”), and allow analyses to occur at broad or fine scale resolution by
introducing scale-specific objectives. These and other existing examples may provide useful templates for the
CEMS.
Conclusions
Overarching insights
Assessing cumulative effects as part of the CEMS initiative will require a combination of assessment
methods. On their own, most of the methods evaluated are insufficient to complete a full assessment.
However, they each can perform important roles through the assessment process, specifically:
Spatial methods are most useful for evaluating the reference condition of either activities/stressors or
VCs as well as understanding how VCs are spatially exposed to activities/stressors;
Analytical methods based on empirical data are useful for interpreting spatial data to inform our
understanding of key habitat requirements, evaluating risk, and quantifying the relationships between
stressors and VCs (i.e., pathways);
Modeling methods build on the previous two categories and are necessary for evaluating alternative
scenarios.
Appendix C
ESSA Technologies Ltd.
1 7 2 | P a g e
Examples addressing social VCs were less prevalent in the evaluation however insights generally
apply to both ecological and social VCs.
Marine shipping activities are relevant nationally, whereas VCs and impact pathways differ by region.
It may be possible to select a single modeling tool for stressors of concern (e.g., oil or noise) and replicate
these across multiple regions. This would improve efficiency, build capacity, and enable results to be more
easily compared across regions. However, it is likely that different methods and associated tools will be
required to assess VCs and impact pathways in each region depending on the nature of the VCs, the intensity
of stressors, the local data availability and capacity.
Preliminary guiding principles
The following list of guiding principles emerged from the evaluation.
Table D.7: Guiding principles for implementation of the assessment step of the CEMS initiative.
Principle Description
Identify management
objectives early in the
process
Identifying management decisions up front will help to characterize alternative scenarios of
interest. Identifying mitigation opportunities which are within control of the CEMS initiative will
also help to focus assessment efforts.
Focus on the essential It is not possible to assess everything. Scoping to a manageable set of priority VCs (e.g., less
than 10), stressors of concern, and most important pathways is critical to successful
implementation of the assessment step. The CEMS initiative is currently in the process of
collaboratively refining the scope in each region. The process for prioritization and resulting
decisions should be documented. Scope refinement is expected to continue iteratively as the
assessment progresses.
Build on existing work Where possible leverage existing work rather than starting from scratch. There are a number of
related initiatives which could be employed to support different aspects of the CEMS initiative. This
can include everything from: CEA frameworks, existing modeling tools, analyses quantifying
pathways, thresholds, monitoring and data management systems.
Explicitly identify
uncertainties
This may include model assumptions, data gaps or data uncertainty. Uncertainty may be expressed
quantitatively or qualitatively.
Keep it simple Models are complex assessment methods and this complexity increases as the scope of the model
increases (e.g., pathways instead of single stressors or VCs). To avoid unnecessary complications,
the simplest model that achieves the objectives of the assessment should be selected. We
recommend coupling several smaller and simpler models rather than creating a single all-
encompassing model (e.g., linking a stressor model for noise to a separate life cycle model for
beluga populations). This approach is better able to leverage existing work, builds upon the
strengths of subject matter experts, and reduces complexity. In general, we recommend only
considering one VC at a time, although multiple stressors and pathways should be considered
simultaneously. The added complexity of modeling multiple VCs simultaneously is not expected to
be fruitful except perhaps in cases where there are clear trophic level interactions between VCs
(e.g. marine mammals and forage fish). Even so, these would likely be questions for later iterations
as specific uncertainties are identified.
Appendix C
Evaluation of Cumulative Effects Assessment Methodologies for Marine Shipping
Final Report
1 7 3 | P a g e
Selection of assessment method
Selecting specific methods and associated tools within each category depends on the: relevance (e.g., priority
VCs), rigour (e.g., credibility of the method and quality of the outputs), and feasibility (e.g., capacity/funding) of
different options within the category. In general, early iterations of the assessment step tend to use simpler
less data intensive methods and are more focused on refining scope and identifying knowledge gaps. Whereas
later iterations involve more complex methods applied to a narrower scope (e.g., the most important pathways).
We propose a series of guiding questions for consideration when selecting assessment method(s) to be used
along with the detailed summary tables of the report (Tables 5.2 and 5.3):
Relevance
o What stage of the assessment process are you in?
o Have the most important pathways been identified?
o What management decisions are informed by the CEA?
Rigour
o What level of information is available for priority VCs and stressors?
o Is it possible to supplement the available information with Indigenous or expert knowledge?
o Is it possible to collect new data?
Feasibility
o What is the general knowledge and skill level of the team conducting the CEA?
o What are the resources (e.g., time, money) available for conducting the CEA?
o Are there existing applications of methods or tools for priority VCs, stressors of concern, or
impact pathways?
o Who are the key stakeholders and what is the best way to communicate the results?
1 Stressor is any physical, chemical, or biological means that, at some given level of intensity, has the potential
to negatively affect a valued component. [Thornborough et al. 2018 (DFO)]
2 Valued components refer to environmental features that may be affected by an activity and that have been
identified to be of concern by the proponent, government agencies, Indigenous peoples, or the public. The
value of a component not only relates to its role in the ecosystem, but also to the value people place on it. For
example, it may have been identified as having scientific, social, cultural, economic, historical, archaeological,
or aesthetic importance. [Definition is adapted from CEAA 2012]
3 Cumulative effect is a change in the environment caused by multiple interactions among human activities
and natural processes that accumulate across space and time
4 Empirical “originating in or based on observation or experience” Merriam-Webster [https://www.merriam-
webster.com/dictionary/empirical]
Appendix C