Embed Size (px)
Citation preview
Evaluation of CMMI Accountable Care Organization Initiatives Contract HHSM-500-2011-00019i/HHSM-500-T0002 Pioneer ACO Final Report December 2, 2016
Prepared for: David Nyweide, Ph.D. Contracting Officer Representative Centers for Medicare & Medicaid Services CMS/CMMI/RREG/DRPA 7500 Security Boulevard Baltimore, MD 21244 Prepared by: L&M Policy Research, LLC 1743 Connecticut Ave NW, Suite 200 Washington, DC 20009 Attn: Lisa Green, Project Director [email protected] With partners: Abt Associates, Avalere Health, Social & Scientific Systems, and Truven Health Analytics
Pioneer ACO Final Report HHSM-500-2011-00019i/HHSM-500-T0002
i
TABLE OF CONTENTS
EXECUTIVE SUMMARY ................................................................................................................. VII
Who were the Pioneer ACOs? .................................................................................................. vii
What types of activities did Pioneer ACOs undertake? ............................................................. ix
Did the Pioneer ACO Model facilitate increased financial risk-bearing and movement toward
population health? ...................................................................................................................... xi
INTRODUCTION ............................................................................................................................. 13
Pioneer ACO Model background ............................................................................................. 13
Context for this report ............................................................................................................... 16
WHO ARE THE PIONEER ACOS? ................................................................................................. 17
Overwhelmingly, past experience and ongoing initiatives motivated organizations to participate
in the Pioneer ACO Model ....................................................................................................... 17
Organizations varied in structure, markets, and size ................................................................ 18
HOW DID PIONEER ACOS DELIVER CARE DURING THEIR INITIAL PERFORMANCE PERIOD? . 37
Learning and feedback processes were not necessarily formalized and relied on experimentation
.................................................................................................................................................. 37
While ACOs reported multiple strategies for engaging providers, the views of providers
demonstrate room for improvement ......................................................................................... 39
Care management in ACOs, reflections of a managed care past .............................................. 47
ACO health information technology investments driven by broader organizational strategy . 48
Model restrictions and weak beneficiary ties challenged Pioneer ACOs’ ability to engage
beneficiaries .............................................................................................................................. 49
Pioneer ACOs acknowledge need for behavioral health management but extent of activity was
mixed ........................................................................................................................................ 51
The SNF waiver may help ACOs manage care ........................................................................ 54
ACO impact on quality of care: CAHPS and GPRO analysis .................................................. 60
DISCUSSION ................................................................................................................................... 70
Pioneer ACO Final Report HHSM-500-2011-00019i/HHSM-500-T0002
ii
Did the Pioneer ACO Model facilitate increased financial risk-bearing and movement toward
population health? ..................................................................................................................... 71
APPENDIX A. METHODS ............................................................................................................... 79
Provider participation, ACO markets, and beneficiary alignment ............................................ 79
CAHPS and GPRO analyses ..................................................................................................... 80
Primary data collection and analysis ........................................................................................ 88
APPENDIX B. DATA TABLES ......................................................................................................... 92
LIST OF FIGURES
Figure 1. Provider Participation and Beneficiary Alignment for Pioneer ACOs in the Initial
Performance Period ...................................................................................................................... viii
Figure 2. Mean Annual Medicare Spending by Beneficiary Alignment Status ............................ ix
Figure 3. Selected Characteristics of Pioneer ACOs: Structure, Leadership, and Proprietary
Hospital Relationship .................................................................................................................... 21
Figure 4. Distribution of ACOs by Payment Arrangement, 2012 to 2014 ................................... 22
Figure 5. Distribution of ACOs by Number of Participating Providers, 2012 to 2014 ................ 24
Figure 6. Distribution of ACOs by Number of Aligned Beneficiaries, 2012 to 2014 .................. 25
Figure 7. Overlap in Participating Providers across Performance Years ...................................... 26
Figure 8. Overlap Among Beneficiaries Aligned with Pioneer ACOs Across Performance Years
....................................................................................................................................................... 29
Figure 9. Pioneer ACO Beneficiary Alignment Process: Changes in Status Across Initial
Performance Period ....................................................................................................................... 33
Figure 10. Percent of Aligned and Spillover Beneficiaries with Selected Characteristics ........... 34
Figure 11. Percent of Re-Aligned and Newly Aligned Beneficiaries with Selected Characteristics
....................................................................................................................................................... 35
Figure 12. Physician Views of Health Care Market and Pioneer ACO Model: Percent Agreeing or
Disagreeing ................................................................................................................................... 43
Figure 13. Impact of Pioneer ACO on How Physicians Practice Medicine: Percent Agreeing or
Disagreeing ................................................................................................................................... 44
Pioneer ACO Final Report HHSM-500-2011-00019i/HHSM-500-T0002
iii
Figure 14. Physician Perception of Pioneer ACO-provided Tools and Resources: Percent
Indicating Tool Reduces Cost, Improves Quality of Patient Care ................................................ 45
Figure 15. Physician Perception of Pioneer ACO Progress toward Goals: Percent Reporting “Very
successful” or “Somewhat successful” ......................................................................................... 46
Figure 16. Why and How Pioneer ACOs Engage Beneficiaries .................................................. 50
Figure 17. ACO CAHPS Measure Composites, Pioneer ACOs, 2012–2014 ............................... 63
Figure 18. Pioneer ACO PY1 (2012) Savings/Losses and Participation in PY3 (2014) .............. 72
Figure 19. Pioneer ACO PY2 (2013) Savings/Losses and Participation in PY4 (2015) ............. 72
Figure 20. Pioneer ACO Model Financial Results (in millions) for Continuing Pioneer ACOs . 76
LIST OF TABLES
Table 1. Pioneer ACO Payment Arrangements ............................................................................ 14
Table 2. Characteristics of ACO Markets, 2012 ........................................................................... 20
Table 3. Distribution of Participating Providers across Pioneer ACOs, 2012 to 2014 ................. 24
Table 4. Distribution of Aligned Beneficiaries across Pioneer ACOs, 2012 to 2014 .................. 25
Table 5. Overall Number and Distribution of Participating Providers and Turnover per ACO by
Performance Year ......................................................................................................................... 27
Table 6. Overall Number and Distribution of Aligned Beneficiaries and Turnover per ACO by
Performance Year ......................................................................................................................... 30
Table 7. Beneficiary Alignment Groups ....................................................................................... 31
Table 8. Selected Descriptive Characteristics of SNF Waiver Patients ........................................ 55
Table 9. Marginal Effects of the SNF Waiver Conditional on SNF Use: Multivariate Regression
Results 1,3,4 ..................................................................................................................................... 58
Table 10. Market- and ACO-Level Characteristics ...................................................................... 61
Table 11. Estimated Effects of Each Explanatory Variable on the ACO CAHPS Composites, 23
Pioneer ACOs 2012-14 ................................................................................................................. 65
Table 12. Estimated Effects of Each Explanatory Variable on the GPRO Composites, 23 Pioneer
ACOs 2012-14 .............................................................................................................................. 68
Table 13. Pioneer ACO Model Shared Savings Results (in millions) of Pioneer ACOs that Ended
Medicare ACO Activity ................................................................................................................ 74
Pioneer ACO Final Report HHSM-500-2011-00019i/HHSM-500-T0002
iv
Table 14. Pioneer ACO Model Shared Savings Results (in millions) of Pioneer ACOs that
Transitioned to the Medicare Shared Savings Program ................................................................ 74
Table 15. Pioneer ACO Model Shared Savings Results (in millions) of Pioneer ACOs that
Remained in Pioneer through 2016............................................................................................... 75
Table 16. Pioneer ACO Model Shared Savings Results (in millions) of Pioneer ACOs that
Transitioned to Next Generation ................................................................................................... 77
Table 17. ACO CAHPS Domains and Item Text ......................................................................... 81
Table 18. Means and Standard Deviations of ACO- and Market-Level Explanatory Variables for
Pioneer ACOs in ACO CAHPS Analysis ..................................................................................... 83
Table 19. GPRO Quality Measures, Domains, and Composites .................................................. 84
Table 20. GPRO Composite Item Correlation and Cronbach's Alpha for Equal-Weighted Index of
Other Items in Domain.................................................................................................................. 85
Table 21. Average Values of GPRO Composites for Pioneer ACOs, 2012–2014 ....................... 86
Table 22. Means and Standard Deviations of ACO- and Market-Level Explanatory Variables for
Pioneer ACOs in GPRO Analysis................................................................................................. 86
Table 23. ACO Market Definitions .............................................................................................. 87
Table 24. ACO Quarterly Assessment Interviews with Pioneer ACOs, 2012 – 2014 .................. 89
Table 25. Sample Characteristics .................................................................................................. 91
Table 26. Number of Counties in Pioneer ACO Market Areas, 2012-2014 ................................. 92
Table 27. Characteristics of Pioneer ACO Markets, 2012............................................................ 94
Table 28. Selected Organizational Characteristics, Pioneer ACOs .............................................. 96
Table 29. Number of ACOs Moving Across Participating Provider Size Categories, 2012 to 2013
(above) and 2013 to 2014 (below) ................................................................................................ 98
Table 30. Number and Distribution of Participating Providers and Turnover by Performance Year
by ACO ......................................................................................................................................... 99
Table 31. Number of ACOs Moving Across Aligned Beneficiary Size Categories, 2012 to 2013
(above) and 2013 to 2014 (below) .............................................................................................. 101
Table 32. Number and Distribution of Aligned Beneficiaries and Turnover by Performance Year
by ACO ....................................................................................................................................... 102
Table 33. Counts of SNF Waiver Stays by ACO and Year ........................................................ 104
Pioneer ACO Final Report HHSM-500-2011-00019i/HHSM-500-T0002
v
Table 34. Additional Characteristics of SNF Waiver Patients ................................................... 105
Table 35. Regression Results – Impact of SNF Waiver Among Patients Using SNF Compared to
the Unrestricted Comparison Group1,3,4 ...................................................................................... 108
Table 36. Selected Descriptive Characteristics of SNF Waiver and Comparison Patients ........ 109
Table 37. Regression Results – Impact of SNF Waiver Among Patients Using SNF Compared to
Patients in the Near Market and Not Aligned with an ACO1,3,4 ................................................. 111
Pioneer ACO Final Report HHSM-500-2011-00019i/HHSM-500-T0002
vi
ACKNOWLEDGMENTS
L&M Policy Research, LLC is the prime contractor for the “Evaluation of CMMI Accountable
Care Organization Initiatives” and the primary author of this report. We would like to acknowledge
our partner firms, Abt Associates, Avalere Health, Social & Scientific Systems, and Truven Health
Analytics, for their tremendous analytic and written contributions, insights, and review of this
report. We would also like to thank the Pioneer ACOs who were flexible and forthcoming during
our many interactions with them. Without their input, this report would lack context and
interpretability. Finally, we appreciate and want to thank the CMMI evaluation team, particularly
David Nyweide, for their ongoing assistance and feedback.
Disclaimer: L&M Policy Research, LLC conducted this study under contract with the U. S.
Department of Health and Human Services, Centers for Medicare and Medicaid Services (CMS).
The technical parameters and protocols governing the study were determined by the contract terms
and provisions under which the work was performed as well as technical direction provided by the
U. S. Government. The findings included herein reflect these constraints.
L&M Policy Research, LLC is not responsible for information that was available to it but did not
fall into the range of data obtainable using the study protocols and technical direction provided to
the firm by the U.S. Government, even if such information was provided to L&M Policy Research,
LLC by the parties being studied or by any parties. Further, L&M Policy Research, LLC is under
no obligation to provide or include in its analysis any information not obtainable directly through
the study protocols as outlined in its contract with the U.S. Government or as a result of the
technical direction provided by the U.S. Government during this study.
Pioneer ACO Final Report HHSM-500-2011-00019i/HHSM-500-T0002
vii
EXECUTIVE SUMMARY
Medicare Accountable Care Organizations (ACOs) are designed to provide financial incentives
for fee-for-service (FFS) Medicare providers to reduce inefficiencies in care delivery for a
population of beneficiaries under their care. ACOs are grounded in the theory that with the
opportunity to share in financial rewards (or face penalties), ACOs will reduce fragmentation and
duplication in medical care by facilitating improved communication and coordination across
providers and between patients and their doctors, thereby improving quality and reducing
spending.1 The Pioneer ACO Model was established by the Centers for Medicare & Medicaid
Services (CMS) Center for Medicare and Medicaid Innovation (CMMI) to harness the knowledge
and capabilities of health care organizations and providers that were experienced in coordinating
care for patients across care settings and had some previous exposure to risk-based contracting.
For the 32 organizations chosen by CMS to participate, the Pioneer ACO Model established a
laboratory in which ACOs could experiment with and implement strategies to contain cost and
improve quality in FFS Medicare.
The Pioneer model launched on January 1, 2012 with an initial three-year performance period and
two additional option years for a total of five performance years. In May 2015, the CMS Office of
the Actuary certified that expansion of the Pioneer model as a permanent part of the Medicare
program would reduce net program spending without any negative effects on quality of care.2
Since the model was certified prior to completion of the intended evaluation period, CMS directed
the L&M Policy Research evaluation team to focus this final report on describing participating
organizations, their activities, and their aligned beneficiaries during their initial three-year
performance period. Findings in the report are based on analysis of a mix of qualitative and
quantitative sources including Medicare claims, process and clinical quality measures (from Group
Practice Reporting Option [GPRO] data), patient experience survey data (from ACO Consumer
Assessment of Healthcare Providers and Systems [CAHPS] survey), a survey of Pioneer ACO
physicians, and telephone interviews, focus groups, and site visits with Pioneer ACO stakeholders.
Who are the Pioneer ACOs?
While the Pioneer ACOs represent a diverse set of organizations at different stages of development
facing diverse internal and external challenges, their high-level motivations for participating in the
Pioneer model were similar. A common motivation was an interest in improving care for their
patients, to be achieved through a focus on value, innovation, care management, and clinical
integration. Most perceived the Pioneer model as an opportunity to continue these efforts and be
financially rewarded for doing so, all while maintaining or increasing their competitive position in
a rapidly evolving marketplace. They reported a strong sense that their previous experience with
managed care and quality initiatives, existing health information technology infrastructure, and,
for some, employed physicians were factors that positioned them for success.
Most of the Pioneer ACOs were part of larger health care systems with broad portfolios and
sometimes multiple ongoing commercial and public sector contracts and initiatives. As a result,
the ACOs that these organizations established were a heterogeneous group in terms of location,
1 https://innovation.cms.gov/initiatives/Pioneer-ACO-Model/Pioneer-ACO-FAQs.html 2 See https://www.cms.gov/Research-Statistics-Data-and-Systems/Research/ActuarialStudies/Downloads/Pioneer-
Certification-2015-04-10.pdf
Pioneer ACO Final Report HHSM-500-2011-00019i/HHSM-500-T0002
viii
size, organizational structure, and other characteristics, with many of these differences driven by
the goals and business interests of the larger organizations as well as the markets in which they
operated.
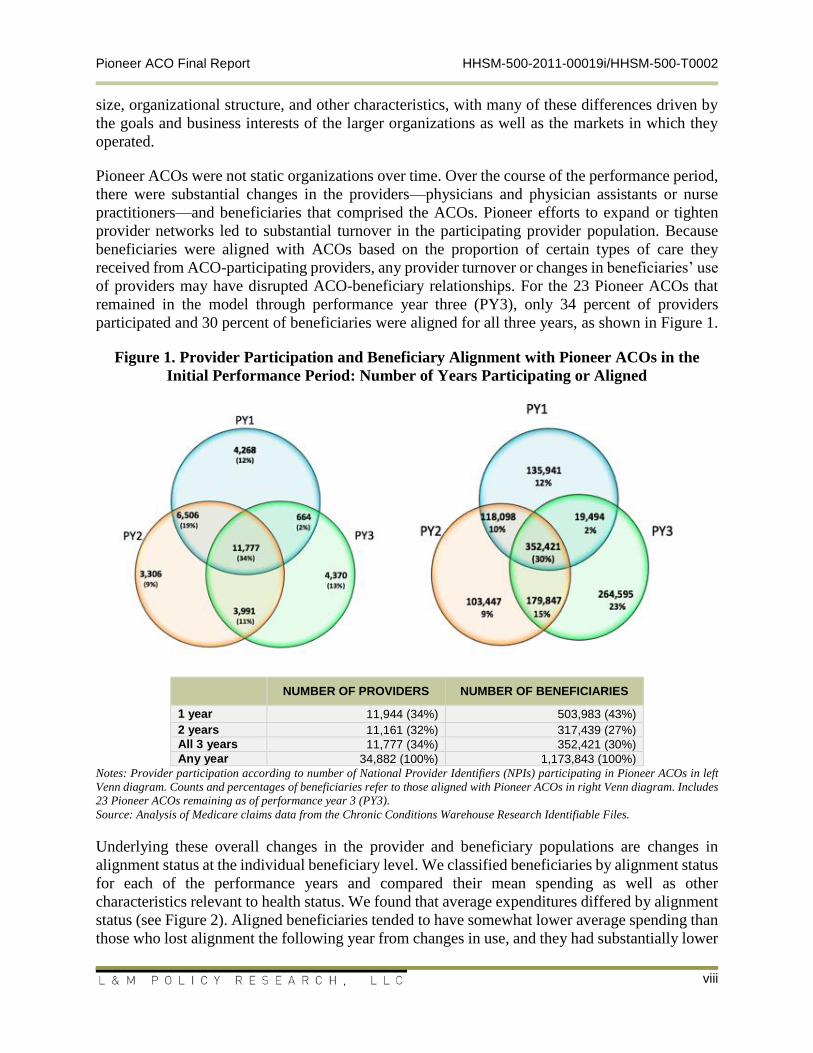
Pioneer ACOs were not static organizations over time. Over the course of the performance period,
there were substantial changes in the providers—physicians and physician assistants or nurse
practitioners—and beneficiaries that comprised the ACOs. Pioneer efforts to expand or tighten
provider networks led to substantial turnover in the participating provider population. Because
beneficiaries were aligned with ACOs based on the proportion of certain types of care they
received from ACO-participating providers, any provider turnover or changes in beneficiaries’ use
of providers may have disrupted ACO-beneficiary relationships. For the 23 Pioneer ACOs that
remained in the model through performance year three (PY3), only 34 percent of providers
participated and 30 percent of beneficiaries were aligned for all three years, as shown in Figure 1.
Figure 1. Provider Participation and Beneficiary Alignment with Pioneer ACOs in the
Initial Performance Period: Number of Years Participating or Aligned
NUMBER OF PROVIDERS NUMBER OF BENEFICIARIES
1 year 11,944 (34%) 503,983 (43%)
2 years 11,161 (32%) 317,439 (27%)
All 3 years 11,777 (34%) 352,421 (30%)
Any year 34,882 (100%) 1,173,843 (100%)
Notes: Provider participation according to number of National Provider Identifiers (NPIs) participating in Pioneer ACOs in left
Venn diagram. Counts and percentages of beneficiaries refer to those aligned with Pioneer ACOs in right Venn diagram. Includes
23 Pioneer ACOs remaining as of performance year 3 (PY3).
Source: Analysis of Medicare claims data from the Chronic Conditions Warehouse Research Identifiable Files.
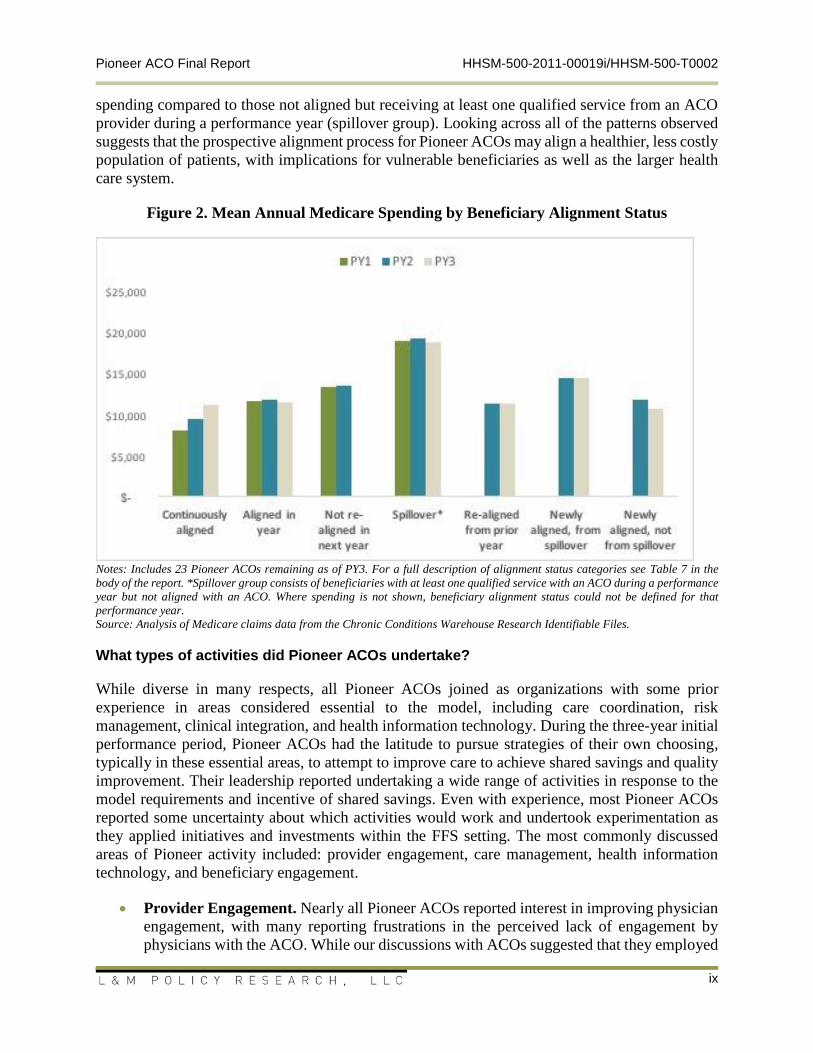
Underlying these overall changes in the provider and beneficiary populations are changes in
alignment status at the individual beneficiary level. We classified beneficiaries by alignment status
for each of the performance years and compared their mean spending as well as other
characteristics relevant to health status. We found that average expenditures differed by alignment
status (see Figure 2). Aligned beneficiaries tended to have somewhat lower average spending than
those who lost alignment the following year from changes in use, and they had substantially lower
Pioneer ACO Final Report HHSM-500-2011-00019i/HHSM-500-T0002
ix
spending compared to those not aligned but receiving at least one qualified service from an ACO
provider during a performance year (spillover group). Looking across all of the patterns observed
suggests that the prospective alignment process for Pioneer ACOs may align a healthier, less costly
population of patients, with implications for vulnerable beneficiaries as well as the larger health
care system.
Figure 2. Mean Annual Medicare Spending by Beneficiary Alignment Status
Notes: Includes 23 Pioneer ACOs remaining as of PY3. For a full description of alignment status categories see Table 7 in the
body of the report. *Spillover group consists of beneficiaries with at least one qualified service with an ACO during a performance
year but not aligned with an ACO. Where spending is not shown, beneficiary alignment status could not be defined for that
performance year.
Source: Analysis of Medicare claims data from the Chronic Conditions Warehouse Research Identifiable Files.
What types of activities did Pioneer ACOs undertake?
While diverse in many respects, all Pioneer ACOs joined as organizations with some prior
experience in areas considered essential to the model, including care coordination, risk
management, clinical integration, and health information technology. During the three-year initial
performance period, Pioneer ACOs had the latitude to pursue strategies of their own choosing,
typically in these essential areas, to attempt to improve care to achieve shared savings and quality
improvement. Their leadership reported undertaking a wide range of activities in response to the
model requirements and incentive of shared savings. Even with experience, most Pioneer ACOs
reported some uncertainty about which activities would work and undertook experimentation as
they applied initiatives and investments within the FFS setting. The most commonly discussed
areas of Pioneer activity included: provider engagement, care management, health information
technology, and beneficiary engagement.
Provider Engagement. Nearly all Pioneer ACOs reported interest in improving physician
engagement, with many reporting frustrations in the perceived lack of engagement by
physicians with the ACO. While our discussions with ACOs suggested that they employed
Pioneer ACO Final Report HHSM-500-2011-00019i/HHSM-500-T0002
x
multiple strategies to communicate with participating physicians to engage them in
achieving ACO goals, physician perspectives on the ACO seemed only moderately positive
and suggest that the ACO’s strategies may not be having their intended effects.
Care Management. The Pioneer ACOs named reducing unnecessary inpatient
admissions, avoidable readmissions, inappropriate emergency department use, and
improving care transitions as primary goals for their care management efforts. Some
Pioneer ACOs with centralized care management structures moved to decentralize them
into provider offices, while other ACOs moved in the other direction. Pioneer ACOs also
worked to improve the way they targeted beneficiaries to receive care management,
attempting to identify them before they became high-cost. In some cases, they employed
more complex data mining to improve predictive models, and in other cases they engaged
beneficiaries themselves to assess risk. Pioneer ACOs also refined their communications
with beneficiaries around care management, emphasizing physician relationships and
replacing terms such as “care coordinator” with “health coach” or “health advocate.”
Health Information Technology. While the Pioneer model likely had some influence or
catalyzing effect, most ACOs indicated that, absent participation in the Pioneer model, they
would have continued to improve their systems as part of an overall business strategy to
keep pace with the health care market’s trajectory toward data analytics and promoting
value. The most common enhancements focused on the operational and analytic needs of
the organizations—integrating claims and clinical data and making improvements to ease
development, sharing, and analysis of ACO-specific quality metrics. Pioneer ACOs also
faced a learning curve with analyzing and using Medicare claims data as part of their
participation in the model to manage their aligned beneficiary population. Some
organizations felt that the data were not timely enough to optimally inform their patient
care strategies, though some also described benefit from gaining understanding of where
their beneficiaries sought care and the variation in utilization among different providers
such as SNFs.
Beneficiary Engagement. Generally, Pioneer ACOs engaged beneficiaries through
contact with their providers—largely through contact with care managers as well as
community-based organizations and primary care providers. Care managers were cited as
the most common form of engagement, likely because of their focus on high-risk patients
and delivery of services such as care coordination, home visits, environmental safety
checks, and scheduling follow-up visits. Representatives from many of the Pioneer ACOs
noted that it was more difficult than initially anticipated to manage beneficiary utilization
and prevent leakage outside of the ACO because beneficiaries did not face financial
incentives to use ACO providers. Some ACOs reported frustration with translating existing
care management programs to the ACO population without the benefit of traditional
managed care tools (e.g., enrolled population, utilization management, prior authorization).
Underlying the Pioneer ACOs’ activities was a focus on quality of care. Our quality analyses,
which focused on understanding which market- or ACO-level characteristics were related to
patient experience and quality of care, suggest that Pioneer ACOs showed improvements in some,
but not all, measures. In some cases, it was also difficult to assess if the improvements were
specific to the ACOs or other factors.
Pioneer ACO Final Report HHSM-500-2011-00019i/HHSM-500-T0002
xi
Patient Experience. There was a higher level of beneficiary satisfaction related to access
to timely care, provider communication, and shared decision-making in larger ACOs. Also,
Pioneers with hospital ownership tended to have higher levels of satisfaction on improved
provider communication, overall rating of physician, and shared decision-making. ACOs
in areas with lower socioeconomic status had better scores on access to timely care and
physician rating, but lower socioeconomic status was associated with less access to
specialty care. In addition, ACOs in states that adopted Medicaid delivery reform scored
higher on access to timely care, provider communication, and overall rating of physician,
suggesting that new delivery approaches are better meeting patient needs. In contrast,
having multiple EHRs or using both claims and EHR data together to identify patients for
care management was associated with lower patient satisfaction.
Quality of Care. As measured by GPRO clinical quality measures, a key finding showed
that the presence of embedded care managers in the clinic setting was associated with
improved performance in quality of care. However, the factor with a consistently
significant positive effect on quality outcomes was the time trend between performance
years. In other words, the improvements in measure performance that occurred for all
Pioneer ACOs between 2012 and 2014 were larger than differences driven by the ACO
and market characteristics analyzed. From a lack of comparison data, we were unable to
determine whether this improvement in quality over time was specific to ACOs, or if care
was also improving on a broader basis over the same time period.
Did the Pioneer ACO Model facilitate increased financial risk-bearing and movement toward population health?
Despite the organizations’ depth of experience and capabilities, Pioneer ACO leadership discussed
some challenges of managing population health in the Pioneer ACO Model. These challenges were
exacerbated by specific model rules, such as the financial benchmark and beneficiary alignment
algorithm, that were not well understood by the Pioneer ACOs but had substantial impacts on
financial sustainability and, ultimately, some organizations’ willingness to continue as an ACO.
By the end of the second performance year (2013), 9 of the 32 original Pioneer ACOs announced
their intent to leave the model for 2014, with organizations that opted to leave the Pioneer model
more likely to be those that did not have shared savings in the prior performance year. By the end
of the second performance year, remaining Pioneer ACOs could qualify to receive population-
based payments in the third performance year if the ACO achieved savings of at least 2 percent in
PY1 and met other specific requirements. While 12 of the 23 Pioneer ACOs that participated
through PY2 qualified for these population-based payments, only 2 of the 12 decided to move
forward with the arrangement.
That Pioneer ACOs chose lower risk payment options and some decided to exit the Pioneer model
altogether suggest that, despite some evidence of readiness to take on more financial risk, most
organizations did not elect to do so. In some cases, being at risk for losses while learning to manage
the total cost of care under the rules of the Pioneer model and within a FFS context proved more
difficult than anticipated and was difficult to manage considering the ACOs’ resources and broader
organizational goals.

Pioneer ACO Final Report HHSM-500-2011-00019i/HHSM-500-T0002
xii
Yet by the end of the fifth performance year, 25 of the 32 original Pioneer ACOs continued to
function as a Medicare ACO. For 9 of the 25 ACOs that were unwilling to bear financial risk, the
Medicare Shared Savings Program provided the option of upside risk only. For the remaining 16
of 25 ACOs, the Pioneer model and, starting in 2016, the Next Generation model offered the
opportunity to assume higher levels of financial risk with the promise of sharing in greater rewards
for achieving the three-part aim of better care for individuals, better health for populations, and
lower costs.
Pioneer ACO Final Report HHSM-500-2011-00019i/HHSM-500-T0002
13
INTRODUCTION
Sections 3021 and 3022 of the Affordable Care Act (ACA) established Accountable Care
Organization (ACO) initiatives, which offer financial incentives for providers to cooperate and
share accountability in delivering better coordinated, higher quality, and more efficient care to
Medicare beneficiaries. The Pioneer ACO Model is sponsored by the Centers for Medicare &
Medicaid Services (CMS) Center for Medicare and Medicaid Innovation (CMMI). The Pioneer
model had an initial performance period that ran from January 1, 2102 through December 31,
2014. It also had two optional performance years, 2015 and 2016. This evaluation report covers
the initial three-year performance period of the Pioneer model.
Pioneer ACO Model background
The Pioneer ACO Model was a financial arrangement in which ACOs share in savings (or losses)
if they achieved quality scores and spending below (or above) a benchmark amount established by
CMS for a population of aligned beneficiaries in a given year (see below for an explanation of
alignment).3 Given the financial risk, the Pioneer ACO Model was designed for health care
organizations and providers experienced in coordinating care for patients across care settings and
had at least 15,000 aligned beneficiaries (5,000 for rural ACOs). CMS intended the model to allow
these provider groups to move more rapidly from a shared savings payment model to a population-
based payment model. To be eligible to participate in the Pioneer ACO Model, applicants had to
apply and be selected by CMS based on the strength of their applications. CMS selected 32
organizations to participate in the model starting January 1, 2012.
Payment
Under Medicare’s payment rules for the Pioneer model, participating providers continued to be
paid Medicare FFS rates for providing services. A Pioneer ACO could earn additional payments
for achieving savings relative to its benchmark spending level or may have had to pay money back
to Medicare if it experienced losses outside of a specified corridor for a given year. To calculate
savings/losses, CMS compared performance-year expenditures for aligned beneficiaries to
performance year-specific benchmarks established using a three-year historical claims benchmark
based on Medicare spending (parts A and B) for each ACO, a national spending growth factor,
and adjustment for beneficiary characteristics. A new benchmark was established for each
performance year. If an ACO’s performance year expenditures were less than the benchmark and
the results were outside an established margin of error—referred to as a minimum savings rate
(MSR)—then the Pioneer ACO would be deemed to have generated savings. Alternatively, if the
performance year expenditures were greater than the benchmark and the results were outside the
MSR, then the Pioneer ACO would be deemed to have generated losses. The ACOs were also
required to achieve a certain level of performance on specific quality measures to be eligible for
shared savings, though the first performance year required only that the measures be reported.4
3 See http://innovation.cms.gov/initiatives/Pioneer-ACO-Model/ for more information regarding the contractual
arrangements and incentives of Pioneer ACOs. 4 See https://www.cms.gov/Medicare/Medicare-Fee-for-Service-
Payment/sharedsavingsprogram/Downloads/ACO_Methodology_Factsheet_ICN907405.pdf for more information
on the benchmarking methodology used in PY1-PY3. A revised benchmarking methodology was implemented for
Pioneer ACO Final Report HHSM-500-2011-00019i/HHSM-500-T0002
14
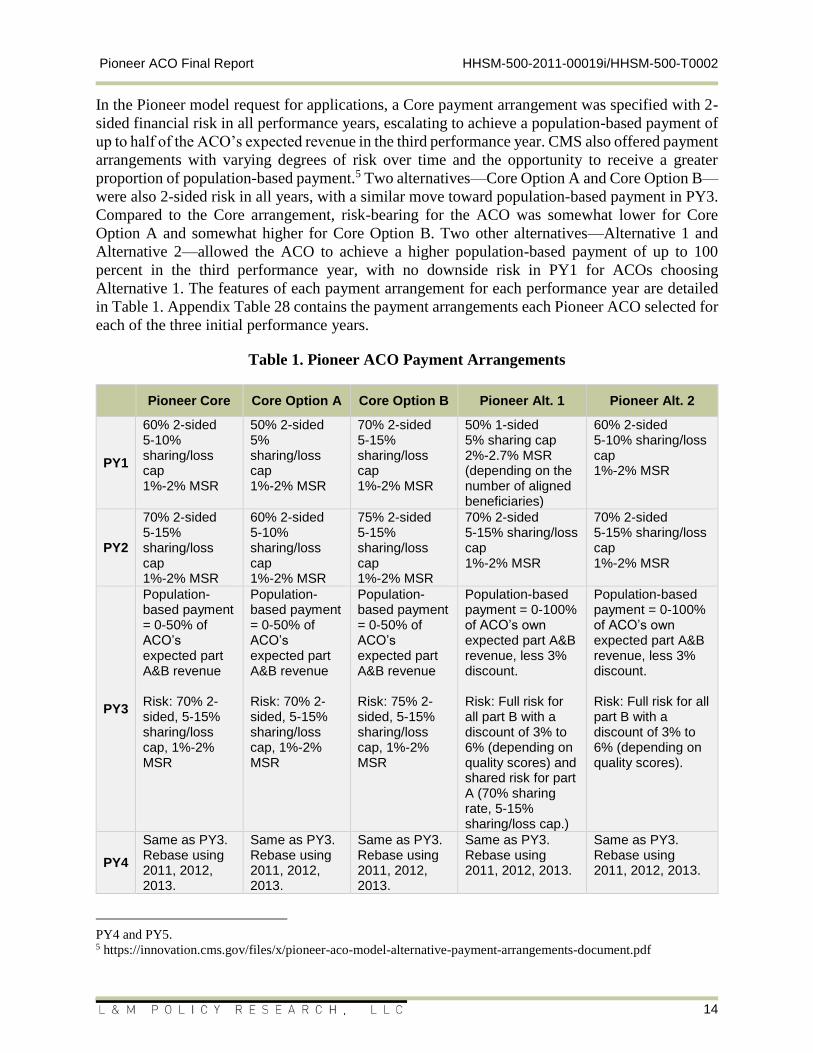
In the Pioneer model request for applications, a Core payment arrangement was specified with 2-
sided financial risk in all performance years, escalating to achieve a population-based payment of
up to half of the ACO’s expected revenue in the third performance year. CMS also offered payment
arrangements with varying degrees of risk over time and the opportunity to receive a greater
proportion of population-based payment.5 Two alternatives—Core Option A and Core Option B—
were also 2-sided risk in all years, with a similar move toward population-based payment in PY3.
Compared to the Core arrangement, risk-bearing for the ACO was somewhat lower for Core
Option A and somewhat higher for Core Option B. Two other alternatives—Alternative 1 and
Alternative 2—allowed the ACO to achieve a higher population-based payment of up to 100
percent in the third performance year, with no downside risk in PY1 for ACOs choosing
Alternative 1. The features of each payment arrangement for each performance year are detailed
in Table 1. Appendix Table 28 contains the payment arrangements each Pioneer ACO selected for
each of the three initial performance years.
Table 1. Pioneer ACO Payment Arrangements
Pioneer Core Core Option A Core Option B Pioneer Alt. 1 Pioneer Alt. 2
PY1
60% 2-sided 5-10% sharing/loss cap 1%-2% MSR
50% 2-sided 5% sharing/loss cap 1%-2% MSR
70% 2-sided 5-15% sharing/loss cap 1%-2% MSR
50% 1-sided 5% sharing cap 2%-2.7% MSR (depending on the number of aligned beneficiaries)
60% 2-sided 5-10% sharing/loss cap 1%-2% MSR
PY2
70% 2-sided 5-15% sharing/loss cap 1%-2% MSR
60% 2-sided 5-10% sharing/loss cap 1%-2% MSR
75% 2-sided 5-15% sharing/loss cap 1%-2% MSR
70% 2-sided 5-15% sharing/loss cap 1%-2% MSR
70% 2-sided 5-15% sharing/loss cap 1%-2% MSR
PY3
Population-based payment = 0-50% of ACO’s expected part A&B revenue Risk: 70% 2-sided, 5-15% sharing/loss cap, 1%-2% MSR
Population-based payment = 0-50% of ACO’s expected part A&B revenue Risk: 70% 2-sided, 5-15% sharing/loss cap, 1%-2% MSR
Population-based payment = 0-50% of ACO’s expected part A&B revenue Risk: 75% 2-sided, 5-15% sharing/loss cap, 1%-2% MSR
Population-based payment = 0-100% of ACO’s own expected part A&B revenue, less 3% discount. Risk: Full risk for all part B with a discount of 3% to 6% (depending on quality scores) and shared risk for part A (70% sharing rate, 5-15% sharing/loss cap.)
Population-based payment = 0-100% of ACO’s own expected part A&B revenue, less 3% discount. Risk: Full risk for all part B with a discount of 3% to 6% (depending on quality scores).
PY4
Same as PY3. Rebase using 2011, 2012, 2013.
Same as PY3. Rebase using 2011, 2012, 2013.
Same as PY3. Rebase using 2011, 2012, 2013.
Same as PY3. Rebase using 2011, 2012, 2013.
Same as PY3. Rebase using 2011, 2012, 2013.
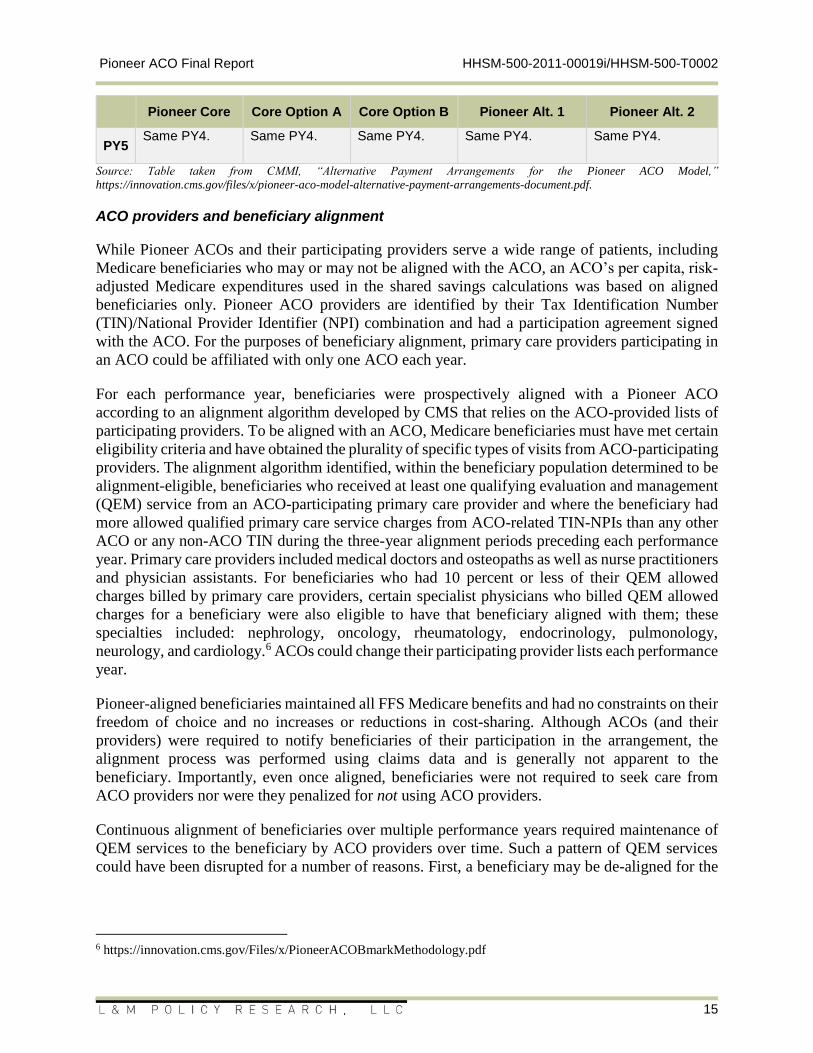
PY4 and PY5. 5 https://innovation.cms.gov/files/x/pioneer-aco-model-alternative-payment-arrangements-document.pdf
Pioneer ACO Final Report HHSM-500-2011-00019i/HHSM-500-T0002
15
Pioneer Core Core Option A Core Option B Pioneer Alt. 1 Pioneer Alt. 2
PY5 Same PY4. Same PY4. Same PY4. Same PY4. Same PY4.
Source: Table taken from CMMI, “Alternative Payment Arrangements for the Pioneer ACO Model,”
https://innovation.cms.gov/files/x/pioneer-aco-model-alternative-payment-arrangements-document.pdf.
ACO providers and beneficiary alignment
While Pioneer ACOs and their participating providers serve a wide range of patients, including
Medicare beneficiaries who may or may not be aligned with the ACO, an ACO’s per capita, risk-
adjusted Medicare expenditures used in the shared savings calculations was based on aligned
beneficiaries only. Pioneer ACO providers are identified by their Tax Identification Number
(TIN)/National Provider Identifier (NPI) combination and had a participation agreement signed
with the ACO. For the purposes of beneficiary alignment, primary care providers participating in
an ACO could be affiliated with only one ACO each year.
For each performance year, beneficiaries were prospectively aligned with a Pioneer ACO
according to an alignment algorithm developed by CMS that relies on the ACO-provided lists of
participating providers. To be aligned with an ACO, Medicare beneficiaries must have met certain
eligibility criteria and have obtained the plurality of specific types of visits from ACO-participating
providers. The alignment algorithm identified, within the beneficiary population determined to be
alignment-eligible, beneficiaries who received at least one qualifying evaluation and management
(QEM) service from an ACO-participating primary care provider and where the beneficiary had
more allowed qualified primary care service charges from ACO-related TIN-NPIs than any other
ACO or any non-ACO TIN during the three-year alignment periods preceding each performance
year. Primary care providers included medical doctors and osteopaths as well as nurse practitioners
and physician assistants. For beneficiaries who had 10 percent or less of their QEM allowed
charges billed by primary care providers, certain specialist physicians who billed QEM allowed
charges for a beneficiary were also eligible to have that beneficiary aligned with them; these
specialties included: nephrology, oncology, rheumatology, endocrinology, pulmonology,
neurology, and cardiology.6 ACOs could change their participating provider lists each performance
year.
Pioneer-aligned beneficiaries maintained all FFS Medicare benefits and had no constraints on their
freedom of choice and no increases or reductions in cost-sharing. Although ACOs (and their
providers) were required to notify beneficiaries of their participation in the arrangement, the
alignment process was performed using claims data and is generally not apparent to the
beneficiary. Importantly, even once aligned, beneficiaries were not required to seek care from
ACO providers nor were they penalized for not using ACO providers.
Continuous alignment of beneficiaries over multiple performance years required maintenance of
QEM services to the beneficiary by ACO providers over time. Such a pattern of QEM services
could have been disrupted for a number of reasons. First, a beneficiary may be de-aligned for the
6 https://innovation.cms.gov/Files/x/PioneerACOBmarkMethodology.pdf
Pioneer ACO Final Report HHSM-500-2011-00019i/HHSM-500-T0002
16
performance year by receiving more than half of QEM services outside of the ACO’s service area.7
Second, a beneficiary may not be aligned in the following performance period by no longer visiting
providers in the same ACO. Third, a beneficiary may not be aligned in a subsequent performance
period if the same providers are no long affiliated with the ACO.
Context for this report
In May 2015, the CMS Office of the Actuary certified that the Pioneer ACO Model was promising
enough in its ability to lower Medicare program spending without compromising quality that it
could become a permanent part of the Medicare program.8 Following model certification, CMS
directed the L&M Policy Research evaluation team to focus this final report on describing key
features of Pioneer ACOs and their motivations for participating in the model. It traces the
continuity of provider and beneficiary populations during the initial three-year performance period
and shows how changes in practice arrangements and patient health care seeking behaviors,
coupled with the Pioneer model rules for participation and alignment, may contribute to the
dynamic nature of the ACOs. It also summarizes qualitative information on the strategies that
ACOs used to communicate with their providers, presents data on physician perspectives on ACOs
from a survey, and describes Pioneer ACOs’ activities around care management and some of the
successes and challenges the Pioneer ACOs faced. We also present findings related to Pioneer
ACOs’ performance on mandatory quality measures. The report concludes with a description of
the Pioneer ACOs’ participation status by the end of the full five-year performance period and
circumstances that may have influenced their participation decisions.
7 Beneficiaries may also lose ACO-alignment designation during the performance year if they enroll in Medicare
Advantage, lose Part A or Part B coverage, Medicare becomes the secondary payer, or they move out of the United
States. 8 See https://www.cms.gov/Research-Statistics-Data-and-Systems/Research/ActuarialStudies/Downloads/Pioneer-
Certification-2015-04-10.pdf
Pioneer ACO Final Report HHSM-500-2011-00019i/HHSM-500-T0002
17
WHO ARE THE PIONEER ACOS?
While the Pioneer ACOs represent a diverse set of organizations at different stages of development
facing different internal and external challenges, their high-level motivations for participating in
the Pioneer model were quite similar. We synthesized our discussions with ACO leaders focused
on the organizations’ reasons for participating in the Pioneer model, which included the first
quarterly interview where ACO leaders were asked directly about their specific motivations for
joining the model as well as findings from other interviews where leaders described ACO strengths
and business strategies. A common theme embedded in many of these discussions was an interest
in improving care for their patients, to be achieved through a focus on value, innovation, care
management, and clinical integration. This section discusses the Pioneer motivations for
participating in the model, provides an overview of the ACOs’ organizational and structural
characteristics, and documents how these organizations were evolving throughout the model’s
initial three-year performance period through fluctuations in their participating provider and
aligned beneficiary populations.
Overwhelmingly, past experience and ongoing initiatives motivated organizations to participate in the Pioneer ACO Model
The vast majority of Pioneer ACO leaders who specifically identified reasons for participation
indicated that the model appeared to be a logical step in the organization’s evolution and would
allow them to continue work they were already engaged in to improve patient care. Most Pioneer
ACOs reported a strong sense that their previous experience with managed care and quality
initiatives, existing health information technology (HIT) infrastructure, and employed physicians
were factors that positioned them for success. Framing the Pioneer model as part of a planned
progression in their organizations’ evolution, a number of ACO leaders used phrases such as “good
fit,” “natural extension,” “well-suited,” and “natural transition” to describe their participation
rationale. Many of the organizations also referred to work they had begun prior to participating in
the model, which they believed would benefit the ACO. For example, one ACO noted that it had
already started to build a “clinically integrated organization” and another said that it had “started
down the path of preparing for value-based payment.” Many ACOs indicated that the model
aligned well with what the organization was already doing, with one noting ACO formation was
“filling out work [it] had been doing across the patient spectrum [but now doing under] a common
model” and another describing the ACO as “an addition of a service line.”
A small subset of these ACOs, while echoing the larger sentiment of continuing prior efforts,
volunteered that they were feeling that progress prior to being an ACO was slow or especially
challenging within their organizations. They viewed the Pioneer model as a way to accelerate the
move toward value-based payment, with one indicating that the model served as a “nice catalyst
to move us forward at a faster rate.” Several Pioneer ACOs noted that the Pioneer model offered
them the ability to continue their work and become more proficient in population health and care
management; as two different ACOs put it, being a Pioneer was an “opportunity to test the
investments we were making” and “to test various theories and have something to say about it.”
Another Pioneer noted that it had an alliance in place with a large physician practice, “but the
Pioneer helped to accelerate a lot of the work we already wanted to do [together].”
Pioneer ACO Final Report HHSM-500-2011-00019i/HHSM-500-T0002
18
Not surprisingly, given the experience required for selection as part of the model, many of the
Pioneer ACOs are part of large health care systems. Thus, a number of ACOs indicated that their
organization wanted to help make the decisions that would shape change in health care delivery.
One ACO CEO indicated that it was the organization’s “duty as a leading health system” to
participate, while others said that they wanted to “help develop models for the future,” “shape how
the program works,” and “be a leader in proving the concept of innovative care.”
One ACO said that the organization was feeling “increasing pressure from major employers” and
another indicated that market pressure drove them to collaborate. These ACOs expected that
becoming a Pioneer would help strengthen their market position so they could remain competitive
and keep pace with a changing health care environment. Another ACO commented that the model
offered “a great way to learn from others.” Finally, one ACO said that becoming a Pioneer ACO
fulfilled its mission to serve the local population, “proving this concept as it applies to safety net
populations.”
Organizations varied in structure, markets, and size
Most of the Pioneer ACOs were part of larger health systems with broad portfolios and varying
ongoing commercial and public sector contracts and initiatives. As a result, the ACOs that these
organizations established were a heterogeneous group in terms of location, size, organizational
structure, and other characteristics, with many of these differences driven by the goals and business
of the larger organizations as well as the markets in which they were engaged.
What do the ACO markets look like?
Each ACO develops and operates within the context of a market, or a geographic area generally
encompassing the health care providers and facilities comprising the ACO and the beneficiaries
served.9 The ACOs’ markets vary along a number of dimensions—size, competitiveness, health
care infrastructure, practice style or culture, and beneficiary health status—in ways that can have
both positive and negative impacts on ACO development and performance. For example, a highly
competitive market with many providers may make it difficult to establish effective referral
relationships and coordinate care across settings. Markets with established players that are
experienced in managing risk under different arrangements may be further along the continuum
toward population-based health. Markets with historically higher spending or a population with
greater illness severity may experience greater challenges in managing care to achieve quality
benchmarks while lowering costs. As noted above, several ACOs indicated that becoming a
Pioneer was part of leading or keeping up with changes in the health care delivery system, and a
few ACOs noted that they felt market or competitive pressure to be part of an ACO.
The original 32 Pioneer ACOs were located across 18 states, with concentration in a handful of
states; there were six in California, five in Massachusetts, and three in Minnesota. In contrast, just
three Pioneer ACOs represented the entire South. This somewhat skewed distribution of ACOs is
reflected in the aligned beneficiary population: the 11 ACOs in California and Massachusetts
9 For the purposes of this report, the evaluation defined an ACO’s market to reflect the geographic distribution of
aligned beneficiaries by including counties where the ACO draws at least 1 percent of its aligned population in a given
performance year.
Pioneer ACO Final Report HHSM-500-2011-00019i/HHSM-500-T0002
19
together represented almost half of all aligned beneficiaries in the first performance year.10
Approximately two-thirds of the ACOs were located in large metropolitan areas, many with well-
developed and competitive health care markets, while the others were in mid-size markets or mixed
rurality geographic areas.
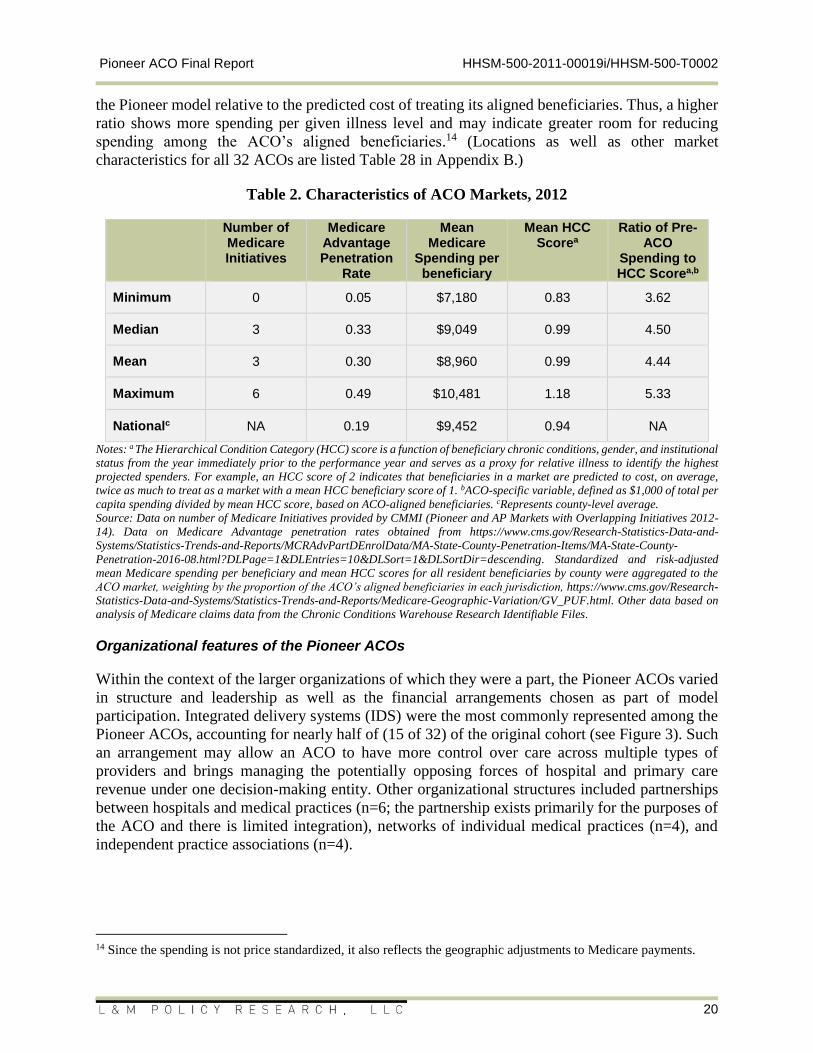
Selected market-level indicators relevant to an ACO in its outlook or decision-making are shown
in Table 2. The number of co-occurring Medicare initiatives is one measure of the level of
alternative payment model activity in a given market and is a proxy for the appetite for, or
competitive pressure to experiment with, new models for improving care delivery.11 The measure
presents an incomplete picture to the extent that organizations with experience in innovative or
coordinated care delivery are not participating in Medicare initiatives. Markets in certain urban
areas in the Eastern or Midwestern U.S.—Philadelphia (Renaissance), New York City
(Montefiore), and Detroit (Michigan Pioneer and University of Michigan)—had the highest
number of initiatives in 2012, either five or six, while markets varying in size but largely in the
West had either zero or one initiatives in that year (including HealthCare Partners of Nevada in
Las Vegas, Presbyterian in New Mexico, Trinity in Iowa, and Physician Health Partners in
Denver). The Medicare Advantage (MA) penetration rate (the ratio of MA enrollees to eligible
beneficiaries) is one indicator of the level of experience managing risk in the market; the markets
with the highest MA penetration rates (above 40 percent) were in the West and in the Minneapolis
area. Mean total Medicare spending per beneficiary also shows a considerable range, with mean
spending in the highest-spending market almost 50 percent greater than that in the lowest-spending
market.12 Mean Hierarchical Condition Category (HCC) score is a measure of the predicted cost
of treating the average beneficiary in the market based on beneficiary chronic conditions, gender,
and institutional status from the year immediately prior to the performance year; again, there is
substantial variation from the market with the highest score more than 40 percent greater than the
market with the lowest HCC score.13
The final measure in the table is ACO-specific rather than market-level. The ratio of spending per
HCC score is derived by dividing 2010-2011 per-beneficiary spending by the 2012 mean HCC
score for the beneficiaries aligned with each ACO. The ratio juxtaposes the ACO’s spending
among beneficiaries who would have been aligned with the ACO’s providers prior to the start of
10 See https://innovation.cms.gov/Files/x/pioneeraco-fncl-py1.pdf for a list of the number of aligned beneficiaries in
2012 by ACO. 11 Initiatives are counted uniquely if any counties where an initiative is occurring overlaps with an ACO’s market in
a given year and include the following: Medicare Shared Savings Program ACOs other than Advance Payment ACOs;
Multi-Payer Advanced Primary Care Practice Demonstration; Physician Group Practice Transition Demonstration;
Health Quality Partners Demonstration; Independence at Home Demonstration; Community Based Care Transitions
Program Demonstration; Comprehensive Primary Care Initiative; Federally Qualified Health Center Advanced
Primary Care Demonstration; Partnership for Patients; Rural Community Hospital Demonstration; State Innovation
Models; Maryland All-Payer Model; and Bundled Payments for Care Improvements 1. 12
To calculate mean Medicare spending per beneficiary at the ACO level, standardized and risk-adjusted mean
Medicare spending per beneficiary for all beneficiaries in a county was aggregated to the ACO market and weighted
by the proportion of the ACO’s aligned beneficiaries in each county, https://www.cms.gov/Research-Statistics-Data-
and-Systems/Statistics-Trends-and-Reports/Medicare-Geographic-Variation/GV_PUF.html. 13 To calculate mean HCC scores at the ACO level, mean HCC scores for all Medicare beneficiaries in a county were
aggregated to the ACO market and weighted by the proportion of the ACO’s aligned beneficiaries in each county,
https://www.cms.gov/Research-Statistics-Data-and-Systems/Statistics-Trends-and-Reports/Medicare-Geographic-
Variation/GV_PUF.html.
Pioneer ACO Final Report HHSM-500-2011-00019i/HHSM-500-T0002
20
the Pioneer model relative to the predicted cost of treating its aligned beneficiaries. Thus, a higher
ratio shows more spending per given illness level and may indicate greater room for reducing
spending among the ACO’s aligned beneficiaries.14 (Locations as well as other market
characteristics for all 32 ACOs are listed Table 28 in Appendix B.)
Table 2. Characteristics of ACO Markets, 2012
Number of Medicare Initiatives
Medicare Advantage Penetration
Rate
Mean Medicare
Spending per beneficiary
Mean HCC Scorea
Ratio of Pre-ACO
Spending to HCC Scorea,b
Minimum 0 0.05 $7,180 0.83 3.62
Median 3 0.33 $9,049 0.99 4.50
Mean 3 0.30 $8,960 0.99 4.44
Maximum 6 0.49 $10,481 1.18 5.33
Nationalc NA 0.19 $9,452 0.94 NA
Notes: a The Hierarchical Condition Category (HCC) score is a function of beneficiary chronic conditions, gender, and institutional
status from the year immediately prior to the performance year and serves as a proxy for relative illness to identify the highest
projected spenders. For example, an HCC score of 2 indicates that beneficiaries in a market are predicted to cost, on average,
twice as much to treat as a market with a mean HCC beneficiary score of 1. bACO-specific variable, defined as $1,000 of total per
capita spending divided by mean HCC score, based on ACO-aligned beneficiaries. cRepresents county-level average.
Source: Data on number of Medicare Initiatives provided by CMMI (Pioneer and AP Markets with Overlapping Initiatives 2012-
14). Data on Medicare Advantage penetration rates obtained from https://www.cms.gov/Research-Statistics-Data-and-
Systems/Statistics-Trends-and-Reports/MCRAdvPartDEnrolData/MA-State-County-Penetration-Items/MA-State-County-
Penetration-2016-08.html?DLPage=1&DLEntries=10&DLSort=1&DLSortDir=descending. Standardized and risk-adjusted
mean Medicare spending per beneficiary and mean HCC scores for all resident beneficiaries by county were aggregated to the
ACO market, weighting by the proportion of the ACO’s aligned beneficiaries in each jurisdiction, https://www.cms.gov/Research-
Statistics-Data-and-Systems/Statistics-Trends-and-Reports/Medicare-Geographic-Variation/GV_PUF.html. Other data based on
analysis of Medicare claims data from the Chronic Conditions Warehouse Research Identifiable Files.
Organizational features of the Pioneer ACOs
Within the context of the larger organizations of which they were a part, the Pioneer ACOs varied
in structure and leadership as well as the financial arrangements chosen as part of model
participation. Integrated delivery systems (IDS) were the most commonly represented among the
Pioneer ACOs, accounting for nearly half of (15 of 32) of the original cohort (see Figure 3). Such
an arrangement may allow an ACO to have more control over care across multiple types of
providers and brings managing the potentially opposing forces of hospital and primary care
revenue under one decision-making entity. Other organizational structures included partnerships
between hospitals and medical practices (n=6; the partnership exists primarily for the purposes of
the ACO and there is limited integration), networks of individual medical practices (n=4), and
independent practice associations (n=4).
14 Since the spending is not price standardized, it also reflects the geographic adjustments to Medicare payments.
Pioneer ACO Final Report HHSM-500-2011-00019i/HHSM-500-T0002
21
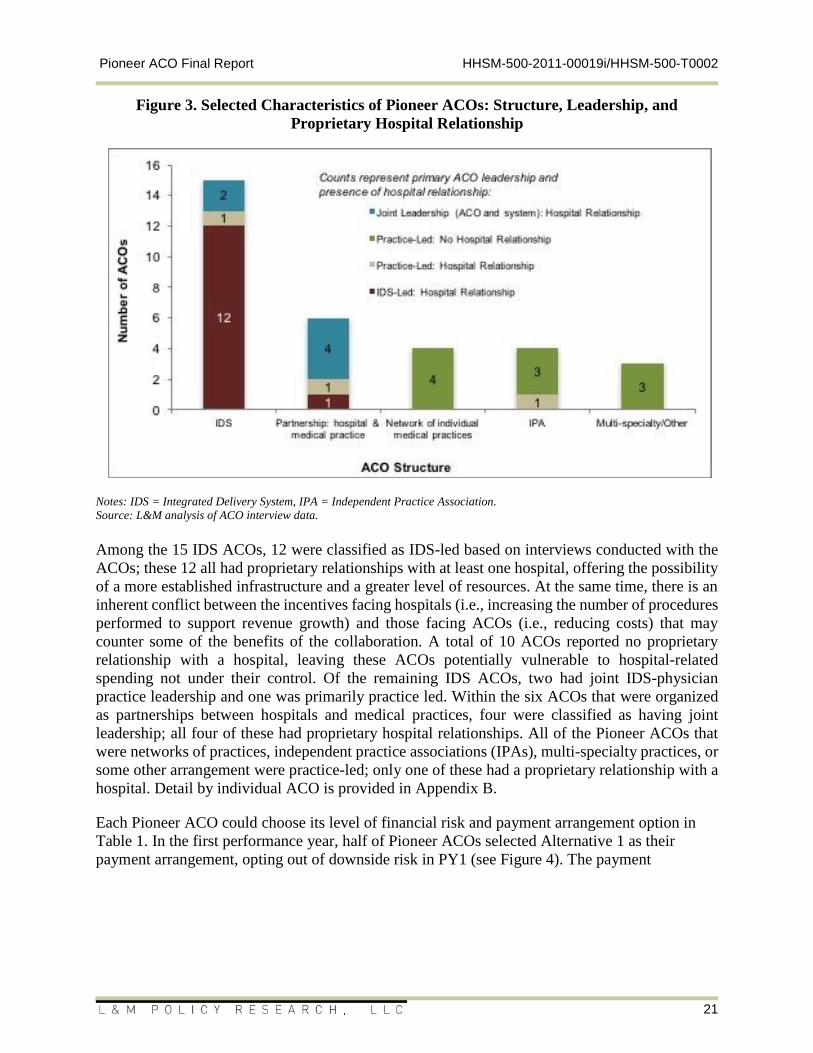
Figure 3. Selected Characteristics of Pioneer ACOs: Structure, Leadership, and
Proprietary Hospital Relationship
Notes: IDS = Integrated Delivery System, IPA = Independent Practice Association.
Source: L&M analysis of ACO interview data.
Among the 15 IDS ACOs, 12 were classified as IDS-led based on interviews conducted with the
ACOs; these 12 all had proprietary relationships with at least one hospital, offering the possibility
of a more established infrastructure and a greater level of resources. At the same time, there is an
inherent conflict between the incentives facing hospitals (i.e., increasing the number of procedures
performed to support revenue growth) and those facing ACOs (i.e., reducing costs) that may
counter some of the benefits of the collaboration. A total of 10 ACOs reported no proprietary
relationship with a hospital, leaving these ACOs potentially vulnerable to hospital-related
spending not under their control. Of the remaining IDS ACOs, two had joint IDS-physician
practice leadership and one was primarily practice led. Within the six ACOs that were organized
as partnerships between hospitals and medical practices, four were classified as having joint
leadership; all four of these had proprietary hospital relationships. All of the Pioneer ACOs that
were networks of practices, independent practice associations (IPAs), multi-specialty practices, or
some other arrangement were practice-led; only one of these had a proprietary relationship with a
hospital. Detail by individual ACO is provided in Appendix B.
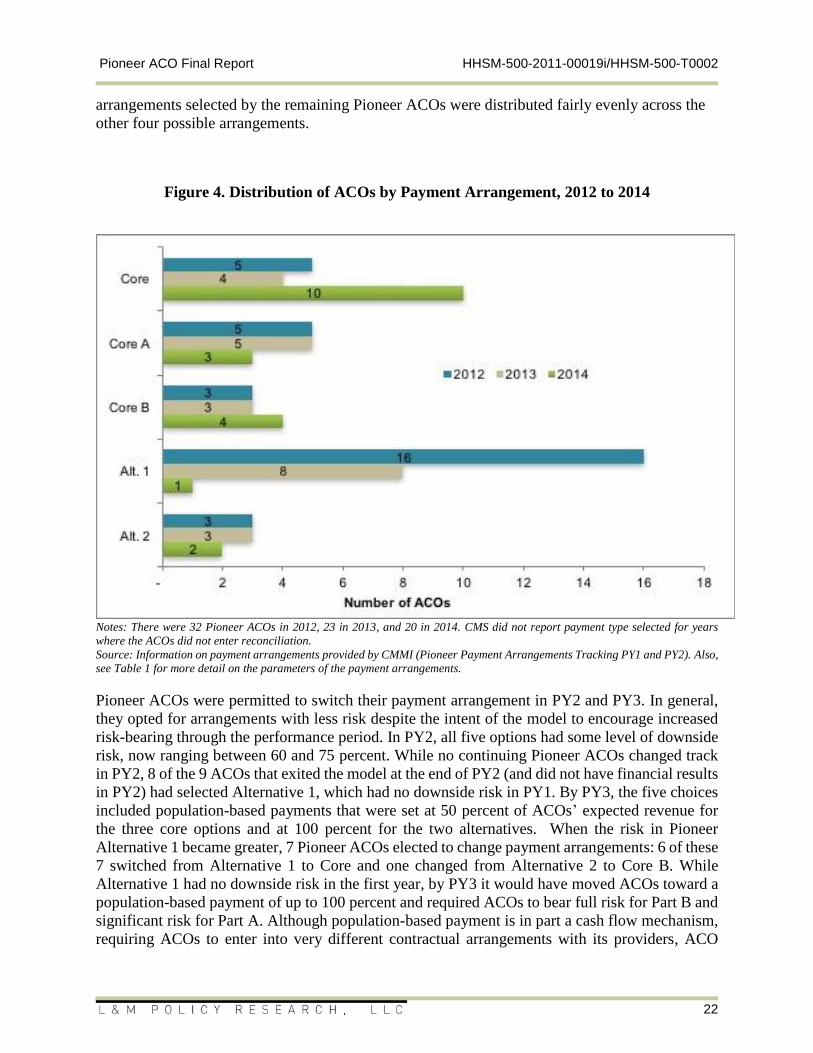
Each Pioneer ACO could choose its level of financial risk and payment arrangement option in
Table 1. In the first performance year, half of Pioneer ACOs selected Alternative 1 as their
payment arrangement, opting out of downside risk in PY1 (see Figure 4). The payment
Pioneer ACO Final Report HHSM-500-2011-00019i/HHSM-500-T0002
22
arrangements selected by the remaining Pioneer ACOs were distributed fairly evenly across the
other four possible arrangements.
Figure 4. Distribution of ACOs by Payment Arrangement, 2012 to 2014
Notes: There were 32 Pioneer ACOs in 2012, 23 in 2013, and 20 in 2014. CMS did not report payment type selected for years
where the ACOs did not enter reconciliation.
Source: Information on payment arrangements provided by CMMI (Pioneer Payment Arrangements Tracking PY1 and PY2). Also,
see Table 1 for more detail on the parameters of the payment arrangements.
Pioneer ACOs were permitted to switch their payment arrangement in PY2 and PY3. In general,
they opted for arrangements with less risk despite the intent of the model to encourage increased
risk-bearing through the performance period. In PY2, all five options had some level of downside
risk, now ranging between 60 and 75 percent. While no continuing Pioneer ACOs changed track
in PY2, 8 of the 9 ACOs that exited the model at the end of PY2 (and did not have financial results
in PY2) had selected Alternative 1, which had no downside risk in PY1. By PY3, the five choices
included population-based payments that were set at 50 percent of ACOs’ expected revenue for
the three core options and at 100 percent for the two alternatives. When the risk in Pioneer
Alternative 1 became greater, 7 Pioneer ACOs elected to change payment arrangements: 6 of these
7 switched from Alternative 1 to Core and one changed from Alternative 2 to Core B. While
Alternative 1 had no downside risk in the first year, by PY3 it would have moved ACOs toward a
population-based payment of up to 100 percent and required ACOs to bear full risk for Part B and
significant risk for Part A. Although population-based payment is in part a cash flow mechanism,
requiring ACOs to enter into very different contractual arrangements with its providers, ACO
Pioneer ACO Final Report HHSM-500-2011-00019i/HHSM-500-T0002
23
leadership expressed reticence with adopting population-based payment and taking additional
financial risk. Thus, opting for the Core track in 2014 was a step back from increased risk bearing.
Table 28 in Appendix B provides more information on payment track as well as other
organizational characteristics for each of the 32 Pioneer ACOs.
Numbers of participating providers and aligned beneficiaries varied across ACOs and performance years
In this section, we present information on the size of the ACOs in terms of the numbers of
participating providers and aligned beneficiaries.15 For many ACOs, providers were primarily
connected to the ACO because they were part of the health system in which the ACO operated.
The vast majority of providers participating in Pioneer ACOs were not directly part of the decision
to participate, but rather were employed by or part of a medical group that joined the ACO.
The numbers of participating providers and aligned beneficiaries varied across Pioneer ACOs as
well as across performance years. Size could lend to the ability to confer certain benefits, for
example, if there were economies of scale in implementation of EHRs, or if size allowed ACOs to
use their leverage to demand certain efficiencies with ancillary care providers (e.g., post-acute
care). On the other hand, a smaller ACO, as measured by the number of participating providers,
may find it easier to influence behaviors that affect spending and quality, with more direct
interactions between ACO leadership and providers and greater opportunities for participating
providers to be part of ACO governance.
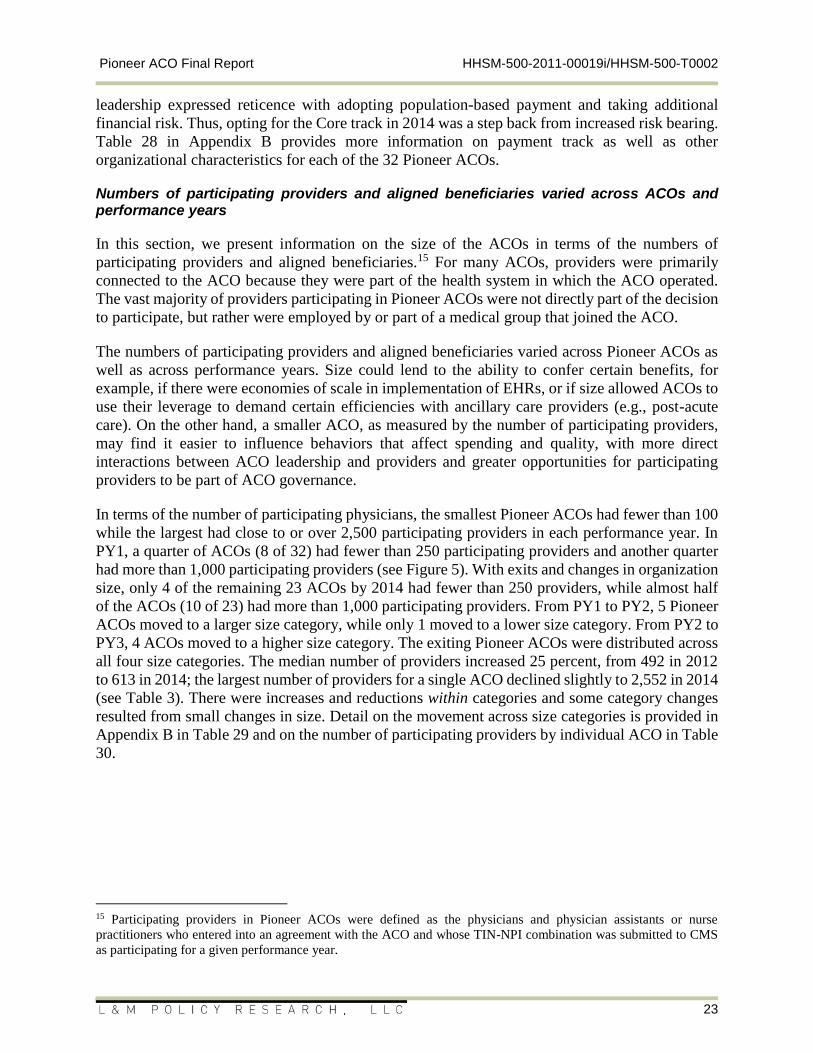
In terms of the number of participating physicians, the smallest Pioneer ACOs had fewer than 100
while the largest had close to or over 2,500 participating providers in each performance year. In
PY1, a quarter of ACOs (8 of 32) had fewer than 250 participating providers and another quarter
had more than 1,000 participating providers (see Figure 5). With exits and changes in organization
size, only 4 of the remaining 23 ACOs by 2014 had fewer than 250 providers, while almost half
of the ACOs (10 of 23) had more than 1,000 participating providers. From PY1 to PY2, 5 Pioneer
ACOs moved to a larger size category, while only 1 moved to a lower size category. From PY2 to
PY3, 4 ACOs moved to a higher size category. The exiting Pioneer ACOs were distributed across
all four size categories. The median number of providers increased 25 percent, from 492 in 2012
to 613 in 2014; the largest number of providers for a single ACO declined slightly to 2,552 in 2014
(see Table 3). There were increases and reductions within categories and some category changes
resulted from small changes in size. Detail on the movement across size categories is provided in
Appendix B in Table 29 and on the number of participating providers by individual ACO in Table
30.
15 Participating providers in Pioneer ACOs were defined as the physicians and physician assistants or nurse
practitioners who entered into an agreement with the ACO and whose TIN-NPI combination was submitted to CMS
as participating for a given performance year.
Pioneer ACO Final Report HHSM-500-2011-00019i/HHSM-500-T0002
24
Figure 5. Distribution of ACOs by Number of Participating Providers, 2012 to 2014
Notes: There were 32 ACOs participating in PY1 and PY2 and 23 ACOs participating in PY3. Participating providers were defined
by NPI.
Source: L&M tabulations based on lists of participating providers submitted to CMS by ACO in each performance year.
Table 3. Distribution of Participating Providers across Pioneer ACOs, 2012 to 2014
2012 (n=32) 2013 (n=32) 2014 (n=23)
Minimum 67 84 55
Median 492 631 613
Mean 725 799 904
Maximum 2,966 2,464 2,552
Notes: Participating providers were defined by NPI.
Source: L&M tabulations based on lists of participating providers submitted to CMS by ACO in each performance year.
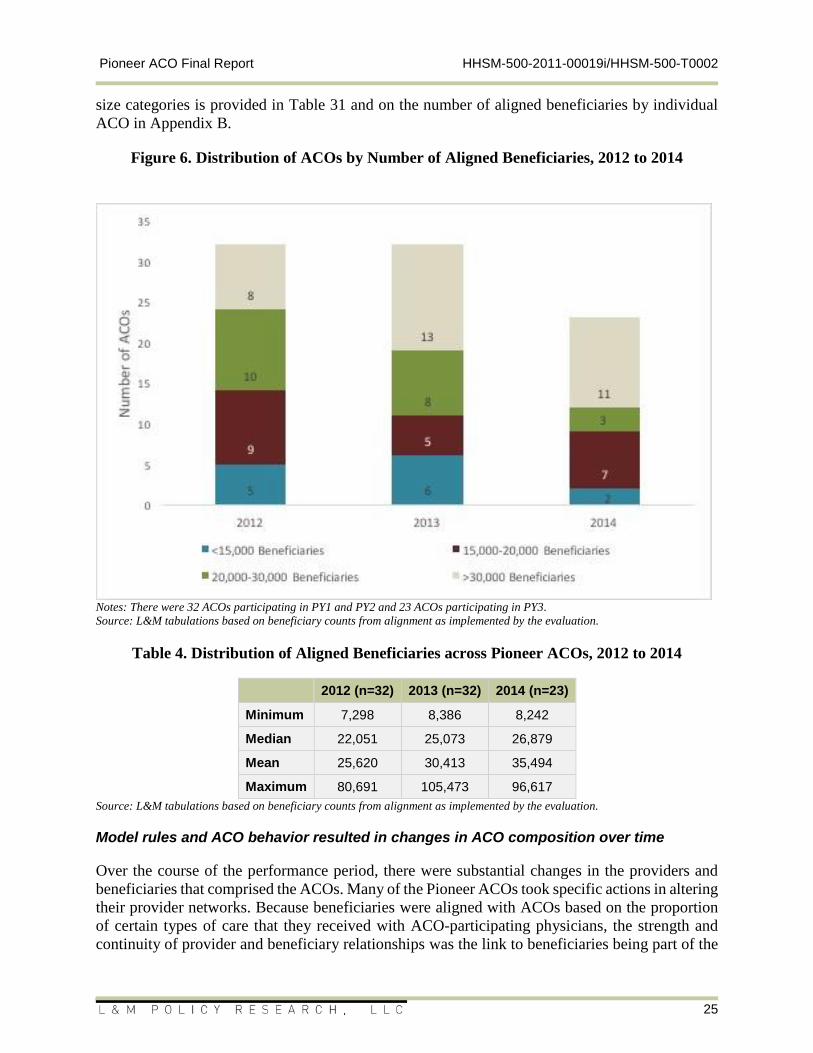
In terms of the number of beneficiaries served by the ACO in PY1, almost half of Pioneer ACOs
(14 of 32) had fewer than 20,000 aligned beneficiaries and a quarter had more than 30,000 aligned
beneficiaries (see Figure 6). By 2014, the number of Pioneer ACOs with more than 30,000 aligned
beneficiaries had increased to 11 (almost half of the 23 remaining), and only 2 had less than 15,000
aligned beneficiaries. As with providers, there were no clear patterns in terms of growth or
continued model participation by beneficiary size category, though there were other increases and
reductions within these size groupings and some category changes were small. From PY1 to PY2,
7 Pioneer ACOs moved to a larger size category, while only 1 moved to a lower size category.
From PY2 to PY3, 3 ACOs moved to a larger size category and 2 ACOs moved to a smaller size
category. Again, the exiting Pioneer ACOs were distributed across all four size categories. The
median size increased 22 percent, from 22,051 in 2012 to 26,879 in 2014, with the largest Pioneer
ACO reaching almost 100,000 aligned beneficiaries (see Table 4). Detail on the movement across
Pioneer ACO Final Report HHSM-500-2011-00019i/HHSM-500-T0002
25
size categories is provided in Table 31 and on the number of aligned beneficiaries by individual
ACO in Appendix B.
Figure 6. Distribution of ACOs by Number of Aligned Beneficiaries, 2012 to 2014
Notes: There were 32 ACOs participating in PY1 and PY2 and 23 ACOs participating in PY3.
Source: L&M tabulations based on beneficiary counts from alignment as implemented by the evaluation.
Table 4. Distribution of Aligned Beneficiaries across Pioneer ACOs, 2012 to 2014
2012 (n=32) 2013 (n=32) 2014 (n=23)
Minimum 7,298 8,386 8,242
Median 22,051 25,073 26,879
Mean 25,620 30,413 35,494
Maximum 80,691 105,473 96,617
Source: L&M tabulations based on beneficiary counts from alignment as implemented by the evaluation.
Model rules and ACO behavior resulted in changes in ACO composition over time
Over the course of the performance period, there were substantial changes in the providers and
beneficiaries that comprised the ACOs. Many of the Pioneer ACOs took specific actions in altering
their provider networks. Because beneficiaries were aligned with ACOs based on the proportion
of certain types of care that they received with ACO-participating physicians, the strength and
continuity of provider and beneficiary relationships was the link to beneficiaries being part of the
Pioneer ACO Final Report HHSM-500-2011-00019i/HHSM-500-T0002
26
ACO, and any provider turnover or changes in beneficiaries’ visit patterns with ACO providers
may have also disrupted ACO-beneficiary relationships.
Turnover among participating providers
In this section, we examine the extent of continuity (or turnover) in the set of participating
providers, pooled and by ACO, in each of the three years of the initial performance period.
Changes in participating providers may be initiated by the provider (or provider group) or by the
ACO, with individual physicians or entire practices joining or exiting between performance years.
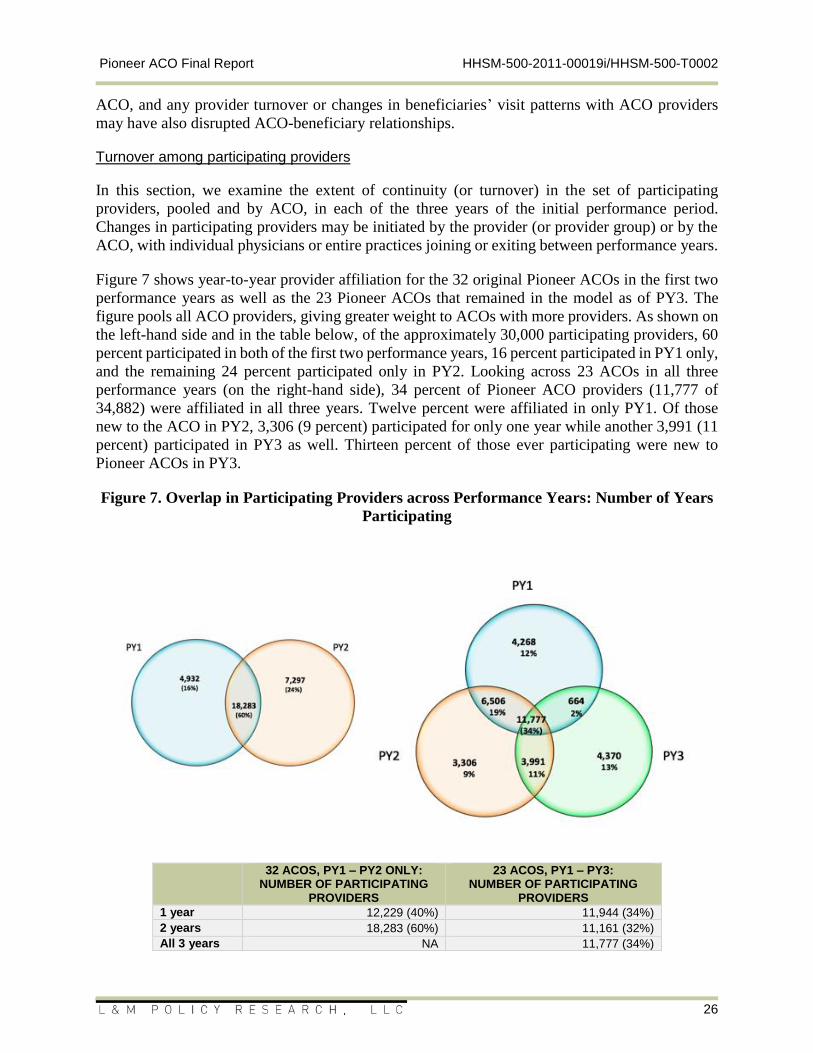
Figure 7 shows year-to-year provider affiliation for the 32 original Pioneer ACOs in the first two
performance years as well as the 23 Pioneer ACOs that remained in the model as of PY3. The
figure pools all ACO providers, giving greater weight to ACOs with more providers. As shown on
the left-hand side and in the table below, of the approximately 30,000 participating providers, 60
percent participated in both of the first two performance years, 16 percent participated in PY1 only,
and the remaining 24 percent participated only in PY2. Looking across 23 ACOs in all three
performance years (on the right-hand side), 34 percent of Pioneer ACO providers (11,777 of
34,882) were affiliated in all three years. Twelve percent were affiliated in only PY1. Of those
new to the ACO in PY2, 3,306 (9 percent) participated for only one year while another 3,991 (11
percent) participated in PY3 as well. Thirteen percent of those ever participating were new to
Pioneer ACOs in PY3.
Figure 7. Overlap in Participating Providers across Performance Years: Number of Years
Participating
32 ACOS, PY1 – PY2 ONLY:
NUMBER OF PARTICIPATING PROVIDERS
23 ACOS, PY1 – PY3: NUMBER OF PARTICIPATING
PROVIDERS
1 year 12,229 (40%) 11,944 (34%)
2 years 18,283 (60%) 11,161 (32%)
All 3 years NA 11,777 (34%)
Pioneer ACO Final Report HHSM-500-2011-00019i/HHSM-500-T0002
27
32 ACOS, PY1 – PY2 ONLY:
NUMBER OF PARTICIPATING PROVIDERS
23 ACOS, PY1 – PY3: NUMBER OF PARTICIPATING
PROVIDERS
Any year 30,512 (100%) 34,882 (100%)
Notes: The Venn diagram on the left-hand side includes all 32 Pioneer ACOs for the first two performance years; the Venn diagram
on the right-hand side includes 23 Pioneer ACOs remaining as of PY3. Participating providers were defined by NPI.
Source: L&M tabulations based on lists of participating providers submitted to CMS by ACO in each performance year.
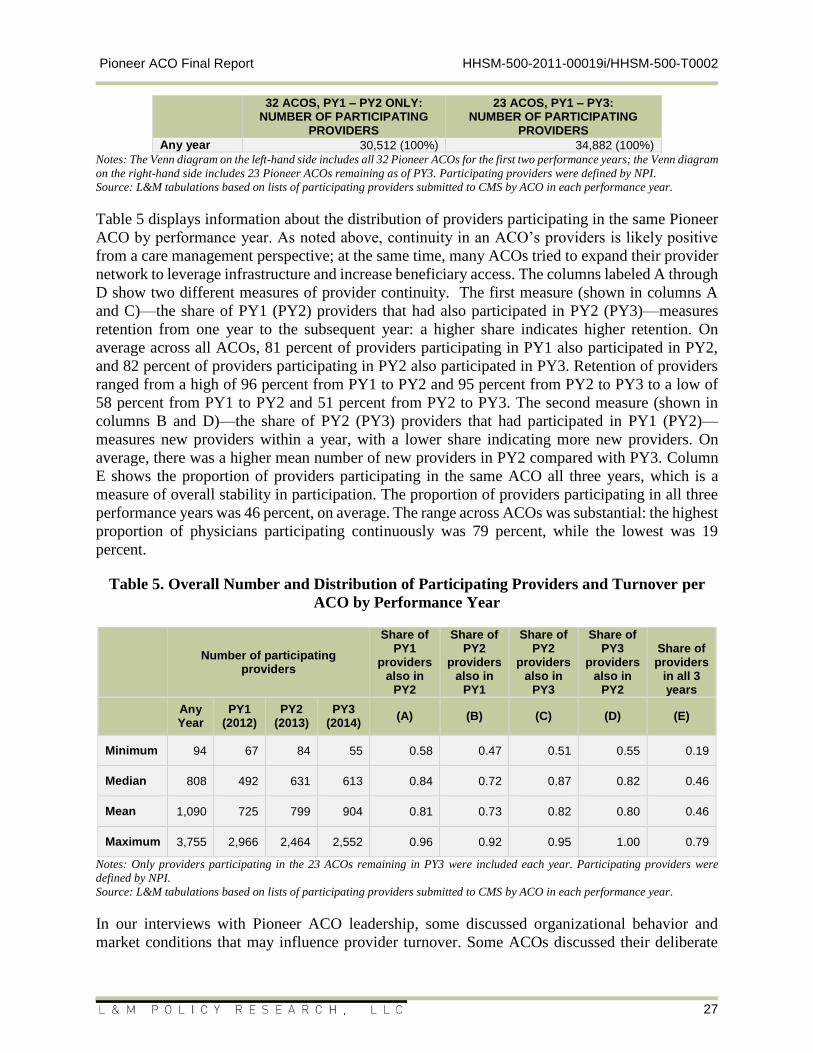
Table 5 displays information about the distribution of providers participating in the same Pioneer
ACO by performance year. As noted above, continuity in an ACO’s providers is likely positive
from a care management perspective; at the same time, many ACOs tried to expand their provider
network to leverage infrastructure and increase beneficiary access. The columns labeled A through
D show two different measures of provider continuity. The first measure (shown in columns A
and C)—the share of PY1 (PY2) providers that had also participated in PY2 (PY3)—measures
retention from one year to the subsequent year: a higher share indicates higher retention. On
average across all ACOs, 81 percent of providers participating in PY1 also participated in PY2,
and 82 percent of providers participating in PY2 also participated in PY3. Retention of providers
ranged from a high of 96 percent from PY1 to PY2 and 95 percent from PY2 to PY3 to a low of
58 percent from PY1 to PY2 and 51 percent from PY2 to PY3. The second measure (shown in
columns B and D)—the share of PY2 (PY3) providers that had participated in PY1 (PY2)—
measures new providers within a year, with a lower share indicating more new providers. On
average, there was a higher mean number of new providers in PY2 compared with PY3. Column
E shows the proportion of providers participating in the same ACO all three years, which is a
measure of overall stability in participation. The proportion of providers participating in all three
performance years was 46 percent, on average. The range across ACOs was substantial: the highest
proportion of physicians participating continuously was 79 percent, while the lowest was 19
percent.
Table 5. Overall Number and Distribution of Participating Providers and Turnover per
ACO by Performance Year
Number of participating
providers
Share of PY1
providers also in
PY2
Share of PY2
providers also in
PY1
Share of PY2
providers also in
PY3
Share of PY3
providers also in
PY2
Share of providers
in all 3 years
Any Year
PY1 (2012)
PY2 (2013)
PY3 (2014)
(A) (B) (C) (D) (E)
Minimum 94 67 84 55 0.58 0.47 0.51 0.55 0.19
Median 808 492 631 613 0.84 0.72 0.87 0.82 0.46
Mean 1,090 725 799 904 0.81 0.73 0.82 0.80 0.46
Maximum 3,755 2,966 2,464 2,552 0.96 0.92 0.95 1.00 0.79
Notes: Only providers participating in the 23 ACOs remaining in PY3 were included each year. Participating providers were
defined by NPI.
Source: L&M tabulations based on lists of participating providers submitted to CMS by ACO in each performance year.
In our interviews with Pioneer ACO leadership, some discussed organizational behavior and
market conditions that may influence provider turnover. Some ACOs discussed their deliberate
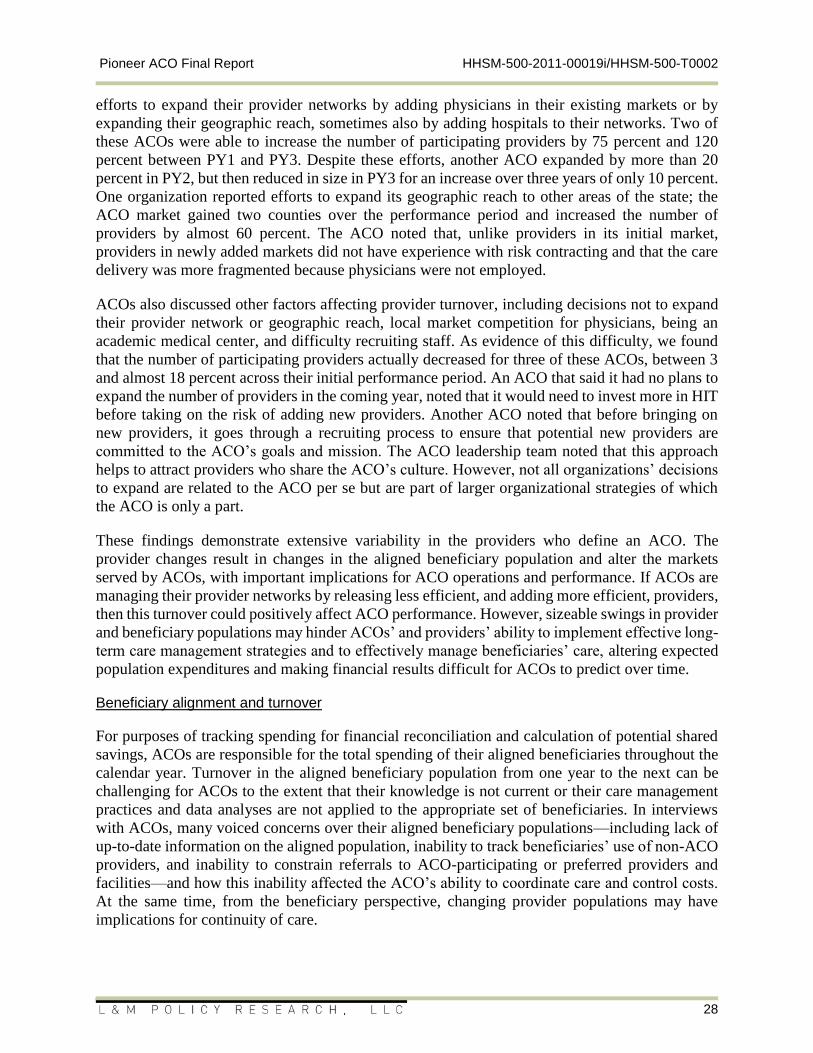
Pioneer ACO Final Report HHSM-500-2011-00019i/HHSM-500-T0002
28
efforts to expand their provider networks by adding physicians in their existing markets or by
expanding their geographic reach, sometimes also by adding hospitals to their networks. Two of
these ACOs were able to increase the number of participating providers by 75 percent and 120
percent between PY1 and PY3. Despite these efforts, another ACO expanded by more than 20
percent in PY2, but then reduced in size in PY3 for an increase over three years of only 10 percent.
One organization reported efforts to expand its geographic reach to other areas of the state; the
ACO market gained two counties over the performance period and increased the number of
providers by almost 60 percent. The ACO noted that, unlike providers in its initial market,
providers in newly added markets did not have experience with risk contracting and that the care
delivery was more fragmented because physicians were not employed.
ACOs also discussed other factors affecting provider turnover, including decisions not to expand
their provider network or geographic reach, local market competition for physicians, being an
academic medical center, and difficulty recruiting staff. As evidence of this difficulty, we found
that the number of participating providers actually decreased for three of these ACOs, between 3
and almost 18 percent across their initial performance period. An ACO that said it had no plans to
expand the number of providers in the coming year, noted that it would need to invest more in HIT
before taking on the risk of adding new providers. Another ACO noted that before bringing on
new providers, it goes through a recruiting process to ensure that potential new providers are
committed to the ACO’s goals and mission. The ACO leadership team noted that this approach
helps to attract providers who share the ACO’s culture. However, not all organizations’ decisions
to expand are related to the ACO per se but are part of larger organizational strategies of which
the ACO is only a part.
These findings demonstrate extensive variability in the providers who define an ACO. The
provider changes result in changes in the aligned beneficiary population and alter the markets
served by ACOs, with important implications for ACO operations and performance. If ACOs are
managing their provider networks by releasing less efficient, and adding more efficient, providers,
then this turnover could positively affect ACO performance. However, sizeable swings in provider
and beneficiary populations may hinder ACOs’ and providers’ ability to implement effective long-
term care management strategies and to effectively manage beneficiaries’ care, altering expected
population expenditures and making financial results difficult for ACOs to predict over time.
Beneficiary alignment and turnover
For purposes of tracking spending for financial reconciliation and calculation of potential shared
savings, ACOs are responsible for the total spending of their aligned beneficiaries throughout the
calendar year. Turnover in the aligned beneficiary population from one year to the next can be
challenging for ACOs to the extent that their knowledge is not current or their care management
practices and data analyses are not applied to the appropriate set of beneficiaries. In interviews
with ACOs, many voiced concerns over their aligned beneficiary populations—including lack of
up-to-date information on the aligned population, inability to track beneficiaries’ use of non-ACO
providers, and inability to constrain referrals to ACO-participating or preferred providers and
facilities—and how this inability affected the ACO’s ability to coordinate care and control costs.
At the same time, from the beneficiary perspective, changing provider populations may have
implications for continuity of care.
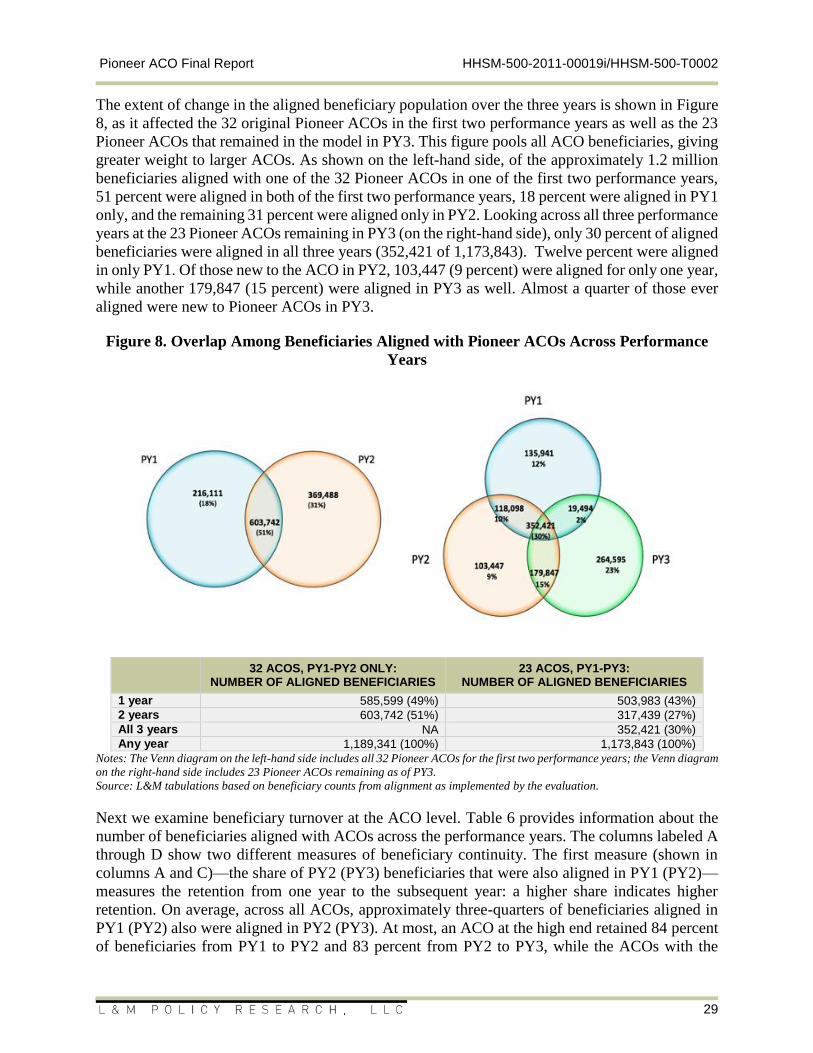
Pioneer ACO Final Report HHSM-500-2011-00019i/HHSM-500-T0002
29
The extent of change in the aligned beneficiary population over the three years is shown in Figure
8, as it affected the 32 original Pioneer ACOs in the first two performance years as well as the 23
Pioneer ACOs that remained in the model in PY3. This figure pools all ACO beneficiaries, giving
greater weight to larger ACOs. As shown on the left-hand side, of the approximately 1.2 million
beneficiaries aligned with one of the 32 Pioneer ACOs in one of the first two performance years,
51 percent were aligned in both of the first two performance years, 18 percent were aligned in PY1
only, and the remaining 31 percent were aligned only in PY2. Looking across all three performance
years at the 23 Pioneer ACOs remaining in PY3 (on the right-hand side), only 30 percent of aligned
beneficiaries were aligned in all three years (352,421 of 1,173,843). Twelve percent were aligned
in only PY1. Of those new to the ACO in PY2, 103,447 (9 percent) were aligned for only one year,
while another 179,847 (15 percent) were aligned in PY3 as well. Almost a quarter of those ever
aligned were new to Pioneer ACOs in PY3.
Figure 8. Overlap Among Beneficiaries Aligned with Pioneer ACOs Across Performance
Years
32 ACOS, PY1-PY2 ONLY:
NUMBER OF ALIGNED BENEFICIARIES 23 ACOS, PY1-PY3:
NUMBER OF ALIGNED BENEFICIARIES
1 year 585,599 (49%) 503,983 (43%)
2 years 603,742 (51%) 317,439 (27%)
All 3 years NA 352,421 (30%)
Any year 1,189,341 (100%) 1,173,843 (100%)
Notes: The Venn diagram on the left-hand side includes all 32 Pioneer ACOs for the first two performance years; the Venn diagram
on the right-hand side includes 23 Pioneer ACOs remaining as of PY3.
Source: L&M tabulations based on beneficiary counts from alignment as implemented by the evaluation.
Next we examine beneficiary turnover at the ACO level. Table 6 provides information about the
number of beneficiaries aligned with ACOs across the performance years. The columns labeled A
through D show two different measures of beneficiary continuity. The first measure (shown in
columns A and C)—the share of PY2 (PY3) beneficiaries that were also aligned in PY1 (PY2)—
measures the retention from one year to the subsequent year: a higher share indicates higher
retention. On average, across all ACOs, approximately three-quarters of beneficiaries aligned in
PY1 (PY2) also were aligned in PY2 (PY3). At most, an ACO at the high end retained 84 percent
of beneficiaries from PY1 to PY2 and 83 percent from PY2 to PY3, while the ACOs with the
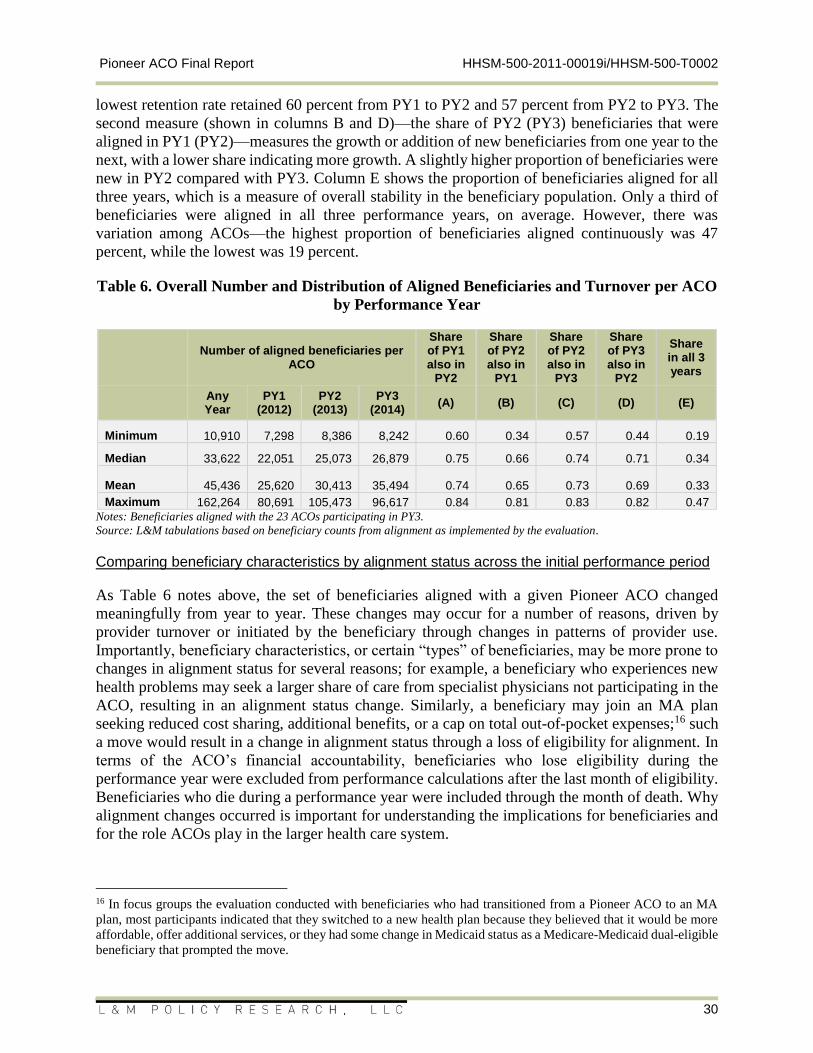
Pioneer ACO Final Report HHSM-500-2011-00019i/HHSM-500-T0002
30
lowest retention rate retained 60 percent from PY1 to PY2 and 57 percent from PY2 to PY3. The
second measure (shown in columns B and D)—the share of PY2 (PY3) beneficiaries that were
aligned in PY1 (PY2)—measures the growth or addition of new beneficiaries from one year to the
next, with a lower share indicating more growth. A slightly higher proportion of beneficiaries were
new in PY2 compared with PY3. Column E shows the proportion of beneficiaries aligned for all
three years, which is a measure of overall stability in the beneficiary population. Only a third of
beneficiaries were aligned in all three performance years, on average. However, there was
variation among ACOs—the highest proportion of beneficiaries aligned continuously was 47
percent, while the lowest was 19 percent.
Table 6. Overall Number and Distribution of Aligned Beneficiaries and Turnover per ACO
by Performance Year
Number of aligned beneficiaries per
ACO
Share of PY1 also in
PY2
Share of PY2 also in
PY1
Share of PY2 also in
PY3
Share of PY3 also in
PY2
Share in all 3 years
Any Year
PY1 (2012)
PY2 (2013)
PY3 (2014)
(A) (B) (C) (D) (E)
Minimum 10,910 7,298 8,386 8,242 0.60 0.34 0.57 0.44 0.19
Median 33,622 22,051 25,073 26,879 0.75 0.66 0.74 0.71 0.34
Mean 45,436 25,620 30,413 35,494 0.74 0.65 0.73 0.69 0.33
Maximum 162,264 80,691 105,473 96,617 0.84 0.81 0.83 0.82 0.47
Notes: Beneficiaries aligned with the 23 ACOs participating in PY3.
Source: L&M tabulations based on beneficiary counts from alignment as implemented by the evaluation.
Comparing beneficiary characteristics by alignment status across the initial performance period
As Table 6 notes above, the set of beneficiaries aligned with a given Pioneer ACO changed
meaningfully from year to year. These changes may occur for a number of reasons, driven by
provider turnover or initiated by the beneficiary through changes in patterns of provider use.
Importantly, beneficiary characteristics, or certain “types” of beneficiaries, may be more prone to
changes in alignment status for several reasons; for example, a beneficiary who experiences new
health problems may seek a larger share of care from specialist physicians not participating in the
ACO, resulting in an alignment status change. Similarly, a beneficiary may join an MA plan
seeking reduced cost sharing, additional benefits, or a cap on total out-of-pocket expenses;16 such
a move would result in a change in alignment status through a loss of eligibility for alignment. In
terms of the ACO’s financial accountability, beneficiaries who lose eligibility during the
performance year were excluded from performance calculations after the last month of eligibility.
Beneficiaries who die during a performance year were included through the month of death. Why
alignment changes occurred is important for understanding the implications for beneficiaries and
for the role ACOs play in the larger health care system.
16 In focus groups the evaluation conducted with beneficiaries who had transitioned from a Pioneer ACO to an MA
plan, most participants indicated that they switched to a new health plan because they believed that it would be more
affordable, offer additional services, or they had some change in Medicaid status as a Medicare-Medicaid dual-eligible
beneficiary that prompted the move.
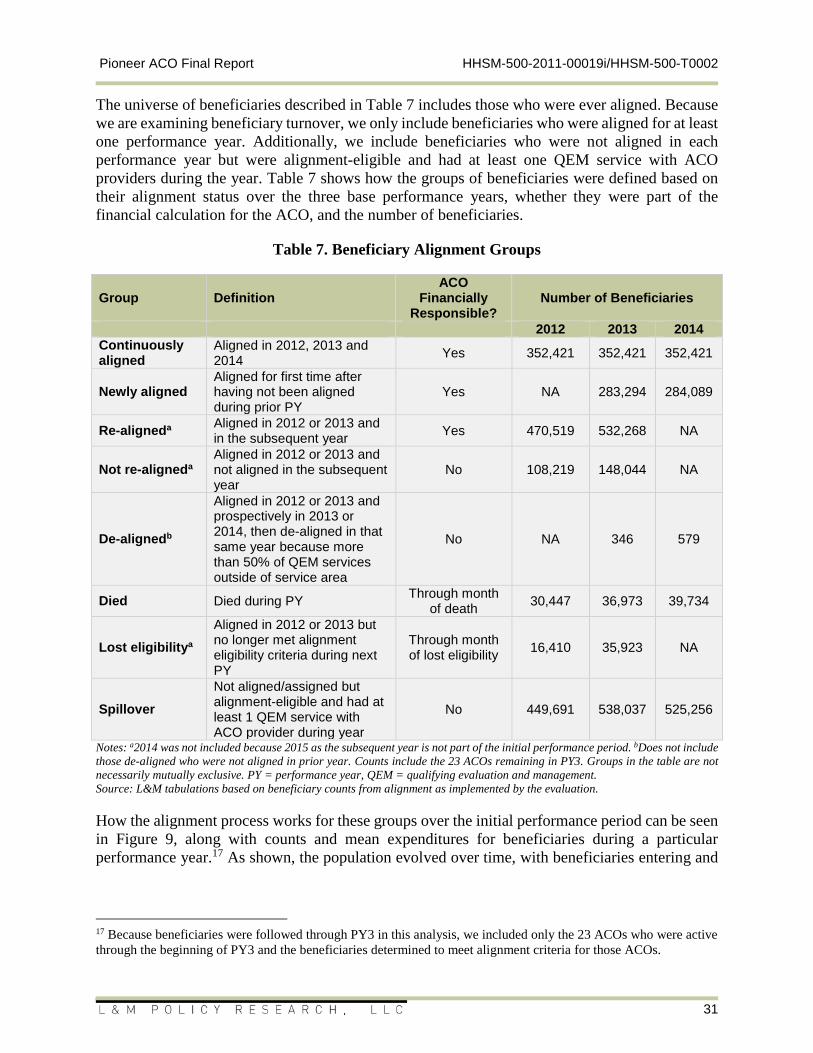
Pioneer ACO Final Report HHSM-500-2011-00019i/HHSM-500-T0002
31
The universe of beneficiaries described in Table 7 includes those who were ever aligned. Because
we are examining beneficiary turnover, we only include beneficiaries who were aligned for at least
one performance year. Additionally, we include beneficiaries who were not aligned in each
performance year but were alignment-eligible and had at least one QEM service with ACO
providers during the year. Table 7 shows how the groups of beneficiaries were defined based on
their alignment status over the three base performance years, whether they were part of the
financial calculation for the ACO, and the number of beneficiaries.
Table 7. Beneficiary Alignment Groups
Group Definition ACO
Financially Responsible?
Number of Beneficiaries
2012 2013 2014
Continuously aligned
Aligned in 2012, 2013 and 2014
Yes 352,421 352,421 352,421
Newly aligned Aligned for first time after having not been aligned during prior PY
Yes NA 283,294 284,089
Re-aligneda Aligned in 2012 or 2013 and in the subsequent year
Yes 470,519 532,268 NA
Not re-aligneda Aligned in 2012 or 2013 and not aligned in the subsequent year
No 108,219 148,044 NA
De-alignedb
Aligned in 2012 or 2013 and prospectively in 2013 or 2014, then de-aligned in that same year because more than 50% of QEM services outside of service area
No NA 346 579
Died Died during PY Through month
of death 30,447 36,973 39,734
Lost eligibilitya
Aligned in 2012 or 2013 but no longer met alignment eligibility criteria during next PY
Through month of lost eligibility
16,410 35,923 NA
Spillover
Not aligned/assigned but alignment-eligible and had at least 1 QEM service with ACO provider during year
No 449,691 538,037 525,256
Notes: a2014 was not included because 2015 as the subsequent year is not part of the initial performance period. bDoes not include
those de-aligned who were not aligned in prior year. Counts include the 23 ACOs remaining in PY3. Groups in the table are not
necessarily mutually exclusive. PY = performance year, QEM = qualifying evaluation and management.
Source: L&M tabulations based on beneficiary counts from alignment as implemented by the evaluation.
How the alignment process works for these groups over the initial performance period can be seen
in Figure 9, along with counts and mean expenditures for beneficiaries during a particular
performance year.17 As shown, the population evolved over time, with beneficiaries entering and
17 Because beneficiaries were followed through PY3 in this analysis, we included only the 23 ACOs who were active
through the beginning of PY3 and the beneficiaries determined to meet alignment criteria for those ACOs.
Pioneer ACO Final Report HHSM-500-2011-00019i/HHSM-500-T0002
32
exiting alignment status. Across the three years, only about 30 percent of beneficiaries who were
ever aligned with a Pioneer ACO were continuously aligned.
There were 625,954 beneficiaries aligned with the 23 ACOs through the first performance year
(“Aligned,” shown in the upper right-hand portion of Figure 9). However, the providers affiliated
with these ACOs delivered QEM services to 449,691 FFS beneficiaries who were alignment-
eligible but not aligned during PY1 and, therefore, for whom the ACOs were not financially
responsible (“Spillover,” shown in the upper left-hand portion). The average PY1 expenditures of
these two populations differed significantly: $11,605 per aligned beneficiary compared to $18,992
per spillover beneficiary. Of the aligned beneficiaries who were part of the PY1 cohort, 30,447
(4.9 percent) died during the performance year, 487,288 (77.8 percent) were prospectively aligned
for the next performance year, and the remaining 108,219 (17.3 percent) were not (prospectively)
re-aligned with the ACO for PY2. Of the spillover beneficiary population, 79,199 beneficiaries
(17.6 percent of the spillover population) were aligned in the subsequent performance year.
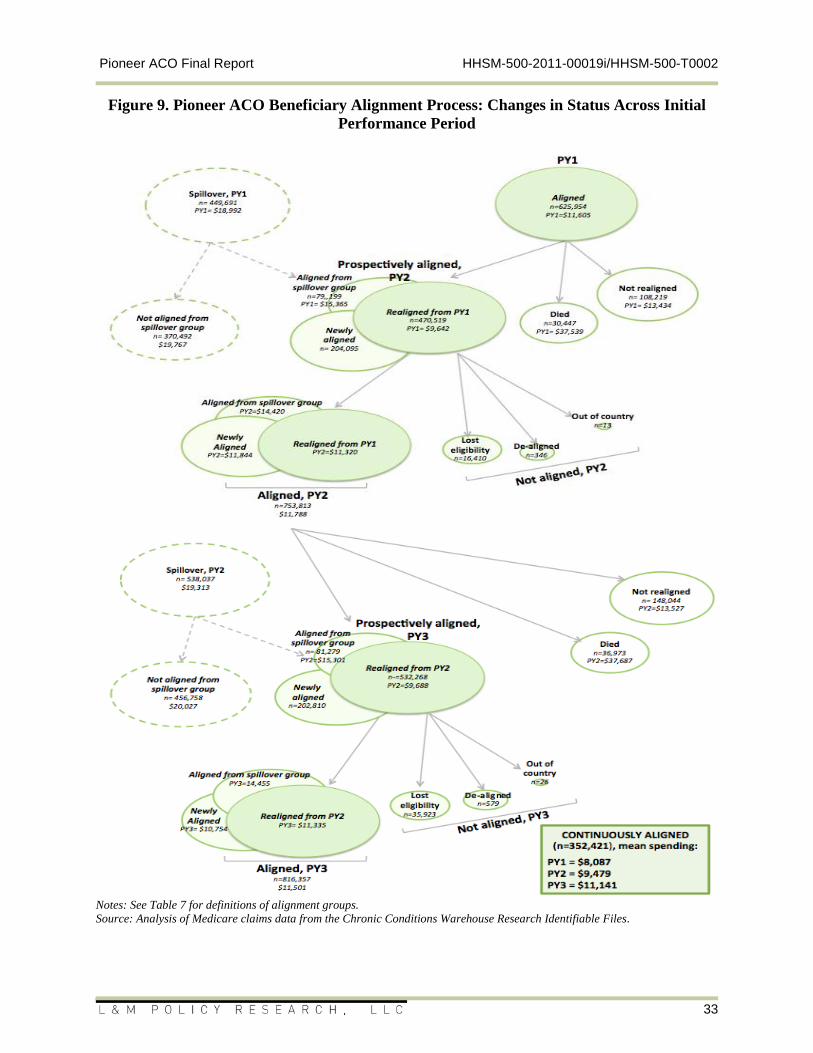
Pioneer ACO Final Report HHSM-500-2011-00019i/HHSM-500-T0002
33
Figure 9. Pioneer ACO Beneficiary Alignment Process: Changes in Status Across Initial
Performance Period
Notes: See Table 7 for definitions of alignment groups.
Source: Analysis of Medicare claims data from the Chronic Conditions Warehouse Research Identifiable Files.
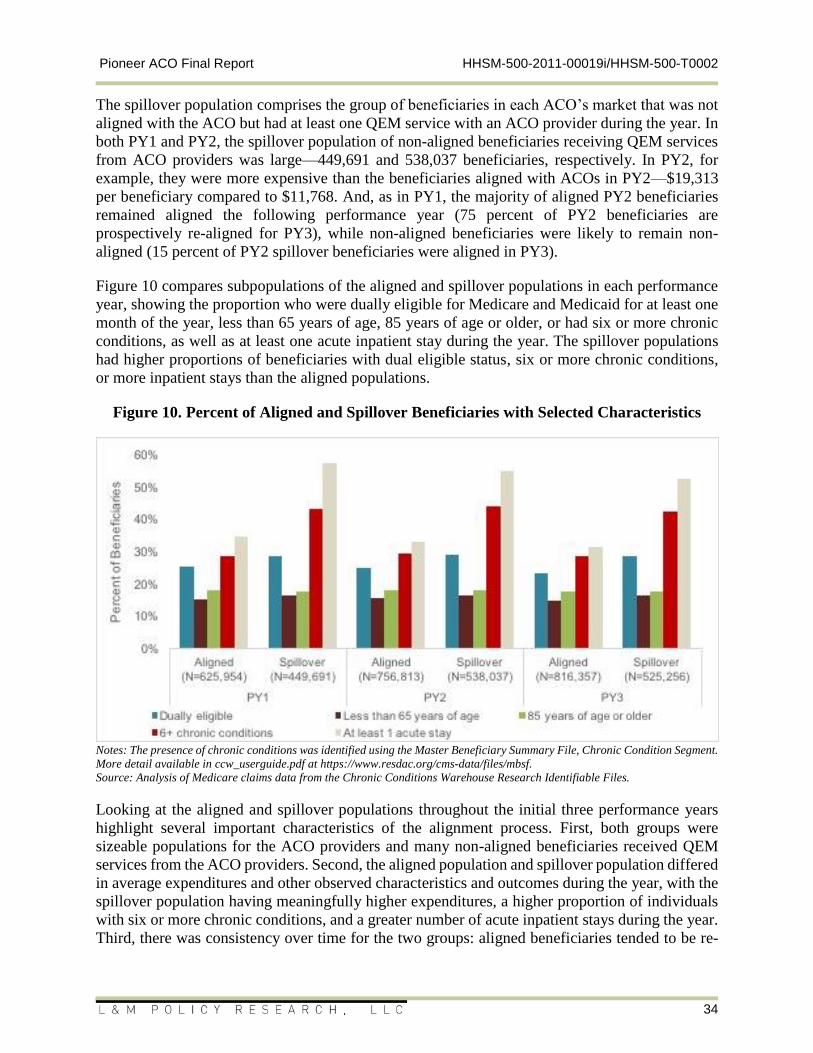
Pioneer ACO Final Report HHSM-500-2011-00019i/HHSM-500-T0002
34
The spillover population comprises the group of beneficiaries in each ACO’s market that was not
aligned with the ACO but had at least one QEM service with an ACO provider during the year. In
both PY1 and PY2, the spillover population of non-aligned beneficiaries receiving QEM services
from ACO providers was large—449,691 and 538,037 beneficiaries, respectively. In PY2, for
example, they were more expensive than the beneficiaries aligned with ACOs in PY2—$19,313
per beneficiary compared to $11,768. And, as in PY1, the majority of aligned PY2 beneficiaries
remained aligned the following performance year (75 percent of PY2 beneficiaries are
prospectively re-aligned for PY3), while non-aligned beneficiaries were likely to remain non-
aligned (15 percent of PY2 spillover beneficiaries were aligned in PY3).
Figure 10 compares subpopulations of the aligned and spillover populations in each performance
year, showing the proportion who were dually eligible for Medicare and Medicaid for at least one
month of the year, less than 65 years of age, 85 years of age or older, or had six or more chronic
conditions, as well as at least one acute inpatient stay during the year. The spillover populations
had higher proportions of beneficiaries with dual eligible status, six or more chronic conditions,
or more inpatient stays than the aligned populations.
Figure 10. Percent of Aligned and Spillover Beneficiaries with Selected Characteristics
Notes: The presence of chronic conditions was identified using the Master Beneficiary Summary File, Chronic Condition Segment.
More detail available in ccw_userguide.pdf at https://www.resdac.org/cms-data/files/mbsf.
Source: Analysis of Medicare claims data from the Chronic Conditions Warehouse Research Identifiable Files.
Looking at the aligned and spillover populations throughout the initial three performance years
highlight several important characteristics of the alignment process. First, both groups were
sizeable populations for the ACO providers and many non-aligned beneficiaries received QEM
services from the ACO providers. Second, the aligned population and spillover population differed
in average expenditures and other observed characteristics and outcomes during the year, with the
spillover population having meaningfully higher expenditures, a higher proportion of individuals
with six or more chronic conditions, and a greater number of acute inpatient stays during the year.
Third, there was consistency over time for the two groups: aligned beneficiaries tended to be re-
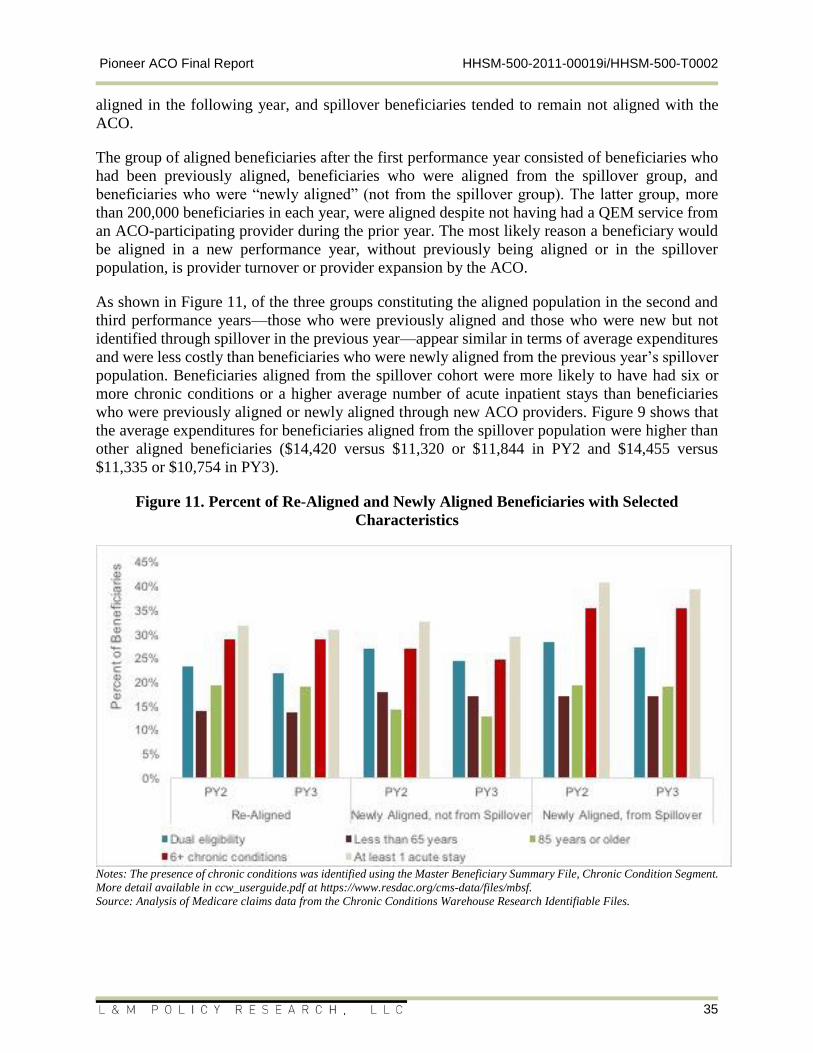
Pioneer ACO Final Report HHSM-500-2011-00019i/HHSM-500-T0002
35
aligned in the following year, and spillover beneficiaries tended to remain not aligned with the
ACO.
The group of aligned beneficiaries after the first performance year consisted of beneficiaries who
had been previously aligned, beneficiaries who were aligned from the spillover group, and
beneficiaries who were “newly aligned” (not from the spillover group). The latter group, more
than 200,000 beneficiaries in each year, were aligned despite not having had a QEM service from
an ACO-participating provider during the prior year. The most likely reason a beneficiary would
be aligned in a new performance year, without previously being aligned or in the spillover
population, is provider turnover or provider expansion by the ACO.
As shown in Figure 11, of the three groups constituting the aligned population in the second and
third performance years—those who were previously aligned and those who were new but not
identified through spillover in the previous year—appear similar in terms of average expenditures
and were less costly than beneficiaries who were newly aligned from the previous year’s spillover
population. Beneficiaries aligned from the spillover cohort were more likely to have had six or
more chronic conditions or a higher average number of acute inpatient stays than beneficiaries
who were previously aligned or newly aligned through new ACO providers. Figure 9 shows that
the average expenditures for beneficiaries aligned from the spillover population were higher than
other aligned beneficiaries ($14,420 versus $11,320 or $11,844 in PY2 and $14,455 versus
$11,335 or $10,754 in PY3).
Figure 11. Percent of Re-Aligned and Newly Aligned Beneficiaries with Selected
Characteristics
Notes: The presence of chronic conditions was identified using the Master Beneficiary Summary File, Chronic Condition Segment.
More detail available in ccw_userguide.pdf at https://www.resdac.org/cms-data/files/mbsf.
Source: Analysis of Medicare claims data from the Chronic Conditions Warehouse Research Identifiable Files.
Pioneer ACO Final Report HHSM-500-2011-00019i/HHSM-500-T0002
36
The relative spending level of one additional group in the alignment process is worth noting.
Although perhaps a moderately sized group, beneficiaries who lost alignment status for the
subsequent year were more costly than aligned beneficiaries who remained alive. As noted above,
the majority of aligned beneficiaries were prospectively re-aligned in the subsequent year. A small
number of prospectively re-aligned beneficiaries (roughly 17,000 to 30,000) were not counted in
the next performance year because they either lost eligibility, were retrospectively de-aligned, or
out of country. However, beneficiaries who were not prospectively re-aligned differed in important
ways. A number of beneficiaries, roughly 4.9 percent, died during a performance year and did not
meet eligibility for prospective alignment. But the majority of those who were not re-aligned
(noted as “Not re-aligned” in Figure 9) lost alignment because they no longer received the plurality
of their QEM services from ACO providers. Compared to those who were re-aligned, beneficiaries
who were not re-aligned had higher average expenditures during the performance year ($13,434
versus $9,642 in PY1 and $13,527 versus $9,688 in PY2).
The loss of alignment status indicates that beneficiaries no longer received the plurality of QEM
services from ACO-participating providers. While we are not able to provide any detail on why
their utilization patterns changed in this way, some of the attrition may be associated with provider
turnover or beneficiary decisions to see providers outside the ACO. At the same time, their higher
costs suggest the possibility that a decline in health status underlies the change. Looking across all
of the alignment patterns observed suggests that the prospective alignment process for Pioneer
ACOs may tend to align a healthier, less costly population of patients.
There is no indication that ACOs intentionally attract healthier beneficiaries; rather, this apparent
selection is built into the alignment algorithm itself. The alignment algorithm has important
implications for the beneficiary population in that more vulnerable beneficiaries may be less likely
to benefit from any care coordination or quality improvements conferred by the ACO. Perhaps
more seriously, as ACOs expand to cover a greater proportion of the Medicare beneficiary
population, it is not clear how these sicker beneficiaries would be included, or how integrating
these beneficiaries would impact the ACO.
Pioneer ACO Final Report HHSM-500-2011-00019i/HHSM-500-T0002
37
HOW DID PIONEER ACOs DELIVER CARE DURING THEIR INITIAL PERFORMANCE PERIOD?
The Pioneer ACO Model broadly tested the effect of providing a financial incentive for
experienced health care organizations to achieve the three-part aim. Participating organizations
reported undertaking a wide range of activities in response to the model incentive and
requirements. Through quarterly calls, in-person site visits, provider and beneficiary focus groups,
and a physician survey over the three-year initial performance period, the evaluation gathered
perspectives and information directly from Pioneer ACO executives, implementation and front-
line staff, and clinicians to understand their experiences in the ACO, the activities they undertook,
and what they saw as challenges and opportunities along the way. The following discussion
reviews the areas in which Pioneer ACOs focused efforts to improve care delivery to their
beneficiaries and manage expenditures.
This section begins with findings from an assessment of how Pioneer ACOs approached learning
as part of their experience with the model, which offers insight into which resources informed and
shaped the activities they undertook. This backdrop is followed by a presentation of the key areas
that all Pioneer ACOs reported as important: 1) provider engagement and communications, which
also includes perspectives from participating providers, 2) care management activities, 3) health
information technology and use of data, and 4) patient engagement strategies. The section
continues with a focus on the provision of two types of services in Pioneer ACOs: skilled nursing
facility services under the 3-day SNF waiver and behavioral health care. All Pioneer ACOs were
eligible to apply for the waiver of the 3-day inpatient stay requirement prior to a SNF stay after
the Pioneer model launched. The other topic, management of behavioral health, offers insight into
how Pioneer ACOs viewed behavioral health and how they shaped behavioral health activities,
which is of interest given the prevalence of and oft-overlooked mental and behavioral health
needs—and associated impact on expenditures—in the Medicare population. Underlying the
Pioneer ACOs’ activities was a focus on quality of care; the section concludes with results of an
analysis of the ACOs’ performance on specific quality measures.
Learning and feedback processes were not necessarily formalized and relied on experimentation
As reported through interviews with ACO leadership, all Pioneer ACOs had established priority
areas at the outset of the model, including developing care management programs and coordinating
care, engaging beneficiaries, and expanding the care continuum. We specifically examined how
Pioneer ACOs gathered information, set their priorities, and refined interventions and processes.
Most Pioneer ACOs discussed an iterative process of learning that was based on experimentation
and rapid-cycle changes in their approaches to care management, quality improvement, and care
transition efforts. Their learning and feedback processes were not necessarily formalized and
reflected a more organically assembled collection of information sources and data-driven analytic
activities. Of note is that Pioneer ACOs most frequently identified priorities and interventions by
building on their own past experiences and by analyzing data (typically Medicare Part A & B
claims data). Yet, many Pioneer ACOs also reported challenges in translating past experience to
the Pioneer ACO Model. For example, compared with other risk-based contracts, Pioneer ACOs
discussed the challenge of trying to manage ACO investments without fully knowing their
financial benchmark until the end of a performance year. Many Pioneer ACOs also indicated that
Pioneer ACO Final Report HHSM-500-2011-00019i/HHSM-500-T0002
38
performing case management in an open provider network setting was more challenging than
under Medicare Advantage settings, which allows for closed provider networks.
Pioneer ACOs reported a variety of information and learning sources, described below. (See the
previous evaluation report, Pioneer Evaluation Findings from Performance Years One and Two,
dated March 10, 2015 for more detail.)18
Staff Experience. Pioneer ACOs relied heavily on their past experiences with processes
such as care management and care coordination to improve care provided to beneficiaries,
and nearly all ranked previous experience with care management or care transitions, risk
contracting, data analytics, and quality measurement as their most important resource for
guiding the activities they implemented. Several of the Pioneer ACOs reported that they
had prior experience with CMS demonstration projects that directly contributed to their
ACO development, including the Physician Group Practice Transition Demonstration and
the Care Management for High-Cost Beneficiaries Demonstration.19 In addition, Pioneer
ACOs relied on providers and staff at participating practices to inform them about which
programs were working for patients and to provide insights on how to improve practices
to ensure their effectiveness.
Data Analytics. Much of the claims data and utilization reports provided by CMS were
used by Pioneer ACOs to help inform the implementation of an initiative or to identify an
area that might require an intervention. For example, many ACOs examined trends in
emergency department, inpatient, and post-acute care to identify potential areas for
intervention, or used analytics to identify beneficiaries for care management initiatives. As
so many of the Pioneer ACOs were implementing multiple activities and experimenting
along the way, it was unclear the extent to which they were using data analysis for feedback
purposes at the ACO rather than physician level.
Consultants and Vendors. Many Pioneer ACOs initially turned to external advisors for
guidance on acquiring needed capabilities such as expertise in developing data warehouses
and analytic capabilities, but they shifted to reliance on their own internal expertise as
experience was gained – several Pioneer ACOs noted these vendors and consultants had
limited experience in care and transition management, practice process improvement, and
other practice transformation in the ACO context.
Peer Organizations. Most Pioneer ACOs consulted with other ACOs that were similar in
terms of geography, size, or available resources to learn about new projects that other
Pioneer ACOs were implementing, barriers they were facing, and solutions to challenges.
A key mechanism used to forge relationships with other ACOs was through learning
collaboratives hosted by CMS or other sponsors, such as the National Association of
ACOs. In-person and online meetings hosted as part of these learning collaboratives
18 Evaluation of Center for Medicare and Medicaid Innovation (CMMI) Accountable Care Organization Initiatives
Annual Report. Appendix B: Analysis of Learning System Participation. July 15, 2014. Prepared by L&M Policy
Research with Partners. 19 https://innovation.cms.gov/initiatives/physician-group-practice-transition/
https://innovation.cms.gov/medicare-demonstrations/care-management-for-high-cost-beneficiaries-
demonstration.html
Pioneer ACO Final Report HHSM-500-2011-00019i/HHSM-500-T0002
39
enabled ACOs to identify other groups with similar market characteristics or goals and
forge connections that could be fostered outside of the formal collaborative to promote
ACO growth and learning.
Other Partners. Other sources of learning for many Pioneer ACOs were health plans and
other health care stakeholders that could supplement expertise on core ACO functions in a
consulting or networking capacity or even as a partner. Half of the Pioneer ACOs relied on
a partner (e.g., health plan, public health organization, or outside industry) to assist them
in developing processes or in furthering their development. Among these ACOs, the most
common partner was a hospital, a SNF, or another type of provider organization such as a
home health provider, post-acute care provider, or physician-hospital organization. Pioneer
ACOs sometimes engaged other, non-ACO health systems to work in a formal consulting
capacity. For example, one Pioneer ACO engaged a large health system because of its
experience with Medicare Advantage and with managing a population over a long period
of time. A few other Pioneer ACOs reported working with other types of partners,
including practice management companies, state health care leaders, and community
resources such as local firefighters.
Policymakers and learning system developers can use these findings to shape future efforts to assist
ACOs with transformation. For example, providing technical assistance to improve programs that
Pioneer ACOs already have in place may be more effective in helping the organizations to be
successful than encouraging adoption of additional initiatives where the ACO has no prior
experience. Facilitating ACO-to-ACO connections where organizations are working on similar
issues or have a similar structure may be another high-impact approach.
While ACOs reported multiple strategies for engaging providers, the views of providers demonstrate room for improvement
Clinical care providers make many, if not most, of the decisions that determine the care used by
patients—ordering imaging and other tests, making referrals to specialists or post-acute settings,
or recommending procedures or hospitalizations—and are thus essential to eliminating
inappropriate care, improving care coordination, and engaging patients—all central to accountable
care.20,21 How well an organization can engage and work with participating providers is thus
critically important. Moreover, providers’ face-to-face interactions and relationships with patients
20 Hroscikoski MC, Solberg Ll, Sperl-Hillen JM, Harper PG, McGrail MP, Crabtree BF. 2006. "Challenges of
Change: A Qualitative Study of Chronic Care Model Implementation.” Annals of Family Medicine 4(4):317-326.
Nutting PA, Crabtree BF, Miller WL, Stewart EE, Stange KC, Jaen CR. 2010. "Journey to the Patient-Centered
Medical Home: A Qualitative Analysis of the Experiences of Practices in the National Demonstration Project." Annals
of Family Medicine 8(4):S45-S56, S92. 21 See McGinnis, Tricia, and David Marc Small. 2012. “Accountable Care Organizations in Medicaid: Emerging
Practices to Guide Program Design.” Policy Brief. Center for Health Care Strategies, Inc.
http://edwardfox.homestead.com/~local/~preview/Creating_ACOs_in_Medicaid_copy.pdf. Colla, Carrie H., Valerie
A. Lewis, Stephen M. Shortell, and Elliott S. Fisher. 2014. “First National Survey of ACOs Finds That Physicians
Are Playing Strong Leadership and Ownership Roles.” Health Affairs (Project Hope) 33 (6): 964–71.
doi:10.1377/hlthaff.2013.1463. Snell, Anita J., Don Briscoe, and Graham Dickson. 2011. “From the inside out: The
Engagement of Physicians as Leaders in Health Care Settings.” Qualitative Health Research 21 (7): 952–67.
doi:10.1177/1049732311399780.
Pioneer ACO Final Report HHSM-500-2011-00019i/HHSM-500-T0002
40
are fundamental to sustaining beneficiary alignment to the ACO, which serves as the basis of
shared savings calculations.
To understand how Pioneer ACOs worked with and engaged participating physicians, the
evaluation used its site visits and some of its quarterly interviews to ask ACO administrators, staff,
and physician leaders about the strategies that they used to engage participating providers.
Questions typically focused on mechanisms that the ACO used to communicate information on
the ACO’s goals, operational requirements, financial and quality performance, and best practices.
Provider outreach and communications fell across several categories:
In-person Communications. Communication between ACO leaders (e.g., medical
director, board members) and individual physicians, as well as peer-to-peer
communication, was frequently cited as the most effective means of engaging physicians.
Pioneer ACOs indicated that some types of communication were not as effective as others.
For example, webinars and conferences were not typically well attended and emails may
go unread.
Financial Incentives. A large number of ACOs mentioned financial incentives as an
important means of engaging physicians. However, rather than relying on shared savings,
several ACOs offered financial incentives to physicians based on providers’ participation
in ACO activities or meeting internal quality goals. For instance, recognizing the
importance of specialists in achieving ACO goals, one ACO provided financial incentives
to specialists when the provider participated in ACO activities or developed and
implemented quality improvement projects. Perhaps surprisingly, at least two Pioneer
ACOs indicated that their employed physicians were more difficult to engage than
independent physicians. These ACOs reported that employed physicians were more apt to
think of ACO participation as burdensome in terms of time and workload; they were also
less familiar with receiving financial incentives compared to independent physicians.
ACOs also reported offering incentives to ensure that communication reached physicians.
For instance, ACOs may have required physicians to attend a certain number of meetings
each year, and financial penalties were imposed if they failed to meet this requirement.
Another ACO paid physicians to attend meetings and participate in ACO activities.
Performance Feedback. Performance feedback in the form of report cards, dashboards,
and scorecards was a widespread approach for engaging physicians participating in Pioneer
ACOs. Utilization, financial, and quality data were often made available to participating
providers at the ACO, practice, and physician levels. Data may have been blinded to protect
practice and provider identities or unblinded to reveal provider and practice identities.
ACOs reported that unblinded feedback was an effective means to engage providers to
improve financial and quality performance since physicians are “competitive by nature”
and respond to “peer pressure.” Other ACOs indicated that provider rankings included in
performance reports enabled the better-performing physicians to offer feedback and
suggestions for improvement to those providers who did not perform as well.
Education/Training Support. Training and educational activities occurred in the form of
webinars, newsletters, email, and in-person meetings and were generally focused on quality
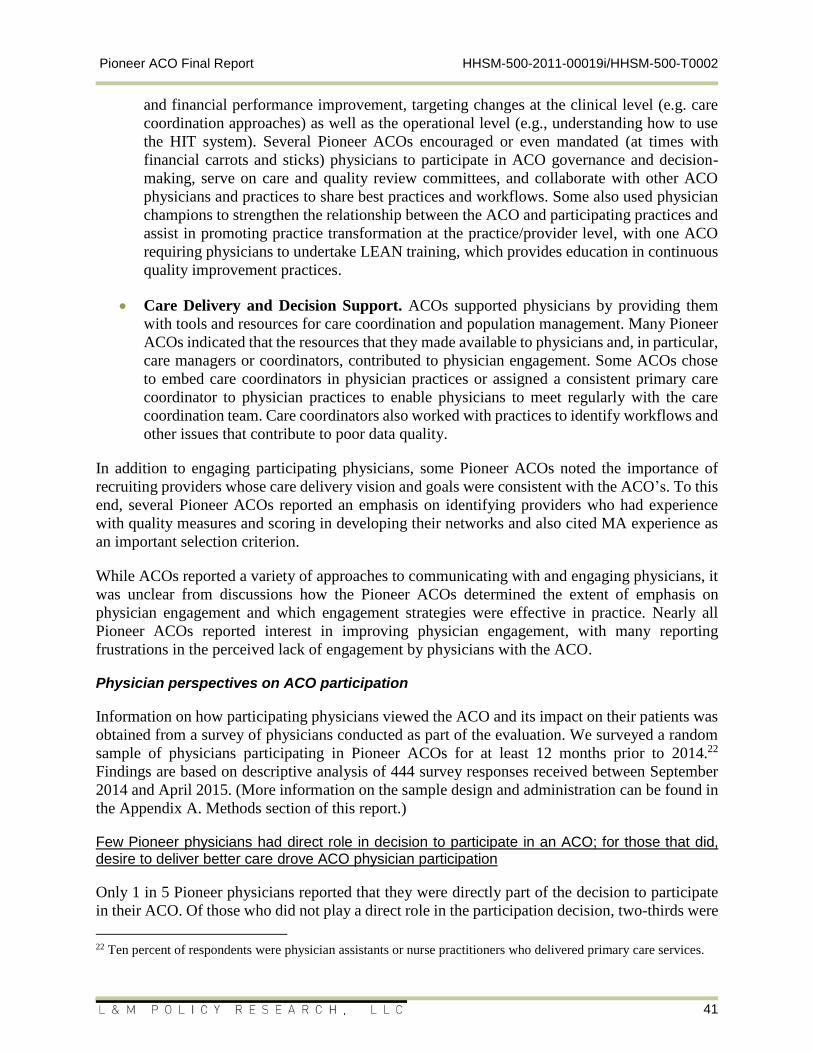
Pioneer ACO Final Report HHSM-500-2011-00019i/HHSM-500-T0002
41
and financial performance improvement, targeting changes at the clinical level (e.g. care
coordination approaches) as well as the operational level (e.g., understanding how to use
the HIT system). Several Pioneer ACOs encouraged or even mandated (at times with
financial carrots and sticks) physicians to participate in ACO governance and decision-
making, serve on care and quality review committees, and collaborate with other ACO
physicians and practices to share best practices and workflows. Some also used physician
champions to strengthen the relationship between the ACO and participating practices and
assist in promoting practice transformation at the practice/provider level, with one ACO
requiring physicians to undertake LEAN training, which provides education in continuous
quality improvement practices.
Care Delivery and Decision Support. ACOs supported physicians by providing them
with tools and resources for care coordination and population management. Many Pioneer
ACOs indicated that the resources that they made available to physicians and, in particular,
care managers or coordinators, contributed to physician engagement. Some ACOs chose
to embed care coordinators in physician practices or assigned a consistent primary care
coordinator to physician practices to enable physicians to meet regularly with the care
coordination team. Care coordinators also worked with practices to identify workflows and
other issues that contribute to poor data quality.
In addition to engaging participating physicians, some Pioneer ACOs noted the importance of
recruiting providers whose care delivery vision and goals were consistent with the ACO’s. To this
end, several Pioneer ACOs reported an emphasis on identifying providers who had experience
with quality measures and scoring in developing their networks and also cited MA experience as
an important selection criterion.
While ACOs reported a variety of approaches to communicating with and engaging physicians, it
was unclear from discussions how the Pioneer ACOs determined the extent of emphasis on
physician engagement and which engagement strategies were effective in practice. Nearly all
Pioneer ACOs reported interest in improving physician engagement, with many reporting
frustrations in the perceived lack of engagement by physicians with the ACO.
Physician perspectives on ACO participation
Information on how participating physicians viewed the ACO and its impact on their patients was
obtained from a survey of physicians conducted as part of the evaluation. We surveyed a random
sample of physicians participating in Pioneer ACOs for at least 12 months prior to 2014.22
Findings are based on descriptive analysis of 444 survey responses received between September
2014 and April 2015. (More information on the sample design and administration can be found in
the Appendix A. Methods section of this report.)
Few Pioneer physicians had direct role in decision to participate in an ACO; for those that did, desire to deliver better care drove ACO physician participation
Only 1 in 5 Pioneer physicians reported that they were directly part of the decision to participate
in their ACO. Of those who did not play a direct role in the participation decision, two-thirds were
22 Ten percent of respondents were physician assistants or nurse practitioners who delivered primary care services.
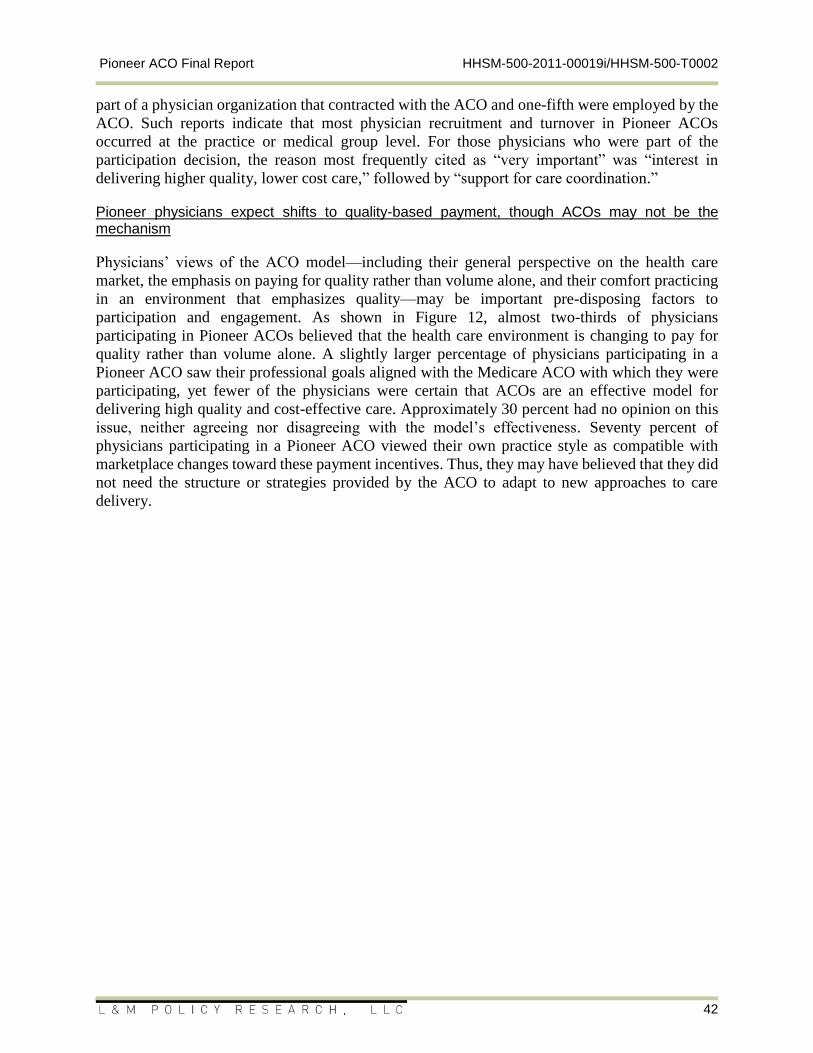
Pioneer ACO Final Report HHSM-500-2011-00019i/HHSM-500-T0002
42
part of a physician organization that contracted with the ACO and one-fifth were employed by the
ACO. Such reports indicate that most physician recruitment and turnover in Pioneer ACOs
occurred at the practice or medical group level. For those physicians who were part of the
participation decision, the reason most frequently cited as “very important” was “interest in
delivering higher quality, lower cost care,” followed by “support for care coordination.”
Pioneer physicians expect shifts to quality-based payment, though ACOs may not be the mechanism
Physicians’ views of the ACO model—including their general perspective on the health care
market, the emphasis on paying for quality rather than volume alone, and their comfort practicing
in an environment that emphasizes quality—may be important pre-disposing factors to
participation and engagement. As shown in Figure 12, almost two-thirds of physicians
participating in Pioneer ACOs believed that the health care environment is changing to pay for
quality rather than volume alone. A slightly larger percentage of physicians participating in a
Pioneer ACO saw their professional goals aligned with the Medicare ACO with which they were
participating, yet fewer of the physicians were certain that ACOs are an effective model for
delivering high quality and cost-effective care. Approximately 30 percent had no opinion on this
issue, neither agreeing nor disagreeing with the model’s effectiveness. Seventy percent of
physicians participating in a Pioneer ACO viewed their own practice style as compatible with
marketplace changes toward these payment incentives. Thus, they may have believed that they did
not need the structure or strategies provided by the ACO to adapt to new approaches to care
delivery.
Pioneer ACO Final Report HHSM-500-2011-00019i/HHSM-500-T0002
43
Figure 12. Physician Views of Health Care Market and Pioneer ACO Model: Percent
Agreeing or Disagreeing
Notes: Percents may not add to 100 percent from item nonresponse.
Source: L&M analysis of data from the 2014 Survey of Physicians Participating in Medicare ACOs.
Mixed involvement with and understanding of the ACO
Survey results indicated that only 2 percent of Pioneer physicians had served on the ACO board
of directors and only 9 percent had served on an ACO committee. Even for those reporting such
involvement, only half of Pioneer physicians said they were satisfied with their participation,
although 30 percent indicated they did not have enough time to be involved in the way they wanted
to be involved. In several respects, physicians were not particularly knowledgeable about the ACO.
When asked if they knew which of their patients were aligned with the Medicare ACO, just over
a third of Pioneer physicians reported knowing which beneficiaries were aligned and a similar
proportion reported not knowing their aligned beneficiaries at all. When asked about the elements
of their compensation, almost half of physicians participating in the Pioneer model reported not
knowing whether they were eligible to receive shared savings from the ACO if the ACO achieved
shared savings.
ACOs improving awareness of costs
In terms of how care is delivered, however, participating physicians did note a number of modest,
but favorable, impacts. Approximately half of physicians participating in Pioneer ACOs reported
that ACO participation made them more aware of controlling treatment costs and that their
participation with the ACO influenced how they treated all of their patients, not just those aligned
Pioneer ACO Final Report HHSM-500-2011-00019i/HHSM-500-T0002
44
with the ACO (see Figure 13). This sort of spillover effect may vary across ACOs depending on
what proportion of a physician’s patients are part of the ACO and also across markets depending
on the level of ACO presence. At the same time, less than 40 percent of Pioneer physicians
indicated that quality of care had improved for their ACO-aligned patients since they joined the
ACO, and less than 30 percent indicated that they were likely to lower treatment costs or provide
higher quality care for their non-ACO patients. It is possible that responses to these questions were
tempered by reluctance on the part of physicians to say that the quality of care they previously
provided was not as high as it could have been.
Figure 13. Impact of Pioneer ACO on How Physicians Practice Medicine: Percent Agreeing
or Disagreeing
Notes: Percents may not add to 100 percent from item nonresponse.
Source: L&M analysis of data from the 2014 Survey of Physicians Participating in Medicare ACOs.
While one of the main physician engagement strategies was to support improved patient care, as
shown in Figure 14, less than a third of physicians reported that the tools and resources provided
by the ACO improved quality “a lot.” However, approximately two-thirds of physicians perceived
that quality had been improved “a lot” or “somewhat.” The percentage indicating that the tools
reduced costs “a lot” was almost negligible, and less than a third reported that cost has been
reduced “a lot” or “somewhat.” In terms of both cost and quality, care management support and
tools were perceived to have the largest impact on providing better patient care.
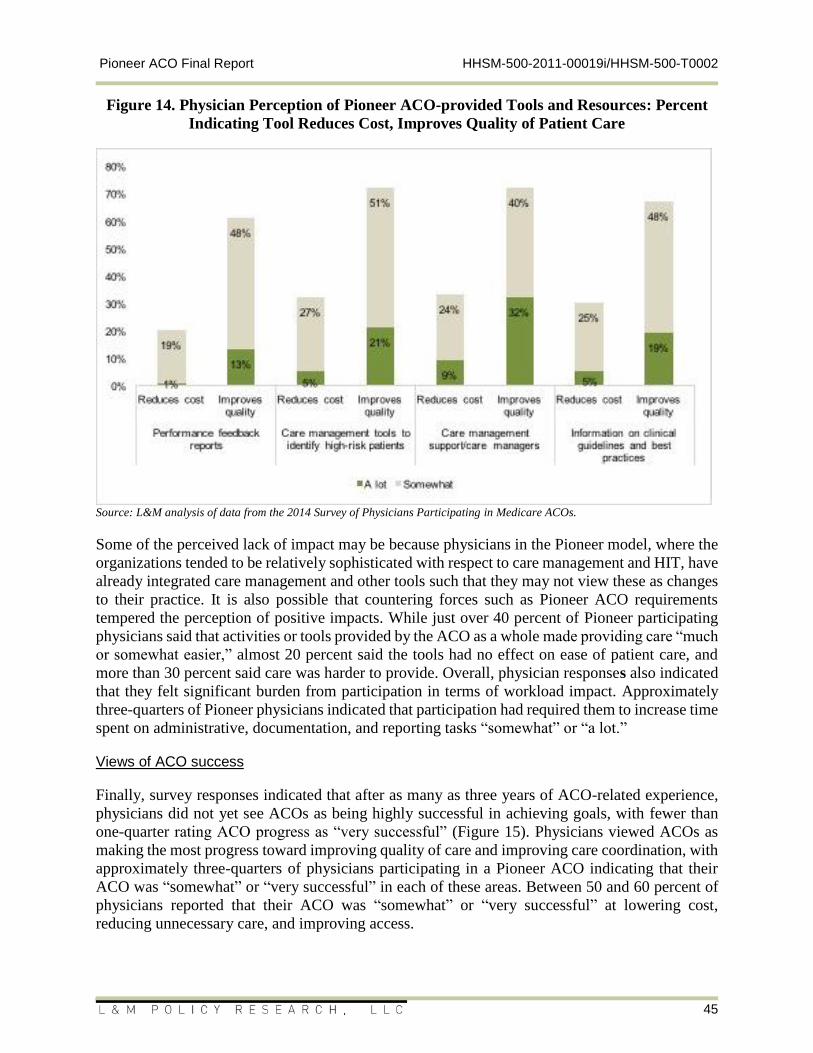
Pioneer ACO Final Report HHSM-500-2011-00019i/HHSM-500-T0002
45
Figure 14. Physician Perception of Pioneer ACO-provided Tools and Resources: Percent
Indicating Tool Reduces Cost, Improves Quality of Patient Care
Source: L&M analysis of data from the 2014 Survey of Physicians Participating in Medicare ACOs.
Some of the perceived lack of impact may be because physicians in the Pioneer model, where the
organizations tended to be relatively sophisticated with respect to care management and HIT, have
already integrated care management and other tools such that they may not view these as changes
to their practice. It is also possible that countering forces such as Pioneer ACO requirements
tempered the perception of positive impacts. While just over 40 percent of Pioneer participating
physicians said that activities or tools provided by the ACO as a whole made providing care “much
or somewhat easier,” almost 20 percent said the tools had no effect on ease of patient care, and
more than 30 percent said care was harder to provide. Overall, physician responses also indicated
that they felt significant burden from participation in terms of workload impact. Approximately
three-quarters of Pioneer physicians indicated that participation had required them to increase time
spent on administrative, documentation, and reporting tasks “somewhat” or “a lot.”
Views of ACO success
Finally, survey responses indicated that after as many as three years of ACO-related experience,
physicians did not yet see ACOs as being highly successful in achieving goals, with fewer than
one-quarter rating ACO progress as “very successful” (Figure 15). Physicians viewed ACOs as
making the most progress toward improving quality of care and improving care coordination, with
approximately three-quarters of physicians participating in a Pioneer ACO indicating that their
ACO was “somewhat” or “very successful” in each of these areas. Between 50 and 60 percent of
physicians reported that their ACO was “somewhat” or “very successful” at lowering cost,
reducing unnecessary care, and improving access.
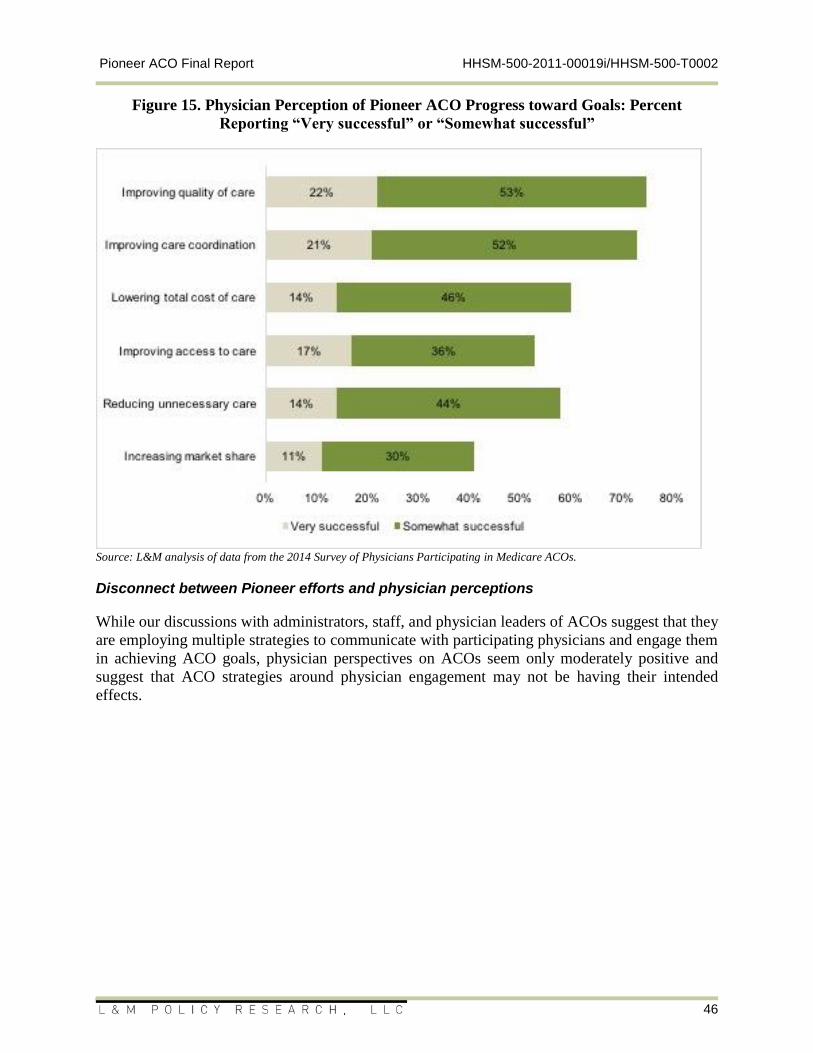
Pioneer ACO Final Report HHSM-500-2011-00019i/HHSM-500-T0002
46
Figure 15. Physician Perception of Pioneer ACO Progress toward Goals: Percent
Reporting “Very successful” or “Somewhat successful”
Source: L&M analysis of data from the 2014 Survey of Physicians Participating in Medicare ACOs.
Disconnect between Pioneer efforts and physician perceptions
While our discussions with administrators, staff, and physician leaders of ACOs suggest that they
are employing multiple strategies to communicate with participating physicians and engage them
in achieving ACO goals, physician perspectives on ACOs seem only moderately positive and
suggest that ACO strategies around physician engagement may not be having their intended
effects.

Pioneer ACO Final Report HHSM-500-2011-00019i/HHSM-500-T0002
47
One possible explanation of why ACOs appear to be
more active in these communication activities than
physicians report may have to do with the two very
different approaches to gathering information used
for ACOs and for physicians—it is possible that the
ACOs speaking about their efforts in our less
structured discussions may be those who are more
active in physician engagement while the physician
views, coming from a structured and representative
survey, portray the views of a broader swath of
participating physicians.
There are a number of other possible explanations
for why ACO engagement strategies may not have
fully taken hold. Particularly for the larger ACOs,
ACOs may have a difficult time finding strategies to
engage a substantial proportion of physicians and large practices. It also may be that ACOs initially
focused their efforts on the immediate challenges of strategies around care coordination or
development of HIT infrastructure and simply require more time to develop relationships of trust
and collaboration with their physicians; these results are from relatively early in the evolution of
Medicare ACOs, so it is possible that the ACOs will devote more efforts toward physician
engagement as they establish themselves. As they do so, they may need time and resources to try
out and test different approaches to better understand and focus on the most effective strategies for
engaging physicians. Finally, as discussed later in this report, there is substantial turnover in
providers from year to year, making the forging of a relationship more challenging.
Care management in ACOs, reflections of a managed care past
The Pioneer ACOs named reducing unnecessary inpatient admissions, avoidable readmissions,
inappropriate emergency department use, and improving care transitions as primary goals for their
care management efforts. These efforts focused on activities to identify beneficiaries for specific
interventions and implementing the technologies and tools that support the interventions.
Pioneer ACOs used different approaches to identify patient populations for care management
services, which reflect the organizations’ capacities to manage and analyze data. They also reflect
decisions about where they anticipated the most impact on improving beneficiary care and
reducing fragmentation and duplication of services. All of the 23 Pioneer ACOs remaining through
the initial performance period reported relying on claims data (often from the CMS claims feeds)
to identify beneficiaries. Other common care management identification strategies reported by at
least half of Pioneer ACOs include: identifying or referring patients to care management, focusing
on particular populations (e.g., beneficiaries with chronic conditions or those with prior high
utilization), identifying specific trigger events (such as an inpatient stay), or focusing on
beneficiaries identified through predictive modeling efforts. For example, one ACO shared that it
calculated a risk score for all beneficiaries, varying the care management strategy for those with
low scores versus those with moderate or high scores.
Many of the Pioneer ACOs expanded or
refined their existing care management
approaches to serve the Medicare FFS
population. Several ACOs used programs
piloted as part of the Pioneer model to gain
experience managing or extend existing care
management to a geriatric population, either
based on or as a stepping stone to MA. One
ACO said that the Pioneer model represented
the “tipping point,” allowing the ACO to
expand its care management from MA to FFS
populations. Another ACO noted that the
increased volume of patients under value-
based contracts resulting from becoming a
Pioneer ACO allowed them to expand the
resources available for care management,
adding embedded care managers to practices.
Pioneer ACO Final Report HHSM-500-2011-00019i/HHSM-500-T0002
48
With respect to the set of care management interventions used, Pioneer ACOs differed in their
approaches. Several ACOs had embedded care managers in practices, while others had a
centralized approach for outreach often coupled with home visits or care management conferences
with multi-disciplinary teams managing high-risk patients. A few Pioneer ACOs noted changing
their approach from inpatient- to ambulatory-focused or from disease-focused to encompassing
the broader continuum of care. Several ACOs had specific initiatives, funded under separate
auspices, which focused on beneficiaries with a specific condition or a team-based approach for
ambulatory care management.
As the care management programs grew and developed during the Pioneer initial performance
period, the ACOs continued to refine their care management programs. Some Pioneer ACOs with
centralized care management structures moved to decentralize them into provider offices, while
other ACOs moved in the other direction. ACOs also worked to improve the way they targeted
beneficiaries to receive care management, attempting to identify them before they became high-
cost. In some cases, this entailed employing more complex data mining to improve predictive
models and in other cases it involved engaging beneficiaries themselves to assess risk. Pioneer
ACOs also refined their communications with beneficiaries around care management,
emphasizing physician relationships and replacing terms such as “care coordinator with “health
coach” or “health advocate.”
Among all Pioneer ACOs, a common driver of care management changes was the need to
maximize the return on investment (ROI) from these services. Acknowledging the difficulty in
measuring ROI, some ACOs also expressed concerns about the inability to assess ROI, particularly
given the high turnover in aligned beneficiaries from one performance year to the next. Some
ACOs reported that other business changes within the ACO or its parent organization were driving
changes to care management, whether through taking on an additional business function for a
parent organization or losing the support of a parent organization’s tool or vendor.
The vast majority of Pioneer ACOs entered the model with care management experience—often
developed and implemented as part of managing the total cost of care for a population for an MA
plan, commercial contract, or a previous CMS or other initiative. However, there remained a
decided lack of consensus on what makes care management effective, evidenced by the variation
and fluctuations in the approaches described above and the difficulty in measuring ROI for care
management activities. Even through the third year of the initial performance period, Pioneer
ACOs continued to report using trial and error to make incremental changes and improvements to
their care management programs.
ACO health information technology investments driven by broader organizational strategy
Given that the Pioneer ACOs were selected based on demonstrated capabilities in managing
population health, it is not surprising that almost all had advanced IT systems at the outset of the
model. These systems typically included both integrated EHRs and data warehouses, though rarely
full interoperability across the care spectrum. Most Pioneer ACOs reported continuing to augment
or enhance their systems over the course of the performance years.
While almost all had integrated EHRs, the existing EHR for a small number of Pioneer ACOs was
common only to the hospital and employed physicians or was not interoperable across all ACO
Pioneer ACO Final Report HHSM-500-2011-00019i/HHSM-500-T0002
49
participating providers. For those with less integrated systems, there were generally efforts to
broaden the EHR’s reach to a broader set of providers with data and other communications over
the performance period. By the end of the three-year initial performance period, one Pioneer ACO
solved this problem by subsidizing independent providers to move onto an interoperable EHR.
Two other Pioneer ACOs either gave providers access to patient data or analytics or created
separate quality reports. Another ACO loaded data from non-interoperable providers into the
ACO’s data warehouse for analysis.
Even those entering the model with large, integrated systems continued to evolve and improve
their IT capabilities over time. While the Pioneer model likely had some influence, most ACOs
indicated that they would have continued to improve their systems as part of an overall business
strategy to keep pace with the health care market’s trajectory toward data analytics and promoting
value.
The most common enhancements across those ACOs augmenting their systems were focused on
the operational and analytic needs of the organizations—integrating claims and clinical data and
making improvements to ease development, sharing, and analysis of ACO-specific quality metrics.
With respect to data analytics, there were different approaches across the Pioneer ACOs. Some
ACOs hired additional staff or used a vendor to support this function; many focused exclusively
on the Pioneer aligned beneficiaries for their performance measurement while others analyzed
other patient populations as well. In addition to performance measurement and reporting, most of
the Pioneer ACOs emphasized the use of data for care management. The most integrated systems
were able to produce reports using combined clinical and claims data and feed information on gaps
in care back into an EHR. Several systems used their data analytics for selecting patients and
analyzing utilization for care management. Also, several Pioneer ACOs relied on their data system
for passive or active alerts to providers when an aligned patient is hospitalized within the ACO’s
own system.
Model restrictions and weak beneficiary ties challenged Pioneer ACOs’ ability to engage beneficiaries
Pioneer ACOs were responsible for improving cost, quality, and patient experience for an aligned
population of Medicare FFS beneficiaries, although these beneficiaries retained full freedom of
choice, did not have cost-sharing incentives to use ACO providers, and did not affirmatively enroll
in an ACO as they would in an MA plan. Absent differential cost sharing and active enrollment,
Pioneer ACOs viewed beneficiary engagement as another key component to achieving the triple
aim.
Patient engagement, which combines “patient activation [a patient’s knowledge, skills, and ability
to manage his or her own health] with interventions designed to increase activation and promote
positive behavior, such as obtaining preventive care or exercising regularly,” may improve health
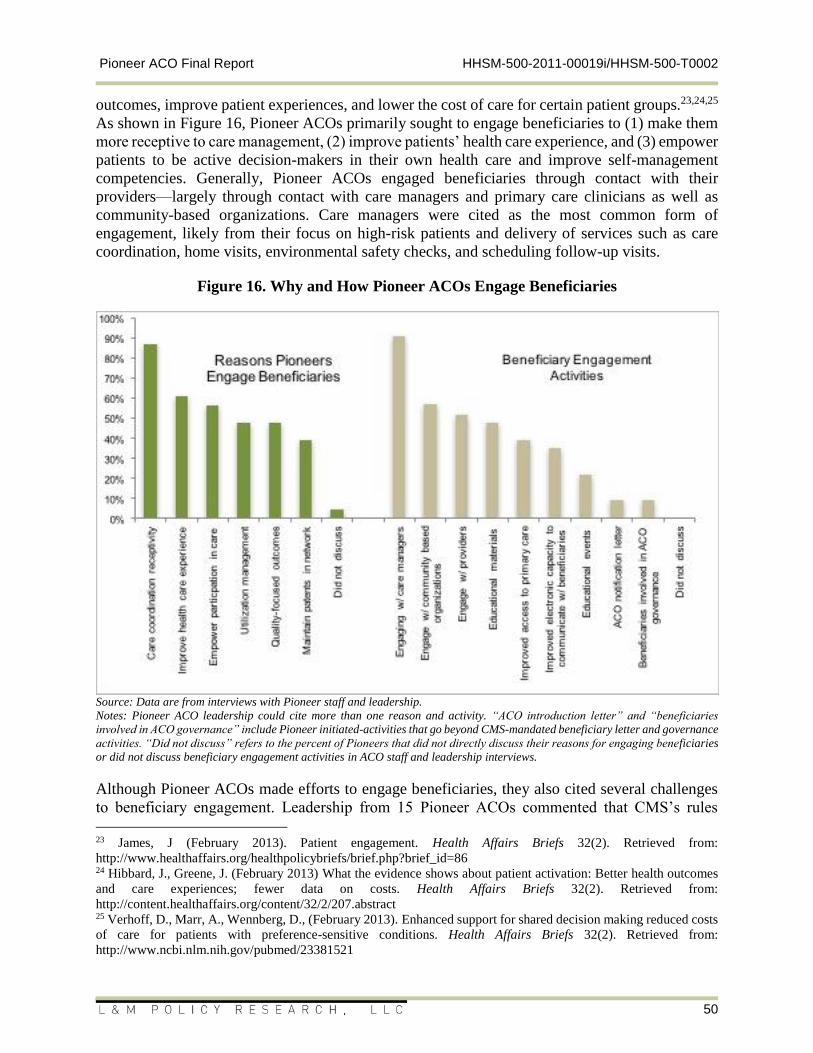
Pioneer ACO Final Report HHSM-500-2011-00019i/HHSM-500-T0002
50
outcomes, improve patient experiences, and lower the cost of care for certain patient groups.23,24,25
As shown in Figure 16, Pioneer ACOs primarily sought to engage beneficiaries to (1) make them
more receptive to care management, (2) improve patients’ health care experience, and (3) empower
patients to be active decision-makers in their own health care and improve self-management
competencies. Generally, Pioneer ACOs engaged beneficiaries through contact with their
providers—largely through contact with care managers and primary care clinicians as well as
community-based organizations. Care managers were cited as the most common form of
engagement, likely from their focus on high-risk patients and delivery of services such as care
coordination, home visits, environmental safety checks, and scheduling follow-up visits.
Figure 16. Why and How Pioneer ACOs Engage Beneficiaries
Source: Data are from interviews with Pioneer staff and leadership.
Notes: Pioneer ACO leadership could cite more than one reason and activity. “ACO introduction letter” and “beneficiaries
involved in ACO governance” include Pioneer initiated-activities that go beyond CMS-mandated beneficiary letter and governance
activities. “Did not discuss” refers to the percent of Pioneers that did not directly discuss their reasons for engaging beneficiaries
or did not discuss beneficiary engagement activities in ACO staff and leadership interviews.
Although Pioneer ACOs made efforts to engage beneficiaries, they also cited several challenges
to beneficiary engagement. Leadership from 15 Pioneer ACOs commented that CMS’s rules
23 James, J (February 2013). Patient engagement. Health Affairs Briefs 32(2). Retrieved from:
http://www.healthaffairs.org/healthpolicybriefs/brief.php?brief_id=86 24 Hibbard, J., Greene, J. (February 2013) What the evidence shows about patient activation: Better health outcomes
and care experiences; fewer data on costs. Health Affairs Briefs 32(2). Retrieved from:
http://content.healthaffairs.org/content/32/2/207.abstract 25 Verhoff, D., Marr, A., Wennberg, D., (February 2013). Enhanced support for shared decision making reduced costs
of care for patients with preference-sensitive conditions. Health Affairs Briefs 32(2). Retrieved from:
http://www.ncbi.nlm.nih.gov/pubmed/23381521
Pioneer ACO Final Report HHSM-500-2011-00019i/HHSM-500-T0002
51
regarding communications with beneficiaries about the ACO were too restrictive and bureaucratic.
The most commonly raised example was the annual letter that ACOs were required to send to
beneficiaries notifying them that their providers were participating in an ACO and that their
medical data would be shared with the ACO unless the beneficiary opted out of data sharing;
several ACOs commented that the required language in these letters was cumbersome and
confusing to beneficiaries. After restrictions on communications, the most commonly discussed
challenge was patient resistance or attitude, especially if beneficiaries were skeptical or suspicious
about the legitimacy of health care outreach efforts. Additionally, Pioneer ACOs highlighted
difficulties managing FFS beneficiaries; these ACOs often contrasted ACO-aligned beneficiaries
to beneficiaries in MA plans. These ACOs asserted that engaging beneficiaries was difficult when
there were no explicit financial incentives for patients to receive care from the ACOs, while MA
patients have financial motivations to use in-network providers. Some Pioneer ACOs asserted that
beneficiaries often choose traditional Medicare FFS specifically because they do not want provider
network limitations, and these patients may have construed efforts to engage them in the ACO as
an effort to limit provider choice. From interviews with Pioneer ACO leadership, many
organizations’ beneficiary engagement activities focused on describing additional benefits
available to beneficiaries and encouraging them to participate in care management and other
activities, while specifically avoiding the ACO label.
Despite the annual notification letter and Pioneer ACOs’ efforts to engage beneficiaries, in small
group discussions with beneficiaries focused on understanding beneficiaries’ experiences with
ACOs, we learned that beneficiaries were generally unaware of the ACO organization and the term
“ACO.” In the few cases where the beneficiaries reported hearing the term ACO, they were not
able to describe what an ACO is and its relationship to them as recipients of health care services.
Since beneficiaries were not even aware of the term “ACO,” they also were unaware that their care
was being provided or coordinated by an ACO. When discussing their care, beneficiaries more
clearly identified with their primary care providers, the provider facilities, and with the care teams
than with the ACO. This discrepancy may be a result, in part, of the fact that most beneficiary
participants in the small group discussions had been receiving care from their primary care
providers for several to many years before the ACO existed.
Pioneer ACOs acknowledge need for behavioral health management but extent of activity was mixed
With the incidence and high cost of behavioral health conditions, improved management of
beneficiaries with behavioral health conditions may help
ACOs generate savings. As behavioral health often lags in
focus behind somatic health in care delivery and focus,
despite the multiplicative effect behavioral health conditions
can have on overall health care spending, the evaluation was
interested in understanding whether and how Pioneer ACOs
managed behavioral health. We analyzed interview data
collected during the third performance year to explore how
the remaining 19 Pioneer ACOs addressed behavioral health
conditions. Again, as the evaluation was focused on the
Pioneer model as a whole, and not any particular ACO, it is difficult to assess the intensity or
extensiveness of Pioneer ACO activities in this area—much of the information gathered on this
Some Pioneer ACO representatives
indicated that FFS beneficiaries are
not accustomed to having care
management benefits, and as a result
may be leery of these efforts. For
example, one Pioneer noted that
FFS patients are often wary of care
management activities, while MA
patients tend to see these activities as
a benefit of their plan.
Pioneer ACO Final Report HHSM-500-2011-00019i/HHSM-500-T0002
52
topic was a function of the Pioneer ACO volunteering information, as opposed to collected with a
protocol structured to capture a more uniform set of details about these activities.
As volunteered in the interviews, almost all Pioneer ACOs recognized the contribution of
behavioral health conditions to higher beneficiary utilization of services and overall spending,
particularly when they examined factors associated with repeat hospitalizations, repeat emergency
department use, and longer hospital stays. All the Pioneer ACOs interviewed reported expanding
their capacity in some way to manage beneficiaries with behavioral health conditions through three
broad approaches: (1) co-locating behavioral health providers with primary care providers; (2)
enhancing the availability of licensed social workers; and (3) expanding their referral network and
general screening efforts. The Pioneer ACOs often combined these approaches to meet the needs
of both a diverse set of primary care providers and the differing needs of their beneficiaries. They
are described in more detail below.
Co-locating with Primary Care Providers. Many Pioneer ACOs co-located behavioral
health care and primary care in a subset of their primary care offices to facilitate access to
behavioral health care and improve care coordination. Some Pioneer ACOs implemented
models based on formal collaborative care models such as IMPACT.26 These ACOs
generally used social workers to provide collaborative care, and some focused on treating
depression in individuals with other chronic physical conditions such as diabetes or
cardiovascular disease. Other ACOs placed a behavioral health provider (usually a social
worker) in selected primary care offices without a formal collaborative care model. A
couple of Pioneer ACOs developed clinics that focused on patients with complex physical
and behavioral health needs. Pioneer ACO providers could refer patients to these specialty
clinics for co-located and integrated care. Also, those that included federally qualified
health centers in their networks used these centers to provide integrated care. Finally, at
least one Pioneer ACO embedded primary care services into a large outpatient mental
health facility in its network.
Increased Beneficiary Access to Social Workers. Another approach Pioneer ACOs
pursued was to increase beneficiaries’ access to social workers, either by hiring social
workers to augment their medical care coordination teams or to serve as an independent—
not located in the same office—centralized resource for providers. When the social workers
were added to the medical care coordination teams, care coordinators would refer
beneficiaries to the social workers when there were significant psychosocial issues to
address or behavioral health disorders that were not appropriately managed. The social
workers could focus on addressing the psychosocial issues and short-term behavioral health
interventions, while coordinating referrals for longer-term mental health treatment. When
the social workers were independent, the Pioneer ACOs made the social workers available
to participating providers via referral. In these instances, social workers functioned
similarly to those embedded in the practice in that they provided short-term care and found
26 The Collaborative Care Model is an evidence-based model for integrating behavioral health and primary care first
developed at the University of Washington through their research involving the Improving Mood–Promoting Access
to Collaborative Treatment (IMPACT) program.
Pioneer ACO Final Report HHSM-500-2011-00019i/HHSM-500-T0002
53
appropriate referrals for individuals who required long-term management but were not co-
located with the care coordination team.
Expanded Referral Networks. Multiple Pioneer ACOs improved access to behavioral
health care providers by (1) improving connections to community resources, (2) partnering
with a behavioral health facility, and (3) organizing internal behavioral health resources to
improve access to and coordination with primary care providers. Many ACOs also
discussed referring to home health agencies and visiting nurse associations to provide
behavioral health and social work services. One Pioneer ACO developed a mental health
center of excellence; in this model, primary care physicians could refer beneficiaries to the
center for long-term management when the beneficiaries’ care needs exceeded what could
be provided in the clinic.
Expanding Existing Programs. Many Pioneer ACOs had plans or programs in place to
address behavioral health before entering the Pioneer model. These activities often were
embedded in larger delivery transformation efforts as some organizations reorganized to
become medical homes with greater emphasis on care coordination. Funding for many of
these programs (particularly the integrated care models) often depended on grants and
organizational overhead funds. For example, one Pioneer ACO was concurrently
participating in a national implementation of a formal collaborative care program (Care of
Mental, Physical and Substance-use Syndromes) and diabetes and cardiovascular disease.
This program served as the basis for the organization’s new social work department, which
was heavily utilized by the ACO.
Enhanced Behavioral Health Screening. Because depression screening is one of the
ACO quality metrics, many Pioneer ACOs enhanced their depression or behavioral health
screenings in primary care settings. Some Pioneer ACOs carried the screening further by
developing specific steps to follow for positive depression screens, including provider
prompts for appropriate follow-up, and referral to in-house or co-located social workers
for treatment or referral assistance. A small minority of ACOs did not improve screening
because physicians felt they did not have the resources or training to respond to all positive
screens effectively.
Challenges to improving behavioral health services
Pioneer ACOs recognize the role that behavioral health plays in health care utilization and
spending, and some reported a focus on improving care in this area, with efforts appearing to be
largely bundled alongside the more expansive suite of care management and social work efforts.
This finding reflects both the challenges to implementing a more robust set of behavioral health
initiatives and that behavioral health is simply not prioritized in the broader rubric of ACO
activities.
The challenges were significant, however, and not unique to ACOs; there was generally an
inadequate supply of behavioral health specialists, a dearth of sustainable financing models for
care integration, obstacles related to data suppression, and beneficiary and provider resistance to
treatment. A couple of ACOs felt that the gradual switch toward global payment (of which they
considered the ACO an intermediate step) helped promote improved coordination and integration
Pioneer ACO Final Report HHSM-500-2011-00019i/HHSM-500-T0002
54
of behavioral health care. However, the privacy provisions 42 of the Code of Federal Regulations
part 2 that lead to a suppression of claims data with a diagnosis or procedure related to substance
use prevented Pioneer ACOs from analyzing data for this patient population in the same way they
analyzed other patient populations. While almost all Pioneer ACOs acknowledged that it was also
important to diagnose and treat substance use disorders, which bring an intensified version of the
challenges noted above, mental illness was still a larger focus.
It is notable that Pioneer ACOs at least mentioned working on improving identification and
referrals, though there was no discussion of measuring or improving quality of care for these
conditions, perhaps because ACOs prioritized identification and access as a start to addressing
behavioral health needs. It could also be because ACOs do not have methods to identify, measure,
or address treatment quality. There are few quality of care measures that are feasible to collect and
endorsed by providers and are not emphasized in the set of CMS ACO quality measures; the most
relevant metrics to behavioral health are depression screening and tobacco use assessment and
cessation intervention. However, the shift toward responsibility for total health care costs does
appear to be promoting efforts to improve care coordination and integration to address the health
care needs of beneficiaries with behavioral health disorders.
The SNF waiver may help ACOs manage care
Starting in 2014, CMS offered Pioneer ACOs the option to apply for and implement a waiver of
the 3-day prior hospitalization requirement before a SNF stay. Waiving this SNF 3-day prior
hospitalization rule provides Pioneer ACOs, already accountable for the total cost of care for their
aligned beneficiaries, with an additional lever for improving care and reducing Medicare costs of
their aligned patients; 14 of the ACOs remaining at the end of the initial performance period used
the waiver. Under this waiver, participating ACOs could send eligible, aligned patients to partner
SNFs to receive Medicare-covered SNF services without a prior 3-day hospitalization. Our
findings were mixed as to whether the waiver benefited the ACOs’ ability to better manage
beneficiary care. On one hand, we observed lower total expenditures among waiver patients
compared with non-waiver patients. However, we found slight increases in rates of hospitalization
and ED use following SNF admission among waiver patients compared with non-waiver patients.
We explored characteristics of the ACOs participating in the waiver and attempted to measure the
effect of the waiver. To do so, we used information gathered throughout the evaluation, conducted
waiver-focused interviews with leadership in each participating ACO in the fall of 2014, and
analyzed Medicare claims data and MDS data.
Who uses the SNF 3-day waiver?
Across the 14 participating Pioneer ACOs, we identified a total of 4,301 SNF stays that used the
SNF 3-day rule waiver (“waiver stays”), of which 1,301 were in 2014 and 3,000 were in 2015.
ACOs noted challenges in identifying patients for the waiver, and as shown in Table 33 in
Appendix B, the number of waiver stays varied widely by ACO.
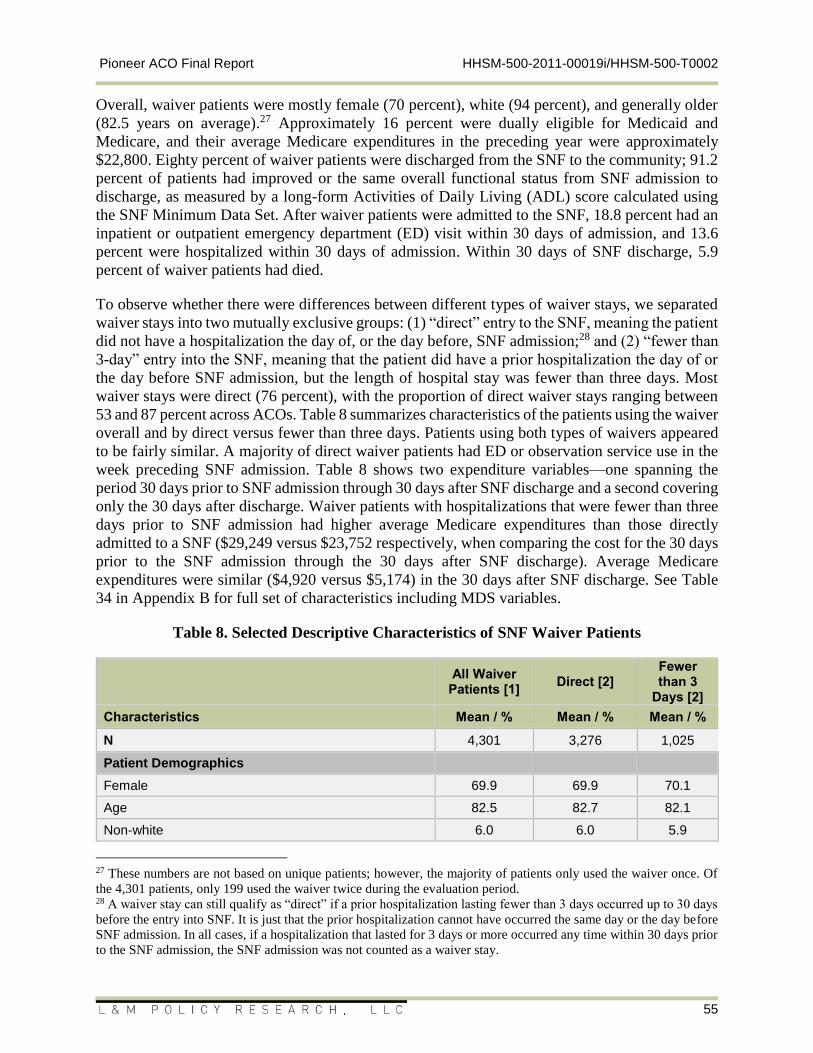
Pioneer ACO Final Report HHSM-500-2011-00019i/HHSM-500-T0002
55
Overall, waiver patients were mostly female (70 percent), white (94 percent), and generally older
(82.5 years on average).27 Approximately 16 percent were dually eligible for Medicaid and
Medicare, and their average Medicare expenditures in the preceding year were approximately
$22,800. Eighty percent of waiver patients were discharged from the SNF to the community; 91.2
percent of patients had improved or the same overall functional status from SNF admission to
discharge, as measured by a long-form Activities of Daily Living (ADL) score calculated using
the SNF Minimum Data Set. After waiver patients were admitted to the SNF, 18.8 percent had an
inpatient or outpatient emergency department (ED) visit within 30 days of admission, and 13.6
percent were hospitalized within 30 days of admission. Within 30 days of SNF discharge, 5.9
percent of waiver patients had died.
To observe whether there were differences between different types of waiver stays, we separated
waiver stays into two mutually exclusive groups: (1) “direct” entry to the SNF, meaning the patient
did not have a hospitalization the day of, or the day before, SNF admission;28 and (2) “fewer than
3-day” entry into the SNF, meaning that the patient did have a prior hospitalization the day of or
the day before SNF admission, but the length of hospital stay was fewer than three days. Most
waiver stays were direct (76 percent), with the proportion of direct waiver stays ranging between
53 and 87 percent across ACOs. Table 8 summarizes characteristics of the patients using the waiver
overall and by direct versus fewer than three days. Patients using both types of waivers appeared
to be fairly similar. A majority of direct waiver patients had ED or observation service use in the
week preceding SNF admission. Table 8 shows two expenditure variables—one spanning the
period 30 days prior to SNF admission through 30 days after SNF discharge and a second covering
only the 30 days after discharge. Waiver patients with hospitalizations that were fewer than three
days prior to SNF admission had higher average Medicare expenditures than those directly
admitted to a SNF ($29,249 versus $23,752 respectively, when comparing the cost for the 30 days
prior to the SNF admission through the 30 days after SNF discharge). Average Medicare
expenditures were similar ($4,920 versus $5,174) in the 30 days after SNF discharge. See Table
34 in Appendix B for full set of characteristics including MDS variables.
Table 8. Selected Descriptive Characteristics of SNF Waiver Patients
All Waiver
Patients [1] Direct [2]
Fewer than 3
Days [2]
Characteristics Mean / % Mean / % Mean / %
N 4,301 3,276 1,025
Patient Demographics
Female 69.9 69.9 70.1
Age 82.5 82.7 82.1
Non-white 6.0 6.0 5.9
27 These numbers are not based on unique patients; however, the majority of patients only used the waiver once. Of
the 4,301 patients, only 199 used the waiver twice during the evaluation period. 28 A waiver stay can still qualify as “direct” if a prior hospitalization lasting fewer than 3 days occurred up to 30 days
before the entry into SNF. It is just that the prior hospitalization cannot have occurred the same day or the day before
SNF admission. In all cases, if a hospitalization that lasted for 3 days or more occurred any time within 30 days prior
to the SNF admission, the SNF admission was not counted as a waiver stay.
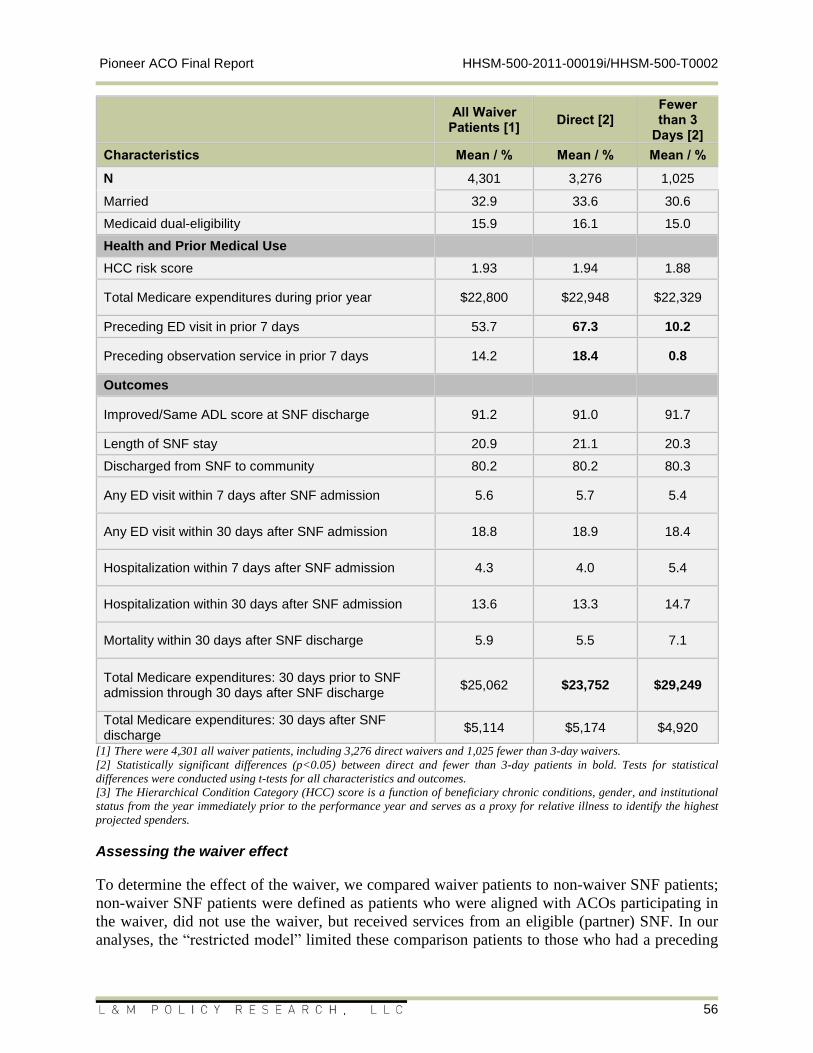
Pioneer ACO Final Report HHSM-500-2011-00019i/HHSM-500-T0002
56
All Waiver
Patients [1] Direct [2]
Fewer than 3
Days [2]
Characteristics Mean / % Mean / % Mean / %
N 4,301 3,276 1,025
Married 32.9 33.6 30.6
Medicaid dual-eligibility 15.9 16.1 15.0
Health and Prior Medical Use
HCC risk score 1.93 1.94 1.88
Total Medicare expenditures during prior year $22,800 $22,948 $22,329
Preceding ED visit in prior 7 days 53.7 67.3 10.2
Preceding observation service in prior 7 days 14.2 18.4 0.8
Outcomes
Improved/Same ADL score at SNF discharge 91.2 91.0 91.7
Length of SNF stay 20.9 21.1 20.3
Discharged from SNF to community 80.2 80.2 80.3
Any ED visit within 7 days after SNF admission 5.6 5.7 5.4
Any ED visit within 30 days after SNF admission 18.8 18.9 18.4
Hospitalization within 7 days after SNF admission 4.3 4.0 5.4
Hospitalization within 30 days after SNF admission 13.6 13.3 14.7
Mortality within 30 days after SNF discharge 5.9 5.5 7.1
Total Medicare expenditures: 30 days prior to SNF admission through 30 days after SNF discharge
$25,062 $23,752 $29,249
Total Medicare expenditures: 30 days after SNF discharge
$5,114 $5,174 $4,920
[1] There were 4,301 all waiver patients, including 3,276 direct waivers and 1,025 fewer than 3-day waivers.
[2] Statistically significant differences (p<0.05) between direct and fewer than 3-day patients in bold. Tests for statistical
differences were conducted using t-tests for all characteristics and outcomes.
[3] The Hierarchical Condition Category (HCC) score is a function of beneficiary chronic conditions, gender, and institutional
status from the year immediately prior to the performance year and serves as a proxy for relative illness to identify the highest
projected spenders.
Assessing the waiver effect
To determine the effect of the waiver, we compared waiver patients to non-waiver SNF patients;
non-waiver SNF patients were defined as patients who were aligned with ACOs participating in
the waiver, did not use the waiver, but received services from an eligible (partner) SNF. In our
analyses, the “restricted model” limited these comparison patients to those who had a preceding
Pioneer ACO Final Report HHSM-500-2011-00019i/HHSM-500-T0002
57
inpatient hospitalization that was exactly three days in length. We also estimated the model using
an “unrestricted model” that allowed the prior in patient hospitalization to be more than three days.
We used multivariate linear regression that controls for the multitude of beneficiary characteristics
and SNF characteristics.
The main model examined the effect of waiver conditional on using SNF, but in the absence of the
waiver, patients may not have used a Medicare-covered SNF. We explored the use of a sample
selection model to jointly estimate the probability of using SNF and the effect of the waiver on
outcomes conditional on using a SNF. This method provides the unconditional effect of the waiver
in the sense that it accounts for a patient’s predicted probability of SNF use based on a set of patient
and market-level characteristics. However, this method does not explicitly measure the existence
(or extent) of increased SNF use directly attributed to the waiver.
We examined the outcome measures listed in the bottom panel of Table 8. Where possible, we
used performance measures that were in line with the goals and expectations that the ACOs stated
for them. ACOs believed that the waiver would provide more flexibility for selecting the most
appropriate setting for care and would help reduce costs. Also, they felt that allowing patients to
avoid the hospital (when appropriate) or minimize their stay would reduce hospital-related
infections and other complications.
Results
Table 9 summarizes the risk-adjusted results of comparing the restricted (prior hospitalization of
exactly three days) and unrestricted (prior hospitalization of any length) to the waiver group. We
provide the direction of the estimated marginal effect of the waiver for estimates that are
statistically significant at the 5 percent level (bold italicized font). See Table 35 and Table 36 in
Appendix B. Data Tables for the full set of results. Generally, we see the same direction and
significance using both the restricted and unrestricted comparison groups. Waiver patients had
shorter SNF lengths of stay and lower Medicare spending when spending is measured over the
period spanning 30 days prior to SNF admission and 30 days after SNF discharge. On the other
hand, waiver patients were more likely to have had an ED visit or a hospitalization after seven
days of SNF admission and after 30 days of SNF admission. Effects on spending were not
statistically significant when only examining the 30 days after SNF discharge.
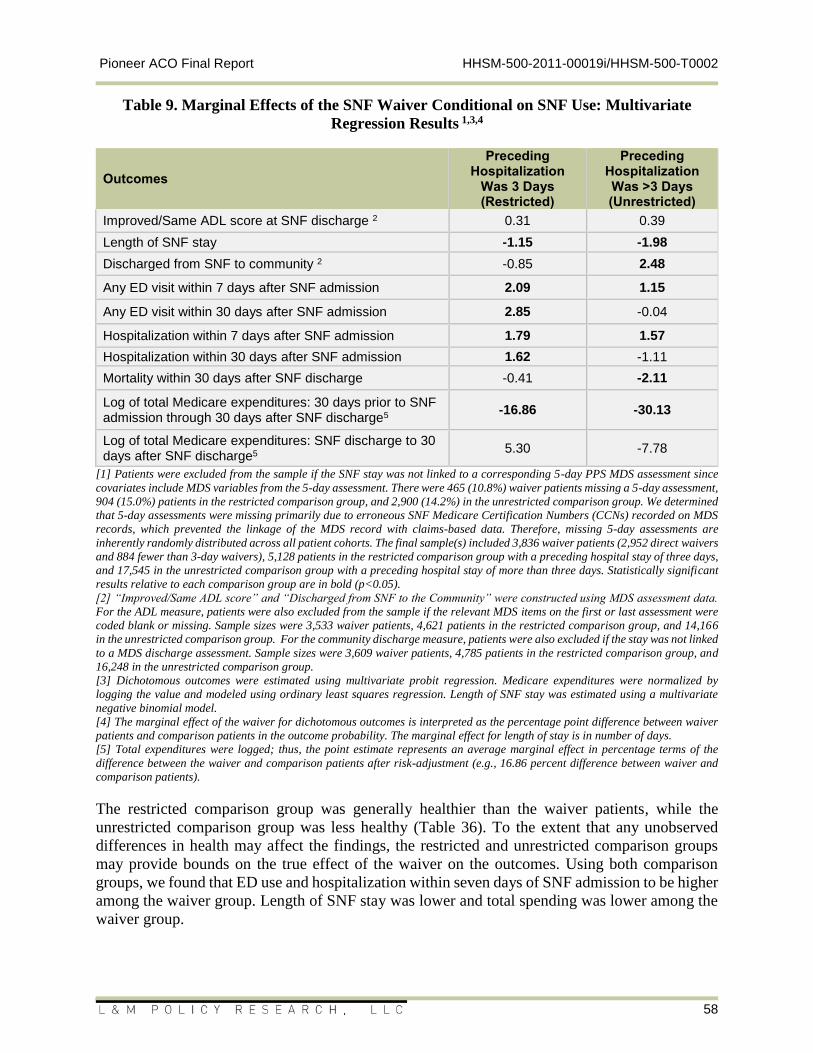
Pioneer ACO Final Report HHSM-500-2011-00019i/HHSM-500-T0002
58
Table 9. Marginal Effects of the SNF Waiver Conditional on SNF Use: Multivariate
Regression Results 1,3,4
Outcomes
Preceding Hospitalization
Was 3 Days (Restricted)
Preceding Hospitalization Was >3 Days (Unrestricted)
Improved/Same ADL score at SNF discharge 2 0.31 0.39
Length of SNF stay -1.15 -1.98
Discharged from SNF to community 2 -0.85 2.48
Any ED visit within 7 days after SNF admission 2.09 1.15
Any ED visit within 30 days after SNF admission 2.85 -0.04
Hospitalization within 7 days after SNF admission 1.79 1.57
Hospitalization within 30 days after SNF admission 1.62 -1.11
Mortality within 30 days after SNF discharge -0.41 -2.11
Log of total Medicare expenditures: 30 days prior to SNF admission through 30 days after SNF discharge5
-16.86 -30.13
Log of total Medicare expenditures: SNF discharge to 30 days after SNF discharge5
5.30 -7.78
[1] Patients were excluded from the sample if the SNF stay was not linked to a corresponding 5-day PPS MDS assessment since
covariates include MDS variables from the 5-day assessment. There were 465 (10.8%) waiver patients missing a 5-day assessment,
904 (15.0%) patients in the restricted comparison group, and 2,900 (14.2%) in the unrestricted comparison group. We determined
that 5-day assessments were missing primarily due to erroneous SNF Medicare Certification Numbers (CCNs) recorded on MDS
records, which prevented the linkage of the MDS record with claims-based data. Therefore, missing 5-day assessments are
inherently randomly distributed across all patient cohorts. The final sample(s) included 3,836 waiver patients (2,952 direct waivers
and 884 fewer than 3-day waivers), 5,128 patients in the restricted comparison group with a preceding hospital stay of three days,
and 17,545 in the unrestricted comparison group with a preceding hospital stay of more than three days. Statistically significant
results relative to each comparison group are in bold (p<0.05).
[2] “Improved/Same ADL score” and “Discharged from SNF to the Community” were constructed using MDS assessment data.
For the ADL measure, patients were also excluded from the sample if the relevant MDS items on the first or last assessment were
coded blank or missing. Sample sizes were 3,533 waiver patients, 4,621 patients in the restricted comparison group, and 14,166
in the unrestricted comparison group. For the community discharge measure, patients were also excluded if the stay was not linked
to a MDS discharge assessment. Sample sizes were 3,609 waiver patients, 4,785 patients in the restricted comparison group, and
16,248 in the unrestricted comparison group.
[3] Dichotomous outcomes were estimated using multivariate probit regression. Medicare expenditures were normalized by
logging the value and modeled using ordinary least squares regression. Length of SNF stay was estimated using a multivariate
negative binomial model.
[4] The marginal effect of the waiver for dichotomous outcomes is interpreted as the percentage point difference between waiver
patients and comparison patients in the outcome probability. The marginal effect for length of stay is in number of days.
[5] Total expenditures were logged; thus, the point estimate represents an average marginal effect in percentage terms of the
difference between the waiver and comparison patients after risk-adjustment (e.g., 16.86 percent difference between waiver and
comparison patients).
The restricted comparison group was generally healthier than the waiver patients, while the
unrestricted comparison group was less healthy (Table 36). To the extent that any unobserved
differences in health may affect the findings, the restricted and unrestricted comparison groups
may provide bounds on the true effect of the waiver on the outcomes. Using both comparison
groups, we found that ED use and hospitalization within seven days of SNF admission to be higher
among the waiver group. Length of SNF stay was lower and total spending was lower among the
waiver group.
Pioneer ACO Final Report HHSM-500-2011-00019i/HHSM-500-T0002
59
Unconditional effects
Using a sample selection model, we attempted to examine the unconditional effect of SNF. This
model incorporates the probability of any SNF use. In general, we did not find that using this
selection model substantially changed the findings, meaning we did not find evidence that the
availability of the waiver induced SNF use among patients that would otherwise have not used a
SNF, but we cannot conclude that the waiver did not induce any additional SNF use compared
with no waiver available. Out of the nine outcomes, there were six where we could reject the
hypothesis that the probability that the patient using the SNF did not influence the estimated
marginal effect of the waiver: improved/same ADL score at SNF discharge, ED visit after 30 days
of SNF admission, hospitalization after seven days of SNF admission, 30-day mortality following
SNF discharge, total Medicare expenditures in the period spanning 30 days before and after the
SNF stay, and total Medicare expenditures in only the 30 days after SNF discharge. For each
outcome, though, the direction and significance for all waiver patients and each of the subgroups
remained the same.
Analysis by ACO waiver experience and implementation characteristics
We examined whether the impact of the SNF 3-day waiver differed according to whether the
participating ACO had prior experience with the SNF 3-day waiver from MA or commercial plans,
had a dedicated waiver care coordinator, or required physician oversight of SNF admissions. We
found that:
Waiver patients of ACOs that had prior experience with a SNF 3-day waiver were more
likely to be discharged to the community and less likely to be hospitalized within seven
days of SNF admission compared to other waiver patients.
Waiver patients of ACOs with a dedicated waiver care coordinator or ACOs that required
physician oversight of SNF admissions had lower total Medicare expenditures between 30
days before and after the SNF stay compared to other waiver patients.
Waiver patients of ACOs that had physician oversight of SNF admissions had lower
Medicare expenditures in the 30 days following SNF discharge compared with other
waiver patients.
Most waiver patients entered a SNF without a prior hospital admission, either directly from the
ED or after being in the hospital for observation (without being admitted). Compared to non-
waiver SNF patients aligned with participating ACOs who had a prior hospitalization lasting
exactly three days, waiver patients had shorter SNF stays and lower Medicare expenditures
(counting the period 30 days before the SNF stay through 30 days after the SNF stay). This finding
is unsurprising, as waiver patients had no (or shorter) hospitalizations prior to SNF admission. On
the other hand, waiver use appeared to be associated with higher rates of post-SNF admission ED
visits and hospitalizations. Thus, although we did not find evidence that the waiver induced SNF
use among patients who otherwise would not have used SNF, findings of higher ED and
hospitalizations among waiver patients indicated that the waiver may have induced the use of
additional (and potentially undesirable) health care. The extent of and reason for higher ED and
hospitalization use among waiver patients merits additional exploration.
Pioneer ACO Final Report HHSM-500-2011-00019i/HHSM-500-T0002
60
ACO impact on quality of care: CAHPS and GPRO analysis
Since their inception, the Medicare ACO initiatives, and their predecessor, the Medicare Physician
Group Practice Demonstration, have sought to develop incentives for providers to deliver care
more cost-efficiently without jeopardizing the quality of care provided. Medicare therefore
designed them so that ACOs’ performance payments are contingent not only on achieving savings
but also on meeting specific quality standards. These quality measures are based on claims, the
ACO CAHPS, which is the ACO version of the Consumer Assessment of Healthcare Providers
and Systems (CAHPS) patient experience survey, and on the Group Practice Reporting Option
(GPRO) process and clinical quality measures.
This analysis utilized selected items from the ACO CAHPS instrument and GPRO to measure
aspects of patient experience (ACO CAHPS) and quality of care (GPRO) that supplement what is
possible using administrative claims data. Data from these item sets were only collected from
ACOs that were actively participating in the initiatives; if an ACO withdrew from the Pioneer
model, it no longer submitted these data. Since ACO CAHPS instruments were fielded after the
completion of a performance year, the corresponding ACO CAHPS data might not be available if
an ACO withdrew during or immediately following the performance year. As a result of these
constraints, and because we focused on ACOs participating for at least the years 2012 and 2013 to
observe a trend, the ACO CAHPS and GPRO analyses include results based on 23 Pioneer ACOs.
We examined six market and six ACO-level measures with the goal of establishing how they are
related to ACO quality, as measured through ACO CAHPS and GPRO measures. For the market-
level measures, we defined ACO markets either by Dartmouth Atlas Hospital Referral Regions
(HRRs) or U.S. Office of Management and Budget Core-Based Statistical Areas (CBSAs). We
chose between HRR and CBSA for a market based on which contained a larger proportion of
ACO-aligned beneficiaries. The market and ACO characteristics used in the analyses are shown
in Table 10. Table 23 identifies each of the markets used in this analysis.
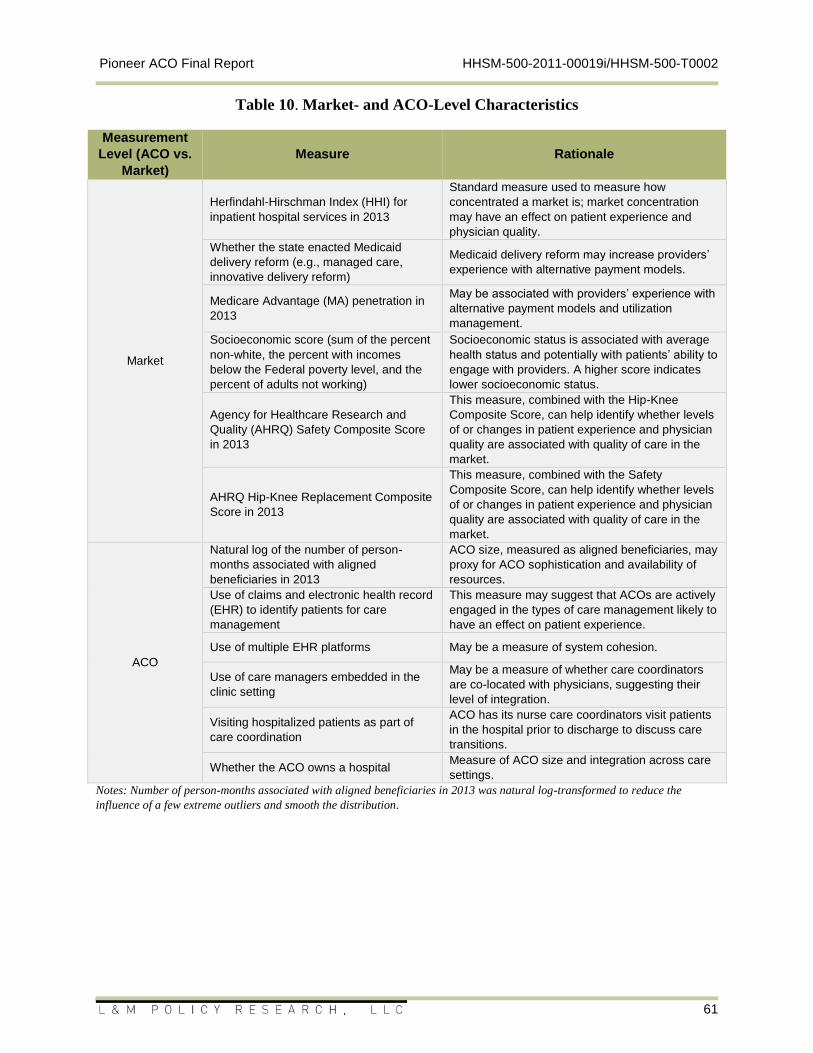
Pioneer ACO Final Report HHSM-500-2011-00019i/HHSM-500-T0002
61
Table 10. Market- and ACO-Level Characteristics
Measurement
Level (ACO vs.
Market)
Measure Rationale
Market
Herfindahl-Hirschman Index (HHI) for
inpatient hospital services in 2013
Standard measure used to measure how
concentrated a market is; market concentration
may have an effect on patient experience and
physician quality.
Whether the state enacted Medicaid
delivery reform (e.g., managed care,
innovative delivery reform)
Medicaid delivery reform may increase providers’
experience with alternative payment models.
Medicare Advantage (MA) penetration in
2013
May be associated with providers’ experience with
alternative payment models and utilization
management.
Socioeconomic score (sum of the percent
non-white, the percent with incomes
below the Federal poverty level, and the
percent of adults not working)
Socioeconomic status is associated with average
health status and potentially with patients’ ability to
engage with providers. A higher score indicates
lower socioeconomic status.
Agency for Healthcare Research and
Quality (AHRQ) Safety Composite Score
in 2013
This measure, combined with the Hip-Knee
Composite Score, can help identify whether levels
of or changes in patient experience and physician
quality are associated with quality of care in the
market.
AHRQ Hip-Knee Replacement Composite
Score in 2013
This measure, combined with the Safety
Composite Score, can help identify whether levels
of or changes in patient experience and physician
quality are associated with quality of care in the
market.
ACO
Natural log of the number of person-
months associated with aligned
beneficiaries in 2013
ACO size, measured as aligned beneficiaries, may
proxy for ACO sophistication and availability of
resources.
Use of claims and electronic health record
(EHR) to identify patients for care
management
This measure may suggest that ACOs are actively
engaged in the types of care management likely to
have an effect on patient experience.
Use of multiple EHR platforms May be a measure of system cohesion.
Use of care managers embedded in the
clinic setting
May be a measure of whether care coordinators
are co-located with physicians, suggesting their
level of integration.
Visiting hospitalized patients as part of
care coordination
ACO has its nurse care coordinators visit patients
in the hospital prior to discharge to discuss care
transitions.
Whether the ACO owns a hospital Measure of ACO size and integration across care
settings.
Notes: Number of person-months associated with aligned beneficiaries in 2013 was natural log-transformed to reduce the
influence of a few extreme outliers and smooth the distribution.
Pioneer ACO Final Report HHSM-500-2011-00019i/HHSM-500-T0002
62
ACO CAHPS results
For the Pioneer ACOs, the primary data source that provided insight into beneficiary experiences
and perceptions of the quality of care ACO providers deliver was the ACO CAHPS survey created
by the Agency for Healthcare Research and Quality. This survey was sent to ACO-aligned
beneficiaries and allows them the opportunity to answer a variety of questions about their
experience and satisfaction with a health care provider participating in the ACO.
Using AHRQ’s CAHPS macro, or computer code facilitating case mix adjustment and recoding
of responses to allow for efficient analysis, we aggregated the patient-level responses for each item
up to ACO-level reports across a number of composite measures. This analysis focused on
beneficiaries’ experiences receiving courteous and timely care through their ACO, as assessed by
the following domain-specific composite measures:29
1. Getting Timely Care, Appointments, and Information (Timely Care)
2. How Well Providers Communicate (Provider Communication)
3. Patient’s Rating of Provider (Overall Provider Rating)
4. Access to Specialists (Access to Specialty Care)
5. Health Promotion and Education (Health Education)
6. Shared Decision-Making
7. Courteous and Helpful Office Staff (ACO Staff)
For these seven patient experience measure domains, we estimated models of the measures as
functions of a time trend and ACO- and market-level characteristics. Figure 17 presents
graphically the average values and 95 percent confidence intervals (in brackets around each point
estimate) for the ACO CAHPS composite scores.
As shown below, in Figure 17, time trends were quite small for all the ACO CAHPS composites,
with the exception of the health education composite, for which there was a large increase between
2012 and 2013. However, the time trend for the health education composite was effectively zero
for 2013 to 2014.
29 CAHPS Survey for Accountable Care Organizations (ACOs) Participating in Medicare Initiatives. Accessed at http://acocahps.cms.gov/Files/Table2QAGV2_ACO_12_standalone.pdf.
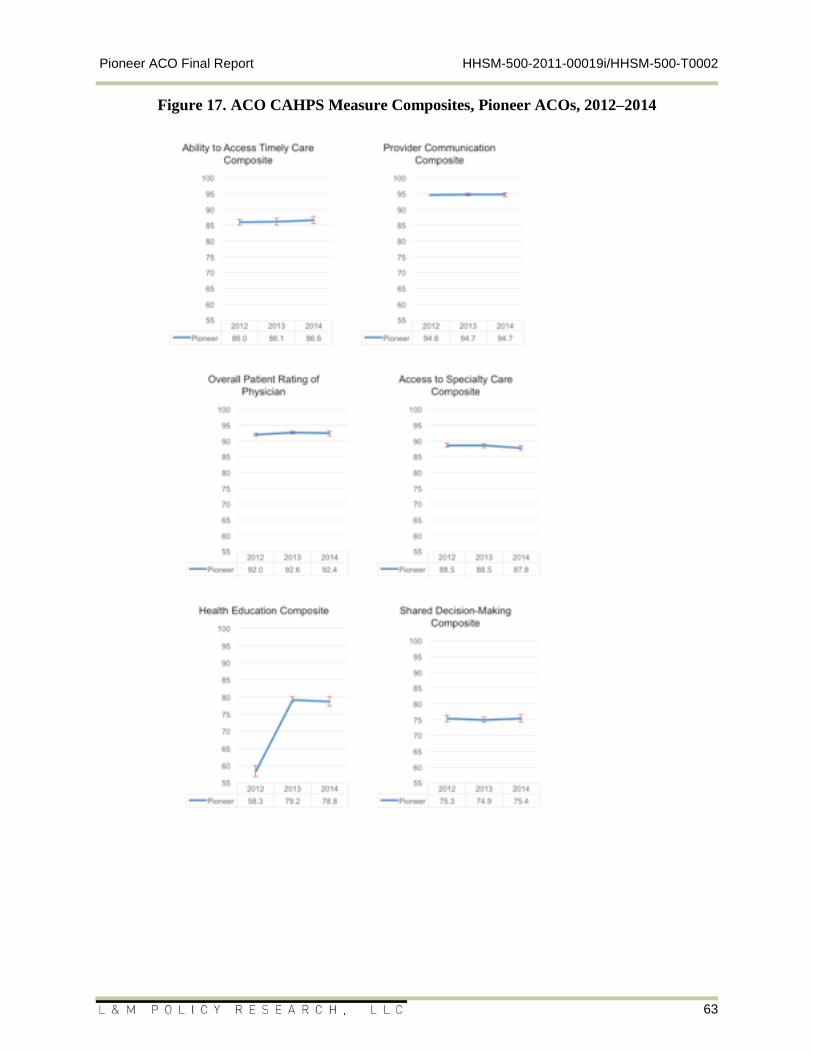
Pioneer ACO Final Report HHSM-500-2011-00019i/HHSM-500-T0002
63
Figure 17. ACO CAHPS Measure Composites, Pioneer ACOs, 2012–2014
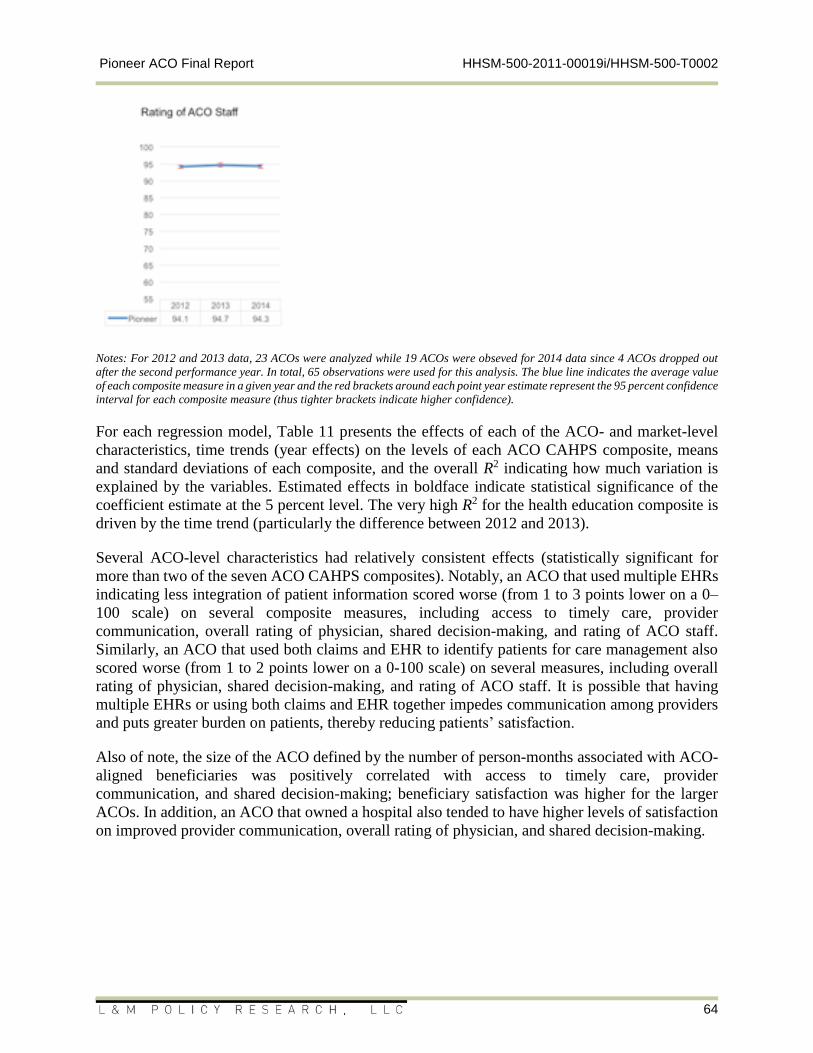
Pioneer ACO Final Report HHSM-500-2011-00019i/HHSM-500-T0002
64
Notes: For 2012 and 2013 data, 23 ACOs were analyzed while 19 ACOs were obseved for 2014 data since 4 ACOs dropped out
after the second performance year. In total, 65 observations were used for this analysis. The blue line indicates the average value
of each composite measure in a given year and the red brackets around each point year estimate represent the 95 percent confidence
interval for each composite measure (thus tighter brackets indicate higher confidence).
For each regression model, Table 11 presents the effects of each of the ACO- and market-level
characteristics, time trends (year effects) on the levels of each ACO CAHPS composite, means
and standard deviations of each composite, and the overall R2 indicating how much variation is
explained by the variables. Estimated effects in boldface indicate statistical significance of the
coefficient estimate at the 5 percent level. The very high R2 for the health education composite is
driven by the time trend (particularly the difference between 2012 and 2013).
Several ACO-level characteristics had relatively consistent effects (statistically significant for
more than two of the seven ACO CAHPS composites). Notably, an ACO that used multiple EHRs
indicating less integration of patient information scored worse (from 1 to 3 points lower on a 0–
100 scale) on several composite measures, including access to timely care, provider
communication, overall rating of physician, shared decision-making, and rating of ACO staff.
Similarly, an ACO that used both claims and EHR to identify patients for care management also
scored worse (from 1 to 2 points lower on a 0-100 scale) on several measures, including overall
rating of physician, shared decision-making, and rating of ACO staff. It is possible that having
multiple EHRs or using both claims and EHR together impedes communication among providers
and puts greater burden on patients, thereby reducing patients’ satisfaction.
Also of note, the size of the ACO defined by the number of person-months associated with ACO-
aligned beneficiaries was positively correlated with access to timely care, provider
communication, and shared decision-making; beneficiary satisfaction was higher for the larger
ACOs. In addition, an ACO that owned a hospital also tended to have higher levels of satisfaction
on improved provider communication, overall rating of physician, and shared decision-making.
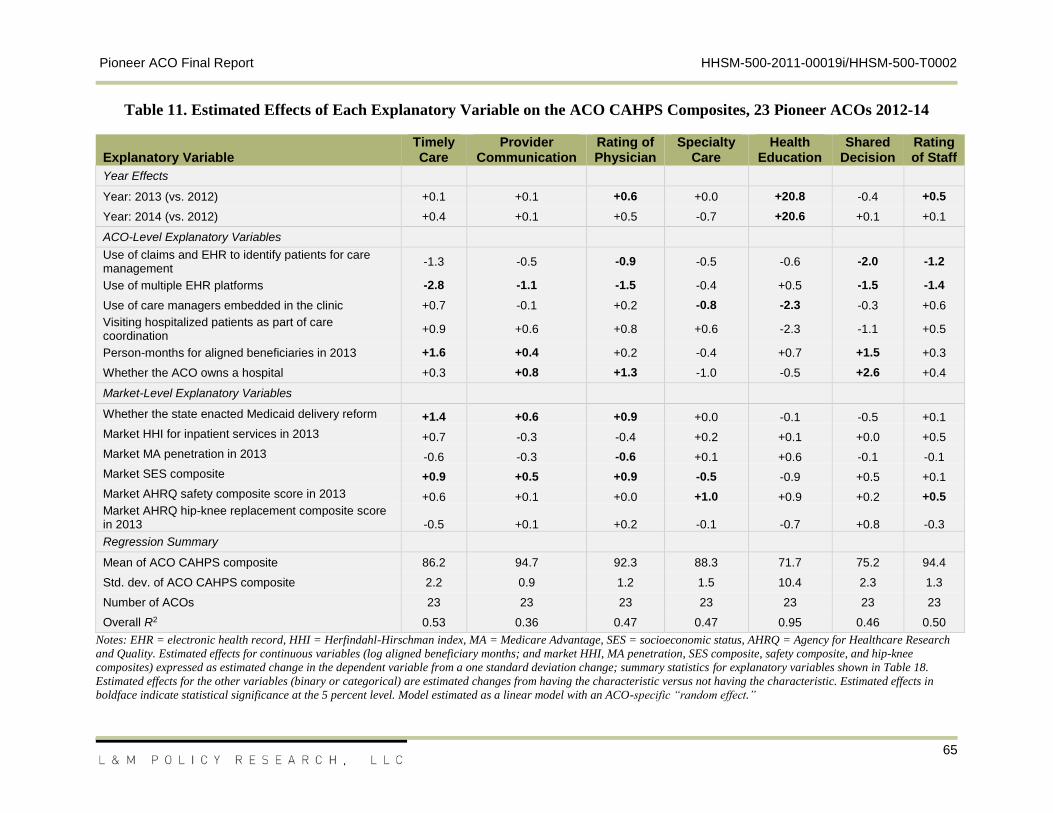
Pioneer ACO Final Report HHSM-500-2011-00019i/HHSM-500-T0002
65
Table 11. Estimated Effects of Each Explanatory Variable on the ACO CAHPS Composites, 23 Pioneer ACOs 2012-14
Explanatory Variable Timely Care
Provider Communication
Rating of Physician
Specialty Care
Health Education
Shared Decision
Rating of Staff
Year Effects
Year: 2013 (vs. 2012) +0.1 +0.1 +0.6 +0.0 +20.8 -0.4 +0.5
Year: 2014 (vs. 2012) +0.4 +0.1 +0.5 -0.7 +20.6 +0.1 +0.1
ACO-Level Explanatory Variables
Use of claims and EHR to identify patients for care management
-1.3 -0.5 -0.9 -0.5 -0.6 -2.0 -1.2
Use of multiple EHR platforms -2.8 -1.1 -1.5 -0.4 +0.5 -1.5 -1.4
Use of care managers embedded in the clinic +0.7 -0.1 +0.2 -0.8 -2.3 -0.3 +0.6
Visiting hospitalized patients as part of care coordination
+0.9 +0.6 +0.8 +0.6 -2.3 -1.1 +0.5
Person-months for aligned beneficiaries in 2013 +1.6 +0.4 +0.2 -0.4 +0.7 +1.5 +0.3
Whether the ACO owns a hospital +0.3 +0.8 +1.3 -1.0 -0.5 +2.6 +0.4
Market-Level Explanatory Variables
Whether the state enacted Medicaid delivery reform +1.4 +0.6 +0.9 +0.0 -0.1 -0.5 +0.1
Market HHI for inpatient services in 2013 +0.7 -0.3 -0.4 +0.2 +0.1 +0.0 +0.5
Market MA penetration in 2013 -0.6 -0.3 -0.6 +0.1 +0.6 -0.1 -0.1
Market SES composite +0.9 +0.5 +0.9 -0.5 -0.9 +0.5 +0.1
Market AHRQ safety composite score in 2013 +0.6 +0.1 +0.0 +1.0 +0.9 +0.2 +0.5
Market AHRQ hip-knee replacement composite score in 2013 -0.5 +0.1 +0.2 -0.1 -0.7 +0.8 -0.3
Regression Summary
Mean of ACO CAHPS composite 86.2 94.7 92.3 88.3 71.7 75.2 94.4
Std. dev. of ACO CAHPS composite 2.2 0.9 1.2 1.5 10.4 2.3 1.3
Number of ACOs 23 23 23 23 23 23 23
Overall R2 0.53 0.36 0.47 0.47 0.95 0.46 0.50
Notes: EHR = electronic health record, HHI = Herfindahl-Hirschman index, MA = Medicare Advantage, SES = socioeconomic status, AHRQ = Agency for Healthcare Research
and Quality. Estimated effects for continuous variables (log aligned beneficiary months; and market HHI, MA penetration, SES composite, safety composite, and hip-knee
composites) expressed as estimated change in the dependent variable from a one standard deviation change; summary statistics for explanatory variables shown in Table 18.
Estimated effects for the other variables (binary or categorical) are estimated changes from having the characteristic versus not having the characteristic. Estimated effects in
boldface indicate statistical significance at the 5 percent level. Model estimated as a linear model with an ACO-specific “random effect.”
Pioneer ACO Final Report HHSM-500-2011-00019i/HHSM-500-T0002
66
Among market-level characteristics, socioeconomic status (SES) index and the state’s Medicaid
delivery reform indicator were statistically significantly associated with variation in more than two
of the seven ACO CAHPS composites. A higher level on the SES index—indicating living in areas
with lower SES factors such as lower income, higher minority population, and higher
unemployment—was positively associated with access to timely care and physician rating, but
negatively associated with access to specialty care. It is possible that any improved care
coordination implemented by ACOs may have impacted patients in low-SES areas more than it
patients in higher-SES areas, thus resulting in greater satisfaction in low-SES areas. However, this
improved coordination may have also resulted in more “gatekeeping” of specialists.
In addition, if an ACO was located in a state that enacted Medicaid delivery reform, the ACO
scored higher (by 1 point on a 0-100 scale) on access to timely care, provider communication, and
overall rating of physician, suggesting that new delivery approaches better meet patient needs.
GPRO results
For the GPRO process and clinical outcome measures, we estimated models of the measures as
functions of a time trend and also ACO- and market-level characteristics. We grouped the 21
individual measures into four composites (care coordination, diabetes, cardiovascular disease, and
preventive care) and analyzed results for all ACO-aligned beneficiaries. Because of increased
scrutiny of hospitalizations (and readmissions) as a driver of greater spending and also because
several quality measures focused on such utilization, we also analyzed results for the subset of
beneficiaries with at least one inpatient hospitalization during the year. ACOs may have focused
increased attention on beneficiaries who had at least one hospitalization, and the results for this
group may have varied from those for the entire population.
Table 12 presents the two sets of effects of each of the ACO- and market-level characteristics, time
trends (year effects) on the levels of each GPRO composite, and the overall R2 statistic for each
regression model that includes the 23 Pioneer ACOs participating in the Pioneer ACO program for
at least 2012 and 2013. The first set of effects represents overall beneficiaries in those ACOs, while
the second set applies to beneficiaries with at least one hospitalization. Estimated effects in
boldface indicate statistical significance of the coefficient estimate at the 5 percent level.
We found that Pioneer ACOs successfully improved quality of care, as measured by these GPRO
composites. With some exceptions, however, the links between the ACO and market
characteristics and this improved performance seemed relatively weak. For all four measures for
both the full population and the subset with one or more hospitalizations in the year, the time trend
was consistently statistically significant. Because of the absence of a comparison population of
non-aligned beneficiaries, we cannot determine whether these time trends were specific to the
ACOs’ performance versus being experienced by all Medicare beneficiaries, which could be
occurring from the growing national focus on quality improvement in key areas of care.
Among the ACO and market characteristics, the one most consistently associated with GPRO
quality outcomes was the presence of embedded care managers in the clinic setting. For the
diabetes and cardiovascular disease composites, the presence of care managers was positively
associated with better performance on quality measures, even after controlling for the time trend
Pioneer ACO Final Report HHSM-500-2011-00019i/HHSM-500-T0002
67
between 2012 and 2014. For the other two composites, the effect of embedded care managers was
still positive, but smaller and not statistically significant.
Interestingly, greater Medicare Advantage penetration in the market was associated with lower
care coordination scores. This result was somewhat surprising and may be a result of other latent
factors that we could not control for in the model. For example, there may be other characteristics
of specific markets and populations that we did not have information or data to evaluate, such as
population or ACO-specific effects. Whether a state implemented Medicaid delivery reform was
also negatively associated with care coordination but not statistically significant. Medicaid
delivery reform was positively associated with other measures, including preventive care, but only
statistically significantly for improved diabetes care for the full population (not for the hospitalized
subpopulation).
The use of claims and EHRs to identify patients for care management was associated with lower
preventive care scores. Using claims and EHRs may indicate a greater focus on identifying high
risk or high cost beneficiaries for care management, rather than a focus on preventive care. Also,
the use of multiple EHRs was associated with lower scores on all of the composite measures but
was statistically significant for only the diabetes care scores overall; the relationship was not
statistically significant for the subset of beneficiaries with one or more hospitalizations.
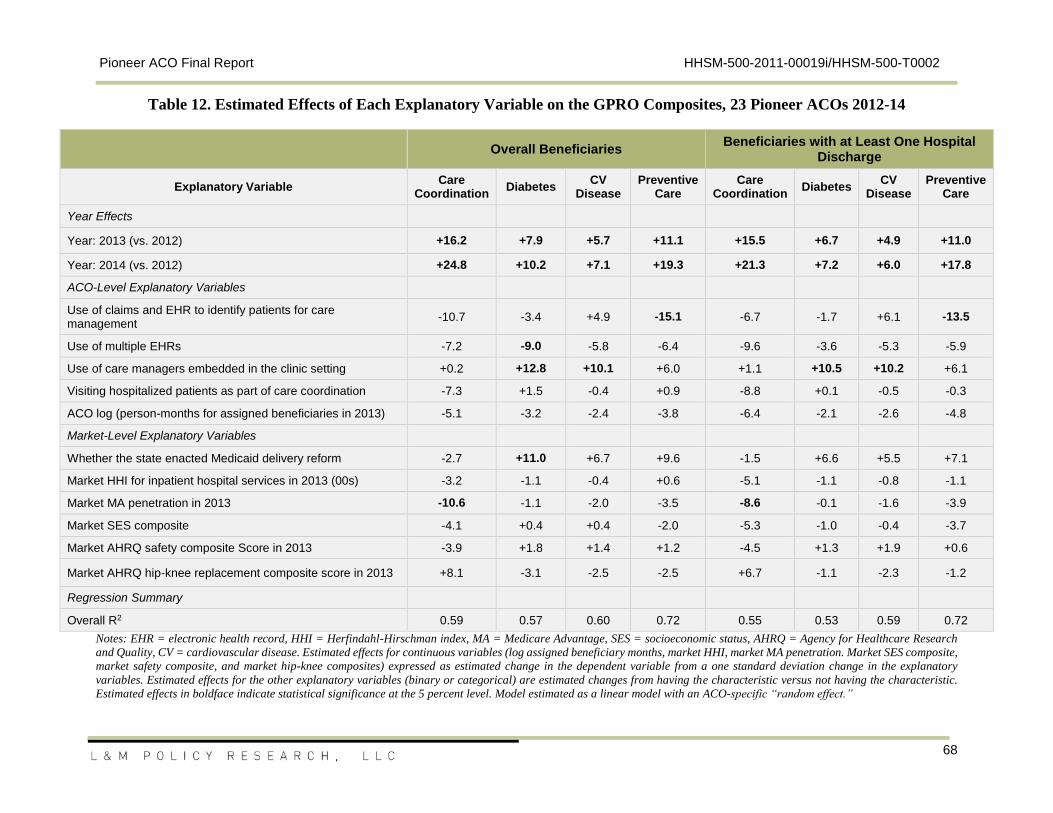
Pioneer ACO Final Report HHSM-500-2011-00019i/HHSM-500-T0002
68
Table 12. Estimated Effects of Each Explanatory Variable on the GPRO Composites, 23 Pioneer ACOs 2012-14
Overall Beneficiaries Beneficiaries with at Least One Hospital
Discharge
Explanatory Variable Care
Coordination Diabetes
CV Disease
Preventive Care
Care Coordination
Diabetes CV
Disease Preventive
Care
Year Effects
Year: 2013 (vs. 2012) +16.2 +7.9 +5.7 +11.1 +15.5 +6.7 +4.9 +11.0
Year: 2014 (vs. 2012) +24.8 +10.2 +7.1 +19.3 +21.3 +7.2 +6.0 +17.8
ACO-Level Explanatory Variables
Use of claims and EHR to identify patients for care management
-10.7 -3.4 +4.9 -15.1 -6.7 -1.7 +6.1 -13.5
Use of multiple EHRs -7.2 -9.0 -5.8 -6.4 -9.6 -3.6 -5.3 -5.9
Use of care managers embedded in the clinic setting +0.2 +12.8 +10.1 +6.0 +1.1 +10.5 +10.2 +6.1
Visiting hospitalized patients as part of care coordination -7.3 +1.5 -0.4 +0.9 -8.8 +0.1 -0.5 -0.3
ACO log (person-months for assigned beneficiaries in 2013) -5.1 -3.2 -2.4 -3.8 -6.4 -2.1 -2.6 -4.8
Market-Level Explanatory Variables
Whether the state enacted Medicaid delivery reform -2.7 +11.0 +6.7 +9.6 -1.5 +6.6 +5.5 +7.1
Market HHI for inpatient hospital services in 2013 (00s) -3.2 -1.1 -0.4 +0.6 -5.1 -1.1 -0.8 -1.1
Market MA penetration in 2013 -10.6 -1.1 -2.0 -3.5 -8.6 -0.1 -1.6 -3.9
Market SES composite -4.1 +0.4 +0.4 -2.0 -5.3 -1.0 -0.4 -3.7
Market AHRQ safety composite Score in 2013 -3.9 +1.8 +1.4 +1.2 -4.5 +1.3 +1.9 +0.6
Market AHRQ hip-knee replacement composite score in 2013 +8.1 -3.1 -2.5 -2.5 +6.7 -1.1 -2.3 -1.2
Regression Summary
Overall R2 0.59 0.57 0.60 0.72 0.55 0.53 0.59 0.72
Notes: EHR = electronic health record, HHI = Herfindahl-Hirschman index, MA = Medicare Advantage, SES = socioeconomic status, AHRQ = Agency for Healthcare Research
and Quality, CV = cardiovascular disease. Estimated effects for continuous variables (log assigned beneficiary months, market HHI, market MA penetration. Market SES composite,
market safety composite, and market hip-knee composites) expressed as estimated change in the dependent variable from a one standard deviation change in the explanatory
variables. Estimated effects for the other explanatory variables (binary or categorical) are estimated changes from having the characteristic versus not having the characteristic.
Estimated effects in boldface indicate statistical significance at the 5 percent level. Model estimated as a linear model with an ACO-specific “random effect.”
Pioneer ACO Final Report HHSM-500-2011-00019i/HHSM-500-T0002
69
Impact on quality
Pioneer ACOs experienced improvements in some measures of patient experience and quality of
care. For ACO CAHPS outcomes, larger ACOs (as measured by the number of person-months
associated with its aligned beneficiaries) were associated with higher satisfaction of beneficiaries
on access to timely care, provider communication, and shared decision-making. ACOs with
hospital ownership also tended to have higher levels of satisfaction on improved provider
communication, overall rating of physician, and shared decision-making. ACOs in areas with
lower SES had better scores on access to timely care and physician rating, but lower SES was
negatively associated with access to specialty care. In addition, ACOs in states that adopted
Medicaid delivery reform scored higher on access to timely care, provider communication, and
overall rating of physician, suggesting that new delivery approaches are better meeting patient
needs.
In contrast, having multiple EHRs or using both claims and EHR data together was associated with
lower patient satisfaction. Use of multiple sources of information may impede communication
among providers, resulting in worse coordination of care.
For GPRO quality outcomes, a key finding showed that the presence of embedded care managers
in the clinic setting was associated with improved performance in quality of care, even after
controlling for the time trend. Although other factors had some isolated effects on quality, the
factor with a consistently significant positive effect on quality outcomes was the time trend
between performance years (i.e., the average increase experienced by all Pioneer ACOs between
2012 and 2013 and between 2012 and 2014). In other words, the increases in these measures that
occurred for all Pioneer ACOs between 2012 and 2014 were larger than any differences between
ACOs that were driven by the ACO and market characteristics analyzed. Without data for
comparable non-ACO beneficiaries, we were unable to determine whether this improvement in
quality over time was specific to ACOs, or if care was also improving on a broader basis over the
same time period.
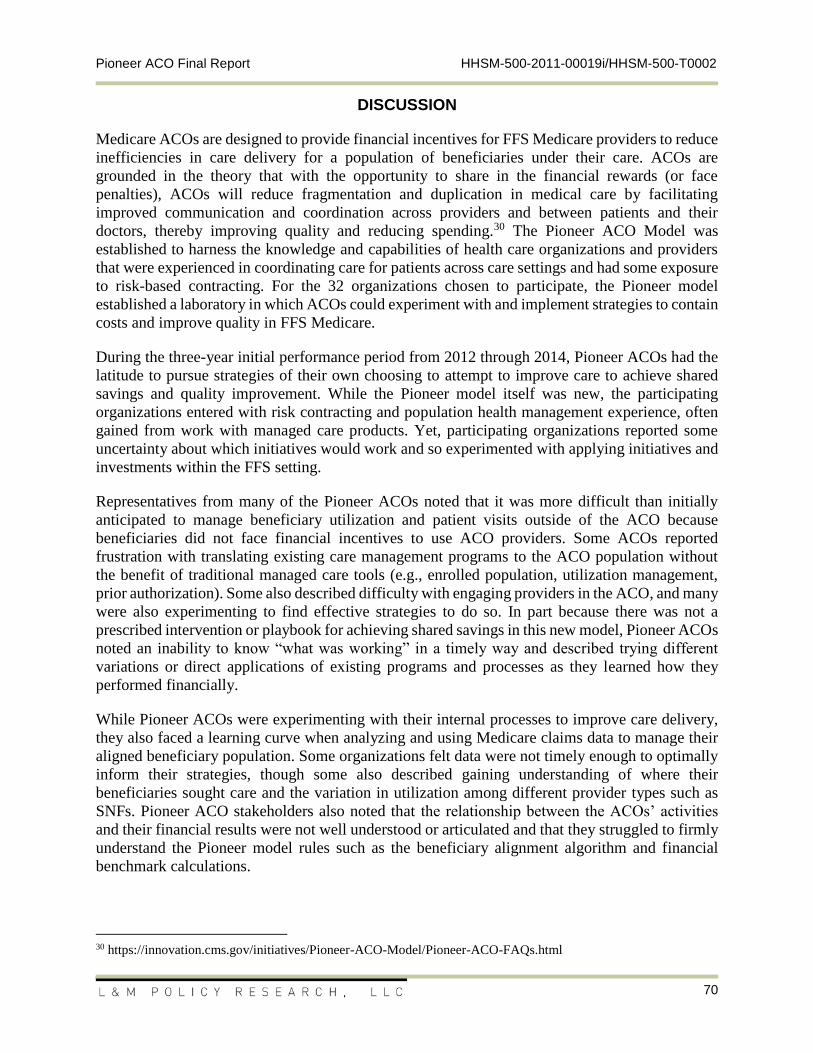
Pioneer ACO Final Report HHSM-500-2011-00019i/HHSM-500-T0002
70
DISCUSSION
Medicare ACOs are designed to provide financial incentives for FFS Medicare providers to reduce
inefficiencies in care delivery for a population of beneficiaries under their care. ACOs are
grounded in the theory that with the opportunity to share in the financial rewards (or face
penalties), ACOs will reduce fragmentation and duplication in medical care by facilitating
improved communication and coordination across providers and between patients and their
doctors, thereby improving quality and reducing spending.30 The Pioneer ACO Model was
established to harness the knowledge and capabilities of health care organizations and providers
that were experienced in coordinating care for patients across care settings and had some exposure
to risk-based contracting. For the 32 organizations chosen to participate, the Pioneer model
established a laboratory in which ACOs could experiment with and implement strategies to contain
costs and improve quality in FFS Medicare.
During the three-year initial performance period from 2012 through 2014, Pioneer ACOs had the
latitude to pursue strategies of their own choosing to attempt to improve care to achieve shared
savings and quality improvement. While the Pioneer model itself was new, the participating
organizations entered with risk contracting and population health management experience, often
gained from work with managed care products. Yet, participating organizations reported some
uncertainty about which initiatives would work and so experimented with applying initiatives and
investments within the FFS setting.
Representatives from many of the Pioneer ACOs noted that it was more difficult than initially
anticipated to manage beneficiary utilization and patient visits outside of the ACO because
beneficiaries did not face financial incentives to use ACO providers. Some ACOs reported
frustration with translating existing care management programs to the ACO population without
the benefit of traditional managed care tools (e.g., enrolled population, utilization management,
prior authorization). Some also described difficulty with engaging providers in the ACO, and many
were also experimenting to find effective strategies to do so. In part because there was not a
prescribed intervention or playbook for achieving shared savings in this new model, Pioneer ACOs
noted an inability to know “what was working” in a timely way and described trying different
variations or direct applications of existing programs and processes as they learned how they
performed financially.
While Pioneer ACOs were experimenting with their internal processes to improve care delivery,
they also faced a learning curve when analyzing and using Medicare claims data to manage their
aligned beneficiary population. Some organizations felt data were not timely enough to optimally
inform their strategies, though some also described gaining understanding of where their
beneficiaries sought care and the variation in utilization among different provider types such as
SNFs. Pioneer ACO stakeholders also noted that the relationship between the ACOs’ activities
and their financial results were not well understood or articulated and that they struggled to firmly
understand the Pioneer model rules such as the beneficiary alignment algorithm and financial
benchmark calculations.
30 https://innovation.cms.gov/initiatives/Pioneer-ACO-Model/Pioneer-ACO-FAQs.html

Pioneer ACO Final Report HHSM-500-2011-00019i/HHSM-500-T0002
71
Our analysis of provider and beneficiary churn shows that during the initial performance period,
while Pioneer ACOs were experimenting with approaches to care management, incorporating
Medicare data into their operations, and using new tools such as the SNF 3-day waiver, their
beneficiary populations were changing from year to year. Our analysis shows that the prospective
alignment algorithm for Pioneer ACOs may have tended to align a healthier, less costly population
of patients; in other words, the marginal beneficiary for alignment was sicker and more costly. As
noted above, it appears to be a consequence of the alignment algorithm and not deliberate selection
by the ACOs but raises the question of whether the alignment algorithm may de-align or not align
beneficiaries who are less healthy and in need of precisely the kind of care coordination and
reduction in fragmentation that the Pioneer model was designed to remedy.
Our quality analyses suggest that Pioneer ACOs experienced improvements in some measures of
patient experience and quality of care. Larger ACOs were associated with higher beneficiary
satisfaction on access to timely care, provider communication, and shared decision-making. ACOs
with hospital ownership also tended to have higher levels of satisfaction on improved provider
communication, overall rating of physician, and shared decision-making. ACOs in areas with
lower SES had better scores on access to timely care and physician rating, but lower SES was
negatively associated with access to specialty care. In addition, ACOs in states that adopted
Medicaid delivery reform scored higher on access to timely care, provider communication, and
overall rating of physician, suggesting that new delivery approaches are better meeting patient
needs. In contrast, having multiple EHRs or using both claims and EHR data together to identify
patients for care management was associated with lower patient satisfaction. Use of multiple
sources of information may impede communication among providers, resulting in worse
coordination of care.
For GPRO quality outcomes, a key finding showed that the presence of embedded care managers
in hospitals was associated with improved performance in quality of care, even after controlling
for the time trend. Although other factors had some isolated effects on quality, the factor with a
consistently significant positive effect on quality outcomes was the time trend between
performance years (i.e., the average increase experienced by all Pioneer ACOs between 2012 and
2013 and between 2012 and 2014). However, without data for comparable non-ACO beneficiaries,
we were unable to determine whether this improvement in quality over time was specific to ACOs,
or if care was also improving on a broader basis over the same time period.
Did the Pioneer ACO Model facilitate increased financial risk-bearing and movement toward population health?
In addition to offering the prospect of shared savings payments, the Pioneer model was also
structured to allow provider groups to move more rapidly from a shared savings payment model
to a population-based payment model.
As outlined above, in the initial three-year performance period, participating organizations had
options for how much financial risk they wanted to bear during each performance year and other
terms of their payments under the model. They also had the option to transition to being an ACO
in the Medicare Shared Savings Program, where they would not be at risk for losses, or stop
participating in any Medicare ACO initiative. Pioneer ACOs learned about their annual shared
savings results—whether they earned shared savings or had losses—midway through the year after
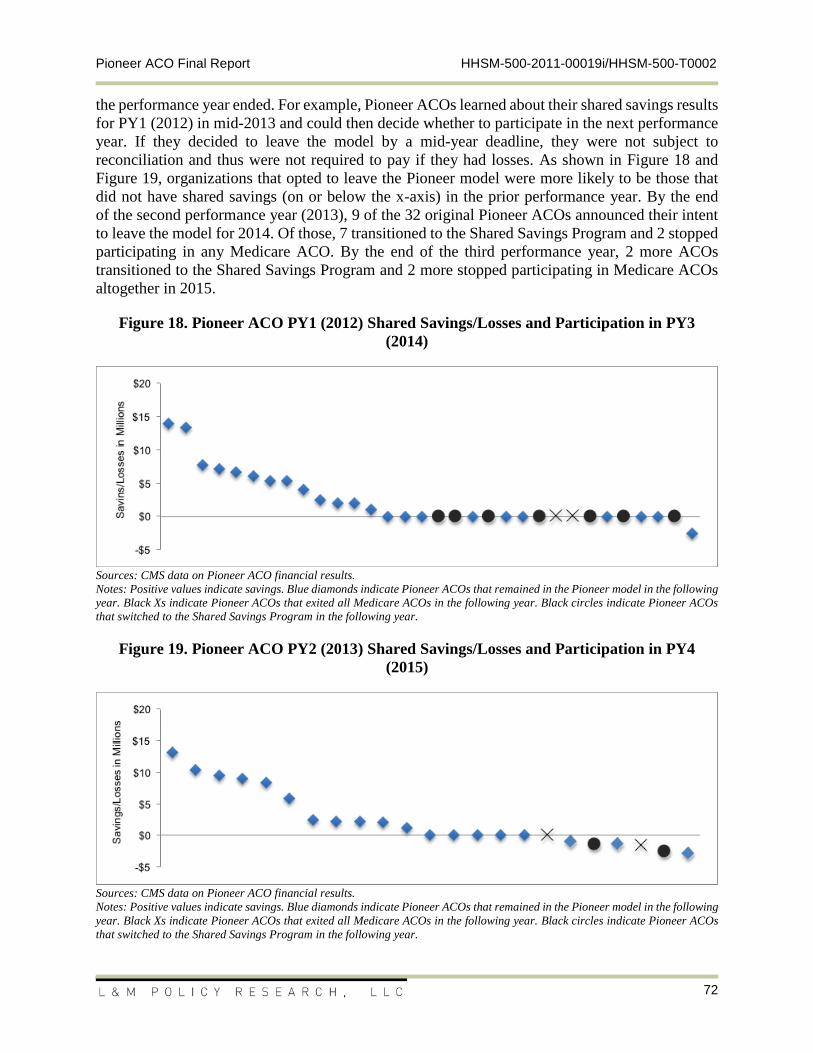
Pioneer ACO Final Report HHSM-500-2011-00019i/HHSM-500-T0002
72
the performance year ended. For example, Pioneer ACOs learned about their shared savings results
for PY1 (2012) in mid-2013 and could then decide whether to participate in the next performance
year. If they decided to leave the model by a mid-year deadline, they were not subject to
reconciliation and thus were not required to pay if they had losses. As shown in Figure 18 and
Figure 19, organizations that opted to leave the Pioneer model were more likely to be those that
did not have shared savings (on or below the x-axis) in the prior performance year. By the end
of the second performance year (2013), 9 of the 32 original Pioneer ACOs announced their intent
to leave the model for 2014. Of those, 7 transitioned to the Shared Savings Program and 2 stopped
participating in any Medicare ACO. By the end of the third performance year, 2 more ACOs
transitioned to the Shared Savings Program and 2 more stopped participating in Medicare ACOs
altogether in 2015.
Figure 18. Pioneer ACO PY1 (2012) Shared Savings/Losses and Participation in PY3
(2014)
Sources: CMS data on Pioneer ACO financial results.
Notes: Positive values indicate savings. Blue diamonds indicate Pioneer ACOs that remained in the Pioneer model in the following
year. Black Xs indicate Pioneer ACOs that exited all Medicare ACOs in the following year. Black circles indicate Pioneer ACOs
that switched to the Shared Savings Program in the following year.
Figure 19. Pioneer ACO PY2 (2013) Shared Savings/Losses and Participation in PY4
(2015)
Sources: CMS data on Pioneer ACO financial results.
Notes: Positive values indicate savings. Blue diamonds indicate Pioneer ACOs that remained in the Pioneer model in the following
year. Black Xs indicate Pioneer ACOs that exited all Medicare ACOs in the following year. Black circles indicate Pioneer ACOs
that switched to the Shared Savings Program in the following year.
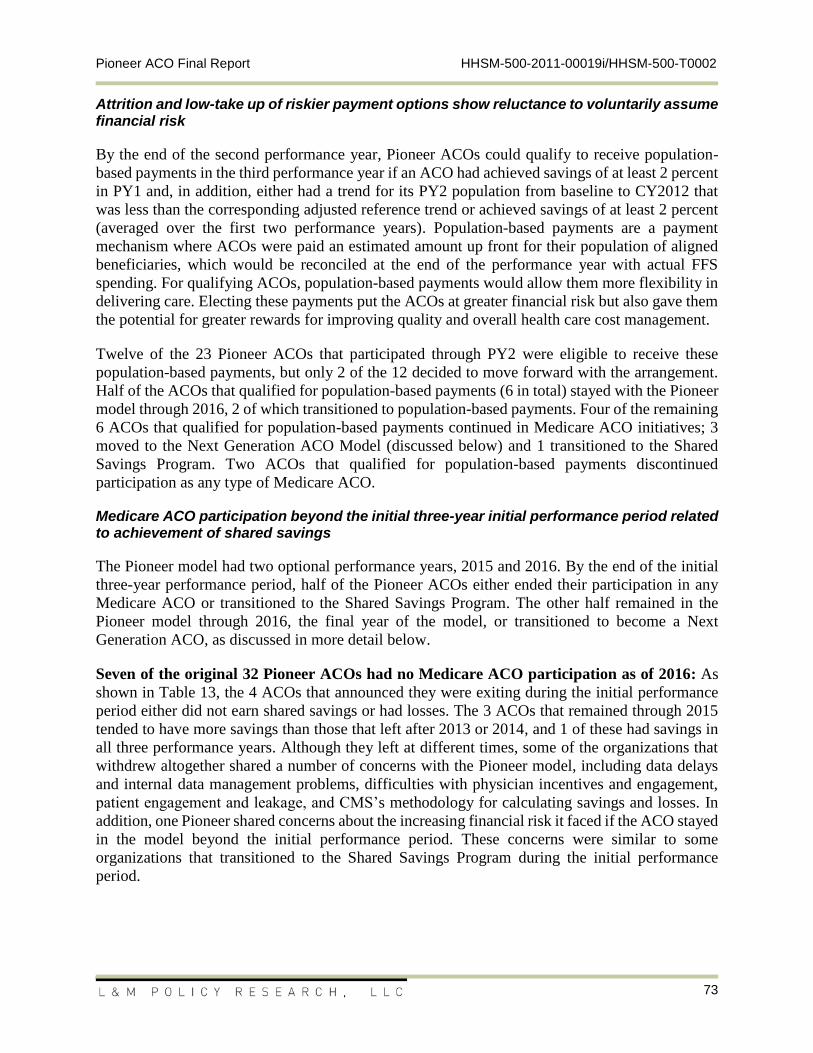
Pioneer ACO Final Report HHSM-500-2011-00019i/HHSM-500-T0002
73
Attrition and low-take up of riskier payment options show reluctance to voluntarily assume financial risk
By the end of the second performance year, Pioneer ACOs could qualify to receive population-
based payments in the third performance year if an ACO had achieved savings of at least 2 percent
in PY1 and, in addition, either had a trend for its PY2 population from baseline to CY2012 that
was less than the corresponding adjusted reference trend or achieved savings of at least 2 percent
(averaged over the first two performance years). Population-based payments are a payment
mechanism where ACOs were paid an estimated amount up front for their population of aligned
beneficiaries, which would be reconciled at the end of the performance year with actual FFS
spending. For qualifying ACOs, population-based payments would allow them more flexibility in
delivering care. Electing these payments put the ACOs at greater financial risk but also gave them
the potential for greater rewards for improving quality and overall health care cost management.
Twelve of the 23 Pioneer ACOs that participated through PY2 were eligible to receive these
population-based payments, but only 2 of the 12 decided to move forward with the arrangement.
Half of the ACOs that qualified for population-based payments (6 in total) stayed with the Pioneer
model through 2016, 2 of which transitioned to population-based payments. Four of the remaining
6 ACOs that qualified for population-based payments continued in Medicare ACO initiatives; 3
moved to the Next Generation ACO Model (discussed below) and 1 transitioned to the Shared
Savings Program. Two ACOs that qualified for population-based payments discontinued
participation as any type of Medicare ACO.
Medicare ACO participation beyond the initial three-year initial performance period related to achievement of shared savings
The Pioneer model had two optional performance years, 2015 and 2016. By the end of the initial
three-year performance period, half of the Pioneer ACOs either ended their participation in any
Medicare ACO or transitioned to the Shared Savings Program. The other half remained in the
Pioneer model through 2016, the final year of the model, or transitioned to become a Next
Generation ACO, as discussed in more detail below.
Seven of the original 32 Pioneer ACOs had no Medicare ACO participation as of 2016: As
shown in Table 13, the 4 ACOs that announced they were exiting during the initial performance
period either did not earn shared savings or had losses. The 3 ACOs that remained through 2015
tended to have more savings than those that left after 2013 or 2014, and 1 of these had savings in
all three performance years. Although they left at different times, some of the organizations that
withdrew altogether shared a number of concerns with the Pioneer model, including data delays
and internal data management problems, difficulties with physician incentives and engagement,
patient engagement and leakage, and CMS’s methodology for calculating savings and losses. In
addition, one Pioneer shared concerns about the increasing financial risk it faced if the ACO stayed
in the model beyond the initial performance period. These concerns were similar to some
organizations that transitioned to the Shared Savings Program during the initial performance
period.
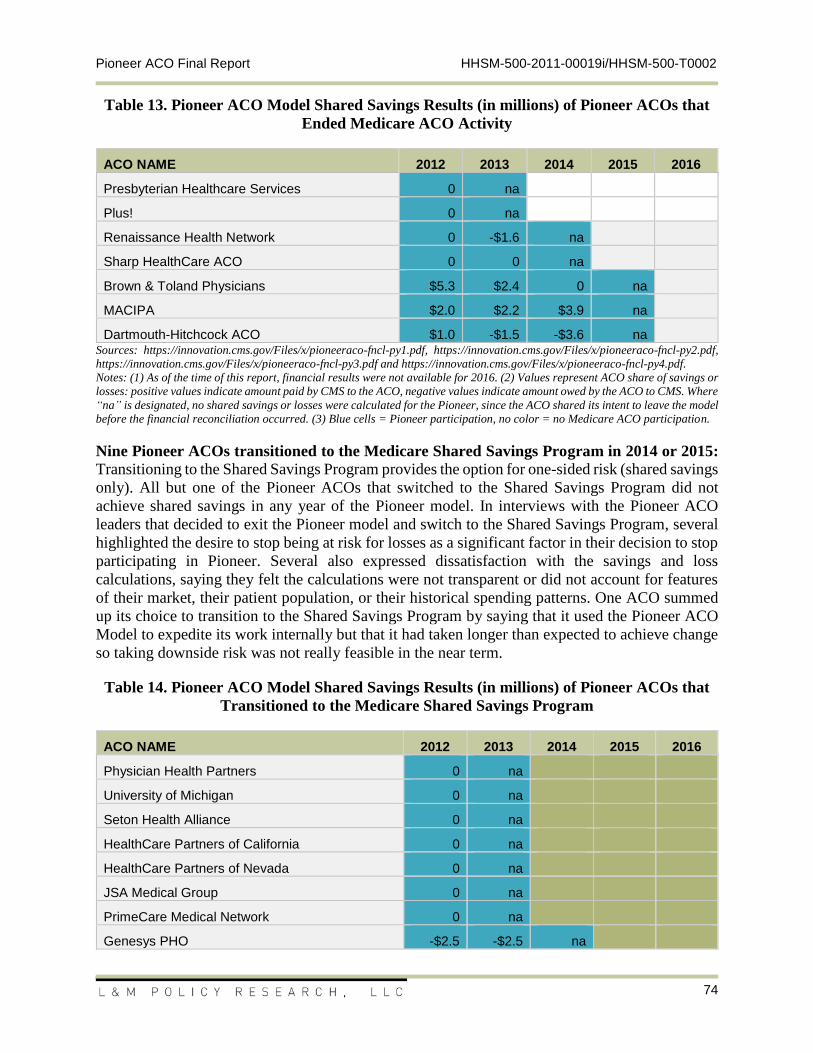
Pioneer ACO Final Report HHSM-500-2011-00019i/HHSM-500-T0002
74
Table 13. Pioneer ACO Model Shared Savings Results (in millions) of Pioneer ACOs that
Ended Medicare ACO Activity
ACO NAME 2012 2013 2014 2015 2016
Presbyterian Healthcare Services 0 na
Plus! 0 na
Renaissance Health Network 0 -$1.6 na
Sharp HealthCare ACO 0 0 na
Brown & Toland Physicians $5.3 $2.4 0 na
MACIPA $2.0 $2.2 $3.9 na
Dartmouth-Hitchcock ACO $1.0 -$1.5 -$3.6 na Sources: https://innovation.cms.gov/Files/x/pioneeraco-fncl-py1.pdf, https://innovation.cms.gov/Files/x/pioneeraco-fncl-py2.pdf,
https://innovation.cms.gov/Files/x/pioneeraco-fncl-py3.pdf and https://innovation.cms.gov/Files/x/pioneeraco-fncl-py4.pdf.
Notes: (1) As of the time of this report, financial results were not available for 2016. (2) Values represent ACO share of savings or
losses: positive values indicate amount paid by CMS to the ACO, negative values indicate amount owed by the ACO to CMS. Where
“na” is designated, no shared savings or losses were calculated for the Pioneer, since the ACO shared its intent to leave the model
before the financial reconciliation occurred. (3) Blue cells = Pioneer participation, no color = no Medicare ACO participation.
Nine Pioneer ACOs transitioned to the Medicare Shared Savings Program in 2014 or 2015: Transitioning to the Shared Savings Program provides the option for one-sided risk (shared savings
only). All but one of the Pioneer ACOs that switched to the Shared Savings Program did not
achieve shared savings in any year of the Pioneer model. In interviews with the Pioneer ACO
leaders that decided to exit the Pioneer model and switch to the Shared Savings Program, several
highlighted the desire to stop being at risk for losses as a significant factor in their decision to stop
participating in Pioneer. Several also expressed dissatisfaction with the savings and loss
calculations, saying they felt the calculations were not transparent or did not account for features
of their market, their patient population, or their historical spending patterns. One ACO summed
up its choice to transition to the Shared Savings Program by saying that it used the Pioneer ACO
Model to expedite its work internally but that it had taken longer than expected to achieve change
so taking downside risk was not really feasible in the near term.
Table 14. Pioneer ACO Model Shared Savings Results (in millions) of Pioneer ACOs that
Transitioned to the Medicare Shared Savings Program
ACO NAME 2012 2013 2014 2015 2016
Physician Health Partners 0 na
University of Michigan 0 na
Seton Health Alliance 0 na
HealthCare Partners of California 0 na
HealthCare Partners of Nevada 0 na
JSA Medical Group 0 na
PrimeCare Medical Network 0 na
Genesys PHO -$2.5 -$2.5 na
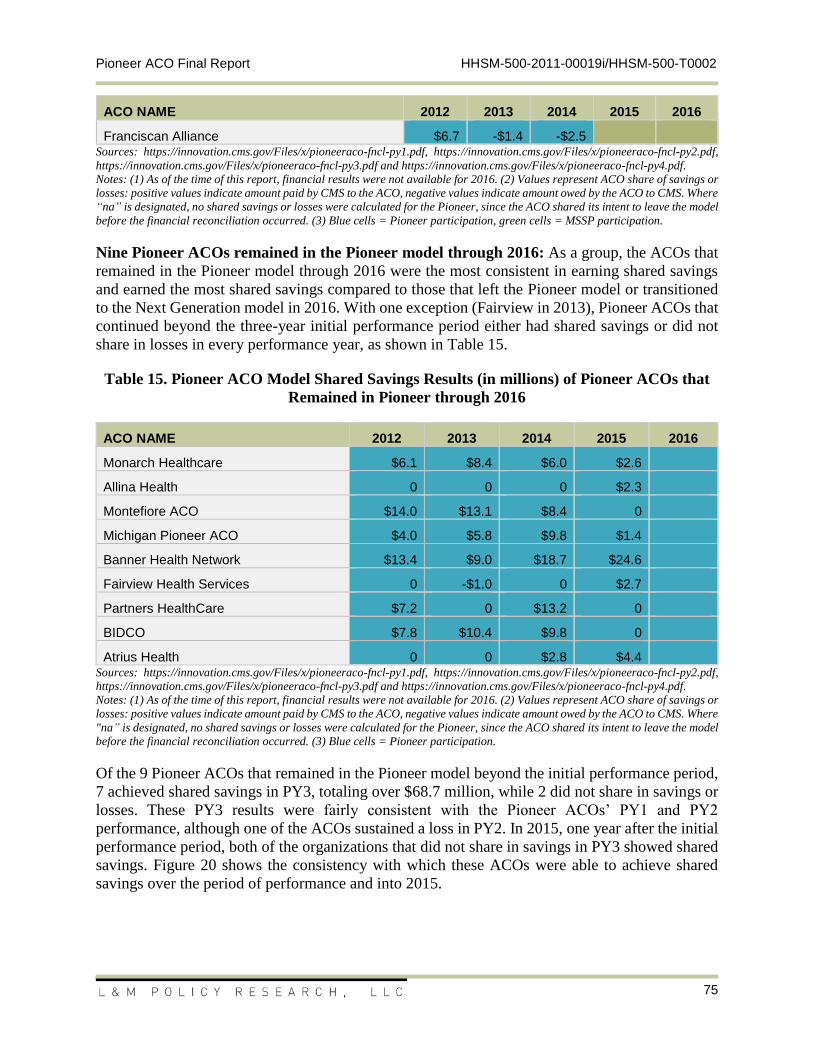
Pioneer ACO Final Report HHSM-500-2011-00019i/HHSM-500-T0002
75
ACO NAME 2012 2013 2014 2015 2016
Franciscan Alliance $6.7 -$1.4 -$2.5 Sources: https://innovation.cms.gov/Files/x/pioneeraco-fncl-py1.pdf, https://innovation.cms.gov/Files/x/pioneeraco-fncl-py2.pdf,
https://innovation.cms.gov/Files/x/pioneeraco-fncl-py3.pdf and https://innovation.cms.gov/Files/x/pioneeraco-fncl-py4.pdf.
Notes: (1) As of the time of this report, financial results were not available for 2016. (2) Values represent ACO share of savings or
losses: positive values indicate amount paid by CMS to the ACO, negative values indicate amount owed by the ACO to CMS. Where
“na” is designated, no shared savings or losses were calculated for the Pioneer, since the ACO shared its intent to leave the model
before the financial reconciliation occurred. (3) Blue cells = Pioneer participation, green cells = MSSP participation.
Nine Pioneer ACOs remained in the Pioneer model through 2016: As a group, the ACOs that
remained in the Pioneer model through 2016 were the most consistent in earning shared savings
and earned the most shared savings compared to those that left the Pioneer model or transitioned
to the Next Generation model in 2016. With one exception (Fairview in 2013), Pioneer ACOs that
continued beyond the three-year initial performance period either had shared savings or did not
share in losses in every performance year, as shown in Table 15.
Table 15. Pioneer ACO Model Shared Savings Results (in millions) of Pioneer ACOs that
Remained in Pioneer through 2016
ACO NAME 2012 2013 2014 2015 2016
Monarch Healthcare $6.1 $8.4 $6.0 $2.6
Allina Health 0 0 0 $2.3
Montefiore ACO $14.0 $13.1 $8.4 0
Michigan Pioneer ACO $4.0 $5.8 $9.8 $1.4
Banner Health Network $13.4 $9.0 $18.7 $24.6
Fairview Health Services 0 -$1.0 0 $2.7
Partners HealthCare $7.2 0 $13.2 0
BIDCO $7.8 $10.4 $9.8 0
Atrius Health 0 0 $2.8 $4.4 Sources: https://innovation.cms.gov/Files/x/pioneeraco-fncl-py1.pdf, https://innovation.cms.gov/Files/x/pioneeraco-fncl-py2.pdf,
https://innovation.cms.gov/Files/x/pioneeraco-fncl-py3.pdf and https://innovation.cms.gov/Files/x/pioneeraco-fncl-py4.pdf.
Notes: (1) As of the time of this report, financial results were not available for 2016. (2) Values represent ACO share of savings or
losses: positive values indicate amount paid by CMS to the ACO, negative values indicate amount owed by the ACO to CMS. Where
"na” is designated, no shared savings or losses were calculated for the Pioneer, since the ACO shared its intent to leave the model
before the financial reconciliation occurred. (3) Blue cells = Pioneer participation.
Of the 9 Pioneer ACOs that remained in the Pioneer model beyond the initial performance period,
7 achieved shared savings in PY3, totaling over $68.7 million, while 2 did not share in savings or
losses. These PY3 results were fairly consistent with the Pioneer ACOs’ PY1 and PY2
performance, although one of the ACOs sustained a loss in PY2. In 2015, one year after the initial
performance period, both of the organizations that did not share in savings in PY3 showed shared
savings. Figure 20 shows the consistency with which these ACOs were able to achieve shared
savings over the period of performance and into 2015.
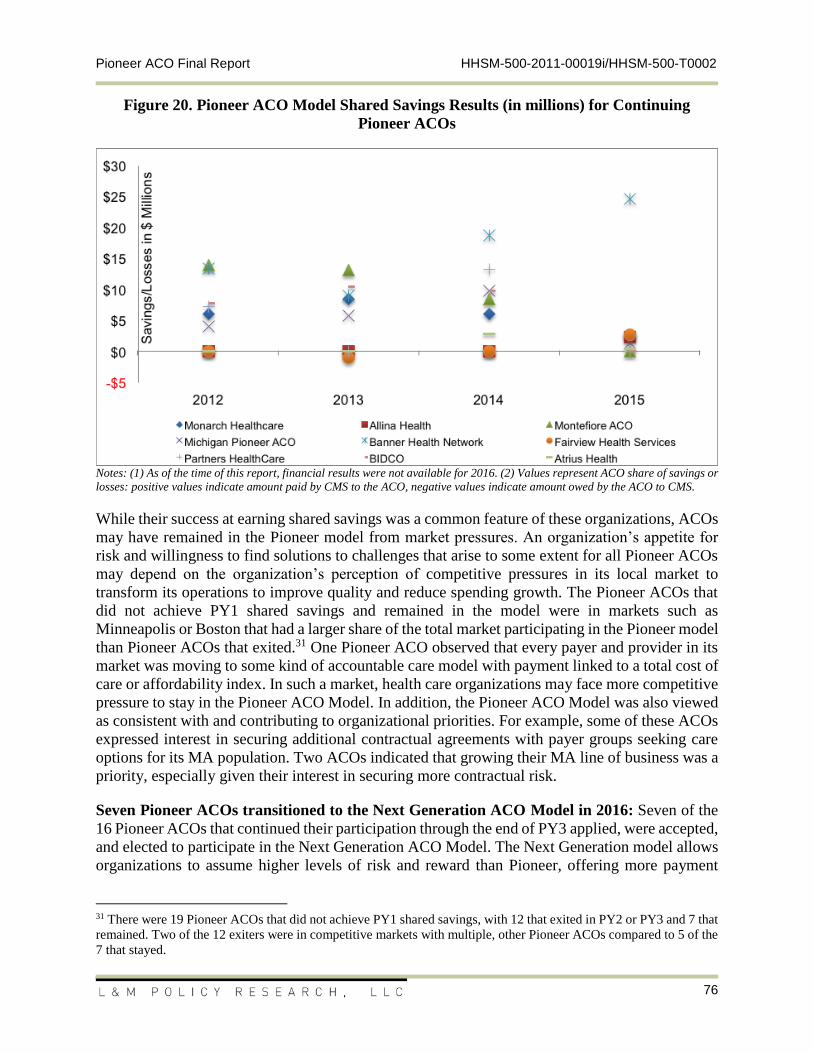
Pioneer ACO Final Report HHSM-500-2011-00019i/HHSM-500-T0002
76
Figure 20. Pioneer ACO Model Shared Savings Results (in millions) for Continuing
Pioneer ACOs
Notes: (1) As of the time of this report, financial results were not available for 2016. (2) Values represent ACO share of savings or
losses: positive values indicate amount paid by CMS to the ACO, negative values indicate amount owed by the ACO to CMS.
While their success at earning shared savings was a common feature of these organizations, ACOs
may have remained in the Pioneer model from market pressures. An organization’s appetite for
risk and willingness to find solutions to challenges that arise to some extent for all Pioneer ACOs
may depend on the organization’s perception of competitive pressures in its local market to
transform its operations to improve quality and reduce spending growth. The Pioneer ACOs that
did not achieve PY1 shared savings and remained in the model were in markets such as
Minneapolis or Boston that had a larger share of the total market participating in the Pioneer model
than Pioneer ACOs that exited.31 One Pioneer ACO observed that every payer and provider in its
market was moving to some kind of accountable care model with payment linked to a total cost of
care or affordability index. In such a market, health care organizations may face more competitive
pressure to stay in the Pioneer ACO Model. In addition, the Pioneer ACO Model was also viewed
as consistent with and contributing to organizational priorities. For example, some of these ACOs
expressed interest in securing additional contractual agreements with payer groups seeking care
options for its MA population. Two ACOs indicated that growing their MA line of business was a
priority, especially given their interest in securing more contractual risk.
Seven Pioneer ACOs transitioned to the Next Generation ACO Model in 2016: Seven of the
16 Pioneer ACOs that continued their participation through the end of PY3 applied, were accepted,
and elected to participate in the Next Generation ACO Model. The Next Generation model allows
organizations to assume higher levels of risk and reward than Pioneer, offering more payment
31 There were 19 Pioneer ACOs that did not achieve PY1 shared savings, with 12 that exited in PY2 or PY3 and 7 that
remained. Two of the 12 exiters were in competitive markets with multiple, other Pioneer ACOs compared to 5 of the
7 that stayed.
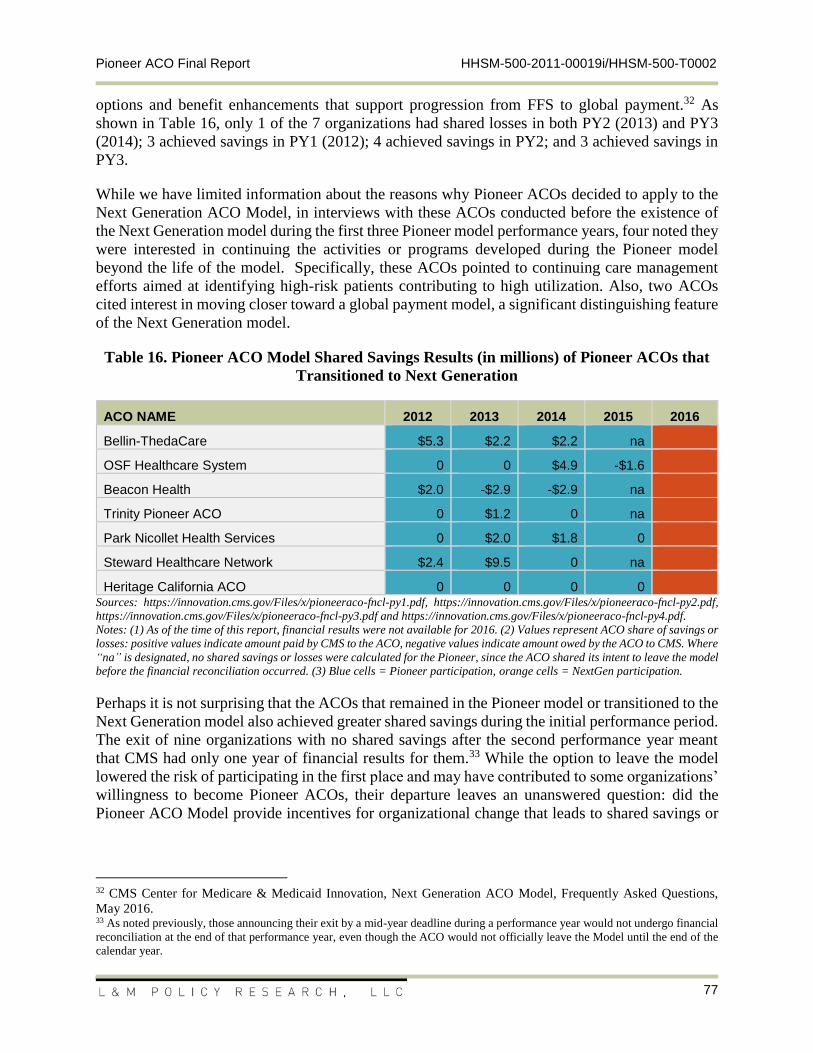
Pioneer ACO Final Report HHSM-500-2011-00019i/HHSM-500-T0002
77
options and benefit enhancements that support progression from FFS to global payment.32 As
shown in Table 16, only 1 of the 7 organizations had shared losses in both PY2 (2013) and PY3
(2014); 3 achieved savings in PY1 (2012); 4 achieved savings in PY2; and 3 achieved savings in
PY3.
While we have limited information about the reasons why Pioneer ACOs decided to apply to the
Next Generation ACO Model, in interviews with these ACOs conducted before the existence of
the Next Generation model during the first three Pioneer model performance years, four noted they
were interested in continuing the activities or programs developed during the Pioneer model
beyond the life of the model. Specifically, these ACOs pointed to continuing care management
efforts aimed at identifying high-risk patients contributing to high utilization. Also, two ACOs
cited interest in moving closer toward a global payment model, a significant distinguishing feature
of the Next Generation model.
Table 16. Pioneer ACO Model Shared Savings Results (in millions) of Pioneer ACOs that
Transitioned to Next Generation
ACO NAME 2012 2013 2014 2015 2016
Bellin-ThedaCare $5.3 $2.2 $2.2 na
OSF Healthcare System 0 0 $4.9 -$1.6
Beacon Health $2.0 -$2.9 -$2.9 na
Trinity Pioneer ACO 0 $1.2 0 na
Park Nicollet Health Services 0 $2.0 $1.8 0
Steward Healthcare Network $2.4 $9.5 0 na
Heritage California ACO 0 0 0 0 Sources: https://innovation.cms.gov/Files/x/pioneeraco-fncl-py1.pdf, https://innovation.cms.gov/Files/x/pioneeraco-fncl-py2.pdf,
https://innovation.cms.gov/Files/x/pioneeraco-fncl-py3.pdf and https://innovation.cms.gov/Files/x/pioneeraco-fncl-py4.pdf.
Notes: (1) As of the time of this report, financial results were not available for 2016. (2) Values represent ACO share of savings or
losses: positive values indicate amount paid by CMS to the ACO, negative values indicate amount owed by the ACO to CMS. Where
“na” is designated, no shared savings or losses were calculated for the Pioneer, since the ACO shared its intent to leave the model
before the financial reconciliation occurred. (3) Blue cells = Pioneer participation, orange cells = NextGen participation.
Perhaps it is not surprising that the ACOs that remained in the Pioneer model or transitioned to the
Next Generation model also achieved greater shared savings during the initial performance period.
The exit of nine organizations with no shared savings after the second performance year meant
that CMS had only one year of financial results for them.33 While the option to leave the model
lowered the risk of participating in the first place and may have contributed to some organizations’
willingness to become Pioneer ACOs, their departure leaves an unanswered question: did the
Pioneer ACO Model provide incentives for organizational change that leads to shared savings or
32 CMS Center for Medicare & Medicaid Innovation, Next Generation ACO Model, Frequently Asked Questions,
May 2016. 33 As noted previously, those announcing their exit by a mid-year deadline during a performance year would not undergo financial
reconciliation at the end of that performance year, even though the ACO would not officially leave the Model until the end of the
calendar year.
Pioneer ACO Final Report HHSM-500-2011-00019i/HHSM-500-T0002
78
did the Pioneer model attract and retain organizations that would have practiced in the same way
regardless of their participation?
That Pioneer ACOs generally chose lower risk payment options and some decided to exit the
Pioneer model altogether suggest that, despite some evidence of readiness to take on more risk,
most organizations did not elect to do so. Similarly, in the large Shared Savings Program field,
there are examples of sophisticated organizations that opted into only one-sided risk contracts—
specifically, only 5 percent (22 organizations) of the current 433 Shared Savings Program ACOs
took on two-sided risk.34 In some cases, being at risk for losses while learning to manage the total
cost of care under the rules of the Pioneer model and within a FFS context proved more difficult
than anticipated and was not sufficiently high in an organization’s priorities to warrant continued
investment.
Yet most Pioneer ACOs do continue to participate in some type of Medicare ACO. By the end
of the fifth performance year, 25 of the 32 original Pioneer ACOs continued to function as a
Medicare ACO. For 9 organizations that were not ready to bear financial risk, the Shared Savings
Program provided an option suitable for organizations with less experience in risk models. For the
other 16 organizations, the Pioneer and Next Generation models offered the opportunity to accept
higher levels of risk with the promise of sharing in the rewards for achieving the three-part aim of
better care for individuals, better health for populations, and lower health care costs.
34 https://www.cms.gov/Medicare/Medicare-Fee-for-Service-Payment/sharedsavingsprogram/Downloads/All-Starts-MSSP-
ACO.pdf
Pioneer ACO Final Report HHSM-500-2011-00019i/HHSM-500-T0002
79
APPENDIX A. METHODS
The evaluation relied on a mixed-methods data collection and analytic research approach. For this
report, secondary data analyses included analysis of participating provider lists, identification and
analysis of beneficiaries eligible for alignment with a Pioneer ACO and related Medicare claims
analysis, and examination of Pioneer ACO markets. We also report on analysis of quality measures
based on Medicare claims, the ACO version of the Consumer Assessment of Healthcare Providers
and Systems (CAHPS) patient experience survey, and the Group Practice Reporting Option
(GPRO) process and clinical quality measures. Primary data collection included site visits and
quarterly telephone assessments with each of the Pioneer ACOs, focus groups with providers and
beneficiaries, and a survey of participating providers. Detail on the specific data sources and
methods are provided here for the study’s quantitative and qualitative components, respectively.
Provider participation, ACO markets, and beneficiary alignment
The population of alignment-eligible beneficiaries was drawn from the universe of beneficiaries
listed in the Master Beneficiary Summary File (MBSF) for each relevant year and restricted to
beneficiaries with at least one qualified evaluation and management (QEM) service during the
three-year alignment period ending six months prior to the start of a performance year; in addition,
the beneficiary had to meet the following CMS-established criteria for alignment:35
Alive as of January 1 of performance year
One or more months of Part A and Part B coverage
No months where covered by only Part A or Part B
No months in which beneficiary was enrolled in a Medicare Advantage plan
No months of residence outside the U.S. or U.S. territories
Beneficiaries were flagged if they (i) moved outside the Pioneer ACO service area or (ii) received
more than half of QEM services from outside the Pioneer ACO service area.36
Among the population of alignment-eligible beneficiaries, we applied the alignment algorithm
according to the PY3 Pioneer ACO alignment technical specifications to the participating
providers submitted by each ACO to CMS each performance year. Participating providers in the
Pioneer model had a participation agreement signed with the ACO and were identified by their
Tax Identification Number (TIN)/National Provider Identifier (NPI) combinations. For purposes
of the evaluation, beneficiaries were aligned with a Pioneer ACO for each performance year using
provider NPIs associated with the ACO and, for some analyses, the two years prior to the start of
the ACO. Use of the same alignment algorithm by the evaluation ensured internal consistency
across performance years.
Alignment-eligible beneficiaries who received the plurality of their QEM allowed charges from
ACO-related TIN-NPIs relative to any other Medicare ACO or any non-ACO TIN during the 36-
35 https://innovation.cms.gov/Files/x/PioneerACOBmarkMethodology.pdf, Ver. 91., Updated March 26, 2014. 36 The Pioneer ACO service area is defined in the benchmark methodology as the counties in which the ACO’s
participating primary care providers maintain practice locations and the counties adjacent to those counties.
Pioneer ACO Final Report HHSM-500-2011-00019i/HHSM-500-T0002
80
month alignment period preceding each performance year were aligned with a Pioneer ACO.37 For
beneficiaries who had 10 percent or less of their QEM charges billed by primary care providers
(general practice, family practice, internal medicine, geriatric medicine, nurse practitioner, or
physician assistant), certain specialist physicians were also eligible to have such beneficiaries
aligned through their QEM charges; these specialties included: nephrology, oncology,
rheumatology, endocrinology, pulmonology, neurology, and cardiology. In these cases, we aligned
beneficiaries based on the plurality of QEM charges with specialists participating in the ACO.
Change or turnover in ACOs was calculated for providers and beneficiaries by performance year.
Beneficiaries in the alignment-eligible population who were not attributed to a Medicare ACO in
a given year could be included in the spillover group. To be included in this group, an unaligned
beneficiary had to have at least one QEM service with an ACO provider during the year.
In addition to examining turnover in provider and beneficiary populations, we also examined year-
to-year changes in ACO market areas. An ACO’s market was defined as all counties where at least
1 percent of an ACO’s aligned beneficiaries resided according to the MBSF. ACO markets could
change each year depending on which beneficiaries were aligned. Table 26 in the Appendix B
shows the total number of counties per ACO market over the performance period and the number
and percent of overlapping counties across the three-year period.
CAHPS and GPRO analyses
One data source that provides insight into the quality of care ACO providers deliver to their
patients is the ACO version of the Consumer Assessment of Healthcare Providers and Systems
(CAHPS) survey administered by AHRQ. This survey was sent to patients and allows them the
opportunity to answer a variety of questions about their experience and satisfaction with the health
care provider (clinician) they consider their own who is also affiliated with the ACO.
ACO CAHPS methodology
For this analysis, we used ACO CAHPS survey responses for the ACOs engaged in the Pioneer
ACO Model. Using AHRQ’s CAHPS macro, which facilitates case mix adjustment and recoding
of responses to allow for efficient analysis, we aggregated the patient-level responses for each item
up to ACO-level reports across a number of composite measures. This analysis focused on
patients’ experience in receiving courteous and timely care through their ACO, as assessed by the
following domain-specific composite measures:38
1. Getting Timely Care, Appointments and Information (Timely Care)
2. How Well Providers Communicate (Provider Communication)
37 QEM allowed charges are weighted by each year of the alignment period: 10% for the first 12 months of the
alignment period, 30% for the second 12-month period, and 60% for the third 12-month period. If a tie occurs when
calculating total charges by provider and by ACO, the provider with the most recent service takes precedence for that
step of the assignment algorithm. If a tie still remains, then assignment is random.
38 CAHPS Survey for Accountable Care Organizations (ACOs) Participating in Medicare Initiatives. Accessed at http://acocahps.cms.gov/Files/Table2QAGV2_ACO_12_standalone.pdf.

Pioneer ACO Final Report HHSM-500-2011-00019i/HHSM-500-T0002
81
3. Patient’s Rating of Provider (Overall Provider Rating)
4. Access to Specialists (Access to Specialty Care)
5. Health Promotion and Education (Health Education)
6. Shared Decision-Making
7. Courteous and Helpful Office Staff (ACO Staff)
We used Version 4.1 of the CAHPS macro to produce the composite scores. A list of the ACO
CAHPS items in each composite is in Table 17.
Table 17. ACO CAHPS Domains and Item Text
ACO Item #
ACO Item Text
1. Getting Timely Care, Appointments, and Information (Timely Care)
6 In the last 6 months, when you phoned this provider’s office to get an appointment for care you needed right away, how often did you get an appointment as soon as you needed?
8 In the last 6 months, when you made an appointment for a check-up or routine care with this provider, how often did you get an appointment as soon as you needed?
10 In the last 6 months, when you phoned this provider’s office during regular office hours, how often did you get an answer to your medical question that same day?
12 In the last 6 months, when you phoned this provider’s office after regular office hours, how often did you get an answer to your medical question as soon as you needed?
15 Wait time includes time spent in the waiting room and exam room. In the last 6 months, how often did you see this provider within 15 minutes of your appointment time?
2. How Well Providers Communicate (Provider Communication)
16 In the last 6 months, how often did this provider explain things in a way that was easy to understand?
17 In the last 6 months, how often did this provider listen carefully to you?
19 In the last 6 months, how often did this provider give you easy to understand information about these health questions or concerns?
20 In the last 6 months, how often did this provider seem to know the important information about your medical history?
22 In the last 6 months, how often did this provider show respect for what you had to say?
23 In the last 6 months, how often did this provider spend enough time with you?
3. Patient’s Rating of Provider (Overall Provider Rating)
41 Using any number from 0 to 10, where 0 is the worst provider possible and 10 is the best provider possible, what number would you use to rate this provider?
4. Access to Specialists (Access to Specialty Care)
46 In the last 6 months, how often was it easy to get appointments with specialists?
47 In the last 6 months, how often did the specialist you saw most seem to know the important information about your medical history?
5. Health Promotion and Education (Health Education)
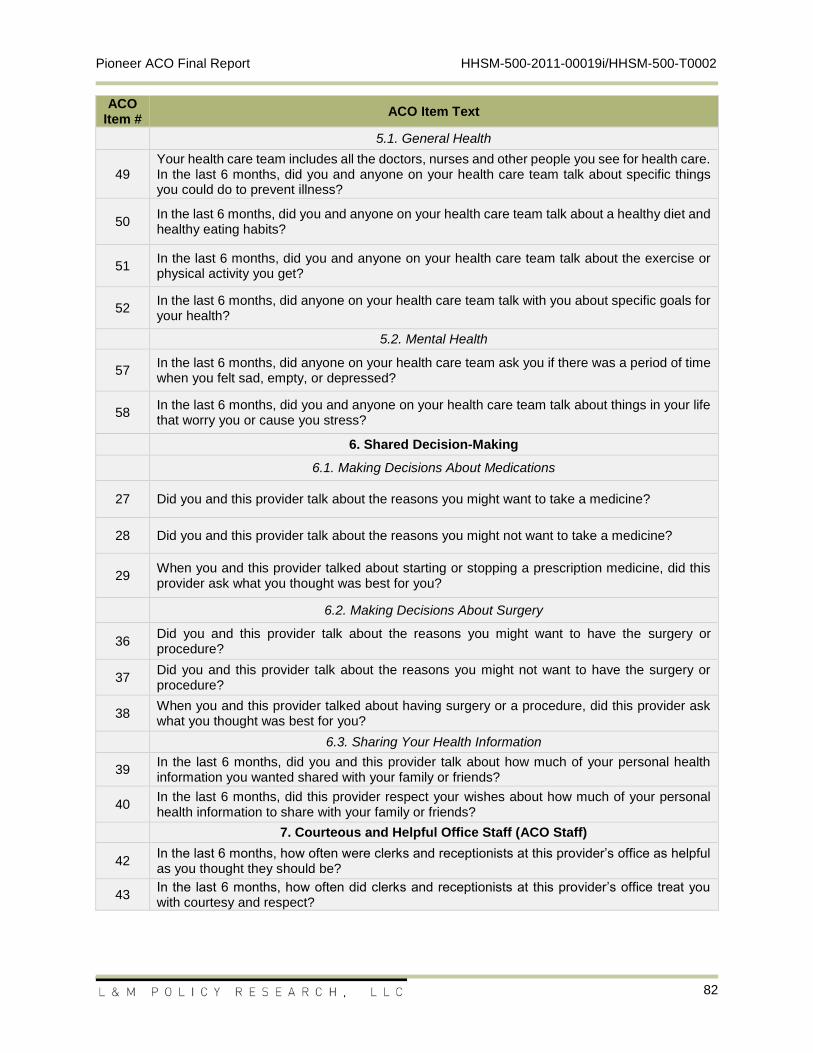
Pioneer ACO Final Report HHSM-500-2011-00019i/HHSM-500-T0002
82
ACO Item #
ACO Item Text
5.1. General Health
49 Your health care team includes all the doctors, nurses and other people you see for health care. In the last 6 months, did you and anyone on your health care team talk about specific things you could do to prevent illness?
50 In the last 6 months, did you and anyone on your health care team talk about a healthy diet and healthy eating habits?
51 In the last 6 months, did you and anyone on your health care team talk about the exercise or physical activity you get?
52 In the last 6 months, did anyone on your health care team talk with you about specific goals for your health?
5.2. Mental Health
57 In the last 6 months, did anyone on your health care team ask you if there was a period of time when you felt sad, empty, or depressed?
58 In the last 6 months, did you and anyone on your health care team talk about things in your life that worry you or cause you stress?
6. Shared Decision-Making
6.1. Making Decisions About Medications
27 Did you and this provider talk about the reasons you might want to take a medicine?
28 Did you and this provider talk about the reasons you might not want to take a medicine?
29 When you and this provider talked about starting or stopping a prescription medicine, did this provider ask what you thought was best for you?
6.2. Making Decisions About Surgery
36 Did you and this provider talk about the reasons you might want to have the surgery or procedure?
37 Did you and this provider talk about the reasons you might not want to have the surgery or procedure?
38 When you and this provider talked about having surgery or a procedure, did this provider ask what you thought was best for you?
6.3. Sharing Your Health Information
39 In the last 6 months, did you and this provider talk about how much of your personal health information you wanted shared with your family or friends?
40 In the last 6 months, did this provider respect your wishes about how much of your personal health information to share with your family or friends?
7. Courteous and Helpful Office Staff (ACO Staff)
42 In the last 6 months, how often were clerks and receptionists at this provider’s office as helpful as you thought they should be?
43 In the last 6 months, how often did clerks and receptionists at this provider’s office treat you with courtesy and respect?
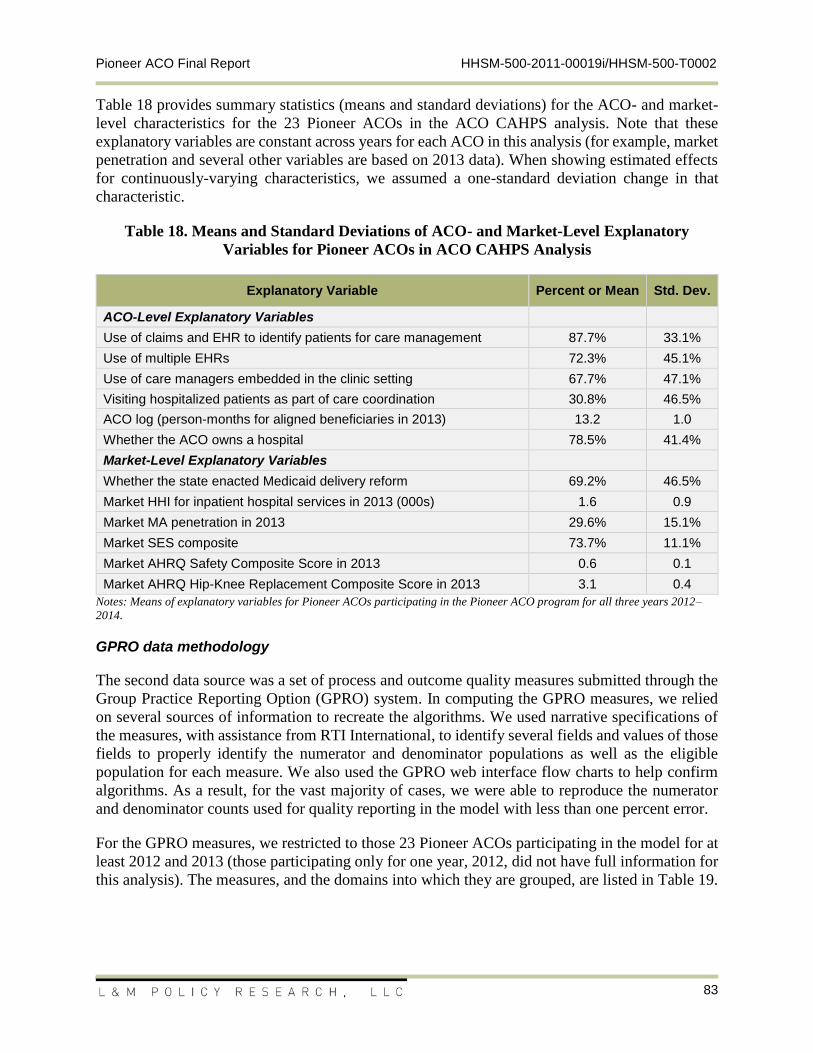
Pioneer ACO Final Report HHSM-500-2011-00019i/HHSM-500-T0002
83
Table 18 provides summary statistics (means and standard deviations) for the ACO- and market-
level characteristics for the 23 Pioneer ACOs in the ACO CAHPS analysis. Note that these
explanatory variables are constant across years for each ACO in this analysis (for example, market
penetration and several other variables are based on 2013 data). When showing estimated effects
for continuously-varying characteristics, we assumed a one-standard deviation change in that
characteristic.
Table 18. Means and Standard Deviations of ACO- and Market-Level Explanatory
Variables for Pioneer ACOs in ACO CAHPS Analysis
Explanatory Variable Percent or Mean Std. Dev.
ACO-Level Explanatory Variables
Use of claims and EHR to identify patients for care management 87.7% 33.1%
Use of multiple EHRs 72.3% 45.1%
Use of care managers embedded in the clinic setting 67.7% 47.1%
Visiting hospitalized patients as part of care coordination 30.8% 46.5%
ACO log (person-months for aligned beneficiaries in 2013) 13.2 1.0
Whether the ACO owns a hospital 78.5% 41.4%
Market-Level Explanatory Variables
Whether the state enacted Medicaid delivery reform 69.2% 46.5%
Market HHI for inpatient hospital services in 2013 (000s) 1.6 0.9
Market MA penetration in 2013 29.6% 15.1%
Market SES composite 73.7% 11.1%
Market AHRQ Safety Composite Score in 2013 0.6 0.1
Market AHRQ Hip-Knee Replacement Composite Score in 2013 3.1 0.4
Notes: Means of explanatory variables for Pioneer ACOs participating in the Pioneer ACO program for all three years 2012–
2014.
GPRO data methodology
The second data source was a set of process and outcome quality measures submitted through the
Group Practice Reporting Option (GPRO) system. In computing the GPRO measures, we relied
on several sources of information to recreate the algorithms. We used narrative specifications of
the measures, with assistance from RTI International, to identify several fields and values of those
fields to properly identify the numerator and denominator populations as well as the eligible
population for each measure. We also used the GPRO web interface flow charts to help confirm
algorithms. As a result, for the vast majority of cases, we were able to reproduce the numerator
and denominator counts used for quality reporting in the model with less than one percent error.
For the GPRO measures, we restricted to those 23 Pioneer ACOs participating in the model for at
least 2012 and 2013 (those participating only for one year, 2012, did not have full information for
this analysis). The measures, and the domains into which they are grouped, are listed in Table 19.
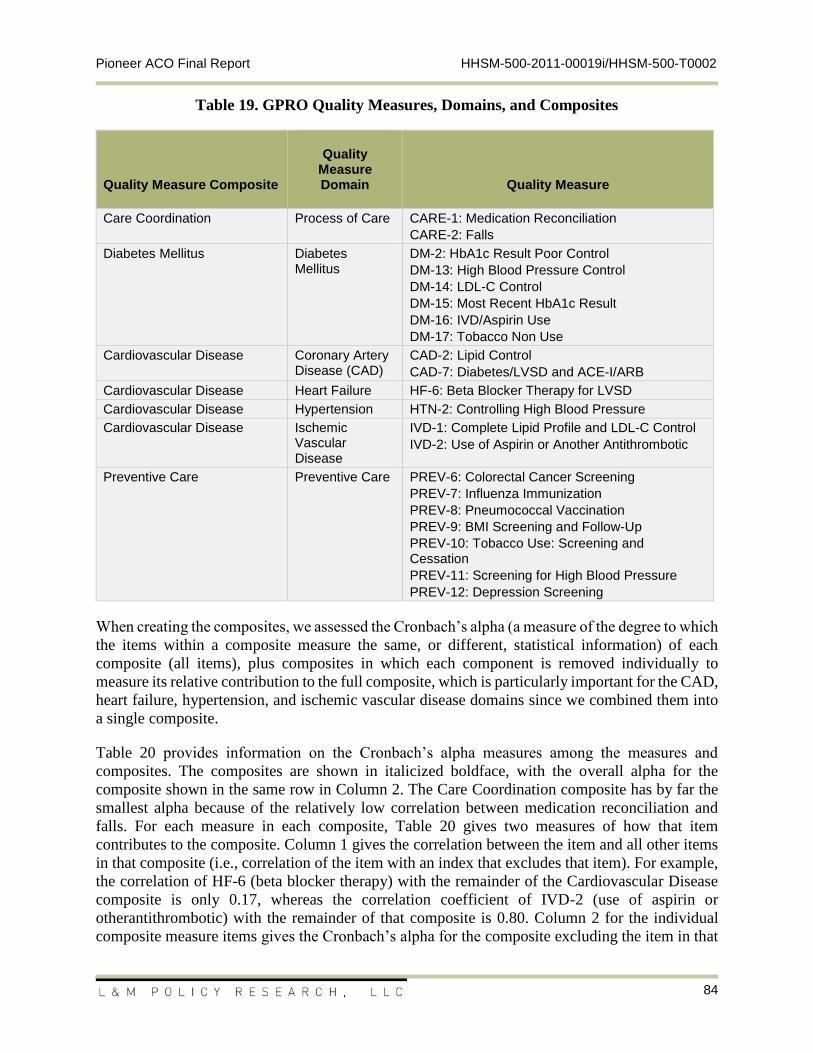
Pioneer ACO Final Report HHSM-500-2011-00019i/HHSM-500-T0002
84
Table 19. GPRO Quality Measures, Domains, and Composites
Quality Measure Composite
Quality Measure Domain Quality Measure
Care Coordination
Process of Care CARE-1: Medication Reconciliation
CARE-2: Falls
Diabetes Mellitus Diabetes Mellitus
DM-2: HbA1c Result Poor Control
DM-13: High Blood Pressure Control
DM-14: LDL-C Control
DM-15: Most Recent HbA1c Result
DM-16: IVD/Aspirin Use
DM-17: Tobacco Non Use
Cardiovascular Disease Coronary Artery Disease (CAD)
CAD-2: Lipid Control
CAD-7: Diabetes/LVSD and ACE-I/ARB
Cardiovascular Disease Heart Failure HF-6: Beta Blocker Therapy for LVSD
Cardiovascular Disease Hypertension HTN-2: Controlling High Blood Pressure
Cardiovascular Disease Ischemic Vascular Disease
IVD-1: Complete Lipid Profile and LDL-C Control
IVD-2: Use of Aspirin or Another Antithrombotic
Preventive Care Preventive Care PREV-6: Colorectal Cancer Screening
PREV-7: Influenza Immunization
PREV-8: Pneumococcal Vaccination
PREV-9: BMI Screening and Follow-Up
PREV-10: Tobacco Use: Screening and Cessation
PREV-11: Screening for High Blood Pressure
PREV-12: Depression Screening
When creating the composites, we assessed the Cronbach’s alpha (a measure of the degree to which
the items within a composite measure the same, or different, statistical information) of each
composite (all items), plus composites in which each component is removed individually to
measure its relative contribution to the full composite, which is particularly important for the CAD,
heart failure, hypertension, and ischemic vascular disease domains since we combined them into
a single composite.
Table 20 provides information on the Cronbach’s alpha measures among the measures and
composites. The composites are shown in italicized boldface, with the overall alpha for the
composite shown in the same row in Column 2. The Care Coordination composite has by far the
smallest alpha because of the relatively low correlation between medication reconciliation and
falls. For each measure in each composite, Table 20 gives two measures of how that item
contributes to the composite. Column 1 gives the correlation between the item and all other items
in that composite (i.e., correlation of the item with an index that excludes that item). For example,
the correlation of HF-6 (beta blocker therapy) with the remainder of the Cardiovascular Disease
composite is only 0.17, whereas the correlation coefficient of IVD-2 (use of aspirin or
otherantithrombotic) with the remainder of that composite is 0.80. Column 2 for the individual
composite measure items gives the Cronbach’s alpha for the composite excluding the item in that
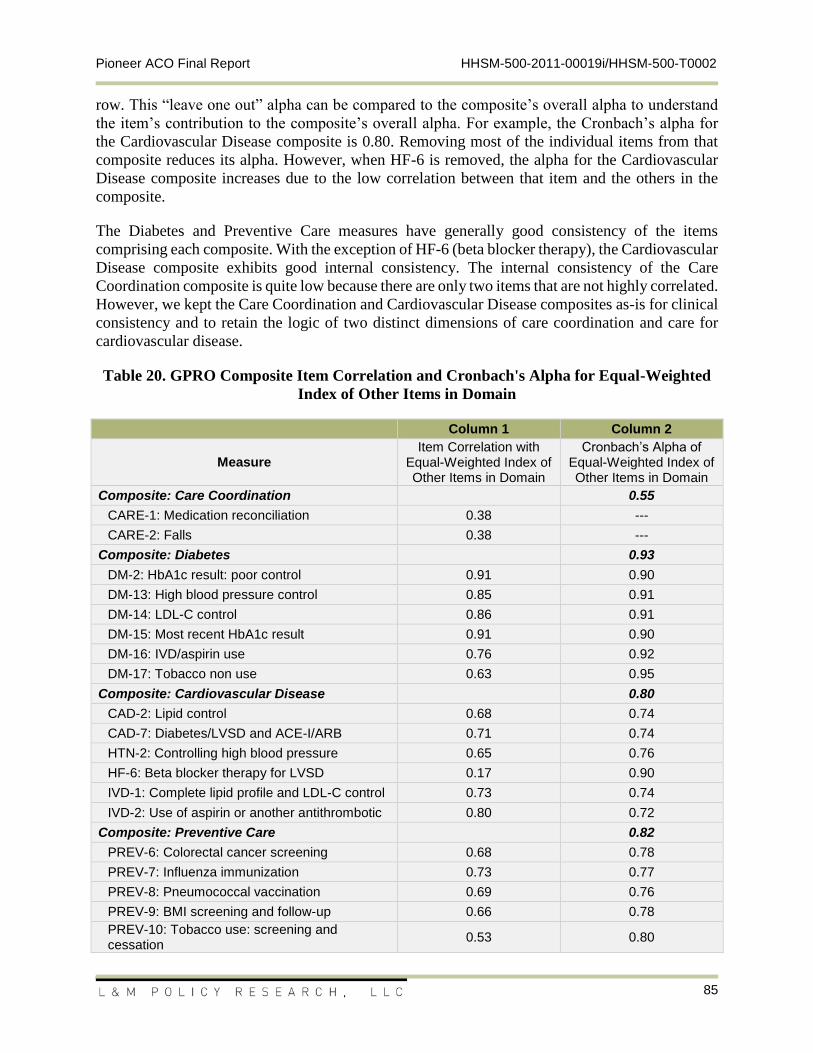
Pioneer ACO Final Report HHSM-500-2011-00019i/HHSM-500-T0002
85
row. This “leave one out” alpha can be compared to the composite’s overall alpha to understand
the item’s contribution to the composite’s overall alpha. For example, the Cronbach’s alpha for
the Cardiovascular Disease composite is 0.80. Removing most of the individual items from that
composite reduces its alpha. However, when HF-6 is removed, the alpha for the Cardiovascular
Disease composite increases due to the low correlation between that item and the others in the
composite.
The Diabetes and Preventive Care measures have generally good consistency of the items
comprising each composite. With the exception of HF-6 (beta blocker therapy), the Cardiovascular
Disease composite exhibits good internal consistency. The internal consistency of the Care
Coordination composite is quite low because there are only two items that are not highly correlated.
However, we kept the Care Coordination and Cardiovascular Disease composites as-is for clinical
consistency and to retain the logic of two distinct dimensions of care coordination and care for
cardiovascular disease.
Table 20. GPRO Composite Item Correlation and Cronbach's Alpha for Equal-Weighted
Index of Other Items in Domain
Column 1 Column 2
Measure Item Correlation with
Equal-Weighted Index of Other Items in Domain
Cronbach’s Alpha of Equal-Weighted Index of Other Items in Domain
Composite: Care Coordination 0.55
CARE-1: Medication reconciliation 0.38 ---
CARE-2: Falls 0.38 ---
Composite: Diabetes 0.93
DM-2: HbA1c result: poor control 0.91 0.90
DM-13: High blood pressure control 0.85 0.91
DM-14: LDL-C control 0.86 0.91
DM-15: Most recent HbA1c result 0.91 0.90
DM-16: IVD/aspirin use 0.76 0.92
DM-17: Tobacco non use 0.63 0.95
Composite: Cardiovascular Disease 0.80
CAD-2: Lipid control 0.68 0.74
CAD-7: Diabetes/LVSD and ACE-I/ARB 0.71 0.74
HTN-2: Controlling high blood pressure 0.65 0.76
HF-6: Beta blocker therapy for LVSD 0.17 0.90
IVD-1: Complete lipid profile and LDL-C control 0.73 0.74
IVD-2: Use of aspirin or another antithrombotic 0.80 0.72
Composite: Preventive Care 0.82
PREV-6: Colorectal cancer screening 0.68 0.78
PREV-7: Influenza immunization 0.73 0.77
PREV-8: Pneumococcal vaccination 0.69 0.76
PREV-9: BMI screening and follow-up 0.66 0.78
PREV-10: Tobacco use: screening and cessation
0.53 0.80
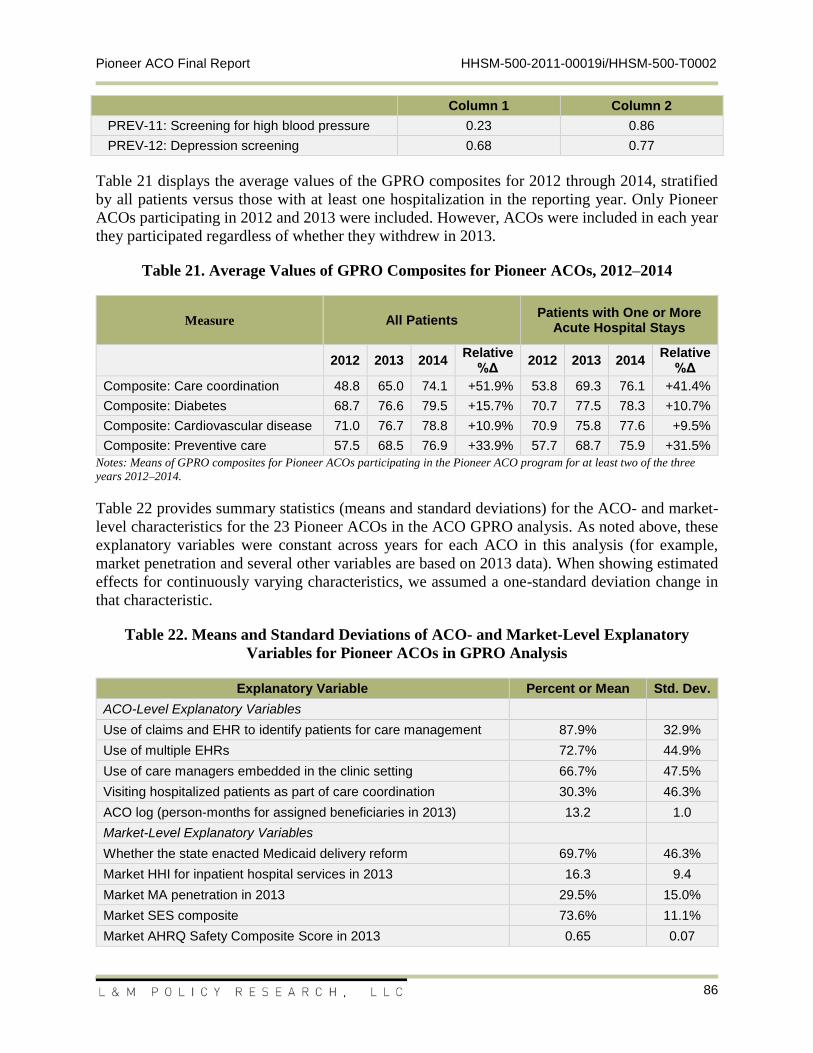
Pioneer ACO Final Report HHSM-500-2011-00019i/HHSM-500-T0002
86
Column 1 Column 2
PREV-11: Screening for high blood pressure 0.23 0.86
PREV-12: Depression screening 0.68 0.77
Table 21 displays the average values of the GPRO composites for 2012 through 2014, stratified
by all patients versus those with at least one hospitalization in the reporting year. Only Pioneer
ACOs participating in 2012 and 2013 were included. However, ACOs were included in each year
they participated regardless of whether they withdrew in 2013.
Table 21. Average Values of GPRO Composites for Pioneer ACOs, 2012–2014
Measure All Patients Patients with One or More
Acute Hospital Stays
2012 2013 2014 Relative
%Δ 2012 2013 2014
Relative %Δ
Composite: Care coordination 48.8 65.0 74.1 +51.9% 53.8 69.3 76.1 +41.4%
Composite: Diabetes 68.7 76.6 79.5 +15.7% 70.7 77.5 78.3 +10.7%
Composite: Cardiovascular disease 71.0 76.7 78.8 +10.9% 70.9 75.8 77.6 +9.5%
Composite: Preventive care 57.5 68.5 76.9 +33.9% 57.7 68.7 75.9 +31.5%
Notes: Means of GPRO composites for Pioneer ACOs participating in the Pioneer ACO program for at least two of the three
years 2012–2014.
Table 22 provides summary statistics (means and standard deviations) for the ACO- and market-
level characteristics for the 23 Pioneer ACOs in the ACO GPRO analysis. As noted above, these
explanatory variables were constant across years for each ACO in this analysis (for example,
market penetration and several other variables are based on 2013 data). When showing estimated
effects for continuously varying characteristics, we assumed a one-standard deviation change in
that characteristic.
Table 22. Means and Standard Deviations of ACO- and Market-Level Explanatory
Variables for Pioneer ACOs in GPRO Analysis
Explanatory Variable Percent or Mean Std. Dev.
ACO-Level Explanatory Variables
Use of claims and EHR to identify patients for care management 87.9% 32.9%
Use of multiple EHRs 72.7% 44.9%
Use of care managers embedded in the clinic setting 66.7% 47.5%
Visiting hospitalized patients as part of care coordination 30.3% 46.3%
ACO log (person-months for assigned beneficiaries in 2013) 13.2 1.0
Market-Level Explanatory Variables
Whether the state enacted Medicaid delivery reform 69.7% 46.3%
Market HHI for inpatient hospital services in 2013 16.3 9.4
Market MA penetration in 2013 29.5% 15.0%
Market SES composite 73.6% 11.1%
Market AHRQ Safety Composite Score in 2013 0.65 0.07
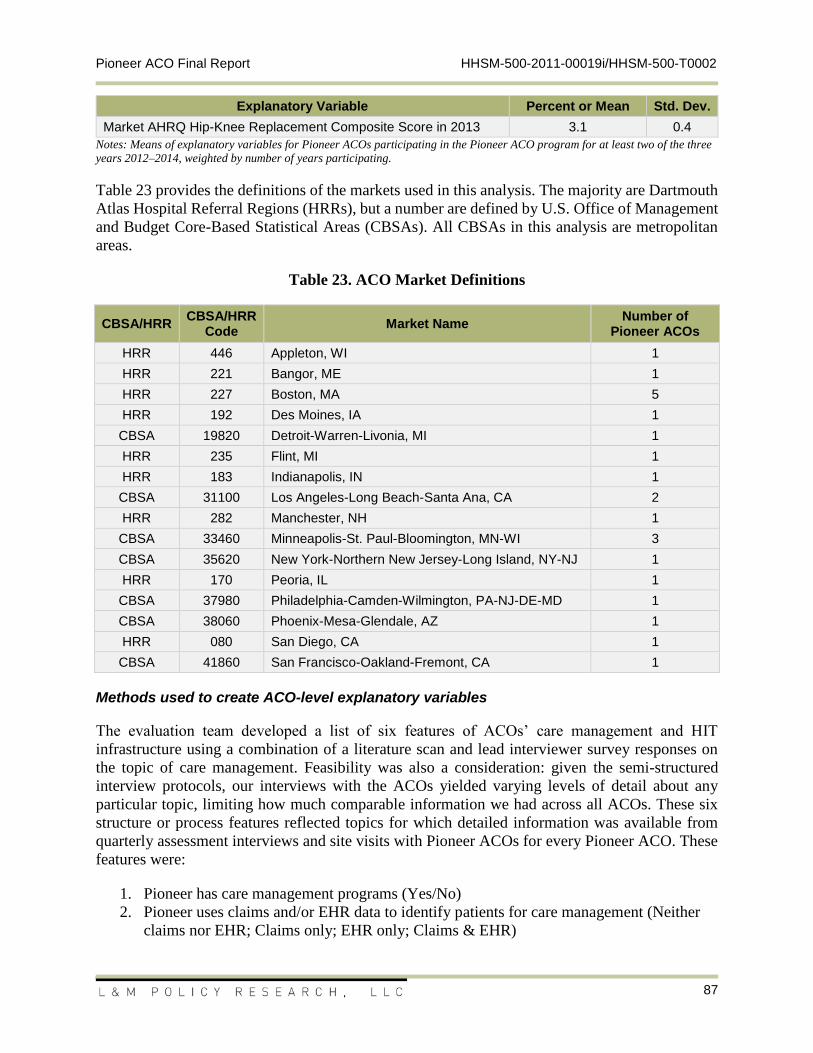
Pioneer ACO Final Report HHSM-500-2011-00019i/HHSM-500-T0002
87
Explanatory Variable Percent or Mean Std. Dev.
Market AHRQ Hip-Knee Replacement Composite Score in 2013 3.1 0.4
Notes: Means of explanatory variables for Pioneer ACOs participating in the Pioneer ACO program for at least two of the three
years 2012–2014, weighted by number of years participating.
Table 23 provides the definitions of the markets used in this analysis. The majority are Dartmouth
Atlas Hospital Referral Regions (HRRs), but a number are defined by U.S. Office of Management
and Budget Core-Based Statistical Areas (CBSAs). All CBSAs in this analysis are metropolitan
areas.
Table 23. ACO Market Definitions
CBSA/HRR CBSA/HRR
Code Market Name
Number of Pioneer ACOs
HRR 446 Appleton, WI 1
HRR 221 Bangor, ME 1
HRR 227 Boston, MA 5
HRR 192 Des Moines, IA 1
CBSA 19820 Detroit-Warren-Livonia, MI 1
HRR 235 Flint, MI 1
HRR 183 Indianapolis, IN 1
CBSA 31100 Los Angeles-Long Beach-Santa Ana, CA 2
HRR 282 Manchester, NH 1
CBSA 33460 Minneapolis-St. Paul-Bloomington, MN-WI 3
CBSA 35620 New York-Northern New Jersey-Long Island, NY-NJ 1
HRR 170 Peoria, IL 1
CBSA 37980 Philadelphia-Camden-Wilmington, PA-NJ-DE-MD 1
CBSA 38060 Phoenix-Mesa-Glendale, AZ 1
HRR 080 San Diego, CA 1
CBSA 41860 San Francisco-Oakland-Fremont, CA 1
Methods used to create ACO-level explanatory variables
The evaluation team developed a list of six features of ACOs’ care management and HIT
infrastructure using a combination of a literature scan and lead interviewer survey responses on
the topic of care management. Feasibility was also a consideration: given the semi-structured
interview protocols, our interviews with the ACOs yielded varying levels of detail about any
particular topic, limiting how much comparable information we had across all ACOs. These six
structure or process features reflected topics for which detailed information was available from
quarterly assessment interviews and site visits with Pioneer ACOs for every Pioneer ACO. These
features were:
1. Pioneer has care management programs (Yes/No)
2. Pioneer uses claims and/or EHR data to identify patients for care management (Neither
claims nor EHR; Claims only; EHR only; Claims & EHR)
Pioneer ACO Final Report HHSM-500-2011-00019i/HHSM-500-T0002
88
3. ACO physicians have a single EHR (“No” = Multiple/no EHRs and “Yes” = single EHR
across the ACO)
4. Care managers embedded in any ACO practices (Yes/No)
5. Pioneer routinely receives timely notification from hospitals of inpatient
admissions/discharges (Yes/No)
6. Visiting ACO patients during an inpatient stay is part of care management program
(Yes/No)
Two reviewers were assigned to each variable and independently reviewed site visit reports for
each ACO to determine the correct close-ended response for each Pioneer ACO. Reviewers also
recorded the text supporting the selected responses. In instances where sufficient detail was not
available in the site visit narrative, reviewers consulted transcript-style notes from relevant
quarterly assessment interviews. The reviewers then reconciled their individual responses. In cases
where there was disagreement, reviewers compared textual evidence from the site visit debrief
narratives to reach consensus. Once the reviewers reconciled all responses to the six key features,
the team circulated the data collection tool to ACO leads who had deep knowledge of the ACOs
they interviewed for review and validation. This information has a number of limitations: (1) it
was self-reported by the ACO; (2) it was collected at a point in time but may have changed after
the interview was conducted; and (3) it does not provide detail on how well or how often certain
activities occur, so it may be an insensitive measure of important facets of care management.
Regression approach
For the regression analysis, we treated the ACO CAHPS and GPRO data as a balanced panel (3
years for each ACO). The models were random effects linear models specified as:
𝑌𝑖𝑡 = 𝛽0 + 𝐀′𝑖𝛽𝐴𝑖 +𝐌′𝑖𝛽𝑀𝑖 + 𝐓′𝑡 + 𝜐𝑖 + 𝜀𝑖𝑡
where
– Yit is the ACO CAHPS or GPRO composite measure where i indexes ACOs and t indexes
years (𝑡 ∈ {2012,2013,2014})
– β0 is the constant (intercept) term
– Ai is the vector of ACO characteristics
– Mi is the vector of market characteristics
– βAi is the vector of coefficients for ACO characteristics
– βMi is the vector of coefficients for market characteristics
– Tt is the vector of year
– υi is the ACO-specific “random” effect
– εit is the error term
Primary data collection and analysis
Self-reported data were collected on implementation of Pioneer ACO systems, processes, and
initiatives from quarterly assessment interviews and site visits with each Pioneer ACO. Interviews
and site visits used semi-structured protocols to allow for flexibility for each organization to raise
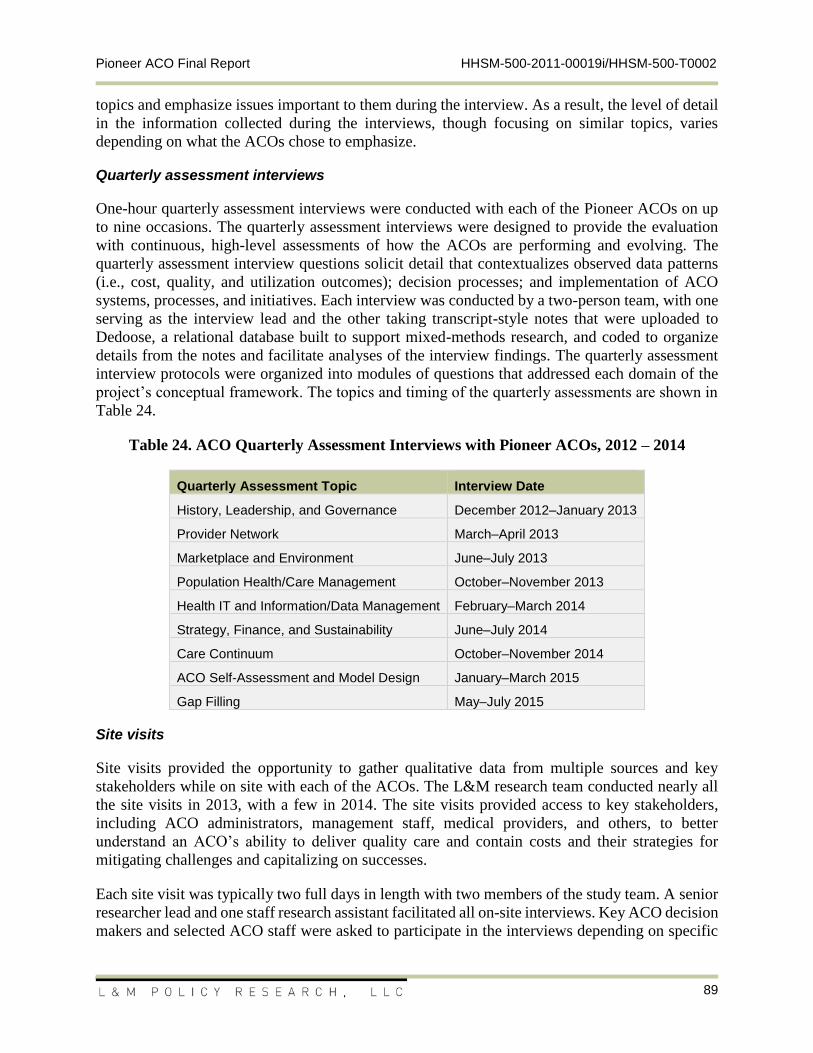
Pioneer ACO Final Report HHSM-500-2011-00019i/HHSM-500-T0002
89
topics and emphasize issues important to them during the interview. As a result, the level of detail
in the information collected during the interviews, though focusing on similar topics, varies
depending on what the ACOs chose to emphasize.
Quarterly assessment interviews
One-hour quarterly assessment interviews were conducted with each of the Pioneer ACOs on up
to nine occasions. The quarterly assessment interviews were designed to provide the evaluation
with continuous, high-level assessments of how the ACOs are performing and evolving. The
quarterly assessment interview questions solicit detail that contextualizes observed data patterns
(i.e., cost, quality, and utilization outcomes); decision processes; and implementation of ACO
systems, processes, and initiatives. Each interview was conducted by a two-person team, with one
serving as the interview lead and the other taking transcript-style notes that were uploaded to
Dedoose, a relational database built to support mixed-methods research, and coded to organize
details from the notes and facilitate analyses of the interview findings. The quarterly assessment
interview protocols were organized into modules of questions that addressed each domain of the
project’s conceptual framework. The topics and timing of the quarterly assessments are shown in
Table 24.
Table 24. ACO Quarterly Assessment Interviews with Pioneer ACOs, 2012 – 2014
Quarterly Assessment Topic Interview Date
History, Leadership, and Governance December 2012–January 2013
Provider Network March–April 2013
Marketplace and Environment June–July 2013
Population Health/Care Management October–November 2013
Health IT and Information/Data Management February–March 2014
Strategy, Finance, and Sustainability June–July 2014
Care Continuum October–November 2014
ACO Self-Assessment and Model Design January–March 2015
Gap Filling May–July 2015
Site visits
Site visits provided the opportunity to gather qualitative data from multiple sources and key
stakeholders while on site with each of the ACOs. The L&M research team conducted nearly all
the site visits in 2013, with a few in 2014. The site visits provided access to key stakeholders,
including ACO administrators, management staff, medical providers, and others, to better
understand an ACO’s ability to deliver quality care and contain costs and their strategies for
mitigating challenges and capitalizing on successes.
Each site visit was typically two full days in length with two members of the study team. A senior
researcher lead and one staff research assistant facilitated all on-site interviews. Key ACO decision
makers and selected ACO staff were asked to participate in the interviews depending on specific
Pioneer ACO Final Report HHSM-500-2011-00019i/HHSM-500-T0002
90
informational needs. Selected ACO staff sometimes included nurse managers, site-specific
administrators (hospital, SNF, home health, hospice), clinical and non-clinical staff associated with
care management, and staff associated with provider communications and incentive structures.
The research assistant took transcript-style notes that were uploaded to Dedoose and coded to
organize details from the notes and facilitate analyses of the interview findings. The notes were
also turned into a site visit report on each ACO. These reports were organized into key topics (e.g.,
management, care coordination activities, physician engagement) to facilitate review by the
evaluation team. Each site visit report was reviewed by the ACOs, who were given the opportunity
to correct errors of fact.
Analysis
The evaluation team used Dedoose to store all written interview notes. Dedoose is a secure, web-
based application that facilitates aggregation and storage of historical and current data by a broad
team of users, allowing immediate access and real-time data sharing, with tight controls for access
levels and version management. All relevant primary data was uploaded into Dedoose and coded
using a defined list of key topics and themes. The team used coded interview notes in Dedoose to
identify relevant themes and excerpts by topic. In addition, we summarized site visit debriefs and
quarterly assessments using keyword searches and reviews of documents by topic and themes.
Some interviews were accompanied by short surveys of evaluation team leads on specific topics,
allowing the team to note any changes to previously collected data from ACOs over the lifespan
of the data collection period.
Survey of ACO-participating physicians
The evaluation team also fielded a survey of ACO-participating physicians designed to be
representative of physicians participating in Pioneer ACOs. The sample was drawn from the 23
Pioneer Medicare ACOs participating at the end of 2013 and limited to participating providers
with the following specialty designations: general practice (1), family practice (8), internal
medicine (11), geriatric medicine (38), nurse practitioner (50), or physician assistant (97).39 The
sample was selected randomly from the combined list of providers participating in Pioneer ACOs.
The questionnaire was used to screen providers to eliminate any that had not been participating in
the same ACO for at least 12 months. Because of the small number of respondents from any one
ACO, no inferences can be made to specific ACOs.
The survey was fielded from September 2014 through April 2015 using a mixed mode approach
of mail and web administration with telephone follow-up to non-responders. An option to complete
a web version of the survey was also offered, with a link provided in the cover letter. A $50 prepaid
incentive was provided in the initial mailing. The total sample was 1,150 physicians, 199 were
ineligible, and 442 completed the survey for a response rate of 46 percent. The analysis relies on
39 Captured using the TAXONOMY code from the NPPES and the HCFA specialty Taxonomy code crosswalk from
CMS: http://www.cms.gov/Medicare/Provider-Enrollment-and-
Certification/MedicareProviderSupEnroll/Downloads/TaxonomyCrosswalk.pdf
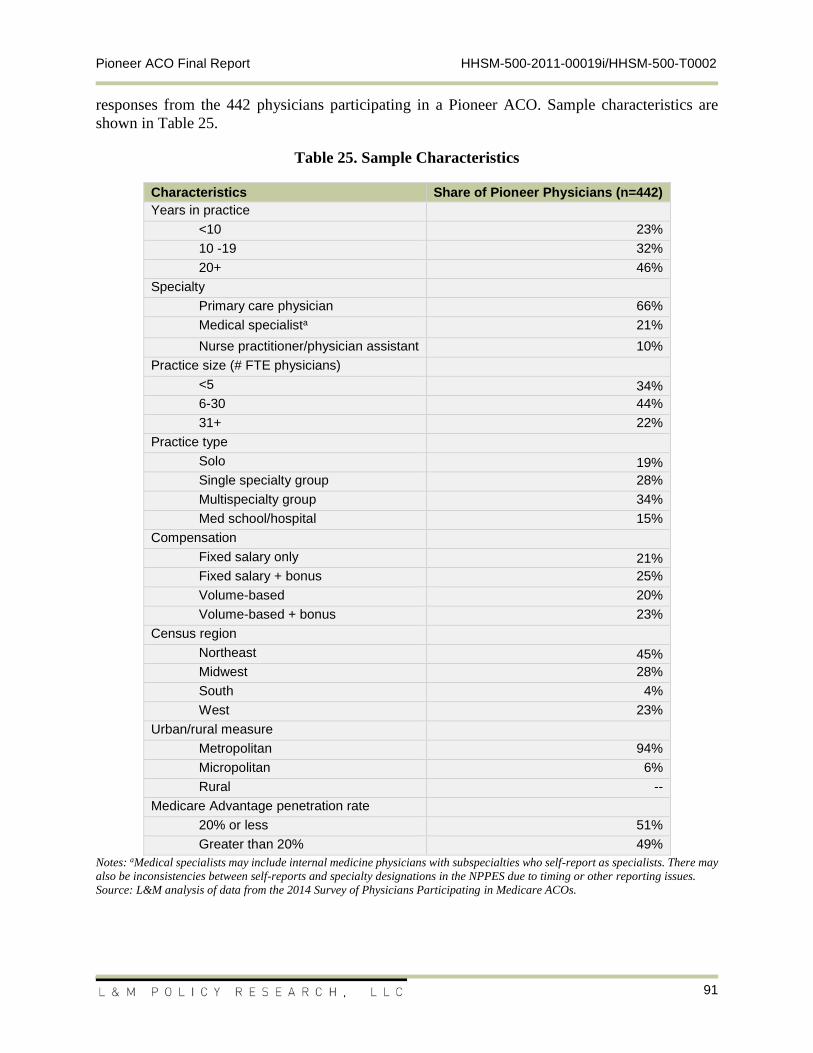
Pioneer ACO Final Report HHSM-500-2011-00019i/HHSM-500-T0002
91
responses from the 442 physicians participating in a Pioneer ACO. Sample characteristics are
shown in Table 25.
Table 25. Sample Characteristics
Characteristics Share of Pioneer Physicians (n=442)
Years in practice
<10 23%
10 -19 32%
20+ 46%
Specialty
Primary care physician 66%
Medical specialista 21%
Nurse practitioner/physician assistant 10%
Practice size (# FTE physicians)
<5 34%
6-30 44%
31+ 22%
Practice type
Solo 19%
Single specialty group 28%
Multispecialty group 34%
Med school/hospital 15%
Compensation
Fixed salary only 21%
Fixed salary + bonus 25%
Volume-based 20%
Volume-based + bonus 23%
Census region
Northeast 45%
Midwest 28%
South 4%
West 23%
Urban/rural measure
Metropolitan 94%
Micropolitan 6%
Rural --
Medicare Advantage penetration rate
20% or less 51%
Greater than 20% 49%
Notes: aMedical specialists may include internal medicine physicians with subspecialties who self-report as specialists. There may
also be inconsistencies between self-reports and specialty designations in the NPPES due to timing or other reporting issues.
Source: L&M analysis of data from the 2014 Survey of Physicians Participating in Medicare ACOs.

Pioneer ACO Final Report HHSM-500-2011-00019i/HHSM-500-T0002
92
APPENDIX B. DATA TABLES
Table 26. Number of Counties in Pioneer ACO Market Areas, 2012-2014
ACO Name
Total Counties in Market in Any PY
Counties in Market in All
PYs
% Counties Continuously in ACO’s Market
Bellin-Thedacare Healthcare Partners 15 14 93%
Physician Health Partners 7 7 100%
University of Michigan 9 9 100%
Renaissance Health Network 7 7 100%
Genesys PHO 5 5 100%
Monarch Healthcare 3 3 100%
Allina Health 6 5 83%
Brown & Toland Physicians 5 5 100%
Montefiore ACO 8 4 50%
Sharp Healthcare System 2 2 100%
Michigan Pioneer ACO 4 4 100%
Banner Health Network 4 2 50%
MACIPA 4 4 100%
OSF Healthcare System 13 9 69%
Fairview Health Systems 12 10 83%
Franciscan Alliance 15 5 33%
Partners Healthcare 11 8 73%
BIDCO 8 8 100%
Beacon, LLC 10 6 60%
Trinity Pioneer ACO, LC 9 8 89%
Atrius Health 8 8 100%
Park Nicollet Health Services 7 7 100%
Seton Health Alliance 5 5 100%
Steward Health Care System 9 7 78%
Healthcare Partners of California 5 5 100%
Healthcare Partners of Nevada 3 3 100%
JSA Medical Group 11 8 73%
PrimeCare Medical Network 5 5 100%
Presbyterian Healthcare Services 10 8 80%
Plus! 10 6 60%
Dartmouth-Hitchcock ACO 15 12 80%
Heritage California ACO 12 10 83%
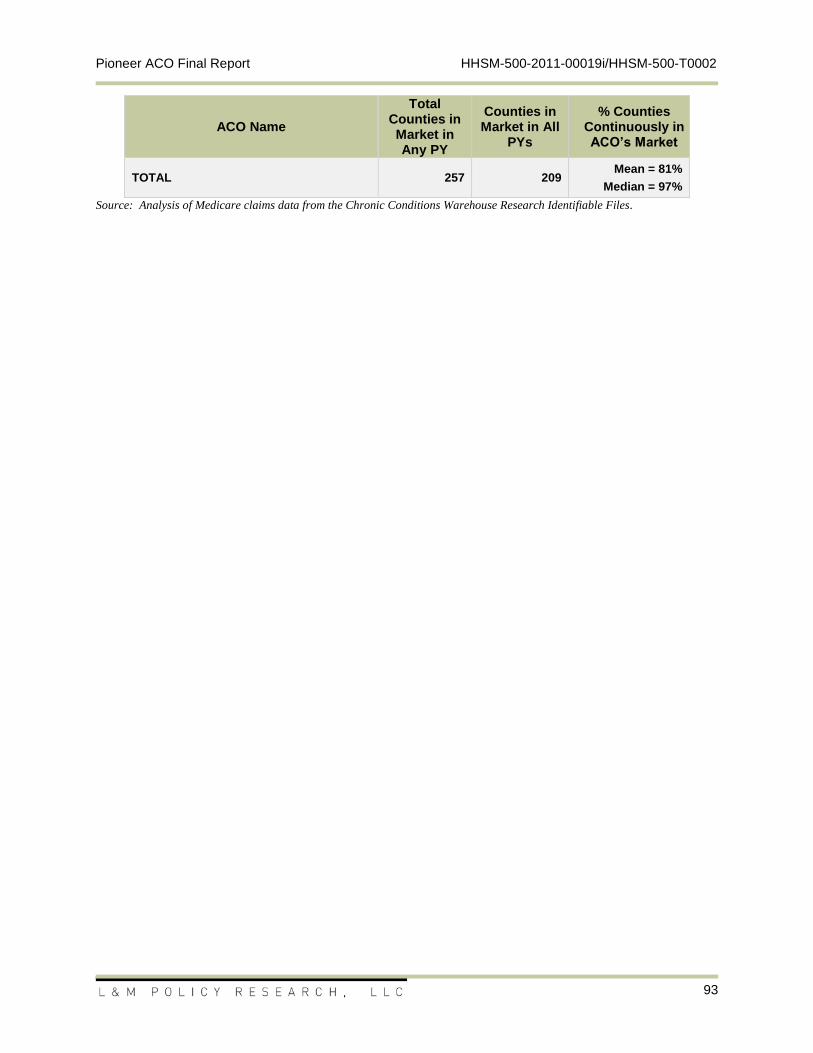
Pioneer ACO Final Report HHSM-500-2011-00019i/HHSM-500-T0002
93
ACO Name
Total Counties in Market in Any PY
Counties in Market in All
PYs
% Counties Continuously in ACO’s Market
TOTAL 257 209 Mean = 81%
Median = 97%
Source: Analysis of Medicare claims data from the Chronic Conditions Warehouse Research Identifiable Files.
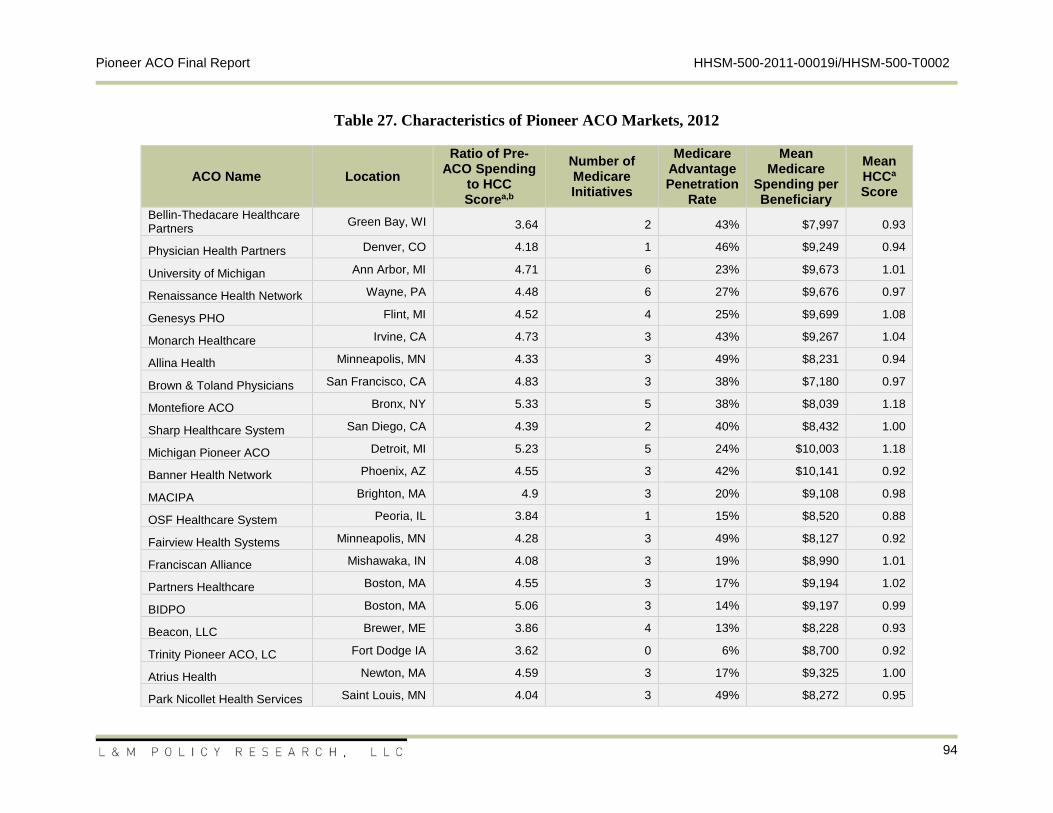
Pioneer ACO Final Report HHSM-500-2011-00019i/HHSM-500-T0002
94
Table 27. Characteristics of Pioneer ACO Markets, 2012
ACO Name Location
Ratio of Pre-ACO Spending
to HCC Scorea,b
Number of Medicare Initiatives
Medicare Advantage Penetration
Rate
Mean Medicare
Spending per Beneficiary
Mean HCCa Score
Bellin-Thedacare Healthcare Partners
Green Bay, WI 3.64 2 43% $7,997 0.93
Physician Health Partners Denver, CO 4.18 1 46% $9,249 0.94
University of Michigan Ann Arbor, MI 4.71 6 23% $9,673 1.01
Renaissance Health Network Wayne, PA 4.48 6 27% $9,676 0.97
Genesys PHO Flint, MI 4.52 4 25% $9,699 1.08
Monarch Healthcare Irvine, CA 4.73 3 43% $9,267 1.04
Allina Health Minneapolis, MN 4.33 3 49% $8,231 0.94
Brown & Toland Physicians San Francisco, CA 4.83 3 38% $7,180 0.97
Montefiore ACO Bronx, NY 5.33 5 38% $8,039 1.18
Sharp Healthcare System San Diego, CA 4.39 2 40% $8,432 1.00
Michigan Pioneer ACO Detroit, MI 5.23 5 24% $10,003 1.18
Banner Health Network Phoenix, AZ 4.55 3 42% $10,141 0.92
MACIPA Brighton, MA 4.9 3 20% $9,108 0.98
OSF Healthcare System Peoria, IL 3.84 1 15% $8,520 0.88
Fairview Health Systems Minneapolis, MN 4.28 3 49% $8,127 0.92
Franciscan Alliance Mishawaka, IN 4.08 3 19% $8,990 1.01
Partners Healthcare Boston, MA 4.55 3 17% $9,194 1.02
BIDPO Boston, MA 5.06 3 14% $9,197 0.99
Beacon, LLC Brewer, ME 3.86 4 13% $8,228 0.93
Trinity Pioneer ACO, LC Fort Dodge IA 3.62 0 6% $8,700 0.92
Atrius Health Newton, MA 4.59 3 17% $9,325 1.00
Park Nicollet Health Services Saint Louis, MN 4.04 3 49% $8,272 0.95
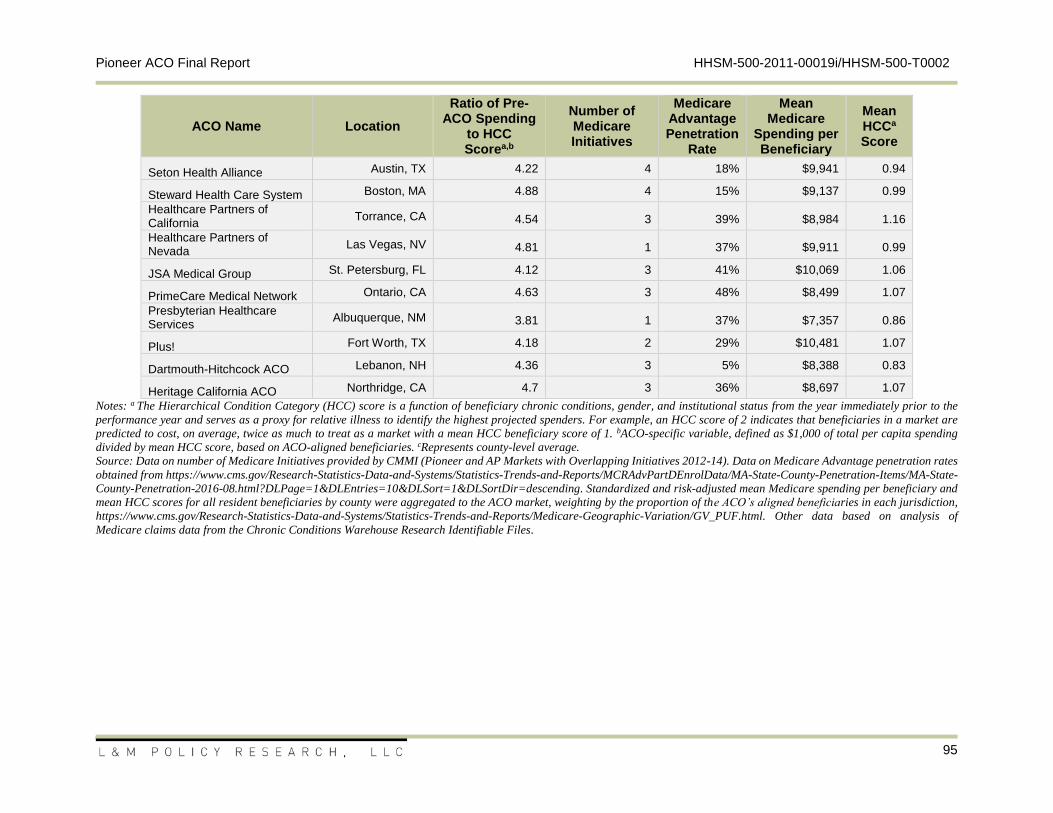
Pioneer ACO Final Report HHSM-500-2011-00019i/HHSM-500-T0002
95
ACO Name Location
Ratio of Pre-ACO Spending
to HCC Scorea,b
Number of Medicare Initiatives
Medicare Advantage Penetration
Rate
Mean Medicare
Spending per Beneficiary
Mean HCCa Score
Seton Health Alliance Austin, TX 4.22 4 18% $9,941 0.94
Steward Health Care System Boston, MA 4.88 4 15% $9,137 0.99
Healthcare Partners of California
Torrance, CA 4.54 3 39% $8,984 1.16
Healthcare Partners of Nevada
Las Vegas, NV 4.81 1 37% $9,911 0.99
JSA Medical Group St. Petersburg, FL 4.12 3 41% $10,069 1.06
PrimeCare Medical Network Ontario, CA 4.63 3 48% $8,499 1.07
Presbyterian Healthcare Services
Albuquerque, NM 3.81 1 37% $7,357 0.86
Plus! Fort Worth, TX 4.18 2 29% $10,481 1.07
Dartmouth-Hitchcock ACO Lebanon, NH 4.36 3 5% $8,388 0.83
Heritage California ACO Northridge, CA 4.7 3 36% $8,697 1.07
Notes: a The Hierarchical Condition Category (HCC) score is a function of beneficiary chronic conditions, gender, and institutional status from the year immediately prior to the
performance year and serves as a proxy for relative illness to identify the highest projected spenders. For example, an HCC score of 2 indicates that beneficiaries in a market are
predicted to cost, on average, twice as much to treat as a market with a mean HCC beneficiary score of 1. bACO-specific variable, defined as $1,000 of total per capita spending
divided by mean HCC score, based on ACO-aligned beneficiaries. cRepresents county-level average.
Source: Data on number of Medicare Initiatives provided by CMMI (Pioneer and AP Markets with Overlapping Initiatives 2012-14). Data on Medicare Advantage penetration rates
obtained from https://www.cms.gov/Research-Statistics-Data-and-Systems/Statistics-Trends-and-Reports/MCRAdvPartDEnrolData/MA-State-County-Penetration-Items/MA-State-
County-Penetration-2016-08.html?DLPage=1&DLEntries=10&DLSort=1&DLSortDir=descending. Standardized and risk-adjusted mean Medicare spending per beneficiary and
mean HCC scores for all resident beneficiaries by county were aggregated to the ACO market, weighting by the proportion of the ACO’s aligned beneficiaries in each jurisdiction,
https://www.cms.gov/Research-Statistics-Data-and-Systems/Statistics-Trends-and-Reports/Medicare-Geographic-Variation/GV_PUF.html. Other data based on analysis of
Medicare claims data from the Chronic Conditions Warehouse Research Identifiable Files.
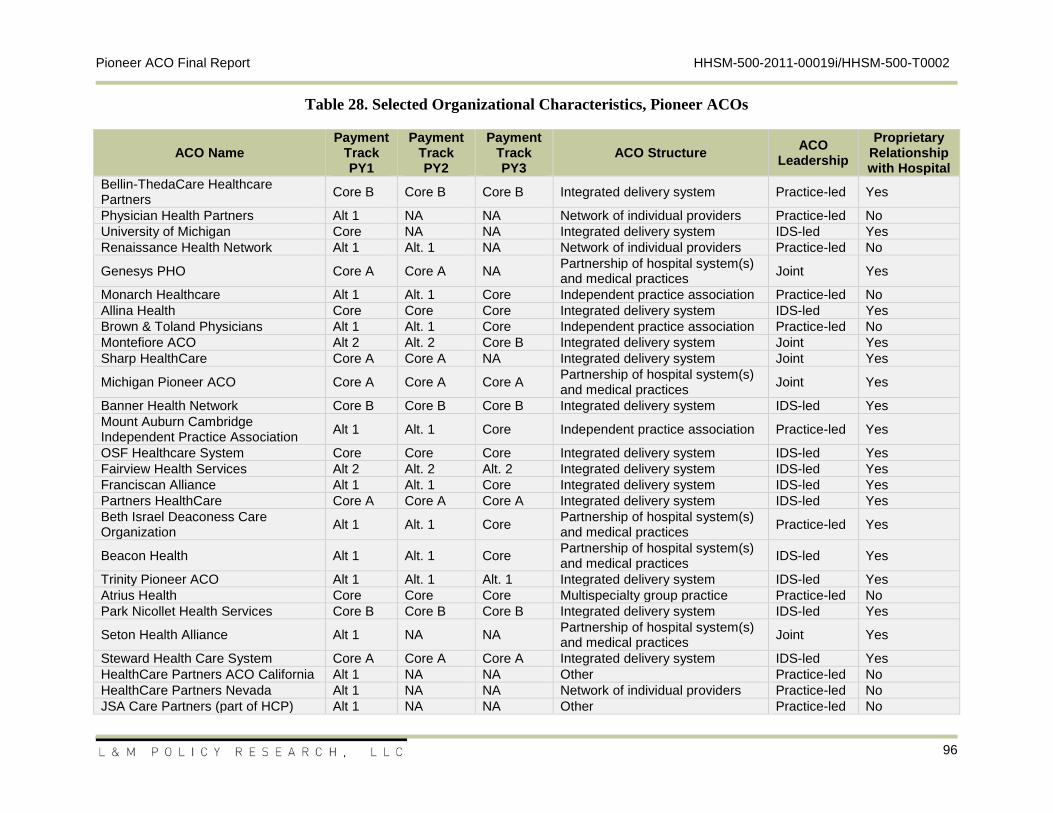
Pioneer ACO Final Report HHSM-500-2011-00019i/HHSM-500-T0002
96
Table 28. Selected Organizational Characteristics, Pioneer ACOs
ACO Name Payment
Track PY1
Payment Track PY2
Payment Track PY3
ACO Structure ACO
Leadership
Proprietary Relationship with Hospital
Bellin-ThedaCare Healthcare Partners
Core B Core B Core B Integrated delivery system Practice-led Yes
Physician Health Partners Alt 1 NA NA Network of individual providers Practice-led No
University of Michigan Core NA NA Integrated delivery system IDS-led Yes
Renaissance Health Network Alt 1 Alt. 1 NA Network of individual providers Practice-led No
Genesys PHO Core A Core A NA Partnership of hospital system(s) and medical practices
Joint Yes
Monarch Healthcare Alt 1 Alt. 1 Core Independent practice association Practice-led No
Allina Health Core Core Core Integrated delivery system IDS-led Yes
Brown & Toland Physicians Alt 1 Alt. 1 Core Independent practice association Practice-led No
Montefiore ACO Alt 2 Alt. 2 Core B Integrated delivery system Joint Yes
Sharp HealthCare Core A Core A NA Integrated delivery system Joint Yes
Michigan Pioneer ACO Core A Core A Core A Partnership of hospital system(s) and medical practices
Joint Yes
Banner Health Network Core B Core B Core B Integrated delivery system IDS-led Yes
Mount Auburn Cambridge Independent Practice Association
Alt 1 Alt. 1 Core Independent practice association Practice-led Yes
OSF Healthcare System Core Core Core Integrated delivery system IDS-led Yes
Fairview Health Services Alt 2 Alt. 2 Alt. 2 Integrated delivery system IDS-led Yes
Franciscan Alliance Alt 1 Alt. 1 Core Integrated delivery system IDS-led Yes
Partners HealthCare Core A Core A Core A Integrated delivery system IDS-led Yes
Beth Israel Deaconess Care Organization
Alt 1 Alt. 1 Core Partnership of hospital system(s) and medical practices
Practice-led Yes
Beacon Health Alt 1 Alt. 1 Core Partnership of hospital system(s) and medical practices
IDS-led Yes
Trinity Pioneer ACO Alt 1 Alt. 1 Alt. 1 Integrated delivery system IDS-led Yes
Atrius Health Core Core Core Multispecialty group practice Practice-led No
Park Nicollet Health Services Core B Core B Core B Integrated delivery system IDS-led Yes
Seton Health Alliance Alt 1 NA NA Partnership of hospital system(s) and medical practices
Joint Yes
Steward Health Care System Core A Core A Core A Integrated delivery system IDS-led Yes
HealthCare Partners ACO California Alt 1 NA NA Other Practice-led No
HealthCare Partners Nevada Alt 1 NA NA Network of individual providers Practice-led No
JSA Care Partners (part of HCP) Alt 1 NA NA Other Practice-led No
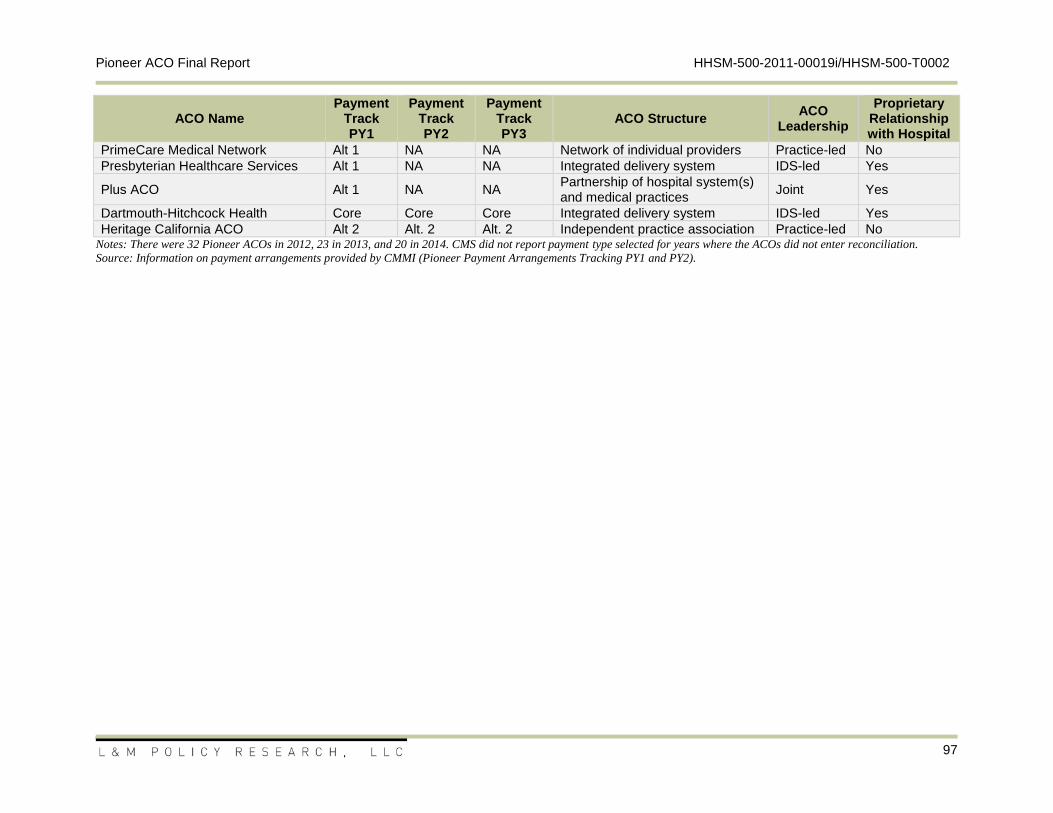
Pioneer ACO Final Report HHSM-500-2011-00019i/HHSM-500-T0002
97
ACO Name Payment
Track PY1
Payment Track PY2
Payment Track PY3
ACO Structure ACO
Leadership
Proprietary Relationship with Hospital
PrimeCare Medical Network Alt 1 NA NA Network of individual providers Practice-led No
Presbyterian Healthcare Services Alt 1 NA NA Integrated delivery system IDS-led Yes
Plus ACO Alt 1 NA NA Partnership of hospital system(s) and medical practices
Joint Yes
Dartmouth-Hitchcock Health Core Core Core Integrated delivery system IDS-led Yes
Heritage California ACO Alt 2 Alt. 2 Alt. 2 Independent practice association Practice-led No Notes: There were 32 Pioneer ACOs in 2012, 23 in 2013, and 20 in 2014. CMS did not report payment type selected for years where the ACOs did not enter reconciliation.
Source: Information on payment arrangements provided by CMMI (Pioneer Payment Arrangements Tracking PY1 and PY2).
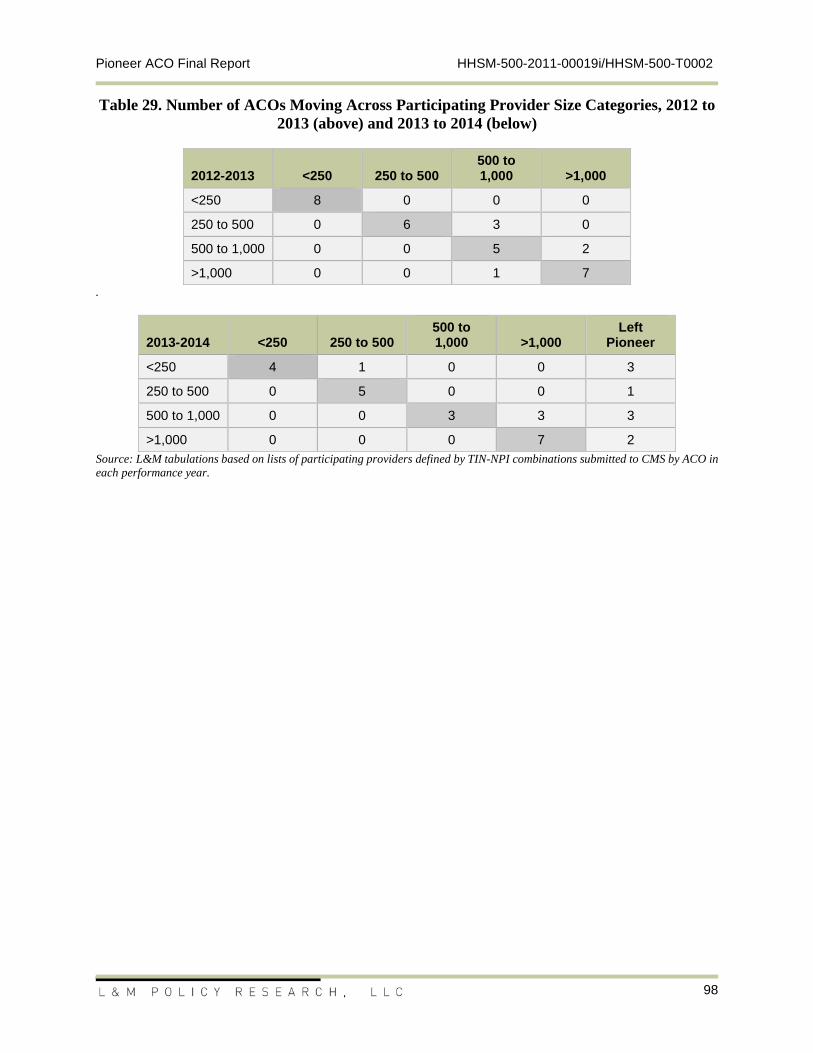
Pioneer ACO Final Report HHSM-500-2011-00019i/HHSM-500-T0002
98
Table 29. Number of ACOs Moving Across Participating Provider Size Categories, 2012 to
2013 (above) and 2013 to 2014 (below)
2012-2013 <250 250 to 500 500 to 1,000 >1,000
<250 8 0 0 0
250 to 500 0 6 3 0
500 to 1,000 0 0 5 2
>1,000 0 0 1 7
.
2013-2014 <250 250 to 500 500 to 1,000 >1,000
Left Pioneer
<250 4 1 0 0 3
250 to 500 0 5 0 0 1
500 to 1,000 0 0 3 3 3
>1,000 0 0 0 7 2
Source: L&M tabulations based on lists of participating providers defined by TIN-NPI combinations submitted to CMS by ACO in
each performance year.
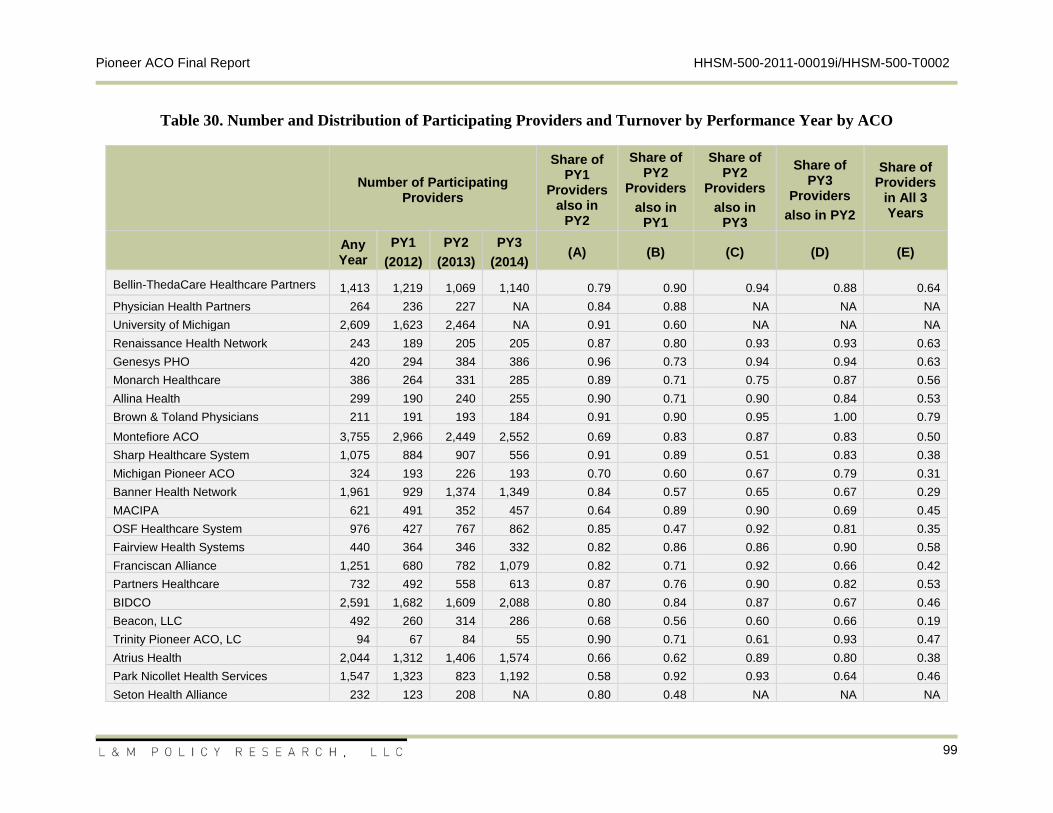
Pioneer ACO Final Report HHSM-500-2011-00019i/HHSM-500-T0002
99
Table 30. Number and Distribution of Participating Providers and Turnover by Performance Year by ACO
Number of Participating
Providers
Share of PY1
Providers also in
PY2
Share of PY2
Providers
also in PY1
Share of PY2
Providers
also in PY3
Share of PY3
Providers
also in PY2
Share of Providers
in All 3 Years
Any Year
PY1
(2012)
PY2
(2013)
PY3
(2014) (A) (B) (C) (D) (E)
Bellin-ThedaCare Healthcare Partners 1,413 1,219 1,069 1,140 0.79 0.90 0.94 0.88 0.64
Physician Health Partners 264 236 227 NA 0.84 0.88 NA NA NA
University of Michigan 2,609 1,623 2,464 NA 0.91 0.60 NA NA NA
Renaissance Health Network 243 189 205 205 0.87 0.80 0.93 0.93 0.63
Genesys PHO 420 294 384 386 0.96 0.73 0.94 0.94 0.63
Monarch Healthcare 386 264 331 285 0.89 0.71 0.75 0.87 0.56
Allina Health 299 190 240 255 0.90 0.71 0.90 0.84 0.53
Brown & Toland Physicians 211 191 193 184 0.91 0.90 0.95 1.00 0.79
Montefiore ACO 3,755 2,966 2,449 2,552 0.69 0.83 0.87 0.83 0.50
Sharp Healthcare System 1,075 884 907 556 0.91 0.89 0.51 0.83 0.38
Michigan Pioneer ACO 324 193 226 193 0.70 0.60 0.67 0.79 0.31
Banner Health Network 1,961 929 1,374 1,349 0.84 0.57 0.65 0.67 0.29
MACIPA 621 491 352 457 0.64 0.89 0.90 0.69 0.45
OSF Healthcare System 976 427 767 862 0.85 0.47 0.92 0.81 0.35
Fairview Health Systems 440 364 346 332 0.82 0.86 0.86 0.90 0.58
Franciscan Alliance 1,251 680 782 1,079 0.82 0.71 0.92 0.66 0.42
Partners Healthcare 732 492 558 613 0.87 0.76 0.90 0.82 0.53
BIDCO 2,591 1,682 1,609 2,088 0.80 0.84 0.87 0.67 0.46
Beacon, LLC 492 260 314 286 0.68 0.56 0.60 0.66 0.19
Trinity Pioneer ACO, LC 94 67 84 55 0.90 0.71 0.61 0.93 0.47
Atrius Health 2,044 1,312 1,406 1,574 0.66 0.62 0.89 0.80 0.38
Park Nicollet Health Services 1,547 1,323 823 1,192 0.58 0.92 0.93 0.64 0.46
Seton Health Alliance 232 123 208 NA 0.80 0.48 NA NA NA
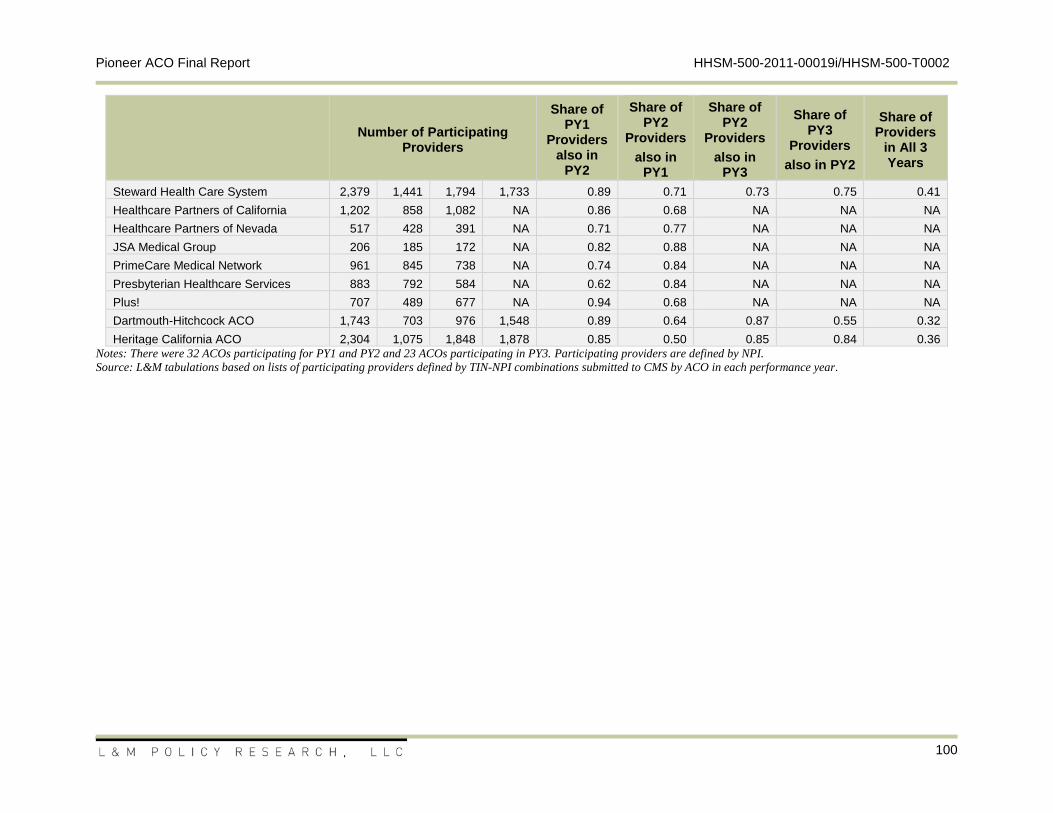
Pioneer ACO Final Report HHSM-500-2011-00019i/HHSM-500-T0002
100
Number of Participating
Providers
Share of PY1
Providers also in
PY2
Share of PY2
Providers
also in PY1
Share of PY2
Providers
also in PY3
Share of PY3
Providers
also in PY2
Share of Providers
in All 3 Years
Steward Health Care System 2,379 1,441 1,794 1,733 0.89 0.71 0.73 0.75 0.41
Healthcare Partners of California 1,202 858 1,082 NA 0.86 0.68 NA NA NA
Healthcare Partners of Nevada 517 428 391 NA 0.71 0.77 NA NA NA
JSA Medical Group 206 185 172 NA 0.82 0.88 NA NA NA
PrimeCare Medical Network 961 845 738 NA 0.74 0.84 NA NA NA
Presbyterian Healthcare Services 883 792 584 NA 0.62 0.84 NA NA NA
Plus! 707 489 677 NA 0.94 0.68 NA NA NA
Dartmouth-Hitchcock ACO 1,743 703 976 1,548 0.89 0.64 0.87 0.55 0.32
Heritage California ACO 2,304 1,075 1,848 1,878 0.85 0.50 0.85 0.84 0.36
Notes: There were 32 ACOs participating for PY1 and PY2 and 23 ACOs participating in PY3. Participating providers are defined by NPI.
Source: L&M tabulations based on lists of participating providers defined by TIN-NPI combinations submitted to CMS by ACO in each performance year.
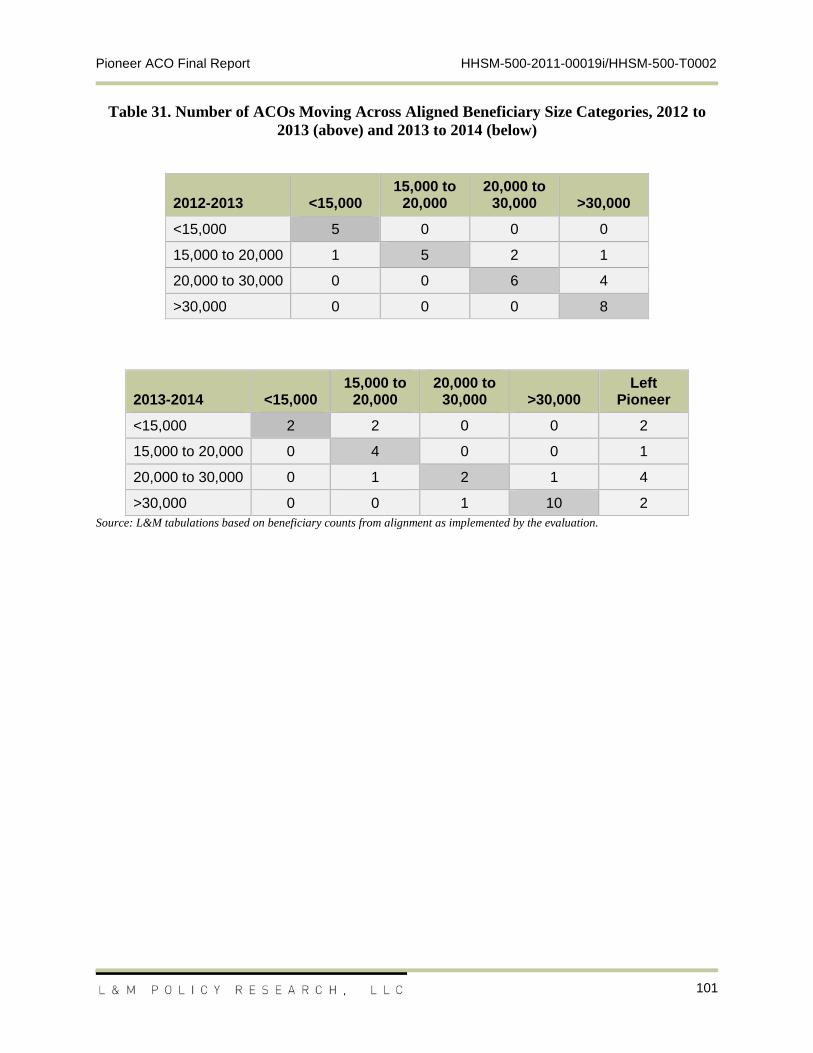
Pioneer ACO Final Report HHSM-500-2011-00019i/HHSM-500-T0002
101
Table 31. Number of ACOs Moving Across Aligned Beneficiary Size Categories, 2012 to
2013 (above) and 2013 to 2014 (below)
2012-2013 <15,000 15,000 to
20,000 20,000 to
30,000 >30,000
<15,000 5 0 0 0
15,000 to 20,000 1 5 2 1
20,000 to 30,000 0 0 6 4
>30,000 0 0 0 8
2013-2014 <15,000 15,000 to
20,000 20,000 to
30,000 >30,000 Left
Pioneer
<15,000 2 2 0 0 2
15,000 to 20,000 0 4 0 0 1
20,000 to 30,000 0 1 2 1 4
>30,000 0 0 1 10 2
Source: L&M tabulations based on beneficiary counts from alignment as implemented by the evaluation.
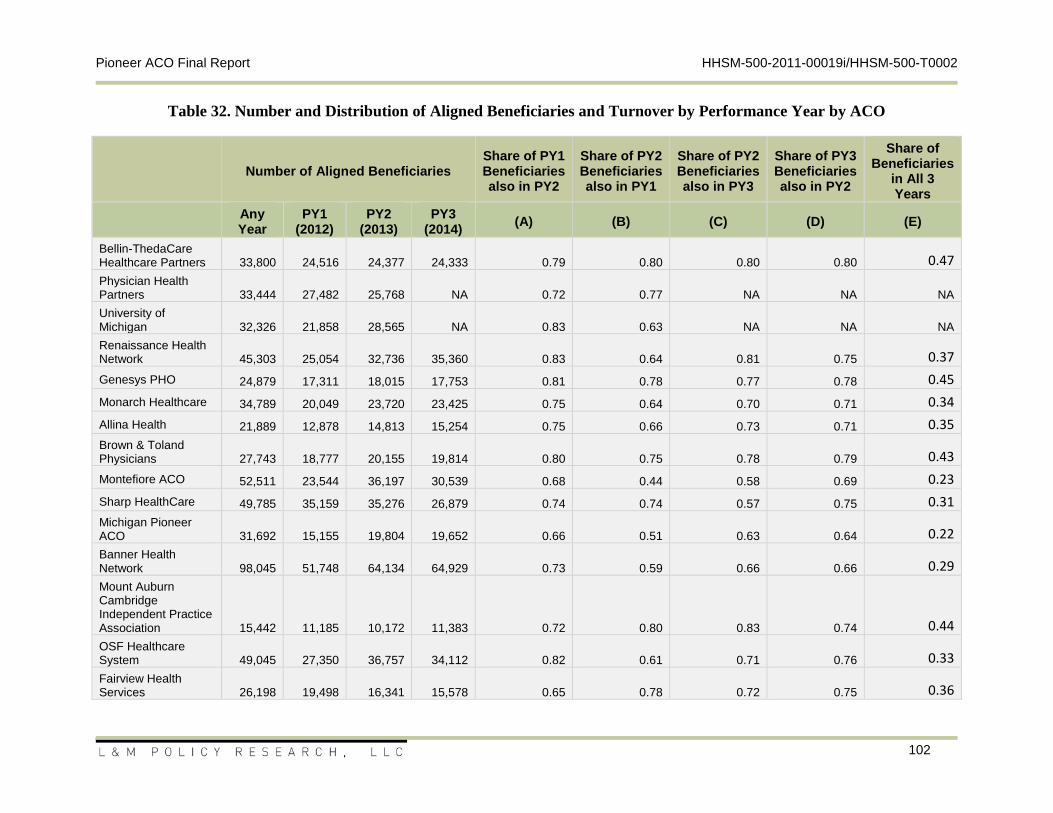
Pioneer ACO Final Report HHSM-500-2011-00019i/HHSM-500-T0002
102
Table 32. Number and Distribution of Aligned Beneficiaries and Turnover by Performance Year by ACO
Number of Aligned Beneficiaries Share of PY1 Beneficiaries also in PY2
Share of PY2 Beneficiaries also in PY1
Share of PY2 Beneficiaries also in PY3
Share of PY3 Beneficiaries also in PY2
Share of Beneficiaries
in All 3 Years
Any Year
PY1 (2012)
PY2 (2013)
PY3 (2014)
(A) (B) (C) (D) (E)
Bellin-ThedaCare Healthcare Partners 33,800 24,516 24,377 24,333 0.79 0.80 0.80 0.80 0.47
Physician Health Partners 33,444 27,482 25,768 NA 0.72 0.77 NA NA NA
University of Michigan 32,326 21,858 28,565 NA 0.83 0.63 NA NA NA
Renaissance Health Network 45,303 25,054 32,736 35,360 0.83 0.64 0.81 0.75 0.37
Genesys PHO 24,879 17,311 18,015 17,753 0.81 0.78 0.77 0.78 0.45
Monarch Healthcare 34,789 20,049 23,720 23,425 0.75 0.64 0.70 0.71 0.34
Allina Health 21,889 12,878 14,813 15,254 0.75 0.66 0.73 0.71 0.35
Brown & Toland Physicians 27,743 18,777 20,155 19,814 0.80 0.75 0.78 0.79 0.43
Montefiore ACO 52,511 23,544 36,197 30,539 0.68 0.44 0.58 0.69 0.23
Sharp HealthCare 49,785 35,159 35,276 26,879 0.74 0.74 0.57 0.75 0.31
Michigan Pioneer ACO 31,692 15,155 19,804 19,652 0.66 0.51 0.63 0.64 0.22
Banner Health Network 98,045 51,748 64,134 64,929 0.73 0.59 0.66 0.66 0.29
Mount Auburn Cambridge Independent Practice Association 15,442 11,185 10,172 11,383 0.72 0.80 0.83 0.74 0.44
OSF Healthcare System 49,045 27,350 36,757 34,112 0.82 0.61 0.71 0.76 0.33
Fairview Health Services 26,198 19,498 16,341 15,578 0.65 0.78 0.72 0.75 0.36
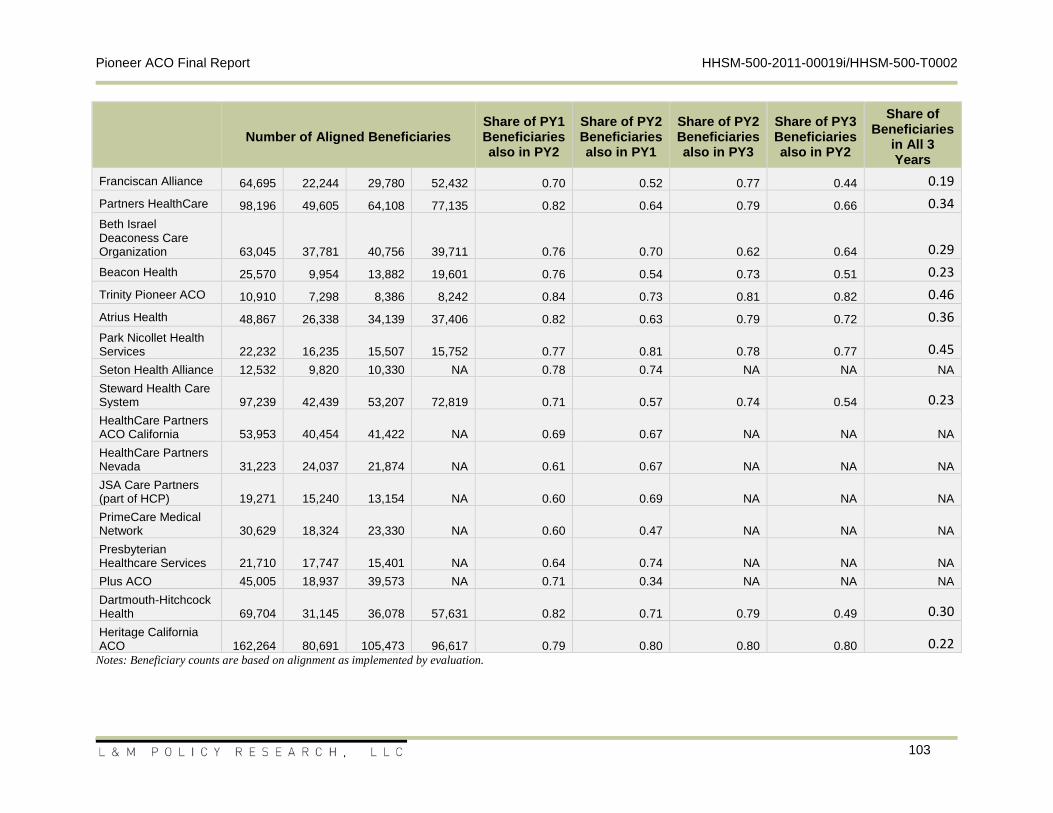
Pioneer ACO Final Report HHSM-500-2011-00019i/HHSM-500-T0002
103
Number of Aligned Beneficiaries Share of PY1 Beneficiaries also in PY2
Share of PY2 Beneficiaries also in PY1
Share of PY2 Beneficiaries also in PY3
Share of PY3 Beneficiaries also in PY2
Share of Beneficiaries
in All 3 Years
Franciscan Alliance 64,695 22,244 29,780 52,432 0.70 0.52 0.77 0.44 0.19
Partners HealthCare 98,196 49,605 64,108 77,135 0.82 0.64 0.79 0.66 0.34
Beth Israel Deaconess Care Organization 63,045 37,781 40,756 39,711 0.76 0.70 0.62 0.64 0.29
Beacon Health 25,570 9,954 13,882 19,601 0.76 0.54 0.73 0.51 0.23
Trinity Pioneer ACO 10,910 7,298 8,386 8,242 0.84 0.73 0.81 0.82 0.46
Atrius Health 48,867 26,338 34,139 37,406 0.82 0.63 0.79 0.72 0.36
Park Nicollet Health Services 22,232 16,235 15,507 15,752 0.77 0.81 0.78 0.77 0.45
Seton Health Alliance 12,532 9,820 10,330 NA 0.78 0.74 NA NA NA
Steward Health Care System 97,239 42,439 53,207 72,819 0.71 0.57 0.74 0.54 0.23
HealthCare Partners ACO California 53,953 40,454 41,422 NA 0.69 0.67 NA NA NA
HealthCare Partners Nevada 31,223 24,037 21,874 NA 0.61 0.67 NA NA NA
JSA Care Partners (part of HCP) 19,271 15,240 13,154 NA 0.60 0.69 NA NA NA
PrimeCare Medical Network 30,629 18,324 23,330 NA 0.60 0.47 NA NA NA
Presbyterian Healthcare Services 21,710 17,747 15,401 NA 0.64 0.74 NA NA NA
Plus ACO 45,005 18,937 39,573 NA 0.71 0.34 NA NA NA
Dartmouth-Hitchcock Health 69,704 31,145 36,078 57,631 0.82 0.71 0.79 0.49 0.30
Heritage California ACO 162,264 80,691 105,473 96,617 0.79 0.80 0.80 0.80 0.22
Notes: Beneficiary counts are based on alignment as implemented by evaluation.
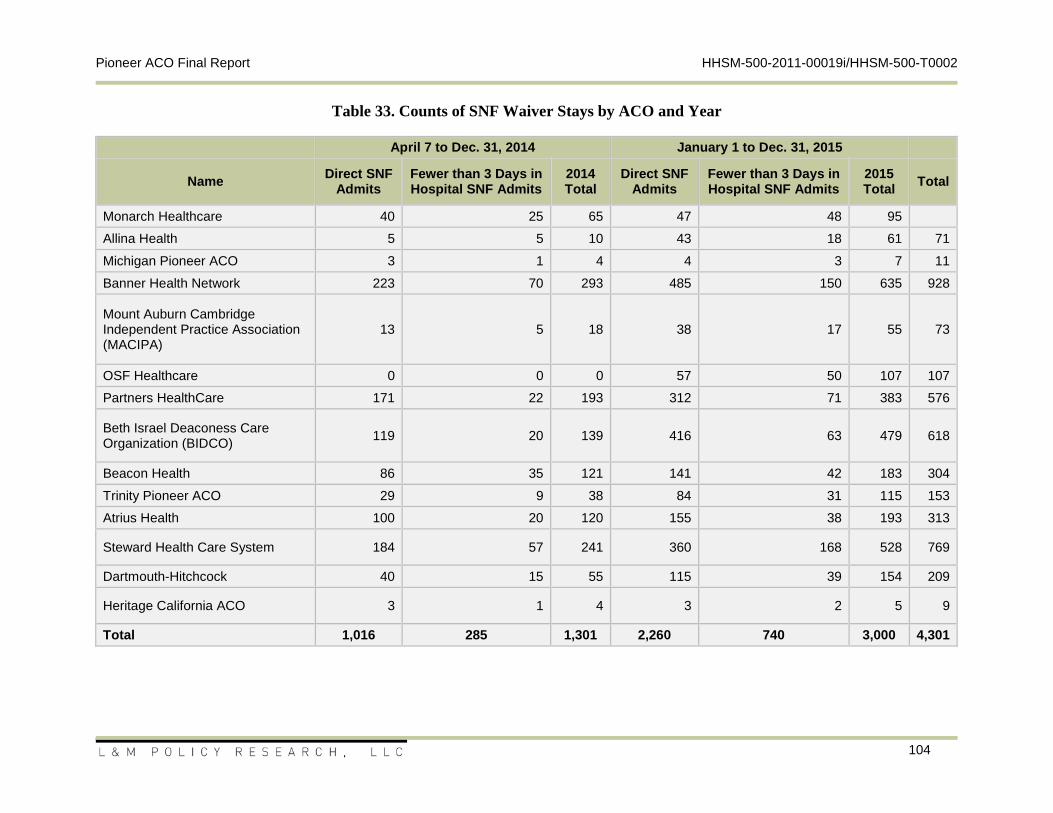
Pioneer ACO Final Report HHSM-500-2011-00019i/HHSM-500-T0002
104
Table 33. Counts of SNF Waiver Stays by ACO and Year
April 7 to Dec. 31, 2014 January 1 to Dec. 31, 2015
Name Direct SNF
Admits Fewer than 3 Days in Hospital SNF Admits
2014 Total
Direct SNF Admits
Fewer than 3 Days in Hospital SNF Admits
2015 Total
Total
Monarch Healthcare 40 25 65 47 48 95
Allina Health 5 5 10 43 18 61 71
Michigan Pioneer ACO 3 1 4 4 3 7 11
Banner Health Network 223 70 293 485 150 635 928
Mount Auburn Cambridge Independent Practice Association (MACIPA)
13 5 18 38 17 55 73
OSF Healthcare 0 0 0 57 50 107 107
Partners HealthCare 171 22 193 312 71 383 576
Beth Israel Deaconess Care Organization (BIDCO)
119 20 139 416 63 479 618
Beacon Health 86 35 121 141 42 183 304
Trinity Pioneer ACO 29 9 38 84 31 115 153
Atrius Health 100 20 120 155 38 193 313
Steward Health Care System 184 57 241 360 168 528 769
Dartmouth-Hitchcock 40 15 55 115 39 154 209
Heritage California ACO 3 1 4 3 2 5 9
Total 1,016 285 1,301 2,260 740 3,000 4,301
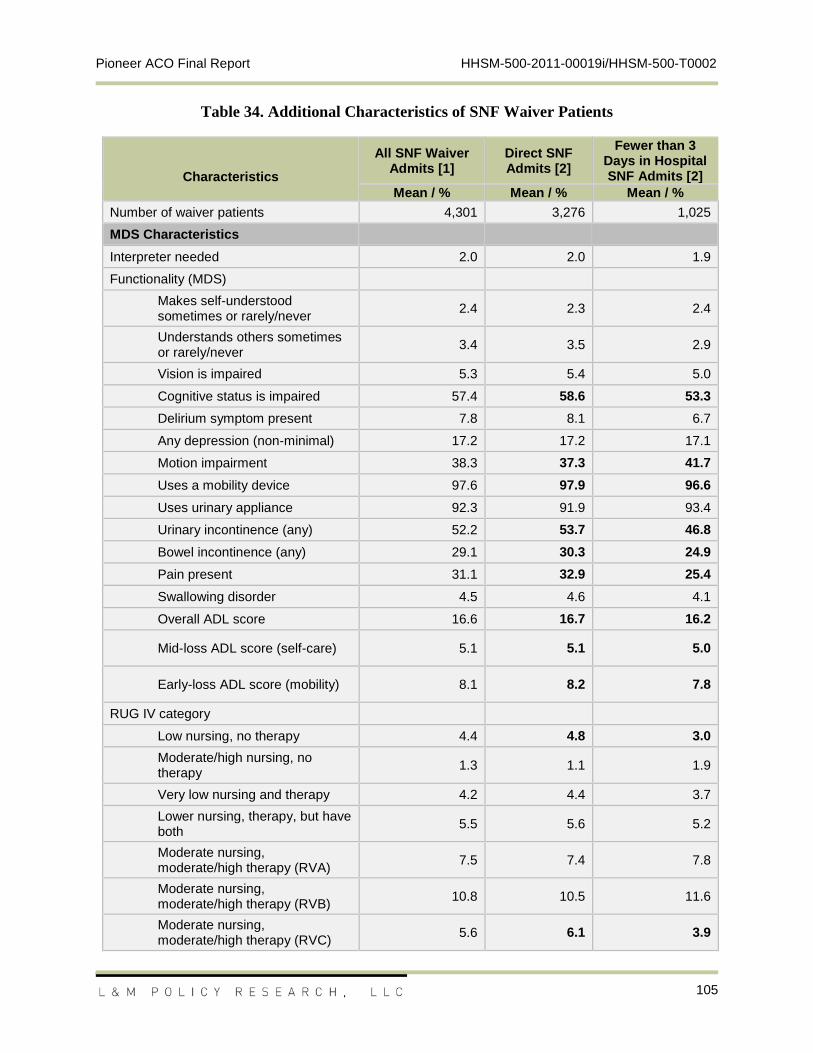
Pioneer ACO Final Report HHSM-500-2011-00019i/HHSM-500-T0002
105
Table 34. Additional Characteristics of SNF Waiver Patients
Characteristics
All SNF Waiver Admits [1]
Direct SNF Admits [2]
Fewer than 3 Days in Hospital SNF Admits [2]
Mean / % Mean / % Mean / %
Number of waiver patients 4,301 3,276 1,025
MDS Characteristics
Interpreter needed 2.0 2.0 1.9
Functionality (MDS)
Makes self-understood sometimes or rarely/never
2.4 2.3 2.4
Understands others sometimes or rarely/never
3.4 3.5 2.9
Vision is impaired 5.3 5.4 5.0
Cognitive status is impaired 57.4 58.6 53.3
Delirium symptom present 7.8 8.1 6.7
Any depression (non-minimal) 17.2 17.2 17.1
Motion impairment 38.3 37.3 41.7
Uses a mobility device 97.6 97.9 96.6
Uses urinary appliance 92.3 91.9 93.4
Urinary incontinence (any) 52.2 53.7 46.8
Bowel incontinence (any) 29.1 30.3 24.9
Pain present 31.1 32.9 25.4
Swallowing disorder 4.5 4.6 4.1
Overall ADL score 16.6 16.7 16.2
Mid-loss ADL score (self-care) 5.1 5.1 5.0
Early-loss ADL score (mobility) 8.1 8.2 7.8
RUG IV category
Low nursing, no therapy 4.4 4.8 3.0
Moderate/high nursing, no therapy
1.3 1.1 1.9
Very low nursing and therapy 4.2 4.4 3.7
Lower nursing, therapy, but have both
5.5 5.6 5.2
Moderate nursing, moderate/high therapy (RVA)
7.5 7.4 7.8
Moderate nursing, moderate/high therapy (RVB)
10.8 10.5 11.6
Moderate nursing, moderate/high therapy (RVC)
5.6 6.1 3.9
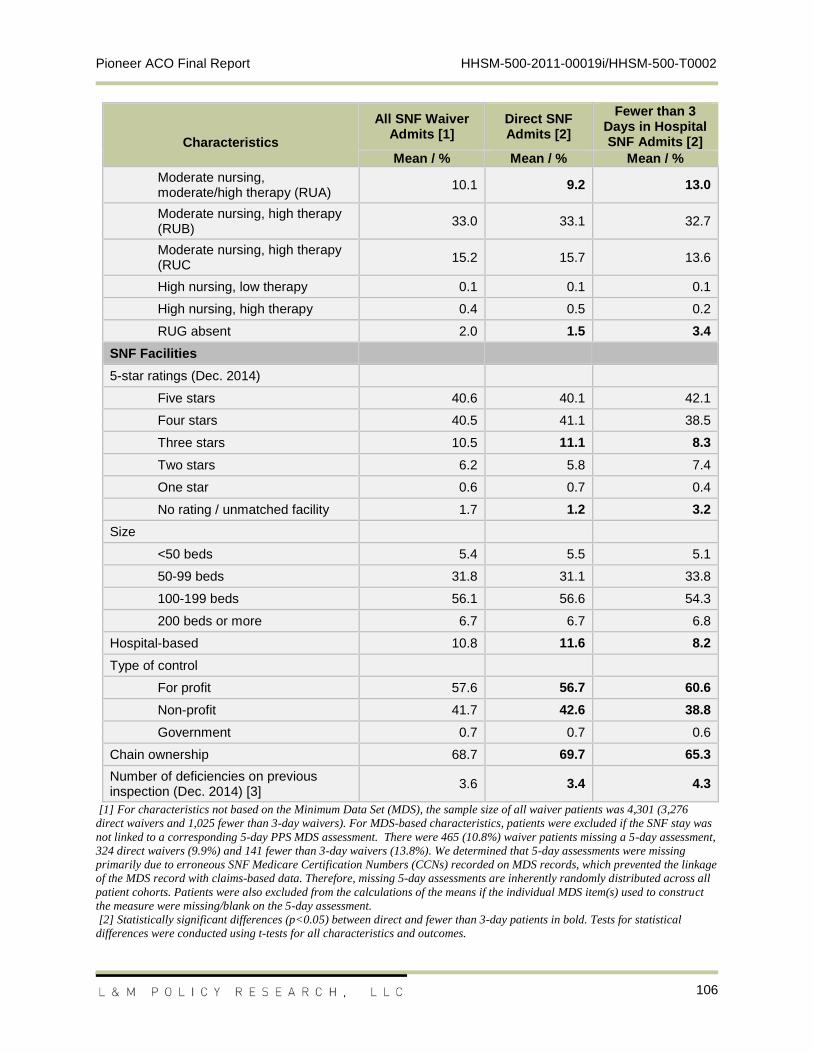
Pioneer ACO Final Report HHSM-500-2011-00019i/HHSM-500-T0002
106
Characteristics
All SNF Waiver Admits [1]
Direct SNF Admits [2]
Fewer than 3 Days in Hospital SNF Admits [2]
Mean / % Mean / % Mean / %
Moderate nursing, moderate/high therapy (RUA)
10.1 9.2 13.0
Moderate nursing, high therapy (RUB)
33.0 33.1 32.7
Moderate nursing, high therapy (RUC
15.2 15.7 13.6
High nursing, low therapy 0.1 0.1 0.1
High nursing, high therapy 0.4 0.5 0.2
RUG absent 2.0 1.5 3.4
SNF Facilities
5-star ratings (Dec. 2014)
Five stars 40.6 40.1 42.1
Four stars 40.5 41.1 38.5
Three stars 10.5 11.1 8.3
Two stars 6.2 5.8 7.4
One star 0.6 0.7 0.4
No rating / unmatched facility 1.7 1.2 3.2
Size
<50 beds 5.4 5.5 5.1
50-99 beds 31.8 31.1 33.8
100-199 beds 56.1 56.6 54.3
200 beds or more 6.7 6.7 6.8
Hospital-based 10.8 11.6 8.2
Type of control
For profit 57.6 56.7 60.6
Non-profit 41.7 42.6 38.8
Government 0.7 0.7 0.6
Chain ownership 68.7 69.7 65.3
Number of deficiencies on previous inspection (Dec. 2014) [3]
3.6 3.4 4.3
[1] For characteristics not based on the Minimum Data Set (MDS), the sample size of all waiver patients was 4,301 (3,276
direct waivers and 1,025 fewer than 3-day waivers). For MDS-based characteristics, patients were excluded if the SNF stay was
not linked to a corresponding 5-day PPS MDS assessment. There were 465 (10.8%) waiver patients missing a 5-day assessment,
324 direct waivers (9.9%) and 141 fewer than 3-day waivers (13.8%). We determined that 5-day assessments were missing
primarily due to erroneous SNF Medicare Certification Numbers (CCNs) recorded on MDS records, which prevented the linkage
of the MDS record with claims-based data. Therefore, missing 5-day assessments are inherently randomly distributed across all
patient cohorts. Patients were also excluded from the calculations of the means if the individual MDS item(s) used to construct
the measure were missing/blank on the 5-day assessment.
[2] Statistically significant differences (p<0.05) between direct and fewer than 3-day patients in bold. Tests for statistical
differences were conducted using t-tests for all characteristics and outcomes.

Pioneer ACO Final Report HHSM-500-2011-00019i/HHSM-500-T0002
107
[3] To be part of the Medicare and Medicaid programs, nursing homes must meet certain requirements set by Congress. CMS,
with state and local governments, do health and fire safety inspections of these nursing homes and investigate complaints about
nursing home care. This variable is the total number of deficiencies (from inspector surveys and complaints) corresponding to
the most recent nursing home inspection prior to December 31, 2014, as reported on the CMS Nursing Home Compare website.
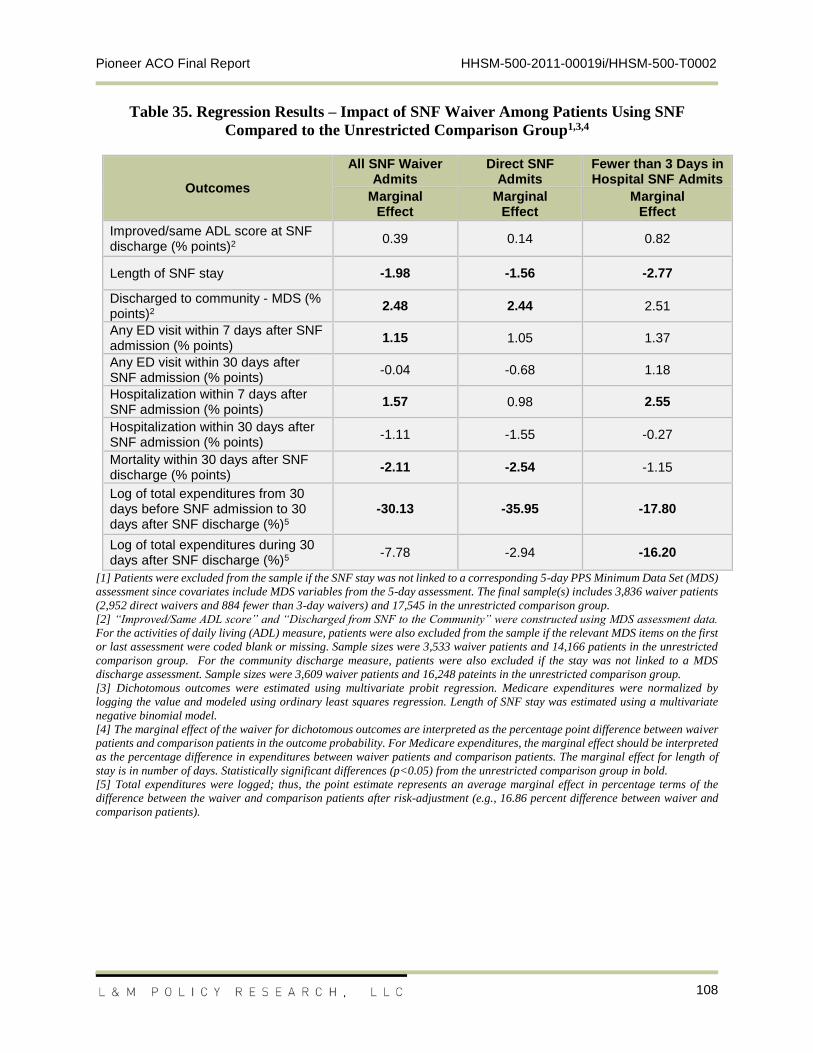
Pioneer ACO Final Report HHSM-500-2011-00019i/HHSM-500-T0002
108
Table 35. Regression Results – Impact of SNF Waiver Among Patients Using SNF
Compared to the Unrestricted Comparison Group1,3,4
Outcomes
All SNF Waiver Admits
Direct SNF Admits
Fewer than 3 Days in Hospital SNF Admits
Marginal Effect
Marginal Effect
Marginal Effect
Improved/same ADL score at SNF discharge (% points)2 0.39 0.14 0.82
Length of SNF stay -1.98 -1.56 -2.77
Discharged to community - MDS (% points)2 2.48 2.44 2.51
Any ED visit within 7 days after SNF admission (% points)
1.15 1.05 1.37
Any ED visit within 30 days after SNF admission (% points)
-0.04 -0.68 1.18
Hospitalization within 7 days after SNF admission (% points)
1.57 0.98 2.55
Hospitalization within 30 days after SNF admission (% points)
-1.11 -1.55 -0.27
Mortality within 30 days after SNF discharge (% points)
-2.11 -2.54 -1.15
Log of total expenditures from 30 days before SNF admission to 30 days after SNF discharge (%)5
-30.13 -35.95 -17.80
Log of total expenditures during 30 days after SNF discharge (%)5 -7.78 -2.94 -16.20
[1] Patients were excluded from the sample if the SNF stay was not linked to a corresponding 5-day PPS Minimum Data Set (MDS)
assessment since covariates include MDS variables from the 5-day assessment. The final sample(s) includes 3,836 waiver patients
(2,952 direct waivers and 884 fewer than 3-day waivers) and 17,545 in the unrestricted comparison group.
[2] “Improved/Same ADL score” and “Discharged from SNF to the Community” were constructed using MDS assessment data.
For the activities of daily living (ADL) measure, patients were also excluded from the sample if the relevant MDS items on the first
or last assessment were coded blank or missing. Sample sizes were 3,533 waiver patients and 14,166 patients in the unrestricted
comparison group. For the community discharge measure, patients were also excluded if the stay was not linked to a MDS
discharge assessment. Sample sizes were 3,609 waiver patients and 16,248 pateints in the unrestricted comparison group.
[3] Dichotomous outcomes were estimated using multivariate probit regression. Medicare expenditures were normalized by
logging the value and modeled using ordinary least squares regression. Length of SNF stay was estimated using a multivariate
negative binomial model.
[4] The marginal effect of the waiver for dichotomous outcomes are interpreted as the percentage point difference between waiver
patients and comparison patients in the outcome probability. For Medicare expenditures, the marginal effect should be interpreted
as the percentage difference in expenditures between waiver patients and comparison patients. The marginal effect for length of
stay is in number of days. Statistically significant differences (p<0.05) from the unrestricted comparison group in bold.
[5] Total expenditures were logged; thus, the point estimate represents an average marginal effect in percentage terms of the
difference between the waiver and comparison patients after risk-adjustment (e.g., 16.86 percent difference between waiver and
comparison patients).
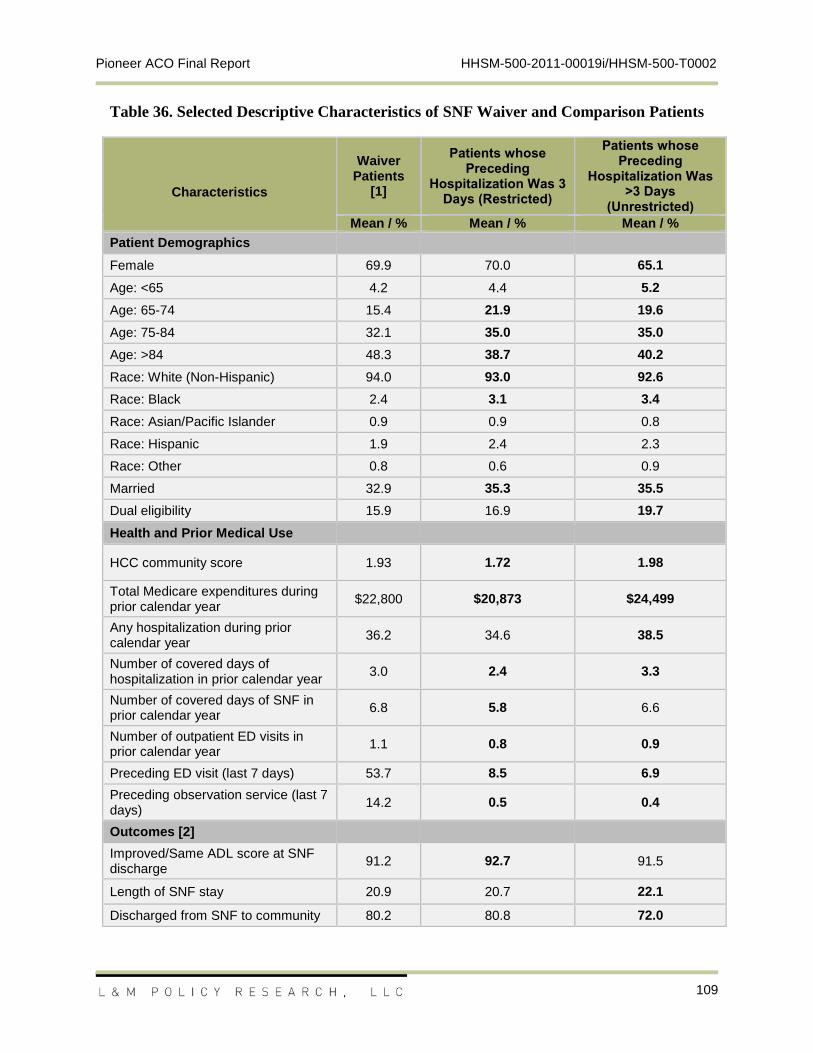
Pioneer ACO Final Report HHSM-500-2011-00019i/HHSM-500-T0002
109
Table 36. Selected Descriptive Characteristics of SNF Waiver and Comparison Patients
Characteristics
Waiver Patients
[1]
Patients whose Preceding
Hospitalization Was 3 Days (Restricted)
Patients whose Preceding
Hospitalization Was >3 Days
(Unrestricted)
Mean / % Mean / % Mean / %
Patient Demographics
Female 69.9 70.0 65.1
Age: <65 4.2 4.4 5.2
Age: 65-74 15.4 21.9 19.6
Age: 75-84 32.1 35.0 35.0
Age: >84 48.3 38.7 40.2
Race: White (Non-Hispanic) 94.0 93.0 92.6
Race: Black 2.4 3.1 3.4
Race: Asian/Pacific Islander 0.9 0.9 0.8
Race: Hispanic 1.9 2.4 2.3
Race: Other 0.8 0.6 0.9
Married 32.9 35.3 35.5
Dual eligibility 15.9 16.9 19.7
Health and Prior Medical Use
HCC community score 1.93 1.72 1.98
Total Medicare expenditures during prior calendar year
$22,800 $20,873 $24,499
Any hospitalization during prior calendar year
36.2 34.6 38.5
Number of covered days of hospitalization in prior calendar year
3.0 2.4 3.3
Number of covered days of SNF in prior calendar year
6.8 5.8 6.6
Number of outpatient ED visits in prior calendar year
1.1 0.8 0.9
Preceding ED visit (last 7 days) 53.7 8.5 6.9
Preceding observation service (last 7 days)
14.2 0.5 0.4
Outcomes [2]
Improved/Same ADL score at SNF discharge
91.2 92.7 91.5
Length of SNF stay 20.9 20.7 22.1
Discharged from SNF to community 80.2 80.8 72.0
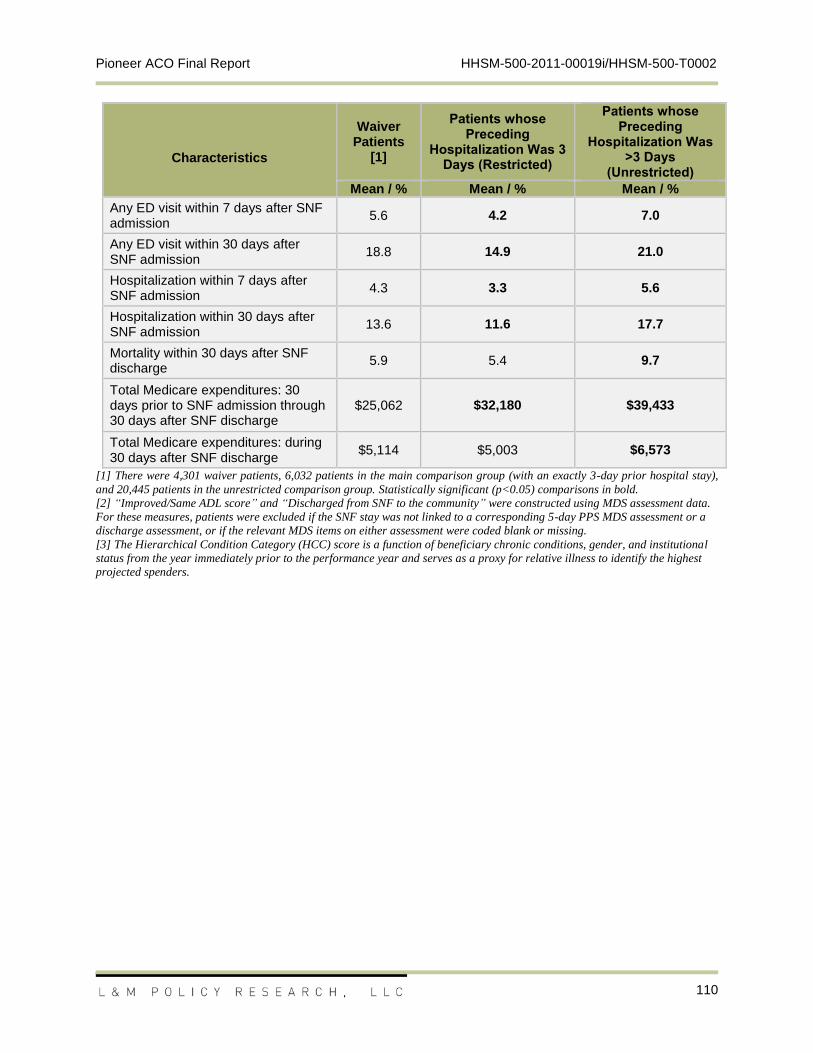
Pioneer ACO Final Report HHSM-500-2011-00019i/HHSM-500-T0002
110
Characteristics
Waiver Patients
[1]
Patients whose Preceding
Hospitalization Was 3 Days (Restricted)
Patients whose Preceding
Hospitalization Was >3 Days
(Unrestricted)
Mean / % Mean / % Mean / %
Any ED visit within 7 days after SNF admission
5.6 4.2 7.0
Any ED visit within 30 days after SNF admission
18.8 14.9 21.0
Hospitalization within 7 days after SNF admission
4.3 3.3 5.6
Hospitalization within 30 days after SNF admission
13.6 11.6 17.7
Mortality within 30 days after SNF discharge
5.9 5.4 9.7
Total Medicare expenditures: 30 days prior to SNF admission through 30 days after SNF discharge
$25,062 $32,180 $39,433
Total Medicare expenditures: during 30 days after SNF discharge
$5,114 $5,003 $6,573
[1] There were 4,301 waiver patients, 6,032 patients in the main comparison group (with an exactly 3-day prior hospital stay),
and 20,445 patients in the unrestricted comparison group. Statistically significant (p<0.05) comparisons in bold.
[2] “Improved/Same ADL score” and “Discharged from SNF to the community” were constructed using MDS assessment data.
For these measures, patients were excluded if the SNF stay was not linked to a corresponding 5-day PPS MDS assessment or a
discharge assessment, or if the relevant MDS items on either assessment were coded blank or missing.
[3] The Hierarchical Condition Category (HCC) score is a function of beneficiary chronic conditions, gender, and institutional
status from the year immediately prior to the performance year and serves as a proxy for relative illness to identify the highest
projected spenders.
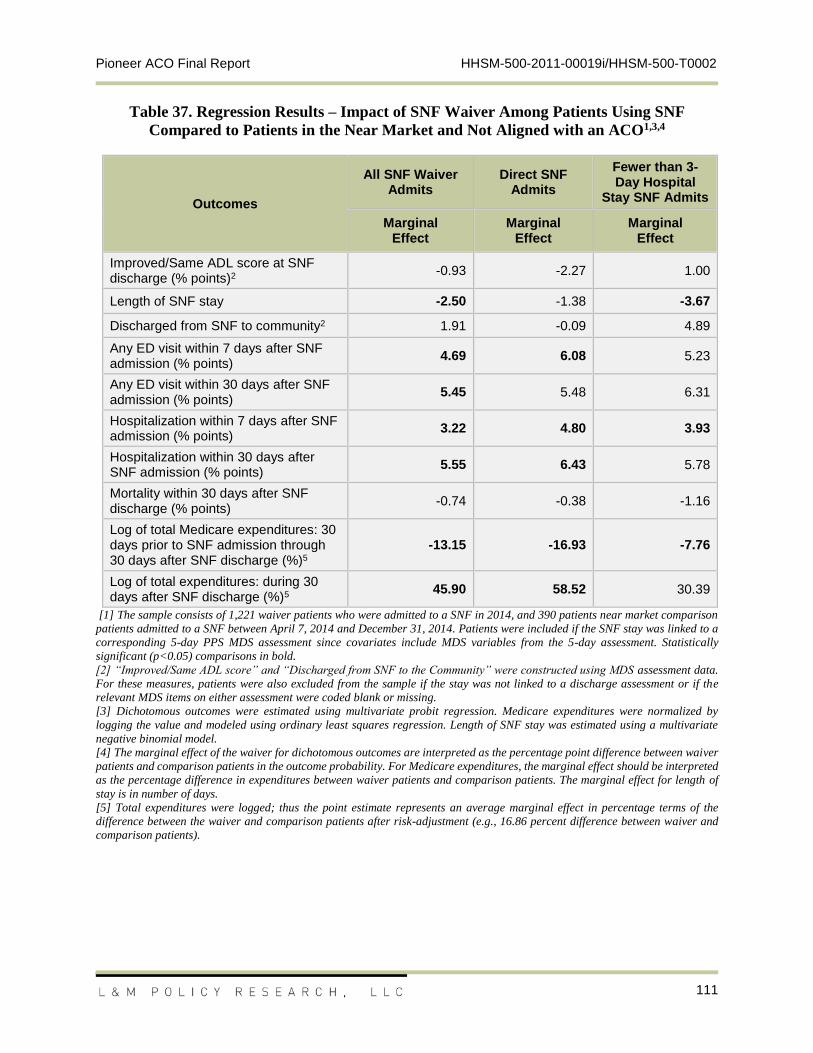
Pioneer ACO Final Report HHSM-500-2011-00019i/HHSM-500-T0002
111
Table 37. Regression Results – Impact of SNF Waiver Among Patients Using SNF
Compared to Patients in the Near Market and Not Aligned with an ACO1,3,4
Outcomes
All SNF Waiver Admits
Direct SNF Admits
Fewer than 3-Day Hospital
Stay SNF Admits
Marginal Effect
Marginal Effect
Marginal Effect
Improved/Same ADL score at SNF discharge (% points)2 -0.93 -2.27 1.00
Length of SNF stay -2.50 -1.38 -3.67
Discharged from SNF to community2 1.91 -0.09 4.89
Any ED visit within 7 days after SNF admission (% points)
4.69 6.08 5.23
Any ED visit within 30 days after SNF admission (% points)
5.45 5.48 6.31
Hospitalization within 7 days after SNF admission (% points)
3.22 4.80 3.93
Hospitalization within 30 days after SNF admission (% points)
5.55 6.43 5.78
Mortality within 30 days after SNF discharge (% points)
-0.74 -0.38 -1.16
Log of total Medicare expenditures: 30 days prior to SNF admission through 30 days after SNF discharge (%)5
-13.15 -16.93 -7.76
Log of total expenditures: during 30 days after SNF discharge (%)5 45.90 58.52 30.39
[1] The sample consists of 1,221 waiver patients who were admitted to a SNF in 2014, and 390 patients near market comparison
patients admitted to a SNF between April 7, 2014 and December 31, 2014. Patients were included if the SNF stay was linked to a
corresponding 5-day PPS MDS assessment since covariates include MDS variables from the 5-day assessment. Statistically
significant (p<0.05) comparisons in bold.
[2] “Improved/Same ADL score” and “Discharged from SNF to the Community” were constructed using MDS assessment data.
For these measures, patients were also excluded from the sample if the stay was not linked to a discharge assessment or if the
relevant MDS items on either assessment were coded blank or missing.
[3] Dichotomous outcomes were estimated using multivariate probit regression. Medicare expenditures were normalized by
logging the value and modeled using ordinary least squares regression. Length of SNF stay was estimated using a multivariate
negative binomial model.
[4] The marginal effect of the waiver for dichotomous outcomes are interpreted as the percentage point difference between waiver
patients and comparison patients in the outcome probability. For Medicare expenditures, the marginal effect should be interpreted
as the percentage difference in expenditures between waiver patients and comparison patients. The marginal effect for length of
stay is in number of days.
[5] Total expenditures were logged; thus the point estimate represents an average marginal effect in percentage terms of the
difference between the waiver and comparison patients after risk-adjustment (e.g., 16.86 percent difference between waiver and
comparison patients).


![Cmmi agile kulpa 2004meas cmmi[1]](https://img.pdfslide.us/doc/110x75/5455d335af795994188b4aed/cmmi-agile-kulpa-2004meas-cmmi1.jpg)

![Acos postcard[final]](https://img.pdfslide.us/doc/110x75/568c55701a28ab4916c2c624/acos-postcardfinal.jpg)