Embed Size (px)
Citation preview
EVALUATION OF CHLOROPICRINAS A TOXIC AIR CONTAMINANT
Cl
Cl C NO2
Cl
PART B
Human Health Assessment
Medical Toxicology Branch
Department of Pesticide Regulation
California Environmental Protection Agency
February 4, 2010
CHLOROPICRIN February 4, 2010
Contributors and Acknowledgments
Principal Author: Carolyn M. Lewis, M.S., D.A.B.T. Associate Toxicologist Health Assessment Section Medical Toxicology Branch
Toxicology Reviews: Marilyn H. Silva, Ph.D., D.A.B.T. Staff Toxicologist SB 950 Data Review Section Medical Toxicology Branch
Peer Reviewed By: Joyce Gee, Ph.D. Senior Toxicologist Health Assessment Section Medical Toxicology Branch
Jay P. Schreider, Ph.D. Primary State Toxicologist Medical Toxicology Branch
DPR acknowledges the review of this document by the Pesticide Epidemiology Unit, Office of Environmental Health Hazard Assessment.
ii
CHLOROPICRIN February 4, 2010
TABLE OF CONTENTS
PAGE
Contributions and Acknowledgments ........................................................................................... iiTable of Contents ......................................................................................................................... iiiSummary ........................................................................................................................................ 1
I. Introduction ......................................................................................................................... 6I.A. Regulatory Background ......................................................................................... 6I.B. Chemical Identification .......................................................................................... 7
II. Toxicology Profile .............................................................................................................. 8II.A. Pharmacokinetics ................................................................................................... 8II.B. Acute Toxicity ...................................................................................................... 10II.C. Subchronic Toxicity ............................................................................................. 22II.D. Chronic Toxicity/Carcinogenicity ........................................................................ 29II.E. Genotoxicity ......................................................................................................... 36II.F. Reproductive Toxicity .......................................................................................... 40II.G. Developmental Toxicity ....................................................................................... 41
III. Risk Assessment ............................................................................................................... 45III.A. Hazard Identification ............................................................................................ 45
III.A.1. Acute Toxicity ........................................................................................ 45III.A.2. Subchronic Toxicity ............................................................................... 50III.A.3. Chronic Toxicity .................................................................................... 52III.A.4. Carcinogenicity - Weight of Evidence ................................................... 56III.A.5. Reference Concentrations ...................................................................... 59
III.B. Exposure Assessment ........................................................................................... 62III.B.1. Soil Fumigation ...................................................................................... 62III.B.2. Structural Fumigation ............................................................................. 66III.B.3. Enclosed Space Fumigation ................................................................... 67
III.C. Risk Characterization ........................................................................................... 68III.C.1. Soil Fumigation ...................................................................................... 68III.C.2. Structural Fumigation ............................................................................. 71III.C.3. Enclosed Space Fumigation ................................................................... 72
IV. Risk Appraisal ................................................................................................................... 74IV.A. Hazard Identification ............................................................................................. 74IV.B. Exposure Assessment ............................................................................................. 78IV.C. Risk Characterization ............................................................................................. 81IV.D. U.S. EPA’s Human Health Risk Assessment for Chloropicrin ............................. 82IV.E. Issues Related to the Food Quality Protection Act ................................................ 86
V. Conclusions ....................................................................................................................... 90
VI. References ......................................................................................................................... 91
iii
CHLOROPICRIN February 4, 2010
CHLOROPICRIN
SUMMARY
Chloropicrin (trichloronitromethane) was first patented for use as an insecticide in 1908. Chloropicrin is a broad-spectrum fumigant with insecticidal, fungicidal, nematicidal and herbicidal properties. Chloropicrin also has a low odor threshold and causes sensory irritation at very low concentrations, so it has been added as a warning agent to other fumigants like methyl bromide and sulfuryl fluoride which are odorless. The Department of Pesticide Regulation (DPR) placed chloropicrin into reevaluation in 2001 based on air monitoring data which found that air concentrations of chloropicrin at some distances from treated greenhouses were greater than established occupational exposure limits (Cortez, 2001). DPR has placed chloropicrin on the high-priority list for risk assessment based on possible adverse effects identified in genotoxicity and developmental toxicity studies submitted under the Birth Defect Prevention Act (SB 950). Chloropicrin is also a high-priority pesticide for risk assessment under the California Toxic Air Contaminant Act (AB 1807). The purpose of this risk assessment is to evaluate the risks for potential human health effects from bystander exposure to chloropicrin.
Toxicity
The pharmacokinetic and toxicology studies were reviewed and presented in the Toxicology Profile section. Included in the Toxicology Profile are guideline studies submitted to DPR for registration purposes and studies from the open literature with the greatest weight generally given to studies that met the Federal Insecticide, Fungicide and Rodenticide Act (FIFRA) guidelines. From the treatment-related effects identified in the studies, the highest dose, which did not cause any toxicological effect, known as No-Observed-Effect Level (NOEL), was established for each study. For some studies where a NOEL was not observed, a benchmark concentration (BMC) estimate was determined instead. In the Hazard Identification section, the NOELs/BMCs and effects at the Lowest-Observed-Effect Levels (LOELs) from the available toxicity studies were evaluated to determine what would be the most appropriate NOEL/BMC, referred to as a critical NOEL, to evaluate particular exposure scenarios. The toxicity studies can be categorized as acute (< 7 days), subchronic (> 7 days to < 6 months), and chronic (1 or more years) in duration. To evaluate acute exposure, 1-hr, 8-hr and 24-hr NOELs/BMCs were selected.
The primary effects observed with short and long-term exposure to chloropicrin are sensory and respiratory irritation. The mechanism of action for chloropicrin is not well understood, but may involve an oxidative reaction with biological thiols, such as glutathione and hemoglobin. A sensory irritation study was conducted using human subjects with exposures up to one hour. A NOEL was not observed with the 1-hr exposure for eye irritation and increased nitric oxide (NO) in expired nasal air. Increased NO in expired nasal or pulmonary air is considered an indication of respiratory inflammation. A BMC estimate of 44 ppb was selected for evaluating 1-hr exposures to chloropicrin based on the increased NO in expired nasal air. Animal studies were used to evaluate longer-term exposures. The lowest acute NOEL in an animal study was seen in an inhalation developmental toxicity study in rabbits based on mortalities, nasal discharge, reduced body weights and food consumption and red discoloration in lungs. This NOEL was selected for evaluating 8-hr and 24-hr exposures. The 8-hr and 24-hr
1
CHLOROPICRIN February 4, 2010
NOELs estimated from this study were 300 and 100 ppb, respectively. The 8-hr human equivalent concentrations (HECs) were 270 and 580 ppb for children and adults, respectively. The 24-hr HECs were 92 and 190 ppb for children and adults, respectively. A BMC analysis was also performed to determine the most sensitive endpoint and species with seasonal and chronic inhalation exposure to chloropicrin. The lowest BMC estimate with subchronic inhalation exposure was rhinitis in female rats after adjusting for species differences in breathing rates. The BMC estimate for rhinitis, 120 ppb (HEC = 35 ppb for children and 73 ppb for adults), was selected for evaluating seasonal exposure to chloropicrin. The lowest BMC estimate with chronic inhalation exposure was bronchiectasis in male and female mice after adjusting for breathing rate. The BMC estimate for bronchiectasis, 49 ppb (HEC = 27 ppb for children and 56 ppb for adults) was selected for evaluating chronic exposure to chloropicrin.
Chloropicrin is a strong electrophile due to the presence of the chlorine and nitro groups. There was clear evidence of DNA damage, gene mutation and clastogenicity in a number of in vitro genotoxicity tests for chloropicrin. More importantly, there was a significant increase in tumors in two different species in two different laboratories. A slight increase in adenomas and carcinomas was seen in female mice that was significant by trend analysis and pair-wise comparison when survival was taken into consideration. There was also an increase in the multiplicity of these tumors and a slight shortening of the time-to-tumor at the high dose. A significant increase in fibroadenomas was also seen in female rats with oral exposure. Therefore, DPR concluded the weight of evidence was sufficient to do a quantitative assessment of the carcinogenic risk using a linear approach. The cancer potency was estimated to range from 1.3 (mg/kg/day)-1 for the maximum likelihood estimate to 2.2 (mg/kg/day)-1 for the 95th
percent upper bound based on the incidence of lung tumors in female mice.
Several developmental and reproductive effects were seen in studies including reduced number of implantation sites, increased pre- and post-implantation losses, late-term abortions, and visceral and skeletal variations in fetuses. The NOELs for fetal or pup effects were equal to or higher than the maternal or parental NOELs, suggesting there is no increased pre- or postnatal sensitivity to chloropicrin. Direct exposure to neonates, however, was not evaluated. Theoretically, neonates could be more sensitive to chloropicrin due to higher breathing rates or the immaturity of their respiratory system, immune system and/or metabolic enzymes. Therefore, an additional uncertainty factor may be appropriate for infants and children.
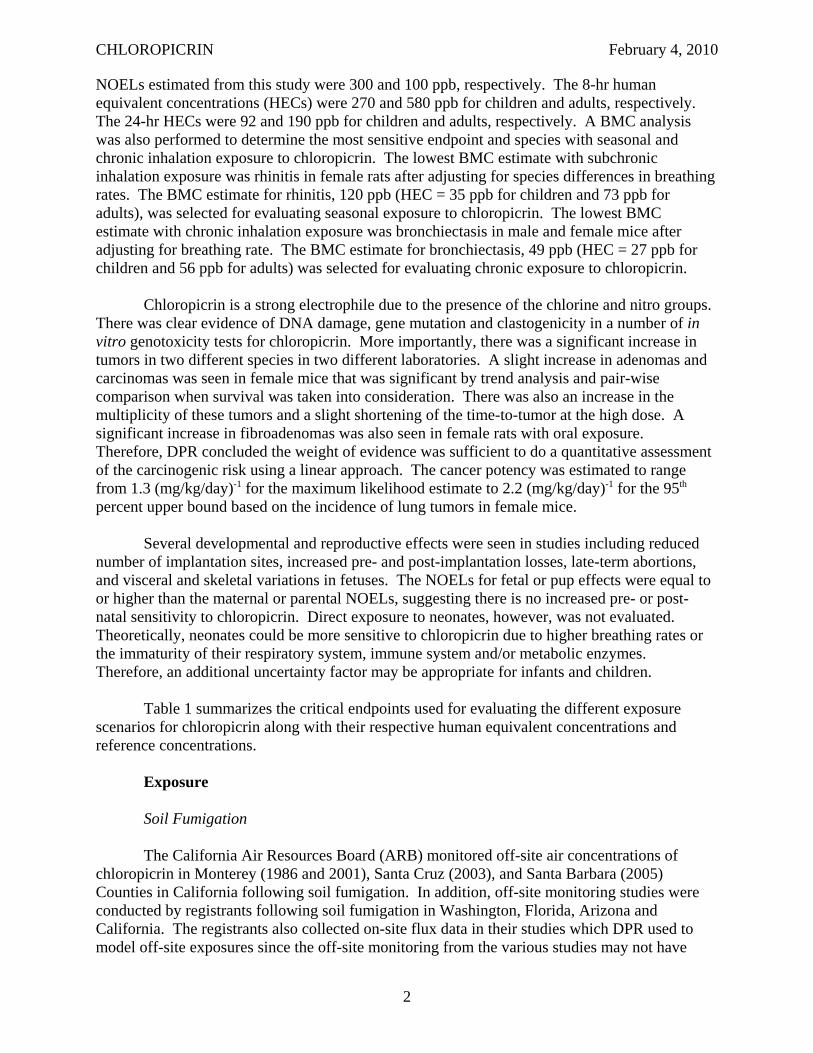
Table 1 summarizes the critical endpoints used for evaluating the different exposure scenarios for chloropicrin along with their respective human equivalent concentrations and reference concentrations.
Exposure
Soil Fumigation
The California Air Resources Board (ARB) monitored off-site air concentrations of chloropicrin in Monterey (1986 and 2001), Santa Cruz (2003), and Santa Barbara (2005) Counties in California following soil fumigation. In addition, off-site monitoring studies were conducted by registrants following soil fumigation in Washington, Florida, Arizona and California. The registrants also collected on-site flux data in their studies which DPR used to model off-site exposures since the off-site monitoring from the various studies may not have
2
CHLOROPICRIN February 4, 2010
Table 1. DPR Critical Endpoints, Human Equivalent Concentrations and Reference Concentrations for Chloropicrin
Exposure Scenario Critical Endpoints
HEC RfC
Children Adults Children Adults
Acute - 1 hr NO in nasal air of humans 44 ppb 44 ppb 4.4 ppb UFa = 10
4.4 ppb UF = 10
Acute - 8 hr & 24 hr
Mortalities (days 2-4), nasal discharge (onset day 0), body weights & food consumption (days 0-6), red discoloration in lungs of pregnant rabbits.
8-hr 270 ppb
24-hr 92 ppb
8-hr 580 ppb
24-hr 190 ppb
8-hr 2.7 ppb 24-hr
0.92 ppb UF = 100
8-hr 5.8 ppb 24-hr
1.9 ppb UF = 100
Seasonal Rhinitis in female rats 35 ppb 73 ppb 0.35 ppb UF = 100
0.73 ppb UF = 100
Chronic Bronchiectasis in male and female mice
27 ppb 56 ppb 0.27 ppb UF = 100
0.56 ppb UF = 100
Lifetime Lung tumors in female mice Potency = 2.2 (mg/kg/day)-1
------- 0.24 pptb
a UF = Uncertainty factor used to derive RfC. b RfC for cancer is the air concentration corresponding to a negligible risk level (i.e., one in a million excess cancer cases)
represented the worse-case scenario as far as weather and sampler location. The modeling estimated downwind centerline exposure estimates at 1.2 m above ground (breathing zone) and 3 m from the edge of a 40-acre square field treated at the maximum application rate which were considered reasonable worse-case estimates. From the modeling, 1-hr, 8-hr and 24-hr exposure estimates were generated for the different application methods used in these studies. Broadcast non-tarped application had the highest 1-hr and 8-hr exposure estimates, 16,000 ppb (110,000 μg/m3) and 6,500 ppb (44,000 μg/m3), respectively. Bedded tarped application had the highest 24-hr exposure estimates, 1,100 ppb (7,400 μg/m3). Seasonal exposure was estimated from the 24-hr average flux over 2 weeks, adjusting for time using the peak-to-mean method. The bedded tarped application had the highest estimate, 73 ppb (490 μg/m3). Annual exposure was estimated by amortizing the seasonal exposure over a year assuming a 5-month use season. The highest annual exposure was 30 ppb (200 μg/m3) for the bedded tarped application. Lifetime exposure for residential bystanders was the same as the annual exposure, except it was converted to mg/kg/day for ease of calculation of the cancer risk. The lifetime exposure estimate for residential bystanders for bedded tarped application was 25 μg/kg/day. The lifetime exposure for occupational bystanders assumed exposure was limited to 40 years of a 70-year lifespan. The estimated lifetime exposure for bedded tarped application was 14 μg/kg/day.
Ambient air monitoring studies were also conducted by ARB in Monterey (1986 and 2001), Santa Cruz (2001), Santa Barbara (2000) and Kern (2001) Counties. Exposure estimates were not calculated from these studies since the air concentrations were lower than at the application site as would be expected and it was assumed that any mitigation needed for
3
CHLOROPICRIN February 4, 2010
bystander exposure near application sites would mitigate any concerns regarding air concentrations in ambient air.
Structural Fumigation
Off-site air concentrations was monitored by the registrants following structural fumigation with sulfuryl fluoride where chloropicrin was added as a warning agent in four houses in Ventura (Ojai), Riverside (Homeland) and Fresno (Reedley - 2 houses) Counties. Modeling was not possible with this use, so exposure estimates were based the actual air concentrations after correcting for recovery. The highest off-site air concentration of chloropicrin associated with structural fumigation was found in the Ojai house which had a fumigation volume of 32,000 ft3. The corrected 1-hr, 8-hr and 24-hr air concentrations were 36.2, 10.1 and 7.39 ppb (244, 67.7and 49.7 μg/m3), respectively. These air concentrations were used to evaluate bystander exposure for structural fumigation. No seasonal and annual exposure estimates were calculated for bystanders following structural fumigation since multiple structural fumigations are not anticipated in the same area.
Indoor air concentrations was also monitored in the registrant studies of structural fumigation with chloropicrin. The highest 1-hr, 8-hr and 24-hr indoor air concentrations after aeration was completed were found in the Homeland (53,000 ft3), Reedley (25,000 ft3) and Reedley (25,000 ft3) houses, respectively. After adjusting for recovery and application rate, the 1-hr, 8-hr and 24-hr indoor air concentrations were 456, 183 and 172 ppb (3,060, 1,230 and 1,160 μg/m3) in the first 24 hours after aeration was completed. As with bystander exposure, no seasonal or annual exposure for indoor air following structural fumigation was calculated.
Enclosed Space Fumigation
One chloropicrin product includes directions for its use as an active ingredient in fumigating empty potato storages and empty grain bins. Therefore, exposure estimates were calculated for bystanders following enclosed space fumigation. The registrant monitoring data following structural fumigation of the Ojai house was also used to estimate bystander exposure for this use adjusting for maximum application rate and building size. Following enclosed space fumigation, the 1-hr, 8-hr and 24-hr bystander exposures were estimated to be 24,000, 6,800 and 5,000 ppb (160,000, 46,000 and 34,000 μg/m3), respectively. The annual exposure was estimated to be 28 ppb (190 μg/m3) assuming only 2 days of exposure per year. The estimated lifetime exposure for bystanders from enclosed space fumigation was 53 μg/kg/day.
Risk Characterization
The risk for non-carcinogenic health effects is expressed as a margin of exposure (MOE) which is the ratio of the NOEL from the animal study to the human exposure dosage. Generally, an MOE of at least 100 is desirable when the NOEL is derived from an animal study assuming that humans are 10 times more sensitive than animals and that there is a 10-fold variation in the sensitivity between the lower distribution of the overall human population and the sensitive subgroup. When the NOEL is derived from a human study, a MOE of at least 10 is desirable, assuming a 10-fold variation in the sensitivity of the human population. The negligible risk level for cancer is one in a million or 10-6. California regulations state that if the air concentrations of a pesticide are not 10-fold below the reference concentration that is considered protective of
4
CHLOROPICRIN February 4, 2010
human health, it meets the criteria to be listed as a toxic air contaminant. This is equivalent to the MOEs being less than 100 when a human NOEL is used or 1,000 when an animal NOEL is used. For cancer, if the risk is greater than one in 10 million or 10-7 it would meet the listing criteria.
Soil Fumigation
The potential health risks from bystander exposure to chloropicrin following soil fumigation are of concern since all of the MOEs were less than 100 for both children and adults. The acute MOEs for soil fumigation are clearly of concern since they are all less than 1. With the 1-hr exposure, the MOEs are orders of magnitude lower than the target MOE of 10. The seasonal and chronic MOEs for soil fumigation were greater than 1 (except for seasonal exposure with bedded tarped application), but still less than 100 which is the target MOE. In addition, the cancer risk estimates for bystanders of soil fumigation were several orders of magnitude greater than the negligible risk level, ranging between two and thirty excess cases in 1,000 people.
Structural Fumigation
The off-site air concentrations of chloropicrin following structural fumigation are lower than following soil fumigation, but the acute exposures are still of concern. The 1-hr MOEs are less than the target MOE of 10. The 8-hr and 24-hr MOEs are greater than 10, but less than the target MOE of 100 for these exposure durations. The indoor air concentrations are of greater concern since the 1-hr MOEs are less than 0.1 and 8-hr and 24-hr MOEs are less than 10.
Enclosed Space Fumigation
The potential health risks from bystander exposure following enclosed space fumigation were of great concern since the all of the MOEs were less than their target MOEs, by several orders of magnitude. Furthermore, the carcinogenic risk estimates were also greater than the negligible risk level by several orders of magnitude, ranging from seven to twelve excess cases in 100 people.
Conclusions
The potential health risks from bystander exposure to chloropicrin following soil fumigation are of concern, especially for acute exposure since they were orders of magnitude below the target MOEs. The cancer risk estimates were also orders of magnitude greater than the negligible risk level and, therefore, are of concern. The potential health risks for bystanders from exposure to chloropicrin after structural fumigation are less, however, the MOEs were still less than the target MOEs and are of concern. The exposure to chloropicrin for bystanders near enclosed space fumigation were also of concern since the MOEs were orders of magnitude less than their target. The cancer risk estimates for bystanders of enclosed space fumigation were also orders of magnitude greater than negligible risk level. The off-site air concentrations of chloropicrin following soil fumigation, structural fumigation and enclosed space fumigation clearly meet the criteria for listing chloropicrin as a toxic air contaminant.
5
CHLOROPICRIN February 4, 2010
I. INTRODUCTION
I.A. REGULATORY BACKGROUND
Chloropicrin (trichloronitromethane) was first patented for use as an insecticide in 1908 (Gehring et al., 1991). During World War I (WWI) chloropicrin was used as a warfare agent because of its strong lacrimatory and respiratory irritant properties. In 1926, chloropicrin was first used as a fumigant in flour mills (Clemson Univ., 2006). Since then it has also been used as a preplant soil fumigant, as a warning agent with other odorless fumigants, and as a wood preservative.
The American Conference of Governmental Industrial Hygienists (ACGIH) has long recommended a time-weighted average threshold limit value (TWA-TLV) for chloropicrin of 0.1 ppm which appears to be based on reports of painful eye irritation at concentrations between 0.3 and 0.37 ppm after exposure of 3-30 seconds (ACGIH, 1997). OHSA’s Permissible Exposure Limit (PEL) and NIOSH’s Recommended Exposure Limit (REL) are also established at 0.1 ppm. NIOSH’s Immediately Dangerous to Life or Health (IDLH) value was initially set at 4 ppm for chloropicrin based on reports that exposure to chloropicrin for a few seconds at 4 ppm renders a man unfit for action (NIOSH, 1996). In 1996, it was reduced to 2 ppm taking into consideration more recent acute inhalation toxicity studies in animals. The Office of Environmental Health Hazard Assessment (OEHHA) in the California Environmental Protection Agency (Cal/EPA) established an acute 1-hour Reference Exposure Level (REL) for chloropicrin of 4.4 ppb (29 μg/m3) (OEHHA, 1999). OEHHA also established a chronic REL for chloropicrin of 0.05 ppb (0.4 μg/m3) (OEHHA, 2001). More recently, U.S. EPA completed a risk assessment for chloropicrin which addressed both occupational and bystander exposure (Reeves and Smith, 2008). Although Reference Concentrations (RfCs) were not identified in this risk assessment, they could be estimated by dividing the selected human concentration (HC) or human equivalent concentration (HEC) by the recommended uncertainty factor (UF). Their RfC for acute bystander and worker exposure was 73 ppb using the HC from the human study and dividing by their recommended UF of 1. Their RfCs for short- and intermediate-term exposure for bystanders and workers would be 0.27 and 1.17 ppb, respectively, by dividing their HECs from the 13-week mouse inhalation study by their recommended UF of 30. Their RfCs for long-term exposure for bystanders and workers would be 0.13 and 0.50 ppb, respectively, by dividing their HECs from the 78-week mouse inhalation study by their recommended UF of 30. Buffer zones were needed for most soil fumigation when chloropicrin concentrations were greater than 2%. Buffer zones may also be needed for greenhouse fumigation depending on size of the greenhouse and the percent released. Risks were not a concern for bystanders near residential structural fumigation. U.S. EPA also found the air concentrations of chloropicrin were not of concern for residential bystanders from non-point sources (i.e., ambient air). U.S. EPA did find that the handler exposures exceeded their level of concern for many scenarios, but these exposures could be mitigated by use of a PF 10 respirator.
The Department of Pesticide Regulation (DPR) placed chloropicrin into reevaluation in 2001 (Cortez, 2001). The basis for this decision was that air monitoring data submitted by the Chloropicrin Manufacturers Task Force (CMTF) indicated that air concentrations at some distances from treated greenhouses exceeded NIOSH’s REL of 0.1 ppm. DPR requested that the chloropicrin registrants conduct and submit worker exposure and air monitoring studies
6
CHLOROPICRIN February 4, 2010
associated with field and greenhouse applications of chloropicrin. DPR placed chloropicrin on the high-priority list for risk assessment based on possible adverse effects identified in genotoxicity and developmental toxicity studies submitted under the Birth Defect Prevention Act (SB 950). Chloropicrin is also a high-priority pesticide for risk assessment under the California Toxic Air Contaminant Act (AB 1807) which is based on a combination of its toxicity and physical/chemical properties. The purpose of this risk assessment is to evaluate the risks for potential human health effects from bystander exposure to chloropicrin. A separate risk assessment to follow will address occupational exposure to chloropicrin.
I.B. CHEMICAL IDENTIFICATION
Chloropicrin is a broad-spectrum fumigant that rapidly diffuses through soil and kills common root destroying fungi, nematodes, soil insects and other plant pests (Wilhelm, 1996). Chloropicrin does not have the broader herbicidal properties of methyl bromide and metam sodium or the broader nematicidal properties of 1,3-dichloropropene, so it is usually used in combination with these other fumigants. Chloropicrin has a low odor threshold and causes sensory irritation at very low concentrations, so it has been added as a warning agent to other fumigants like methyl bromide and sulfuryl fluoride which are odorless. Chloropicrin’s mechanism of action is not well understood, but it may be related to its reaction with biological thiols like glutathione and hemoglobin (Sparks et al., 1997). Chloropicrin also inhibits pyruvate and succinate dehydrogenase (Sparks et al., 2000). The inhibition of these enzymes has been correlated to the lethality of various halonitromethanes, quinones, fungicides and other thiol-reactive chemicals. Today, its greatest use in California is on strawberries, usually in combination with methyl bromide. Due to the eventual phase out of methyl bromide because of its ozone-depleting properties, the amount of chloropicrin in these formulations has increased.
7
CHLOROPICRIN February 4, 2010
II. TOXICOLOGY PROFILE
All the available toxicity studies for chloropicrin are summarized in the Toxicology Profile including studies from the open literature and studies submitted to DPR for registration of pesticide products in California as required by the Birth Defects Prevention Act (SB-950). DPR reviews the studies submitted to fill data requirements for SB-950 and determines the acceptability of these toxicology studies based on study guidelines as required under the Federal Insecticide, Fungicide and Rodenticide Act (FIFRA) (U.S. EPA, 2006). For SB-950, literature studies are generally considered supplemental because they do not follow FIFRA guideline protocols and/or do not provide sufficient detail in their reports to determine if they were conducted properly. In the risk assessment, greater weight is given to guideline studies, especially if they are found acceptable based on FIFRA guidelines. However, literature studies are useful in the selection of the critical NOEL in the Hazard Identification section to support effects seen in the guideline studies and can be used for the critical NOEL if they evaluate an endpoint not examined in the guideline studies and they appear to be scientifically valid studies. Except for the Pharmacokinetics and Acute Toxicity sections, the studies are generally organized within each section by route and species with the older studies discussed first. When mechanistic studies are available, they are discussed after the guideline studies under the appropriate route and species. The Pharmacokinetics section is organized by different phases in the disposition of xenobiotics in the body. The Acute Toxicity section is separated into data for the technical grade material and the various formulations.
II.A. PHARMACOKINETICS
There were no FIFRA guideline pharmacokinetics/metabolism studies for chloropicrin and very limited pharmacokinetic data available in the open literature. Sparks et al. (1997) administered 14C-chloropicrin to male Swiss Webster mice intraperitoneally and orally at 1-3 mg/kg with triethylene glycol monomethyl ether as the vehicle. They monitored the radioactivity in the urine, feces and expired air for 48 hours. The urine was the major route of excretion with 43-47% excreted in the first 24 hours. Another 8-8.5% was excreted in the urine between 24 and 48 hours. The metabolites in urine were analyzed by TLC. None were identified, but they appeared to be polar and nonvolatile. The other major route of excretion was expired air with 6.5-15% excreted as CO2 in 48 hours. Only 2.5-9% of the applied dose was excreted in the feces in the 48 hours following dosing. Tissue levels of radioactivity were measured at 1 hour (i.p.) and 48 hours (i.p. and oral) after dosing. At 1 hour and 48 hours, the liver had the highest level of radioactivity, followed by the kidney, lung, blood, fat and skin.
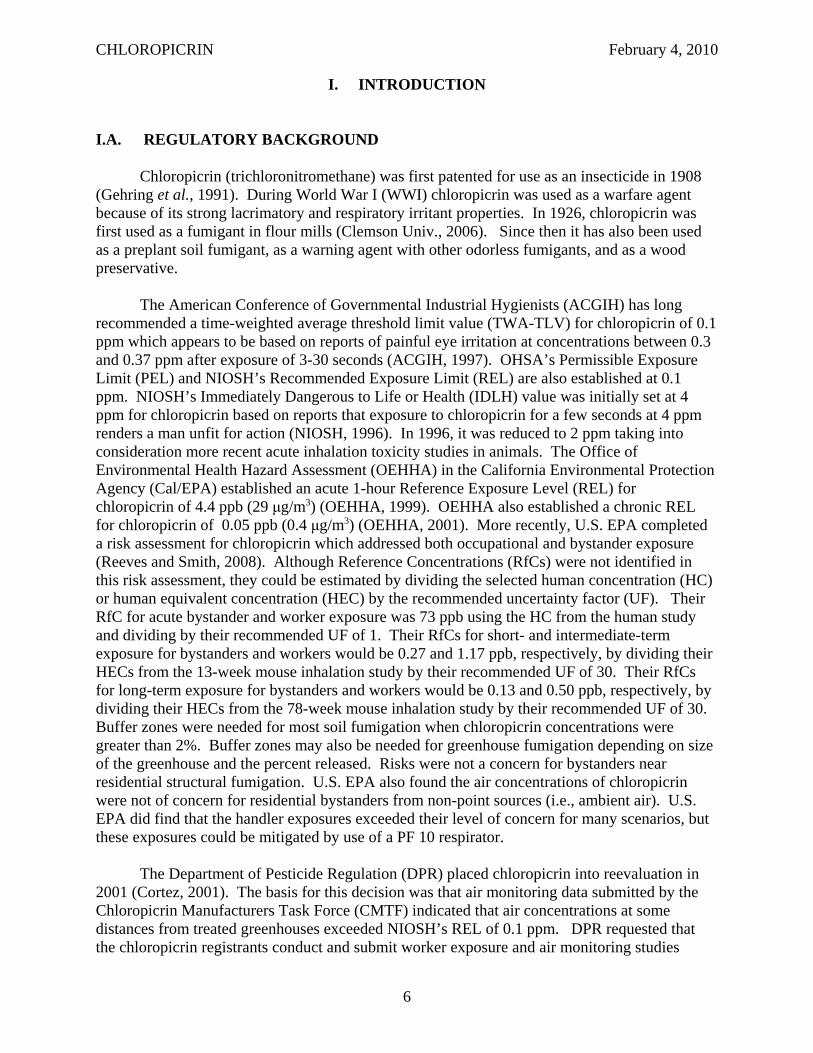
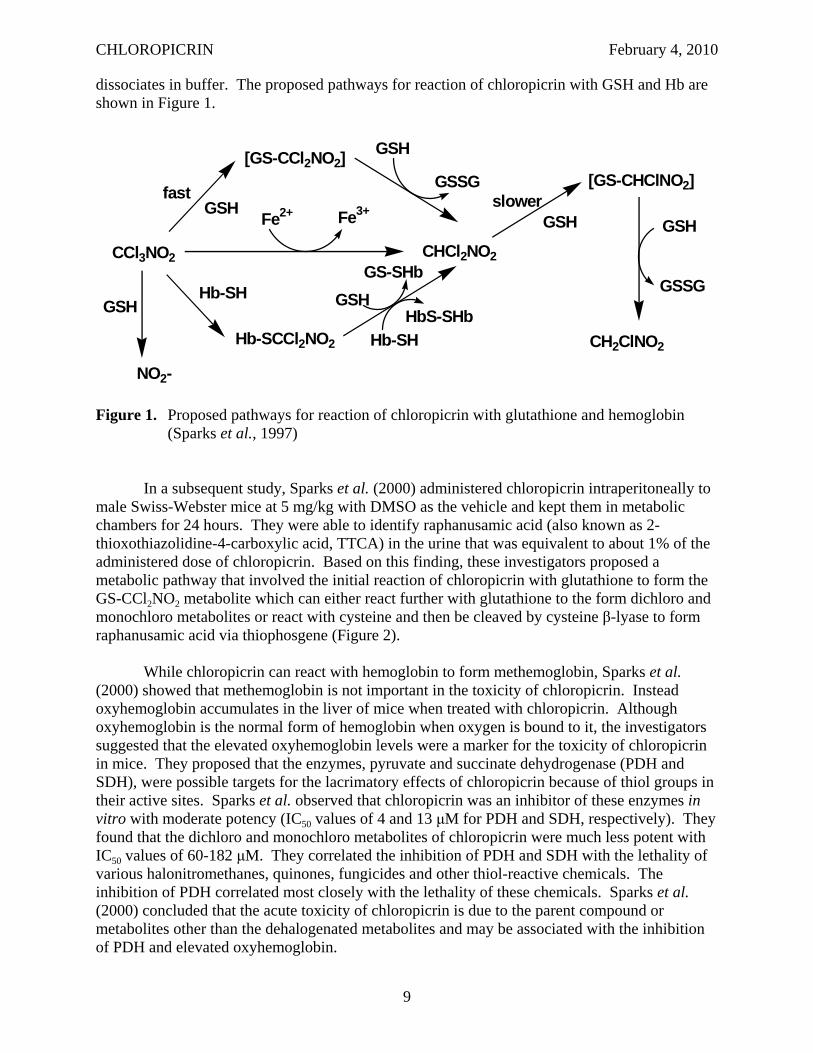
Sparks et al. (1997) also investigated the reaction of chloropicrin with biological thiols in vitro. Chloropicrin reacted quickly with various biological thiols including glutathione (GSH), cysteine, N-acetylcysteine, coenzyme A and reduced lipoic acid. These reactions resulted in the conversion of chloropicrin to dichloronitromethane and the formation of the corresponding disulfide of the thiol. The initial adduct with GSH and chloropicrin was unstable since attempts to isolate it were unsuccessful. Nitric oxide was an unlikely metabolite since S-nitroso-GSH was not found. Chloropicrin also oxidizes protein thiols in vitro including hemoglobin (Hb) and alcohol dehydrogenase. The change in the UV profile implied formation of internal and crosslinked disulfide bonds. The Hb adduct formation is more stable than GSH adduct, but it readily
8
CHLOROPICRIN February 4, 2010
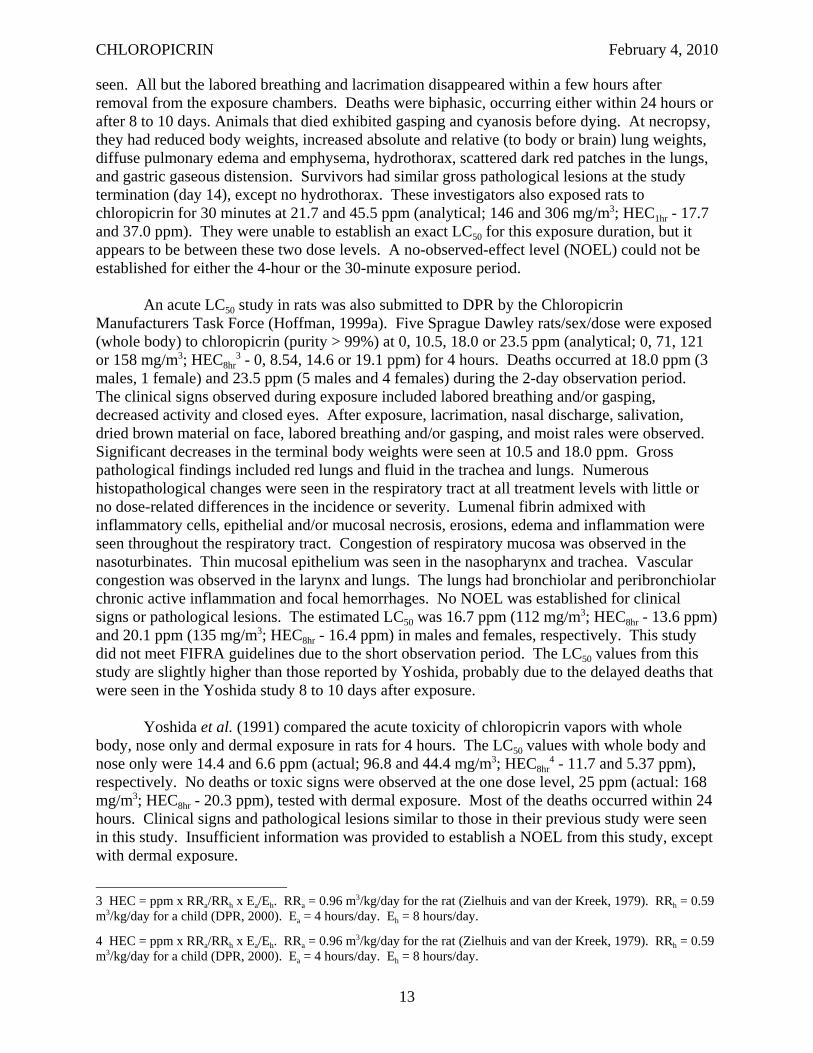
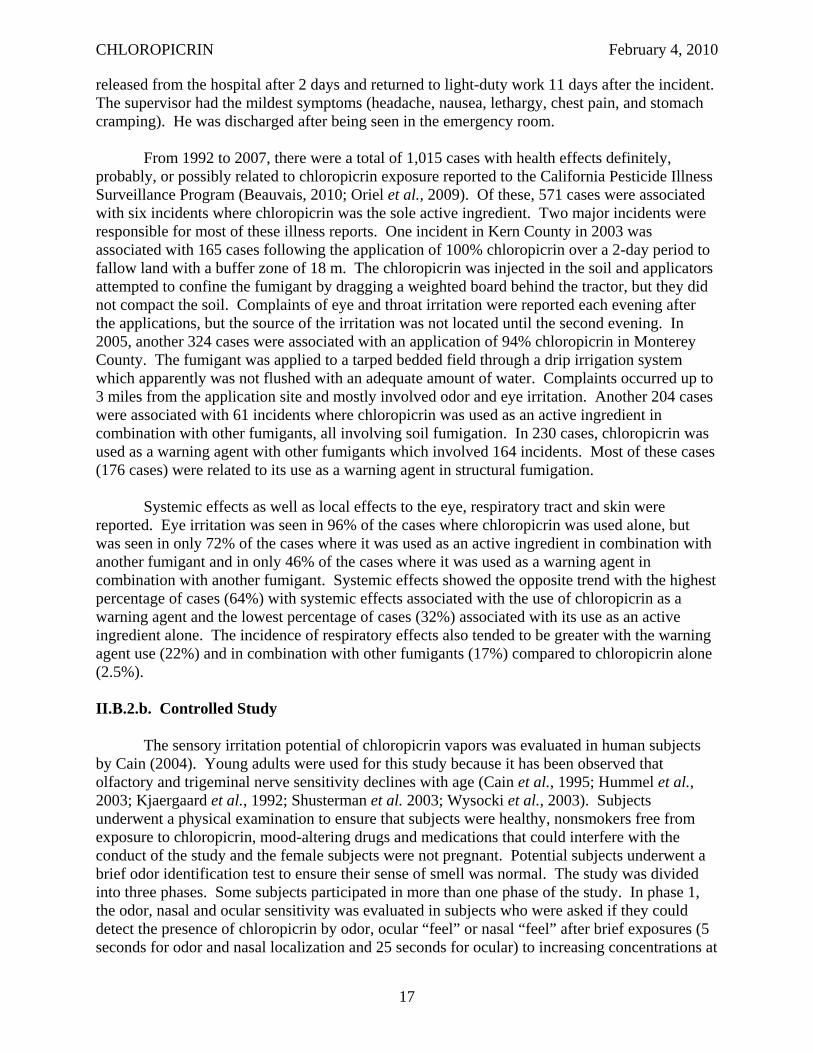
dissociates in buffer. The proposed pathways for reaction of chloropicrin with GSH and Hb are shown in Figure 1.
CCl3NO2
Fe2+ Fe3+
CHCl2NO2
CH2ClNO2
fast
Hb-SH GSH
Hb-SCCl2NO2
GSH
GS-SHb
Hb-SH
HbS-SHb
[GS-CCl2NO2] GSH
GSSG
GSH
[GS-CHClNO2]
GSH
GSSG
slower GSH
NO2-
Figure 1. Proposed pathways for reaction of chloropicrin with glutathione and hemoglobin (Sparks et al., 1997)
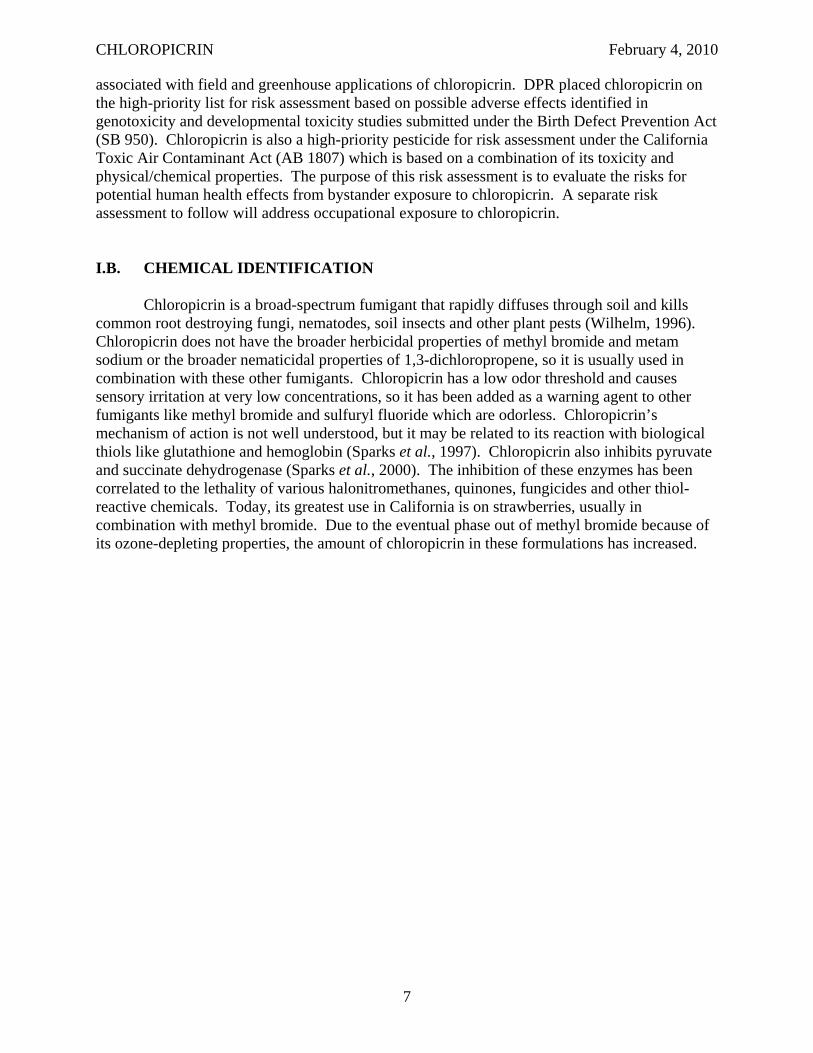
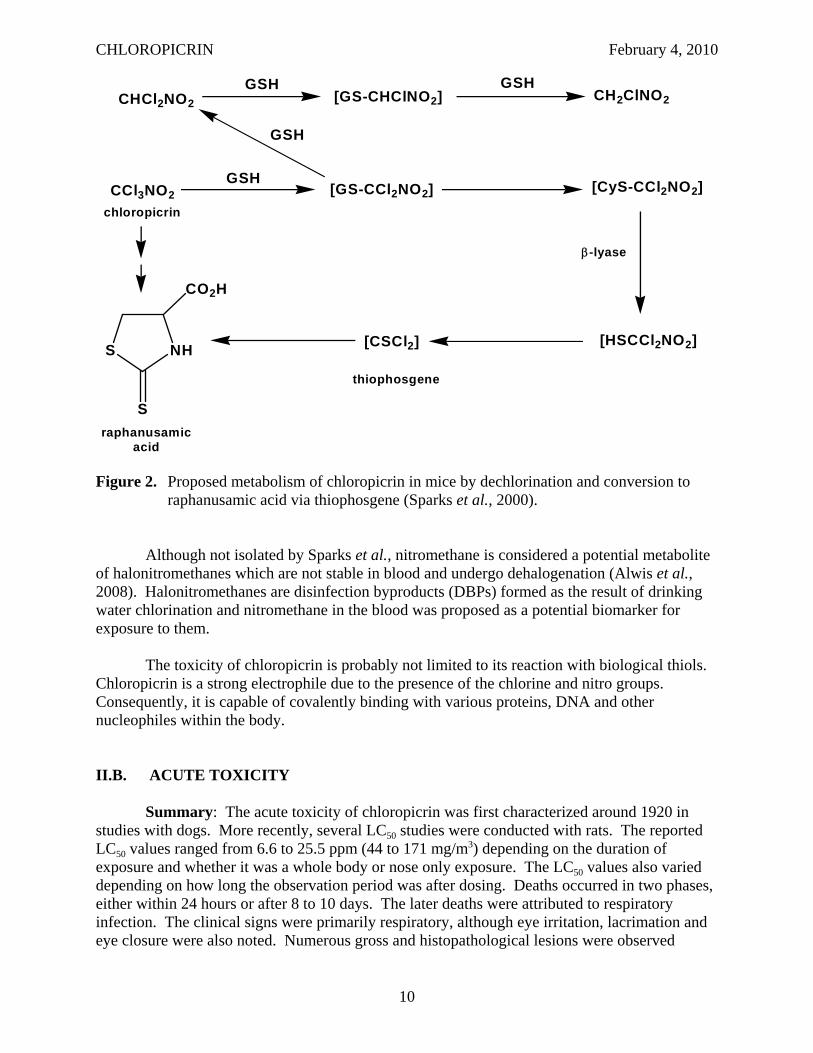
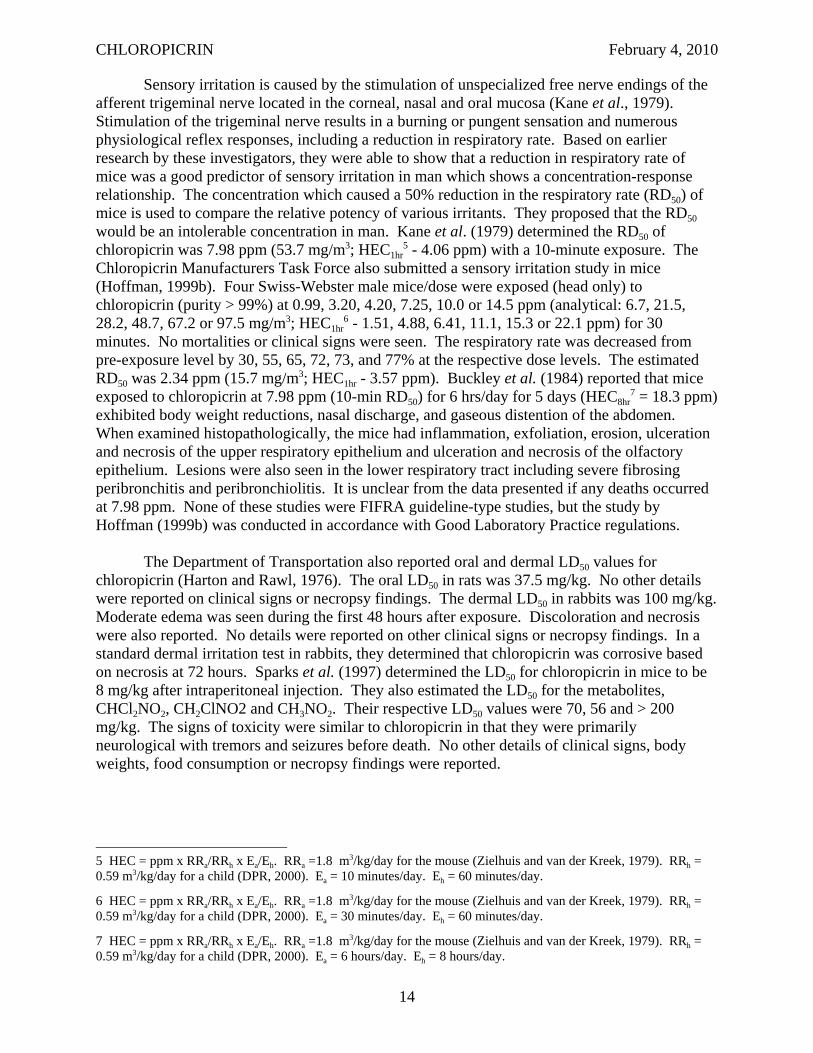
In a subsequent study, Sparks et al. (2000) administered chloropicrin intraperitoneally to male Swiss-Webster mice at 5 mg/kg with DMSO as the vehicle and kept them in metabolic chambers for 24 hours. They were able to identify raphanusamic acid (also known as 2thioxothiazolidine-4-carboxylic acid, TTCA) in the urine that was equivalent to about 1% of the administered dose of chloropicrin. Based on this finding, these investigators proposed a metabolic pathway that involved the initial reaction of chloropicrin with glutathione to form the GS-CCl2NO2 metabolite which can either react further with glutathione to the form dichloro and monochloro metabolites or react with cysteine and then be cleaved by cysteine β-lyase to form raphanusamic acid via thiophosgene (Figure 2).
While chloropicrin can react with hemoglobin to form methemoglobin, Sparks et al. (2000) showed that methemoglobin is not important in the toxicity of chloropicrin. Instead oxyhemoglobin accumulates in the liver of mice when treated with chloropicrin. Although oxyhemoglobin is the normal form of hemoglobin when oxygen is bound to it, the investigators suggested that the elevated oxyhemoglobin levels were a marker for the toxicity of chloropicrin in mice. They proposed that the enzymes, pyruvate and succinate dehydrogenase (PDH and SDH), were possible targets for the lacrimatory effects of chloropicrin because of thiol groups in their active sites. Sparks et al. observed that chloropicrin was an inhibitor of these enzymes in vitro with moderate potency (IC50 values of 4 and 13 μM for PDH and SDH, respectively). They found that the dichloro and monochloro metabolites of chloropicrin were much less potent with IC50 values of 60-182 μM. They correlated the inhibition of PDH and SDH with the lethality of various halonitromethanes, quinones, fungicides and other thiol-reactive chemicals. The inhibition of PDH correlated most closely with the lethality of these chemicals. Sparks et al. (2000) concluded that the acute toxicity of chloropicrin is due to the parent compound or metabolites other than the dehalogenated metabolites and may be associated with the inhibition of PDH and elevated oxyhemoglobin.
9
CHLOROPICRIN February 4, 2010
GSH GSH
[HSCCl2NO2]
[CyS-CCl2NO2]
CH2ClNO2
β-lyase
[CSCl2]S NH
CO2H
CHCl2NO2
CCl3NO2
[GS-CHClNO2]
[GS-CCl2NO2]
thiophosgene
chloropicrin
GSH
GSH
S
raphanusamicacid
Figure 2. Proposed metabolism of chloropicrin in mice by dechlorination and conversion to raphanusamic acid via thiophosgene (Sparks et al., 2000).
Although not isolated by Sparks et al., nitromethane is considered a potential metabolite of halonitromethanes which are not stable in blood and undergo dehalogenation (Alwis et al., 2008). Halonitromethanes are disinfection byproducts (DBPs) formed as the result of drinking water chlorination and nitromethane in the blood was proposed as a potential biomarker for exposure to them.
The toxicity of chloropicrin is probably not limited to its reaction with biological thiols. Chloropicrin is a strong electrophile due to the presence of the chlorine and nitro groups. Consequently, it is capable of covalently binding with various proteins, DNA and other nucleophiles within the body.
II.B. ACUTE TOXICITY
Summary: The acute toxicity of chloropicrin was first characterized around 1920 in studies with dogs. More recently, several LC50 studies were conducted with rats. The reported LC50 values ranged from 6.6 to 25.5 ppm (44 to 171 mg/m3) depending on the duration of exposure and whether it was a whole body or nose only exposure. The LC50 values also varied depending on how long the observation period was after dosing. Deaths occurred in two phases, either within 24 hours or after 8 to 10 days. The later deaths were attributed to respiratory infection. The clinical signs were primarily respiratory, although eye irritation, lacrimation and eye closure were also noted. Numerous gross and histopathological lesions were observed
10
CHLOROPICRIN February 4, 2010
throughout the respiratory tract. In comparing chloropicrin to other lethal WWI warfare agents like chlorine gas and phosgene, early investigators described the respiratory effects to be intermediate in onset and primarily affecting small to medium bronchi. The ability of chloropicrin to cause respiratory depression in mice was also evaluated in two studies as an indication of sensory irritation in man. The RD50 (concentration that caused a 50% reduction in respiratory rate) values ranged from 2.34 ppm (15.7 mg/m3; HEC1hr - 3.57 ppm) for a 30 minute exposure to 7.98 ppm (53.7 mg/m3; HEC1hr- 4.06 ppm) for a 10 minute exposure. The RD50 was proposed as an intolerable concentration to man. More recently a human sensory irritation study was conducted which consisted of three phases. The first phase identified the median odor threshold for chloropicrin at 700 ppb. The median threshold for eye irritation was 900 ppb. The median threshold for nasal irritation was greater than 1200 ppb, the highest level tested. In phase 2, a NOEL for ocular irritation was established at 50 ppb with a 20-minute exposure in a walk-in chamber. No nasal or throat irritation was observed up to 150 ppb. In phase 3, the NOEL for ocular irritation appears to be less than 100 ppb after a 1-hour exposure in a walk-in chamber. No nasal or throat irritation was reported in this phase, but increased production of nitric oxide (NO) and decreased nasal airflow at 100 and 150 ppb suggests some subtle upper respiratory changes.
II.B.1. Animal Studies
Underhill (1920) exposed 219 dogs to chloropicrin for 30 minutes at air concentrations ranging from 0.36 to 1.25 mg/L (49 to 172 ppm). An LC50 value was not calculated, but 53% of dogs were killed when exposed to chloropicrin at 0.81 to 0.95 mg/L (111-131 ppm). Only one of 12 animals exposed to chloropicrin at the lowest concentration, 0.35 to 0.50 mg/L (49-69 ppm) died. The majority of the dogs died within 24 hours after exposure. However, several delayed deaths were seen. The clinical signs observed after exposure to chloropicrin were not reported, but the respiration, pulse, temperature, and composition of the urine and blood were examined in the dogs. There was an immediate lowering of the respiratory rate that returned to normal within 2-3 hours after exposure except in dogs that died. The respiratory passages became clogged with excessive mucus and the animals began mouth breathing with a gasping reflex. The pulse initially dropped to less than half the normal rate after being exposed to chloropicrin, followed by a return to normal or above normal in more severely affected dogs. A drop in body temperature was seen in most dogs after exposure to chloropicrin and continued to fall (up to 4°C) in animals that died. There was an increase in urinary total nitrogen, ammonia nitrogen, creatine nitrogen, phosphate and chloride levels after exposure. An increase in total blood solids, red blood cell count and hemoglobin concentration were seen in dogs after exposure. These values remained elevated in animals that died.
Lambert and Jackson (1920) examined 120 dogs that were exposed to chloropicrin gas in studies conducted by Underhill. Dogs that died within in a few days of exposure had extreme edema and congestion of the lungs, necrosis of the bronchial epithelium and bronchiolar walls, dilation of the heart, and passive congestion of the abdominal viscera. The investigators concluded that the edema was not the cause of death because the severity was no greater in animals that died than those that survived. Instead, they proposed that the cause of death was due to the accumulation of fibrin in the pulmonary septa forming a barrier to blood flow through the lungs. There were a number of delayed deaths which were attributed to respiratory infection in most cases. The investigators compared the damage seen with chloropicrin to other lethal WWI warfare agents, chlorine and phosgene. Chlorine acts very rapidly and affects primarily
11
CHLOROPICRIN February 4, 2010
the upper respiratory tract (trachea, large and medium bronchi) where it first comes in contact. Phosgene, on the other hand, has a delayed action and primarily affects the lower respiratory tract (smaller bronchi, bronchioles and alveoli) presumably due to its metabolism to hydrogen chloride. Chloropicrin is intermediate in its onset and primarily affects the medium and small bronchi. The information in these early investigations was too limited and the dose levels too high to be useful for estimating an acute NOEL.
The U.S. Department of Transportation reported a one-hour LC50 (whole body) of 25.5 ppm (analytical; 171 mg/m3; HEC1hr
1 - 41.5 ppm) for chloropicrin in rats (Harton and Rawl, 1976) (Table 2). The animals exhibited gagging response and irritation to the eyes and mucous membranes during exposure (dose response not indicated). This study had major deficiencies in that there were no data reported on clinical signs or necropsy findings.
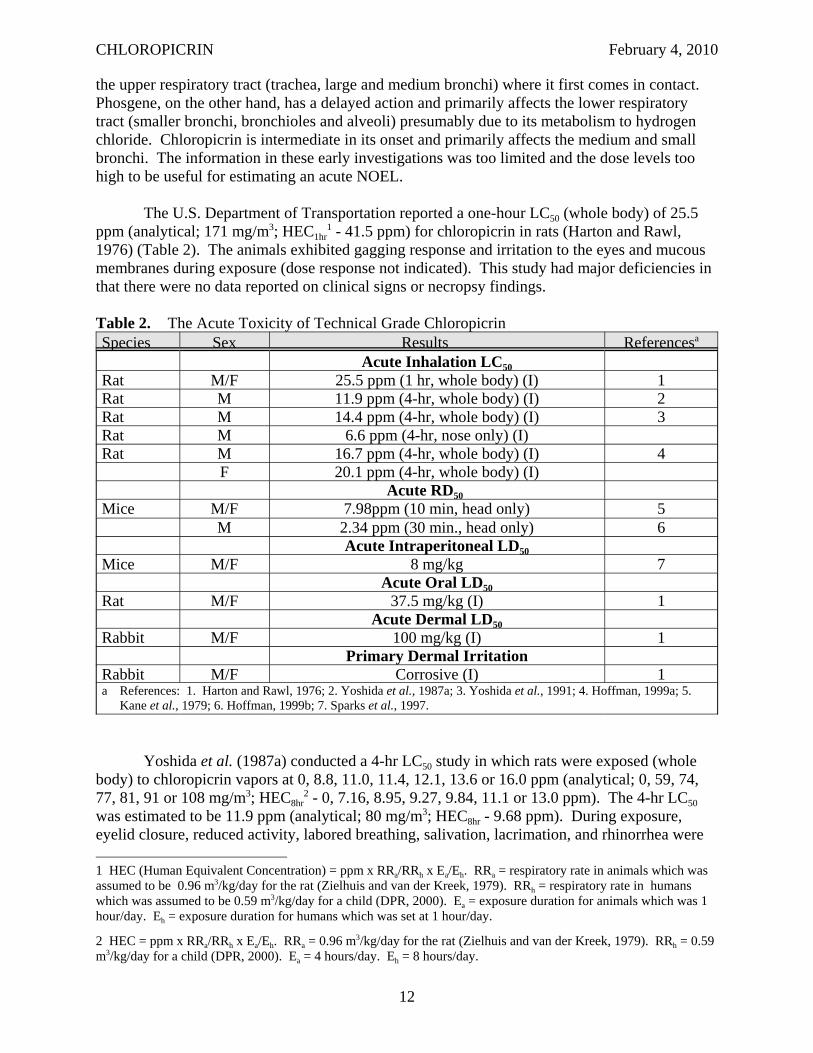
Table 2. The Acute Toxicity of Technical Grade Chloropicrin Species Sex Results Referencesa
Acute Inhalation LC50 Rat M/F 25.5 ppm (1 hr, whole body) (I) 1 Rat M 11.9 ppm (4-hr, whole body) (I) 2 Rat M 14.4 ppm (4-hr, whole body) (I) 3 Rat M 6.6 ppm (4-hr, nose only) (I) Rat M 16.7 ppm (4-hr, whole body) (I) 4
F 20.1 ppm (4-hr, whole body) (I) Acute RD50
Mice M/F 7.98ppm (10 min, head only) 5 M 2.34 ppm (30 min., head only) 6
Acute Intraperitoneal LD50 Mice M/F 8 mg/kg 7
Acute Oral LD50 Rat M/F 37.5 mg/kg (I) 1
Acute Dermal LD50 Rabbit M/F 100 mg/kg (I) 1
Primary Dermal Irritation Rabbit M/F Corrosive (I) 1 a References: 1. Harton and Rawl, 1976; 2. Yoshida et al., 1987a; 3. Yoshida et al., 1991; 4. Hoffman, 1999a; 5.
Kane et al., 1979; 6. Hoffman, 1999b; 7. Sparks et al., 1997.
Yoshida et al. (1987a) conducted a 4-hr LC50 study in which rats were exposed (whole body) to chloropicrin vapors at 0, 8.8, 11.0, 11.4, 12.1, 13.6 or 16.0 ppm (analytical; 0, 59, 74, 77, 81, 91 or 108 mg/m3; HEC8hr
2 - 0, 7.16, 8.95, 9.27, 9.84, 11.1 or 13.0 ppm). The 4-hr LC50 was estimated to be 11.9 ppm (analytical; 80 mg/m3; HEC8hr - 9.68 ppm). During exposure, eyelid closure, reduced activity, labored breathing, salivation, lacrimation, and rhinorrhea were
1 HEC (Human Equivalent Concentration) = ppm x RRa/RRh x Ea/Eh. RRa = respiratory rate in animals which was assumed to be 0.96 m3/kg/day for the rat (Zielhuis and van der Kreek, 1979). RRh = respiratory rate in humans which was assumed to be 0.59 m3/kg/day for a child (DPR, 2000). Ea = exposure duration for animals which was 1 hour/day. Eh = exposure duration for humans which was set at 1 hour/day.
2 HEC = ppm x RRa/RRh x Ea/Eh. RRa = 0.96 m3/kg/day for the rat (Zielhuis and van der Kreek, 1979). RRh = 0.59 m3/kg/day for a child (DPR, 2000). Ea = 4 hours/day. Eh = 8 hours/day.
12
CHLOROPICRIN February 4, 2010
seen. All but the labored breathing and lacrimation disappeared within a few hours after removal from the exposure chambers. Deaths were biphasic, occurring either within 24 hours or after 8 to 10 days. Animals that died exhibited gasping and cyanosis before dying. At necropsy, they had reduced body weights, increased absolute and relative (to body or brain) lung weights, diffuse pulmonary edema and emphysema, hydrothorax, scattered dark red patches in the lungs, and gastric gaseous distension. Survivors had similar gross pathological lesions at the study termination (day 14), except no hydrothorax. These investigators also exposed rats to chloropicrin for 30 minutes at 21.7 and 45.5 ppm (analytical; 146 and 306 mg/m3; HEC1hr - 17.7 and 37.0 ppm). They were unable to establish an exact LC50 for this exposure duration, but it appears to be between these two dose levels. A no-observed-effect level (NOEL) could not be established for either the 4-hour or the 30-minute exposure period.
An acute LC50 study in rats was also submitted to DPR by the Chloropicrin Manufacturers Task Force (Hoffman, 1999a). Five Sprague Dawley rats/sex/dose were exposed (whole body) to chloropicrin (purity > 99%) at 0, 10.5, 18.0 or 23.5 ppm (analytical; 0, 71, 121 or 158 mg/m3; HEC8hr
3 - 0, 8.54, 14.6 or 19.1 ppm) for 4 hours. Deaths occurred at 18.0 ppm (3 males, 1 female) and 23.5 ppm (5 males and 4 females) during the 2-day observation period. The clinical signs observed during exposure included labored breathing and/or gasping, decreased activity and closed eyes. After exposure, lacrimation, nasal discharge, salivation, dried brown material on face, labored breathing and/or gasping, and moist rales were observed. Significant decreases in the terminal body weights were seen at 10.5 and 18.0 ppm. Gross pathological findings included red lungs and fluid in the trachea and lungs. Numerous histopathological changes were seen in the respiratory tract at all treatment levels with little or no dose-related differences in the incidence or severity. Lumenal fibrin admixed with inflammatory cells, epithelial and/or mucosal necrosis, erosions, edema and inflammation were seen throughout the respiratory tract. Congestion of respiratory mucosa was observed in the nasoturbinates. Thin mucosal epithelium was seen in the nasopharynx and trachea. Vascular congestion was observed in the larynx and lungs. The lungs had bronchiolar and peribronchiolar chronic active inflammation and focal hemorrhages. No NOEL was established for clinical signs or pathological lesions. The estimated LC50 was 16.7 ppm (112 mg/m3; HEC8hr - 13.6 ppm) and 20.1 ppm (135 mg/m3; HEC8hr - 16.4 ppm) in males and females, respectively. This study did not meet FIFRA guidelines due to the short observation period. The LC50 values from this study are slightly higher than those reported by Yoshida, probably due to the delayed deaths that were seen in the Yoshida study 8 to 10 days after exposure.
Yoshida et al. (1991) compared the acute toxicity of chloropicrin vapors with whole body, nose only and dermal exposure in rats for 4 hours. The LC50 values with whole body and nose only were 14.4 and 6.6 ppm (actual; 96.8 and 44.4 mg/m3; HEC8hr
4 - 11.7 and 5.37 ppm), respectively. No deaths or toxic signs were observed at the one dose level, 25 ppm (actual: 168 mg/m3; HEC8hr - 20.3 ppm), tested with dermal exposure. Most of the deaths occurred within 24 hours. Clinical signs and pathological lesions similar to those in their previous study were seen in this study. Insufficient information was provided to establish a NOEL from this study, except with dermal exposure.
3 HEC = ppm x RRa/RRh x Ea/Eh. RRa = 0.96 m3/kg/day for the rat (Zielhuis and van der Kreek, 1979). RRh = 0.59 m3/kg/day for a child (DPR, 2000). Ea = 4 hours/day. Eh = 8 hours/day.
4 HEC = ppm x RRa/RRh x Ea/Eh. RRa = 0.96 m3/kg/day for the rat (Zielhuis and van der Kreek, 1979). RRh = 0.59 m3/kg/day for a child (DPR, 2000). Ea = 4 hours/day. Eh = 8 hours/day.
13
CHLOROPICRIN February 4, 2010
Sensory irritation is caused by the stimulation of unspecialized free nerve endings of the afferent trigeminal nerve located in the corneal, nasal and oral mucosa (Kane et al., 1979). Stimulation of the trigeminal nerve results in a burning or pungent sensation and numerous physiological reflex responses, including a reduction in respiratory rate. Based on earlier research by these investigators, they were able to show that a reduction in respiratory rate of mice was a good predictor of sensory irritation in man which shows a concentration-response relationship. The concentration which caused a 50% reduction in the respiratory rate (RD50) of mice is used to compare the relative potency of various irritants. They proposed that the RD50 would be an intolerable concentration in man. Kane et al. (1979) determined the RD50 of chloropicrin was 7.98 ppm (53.7 mg/m3; HEC1hr
5 - 4.06 ppm) with a 10-minute exposure. The Chloropicrin Manufacturers Task Force also submitted a sensory irritation study in mice (Hoffman, 1999b). Four Swiss-Webster male mice/dose were exposed (head only) to chloropicrin (purity > 99%) at 0.99, 3.20, 4.20, 7.25, 10.0 or 14.5 ppm (analytical: 6.7, 21.5, 28.2, 48.7, 67.2 or 97.5 mg/m3; HEC1hr
6 - 1.51, 4.88, 6.41, 11.1, 15.3 or 22.1 ppm) for 30 minutes. No mortalities or clinical signs were seen. The respiratory rate was decreased from pre-exposure level by 30, 55, 65, 72, 73, and 77% at the respective dose levels. The estimated RD50 was 2.34 ppm (15.7 mg/m3; HEC1hr - 3.57 ppm). Buckley et al. (1984) reported that mice exposed to chloropicrin at 7.98 ppm (10-min RD50) for 6 hrs/day for 5 days (HEC8hr
7 = 18.3 ppm) exhibited body weight reductions, nasal discharge, and gaseous distention of the abdomen. When examined histopathologically, the mice had inflammation, exfoliation, erosion, ulceration and necrosis of the upper respiratory epithelium and ulceration and necrosis of the olfactory epithelium. Lesions were also seen in the lower respiratory tract including severe fibrosing peribronchitis and peribronchiolitis. It is unclear from the data presented if any deaths occurred at 7.98 ppm. None of these studies were FIFRA guideline-type studies, but the study by Hoffman (1999b) was conducted in accordance with Good Laboratory Practice regulations.
The Department of Transportation also reported oral and dermal LD50 values for chloropicrin (Harton and Rawl, 1976). The oral LD50 in rats was 37.5 mg/kg. No other details were reported on clinical signs or necropsy findings. The dermal LD50 in rabbits was 100 mg/kg. Moderate edema was seen during the first 48 hours after exposure. Discoloration and necrosis were also reported. No details were reported on other clinical signs or necropsy findings. In a standard dermal irritation test in rabbits, they determined that chloropicrin was corrosive based on necrosis at 72 hours. Sparks et al. (1997) determined the LD50 for chloropicrin in mice to be 8 mg/kg after intraperitoneal injection. They also estimated the LD50 for the metabolites, CHCl2NO2, CH2ClNO2 and CH3NO2. Their respective LD50 values were 70, 56 and > 200 mg/kg. The signs of toxicity were similar to chloropicrin in that they were primarily neurological with tremors and seizures before death. No other details of clinical signs, body weights, food consumption or necropsy findings were reported.
5 HEC = ppm x RRa/RRh x Ea/Eh. RRa =1.8 m3/kg/day for the mouse (Zielhuis and van der Kreek, 1979). RRh = 0.59 m3/kg/day for a child (DPR, 2000). Ea = 10 minutes/day. Eh = 60 minutes/day.
6 HEC = ppm x RRa/RRh x Ea/Eh. RRa =1.8 m3/kg/day for the mouse (Zielhuis and van der Kreek, 1979). RRh = 0.59 m3/kg/day for a child (DPR, 2000). Ea = 30 minutes/day. Eh = 60 minutes/day.
7 HEC = ppm x RRa/RRh x Ea/Eh. RRa =1.8 m3/kg/day for the mouse (Zielhuis and van der Kreek, 1979). RRh = 0.59 m3/kg/day for a child (DPR, 2000). Ea = 6 hours/day. Eh = 8 hours/day.
14
CHLOROPICRIN February 4, 2010
II.B.2. Human Studies
II.B.2.a. Case Reports
During World War I, chloropicrin was used primarily in high explosive gas shells mixed with other gases due to its high boiling point and was rarely used alone (Underhill, 1920). Chloropicrin was not as poisonous as some of the other WWI warfare agents, but it penetrated gas masks more rapidly and produced nausea and vomiting. This forced the soldiers to remove their masks, exposing them to the more poisonous gases with which it had been mixed. Berghoff (1919) examined 2,000 cases of soldiers that survived gas attacks during World War I and only 38 cases involved chloropicrin exposure alone. Another 515 cases involved exposure to a mixture of gases, of which chloropicrin may have been one. Generally, the symptoms with chloropicrin were less severe than with other gases based on the percentage with coughs, other physical findings, and the average time in the hospital. No details were provided about the physical findings with chloropicrin. Since chloropicrin was usually used in combination with other gases, it was difficult to distinguish the effects due to chloropicrin from other WWI warfare agents. However, accidents in gas manufacturing plants have been useful in identifying effects (Lambert and Jackson, 1920). In humans, inhalation of chloropicrin results in immediate cough, nausea and vomiting. With higher or prolonged exposure, dyspnea, cyanosis, and weakness develop. Death usually occurs within a few hours. Even if initial symptoms are not severe, death may occur 3 or 4 days later due to respiratory infection. Other complications reported included nephritis. Fries and West (1921) reported that the eye is very sensitive to chloropicrin, causing essentially involuntary closing of the eye. Concentrations above 25 ppm caused the eye to close so rapidly after exposure that it was impossible to measure the time elapsed. Between 2 and 25 ppm, the eye closed within 3 to 30 seconds. Below 1 to 2 ppm, the eye did not close, but considerable blinking sometimes occurred. Prentiss (1937) reported that exposure to chloropicrin at 2 mg/L (297 ppm) or 0.8 mg/L (119 ppm) was lethal after 10 or 30 minutes, respectively. A concentration of 50 μg/L (7.4 ppm) was intolerable and concentrations as low as 2 μg/L (0.3 ppm) caused lacrimation. However, it is unclear if these are original observations or are based on research by others.
There are several case reports of effects in humans after accidental exposure to chloropicrin. In one case, the owner of a house released chloropicrin in the basement to get rid of bats 3 to 4 weeks before the new owners moved in (TeSlaa et al., 1986). In the week following the arrival at their new house, the family members (2 adults and 2 children) experienced runny noses, lacrimation and coughing. The father who was a smoker developed the most severe symptoms including a dry cough and red, edematous nasal and pharyngeal mucosa. He was diagnosed with bronchitis and sinusitis. A month later he developed a heart murmur and showed some thickening of the aortic valve with slight left ventricular dilatation. However, the cardiologist and consulting toxicologist concluded it was not related to chloropicrin exposure. The family dog, which was kept in the basement at night, developed lacrimation, dyspnea, and repeated coughing. It was diagnosed with bronchitis and pneumonia. Chloropicrin residues measured at 6, 18 and 38 weeks after application were 30, 2 and 2 ppb, respectively.
In October of 1984, the fumigation of a strawberry field (pre-plant) near Ceres, California, with methyl bromide and chloropicrin resulted in 32 people being seen at an emergency room with symptoms such as eye irritation, sore throat, headache, shortness of breath
15
CHLOROPICRIN February 4, 2010
and cough (Goldman et al., 1987). No air samples were taken at the time of the incident, but air samples taken the next day were negative (minimum detection limit was 1 ppb). Several days later, a community survey was conducted to determine the extent of the exposure and nature of symptoms experienced. Among 94 people reporting new illnesses after the incident, 32 adults and 4 children had symptoms consistent with exposure to either methyl bromide or chloropicrin. The vast majority (31 adults and 4 children) had symptoms that were attributed to chloropicrin poisoning. The most common symptoms attributed to chloropicrin exposure were eye irritation (65%), headache (48%), throat irritation (45%) and unusual odors (39%). The reporting of symptoms was related to the distance from the field with 30% of the people living or working within 1 kilometer of the field.
In an unusual incident in Japan, an 18-year-old woman and 21-year-old man were sprayed with chloropicrin by an assailant while parked in a car on a farm road (Gonmori et al., 1987). The woman was transferred to a hospital 75 minutes after the incident, but died 3 hours later. Dark purple discoloration of the skin and pulmonary edema were the main findings at autopsy. Chemical analysis of lung tissue and wiped samples from the car confirmed the presence of chloropicrin. The male survivor of the incident recovered after spending 30 days in the hospital. No details were reported of his symptoms.
In an incident in Belgium, a farmer accidentally fumigated a greenhouse with a mixture of chloropicrin and metam-sodium due to a mislabeling of a bottle containing pure chloropicrin as metam-sodium (Selala et al., 1989). The fumes escaped through the vents of the greenhouse and dissipated into neighboring areas. A number of animals (2,500 turkeys, numerous ducklings, 4 sheep, and a goat) adjacent to the greenhouse died as a result of exposure to the fumes. No human fatalities were reported, but residents within a 200 to 600 meter radius of the greenhouse reported various complaints including eye irritation, lacrimation, coughing, runny nose, nausea, sore throat, headache, dyspnea, and skin irritations. Thirty-five people including some rescue workers were admitted to an emergency room. Seven of these 35 people had elevated methemoglobin levels. Based on the complaints, the investigators estimated that the air concentration of chloropicrin was between 0.05 and 0.1 mg/L (7.5 and 15 ppm, approximately).
Three workers from a freight transportation company were briefly exposed to chloropicrin while unloading palettes of canisters containing methyl bromide or chloropicrin from a trailer truck (Prudhomme et al., 1999). Apparently several of the chloropicrin canisters were overfilled at the factory and residue had evaporated from the outside of the canister. One worker was initially exposed for approximately a minute before severe eye irritation and burning chest pain forced him to leave the truck. A co-worker was exposed for about 30 seconds before eye irritation caused him to leave. The third person, a supervisor, held his breath during the 15 seconds while he was inside. The first worker had the most severe symptoms including unusual taste or odor, eye, nose and throat irritation, runny nose, headache, nausea, dizziness, lethargy, burning in chest, shortness of breath, stomach/abdominal and generalized muscle cramping, rash, pleuritic chest pain, dysphagia, dysuria, anxiety, fatigue, and peripheral numbness. Laboratory results showed a marked elevation in his serum creatine phosphokinase activity. After his discharge from the hospital 4 days later, he continued to experience headaches and diffuse muscular pain in his upper extremities, chest and abdomen. He remained off work for several months due to lethargy, musculoskeletal pain and poor tolerance to exertion. The second worker experienced less severe symptoms (eye irritation, nausea, shortness of breath, abdominal and stomach cramping, fatigue) and slightly elevated serum creatine phosphokinase activity. He was
16
CHLOROPICRIN February 4, 2010
released from the hospital after 2 days and returned to light-duty work 11 days after the incident. The supervisor had the mildest symptoms (headache, nausea, lethargy, chest pain, and stomach cramping). He was discharged after being seen in the emergency room.
From 1992 to 2007, there were a total of 1,015 cases with health effects definitely, probably, or possibly related to chloropicrin exposure reported to the California Pesticide Illness Surveillance Program (Beauvais, 2010; Oriel et al., 2009). Of these, 571 cases were associated with six incidents where chloropicrin was the sole active ingredient. Two major incidents were responsible for most of these illness reports. One incident in Kern County in 2003 was associated with 165 cases following the application of 100% chloropicrin over a 2-day period to fallow land with a buffer zone of 18 m. The chloropicrin was injected in the soil and applicators attempted to confine the fumigant by dragging a weighted board behind the tractor, but they did not compact the soil. Complaints of eye and throat irritation were reported each evening after the applications, but the source of the irritation was not located until the second evening. In 2005, another 324 cases were associated with an application of 94% chloropicrin in Monterey County. The fumigant was applied to a tarped bedded field through a drip irrigation system which apparently was not flushed with an adequate amount of water. Complaints occurred up to 3 miles from the application site and mostly involved odor and eye irritation. Another 204 cases were associated with 61 incidents where chloropicrin was used as an active ingredient in combination with other fumigants, all involving soil fumigation. In 230 cases, chloropicrin was used as a warning agent with other fumigants which involved 164 incidents. Most of these cases (176 cases) were related to its use as a warning agent in structural fumigation.
Systemic effects as well as local effects to the eye, respiratory tract and skin were reported. Eye irritation was seen in 96% of the cases where chloropicrin was used alone, but was seen in only 72% of the cases where it was used as an active ingredient in combination with another fumigant and in only 46% of the cases where it was used as a warning agent in combination with another fumigant. Systemic effects showed the opposite trend with the highest percentage of cases (64%) with systemic effects associated with the use of chloropicrin as a warning agent and the lowest percentage of cases (32%) associated with its use as an active ingredient alone. The incidence of respiratory effects also tended to be greater with the warning agent use (22%) and in combination with other fumigants (17%) compared to chloropicrin alone (2.5%).
II.B.2.b. Controlled Study
The sensory irritation potential of chloropicrin vapors was evaluated in human subjects by Cain (2004). Young adults were used for this study because it has been observed that olfactory and trigeminal nerve sensitivity declines with age (Cain et al., 1995; Hummel et al., 2003; Kjaergaard et al., 1992; Shusterman et al. 2003; Wysocki et al., 2003). Subjects underwent a physical examination to ensure that subjects were healthy, nonsmokers free from exposure to chloropicrin, mood-altering drugs and medications that could interfere with the conduct of the study and the female subjects were not pregnant. Potential subjects underwent a brief odor identification test to ensure their sense of smell was normal. The study was divided into three phases. Some subjects participated in more than one phase of the study. In phase 1, the odor, nasal and ocular sensitivity was evaluated in subjects who were asked if they could detect the presence of chloropicrin by odor, ocular “feel” or nasal “feel” after brief exposures (5 seconds for odor and nasal localization and 25 seconds for ocular) to increasing concentrations at
17
CHLOROPICRIN February 4, 2010
356, 533, 800 and 1200 ppb. Each subject was exposed to the 4 different levels in 30 rounds. The subjects were blinded to their exposure by randomly exposing them through one of 3 cones at a station, which varied from trial to trial. With ocular detection, the subjects wore nose clips. For nasal localization, tubes from separate cones were directed to the left and right nostrils. For odor detection, 62 subjects (32 males, 30 females) were tested. The median level of detection for odor was 700 ppb (males - 590 ppb; females - 810 ppb). The ocular detection was tested in 63 subjects (32 males, 31 females). The median level of detection by eye irritation was 900 ppb (males - 790 ppb males; females - 1010 ppb). Nasal localization was only tested in 20 subjects. Due to their inability to localize nasal irritation, no additional subjects were tested.
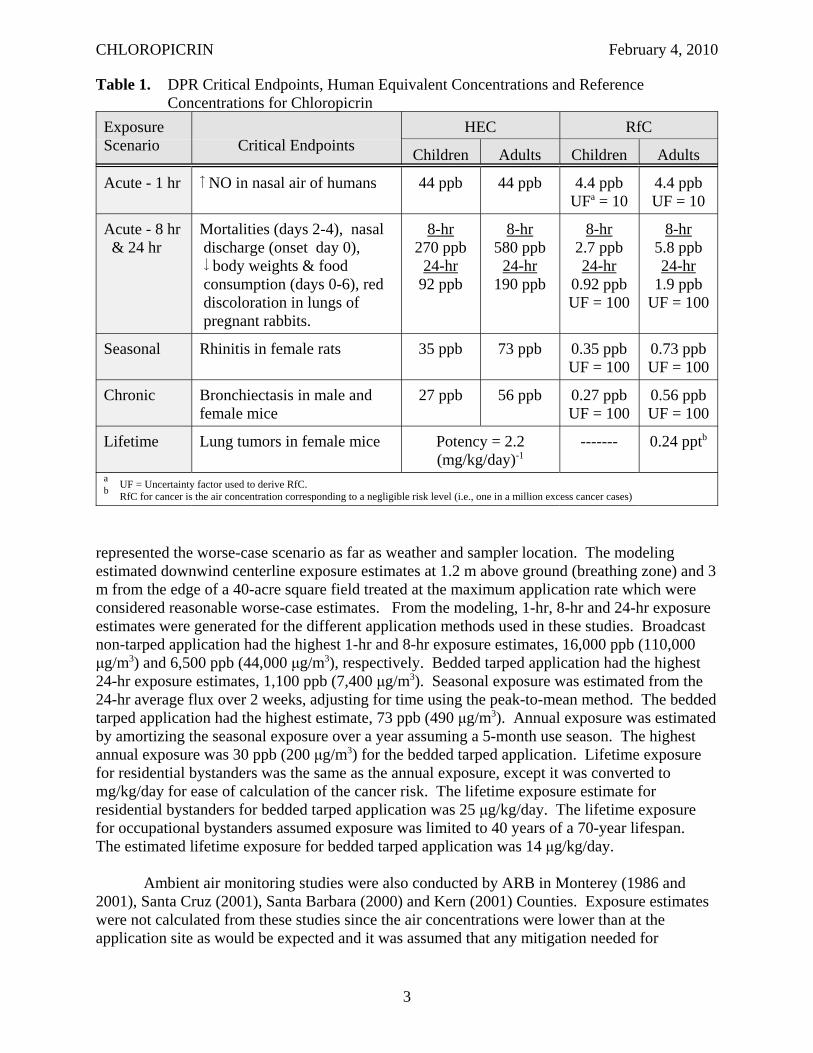
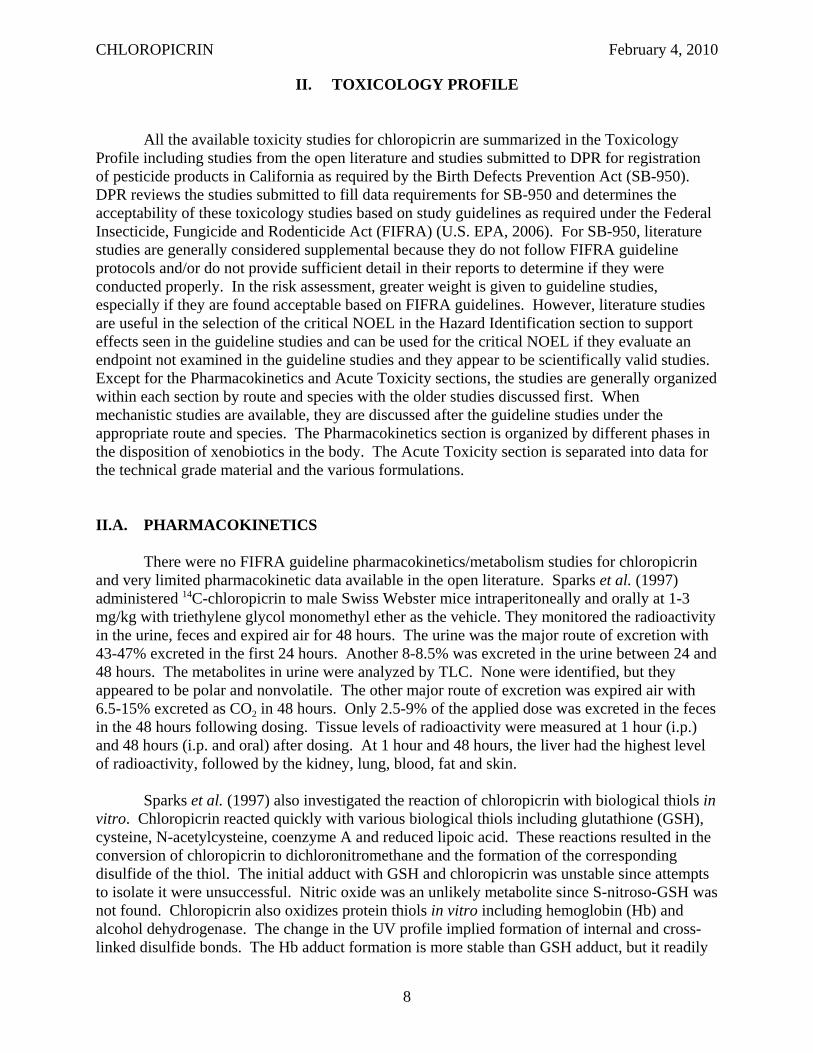
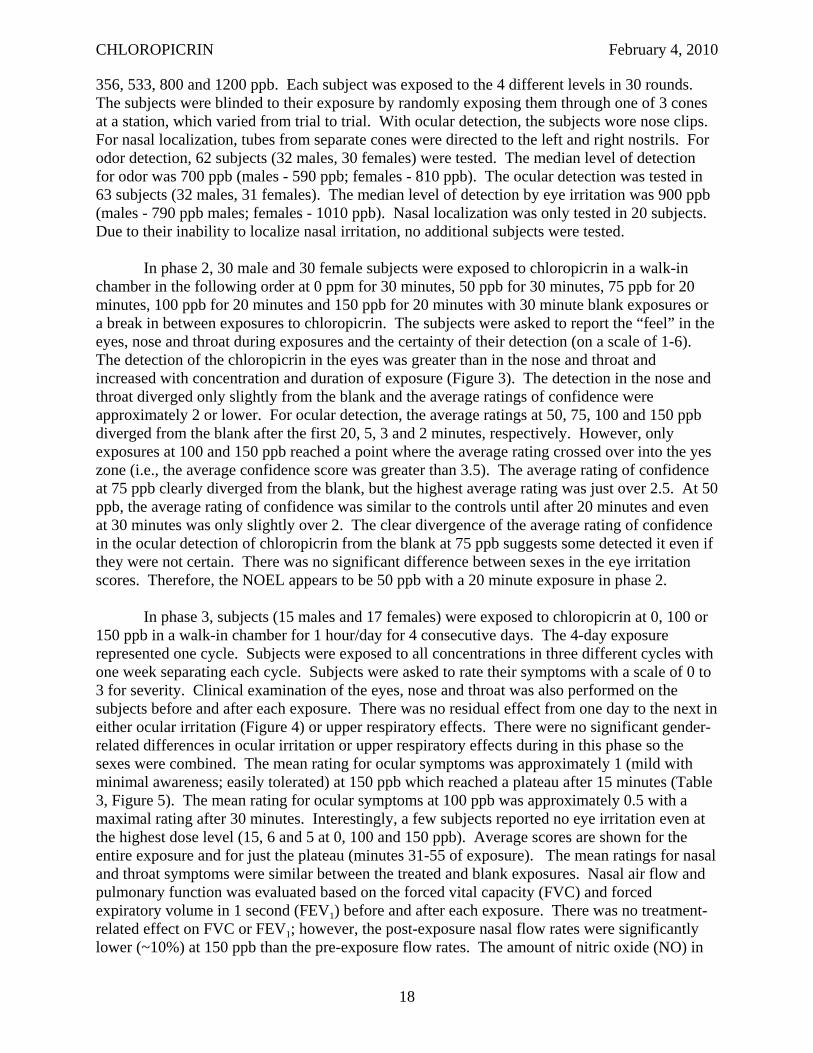
In phase 2, 30 male and 30 female subjects were exposed to chloropicrin in a walk-in chamber in the following order at 0 ppm for 30 minutes, 50 ppb for 30 minutes, 75 ppb for 20 minutes, 100 ppb for 20 minutes and 150 ppb for 20 minutes with 30 minute blank exposures or a break in between exposures to chloropicrin. The subjects were asked to report the “feel” in the eyes, nose and throat during exposures and the certainty of their detection (on a scale of 1-6). The detection of the chloropicrin in the eyes was greater than in the nose and throat and increased with concentration and duration of exposure (Figure 3). The detection in the nose and throat diverged only slightly from the blank and the average ratings of confidence were approximately 2 or lower. For ocular detection, the average ratings at 50, 75, 100 and 150 ppb diverged from the blank after the first 20, 5, 3 and 2 minutes, respectively. However, only exposures at 100 and 150 ppb reached a point where the average rating crossed over into the yes zone (i.e., the average confidence score was greater than 3.5). The average rating of confidence at 75 ppb clearly diverged from the blank, but the highest average rating was just over 2.5. At 50 ppb, the average rating of confidence was similar to the controls until after 20 minutes and even at 30 minutes was only slightly over 2. The clear divergence of the average rating of confidence in the ocular detection of chloropicrin from the blank at 75 ppb suggests some detected it even if they were not certain. There was no significant difference between sexes in the eye irritation scores. Therefore, the NOEL appears to be 50 ppb with a 20 minute exposure in phase 2.
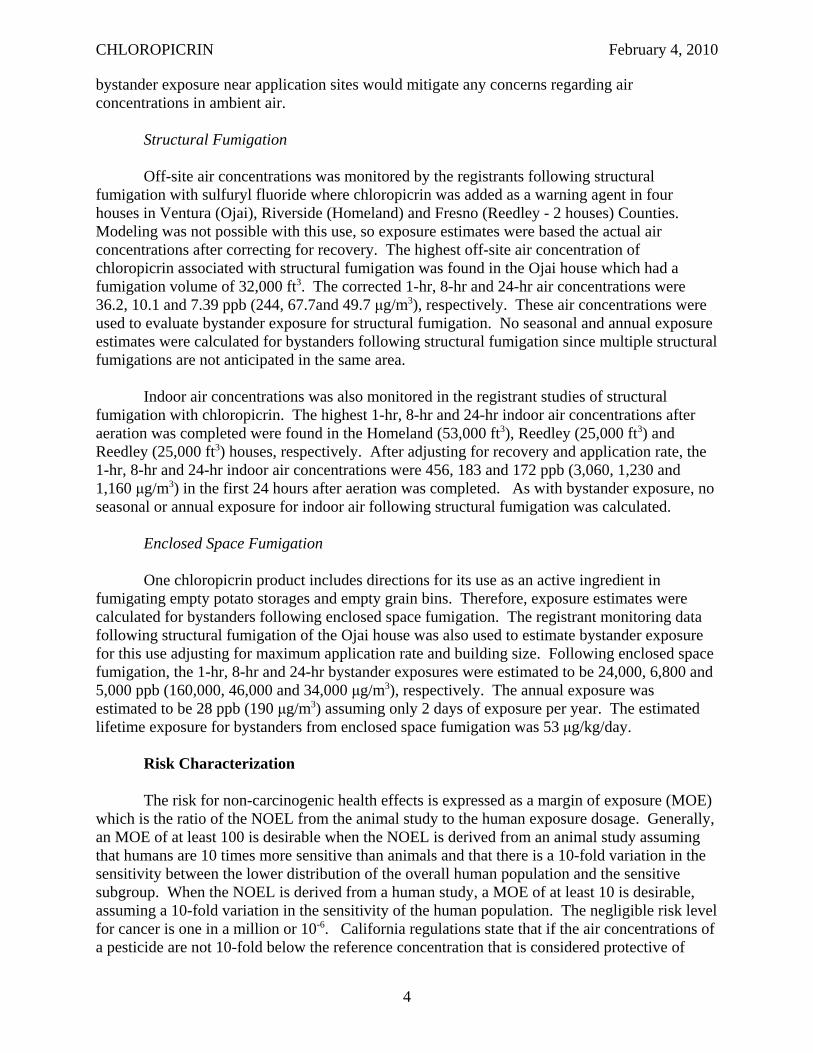
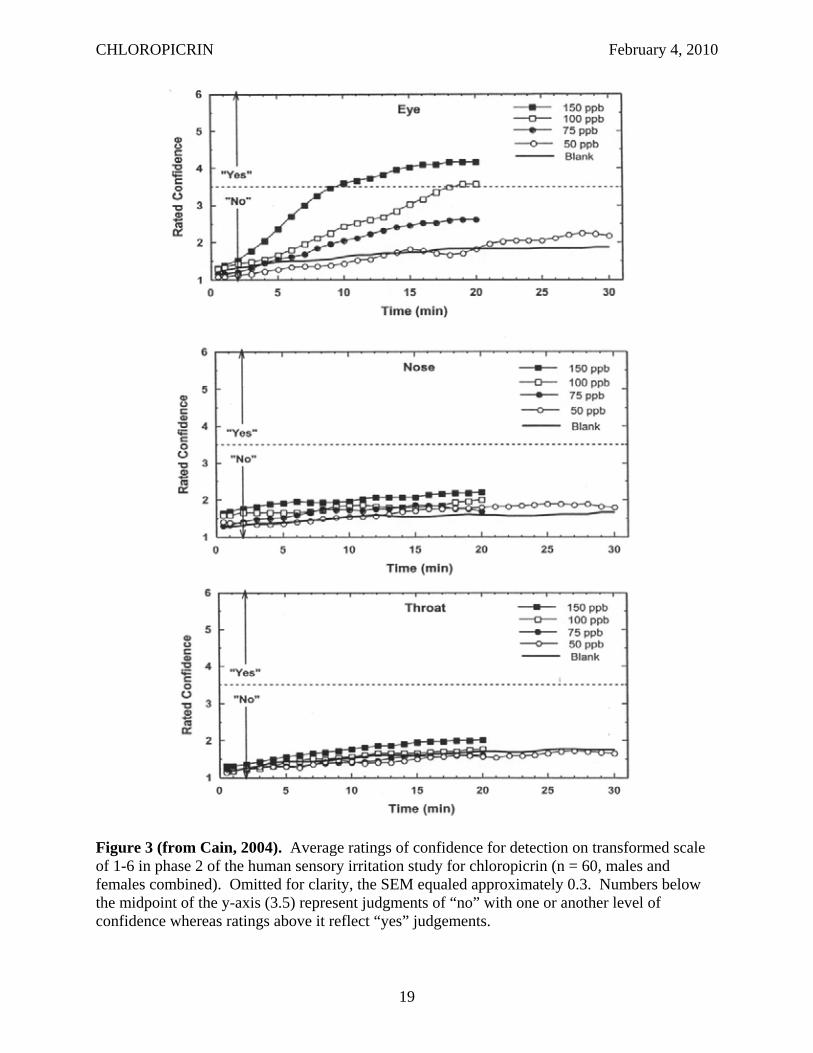
In phase 3, subjects (15 males and 17 females) were exposed to chloropicrin at 0, 100 or 150 ppb in a walk-in chamber for 1 hour/day for 4 consecutive days. The 4-day exposure represented one cycle. Subjects were exposed to all concentrations in three different cycles with one week separating each cycle. Subjects were asked to rate their symptoms with a scale of 0 to 3 for severity. Clinical examination of the eyes, nose and throat was also performed on the subjects before and after each exposure. There was no residual effect from one day to the next in either ocular irritation (Figure 4) or upper respiratory effects. There were no significant gender-related differences in ocular irritation or upper respiratory effects during in this phase so the sexes were combined. The mean rating for ocular symptoms was approximately 1 (mild with minimal awareness; easily tolerated) at 150 ppb which reached a plateau after 15 minutes (Table 3, Figure 5). The mean rating for ocular symptoms at 100 ppb was approximately 0.5 with a maximal rating after 30 minutes. Interestingly, a few subjects reported no eye irritation even at the highest dose level (15, 6 and 5 at 0, 100 and 150 ppb). Average scores are shown for the entire exposure and for just the plateau (minutes 31-55 of exposure). The mean ratings for nasal and throat symptoms were similar between the treated and blank exposures. Nasal air flow and pulmonary function was evaluated based on the forced vital capacity (FVC) and forced expiratory volume in 1 second (FEV1) before and after each exposure. There was no treatment-related effect on FVC or FEV1; however, the post-exposure nasal flow rates were significantly lower (~10%) at 150 ppb than the pre-exposure flow rates. The amount of nitric oxide (NO) in
18
CHLOROPICRIN February 4, 2010
Figure 3 (from Cain, 2004). Average ratings of confidence for detection on transformed scale of 1-6 in phase 2 of the human sensory irritation study for chloropicrin (n = 60, males and females combined). Omitted for clarity, the SEM equaled approximately 0.3. Numbers below the midpoint of the y-axis (3.5) represent judgments of “no” with one or another level of confidence whereas ratings above it reflect “yes” judgements.
19
CHLOROPICRIN February 4, 2010
Figure 4 (from Cain, 2004). Ratings of ocular symptoms in the chamber by day of exposure in phase 3. Each point represents the average of five minutes of exposure (n = 32, males and females combined). Blank air shown by unfilled circles, 100 ppb by filled circles and 150 ppb by unfilled squares.
Table 3. Ocular and Nasal Irritation in Human Subjects after 1-Hour Exposures for 4 Consecutive Days to Chloropicrina
Dose Level (ppm)
0 100 150
Ocular Irritation Average score, overallb 0.10±0.19c 0.39±0.39 0.77±0.70
Average score, plateaue 0.12±0.22 0.54±0.51 0.94±0.85
Nasal Irritation Average difference in NO in expired nasal aird
1.6±15.6 12.0±11.9 12.7±16.6
a Cain, 2004. b. The average score for ocular irritation overall is the average of the reported severity score for every minute of the 1 hour exposure for all
four days of exposure. The severity score had a four point scale from 0 (no symptom) to 3 (severe; symptom hard to tolerate and can interfere with activities of daily living or sleeping).
c mean±standard deviation. n = 32, males and females combined since no significant gender-related differences. d The average difference in the nitric oxide (NO) concentration (ppb) in expired nasal air is the average of the difference in the pre- and
post-exposure levels in expired nasal air for an each individual for all four days of exposure. Increased NO production is an indication of inflammation. Individual increases of greater than 25% are considered clinically significant.
20
CHLOROPICRIN February 4, 2010
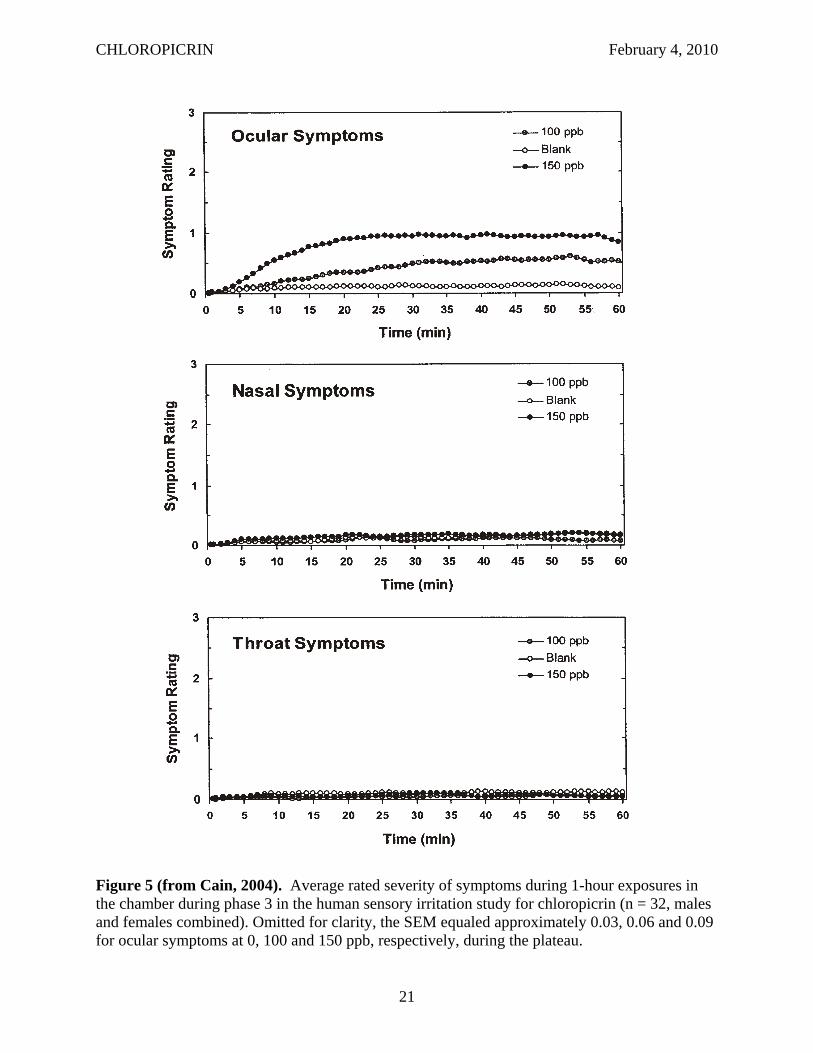
Figure 5 (from Cain, 2004). Average rated severity of symptoms during 1-hour exposures in the chamber during phase 3 in the human sensory irritation study for chloropicrin (n = 32, males and females combined). Omitted for clarity, the SEM equaled approximately 0.03, 0.06 and 0.09 for ocular symptoms at 0, 100 and 150 ppb, respectively, during the plateau.
21
CHLOROPICRIN February 4, 2010
the exhaled air of subjects was measured for the lungs and nose before and after each exposure as an indicator of respiratory inflammation. The NO in expired nasal air was significantly elevated at both 100 and 150 ppb, although the dose response was relatively flat (Table 3). The investigators suggested that the reduced air flow at 150 ppb was due to some engorgement which may have impeded the diffusion of NO from the tissue resulting in the flat dose response. The NOEL in phase 3 appears to be less than 100 ppb based on ocular irritation and upper respiratory changes in NO production and airflow. See the Risk Assessment section (Section III.A.1) and the Risk Appraisal section (Section IV.A) of this document for a discussion of the benchmark dose analysis of this study. Although there currently are no FIFRA guidelines for conducting human studies, this study was conducted in accordance with Good Laboratory Practice regulations and was approved by the Internal Review Board of the University of California, San Diego, which reviewed the protocol and informed consent forms signed by subjects. In addition, the study protocol was reviewed prior to the study start by a biostatistician, Dr. Robert Sielken, to ensure there was sufficient statistical power. The study was also reviewed by U.S. EPA’s Human Studies Review Board and found the be ethically conducted and scientifically valid.
II.B.3. Formulations
All of the currently registered formulations containing chloropicrin are labeled as Category I pesticides and as such, are not required to submit acute toxicity data to DPR to register them in California. Consequently, DPR has no acute toxicity data on file for the formulations containing methyl bromide or 1,3-dichloropropene, except for one 1,3dichloropropene/chloropicrin formulation which is not currently registered.
II.C. SUBCHRONIC TOXICITY
Summary: Four subacute/subchronic toxicity studies in rats were available for chloropicrin, two inhalation toxicity studies and two oral toxicity studies (one 10-day and one 90-day study). In addition, one subchronic inhalation toxicity study in mice was conducted. Three of the studies are published reports and two others were conducted by registrants in accordance with FIFRA guidelines. It is uncertain if the published studies were conducted according to FIFRA guidelines. The effects seen in the inhalation studies included eye closure, reddened eyes, labored respiration, reduced activity, reduced body weights and food consumption, changes in hematological and clinical chemistry values, increased lung weights and various histopathological lesions in the nasal cavity and lungs. A NOEL of 0.3 ppm (2.20 mg/m3) was established in both rats (HEC - 0.088 ppm) and mice (HEC - 0.16 ppm). The effects seen with oral administration in rats included reduced body weights, changes in thymus, liver and spleen weights, changes in hematological and clinical chemistry values, and histopathological lesions in the forestomach (nonglandular stomach). The NOEL in the 90-day oral gavage study appears to be 8 mg/kg/day based on body weight reduction, hematological changes and histological changes in the forestomach.
22
CHLOROPICRIN February 4, 2010
II.C.1. Inhalation-Mouse
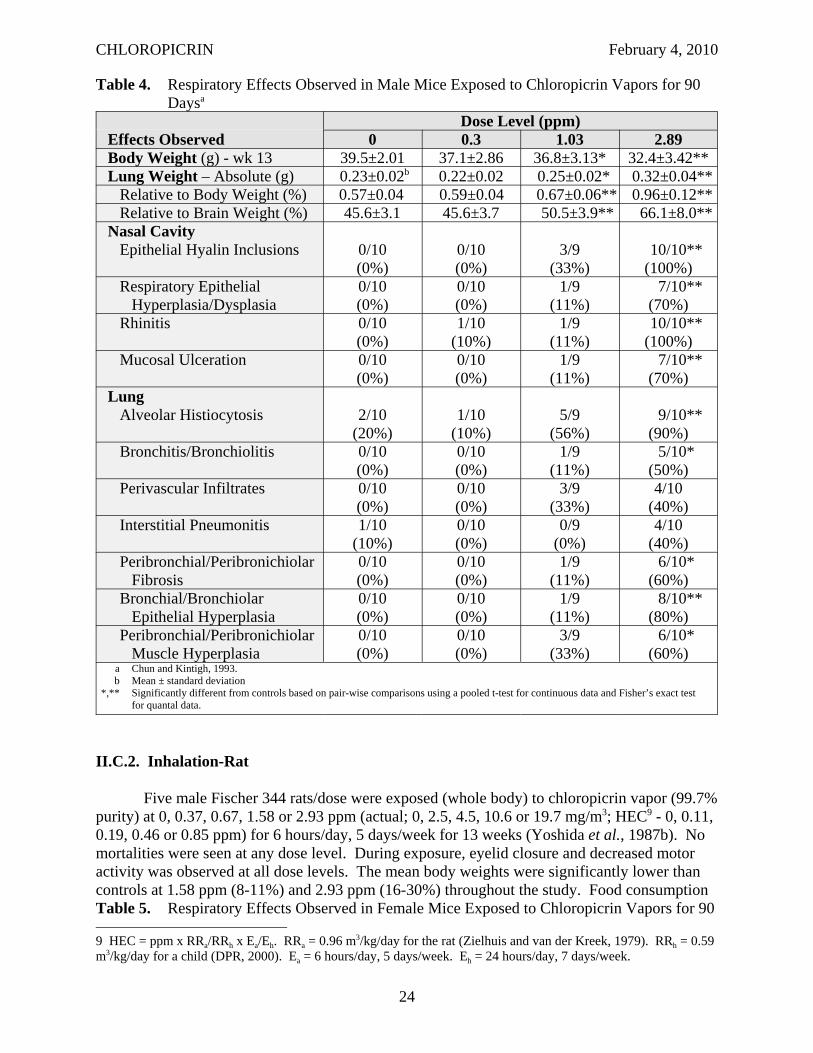
CD-1® mice (10 mice/sex/dose) were exposed (whole body) to chloropicrin vapors (99.6% purity) at 0, 0.3, 1.03 or 2.89 ppm (actual; 0, 2.02, 6.93 or 19.4 mg/m3; HEC8 - 0, 0.16, 0.56 or 1.57 ppm) for 6 hours/day, 5 days/week for 13 weeks (Chun and Kintigh, 1993). One male at 1.03 ppm was found dead and one control female was sacrificed in extremis, but these deaths were not considered treatment-related. The only clinical sign observed during exposure were blepharospasm (tonic spasm of the orbicularis oculi muscle, producing more or less complete closure of the eye) at 2.89 ppm. After exposure, dehydration was observed in mice at 2.89 ppm during the first 2 weeks of exposure. Male mice had significantly reduced body weights (1.03 ppm – 7%; 2.89 ppm - 17%) and body weight gains (1.03 ppm – 44%; 2.89 ppm – 95%). Female mice at 2.89 ppm also had significantly reduced body weights (8%) and body weight gain (58%). The food consumption was significantly reduced in both sexes at 1.03 ppm (M: 9-12%; F: 13-25%) and 2.89 ppm (M: 17-38%; F: 17-44%). Male mice had significant increases in red blood cell (RBC) and eosinophil counts and significant decreases of the mean cell volume (MCV) and mean corpuscular hemoglobin (MCH). Female mice only had a significant decrease in monocytes at 1.03 ppm. Total serum protein, albumin and calcium were significantly elevated in male mice at 2.89 ppm. Blood urea nitrogen (BUN) was significantly reduced at 0.3 and 2.89 ppm, but did not show a clear dose response relationship. Only globulin levels were significantly elevated in females at 2.89 ppm. The toxicological significance of the hematological and clinical chemistry changes is uncertain. Significant reductions in organ weights were seen in both sexes at 2.89 ppm including liver (absolute: M&F), kidneys (absolute: M; relative to brain: M) and spleen (absolute: M&F; relative to body: M; relative to brain: M&F). A significant reduction was seen in spleen weights of males at 0.3 ppm (absolute, relative body and relative to brain) and in liver weights of females at 1.03 ppm (absolute and relative to brain). Lung weights were significantly elevated at 1.03 and 2.89 ppm in both sexes (absolute, relative body and relative brain) (Tables 4 and 5). Significant increases in histopathological lesions were seen in the nasal cavity of both sexes at 2.89 ppm including epithelial hyalin inclusions, respiratory epithelial hyperplasia/dysplasia, rhinitis and mucosal ulceration (Tables 4 and 5). Females at 1.03 ppm also had a significant increase in epithelial hyalin inclusions in the nasal cavity. Numerous histopathological lesions were found in the lungs of both sexes at 2.89 ppm including alveolar histiocytosis, bronchitis/bronchiolitis, perivascular infiltrates, interstitial pneumonitis, peribronchial/peribronchiolar fibrosis, bronchial/bronchiolar epithelial hyperplasia and peribronchial/peribronchiolar muscle hyperplasia (Tables 4 and 5). Alveolar histiocytosis and bronchial/bronchiolar epithelial hyperplasia were also significantly elevated at 1.03 ppm in females. The increases in lung weights were probably related to the histopathological lesions found in the lung. The toxicological significance of the reduction in the other organ weights is uncertain, but may be related to the reduced body weights. The NOEL appears to be 0.3 ppm (2.02 mg/m3; HEC - 0.16 ppm) based on reduced body weights in males, reduced food consumption in both sexes, increased lung weights in both sexes and lesions in the nasal cavity and lungs of females at 1.03 ppm. This study was found acceptable to DPR toxicologists based on the FIFRA guidelines.
8 HEC = ppm x RRa/RRh x Ea/Eh. RRa =1.8 m3/kg/day for the mouse (Zielhuis and van der Kreek, 1979). RRh = 0.59 m3/kg/day for a child (DPR, 2000). Ea = 6 hours/day, 5 days/week. Eh = 24 hours/day, 7 days/week.
23
CHLOROPICRIN February 4, 2010
Table 4. Respiratory Effects Observed in Male Mice Exposed to Chloropicrin Vapors for 90 Daysa
Effects Observed Dose Level (ppm)
0 0.3 1.03 2.89 Body Weight (g) - wk 13 39.5±2.01 37.1±2.86 36.8±3.13* 32.4±3.42** Lung Weight – Absolute (g) 0.23±0.02b 0.22±0.02 0.25±0.02* 0.32±0.04**
Relative to Body Weight (%) 0.57±0.04 0.59±0.04 0.67±0.06** 0.96±0.12** Relative to Brain Weight (%) 45.6±3.1 45.6±3.7 50.5±3.9** 66.1±8.0**
Nasal Cavity Epithelial Hyalin Inclusions 0/10
(0%) 0/10 (0%)
3/9 (33%)
10/10** (100%)
Respiratory Epithelial Hyperplasia/Dysplasia
0/10 (0%)
0/10 (0%)
1/9 (11%)
7/10** (70%)
Rhinitis 0/10 (0%)
1/10 (10%)
1/9 (11%)
10/10** (100%)
Mucosal Ulceration 0/10 (0%)
0/10 (0%)
1/9 (11%)
7/10** (70%)
Lung Alveolar Histiocytosis 2/10
(20%) 1/10
(10%) 5/9
(56%) 9/10**
(90%) Bronchitis/Bronchiolitis 0/10
(0%) 0/10 (0%)
1/9 (11%)
5/10* (50%)
Perivascular Infiltrates 0/10 (0%)
0/10 (0%)
3/9 (33%)
4/10 (40%)
Interstitial Pneumonitis 1/10 (10%)
0/10 (0%)
0/9 (0%)
4/10 (40%)
Peribronchial/Peribronichiolar Fibrosis
0/10 (0%)
0/10 (0%)
1/9 (11%)
6/10* (60%)
Bronchial/Bronchiolar Epithelial Hyperplasia
0/10 (0%)
0/10 (0%)
1/9 (11%)
8/10** (80%)
Peribronchial/Peribronichiolar Muscle Hyperplasia
0/10 (0%)
0/10 (0%)
3/9 (33%)
6/10* (60%)
a Chun and Kintigh, 1993. b Mean ± standard deviation
*,** Significantly different from controls based on pair-wise comparisons using a pooled t-test for continuous data and Fisher’s exact test for quantal data.
II.C.2. Inhalation-Rat
Five male Fischer 344 rats/dose were exposed (whole body) to chloropicrin vapor (99.7% purity) at 0, 0.37, 0.67, 1.58 or 2.93 ppm (actual; 0, 2.5, 4.5, 10.6 or 19.7 mg/m3; HEC9 - 0, 0.11, 0.19, 0.46 or 0.85 ppm) for 6 hours/day, 5 days/week for 13 weeks (Yoshida et al., 1987b). No mortalities were seen at any dose level. During exposure, eyelid closure and decreased motor activity was observed at all dose levels. The mean body weights were significantly lower than controls at 1.58 ppm (8-11%) and 2.93 ppm (16-30%) throughout the study. Food consumption Table 5. Respiratory Effects Observed in Female Mice Exposed to Chloropicrin Vapors for 90
9 HEC = ppm x RRa/RRh x Ea/Eh. RRa = 0.96 m3/kg/day for the rat (Zielhuis and van der Kreek, 1979). RRh = 0.59 m3/kg/day for a child (DPR, 2000). Ea = 6 hours/day, 5 days/week. Eh = 24 hours/day, 7 days/week.
24
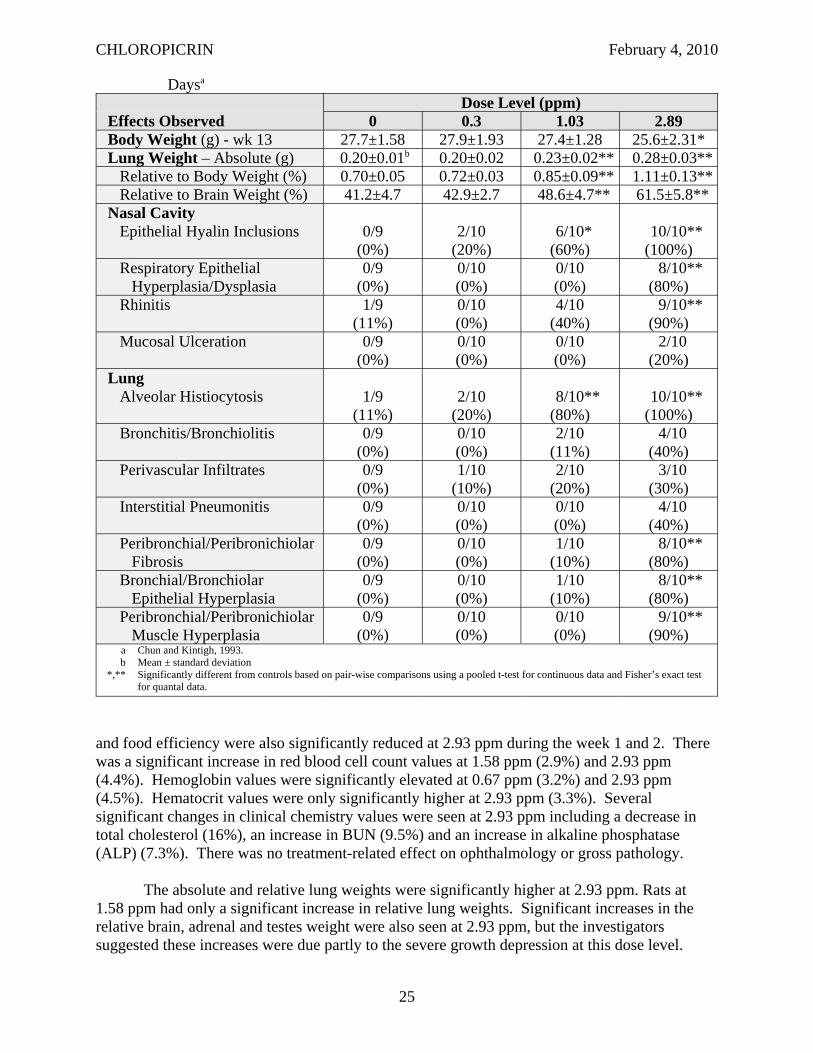
CHLOROPICRIN February 4, 2010
Daysa
Effects Observed Dose Level (ppm)
0 0.3 1.03 2.89 Body Weight (g) - wk 13 27.7±1.58 27.9±1.93 27.4±1.28 25.6±2.31* Lung Weight – Absolute (g) 0.20±0.01b 0.20±0.02 0.23±0.02** 0.28±0.03**
Relative to Body Weight (%) 0.70±0.05 0.72±0.03 0.85±0.09** 1.11±0.13** Relative to Brain Weight (%) 41.2±4.7 42.9±2.7 48.6±4.7** 61.5±5.8**
Nasal Cavity Epithelial Hyalin Inclusions 0/9
(0%) 2/10
(20%) 6/10* (60%)
10/10** (100%)
Respiratory Epithelial Hyperplasia/Dysplasia
0/9 (0%)
0/10 (0%)
0/10 (0%)
8/10** (80%)
Rhinitis 1/9 (11%)
0/10 (0%)
4/10 (40%)
9/10** (90%)
Mucosal Ulceration 0/9 (0%)
0/10 (0%)
0/10 (0%)
2/10 (20%)
Lung Alveolar Histiocytosis 1/9
(11%) 2/10
(20%) 8/10** (80%)
10/10** (100%)
Bronchitis/Bronchiolitis 0/9 (0%)
0/10 (0%)
2/10 (11%)
4/10 (40%)
Perivascular Infiltrates 0/9 (0%)
1/10 (10%)
2/10 (20%)
3/10 (30%)
Interstitial Pneumonitis 0/9 (0%)
0/10 (0%)
0/10 (0%)
4/10 (40%)
Peribronchial/Peribronichiolar Fibrosis
0/9 (0%)
0/10 (0%)
1/10 (10%)
8/10** (80%)
Bronchial/Bronchiolar Epithelial Hyperplasia
0/9 (0%)
0/10 (0%)
1/10 (10%)
8/10** (80%)
Peribronchial/Peribronichiolar Muscle Hyperplasia
0/9 (0%)
0/10 (0%)
0/10 (0%)
9/10** (90%)
a Chun and Kintigh, 1993. b Mean ± standard deviation
*,** Significantly different from controls based on pair-wise comparisons using a pooled t-test for continuous data and Fisher’s exact test for quantal data.
and food efficiency were also significantly reduced at 2.93 ppm during the week 1 and 2. There was a significant increase in red blood cell count values at 1.58 ppm (2.9%) and 2.93 ppm (4.4%). Hemoglobin values were significantly elevated at 0.67 ppm (3.2%) and 2.93 ppm (4.5%). Hematocrit values were only significantly higher at 2.93 ppm (3.3%). Several significant changes in clinical chemistry values were seen at 2.93 ppm including a decrease in total cholesterol (16%), an increase in BUN (9.5%) and an increase in alkaline phosphatase (ALP) (7.3%). There was no treatment-related effect on ophthalmology or gross pathology.
The absolute and relative lung weights were significantly higher at 2.93 ppm. Rats at 1.58 ppm had only a significant increase in relative lung weights. Significant increases in the relative brain, adrenal and testes weight were also seen at 2.93 ppm, but the investigators suggested these increases were due partly to the severe growth depression at this dose level.
25
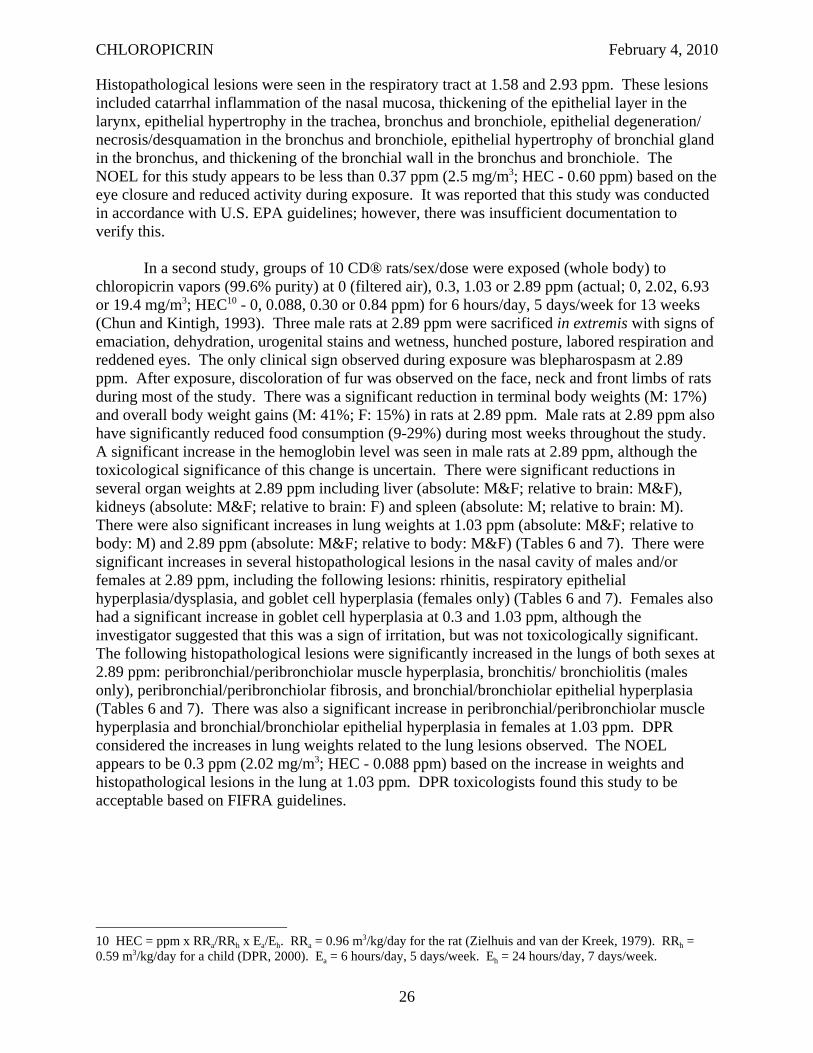
CHLOROPICRIN February 4, 2010
Histopathological lesions were seen in the respiratory tract at 1.58 and 2.93 ppm. These lesions included catarrhal inflammation of the nasal mucosa, thickening of the epithelial layer in the larynx, epithelial hypertrophy in the trachea, bronchus and bronchiole, epithelial degeneration/ necrosis/desquamation in the bronchus and bronchiole, epithelial hypertrophy of bronchial gland in the bronchus, and thickening of the bronchial wall in the bronchus and bronchiole. The NOEL for this study appears to be less than 0.37 ppm (2.5 mg/m3; HEC - 0.60 ppm) based on the eye closure and reduced activity during exposure. It was reported that this study was conducted in accordance with U.S. EPA guidelines; however, there was insufficient documentation to verify this.
In a second study, groups of 10 CD® rats/sex/dose were exposed (whole body) to chloropicrin vapors (99.6% purity) at 0 (filtered air), 0.3, 1.03 or 2.89 ppm (actual; 0, 2.02, 6.93 or 19.4 mg/m3; HEC10 - 0, 0.088, 0.30 or 0.84 ppm) for 6 hours/day, 5 days/week for 13 weeks (Chun and Kintigh, 1993). Three male rats at 2.89 ppm were sacrificed in extremis with signs of emaciation, dehydration, urogenital stains and wetness, hunched posture, labored respiration and reddened eyes. The only clinical sign observed during exposure was blepharospasm at 2.89 ppm. After exposure, discoloration of fur was observed on the face, neck and front limbs of rats during most of the study. There was a significant reduction in terminal body weights (M: 17%) and overall body weight gains (M: 41%; F: 15%) in rats at 2.89 ppm. Male rats at 2.89 ppm also have significantly reduced food consumption (9-29%) during most weeks throughout the study. A significant increase in the hemoglobin level was seen in male rats at 2.89 ppm, although the toxicological significance of this change is uncertain. There were significant reductions in several organ weights at 2.89 ppm including liver (absolute: M&F; relative to brain: M&F), kidneys (absolute: M&F; relative to brain: F) and spleen (absolute: M; relative to brain: M). There were also significant increases in lung weights at 1.03 ppm (absolute: M&F; relative to body: M) and 2.89 ppm (absolute: M&F; relative to body: M&F) (Tables 6 and 7). There were significant increases in several histopathological lesions in the nasal cavity of males and/or females at 2.89 ppm, including the following lesions: rhinitis, respiratory epithelial hyperplasia/dysplasia, and goblet cell hyperplasia (females only) (Tables 6 and 7). Females also had a significant increase in goblet cell hyperplasia at 0.3 and 1.03 ppm, although the investigator suggested that this was a sign of irritation, but was not toxicologically significant. The following histopathological lesions were significantly increased in the lungs of both sexes at 2.89 ppm: peribronchial/peribronchiolar muscle hyperplasia, bronchitis/ bronchiolitis (males only), peribronchial/peribronchiolar fibrosis, and bronchial/bronchiolar epithelial hyperplasia (Tables 6 and 7). There was also a significant increase in peribronchial/peribronchiolar muscle hyperplasia and bronchial/bronchiolar epithelial hyperplasia in females at 1.03 ppm. DPR considered the increases in lung weights related to the lung lesions observed. The NOEL appears to be 0.3 ppm (2.02 mg/m3; HEC - 0.088 ppm) based on the increase in weights and histopathological lesions in the lung at 1.03 ppm. DPR toxicologists found this study to be acceptable based on FIFRA guidelines.
10 HEC = ppm x RRa/RRh x Ea/Eh. RRa = 0.96 m3/kg/day for the rat (Zielhuis and van der Kreek, 1979). RRh = 0.59 m3/kg/day for a child (DPR, 2000). Ea = 6 hours/day, 5 days/week. Eh = 24 hours/day, 7 days/week.
26
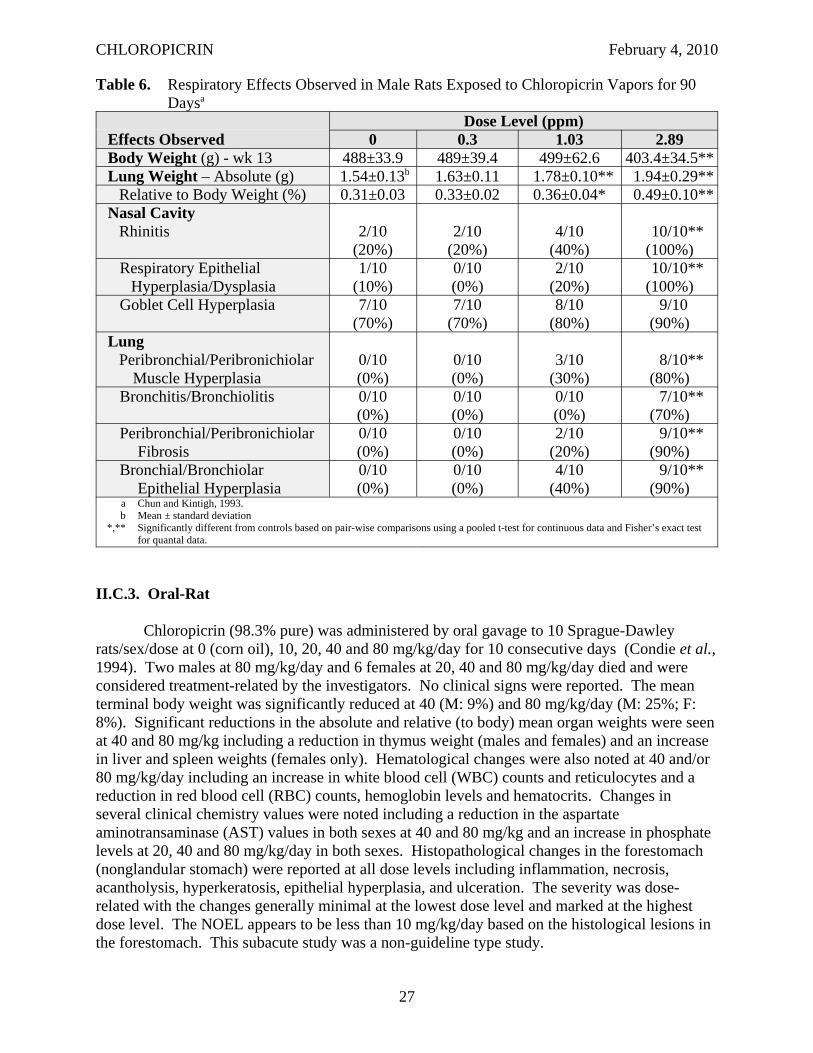
CHLOROPICRIN February 4, 2010
Table 6. Respiratory Effects Observed in Male Rats Exposed to Chloropicrin Vapors for 90 Daysa
Effects Observed Dose Level (ppm)
0 0.3 1.03 2.89 Body Weight (g) - wk 13 488±33.9 489±39.4 499±62.6 403.4±34.5** Lung Weight – Absolute (g) 1.54±0.13b 1.63±0.11 1.78±0.10** 1.94±0.29**
Relative to Body Weight (%) 0.31±0.03 0.33±0.02 0.36±0.04* 0.49±0.10** Nasal Cavity
Rhinitis 2/10 (20%)
2/10 (20%)
4/10 (40%)
10/10** (100%)
Respiratory Epithelial Hyperplasia/Dysplasia
1/10 (10%)
0/10 (0%)
2/10 (20%)
10/10** (100%)
Goblet Cell Hyperplasia 7/10 (70%)
7/10 (70%)
8/10 (80%)
9/10 (90%)
Lung Peribronchial/Peribronichiolar
Muscle Hyperplasia 0/10 (0%)
0/10 (0%)
3/10 (30%)
8/10** (80%)
Bronchitis/Bronchiolitis 0/10 (0%)
0/10 (0%)
0/10 (0%)
7/10** (70%)
Peribronchial/Peribronichiolar Fibrosis
0/10 (0%)
0/10 (0%)
2/10 (20%)
9/10** (90%)
Bronchial/Bronchiolar Epithelial Hyperplasia
0/10 (0%)
0/10 (0%)
4/10 (40%)
9/10** (90%)
a Chun and Kintigh, 1993. b Mean ± standard deviation
*,** Significantly different from controls based on pair-wise comparisons using a pooled t-test for continuous data and Fisher’s exact test for quantal data.
II.C.3. Oral-Rat
Chloropicrin (98.3% pure) was administered by oral gavage to 10 Sprague-Dawley rats/sex/dose at 0 (corn oil), 10, 20, 40 and 80 mg/kg/day for 10 consecutive days (Condie et al., 1994). Two males at 80 mg/kg/day and 6 females at 20, 40 and 80 mg/kg/day died and were considered treatment-related by the investigators. No clinical signs were reported. The mean terminal body weight was significantly reduced at 40 (M: 9%) and 80 mg/kg/day (M: 25%; F: 8%). Significant reductions in the absolute and relative (to body) mean organ weights were seen at 40 and 80 mg/kg including a reduction in thymus weight (males and females) and an increase in liver and spleen weights (females only). Hematological changes were also noted at 40 and/or 80 mg/kg/day including an increase in white blood cell (WBC) counts and reticulocytes and a reduction in red blood cell (RBC) counts, hemoglobin levels and hematocrits. Changes in several clinical chemistry values were noted including a reduction in the aspartate aminotransaminase (AST) values in both sexes at 40 and 80 mg/kg and an increase in phosphate levels at 20, 40 and 80 mg/kg/day in both sexes. Histopathological changes in the forestomach (nonglandular stomach) were reported at all dose levels including inflammation, necrosis, acantholysis, hyperkeratosis, epithelial hyperplasia, and ulceration. The severity was dose-related with the changes generally minimal at the lowest dose level and marked at the highest dose level. The NOEL appears to be less than 10 mg/kg/day based on the histological lesions in the forestomach. This subacute study was a non-guideline type study.
27
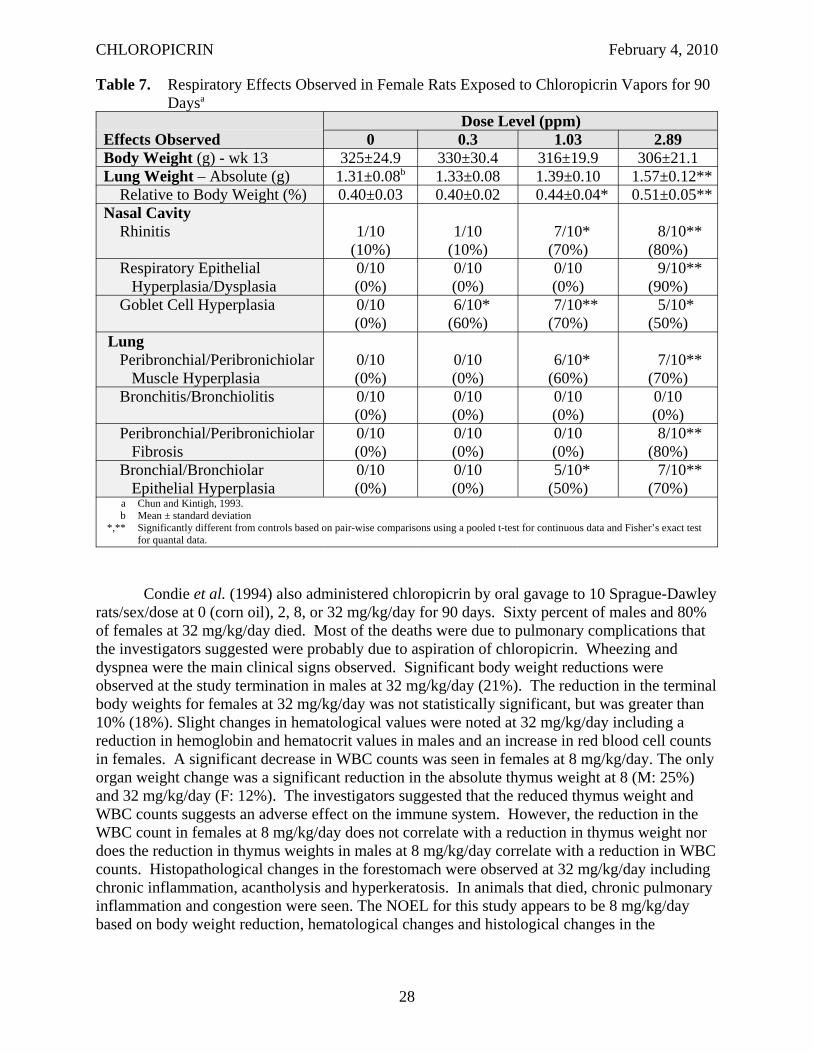
CHLOROPICRIN February 4, 2010
Table 7. Respiratory Effects Observed in Female Rats Exposed to Chloropicrin Vapors for 90 Daysa
Effects Observed Dose Level (ppm)
0 0.3 1.03 2.89 Body Weight (g) - wk 13 325±24.9 330±30.4 316±19.9 306±21.1 Lung Weight – Absolute (g) 1.31±0.08b 1.33±0.08 1.39±0.10 1.57±0.12**
Relative to Body Weight (%) 0.40±0.03 0.40±0.02 0.44±0.04* 0.51±0.05** Nasal Cavity
Rhinitis 1/10 (10%)
1/10 (10%)
7/10* (70%)
8/10** (80%)
Respiratory Epithelial Hyperplasia/Dysplasia
0/10 (0%)
0/10 (0%)
0/10 (0%)
9/10** (90%)
Goblet Cell Hyperplasia 0/10 (0%)
6/10* (60%)
7/10** (70%)
5/10* (50%)
Lung Peribronchial/Peribronichiolar
Muscle Hyperplasia 0/10 (0%)
0/10 (0%)
6/10* (60%)
7/10** (70%)
Bronchitis/Bronchiolitis 0/10 (0%)
0/10 (0%)
0/10 (0%)
0/10 (0%)
Peribronchial/Peribronichiolar Fibrosis
0/10 (0%)
0/10 (0%)
0/10 (0%)
8/10** (80%)
Bronchial/Bronchiolar Epithelial Hyperplasia
0/10 (0%)
0/10 (0%)
5/10* (50%)
7/10** (70%)
a Chun and Kintigh, 1993. b Mean ± standard deviation
*,** Significantly different from controls based on pair-wise comparisons using a pooled t-test for continuous data and Fisher’s exact test for quantal data.
Condie et al. (1994) also administered chloropicrin by oral gavage to 10 Sprague-Dawley rats/sex/dose at 0 (corn oil), 2, 8, or 32 mg/kg/day for 90 days. Sixty percent of males and 80% of females at 32 mg/kg/day died. Most of the deaths were due to pulmonary complications that the investigators suggested were probably due to aspiration of chloropicrin. Wheezing and dyspnea were the main clinical signs observed. Significant body weight reductions were observed at the study termination in males at 32 mg/kg/day (21%). The reduction in the terminal body weights for females at 32 mg/kg/day was not statistically significant, but was greater than 10% (18%). Slight changes in hematological values were noted at 32 mg/kg/day including a reduction in hemoglobin and hematocrit values in males and an increase in red blood cell counts in females. A significant decrease in WBC counts was seen in females at 8 mg/kg/day. The only organ weight change was a significant reduction in the absolute thymus weight at 8 (M: 25%) and 32 mg/kg/day (F: 12%). The investigators suggested that the reduced thymus weight and WBC counts suggests an adverse effect on the immune system. However, the reduction in the WBC count in females at 8 mg/kg/day does not correlate with a reduction in thymus weight nor does the reduction in thymus weights in males at 8 mg/kg/day correlate with a reduction in WBC counts. Histopathological changes in the forestomach were observed at 32 mg/kg/day including chronic inflammation, acantholysis and hyperkeratosis. In animals that died, chronic pulmonary inflammation and congestion were seen. The NOEL for this study appears to be 8 mg/kg/day based on body weight reduction, hematological changes and histological changes in the
28
CHLOROPICRIN February 4, 2010
forestomach. There was insufficient information in this published report to determine if this study met FIFRA guidelines.
II.D. CHRONIC TOXICITY/CARCINOGENICITY
Summary: Six chronic toxicity/carcinogenicity studies were available for chloropicrin. Two studies were mouse carcinogenicity studies (one oral, one inhalation). Three studies were rat chronic toxicity/carcinogenicity studies (two oral, one inhalation). One oral chronic toxicity study was conducted in dogs. Four of these studies met FIFRA guidelines. The effects observed with oral exposure included reduced survival, ptyalism, emesis, diarrhea, hunched posture, squinted or reddened eyes, reddened ears, urogenital stains, reduced body weights, hematological and clinical chemistry changes, nonneoplastic lesions in the forestomach/nonglandular stomach and liver, and neoplastic lesions in the mammary gland and stomach. The lowest NOEL with oral exposure was 0.1 mg/kg/day based on reduced body weights and periportal hepatocyte vacuolation in rats. The effects seen with inhalation exposure included reduced survival, reduced body weights and food consumption, increased lung weights, and nonneoplastic and neoplastic lesions in the respiratory tract. The lowest NOEL with inhalation exposure was 0.1 ppm (0.67 mg/m3) in both rats (HEC = 0.029 ppm) and mice (HEC = 0.054 ppm).
II.D.1. Inhalation-Mouse
Fifty CD-1 mice/sex/dose were exposed (whole body) to chloropicrin (99.6% pure) vapors at 0, 0.1, 0.5 or 1.0 ppm (analytical; 0, 0.67, 3.36 or 6.72 mg/m3; HEC11 - 0.054, 0.27 or 0.54 ppm) for 6 hours/day, 5 days/week for at least 78 weeks (Burleigh-Flayer et al., 1995). Surviving animals were sacrificed at week 82. There was no treatment-related effect on mortality or clinical signs. Significant decreases in the mean body weights (M: 3 and 7%; F: 4 and 10% at week 53) and the mean body weight gains (M: 8 and 24%; F: 15 and 35% at week 53) were seen at 0.5 and 1.0 ppm, respectively, throughout the study. Decreases in the mean food consumption corresponded with the body weight changes in males at 1.0 ppm and in females at 0.5 and 1.0 ppm. No treatment-related changes in hematological values were seen. Significant increases in absolute and/or relative lung weights (to body or brain) were seen in both sexes at 0.5 ppm (absolute – M: 14%) and 1.0 ppm (absolute – M: 16%; F: 36%). There was also a significant decrease in the absolute brain weight in females at 1.0 ppm (4%), but there were no microscopic findings in this tissue so the toxicological significance of this finding is uncertain. Macroscopic pathological changes were seen in the lung (color change, hyperinflation, nodules and/or masses) and kidney (cysts, size decrease and color change), primarily at 1.0 ppm. Significant increases in numerous microscopic lesions in the respiratory tract were seen in both sexes at 0.5 and 1.0 ppm (Tables 8 and 9). These microscopic lesions involved both the nasal cavity (serous exudate, epithelial hyalin inclusions, rhinitis, olfactory epithelial atrophy) and the lungs (alveolar protein deposits – females only, alveolar histiocytosis, peribronchial lymphocytic infiltrates, bronchiectasis, bronchial submucosal fibrosis, bronchioalveolar cell hyperplasia – females only, peribronchial smooth muscle hyperplasia – females only). The slight increase in adenomas and carcinomas in the lungs was significant by
11 HEC = ppm x RRa/RRh x Ea/Eh. RRa =1.8 m3/kg/day for the mouse (Zielhuis and van der Kreek, 1979). RRh = 0.59 m3/kg/day for a child (DPR, 2000). Ea = 6 hours/day, 5 days/week. Eh = 24 hours/day, 7 days/week.
29
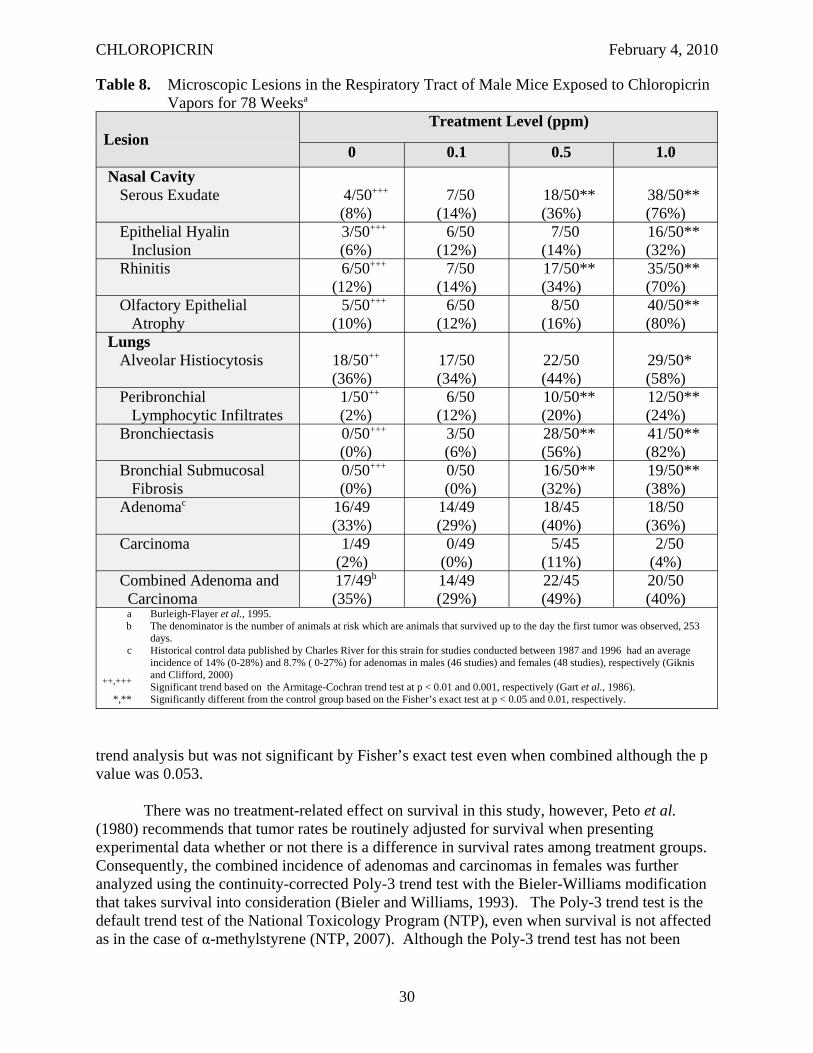
CHLOROPICRIN February 4, 2010
Table 8. Microscopic Lesions in the Respiratory Tract of Male Mice Exposed to Chloropicrin Vapors for 78 Weeksa
Lesion Treatment Level (ppm)
0 0.1 0.5 1.0 Nasal Cavity
Serous Exudate 4/50+++
(8%) 7/50
(14%) 18/50** (36%)
38/50** (76%)
Epithelial Hyalin Inclusion
3/50+++
(6%) 6/50
(12%) 7/50
(14%) 16/50** (32%)
Rhinitis 6/50+++
(12%) 7/50
(14%) 17/50** (34%)
35/50** (70%)
Olfactory Epithelial Atrophy
5/50+++
(10%) 6/50
(12%) 8/50
(16%) 40/50** (80%)
Lungs Alveolar Histiocytosis 18/50++
(36%) 17/50 (34%)
22/50 (44%)
29/50* (58%)
Peribronchial Lymphocytic Infiltrates
1/50++
(2%) 6/50
(12%) 10/50** (20%)
12/50** (24%)
Bronchiectasis 0/50+++
(0%) 3/50 (6%)
28/50** (56%)
41/50** (82%)
Bronchial Submucosal Fibrosis
0/50+++
(0%) 0/50 (0%)
16/50** (32%)
19/50** (38%)
Adenomac 16/49 (33%)
14/49 (29%)
18/45 (40%)
18/50 (36%)
Carcinoma 1/49 (2%)
0/49 (0%)
5/45 (11%)
2/50 (4%)
Combined Adenoma and Carcinoma
17/49b
(35%) 14/49 (29%)
22/45 (49%)
20/50 (40%)
a Burleigh-Flayer et al., 1995. b The denominator is the number of animals at risk which are animals that survived up to the day the first tumor was observed, 253
days. c Historical control data published by Charles River for this strain for studies conducted between 1987 and 1996 had an average
incidence of 14% (0-28%) and 8.7% ( 0-27%) for adenomas in males (46 studies) and females (48 studies), respectively (Giknis and Clifford, 2000) ++,+++ Significant trend based on the Armitage-Cochran trend test at p < 0.01 and 0.001, respectively (Gart et al., 1986).
*,** Significantly different from the control group based on the Fisher’s exact test at p < 0.05 and 0.01, respectively.
trend analysis but was not significant by Fisher’s exact test even when combined although the p value was 0.053.
There was no treatment-related effect on survival in this study, however, Peto et al. (1980) recommends that tumor rates be routinely adjusted for survival when presenting experimental data whether or not there is a difference in survival rates among treatment groups. Consequently, the combined incidence of adenomas and carcinomas in females was further analyzed using the continuity-corrected Poly-3 trend test with the Bieler-Williams modification that takes survival into consideration (Bieler and Williams, 1993). The Poly-3 trend test is the default trend test of the National Toxicology Program (NTP), even when survival is not affected as in the case of α-methylstyrene (NTP, 2007). Although the Poly-3 trend test has not been
30
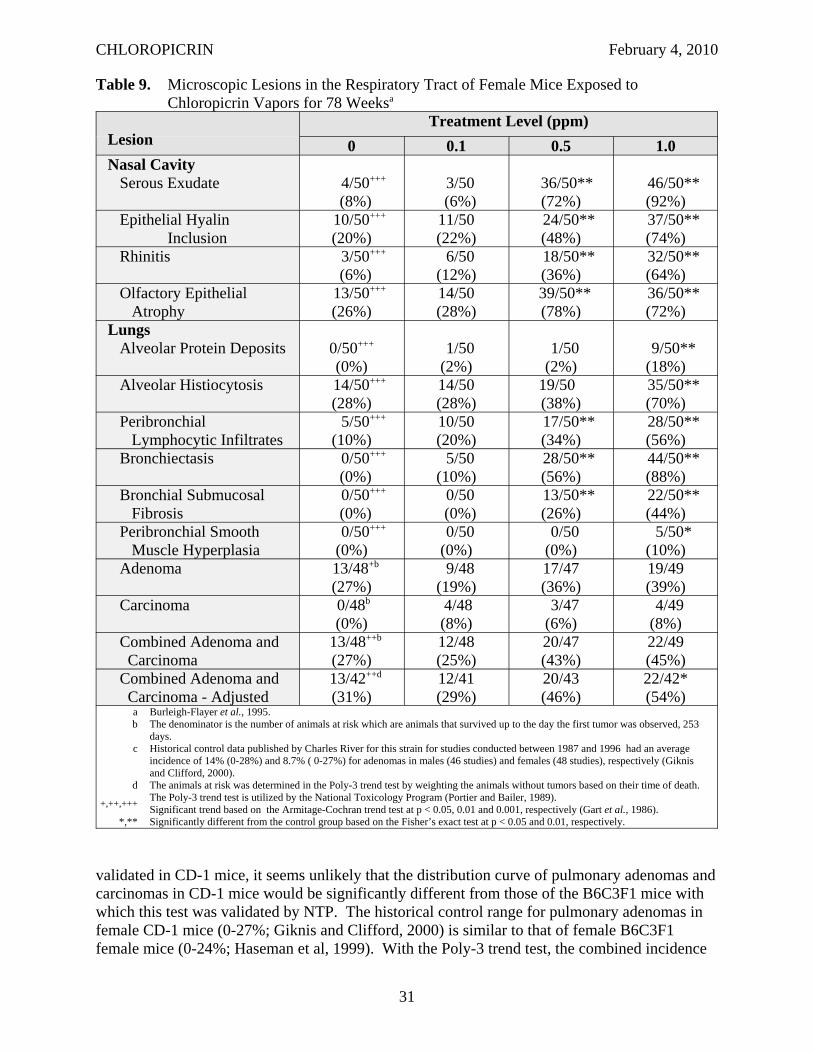
CHLOROPICRIN February 4, 2010
Table 9. Microscopic Lesions in the Respiratory Tract of Female Mice Exposed to Chloropicrin Vapors for 78 Weeksa
Lesion Treatment Level (ppm)
0 0.1 0.5 1.0 Nasal Cavity
Serous Exudate 4/50+++
(8%) 3/50 (6%)
36/50** (72%)
46/50** (92%)
Epithelial Hyalin Inclusion
10/50+++
(20%) 11/50 (22%)
24/50** (48%)
37/50** (74%)
Rhinitis 3/50+++
(6%) 6/50
(12%) 18/50** (36%)
32/50** (64%)
Olfactory Epithelial Atrophy
13/50+++
(26%) 14/50 (28%)
39/50** (78%)
36/50** (72%)
Lungs Alveolar Protein Deposits 0/50+++
(0%) 1/50 (2%)
1/50 (2%)
9/50** (18%)
Alveolar Histiocytosis 14/50+++
(28%) 14/50 (28%)
19/50 (38%)
35/50** (70%)
Peribronchial Lymphocytic Infiltrates
5/50+++
(10%) 10/50 (20%)
17/50** (34%)
28/50** (56%)
Bronchiectasis 0/50+++
(0%) 5/50
(10%) 28/50** (56%)
44/50** (88%)
Bronchial Submucosal Fibrosis
0/50+++
(0%) 0/50 (0%)
13/50** (26%)
22/50** (44%)
Peribronchial Smooth Muscle Hyperplasia
0/50+++
(0%) 0/50 (0%)
0/50 (0%)
5/50* (10%)
Adenoma 13/48+b
(27%) 9/48
(19%) 17/47 (36%)
19/49 (39%)
Carcinoma 0/48b
(0%) 4/48 (8%)
3/47 (6%)
4/49 (8%)
Combined Adenoma and Carcinoma
13/48++b
(27%) 12/48 (25%)
20/47 (43%)
22/49 (45%)
Combined Adenoma and Carcinoma - Adjusted
13/42++d
(31%) 12/41 (29%)
20/43 (46%)
22/42* (54%)
a Burleigh-Flayer et al., 1995. b The denominator is the number of animals at risk which are animals that survived up to the day the first tumor was observed, 253
days. c Historical control data published by Charles River for this strain for studies conducted between 1987 and 1996 had an average
incidence of 14% (0-28%) and 8.7% ( 0-27%) for adenomas in males (46 studies) and females (48 studies), respectively (Giknis and Clifford, 2000).
d The animals at risk was determined in the Poly-3 trend test by weighting the animals without tumors based on their time of death. The Poly-3 trend test is utilized by the National Toxicology Program (Portier and Bailer, 1989). +,++,+++ Significant trend based on the Armitage-Cochran trend test at p < 0.05, 0.01 and 0.001, respectively (Gart et al., 1986).
*,** Significantly different from the control group based on the Fisher’s exact test at p < 0.05 and 0.01, respectively.
validated in CD-1 mice, it seems unlikely that the distribution curve of pulmonary adenomas and carcinomas in CD-1 mice would be significantly different from those of the B6C3F1 mice with which this test was validated by NTP. The historical control range for pulmonary adenomas in female CD-1 mice (0-27%; Giknis and Clifford, 2000) is similar to that of female B6C3F1 female mice (0-24%; Haseman et al, 1999). With the Poly-3 trend test, the combined incidence
31
CHLOROPICRIN February 4, 2010
not only had a significant trend (p = 0.009), but the incidence at the high dose was significant (p = 0.03) based on the pair-wise comparison which is part of this test. Also noteworthy was an increase in the number of animals with multiple lung adenomas and/or carcinomas in males (4/49, 0/49, 6/45 and 10/50) and females (3/48, 3/48, 6/47 and 9/49) which were significant by trend analysis in both sexes (p = 0.003 in males and p = 0.02 in females), but not significant in either sex by Fisher’s exact. The average time to tumor did not show a dose-related decrease in males (562, 540, 546 and 549 days at 0, 100, 500 and 1,000 ppb, respectively), but was slightly shorter in the high dose females (554, 562, 564 and 543 days at 0, 100, 500 and 1,000 ppb, respectively). The shorter time to tumor in the high dose females may be primarily due to two deaths that occurred within the first year that were unrelated to the tumors (both had adenomas, not carcinomas; trauma in one case and undetermined cause of death in another). No historical control data were available for this laboratory, but historical control data published by Charles River for this strain for studies conducted between 1987 and 1996 had an average incidence of 14% (0-28%) and 8.7% ( 0-27%) for adenomas in males (46 studies) and females (48 studies), respectively (Giknis and Clifford, 2000). The incidence of adenomas in the male control group was outside the historical control range which may be one reason why a significant increase in these tumors was not seen in males.
Other possible treatment-related increases in microscopic lesions included auditory sebaceous gland adenitis (7/50, -, -, 17/50*) in males at 1.0 ppm, liver Ito cell hyperplasia (29/50, 23/50, 31/50, 43/50**) and endocervical metaplasia (0/50, 0/50, 2/50, 5/50*) in females at 1.0 ppm, and kidney cysts (5/50, 10/50, 14/50*, 13/50) in females at 0.5 ppm. In addition, at week 82 there was a significant increase in corneal mineralization (2/34, 2/34, 2/31, 9/32*) and vascularization (0/34, 2/34, 3/31, 4/32*) in the eyes of females at 1.0 ppm. No other treatment-related increases in tumors were observed. The NOEL for this study was 0.1 ppm (0.67 mg/m3; HEC - 0.054 ppm) based on the reduction in body weights and food consumption, increased lung weights and microscopic lesions in the nasal cavity and lungs. DPR found this study acceptable based on FIFRA guidelines.
II.D.2. Oral-Mouse
Groups of 50 B653F1 mice/sex/dose were administered chloropicrin (98% purity) by oral gavage in corn oil at 25 and 50 mg/kg/day during weeks 1 through 13 and 35 and 70 mg/kg/day, respectively, during weeks 14 to 78 weeks followed by an observation period of 13 weeks (NCI, 1978). The respective time-weighted average dosages were 33 and 66 mg/kg/day. Twenty mice/sex were assigned to untreated and vehicle (corn oil) control groups. A significant reduction in survival was seen in both sexes at 66 mg/kg/day. There was a progressive depression of body weights in female mice at both 33 and 66 mg/kg/day. No consistent difference in male body weight gains was seen. After the first 6 months of the study, there was a higher frequency of hunched or bloated appearance in treated animals compared to controls. An increased incidence of acanthosis and hyperkeratosis in the stomach was seen in both sexes at 33 and 66 mg/kg/day, especially the females. Two squamous cell carcinomas were seen the stomach of males at 66 mg/kg/day and one papilloma in the stomach of a female at 33 mg/kg/day. However, the incidence of neither of these lesions was statistically significant. The NOEL appears to be less than 33 mg/kg/day based on the acanthosis and hyperkeratosis in the forestomach in both sexes and the body weight depression in females. The study had major deficiencies including an inadequate number of dose groups and control animals. The report
32
CHLOROPICRIN February 4, 2010
also lacks data on the analysis of dosing solution, individual body weights, food consumption and clinical data.
II.D.3. Inhalation-Rat
In a rat inhalation carcinogenicity study, groups of 50 CD® rats/sex/dose were exposed (whole body) to chloropicrin (99.6% purity) vapors at 0 (air), 0.1, 0.5 and 1.0 ppm (analytical; 0, 0.67, 3.36 or 6.72 mg/m3; HEC12 - 0, 0.029, 0.15 or 0.29 ppm) for 6 hours/day, 5 days/week for at least 107 weeks (Burleigh-Flayer and Benson, 1995). A significant reduction in the survival rate of males at 0.5 and 1.0 ppm were observed (Table 10). The incidence of a few clinical signs were elevated at 1.0 ppm, including hypoactivity, prostration, cold extremities, urogenital wetness, bleopharospasm, and periocular encrustation. There was no significant difference in absolute body weights, but the body weight gains were significantly reduced during the first few weeks of exposure at 0.5 and 1.0 ppm (M: 8-28%; F: 9-25%) in both sexes. Female rats at 0.1 ppm also had significant reductions in body weight gains (6-10%) during this time; however, these minor reductions in body weight gain were of uncertain toxicological significance. There was no treatment-related effect on food consumption, palpable masses or hematology. A few significant differences in the absolute liver and kidney weights were seen in females at 0.1 and 0.5 ppm which the investigators suggested was due to the lower terminal body weights in these groups and not treatment-related. The increases in the absolute and relative (to body and brain) lung weights at 1.0 ppm were considered treatment-related by the investigators, although not statistically significant. There appeared to be a treatment-related increase in spleen weight and/or in the incidence of increased spleen size especially in males, but the differences were not statistically significant in either sex. Males also appeared to have an increased incidence of hyperinflated lung that was observed macroscopically, but the increase was not statistically significant. No other treatment- related macroscopic pathological lesions were observed. The only significant increase in microscopic lesions was rhinitis in the anterior nasal cavities in male rats at 1.0 ppm. The rhinitis was characterized by sporadic lymphocytic or neutrophilic mucosal/submucosal infiltrates and occasionally by purulent exudate. There was no treatment-related increase in tumor incidence, except for the incidence in fibroadenomas in females. However, this incidence was not statistically significant and within the reported historical control range for this strain from this laboratory (11-47%). The NOEL for this study was 0.1 ppm (0.67 mg/m3; HEC - 0.029 ppm) based on the reduced survival rate in males and reduced body weight gain in both sexes. DPR found this study acceptable based on FIFRA guidelines.
II.D.4. Oral-Rat
In an NCI study, 50 Osborne-Mendel rats that were administered chloropicrin (95% pure) by oral gavage 5 days per week at two dose levels (NCI, 1978). Rats of both sexes initially received 23 and 46 mg/kg/day at the low and high-dose level during the first 4 weeks. Starting at week 5, the dose levels for males were increased to 28 and 56 mg/kg/day for the low and high dose-groups while the dose levels for females remained the same. After week 17, the dosing was stopped for the high dose animals for 13 weeks, but was continued for low dose animals. At week 31, high-dose animals resumed dosing at the same dose level as the low dose animals. Beginning with week 34, a cyclic pattern of dosing was started with all the treated animals
12. HEC = ppm x RRa/RRh x Ea/Eh. RRa = 0.96 m3/kg/day for the rat (Zielhuis and van der Kreek, 1979). RRh = 0.59 m3/kg/day for a child (DPR, 2000). Ea = 6 hours/day, 5 days/week. Eh = 24 hours/day, 7 days/week.
33
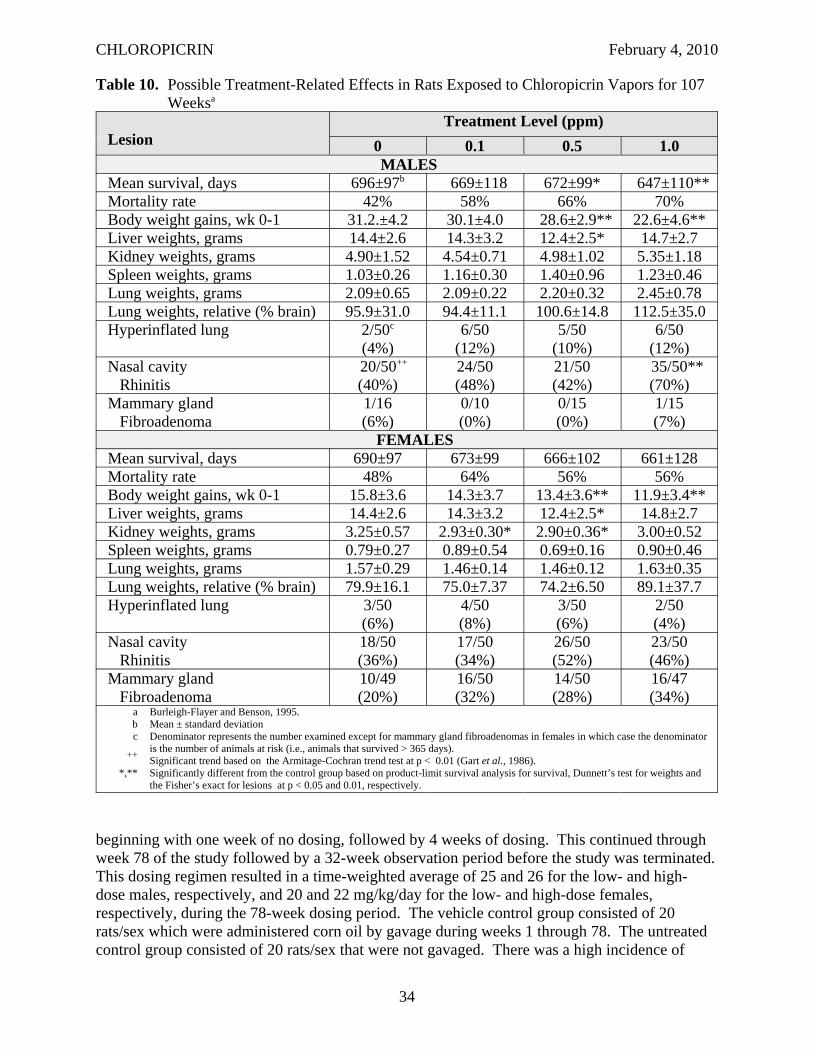
CHLOROPICRIN February 4, 2010
Table 10. Possible Treatment-Related Effects in Rats Exposed to Chloropicrin Vapors for 107 Weeksa
Lesion Treatment Level (ppm)
0 0.1 0.5 1.0 MALES
Mean survival, days 696±97b 669±118 672±99* 647±110** Mortality rate 42% 58% 66% 70% Body weight gains, wk 0-1 31.2.±4.2 30.1±4.0 28.6±2.9** 22.6±4.6** Liver weights, grams 14.4±2.6 14.3±3.2 12.4±2.5* 14.7±2.7 Kidney weights, grams 4.90±1.52 4.54±0.71 4.98±1.02 5.35±1.18 Spleen weights, grams 1.03±0.26 1.16±0.30 1.40±0.96 1.23±0.46 Lung weights, grams 2.09±0.65 2.09±0.22 2.20±0.32 2.45±0.78 Lung weights, relative (% brain) 95.9±31.0 94.4±11.1 100.6±14.8 112.5±35.0 Hyperinflated lung 2/50c
(4%) 6/50
(12%) 5/50
(10%) 6/50
(12%) Nasal cavity
Rhinitis 20/50++
(40%) 24/50 (48%)
21/50 (42%)
35/50** (70%)
Mammary gland Fibroadenoma
1/16 (6%)
0/10 (0%)
0/15 (0%)
1/15 (7%)
FEMALES Mean survival, days 690±97 673±99 666±102 661±128 Mortality rate 48% 64% 56% 56% Body weight gains, wk 0-1 15.8±3.6 14.3±3.7 13.4±3.6** 11.9±3.4** Liver weights, grams 14.4±2.6 14.3±3.2 12.4±2.5* 14.8±2.7 Kidney weights, grams 3.25±0.57 2.93±0.30* 2.90±0.36* 3.00±0.52 Spleen weights, grams 0.79±0.27 0.89±0.54 0.69±0.16 0.90±0.46 Lung weights, grams 1.57±0.29 1.46±0.14 1.46±0.12 1.63±0.35 Lung weights, relative (% brain) 79.9±16.1 75.0±7.37 74.2±6.50 89.1±37.7 Hyperinflated lung 3/50
(6%) 4/50 (8%)
3/50 (6%)
2/50 (4%)
Nasal cavity Rhinitis
18/50 (36%)
17/50 (34%)
26/50 (52%)
23/50 (46%)
Mammary gland Fibroadenoma
10/49 (20%)
16/50 (32%)
14/50 (28%)
16/47 (34%)
a Burleigh-Flayer and Benson, 1995. b Mean ± standard deviation c Denominator represents the number examined except for mammary gland fibroadenomas in females in which case the denominator
is the number of animals at risk (i.e., animals that survived > 365 days). ++ Significant trend based on the Armitage-Cochran trend test at p < 0.01 (Gart et al., 1986). *,** Significantly different from the control group based on product-limit survival analysis for survival, Dunnett’s test for weights and
the Fisher’s exact for lesions at p < 0.05 and 0.01, respectively.
beginning with one week of no dosing, followed by 4 weeks of dosing. This continued through week 78 of the study followed by a 32-week observation period before the study was terminated. This dosing regimen resulted in a time-weighted average of 25 and 26 for the low- and high-dose males, respectively, and 20 and 22 mg/kg/day for the low- and high-dose females, respectively, during the 78-week dosing period. The vehicle control group consisted of 20 rats/sex which were administered corn oil by gavage during weeks 1 through 78. The untreated control group consisted of 20 rats/sex that were not gavaged. There was a high incidence of
34
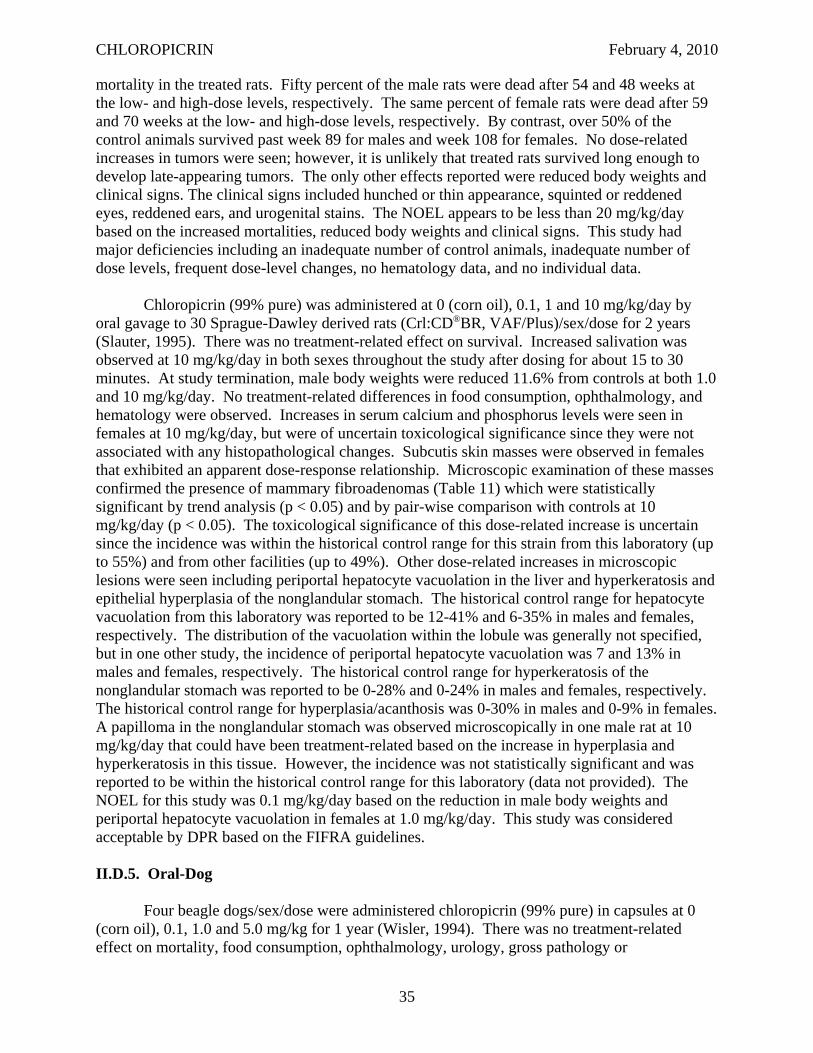
CHLOROPICRIN February 4, 2010
mortality in the treated rats. Fifty percent of the male rats were dead after 54 and 48 weeks at the low- and high-dose levels, respectively. The same percent of female rats were dead after 59 and 70 weeks at the low- and high-dose levels, respectively. By contrast, over 50% of the control animals survived past week 89 for males and week 108 for females. No dose-related increases in tumors were seen; however, it is unlikely that treated rats survived long enough to develop late-appearing tumors. The only other effects reported were reduced body weights and clinical signs. The clinical signs included hunched or thin appearance, squinted or reddened eyes, reddened ears, and urogenital stains. The NOEL appears to be less than 20 mg/kg/day based on the increased mortalities, reduced body weights and clinical signs. This study had major deficiencies including an inadequate number of control animals, inadequate number of dose levels, frequent dose-level changes, no hematology data, and no individual data.
Chloropicrin (99% pure) was administered at 0 (corn oil), 0.1, 1 and 10 mg/kg/day by oral gavage to 30 Sprague-Dawley derived rats (Crl:CD®BR, VAF/Plus)/sex/dose for 2 years (Slauter, 1995). There was no treatment-related effect on survival. Increased salivation was observed at 10 mg/kg/day in both sexes throughout the study after dosing for about 15 to 30 minutes. At study termination, male body weights were reduced 11.6% from controls at both 1.0 and 10 mg/kg/day. No treatment-related differences in food consumption, ophthalmology, and hematology were observed. Increases in serum calcium and phosphorus levels were seen in females at 10 mg/kg/day, but were of uncertain toxicological significance since they were not associated with any histopathological changes. Subcutis skin masses were observed in females that exhibited an apparent dose-response relationship. Microscopic examination of these masses confirmed the presence of mammary fibroadenomas (Table 11) which were statistically significant by trend analysis (p < 0.05) and by pair-wise comparison with controls at 10 mg/kg/day (p < 0.05). The toxicological significance of this dose-related increase is uncertain since the incidence was within the historical control range for this strain from this laboratory (up to 55%) and from other facilities (up to 49%). Other dose-related increases in microscopic lesions were seen including periportal hepatocyte vacuolation in the liver and hyperkeratosis and epithelial hyperplasia of the nonglandular stomach. The historical control range for hepatocyte vacuolation from this laboratory was reported to be 12-41% and 6-35% in males and females, respectively. The distribution of the vacuolation within the lobule was generally not specified, but in one other study, the incidence of periportal hepatocyte vacuolation was 7 and 13% in males and females, respectively. The historical control range for hyperkeratosis of the nonglandular stomach was reported to be 0-28% and 0-24% in males and females, respectively. The historical control range for hyperplasia/acanthosis was 0-30% in males and 0-9% in females. A papilloma in the nonglandular stomach was observed microscopically in one male rat at 10 mg/kg/day that could have been treatment-related based on the increase in hyperplasia and hyperkeratosis in this tissue. However, the incidence was not statistically significant and was reported to be within the historical control range for this laboratory (data not provided). The NOEL for this study was 0.1 mg/kg/day based on the reduction in male body weights and periportal hepatocyte vacuolation in females at 1.0 mg/kg/day. This study was considered acceptable by DPR based on the FIFRA guidelines.
II.D.5. Oral-Dog
Four beagle dogs/sex/dose were administered chloropicrin (99% pure) in capsules at 0 (corn oil), 0.1, 1.0 and 5.0 mg/kg for 1 year (Wisler, 1994). There was no treatment-related effect on mortality, food consumption, ophthalmology, urology, gross pathology or
35
CHLOROPICRIN February 4, 2010
Table 11. Microscopic Lesions in Rats Administered Chloropicrin by Oral Gavage for 2 Yearsa
Lesion Treatment Level (mg/kg/day)
0 0.1 1.0 10.0 MALES
Liver Periportal hepatocyte
vacuolation 2/30 (7%)
8/30 (27%)
3/30 (10%)
6/30 (20%)
Nonglandular Stomach Hyperkeratosis 7/30+++
(23%) 9/30
(30%) 11/30 (37%)
20/30** (67%)
Epithelial Hyperplasia 3/30+++
(10%) 5/30
(17%) 4/30
(13%) 18/30** (60%)
FEMALES Liver
Periportal hepatocyte vacuolation
2/30++
(7%) 6/30
(20%) 10/30* (33%)
13/30** (43%)
Nonglandular Stomach Hyperkeratosis 6/30+++
(20%) 5/30
(17%) 11/30 (37%)
24/30** (80%)
Epithelial Hyperplasia 6/30++
(20%) 5/30
(17%) 6/30
(20%) 14/30* (47%)
Mammary Gland Fibroadenoma 6/30+
(20%) 9/30
(30%) 12/30 (40%)
14/30* (47%)
a Slauter, 1995. +,++,+++ Significant trend based on the Armitage-Cochran trend test at p < 0.05, 0.01 and 0.001, respectively (Gart et al., 1986).
*,** Significantly different from the control group based on the Fisher’s exact test at p < 0.05 and 0.01, respectively.
histopathology. There was an increase in ptyalism, food-like or frothy emesis, and soft stool/diarrhea in dogs at 5.0 mg/kg/day. Discolored feces were observed in half the animals of both sexes during the last 13 weeks of the study. Food-like emesis was also observed with increased frequency at 1.0 mg/kg/day. The mean body weights of males at 5.0 mg/kg/day were reduced (~10%) throughout the study compared to controls. There was a significant decrease in the mean corpuscular volume and mean corpuscular hemoglobin in both sexes at 5.0 mg/kg/day throughout the study. A decrease in aspartate aminotransferase, total protein and albumin were also seen in both sexes at 5.0 mg/kg/day throughout the study. In addition, the calcium levels were reduced during the last 6 months of the study. The investigators suggested that the diarrhea/soft stools, and reduced body weights in conjunction with the clinical pathological changes at 5.0 mg/kg /day were indicative of an enterogenous malabsorption condition. The NOEL was 1.0 mg/kg/day based on the clinical signs, reduced body weights (males) and clinical pathology changes. This study was considered acceptable to DPR based on FIFRA guidelines.
II. E. GENOTOXICITY
Summary: Chloropicrin tested positive in eight reverse mutation assays with Salmonella typhimurium strains with and without activation; however, only one of these studies met FIFRA guidelines. One study found that the addition of GSH alone also converted
36
CHLOROPICRIN February 4, 2010
chloropicrin to a mutagenic metabolite either through reductive dechlorination or through the formation of a reactive intermediate GSH conjugate, such as GSCCl2NO2 or GSCHClNO2. In addition, chloropicrin tested positive in a reverse mutation assay with Escherichia coli WP2 hcr. Chloropicrin was negative in a mouse lymphoma assay which met FIFRA guidelines. Results from the Drosophila sex-linked recessive lethal assay were mixed. One study reported it was weakly mutagenic, but another reported it was negative. It is unclear if either of these published studies met FIFRA guidelines. A published Drosophila wing-spot test was also negative, although this was a non-guideline study. Results from chromosomal aberrations assays were mixed. One study, which met FIFRA guidelines, reported that chloropicrin induced chromosomal aberrations in Chinese hamster ovary cells without S-9. In a published report, no increase in chromosomal aberrations was seen in human lymphocytes with or without S-9; however, an increase in sister chromatid exchanges was observed with and without S-9. No increase in micronuclei was seen in vitro with TK6 cells and human lymphocytes and in vivo with newt larvae or mice. Only the in vivo assay with mice met FIFRA guidelines. There was no increase in unscheduled DNA synthesis either in vitro with rat primary hepatocytes or in vivo with rats. Both of these studies met FIFRA guidelines. Increased DNA damage was seen in three published, non-guideline studies, a SOS chromotest with E. coli, a Comet assay with TK6 cells and a single-cell gel electrophoresis assay with CHO cells. Repair kinetics in the Comet assay indicated this damage was readily repaired.
II.E.1. Gene Mutation
Chloropicrin (99.5%) was tested in a reverse mutation assay with S. typhimurium strains TA98, TA100, TA1535, TA1537 and TA1538 with and without S-9 up to 1,000 μg/plate in the initial assay and up to 500 μg/plate in the confirmatory assay (San and Wagner, 1990). An increase in revertant colonies with seen in strain TA98 with S-9. TA 1537 and TA1538 were also positive without S-9. DPR found this study acceptable based on FIFRA guidelines. Moriya et al (1983) reported that chloropicrin (purity not stated) was mutagenic using the reverse mutation assay with S. typhimurium TA98 (weakly positive) and TA 100 (with S-9) and E. coli WP2 hcr (weakly positive). No increase in mutation frequency was seen with TA 1535, TA1537 and TA1538 strains. Doses were reported to be tested up to 5,000 μg/plate, unless toxic to bacteria. Insufficient information was provided in this published report to determine if this study was conducted in accordance with FIFRA guidelines. There were other published reports of positive responses in the reverse mutation assay with S. typhimurium. Shirasu et al. (1982) reported an increase in mutation frequency with TA100, but only with S-9. Haworth et al. (1983) also reported an increase in mutation frequency with TA100 with S-9, but not with TA98, TA1535 and TA1537 strains. Kawai et al. (1987) observed an increase in mutation frequency with S. typhimurium TA100 and TA98 strains (+ S9 only) and E. coli WP2uvrA/pKM101 strain (+/- S9). In a modified Ames assay with S. typhimurium strains TA98 and TA1538, Sariaslani and Stahl (1990) found an increase in mutation frequency with TA98 after activation with Streptomyces griseus cells. In an another adaptation of the reverse mutation assay with S. typhimurium TA100 in liquid medium, Giller et al. (1995) observed a significant increase in wells containing prototrophic revertants with S-9. Schneider et al. (1999) reported that chloropicrin was toxic to S. typhimurium TA100 at 500 nmol/plate, but not mutagenic. Chloropicrin became mutagenic, but not toxic at this concentration with the addition of S-9 or 12 molar equivalents of glutathione (GSH). The dechlorination products, CHCl2NO2 and CH2ClNO2, were also mutagenic with and without GSH. The investigators suggested that the
37
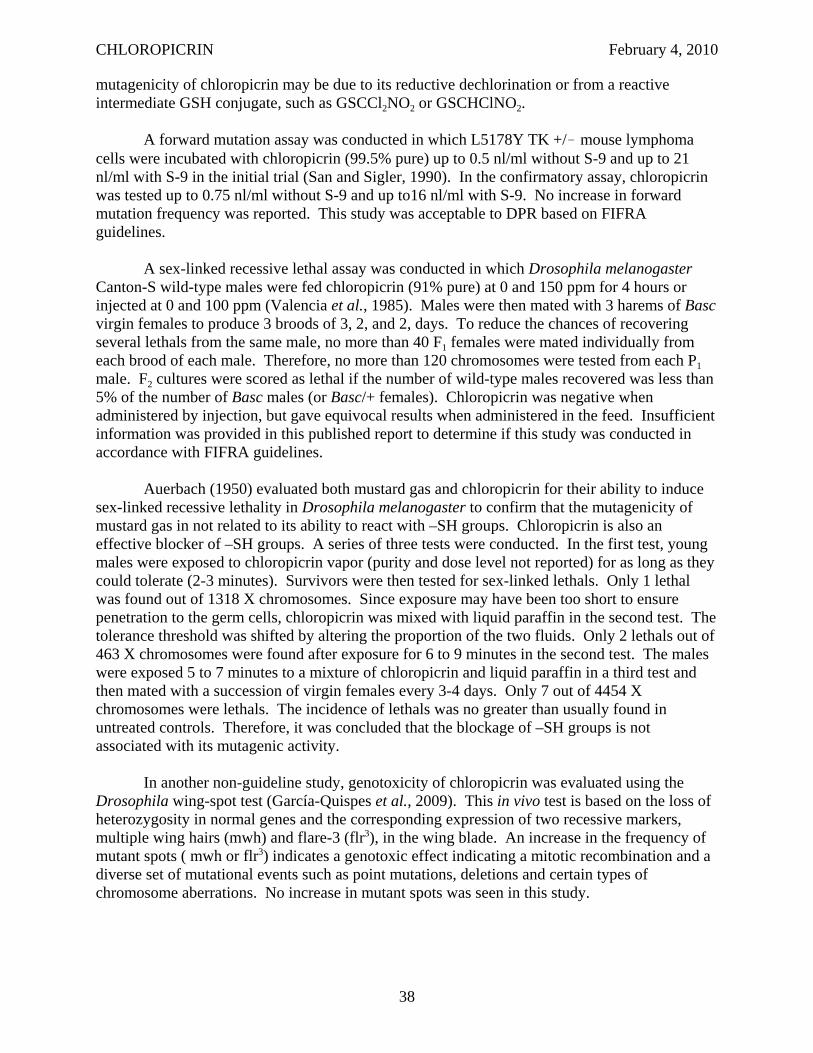
CHLOROPICRIN February 4, 2010
mutagenicity of chloropicrin may be due to its reductive dechlorination or from a reactive intermediate GSH conjugate, such as GSCCl2NO2 or GSCHClNO2.
A forward mutation assay was conducted in which L5178Y TK +/! mouse lymphoma cells were incubated with chloropicrin (99.5% pure) up to 0.5 nl/ml without S-9 and up to 21 nl/ml with S-9 in the initial trial (San and Sigler, 1990). In the confirmatory assay, chloropicrin was tested up to 0.75 nl/ml without S-9 and up to16 nl/ml with S-9. No increase in forward mutation frequency was reported. This study was acceptable to DPR based on FIFRA guidelines.
A sex-linked recessive lethal assay was conducted in which Drosophila melanogaster Canton-S wild-type males were fed chloropicrin (91% pure) at 0 and 150 ppm for 4 hours or injected at 0 and 100 ppm (Valencia et al., 1985). Males were then mated with 3 harems of Basc virgin females to produce 3 broods of 3, 2, and 2, days. To reduce the chances of recovering several lethals from the same male, no more than 40 F1 females were mated individually from each brood of each male. Therefore, no more than 120 chromosomes were tested from each P1 male. F2 cultures were scored as lethal if the number of wild-type males recovered was less than 5% of the number of Basc males (or Basc/+ females). Chloropicrin was negative when administered by injection, but gave equivocal results when administered in the feed. Insufficient information was provided in this published report to determine if this study was conducted in accordance with FIFRA guidelines.
Auerbach (1950) evaluated both mustard gas and chloropicrin for their ability to induce sex-linked recessive lethality in Drosophila melanogaster to confirm that the mutagenicity of mustard gas in not related to its ability to react with –SH groups. Chloropicrin is also an effective blocker of –SH groups. A series of three tests were conducted. In the first test, young males were exposed to chloropicrin vapor (purity and dose level not reported) for as long as they could tolerate (2-3 minutes). Survivors were then tested for sex-linked lethals. Only 1 lethal was found out of 1318 X chromosomes. Since exposure may have been too short to ensure penetration to the germ cells, chloropicrin was mixed with liquid paraffin in the second test. The tolerance threshold was shifted by altering the proportion of the two fluids. Only 2 lethals out of 463 X chromosomes were found after exposure for 6 to 9 minutes in the second test. The males were exposed 5 to 7 minutes to a mixture of chloropicrin and liquid paraffin in a third test and then mated with a succession of virgin females every 3-4 days. Only 7 out of 4454 X chromosomes were lethals. The incidence of lethals was no greater than usually found in untreated controls. Therefore, it was concluded that the blockage of –SH groups is not associated with its mutagenic activity.
In another non-guideline study, genotoxicity of chloropicrin was evaluated using the Drosophila wing-spot test (García-Quispes et al., 2009). This in vivo test is based on the loss of heterozygosity in normal genes and the corresponding expression of two recessive markers, multiple wing hairs (mwh) and flare-3 (flr3), in the wing blade. An increase in the frequency of mutant spots ( mwh or flr3) indicates a genotoxic effect indicating a mitotic recombination and a diverse set of mutational events such as point mutations, deletions and certain types of chromosome aberrations. No increase in mutant spots was seen in this study.
38
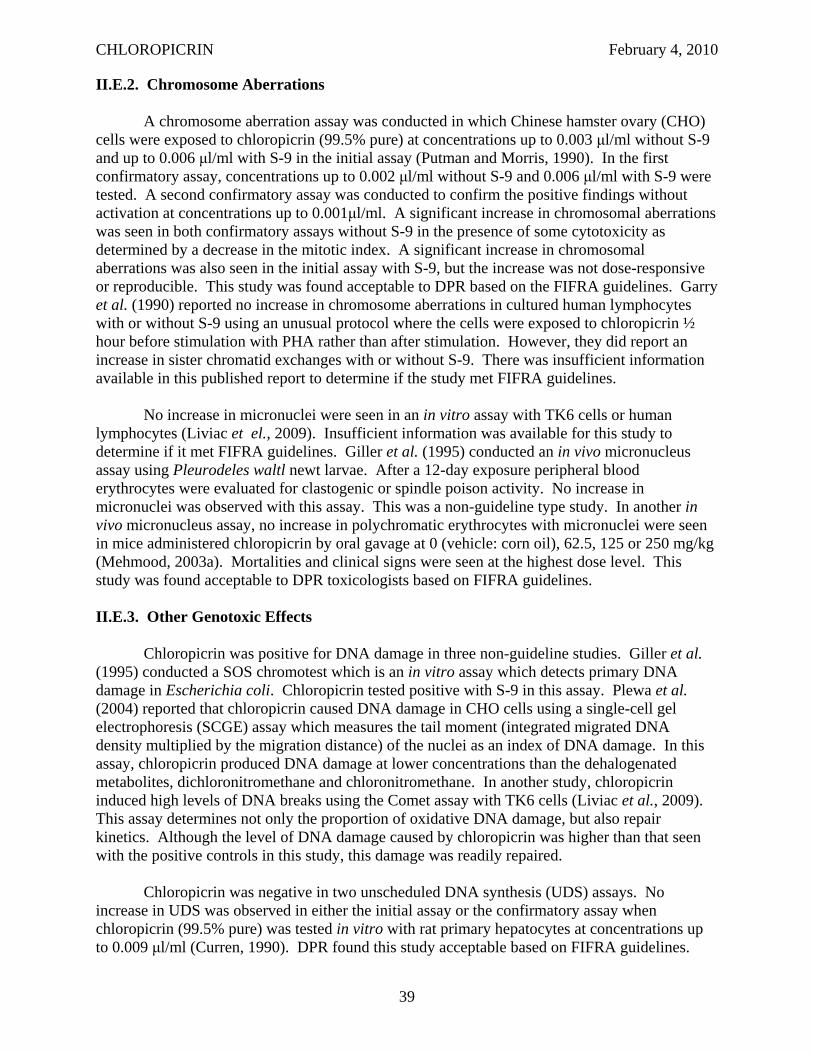
CHLOROPICRIN February 4, 2010
II.E.2. Chromosome Aberrations
A chromosome aberration assay was conducted in which Chinese hamster ovary (CHO) cells were exposed to chloropicrin (99.5% pure) at concentrations up to 0.003 μl/ml without S-9 and up to 0.006 μl/ml with S-9 in the initial assay (Putman and Morris, 1990). In the first confirmatory assay, concentrations up to 0.002 μl/ml without S-9 and 0.006 μl/ml with S-9 were tested. A second confirmatory assay was conducted to confirm the positive findings without activation at concentrations up to 0.001μl/ml. A significant increase in chromosomal aberrations was seen in both confirmatory assays without S-9 in the presence of some cytotoxicity as determined by a decrease in the mitotic index. A significant increase in chromosomal aberrations was also seen in the initial assay with S-9, but the increase was not dose-responsive or reproducible. This study was found acceptable to DPR based on the FIFRA guidelines. Garry et al. (1990) reported no increase in chromosome aberrations in cultured human lymphocytes with or without S-9 using an unusual protocol where the cells were exposed to chloropicrin ½ hour before stimulation with PHA rather than after stimulation. However, they did report an increase in sister chromatid exchanges with or without S-9. There was insufficient information available in this published report to determine if the study met FIFRA guidelines.
No increase in micronuclei were seen in an in vitro assay with TK6 cells or human lymphocytes (Liviac et el., 2009). Insufficient information was available for this study to determine if it met FIFRA guidelines. Giller et al. (1995) conducted an in vivo micronucleus assay using Pleurodeles waltl newt larvae. After a 12-day exposure peripheral blood erythrocytes were evaluated for clastogenic or spindle poison activity. No increase in micronuclei was observed with this assay. This was a non-guideline type study. In another in vivo micronucleus assay, no increase in polychromatic erythrocytes with micronuclei were seen in mice administered chloropicrin by oral gavage at 0 (vehicle: corn oil), 62.5, 125 or 250 mg/kg (Mehmood, 2003a). Mortalities and clinical signs were seen at the highest dose level. This study was found acceptable to DPR toxicologists based on FIFRA guidelines.
II.E.3. Other Genotoxic Effects
Chloropicrin was positive for DNA damage in three non-guideline studies. Giller et al. (1995) conducted a SOS chromotest which is an in vitro assay which detects primary DNA damage in Escherichia coli. Chloropicrin tested positive with S-9 in this assay. Plewa et al. (2004) reported that chloropicrin caused DNA damage in CHO cells using a single-cell gel electrophoresis (SCGE) assay which measures the tail moment (integrated migrated DNA density multiplied by the migration distance) of the nuclei as an index of DNA damage. In this assay, chloropicrin produced DNA damage at lower concentrations than the dehalogenated metabolites, dichloronitromethane and chloronitromethane. In another study, chloropicrin induced high levels of DNA breaks using the Comet assay with TK6 cells (Liviac et al., 2009). This assay determines not only the proportion of oxidative DNA damage, but also repair kinetics. Although the level of DNA damage caused by chloropicrin was higher than that seen with the positive controls in this study, this damage was readily repaired.
Chloropicrin was negative in two unscheduled DNA synthesis (UDS) assays. No increase in UDS was observed in either the initial assay or the confirmatory assay when chloropicrin (99.5% pure) was tested in vitro with rat primary hepatocytes at concentrations up to 0.009 μl/ml (Curren, 1990). DPR found this study acceptable based on FIFRA guidelines.
39
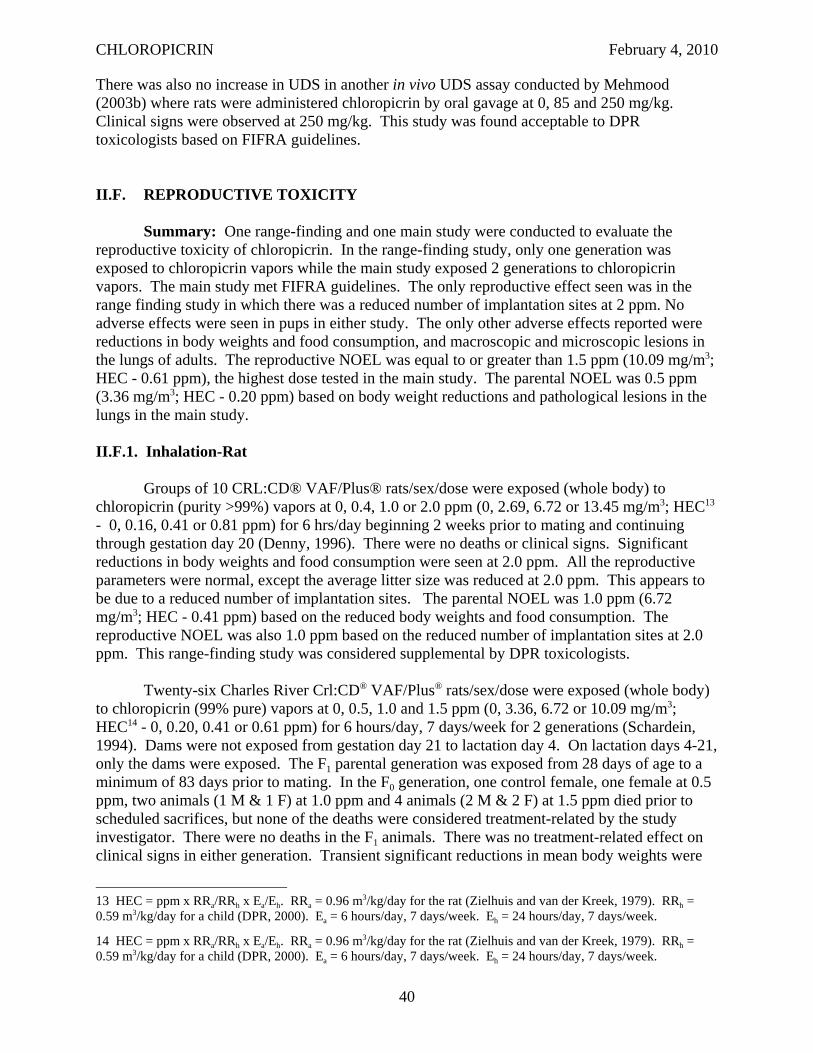
CHLOROPICRIN February 4, 2010
There was also no increase in UDS in another in vivo UDS assay conducted by Mehmood (2003b) where rats were administered chloropicrin by oral gavage at 0, 85 and 250 mg/kg. Clinical signs were observed at 250 mg/kg. This study was found acceptable to DPR toxicologists based on FIFRA guidelines.
II.F. REPRODUCTIVE TOXICITY
Summary: One range-finding and one main study were conducted to evaluate the reproductive toxicity of chloropicrin. In the range-finding study, only one generation was exposed to chloropicrin vapors while the main study exposed 2 generations to chloropicrin vapors. The main study met FIFRA guidelines. The only reproductive effect seen was in the range finding study in which there was a reduced number of implantation sites at 2 ppm. No adverse effects were seen in pups in either study. The only other adverse effects reported were reductions in body weights and food consumption, and macroscopic and microscopic lesions in the lungs of adults. The reproductive NOEL was equal to or greater than 1.5 ppm (10.09 mg/m3; HEC - 0.61 ppm), the highest dose tested in the main study. The parental NOEL was 0.5 ppm (3.36 mg/m3; HEC - 0.20 ppm) based on body weight reductions and pathological lesions in the lungs in the main study.
II.F.1. Inhalation-Rat
Groups of 10 CRL:CD® VAF/Plus® rats/sex/dose were exposed (whole body) to chloropicrin (purity >99%) vapors at 0, 0.4, 1.0 or 2.0 ppm (0, 2.69, 6.72 or 13.45 mg/m3; HEC13
- 0, 0.16, 0.41 or 0.81 ppm) for 6 hrs/day beginning 2 weeks prior to mating and continuing through gestation day 20 (Denny, 1996). There were no deaths or clinical signs. Significant reductions in body weights and food consumption were seen at 2.0 ppm. All the reproductive parameters were normal, except the average litter size was reduced at 2.0 ppm. This appears to be due to a reduced number of implantation sites. The parental NOEL was 1.0 ppm (6.72 mg/m3; HEC - 0.41 ppm) based on the reduced body weights and food consumption. The reproductive NOEL was also 1.0 ppm based on the reduced number of implantation sites at 2.0 ppm. This range-finding study was considered supplemental by DPR toxicologists.
Twenty-six Charles River Crl:CD® VAF/Plus® rats/sex/dose were exposed (whole body) to chloropicrin (99% pure) vapors at 0, 0.5, 1.0 and 1.5 ppm (0, 3.36, 6.72 or 10.09 mg/m3; HEC14 - 0, 0.20, 0.41 or 0.61 ppm) for 6 hours/day, 7 days/week for 2 generations (Schardein, 1994). Dams were not exposed from gestation day 21 to lactation day 4. On lactation days 4-21, only the dams were exposed. The F1 parental generation was exposed from 28 days of age to a minimum of 83 days prior to mating. In the F0 generation, one control female, one female at 0.5 ppm, two animals (1 M & 1 F) at 1.0 ppm and 4 animals (2 M & 2 F) at 1.5 ppm died prior to scheduled sacrifices, but none of the deaths were considered treatment-related by the study investigator. There were no deaths in the F1 animals. There was no treatment-related effect on clinical signs in either generation. Transient significant reductions in mean body weights were
13 HEC = ppm x RRa/RRh x Ea/Eh. RRa = 0.96 m3/kg/day for the rat (Zielhuis and van der Kreek, 1979). RRh = 0.59 m3/kg/day for a child (DPR, 2000). Ea = 6 hours/day, 7 days/week. Eh = 24 hours/day, 7 days/week.
14 HEC = ppm x RRa/RRh x Ea/Eh. RRa = 0.96 m3/kg/day for the rat (Zielhuis and van der Kreek, 1979). RRh = 0.59 m3/kg/day for a child (DPR, 2000). Ea = 6 hours/day, 7 days/week. Eh = 24 hours/day, 7 days/week.
40

CHLOROPICRIN February 4, 2010
seen in both sexes of both generations at 1.0 and/or 1.5 ppm. F1 females at 1.5 ppm had significantly lower food consumption during gestation. There was no treatment-related effect on reproductive parameters including fertility indices, gestation length, and spermatogenesis. No treatment-related effect on pup survival, growth and gross pathological findings. A slight increase in macroscopic pathological lesions was found in the lungs of females (primarily F0) at 1.0 and 1.5 ppm, including red discoloration, tan foci, white foci, nodule and adhesions (Table 12). The increase in these lesions was insufficient to reach statistical significance by either trend analysis or pair-wise comparison with controls. There was also a slight dose-related increase in the incidence and severity of acute/subacute inflammation in the lungs of F0 females; however, this increase also was not statistically significant. Despite the lack of statistical significance, these lesions were considered treatment-related by DPR. Consequently, the parental NOEL for the study was set at 0.5 ppm (3.36 mg/m3; HEC - 0.20 ppm) based on the body weight changes in both sexes and pathological lesions in the lungs of females. The reproductive NOEL for the study was equal to or greater than 1.5 ppm (10.09 mg/m3; HEC - 0.61 ppm) based on the lack of any reproductive effects in the adults or developmental effects in the pups at any dose level tested. This study was considered acceptable to DPR based on the FIFRA guidelines.
Table 12. Possible Treatment-Related Pathological Lesions in the Lungs of Female Rats Exposed to Chloropicrin Vapors for Two Generationsa
Lesion Treatment Level (ppm)
0 0.5 1.0 1.5 Macroscopic (F0)
Red discoloration 1/26 (4%)
1/26 (4%)
1/26 (4%)
2/26 (8%)
Tan foci 0/26 (0%)
1/26 (4%)
1/26 (4%)
1/26 (4%)
White foci 0/26 (0%)
0/26 (0%)
1/26 (4%)
0/26 (0%)
Nodule 0/26 (0%)
0/26 (0%)
1/26 (4%)
1/26 (4%)
Adhesions 0/26 (0%)
0/26 (0%)
1/26 (4%)
0/26 (0%)
Microscopic (F0) Acute/subacute
inflammation 7/16
(44%) 10/21 (48%)
12/24 (50%)
11/18 (61%)
Macroscopic (F1) Yellow foci 1/26
(4%) 0/26 (0%)
2/26 (8%)
3/26 (12%)
Adhesions 0/26 (0%)
0/26 (0%)
0/26 (0%)
1/26 (4%)
a Schardein, 1994
II.G. DEVELOPMENTAL TOXICITY
Summary: Two developmental toxicity studies were available for chloropicrin, one in rats and one in rabbits. Both exposed animals by the inhalation route. Maternal toxicity was observed in both studies including mortalities, clinical signs, reduced body weights and food
41
CHLOROPICRIN February 4, 2010
consumption, and red discoloration and edema of lungs. The lowest maternal NOEL was 0.4 ppm (2.7 mg/m3; HEC8hr - 0.27 ppm) based on mortalities, nasal discharge, reduced body weights and food consumption, and red discoloration of the lungs in rabbits. Developmental effects were seen including miscellaneous visceral and skeletal variations, increased preimplantation losses, late-term abortions and reduced fetal weights. The lowest developmental NOEL was also 0.4 ppm based on skeletal variations in both rats and rabbits.
II.G.1. Inhalation-Rat
Schardein (1993) exposed (whole-body) 30 pregnant female rats/dose to chloropicrin (99% pure) vapors at 0, 0.4, 1.2 or 3.5 ppm (analytical; 0, 2.7, 8.1 or 23.5mg/m3; HEC15 - 0, 0.16, 0.49 or 1.42 ppm) for 6 hrs/day from gestation days 6-15. Four deaths were observed at 3.5 ppm between gestation days 14 and 18. At necropsy, these four animals had red discolored lungs. No exposure-related necropsy findings were seen in the survivors. In addition, labored breathing, emaciation, coldness to touch, reduced activity, and red nasal stains were seen at 3.5 ppm primarily after gestation day 12. Emaciation, however, was observed as early as gestation day 8. In addition, animals at 1.2 and 3.5 ppm had significantly reduced mean body weights (!3% and !9%, respectively), body weight changes (-7% and -27%, respectively) and mean food consumption (!16% and !47%, respectively) during gestation days 6-9. Fetal body weights were also reduced (-6%) at 3.5 ppm. There was an increase in several skeletal variations (reduced ossification of skull bone, less than 13 rib pairs, 14th rudimentary ribs, bent ribs, unossified 5th and 6th sternebrae) at 1.2 and 3.5 ppm. However, the difference was only statistically significant at 3.5 ppm when the total number of fetuses with developmental variations was combined. The developmental NOEL was 0.4 ppm (2.7 mg/m3; HEC8hr - 0.49 ppm) based on the skeletal variations in fetuses. The maternal NOEL was also 0.4 ppm based on clinical signs, reduced body weight, body weight gains, and food consumption. DPR found this study acceptable based on FIFRA guidelines.
II.G.2. Inhalation-Rabbit
Twenty pregnant female rabbits/dose were exposed (whole body) to chloropicrin (99% pure) vapors at 0, 0.4, 1.2, or 2.0 ppm (analytical; 0, 2.7, 8.1 or 13.4 mg/m3; HEC16 - 0, 0.092, 0.27 or 0.46 ppm) for 6 hrs/day during gestation days 7 to 20 (York, 1993). Deaths occurred at 1.2 ppm (2 deaths on gestation days 9 and 19) and 2.0 ppm (10 deaths on gestation days 9, 10, 11, and 19) (Table 13). All of the animals that died had red discoloration of the lungs at necropsy. In addition, 1 animal at 1.2 ppm (died gestation day 19) and 7 animals at 2.0 ppm (died gestation days 9-11, and 19) had edema of the lungs. Various clinical signs indicative of sensory or respiratory irritation were seen at 1.2 and/or 2.0 ppm, including gasping, labored breathing, increased salivation, clear nasal discharge, red area around eyes/eyelids, and excessive lacrimation. Some of these signs occurred within the first few days of exposure, so they could be considered acute effects. The nasal discharge appears to be one of the more sensitive acute endpoints with an onset between gestation days 7 and 11 in 7 of 18 animals at 1.2 ppm. Reductions in body weight and food consumption also appear to be an acute effect due to the
15 HEC = ppm x RRa/RRh x Ea/Eh. RRa = 0.96 m3/kg/day for the rat (Zielhuis and van der Kreek, 1979). RRh = 0.59 m3/kg/day for a child (DPR, 2000). Ea = 6 hours/day, 7 days/week. Eh = 24 hours/day, 7 days/week.
16 HEC = ppm x RRa/RRh x Ea/Eh. RRa = 0.54 m3/kg/day for the rabbit (Zielhuis and van der Kreek, 1979). RRh = 0.59 m3/kg/day for a child (DPR, 2000). Ea = 6 hours/day, 7 days/week. Eh = 24 hours/day, 7 days/week..
42
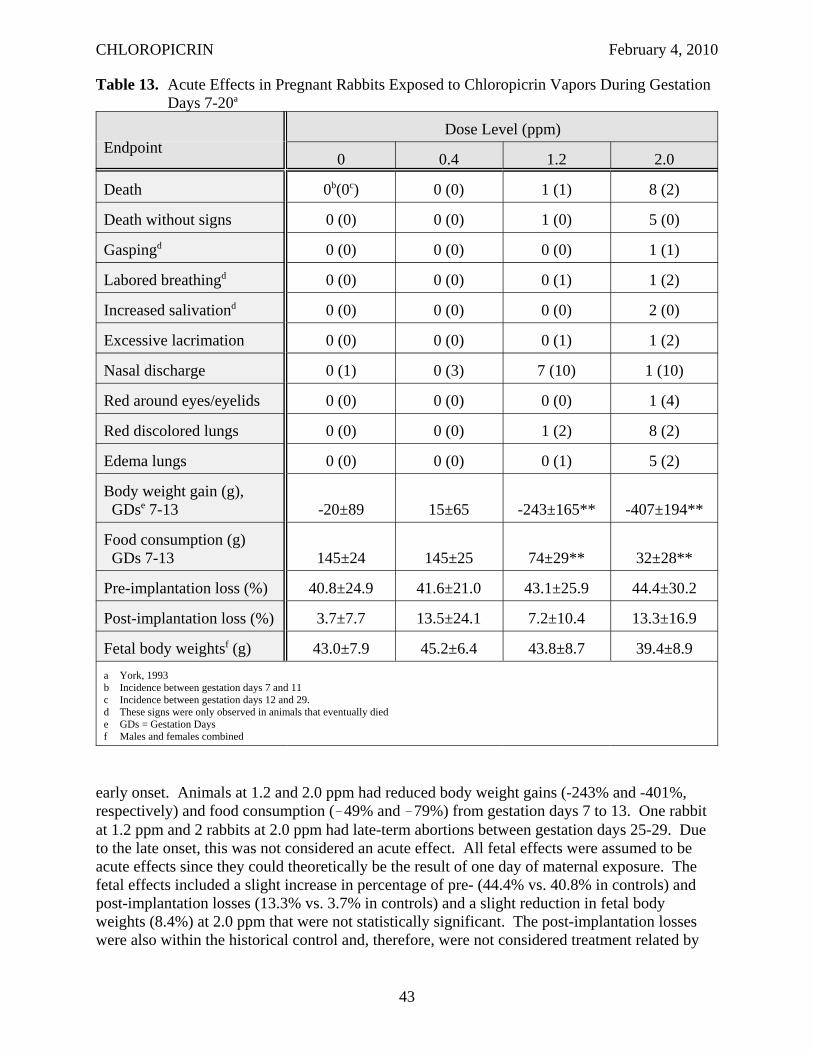
CHLOROPICRIN February 4, 2010
Table 13. Acute Effects in Pregnant Rabbits Exposed to Chloropicrin Vapors During Gestation Days 7-20a
Endpoint Dose Level (ppm)
0 0.4 1.2 2.0
Death 0b(0c) 0 (0) 1 (1) 8 (2)
Death without signs 0 (0) 0 (0) 1 (0) 5 (0)
Gaspingd 0 (0) 0 (0) 0 (0) 1 (1)
Labored breathingd 0 (0) 0 (0) 0 (1) 1 (2)
Increased salivationd 0 (0) 0 (0) 0 (0) 2 (0)
Excessive lacrimation 0 (0) 0 (0) 0 (1) 1 (2)
Nasal discharge 0 (1) 0 (3) 7 (10) 1 (10)
Red around eyes/eyelids 0 (0) 0 (0) 0 (0) 1 (4)
Red discolored lungs 0 (0) 0 (0) 1 (2) 8 (2)
Edema lungs 0 (0) 0 (0) 0 (1) 5 (2)
Body weight gain (g), GDse 7-13 -20±89 15±65 -243±165** -407±194**
Food consumption (g) GDs 7-13 145±24 145±25 74±29** 32±28**
Pre-implantation loss (%) 40.8±24.9 41.6±21.0 43.1±25.9 44.4±30.2
Post-implantation loss (%) 3.7±7.7 13.5±24.1 7.2±10.4 13.3±16.9
Fetal body weightsf (g) 43.0±7.9 45.2±6.4 43.8±8.7 39.4±8.9 a York, 1993 b Incidence between gestation days 7 and 11 c Incidence between gestation days 12 and 29. d These signs were only observed in animals that eventually died e GDs = Gestation Days f Males and females combined
early onset. Animals at 1.2 and 2.0 ppm had reduced body weight gains (-243% and -401%, respectively) and food consumption (!49% and !79%) from gestation days 7 to 13. One rabbit at 1.2 ppm and 2 rabbits at 2.0 ppm had late-term abortions between gestation days 25-29. Due to the late onset, this was not considered an acute effect. All fetal effects were assumed to be acute effects since they could theoretically be the result of one day of maternal exposure. The fetal effects included a slight increase in percentage of pre- (44.4% vs. 40.8% in controls) and post-implantation losses (13.3% vs. 3.7% in controls) and a slight reduction in fetal body weights (8.4%) at 2.0 ppm that were not statistically significant. The post-implantation losses were also within the historical control and, therefore, were not considered treatment related by
43

CHLOROPICRIN February 4, 2010
the study investigators. Several developmental variations were observed in the fetuses including visceral (left carotid artery arising from the innominate artery) and skeletal variations (unossified hyoid body and unossified tail) which were considered toxicologically significant at 2.0 ppm. The developmental NOEL was 1.2 ppm (2.7 mg/m3; HEC8hr - 0.27 ppm) based on the increased developmental variations, increased pre- and post-implantation losses, late-term abortions and reduced fetal body weights. The maternal NOEL was 0.4 ppm based on mortalities, nasal discharge, reductions in body weights and food consumption, late-term abortions and red discoloration and edema in the lung. This study was acceptable to DPR based on FIFRA guidelines.
44
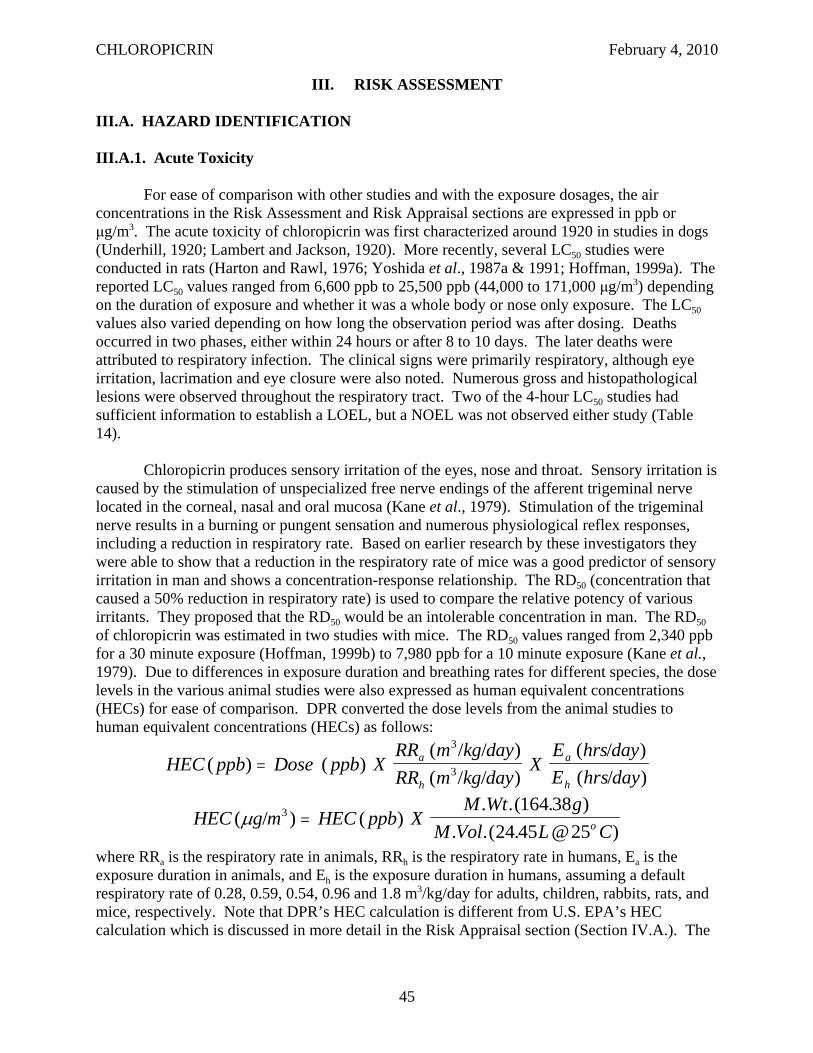
CHLOROPICRIN February 4, 2010
III. RISK ASSESSMENT
III.A. HAZARD IDENTIFICATION
III.A.1. Acute Toxicity
For ease of comparison with other studies and with the exposure dosages, the air concentrations in the Risk Assessment and Risk Appraisal sections are expressed in ppb or μg/m3. The acute toxicity of chloropicrin was first characterized around 1920 in studies in dogs (Underhill, 1920; Lambert and Jackson, 1920). More recently, several LC50 studies were conducted in rats (Harton and Rawl, 1976; Yoshida et al., 1987a & 1991; Hoffman, 1999a). The reported LC50 values ranged from 6,600 ppb to 25,500 ppb (44,000 to 171,000 μg/m3) depending on the duration of exposure and whether it was a whole body or nose only exposure. The LC50 values also varied depending on how long the observation period was after dosing. Deaths occurred in two phases, either within 24 hours or after 8 to 10 days. The later deaths were attributed to respiratory infection. The clinical signs were primarily respiratory, although eye irritation, lacrimation and eye closure were also noted. Numerous gross and histopathological lesions were observed throughout the respiratory tract. Two of the 4-hour LC50 studies had sufficient information to establish a LOEL, but a NOEL was not observed either study (Table 14).
Chloropicrin produces sensory irritation of the eyes, nose and throat. Sensory irritation is caused by the stimulation of unspecialized free nerve endings of the afferent trigeminal nerve located in the corneal, nasal and oral mucosa (Kane et al., 1979). Stimulation of the trigeminal nerve results in a burning or pungent sensation and numerous physiological reflex responses, including a reduction in respiratory rate. Based on earlier research by these investigators they were able to show that a reduction in the respiratory rate of mice was a good predictor of sensory irritation in man and shows a concentration-response relationship. The RD50 (concentration that caused a 50% reduction in respiratory rate) is used to compare the relative potency of various irritants. They proposed that the RD50 would be an intolerable concentration in man. The RD50 of chloropicrin was estimated in two studies with mice. The RD50 values ranged from 2,340 ppb for a 30 minute exposure (Hoffman, 1999b) to 7,980 ppb for a 10 minute exposure (Kane et al., 1979). Due to differences in exposure duration and breathing rates for different species, the dose levels in the various animal studies were also expressed as human equivalent concentrations (HECs) for ease of comparison. DPR converted the dose levels from the animal studies to human equivalent concentrations (HECs) as follows:
RRa ( /m3 kg day / ) Ea (hrs day / )HEC ppb ) = Dose ( ppb) X 3 kg day (hrs day
( RRh ( /m / )
X Eh / )
164 38 )HEC μg m ) = ( ) X
M Wt . .( . g( / 3 HEC ppb
M Vol . .( 24 45 . L @25o C) where RRa is the respiratory rate in animals, RRh is the respiratory rate in humans, Ea is the exposure duration in animals, and Eh is the exposure duration in humans, assuming a default respiratory rate of 0.28, 0.59, 0.54, 0.96 and 1.8 m3/kg/day for adults, children, rabbits, rats, and mice, respectively. Note that DPR’s HEC calculation is different from U.S. EPA’s HEC calculation which is discussed in more detail in the Risk Appraisal section (Section IV.A.). The
45
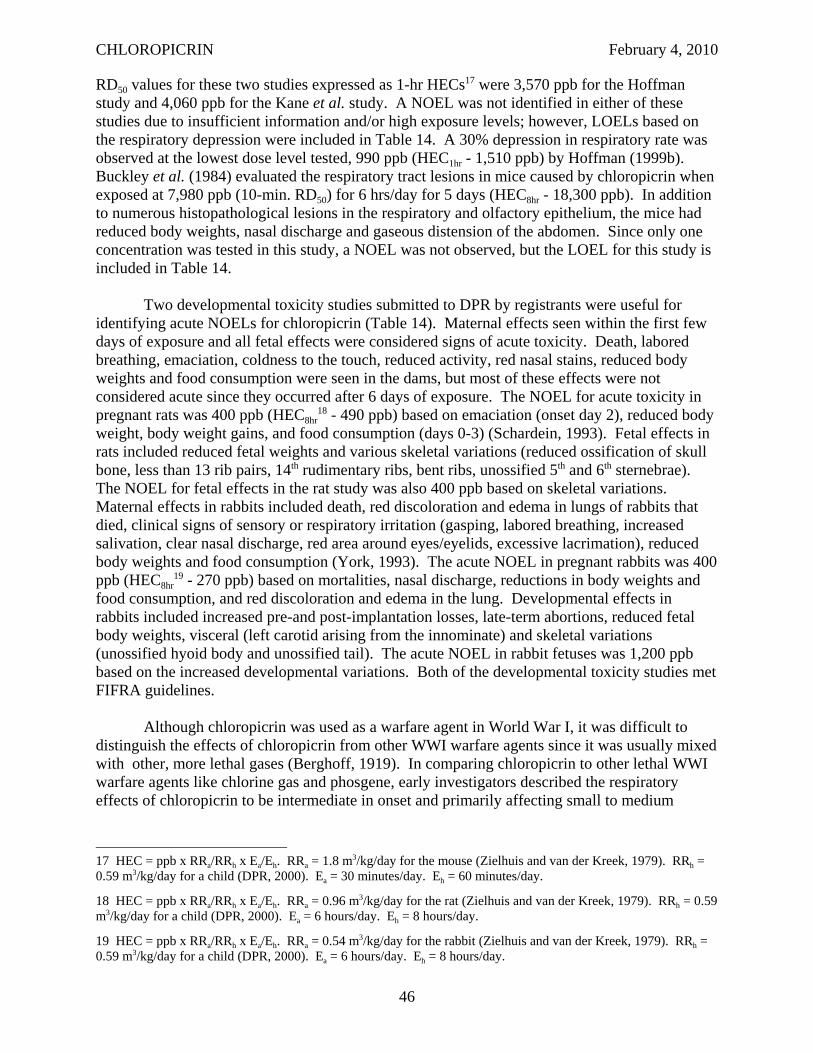
CHLOROPICRIN February 4, 2010
RD50 values for these two studies expressed as 1-hr HECs17 were 3,570 ppb for the Hoffman study and 4,060 ppb for the Kane et al. study. A NOEL was not identified in either of these studies due to insufficient information and/or high exposure levels; however, LOELs based on the respiratory depression were included in Table 14. A 30% depression in respiratory rate was observed at the lowest dose level tested, 990 ppb (HEC1hr - 1,510 ppb) by Hoffman (1999b). Buckley et al. (1984) evaluated the respiratory tract lesions in mice caused by chloropicrin when exposed at 7,980 ppb (10-min. RD50) for 6 hrs/day for 5 days (HEC8hr - 18,300 ppb). In addition to numerous histopathological lesions in the respiratory and olfactory epithelium, the mice had reduced body weights, nasal discharge and gaseous distension of the abdomen. Since only one concentration was tested in this study, a NOEL was not observed, but the LOEL for this study is included in Table 14.
Two developmental toxicity studies submitted to DPR by registrants were useful for identifying acute NOELs for chloropicrin (Table 14). Maternal effects seen within the first few days of exposure and all fetal effects were considered signs of acute toxicity. Death, labored breathing, emaciation, coldness to the touch, reduced activity, red nasal stains, reduced body weights and food consumption were seen in the dams, but most of these effects were not considered acute since they occurred after 6 days of exposure. The NOEL for acute toxicity in pregnant rats was 400 ppb (HEC8hr
18 - 490 ppb) based on emaciation (onset day 2), reduced body weight, body weight gains, and food consumption (days 0-3) (Schardein, 1993). Fetal effects in rats included reduced fetal weights and various skeletal variations (reduced ossification of skull bone, less than 13 rib pairs, 14th rudimentary ribs, bent ribs, unossified 5th and 6th sternebrae). The NOEL for fetal effects in the rat study was also 400 ppb based on skeletal variations. Maternal effects in rabbits included death, red discoloration and edema in lungs of rabbits that died, clinical signs of sensory or respiratory irritation (gasping, labored breathing, increased salivation, clear nasal discharge, red area around eyes/eyelids, excessive lacrimation), reduced body weights and food consumption (York, 1993). The acute NOEL in pregnant rabbits was 400 ppb (HEC8hr
19 - 270 ppb) based on mortalities, nasal discharge, reductions in body weights and food consumption, and red discoloration and edema in the lung. Developmental effects in rabbits included increased pre-and post-implantation losses, late-term abortions, reduced fetal body weights, visceral (left carotid arising from the innominate) and skeletal variations (unossified hyoid body and unossified tail). The acute NOEL in rabbit fetuses was 1,200 ppb based on the increased developmental variations. Both of the developmental toxicity studies met FIFRA guidelines.
Although chloropicrin was used as a warfare agent in World War I, it was difficult to distinguish the effects of chloropicrin from other WWI warfare agents since it was usually mixed with other, more lethal gases (Berghoff, 1919). In comparing chloropicrin to other lethal WWI warfare agents like chlorine gas and phosgene, early investigators described the respiratory effects of chloropicrin to be intermediate in onset and primarily affecting small to medium
17 HEC = ppb x RRa/RRh x Ea/Eh. RRa = 1.8 m3/kg/day for the mouse (Zielhuis and van der Kreek, 1979). RRh = 0.59 m3/kg/day for a child (DPR, 2000). Ea = 30 minutes/day. Eh = 60 minutes/day.
18 HEC = ppb x RRa/RRh x Ea/Eh. RRa = 0.96 m3/kg/day for the rat (Zielhuis and van der Kreek, 1979). RRh = 0.59 m3/kg/day for a child (DPR, 2000). Ea = 6 hours/day. Eh = 8 hours/day.
19 HEC = ppb x RRa/RRh x Ea/Eh. RRa = 0.54 m3/kg/day for the rabbit (Zielhuis and van der Kreek, 1979). RRh = 0.59 m3/kg/day for a child (DPR, 2000). Ea = 6 hours/day. Eh = 8 hours/day.
46
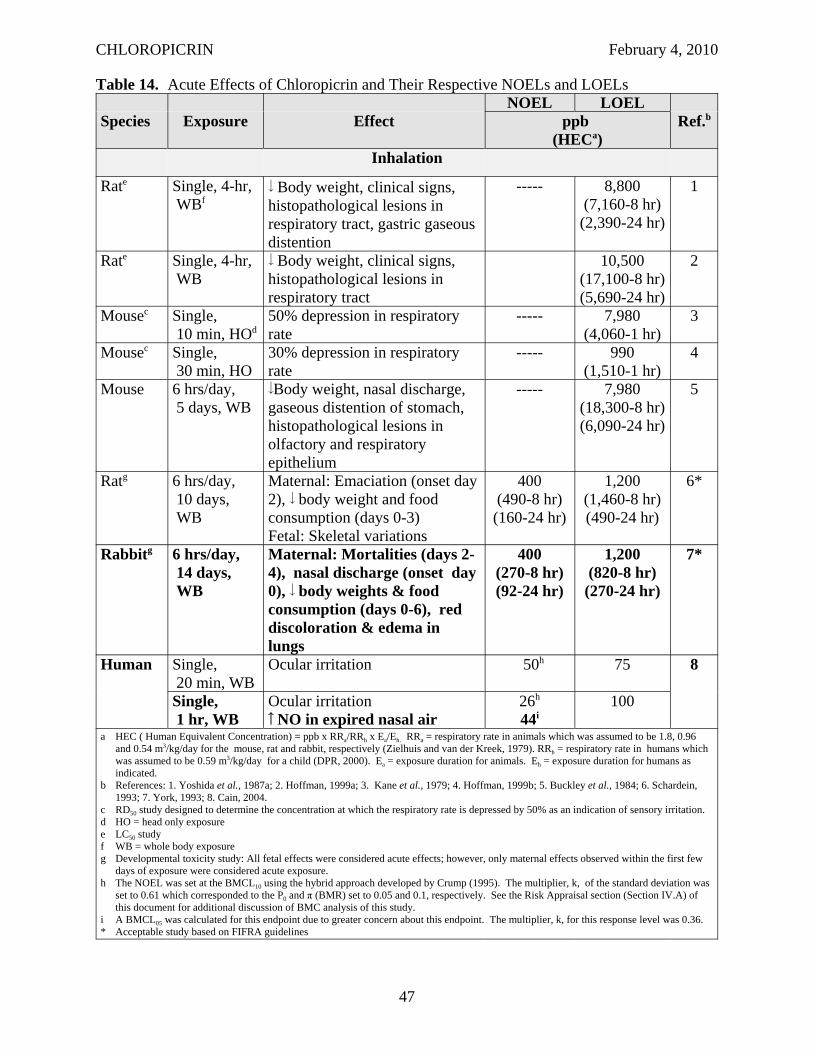
CHLOROPICRIN February 4, 2010
Table 14. Acute Effects of Chloropicrin and Their Respective NOELs and LOELs
Species Exposure Effect NOEL LOEL
Ref.bppb (HECa)
Inhalation
Rate Single, 4-hr, WBf
Body weight, clinical signs, histopathological lesions in respiratory tract, gastric gaseous distention
----- 8,800 (7,160-8 hr) (2,390-24 hr)
1
Rate Single, 4-hr, WB
Body weight, clinical signs, histopathological lesions in respiratory tract
10,500 (17,100-8 hr) (5,690-24 hr)
2
Mousec Single, 10 min, HOd
50% depression in respiratory rate
----- 7,980 (4,060-1 hr)
3
Mousec Single, 30 min, HO
30% depression in respiratory rate
----- 990 (1,510-1 hr)
4
Mouse 6 hrs/day, 5 days, WB
Body weight, nasal discharge, gaseous distention of stomach, histopathological lesions in olfactory and respiratory epithelium
----- 7,980 (18,300-8 hr) (6,090-24 hr)
5
Ratg 6 hrs/day, 10 days, WB
Maternal: Emaciation (onset day 2), body weight and food consumption (days 0-3) Fetal: Skeletal variations
400 (490-8 hr) (160-24 hr)
1,200 (1,460-8 hr) (490-24 hr)
6*
Rabbitg 6 hrs/day, 14 days, WB
Maternal: Mortalities (days 24), nasal discharge (onset day 0), body weights & food consumption (days 0-6), red discoloration & edema in lungs
400 (270-8 hr) (92-24 hr)
1,200 (820-8 hr) (270-24 hr)
7*
Human Single, 20 min, WB
Ocular irritation 50h 75 8
Single, 1 hr, WB
Ocular irritation NO in expired nasal air
26h
44i 100
a HEC ( Human Equivalent Concentration) = ppb x RRa/RRh x Ea/Eh. RRa = respiratory rate in animals which was assumed to be 1.8, 0.96 and 0.54 m3/kg/day for the mouse, rat and rabbit, respectively (Zielhuis and van der Kreek, 1979). RRh = respiratory rate in humans which was assumed to be 0.59 m3/kg/day for a child (DPR, 2000). Ea = exposure duration for animals. Eh = exposure duration for humans as indicated.
b References: 1. Yoshida et al., 1987a; 2. Hoffman, 1999a; 3. Kane et al., 1979; 4. Hoffman, 1999b; 5. Buckley et al., 1984; 6. Schardein, 1993; 7. York, 1993; 8. Cain, 2004.
c RD50 study designed to determine the concentration at which the respiratory rate is depressed by 50% as an indication of sensory irritation. d HO = head only exposure e LC50 study f WB = whole body exposure g Developmental toxicity study: All fetal effects were considered acute effects; however, only maternal effects observed within the first few
days of exposure were considered acute exposure. h The NOEL was set at the BMCL10 using the hybrid approach developed by Crump (1995). The multiplier, k, of the standard deviation was
set to 0.61 which corresponded to the P0 and π (BMR) set to 0.05 and 0.1, respectively. See the Risk Appraisal section (Section IV.A) of this document for additional discussion of BMC analysis of this study.
i A BMCL05 was calculated for this endpoint due to greater concern about this endpoint. The multiplier, k, for this response level was 0.36. * Acceptable study based on FIFRA guidelines
47
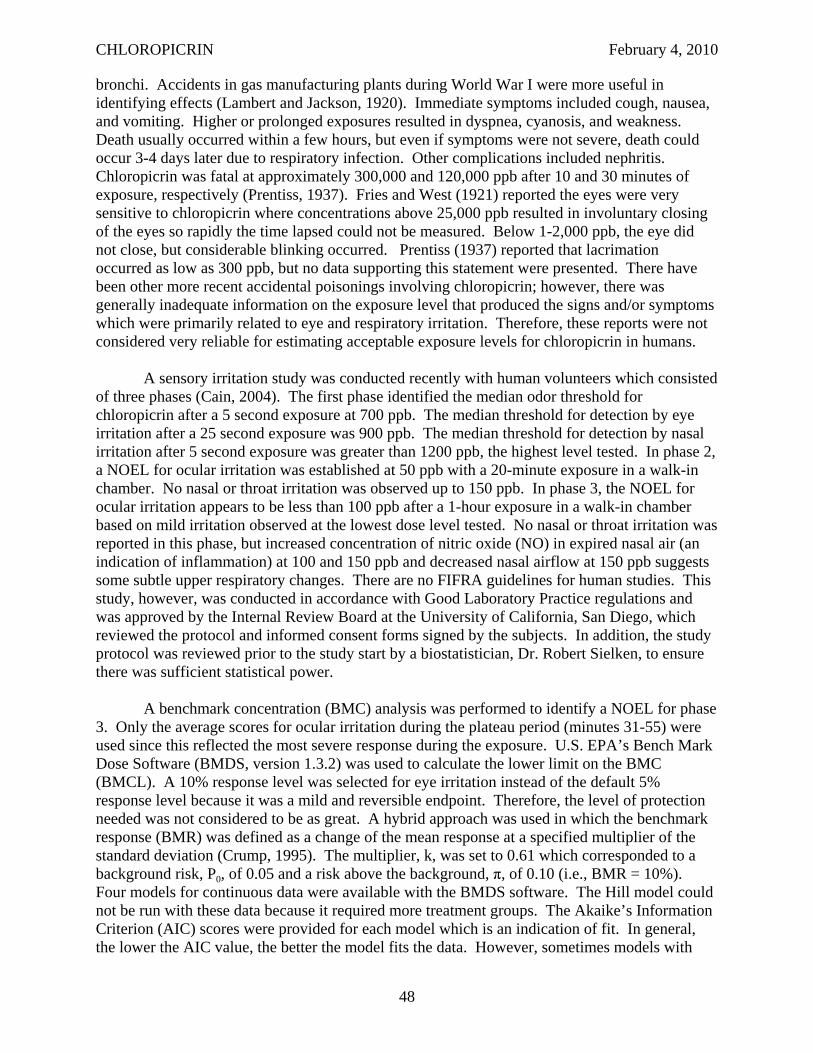
CHLOROPICRIN February 4, 2010
bronchi. Accidents in gas manufacturing plants during World War I were more useful in identifying effects (Lambert and Jackson, 1920). Immediate symptoms included cough, nausea, and vomiting. Higher or prolonged exposures resulted in dyspnea, cyanosis, and weakness. Death usually occurred within a few hours, but even if symptoms were not severe, death could occur 3-4 days later due to respiratory infection. Other complications included nephritis. Chloropicrin was fatal at approximately 300,000 and 120,000 ppb after 10 and 30 minutes of exposure, respectively (Prentiss, 1937). Fries and West (1921) reported the eyes were very sensitive to chloropicrin where concentrations above 25,000 ppb resulted in involuntary closing of the eyes so rapidly the time lapsed could not be measured. Below 1-2,000 ppb, the eye did not close, but considerable blinking occurred. Prentiss (1937) reported that lacrimation occurred as low as 300 ppb, but no data supporting this statement were presented. There have been other more recent accidental poisonings involving chloropicrin; however, there was generally inadequate information on the exposure level that produced the signs and/or symptoms which were primarily related to eye and respiratory irritation. Therefore, these reports were not considered very reliable for estimating acceptable exposure levels for chloropicrin in humans.
A sensory irritation study was conducted recently with human volunteers which consisted of three phases (Cain, 2004). The first phase identified the median odor threshold for chloropicrin after a 5 second exposure at 700 ppb. The median threshold for detection by eye irritation after a 25 second exposure was 900 ppb. The median threshold for detection by nasal irritation after 5 second exposure was greater than 1200 ppb, the highest level tested. In phase 2, a NOEL for ocular irritation was established at 50 ppb with a 20-minute exposure in a walk-in chamber. No nasal or throat irritation was observed up to 150 ppb. In phase 3, the NOEL for ocular irritation appears to be less than 100 ppb after a 1-hour exposure in a walk-in chamber based on mild irritation observed at the lowest dose level tested. No nasal or throat irritation was reported in this phase, but increased concentration of nitric oxide (NO) in expired nasal air (an indication of inflammation) at 100 and 150 ppb and decreased nasal airflow at 150 ppb suggests some subtle upper respiratory changes. There are no FIFRA guidelines for human studies. This study, however, was conducted in accordance with Good Laboratory Practice regulations and was approved by the Internal Review Board at the University of California, San Diego, which reviewed the protocol and informed consent forms signed by the subjects. In addition, the study protocol was reviewed prior to the study start by a biostatistician, Dr. Robert Sielken, to ensure there was sufficient statistical power.
A benchmark concentration (BMC) analysis was performed to identify a NOEL for phase 3. Only the average scores for ocular irritation during the plateau period (minutes 31-55) were used since this reflected the most severe response during the exposure. U.S. EPA’s Bench Mark Dose Software (BMDS, version 1.3.2) was used to calculate the lower limit on the BMC (BMCL). A 10% response level was selected for eye irritation instead of the default 5% response level because it was a mild and reversible endpoint. Therefore, the level of protection needed was not considered to be as great. A hybrid approach was used in which the benchmark response (BMR) was defined as a change of the mean response at a specified multiplier of the standard deviation (Crump, 1995). The multiplier, k, was set to 0.61 which corresponded to a background risk, P0, of 0.05 and a risk above the background, π, of 0.10 (i.e., BMR = 10%). Four models for continuous data were available with the BMDS software. The Hill model could not be run with these data because it required more treatment groups. The Akaike’s Information Criterion (AIC) scores were provided for each model which is an indication of fit. In general, the lower the AIC value, the better the model fits the data. However, sometimes models with
48
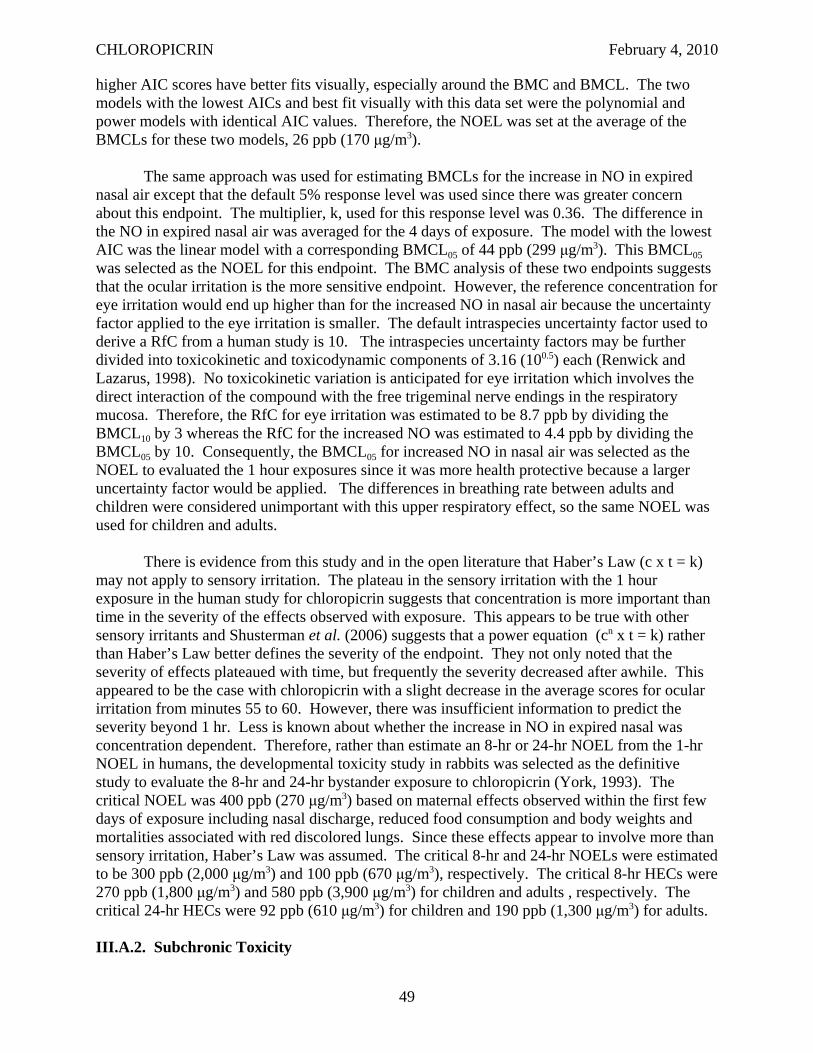
CHLOROPICRIN February 4, 2010
higher AIC scores have better fits visually, especially around the BMC and BMCL. The two models with the lowest AICs and best fit visually with this data set were the polynomial and power models with identical AIC values. Therefore, the NOEL was set at the average of the BMCLs for these two models, 26 ppb (170 μg/m3).
The same approach was used for estimating BMCLs for the increase in NO in expired nasal air except that the default 5% response level was used since there was greater concern about this endpoint. The multiplier, k, used for this response level was 0.36. The difference in the NO in expired nasal air was averaged for the 4 days of exposure. The model with the lowest AIC was the linear model with a corresponding BMCL05 of 44 ppb (299 μg/m3). This BMCL05 was selected as the NOEL for this endpoint. The BMC analysis of these two endpoints suggests that the ocular irritation is the more sensitive endpoint. However, the reference concentration for eye irritation would end up higher than for the increased NO in nasal air because the uncertainty factor applied to the eye irritation is smaller. The default intraspecies uncertainty factor used to derive a RfC from a human study is 10. The intraspecies uncertainty factors may be further divided into toxicokinetic and toxicodynamic components of 3.16 (100.5) each (Renwick and Lazarus, 1998). No toxicokinetic variation is anticipated for eye irritation which involves the direct interaction of the compound with the free trigeminal nerve endings in the respiratory mucosa. Therefore, the RfC for eye irritation was estimated to be 8.7 ppb by dividing the BMCL10 by 3 whereas the RfC for the increased NO was estimated to 4.4 ppb by dividing the BMCL05 by 10. Consequently, the BMCL05 for increased NO in nasal air was selected as the NOEL to evaluated the 1 hour exposures since it was more health protective because a larger uncertainty factor would be applied. The differences in breathing rate between adults and children were considered unimportant with this upper respiratory effect, so the same NOEL was used for children and adults.
There is evidence from this study and in the open literature that Haber’s Law (c x t = k) may not apply to sensory irritation. The plateau in the sensory irritation with the 1 hour exposure in the human study for chloropicrin suggests that concentration is more important than time in the severity of the effects observed with exposure. This appears to be true with other sensory irritants and Shusterman et al. (2006) suggests that a power equation (cn x t = k) rather than Haber’s Law better defines the severity of the endpoint. They not only noted that the severity of effects plateaued with time, but frequently the severity decreased after awhile. This appeared to be the case with chloropicrin with a slight decrease in the average scores for ocular irritation from minutes 55 to 60. However, there was insufficient information to predict the severity beyond 1 hr. Less is known about whether the increase in NO in expired nasal was concentration dependent. Therefore, rather than estimate an 8-hr or 24-hr NOEL from the 1-hr NOEL in humans, the developmental toxicity study in rabbits was selected as the definitive study to evaluate the 8-hr and 24-hr bystander exposure to chloropicrin (York, 1993). The critical NOEL was 400 ppb (270 μg/m3) based on maternal effects observed within the first few days of exposure including nasal discharge, reduced food consumption and body weights and mortalities associated with red discolored lungs. Since these effects appear to involve more than sensory irritation, Haber’s Law was assumed. The critical 8-hr and 24-hr NOELs were estimated to be 300 ppb (2,000 μg/m3) and 100 ppb (670 μg/m3), respectively. The critical 8-hr HECs were 270 ppb (1,800 μg/m3) and 580 ppb (3,900 μg/m3) for children and adults , respectively. The critical 24-hr HECs were 92 ppb (610 μg/m3) for children and 190 ppb (1,300 μg/m3) for adults.
III.A.2. Subchronic Toxicity
49
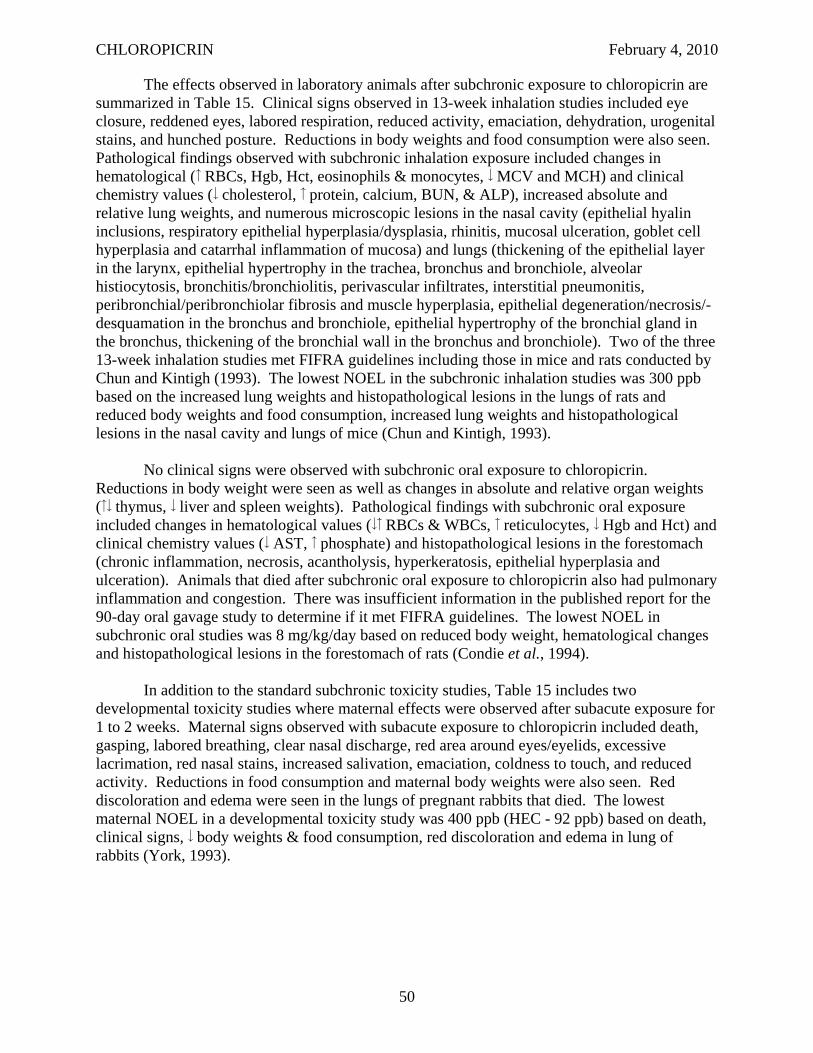
CHLOROPICRIN February 4, 2010
The effects observed in laboratory animals after subchronic exposure to chloropicrin are summarized in Table 15. Clinical signs observed in 13-week inhalation studies included eye closure, reddened eyes, labored respiration, reduced activity, emaciation, dehydration, urogenital stains, and hunched posture. Reductions in body weights and food consumption were also seen. Pathological findings observed with subchronic inhalation exposure included changes in hematological ( RBCs, Hgb, Hct, eosinophils & monocytes, MCV and MCH) and clinical chemistry values ( cholesterol, protein, calcium, BUN, & ALP), increased absolute and relative lung weights, and numerous microscopic lesions in the nasal cavity (epithelial hyalin inclusions, respiratory epithelial hyperplasia/dysplasia, rhinitis, mucosal ulceration, goblet cell hyperplasia and catarrhal inflammation of mucosa) and lungs (thickening of the epithelial layer in the larynx, epithelial hypertrophy in the trachea, bronchus and bronchiole, alveolar histiocytosis, bronchitis/bronchiolitis, perivascular infiltrates, interstitial pneumonitis, peribronchial/peribronchiolar fibrosis and muscle hyperplasia, epithelial degeneration/necrosis/desquamation in the bronchus and bronchiole, epithelial hypertrophy of the bronchial gland in the bronchus, thickening of the bronchial wall in the bronchus and bronchiole). Two of the three 13-week inhalation studies met FIFRA guidelines including those in mice and rats conducted by Chun and Kintigh (1993). The lowest NOEL in the subchronic inhalation studies was 300 ppb based on the increased lung weights and histopathological lesions in the lungs of rats and reduced body weights and food consumption, increased lung weights and histopathological lesions in the nasal cavity and lungs of mice (Chun and Kintigh, 1993).
No clinical signs were observed with subchronic oral exposure to chloropicrin. Reductions in body weight were seen as well as changes in absolute and relative organ weights ( thymus, liver and spleen weights). Pathological findings with subchronic oral exposure included changes in hematological values ( RBCs & WBCs, reticulocytes, Hgb and Hct) and clinical chemistry values ( AST, phosphate) and histopathological lesions in the forestomach (chronic inflammation, necrosis, acantholysis, hyperkeratosis, epithelial hyperplasia and ulceration). Animals that died after subchronic oral exposure to chloropicrin also had pulmonary inflammation and congestion. There was insufficient information in the published report for the 90-day oral gavage study to determine if it met FIFRA guidelines. The lowest NOEL in subchronic oral studies was 8 mg/kg/day based on reduced body weight, hematological changes and histopathological lesions in the forestomach of rats (Condie et al., 1994).
In addition to the standard subchronic toxicity studies, Table 15 includes two developmental toxicity studies where maternal effects were observed after subacute exposure for 1 to 2 weeks. Maternal signs observed with subacute exposure to chloropicrin included death, gasping, labored breathing, clear nasal discharge, red area around eyes/eyelids, excessive lacrimation, red nasal stains, increased salivation, emaciation, coldness to touch, and reduced activity. Reductions in food consumption and maternal body weights were also seen. Red discoloration and edema were seen in the lungs of pregnant rabbits that died. The lowest maternal NOEL in a developmental toxicity study was 400 ppb (HEC - 92 ppb) based on death, clinical signs, body weights & food consumption, red discoloration and edema in lung of rabbits (York, 1993).
50
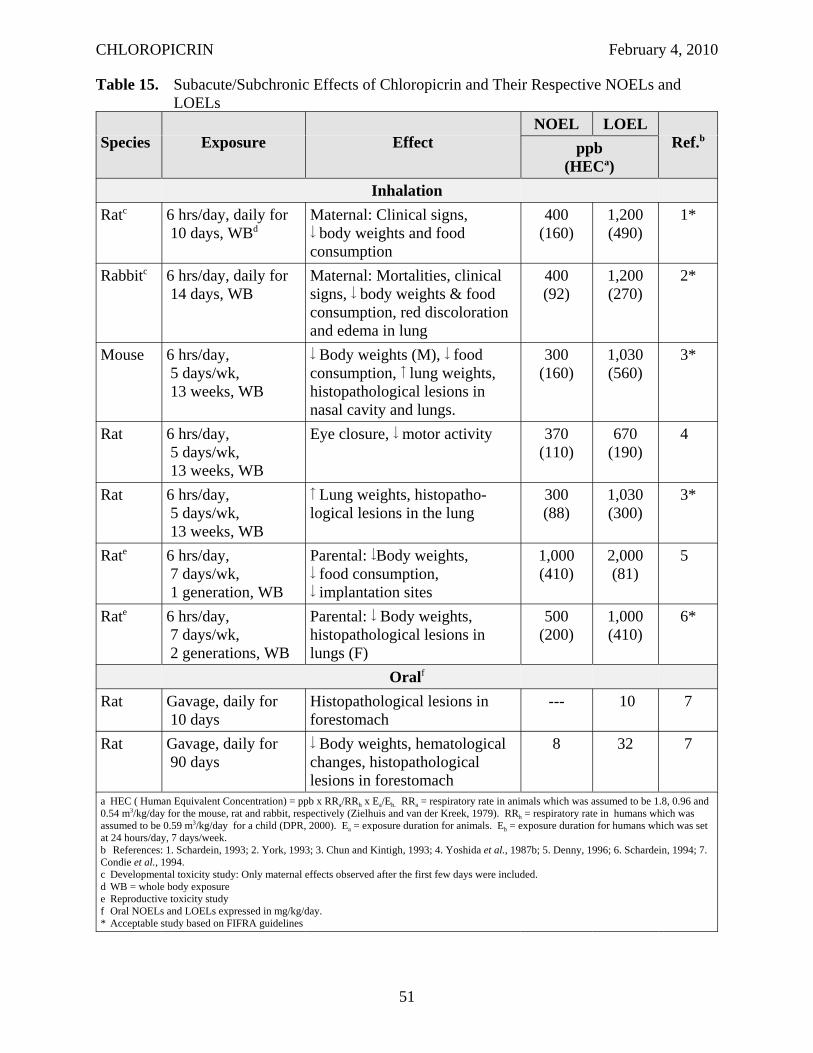
CHLOROPICRIN February 4, 2010
Table 15. Subacute/Subchronic Effects of Chloropicrin and Their Respective NOELs and LOELs
Species Exposure Effect NOEL LOEL
Ref.bppb (HECa)
Inhalation Ratc 6 hrs/day, daily for
10 days, WBd Maternal: Clinical signs, body weights and food consumption
400 (160)
1,200 (490)
1*
Rabbitc 6 hrs/day, daily for 14 days, WB
Maternal: Mortalities, clinical signs, body weights & food consumption, red discoloration and edema in lung
400 (92)
1,200 (270)
2*
Mouse 6 hrs/day, 5 days/wk, 13 weeks, WB
Body weights (M), food consumption, lung weights, histopathological lesions in nasal cavity and lungs.
300 (160)
1,030 (560)
3*
Rat 6 hrs/day, 5 days/wk, 13 weeks, WB
Eye closure, motor activity 370 (110)
670 (190)
4
Rat 6 hrs/day, 5 days/wk, 13 weeks, WB
Lung weights, histopathological lesions in the lung
300 (88)
1,030 (300)
3*
Rate 6 hrs/day, 7 days/wk, 1 generation, WB
Parental: Body weights, food consumption, implantation sites
1,000 (410)
2,000 (81)
5
Rate 6 hrs/day, 7 days/wk, 2 generations, WB
Parental: Body weights, histopathological lesions in lungs (F)
500 (200)
1,000 (410)
6*
Oralf
Rat Gavage, daily for 10 days
Histopathological lesions in forestomach
--- 10 7
Rat Gavage, daily for 90 days
Body weights, hematological changes, histopathological lesions in forestomach
8 32 7
a HEC ( Human Equivalent Concentration) = ppb x RRa/RRh x Ea/Eh. RRa = respiratory rate in animals which was assumed to be 1.8, 0.96 and 0.54 m3/kg/day for the mouse, rat and rabbit, respectively (Zielhuis and van der Kreek, 1979). RRh = respiratory rate in humans which was assumed to be 0.59 m3/kg/day for a child (DPR, 2000). Ea = exposure duration for animals. Eh = exposure duration for humans which was set at 24 hours/day, 7 days/week. b References: 1. Schardein, 1993; 2. York, 1993; 3. Chun and Kintigh, 1993; 4. Yoshida et al., 1987b; 5. Denny, 1996; 6. Schardein, 1994; 7. Condie et al., 1994. c Developmental toxicity study: Only maternal effects observed after the first few days were included. d WB = whole body exposure e Reproductive toxicity study f Oral NOELs and LOELs expressed in mg/kg/day. * Acceptable study based on FIFRA guidelines
51
CHLOROPICRIN February 4, 2010
The effects observed in the two reproductive toxicity studies after subchronic inhalation exposure to chloropicrin for one or two generations were also included in Table 15. No clinical signs were observed in either study. The effects observed in the parental generations included reductions in body weight and food consumption and pathological lesions in the lungs (gross: red discoloration, tan foci, white foci, nodule and adhesions; histological: acute/subacute inflammation). There was no treatment-related effect on reproductive parameters, except a reduction in the number of implantation sites in the 1-generation study (Denny, 1996). The lowest parental NOEL was 500 ppb (HEC - 200 ppb) based on the reduced body weights and pathological lesions in the lungs in the two-generation study. The lowest reproductive NOEL was 1,000 ppb (HEC - 410 ppb) based on the reduced number of implantation sites in the one-generation study.
The NOELs for the 90-day inhalation studies in rats and mice were identical, although mice appear to be more sensitive than rats based on the severity of endpoints at the LOEL. On the other hand, if breathing rate is taken into consideration, the rats appear to be more sensitive. Consequently, a benchmark dose analysis was performed on the more sensitive endpoints observed in these studies, taking into consideration the breathing rate adjustments. The BMDS software was also used for this analysis, except the models for dichotomous data were used for the histopathological lesions. Because the histological effects were more frank effects, the BMCL at the 5% response level was selected as equivalent to a NOEL. Also, because there appeared to be gender-related differences, the incidences for the males and females were not combined. As with the models for continuous data, AIC scores were generated. In comparing the results from the various models, it was noted that even when the AIC scores and visual fit were similar among the models, the BMCL estimate could vary significantly because of differences in the way the confidence limits were calculated between the models. This made selection of the most sensitive endpoint difficult because it could be very model dependent. Consequently, one model was selected to compare all the endpoints. The probit model was selected for this purpose because it seemed to have a good fit consistently with tight confidence limits among the various data sets. Table 16 summarizes the BMC analysis for the respiratory lesions with non-significant increases at the lowest dose, including their respective BMC and BMCL05 estimates. The BMCL05 estimates were then converted to HECs for children and adults, adjusting for species differences in breathing rate. The BMC analysis for goblet cell hyperplasia in rats was not shown despite a significant increase in females at the lowest dose. The increase in males was not significant in males even at the high dose and the trend was also not significant. Meaningful results could not be obtained with the female incidence because of the non-monotonic dose response which resulted in a poor fit with all models. Based on a comparison of the HECs in Table 16, the rhinitis in female rats appears to be the most sensitive endpoint with subchronic exposure. Therefore, the 90-day inhalation study conducted by Chun and Kintigh (1993) was selected as the definitive study for evaluating seasonal exposure to chloropicrin in air based on the rhinitis in female rats with a BMCL05 of 120 ppb (HEC = 35 ppb for children and 73 ppb for adults).
III.A.3. Chronic Toxicity
The effects observed in laboratory animals with chronic exposure to chloropicrin are summarized in Table 17. Two chronic inhalation studies were conducted with chloropicrin, one in mice and the other in rats. The effects observed with chronic inhalation exposure included
52
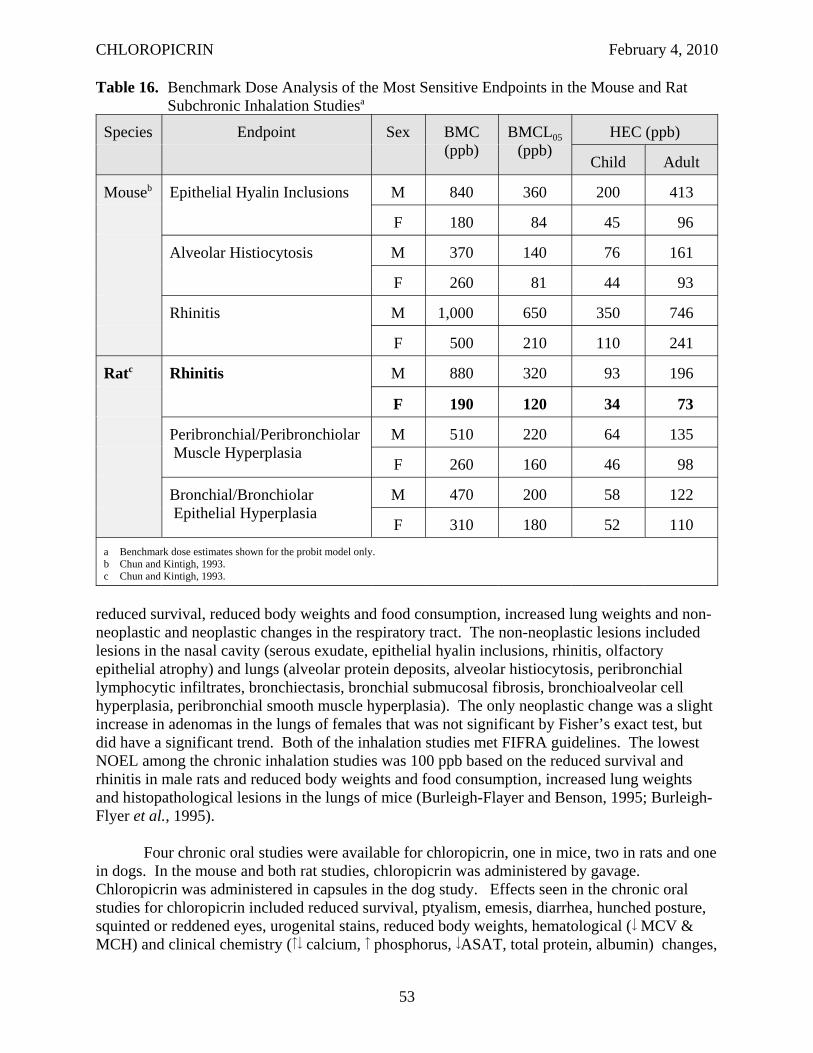
CHLOROPICRIN February 4, 2010
Table 16. Benchmark Dose Analysis of the Most Sensitive Endpoints in the Mouse and Rat Subchronic Inhalation Studiesa
Species Endpoint Sex BMC (ppb)
BMCL05 (ppb)
HEC (ppb)
Child Adult
Mouseb Epithelial Hyalin Inclusions M 840 360 200 413
F 180 84 45 96
Alveolar Histiocytosis M 370 140 76 161
F 260 81 44 93
Rhinitis M 1,000 650 350 746
F 500 210 110 241
Ratc Rhinitis M 880 320 93 196
F 190 120 34 73
Peribronchial/Peribronchiolar Muscle Hyperplasia
M 510 220 64 135
F 260 160 46 98
Bronchial/Bronchiolar Epithelial Hyperplasia
M 470 200 58 122
F 310 180 52 110 a Benchmark dose estimates shown for the probit model only. b Chun and Kintigh, 1993. c Chun and Kintigh, 1993.
reduced survival, reduced body weights and food consumption, increased lung weights and nonneoplastic and neoplastic changes in the respiratory tract. The non-neoplastic lesions included lesions in the nasal cavity (serous exudate, epithelial hyalin inclusions, rhinitis, olfactory epithelial atrophy) and lungs (alveolar protein deposits, alveolar histiocytosis, peribronchial lymphocytic infiltrates, bronchiectasis, bronchial submucosal fibrosis, bronchioalveolar cell hyperplasia, peribronchial smooth muscle hyperplasia). The only neoplastic change was a slight increase in adenomas in the lungs of females that was not significant by Fisher’s exact test, but did have a significant trend. Both of the inhalation studies met FIFRA guidelines. The lowest NOEL among the chronic inhalation studies was 100 ppb based on the reduced survival and rhinitis in male rats and reduced body weights and food consumption, increased lung weights and histopathological lesions in the lungs of mice (Burleigh-Flayer and Benson, 1995; Burleigh-Flyer et al., 1995).
Four chronic oral studies were available for chloropicrin, one in mice, two in rats and one in dogs. In the mouse and both rat studies, chloropicrin was administered by gavage. Chloropicrin was administered in capsules in the dog study. Effects seen in the chronic oral studies for chloropicrin included reduced survival, ptyalism, emesis, diarrhea, hunched posture, squinted or reddened eyes, urogenital stains, reduced body weights, hematological ( MCV & MCH) and clinical chemistry ( calcium, phosphorus, ASAT, total protein, albumin) changes,
53
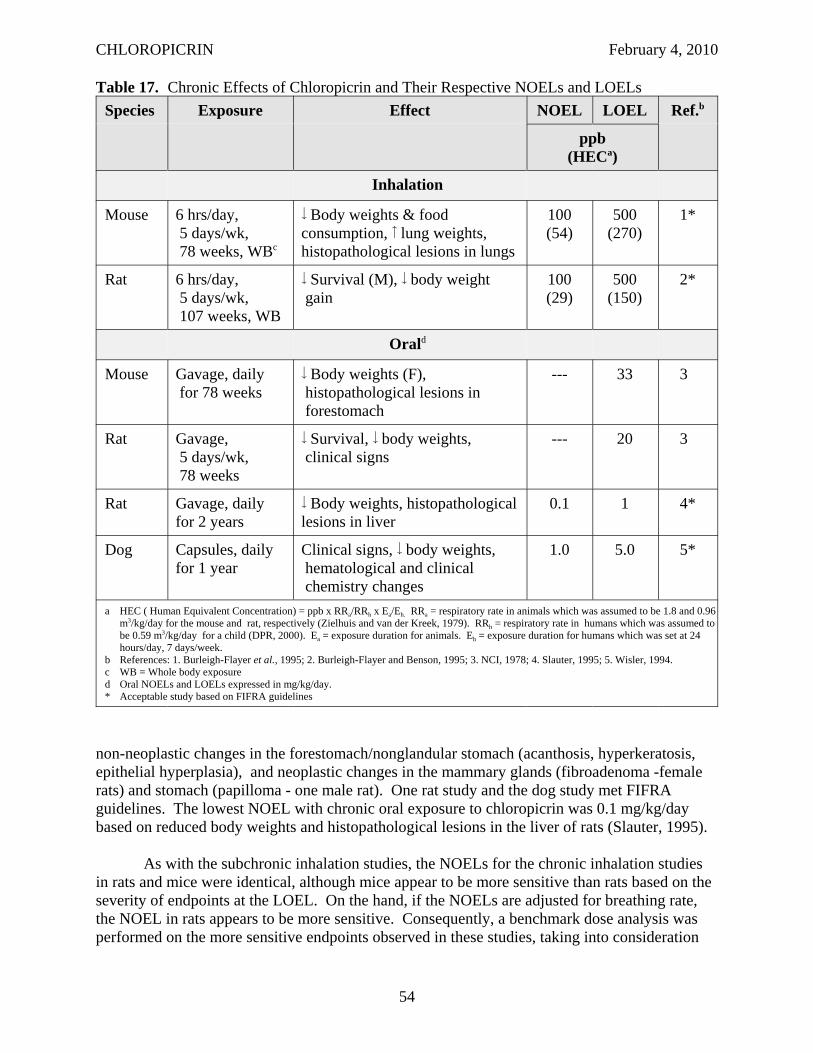
CHLOROPICRIN February 4, 2010
Table 17. Chronic Effects of Chloropicrin and Their Respective NOELs and LOELs Species Exposure Effect NOEL LOEL Ref.b
ppb (HECa)
Inhalation
Mouse 6 hrs/day, 5 days/wk, 78 weeks, WBc
Body weights & food consumption, lung weights, histopathological lesions in lungs
100 (54)
500 (270)
1*
Rat 6 hrs/day, 5 days/wk, 107 weeks, WB
Survival (M), body weight gain
100 (29)
500 (150)
2*
Orald
Mouse Gavage, daily for 78 weeks
Body weights (F), histopathological lesions in forestomach
--- 33 3
Rat Gavage, 5 days/wk, 78 weeks
Survival, body weights, clinical signs
--- 20 3
Rat Gavage, daily for 2 years
Body weights, histopathological lesions in liver
0.1 1 4*
Dog Capsules, daily for 1 year
Clinical signs, body weights, hematological and clinical chemistry changes
1.0 5.0 5*
a HEC ( Human Equivalent Concentration) = ppb x RRa/RRh x Ea/Eh. RRa = respiratory rate in animals which was assumed to be 1.8 and 0.96 m3/kg/day for the mouse and rat, respectively (Zielhuis and van der Kreek, 1979). RRh = respiratory rate in humans which was assumed to be 0.59 m3/kg/day for a child (DPR, 2000). Ea = exposure duration for animals. Eh = exposure duration for humans which was set at 24 hours/day, 7 days/week.
b References: 1. Burleigh-Flayer et al., 1995; 2. Burleigh-Flayer and Benson, 1995; 3. NCI, 1978; 4. Slauter, 1995; 5. Wisler, 1994. c WB = Whole body exposure d Oral NOELs and LOELs expressed in mg/kg/day. * Acceptable study based on FIFRA guidelines
non-neoplastic changes in the forestomach/nonglandular stomach (acanthosis, hyperkeratosis, epithelial hyperplasia), and neoplastic changes in the mammary glands (fibroadenoma -female rats) and stomach (papilloma - one male rat). One rat study and the dog study met FIFRA guidelines. The lowest NOEL with chronic oral exposure to chloropicrin was 0.1 mg/kg/day based on reduced body weights and histopathological lesions in the liver of rats (Slauter, 1995).
As with the subchronic inhalation studies, the NOELs for the chronic inhalation studies in rats and mice were identical, although mice appear to be more sensitive than rats based on the severity of endpoints at the LOEL. On the hand, if the NOELs are adjusted for breathing rate, the NOEL in rats appears to be more sensitive. Consequently, a benchmark dose analysis was performed on the more sensitive endpoints observed in these studies, taking into consideration
54
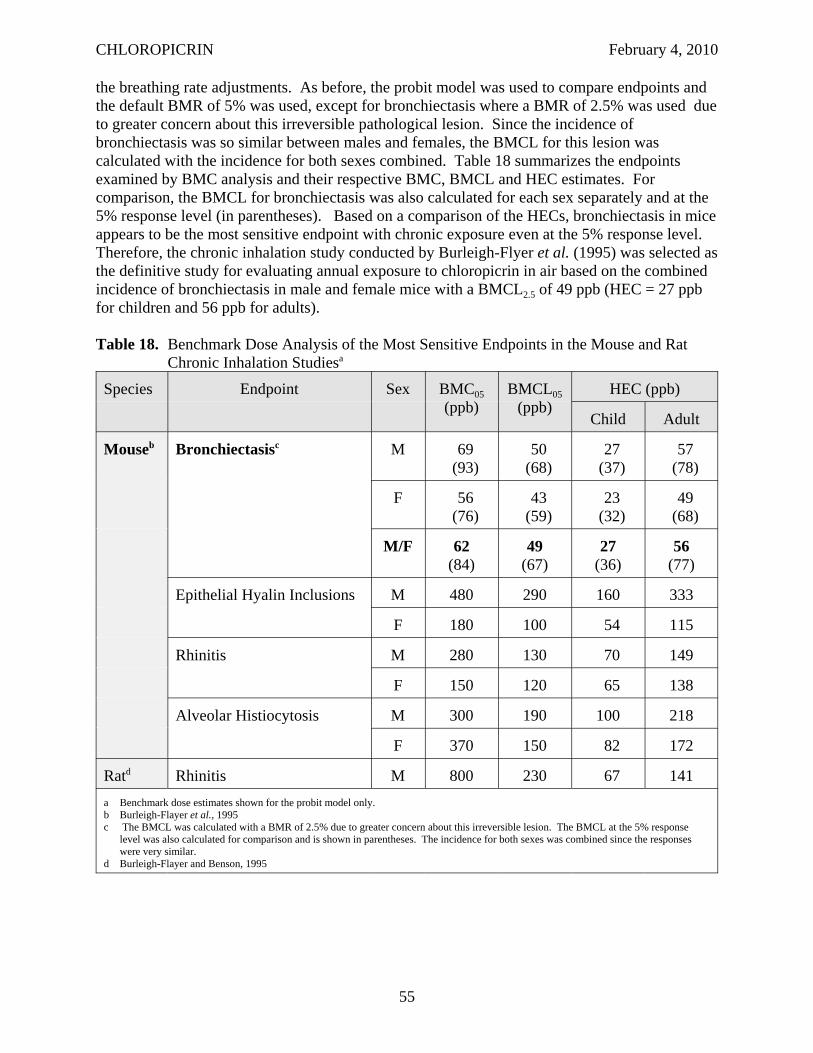
CHLOROPICRIN February 4, 2010
the breathing rate adjustments. As before, the probit model was used to compare endpoints and the default BMR of 5% was used, except for bronchiectasis where a BMR of 2.5% was used due to greater concern about this irreversible pathological lesion. Since the incidence of bronchiectasis was so similar between males and females, the BMCL for this lesion was calculated with the incidence for both sexes combined. Table 18 summarizes the endpoints examined by BMC analysis and their respective BMC, BMCL and HEC estimates. For comparison, the BMCL for bronchiectasis was also calculated for each sex separately and at the 5% response level (in parentheses). Based on a comparison of the HECs, bronchiectasis in mice appears to be the most sensitive endpoint with chronic exposure even at the 5% response level. Therefore, the chronic inhalation study conducted by Burleigh-Flyer et al. (1995) was selected as the definitive study for evaluating annual exposure to chloropicrin in air based on the combined incidence of bronchiectasis in male and female mice with a BMCL2.5 of 49 ppb (HEC = 27 ppb for children and 56 ppb for adults).
Table 18. Benchmark Dose Analysis of the Most Sensitive Endpoints in the Mouse and Rat Chronic Inhalation Studiesa
Species Endpoint Sex BMC05 (ppb)
BMCL05 (ppb)
HEC (ppb)
Child Adult
Mouseb Bronchiectasisc M 69 (93)
50 (68)
27 (37)
57 (78)
F 56 (76)
43 (59)
23 (32)
49 (68)
M/F 62 (84)
49 (67)
27 (36)
56 (77)
Epithelial Hyalin Inclusions M 480 290 160 333
F 180 100 54 115
Rhinitis M 280 130 70 149
F 150 120 65 138
Alveolar Histiocytosis M 300 190 100 218
F 370 150 82 172
Ratd Rhinitis M 800 230 67 141 a Benchmark dose estimates shown for the probit model only. b Burleigh-Flayer et al., 1995 c The BMCL was calculated with a BMR of 2.5% due to greater concern about this irreversible lesion. The BMCL at the 5% response
level was also calculated for comparison and is shown in parentheses. The incidence for both sexes was combined since the responses were very similar.
d Burleigh-Flayer and Benson, 1995
55
CHLOROPICRIN February 4, 2010
III.A.4. Carcinogenicity - Weight of Evidence
Chloropicrin is a strong electrophile due to its chlorine and nitro groups. Therefore, it is capable of covalently binding to nucleophiles, such as DNA. Chloropicrin tested positive in a number of tests for genotoxicity. There was evidence of DNA damage in three in vitro tests, including a SOS chromotest with E. coli, a single-cell gel electrophoresis (SCGE) assay with Chinese hamster ovary (CHO) cells and a Comet assay with TK6 cells (Giller et al., 1995; Plewa et al., 2004; Liviac et al., 2009). With the Comet assay, the level of DNA damage was reported to be higher than that seen with positive controls, however, this damage appears to be easily repaired based on the repair kinetics that were analyzed with this assay. Since these DNA damage assays are not commonly conducted assays, there is some uncertainty about their relative sensitivity. Furthermore, there are no FIFRA guidelines for these studies. Chloropicrin was also consistently positive in reverse mutation assays with bacterial systems, including eight with Salmonella typhimurium and two with Escherichia coli, one of which met FIFRA guidelines (Shirasu et al., 1982; Haworth et al., 1983; Moriya et al, 1983; Kawai et al., 1987; San and Wagner, 1990; Sariaslani and Stahl, 1990; Giller et al., 1995; Schneider et al., 1999). In six of these eight studies, the positive responses were seen with S. typhimurium TA100 strain with activation. Schneider et al. (1999) reported the dechlorination products, CHCl2NO2 and CH2ClNO2, were also mutagenic with and without GSH. The investigators suggested that the mutagenicity of chloropicrin may be due to its reductive dechlorination or from a reactive intermediate GSH conjugate, such as GSCCl2NO2 or GSCHClNO2. Two in vitro tests for clastogenicity were positive, including an in vitro chromosomal aberrations assay with CHO cells (Putman and Morris, 1990) and a sister chromatid exchange assay with human lymphocytes (Garry et al., 1990). The assay with CHO cells did meet FIFRA guidelines; however, it was unclear if the sister chromatid exchange assay met FIFRA guidelines due to insufficient information. One sex-linked recessive lethal (SLRL) assay in Drosophila melanogaster had equivocal results (Valencia et al., 1985), but there was also insufficient information to determine if this study met FIFRA guidelines.
There were a number of negative assays including another SLRL assay with Drosophila (Auerbach, 1950), a wing-spot test with Drosophila (García-Quispes et al., 2009), a forward mutation assay with L5178Y TK+/- mouse lymphoma cells (San and Sigler, 1990), another chromosomal aberrations assay using cultured human lymphocytes (Garry et al. 1990), an in vitro micronucleus assay with TK6 cells and human lymphocytes (Liviac et al., 2009), two in vivo micronucleus assays, one with Pleurodeles waltl newt larvae (Giller et al., 1995) and another with mice (Mehmood, 2003a), two in vitro unscheduled DNA synthesis (UDS) assays, one with rat primary hepatocytes (Curren, 1990) and another with TK6 cells (Liviac et al., 2009) and an in vivo UDS assay with rats (Mehmood, 2003b). Four of the negative assays met FIFRA guidelines (forward mutation assay, mouse micronucleus assay and both UDS assays), however, it is unclear if the other assays met FIFRA guidelines because there was insufficient information or there were no guidelines for those assays. Although the SLRL assay is an in vivo assay for mutagenicity, there is more uncertainty in extrapolating from this invertebrate species to humans than from a mammalian species. The toxicological significance of the in vivo micronucleus assay with newt larvae is also uncertain since this amphibian species is not the typical test organism for this assay and it introduces more uncertainty in extrapolating to humans than with a mammalian species. The UDS assays were also not very meaningful since this assay has a reputation for not being very sensitive. The negative results in the forward mutation assay in
56
CHLOROPICRIN February 4, 2010
mouse lymphoma cells could be considered more meaningful than the reverse mutation assays with bacteria because it used mammalian cells, however, this assay was found to not correlate as well as the reverse mutation assay with the results from NTP rodent carcinogenicity studies. A comparison of results from four in vitro genotoxicity assays (Tennant et al., 1987; Zeiger et al., 1990 ) with the results from 114 NTP rodent cancer bioassays found that the reverse mutation assay with Salmonella was the most useful based on its positive predictivity and correlation and that the mouse lymphoma assay was the least useful. None of the in vivo assays for chloropicrin were positive, however, there was clear evidence of genotoxicity with in vitro testing including three assays for DNA damage, all eight reverse mutation assays with Salmonella, and two assays for clastogenicity. Therefore, based on this clear evidence of genotoxicity in vitro, DPR concluded a genotoxic mode of action for tumor formation was more likely than not.
There was a significant increase in tumors in two carcinogenicity studies for chloropicrin. In a 78-week mouse inhalation study, there was a slight increase in adenomas of the lung in females that was significant by trend analysis (p < 0.05) , but not by the Fisher’s exact test (Burleigh-Flayer et al., 1995). When combined with the carcinomas the trend was significant at p < 0.01 and the p-value for Fisher’s exact approached statistical significance (0.053). The combined tumor incidence was further examined using the Poly-3 trend test which takes survival into consideration. This test also includes an pair-wise comparison test similar to the Fisher’s exact test. Using this test, not only was the increase in combined tumors significant by trend analysis (p < 0.01), but the incidence at the high dose was significant by pair-wise comparison (p < 0.05). No historical control data were available from the laboratory where the study was conducted. However, the incidence of the pulmonary adenomas in the female mice at the high dose (37%) was clearly outside the historical control range reported by the supplier (0-27%) during a similar time period (Giknis and Clifford, 2000). In addition, the number of animals with multiple lung adenomas and/or carcinomas increased in females (3/48, 3/48, 6/47 and 9/49). The average time to tumor was also slightly shorter in the high dose females (554, 562, 564 and 543 days at 0, 100, 500 and 1,000 ppb, respectively). The increase in these lung tumors in males was not significant either by trend analysis or Fisher’s exact, but several factors may have contributed to this. The incidence of the pulmonary adenomas in control males (16/49 or 33%) was outside the historical control range (0-28%) and may have masked the increase at the high dose. It has also been reported that the body weight reductions can reduce the incidence of certain tumors in mice and rats, including lung tumors in male mice (Seilkop, 1995). This may be related to reduced caloric intake. Tumor incidence can be seriously diminished when the mean body weights are reduced as little as 10%. Reductions in body weights did not have the same effect on the incidence of lung tumors in female mice according to this study. Another consideration in the interpretation of the findings from the mouse inhalation carcinogenicity study is the length of the study. If the exposure had been longer (e.g., 104 weeks rather than 78 weeks), the increase in tumors might have been more dramatic. A higher incidence in tumors might also have been seen if higher dose levels were tested.
An increase in fibroadenomas was also seen in mammary glands of female rats with oral exposure to chloropicrin (Slauter, 1995). The increase was significant by trend analysis (p < 0.001) and by pair-wise comparison with controls at the high dose (p < 0.05). The increase at the high dose (34%) was within the historical control range for this laboratory (up to 55%) so there is some uncertainty about the toxicological significance of the increase in these tumors. However, a slight increase in fibroadenomas was also seen in female rats with inhalation
57
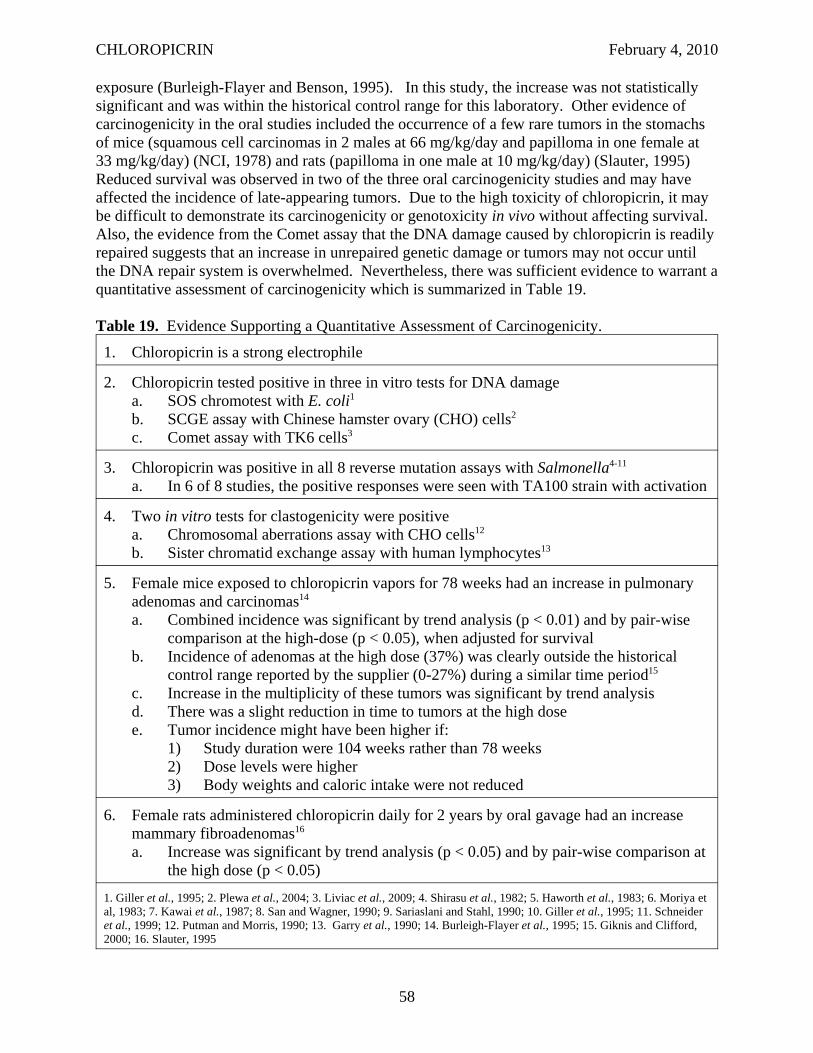
CHLOROPICRIN February 4, 2010
exposure (Burleigh-Flayer and Benson, 1995). In this study, the increase was not statistically significant and was within the historical control range for this laboratory. Other evidence of carcinogenicity in the oral studies included the occurrence of a few rare tumors in the stomachs of mice (squamous cell carcinomas in 2 males at 66 mg/kg/day and papilloma in one female at 33 mg/kg/day) (NCI, 1978) and rats (papilloma in one male at 10 mg/kg/day) (Slauter, 1995) Reduced survival was observed in two of the three oral carcinogenicity studies and may have affected the incidence of late-appearing tumors. Due to the high toxicity of chloropicrin, it may be difficult to demonstrate its carcinogenicity or genotoxicity in vivo without affecting survival. Also, the evidence from the Comet assay that the DNA damage caused by chloropicrin is readily repaired suggests that an increase in unrepaired genetic damage or tumors may not occur until the DNA repair system is overwhelmed. Nevertheless, there was sufficient evidence to warrant a quantitative assessment of carcinogenicity which is summarized in Table 19.
Table 19. Evidence Supporting a Quantitative Assessment of Carcinogenicity.
1. Chloropicrin is a strong electrophile
2. Chloropicrin tested positive in three in vitro tests for DNA damage a. SOS chromotest with E. coli1
b. SCGE assay with Chinese hamster ovary (CHO) cells2
c. Comet assay with TK6 cells3
3. Chloropicrin was positive in all 8 reverse mutation assays with Salmonella4-11
a. In 6 of 8 studies, the positive responses were seen with TA100 strain with activation
4. Two in vitro tests for clastogenicity were positive a. Chromosomal aberrations assay with CHO cells12
b. Sister chromatid exchange assay with human lymphocytes13
5. Female mice exposed to chloropicrin vapors for 78 weeks had an increase in pulmonary adenomas and carcinomas14
a. Combined incidence was significant by trend analysis (p < 0.01) and by pair-wise comparison at the high-dose (p < 0.05), when adjusted for survival
b. Incidence of adenomas at the high dose (37%) was clearly outside the historical control range reported by the supplier (0-27%) during a similar time period15
c. Increase in the multiplicity of these tumors was significant by trend analysis d. There was a slight reduction in time to tumors at the high dose e. Tumor incidence might have been higher if:
1) Study duration were 104 weeks rather than 78 weeks 2) Dose levels were higher 3) Body weights and caloric intake were not reduced
6. Female rats administered chloropicrin daily for 2 years by oral gavage had an increase mammary fibroadenomas16
a. Increase was significant by trend analysis (p < 0.05) and by pair-wise comparison at the high dose (p < 0.05)
1. Giller et al., 1995; 2. Plewa et al., 2004; 3. Liviac et al., 2009; 4. Shirasu et al., 1982; 5. Haworth et al., 1983; 6. Moriya et al, 1983; 7. Kawai et al., 1987; 8. San and Wagner, 1990; 9. Sariaslani and Stahl, 1990; 10. Giller et al., 1995; 11. Schneider et al., 1999; 12. Putman and Morris, 1990; 13. Garry et al., 1990; 14. Burleigh-Flayer et al., 1995; 15. Giknis and Clifford, 2000; 16. Slauter, 1995
58
CHLOROPICRIN February 4, 2010
III.A.4.a. Quantitative Assessment of Carcinogenic Effects
Based on the evidence summarized in Table 19, a quantitative assessment was conducted of the carcinogenicity for chloropicrin. Not only is chloropicrin electrophilic, there was clear evidence of DNA damage, gene mutation and clastogenicity in the in vitro genotoxicity tests for chloropicrin. More importantly, there was a significant increase in tumors in two different species in two different laboratories. Assuming a genotoxic mode of action is involved, then a linear dose response would be used to estimate the carcinogenic potential. But even when the mode of action is uncertain, the U.S. EPA Guidelines for Carcinogen Risk Assessment recommends that a linear approach be used as a default (U.S. EPA, 2005). Consequently, a linear dose response was assumed in evaluating the carcinogenic potential of chloropicrin.
The combined incidence of lung adenomas and carcinomas in female mice in the carcinogenicity study conducted by Burleigh-Flayer et al. (1995) was used to estimate carcinogenic potency. The adjusted incidence from the Poly-3 trend test was used to estimate potency with the Multistage Cancer model in the BMDS software. The air concentrations from the mouse study were first converted to mg/kg/day (mg/kg/day = ppm x M.Wt./M.Vol. x RRa x 6 hrs/24 hrs x 5 days/7days) and then converted to human equivalent dose by multiplying by an interspecies scaling factor of body weight to the 3/4 power [(BWtA/BWtH)0.25 = (0.030 kg/70 kg)0.25 = 0.144] (U.S. EPA, 2005). The resulting adjusted dosages were 0, 0.031, 0.155 and 0.311 mg/kg/day. The estimated carcinogenic potency for chloropicrin ranged from 1.3 (mg/kg/day)-1 (maximum likelihood estimate or MLE) to 2.2 (mg/kg/day)-1 (95% upper bound or 95% UB).
The estimated carcinogenic potency for chloropicrin expressed as unit risk is shown in Table 20 relative to other chemicals for which there are carcinogenic potency estimates that have been approved by the Scientific Review Panel (SRP) for Toxic Air Contaminants (TACs). The unit risk estimate for chloropicrin was 6.3 x 10⁻⁴ (μg/m3)-1 at the 95% UB.
III.A.5. Reference Concentrations
The reference concentration (RfC) is the air concentration at which no adverse effects are expected to occur in humans. RfCs were calculated for chloropicrin for acute, seasonal and chronic exposures. Generally, the RfCs are calculated by dividing the NOEL or BMC (after conversion to a HEC) by a default uncertainty factor of 100 when the NOEL is from an animal study to account for interspecies and intraspecies variation in sensitivity. When the NOEL is from a human study the NOEL was divided by a default uncertainty factor of 10 for intraspecies variation.
HEC ppb )(RfC ppb ( ) =
uncertainty factor (e.g., 100 ) M Wt . ( . g. 164 38 )
RfC ( /g m 3) = RfC (ppb) x M Vol . ( . L 25o C
μ . 24 45 @ )
59
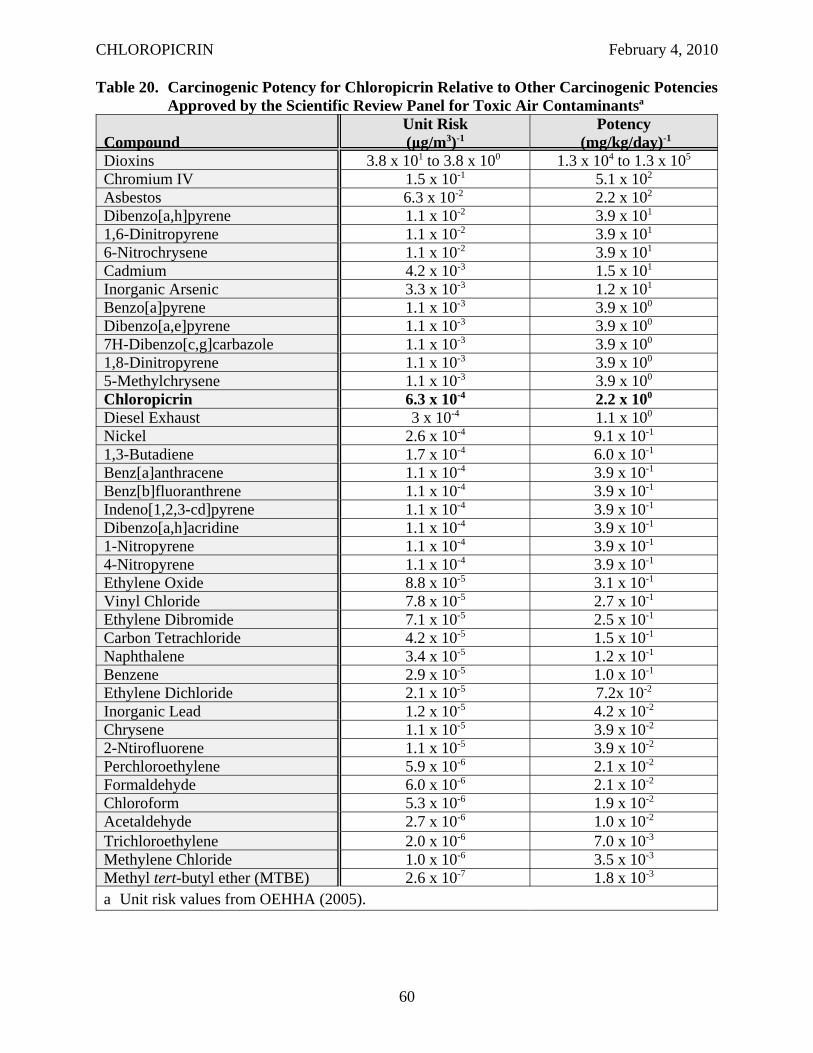
CHLOROPICRIN February 4, 2010
Table 20. Carcinogenic Potency for Chloropicrin Relative to Other Carcinogenic PotenciesApproved by the Scientific Review Panel for Toxic Air Contaminantsa
Compound Unit Risk (μg/m3)-1
Potency (mg/kg/day)-1
Dioxins 3.8 x 101 to 3.8 x 100 1.3 x 10⁴ to 1.3 x 10⁵
Chromium IV 1.5 x 10⁻¹ 5.1 x 10²
Asbestos 6.3 x 10⁻² 2.2 x 10²
Dibenzo[a,h]pyrene 1.1 x 10⁻² 3.9 x 101
1,6-Dinitropyrene 1.1 x 10⁻² 3.9 x 101
6-Nitrochrysene 1.1 x 10⁻² 3.9 x 101
Cadmium 4.2 x 10⁻³ 1.5 x 101
Inorganic Arsenic 3.3 x 10⁻³ 1.2 x 101
Benzo[a]pyrene 1.1 x 10⁻³ 3.9 x 100
Dibenzo[a,e]pyrene 1.1 x 10⁻³ 3.9 x 100
7H-Dibenzo[c,g]carbazole 1.1 x 10⁻³ 3.9 x 100
1,8-Dinitropyrene 1.1 x 10⁻³ 3.9 x 100
5-Methylchrysene 1.1 x 10⁻³ 3.9 x 100
Chloropicrin 6.3 x 10⁻⁴ 2.2 x 100
Diesel Exhaust 3 x 10⁻⁴ 1.1 x 100
Nickel 2.6 x 10⁻⁴ 9.1 x 10⁻¹
1,3-Butadiene 1.7 x 10⁻⁴ 6.0 x 10⁻¹
Benz[a]anthracene 1.1 x 10⁻⁴ 3.9 x 10⁻¹
Benz[b]fluoranthrene 1.1 x 10⁻⁴ 3.9 x 10⁻¹
Indeno[1,2,3-cd]pyrene 1.1 x 10⁻⁴ 3.9 x 10⁻¹
Dibenzo[a,h]acridine 1.1 x 10⁻⁴ 3.9 x 10⁻¹
1-Nitropyrene 1.1 x 10⁻⁴ 3.9 x 10⁻¹
4-Nitropyrene 1.1 x 10⁻⁴ 3.9 x 10⁻¹
Ethylene Oxide 8.8 x 10⁻⁵ 3.1 x 10⁻¹
Vinyl Chloride 7.8 x 10⁻⁵ 2.7 x 10⁻¹
Ethylene Dibromide 7.1 x 10⁻⁵ 2.5 x 10⁻¹
Carbon Tetrachloride 4.2 x 10⁻⁵ 1.5 x 10⁻¹
Naphthalene 3.4 x 10⁻⁵ 1.2 x 10⁻¹
Benzene 2.9 x 10⁻⁵ 1.0 x 10⁻¹
Ethylene Dichloride 2.1 x 10⁻⁵ 7.2x 10⁻²
Inorganic Lead 1.2 x 10⁻⁵ 4.2 x 10⁻²
Chrysene 1.1 x 10⁻⁵ 3.9 x 10⁻²
2-Ntirofluorene 1.1 x 10⁻⁵ 3.9 x 10⁻²
Perchloroethylene 5.9 x 10⁻⁶ 2.1 x 10⁻²
Formaldehyde 6.0 x 10⁻⁶ 2.1 x 10⁻²
Chloroform 5.3 x 10⁻⁶ 1.9 x 10⁻²
Acetaldehyde 2.7 x 10⁻⁶ 1.0 x 10⁻²
Trichloroethylene 2.0 x 10⁻⁶ 7.0 x 10⁻³
Methylene Chloride 1.0 x 10⁻⁶ 3.5 x 10⁻³
Methyl tert-butyl ether (MTBE) 2.6 x 10⁻⁷ 1.8 x 10⁻³
a Unit risk values from OEHHA (2005).
60
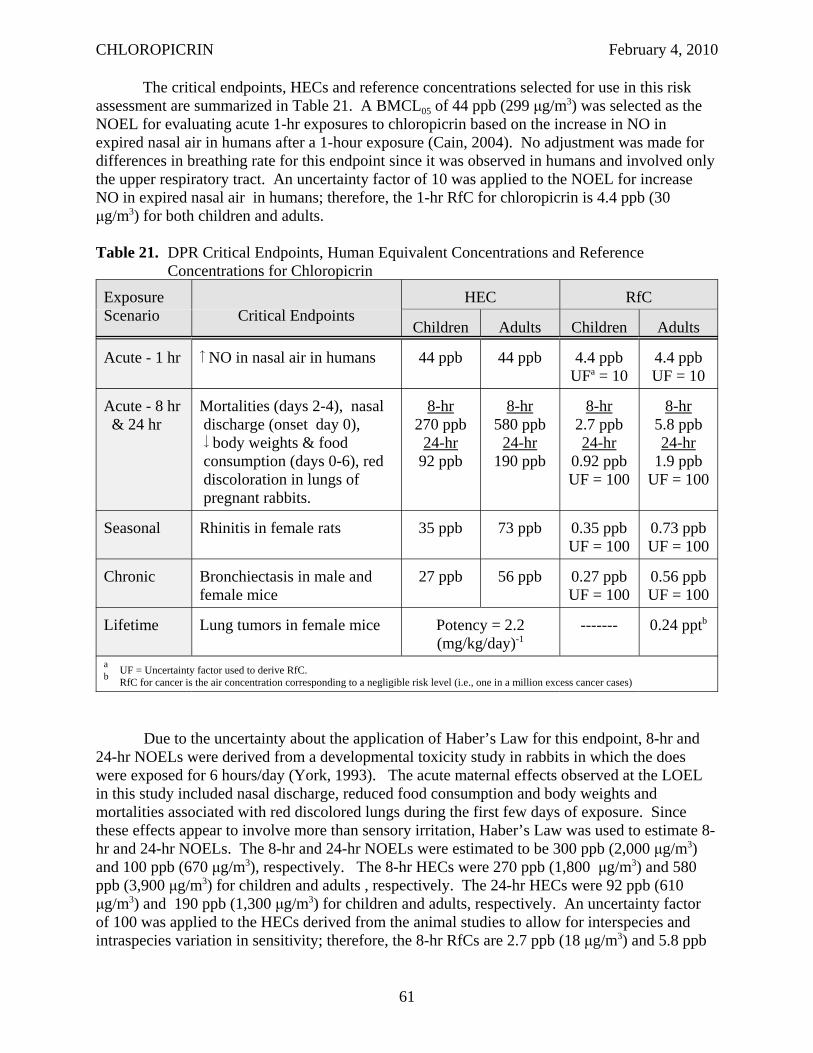
CHLOROPICRIN February 4, 2010
The critical endpoints, HECs and reference concentrations selected for use in this risk assessment are summarized in Table 21. A BMCL05 of 44 ppb (299 μg/m3) was selected as the NOEL for evaluating acute 1-hr exposures to chloropicrin based on the increase in NO in expired nasal air in humans after a 1-hour exposure (Cain, 2004). No adjustment was made for differences in breathing rate for this endpoint since it was observed in humans and involved only the upper respiratory tract. An uncertainty factor of 10 was applied to the NOEL for increase NO in expired nasal air in humans; therefore, the 1-hr RfC for chloropicrin is 4.4 ppb (30 μg/m3) for both children and adults.
Table 21. DPR Critical Endpoints, Human Equivalent Concentrations and Reference Concentrations for Chloropicrin
Exposure Scenario Critical Endpoints
HEC RfC
Children Adults Children Adults
Acute - 1 hr NO in nasal air in humans 44 ppb 44 ppb 4.4 ppb UFa = 10
4.4 ppb UF = 10
Acute - 8 hr & 24 hr
Mortalities (days 2-4), nasal discharge (onset day 0), body weights & food consumption (days 0-6), red discoloration in lungs of pregnant rabbits.
8-hr 270 ppb
24-hr 92 ppb
8-hr 580 ppb
24-hr 190 ppb
8-hr 2.7 ppb 24-hr
0.92 ppb UF = 100
8-hr 5.8 ppb 24-hr
1.9 ppb UF = 100
Seasonal Rhinitis in female rats 35 ppb 73 ppb 0.35 ppb UF = 100
0.73 ppb UF = 100
Chronic Bronchiectasis in male and female mice
27 ppb 56 ppb 0.27 ppb UF = 100
0.56 ppb UF = 100
Lifetime Lung tumors in female mice Potency = 2.2 (mg/kg/day)-1
------- 0.24 pptb
a UF = Uncertainty factor used to derive RfC. b RfC for cancer is the air concentration corresponding to a negligible risk level (i.e., one in a million excess cancer cases)
Due to the uncertainty about the application of Haber’s Law for this endpoint, 8-hr and 24-hr NOELs were derived from a developmental toxicity study in rabbits in which the does were exposed for 6 hours/day (York, 1993). The acute maternal effects observed at the LOEL in this study included nasal discharge, reduced food consumption and body weights and mortalities associated with red discolored lungs during the first few days of exposure. Since these effects appear to involve more than sensory irritation, Haber’s Law was used to estimate 8hr and 24-hr NOELs. The 8-hr and 24-hr NOELs were estimated to be 300 ppb (2,000 μg/m3) and 100 ppb (670 μg/m3), respectively. The 8-hr HECs were 270 ppb (1,800 μg/m3) and 580 ppb (3,900 μg/m3) for children and adults , respectively. The 24-hr HECs were 92 ppb (610 μg/m3) and 190 ppb (1,300 μg/m3) for children and adults, respectively. An uncertainty factor of 100 was applied to the HECs derived from the animal studies to allow for interspecies and intraspecies variation in sensitivity; therefore, the 8-hr RfCs are 2.7 ppb (18 μg/m3) and 5.8 ppb
61
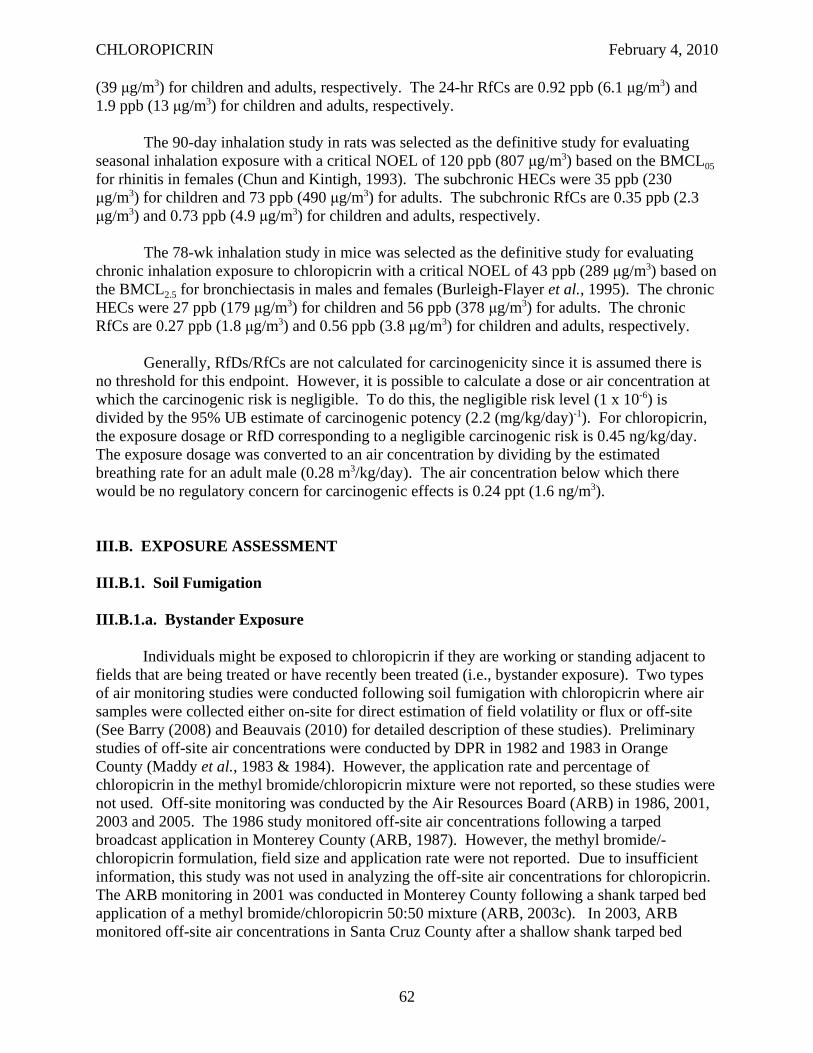
CHLOROPICRIN February 4, 2010
(39 μg/m3) for children and adults, respectively. The 24-hr RfCs are 0.92 ppb (6.1 μg/m3) and 1.9 ppb (13 μg/m3) for children and adults, respectively.
The 90-day inhalation study in rats was selected as the definitive study for evaluating seasonal inhalation exposure with a critical NOEL of 120 ppb (807 μg/m3) based on the BMCL05 for rhinitis in females (Chun and Kintigh, 1993). The subchronic HECs were 35 ppb (230 μg/m3) for children and 73 ppb (490 μg/m3) for adults. The subchronic RfCs are 0.35 ppb (2.3 μg/m3) and 0.73 ppb (4.9 μg/m3) for children and adults, respectively.
The 78-wk inhalation study in mice was selected as the definitive study for evaluating chronic inhalation exposure to chloropicrin with a critical NOEL of 43 ppb (289 μg/m3) based on the BMCL2.5 for bronchiectasis in males and females (Burleigh-Flayer et al., 1995). The chronic HECs were 27 ppb (179 μg/m3) for children and 56 ppb (378 μg/m3) for adults. The chronic RfCs are 0.27 ppb (1.8 μg/m3) and 0.56 ppb (3.8 μg/m3) for children and adults, respectively.
Generally, RfDs/RfCs are not calculated for carcinogenicity since it is assumed there is no threshold for this endpoint. However, it is possible to calculate a dose or air concentration at which the carcinogenic risk is negligible. To do this, the negligible risk level (1 x 10⁻⁶) is divided by the 95% UB estimate of carcinogenic potency (2.2 (mg/kg/day)-1). For chloropicrin, the exposure dosage or RfD corresponding to a negligible carcinogenic risk is 0.45 ng/kg/day. The exposure dosage was converted to an air concentration by dividing by the estimated breathing rate for an adult male (0.28 m3/kg/day). The air concentration below which there would be no regulatory concern for carcinogenic effects is 0.24 ppt (1.6 ng/m3).
III.B. EXPOSURE ASSESSMENT
III.B.1. Soil Fumigation
III.B.1.a. Bystander Exposure
Individuals might be exposed to chloropicrin if they are working or standing adjacent to fields that are being treated or have recently been treated (i.e., bystander exposure). Two types of air monitoring studies were conducted following soil fumigation with chloropicrin where air samples were collected either on-site for direct estimation of field volatility or flux or off-site (See Barry (2008) and Beauvais (2010) for detailed description of these studies). Preliminary studies of off-site air concentrations were conducted by DPR in 1982 and 1983 in Orange County (Maddy et al., 1983 & 1984). However, the application rate and percentage of chloropicrin in the methyl bromide/chloropicrin mixture were not reported, so these studies were not used. Off-site monitoring was conducted by the Air Resources Board (ARB) in 1986, 2001, 2003 and 2005. The 1986 study monitored off-site air concentrations following a tarped broadcast application in Monterey County (ARB, 1987). However, the methyl bromide/chloropicrin formulation, field size and application rate were not reported. Due to insufficient information, this study was not used in analyzing the off-site air concentrations for chloropicrin. The ARB monitoring in 2001 was conducted in Monterey County following a shank tarped bed application of a methyl bromide/chloropicrin 50:50 mixture (ARB, 2003c). In 2003, ARB monitored off-site air concentrations in Santa Cruz County after a shallow shank tarped bed
62
CHLOROPICRIN February 4, 2010
application of a methyl bromide/chloropicrin 50:50 mixture (ARB, 2004). In 2005, off-site air concentrations were monitored by ARB in Santa Barbara County following a drip tarped bed application of 94% chloropicrin (ARB, 2006). Two off-site monitoring studies were also conducted by registrants (Beard et al., 1996; Rotondaro, 2004). Beard et al. (1996) monitored off-site air concentrations in Washington (broadcast tarped application), Florida (broadcast tarped application) and Phoenix, Arizona (broadcast tarped, broadcast non-tarped, bedded tarped and bedded non-tarped applications) following the application of 99.4% chloropicrin. Rotondaro (2004) monitored off-site air concentrations after field and greenhouse surface drip applications of 99.1% chloropicrin in California.
The two off-site air monitoring studies conducted by the registrants also characterized the flux for chloropicrin on-site following the soil fumigation (Beard et al., 1996; Rotondaro, 2004). Flux (expressed as μg/m2/sec) is the rate at which a chemical moves out from the ground into the air. Direct measurement of flux measures air concentrations on a mast in the center of the field. Since off-site air concentrations were dependent on environmental conditions, it is unlikely that the highest possible air concentrations were encountered during a particular study. Therefore, the flux data along with air modeling were used to estimate off-site air concentrations for a worse case scenario. The flux following the applications in Washington and Florida was lower than that following the applications in Arizona in the study conducted by Beard et al. (1996) and, therefore, was not further considered in the exposure assessment. From the on-site monitoring, DPR estimated the maximum 6-hour and 24-hour time-weighted average (TWA) chloropicrin flux (Barry, 2008). From these maximum 6-hr and 24-hr flux estimates, DPR then calculated rate adjusted air concentrations for 1.2 m (4 ft) above ground (breathing zone) and 3 m (10 ft) from the edge of a 40-acre square field using the Industrial Source Complex Short Term model, Version 3 (ISCT3). The model generated downwind centerline estimates of reasonable worst-case air concentrations for the different application methods at the maximum application rate for 6-hours and 24-hours (TWA). Table 22 summarizes highest exposure estimates for bystanders using the different application methods based on the reasonable worst case air concentrations from modeling. The highest day or night 6-hr air concentration with each application method was used for their respective 1-hr and 8-hr exposure estimates. Since 6 hours was the shortest monitoring interval for flux, 1-hr exposure estimates were calculated using a peak-to-mean ratio as described in Barry (2008). The 1-hr exposure estimates ranged from 11,000 to 110,000 μg/m3
(1,600 to 16,000 ppb)20. The 6-hr air concentrations were not adjusted for time for the 8-hr exposure estimates. The 8-hr exposure estimates were between 4,700 and 44,000 μg/m3 (700 to 6,500 ppb). The 24-hr exposure estimates ranged from 1,100 to 7,400 μg/m3 (164 to 1,100 ppb). For periods of 24 hours or less, it was assumed a bystander was located downwind throughout the entire exposure period. For the subchronic and chronic exposure, this assumption was unrealistic since wind direction would change. Therefore, the seasonal exposure was estimated from 2-week TWA air concentrations which were calculated by first taking a 24-hr average flux over 2 weeks and then adjusting with a time-scaling factor using the peak-to-mean theory. In addition, the air concentrations were adjusted for the typical application rate instead of the maximum application rate. The seasonal exposure estimates were between 54 and 490 μg/m3
(8.0 to 73 ppb). The annual exposure was estimated from the 2-week average air concentration assuming it was used 5 months out of the year. The annual exposure estimates ranged from 33 to 200 μg/m3 (3.3 and 30 ppb). The highest estimates for 1-hr and 8-hr exposure were for
20 The exposure estimates were rounded to two significant figures for both μg/m3 and ppb.
63
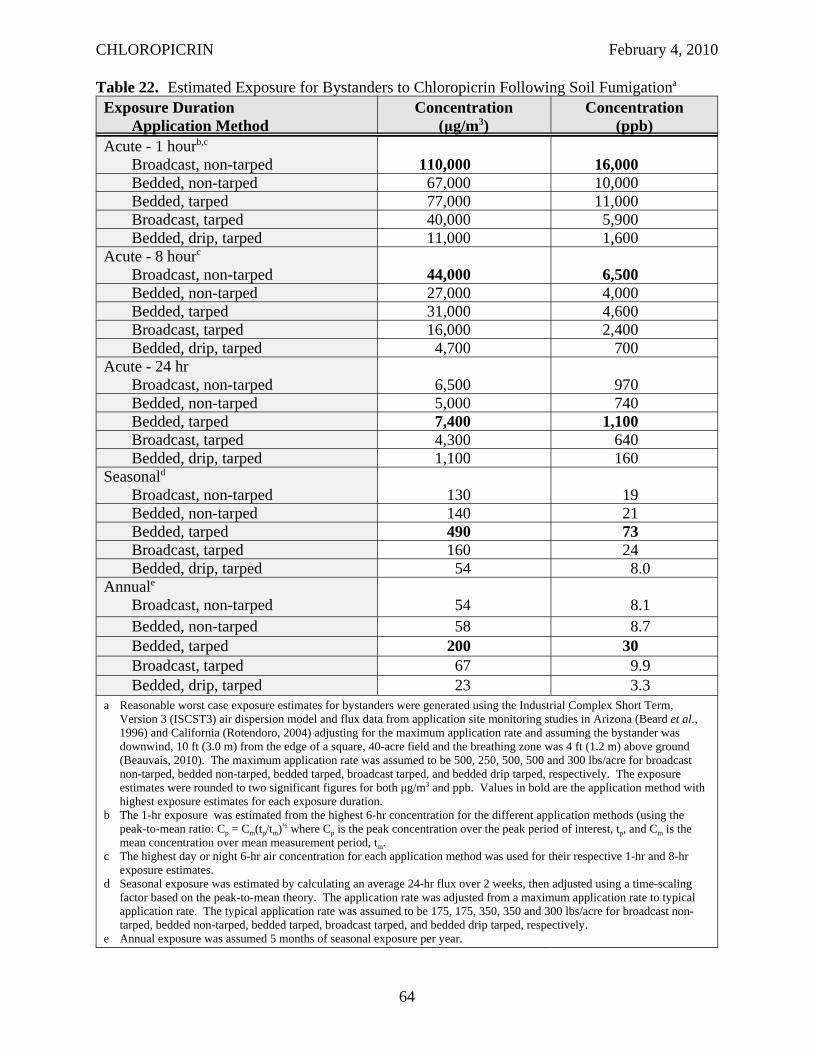
CHLOROPICRIN February 4, 2010
Table 22. Estimated Exposure for Bystanders to Chloropicrin Following Soil Fumigationa
Exposure Duration Application Method
Concentration (μg/m3)
Concentration (ppb)
Acute - 1 hourb,c
Broadcast, non-tarped 110,000 16,000 Bedded, non-tarped 67,000 10,000 Bedded, tarped 77,000 11,000 Broadcast, tarped 40,000 5,900 Bedded, drip, tarped 11,000 1,600
Acute - 8 hourc
Broadcast, non-tarped 44,000 6,500 Bedded, non-tarped 27,000 4,000 Bedded, tarped 31,000 4,600 Broadcast, tarped 16,000 2,400 Bedded, drip, tarped 4,700 700
Acute - 24 hr Broadcast, non-tarped 6,500 970 Bedded, non-tarped 5,000 740 Bedded, tarped 7,400 1,100 Broadcast, tarped 4,300 640 Bedded, drip, tarped 1,100 160
Seasonald
Broadcast, non-tarped 130 19 Bedded, non-tarped 140 21 Bedded, tarped 490 73 Broadcast, tarped 160 24 Bedded, drip, tarped 54 8.0
Annuale
Broadcast, non-tarped 54 8.1 Bedded, non-tarped 58 8.7 Bedded, tarped 200 30 Broadcast, tarped 67 9.9 Bedded, drip, tarped 23 3.3
a Reasonable worst case exposure estimates for bystanders were generated using the Industrial Complex Short Term, Version 3 (ISCST3) air dispersion model and flux data from application site monitoring studies in Arizona (Beard et al., 1996) and California (Rotendoro, 2004) adjusting for the maximum application rate and assuming the bystander was downwind, 10 ft (3.0 m) from the edge of a square, 40-acre field and the breathing zone was 4 ft (1.2 m) above ground (Beauvais, 2010). The maximum application rate was assumed to be 500, 250, 500, 500 and 300 lbs/acre for broadcast non-tarped, bedded non-tarped, bedded tarped, broadcast tarped, and bedded drip tarped, respectively. The exposure estimates were rounded to two significant figures for both μg/m3 and ppb. Values in bold are the application method with highest exposure estimates for each exposure duration.
b The 1-hr exposure was estimated from the highest 6-hr concentration for the different application methods (using the peak-to-mean ratio: Cp = Cm(tp/tm)½ where Cp is the peak concentration over the peak period of interest, tp, and Cm is the mean concentration over mean measurement period, tm.
c The highest day or night 6-hr air concentration for each application method was used for their respective 1-hr and 8-hr exposure estimates.
d Seasonal exposure was estimated by calculating an average 24-hr flux over 2 weeks, then adjusted using a time-scaling factor based on the peak-to-mean theory. The application rate was adjusted from a maximum application rate to typical application rate. The typical application rate was assumed to be 175, 175, 350, 350 and 300 lbs/acre for broadcast nontarped, bedded non-tarped, bedded tarped, broadcast tarped, and bedded drip tarped, respectively.
e Annual exposure was assumed 5 months of seasonal exposure per year.
64
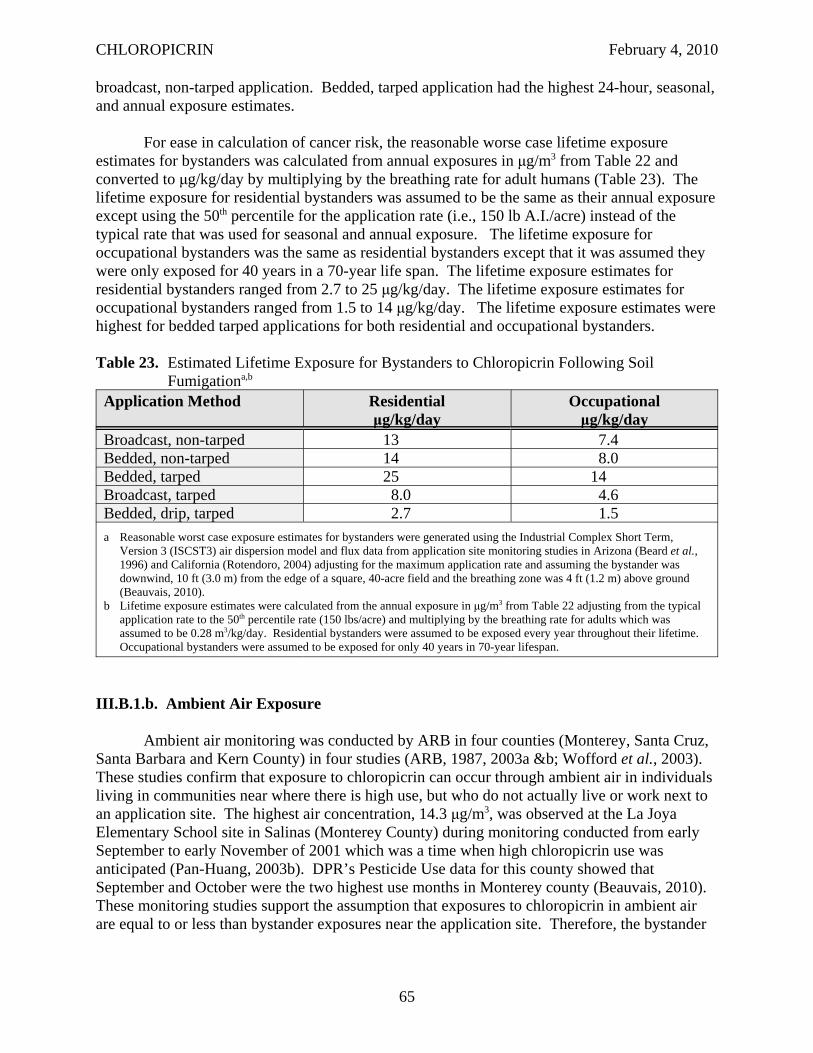
CHLOROPICRIN February 4, 2010
broadcast, non-tarped application. Bedded, tarped application had the highest 24-hour, seasonal, and annual exposure estimates.
For ease in calculation of cancer risk, the reasonable worse case lifetime exposure estimates for bystanders was calculated from annual exposures in μg/m3 from Table 22 and converted to μg/kg/day by multiplying by the breathing rate for adult humans (Table 23). The lifetime exposure for residential bystanders was assumed to be the same as their annual exposure except using the 50th percentile for the application rate (i.e., 150 lb A.I./acre) instead of the typical rate that was used for seasonal and annual exposure. The lifetime exposure for occupational bystanders was the same as residential bystanders except that it was assumed they were only exposed for 40 years in a 70-year life span. The lifetime exposure estimates for residential bystanders ranged from 2.7 to 25 μg/kg/day. The lifetime exposure estimates for occupational bystanders ranged from 1.5 to 14 μg/kg/day. The lifetime exposure estimates were highest for bedded tarped applications for both residential and occupational bystanders.
Table 23. Estimated Lifetime Exposure for Bystanders to Chloropicrin Following Soil Fumigationa,b
Application Method Residential μg/kg/day
Occupational μg/kg/day
Broadcast, non-tarped 13 7.4 Bedded, non-tarped 14 8.0 Bedded, tarped 25 14 Broadcast, tarped 8.0 4.6 Bedded, drip, tarped 2.7 1.5 a Reasonable worst case exposure estimates for bystanders were generated using the Industrial Complex Short Term,
Version 3 (ISCST3) air dispersion model and flux data from application site monitoring studies in Arizona (Beard et al., 1996) and California (Rotendoro, 2004) adjusting for the maximum application rate and assuming the bystander was downwind, 10 ft (3.0 m) from the edge of a square, 40-acre field and the breathing zone was 4 ft (1.2 m) above ground (Beauvais, 2010).
b Lifetime exposure estimates were calculated from the annual exposure in μg/m3 from Table 22 adjusting from the typical application rate to the 50th percentile rate (150 lbs/acre) and multiplying by the breathing rate for adults which was assumed to be 0.28 m3/kg/day. Residential bystanders were assumed to be exposed every year throughout their lifetime. Occupational bystanders were assumed to be exposed for only 40 years in 70-year lifespan.
III.B.1.b. Ambient Air Exposure
Ambient air monitoring was conducted by ARB in four counties (Monterey, Santa Cruz, Santa Barbara and Kern County) in four studies (ARB, 1987, 2003a &b; Wofford et al., 2003). These studies confirm that exposure to chloropicrin can occur through ambient air in individuals living in communities near where there is high use, but who do not actually live or work next to an application site. The highest air concentration, 14.3 μg/m3, was observed at the La Joya Elementary School site in Salinas (Monterey County) during monitoring conducted from early September to early November of 2001 which was a time when high chloropicrin use was anticipated (Pan-Huang, 2003b). DPR’s Pesticide Use data for this county showed that September and October were the two highest use months in Monterey county (Beauvais, 2010). These monitoring studies support the assumption that exposures to chloropicrin in ambient air are equal to or less than bystander exposures near the application site. Therefore, the bystander
65
CHLOROPICRIN February 4, 2010
exposure estimates for application site air were assumed to be health protective estimates for ambient air, also, and no separate exposure estimates were calculated for ambient air.
III.B.2. Structural Fumigation
ARB also monitored off-site air concentrations of chloropicrin following structural fumigations with sulfuryl fluoride in which chloropicrin was used as a warning agent. One study was conducted in Sacramento County during a fumigation of a single-story home with an estimated fumigation volume of 22,000 ft3 (ARB, 2003d). A second study was conducted in Nevada county during a fumigation of a two-story house with a fumigation volume of 81,000 ft3
(ARB, 2005a). The third study was conducted in Placer County during a fumigation of another two-story house with a fumigation volume of 45,000 ft3 (ARB, 2003b). As might be expected, the highest off-site air concentrations were found in the second study with the house that had the highest fumigation volume. The highest air concentrations occurred at 1.5 m northwest of the house during the mechanical ventilation.
Dow AgroSciences, LLC, submitted a study to DPR in support of the registration for sulfuryl fluoride in which chloropicrin was used as a warning agent (Barnekow and Byrne, 2006). Outdoor and indoor chloropicrin air concentrations were monitored in this study along with the air concentrations for sulfuryl fluoride. Chloropicrin air concentrations from this study was selected to estimate acute exposures since the air concentrations were monitored at more frequent intervals allowing for more accurate estimates of 1-hour exposures than in the ARB studies. Furthermore, the chloropicrin air concentrations found in this study were higher than those in the ARB studies. In this study, four houses were fumigated twice such that Replicates 1-2, 3-4, 5-6, and 7-8 are the fumigations for the houses in Ojai (32,000 ft3), Homeland (53,000 ft3), Reedley (25,000 ft3) and Reedley (40,000 ft3), respectively. Outdoor air concentrations were monitored at 32 samplers placed at various distances on all four sides of the house. During fumigation, approximately one 4-hr sample followed by two 8-hr samples were collected. During aeration, four 1-hr samples were collected followed by two 4-hr sample. Following clearance, four indoor samplers were placed in the attic, crawlspace, utility area and living room or bedroom for four 1-hr intervals followed by four 8-hr intervals (see Beauvais, 2010, for detailed discussion). The estimated exposure for bystanders and indoor air with structural fumigation are summarized in Table 24. The 1-hr exposure for bystanders was based on the highest outdoor air concentration which occurred during aeration in Interval 7 of Replicate 2. The 1-hr indoor exposure was based on the highest indoor concentration which occurred in the crawl space during clearance in Interval 11 of Replicate 4. The 8-hr exposure for bystanders was based on the highest rolling time-weighted average for outdoor air concentrations that occurred during aeration in Intervals 4-8 of Replicate 2 that spanned 8 hours. The 8-hr indoor exposure was based on the highest 8-hr indoor concentration which occurred in the living room during the clearance in Interval 14 of Replicate 5. The 24-hr exposure for bystanders was based on the highest rolling time-weighted average for outdoor air concentrations which occurred during fumigation and aeration in Intervals 2-8 of Replicate 2 that spanned 23 hours. The 24-hr indoor exposure was based on the highest rolling time-weighted average for indoor air that occurred in the living room during clearance in Intervals10-15 of Replicate 5 and spanned 20 hours. Multiple structural fumigations are not anticipated in the same area; therefore, no seasonal or annual exposure estimates were calculated for structural fumigation.
66
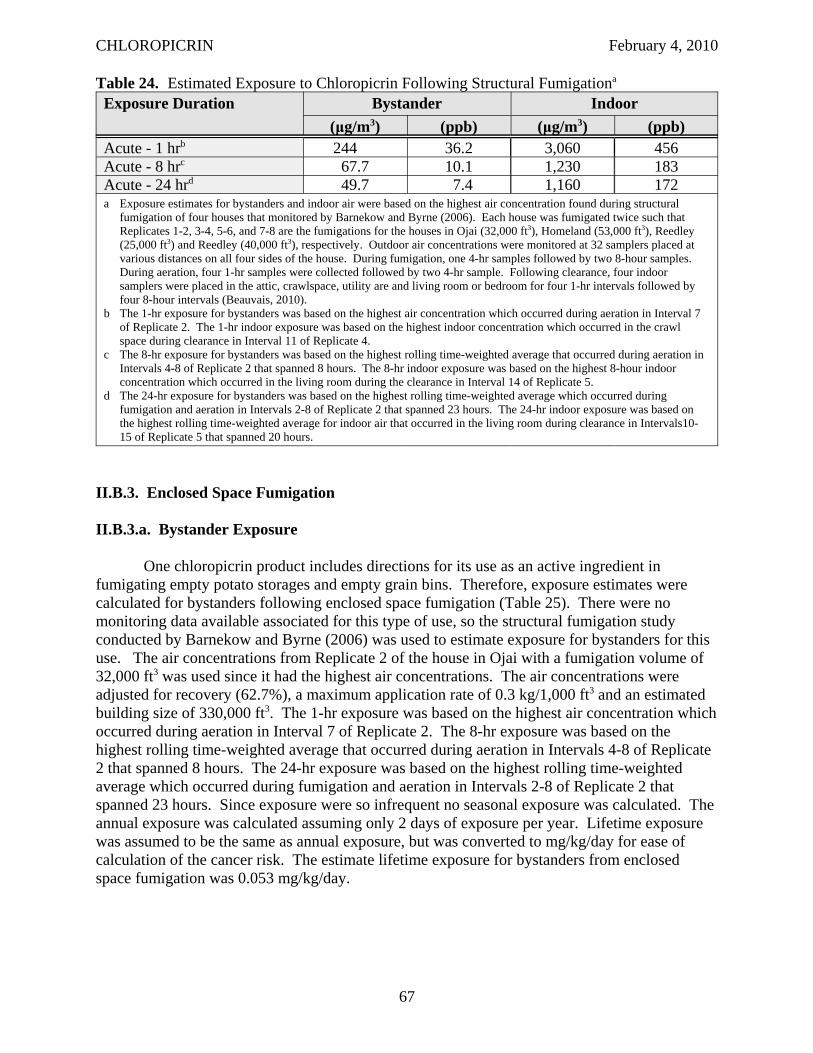
CHLOROPICRIN February 4, 2010
Table 24. Estimated Exposure to Chloropicrin Following Structural Fumigationa
Exposure Duration Bystander Indoor (μg/m3) (ppb) (μg/m3) (ppb)
Acute - 1 hrb 244 36.2 3,060 456 Acute - 8 hrc 67.7 10.1 1,230 183 Acute - 24 hrd 49.7 7.4 1,160 172 a Exposure estimates for bystanders and indoor air were based on the highest air concentration found during structural
fumigation of four houses that monitored by Barnekow and Byrne (2006). Each house was fumigated twice such that Replicates 1-2, 3-4, 5-6, and 7-8 are the fumigations for the houses in Ojai (32,000 ft3), Homeland (53,000 ft3), Reedley (25,000 ft3) and Reedley (40,000 ft3), respectively. Outdoor air concentrations were monitored at 32 samplers placed at various distances on all four sides of the house. During fumigation, one 4-hr samples followed by two 8-hour samples. During aeration, four 1-hr samples were collected followed by two 4-hr sample. Following clearance, four indoor samplers were placed in the attic, crawlspace, utility are and living room or bedroom for four 1-hr intervals followed by four 8-hour intervals (Beauvais, 2010).
b The 1-hr exposure for bystanders was based on the highest air concentration which occurred during aeration in Interval 7 of Replicate 2. The 1-hr indoor exposure was based on the highest indoor concentration which occurred in the crawl space during clearance in Interval 11 of Replicate 4.
c The 8-hr exposure for bystanders was based on the highest rolling time-weighted average that occurred during aeration in Intervals 4-8 of Replicate 2 that spanned 8 hours. The 8-hr indoor exposure was based on the highest 8-hour indoor concentration which occurred in the living room during the clearance in Interval 14 of Replicate 5.
d The 24-hr exposure for bystanders was based on the highest rolling time-weighted average which occurred during fumigation and aeration in Intervals 2-8 of Replicate 2 that spanned 23 hours. The 24-hr indoor exposure was based on the highest rolling time-weighted average for indoor air that occurred in the living room during clearance in Intervals1015 of Replicate 5 that spanned 20 hours.
II.B.3. Enclosed Space Fumigation
II.B.3.a. Bystander Exposure
One chloropicrin product includes directions for its use as an active ingredient in fumigating empty potato storages and empty grain bins. Therefore, exposure estimates were calculated for bystanders following enclosed space fumigation (Table 25). There were no monitoring data available associated for this type of use, so the structural fumigation study conducted by Barnekow and Byrne (2006) was used to estimate exposure for bystanders for this use. The air concentrations from Replicate 2 of the house in Ojai with a fumigation volume of 32,000 ft3 was used since it had the highest air concentrations. The air concentrations were adjusted for recovery (62.7%), a maximum application rate of 0.3 kg/1,000 ft3 and an estimated building size of 330,000 ft3. The 1-hr exposure was based on the highest air concentration which occurred during aeration in Interval 7 of Replicate 2. The 8-hr exposure was based on the highest rolling time-weighted average that occurred during aeration in Intervals 4-8 of Replicate 2 that spanned 8 hours. The 24-hr exposure was based on the highest rolling time-weighted average which occurred during fumigation and aeration in Intervals 2-8 of Replicate 2 that spanned 23 hours. Since exposure were so infrequent no seasonal exposure was calculated. The annual exposure was calculated assuming only 2 days of exposure per year. Lifetime exposure was assumed to be the same as annual exposure, but was converted to mg/kg/day for ease of calculation of the cancer risk. The estimate lifetime exposure for bystanders from enclosed space fumigation was 0.053 mg/kg/day.
67
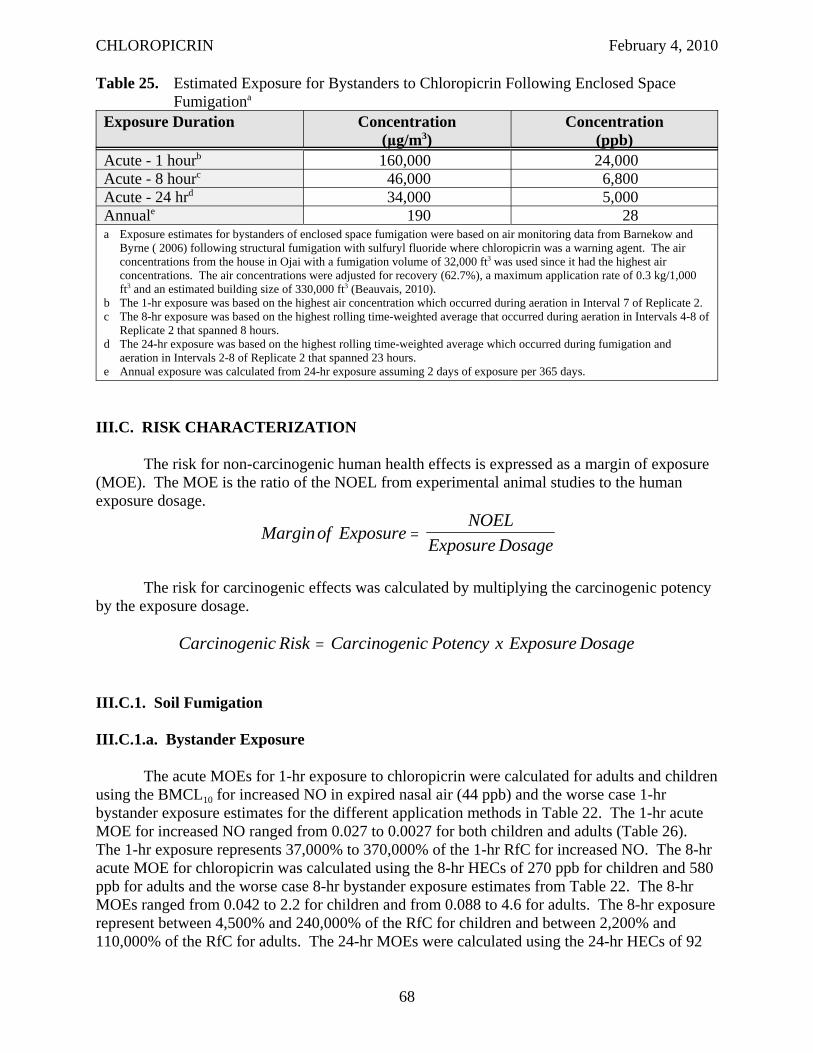
CHLOROPICRIN February 4, 2010
Table 25. Estimated Exposure for Bystanders to Chloropicrin Following Enclosed Space Fumigationa
Exposure Duration Concentration (μg/m3)
Concentration (ppb)
Acute - 1 hourb 160,000 24,000 Acute - 8 hourc 46,000 6,800 Acute - 24 hrd 34,000 5,000 Annuale 190 28 a Exposure estimates for bystanders of enclosed space fumigation were based on air monitoring data from Barnekow and
Byrne ( 2006) following structural fumigation with sulfuryl fluoride where chloropicrin was a warning agent. The air concentrations from the house in Ojai with a fumigation volume of 32,000 ft3 was used since it had the highest air concentrations. The air concentrations were adjusted for recovery (62.7%), a maximum application rate of 0.3 kg/1,000 ft3 and an estimated building size of 330,000 ft3 (Beauvais, 2010).
b The 1-hr exposure was based on the highest air concentration which occurred during aeration in Interval 7 of Replicate 2. c The 8-hr exposure was based on the highest rolling time-weighted average that occurred during aeration in Intervals 4-8 of
Replicate 2 that spanned 8 hours. d The 24-hr exposure was based on the highest rolling time-weighted average which occurred during fumigation and
aeration in Intervals 2-8 of Replicate 2 that spanned 23 hours. e Annual exposure was calculated from 24-hr exposure assuming 2 days of exposure per 365 days.
III.C. RISK CHARACTERIZATION
The risk for non-carcinogenic human health effects is expressed as a margin of exposure (MOE). The MOE is the ratio of the NOEL from experimental animal studies to the human exposure dosage.
NOELMarginof Exposure =
Exposure Dosage
The risk for carcinogenic effects was calculated by multiplying the carcinogenic potency by the exposure dosage.
Carcinogenic Risk = Carcinogenic Potency x Exposure Dosage
III.C.1. Soil Fumigation
III.C.1.a. Bystander Exposure
The acute MOEs for 1-hr exposure to chloropicrin were calculated for adults and children using the BMCL10 for increased NO in expired nasal air (44 ppb) and the worse case 1-hr bystander exposure estimates for the different application methods in Table 22. The 1-hr acute MOE for increased NO ranged from 0.027 to 0.0027 for both children and adults (Table 26). The 1-hr exposure represents 37,000% to 370,000% of the 1-hr RfC for increased NO. The 8-hr acute MOE for chloropicrin was calculated using the 8-hr HECs of 270 ppb for children and 580 ppb for adults and the worse case 8-hr bystander exposure estimates from Table 22. The 8-hr MOEs ranged from 0.042 to 2.2 for children and from 0.088 to 4.6 for adults. The 8-hr exposure represent between 4,500% and 240,000% of the RfC for children and between 2,200% and 110,000% of the RfC for adults. The 24-hr MOEs were calculated using the 24-hr HECs of 92
68
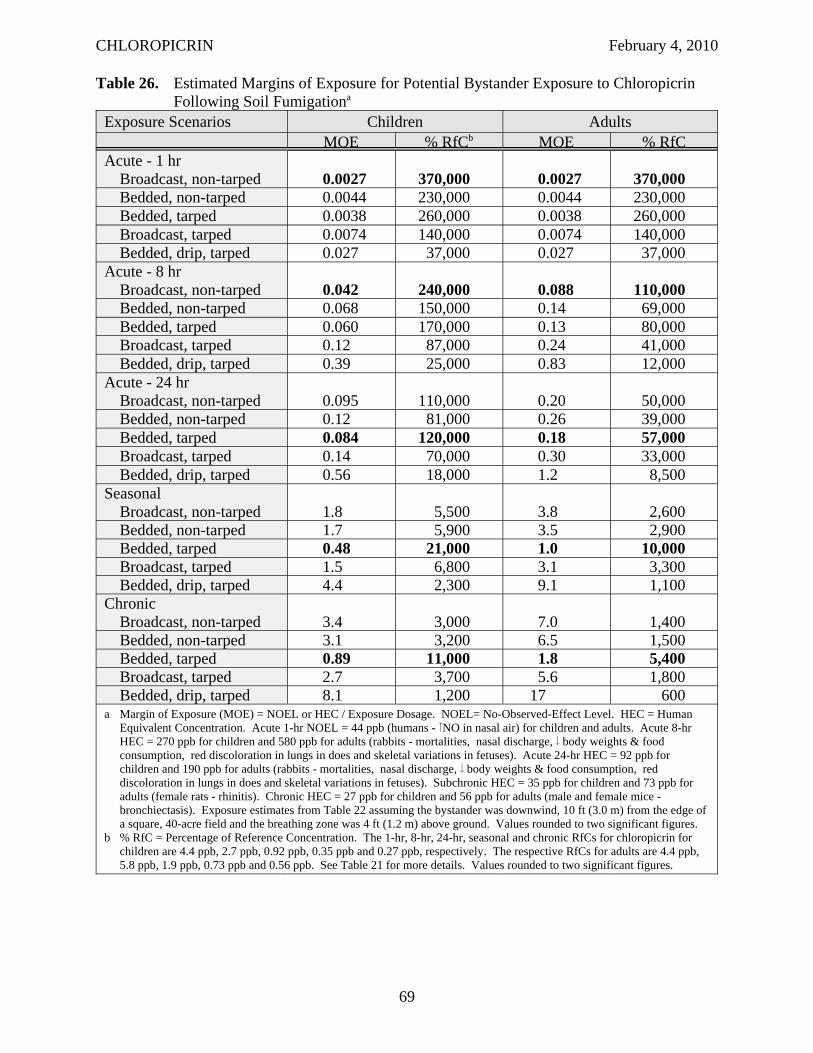
CHLOROPICRIN February 4, 2010
Table 26. Estimated Margins of Exposure for Potential Bystander Exposure to Chloropicrin Following Soil Fumigationa
Exposure Scenarios Children Adults MOE % RfCb MOE % RfC
Acute - 1 hr Broadcast, non-tarped 0.0027 370,000 0.0027 370,000 Bedded, non-tarped 0.0044 230,000 0.0044 230,000 Bedded, tarped 0.0038 260,000 0.0038 260,000 Broadcast, tarped 0.0074 140,000 0.0074 140,000 Bedded, drip, tarped 0.027 37,000 0.027 37,000
Acute - 8 hr Broadcast, non-tarped 0.042 240,000 0.088 110,000 Bedded, non-tarped 0.068 150,000 0.14 69,000 Bedded, tarped 0.060 170,000 0.13 80,000 Broadcast, tarped 0.12 87,000 0.24 41,000 Bedded, drip, tarped 0.39 25,000 0.83 12,000
Acute - 24 hr Broadcast, non-tarped 0.095 110,000 0.20 50,000 Bedded, non-tarped 0.12 81,000 0.26 39,000 Bedded, tarped 0.084 120,000 0.18 57,000 Broadcast, tarped 0.14 70,000 0.30 33,000 Bedded, drip, tarped 0.56 18,000 1.2 8,500
Seasonal Broadcast, non-tarped 1.8 5,500 3.8 2,600 Bedded, non-tarped 1.7 5,900 3.5 2,900 Bedded, tarped 0.48 21,000 1.0 10,000 Broadcast, tarped 1.5 6,800 3.1 3,300 Bedded, drip, tarped 4.4 2,300 9.1 1,100
Chronic Broadcast, non-tarped 3.4 3,000 7.0 1,400 Bedded, non-tarped 3.1 3,200 6.5 1,500 Bedded, tarped 0.89 11,000 1.8 5,400 Broadcast, tarped 2.7 3,700 5.6 1,800 Bedded, drip, tarped 8.1 1,200 17 600
a Margin of Exposure (MOE) = NOEL or HEC / Exposure Dosage. NOEL= No-Observed-Effect Level. HEC = Human Equivalent Concentration. Acute 1-hr NOEL = 44 ppb (humans - NO in nasal air) for children and adults. Acute 8-hr HEC = 270 ppb for children and 580 ppb for adults (rabbits - mortalities, nasal discharge, body weights & food consumption, red discoloration in lungs in does and skeletal variations in fetuses). Acute 24-hr HEC = 92 ppb for children and 190 ppb for adults (rabbits - mortalities, nasal discharge, body weights & food consumption, red discoloration in lungs in does and skeletal variations in fetuses). Subchronic HEC = 35 ppb for children and 73 ppb for adults (female rats - rhinitis). Chronic HEC = 27 ppb for children and 56 ppb for adults (male and female mice bronchiectasis). Exposure estimates from Table 22 assuming the bystander was downwind, 10 ft (3.0 m) from the edge of a square, 40-acre field and the breathing zone was 4 ft (1.2 m) above ground. Values rounded to two significant figures.
b % RfC = Percentage of Reference Concentration. The 1-hr, 8-hr, 24-hr, seasonal and chronic RfCs for chloropicrin for children are 4.4 ppb, 2.7 ppb, 0.92 ppb, 0.35 ppb and 0.27 ppb, respectively. The respective RfCs for adults are 4.4 ppb, 5.8 ppb, 1.9 ppb, 0.73 ppb and 0.56 ppb. See Table 21 for more details. Values rounded to two significant figures.
69
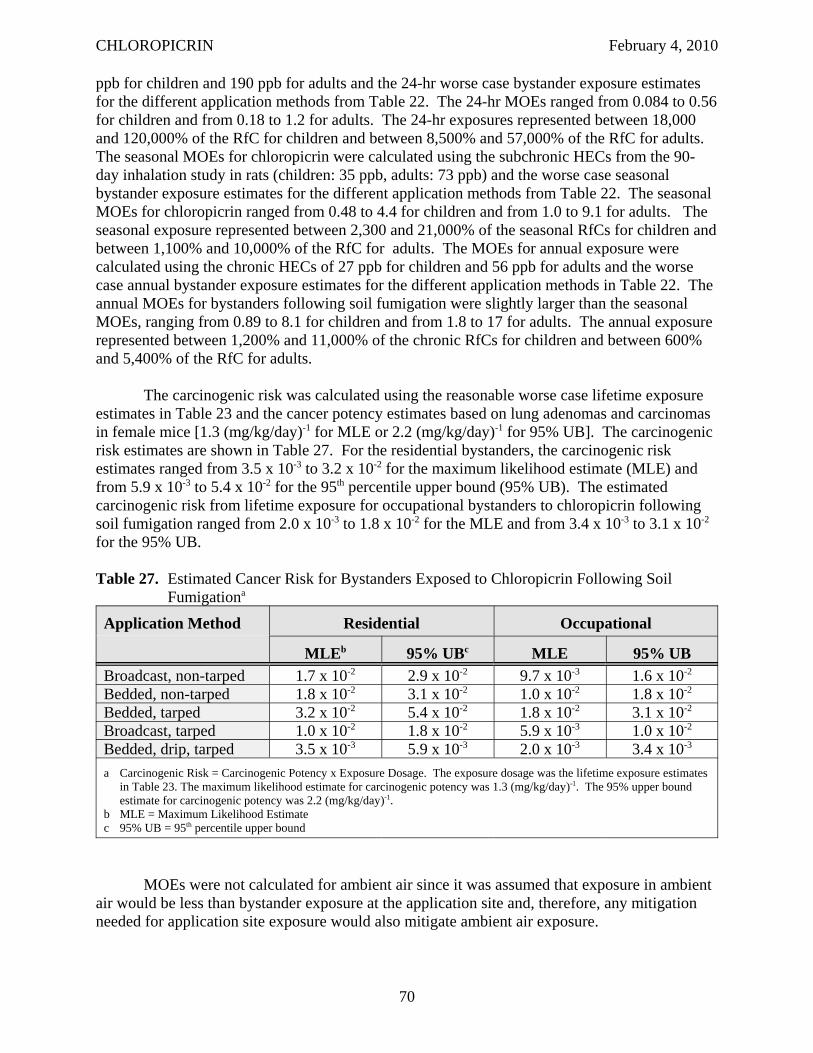
CHLOROPICRIN February 4, 2010
ppb for children and 190 ppb for adults and the 24-hr worse case bystander exposure estimates for the different application methods from Table 22. The 24-hr MOEs ranged from 0.084 to 0.56 for children and from 0.18 to 1.2 for adults. The 24-hr exposures represented between 18,000 and 120,000% of the RfC for children and between 8,500% and 57,000% of the RfC for adults. The seasonal MOEs for chloropicrin were calculated using the subchronic HECs from the 90day inhalation study in rats (children: 35 ppb, adults: 73 ppb) and the worse case seasonal bystander exposure estimates for the different application methods from Table 22. The seasonal MOEs for chloropicrin ranged from 0.48 to 4.4 for children and from 1.0 to 9.1 for adults. The seasonal exposure represented between 2,300 and 21,000% of the seasonal RfCs for children and between 1,100% and 10,000% of the RfC for adults. The MOEs for annual exposure were calculated using the chronic HECs of 27 ppb for children and 56 ppb for adults and the worse case annual bystander exposure estimates for the different application methods in Table 22. The annual MOEs for bystanders following soil fumigation were slightly larger than the seasonal MOEs, ranging from 0.89 to 8.1 for children and from 1.8 to 17 for adults. The annual exposure represented between 1,200% and 11,000% of the chronic RfCs for children and between 600% and 5,400% of the RfC for adults.
The carcinogenic risk was calculated using the reasonable worse case lifetime exposure estimates in Table 23 and the cancer potency estimates based on lung adenomas and carcinomas in female mice [1.3 (mg/kg/day)-1 for MLE or 2.2 (mg/kg/day)-1 for 95% UB]. The carcinogenic risk estimates are shown in Table 27. For the residential bystanders, the carcinogenic risk estimates ranged from 3.5 x 10⁻³ to 3.2 x 10⁻² for the maximum likelihood estimate (MLE) and from 5.9 x 10⁻³ to 5.4 x 10⁻² for the 95th percentile upper bound (95% UB). The estimated carcinogenic risk from lifetime exposure for occupational bystanders to chloropicrin following soil fumigation ranged from 2.0 x 10⁻³ to 1.8 x 10⁻² for the MLE and from 3.4 x 10⁻³ to 3.1 x 10⁻²
for the 95% UB.
Table 27. Estimated Cancer Risk for Bystanders Exposed to Chloropicrin Following Soil Fumigationa
Application Method Residential Occupational
MLEb 95% UBc MLE 95% UB Broadcast, non-tarped 1.7 x 10⁻² 2.9 x 10⁻² 9.7 x 10⁻³ 1.6 x 10⁻²
Bedded, non-tarped 1.8 x 10⁻² 3.1 x 10⁻² 1.0 x 10⁻² 1.8 x 10⁻²
Bedded, tarped 3.2 x 10⁻² 5.4 x 10⁻² 1.8 x 10⁻² 3.1 x 10⁻²
Broadcast, tarped 1.0 x 10⁻² 1.8 x 10⁻² 5.9 x 10⁻³ 1.0 x 10⁻²
Bedded, drip, tarped 3.5 x 10⁻³ 5.9 x 10⁻³ 2.0 x 10⁻³ 3.4 x 10⁻³
a Carcinogenic Risk = Carcinogenic Potency x Exposure Dosage. The exposure dosage was the lifetime exposure estimates in Table 23. The maximum likelihood estimate for carcinogenic potency was 1.3 (mg/kg/day)-1 . The 95% upper bound estimate for carcinogenic potency was 2.2 (mg/kg/day)-1 .
b MLE = Maximum Likelihood Estimate c 95% UB = 95th percentile upper bound
MOEs were not calculated for ambient air since it was assumed that exposure in ambient air would be less than bystander exposure at the application site and, therefore, any mitigation needed for application site exposure would also mitigate ambient air exposure.
70
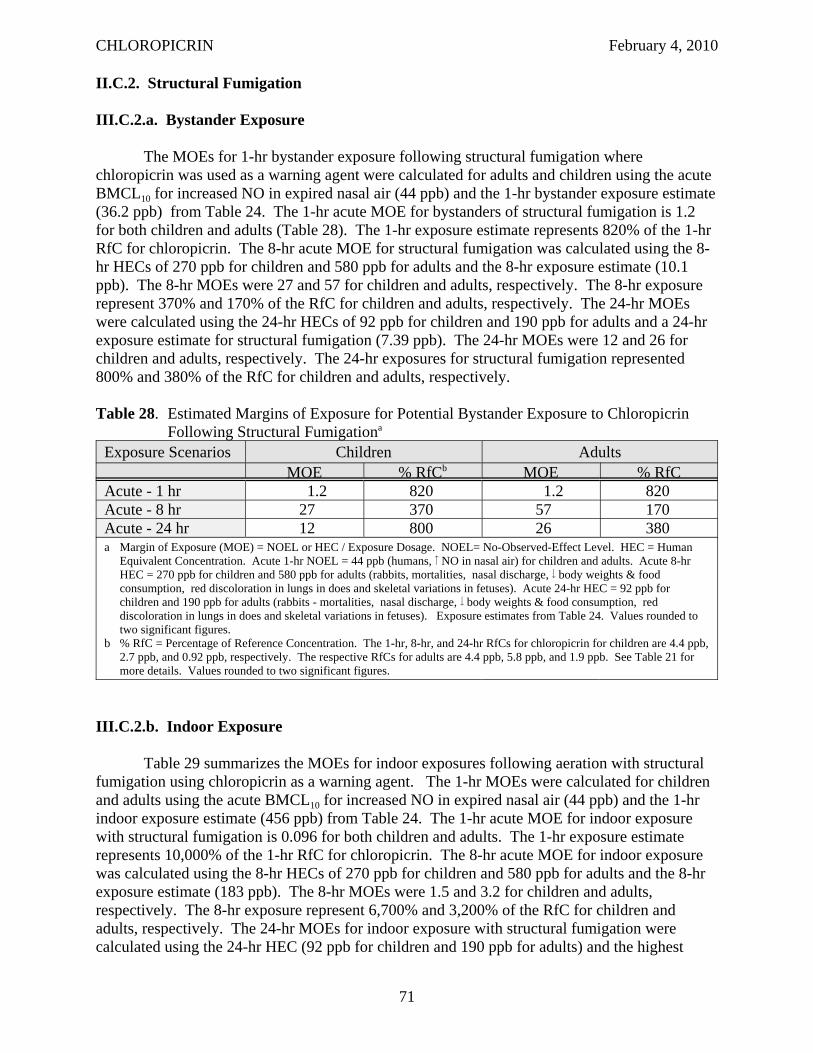
CHLOROPICRIN February 4, 2010
II.C.2. Structural Fumigation
III.C.2.a. Bystander Exposure
The MOEs for 1-hr bystander exposure following structural fumigation where chloropicrin was used as a warning agent were calculated for adults and children using the acute BMCL10 for increased NO in expired nasal air (44 ppb) and the 1-hr bystander exposure estimate (36.2 ppb) from Table 24. The 1-hr acute MOE for bystanders of structural fumigation is 1.2 for both children and adults (Table 28). The 1-hr exposure estimate represents 820% of the 1-hr RfC for chloropicrin. The 8-hr acute MOE for structural fumigation was calculated using the 8hr HECs of 270 ppb for children and 580 ppb for adults and the 8-hr exposure estimate (10.1 ppb). The 8-hr MOEs were 27 and 57 for children and adults, respectively. The 8-hr exposure represent 370% and 170% of the RfC for children and adults, respectively. The 24-hr MOEs were calculated using the 24-hr HECs of 92 ppb for children and 190 ppb for adults and a 24-hr exposure estimate for structural fumigation (7.39 ppb). The 24-hr MOEs were 12 and 26 for children and adults, respectively. The 24-hr exposures for structural fumigation represented 800% and 380% of the RfC for children and adults, respectively.
Table 28. Estimated Margins of Exposure for Potential Bystander Exposure to Chloropicrin Following Structural Fumigationa
Exposure Scenarios Children Adults MOE % RfCb MOE % RfC
Acute - 1 hr 1.2 820 1.2 820 Acute - 8 hr 27 370 57 170 Acute - 24 hr 12 800 26 380 a Margin of Exposure (MOE) = NOEL or HEC / Exposure Dosage. NOEL= No-Observed-Effect Level. HEC = Human
Equivalent Concentration. Acute 1-hr NOEL = 44 ppb (humans, NO in nasal air) for children and adults. Acute 8-hr HEC = 270 ppb for children and 580 ppb for adults (rabbits, mortalities, nasal discharge, body weights & food consumption, red discoloration in lungs in does and skeletal variations in fetuses). Acute 24-hr HEC = 92 ppb for children and 190 ppb for adults (rabbits - mortalities, nasal discharge, body weights & food consumption, red discoloration in lungs in does and skeletal variations in fetuses). Exposure estimates from Table 24. Values rounded to two significant figures.
b % RfC = Percentage of Reference Concentration. The 1-hr, 8-hr, and 24-hr RfCs for chloropicrin for children are 4.4 ppb, 2.7 ppb, and 0.92 ppb, respectively. The respective RfCs for adults are 4.4 ppb, 5.8 ppb, and 1.9 ppb. See Table 21 for more details. Values rounded to two significant figures.
III.C.2.b. Indoor Exposure
Table 29 summarizes the MOEs for indoor exposures following aeration with structural fumigation using chloropicrin as a warning agent. The 1-hr MOEs were calculated for children and adults using the acute BMCL10 for increased NO in expired nasal air (44 ppb) and the 1-hr indoor exposure estimate (456 ppb) from Table 24. The 1-hr acute MOE for indoor exposure with structural fumigation is 0.096 for both children and adults. The 1-hr exposure estimate represents 10,000% of the 1-hr RfC for chloropicrin. The 8-hr acute MOE for indoor exposure was calculated using the 8-hr HECs of 270 ppb for children and 580 ppb for adults and the 8-hr exposure estimate (183 ppb). The 8-hr MOEs were 1.5 and 3.2 for children and adults, respectively. The 8-hr exposure represent 6,700% and 3,200% of the RfC for children and adults, respectively. The 24-hr MOEs for indoor exposure with structural fumigation were calculated using the 24-hr HEC (92 ppb for children and 190 ppb for adults) and the highest
71
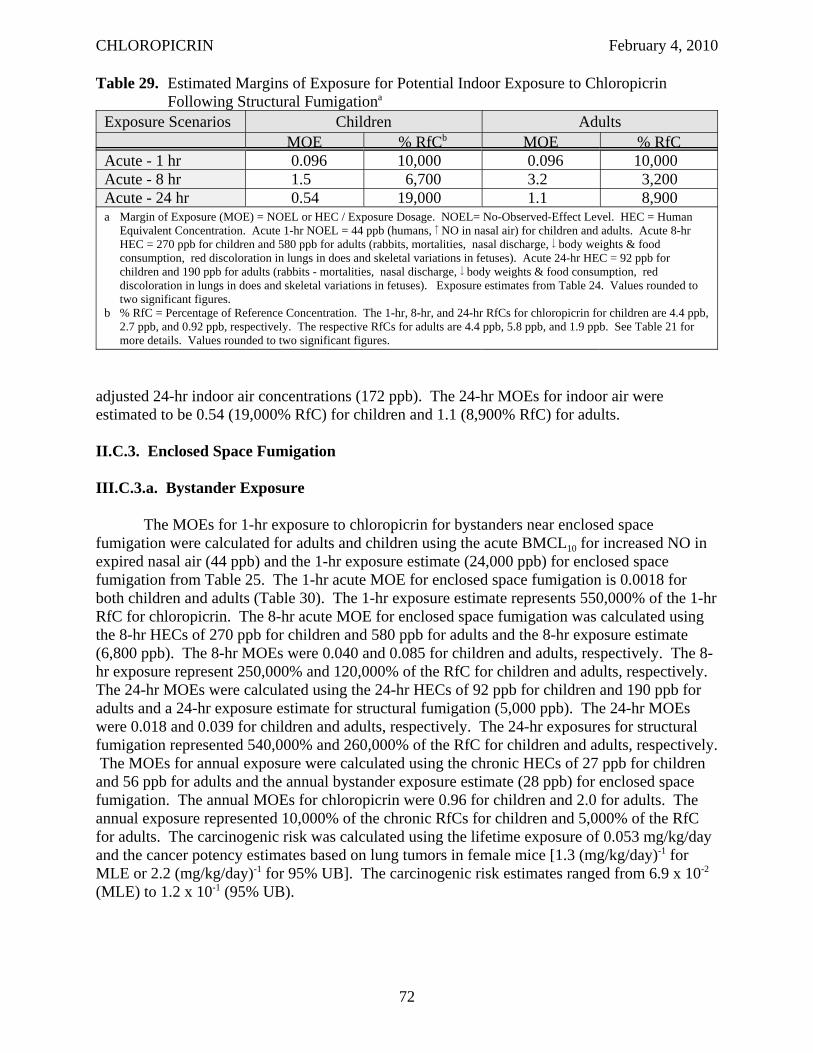
CHLOROPICRIN February 4, 2010
Table 29. Estimated Margins of Exposure for Potential Indoor Exposure to Chloropicrin Following Structural Fumigationa
Exposure Scenarios Children Adults MOE % RfCb MOE % RfC
Acute - 1 hr 0.096 10,000 0.096 10,000 Acute - 8 hr 1.5 6,700 3.2 3,200 Acute - 24 hr 0.54 19,000 1.1 8,900 a Margin of Exposure (MOE) = NOEL or HEC / Exposure Dosage. NOEL= No-Observed-Effect Level. HEC = Human
Equivalent Concentration. Acute 1-hr NOEL = 44 ppb (humans, NO in nasal air) for children and adults. Acute 8-hr HEC = 270 ppb for children and 580 ppb for adults (rabbits, mortalities, nasal discharge, body weights & food consumption, red discoloration in lungs in does and skeletal variations in fetuses). Acute 24-hr HEC = 92 ppb for children and 190 ppb for adults (rabbits - mortalities, nasal discharge, body weights & food consumption, red discoloration in lungs in does and skeletal variations in fetuses). Exposure estimates from Table 24. Values rounded to two significant figures.
b % RfC = Percentage of Reference Concentration. The 1-hr, 8-hr, and 24-hr RfCs for chloropicrin for children are 4.4 ppb, 2.7 ppb, and 0.92 ppb, respectively. The respective RfCs for adults are 4.4 ppb, 5.8 ppb, and 1.9 ppb. See Table 21 for more details. Values rounded to two significant figures.
adjusted 24-hr indoor air concentrations (172 ppb). The 24-hr MOEs for indoor air were estimated to be 0.54 (19,000% RfC) for children and 1.1 (8,900% RfC) for adults.
II.C.3. Enclosed Space Fumigation
III.C.3.a. Bystander Exposure
The MOEs for 1-hr exposure to chloropicrin for bystanders near enclosed space fumigation were calculated for adults and children using the acute BMCL10 for increased NO in expired nasal air (44 ppb) and the 1-hr exposure estimate (24,000 ppb) for enclosed space fumigation from Table 25. The 1-hr acute MOE for enclosed space fumigation is 0.0018 for both children and adults (Table 30). The 1-hr exposure estimate represents 550,000% of the 1-hr RfC for chloropicrin. The 8-hr acute MOE for enclosed space fumigation was calculated using the 8-hr HECs of 270 ppb for children and 580 ppb for adults and the 8-hr exposure estimate (6,800 ppb). The 8-hr MOEs were 0.040 and 0.085 for children and adults, respectively. The 8hr exposure represent 250,000% and 120,000% of the RfC for children and adults, respectively. The 24-hr MOEs were calculated using the 24-hr HECs of 92 ppb for children and 190 ppb for adults and a 24-hr exposure estimate for structural fumigation (5,000 ppb). The 24-hr MOEs were 0.018 and 0.039 for children and adults, respectively. The 24-hr exposures for structural fumigation represented 540,000% and 260,000% of the RfC for children and adults, respectively. The MOEs for annual exposure were calculated using the chronic HECs of 27 ppb for children and 56 ppb for adults and the annual bystander exposure estimate (28 ppb) for enclosed space fumigation. The annual MOEs for chloropicrin were 0.96 for children and 2.0 for adults. The annual exposure represented 10,000% of the chronic RfCs for children and 5,000% of the RfC for adults. The carcinogenic risk was calculated using the lifetime exposure of 0.053 mg/kg/day and the cancer potency estimates based on lung tumors in female mice [1.3 (mg/kg/day)-1 for MLE or 2.2 (mg/kg/day)-1 for 95% UB]. The carcinogenic risk estimates ranged from 6.9 x 10⁻²
(MLE) to 1.2 x 10⁻¹ (95% UB).
72
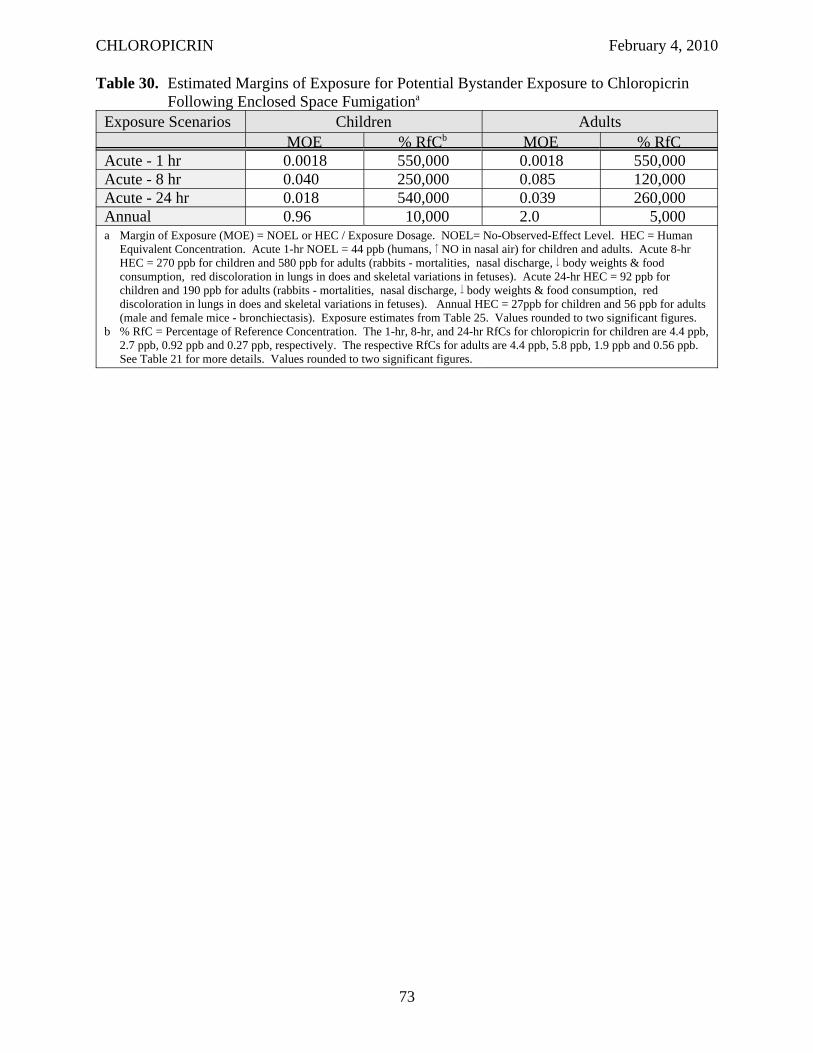
CHLOROPICRIN February 4, 2010
Table 30. Estimated Margins of Exposure for Potential Bystander Exposure to Chloropicrin Following Enclosed Space Fumigationa
Exposure Scenarios Children Adults MOE % RfCb MOE % RfC
Acute - 1 hr 0.0018 550,000 0.0018 550,000 Acute - 8 hr 0.040 250,000 0.085 120,000 Acute - 24 hr 0.018 540,000 0.039 260,000 Annual 0.96 10,000 2.0 5,000 a Margin of Exposure (MOE) = NOEL or HEC / Exposure Dosage. NOEL= No-Observed-Effect Level. HEC = Human
Equivalent Concentration. Acute 1-hr NOEL = 44 ppb (humans, NO in nasal air) for children and adults. Acute 8-hr HEC = 270 ppb for children and 580 ppb for adults (rabbits - mortalities, nasal discharge, body weights & food consumption, red discoloration in lungs in does and skeletal variations in fetuses). Acute 24-hr HEC = 92 ppb for children and 190 ppb for adults (rabbits - mortalities, nasal discharge, body weights & food consumption, red discoloration in lungs in does and skeletal variations in fetuses). Annual HEC = 27ppb for children and 56 ppb for adults (male and female mice - bronchiectasis). Exposure estimates from Table 25. Values rounded to two significant figures.
b % RfC = Percentage of Reference Concentration. The 1-hr, 8-hr, and 24-hr RfCs for chloropicrin for children are 4.4 ppb, 2.7 ppb, 0.92 ppb and 0.27 ppb, respectively. The respective RfCs for adults are 4.4 ppb, 5.8 ppb, 1.9 ppb and 0.56 ppb. See Table 21 for more details. Values rounded to two significant figures.
73
CHLOROPICRIN February 4, 2010
IV. RISK APPRAISAL
Risk assessment is the process used to evaluate the potential for human exposure and the likelihood that the adverse effects observed in toxicity studies with laboratory animals will occur in humans under the specific exposure conditions. Every risk assessment has inherent limitations on the application of existing data to estimate the potential risk to human health. Therefore, certain assumptions and extrapolations are incorporated into the hazard identification, dose-response assessment, and exposure assessment processes. These, in turn, result in uncertainty in the risk characterization which integrates all the information from the previous three processes. Qualitatively, risk assessments for all chemicals have similar uncertainties. However, the degree or magnitude of the uncertainty can vary depending on the availability and quality of the data, and the types of exposure scenarios being assessed. Specific areas of uncertainty associated with this risk assessment for chloropicrin are delineated in the following discussion.
Following the discussion of the uncertainties related to the different components of DPR’s risk assessment is a comparison with the endpoints and exposure estimates used in U.S. EPA’s risk assessment for chloropicrin. In addition, there is a discussion of the information available for chloropicrin related to Food Quality Protection Act including potential increased pre- and post-natal sensitivity in infants and children, endocrine effects, cumulative toxicity and aggregate exposure. Both the uncertainties in the risk estimates and the information related to FQPA can be used in determining the adequacy of the MOEs for chloropicrin.
IV.A. HAZARD IDENTIFICATION
The acute 1-hr MOEs were calculated using the BMCL05 for increased NO in expired nasal air from the human study. An alternative endpoint from the human study that could be used to evaluate 1-hr exposures is the eye irritation which had a lower BMCL10 of 26 ppb. Since no toxicokinetic variation is anticipated with this endpoint due to its direct-acting mechanism of action, the 1-hr RfC for this endpoint would be estimated by dividing the BMCL10 by an intraspecies uncertainty factor of 3 rather than the default of 10. Therefore, the 1-hr RfC for this endpoint would be 8.7 ppb. If this BMCL10 was used to calculate the acute 1-hr MOEs for soil fumigation, they would be approximately 60% lower than estimated, but %of RfC would be 50% higher as shown in Table 31. The 1-hr MOEs and %RfC for structural and enclosed space fumigation would also be higher and lower, respectively, to a similar degree (not shown).
Other uncertainties involved in selecting the acute 1-hr NOEL for chloropicrin was in the BMC analysis for the human study. An alternative approach to the hybrid method used in the BMC analysis for this study was to convert the continuous data to quantal data. To do this a threshold must be selected to identify subjects as responders or non-responders. For increased NO in expired nasal air, the study investigator considered an increase greater than 25% to be clinically significant (Haber et al., 2005). Using this single threshold, there were 2, 4 and 7 responders at 0, 100 and 150 ppb, respectively. The model with lowest Χ2 and AIC values was the logistic model. The BMCL05 from this model was 46 ppb which is very similar to the BMCL05 estimated obtained with the hybrid approach (44 ppb).
74
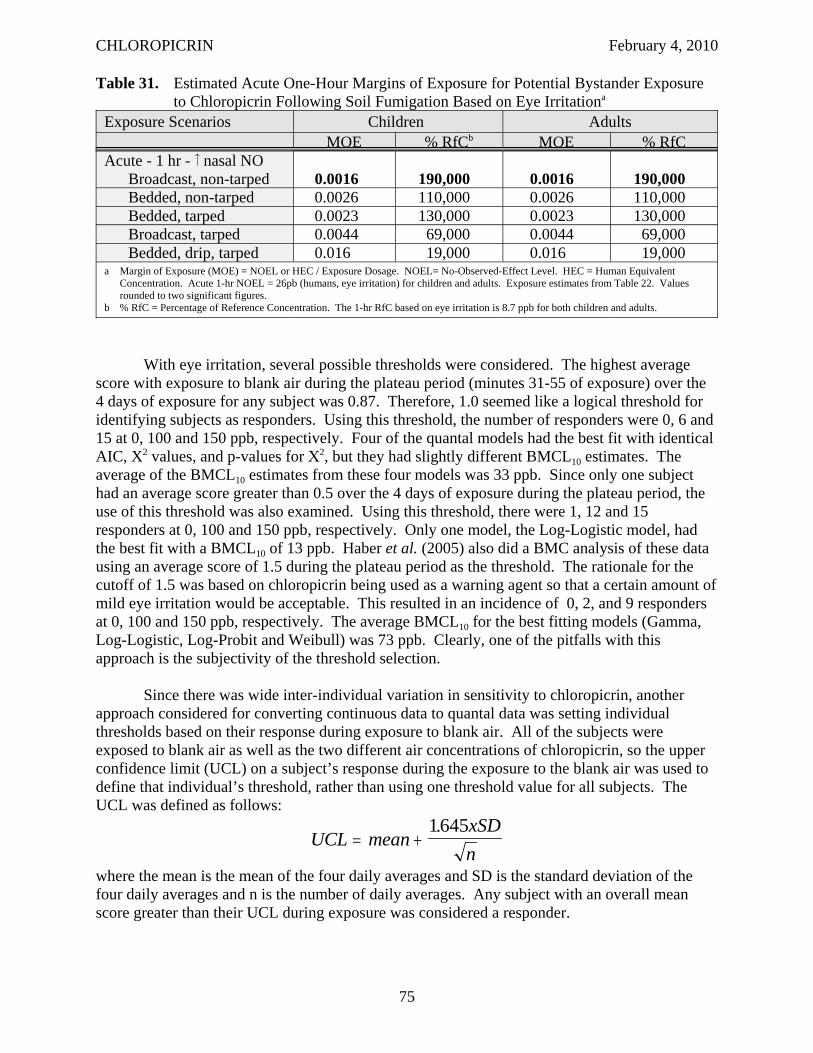
CHLOROPICRIN February 4, 2010
Table 31. Estimated Acute One-Hour Margins of Exposure for Potential Bystander Exposure to Chloropicrin Following Soil Fumigation Based on Eye Irritationa
Exposure Scenarios Children Adults MOE % RfCb MOE % RfC
Acute - 1 hr - nasal NO Broadcast, non-tarped 0.0016 190,000 0.0016 190,000 Bedded, non-tarped 0.0026 110,000 0.0026 110,000 Bedded, tarped 0.0023 130,000 0.0023 130,000 Broadcast, tarped 0.0044 69,000 0.0044 69,000 Bedded, drip, tarped 0.016 19,000 0.016 19,000
a Margin of Exposure (MOE) = NOEL or HEC / Exposure Dosage. NOEL= No-Observed-Effect Level. HEC = Human Equivalent Concentration. Acute 1-hr NOEL = 26pb (humans, eye irritation) for children and adults. Exposure estimates from Table 22. Values rounded to two significant figures.
b % RfC = Percentage of Reference Concentration. The 1-hr RfC based on eye irritation is 8.7 ppb for both children and adults.
With eye irritation, several possible thresholds were considered. The highest average score with exposure to blank air during the plateau period (minutes 31-55 of exposure) over the 4 days of exposure for any subject was 0.87. Therefore, 1.0 seemed like a logical threshold for identifying subjects as responders. Using this threshold, the number of responders were 0, 6 and 15 at 0, 100 and 150 ppb, respectively. Four of the quantal models had the best fit with identical AIC, X2 values, and p-values for Χ2, but they had slightly different BMCL10 estimates. The average of the BMCL10 estimates from these four models was 33 ppb. Since only one subject had an average score greater than 0.5 over the 4 days of exposure during the plateau period, the use of this threshold was also examined. Using this threshold, there were 1, 12 and 15 responders at 0, 100 and 150 ppb, respectively. Only one model, the Log-Logistic model, had the best fit with a BMCL10 of 13 ppb. Haber et al. (2005) also did a BMC analysis of these data using an average score of 1.5 during the plateau period as the threshold. The rationale for the cutoff of 1.5 was based on chloropicrin being used as a warning agent so that a certain amount of mild eye irritation would be acceptable. This resulted in an incidence of 0, 2, and 9 responders at 0, 100 and 150 ppb, respectively. The average BMCL10 for the best fitting models (Gamma, Log-Logistic, Log-Probit and Weibull) was 73 ppb. Clearly, one of the pitfalls with this approach is the subjectivity of the threshold selection.
Since there was wide inter-individual variation in sensitivity to chloropicrin, another approach considered for converting continuous data to quantal data was setting individual thresholds based on their response during exposure to blank air. All of the subjects were exposed to blank air as well as the two different air concentrations of chloropicrin, so the upper confidence limit (UCL) on a subject’s response during the exposure to the blank air was used to define that individual’s threshold, rather than using one threshold value for all subjects. The UCL was defined as follows:
1645xSD.UCL = mean +
n where the mean is the mean of the four daily averages and SD is the standard deviation of the four daily averages and n is the number of daily averages. Any subject with an overall mean score greater than their UCL during exposure was considered a responder.
75
CHLOROPICRIN February 4, 2010
Using this approach for increased NO in expired nasal air, there were 9 responders at 100 ppb and 13 responders at 150 ppb. Several models had the same lowest X2 and AIC values with a BMCL05 of 11 ppb. Using this approach for eye irritation, 22 subjects were responders at 100 ppb and 27 subjects were responders at 150 ppb. Five of the quantal models had the lowest X2
values, the highest p-values for Χ2 and identical AIC scores, but they had slightly different BMCL10 estimates. Therefore, the BMCL10 estimates from these 5 models were averaged, resulting in an average BMCL10 of 7.1 ppb. Since this approach is a fairly novel approach and not fully vetted, there is more uncertainty in the estimates derived. Therefore, these estimates were not used.
Regardless of the approach used for the BMC analysis, the estimates were higher for increased nasal NO production than the BMCL10 for eye irritation, indicating eye irritation is the more sensitive endpoint even using a higher BMR. However, the RfCs for increased NO in nasal air were always lower than the RfCs for eye irritation when using the same approach for BMC analysis since a smaller uncertainty factor of 3 was used with eye irritation.
The Office of Environmental Health Hazard Assessment (OEHHA) in the California Protection Agency (Cal/EPA) derived a 1-hour Reference Level Exposure (REL) for chloropicrin using the RD50 study in mice conducted by Kane et al. (1974). They did a BMC analysis to derive a BMC05 of 790 ppb (5,300 μg/m3) for the respiratory depression. Applying Haber’s Law to adjust from the 10 minute exposure to a 1-hour exposure, the 1-hr BMC05 became 132 ppb. It is interesting to note that OEHHA applied Haber’s Law to estimate the 1-hr REL since some think that sensory irritation is more concentration dependent. However, looking at the human study, during the first 30 minutes of exposure the severity of the eye irritation does appear to increase with time. Therefore, this assumption appears to be appropriate for extrapolating from time periods less than an hour up to an hour. OEHHA used an interspecies factor of only 3 due to the greater degree of certainty or precision in estimating a threshold in animals using a BMC analysis instead of the NOAEL approach. However, OEHHA did not think that the increased precision with the BMC analysis reduced the human variability, therefore, a standard intraspecies uncertainty factor of 10 was applied. This resulted in a 1-hr REL for chloropicrin of 4.4 ppb which is identical to the 1-hr RfC that DPR derived based on increased NO in expired nasal air in humans.
The inhalation developmental toxicity study in rabbits conducted by York (1993) was selected as the definitive study for evaluating acute exposures of 8 and 24 hours. The endpoints observed at the LOEL in this study (maternal: death, nasal discharge, reduced body weights and food consumption, red discoloration of lungs) were more severe than those measured in the human study (eye irritation). The NOEL might have been higher if only a single dose had been administered since most effects, except the nasal discharge were not seen until after more than one dose was administered. Also, the respiratory effects in this study could also be local effects that were concentration dependent and not time dependent, in which case Haber’s Law did not apply and the 8-hr and 24-hr NOEL would be same as the 6-hr NOEL. On the other hand, the NOEL and MOEs might have been lower in this study if sensory irritation had been evaluated in the animals. It is interesting to note that the 8-hour RfC based on this study is very similar to the 1-hour RfC based on the sensory irritation in humans and the 1-hr REL that OEHHA derived based on sensory irritation in mice. If Haber’s Law does not apply to the eye irritation, the 1-hr RfC for eye irritation could also be used for the 8-hour and 24-hour RfCs. Using the BMCL10
76
CHLOROPICRIN February 4, 2010
for eye irritation from the human study would increase the 8-hr RfCs by about 3-fold and the 24RfC by 10-fold.
The 90-day inhalation study in rats was selected as the definitive study for evaluating seasonal exposure to chloropicrin with a critical NOEL of 120 ppb based on BMCL05 for rhinitis in females rats (Chun and Kintigh, 1993). A NOEL of 300 ppb was observed in this study and in the 90-day inhalation study in mice, although the mice appeared to be more sensitive based on more severe effects at the LOEL including reduced body weights and food consumption, increased lung weights and histopathological lesions in the nasal cavity and lungs (Chun and Kintigh, 1993). The lowest BMCL05 values were found in female mice for alveolar histiocytosis (81 ppb) and epithelial hyalin inclusions (84 ppb). However, after converting to an HEC taking species differences in breathing rate into consideration, the HEC for rhinitis in female rats was lower than the HECs for alveolar histiocytosis (44 ppb) and epithelial hyalin inclusions (45 ppb). If these HECs for alveolar histiocytosis or epithelial hyalin inclusions in female mice had been used instead of the one for rhinitis, the subchronic MOEs would be about 25-30% higher than calculated. Alternatively, if the observed NOEL of 300 ppb in rats (HEC = 87 ppb) was used, subchronic MOEs would be 2.5 times larger than estimated.
A similar situation occurred in the selection of the definitive study for evaluating chronic exposure to chloropicrin. A NOEL of 100 ppb was observed in both rats and mice. The lesions were more severe in mice, but if breathing rate was taken into consideration the NOEL in rats was lower. Therefore, DPR performed a BMC analysis on the more sensitive endpoints in the chronic inhalation studies and found the bronchiectasis in both sexes of mice to be the most sensitive endpoint with a BMCL2.5 of 49 ppb. Even with adjusting for breathing rate, the HECs for this endpoint (27 and 56 ppb for children and adults, respectively) were the lowest. If the NOEL had been used instead of the BMCL2.5, the lowest HECs would have been in rats (29 and 62 ppb for children and adults, respectively). If these HECs had been used, the chronic MOEs would have been higher by about 9%.
In calculating the cancer potency factor for chloropicrin, the adjusted number of animals at risk was taken from the Poly-3 trend test. An argument has been made that this test is not the appropriate test to use because survival is not affected and the test has not been validated in CD1 mouse strain which has a natural life span of less than 2 years (CMTF, 2009a). However, the weight of evidence could still be considered sufficient to calculate the cancer potency based on the Fisher’s exact at the high dose being borderline statistically significant (p = 0.053). In this case, the standard approach to calculating animals at risk would be used and the cancer potency estimated would be 1.8 (mg/kg/day)-1. An argument might also be made that because the DNA damage caused by chloropicrin is readily repaired so that a threshold exists at the concentration at which the DNA repair capabilities are overwhelmed. In this case, an alternative approach might be to calculate a BMCL01 for the lung tumors in female mice. Given the adversity of the endpoint, a 1% BMR seems appropriate. The BMCL01 for lung tumors in female mice was estimated to be 14 ppb using the multistage model. The corresponding HEC for this endpoint would be 16 ppb. Given the uncertainty regarding carcinogenicity, an additional uncertainty factor of 10 seems appropriate for deriving the carcinogenicity RfC. This would result in a carcinogenicity RfC of 16 ppt which is 67-fold higher than the carcinogenicity RfC calculated assuming there is no threshold (0.24 ppt).
77
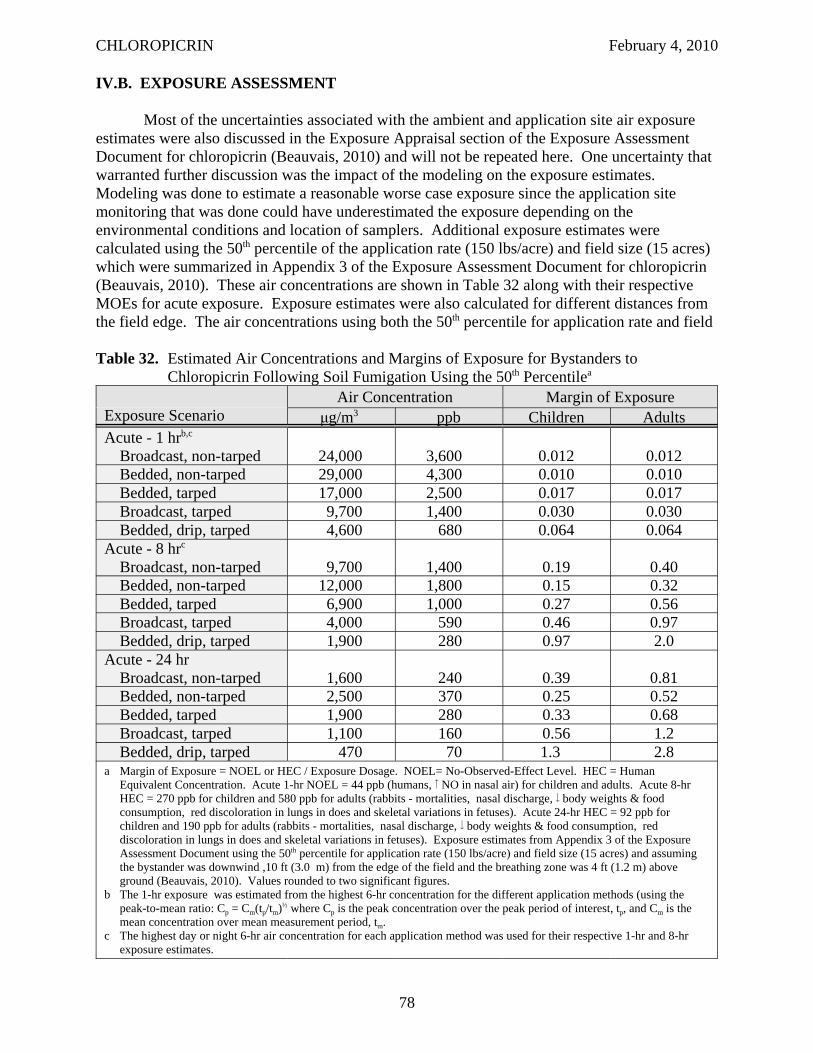
CHLOROPICRIN February 4, 2010
IV.B. EXPOSURE ASSESSMENT
Most of the uncertainties associated with the ambient and application site air exposure estimates were also discussed in the Exposure Appraisal section of the Exposure Assessment Document for chloropicrin (Beauvais, 2010) and will not be repeated here. One uncertainty that warranted further discussion was the impact of the modeling on the exposure estimates. Modeling was done to estimate a reasonable worse case exposure since the application site monitoring that was done could have underestimated the exposure depending on the environmental conditions and location of samplers. Additional exposure estimates were calculated using the 50th percentile of the application rate (150 lbs/acre) and field size (15 acres) which were summarized in Appendix 3 of the Exposure Assessment Document for chloropicrin (Beauvais, 2010). These air concentrations are shown in Table 32 along with their respective MOEs for acute exposure. Exposure estimates were also calculated for different distances from the field edge. The air concentrations using both the 50th percentile for application rate and field
Table 32. Estimated Air Concentrations and Margins of Exposure for Bystanders to Chloropicrin Following Soil Fumigation Using the 50th Percentilea
Exposure Scenario Air Concentration Margin of Exposure
μg/m3 ppb Children Adults Acute - 1 hrb,c
Broadcast, non-tarped 24,000 3,600 0.012 0.012 Bedded, non-tarped 29,000 4,300 0.010 0.010 Bedded, tarped 17,000 2,500 0.017 0.017 Broadcast, tarped 9,700 1,400 0.030 0.030 Bedded, drip, tarped 4,600 680 0.064 0.064
Acute - 8 hrc
Broadcast, non-tarped 9,700 1,400 0.19 0.40 Bedded, non-tarped 12,000 1,800 0.15 0.32 Bedded, tarped 6,900 1,000 0.27 0.56 Broadcast, tarped 4,000 590 0.46 0.97 Bedded, drip, tarped 1,900 280 0.97 2.0
Acute - 24 hr Broadcast, non-tarped 1,600 240 0.39 0.81 Bedded, non-tarped 2,500 370 0.25 0.52 Bedded, tarped 1,900 280 0.33 0.68 Broadcast, tarped 1,100 160 0.56 1.2 Bedded, drip, tarped 470 70 1.3 2.8
a Margin of Exposure = NOEL or HEC / Exposure Dosage. NOEL= No-Observed-Effect Level. HEC = Human Equivalent Concentration. Acute 1-hr NOEL = 44 ppb (humans, NO in nasal air) for children and adults. Acute 8-hr HEC = 270 ppb for children and 580 ppb for adults (rabbits - mortalities, nasal discharge, body weights & food consumption, red discoloration in lungs in does and skeletal variations in fetuses). Acute 24-hr HEC = 92 ppb for children and 190 ppb for adults (rabbits - mortalities, nasal discharge, body weights & food consumption, red discoloration in lungs in does and skeletal variations in fetuses). Exposure estimates from Appendix 3 of the Exposure Assessment Document using the 50th percentile for application rate (150 lbs/acre) and field size (15 acres) and assuming the bystander was downwind ,10 ft (3.0 m) from the edge of the field and the breathing zone was 4 ft (1.2 m) above ground (Beauvais, 2010). Values rounded to two significant figures.
b The 1-hr exposure was estimated from the highest 6-hr concentration for the different application methods (using the peak-to-mean ratio: Cp = Cm(tp/tm)½ where Cp is the peak concentration over the peak period of interest, tp, and Cm is the mean concentration over mean measurement period, tm.
c The highest day or night 6-hr air concentration for each application method was used for their respective 1-hr and 8-hr exposure estimates.
78
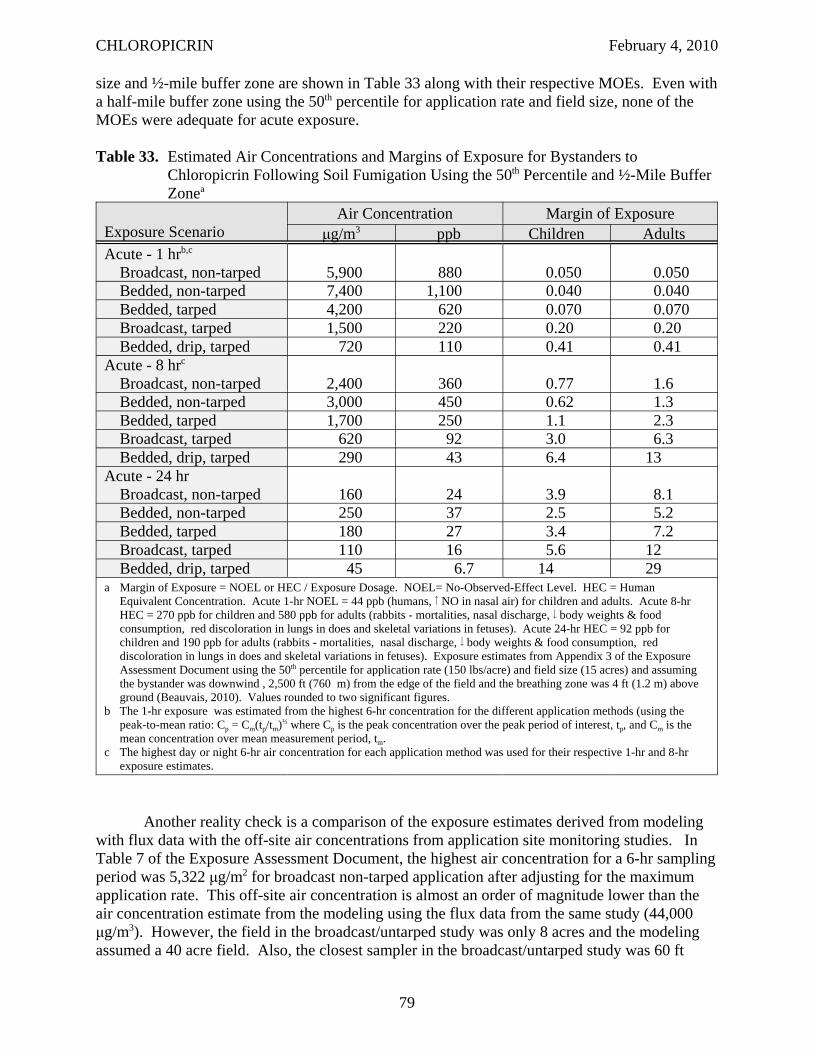
CHLOROPICRIN February 4, 2010
size and ½-mile buffer zone are shown in Table 33 along with their respective MOEs. Even with a half-mile buffer zone using the 50th percentile for application rate and field size, none of the MOEs were adequate for acute exposure.
Table 33. Estimated Air Concentrations and Margins of Exposure for Bystanders to Chloropicrin Following Soil Fumigation Using the 50th Percentile and ½-Mile Buffer Zonea
Exposure Scenario Air Concentration Margin of Exposure
μg/m3 ppb Children Adults Acute - 1 hrb,c
Broadcast, non-tarped 5,900 880 0.050 0.050 Bedded, non-tarped 7,400 1,100 0.040 0.040 Bedded, tarped 4,200 620 0.070 0.070 Broadcast, tarped 1,500 220 0.20 0.20 Bedded, drip, tarped 720 110 0.41 0.41
Acute - 8 hrc
Broadcast, non-tarped 2,400 360 0.77 1.6 Bedded, non-tarped 3,000 450 0.62 1.3 Bedded, tarped 1,700 250 1.1 2.3 Broadcast, tarped 620 92 3.0 6.3 Bedded, drip, tarped 290 43 6.4 13
Acute - 24 hr Broadcast, non-tarped 160 24 3.9 8.1 Bedded, non-tarped 250 37 2.5 5.2 Bedded, tarped 180 27 3.4 7.2 Broadcast, tarped 110 16 5.6 12 Bedded, drip, tarped 45 6.7 14 29
a Margin of Exposure = NOEL or HEC / Exposure Dosage. NOEL= No-Observed-Effect Level. HEC = Human Equivalent Concentration. Acute 1-hr NOEL = 44 ppb (humans, NO in nasal air) for children and adults. Acute 8-hr HEC = 270 ppb for children and 580 ppb for adults (rabbits - mortalities, nasal discharge, body weights & food consumption, red discoloration in lungs in does and skeletal variations in fetuses). Acute 24-hr HEC = 92 ppb for children and 190 ppb for adults (rabbits - mortalities, nasal discharge, body weights & food consumption, red discoloration in lungs in does and skeletal variations in fetuses). Exposure estimates from Appendix 3 of the Exposure Assessment Document using the 50th percentile for application rate (150 lbs/acre) and field size (15 acres) and assuming the bystander was downwind , 2,500 ft (760 m) from the edge of the field and the breathing zone was 4 ft (1.2 m) above ground (Beauvais, 2010). Values rounded to two significant figures.
b The 1-hr exposure was estimated from the highest 6-hr concentration for the different application methods (using the peak-to-mean ratio: Cp = Cm(tp/tm)½ where Cp is the peak concentration over the peak period of interest, tp, and Cm is the mean concentration over mean measurement period, tm.
c The highest day or night 6-hr air concentration for each application method was used for their respective 1-hr and 8-hr exposure estimates.
Another reality check is a comparison of the exposure estimates derived from modeling with flux data with the off-site air concentrations from application site monitoring studies. In Table 7 of the Exposure Assessment Document, the highest air concentration for a 6-hr sampling period was 5,322 μg/m2 for broadcast non-tarped application after adjusting for the maximum application rate. This off-site air concentration is almost an order of magnitude lower than the air concentration estimate from the modeling using the flux data from the same study (44,000 μg/m3). However, the field in the broadcast/untarped study was only 8 acres and the modeling assumed a 40 acre field. Also, the closest sampler in the broadcast/untarped study was 60 ft
79
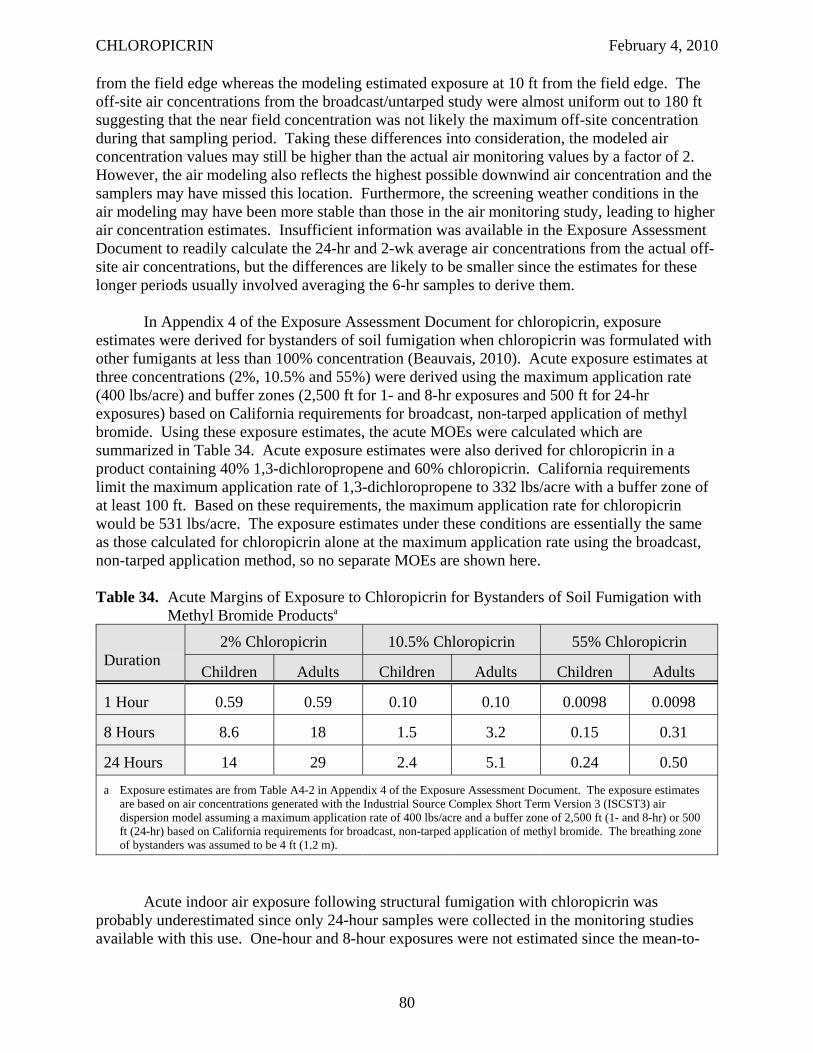
CHLOROPICRIN February 4, 2010
from the field edge whereas the modeling estimated exposure at 10 ft from the field edge. The off-site air concentrations from the broadcast/untarped study were almost uniform out to 180 ft suggesting that the near field concentration was not likely the maximum off-site concentration during that sampling period. Taking these differences into consideration, the modeled air concentration values may still be higher than the actual air monitoring values by a factor of 2. However, the air modeling also reflects the highest possible downwind air concentration and the samplers may have missed this location. Furthermore, the screening weather conditions in the air modeling may have been more stable than those in the air monitoring study, leading to higher air concentration estimates. Insufficient information was available in the Exposure Assessment Document to readily calculate the 24-hr and 2-wk average air concentrations from the actual off-site air concentrations, but the differences are likely to be smaller since the estimates for these longer periods usually involved averaging the 6-hr samples to derive them.
In Appendix 4 of the Exposure Assessment Document for chloropicrin, exposure estimates were derived for bystanders of soil fumigation when chloropicrin was formulated with other fumigants at less than 100% concentration (Beauvais, 2010). Acute exposure estimates at three concentrations (2%, 10.5% and 55%) were derived using the maximum application rate (400 lbs/acre) and buffer zones (2,500 ft for 1- and 8-hr exposures and 500 ft for 24-hr exposures) based on California requirements for broadcast, non-tarped application of methyl bromide. Using these exposure estimates, the acute MOEs were calculated which are summarized in Table 34. Acute exposure estimates were also derived for chloropicrin in a product containing 40% 1,3-dichloropropene and 60% chloropicrin. California requirements limit the maximum application rate of 1,3-dichloropropene to 332 lbs/acre with a buffer zone of at least 100 ft. Based on these requirements, the maximum application rate for chloropicrin would be 531 lbs/acre. The exposure estimates under these conditions are essentially the same as those calculated for chloropicrin alone at the maximum application rate using the broadcast, non-tarped application method, so no separate MOEs are shown here.
Table 34. Acute Margins of Exposure to Chloropicrin for Bystanders of Soil Fumigation with Methyl Bromide Productsa
Duration 2% Chloropicrin 10.5% Chloropicrin 55% Chloropicrin
Children Adults Children Adults Children Adults
1 Hour 0.59 0.59 0.10 0.10 0.0098 0.0098
8 Hours 8.6 18 1.5 3.2 0.15 0.31
24 Hours 14 29 2.4 5.1 0.24 0.50
a Exposure estimates are from Table A4-2 in Appendix 4 of the Exposure Assessment Document. The exposure estimates are based on air concentrations generated with the Industrial Source Complex Short Term Version 3 (ISCST3) air dispersion model assuming a maximum application rate of 400 lbs/acre and a buffer zone of 2,500 ft (1- and 8-hr) or 500 ft (24-hr) based on California requirements for broadcast, non-tarped application of methyl bromide. The breathing zone of bystanders was assumed to be 4 ft (1.2 m).
Acute indoor air exposure following structural fumigation with chloropicrin wasprobably underestimated since only 24-hour samples were collected in the monitoring studiesavailable with this use. One-hour and 8-hour exposures were not estimated since the mean-to
80
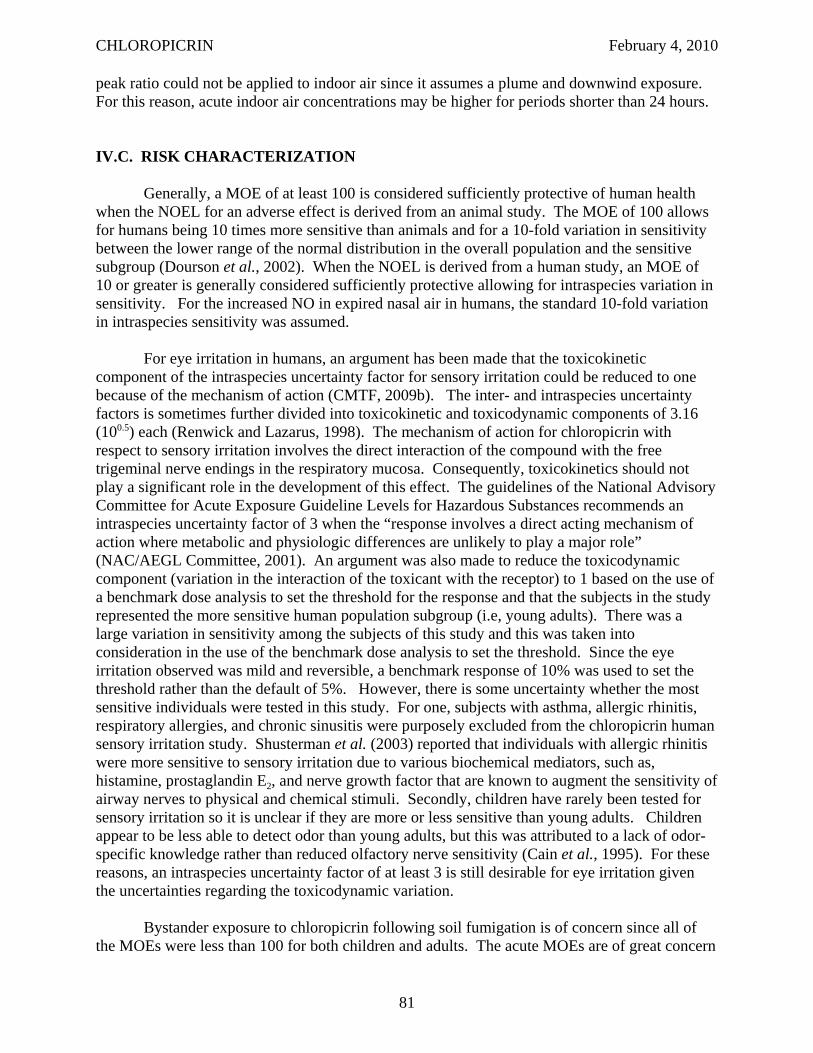
CHLOROPICRIN February 4, 2010
peak ratio could not be applied to indoor air since it assumes a plume and downwind exposure. For this reason, acute indoor air concentrations may be higher for periods shorter than 24 hours.
IV.C. RISK CHARACTERIZATION
Generally, a MOE of at least 100 is considered sufficiently protective of human health when the NOEL for an adverse effect is derived from an animal study. The MOE of 100 allows for humans being 10 times more sensitive than animals and for a 10-fold variation in sensitivity between the lower range of the normal distribution in the overall population and the sensitive subgroup (Dourson et al., 2002). When the NOEL is derived from a human study, an MOE of 10 or greater is generally considered sufficiently protective allowing for intraspecies variation in sensitivity. For the increased NO in expired nasal air in humans, the standard 10-fold variation in intraspecies sensitivity was assumed.
For eye irritation in humans, an argument has been made that the toxicokinetic component of the intraspecies uncertainty factor for sensory irritation could be reduced to one because of the mechanism of action (CMTF, 2009b). The inter- and intraspecies uncertainty factors is sometimes further divided into toxicokinetic and toxicodynamic components of 3.16 (100.5) each (Renwick and Lazarus, 1998). The mechanism of action for chloropicrin with respect to sensory irritation involves the direct interaction of the compound with the free trigeminal nerve endings in the respiratory mucosa. Consequently, toxicokinetics should not play a significant role in the development of this effect. The guidelines of the National Advisory Committee for Acute Exposure Guideline Levels for Hazardous Substances recommends an intraspecies uncertainty factor of 3 when the “response involves a direct acting mechanism of action where metabolic and physiologic differences are unlikely to play a major role” (NAC/AEGL Committee, 2001). An argument was also made to reduce the toxicodynamic component (variation in the interaction of the toxicant with the receptor) to 1 based on the use of a benchmark dose analysis to set the threshold for the response and that the subjects in the study represented the more sensitive human population subgroup (i.e, young adults). There was a large variation in sensitivity among the subjects of this study and this was taken into consideration in the use of the benchmark dose analysis to set the threshold. Since the eye irritation observed was mild and reversible, a benchmark response of 10% was used to set the threshold rather than the default of 5%. However, there is some uncertainty whether the most sensitive individuals were tested in this study. For one, subjects with asthma, allergic rhinitis, respiratory allergies, and chronic sinusitis were purposely excluded from the chloropicrin human sensory irritation study. Shusterman et al. (2003) reported that individuals with allergic rhinitis were more sensitive to sensory irritation due to various biochemical mediators, such as, histamine, prostaglandin E2, and nerve growth factor that are known to augment the sensitivity of airway nerves to physical and chemical stimuli. Secondly, children have rarely been tested for sensory irritation so it is unclear if they are more or less sensitive than young adults. Children appear to be less able to detect odor than young adults, but this was attributed to a lack of odor-specific knowledge rather than reduced olfactory nerve sensitivity (Cain et al., 1995). For these reasons, an intraspecies uncertainty factor of at least 3 is still desirable for eye irritation given the uncertainties regarding the toxicodynamic variation.
Bystander exposure to chloropicrin following soil fumigation is of concern since all of the MOEs were less than 100 for both children and adults. The acute MOEs are of great concern
81
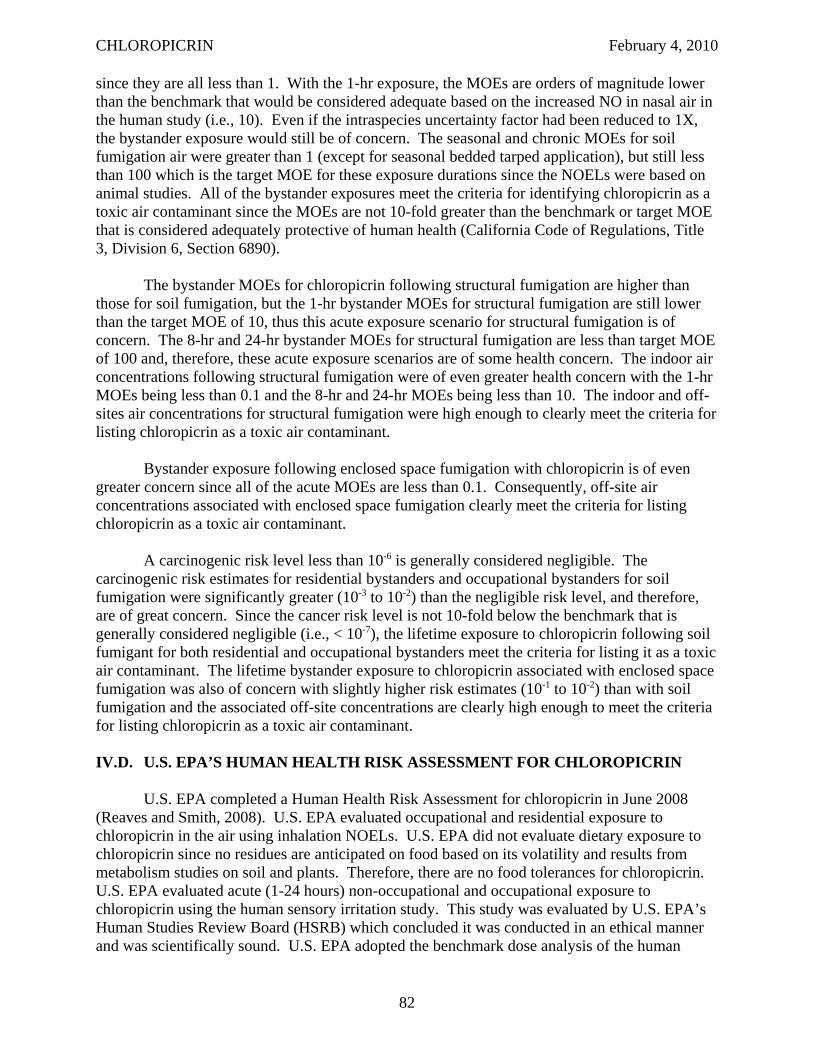
CHLOROPICRIN February 4, 2010
since they are all less than 1. With the 1-hr exposure, the MOEs are orders of magnitude lower than the benchmark that would be considered adequate based on the increased NO in nasal air in the human study (i.e., 10). Even if the intraspecies uncertainty factor had been reduced to 1X, the bystander exposure would still be of concern. The seasonal and chronic MOEs for soil fumigation air were greater than 1 (except for seasonal bedded tarped application), but still less than 100 which is the target MOE for these exposure durations since the NOELs were based on animal studies. All of the bystander exposures meet the criteria for identifying chloropicrin as a toxic air contaminant since the MOEs are not 10-fold greater than the benchmark or target MOE that is considered adequately protective of human health (California Code of Regulations, Title 3, Division 6, Section 6890).
The bystander MOEs for chloropicrin following structural fumigation are higher than those for soil fumigation, but the 1-hr bystander MOEs for structural fumigation are still lower than the target MOE of 10, thus this acute exposure scenario for structural fumigation is of concern. The 8-hr and 24-hr bystander MOEs for structural fumigation are less than target MOE of 100 and, therefore, these acute exposure scenarios are of some health concern. The indoor air concentrations following structural fumigation were of even greater health concern with the 1-hr MOEs being less than 0.1 and the 8-hr and 24-hr MOEs being less than 10. The indoor and off-sites air concentrations for structural fumigation were high enough to clearly meet the criteria for listing chloropicrin as a toxic air contaminant.
Bystander exposure following enclosed space fumigation with chloropicrin is of even greater concern since all of the acute MOEs are less than 0.1. Consequently, off-site air concentrations associated with enclosed space fumigation clearly meet the criteria for listing chloropicrin as a toxic air contaminant.
A carcinogenic risk level less than 10-6 is generally considered negligible. The carcinogenic risk estimates for residential bystanders and occupational bystanders for soil fumigation were significantly greater (10-3 to 10-2) than the negligible risk level, and therefore, are of great concern. Since the cancer risk level is not 10-fold below the benchmark that is generally considered negligible (i.e., < 10-7), the lifetime exposure to chloropicrin following soil fumigant for both residential and occupational bystanders meet the criteria for listing it as a toxic air contaminant. The lifetime bystander exposure to chloropicrin associated with enclosed space fumigation was also of concern with slightly higher risk estimates (10-1 to 10-2) than with soil fumigation and the associated off-site concentrations are clearly high enough to meet the criteria for listing chloropicrin as a toxic air contaminant.
IV.D. U.S. EPA’S HUMAN HEALTH RISK ASSESSMENT FOR CHLOROPICRIN
U.S. EPA completed a Human Health Risk Assessment for chloropicrin in June 2008 (Reaves and Smith, 2008). U.S. EPA evaluated occupational and residential exposure to chloropicrin in the air using inhalation NOELs. U.S. EPA did not evaluate dietary exposure to chloropicrin since no residues are anticipated on food based on its volatility and results from metabolism studies on soil and plants. Therefore, there are no food tolerances for chloropicrin. U.S. EPA evaluated acute (1-24 hours) non-occupational and occupational exposure to chloropicrin using the human sensory irritation study. This study was evaluated by U.S. EPA’s Human Studies Review Board (HSRB) which concluded it was conducted in an ethical manner and was scientifically sound. U.S. EPA adopted the benchmark dose analysis of the human
82
CHLOROPICRIN February 4, 2010
study performed by TERA which was sponsored by the Chloropicrin Manufacturers Task Force. The benchmark concentration (BMC) at the 10% response level (BMCL10) of 73 ppb was selected as the NOAEL or point of departure. In their analysis, TERA converted the eye irritation scores which were continuous to quantal data by selecting a cut-off for the average score during the plateau period to define adversity. The average score selected was 1.5 assuming that a certain amount of mild irritation was acceptable given its use as a warning agent. This is in contrast to DPR’s approach that used a different endpoint (increased NO in expired nasal air) and method to define the threshold (hybrid approach). Consequently, the BMCL05 that DPR used to evaluate acute exposure was 44 ppb which was approximately 1.7-fold lower than that used by U.S. EPA. Furthermore, DPR applied the full 10-fold intraspecies uncertainty factor with the increased NO in nasal air to estimate the 1-hr RfC while U.S. EPA reduced the intraspecies uncertainty factor to estimate a RfC for eye irritation. In addition, DPR only used the human study to evaluate exposures up to 1-hr while U.S. EPA used the BMCL10 for eye irritation in humans to evaluate exposures up to 24 hours. Due to uncertainties about the applicability of Haber’s Law to sensory irritation and increased NO in nasal air, which may be more concentration dependent than time dependent, DPR derived 8-hr and 24-hr NOELs from a developmental toxicity study in rabbits based on maternal effects observed within the first few days of exposure (deaths with red discolored lungs, nasal discharge, and reduced body weights and food consumption) that were not clearly concentration dependent so Haber’s Law was applied. The estimated 8-hr and 24-hr NOELs that DPR used were 27 and 9 ppb, respectively. These NOELs were approximately 3-fold and 8-fold lower than those U.S. EPA used to evaluate acute occupational and non-occupational exposure, respectively.
Unlike DPR, U.S. EPA did not do a BMC analysis on the subchronic studies. Instead they used the observed NOELs and converted them to HECs using a regional gas dose ratio (RGDR) which adjusts for interspecies differences in not only breathing rate, but also regional surface area, if the effects were local. The RGDR for respiratory effects is basically the ratio of the minute volume to the regional surface area in animals divided by the ratio of the minute volume to the regional surface area in humans. For this purpose, the respiratory tract was divided into three regions: extrathoracic, tracheobronchial and pulmonary. Using the RGDR for extrathoracic effects, U.S. EPA calculated a HEC of 8 ppb for the 90-day mouse inhalation study, which it used to evaluate seasonal non-occupational exposure to chloropicrin. U.S. EPA’s HEC for seasonal occupational exposure was 35 ppb assuming exposure was limited to 8 hrs/day, 5 days/wk. DPR did not calculate different HECs for occupational and residential exposure, but did calculate different HECs for adults and children based on differences in their breathing rates. DPR’s subchronic HEC for children was 35 ppb and for adults was 73 ppb.
U.S. EPA assumes that pharmacokinetic differences are taken into consideration in the RGDR adjustment and, consequently, only use an uncertainty factor of 3 for interspecies differences to account for pharmacodynamic differences. DPR has not adopted the use of the RGDR adjustment in the HEC calculation because there are insufficient data and experience for an adjustment of the dose estimate for respiratory effects based on surface area, especially on a regional basis, that would adequately account for the pharmacokinetic differences between species. Instead, DPR prefers to make adjustments for species differences in intake based on their breathing rate and not make any assumption about the concentration of the chemical in different regions of the respiratory tract. For this reason, DPR retains the use of the default uncertainty factor of 10 for interspecies variation to account for both pharmacokinetic and pharmacodynamic differences. So despite the differences in the subchronic HECs, the
83
CHLOROPICRIN February 4, 2010
subchronic RfCs for residential exposure are fairly similar between DPR (0.35 ppb - children) and U.S. EPA (0.27 ppb).
A similar situation occurred with the chronic endpoints. U.S. EPA used the chronic NOEL from the mouse inhalation study and estimated an HEC of 4 ppb for long-term nonoccupational exposure and 15 ppb for long-term occupational exposure. OEHHA also calculated an HEC for the chronic mouse inhalation study using an RGDR factor, however, OEHHA’s HEC for the chronic mouse study (1.6 ppb) was 2.5-fold lower than U.S. EPA’s HEC because OEHHA used a BMC05 of 42 ppb for this study instead of the observed NOAEL of 100 ppb. EPA’s and OEHHA’s HECs for the chronic mouse study are about 8-fold and 20-fold lower, respectively. However, because DPR applied a larger uncertainty factor to estimate the chronic RfC, DPR’s chronic RfC (0.27 ppb for children) was only about 2-fold higher than U.S. EPA’s chronic RfC (0.13 ppb - residential) and about 5-fold higher than OEHHA’s chronic REL (0.05 ppb). U.S. EPA acknowledged that there may be a carcinogenic risk with oral exposure to chloropicrin based on the increase in fibroadenomas in female rats in one study with oral exposure, but they did not think chloropicrin was a carcinogen by the inhalation exposure based on the inhalation studies which, in their evaluation, did not indicate an increase in neoplasm incidence. The National Advisory Committee for Acute Exposure Guideline Levels for Hazardous Substances (NAC/AEGL Committee) apparently also did not consider chloropicrin carcinogenic by the inhalation route since they did not mention the increase in adenomas and carcinomas in lungs of female mice in their summary of the inhalation carcinogenicity studies for chloropicrin (NAC/AEGL Committee, 2008). Table 35 summarizes the critical endpoints, HECs and RfCs that U.S. EPA used in its risk assessment for chloropicrin.
Both U.S. EPA and DPR estimated bystander exposure to chloropicrin following soil fumigation using the ISCST3 model. However, DPR used a deterministic approach with screening level meteorological conditions to provide a single downwind centerline of off-site air concentrations representing reasonable worst case exposure. U.S. EPA used the PERFUM model, which has the ISCST3 model as the core processor, and applied a variety of meteorological conditions to produce buffer zones in a distributional format. U.S. EPA ran analyses with PERFUM assuming 5, 10, 15, 20, 25, 30, 35, 40, 50, 60, 80, 100 and 120 acre fields and 2, 10, 20, 25, 30, 35, 40, 50, 75 and 100% of the maximum application rate. The 2% application rate was selected to evaluate the use of chloropicrin as a warning agent. Meteorological data from six weather stations were used (Ventura, CA, Bakersfield, CA, Flint, MI, Tallahassee, FL, Bradenton, FL, and Yakima, WA). Twelve flux profiles were analyzed by U.S. EPA including broadcast/tarped, broadcast/untarped, bedded/tarped, and bedded/untarped applications in Phoenix (AZ), bedded/tarped applications in Dover (FL), Bainbridge (GA), and Hart (MI) with three different tarps, broadcast/tarped applications in Bradenton (FL) and Yakima (WA), and drip irrigation/tarped applications in Douglas (GA) and Salinas (CA, 2 volatility studies with different tarps). In comparison, DPR limited its exposure estimates to seven flux profiles, including broadcast/tarped, broadcast/untarped, bedded/tarped, and bedded/untarped applications in Phoenix (AZ), broadcast/tarped applications in Bradenton (FL) and Yakima (WA), and a drip irrigation/tarped application in Salinas (CA). Reasonable worst case downwind centerline air concentrations at several application rates were simulated. However, as part of the deterministic approach, the DPR exposure assessment only used air concentration estimates for the maximum application rate at a distance of 3.04 m (10 ft). Since U.S. EPA only reported the size of the buffer zone needed to mitigate the risk and not specific air concentrations, a direct comparison of U.S. EPA’s and DPR’s exposure estimates was difficult.
84
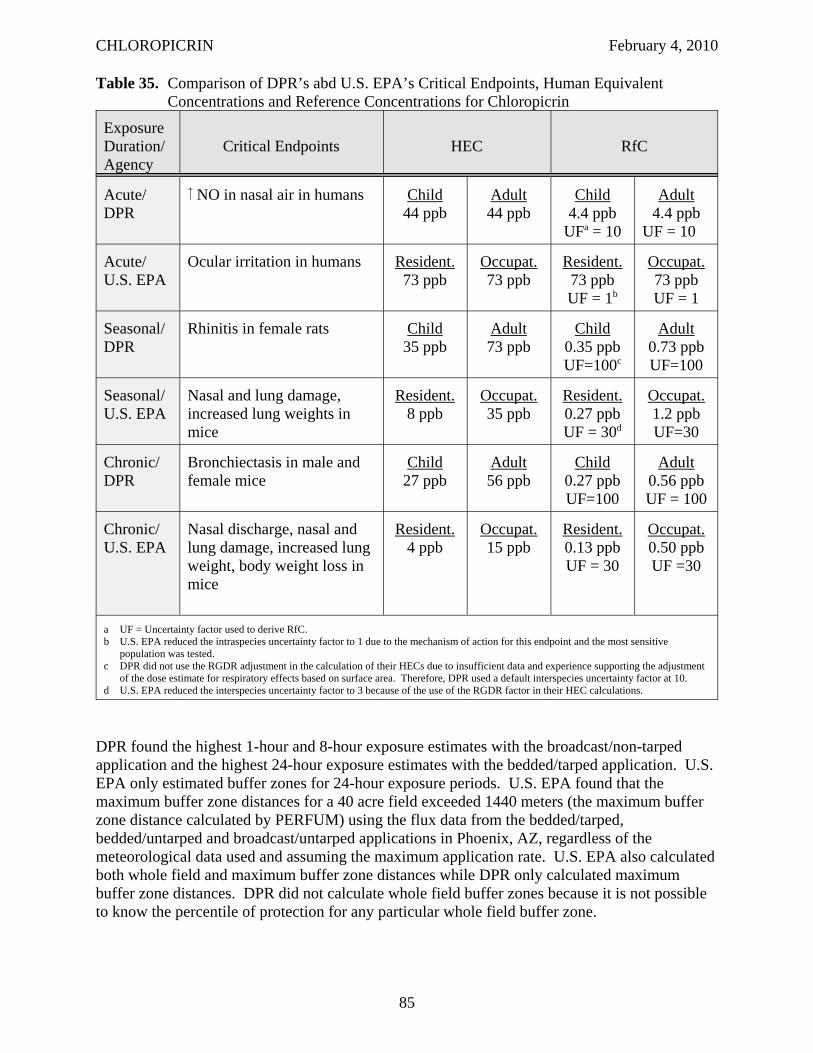
CHLOROPICRIN February 4, 2010
Table 35. Comparison of DPR’s abd U.S. EPA’s Critical Endpoints, Human Equivalent Concentrations and Reference Concentrations for Chloropicrin
Exposure Duration/ Agency
Critical Endpoints HEC RfC
Acute/ DPR
NO in nasal air in humans Child 44 ppb
Adult 44 ppb
Child 4.4 ppb
UFa = 10
Adult 4.4 ppb
UF = 10
Acute/ U.S. EPA
Ocular irritation in humans Resident. 73 ppb
Occupat. 73 ppb
Resident. 73 ppb UF = 1b
Occupat. 73 ppb UF = 1
Seasonal/ DPR
Rhinitis in female rats Child 35 ppb
Adult 73 ppb
Child 0.35 ppb UF=100c
Adult 0.73 ppb UF=100
Seasonal/ U.S. EPA
Nasal and lung damage, increased lung weights in mice
Resident. 8 ppb
Occupat. 35 ppb
Resident. 0.27 ppb UF = 30d
Occupat. 1.2 ppb UF=30
Chronic/ DPR
Bronchiectasis in male and female mice
Child 27 ppb
Adult 56 ppb
Child 0.27 ppb UF=100
Adult 0.56 ppb UF = 100
Chronic/ U.S. EPA
Nasal discharge, nasal and lung damage, increased lung weight, body weight loss in mice
Resident. 4 ppb
Occupat. 15 ppb
Resident. 0.13 ppb UF = 30
Occupat. 0.50 ppb UF =30
a UF = Uncertainty factor used to derive RfC. b U.S. EPA reduced the intraspecies uncertainty factor to 1 due to the mechanism of action for this endpoint and the most sensitive
population was tested. c DPR did not use the RGDR adjustment in the calculation of their HECs due to insufficient data and experience supporting the adjustment
of the dose estimate for respiratory effects based on surface area. Therefore, DPR used a default interspecies uncertainty factor at 10. d U.S. EPA reduced the interspecies uncertainty factor to 3 because of the use of the RGDR factor in their HEC calculations.
DPR found the highest 1-hour and 8-hour exposure estimates with the broadcast/non-tarped application and the highest 24-hour exposure estimates with the bedded/tarped application. U.S. EPA only estimated buffer zones for 24-hour exposure periods. U.S. EPA found that the maximum buffer zone distances for a 40 acre field exceeded 1440 meters (the maximum buffer zone distance calculated by PERFUM) using the flux data from the bedded/tarped, bedded/untarped and broadcast/untarped applications in Phoenix, AZ, regardless of the meteorological data used and assuming the maximum application rate. U.S. EPA also calculated both whole field and maximum buffer zone distances while DPR only calculated maximum buffer zone distances. DPR did not calculate whole field buffer zones because it is not possible to know the percentile of protection for any particular whole field buffer zone.
85
CHLOROPICRIN February 4, 2010
To estimate bystander exposure following structural fumigation, U.S. EPA used air concentrations using air monitoring data that ARB performed in 2004 (ARB, 2005a &b). DPR used the highest air concentrations from these same data to estimate exposure for structural fumigation. The highest air concentration U.S. EPA estimated from these data was 0.79 ppb (5.3 μg/m3), however, it is not clear if this represented a 1-hr, 8-hr or 24-hr exposure estimate. DPR estimated the highest 1-hr, 8-hr and 24-hr air concentrations to be 11, 2.4 and 0.92 ppb (73, 16 and 6.2 μg/m3), respectively, after adjusting for recovery and maximum application rate.
U.S. EPA also estimated exposures for greenhouse fumigation. The exposures for this use were also estimated using the PERFUM model assuming aeration with no stack. At 25% of the maximum application rate or less, the maximum buffer zone distances were very small with greenhouses up to 50,000 sq. ft. With higher concentrations, the maximum buffer zone distances at the 95th percentile of exposure ranged from 20 to 325 meters with the distances increasing with application rate and area treated. DPR did not estimate greenhouse fumigation so no comparison was possible. On the other hand, DPR estimated bystander exposure following enclosed space fumigation which U.S. EPA did not.
U.S. EPA did not specifically evaluate the need for an additional uncertainty factor for infants and children based on the Food Quality and Protection Act since there are no tolerances for chloropicrin. However, they noted that the incident reports for chloropicrin suggest that children and asthmatics respond similarly to other individuals. Furthermore, they also recommended that an intraspecies uncertainty factor of 10 is not warranted. They cited a 2005 WHO International Programme on Chemical Safety (IPCS) guidance document on deriving chemical specific adjustment factors which divided the intraspecies uncertainty factor into two components, toxicokinetics and toxicodynamics. Sensory irritation is a local effect so absorption, distribution, metabolism and excretion are not involved. Therefore, they argued that the toxicokinetic component can be reduced to 1X. The toxicodynamic component is defined as the determination and quantification of the sequence of events at the cellular and molecular levels leading to a toxic response. The IPCS guidance document listed three questions to consider in the determination of the adequacy of the experimental data for refinement of the toxicodynamic component: relevance of population, adequacy of concentration-response data and adequacy of number of subjects/samples. U.S. EPA considered the population tested to be the most sensitive, there was a clear dose-response evaluation in the third phase of the human study and the number of subjects tested (127 for all 3 phases) adequate. Consequently, they argued the toxicodynamic component could also be reduced to 1X. Therefore, an MOE of 1 defined U.S. EPA’s level of concern for acute exposure. DPR recommended an intraspecies uncertainty factor of 10 be used for eye irritation since there appears to be a large variation in sensitivity among the subjects of the human study based on their eye irritation scores.
IV.E. ISSUES RELATED TO THE FOOD QUALITY PROTECTION ACT
The Food Quality Protection Act of 1996 mandated U.S. EPA to “upgrade its risk assessment process as part of the tolerance setting procedures” (U.S. EPA, 1997a and b). The improvements to risk assessment were based on the recommendations from the 1993 National Academy of Sciences report, “Pesticides in the Diets of Infants and Children” (NAS, 1993). The Act required an explicit finding that tolerances are safe for children. U.S. EPA was required to use an extra 10-fold safety factor to take into account potential pre- and post-natal
86
CHLOROPICRIN February 4, 2010
developmental toxicity and the completeness of the data unless U.S. EPA determined, based on reliable data, that a different margin would be safe. In addition, U.S. EPA must consider available information on: 1) aggregate exposure from all non-occupational sources; 2) effects of cumulative exposure to the pesticide and other substances with common mechanisms of toxicity; 3) the effects of in utero exposure; and 4) the potential for endocrine disrupting effects. U.S. EPA did not recommend an FQPA factor for chloropicrin since there are no food tolerances for chloropicrin and, therefore, FQPA does not apply. However, the issues addressed under FQPA could still be potentially of concern for chloropicrin and warrant further discussion.
IV.E.1. Prenatal and Postnatal Sensitivity
Two developmental toxicity studies (one with rats and another with rabbits) were available for chloropicrin (Schardein, 1993; York, 1993). Both studies were acceptable based on FIFRA guidelines. Fetal effects in rats included reduced fetal body weights and various skeletal variations (reduced ossification of skull bone, less than 13 rib pairs, 14th rudimentary ribs, bent ribs, unossified 5th and 6th sternebrae). Developmental effects in rabbits included increased pre-and post-implantation losses, late-term abortions, reduced fetal body weights, visceral (left carotid arising from the innominate) and skeletal variations (unossified hyoid body and unossified tail). In both studies, the developmental NOEL was equal or greater than the NOEL for maternal effects. Based on these two studies, there is no evidence of increased prenatal sensitivity to chloropicrin.
There were two reproductive toxicity studies in rats for chloropicrin, a one-generation range-finding study and a standard two-generation study (Denny, 1996; Schardein, 1994). Only the two-generation study met FIFRA guidelines. No developmental effects were seen in the pups in either study. The only reproductive effect was a reduced number of implantation sites in the range-finding study at 2 ppm which was higher than the top dose in the main study (1.5 ppm). The pup/reproductive NOELs were equal to or greater than the parental NOELs in these studies. Based on these reproductive toxicity studies, there is no evidence of increased postnatal sensitivity to chloropicrin. While not required by FIFRA guidelines, the neonates in this study were not exposed directly to chloropicrin vapors until day 28, so theoretically they could have been more sensitive during this developmental period.
Based on the absence of ossification and reduced ossification seen in the two developmental studies, OEHHA concluded that the fetus is impacted by inhalation exposure to chloropicrin (OEHHA, 2009). They note that the octanol/water partition coefficient suggests that it is likely to cross the placenta and be present in breast milk. They suggested a toxicokinetic safety factor of 10 should be applied to protect for this. They also suggest that chloropicrin may impact development by binding with sulfhydryl groups during critical phases of development, leading to possible functional deficits later in life. They note that chloropicrin has a similar mechanism of action to that of arsenic, methylene chloride and a few other chemicals which have been shown to affect critical enzymes during development. This may also be true for chloropicrin, but there is no evidence that this is occurring in fetuses at doses below those which cause maternal or parental toxicity. Furthermore, chloropicrin appears to be a fairly reactive chemical and is most likely reacting primarily with sulfhydryl groups at the site of first contact (i.e, the respiratory tract). For this reason, it seems unlikely that a sufficient amount of chloropicrin would get into the blood stream to affect the developing fetus or nursing pup. Most of the effects seen in the adults were in the respiratory tract, supporting the theory that very little
87
CHLOROPICRIN February 4, 2010
of it reaches the blood stream. In addition, the effects seen in available developmental and reproductive toxicity studies were non-specific signs of delayed development including reduced implantation sites, late-term abortions, reduced pup weights and visceral and skeletal variations. Since these fetal or pup effects were seen at doses that also caused maternal toxicity, it is possible that they are indirect effects from maternal toxicity, such as reduced maternal body weight. There was nothing to suggest any functional losses, either physiological or neurological, although a developmental neurotoxicity study had not been conducted. Generally, DPR and U.S. EPA do not require developmental neurotoxicity studies for chemicals unless there is evidence of neurotoxicity in adults. Although there was no evidence of increased pre- and postnatal sensitivity from the available developmental and reproductive toxicity studies which met FIFRA guidelines, theoretically it is possible that the neonates could be more sensitive to direct exposure to chloropicrin vapors due to a higher breathing rate or the immaturity of their respiratory system, immune system and/or metabolic enzymes. For this reason, it may be appropriate to apply an additional uncertainty factor for infants and children.
IV.E.2. Endocrine Effects
The Food Quality Protection Act (FQPA) of 1996 required U.S. EPA to develop a screening program to determine the endocrine disruption potential of pesticides. In 1997, the Risk Assessment Forum of the U.S. EPA published a report that reviewed the current state of science relative to environmental endocrine disruption (U.S. EPA, 1997c). U.S. EPA formed the Endocrine Disruptor Screening and Testing Advisory Committee (EDSTAC) to develop a strategy for screening and testing of pesticides for their potential to produce endocrine disruption. The EDSTAC members include various stakeholders and scientific experts. This screening and testing process was to be implemented by August of 1999 as required by FQPA.
Environmental chemicals can interact with the endocrine system, resulting in cancer, reproductive and/or developmental anomalies (EDSTAC, 1998). It may produce these effects by affecting hormonal production and synthesis, binding directly to hormone receptors or interfering with the breakdown of hormones (U.S. EPA, 1997c). The interim science policy stated in U.S. EPA’s 1997 report is that “the Agency does not consider endocrine disruption to be an adverse endpoint per se, but rather to be a mode or mechanism of action leading to other outcomes.” The only possible endocrine related effects seen in the available animal studies for chloropicrin were reduced number of implantation sites, increased pre- and post-implantation losses and later-term abortions observed in the developmental and reproductive toxicity studies (York, 1993; Denny, 1996). However, it is unclear from these studies if any of these effects are mediated through endocrine disruption or some other mechanism. U.S. EPA has stated that once its Endocrine Disruptor Screening Program (EDSP) has been developed and vetted, chloropicrin may be subject to additional screening and/or testing to better characterize its endocrine disruption potential (U.S. EPA, 2008a). It should be noted that U.S. EPA concluded in its human health assessment for chloropicrin that there was no evidence of endocrine disruption from the available data (Reaves and Smith, 2008).
IV.E.3. Cumulative Toxicity
Chloropicrin kills common root destroying fungi, nematodes, soil insects and other plant pests. Chloropicrin causes sensory irritation and respiratory toxicity in animals which may be related to its reaction with thiol groups in proteins. U.S. EPA evaluated the mode of action for
88

CHLOROPICRIN February 4, 2010
chloropicrin and noted that its potential to cause eye irritation was similar to methyl isocyanate (MITC) (U.S. EPA, 2008b). U.S. EPA described the mode of action for chloropicrin as sensory irritation. This may describe the mode of action for the effects in the upper respiratory tract at low concentrations, but obviously the respiratory effects, especially in the lower respiratory tract, go beyond the irritation of sensory trigeminal nerves seen at higher concentrations. Irritation may still be a key part of its initial mode of action in the lower respiratory tract. However, there is insufficient information about the mode of action for chloropicrin and other fumigants which also cause sensory irritation and/or respiratory toxicity to know if they have similar modes of action.
89
CHLOROPICRIN February 4, 2010
V. CONCLUSIONS
The risks for potential adverse human health effects with bystander exposure to chloropicrin after soil and structural fumigation were evaluated using margin of exposure (MOE) estimates. The MOEs for acute, subchronic and chronic exposure were calculated using no-observed-effect levels (NOELs) or benchmark concentration (BMC) estimates from the available guideline and literature toxicity studies for chloropicrin. In selecting the NOELs/BMCs to evaluate exposure, the greatest weight was given to studies which met FIFRA guidelines. Generally, an MOE greater than 100 is considered sufficiently protective of human health when the NOEL/BMC for an adverse effect is derived from an animal study. The MOE of 100 allows for humans being 10 times more sensitive than animals and for a 10-fold variation in sensitivity between the lower distribution of the overall human population and the sensitive subgroup. When the NOEL/BMC is derived from a human study generally an MOE of 10 is considered sufficiently protective, allowing for intraspecies variation. A carcinogenic risk level less than one in a million or 10-6 is generally considered negligible.
The potential health risks from bystander exposure to chloropicrin following soil fumigation are of concern since all of the MOEs were less than 100 for both children and adults based on reasonable worse case exposure estimates. The acute MOEs for soil fumigation are clearly of concern since they are all less than 1. With the 1-hr exposure, the MOEs are orders of magnitude lower than the target MOE of 10. The seasonal and chronic MOEs for soil fumigation were greater than 1 (except for seasonal exposure with bedded tarped application), but they were still less than the target MOE of 100. The carcinogenic risk estimates for residential and occupational bystanders to chloropicrin following soil fumigation were of great concern since they were greater than the negligible risk level by several orders of magnitude.
The off-site air concentrations of chloropicrin following structural fumigation are lower than those following soil fumigation, but the acute exposures are still of concern since they were less than their target MOEs. The 1-hr MOEs were less than 1.0 while the 8-hr and 24-hr MOEs are less than 100. The indoor air concentrations after complete aeration with structural fumigation were of even greater concern with 1-hr MOEs less than 0.01 and the 8-hr and 24-hr MOEs less than 10. No seasonal, chronic or lifetime exposures were expected for structural fumigation.
The off-site air concentrations of chloropicrin following enclosed space fumigation are of great concern since all of the MOEs were less than the target MOEs by 2-4 orders of magnitude. The lifetime exposure for bystanders following enclosed space fumigation with chloropicrin are also of great concern since the cancer risk estimates were several orders of magnitude higher than the negligible risk level.
California regulations state that the air concentrations of a pesticide must be 10-fold lower than the reference concentration that is considered protective of human health to not list it as toxic air contaminant. This is equivalent to the MOEs being greater than 100 when the NOEL is from a human study or 1,000 when the NOEL is from an animal study. For cancer, the risk estimates must be 10-fold below the negligible risk level. Therefore, chloropicrin meets the criteria for listing it as a toxic air contaminant based on all of the bystander exposure scenarios for soil fumigation, structural fumigation, and enclosed space fumigation, including lifetime, and for all of the indoor exposure scenarios for structural fumigation.
90
CHLOROPICRIN February 4, 2010
VI. REFERENCES
ACGIH, 1997. Chloropicrin. In: Documentation of the Threshold Limit Values, 6th Ed. (CDROM). American Conference of Governmental Industrial Hygienists.
Alwis, K.U., B.C. Blount, L.K. Silva, M.M. Smith, and K.H. Loose, 2008. Method for quantifying nitromethane in blood as a potential biomarker of halonitromethane exposure. Environ. Sci. Technol. 42:25522-2527.
ARB, 1987. ARB monitoring of chloropicrin. Contract A5-169-43. Air Resources Board, California Environmental Protection Agency.
ARB, 2003a. Ambient air monitoring for chloropicrin and breakdown products of metam sodium in Kern County - Summer 2001. Project No. P-01-004. Air Resources Board, California Environmental Protection Agency. November 13, 2003. http://www.cdpr.ca.gov/docs/emon/pubs/tac/tacpdfs/chlormitc03.pdf
ARB, 2003b. Ambient air Monitoring for chloropicrin and breakdown products of metam sodium in Monterey and Santa Cruz Counties - Fall 2001. Project No. P-01-004. Air Resources Board, California Environmental Protection Agency. November 13, 2003. http://www.cdpr.ca.gov/docs/emon/pubs/tac/tacpdfs/chlor_metsod04.pdf
ARB, 2003c. Air monitoring around a bed fumigation application of chloropicrin - Fall 2001. Project No. P-01-002. Air Resources Board, California Environmental Protection Agency. March 17, 2003. http://www.cdpr.ca.gov/docs/emon/pubs/tac/tacpdfs/chloropicrin_2001.pdf
ARB, 2003d. Report for the air monitoring around a structural application of sulfuryl fluoride Fall 2002. Project No. P-02-004. Air Resources Board, California Environmental Protection Agency. June 18, 2003. http://www.cdpr.ca.gov/docs/emon/pubs/tac/tacpdfs/sulfurylf_2002.pdf
ARB, 2004. Air monitoring around a bed fumigation of chloropicrin in Santa Cruz County November 2003. Project No. P-03-001. Air Resources Board, California Environmental Protection Agency. December 1, 2004. http://www.cdpr.ca.gov/docs/emon/pubs/tac/tacpdfs/chlorpic03.pdf
ARB, 2005a. Report for the air monitoring around a structural application of sulfuryl fluoride in Grass Valley, CA - Summer 2004. Air Resources Board, California Environmental Protection Agency. June 9, 2005. http://www.cdpr.ca.gov/docs/emon/pubs/tac/tacpdfs/sf_gv_rpt.pdf
ARB, 2005b. Report for the air monitoring around a structural application of sulfuryl fluoride in Loomis, CA - Summer 2004. Air Resources Board, California Environmental Protection Agency. June 9, 2005. http://www.cdpr.ca.gov/docs/emon/pubs/tac/tacpdfs/sf_lm_rpt.pdf
ARB, 2006. Report on air monitoring around a field application of chloropicrin in Santa
91
CHLOROPICRIN February 4, 2010
Barbara County - October 2005. Air Resources Board, California Environmental Protection Agency. August 7, 2006. http://www.cdpr.ca.gov/docs/emon/pubs/tac/tacpdfs/Chloro_rep06.pdf
Auerbach, C., 1950. SH poisoning and mutation. Experimentia 6: 17-18. DPR Vol. 199-038, Rec. No. 90209.
Barnekow, D.L. and S.L. Byrne, 2006. Sulfuryl fluoride and chloropicrin concentrations in air during fumigation, aeration, and post-clearance of residential structures. Dow AgroSciences, LLC. DPR Vol. 50223-091, Rec. No. 242458.
Barry, T., 2008. Memorandum: Screening Level Air Concentration Estimates for Worker Health and Safety Exposure Appraisals. August 21, 2008. Environmental Monitoring Branch, Department of Pesticide Regulation, California Environmental Protection Agency.
Beauvais, S., 2010. Public Exposure to Airborne Chloropicrin in California. HS-1846. Evaluation of Chloropicrin As a Toxic Air Contaminant. Part A. Environmental Fate Review and Exposure Assessment. Public Exposure to Airborne Chloropicrin in California. Worker Health and Safety Branch, Department of Pesticide Regulation, California Environmental Protection Agency. January 27, 2010.
Beard, K.K., P.G. Murphy, D.D. Fontaine, and J.T. Weinberg, 1996. Monitoring of potential worker exposure, field flux, off-site air concentration during chloropicrin field application. Chloropicrin Manufacturers Task Force. DPR Vol. 199-073, Rec. No.
Berghoff, R.S., 1919. The more common gases: Their effect on the respiratory tract. Arch. Int. Med. 24: 678-684.
Bieler, G.S. and R.L. Williams, 1993. Ratio estimates, the delta method, and quantal response tests for increased carcinogenicity. Biometrics 49: 793-801.
Buckley, L.A., X.Z. Jiang, R.A. James, K.T. Morgan, and C.S. Barrow, 1984. Respiratory tract lesions induced by sensory irritants at the RD50 concentration. Toxicol. Appl. Pharmacol. 74: 417-429.
Burleigh-Flayer, H.D and C.L. Benson (Bushy Run Research Center), 1995. Chloropicrin: Vapor inhalation oncogenicity study in CD® rats. The Chloropicrin Manufacturers Task Force. DPR Vol. 199-067, Rec. No. 139750.
Burleigh-Flayer, H.D., W.J. Kintigh, and C.L. Benson (Bushy Run Research Center), 1995. Chloropicrin: Vapor inhalation oncogenicity study in CD-1® mice. The Chloropicrin Manufacturers Task Force. DPR Vol. 199-058, Rec. No. 136552.
CMTF, 2009a. Comments on the interpretation of CD-1 mouse lung pathology in the chloropicrin inhalation study. The Chloropicrin Manufacturers Task Force. DPR Vol. 199-133, Rec. No. 249017.
CMTF, 2009b. Memorandum to DPR: UCSD Human Sensory Irritation Study with
92
CHLOROPICRIN February 4, 2010
Chloropicrin - Background and References. John Butala, Toxicologist, Chloropicrin Manufacturing Task Force. DPRVol. 199-132, Rec. No. 246228.
Cain, W.S., J.C. Stevens, C.M. Nickou, A. Giles, I. Johnston, M.R. Garcia-Medina, 1995. Life-span development of odor identification, learning and olfactory sensitivity. Perception 24: 1457-1472.
Cain, W.S. (Chemosensory Perception Laboratory, U.C. San Diego), 2004. Human sensory irritation testing for chloropicrin. Chloropicrin Manufacturers Task Force. DPR Vol. 199-0113, Rec. No. 215620.
Castro, C.E., R. S. Wade and N.O. Belser, 1983. Biodehalogenation. The metabolism of chloropicrin by Pseudomonas sp. J. Agric. Food Chem. 31: 1184-1187.
Chun, J.S. and W.J. Kintigh (Bushy Run Research Center, Union Carbide Chemicals and Plastics Co., Inc.), 1993. Chloropicrin: Ninety-day inhalation toxicology study in rats and mice. Chloropicrin Manufacturers Task Force. DPR Vol. 199-088, Rec. No. 183793.
Condie, L.W., F.B. Daniel, G.R. Olson, and M. Robinson, 1994. Ten and ninety-day toxicity studies of chloropicrin in Sprague-Dawley rats. Drug Chem. Toxicol. 17(2): 125-137.
Cortez, B., 2001. Notice of Decision to Begin Reevaluation of Pesticide Products Containing Chloropicrin. California Notice 2001-8. Department of Pesticide Regulation, California Environmental Protection Agency, Sacramento, CA. December 1, 2001. http:/www.cdpr.ca.gov/docs/canot/ca01-8.pdf
Crump, K.S., 1995. Calculation of benchmark doses from continuous data. Risk Anal. 15: 7989.
Curren, R.D. (Microbiological Associates, Inc.), 1990. Unscheduled DNA synthesis in rat primary hepatocytes with a confirmatory assay. Niklor Chemical Co., Inc. DPR Vol. 199-046, Rec. No. 88718.
Denny, K.H (MPI Research), 1996. Reproduction range-finding inhalation study in rats chloropicrin. The Chloropicrin Manufacturer’s Task Force. DPR Vol. 199-115, Rec. No. 217717.
Dourson, M., G. Charnley and R. Scheuplein, 2002. Differential sensitivity of children and adults to chemical toxicity. II. Risk and regulation. Regul. Toxicol. Pharmacol. 35: 448-467.
DPR, 2000. Memorandum: Interim Guidance for Selecting Default Inhalation Rates for Children and Adults. Worker Health and Safety Branch and Medical Toxicology Branch, Department of Pesticide Regulation, California Environmental Protection Agency. December 1, 2000. HSM-00010. http://www.cdpr.ca.gov/docs/whs/memo/hsm00010.pdf
Fries, A.A. and C.J. West, 1921. Chemical Warfare. New York, McGraw-Hill Book Company, Inc. pp. 144-149.
93
CHLOROPICRIN February 4, 2010
García-Quispes, W.A., E.R. Carmona, A. Creus and R. Marcos, 2009. Genotoxic evaluation of two halonitromethane disinfection by-products in the Drosophila wing-spot test. Chemospere 75: 906-909.
Garry, V.F., R.L. Nelson, J. Griffith, and M. Harkins, 1990. Preparation for Human study of pesticide applicators: Sister chromatid exchanges and chromosome aberrations in cultured human lymphocytes exposed to selected fumigants. Teratogen, Carcinogen., Mutagen. 10: 21-29.
Gart, J.J., D. Krewski, P.N. Lee, R.E. Tarone, and J. Wahrendorf, 1986. Statistical Methods in Cancer Research, Vol. III - The Design and Analysis of Long-term Animal Experiments. International Agency for Research on Cancer Scientific Publication No. 79. Lyon, France. pp. 82-85.
Gehring, P.J., R.J. Nolan, P.G. Watanabe, and A.M. Schumann, 1991. Solvents, fumigants and related compounds. In: Handbook of Pesticide Toxicology, Vol. 2 (W.J. Hayes, Jr., and E.R. Laws, Jr., eds.). Academic Press, San Diego. Pp. 637-730.
Giknis, M.L. and C.B. Clifford, 2000. Spontaneous neoplastic lesions in the Crl:CD-1® (ICR)BR mouse. Charles River Laboratories. http://www.criver.com/flex_content_area/documents/rm_rm_r_lesions_crl_cd_icr_br_m ouse.pdf
Giller, S., F. Le Curieux, L. Gauthier, F. Erb, and D. Marzin, 1995. Genotoxicity assay of chloral hydrate and chloropicrine. Mut. Res. 348: 147-152.
Goldman, L.R., D. Mengle, D.M. Epstein, D. Fredson, K. Kelly, R.J. Jackson, 1987. Acute symptoms in persons residing near a field treated with the soil fumigants methyl bromide and chloropicrin. West. J. Med. 147: 95-98.
Gonmori, K. H. Muto, T. Yamamoto, K. Takahashi, 1987. A case of homicidal intoxication by chloropicrin. Am. J. Foren. Med. Pathol. 8(2): 135-138.
Haber, L., E. Hack, and M. Dourson (TERA), 2005. Use of benchmark concentration modeling and categorical regression to evaluate the effects of acute exposure to chloropicrin vapor. Chloropicrin Manufacturers Task Force. DPR Vol. 199-0118, Rec. No. 219517.
Haseman, J.K., M.R. Elwell and J.R. Hailey, 1999. Neoplasm incidences in B6C3F1 mice: NTP historical data. In: Pathology of the Mouse - Reference and Atlas (eds., R.R. Maronpot, G.A. Boorman and B.W. Gaul). p. 670-689.
Harton, E.E., Jr., and R.R. Rawl, 1976. Toxicological and skin corrosion testing of selected hazardous materials. Office of Hazardous Materials Operations, Department of Transportation, Washington, D.C. NTIS PB-264 975.
Haworth, S., T. Lawlor, K. Mortelmans, W. Speck, and E. Zeiger, 1983. Salmonella mutagenicity test results for 250 chemicals. Environ. Mutagen. Suppl. 1: 3-142.
94
CHLOROPICRIN February 4, 2010
Hoffman, G. (Huntingdon Life Sciences), 1999a. Chloropicrin: An acute (4-hour) inhalation toxicity study in the rat via whole-body exposure. Chloropicrin Manufacturers Task Force c/o Niklor Chemical Co. DPR Vol. 199-082, Rec. No. 172375.
Hoffman, G. (Huntingdon Life Sciences), 1999b. Chloropicrin: A sensory irritation study in the mouse via head-only exposure. Chloropicrin Manufacturers Task Force c/o Niklor Chemical Co. DPR Vol. 199-081, Rec. No. 172374.
Hummel, T., T. Futschik, J. Frasnelli, K.-B. Hüttenbrink, 2003. Effects of olfactory function, age and gender on trigeminally mediated sensations: a study based on the lateralization of chemosensory stimuli. Toxicol. Letters 140-141: 273-280.
IPCS, 2005. Chemical-Specific Adjustment Factors for Interspecies Difference and Human Variability: Guidance Document for Use of Data in Dose-Concentration-Response Assessment. Harmonization Project Dcoument No. 2. International Programme on Chemical Safety, World Health Organization, Geneva, Switzerland.
Kane, L.E., C.S. Barrow, and Y. Alarie, 1979. A short-term test to predict acceptable levels of exposure to airborne sensory irritants. Amer. Ind. Hyg. Assoc. J. 40: 207-229
Kawai, A., S. Goto, Y. Matsumoto, and H. Matsushita, 1987. Mutagenicity of aliphatic and aromatic nitro compounds. Jpn. J. Ind. Health 29: 34-54.
Kjaergaard, S., O.F. Pedersen, and L. Mølhave, 1992. Sensitivity of the eyes to airborne irritant stimuli influence of individual characteristics. Arch. Environ. Health 47(1) 4550.
Lambert, R.A. and L. Jackson, 1920. The pathology of chloropicrin poisoning. In: The Collected Studies on the Pathology of War Gas Poisoning (Winternitz, M.C., ed.). New Haven, Yale University Press. pp. 68-87.
Liviac, D., A. Creus, and R. Marcos, 2009. Genotoxicity analysis of two halonitromethanes, a novel group of disinfection by-products (DBPs), in human cells treated in vitro. Environ. Res. 109: 232-238.
Maddy, K.T., D.B. Gibbons, D.M. Richmond and A.S. Frederickson, 1983. A study of the levels of methyl bromide and chloropicrin in the air downwind from a field during and after a preplant soil fumigation (shallow injection) - A preliminary report. HS-1061. Worker Health and Safety Branch, Department of Pesticide Regulation, California Environmental Protection Agency. http://www.cdpr.ca.gov/docs/whs/pdf/hs1061.pdf
Maddy, K.T., D.B. Gibbons, D.M. Richmond, and A.S. Frerickson, 1984. Additional monitoring of the concentrations of methyl bromide and chloropicrin in the air downwind from fields during and after preplant soil fumigations (shallow injection). HA-1183. Worker Health and Safety Branch, Department of Pesticide Regulation, Environmental Protection Agency. http://www.cdpr.ca.gov/docs/whs/pdf/hs1183.pdf
Mehmood, Z. (Huntingdon Life Sciences Ltd.), 2003a. Chloropicrin: Mouse micronucleus test. TriCal, Inc. DPR Vol. 199-????, Rec. No. ?????
95
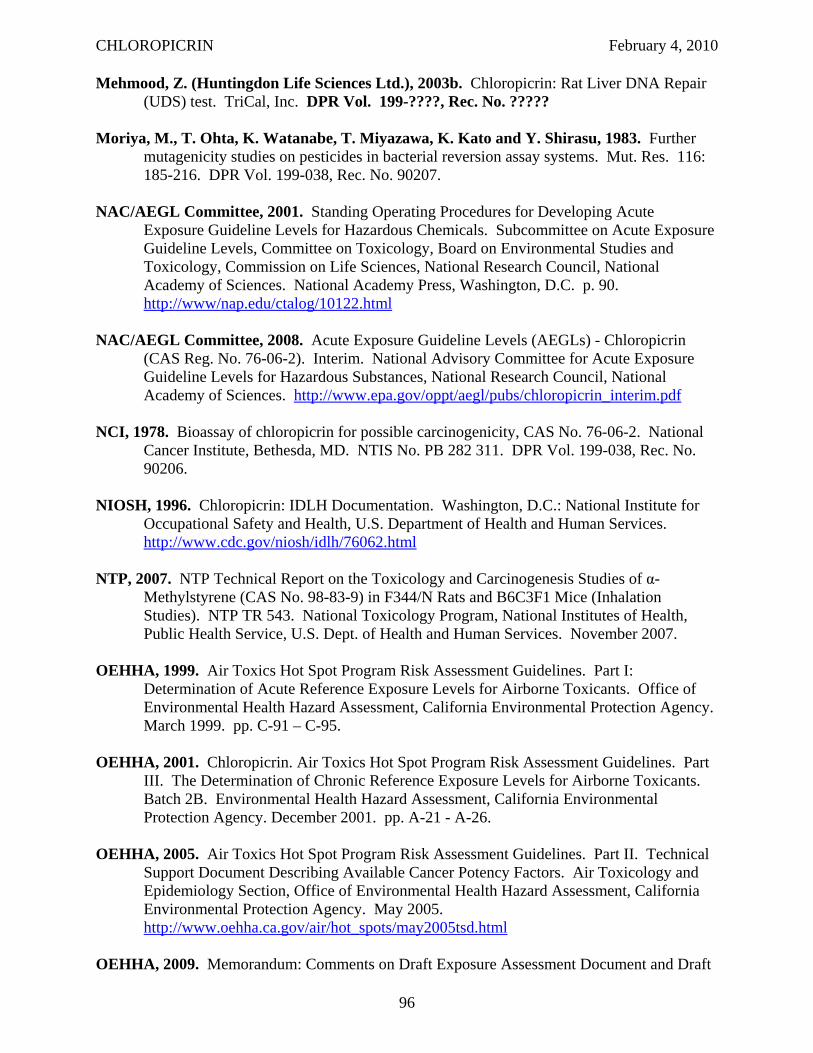
CHLOROPICRIN February 4, 2010
Mehmood, Z. (Huntingdon Life Sciences Ltd.), 2003b. Chloropicrin: Rat Liver DNA Repair (UDS) test. TriCal, Inc. DPR Vol. 199-????, Rec. No. ?????
Moriya, M., T. Ohta, K. Watanabe, T. Miyazawa, K. Kato and Y. Shirasu, 1983. Further mutagenicity studies on pesticides in bacterial reversion assay systems. Mut. Res. 116: 185-216. DPR Vol. 199-038, Rec. No. 90207.
NAC/AEGL Committee, 2001. Standing Operating Procedures for Developing Acute Exposure Guideline Levels for Hazardous Chemicals. Subcommittee on Acute Exposure Guideline Levels, Committee on Toxicology, Board on Environmental Studies and Toxicology, Commission on Life Sciences, National Research Council, National Academy of Sciences. National Academy Press, Washington, D.C. p. 90. http://www/nap.edu/ctalog/10122.html
NAC/AEGL Committee, 2008. Acute Exposure Guideline Levels (AEGLs) - Chloropicrin (CAS Reg. No. 76-06-2). Interim. National Advisory Committee for Acute Exposure Guideline Levels for Hazardous Substances, National Research Council, National Academy of Sciences. http://www.epa.gov/oppt/aegl/pubs/chloropicrin_interim.pdf
NCI, 1978. Bioassay of chloropicrin for possible carcinogenicity, CAS No. 76-06-2. National Cancer Institute, Bethesda, MD. NTIS No. PB 282 311. DPR Vol. 199-038, Rec. No. 90206.
NIOSH, 1996. Chloropicrin: IDLH Documentation. Washington, D.C.: National Institute for Occupational Safety and Health, U.S. Department of Health and Human Services. http://www.cdc.gov/niosh/idlh/76062.html
NTP, 2007. NTP Technical Report on the Toxicology and Carcinogenesis Studies of α-Methylstyrene (CAS No. 98-83-9) in F344/N Rats and B6C3F1 Mice (Inhalation Studies). NTP TR 543. National Toxicology Program, National Institutes of Health, Public Health Service, U.S. Dept. of Health and Human Services. November 2007.
OEHHA, 1999. Air Toxics Hot Spot Program Risk Assessment Guidelines. Part I: Determination of Acute Reference Exposure Levels for Airborne Toxicants. Office of Environmental Health Hazard Assessment, California Environmental Protection Agency. March 1999. pp. C-91 – C-95.
OEHHA, 2001. Chloropicrin. Air Toxics Hot Spot Program Risk Assessment Guidelines. Part III. The Determination of Chronic Reference Exposure Levels for Airborne Toxicants. Batch 2B. Environmental Health Hazard Assessment, California Environmental Protection Agency. December 2001. pp. A-21 - A-26.
OEHHA, 2005. Air Toxics Hot Spot Program Risk Assessment Guidelines. Part II. Technical Support Document Describing Available Cancer Potency Factors. Air Toxicology and Epidemiology Section, Office of Environmental Health Hazard Assessment, California Environmental Protection Agency. May 2005. http://www.oehha.ca.gov/air/hot_spots/may2005tsd.html
OEHHA, 2009. Memorandum: Comments on Draft Exposure Assessment Document and Draft
96
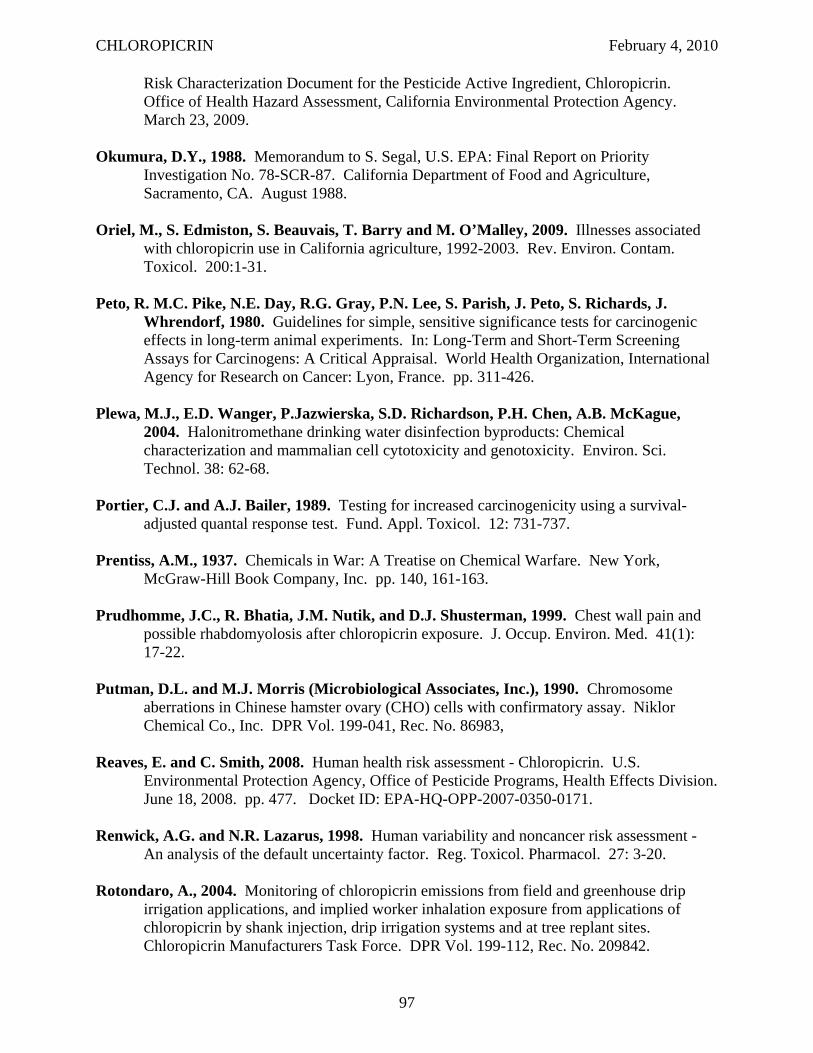
CHLOROPICRIN February 4, 2010
Risk Characterization Document for the Pesticide Active Ingredient, Chloropicrin. Office of Health Hazard Assessment, California Environmental Protection Agency. March 23, 2009.
Okumura, D.Y., 1988. Memorandum to S. Segal, U.S. EPA: Final Report on Priority Investigation No. 78-SCR-87. California Department of Food and Agriculture, Sacramento, CA. August 1988.
Oriel, M., S. Edmiston, S. Beauvais, T. Barry and M. O’Malley, 2009. Illnesses associated with chloropicrin use in California agriculture, 1992-2003. Rev. Environ. Contam. Toxicol. 200:1-31.
Peto, R. M.C. Pike, N.E. Day, R.G. Gray, P.N. Lee, S. Parish, J. Peto, S. Richards, J. Whrendorf, 1980. Guidelines for simple, sensitive significance tests for carcinogenic effects in long-term animal experiments. In: Long-Term and Short-Term Screening Assays for Carcinogens: A Critical Appraisal. World Health Organization, International Agency for Research on Cancer: Lyon, France. pp. 311-426.
Plewa, M.J., E.D. Wanger, P.Jazwierska, S.D. Richardson, P.H. Chen, A.B. McKague, 2004. Halonitromethane drinking water disinfection byproducts: Chemical characterization and mammalian cell cytotoxicity and genotoxicity. Environ. Sci. Technol. 38: 62-68.
Portier, C.J. and A.J. Bailer, 1989. Testing for increased carcinogenicity using a survival-adjusted quantal response test. Fund. Appl. Toxicol. 12: 731-737.
Prentiss, A.M., 1937. Chemicals in War: A Treatise on Chemical Warfare. New York, McGraw-Hill Book Company, Inc. pp. 140, 161-163.
Prudhomme, J.C., R. Bhatia, J.M. Nutik, and D.J. Shusterman, 1999. Chest wall pain and possible rhabdomyolosis after chloropicrin exposure. J. Occup. Environ. Med. 41(1): 17-22.
Putman, D.L. and M.J. Morris (Microbiological Associates, Inc.), 1990. Chromosome aberrations in Chinese hamster ovary (CHO) cells with confirmatory assay. Niklor Chemical Co., Inc. DPR Vol. 199-041, Rec. No. 86983,
Reaves, E. and C. Smith, 2008. Human health risk assessment - Chloropicrin. U.S. Environmental Protection Agency, Office of Pesticide Programs, Health Effects Division. June 18, 2008. pp. 477. Docket ID: EPA-HQ-OPP-2007-0350-0171.
Renwick, A.G. and N.R. Lazarus, 1998. Human variability and noncancer risk assessment An analysis of the default uncertainty factor. Reg. Toxicol. Pharmacol. 27: 3-20.
Rotondaro, A., 2004. Monitoring of chloropicrin emissions from field and greenhouse drip irrigation applications, and implied worker inhalation exposure from applications of chloropicrin by shank injection, drip irrigation systems and at tree replant sites. Chloropicrin Manufacturers Task Force. DPR Vol. 199-112, Rec. No. 209842.
97
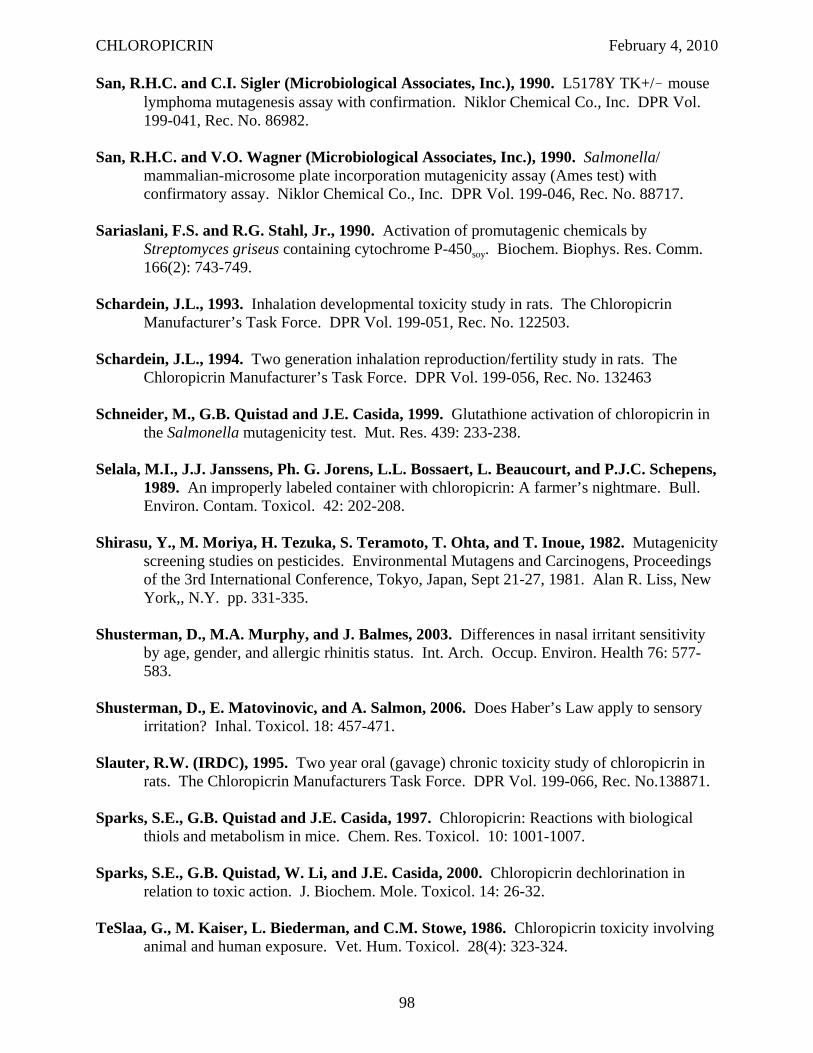
CHLOROPICRIN February 4, 2010
San, R.H.C. and C.I. Sigler (Microbiological Associates, Inc.), 1990. L5178Y TK+/! mouse lymphoma mutagenesis assay with confirmation. Niklor Chemical Co., Inc. DPR Vol. 199-041, Rec. No. 86982.
San, R.H.C. and V.O. Wagner (Microbiological Associates, Inc.), 1990. Salmonella/ mammalian-microsome plate incorporation mutagenicity assay (Ames test) with confirmatory assay. Niklor Chemical Co., Inc. DPR Vol. 199-046, Rec. No. 88717.
Sariaslani, F.S. and R.G. Stahl, Jr., 1990. Activation of promutagenic chemicals by Streptomyces griseus containing cytochrome P-450soy. Biochem. Biophys. Res. Comm. 166(2): 743-749.
Schardein, J.L., 1993. Inhalation developmental toxicity study in rats. The Chloropicrin Manufacturer’s Task Force. DPR Vol. 199-051, Rec. No. 122503.
Schardein, J.L., 1994. Two generation inhalation reproduction/fertility study in rats. The Chloropicrin Manufacturer’s Task Force. DPR Vol. 199-056, Rec. No. 132463
Schneider, M., G.B. Quistad and J.E. Casida, 1999. Glutathione activation of chloropicrin in the Salmonella mutagenicity test. Mut. Res. 439: 233-238.
Selala, M.I., J.J. Janssens, Ph. G. Jorens, L.L. Bossaert, L. Beaucourt, and P.J.C. Schepens, 1989. An improperly labeled container with chloropicrin: A farmer’s nightmare. Bull. Environ. Contam. Toxicol. 42: 202-208.
Shirasu, Y., M. Moriya, H. Tezuka, S. Teramoto, T. Ohta, and T. Inoue, 1982. Mutagenicity screening studies on pesticides. Environmental Mutagens and Carcinogens, Proceedings of the 3rd International Conference, Tokyo, Japan, Sept 21-27, 1981. Alan R. Liss, New York,, N.Y. pp. 331-335.
Shusterman, D., M.A. Murphy, and J. Balmes, 2003. Differences in nasal irritant sensitivity by age, gender, and allergic rhinitis status. Int. Arch. Occup. Environ. Health 76: 577583.
Shusterman, D., E. Matovinovic, and A. Salmon, 2006. Does Haber’s Law apply to sensory irritation? Inhal. Toxicol. 18: 457-471.
Slauter, R.W. (IRDC), 1995. Two year oral (gavage) chronic toxicity study of chloropicrin in rats. The Chloropicrin Manufacturers Task Force. DPR Vol. 199-066, Rec. No.138871.
Sparks, S.E., G.B. Quistad and J.E. Casida, 1997. Chloropicrin: Reactions with biological thiols and metabolism in mice. Chem. Res. Toxicol. 10: 1001-1007.
Sparks, S.E., G.B. Quistad, W. Li, and J.E. Casida, 2000. Chloropicrin dechlorination in relation to toxic action. J. Biochem. Mole. Toxicol. 14: 26-32.
TeSlaa, G., M. Kaiser, L. Biederman, and C.M. Stowe, 1986. Chloropicrin toxicity involving animal and human exposure. Vet. Hum. Toxicol. 28(4): 323-324.
98
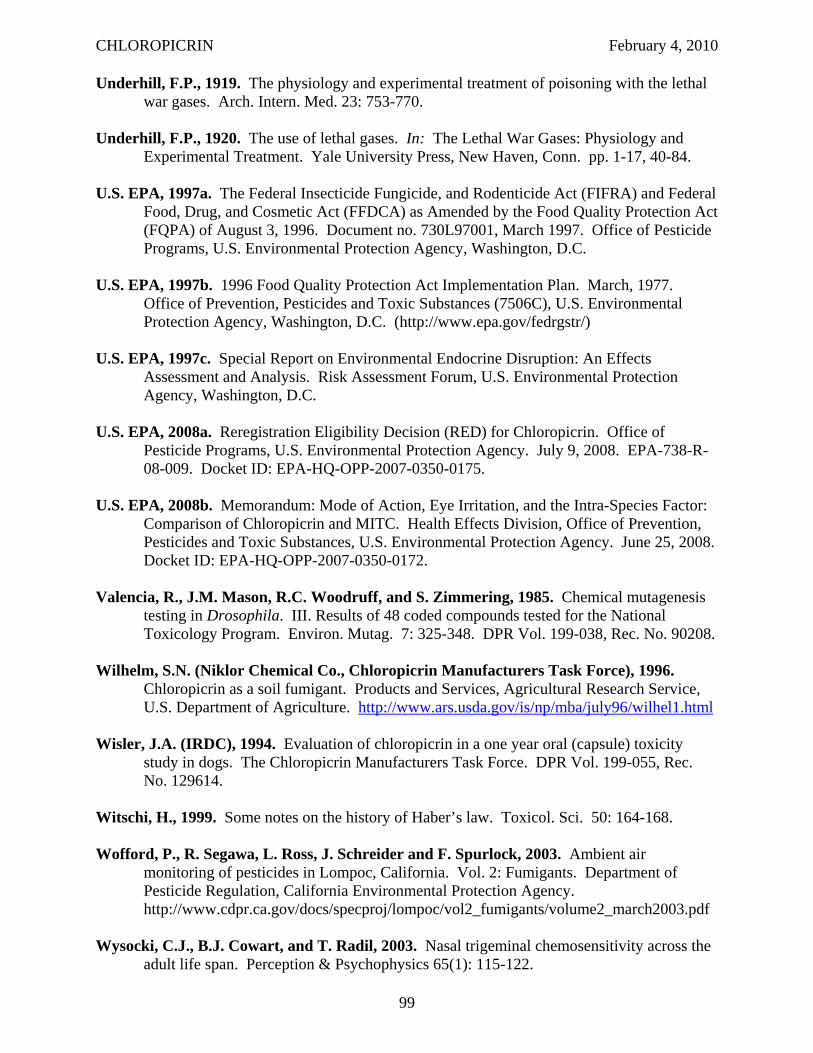
CHLOROPICRIN February 4, 2010
Underhill, F.P., 1919. The physiology and experimental treatment of poisoning with the lethal war gases. Arch. Intern. Med. 23: 753-770.
Underhill, F.P., 1920. The use of lethal gases. In: The Lethal War Gases: Physiology and Experimental Treatment. Yale University Press, New Haven, Conn. pp. 1-17, 40-84.
U.S. EPA, 1997a. The Federal Insecticide Fungicide, and Rodenticide Act (FIFRA) and Federal Food, Drug, and Cosmetic Act (FFDCA) as Amended by the Food Quality Protection Act (FQPA) of August 3, 1996. Document no. 730L97001, March 1997. Office of Pesticide Programs, U.S. Environmental Protection Agency, Washington, D.C.
U.S. EPA, 1997b. 1996 Food Quality Protection Act Implementation Plan. March, 1977. Office of Prevention, Pesticides and Toxic Substances (7506C), U.S. Environmental Protection Agency, Washington, D.C. (http://www.epa.gov/fedrgstr/)
U.S. EPA, 1997c. Special Report on Environmental Endocrine Disruption: An Effects Assessment and Analysis. Risk Assessment Forum, U.S. Environmental Protection Agency, Washington, D.C.
U.S. EPA, 2008a. Reregistration Eligibility Decision (RED) for Chloropicrin. Office of Pesticide Programs, U.S. Environmental Protection Agency. July 9, 2008. EPA-738-R08-009. Docket ID: EPA-HQ-OPP-2007-0350-0175.
U.S. EPA, 2008b. Memorandum: Mode of Action, Eye Irritation, and the Intra-Species Factor: Comparison of Chloropicrin and MITC. Health Effects Division, Office of Prevention, Pesticides and Toxic Substances, U.S. Environmental Protection Agency. June 25, 2008. Docket ID: EPA-HQ-OPP-2007-0350-0172.
Valencia, R., J.M. Mason, R.C. Woodruff, and S. Zimmering, 1985. Chemical mutagenesis testing in Drosophila. III. Results of 48 coded compounds tested for the National Toxicology Program. Environ. Mutag. 7: 325-348. DPR Vol. 199-038, Rec. No. 90208.
Wilhelm, S.N. (Niklor Chemical Co., Chloropicrin Manufacturers Task Force), 1996. Chloropicrin as a soil fumigant. Products and Services, Agricultural Research Service, U.S. Department of Agriculture. http://www.ars.usda.gov/is/np/mba/july96/wilhel1.html
Wisler, J.A. (IRDC), 1994. Evaluation of chloropicrin in a one year oral (capsule) toxicity study in dogs. The Chloropicrin Manufacturers Task Force. DPR Vol. 199-055, Rec. No. 129614.
Witschi, H., 1999. Some notes on the history of Haber’s law. Toxicol. Sci. 50: 164-168.
Wofford, P., R. Segawa, L. Ross, J. Schreider and F. Spurlock, 2003. Ambient air monitoring of pesticides in Lompoc, California. Vol. 2: Fumigants. Department of Pesticide Regulation, California Environmental Protection Agency. http://www.cdpr.ca.gov/docs/specproj/lompoc/vol2_fumigants/volume2_march2003.pdf
Wysocki, C.J., B.J. Cowart, and T. Radil, 2003. Nasal trigeminal chemosensitivity across the adult life span. Perception & Psychophysics 65(1): 115-122.
99
CHLOROPICRIN February 4, 2010
York, R.G., 1993. Inhalation developmental toxicity study in New Zealand White rabbits. The Chloropicrin Manufacturer’s Task Force. DPR Vol. 199-051, Rec. No. 122504.
Yoshida, M., T. Ikeda, M. Iwasaki, S. Tsuda, and Y. Shirasu, 1987a. Acute inhalation toxicity of chloropicrin vapor in rats. J. Pest. Sci. 12: 237-244.
Yoshida, M., T. Ikeda, M. Iwasaki, M. Ikeda, T. Harada, K. Ebino, S. Tsuda, and Y. Shirasu, 1987b. Subchronic inhalation toxicity of chloropicrin vapor in rats. J. Pest. Sci. 12: 673-681. DPR Vol. 199-038, Rec. No. 90205.
Yoshida, M., N. Murao, S. Tsuda, and Y. Shirasu, 1991. Effects of mode of exposure on acute inhalation toxicity of chloropicrin vapor in rats. J. Pest. Sci. 16: 63-69.
Zielhuis, R.L. and F.W. van der Kreek, 1979. The use of a safety factor in setting health based permissible levels for occupational exposure. Int. Arch. Occup. Environ. Health 42: 191-201.
100