Embed Size (px)
Citation preview
EVALUATION OF CAMELINA (CAMELINA SATIVA)
BYPRODUCTS FED TO ATLANTIC SALMON (SALMO SALAR) IN
PRACTICAL DIETS
By
Chang Lin Ye
Submitted in partial fulfilment of the requirements
for the degree of Master of Science
at
Dalhousie University
Halifax, Nova Scotia
August 2014
© Copyright by Chang Lin Ye, 2014
ii
List of tables ...................................................................................................................... vii
List of Figures ...................................................................................................................... x
Abstract ............................................................................................................................... xi
List of Abbreviations Used ............................................................................................... xii
Acknowledgements ........................................................................................................... xiv
Chapter 1 : Introduction ....................................................................................................... 1
1.1 Atlantic Salmon Production ....................................................................................... 1
1.2 Fish Meal and Fish Oil ............................................................................................... 1
1.3 Alternative Ingredients ............................................................................................... 2
Chapter 2 : Literature Review .............................................................................................. 4
2.1 Camelina ..................................................................................................................... 4
2.1.1 History of the Crop .............................................................................................. 4
2.1.2 Fatty Acids in Camelina Oil ................................................................................ 4
2.1.3 Protein in Camelina Meal .................................................................................... 5
2.1.4 Glucosinolates...................................................................................................... 7
2.1.5 Other Antinutritional Factors in Camelina Seed/Meal ...................................... 10
2.1.6 Special Components .......................................................................................... 12
2.1.7 Experiments of Camelina Byproducts as Feed Ingredients ............................... 12
2.2 Life Stages of Atlantic Salmon: Pre-smolt, Smolting and Post-smolt ..................... 14
2.3 Intestine in Atlantic Salmon in Response to Plant Feed Ingredients ....................... 15
2.3.1 Morphology and Histology of Salmon Intestine ............................................... 15
2.3.2 Soybean Induced Enteritis in Salmonids ........................................................... 18
2.4 Summary of the Current Knowledge and Thesis Objectives ................................... 19
iii
Chapter 3 : The Effects of Camelina Oil and Solvent Extracted Camelina Meal on the
Growth, Carcass Composition and Hindgut Histology of Atlantic Salmon Parr (Salmo
salar) in Freshwater ........................................................................................................... 21
3.1 Abstract .................................................................................................................... 21
3.2 Introduction .............................................................................................................. 21
3.3 Objective .................................................................................................................. 22
3.4 Hypothesis ................................................................................................................ 22
3.5 Materials and Methods ............................................................................................. 23
3.5.1 Preparation of Test Ingredients .......................................................................... 23
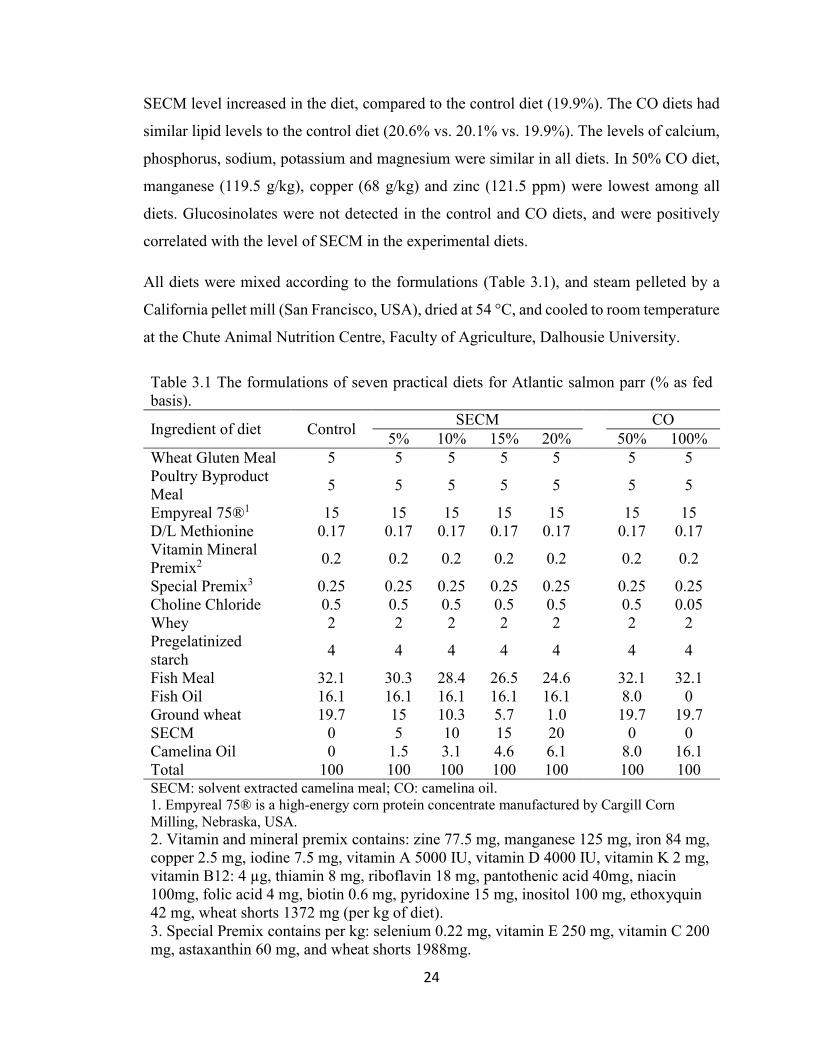
3.5.2 Feed Formulation and Preparation..................................................................... 23
3.5.3 Fish Rearing Conditions .................................................................................... 26
3.5.4 Sampling ............................................................................................................ 26
3.5.5 Calculations ....................................................................................................... 27
3.5.6 Carcass Analysis ................................................................................................ 27
3.5.7 Hindgut Histology Evaluation ........................................................................... 28
3.5.8 Statistical Analysis............................................................................................. 30
3.6 Results ...................................................................................................................... 31
3.6.1 Growth Performance .......................................................................................... 31
3.6.2 Carcass Composition ......................................................................................... 35
3.6.3 Hindgut Histology ............................................................................................. 37
3.7 Discussion ................................................................................................................ 39
3.7.1 Growth Performance .......................................................................................... 39
3.7.2 Carcass Composition ......................................................................................... 40
3.7.3 Hindgut Histology ............................................................................................. 41
3.8 Conclusion ................................................................................................................ 42
iv
Chapter 4 : The Effects of Camelina Oil and Solvent Extracted Camelina Meal on
Growth Performance, Carcass Composition and Hindgut Histology in Atlantic Salmon
(Salmo salar) Post-smolts in Seawater .............................................................................. 43
4.1 Abstract .................................................................................................................... 43
4.2 Introduction .............................................................................................................. 43
4.3 Objectives ................................................................................................................. 44
4.4 Hypothesis ................................................................................................................ 44
4.5 Materials and Methods ............................................................................................. 44
4.5.1 Preparation of Test Ingredients and Feed Formulations .................................... 44
4.5.2 Experimental Fish .............................................................................................. 46
4.5.3 Sampling ............................................................................................................ 47
4.5.4 Calculations ....................................................................................................... 47
4.5.5 Carcass Analysis ................................................................................................ 47
4.5.6 Hindgut Histology Evaluation ........................................................................... 48
4.5.7 Statistical Analysis............................................................................................. 48
4.6 Results ...................................................................................................................... 49
4.6.1 Experimental Diets ............................................................................................ 49
4.6.2 Growth Performance .......................................................................................... 50
4.6.3 Carcass Composition ......................................................................................... 52
4.6.4 Hindgut Histology ............................................................................................. 52
4.7 Discussion ................................................................................................................ 54
4.7.1 Growth ............................................................................................................... 54
4.7.2 Carcass Composition ......................................................................................... 57
4.7.3 Hindgut Histology ............................................................................................. 58
4.8 Conclusion ................................................................................................................ 59

v
Chapter 5 : The Effects of High Oil Residue Camelina Meal on Growth Performance,
Carcass Composition and Hindgut Histology of Atlantic Salmon (Salmo salar) Smolts
in Freshwater ...................................................................................................................... 60
5.1 Abstract .................................................................................................................... 60
5.2 Introduction .............................................................................................................. 60
5.3 Objectives ................................................................................................................. 61
5.4 Hypothesis ................................................................................................................ 61
5.5 Materials and Methods ............................................................................................. 61
5.5.1 Preparation of Test Ingredients and Feed Formulations .................................... 61
5.5.2 Experimental Fish and Rearing Conditions ....................................................... 64
5.5.3 Sampling ............................................................................................................ 65
5.5.4 Calculations ....................................................................................................... 65
5.5.5 Carcass Analysis ................................................................................................ 66
5.5.6 Hindgut Histology Evaluation ........................................................................... 66
5.5.7 Post Mortem Evaluation .................................................................................... 66
5.5.8 Statistical Analysis............................................................................................. 67
5.6 Results ...................................................................................................................... 68
5.6.1 Experimental Diets ............................................................................................ 68
5.6.2 Mortality ............................................................................................................ 68
5.6.3 Growth Performance .......................................................................................... 69
5.6.4 Carcass Composition ......................................................................................... 72
5.6.5 Hindgut Histology ............................................................................................. 74
5.6.6 Post-mortem Evaluation .................................................................................... 76
5.7 Discussion ................................................................................................................ 76
5.7.1 Experimental Diets and Fish Growth ................................................................ 76
5.7.2 Carcass Composition ......................................................................................... 78
vi
5.7.3 Hindgut Histology ............................................................................................. 78
5.7.4 Mortality ............................................................................................................ 80
5.8 Conclusion ................................................................................................................ 80
Chapter 6 : Conclusion ....................................................................................................... 81
6.1 Outcomes of Current Study ...................................................................................... 81
6.2 Future Directions ...................................................................................................... 82
References .......................................................................................................................... 83
Appendix A. The Composition of Solvent Extracted Camelina Meal (SECM) .............. 100
Appendix B. The Composition of High Oil Residue Camelina Meal (HOCM) .............. 101
Appendix C. The Scores of Mucosal Fold (MF) in Semi-quantitative Scoring System .. 102
Appendix D. The Scores of Goblet Cells (GC) in Semi-quantitative Scoring System .... 103
Appendix E. The Scores of Supranuclear Vacuoles (SNV) in Semi-quantitative Scoring
System .............................................................................................................................. 104
Appendix F. The Scores of Lamina Propria (LP) in Semi-quantitative Scoring System 105
Appendix G. The Scores of Sub-mucosal (SM) in Semi-quantitative Scoring System ... 106
Appendix H. The Image of Post-mortem Evaluation ...................................................... 107
vii
List of tables
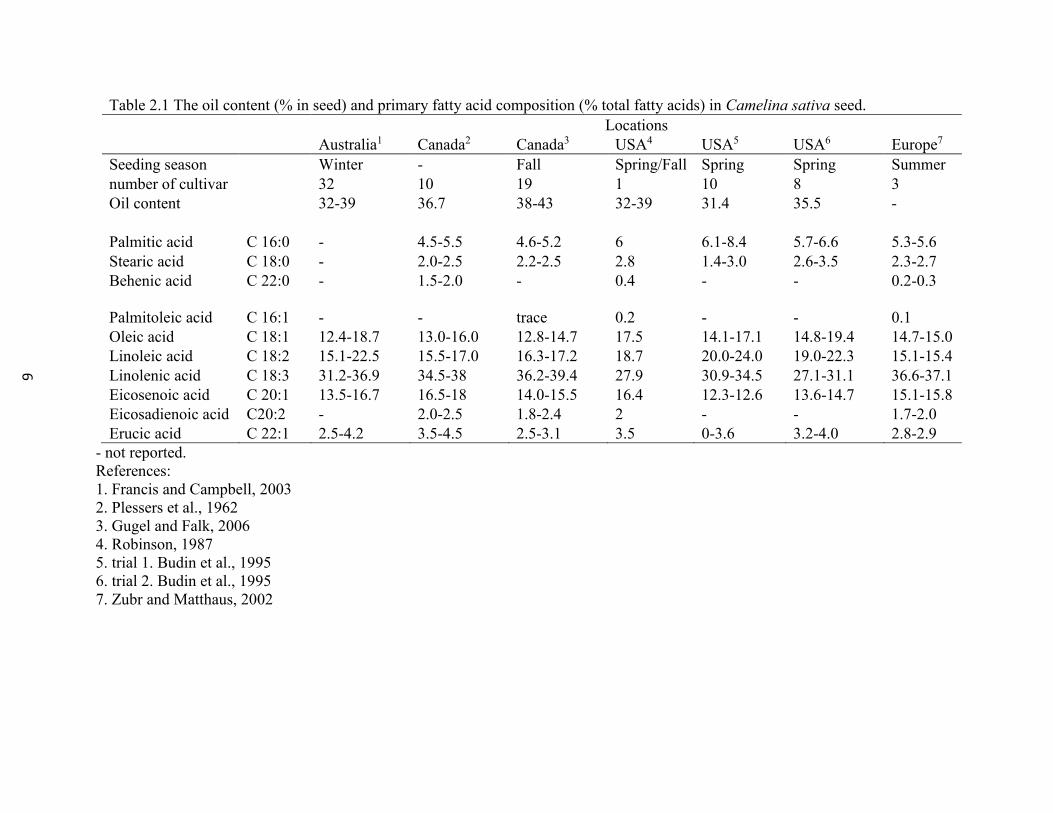
Table 2.1 The oil content (% in seed) and primary fatty acid composition (% total
fatty acids) in Camelina sativa seed. ................................................................... 6
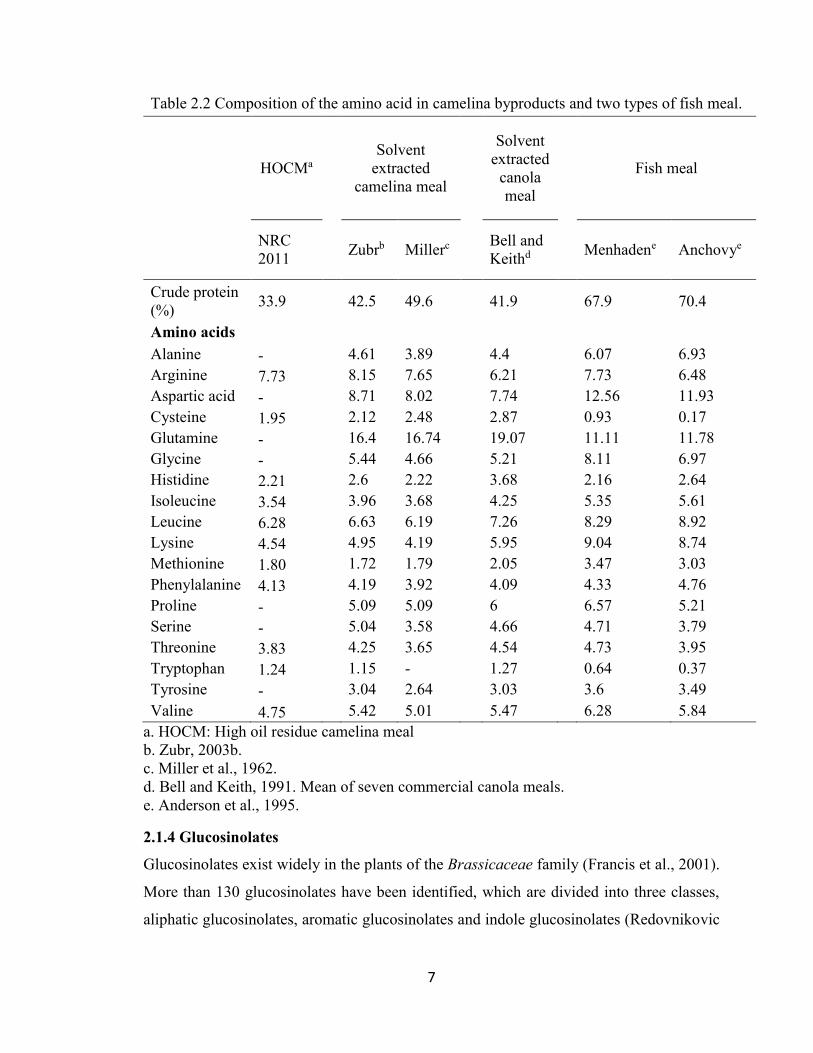
Table 2.2 Composition of the amino acid in camelina byproducts and two types of
fish meal. .............................................................................................................. 7
Table 3.1 The formulations of seven practical diets for Atlantic salmon parr (% as
fed basis). ........................................................................................................... 24
Table 3.3 Analysis of nutrients in practical diets for Atlantic salmon parr (% as
fed basis). ........................................................................................................... 25
Table 3.4 The criteria of each morphology parameter measured in the hindgut of
Atlantic salmon (adapted from Uran et al., 2008b). ........................................... 29
Table 3.5 Significance of treatment, week and treatment×week on weight, weight
gain and feed consumption of Atlantic salmon parr, and the effects of
treatment at each sliced week point or period in Proc Mixed Model, SAS 9.3
(p<0.05 was significant). .................................................................................... 33
Table 3.6 The feed consumption (FC, gram fish-1) and weight gain (WG, gram
fish-1) of Atlantic salmon parr fed different diets at four periods during 16
weeks. ................................................................................................................. 33
Table 3.7 The growth performance, hepatosomatic index and protein retention
ratio (mean±SD, per fish) of Atlantic salmon parr fed different diets for 16
weeks. ................................................................................................................. 34
Table 3.8 P-values for treatment (trt), week and treatment×week on carcass
composition (crude protein, crude lipid, ash and moisture) of fish fed various
experimental diets at week 8 and week 16. ........................................................ 35
Table 3.9 Carcass composition of Atlantic salmon parr fed various experimental
diets for 16 weeks (mean±SD, on wet weight basis). ........................................ 36
Table 3.10 The length, width, and area of simple villi and complex villi (mean±
SD) in Atlantic salmon parr hindgut at Week 16 (n=18 per treatment). ............ 37
Table 3.11 The scores (mean±SD) of different histological parameters in Atlantic
salmon parr hindgut (n=18 per treatment). ........................................................ 38
viii
Table 4.1 The formulations of eight practical diets for Atlantic salmon smolts
(% as fed basis). ................................................................................................. 45
Table 4.2 The calculated nutrients in practical diets for Atlantic salmon smolts
(% as fed basis). ................................................................................................. 46
Table 4.3 Chemical analysis of the practical diets fed to Atlantic salmon post-
smolts (% as fed basis). ...................................................................................... 49
Table 4.4 The growth performance, feed consumption and conversion ratio, and
viscera index of Atlantic salmon post-smolts fed eight experimental diets for
16 weeks. ............................................................................................................ 51
Table 4.5 The carcass compositions (moisture, crude protein, crude lipid and ash
on dry matter basis) of Atlantic salmon smolts fed eight experimental diets
for 16 weeks. ...................................................................................................... 52
Table 4.6 The quantitative measurements of length, width and area of simple villi
and complex villi in the hindgut of Atlantic salmon post-smolts fed eight
experimental diets for 16 weeks. ........................................................................ 53
Table 4.7 The scores of histological parameters (SNV, GC, LP and SM) in the
hindgut of Atlantic salmon post-smolts fed eight experimental diets for 16
weeks. ................................................................................................................. 54
Table 5.1 The formulation of four practical diets with graded levels of high oil
residue camelina meal (HOCM) fed to Atlantic salmon smolts (% as fed
basis). ................................................................................................................. 62
Table 5.2 Calculated nutrients contents in smolts experimental diets (% as fed
basis). ................................................................................................................. 63
Table 5.3 Calculated minerals and antinutrient factors in smolts diets (% as fed
basis). ................................................................................................................. 63
Table 5.4 Nutrient analyses of Atlantic salmon smolt experimental diets (% as
fed basis). ........................................................................................................... 68
Table 5.5 The number of mortalities of Atlantic salmon due to fungal infection in
each dietary treatment at different salinity during the first 5 weeks of the
experiment. ......................................................................................................... 69
ix
Table 5.6 The growth performance, viscera index, hepatosomatic index, and
protein retention ratio (mean/fish) of Atlantic salmon smolts in freshwater
fed four experimental diets for 16 weeks. .......................................................... 70
Table 5.7 The carcass composition (crude protein, crude lipid, ash and moisture)
of Atlantic salmon smolts fed four experimental diets at initial day, week 8
and week 16 (% on wet weight basis). ............................................................... 73
Table 5.8 The quantitative measurements of villi and intestine wall in hindgut of
Atlantic salmon smolts fed various experimental diets for 16 weeks. ............... 75
Table 5.9 The scores of histological parameters (sub-mucosa, supranuclear
vacuoles, goblet cells, and lamina propria) in hindgut of Atlantic salmon
smolts fed four experimental diets for 16 weeks. .............................................. 76

x
List of Figures
Figure 2.1 Chemical structure of glucocamelinin (Kjaer et al., 1956; Schuster and
Friedt, 1998). ........................................................................................................ 8
Figure 2.2 The general structure of glucosinolates and their degradation products
hydrolyzed by myrosinase (Rask et al., 2000). .................................................... 9
Figure 2.3 Diagram of the gastrointestinal tract in Atlantic salmon. ......................... 16
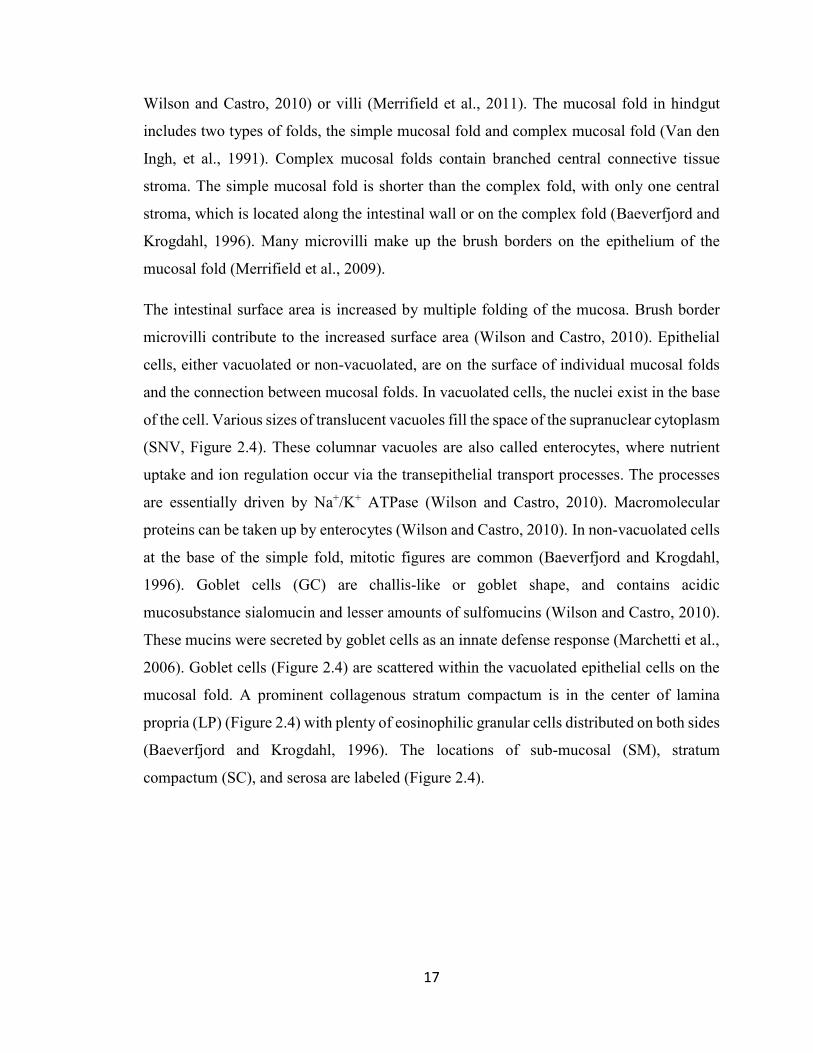
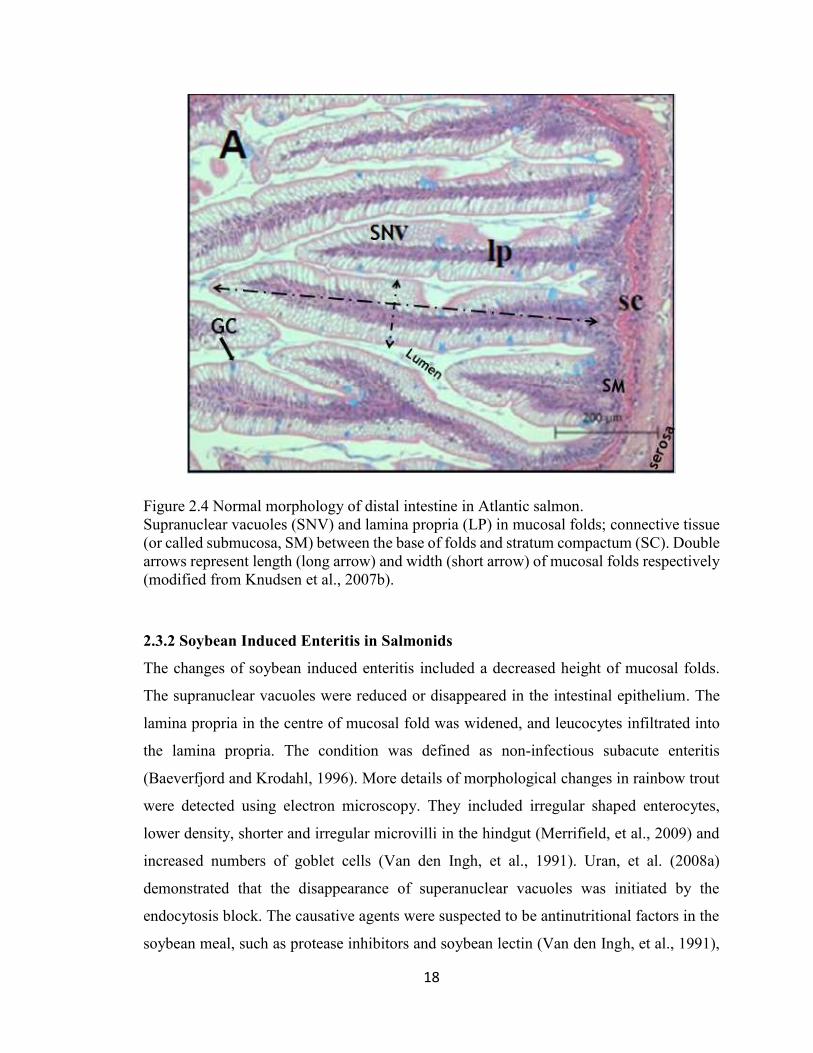
Figure 2.4 Normal morphology of distal intestine in Atlantic salmon. ..................... 18
Figure 3.1 Morphology of the hindgut in Atlantic salmon parr fed the control diet
(X200).. .............................................................................................................. 30
Figure 5.1 The diagram of rearing tanks in six blocks............................................... 64
Figure 5.2 The relationship between final mean body weight of Atlantic salmon
smolts and dietary treatments were compared with each of the six blocks at
week 16 (panel variable: block). ........................................................................ 71
Figure 5.3 The relationship between feed consumption of Atlantic salmon smolts
and dietary treatments were compared with each of the six blocks at week 16
(panel variable: block). ...................................................................................... 71
Figure 5.4 An example of abnormal villi in the hindgut of Atlantic salmon smolts
in freshwater fed various experimental diets.. ................................................... 74
xi
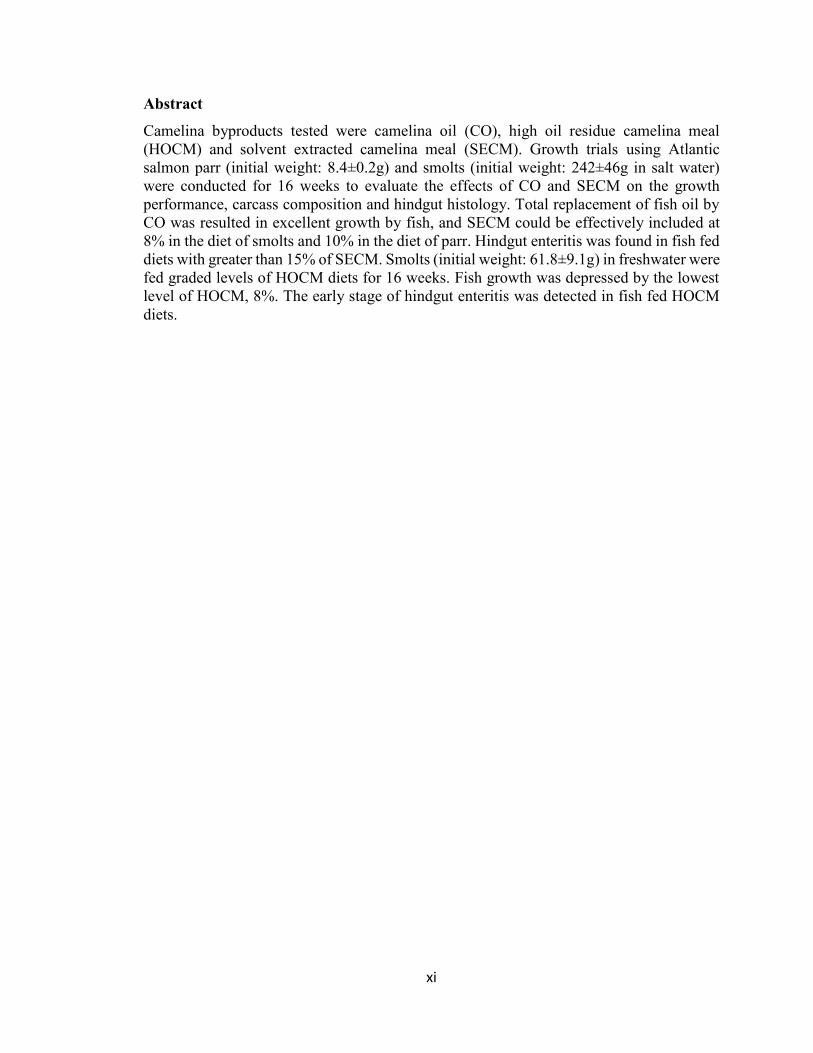
Abstract
Camelina byproducts tested were camelina oil (CO), high oil residue camelina meal
(HOCM) and solvent extracted camelina meal (SECM). Growth trials using Atlantic
salmon parr (initial weight: 8.4±0.2g) and smolts (initial weight: 242±46g in salt water)
were conducted for 16 weeks to evaluate the effects of CO and SECM on the growth
performance, carcass composition and hindgut histology. Total replacement of fish oil by
CO was resulted in excellent growth by fish, and SECM could be effectively included at
8% in the diet of smolts and 10% in the diet of parr. Hindgut enteritis was found in fish fed
diets with greater than 15% of SECM. Smolts (initial weight: 61.8±9.1g) in freshwater were
fed graded levels of HOCM diets for 16 weeks. Fish growth was depressed by the lowest
level of HOCM, 8%. The early stage of hindgut enteritis was detected in fish fed HOCM
diets.
xii
List of Abbreviations Used
ALA α-linolenic acid
ANOVA Analysis of variance
CF Condition factor
CO Camelina oil
CPC Camelina protein concentrate
CS Compound symmetry
DHA Docosahexaenoic acid
EPA Eicosapentaenoic acid
FC Feed consumption
FCR Feed conversion ratio
FM Fish meal
GC Goblet cell
HIS Hepatosomatic index
HOCM High oil residue camelina meal
LNA Linolenic acid
LP Lamina propria
MF Mucosal fold
MUN Memorial University of Newfoundland
NSP Non-starch polysaccharides
NRC National Research Council
PRR Protein retention ratio
xiii
PUFA Polyunsaturated fatty acid
SC Stratum compactum
SD Standard deviation
SECM Solvent extracted camelina meal
SEFM Solvent extracted fish meal
SGR Specific growth rate
SM Sub-mucosal
SNV Supranuclear vacuoles
TMS Tricaine methane sulfonate
VI Viscera index
WG Weight gain
xiv
Acknowledgements
I would like to express the deepest appreciation to my supervisor Dr. Derek Anderson for
his guidance and support during the last three years. I would like to acknowledge the advice
and guidance given by my committee members Dr. Jim Duston and Dr. Santosh Lall. Many
thanks to Paul MacIsaac and Scott Jeffrey for their technical support during the growth
trials. I would like to thank Michael McConkey for the help in feed mill, thank Margie
Hartling for supervising me on the nutrient analyses, and thanks to Cara Kirkpatrick, Janice
MacIsaac and Marilyn Roberts for answering lots of questions and the help on ordering of
experimental consumables and shipping of experimental samples. I would like to appreciate
the students in the aquaculture program for their help during sample collections. Many
thanks to the camelina group at the Ocean Sciences Centre, Memorial University of
Newfoundland for providing fish tissue samples. Thanks to the financial support from
GenomeAtlantic. Last but not least, my grateful thanks to my parents, Chang Hui Ye and
Bing Wang, who gave me great support and encouragement.

1
Chapter 1 : Introduction
1.1 Atlantic Salmon Production
Aquaculture is growing and plays an important role in providing protein food to the world.
World aquaculture production has increased from 41.9 to 63.6 million tonnes between 2004
and 2011(FAO, 2010; 2012). Atlantic salmon is a species with high quality protein and fat.
The production of Atlantic salmon reached 2.0 million tonnes in 2012. Norway and Chile
are the two largest Atlantic salmon producers in the world, contributing 1.2 and 0.4 million
tonnes respectively (Global Aquaculture Production, FishStat, data.fao.org/dataset-data-
filter, accessed on June 17, 2014). By the 1990s, the production of Atlantic salmon on the
west and east coasts of Canada grew rapidly, which contributed to a 40% increase in
Canadian finfish aquaculture (Olin et al., 2010). British Columbia and New Brunswick
shared 61% and 33% of Canadian salmon farming respectively, Nova Scotia and
Newfoundland and Labrador contributed 6% in total (Olin et al, 2010). During 2002 to
2012, the production of Atlantic salmon in Canada remained stable around 0.1 million
tonnes (Global Aquaculture Production, FishStat, data.fao.org/dataset-data-filter, accessed
on June 17, 2014).
1.2 Fish Meal and Fish Oil
Fish meal and fish oil are important protein and fat sources in diets for Atlantic salmon.
Salmon consumed 36.6% of global fish oil usage in compounded aquafeeds, and consumed
13.7% of global fish meal production in compounded aquafeeds in 2008 (FAO, 2012). The
expansion of farmed Atlantic salmon has increased the demand for fish meal and fish oil
dramatically in recent years. Other aquaculture and terrestrial species production shared a
part of fish meal and fish oil consumed. An estimated 31.7 million tonnes of fish and
crustaceans, accounting for 46.1% of world aquaculture production, were fed as
manufactured aquafeeds in 2008 (FAO, 2012). These aquafeeds utilized various levels of
fish meal and fish oil. In 2008, 20.8 million tonnes of captured fish was used for fish meal
and fish oil (FAO, 2010). These two ingredients are mainly processed from small pelagic
species, particular peruvian anchovy (Engraulis ringens) (FAO, 2010). The capture fisheries
production was unchanged in the world, around 90 million tonnes during the years from
2004 to 2011 (FAO, 2010, 2012). In general, a decreasing production trend of fish meal
2
(7.48 to 5.74 million tonnes) and fish oil (1.5 to 1.07 million tonnes) occurred between
1994 and 2009 due to the reduction in captured anchovy (Tacon et al., 2011; FAO, 2012).
Fish meal and fish oil productions were 6.10 and 0.98 million tonnes respectively between
2010 and 2012 (FAO, 2014).Thus, this accounted for the increase of fish meal and fish oil
prices in the last 20 years.
The price trends of fish meal and fish oil in Germany and Netherlands are similar to the
world trend. Fish meal price has jumped from 300 USD/tonne in 1986 to about 1500
USD/tonne in January 2014, the highest price was 1919 USD/tonne in 2013. By contrast,
the soybean meal price was about 500 US$/tonne in 2014 (FAO, 2014). Meanwhile, an
increase in price of fish oil was seen in Netherlands, from 300 USD/tonne in 1986 to 1600
USD/tonne January 2014, the highest price was 2400 USD/tonne in 2013. Soybean oil was
about 1000 USD/tonnes in 2014 (FAO, 2014). Fish meal usage did not grow with the
expansion of aquaculture production, because of the limited supply of capture fish and
increasing use of protein substitutes (FAO, 2012). On the contrary, it decreased from 2005
to 2008, and was predicted to be further decline to 3.63 million tonnes by 2015 (FAO,
2012). These changes were reflected in the inclusion levels of fish meal in compound
aquafeeds. Fish meal inclusion level in feed will decrease by 10-22%, while fish oil levels
will drop by 0.5-7% for carnivorous fish and crustacean species in the next decade (FAO,
2012). For salmon, the fish meal inclusion level will be reduced from 25% in 2008 to 12%
in 2020 (FAO, 2012). The average level of fish meal in the salmon feed has been reduced
to 18.1% in 2013 (EWOS Reporting Centre). Fish oil use is predicted to be reduced to 6%
in salmonid diets by 2020 (Tacon and Metian, 2008). It was 9.8% in the salmon feed in
2013 (EWOS Reporting Centre). Therefore, there will be more space in diet formulation
for alternative protein and lipid sources in the salmon feed.
1.3 Alternative Ingredients
Currently, the available non-fish meal protein sources include soybean protein concentrate,
pea protein concentrate, maize gluten (EWOS Reporting Centre, 2013), soybean meal,
wheat gluten meal, corn gluten meal, canola meal, cottonseed meal, sunflower seed meal,
peanut meal, mustard oil cake, lupine kernel meal, and broad bean meal, meat by-product
meals, poultry by-product meal, hydrolysed feather meal, and blood meal (FAO, 2012).
3
Canola oil, soybean oil, palm oil, and poultry oil can be used as non-fish oil lipid sources
(FAO, 2012). The levels of these ingredients for salmon diets were recommended by Tacon
et al. (2011) to be: poultry by-product meal (10-30%), hydrolysed feather meal (5-12%),
blood meal (1-8%), meat meal (10-30%), poultry oil (1-15%), soybean meal (3-12%),
wheat gluten meal (2-10%), sunflower seed meal (5-9%), corn gluten meal (10-40%),
canola meal (3-10%), lupine kernel meal (5-15%), faba bean meal (5%), field pea meal
(3%), canola oil (5-15%), soybean oil (5-10%). Burr et al. (2013) recommended 10%
canola protein concentrate in salmon diet. The de-phytate canola protein concentrate could
replace 75% fish meal protein in rainbow trout diet (Thiessen et al., 2004). Soy protein
concentrate has been used in commercial salmon feed at 15.7% (EWOS reporting
centre,2013).
Camelina sativa belongs to the Cruciferae (Brassicaceae) family. It is called false flax and
gold of pleasure (Downey, 1971). The extracted oil has been re-investigated in recent years
because of its high level of omega-3 fatty acid linolenic acid (38%) (Crowley and Frohlich,
1998). The camelina meal contains about 33.9% crude protein, which is similar to canola
meal (32.9-38%) and full fat soybean meal (35.2%) (NRC, 2011), making it a potential
protein source in aquafeeds. However, camelina has not been approved as an animal feed
ingredient in Canada. Very little is known regarding the effects of feeding camelina to
Atlantic salmon. The current research investigated graded levels of camelina byproducts in
practical diets fed to Atlantic salmon at different life stages. The byproducts of camelina
seed tested included high oil residue meal, solvent extracted meal, and camelina oil. In
addition, two different genetic samples of camelina, Calena and 007 line, contain higher oil
content, oil yield, protein yield and polyunsaturated fatty acids (Jiang et al., 2014), thus
these two sources of Camelina sativa were used. Calena was used in Chapter 3 and 4, while
the 007 line was used in Chapter 5. Both Calena cultivar and 007 line were grown at
Lyndhurst Farms Ltd, Canning, Nova Scotia, Canada.
4
Chapter 2 : Literature Review
2.1 Camelina
2.1.1 History of the Crop
Camelina is an ancient oil crop. However, it was not successful as a major crop in the
Middle Ages in eastern and northern Europe (Robinson, 1987). During the Middle Ages,
camelina was cultured in Denmark, France, Belgium, Holland, the Balkan region and
Russia (reviewed by Zubr, 1997). Most camelina grown in Europe and Asia since 1934 is
a variety of Camelina sativa Crantz (Plessers et al., 1962). The development of camelina
was replaced by canola during the 1950s due to the difficulty and high cost of oil
hydrogenation (Crowley and Frochlich, 1998). There were still small areas of camelina
production in Europe in 1971, aiming to replace winter canola in the cold months (Downey,
1971). In recent decades, interest in camelina has revived due to its high content of omega-
3 fatty acids (Putnam, et al., 1993; Francis and Campbell, 2003).
Camelina sativa seed was not only desirable for oil production, but the residue cake after
oil pressing is a potential feed ingredient. Camelina oil (CO) can be extracted at an
industrial scale by crushing and pressing (Zubr, 1997). The residue after oil extraction was
referred to as oil cake with about 10% residual oil (Zubr, 1997). This high oil residue meal
(HOCM) was cited in the Nutrient Requirement of Shrimp and Fish (NRC, 2011). The use
of solvent extracted camelina meal (SECM) was investigated by Korsrud and Bell in 1967.
Ground camelina seed was mixed with petroleum ether at 35-58°C for 24 hours (Korsrud
and Bell, 1967). The production of camelina protein concentrate (CPC) can be feasible
using an appropriate procedure like that used to make canola protein concentrate, which
contains higher protein and less antinutritional factors, such as glucosinolates and phytate
(Tzeng, et al., 1990). Camelina byproducts include CO, HOCM, SECM, and CPC.
Camelina has not been approved as feed ingredients in Canada. The results from the current
study will be a portion of application materials submitted to Canadian Food Inspection
Agency as part of the approval process.
2.1.2 Fatty Acids in Camelina Oil
The oil content and fatty acid composition in camelina seed is affected by the varieties of
Camelina sativa, the environmental conditions in different countries, and the seeding
5
season (Table 2.1). Genetics accounted for most to the variation in fatty acid composition
(Francis and Campbell, 2003; Gugel and Falk, 2006). The oil content ranged from 31.4-43%
among all studies (Table 2.1). The ranges of oleic and linoleic from American studies were
greater than those from Canada, Australia and Europe, but the range of linolenic acid
(omega-3 fatty acid) was lower (Table 2.1). Camelina oil (calena cultivar) processed in
Nova Scotia contained 35.6% α-linolenic acid and 18.4% linoleic acid (Hixson et al., 2013).
The α-linolenic acid and linoleic acid in camelina oil are higher than that in canola oil, 11%
linolenic acid and 21% linoleic acid (Canola Council of Canada, accessed on June 17, 2014).
Erucic acid is toxic to animals’ growth and heart health (Sauer and Kramer, 1983; Corner,
1983). Low level erucic acid (0.2% vs. 3.7% as diet basis) reduced the negative impact on
feed consumption, egg weight and egg production of hens (Vogtmann et al., 1974). High
level of erucic acid (50% in rapeseed oil) had negative effects on coho salmon fed diets
containing 6% and 12% rapeseed oil (Hendricks, 2002).
2.1.3 Protein in Camelina Meal
High oil residue camelina (HOCM) contains 33.9% crude protein and 12% crude lipid
(NRC, 2011). The protein content in solvent extracted camelina meal (SECM) at Fort
Vermilion, Alberta was 46.9% and Morden, Manitoba was 45.1% (Korsrud et al., 1978). It
was similar to the 42.5% on a fat free dry matter basis in Europe reported by Zubr (2003
a). The highest level of crude protein reported was 49.6% in fat extracted meal (Miller et
al., 1962). For essential amino acids, SECM had similar levels of arginine, histidine,
phenylalanine, threonine and valine to fish meals, but was lower for isoleucine, leucine,
lysine, and methionine (Table 2.2). The amino acid profile was similar among HOCM,
SECM and solvent extracted canola meal (Table 2.2).
6
Table 2.1 The oil content (% in seed) and primary fatty acid composition (% total fatty acids) in Camelina sativa seed.
Locations
Australia1 Canada2 Canada3 USA4 USA5 USA6 Europe7
Seeding season Winter - Fall Spring/Fall Spring Spring Summer
number of cultivar 32 10 19 1 10 8 3
Oil content 32-39 36.7 38-43 32-39 31.4 35.5 -
Palmitic acid C 16:0 - 4.5-5.5 4.6-5.2 6 6.1-8.4 5.7-6.6 5.3-5.6
Stearic acid C 18:0 - 2.0-2.5 2.2-2.5 2.8 1.4-3.0 2.6-3.5 2.3-2.7
Behenic acid C 22:0 - 1.5-2.0 - 0.4 - - 0.2-0.3
Palmitoleic acid C 16:1 - - trace 0.2 - - 0.1
Oleic acid C 18:1 12.4-18.7 13.0-16.0 12.8-14.7 17.5 14.1-17.1 14.8-19.4 14.7-15.0
Linoleic acid C 18:2 15.1-22.5 15.5-17.0 16.3-17.2 18.7 20.0-24.0 19.0-22.3 15.1-15.4
Linolenic acid C 18:3 31.2-36.9 34.5-38 36.2-39.4 27.9 30.9-34.5 27.1-31.1 36.6-37.1
Eicosenoic acid C 20:1 13.5-16.7 16.5-18 14.0-15.5 16.4 12.3-12.6 13.6-14.7 15.1-15.8
Eicosadienoic acid C20:2 - 2.0-2.5 1.8-2.4 2 - - 1.7-2.0
Erucic acid C 22:1 2.5-4.2 3.5-4.5 2.5-3.1 3.5 0-3.6 3.2-4.0 2.8-2.9
- not reported.
References:
1. Francis and Campbell, 2003
2. Plessers et al., 1962
3. Gugel and Falk, 2006
4. Robinson, 1987
5. trial 1. Budin et al., 1995
6. trial 2. Budin et al., 1995
7. Zubr and Matthaus, 2002
6
7
Table 2.2 Composition of the amino acid in camelina byproducts and two types of fish meal.
HOCMa
Solvent
extracted
camelina meal
Solvent
extracted
canola
meal
Fish meal
NRC
2011
Zubrb Millerc Bell and
Keithd Menhadene Anchovye
Crude protein
(%) 33.9
42.5 49.6 41.9 67.9 70.4
Amino acids
Alanine - 4.61 3.89 4.4 6.07 6.93
Arginine 7.73 8.15 7.65 6.21 7.73 6.48
Aspartic acid - 8.71 8.02 7.74 12.56 11.93
Cysteine 1.95 2.12 2.48 2.87 0.93 0.17
Glutamine - 16.4 16.74 19.07 11.11 11.78
Glycine - 5.44 4.66 5.21 8.11 6.97
Histidine 2.21 2.6 2.22 3.68 2.16 2.64
Isoleucine 3.54 3.96 3.68 4.25 5.35 5.61
Leucine 6.28 6.63 6.19 7.26 8.29 8.92
Lysine 4.54 4.95 4.19 5.95 9.04 8.74
Methionine 1.80 1.72 1.79 2.05 3.47 3.03
Phenylalanine 4.13 4.19 3.92 4.09 4.33 4.76
Proline - 5.09 5.09 6 6.57 5.21
Serine - 5.04 3.58 4.66 4.71 3.79
Threonine 3.83 4.25 3.65 4.54 4.73 3.95
Tryptophan 1.24 1.15 - 1.27 0.64 0.37
Tyrosine - 3.04 2.64 3.03 3.6 3.49
Valine 4.75 5.42 5.01 5.47 6.28 5.84
a. HOCM: High oil residue camelina meal
b. Zubr, 2003b.
c. Miller et al., 1962.
d. Bell and Keith, 1991. Mean of seven commercial canola meals.
e. Anderson et al., 1995.
2.1.4 Glucosinolates
Glucosinolates exist widely in the plants of the Brassicaceae family (Francis et al., 2001).
More than 130 glucosinolates have been identified, which are divided into three classes,
aliphatic glucosinolates, aromatic glucosinolates and indole glucosinolates (Redovnikovic
8
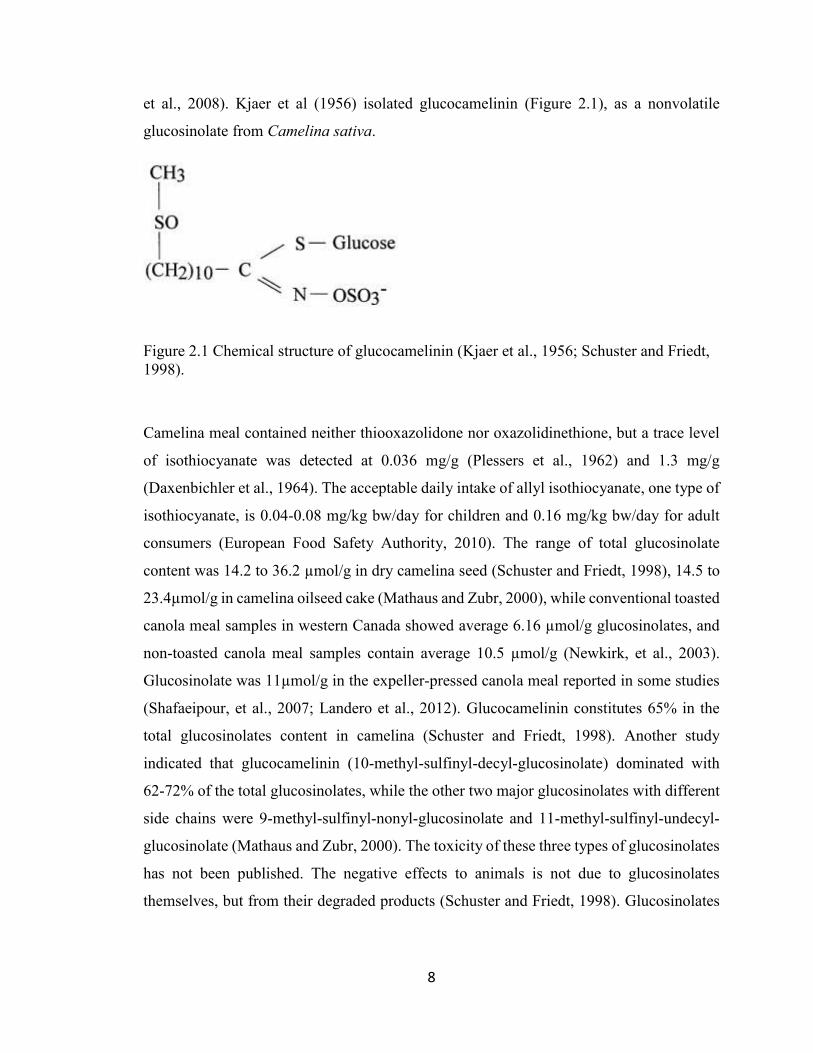
et al., 2008). Kjaer et al (1956) isolated glucocamelinin (Figure 2.1), as a nonvolatile
glucosinolate from Camelina sativa.
Figure 2.1 Chemical structure of glucocamelinin (Kjaer et al., 1956; Schuster and Friedt,
1998).
Camelina meal contained neither thiooxazolidone nor oxazolidinethione, but a trace level
of isothiocyanate was detected at 0.036 mg/g (Plessers et al., 1962) and 1.3 mg/g
(Daxenbichler et al., 1964). The acceptable daily intake of allyl isothiocyanate, one type of
isothiocyanate, is 0.04-0.08 mg/kg bw/day for children and 0.16 mg/kg bw/day for adult
consumers (European Food Safety Authority, 2010). The range of total glucosinolate
content was 14.2 to 36.2 µmol/g in dry camelina seed (Schuster and Friedt, 1998), 14.5 to
23.4µmol/g in camelina oilseed cake (Mathaus and Zubr, 2000), while conventional toasted
canola meal samples in western Canada showed average 6.16 µmol/g glucosinolates, and
non-toasted canola meal samples contain average 10.5 µmol/g (Newkirk, et al., 2003).
Glucosinolate was 11µmol/g in the expeller-pressed canola meal reported in some studies
(Shafaeipour, et al., 2007; Landero et al., 2012). Glucocamelinin constitutes 65% in the
total glucosinolates content in camelina (Schuster and Friedt, 1998). Another study
indicated that glucocamelinin (10-methyl-sulfinyl-decyl-glucosinolate) dominated with
62-72% of the total glucosinolates, while the other two major glucosinolates with different
side chains were 9-methyl-sulfinyl-nonyl-glucosinolate and 11-methyl-sulfinyl-undecyl-
glucosinolate (Mathaus and Zubr, 2000). The toxicity of these three types of glucosinolates
has not been published. The negative effects to animals is not due to glucosinolates
themselves, but from their degraded products (Schuster and Friedt, 1998). Glucosinolates
9
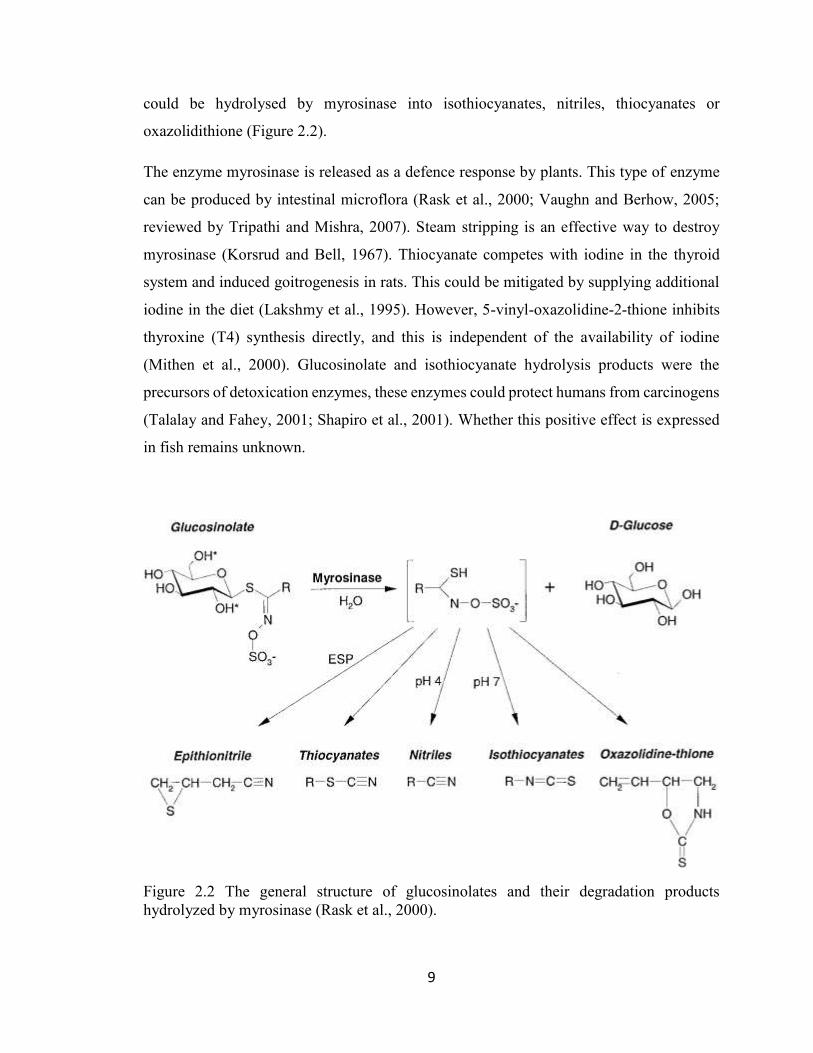
could be hydrolysed by myrosinase into isothiocyanates, nitriles, thiocyanates or
oxazolidithione (Figure 2.2).
The enzyme myrosinase is released as a defence response by plants. This type of enzyme
can be produced by intestinal microflora (Rask et al., 2000; Vaughn and Berhow, 2005;
reviewed by Tripathi and Mishra, 2007). Steam stripping is an effective way to destroy
myrosinase (Korsrud and Bell, 1967). Thiocyanate competes with iodine in the thyroid
system and induced goitrogenesis in rats. This could be mitigated by supplying additional
iodine in the diet (Lakshmy et al., 1995). However, 5-vinyl-oxazolidine-2-thione inhibits
thyroxine (T4) synthesis directly, and this is independent of the availability of iodine
(Mithen et al., 2000). Glucosinolate and isothiocyanate hydrolysis products were the
precursors of detoxication enzymes, these enzymes could protect humans from carcinogens
(Talalay and Fahey, 2001; Shapiro et al., 2001). Whether this positive effect is expressed
in fish remains unknown.
Figure 2.2 The general structure of glucosinolates and their degradation products
hydrolyzed by myrosinase (Rask et al., 2000).
10
Palatability was improved when the glucosinolate level was reduced to 6 µmol/g in calf
and dairy cow diets, 3 µmol/g in pig grower diets or 4.5 µmol/g in finisher diets (Mawson
et al., 1993). The bitterness was due to the glucosinolate breakdown products,
isothiocyanates (Mithen et al., 2000). Growth and feed intake reduction in rats fed SECM
above 10% was caused by volatile isothiocyanates and non-volatile compounds. These
volatile compounds could be reduced by two hours steam stripping at 110 °C (Korsrud and
Bell, 1967). The total glucosinolates in oil extracted rapeseed meal was reduced from 41 to
5 µmol/g via a thermal treatment (Burel et al., 2000). Growth (65.2 g vs. 90.6g) and feed
efficiency (0.68 vs. 1) were reduced severely in rainbow trout fed a diet containing
glucosinolates up to 19.3 µmol/g. By comparison, slight reduction of final weight was seen
at 1.4 µmol/g diet compared to control (82.5 g vs. 90.6 g respectively) (Burel et al., 2000).
The suppression of thyroid function was observed (Burel et al., 2000; Burel et al., 2001).
Since other antinutritional factors in rapeseed may depress growth at the same time,
glucosinolates at 1.4 µmol/g in the diet was regarded as a safe upper limit for rainbow trout
(Burel et al., 2000; NRC, 2011). The major components of glucosinolate degradation in
rapeseed meals varied dependent on the oil extraction and the dgree of thermal treatment.
The oil extracted rapeseed meal with thermal treatment contained progoitrine (2.2 µmol/g)
and gluconapine (1.2 µmol/g) in major amounts. Another type of rapeseed meal had high
levels of progoitrine (17.2 µmol/g), gluconapine (6.9 µmol/g), glucobrassicanapine (2.2
µmol/g), sinalbine (4.5 µmol/g) and glucobrassicine (7.6 µmol/g) (Burel et al., 2000).
Camelina seeds, by comparison to rapeseed, contain different types of glucosinolates
(Mathaus and Zubr, 2000). Other antinutritional factors (described in next section) in
camelina should not be ignored. Therefore, a safe upper limit of 1.4 µmol/g glucosinolates
in the diet may not be appropriate for Atlantic salmon fed camelina byproducts.
2.1.5 Other Antinutritional Factors in Camelina Seed/Meal
Mean values in Camelina seed samples were 2.2 mg/g tannins, 19 mg/g phytic acid and 2
mg/g sinapine (Matthaus, 1997). Both sinapine (1.7-4.2 mg/g vs. 7 mg/g) and condensed
tannins (1.0-2.4 mg/g vs. 3.84 mg/g) measured in camelina oilseed cake were lower than
rapeseed meal, but phytic acid in camelina oilseed cack was higher than rapeseed (21.9-
30.1% vs. 17.4 mg/g) (Matthaus and Zubr, 2000). There was 11.8-26.6 TUI (trypsin units
inhibited)/mg of trypsin inhibitor activity in seed, although it was much lower than raw
11
soybean with 110.7 TUI/mg (Budin et al., 1995). Camelina seed contained 6.7% mucilage
(Zubr, 2010), which should be higher in HOCM and SECM.
Tannins include hydrolysable tannins and condensed tannins (Stobiecki and Makkar, 2004)
that can reduce digestibility by forming less digestible complexes with proteins, starch and
digestive enzymes (Reed, 1995). In an in vitro study, the protease, lipase and amylase
activity in Indian major carps (body weight: 10-17 g) were inhibited by the tannin (12.5-
200 μg) extracted from Pistia (Mandal and Ghosh, 2010). The inhibited growth of common
carp (Cyprinus carpio L.) was partially associated to the 0.57-1.14% tannins in the diet
(Hossain and Jauncey, 1989). It was recommended to use dehulled seeds with lower tannins
(NRC, 2011).
Sinapine has a bitter taste, and subsequently reduced the palatability of feed (McCurdy and
March, 1992). The individual effect of sinapine on salmonids was difficult to address due
to accompanying factors, such as glucosinolates and phytate (McCurdy and March, 1992).
Phytic acid (phytate) can disrupt mineral utilization (Francis et al., 2001). The digestibility
of zinc and magnesium decreased as phytic acid increased from 1 g/kg to 20.7g/kg in the
Atlantic salmon diet (Denstadli et al., 2006). Atlantic salmon parr can tolerate phytic acid
at 4.7-10.0 g/kg in the diet without compromising either growth or feed intake (Denstadli
et al., 2006). In the same experiment, phytic acid diets did not alter the morphology in the
distal intestine (Denstadli et al., 2006). The growth and appetite of juvenile chinook salmon
(Oncorhynchus tshawytscha) were reduced by high ratio of calcium to phytic acid (48-51
to 1.62 g/kg) (Richardson et al., 1985). Phytase is an enzyme that can release phosphorus
from phytate and enhance the availability of other minerals and trace elements (Cao et al.,
2007).
Mucilage is a type of non-starch polysaccharides (NSP) with high water solubility, and
forms a gel (Mazza and Biliaderis, 1989). Thus, mucilage may have a similar manner to
guar gum that slows down the food passage rate in the gastro-intestinal tract (Storebakken,
1985). The apparent digestibility of protein and fat and feed intake in rainbow trout was
reduced by guar gum, and moisture content increased in the faeces (Storebakken, 1985).
The soluble NSP was suspected to absorb water and increase the viscosity of digesta in the

12
intestine, subsequently blocking the contact with digestive enzymes (Francis et al., 2001).
Mucilage in the flax seed coat could be removed from flax seed meal by water or
polysaccharide-degrading enzymes (Wanasundara and Shahidi, 1997). Its viscosity can be
reduced in NaCl solutions (Mazza and Biliaderis, 1989). However, no literature was found
specifically discussing the mucilage from camelina.
2.1.6 Special Components
Camelina seed contained higher levels of Vitamin E at 17.4 mg/100g seed compared to
canola (9.27 mg/100g), flax (12.74 mg/100g), soybean (10.99 mg/100g), and sunflower
(13.29 mg/100g) (Budin et al, 1995). Vitamin E had positive effects on the stability of
camelina oil (Eidhin et al., 2003). This vitamin E will be in the CO, and in the oil residue
in HOCM and SECM.
2.1.7 Experiments of Camelina Byproducts as Feed Ingredients
Use of camelina as a feed ingredient has been reported in mammals, poultry and fish.
Camelina seed up to 15% in the diet did not affect the growth and carcass composition of
rabbits (Peiretti et al., 2007a). Camelina seed inclusion ranging from 10 to 15% increased
the digestibility of organic matter, dry matter, nitrogen-free extract, ether extract and gross
energy in rabbits (Peiretti et al., 2007b). In rats, camelina oil with a high level of α-linolenic
acid lowered the high levels of triglyceride and cholesterol in liver and plasma induced by
high fat diet, and relieve the symptoms of dyslipoproteinemia (Deng et al., 2011).
DHA levels in hen eggs increased as camelina meal percentage increased in feed, but the
camelina meal level recommended was not higher than 10% due to the increased lipid
oxidation in the eggs (Cherian et al., 2009). Ten percent camelina meal in broiler diets
provided similar growth compared to the control group, with n-3 fatty acid composition
enhanced in meat, liver and adipose tissues (Aziza et al., 2010). Five percent camelina meal
inclusion in diet did not reduce the growth of turkeys. Levels above 5% should be used
with caution (Frame et al., 2007). Other vegetable oils in turkey diets could be substituted
with camelina oil (Frame et al., 2007).
Similar specific growth rates were observed in rainbow trout fed 15% full fat camelina seed
cake diet compared to fish fed the control diet (Anderson et al., 2008). Diet containing 16%
13
high fat residue camelina meal (HOCM) did not affect weight gain, feed consumption, feed
conversion ratio, hepatosomatic index (HSI) and carcass composition of rainbow trout (Pan
et al., 2011). Higher level of HOCM (20%) did not inhibit the growth of rainbow trout
(Bullerweel and Anderson, 2012). Inclusion levels of camelina meal greater than 20% in
the diet have not been reported. For canola/rapeseed meal, a level up to 30% can either
inhibit or not inhibit growth of rainbow trout, but 50% inclusion level was not acceptable
(Burel et al., 2000; 2001; Shafaeipour et al., 2007; Collins et al., 2012). The conflicting
results might be due to different fish size and different content of antinutritional factors in
the diet.
Atlantic cod (Gadus morhua) fed up to 80% (Hixson et al., 2013) or 100% (Morais, et al.,
2012) replacement of fish oil with CO diets exhibited similar growth performance to the
control diets. Both studies found significant increases in 18:2n-6 (LNA) and 18:3n-3 (ALA)
levels, and a decrease in 20:5n-3 (EPA) and the ratio of n-3/n-6 polyunsaturated fatty acid
(PUFA) in liver and muscle (Morais et al., 2012; Hixson et al., 2013). This trend was also
found in cod intestine (Morais et al., 2012). Complete substitution of fish oil with CO in
diets was acceptable for rainbow trout, but the fatty acid composition in muscle, skin, and
viscera fat shifted in a similar manner to Atlantic cod (Hixson et al., 2014a). Although the
fatty acid profile changed in Atlantic salmon, the sensory quality (texture, odour, and
appearance) of salmon fillets was similar between fish fed fish oil and 100% CO diets
(Hixson et al., 2014b). Sunflower oil, rapeseed/canola oil, and oil blend of rapeseed, palm
and camelina oil at 5:3:2 did not disrupt fish growth, but tended to decrease EPA, DHA
and the ratio of n-3/n-6 PUFA, and increase LNA and ALA in the fatty acid profiles in
various fish tissues (Bell et al., 2003; Bransden et al., 2003; Drew et al., 2007; Bell et al.,
2010). The reduced EPA and DHA in fish tissues were due to the lack of EPA and DHA in
vegetable oils. Salmonid fish can convert 18:3n-3 to DHA (Tocher et al., 1997; Bell et al.
2001). Hixson et al. (2014a) found that ALA in camelina oil contributed 27% of the DHA
in rainbow trout. but was not efficient enough to compensate for the depletion of DHA in
tissues when replacing fish oil with vegetable oil. Atlantic salmon can convert 25% of ALA
to long chain polyunsaturated fatty acids (Hixson et al., 2014c).
14
The weight gain of Atlantic salmon post-smolts (Salmo salar) was unaffected by 100% CO
as the only lipid source, but was compromised by feeding diets containing 10% solvent
extracted camelina meal (SECM) or a combination of SECM and CO (Hixson et al., 2014b).
The levels of LNA and ALA increased, and the ratio of n-3/n-6 PUFA decreased in both
white and dark muscle tissues, when salmon were fed diets containing 100% CO. The study
in Hixson et al. (2014b) and the study in Chapter 4 were based on the same growth
experiment, but the diets containing graded levels of SECM were not published by Hixson
et al. (2014b). The study in Chapter 4 evaluated all the test diets, and included carcarss
analysis and evaluation of hindgut histology as novel parts. The optimal levels of camelina
byproducts fed to Atlantic salmon at different life stages remains unknown. No literature
indicated the effects of camelina byproducts on the carcass composition and hindgut
histology of Atlantic salmon.
2.2 Life Stages of Atlantic Salmon: Pre-smolt, Smolting and Post-smolt
Smoltification occurs in freshwater when Atlantic salmon parr are ready to migrate to
seawater, which is accompanied with the changes in morphology, physiology and behavior
(Stefansson et al., 2008). This process can be divided into three stages: pre-smolt, smolting
and post-smolt. Pre-smolts (parr) exhibit visible parr-marks and live in freshwater. The
behavior of parr is territorial, bottom-dwelling, and swim against the water current to keep
position. Smolts have dark fin margins, loose silvery scales and disappearance of parr
marks, and adapt to the seawater. Post-smolts complete smoltification and can tolerate full-
strength seawater. The behavior of smolts is pelagic and schooling (Handeland and
Stefansson, 2002; Stefansson et al., 2008).
In freshwater, fish tend to lose ions (predominantly Na+ and Cl-) passively, because they
are faced with passive osmotic influx of water. Fish exhibit active ions uptake in the gills,
low drinking rate and high production of urine (reviewed by Varsamos et al., 2005). The
development of a hypoosmoregulation mechanism in Atlantic salmon occurs and the Na+,
K+ -ATPase in the chloride cells of the gill increases, when salmon are smolting
(McCormick and Saunders, 1987; Duston, 1994). To overcome the dehydration and ions
invasion in the seawater, fish increase the drinking rate, actively absorb ions along the

15
digestive tract accompanying with an osmotic intake of water, actively excrete ions via the
gills, and produce a limited amount of urine (reviewed by Varsamos et al., 2005).
The plasma thyroid hormones in smolts increased compared to parr (McCormick et al.,
2007). The lipid and glycogen content in the carcass decreased, while the protein content
did not change during wild Atlantic salmon migrating from the river to the marine
environment (Stefansson et al., 2003). It indicated that smolts have low energy reserves
during migration, while post-smolts maintains a positive protein balance during the early
marine phase, and the protein contributed to the somatic growth of post-smolts (Stefansson
et al., 2003). Atlantic salmon post-smolts in seawater tended to retain protein content in
fish body and increased dry matter and lipid content, while parr showed a growing trend of
protein, lipid and dry matter in fish body (Shearer, et al., 1994a). A temporary peak of
biosynthesis of highly unsaturated fatty acids occurred at the point of seawater transfer
(Tocher et al., 2003). Parr exhibited increasing fluid transport rate and Na+, K+ -ATPase
activity in the anterior intestine, but decreasing paracellular permeability in the posterior
intestine during parr-smolt transformation. The direction of water flow shifted from the
paracellular route to a transcellular pathway, which was driven by Na+, K+ -ATPase activity
(Sundell et al., 2003). Smolts (>16 cm fork length) in freshwater were more sensitive to
stress than parr (<12 cm) (Carey and McCormick, 1998).
When smolts remained in freshwater, desmoltification occurred and was accelerated by
increased temperature (Duston et al., 1991). These fish did not revert to the morphology of
parr, but failed to adapt to seawater (Stefansson et al., 2008). In Chapter 5, Atlantic salmon
smolts (initial mean weight: 61.8g) were reared in freshwater, thus the desmoltification
should occur during the experiment.
2.3 Intestine in Atlantic Salmon in Response to Plant Feed Ingredients
2.3.1 Morphology and Histology of Salmon Intestine
Terrestrial plant ingredients are common lipid or protein sources in farmed salmon feed.
However, histopathological damage was observed in the gastro-intestinal tract due to plant
ingredients, particular soybean meal. Soybean-induced enteritis in the distal intestine was
reported (Van den Ingh et al., 1991; Van den Ingh et al., 1996; Baeverfjord and Krogdahl,

16
1996; Bakke-McKellep et al., 2007; Knudsen et al., 2007; Uran, 2008a; Overland et al.,
2009). Thus, the morphology and histology of distal intestine need to be examined when
salmon are fed diets containing camelina byproducts.
Atlantic salmon intestine consists of five different regions: pyloric caeca, first segment of
the mid-intestine with pyloric caeca, first segment of the mid intestine posterior to pyloric
caeca, second segment of the mid-intestine and posterior intestinal segment (Figure 2.3,
Lokka et al., 2013). The second segment of the mid intestine also was defined as distal
intestine (Baeverfjord and Krogdahl, 1996; Krogdahl et al., 2003; Bakke-McKellep et al.,
2007). Sometimes, it is difficult to distinguish the dividing line between mid-intestine and
distal intestine. Externally, the midgut is much longer and thinner than hindgut. Internally,
the surface of midgut presents irregular or net-like folding. Conversely, there are abundant
circular or loop-like folding in hindgut (Lokka et al 2013).
The gut wall of both the midgut and hindgut comprise of four layers radially. The tunica
mucosa, which includes mucosal epithelium and lamina propria, is a vascularized
connective tissue with nerves and leukocytes. The submucosa is a connective tissue layer.
Then the tunica muscularis, below the submucosa, contains striated and smooth muscle in
circular or longitudinal layers. Lastly the tunica serosa, refers to the outside layer of gut
Figure 2.3 Diagram of the gastrointestinal tract in Atlantic salmon.
(ca) Cardiac stomach; (1) pyloric caeca; (2) first segment of the mid-intestine with pyloric
caeca; (3) first segment of the mid intestine posterior to pyloric caeca (short for mid gut);
(4) second segment of the mid-intestine (between two arrows, also called distal intestine or
hindgut); (5) posterior segment (Modified based on Lokka et al., 2013).
wall (Wilson and Castro, 2010). The tunica mucosa also refers to the mucosal fold
(Baeverfjord and Krogdahl, 1996; Krogdahl et al., 2003; Bakke-McKellep et al., 2007;
17
Wilson and Castro, 2010) or villi (Merrifield et al., 2011). The mucosal fold in hindgut
includes two types of folds, the simple mucosal fold and complex mucosal fold (Van den
Ingh, et al., 1991). Complex mucosal folds contain branched central connective tissue
stroma. The simple mucosal fold is shorter than the complex fold, with only one central
stroma, which is located along the intestinal wall or on the complex fold (Baeverfjord and
Krogdahl, 1996). Many microvilli make up the brush borders on the epithelium of the
mucosal fold (Merrifield et al., 2009).
The intestinal surface area is increased by multiple folding of the mucosa. Brush border
microvilli contribute to the increased surface area (Wilson and Castro, 2010). Epithelial
cells, either vacuolated or non-vacuolated, are on the surface of individual mucosal folds
and the connection between mucosal folds. In vacuolated cells, the nuclei exist in the base
of the cell. Various sizes of translucent vacuoles fill the space of the supranuclear cytoplasm
(SNV, Figure 2.4). These columnar vacuoles are also called enterocytes, where nutrient
uptake and ion regulation occur via the transepithelial transport processes. The processes
are essentially driven by Na+/K+ ATPase (Wilson and Castro, 2010). Macromolecular
proteins can be taken up by enterocytes (Wilson and Castro, 2010). In non-vacuolated cells
at the base of the simple fold, mitotic figures are common (Baeverfjord and Krogdahl,
1996). Goblet cells (GC) are challis-like or goblet shape, and contains acidic
mucosubstance sialomucin and lesser amounts of sulfomucins (Wilson and Castro, 2010).
These mucins were secreted by goblet cells as an innate defense response (Marchetti et al.,
2006). Goblet cells (Figure 2.4) are scattered within the vacuolated epithelial cells on the
mucosal fold. A prominent collagenous stratum compactum is in the center of lamina
propria (LP) (Figure 2.4) with plenty of eosinophilic granular cells distributed on both sides
(Baeverfjord and Krogdahl, 1996). The locations of sub-mucosal (SM), stratum
compactum (SC), and serosa are labeled (Figure 2.4).
18
Figure 2.4 Normal morphology of distal intestine in Atlantic salmon.
Supranuclear vacuoles (SNV) and lamina propria (LP) in mucosal folds; connective tissue
(or called submucosa, SM) between the base of folds and stratum compactum (SC). Double
arrows represent length (long arrow) and width (short arrow) of mucosal folds respectively
(modified from Knudsen et al., 2007b).
2.3.2 Soybean Induced Enteritis in Salmonids
The changes of soybean induced enteritis included a decreased height of mucosal folds.
The supranuclear vacuoles were reduced or disappeared in the intestinal epithelium. The
lamina propria in the centre of mucosal fold was widened, and leucocytes infiltrated into
the lamina propria. The condition was defined as non-infectious subacute enteritis
(Baeverfjord and Krodahl, 1996). More details of morphological changes in rainbow trout
were detected using electron microscopy. They included irregular shaped enterocytes,
lower density, shorter and irregular microvilli in the hindgut (Merrifield, et al., 2009) and
increased numbers of goblet cells (Van den Ingh, et al., 1991). Uran, et al. (2008a)
demonstrated that the disappearance of superanuclear vacuoles was initiated by the
endocytosis block. The causative agents were suspected to be antinutritional factors in the
soybean meal, such as protease inhibitors and soybean lectin (Van den Ingh, et al., 1991),
19
but were not clearly identified. Because the activities of proteinase inhibitors and lectin
were reduced by 90% after heating, these two antinutritional factors were absent in a later
study on heated soybean meal diets and Velasse diet (proteinase inhibitors and lectin free).
Two other enteritis inducing compounds were alcohol soluble components,
oligosaccharides and saponines (Van den Ingh, et al., 1996). The alcohol extract from
soybean meal reduced the digestibility of fat in salmon. The effects of alcohol soluble
saponines were found in the alcohol extract (Olli and Krogdahl, 1995). Enteritis-like signs
in hindgut were observed in both soybean meal diet and the alcohol extract of soybean meal
diet, and elevated levels of lysozyme and IgM as inflammatory responses in hindgut were
reported in salmon fed soybean molasses (Krogdahl et al., 2000). One hypothesis was that
the saponins increased intestinal epithelial permeability in the hindgut (Knudsen et al.,
2008). The membrane of the intestine was disturbed, allowing foreign antigens to trigger
inflammation in the gut (Knudsen et al., 2008; Merrifield et al., 2009). The soybean meal
increased the permeability of distal intestinal epithelium, and reduced the capacity of
nutrient absorption (Nordrum et al., 2000). Another hypothesis is that the combination of
changes in gut microbiota and hindgut epithelial cell protective responses induced enteritis,
due to increasing numbers and types of adherent bacteria in the gut of fish fed soybean
meal (Bakke-McKellep et al., 2007). Soybean protein concentrate altered the bacteria
composition in hindgut of Atlantic salmon, but mannan-oligosaccharide could ameliorate
the intestinal-microbiome (Green et al., 2013).
2.4 Summary of the Current Knowledge and Thesis Objectives
Camelina oil and camelina meal contain sufficient quantities of linolenic (omega-3 fatty
acid) and crude protein to make them attractive as feed ingredients. Camelina oil can
replace all the fish oil without reducing the growth of Atlantic cod, rainbow trout, and
Atlantic salmon post-smolt. However, there is a challenge in incorporating high levels of
camelina meal in finfish diets due to some antinutritional factors and lower protein
compared to fish meal. The antinutritional factors in camelina meal include glucosinolates,
phytic acid, sinapine, tannins and trypsin inhibitor.
High fat residue camelina meal at 16% in the diet is acceptable for rainbow trout (Pan et
al., 2011), but there is no literature concerning higher inclusion level of HOCM. The

20
combination of 100% CO and 10% SECM in the diet inhibits the growth of Atlantic salmon
smolts (Hixson et al., 2014b). The reasons are unclear, and knowledge about the double
substitution of low level CO and SECM is absent. Because the nutrient requirements differ
at different weight range (NRC, 2011), and the physiology and living conditions of salmon
alter after smoltification (Stefansson et al., 2008), studies at different salmon life stages
should be conducted to determine appropriate inclusion levels of camelina byproducts.
The histological changes in salmon distal intestine, under the condition of soybean induced
enteritis, has been described in detail, but the causative agent is not clear. The changes in
distal intestine in salmon fed camelina have not been described in the scientific literature.
The observations from soybean studies may be useful to study the intestine histology
assessment of Atlantic salmon fed camelina products.
The objectives of this thesis were to investigate the optimal levels of various camelina
byproducts as novel ingredients fed to Atlantic salmon at different life stages. The
evaluation parameters included growth performance, fish carcass composition, and hindgut
histology. In Chapter 3, Atlantic salmon parr were reared in freshwater, and fed test diets
containing four graded levels of SECM (5, 10, 15 and 20%) and two levels of CO (50%
and 100% replacing fish oil). In Chapter 4, Atlantic salmon post-smolts were reared in
seawater, and the experimental diets included Control containing local fish oil and fish
meal, 100% CO+solvent extracted fish meal (SEFM), 100% CO+10% solvent extracted
camelina meal (SECM)+SEFM, 100% CO+fish meal (FM), 100% CO+10% SECM+FM,
8% SECM, 16% SECM, 24% SECM. In Chapter 5, Atlantic salmon smolts were fed three
graded levels (8, 16, and 24%) of high oil residue camelina meal (HOCM) in freshwater.
21
Chapter 3 : The Effects of Camelina Oil and Solvent Extracted Camelina Meal on the
Growth, Carcass Composition and Hindgut Histology of Atlantic Salmon Parr (Salmo
salar) in Freshwater
3.1 Abstract
Generally, the camelina byproducts had no negative impacts on growth performance of
Atlantic salmon parr in a 16 week trial. Fish (initial weight: 8.4g) were fed control, 5, 10,
15 or 20% solvent extracted camelina meal (SECM), or 50% and 100% camelina oil (CO)
substituted for fish oil in diets. Fish were reared in 11.7 °C freshwater. The average final
mean body weight was 46.7g. Weight gain from week 13 to week 16 and SGR among fish
fed 15% SECM was inhibited, but no inhibition was detected in fish fed 20% SECM diet.
Final condition factor, feed conversion ratio and hepatosomatic index were similar among
all groups (p≥0.05). Feed consumption and specific growth rates were similar between
control and all other groups (p≥0.05), these were higher in fish fed CO compared to SECM
(p<0.05). The safe upper range of glucosinolates was 1.8-3.3 µmol/g in the diet. Carcass
protein, fat, ash and moisture were unaffected at week 16. Protein retention ratio was
similar in all treatments. The length, width and area of hindgut villi were unaffected by
treatments. Increased size of lamina propria was observed in 15 and 20% SECM groups.
The promising diets were 50% CO, 100% CO, 5% and 10% SECM in this study, but 10%
SECM should be used with caution.
3.2 Introduction
Intensive research on alternative plant meals and oils for fish feed has been conducted in
recent years. Camelina (Camelina sativa) oil (CO) is rich in α-linolenic (18:3n-3, 35.6%)
and linoleic (18:2n-6, 18.4%) (Hixson et al., 2013), and it can replace all fish oil in the diet
without inhibiting fish growth (Morais, et al., 2012; Hixson et al., 2014a; Hixson et al.,
2014b). Feeding CO to Atlantic salmon parr has not been studied, so 50% and 100% CO
were tested in the present study. Freshwater fish and salmonid species can convert α-
linolenic to docosahexaenoic acid (DHA, 22:6n-3) and eicosapentaenoic acid (EPA, 20:5n-
3) (reviewed by Tocher, 2003). Therefore, the shortage of DHA and EPA in camelina oil
can be compensated somewhat by the high level of α-linolenic in CO via bio-synthesis.
Soybean meal has become a major plant protein to substitute for some degree of fish meal
in salmonid feed (Carter and Hauler, 2000). However, the soybean induced intestinal
enteritis in the distal intestine of Atlantic salmon remains a problem, and the causative
agent is unknown (Van den Ingh et al., 1991; Baeverfjord and Krogdahal, 1996; Krogdahl
et al., 2000; Refstie et al., 2000; Uran et al., 2008a). Canola meal, also belongs to the
brassicaceae family, and can be included in salmoind diets up to 20% (Canola Council of
Canada, accessed on June 17, 2014). In previous studies, high fat residue camelina meal

22
did not suppress the growth of rainbow trout (Oncorhynchus mykiss) at 20% in the diets
(Bullerwell and Anderson, 2012). The growth of rainbow trout was not inhibited by 10%
solvent extracted camelina meal (SECM) at 12 week, but was reduced at week 16
(Bullerwell, personal communication 2012). The carcass composition of rainbow trout fed
16% high fat residue camelina meal was unchanged compared to control (Pan et al., 2011).
The SECM with higher protein (39%) is expected to be included at higher level in the diet,
but the content of antinutritional factors tend to increase in this process. Based on previous
studies, the levels of SECM tested in the current study were 5, 10, 15 and 20% in the diet.
Camelina meals and oil are potential alternative protein and lipid sources, respectively, but
are not yet approved as feedstuffs by the Canadian Food Inspection Agency. The optimal
levels of each type of camelina byproduct for Atlantic salmon needs to be investigated. To
define the levels of these new ingridients to maintain gut health, it was necessary to evaluate
the intestinal histology in the current investigation.
3.3 Objective
Based on previous studies, a range of camelina meal from 0 to 20%, and 50% and 100%
CO substitute for fish oil were worth testing on Atlantic salmon. This study quantified
growth performance, carcass composition, gut histology in Atlantic salmon parr fed
practical diets containing four graded levels of SECM (5, 10, 15 and 20%) and two levels
of CO (50% and 100% replacement of fish oil).
3.4 Hypothesis
The growth performance would be similar among fish fed control, 5%SECM, 10%SECM,
50%CO and 100%CO diets. Fish fed 15 and 20% SECM would show slower growth.
The carcass composition of all treatments would be similar to fish fed the control diet.
Fish fed 20% SECM diet would show histological changes in the hindgut compared to fish
fed control diet.
23
3.5 Materials and Methods
3.5.1 Preparation of Test Ingredients
Camelina (Calena cultivar) was grown by Lyndhurst Farms Ltd. In Canning, Nova Scotia,
Canada. Camelina oil was pressed from seeds using a KEK 0500 press at Atlantic Oilseed
Processing Ltd., in Summerside, Prince Edward Island, Canada. Solvent extracted camelina
meal was made in the Department of Plant and Animal Sciences nutrition lab in a fume
hood at room temperature (20 oC) away from any heat source. Camelina meal (400 g) was
mixed with petroleum ether (Fisher Scientific product# E139-4) at a ratio of 1g meal / 3ml
ether. Petroleum ether is composed of 50-60% pentane and isomers of hexane (Johnson,
personal communication). The mixture was held in the beaker for one hour, and was stirred
every 15 minutes. At the end of 1 hour, the ether was decanted and the wet camelina meal
was placed on an absorbent pad in the fume hood for two hours to air dry. The composition
of SECM was in Appendix A.
3.5.2 Feed Formulation and Preparation
Each of the seven diets was balanced to be isonitrogenous (44% crude protein) and
isocaloric (4400 Kcal/kg) to meet National Research Council (NRC, 2011) requirements
for Atlantic salmon. All ingredients are typical of those used in commercial salmon feed
production in Atlantic salmon. A control treatment based on fish meal and fish oil, four
diets including solvent extracted camelina meal (SECM) at 5%, 10%, 15% and 20%, and
two diets where 50% or 100% of the fish oil is replaced by camelina oil (CO) were prepared.
The fish oil level in SECM diets was the same as the control diet, excluding CO diets. The
extra lipid required was added as camelina oil. Whey (2%) and gelatinized starch (4%)
were added to help bind the feed particles together. To achieve the protein balance of feed
formulations by including SECM, ingredients with high level of proteins were added,
including wheat gluten meal (80%), Empyreal 75® (75%), poultry byproduct meal (66%),
D/L methionine (Table 3.1). The essential amino acids were calculated according to the
ingredient amino acid composition values listed in Nutrient Requirements of Fish and
Shrimp (NRC, 2011) (Table 3.2). All diets met the requirements for essential amino acids.
The major nutrients, minerals and glucosinolates were analysed (Table 3.3). The analysed
protein levels were similar at 43±0.3%. The crude lipid levels increased (21.8-25.1%) as
24
SECM level increased in the diet, compared to the control diet (19.9%). The CO diets had
similar lipid levels to the control diet (20.6% vs. 20.1% vs. 19.9%). The levels of calcium,
phosphorus, sodium, potassium and magnesium were similar in all diets. In 50% CO diet,
manganese (119.5 g/kg), copper (68 g/kg) and zinc (121.5 ppm) were lowest among all
diets. Glucosinolates were not detected in the control and CO diets, and were positively
correlated with the level of SECM in the experimental diets.
All diets were mixed according to the formulations (Table 3.1), and steam pelleted by a
California pellet mill (San Francisco, USA), dried at 54 °C, and cooled to room temperature
at the Chute Animal Nutrition Centre, Faculty of Agriculture, Dalhousie University.
Table 3.1 The formulations of seven practical diets for Atlantic salmon parr (% as fed
basis).
Ingredient of diet Control SECM CO
5% 10% 15% 20% 50% 100%
Wheat Gluten Meal 5 5 5 5 5 5 5
Poultry Byproduct
Meal 5 5 5 5 5 5 5
Empyreal 75®1 15 15 15 15 15 15 15
D/L Methionine 0.17 0.17 0.17 0.17 0.17 0.17 0.17
Vitamin Mineral
Premix2 0.2 0.2 0.2 0.2 0.2 0.2 0.2
Special Premix3 0.25 0.25 0.25 0.25 0.25 0.25 0.25
Choline Chloride 0.5 0.5 0.5 0.5 0.5 0.5 0.05
Whey 2 2 2 2 2 2 2
Pregelatinized
starch 4 4 4 4 4 4 4
Fish Meal 32.1 30.3 28.4 26.5 24.6 32.1 32.1
Fish Oil 16.1 16.1 16.1 16.1 16.1 8.0 0
Ground wheat 19.7 15 10.3 5.7 1.0 19.7 19.7
SECM 0 5 10 15 20 0 0
Camelina Oil 0 1.5 3.1 4.6 6.1 8.0 16.1
Total 100 100 100 100 100 100 100 SECM: solvent extracted camelina meal; CO: camelina oil.
1. Empyreal 75® is a high-energy corn protein concentrate manufactured by Cargill Corn
Milling, Nebraska, USA.
2. Vitamin and mineral premix contains: zine 77.5 mg, manganese 125 mg, iron 84 mg,
copper 2.5 mg, iodine 7.5 mg, vitamin A 5000 IU, vitamin D 4000 IU, vitamin K 2 mg,
vitamin B12: 4 µg, thiamin 8 mg, riboflavin 18 mg, pantothenic acid 40mg, niacin
100mg, folic acid 4 mg, biotin 0.6 mg, pyridoxine 15 mg, inositol 100 mg, ethoxyquin
42 mg, wheat shorts 1372 mg (per kg of diet).
3. Special Premix contains per kg: selenium 0.22 mg, vitamin E 250 mg, vitamin C 200
mg, astaxanthin 60 mg, and wheat shorts 1988mg.
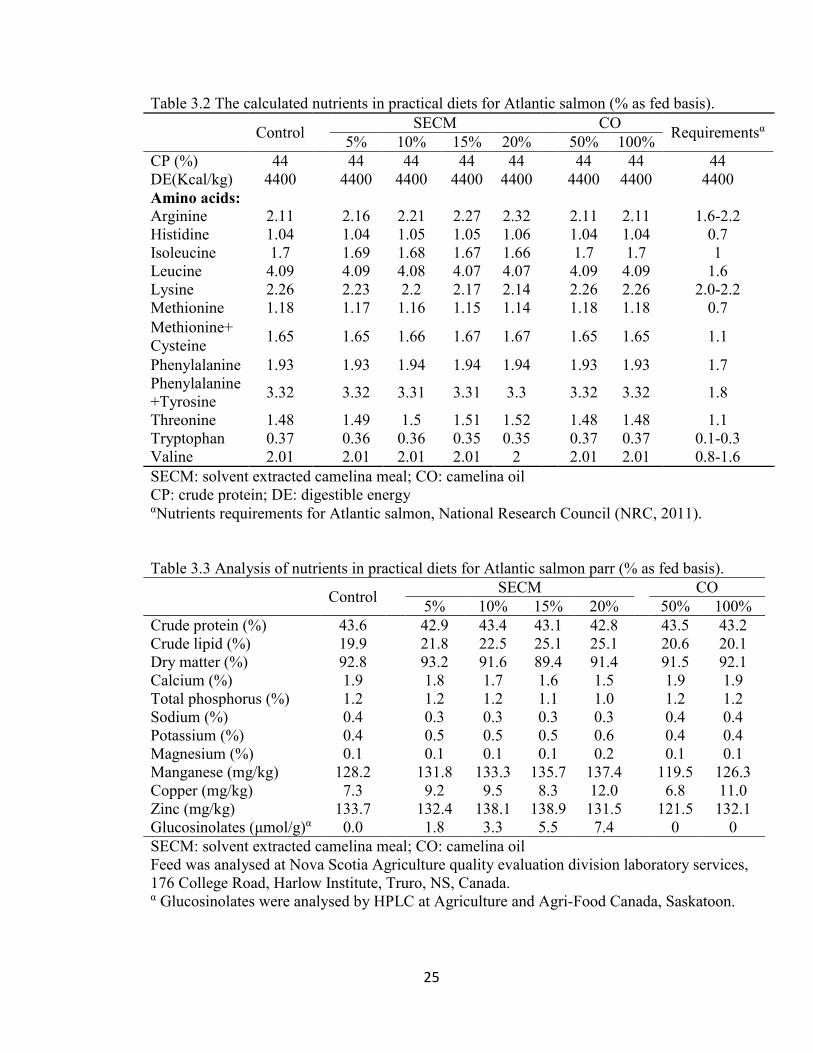
25
Table 3.2 The calculated nutrients in practical diets for Atlantic salmon (% as fed basis).
Control SECM CO
Requirementsα 5% 10% 15% 20% 50% 100%
CP (%) 44 44 44 44 44 44 44 44
DE(Kcal/kg) 4400 4400 4400 4400 4400 4400 4400 4400
Amino acids:
Arginine 2.11 2.16 2.21 2.27 2.32 2.11 2.11 1.6-2.2
Histidine 1.04 1.04 1.05 1.05 1.06 1.04 1.04 0.7
Isoleucine 1.7 1.69 1.68 1.67 1.66 1.7 1.7 1
Leucine 4.09 4.09 4.08 4.07 4.07 4.09 4.09 1.6
Lysine 2.26 2.23 2.2 2.17 2.14 2.26 2.26 2.0-2.2
Methionine 1.18 1.17 1.16 1.15 1.14 1.18 1.18 0.7
Methionine+
Cysteine 1.65 1.65 1.66 1.67 1.67 1.65 1.65 1.1
Phenylalanine 1.93 1.93 1.94 1.94 1.94 1.93 1.93 1.7
Phenylalanine
+Tyrosine 3.32 3.32 3.31 3.31 3.3 3.32 3.32 1.8
Threonine 1.48 1.49 1.5 1.51 1.52 1.48 1.48 1.1
Tryptophan 0.37 0.36 0.36 0.35 0.35 0.37 0.37 0.1-0.3
Valine 2.01 2.01 2.01 2.01 2 2.01 2.01 0.8-1.6
SECM: solvent extracted camelina meal; CO: camelina oil
CP: crude protein; DE: digestible energy αNutrients requirements for Atlantic salmon, National Research Council (NRC, 2011).
Table 3.3 Analysis of nutrients in practical diets for Atlantic salmon parr (% as fed basis).
Control
SECM CO
5% 10% 15% 20% 50% 100%
Crude protein (%) 43.6 42.9 43.4 43.1 42.8 43.5 43.2
Crude lipid (%) 19.9 21.8 22.5 25.1 25.1 20.6 20.1
Dry matter (%) 92.8 93.2 91.6 89.4 91.4 91.5 92.1
Calcium (%) 1.9 1.8 1.7 1.6 1.5 1.9 1.9
Total phosphorus (%) 1.2 1.2 1.2 1.1 1.0 1.2 1.2
Sodium (%) 0.4 0.3 0.3 0.3 0.3 0.4 0.4
Potassium (%) 0.4 0.5 0.5 0.5 0.6 0.4 0.4
Magnesium (%) 0.1 0.1 0.1 0.1 0.2 0.1 0.1
Manganese (mg/kg) 128.2 131.8 133.3 135.7 137.4 119.5 126.3
Copper (mg/kg) 7.3 9.2 9.5 8.3 12.0 6.8 11.0
Zinc (mg/kg) 133.7 132.4 138.1 138.9 131.5 121.5 132.1
Glucosinolates (μmol/g)α 0.0 1.8 3.3 5.5 7.4 0 0
SECM: solvent extracted camelina meal; CO: camelina oil
Feed was analysed at Nova Scotia Agriculture quality evaluation division laboratory services,
176 College Road, Harlow Institute, Truro, NS, Canada. α Glucosinolates were analysed by HPLC at Agriculture and Agri-Food Canada, Saskatoon.
26
All feeds were stored at -20 °C until needed. The original pellet size was 2.5 mm diameter.
A portion of each feed was crumbled to a suitable size of 0.75~1.0 mm particles (Jobling,
1993) and sifted on a screen. The smaller particles were fed to the small fish during the first
four weeks. The size of feed increased to 1.4~2.0 mm from week 5 to week 8, then intact
2.5 mm pellets were used for the remaining period of the experiment.
3.5.3 Fish Rearing Conditions
Fish were sourced from the 2012 year class of St. John River stock at Big Falls Fish Grower
Ltd., in Wolfville, Nova Scotia. There were 1050 Atlantic salmon parr (initial weight:
8.4±0.2 g) divided equally and randomly among 21 tanks, 50 fish per tank. The lower part
of the tank is a cone shape with a height of 20cm, and the upper part of the tank is cylinder
shape with a height of 45 cm and a diameter of 72cm. The volume of each tank is 210L.
Each tank was supplied 3 L/min flow through freshwater. The average temperature and
oxygen saturation were 11.7 °C and 120% respectively. Seven different diets were
randomly assigned to tanks with three replicates per treatment. Fish were fed with the
control diet for one week acclimation in the system. Fish were then hand fed test diets three
times per day to satiation for 16 weeks, week 1 started from this time point (December 26,
2012). Faeces in all the tanks were purged after morning and afternoon feeding. This
experiment was conducted in according with animal care protocol (File: 2012-016)
approved by animal care committee in Faculty of Agriculture, Dalhousie University using
the guidelines of the Canadian Council on Animal Care (2005).
3.5.4 Sampling
Food was withheld for one day prior to the sampling day. Average mean body weight per
tank was determined every four weeks. Feed consumption was calculated every four weeks.
At the beginning of the experiment, twenty-one fish, 1 fish per tank were euthanized using
overdose of buffered tricaine methane sulfonate (TMS) for carcass analysis and six fish of
the sampled fish were randomly selected for gut histology evaluation. Eleven muscle
samples were randomly taken from the tanks, 1 fish per tank, and sent to Memorial
University of Newfoundland (MUN) for other studies. At 8 weeks, 6 fish per tank were
euthanized and dissected for gut histology analysis at Faculty of Agriculture, Dalhousie
University and gut genomic study at the Ocean Sciences Centre of MUN. The same fish

27
were retained for carcass analysis. Gut samples for histology analysis included mid gut and
hindgut. These samples were stored in 10% neutral buffered formalin (source: Fisher
Scientific) in 20 ml vials. At 16 weeks, the sampling procedures were repeated as described
for the 8-week sampling. In addition, muscle samples from three fish per tank were
collected for another study at Ocean Science Centre of MUN. All sampled fish were
weighed individually and the fork length measured. The liver from each sampled fish (6
fish per tank) was weighed at 16 weeks for hepatosomatic index, because nutrient
deficiency can cause hepatocytes swollen (Ellis et al., 1978)
3.5.5 Calculations
The specific growth rate (SGR), feed conversion ratio (FCR), and protein retention ratio
(PRR), Hepatosomatic index (HSI) and glucosinolates intake were calculated.
SGR = ln 𝑀𝑓−ln 𝑀𝑖
𝑡∗ 100 ; Mf and Mi are the mean final and initial individual masses, t
refers to time
FCR = Total feed fed
body weight gain∗ 100
PRR= (final body weight*final body protein content as wet weight basis)-(initial body weight*initial protein content as wet weight basis)
total feed intake*Protein content in diet
Condition factor (CF) = body weight
fork length^3∗ 100
Hepatosomatic index (HSI) = liver weight
body weight∗ 100
Glucosinolates intake = Feed consumption∗glucosinolate in the diet(μmol/g)
time∗(Initial body weight+final body weight)/2∗ 100 (Burel et
al., 2000)
3.5.6 Carcass Analysis
Fish carcass referred to the whole fish with the viscera and kidney removed. Twenty one
fish sampled from week 1 were homogenized in a manual meat grinder. At 8 weeks carcass
samples, six fish from each tank were homogenized together. However, at 16 weeks
samples, three fish from the same tank were pooled as one carcass sample so that there
were two mixed carcass samples for each tank. One hundred grams of wet sample was
needed for carcass analysis of dry matter, crude protein, lipid and ash. All ground samples
were weighed and stored at -20 °C for at least 24 hours. Samples were put into a ModulyoD

28
freeze dryer (Source: Thermo Fisher Scientific) for 24 hours and weighed again, and water
content of carcass samples was calculated.
The freeze dried samples were ground using a small coffee grinder (Brand: Intertek) in
preparation for analysis of crude protein, crude fat and ash. Dry matter in prepared samples
was measured by AOAC International (2011) procedure (method no. 934.01, 2011). Crude
protein was analysed using a Leco FP-528 nitrogen gas analysis, nitrogen*6.25. (AOAC,
2011; method no. 992.15). Crude fat was measured by using ANKOM XT15 solvent
extraction system and ANKOMRD dryer (AOAC, 2011; method no. 920.39). Ash was
measured as the residue that remained after 550 °C heating in Isotemp Muffle Furnace for
at least 2 hours (AOAC, 2011; method no. 942.05). Each sample was analysed in two
replicates.
3.5.7 Hindgut Histology Evaluation
The second segment of the mid-intestine (Figure 2.3, Chapter 2) was defined as distal
intestine or hindgut. All samples were stored in 10% neutral buffered formalin. Histology
samples were prepared by the Animal Health Laboratory, Agriculture and Food Operations
Branch, Nova Scotia Dept. of Agriculture. A small piece of each sample was placed in a
cassette and immersed in 10% buffered formalin. The cassettes were washed by cleaning
solutions at 40 °C in a vacuum infiltration processor (Tissue-TEK VIP). Prepared cassettes
were fixed in paraffin in Tissue-TEK TEC. Each sample was cut into three 5 microns cross
sections using a microtome (LEICA RM2255). The cross sections were fixed in paraffin
solution again and placed on slides. After 40 minutes drying at 62±1°C, the slides were
stained with haematoxylin and eosin (H&E) in an auto-staining machine. Prepared slides
were scanned by Nikon Coolscan 4000ED in the image lab, Haley Institute. Ten intact
shaped villi were selected clockwise in each slide, and they were evenly distributed around
the cross section. The 10 villi included one complex villus and nine simple villi. Tiny villi
(<0.1mm) were not quantified. The length, width and area of a villus were measured
respectively in the photographs by SigmaScan Pro 5 software. Mucosal fold, supranuclear
vacuoles, lamina propria, goblet cells, and sub-epithelial mucosa were assessed using the
semi-quantitative scoring system (Uran et al., 2008b). The slides were evaluated blindly,
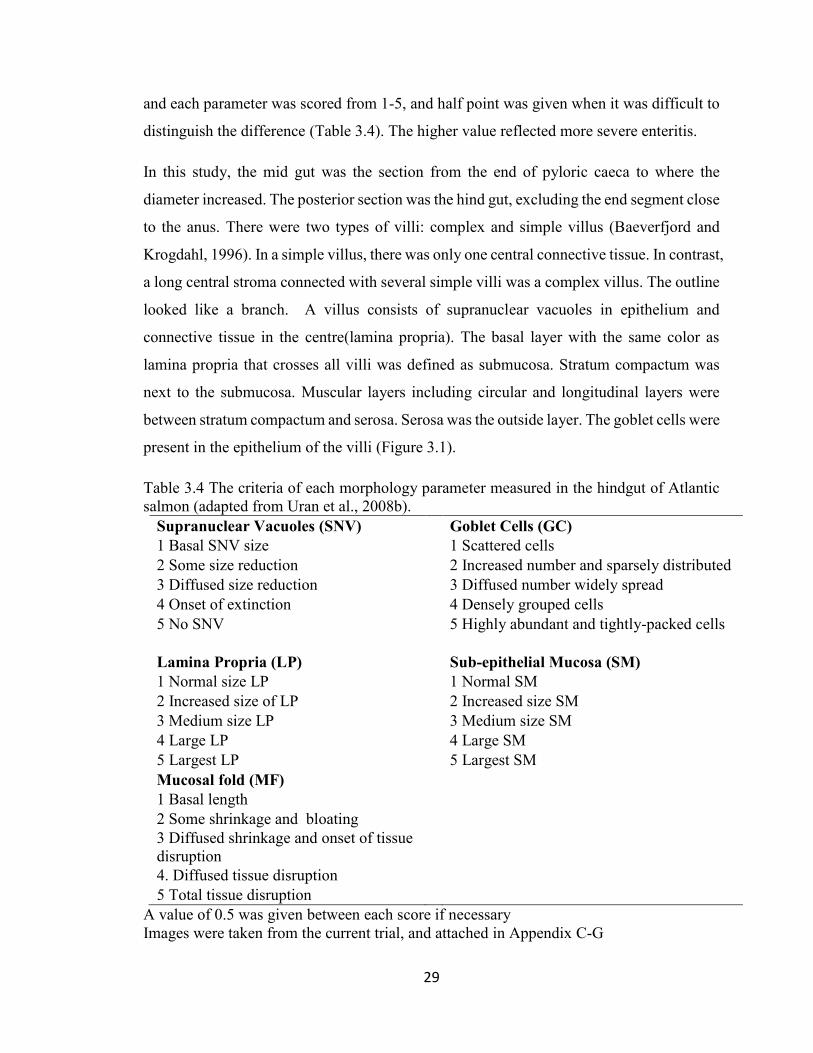
29
and each parameter was scored from 1-5, and half point was given when it was difficult to
distinguish the difference (Table 3.4). The higher value reflected more severe enteritis.
In this study, the mid gut was the section from the end of pyloric caeca to where the
diameter increased. The posterior section was the hind gut, excluding the end segment close
to the anus. There were two types of villi: complex and simple villus (Baeverfjord and
Krogdahl, 1996). In a simple villus, there was only one central connective tissue. In contrast,
a long central stroma connected with several simple villi was a complex villus. The outline
looked like a branch. A villus consists of supranuclear vacuoles in epithelium and
connective tissue in the centre(lamina propria). The basal layer with the same color as
lamina propria that crosses all villi was defined as submucosa. Stratum compactum was
next to the submucosa. Muscular layers including circular and longitudinal layers were
between stratum compactum and serosa. Serosa was the outside layer. The goblet cells were
present in the epithelium of the villi (Figure 3.1).
Table 3.4 The criteria of each morphology parameter measured in the hindgut of Atlantic
salmon (adapted from Uran et al., 2008b).
Supranuclear Vacuoles (SNV) Goblet Cells (GC)
1 Basal SNV size 1 Scattered cells
2 Some size reduction 2 Increased number and sparsely distributed
3 Diffused size reduction 3 Diffused number widely spread
4 Onset of extinction 4 Densely grouped cells
5 No SNV 5 Highly abundant and tightly-packed cells
Lamina Propria (LP) Sub-epithelial Mucosa (SM)
1 Normal size LP 1 Normal SM
2 Increased size of LP 2 Increased size SM
3 Medium size LP 3 Medium size SM
4 Large LP 4 Large SM
5 Largest LP 5 Largest SM
Mucosal fold (MF)
1 Basal length
2 Some shrinkage and bloating
3 Diffused shrinkage and onset of tissue
disruption
4. Diffused tissue disruption
5 Total tissue disruption
A value of 0.5 was given between each score if necessary
Images were taken from the current trial, and attached in Appendix C-G

30
Figure 3.1 Morphology of the hindgut in Atlantic salmon parr fed the control diet (X200).
Supranuclear vacuoles (SNV) in epithelium (E) and lamina propria (LP) in villi; connective
tissue or called submucosa (SM) between the base of villi and stratum compactum (SC).
The intestinal wall consists of SC, inner circular (CM) and an outer longitudinal (LM)
layers, serosa is the outside layer of the wall. Double arrows (long arrow) and (dash arrow)
showed the height and width of a villus respectively. Each layer in the wall was cut by dash
lines (image was taken from the current study).
3.5.8 Statistical Analysis
The experiment was a completely randomized experiment with diet as the main effect.
Analysis of variance was conducted using the Mixed model of SAS (Littell et al, 2006). If
the residuals of data (all parameters measured except the scoring data) did not meet
normality, an appropriate transformation was applied. When time was not a factor, one-
way ANOVA with Tukey-Kramer test was applied. When time was a factor, the repeated
measures statement (SAS 9.3) was included. The experimental unit was tank and the type
of covariance structure was compound symmetry (CS). When the interaction of time and
treatment was significant (p<0.05), then the data was sliced into each time point or period.
If ANOVA was significant (P<0.05), Tukey-Kramer test (Hayter, 1984) as a conservative
method was used to differentiate the means (P<0.05). Parameters measured included
weight, weight gain, fork length, condition factor, specific growth rate (SGR), protein
retention ratio (PRR), feed consumption, feed conversion ratio (FCR), hepatosomatic index
(HSI), and carcass composition (% fat, ash, protein and dry matter).
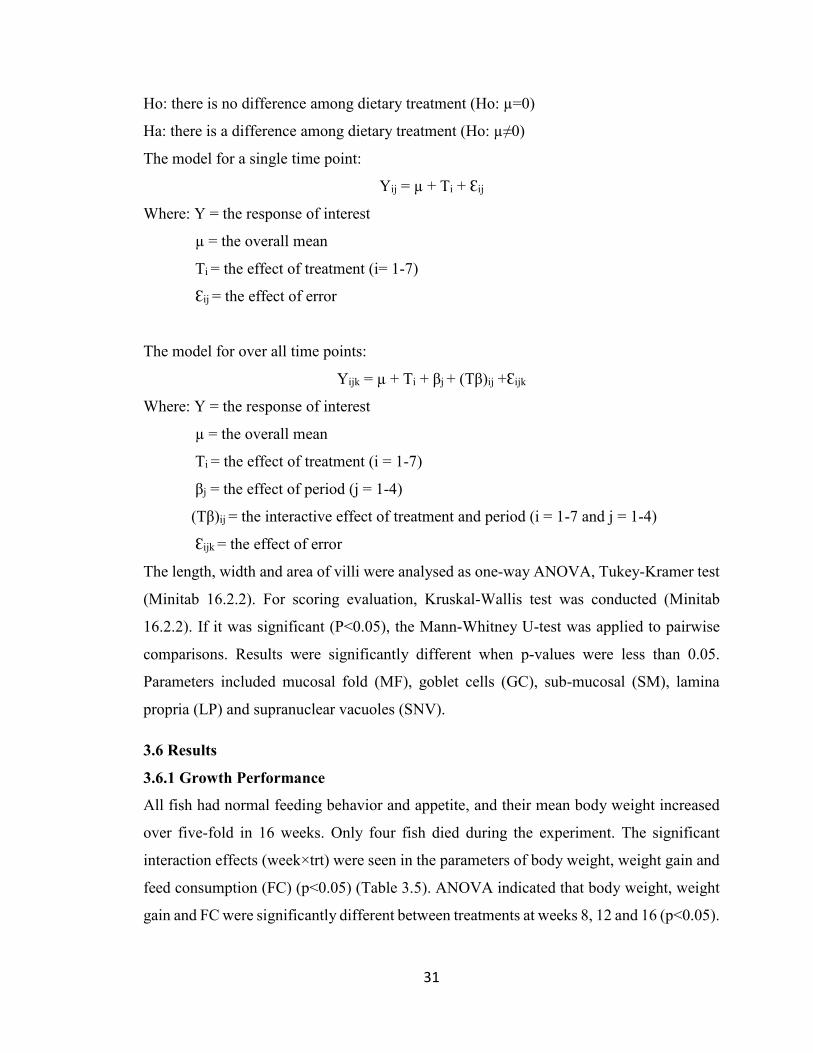
31
Ho: there is no difference among dietary treatment (Ho: µ=0)
Ha: there is a difference among dietary treatment (Ho: µ≠0)
The model for a single time point:
Yij = µ + Ti + Ɛij
Where: Y = the response of interest
µ = the overall mean
Ti = the effect of treatment (i= 1-7)
Ɛij = the effect of error
The model for over all time points:
Yijk = µ + Ti + βj + (Tβ)ij +Ɛijk
Where: Y = the response of interest
µ = the overall mean
Ti = the effect of treatment (i = 1-7)
βj = the effect of period (j = 1-4)
(Tβ)ij = the interactive effect of treatment and period (i = 1-7 and j = 1-4)
Ɛijk = the effect of error
The length, width and area of villi were analysed as one-way ANOVA, Tukey-Kramer test
(Minitab 16.2.2). For scoring evaluation, Kruskal-Wallis test was conducted (Minitab
16.2.2). If it was significant (P<0.05), the Mann-Whitney U-test was applied to pairwise
comparisons. Results were significantly different when p-values were less than 0.05.
Parameters included mucosal fold (MF), goblet cells (GC), sub-mucosal (SM), lamina
propria (LP) and supranuclear vacuoles (SNV).
3.6 Results
3.6.1 Growth Performance
All fish had normal feeding behavior and appetite, and their mean body weight increased
over five-fold in 16 weeks. Only four fish died during the experiment. The significant
interaction effects (week×trt) were seen in the parameters of body weight, weight gain and
feed consumption (FC) (p<0.05) (Table 3.5). ANOVA indicated that body weight, weight
gain and FC were significantly different between treatments at weeks 8, 12 and 16 (p<0.05).

32
However, the Tukey-Kramer test did not reveal the significant differences among means in
weight gain at weeks 8 and 12, and FC at week 12.
In the first period (week 0-4), fish consumed similar amounts of feed among all treatments
and had similar weight gain (p≥0.05) (Table 3.6). Between weeks 5-8, there were no
significant differences between the control (7.5 g/fish) and any other treatments in feed
consumption. However, fish had higher intake of 50% CO (8.5g/fish) than 15% and 20%
SECM (p<0.05), and consumed more of 100% CO (9.1g/fish) than 10, 15 and 20% SECM
(p<0.05). For weight gain, ANOVA showed p<0.05, but Tukey-Kramer test, as a
conservative procedure, did not reveal significant differences in the weight gain among all
dietary treatments. In the third period (weeks 9 to 12), all fish exhibited similar feed
consumption and weight gain (Tukey-Kramer test did not reveal significant differences).
In the final period (week 13-16), fish consumed similar amounts of test diets to the control
diet (16.6 g/fish). The consumption of 50% CO (17.2 g/fish) was higher than 20% SECM
(14.0 g/fish) (p<0.05), and the consumption of 100% CO (19.3 g/fish) was higher than the
four SECM diets (p<0.05). The weight gain in fish fed 15% SECM diet (14.9 g/fish) was
lower than that of fish fed control diet (18.3 g/fish) (p<0.05), and the weight gains in fish
fed the other test diets were similar to that of fish fed control diet. From week 1 to week 16
(Table 3.7), total feed consumption of 50% CO (40.4 g/fish) was higher than 10%, 15%
and 20%SECM (p<0.05). Fish consumed more 100% CO diet (43.6 g/fish) than any of the
SECM diet (p<0.05).
All fish had similar initial mean weight (mean±SD: 8.4±0.2 g/fish). Final mean body
weight in the other six treatments were similar to the control (49.2 g) (p≥0.05) (Table 3.7).
Fish fed 50% and 100% CO (52.8 g and 52.1 g respectively) were heavier than 10%SECM
(42.6g), 15%SECM (42.6 g) and 20% SECM at week 16 (42.5 g) (p<0.05). Fish fed either
50% CO (44.4 g/fish), 100% CO (43.9 g/fish) or 5% SECM (36.9 g/fish) diet exhibited a
similar weight gain to fish fed the control diet (40.8 g/fish) (p≥0.05). By comparison, a
lower weight gain was exhibited by fish fed 10%, 15% and 20% SECM diets (mean: 34.2
g/fish) compared to the control diet (p<0.05). Condition factor, feed conversion ratio (FCR),
and (hepatosomatic index) HSI were independent of dietary treatments (p≥0.05). Specific
growth rate (SGR) in the CO groups was higher than SECM groups (p<0.05). Fish fed 15%
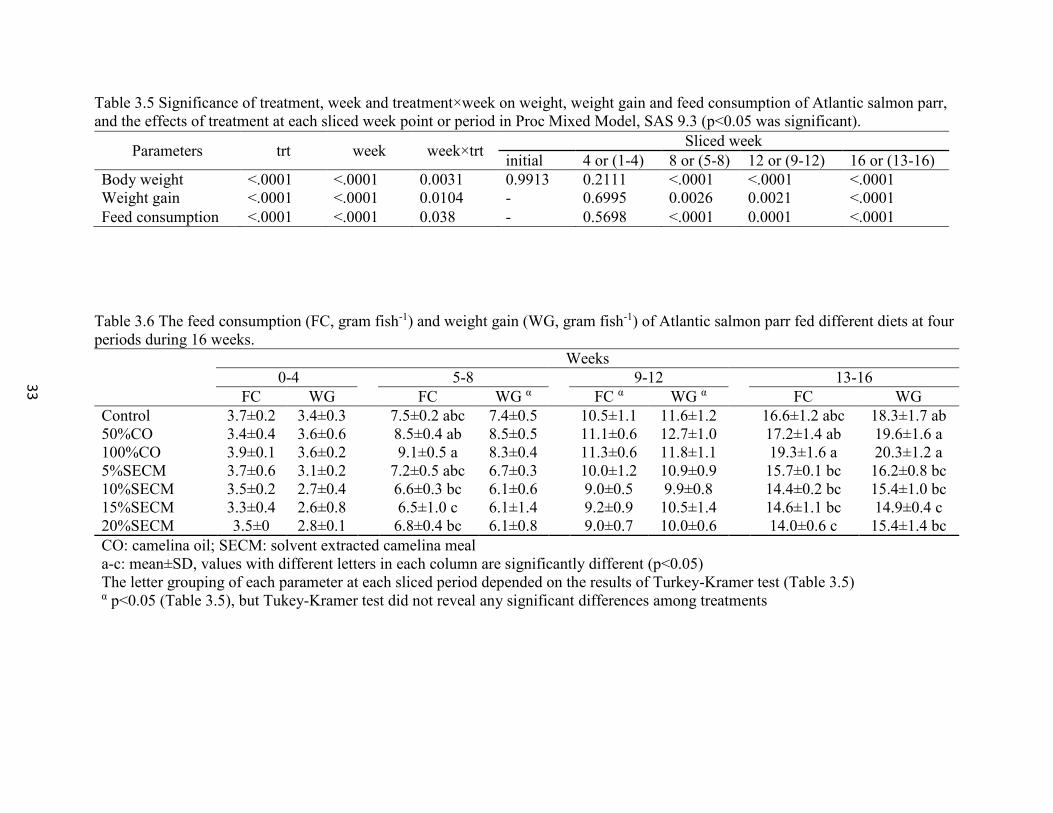
33
Table 3.5 Significance of treatment, week and treatment×week on weight, weight gain and feed consumption of Atlantic salmon parr,
and the effects of treatment at each sliced week point or period in Proc Mixed Model, SAS 9.3 (p<0.05 was significant).
Table 3.6 The feed consumption (FC, gram fish-1) and weight gain (WG, gram fish-1) of Atlantic salmon parr fed different diets at four
periods during 16 weeks.
Weeks
0-4 5-8 9-12 13-16
FC WG FC WG α FC α WG α FC WG
Control 3.7±0.2 3.4±0.3 7.5±0.2 abc 7.4±0.5 10.5±1.1 11.6±1.2 16.6±1.2 abc 18.3±1.7 ab
50%CO 3.4±0.4 3.6±0.6 8.5±0.4 ab 8.5±0.5 11.1±0.6 12.7±1.0 17.2±1.4 ab 19.6±1.6 a
100%CO 3.9±0.1 3.6±0.2 9.1±0.5 a 8.3±0.4 11.3±0.6 11.8±1.1 19.3±1.6 a 20.3±1.2 a
5%SECM 3.7±0.6 3.1±0.2 7.2±0.5 abc 6.7±0.3 10.0±1.2 10.9±0.9 15.7±0.1 bc 16.2±0.8 bc
10%SECM 3.5±0.2 2.7±0.4 6.6±0.3 bc 6.1±0.6 9.0±0.5 9.9±0.8 14.4±0.2 bc 15.4±1.0 bc
15%SECM 3.3±0.4 2.6±0.8 6.5±1.0 c 6.1±1.4 9.2±0.9 10.5±1.4 14.6±1.1 bc 14.9±0.4 c
20%SECM 3.5±0 2.8±0.1 6.8±0.4 bc 6.1±0.8 9.0±0.7 10.0±0.6 14.0±0.6 c 15.4±1.4 bc
CO: camelina oil; SECM: solvent extracted camelina meal
a-c: mean±SD, values with different letters in each column are significantly different (p<0.05)
The letter grouping of each parameter at each sliced period depended on the results of Turkey-Kramer test (Table 3.5) α p<0.05 (Table 3.5), but Tukey-Kramer test did not reveal any significant differences among treatments
Parameters trt week week×trt Sliced week
initial 4 or (1-4) 8 or (5-8) 12 or (9-12) 16 or (13-16)
Body weight <.0001 <.0001 0.0031 0.9913 0.2111 <.0001 <.0001 <.0001
Weight gain <.0001 <.0001 0.0104 - 0.6995 0.0026 0.0021 <.0001
Feed consumption <.0001 <.0001 0.038 - 0.5698 <.0001 0.0001 <.0001
33
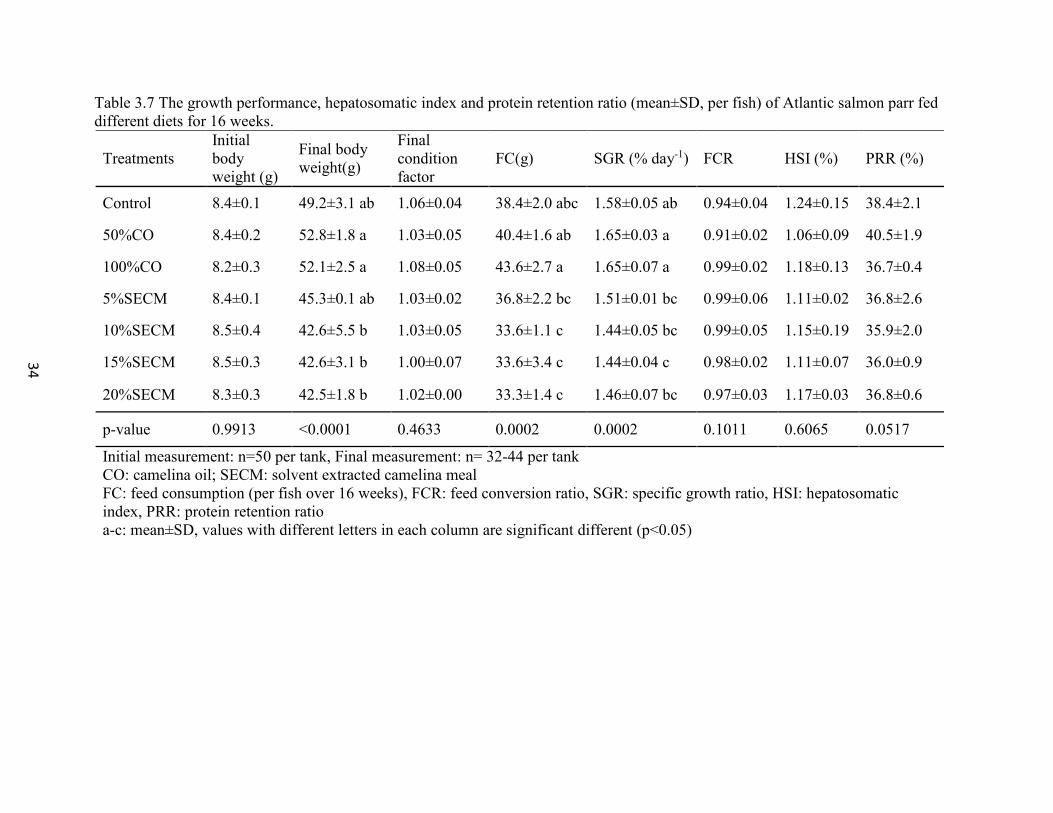
34
Table 3.7 The growth performance, hepatosomatic index and protein retention ratio (mean±SD, per fish) of Atlantic salmon parr fed
different diets for 16 weeks.
Treatments
Initial
body
weight (g)
Final body
weight(g)
Final
condition
factor
FC(g) SGR (% day-1) FCR HSI (%) PRR (%)
Control 8.4±0.1 49.2±3.1 ab 1.06±0.04 38.4±2.0 abc 1.58±0.05 ab 0.94±0.04 1.24±0.15 38.4±2.1
50%CO 8.4±0.2 52.8±1.8 a 1.03±0.05 40.4±1.6 ab 1.65±0.03 a 0.91±0.02 1.06±0.09 40.5±1.9
100%CO 8.2±0.3 52.1±2.5 a 1.08±0.05 43.6±2.7 a 1.65±0.07 a 0.99±0.02 1.18±0.13 36.7±0.4
5%SECM 8.4±0.1 45.3±0.1 ab 1.03±0.02 36.8±2.2 bc 1.51±0.01 bc 0.99±0.06 1.11±0.02 36.8±2.6
10%SECM 8.5±0.4 42.6±5.5 b 1.03±0.05 33.6±1.1 c 1.44±0.05 bc 0.99±0.05 1.15±0.19 35.9±2.0
15%SECM 8.5±0.3 42.6±3.1 b 1.00±0.07 33.6±3.4 c 1.44±0.04 c 0.98±0.02 1.11±0.07 36.0±0.9
20%SECM 8.3±0.3 42.5±1.8 b 1.02±0.00 33.3±1.4 c 1.46±0.07 bc 0.97±0.03 1.17±0.03 36.8±0.6
p-value 0.9913 <0.0001 0.4633 0.0002 0.0002 0.1011 0.6065 0.0517
Initial measurement: n=50 per tank, Final measurement: n= 32-44 per tank
CO: camelina oil; SECM: solvent extracted camelina meal
FC: feed consumption (per fish over 16 weeks), FCR: feed conversion ratio, SGR: specific growth ratio, HSI: hepatosomatic
index, PRR: protein retention ratio
a-c: mean±SD, values with different letters in each column are significant different (p<0.05)
34
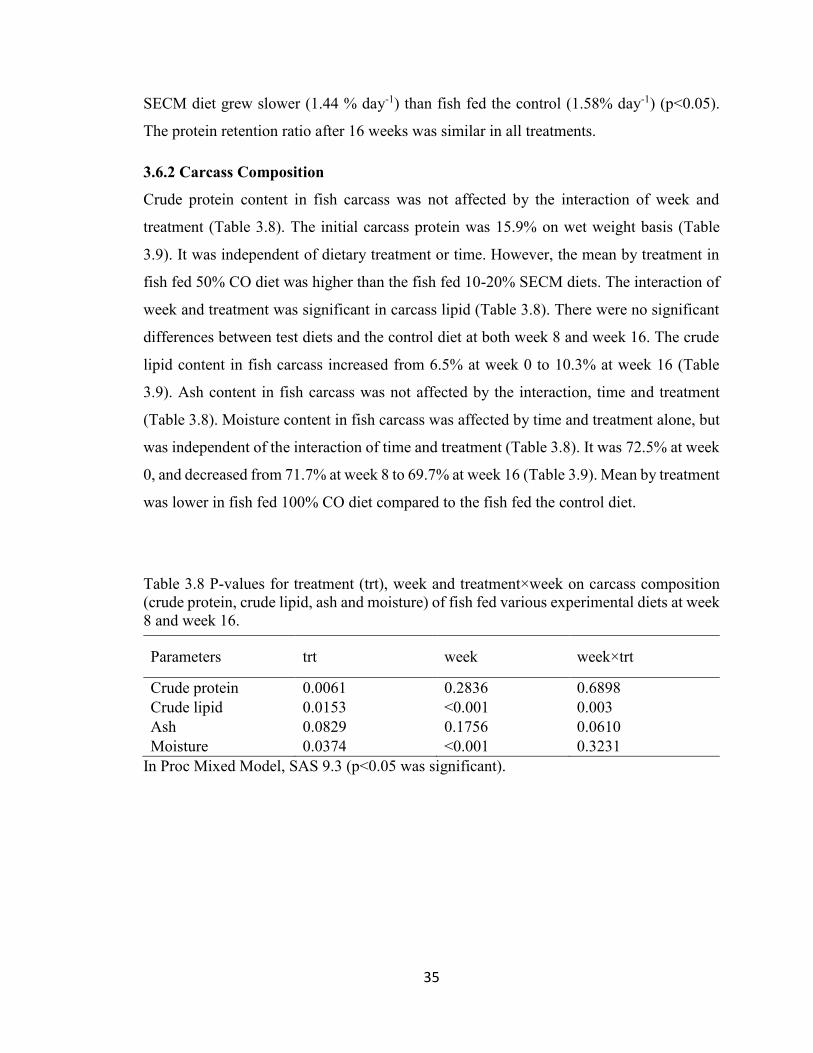
35
SECM diet grew slower (1.44 % day-1) than fish fed the control (1.58% day-1) (p<0.05).
The protein retention ratio after 16 weeks was similar in all treatments.
3.6.2 Carcass Composition
Crude protein content in fish carcass was not affected by the interaction of week and
treatment (Table 3.8). The initial carcass protein was 15.9% on wet weight basis (Table
3.9). It was independent of dietary treatment or time. However, the mean by treatment in
fish fed 50% CO diet was higher than the fish fed 10-20% SECM diets. The interaction of
week and treatment was significant in carcass lipid (Table 3.8). There were no significant
differences between test diets and the control diet at both week 8 and week 16. The crude
lipid content in fish carcass increased from 6.5% at week 0 to 10.3% at week 16 (Table
3.9). Ash content in fish carcass was not affected by the interaction, time and treatment
(Table 3.8). Moisture content in fish carcass was affected by time and treatment alone, but
was independent of the interaction of time and treatment (Table 3.8). It was 72.5% at week
0, and decreased from 71.7% at week 8 to 69.7% at week 16 (Table 3.9). Mean by treatment
was lower in fish fed 100% CO diet compared to the fish fed the control diet.
Table 3.8 P-values for treatment (trt), week and treatment×week on carcass composition
(crude protein, crude lipid, ash and moisture) of fish fed various experimental diets at week
8 and week 16.
In Proc Mixed Model, SAS 9.3 (p<0.05 was significant).
Parameters trt week week×trt
Crude protein 0.0061 0.2836 0.6898
Crude lipid 0.0153 <0.001 0.003
Ash 0.0829 0.1756 0.0610
Moisture 0.0374 <0.001 0.3231

36
Table 3.9 Carcass composition of Atlantic salmon parr fed various experimental diets for 16 weeks (mean±SD, on wet weight basis).
Control
Camelina oil Solvent extracted camelina meal Mean by
week 50% 100% 5% 10% 15% 20%
Crude protein (%)
Initial 15.9±0.1
Wk 8 15.3±0.2 16.1±0.7 15.8±0.3 15.4±0.2 15.3±0.2 15.4±0.3 15.3±0.3 15.5±0.5
Wk 16 15.8±0.4 16.0±0.4 15.8±0.3 15.7±0.2 15.4±0.3 15.4±0.1 15.4±0.2 15.6±0.3
Mean by trt 15.5±0.4 ab 16.0±0.6 a 15.8±0.3 ab 15.6±0.2 ab 15.3±0.3 b 15.4±0.2 b 15.4±0.3 b
Crude lipid (%)
Initial 6.5±0.0
Wk 8 8.0±0.1ef 8.7±0.7 cdef 9.4±0.1bcde 8.3±0.5 def 7.9±0.2 f 8.0±0.5 ef 8.8±0.4 cdef 8.4±0.6
Wk 16 9.7±0.4 abcd 9.9±0.2 abc 10.0±0.3 abc 9.8±0.9 abcd 10.6±0.5 ab 11.1±0.6 a 11.0±0.4 a 10.3±0.7
Mean by trt 8.9±0.9 9.3±0.8 9.7±0.4 9.0±0.1.0 9.3±1.5 9.5±1.7 9.9±1.1
Ash (%)
Iinitial 2.9±0.1
Wk 8 1.8±0.3 2.1±0.3 2.1±0.3 2.4±0.1 2.4±0.1 2.3±0.3 2.2±0.2 2.2±0.3
Wk 16 2.3±0.1 2.3±0.2 2.2±0.4 2.3±0.2 2.3±0.2 2.2±0.3 2.3±0.3 2.3±0.2
Mean by trt 2.0±0.3 2.2±0.3 2.2±0.4 2.3±0.2 2.3±0.2 2.3±0.3 2.3±0.2
Moisture (%)
Initial 72.5±0.0
Wk 8 72.6±0.6 70.9±1.2 70.4±1.1 71.8±1.2 72.6±0.3 72.3±0.6 71.7±0.3 71.7±1.1a
Wk 16 70.2±0.4 69.7±0.3 69.2±1.0 69.9±1.0 69.5±1.4 69.5±0.3 69.6±0.4 69.7±0.7 b
Mean by trt 71.4±1.4 a 70.3±1.0 ab 69.8±1.1 b 70.9±1.4 ab 71.1±1.9 ab 70.9±1.6 ab 70.6±1.2 ab
Wk: week; trt: treatment
a-f: mean±SD, Values with different letters refer to significant differences
Initial values were not included in the statistical analysis
36

37
3.6.3 Hindgut Histology
The length and area of simple villi in the hindgut increased from week 1 to week 16, but
the width did not change (Table 3.10). The length, width and area of simple villi were
unaffected by the treatment (p≥0.05). The length of simple villi in the hindgut grew from
0.36 to 0.59 mm in the fish fed the control diet, and the area increased from 0.05 to 0.08
mm2, but the width (0.13 mm) did not change after 16 weeks. The size of complex villi
(length, width and area) in the hindgut increased from week 1 to week 16. There were no
significant differences among treatments (p≥0.05).
Table 3.10 The length, width, and area of simple villi and complex villi (mean±SD) in
Atlantic salmon parr hindgut at Week 16 (n=18 per treatment).
Simple villi Complex villi
Length
(mm)
Width
(mm)
Area
(mm2)
Length
(mm)
Width
(mm)
Area
(mm2)
Initial 0.36±0.07 0.13±0.04 0.05±0.02 1.66±0.67 0.30±0.06 0.57±0.27
Week 16
Control 0.59±0.14 0.13±0.02 0.08±0.03 2.95±1.36 0.63±0.30 2.30±2.11
50%CO 0.53±0.11 0.14±0.02 0.08±0.02 2.64±1.04 0.52±0.17 1.28±0.58
100%CO 0.60±0.12 0.14±0.02 0.09±0.02 2.07±1.08 0.55±0.25 1.14±0.76
5%SECM 0.57±0.14 0.14±0.03 0.09±0.03 3.31±1.53 0.57±0.28 2.02±1.40
10%SECM 0.59±0.18 0.15±0.02 0.09±0.03 2.99±1.23 0.86±0.35 2.34±1.59
15%SECM 0.55±0.15 0.13±0.02 0.08±0.02 2.09±0.67 0.62±0.25 1.28±0.61
20%SECM 0.63±0.15 0.15±0.03 0.10±0.04 2.76±1.46 0.56±0.29 1.57±1.04
P-value 0.66 0.015α 0.331 0.12 0.146 0.099
CO: camelina oil; SECM: solvent extracted camelina meal α p<0.05 in ANOVA, but Tukey-Kramer test did not show significant differences.
There was no treatment effect on MF, SNV, GC and SM in the hindgut at week 16 (Table
3.11). The mean scores of MF, SNV, GC and SM were all under 2.5. The higher score
represented worse conditions in gut. Some moderate morphological changes were observed,
but there was no sign of severe inflammation. In the lamina propria, the control (1.7) was
significantly lower than 15% (2.3) and 20% SECM (2.5) (p<0.05), but was significantly
higher than 50% CO (1.2) (p<0.05). There was no difference between CO groups (p≥0.05).

38
Among the SECM groups, 5%SECM was significantly lower than 20% SECM, 10%
SECM was significantly lower than 15 and 20% SECM (p<0.05).
Table 3.11 The scores (mean±SD) of different histological parameters in Atlantic salmon parr
hindgut (n=18 per treatment).
MF SNV GC LP SM
Control 1.4±0.7 1.6±0.7 1.7±0.8 1.7±0.5 1.0±0
50%CO 1.6±0.6 2±0.8 1.7±0.9 1.2±0.4 1.0±0
100%CO 1.8±0.9 2±1.0 2.1±0.8 1.4±0.6 1.0±0
5%SECM 1.8±0.9 1.6±0.8 1.8±0.8 1.8±0.9 1.0±0
10%SECM 1.8±0.9 1.6±0.6 2.1±0.7 1.9±0.6 1.0±0
15%SECM 2.3±1.1 2.2±0.9 1.8±0.4 2.3±0.5 1.0±0
20%SECM 1.9±0.7 2.1±0.5 2.1±0.5 2.6±0.8 1.0±0
Kruskal-Wallis Test 0.148 0.094 0.234 0.000 1.000
Mann-Whitney test
Control vs 50%CO ns ns ns 0.015 ns
Control vs 100%CO ns ns ns NS ns
Control vs 5%SECM ns ns ns NS ns
Control vs 10%SECM ns ns ns NS ns
Control vs 15%SECM ns ns ns 0.001 ns
Control vs 20%SECM ns ns ns 0.0003 ns
50%CO vs 100%CO ns ns ns NS ns
5%SECM vs 10%SECM ns ns ns NS ns
5%SECM vs 15%SECM ns ns ns NS ns
5%SECM vs 20%SECM ns ns ns 0.0248 ns
10% SECM vs 15%SECM ns ns ns 0.0148 ns
10% SECM vs 20%SECM ns ns ns 0.0023 ns
15%SECM vs 20%SECM ns ns ns NS ns
CO: camelina oil; SECM: solvent extracted camelina meal
MF: mucosal fold; SNV: superanuclear vacuoles; GC: goblet cell; LP: lamina propria; SM:
sub-mucosal
NS: no significant difference
39
3.7 Discussion
3.7.1 Growth Performance
The result supported a previous study indicating that CO could efficiently replace 100% of fish oil
in fish diets without compromising growth of rainbow trout (Hixson et al., 2014a). The differences
in weight gain and feed consumption between CO and SECM groups (Table 3.6) demonstrated
that weight gain was positively associated with the feed consumption. Mawson et al. (1993)
indicated that the reduction of palatability in the diet was due to the increased dose of
glucosinolates, and the palatability was improved by adding low glucosinolate rapeseed meal (1-
5 µmol/g glucosinolates) at 30% in the diet for calves and dairy cows. The feed consumption
between the control and the SECM diets was statistically similar. Therefore, the range of
glucosinolates, in the current diets between 1.8-7.4 μmol/g did not reduce feed consumption of
Atlantic salmon parr. The similar FCR demonstrated that fish could metabolize camelina diets
equally as control diet.
Atlantic salmon parr (initial weight: 5.5 g) showed lower final weights when fed plant protein
blends (soybean protein concentrate, wheat gluten meal and corn gluten meal) substitute for 50,
66, and 87% fish meal in the diets (Burr et al., 2012). In the current study, SECM was added at an
inclusion rate in the diet, but was partial replacement of fish meal. It accounted for up to 23%
replacement of fish meal (32% in the control diet) in 20% SECM, which was much lower than 50%
replacement of fish meal stated by Burr et al. (2012). In a later trial (Burr et al, 2012), the growth
of Atlantic salmon (initial weight: 31.5 g) fed diets where fish meal was completely replaced by
plant protein blends or land animal protein blends was as good as control fed fish. These different
results demonstrated that late stage juvenile salmon could tolerate non-fish meal protein better than
the early juvenile stage. By contrast, Refstie et al. (2000) indicated that 44% reduction of body
weight in large salmon (initial weight: 200g) was found, when 37% of fish meal was substituted
by soybean meal in the diet. Canola protein concentrate could replace 13-16% of dietary protein
fed to juvenile chinook salmon without inhibiting somatic growth (Higgs et al., 1982). In the
current study, camelina meal comprised up to 17.7% of dietary protein in 20% SECM diet, and
this test diet did not affect the SGR.
The amount of glucosinolate per kg fish body weight consumed per day was 87 µmol/kg /day (not
listed in results) in the diet containing 20%SECM, following the calculation method of Burel et al.
40
(2000). This value was about two-fold greater than 30-47 µmol/kg fish/day, which compromised
growth of rainbow trout in a 9-week trial (Burel et al., 2000). The growth reduction was induced
by the glucosinolate breakdown products, and the threshold level of glucosinolates and their
byproducts was suggested to be 3.7 µmol/g of diet (Burel et al., 2001). The level of glucosinolates
byproducts in the present diets was unknown, but 15 and 20% SECM diets contained total
glucosinolates over 3.7 µmol/g diet. Fish fed 15% SECM did show lower weight gain (week 13 to
16) and SGR compared to fish fed the control diet (SGR: 1.44 vs 1.58), but fish fed 20% SECM
diet did not. The reason was not clear. Rainbow trout fed the diet containing 30% of rapeseed meal
had similar growth to the fish fed the control diet for two months, because of the triiodothyronine
(T3) in plasma was compensated by Thyroxine (T4) (Burel et al., 2001). It might be valid in Atlantic
salmon parr, so total glucosinolates up to7.4 µmol/g in the diets did not trigger severe body weight
reduction in 16 weeks in this study. A longer trial may need to justify the negative effects of high
level of SECM. The proximate levels of other antinutritional factors can be estimated according to
the values reported in the literatures (Chapter 2). In the 20% SECM diet, the proximate levels of
tannins, sinapine and phytic acid in the diet were likely in the range 0.02-0.053%, 0.038~0.093%
and 0.42% respectively. The concentration of tannins was much lower than 0.57-1.14%, which
partially inhibited the growth of carp (Hossain and Jauncey, 1989). The differences among species
should be taken into account. The detrimental level of sinapine remains unknown. The calculated
phytic acid was lower than the safe level for Atlantic salmon parr at 0.47-1.0% (Denstadli et al.,
2006).
3.7.2 Carcass Composition
Carcass protein and protein retention ratio were not affected by the concentration of SECM, which
were in agreement with the results in other studies using plant meal inclusion diets for Atlantic
salmon (Carter and Hauler, 2000; Espe et al., 2006; Overland et al., 2009). All treatment groups
had a similar FCR, indicating they received adequate amounts of protein and deposited dietary
protein in growing tissues without withdrawing protein from less vital tissues (Lall and Anderson,
2005). Although 50% and 100% CO groups showed similar levels of crude fat as the control, it
was reported that CO reduced the long-chain PUFA levels and elevated 18:3n-3 and 18:2n-6 levels
in Atlantic cod (Morais et al., 2012; Hixson et al., 2013).
41
3.7.3 Hindgut Histology
The structure of villi was not affected by feeding SECM or CO, but the structure grew as fish size
increased. The length of simple villi in the fish fed control diet was lower than 1 mm in 550g
salmon (Baeverfjord and Krogdahl, 1996), but higher than 0.26 mm in 108g salmon (Sanden et al.,
2005). The length, width and area of complex villi increased after 16 weeks, but were highly
variable (Table 3.10). The morphology of simple villi in Atlantic salmon was depressed by feeding
33% soybean meal (Baeverfjord and Krogdahl, 1996), but not by feeding 12.5% soybean meal or
12.1% maize (Sanden et al., 2005). It demonstrated that the morphological changes depended on
the dose of plant ingredient. In the present study the gut morphology indicated 20% SECM
inclusion rate was acceptable.
Fish gastro-intestinal tracts were collected after one day of fasting in the current study.
Morphological changes can be initiated after two days of starvation (Baeverfjord and Krogdahl,
1996). In the fish fed control diet, mucosal fold (MF) or villi had slight shrinkage and bloating
(mean score: 1.4), supranuclear vacuoles (SNV) with some size reduction (mean score: 1.6), goble
cells (GC) with increased number and sparse distribution (mean score: 1.7), LP with increased size
(mean score: 1.7) and sub-mucosa (SM) was normal (mean score: 1.0) (Table 3.11). Higher
temperature (12 °C vs 8 °C) increased the metabolic rate in fish, and enhanced the soybean induced
enteritis process in 20 days (Uran et al., 2008b). Camelina byproducts caused somewhat less
moderate inflammation signs, but only fish fed 15% and 20% SECM diets differed from the fish
fed control at 12 °C (Table 3.11). This study agreed with the dose-dependent theory (Krogdahl et
al., 2003; Uran et al., 2009). Increased size of LP was present in fish fed 15% (2.3) and 20% SECM
diets (2.6). There was no literature describing the effects of antinutritional factors in camelina on
gut histology. The widened LP might be due to the infiltration of eosinophilic granular cells,
macrophages and polymorphnuclear leucocytes into LP and the epithelial lining (Baeverfjord and
Krodahl, 1996), and the increased levels of immunoglobulin M (Ig M) and neurophilic
granulocytes in LP (Bakke-McKellep et al., 2000). When Atlantic salmon were under stress and
infection conditions, neutrophils and eosinophils had high invasive capacity and activation
reaction, as a result of penetration in the intestinal epithelium (reviewed by Rombout et al., 2011)
and the LP was widened. Defense responses in hindgut epithelial cells and increased number and
diversity of microbiota were reported in soybean induced enteritis (Bakke-McKellep et al., 2007).
Surprisingly, fish fed 50% CO (1.2) showed better LP condition than fish fed the control diet (1.7)
42
(p<0.05). This could not be explained on the basis of rudimentary state of knowledge in the
published literature.
3.8 Conclusion
Fish fed test diets had similar growth performance to the fish fed control diet, except fish fed 15%
SECM showed lower SGR. The glucosinolates at 1.8-3.3 µmol/g did not trigger significant
reduction in feed consumption and growth performance. Carcass composition (protein, fat, ash and
moisture as wet weight basis) and protein retention ratio in fish fed camelina byproduct diets were
similar to the control at week 16. The microstructure (length, width and area) of hindgut villi were
not altered by SECM or CO. However, lamina propria in the hindgut villi were widened in both of
15% SECM and 20% SECM. Further study on gut immunology in fish fed camelina byproducts
is needed. This study recommended 50% CO, 100% CO, 5% and 10% SECM in parr diet, but 10%
SECM should be used with caution.
43
Chapter 4 : The Effects of Camelina Oil and Solvent Extracted Camelina Meal on Growth
Performance, Carcass Composition and Hindgut Histology in Atlantic Salmon (Salmo salar)
Post-smolts in Seawater
4.1 Abstract
Atlantic salmon post-smolts (initial mean SD weight: 242±46 g) were fed fish meal and oil based
control diets, three graded levels (8, 16, and 24%) of solvent extracted camelina meal (SECM),
and four diets containing camelina oil (CO) replacing fish oil (100% CO, 100% CO+solvent
extracted fish meal (SEFM), 100% CO+SEFM+10% SECM, and 100% CO+10% SECM) for 16
weeks. They were reared at 14 °C seawater. SGR and FCR were not affected by treatments. Weight
gain was not compromised by feeding 100% CO (385±33 g) and 8% SECM (391±99 g) diets
compared to the control group (508±12 g), but was lower in fish fed 16% SECM, 24% SECM, and
complex 100% CO diets. Carcass compositions (fat, protein, ash and moisture) were similar among
all treatments (p≥0.05). CO and SECM did not affect the villi length, width and area compared to
controls (p≥0.05). However, severe diffusion of supranuclear vacuoles and thicker sub-mucosal
layer were observed in 24% SECM. This study indicated 8% inclusion of SECM and up to 100%
CO in practical diets for Atlantic salmon post-smolts. It indirectly reflexed that 2.6 μmol/g
glucosinolates did not inhibit the growth.
4.2 Introduction
Feed cost accounts for up to 50% of total budget in a salmon sea-cage farm. Fish meal and fish oil
are the two key ingredients in salmon feed, but the prices of these two ingredients have
substantially increased in recent years. Alternative protein and lipid sources are required to achieve
economic, sustainable salmon production. Full substitution of fish oil by camelina oil (CO) can be
applied in Atlantic cod (Hixson et al., 2013), rainbow trout (Hixson et al., 2014a) and Atlantic
salmon parr (Chapter 3) diets without negative growth response. Camelina oil is deficient in
eicosapentaenoic acid (EPA) and docosahexaenoic acid (DHA), while rich in α-linolenic acid
(18:3n-3). Salmonid species are able to convert 18:3n-3 fatty acid to DHA (Buzzi et al., 1997;
Tocher et al., 1997 and Hastings et al., 2004), but the conversion rate was not clear. In addition,
the fish oil residue in the fish meal supplies small amounts of EPA and DHA. The effect of a fish
oil devoid diet on Atlantic salmon growth remains unknown. Thus, solvent extracted fish meal
(SEFM), a fish oil-free meal, was used to replace the regular fish meal. The effects of SECM, CO
or the combination of both on the growth of Atlantic salmon post-smolt are not clear. Up to 20%
SECM did not reduce the final body weight of parr (Chapter 3). Atlantic salmon post-smolt have
lower dietary protein requirement than parr (40 vs. 44-48%) (NRC, 2011), thus a higher level of
SECM (24 vs. 20% in Chapter 3) was tested in this study due to differences in the two life stages.
44
The carcass composition of parr was independent of dietary treatments (Chapter 3), but the effects
of camelina byproducts on carcass composition of post-smolts remain unknown. Widened lamina
propria was evident in the parr fed 15 and 20% SECM diets. This condition was considered as
hindgut enteritis (Chapter 3). The histological evaluation for the parr study should be conducted
at post-smolts. Post-smolts had decreased paracellular permeability in the posterior intestine, and
transcellular pathway became dominant in directing water flow in post-smolts (Sundell et al.,
2003). Therefore, post-smolts fed diets containing camelina byproducts may show different
responses in the hindgut histology.
The growth result including CO diets has been published by Hixson et al. (2014b), the statistical
method was a three-way nested ANOVA in a General Linear Model (individual fish as a unit) or
two-way ANOVA (tank as a unit). In current study, the growth data of fish fed CO diets and SECM
diets were analysed by repeated measures in a Mixed Model (tank as a unit). Carcass analysis and
the evaluation of hindgut histology were the unique parts of this study.
4.3 Objectives
This study quantified the growth performance, carcass composition (moisture, protein, fat and ash)
and gut histology of Atlantic salmon smolts fed eight practical diets: Control containing local fish
oil and fish meal, 100% CO+solvent extracted fish meal (SEFM), 100% CO+10 %SECM+SEFM,
100% CO+ fish meal (FM), 100% CO+10% SECM+FM, 8% SECM, 16% SECM, 24% SECM.
4.4 Hypothesis
The growth of fish fed 100% CO+SEFM, 100% CO+10% SECM+SEFM and 24% SECM diets
would be compromised. Fish fed the other test diets would show similar growth response to fish
fed the control diet.
The carcass composition (moisture, protein, fat and ash) would be similar among all treatments.
Diets containing 16% and 24% SECM would have negative impact on the gut histology in fish.
4.5 Materials and Methods
4.5.1 Preparation of Test Ingredients and Feed Formulations
The study used a variety of camelina called Calena. The preparation of camelina oil (CO) and
solvent extracted camelina meal (SECM) were the same as described the trial on parr (Chapter 3).
Diets were formulated to be isonitrogenous (44%) and isocaloric (4400 Kcal/kg, Table 4.1)
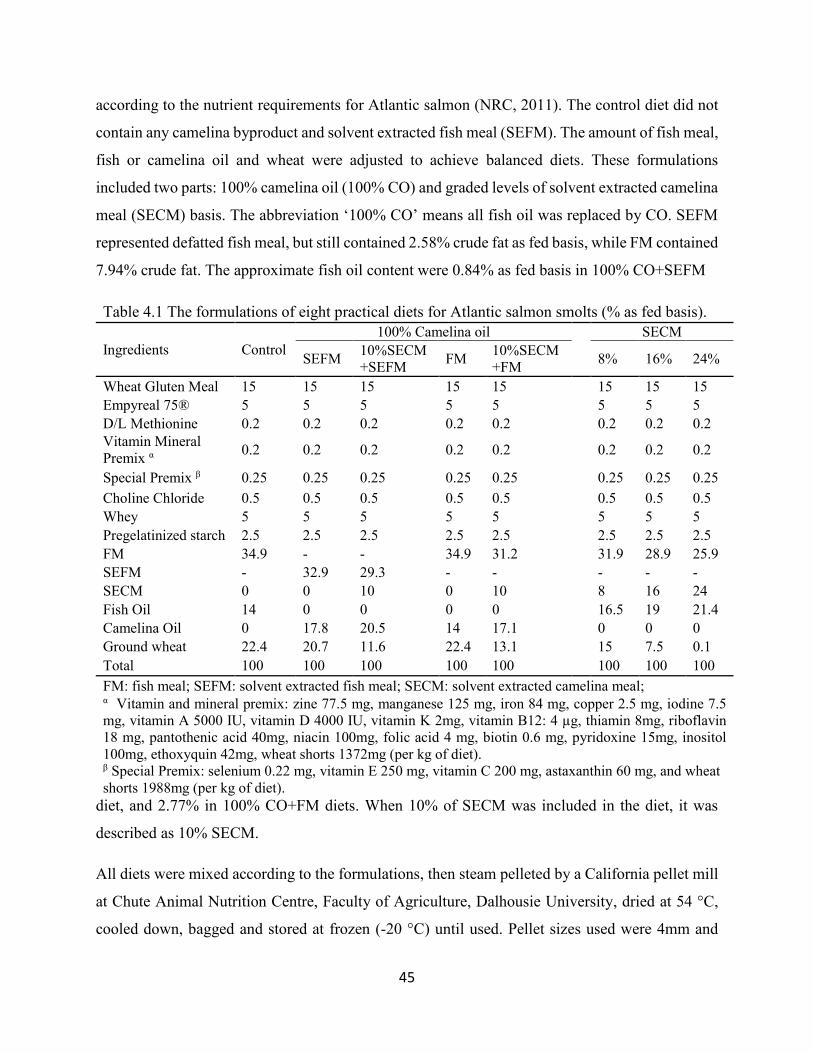
45
according to the nutrient requirements for Atlantic salmon (NRC, 2011). The control diet did not
contain any camelina byproduct and solvent extracted fish meal (SEFM). The amount of fish meal,
fish or camelina oil and wheat were adjusted to achieve balanced diets. These formulations
included two parts: 100% camelina oil (100% CO) and graded levels of solvent extracted camelina
meal (SECM) basis. The abbreviation ‘100% CO’ means all fish oil was replaced by CO. SEFM
represented defatted fish meal, but still contained 2.58% crude fat as fed basis, while FM contained
7.94% crude fat. The approximate fish oil content were 0.84% as fed basis in 100% CO+SEFM
Table 4.1 The formulations of eight practical diets for Atlantic salmon smolts (% as fed basis).
Ingredients Control
100% Camelina oil SECM
SEFM 10%SECM
+SEFM FM
10%SECM
+FM 8% 16% 24%
Wheat Gluten Meal 15 15 15 15 15 15 15 15
Empyreal 75® 5 5 5 5 5 5 5 5
D/L Methionine 0.2 0.2 0.2 0.2 0.2 0.2 0.2 0.2
Vitamin Mineral
Premix α 0.2 0.2 0.2 0.2 0.2 0.2 0.2 0.2
Special Premix β 0.25 0.25 0.25 0.25 0.25 0.25 0.25 0.25
Choline Chloride 0.5 0.5 0.5 0.5 0.5 0.5 0.5 0.5
Whey 5 5 5 5 5 5 5 5
Pregelatinized starch 2.5 2.5 2.5 2.5 2.5 2.5 2.5 2.5
FM 34.9 - - 34.9 31.2 31.9 28.9 25.9
SEFM - 32.9 29.3 - - - - -
SECM 0 0 10 0 10 8 16 24
Fish Oil 14 0 0 0 0 16.5 19 21.4
Camelina Oil 0 17.8 20.5 14 17.1 0 0 0
Ground wheat 22.4 20.7 11.6 22.4 13.1 15 7.5 0.1
Total 100 100 100 100 100 100 100 100
FM: fish meal; SEFM: solvent extracted fish meal; SECM: solvent extracted camelina meal; α Vitamin and mineral premix: zine 77.5 mg, manganese 125 mg, iron 84 mg, copper 2.5 mg, iodine 7.5
mg, vitamin A 5000 IU, vitamin D 4000 IU, vitamin K 2mg, vitamin B12: 4 µg, thiamin 8mg, riboflavin
18 mg, pantothenic acid 40mg, niacin 100mg, folic acid 4 mg, biotin 0.6 mg, pyridoxine 15mg, inositol
100mg, ethoxyquin 42mg, wheat shorts 1372mg (per kg of diet). β Special Premix: selenium 0.22 mg, vitamin E 250 mg, vitamin C 200 mg, astaxanthin 60 mg, and wheat
shorts 1988mg (per kg of diet).
diet, and 2.77% in 100% CO+FM diets. When 10% of SECM was included in the diet, it was
described as 10% SECM.
All diets were mixed according to the formulations, then steam pelleted by a California pellet mill
at Chute Animal Nutrition Centre, Faculty of Agriculture, Dalhousie University, dried at 54 °C,
cooled down, bagged and stored at frozen (-20 °C) until used. Pellet sizes used were 4mm and
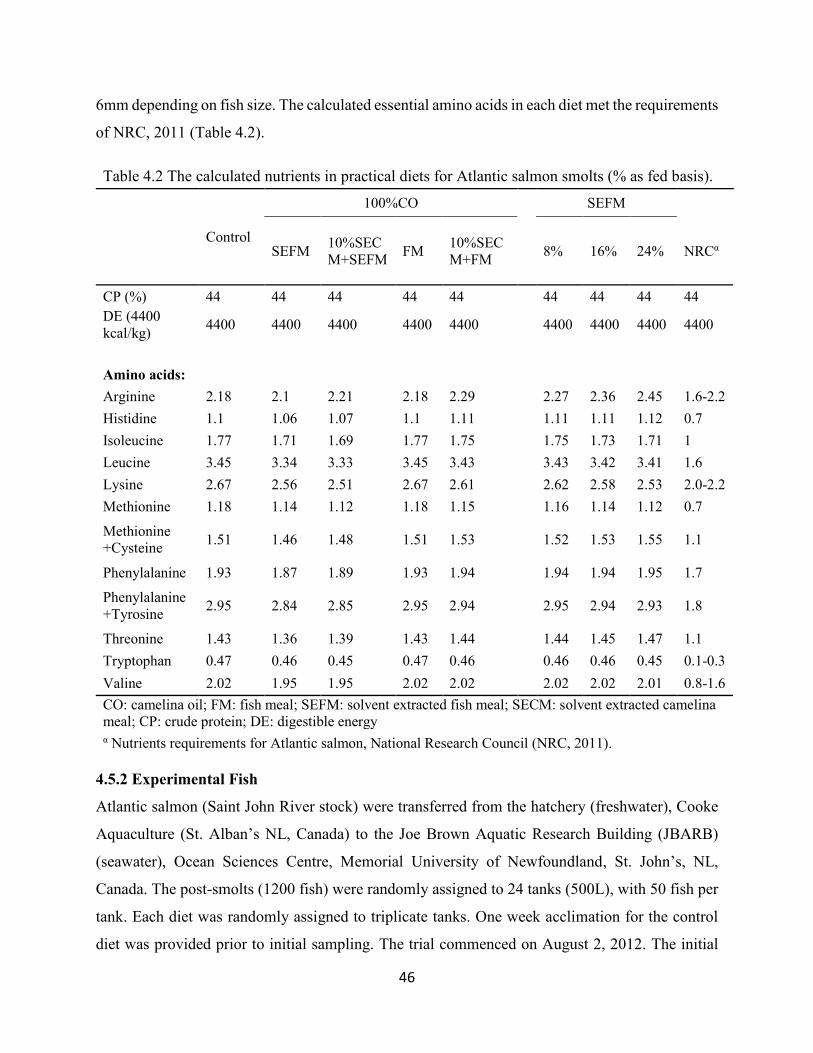
46
6mm depending on fish size. The calculated essential amino acids in each diet met the requirements
of NRC, 2011 (Table 4.2).
Table 4.2 The calculated nutrients in practical diets for Atlantic salmon smolts (% as fed basis).
Control
100%CO SEFM
SEFM 10%SEC
M+SEFM FM
10%SEC
M+FM
8% 16% 24% NRCα
CP (%) 44 44 44 44 44 44 44 44 44
DE (4400
kcal/kg) 4400 4400 4400 4400 4400 4400 4400 4400 4400
Amino acids:
Arginine 2.18 2.1 2.21 2.18 2.29 2.27 2.36 2.45 1.6-2.2
Histidine 1.1 1.06 1.07 1.1 1.11 1.11 1.11 1.12 0.7
Isoleucine 1.77 1.71 1.69 1.77 1.75 1.75 1.73 1.71 1
Leucine 3.45 3.34 3.33 3.45 3.43 3.43 3.42 3.41 1.6
Lysine 2.67 2.56 2.51 2.67 2.61 2.62 2.58 2.53 2.0-2.2
Methionine 1.18 1.14 1.12 1.18 1.15 1.16 1.14 1.12 0.7
Methionine
+Cysteine 1.51 1.46 1.48 1.51 1.53 1.52 1.53 1.55 1.1
Phenylalanine 1.93 1.87 1.89 1.93 1.94 1.94 1.94 1.95 1.7
Phenylalanine
+Tyrosine 2.95 2.84 2.85 2.95 2.94 2.95 2.94 2.93 1.8
Threonine 1.43 1.36 1.39 1.43 1.44 1.44 1.45 1.47 1.1
Tryptophan 0.47 0.46 0.45 0.47 0.46 0.46 0.46 0.45 0.1-0.3
Valine 2.02 1.95 1.95 2.02 2.02 2.02 2.02 2.01 0.8-1.6
CO: camelina oil; FM: fish meal; SEFM: solvent extracted fish meal; SECM: solvent extracted camelina
meal; CP: crude protein; DE: digestible energy α Nutrients requirements for Atlantic salmon, National Research Council (NRC, 2011).
4.5.2 Experimental Fish
Atlantic salmon (Saint John River stock) were transferred from the hatchery (freshwater), Cooke
Aquaculture (St. Alban’s NL, Canada) to the Joe Brown Aquatic Research Building (JBARB)
(seawater), Ocean Sciences Centre, Memorial University of Newfoundland, St. John’s, NL,
Canada. The post-smolts (1200 fish) were randomly assigned to 24 tanks (500L), with 50 fish per
tank. Each diet was randomly assigned to triplicate tanks. One week acclimation for the control
diet was provided prior to initial sampling. The trial commenced on August 2, 2012. The initial
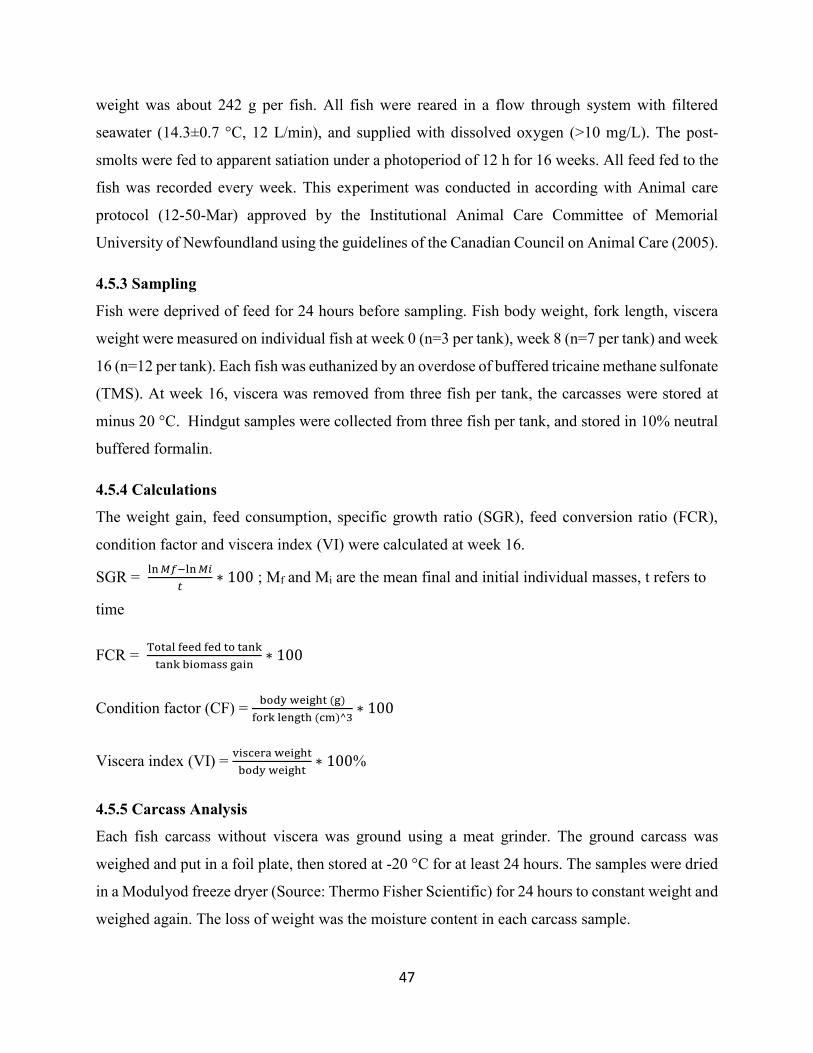
47
weight was about 242 g per fish. All fish were reared in a flow through system with filtered
seawater (14.3±0.7 °C, 12 L/min), and supplied with dissolved oxygen (>10 mg/L). The post-
smolts were fed to apparent satiation under a photoperiod of 12 h for 16 weeks. All feed fed to the
fish was recorded every week. This experiment was conducted in according with Animal care
protocol (12-50-Mar) approved by the Institutional Animal Care Committee of Memorial
University of Newfoundland using the guidelines of the Canadian Council on Animal Care (2005).
4.5.3 Sampling
Fish were deprived of feed for 24 hours before sampling. Fish body weight, fork length, viscera
weight were measured on individual fish at week 0 (n=3 per tank), week 8 (n=7 per tank) and week
16 (n=12 per tank). Each fish was euthanized by an overdose of buffered tricaine methane sulfonate
(TMS). At week 16, viscera was removed from three fish per tank, the carcasses were stored at
minus 20 °C. Hindgut samples were collected from three fish per tank, and stored in 10% neutral
buffered formalin.
4.5.4 Calculations
The weight gain, feed consumption, specific growth ratio (SGR), feed conversion ratio (FCR),
condition factor and viscera index (VI) were calculated at week 16.
SGR = ln 𝑀𝑓−ln 𝑀𝑖
𝑡∗ 100 ; Mf and Mi are the mean final and initial individual masses, t refers to
time
FCR = Total feed fed to tank
tank biomass gain∗ 100
Condition factor (CF) = body weight (g)
fork length (cm)^3∗ 100
Viscera index (VI) = viscera weight
body weight∗ 100%
4.5.5 Carcass Analysis
Each fish carcass without viscera was ground using a meat grinder. The ground carcass was
weighed and put in a foil plate, then stored at -20 °C for at least 24 hours. The samples were dried
in a Modulyod freeze dryer (Source: Thermo Fisher Scientific) for 24 hours to constant weight and
weighed again. The loss of weight was the moisture content in each carcass sample.
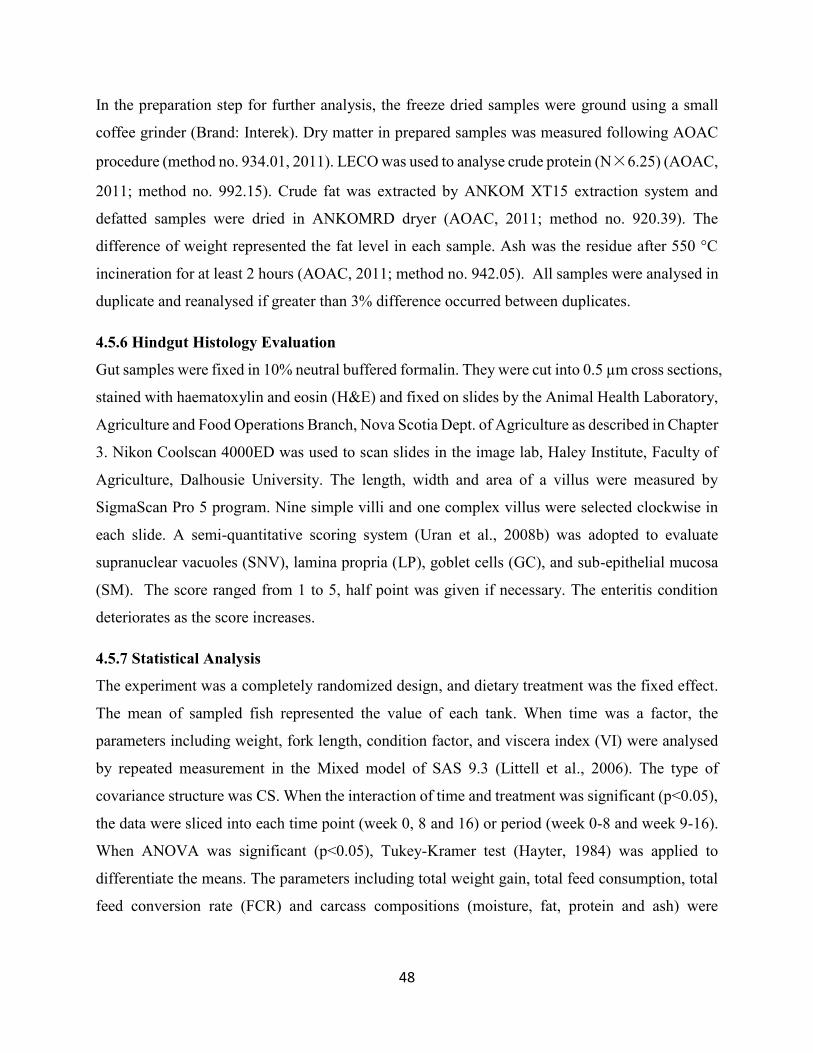
48
In the preparation step for further analysis, the freeze dried samples were ground using a small
coffee grinder (Brand: Interek). Dry matter in prepared samples was measured following AOAC
procedure (method no. 934.01, 2011). LECO was used to analyse crude protein (N×6.25) (AOAC,
2011; method no. 992.15). Crude fat was extracted by ANKOM XT15 extraction system and
defatted samples were dried in ANKOMRD dryer (AOAC, 2011; method no. 920.39). The
difference of weight represented the fat level in each sample. Ash was the residue after 550 °C
incineration for at least 2 hours (AOAC, 2011; method no. 942.05). All samples were analysed in
duplicate and reanalysed if greater than 3% difference occurred between duplicates.
4.5.6 Hindgut Histology Evaluation
Gut samples were fixed in 10% neutral buffered formalin. They were cut into 0.5 µm cross sections,
stained with haematoxylin and eosin (H&E) and fixed on slides by the Animal Health Laboratory,
Agriculture and Food Operations Branch, Nova Scotia Dept. of Agriculture as described in Chapter
3. Nikon Coolscan 4000ED was used to scan slides in the image lab, Haley Institute, Faculty of
Agriculture, Dalhousie University. The length, width and area of a villus were measured by
SigmaScan Pro 5 program. Nine simple villi and one complex villus were selected clockwise in
each slide. A semi-quantitative scoring system (Uran et al., 2008b) was adopted to evaluate
supranuclear vacuoles (SNV), lamina propria (LP), goblet cells (GC), and sub-epithelial mucosa
(SM). The score ranged from 1 to 5, half point was given if necessary. The enteritis condition
deteriorates as the score increases.
4.5.7 Statistical Analysis
The experiment was a completely randomized design, and dietary treatment was the fixed effect.
The mean of sampled fish represented the value of each tank. When time was a factor, the
parameters including weight, fork length, condition factor, and viscera index (VI) were analysed
by repeated measurement in the Mixed model of SAS 9.3 (Littell et al., 2006). The type of
covariance structure was CS. When the interaction of time and treatment was significant (p<0.05),
the data were sliced into each time point (week 0, 8 and 16) or period (week 0-8 and week 9-16).
When ANOVA was significant (p<0.05), Tukey-Kramer test (Hayter, 1984) was applied to
differentiate the means. The parameters including total weight gain, total feed consumption, total
feed conversion rate (FCR) and carcass compositions (moisture, fat, protein and ash) were

49
analysed by one-way ANOVA, Tukey-Kramer test in mixed model (SAS, 9.3). The models were
the same as described in Chapter 3.
The length, width and area of villi were analysed in one-way ANOVA, Tukey-Kramer test
(Minitab 16.2.2). The histological scores were analysed in Kruskal-Wallis test first (Minitab
16.2.2). If the p-value was less than 0.05, Mann-Whitney U-test would be used for pairwise
comparison. Significant difference was addressed between two groups when p-value was less than
0.05. If the Kruskal-Wallis test showed the p-value greater or equal to 0.05, then interpretation
stopped as there were no significant differences among all treatments.
4.6 Results
4.6.1 Experimental Diets
The analysed crude protein levels in all diets were up to 3% lower than the expected levels at 44%
(Table 4.3), but the levels ranged from 41.0 to 42.8% among treatments.
Table 4.3 Chemical analysis of the practical diets fed to Atlantic salmon post-smolts (% as fed
basis).
Control
100% Camelina oil SECM
SEFM 10%SECM
+SEFM FM
10%SECM
+FM 8% 16% 24%
Dry matter 91.2 89.9 90.7 90.8 92.1 93 92.1 92.3
Crude protein 42.7 41 41 42.5 42.7 42.8 41.5 42.1
Crude fat 17.9 20 22.6 17.5 20.6 19.9 22.3 24.6
Calcium (%) 1.7 1.4 1.3 1.5 1.5 1.5 1.4 1.3
Total
phosphorus (%) 1.1 1 1 1.1 1.1 1.1 1.1 1
Sodium (%) 0.4 0.4 0.4 0.4 0.4 0.4 0.3 0.3
Potassium (%) 0.4 0.5 0.6 0.5 0.6 0.5 0.6 0.6
Magnesium (%) 0.1 0.1 0.1 0.1 0.2 0.1 0.2 0.2
Manganese
(mg/kg) 131.4 154.7 132.8 139.8 141.3 159.1 147.1 156.2
Copper (mg/kg) 6.1 7.4 6.4 6.6 7.6 8.7 9.2 9.6
Zinc (mg/kg) 131.4 125.6 119.1 121.8 133.7 135.5 133.4 137
Glucosinolates
(μmol/g)α 0 0 3 0 4 2.6 5.1 8.7
SECM: solvent extracted camelina meal.
Feed (n=2) was analysed at Nova Scotia Agriculture quality evaluation division laboratory services, 176
College Road, Harlow Institute, Truro, NS, Canada. α The glucosinolates (n=2) were analysed by HPLC at Agriculture and Agri-Food Canada, Saskatoon,.

50
The difference of crude fat was up to 7% among all diets, 24% SECM diet was the highest one.
All diets contained similar levels of minerals with marginal variation (Table 4.3). The level of
glucosinolates increased from 2.6 μmol/g in 8%SECM diet to 8.7 μmol/g in 24% SECM diet, and
it was 3.0 μmol/g in 100%CO+10%SECM+FM and 4.0 μmol/g in 100%CO+10%SECM+SEFM
respectively (Table 4.3).
4.6.2 Growth Performance
All treatments had statistically similar initial mean body weight (mean±SD) and fork length at
242±46 g and 26.9±1.8 cm, respectively. However, the large variation should be concerned, and it
was due to the limited fish quantity for this experiment. The body weight of fish was similar among
all treatments at week 8 (p≥0.05, Table 4.4). Fish fed 8% SECM diet grew to 637±95 g in 16
weeks, which was statistically similar to the fish fed the control diet (738±13 g) (Table 4.4). The
final mean weight of fish fed the other test diets (546-622 g) were significantly lower than the
controls (p<0.05), and there were no significant differences among fish fed seven test diets. The
fork length of fish fed 100% CO+10% SECM+SEFM (32.8±0.5 cm) was significantly shorter than
that of fish fed the control diet (36.2±0.3 cm) (p<0.05). However, the condition factor was not
affected by the treatments (~1.5). During 16 weeks, fish fed 100% CO+FM (385±33 g) and 8%
SECM (391±99 g) diets gained similar weight to the fish fed the control diet (508±12 g) (p≥0.05),
while the fish fed other test diets gained less weight (298-359 g) than the control group (p<0.05).
However, fish fed 100% CO+FM diet had statistically lower final mean body weight (622±25 g)
to the control. Fish consumed a similar amount of 100%CO+FM diet (436±11 g/fish) to that of the
control diet (508±12 g/fish), and consumed lower amounts of the other test diets (384-420 g).
Viscera index (VI), specific growth rate (SGR) and feed conversion ratio (FCR) were similar
throughout the trial among all treatments.

51
Table 4.4 The growth performance, feed consumption and conversion ratio, and viscera index of Atlantic salmon post-smolts fed eight
experimental diets for 16 weeks.
Control
100% Camelina oil
SECM
p-value SEFM
10%SECM
+SEFM FM
10%SECM
+FM 8% 16% 24%
Initial body
weight (g)α 230±1 231±27 247±18 236±32 255±27 246±56 250±29 241±9 0.9865
Initial fork
length (cm)α 26.2±0.3 26.3±1.5 27.6±0.4 26.8±0.6 27.3±0.9 26.9±1.9 27.5±1.0 26.8±0.9 0.4794
Week 8 body
weight (g) α 467±8 393±17 398±38 399±20 390±51 438±25 365±44 407±51 0.0501
Final body
weight (g) α 738±13 a 590±32 b 546±11 b 622±25 b 608±60 b 637±95 ab 595±26 b 577±25 b <0.001
Final fork
length (cm) α 36.2±0.3 a 34.1±0.6 ab 32.8±0.5 b 34.5±0.5 ab 33.9±1.2 ab 34.8±1.4 ab 34.0±0.3 ab 33.9±0.4 ab 0.0048
Final
condition
factor β
1.55±0.03 1.48±0.01 1.53±0.04 1.50±0.05 1.54±0.02 1.47±0.08 1.50±0.02 1.47±0.02 0.1081
Weight gain
(g) β 508±12 a 359±56 b 298±24 b 385±33 ab 353±58 b 391±99 ab 345±44 b 336±18 b 0.0057
Feed
consumption
(g) β
515±8 a 400±29 b 381±46 b 436±11 ab 391±15 b 420±57 b 384±33 b 391.3±20 b 0.0016
VI (%) α 9.8±0.5 11.1±0.4 12.0±0.3 11.2±0.4 11.1±0.6 10.8±0.3 11.2±0.2 11.3±0.7 0.2195
SGR
(% day-1) β 1.04±0.01 0.84±0.15 0.71±0.07 0.87±0.12 0.78±0.11 0.86±0.23 0.78±0.12 0.78±0.02 0.112
FCR β 1.01±0.02 1.12±0.12 1.27±0.09 1.14±0.12 1.12±0.14 1.10±0.17 1.12±0.11 1.16±0.02 0.326
SECM: solvent extracted camelina meal; VI: viscera index; SGR: specific growth rate; FCR: feed conversion ratio
Initial measurements: n=3 per tank. Week 8 measurements: n=7 per tank; Final measurements: n=12 per tank. α repeated measurement analysis
β one-way ANOVA analysis
a-b: mean±SD, tank as a unity, triplicate tanks per treatment. Different letters in each row means significant differences (p<0.05).
51

52
4.6.3 Carcass Composition
Carcass composition was similar (p>0.05) among all treatments at week 16 (Table 4.5). The
carcass from fish fed control diet contained 68.2% moisture, 19.3% crude protein, 10.3% crude
lipid, and 2.0% ash on wet weight basis.
Table 4.5 The carcass compositions (moisture, crude protein, crude lipid and ash on dry matter basis) of
Atlantic salmon smolts fed eight experimental diets for 16 weeks.
Treatments Moisture % Crude Protein % Crude Lipid % Ash %
Control (n=5) 68.2±1.4 19.3±0.3 10.3±0.7 2.0±0.3
100% CO+SEFM (n=5) 67.4±0.9 20.0±0.2 10.8±0.9 1.8±0.1
100% CO+10% SECM+SEFM (n=5) 67.4±0.5 20.1±0.4 10.6±0.6 2.0±0.3
100% CO+FM(n=6) 68.2±1.4 19.9±0.4 9.3±1.7 2.1±0.2
100% CO+10% SECM+FM (n=5) 67.0±0.7 20.0±0.2 11.2±0.5 2.0±0.2
8% SECM (n=6) 67.1±0.7 19.6±0.6 10.8±1.0 2.1±0.3
16% SECM (n=6) 67.7±1.0 19.6±0.4 10.5±1.0 2.1±0.2
24% SECM (n=4) 66.8±0.6 19.8±0.5 10.9±0.9 2.1±0.3
p-value 0.2888 0.0702 0.1439 0.4975
SEFM: solvent extracted fish meal; SECM: solvent extracted camelina meal; FM fish meal; CO:
camelina oil
Values were mean±SD, one-way ANOVA, Tukey-Kramer test.
4.6.4 Hindgut Histology
Villi length, width and area of the fish fed test diets were similar to the fish fed the control (Table
4.6). Fish fed 16% SECM diet had longer simple villi (1.07±0.27 mm) than the fish fed 100%
CO+FM (0.69±0.18 mm) and 100% CO+10% SECM+FM (0.63±0.06 mm) diets. The width of
simple villi in the fish fed 8%SECM (0.15±0.02 mm) was wider than that of fish fed 100%
CO+SEFM (0.12±0.01 mm) and 24% SECM (0.12±0.02 mm) diets. The area of simple villi in fish
fed 8% SECM diet was larger (0.17±0.03 mm2) than that of fish fed any diet containing 100% CO
(~0.10 mm2). Larger area of simple villi was seen in fish fed 16%SECM (0.16±0.03 mm2)
compared to fish fed 100% CO+10% SECM+FM and 100% CO+SEFM diets. The length (4.75-
8.70 mm), width (0.79-1.33 mm) and area (4.36-7.33 mm2) of complex villi were similar among
all treatments (Table 4.6).
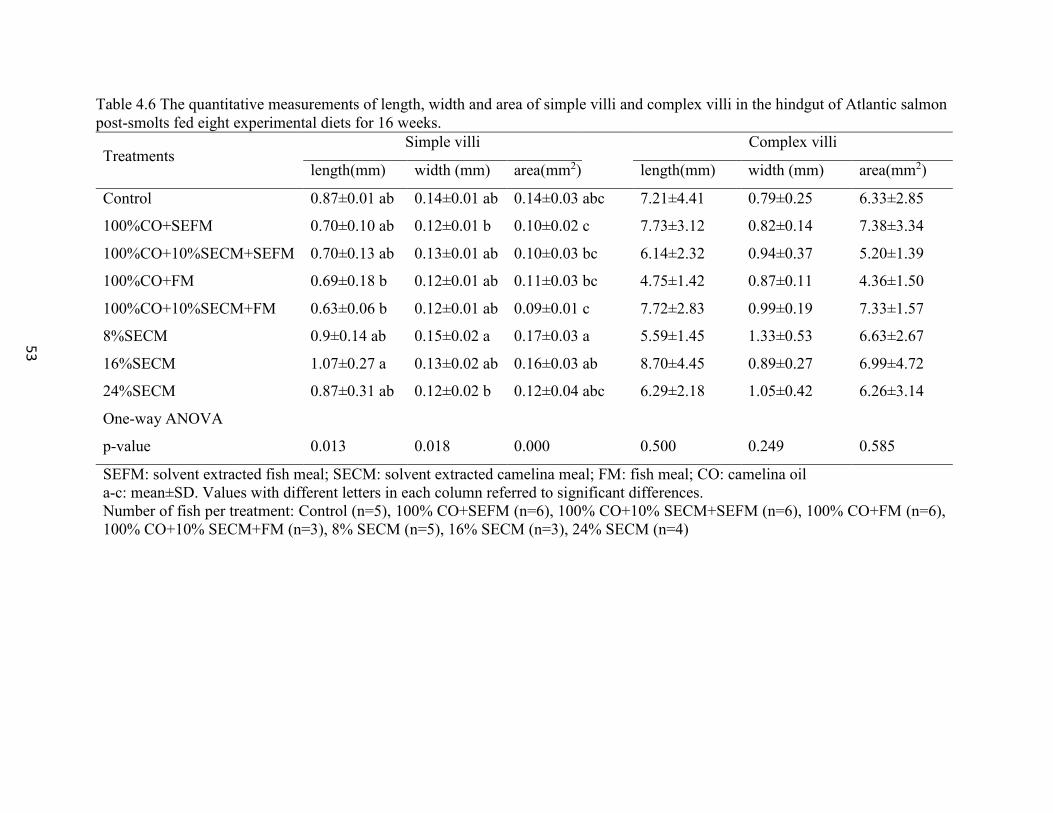
53
Table 4.6 The quantitative measurements of length, width and area of simple villi and complex villi in the hindgut of Atlantic salmon
post-smolts fed eight experimental diets for 16 weeks.
Treatments Simple villi Complex villi
length(mm) width (mm) area(mm2) length(mm) width (mm) area(mm2)
Control 0.87±0.01 ab 0.14±0.01 ab 0.14±0.03 abc 7.21±4.41 0.79±0.25 6.33±2.85
100%CO+SEFM 0.70±0.10 ab 0.12±0.01 b 0.10±0.02 c 7.73±3.12 0.82±0.14 7.38±3.34
100%CO+10%SECM+SEFM 0.70±0.13 ab 0.13±0.01 ab 0.10±0.03 bc 6.14±2.32 0.94±0.37 5.20±1.39
100%CO+FM 0.69±0.18 b 0.12±0.01 ab 0.11±0.03 bc 4.75±1.42 0.87±0.11 4.36±1.50
100%CO+10%SECM+FM 0.63±0.06 b 0.12±0.01 ab 0.09±0.01 c 7.72±2.83 0.99±0.19 7.33±1.57
8%SECM 0.9±0.14 ab 0.15±0.02 a 0.17±0.03 a 5.59±1.45 1.33±0.53 6.63±2.67
16%SECM 1.07±0.27 a 0.13±0.02 ab 0.16±0.03 ab 8.70±4.45 0.89±0.27 6.99±4.72
24%SECM 0.87±0.31 ab 0.12±0.02 b 0.12±0.04 abc 6.29±2.18 1.05±0.42 6.26±3.14
One-way ANOVA
p-value 0.013 0.018 0.000 0.500 0.249 0.585
SEFM: solvent extracted fish meal; SECM: solvent extracted camelina meal; FM: fish meal; CO: camelina oil
a-c: mean±SD. Values with different letters in each column referred to significant differences.
Number of fish per treatment: Control (n=5), 100% CO+SEFM (n=6), 100% CO+10% SECM+SEFM (n=6), 100% CO+FM (n=6),
100% CO+10% SECM+FM (n=3), 8% SECM (n=5), 16% SECM (n=3), 24% SECM (n=4)
53
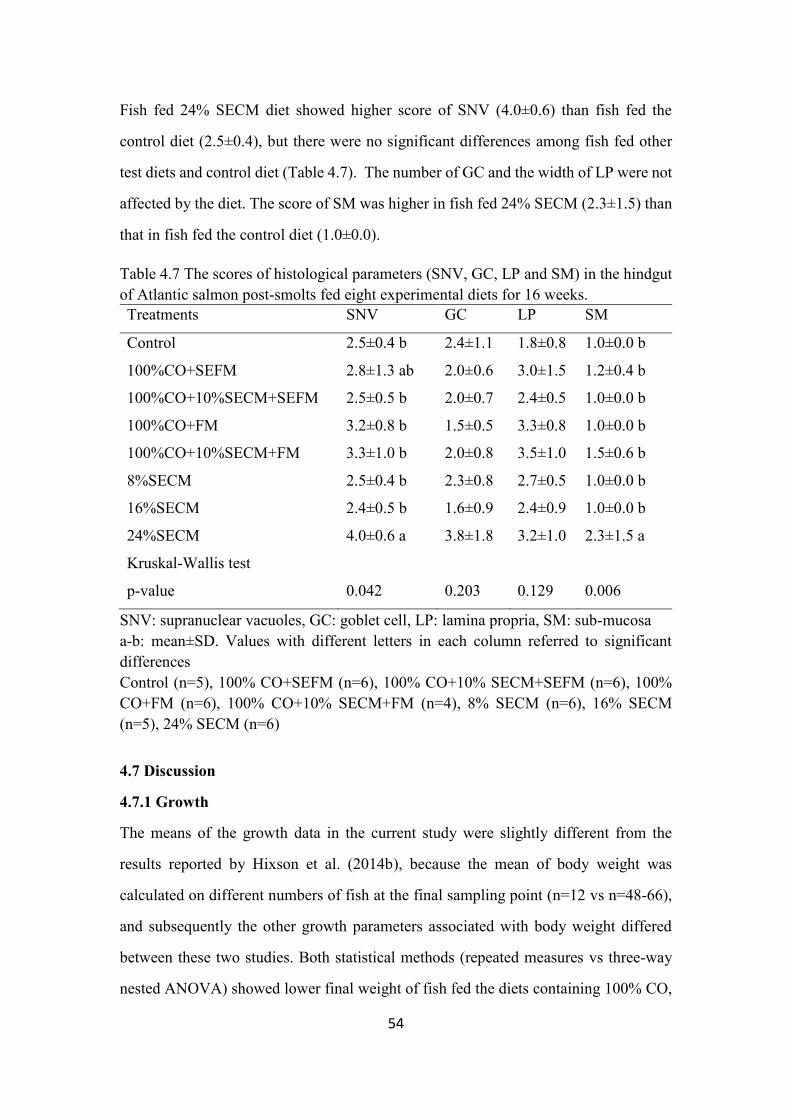
54
Fish fed 24% SECM diet showed higher score of SNV (4.0±0.6) than fish fed the
control diet (2.5±0.4), but there were no significant differences among fish fed other
test diets and control diet (Table 4.7). The number of GC and the width of LP were not
affected by the diet. The score of SM was higher in fish fed 24% SECM (2.3±1.5) than
that in fish fed the control diet (1.0±0.0).
Table 4.7 The scores of histological parameters (SNV, GC, LP and SM) in the hindgut
of Atlantic salmon post-smolts fed eight experimental diets for 16 weeks.
Treatments SNV GC LP SM
Control 2.5±0.4 b 2.4±1.1 1.8±0.8 1.0±0.0 b
100%CO+SEFM 2.8±1.3 ab 2.0±0.6 3.0±1.5 1.2±0.4 b
100%CO+10%SECM+SEFM 2.5±0.5 b 2.0±0.7 2.4±0.5 1.0±0.0 b
100%CO+FM 3.2±0.8 b 1.5±0.5 3.3±0.8 1.0±0.0 b
100%CO+10%SECM+FM 3.3±1.0 b 2.0±0.8 3.5±1.0 1.5±0.6 b
8%SECM 2.5±0.4 b 2.3±0.8 2.7±0.5 1.0±0.0 b
16%SECM 2.4±0.5 b 1.6±0.9 2.4±0.9 1.0±0.0 b
24%SECM 4.0±0.6 a 3.8±1.8 3.2±1.0 2.3±1.5 a
Kruskal-Wallis test
p-value 0.042 0.203 0.129 0.006
SNV: supranuclear vacuoles, GC: goblet cell, LP: lamina propria, SM: sub-mucosa
a-b: mean±SD. Values with different letters in each column referred to significant
differences
Control (n=5), 100% CO+SEFM (n=6), 100% CO+10% SECM+SEFM (n=6), 100%
CO+FM (n=6), 100% CO+10% SECM+FM (n=4), 8% SECM (n=6), 16% SECM
(n=5), 24% SECM (n=6)
4.7 Discussion
4.7.1 Growth
The means of the growth data in the current study were slightly different from the
results reported by Hixson et al. (2014b), because the mean of body weight was
calculated on different numbers of fish at the final sampling point (n=12 vs n=48-66),
and subsequently the other growth parameters associated with body weight differed
between these two studies. Both statistical methods (repeated measures vs three-way
nested ANOVA) showed lower final weight of fish fed the diets containing 100% CO,

55
but similar weight gain between the fish fed 100% CO+FM diet and the control diet.
Considering other growth parameters including final condition factor, feed conversion
ratio and specific growth rate. Atlantic salmon post-smolts fed 100% CO+FM diet had
similar growth performance to the fish fed control diet for 16 weeks, which was in
accordance with the results of CO replacing full fish oil in the diets for various species
(Morais, et al., 2012; Hixson et al., 2014a).
Both the final mean weight and weight gain among fish fed 100% CO+SEFM diet (free
of fish oil) was significantly lower than the fish fed the control diet, but 100% CO+FM
was better than 100% CO+SEFM. The process of solvent extraction did not affect the
growth, since the growth of the fish fed the test diets were similar. The difference
between these two test diets was 1.9% fish oil. The calculated fish oil level in 100%
CO+FM (2.77%) was higher than 100% CO+SECM (0.84%). Therefore, this small
amount of residual oil from fish meal was the key to ensure growth. It is well known
that fish oil contains long chain omega-3 fatty acids (DHA and EPA), which are not
present in vegetable oils. Although salmonids can convert 18:3n-3 to DHA (Tocher et
al., 1997; Bell et al., 2001; Hixson et al., 2014a), this capacity to elongate and desaturate
was not enough for the fish fed the 100% CO+SEFM diet. Erucic acid (22:1n-9) should
be considered, since it reduced growth and impaired heart health of animals (Sauer and
Kramer, 1983; Corner, 1983). 3% erucic acid in the diet depressed the growth of coho
salmon (Hendricks, 2002). The range of erucic acid in the diets containing 100% CO
was from 0.39 to 0.57% as fed basis, 100% CO+FM diet contained the lowest level
(Hixson et al., 2014b). Whether this range of erucic acid is harmful for Atlantic salmon
post-smolts remains unclear. Lower final mean body weight and weight gain were
found in the fish fed the diets containing 100% CO plus SECM or SEFM or both.
Together these results suggested fish growth was not affected by a single factor
including 100% CO, SEFM, and 10% SECM, but perhaps a combination of these
factors.
56
The growth of fish fed 8% SECM diet was similar compared to the fish fed the control
diet, whereas growth of fish fed 16% and 24% SECM diets was suppressed. This may
be due to a decrease in the digestibility of crude protein, since inhibition of somatic
growth was evident among Atlantic salmon post-smolts fed diets containing 14-24%
plant proteins, such as soybean, sunflower, rapeseed and oats (Aslaksen et al., 2007).
However, Burr et al. (2012) indicated that Atlantic salmon parr could tolerate zero fish
protein without inhibiting somatic growth.
Based on the current study, the antinutritional factors should be taken into account. The
glucosinolates levels in all SECM diets were higher than the maximum recommended
level at 1.4 µmol/g (Burel et al., 2000; NRC, 2011). However, up to 7.4 μmol/g of
glucosinolates did not show an adverse impact on the growth and feed intake among
Atlantic salmon parr over 16 weeks (Chapter 3). By contrast, post-smolts tolerated 2.6
μmol/g glucosinolates (8% SECM diet) without compromising growth. The contrast in
the growth response between these two studies might be due to the different life stages
and environment (freshwater vs seawater). Both Atlantic salmon parr and post-smolts
in the present study showed a higher tolerance of glucosinolates compared to rainbow
trout (Burel et al., 2000). Aside from species differences, another reason for the
contrasting growth responses might be the difference in the glucosinolate content of the
diets. The major component of glucosinolates in camelina meal is 10-methyl-sulfinyl-
decyl-glucosinolate (Mathaus and Zubr, 2000), which was different from rapeseed
containing progoitrine and gluconapine (Burel et al., 2000). Its metabolic pathway in
fish is unclear, but it could possibly be degraded into isothiocyanates, nitriles,
thiocyanates or oxazolidithione (Rask et al., 2000) via the intestinal microflora (Rask
et al., 2000; Vaughn and Berhow, 2005; reviewed by Tripathi and Mishra, 2007). These
metabolic byproducts could interrupt the thyroid function in animals (Lakshmy et al.,
1995; Burel et al., 2000; Burel et al., 2001), and subsequently reduce somatic growth.
Rainbow trout fed diets containing 12 µmol/g glucosinolates grew to similar body
weight to the control group in two months, but the growth was affected adversely in six
months (Burel et al., 2001). This safe period was 8 weeks in the current study, since the
57
mean body weight decreased after 8 weeks. In addition, glucosinolates impaired the
palatability of feed and subsequently reduce feed intake (Korsrud and Bell, 1967;
Mawson et al., 1993). It was reflected in the current study, where feed consumption of
all diets containing SECM was lower than that of control diet (Table 4.4). However,
the negative effect of glucosinolates was not dose-dependent, since the feed
consumption was similar in the fish fed 8, 12% 24% SECM diets. In addition, other
antinutritional factors, such as phytic acid, sinapine, tannins and non-starch
polysaccharides (NSP) also changed, and therefore should be considered. Sinapine
reduces the palatability of feed (McCurdy and March, 1992). Tannins decrease the
digestibility of nutrients via forming complexes proteins, starch and digestive enzymes
(Reed, 1995). Phytic acid inhibites the digestibility of zinc and magnesium (Denstadli
et al., 2006). NSP reduces the digestibility of nitrogen and fat in Atlantic salmon (initial
weight 600g and in seawater) (Refstie et al., 1999). The antinutritional factors in
camelina diets need to be investigated in the future.
4.7.2 Carcass Composition
Although the crude lipid level in the carcass was not affected by the diets containing
100% CO, the lipid profile in salmon flesh was different from the control treatment
(Hixson et al., 2014b). This result was in accordance with other studies feeding diet
containing vegetable oil to Atlantic salmon post-smolts caused a decrease in the EPA
and DHA content of the meat, while the level of ALA increased (Tocher et al., 2002;
Bell et al., 2003; Torstensen et al., 2004). Robin et al. (2003) indicated that the fatty
acid composition in the diet altered the fatty acid profile in the tissues of brown trout
(Salmon trutta) and turbot (Psetta maxima), due to multiple factors including various
metabolic factors, initial fatty acid content, cumulative intake of dietary fatty acids,
growth rate and duration. A turn over period (12-24 weeks) by feeding a fish oil
finishing diet could restore EPA and DHA in Atlantic salmon post-smolts (Bell et al.,
2003; 2004). This strategy can improve the levels of EPA and DHA in the salmon fed
a vegetable oil diet for a long term, and subsequently benefit the health of consumers.
The consumption of long chain omega-3 polyunsaturated fatty acid, particularly EPA
58
and DHA, can prevent cardiovascular disease, inflammatory conditions and the
common form of dementia-Alzheimer’s disease, and EPA and DHA are important in
fetal development (Connor, 2000; Ruxton and Derbyshire 2009; Swanson, et al., 2012).
4.7.3 Hindgut Histology
The microstructure (length, width and area) of intestinal villi in Atlantic salmon post-
smolts in seawater was not influenced by the camelina oil or meal. This result agreed
with the findings of the trial on Atlantic salmon parr in freshwater (Chapter 3). Fish
were fasted for 24 hours before sampling in the current study. The changes in
supranuclear vacuoles (SNV) was observed in post-smolts in seawater on second day
starvation, and other histology parameters deteriorated following three weeks starvation
(Baeverfjord and Krogdahl, 1996). When fish were in seawater, Na+/K+-ATPase
activity increased in the posterior intestine, transcellular pathway gradually became
dominant compared to the paracellular route (Sundell et al., 2003). The starvation and
physiological changes might explain that post-smolts fed the control diet showed less
moderate scores of histology parameters, which were higher than that of the parr fed
control diet (Chapter 3). The hindgut in fish fed 24% SECM diet showed some
characteristics similar to soybean induced enteritis in Atlantic salmon (Baeverfjord and
Krogdahl, 1996; Uran et al., 2009), significantly diffused SNV and thickened SM with
infiltration of inflammatory cells. The disappearance of SNV was due to the blockage
of endocytosis, but the causative substances were unclear (Uran et al., 2008a). Knudsen
et al. (2007 and 2008) reported that soya saponins increased the intestinal permeability,
and subsequently induced inflammation combining with other factors, such as antigenic
soybean proteins or the intestinal gut microflora. Camelina meal did not contain any
soyasaponins, therefore there may be other components influencing the permeability
and inducing inflammation in the hindgut. The solvent residue should not be a problem,
because its concentration was only 2.1 ppm in the SECM (Biosciences, Saskatoon, SK,
Canada), and the level was diluted when SECM was included in the diet. The
glucosinolates were an important antinutritional factor in camelina meal, but there is no
published data on the specific effects of glucosinolates on the intestinal histology of

59
either teleosts or any other animals. Rapeseed (Brassica napus), also contained
glucosinolates, but did not impair the gut histology of Atlantic salmon post-smolts when
it was included at 18% in diet (Aslaksen et al., 2007). In the present study, inclusion of
SECM under 16% of the diet did not induce severe inflammations, but abnormalities
were evident among fish fed 24% SECM diet. By contrast, parr fed 15% and 20%
SECM diets exhibited widened lamina propria (Chapter 3). Glucosinolates might only
have minor effect on the gut histology, and this effect was dose-dependent, and
depended on stage of development and salinity. Higher temperature (14 vs. 12 °C)
might increase the development of enteritis (Uran et al., 2008b). Phytic acid did not
affect the morphology of the distal intestine in Atlantic salmon parr (Denstadli et al.,
2006). The level of mucilage in SECM was not clear, but should be greater than the 6%
level in camelina seeds. Mucilage forms gel in water (Mazza and Biliaderis, 1989),
which may be difficult to be digested and absorbed, resulting in the residual mucilage
are transferred with digesta to the hindgut. The viscosity of mucilage can be
significantly reduced by 2 ppt NaCl at 25 °C (Mazza and Biliaderis, 1989). The effect
of mucilage may be ameliorated, since Atlantic salmon post-smolts drink seawater, but
at 14 °C. The sticky matter may block the epithelium of mucosal fold in the hindgut,
subsequently causing the reduced size of SNV. The causative agents of camelina-
induced enteritis need further investigation.
4.8 Conclusion
The body weight of Atlantic salmon post-smolts in seawater fed various experimental
diets were similar at week 8. The growth performance was not affected by either 100%
CO or 8% SECM after 16 weeks. The combination of CO, SEFM, and SECM depressed
the growth. It indirectly reflected that 2.6 μmol/g glucosinolates did not inhibit the
growth. Multiple antinutritional factors contributed to the negative effects. The carcass
composition in all fish were independent of the diets. The enteritis in the hindgut was
evident in the fish fed 24%SECM, but the reason was unknown.
60
Chapter 5 : The Effects of High Oil Residue Camelina Meal on Growth
Performance, Carcass Composition and Hindgut Histology of Atlantic Salmon
(Salmo salar) Smolts in Freshwater
5.1 Abstract
Atlantic salmon smolts (61.8±9.1 g) were reared at 11.9±0.1 °C in freshwater for 16
weeks. Experimental diets included control, 8%, 16% and 24% high oil residue
camelina meal (HOCM). The final weight, weight gain, feed consumption, specific
growth rate, and condition factor decreased as the level of HOCM increased in the diets
(p<0.05). The feed conversion ratio and hepatosomatic index had increasing trend
(p<0.05). Carcass composition and protein retention ratio were not affected by
8%HOCM diet. The carcass protein, lipid and protein retention ratio decreased in fish
fed higher level of HOCM diets, but the carcass moisture increased, and carcass ash
was unchanged (p<0.05). The width and area of simple villi and the thickness of
intestinal wall in fish fed 24%HOCM diet were reduced. The length and area of
complex villi in fish fed 16% and 24%HOCM diets decreased. The number of goblet
cells increased as the level of HOCM increased. Enterocytes separated from lamina
propria at the apical of villi, which was found in all treatments. The causative agents of
enteritis and the cracks within the villi were unknown.
5.2 Introduction
Since 1985, there has been a decreasing trend of fish meal usage in salmonid feed
(Tacon, 2005). The content of fish meal in the commercial salmonid feeds has been
reduced to 18% in 2013 (EWOS Reporting Centre). It is predicted to be 8% by 2020
(Tacon and Metian, 2008). In this case, more alternative protein sources are required by
feed manufacturers to ensure cost efficient feed. Camelina meal is a potential
replacement, it has a similar protein level and amino acid composition to canola meal
(Bell and Keith, 1991).
In two previous trials, solvent extracted camelina (SECM) was readily accepted up to
10% in the diet for Atlantic salmon parr (Chapter 3) but only 8% for post-smolts
(Chapter 4). The production cost of high oil residue camelina meal (HOCM) is lower
than SECM. The growth of rainbow trout was not inhibited by 20% HOCM (Bullerwell
and Anderson, 2012), indicating that HOCM can be a potential ingredient in aquafeeds.
However, an optimal level for Atlantic salmon has not been estimated. The HOCM used
in this study contained 35.9 µmol/g glucosinolates (AAFC, Saskatoon, SK, Canada)
and 0.57% phytic acid (University of Manitoba, Winnipeg, MN, Canada). Negative
61
effects of antinutritional factors on the growth performance were seen in post-smolts
fed 16% and 24% SECM diets (Chapter 4). Some enteritis characteristics in the hindgut
were observed in high level of camelina meal in the two previous trials, but the
causative agent was unknown. Hindgut histology evaluation was conducted in this
study.
5.3 Objectives
This study investigated a satisfactory level of HOCM (8%, 16% and 24%) in the diet
of Atlantic salmon smolts in freshwater by evaluating the growth performance, carcass
composition, hindgut histology.
5.4 Hypothesis
The fish fed 8% HOCM diet would show similar growth and carcass composition to
that of control, but poorer results would be found in fish fed higher levels of HOCM.
The hindgut histological parameters would show HOCM dose-dependent responses,
fish fed 16% and 24% HOCM diets would show significant histological changes in the
hindgut.
5.5 Materials and Methods
5.5.1 Preparation of Test Ingredients and Feed Formulations
Oil was pressed out of camelina seeds (007 line) by using an EGON KELLER KEK
expeller-press at Atlantic Oilseed Processing, Ltd (Summerside, PEI, Canada). The
residue meal was ground with a hammer mill (screen size 8mm) into meal at Atlantic
Oilseed Processing, Ltd. This meal product was named high oil residue meal (HOCM)
in the current study. It contained 30.6% crude protein and 10.3% crude fat as fed basis
(Nova Scotia Agriculture quality evaluation division laboratory services, 176 College
Road, Harlow Institute, Truro, NS, Canada). The composition of HOCM was in
Appendix B. Diets were formulated to be isonitrogenous (44%) and isocaloric (4400
Kcal/kg, Table 5.1) levels to meet the nutrient requirements for Atlantic salmon (NRC,
2011).The level of fish meal was set as 15% in all diets. Fish oil, poultry meal and wheat
were used to balance the diets. All diets were mixed according to the formulations, and
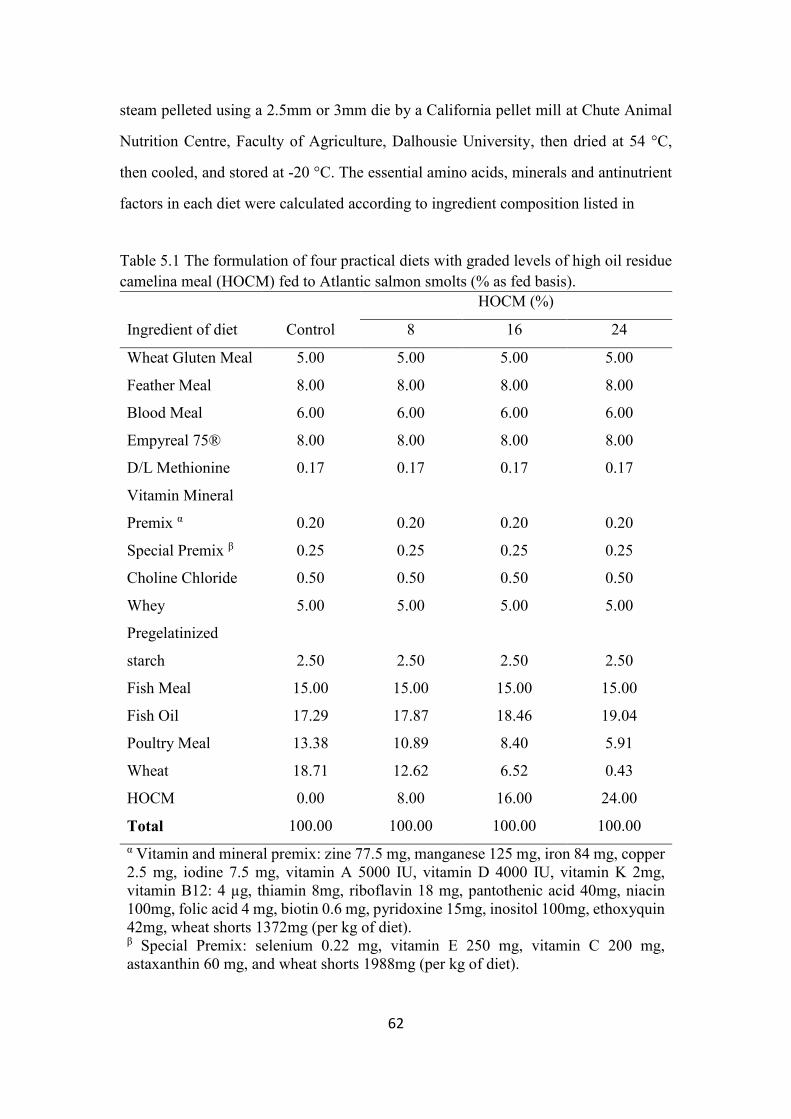
62
steam pelleted using a 2.5mm or 3mm die by a California pellet mill at Chute Animal
Nutrition Centre, Faculty of Agriculture, Dalhousie University, then dried at 54 °C,
then cooled, and stored at -20 °C. The essential amino acids, minerals and antinutrient
factors in each diet were calculated according to ingredient composition listed in
Table 5.1 The formulation of four practical diets with graded levels of high oil residue
camelina meal (HOCM) fed to Atlantic salmon smolts (% as fed basis).
Ingredient of diet Control
HOCM (%)
8 16 24
Wheat Gluten Meal 5.00 5.00 5.00 5.00
Feather Meal 8.00 8.00 8.00 8.00
Blood Meal 6.00 6.00 6.00 6.00
Empyreal 75® 8.00 8.00 8.00 8.00
D/L Methionine 0.17 0.17 0.17 0.17
Vitamin Mineral
Premix α 0.20 0.20 0.20 0.20
Special Premix β 0.25 0.25 0.25 0.25
Choline Chloride 0.50 0.50 0.50 0.50
Whey 5.00 5.00 5.00 5.00
Pregelatinized
starch 2.50 2.50 2.50 2.50
Fish Meal 15.00 15.00 15.00 15.00
Fish Oil 17.29 17.87 18.46 19.04
Poultry Meal 13.38 10.89 8.40 5.91
Wheat 18.71 12.62 6.52 0.43
HOCM 0.00 8.00 16.00 24.00
Total 100.00 100.00 100.00 100.00
α Vitamin and mineral premix: zine 77.5 mg, manganese 125 mg, iron 84 mg, copper
2.5 mg, iodine 7.5 mg, vitamin A 5000 IU, vitamin D 4000 IU, vitamin K 2mg,
vitamin B12: 4 µg, thiamin 8mg, riboflavin 18 mg, pantothenic acid 40mg, niacin
100mg, folic acid 4 mg, biotin 0.6 mg, pyridoxine 15mg, inositol 100mg, ethoxyquin
42mg, wheat shorts 1372mg (per kg of diet). β Special Premix: selenium 0.22 mg, vitamin E 250 mg, vitamin C 200 mg,
astaxanthin 60 mg, and wheat shorts 1988mg (per kg of diet).
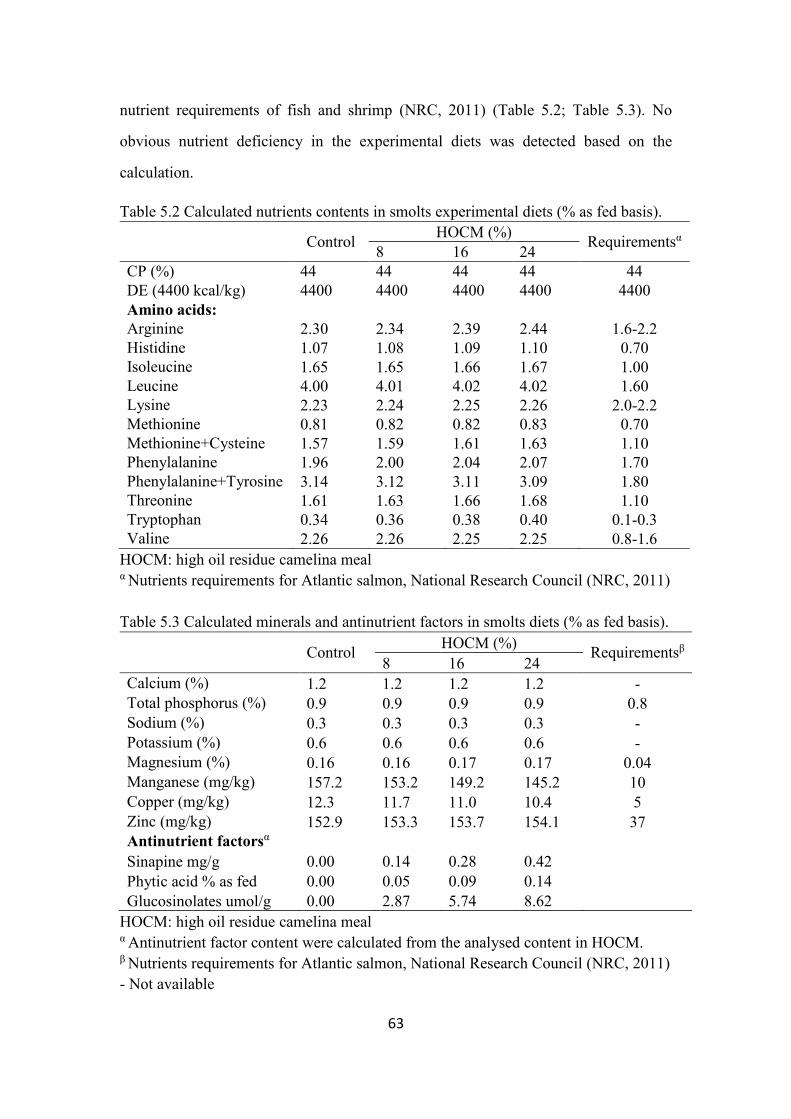
63
nutrient requirements of fish and shrimp (NRC, 2011) (Table 5.2; Table 5.3). No
obvious nutrient deficiency in the experimental diets was detected based on the
calculation.
Table 5.2 Calculated nutrients contents in smolts experimental diets (% as fed basis).
Control
HOCM (%) Requirementsα
8 16 24
CP (%) 44 44 44 44 44
DE (4400 kcal/kg) 4400 4400 4400 4400 4400
Amino acids:
Arginine 2.30 2.34 2.39 2.44 1.6-2.2
Histidine 1.07 1.08 1.09 1.10 0.70
Isoleucine 1.65 1.65 1.66 1.67 1.00
Leucine 4.00 4.01 4.02 4.02 1.60
Lysine 2.23 2.24 2.25 2.26 2.0-2.2
Methionine 0.81 0.82 0.82 0.83 0.70
Methionine+Cysteine 1.57 1.59 1.61 1.63 1.10
Phenylalanine 1.96 2.00 2.04 2.07 1.70
Phenylalanine+Tyrosine 3.14 3.12 3.11 3.09 1.80
Threonine 1.61 1.63 1.66 1.68 1.10
Tryptophan 0.34 0.36 0.38 0.40 0.1-0.3
Valine 2.26 2.26 2.25 2.25 0.8-1.6
HOCM: high oil residue camelina meal α Nutrients requirements for Atlantic salmon, National Research Council (NRC, 2011)
Table 5.3 Calculated minerals and antinutrient factors in smolts diets (% as fed basis).
Control
HOCM (%) Requirementsβ
8 16 24
Calcium (%) 1.2 1.2 1.2 1.2 -
Total phosphorus (%) 0.9 0.9 0.9 0.9 0.8
Sodium (%) 0.3 0.3 0.3 0.3 -
Potassium (%) 0.6 0.6 0.6 0.6 -
Magnesium (%) 0.16 0.16 0.17 0.17 0.04
Manganese (mg/kg) 157.2 153.2 149.2 145.2 10
Copper (mg/kg) 12.3 11.7 11.0 10.4 5
Zinc (mg/kg) 152.9 153.3 153.7 154.1 37
Antinutrient factorsα
Sinapine mg/g 0.00 0.14 0.28 0.42
Phytic acid % as fed 0.00 0.05 0.09 0.14
Glucosinolates umol/g 0.00 2.87 5.74 8.62
HOCM: high oil residue camelina meal α Antinutrient factor content were calculated from the analysed content in HOCM. β Nutrients requirements for Atlantic salmon, National Research Council (NRC, 2011)
- Not available
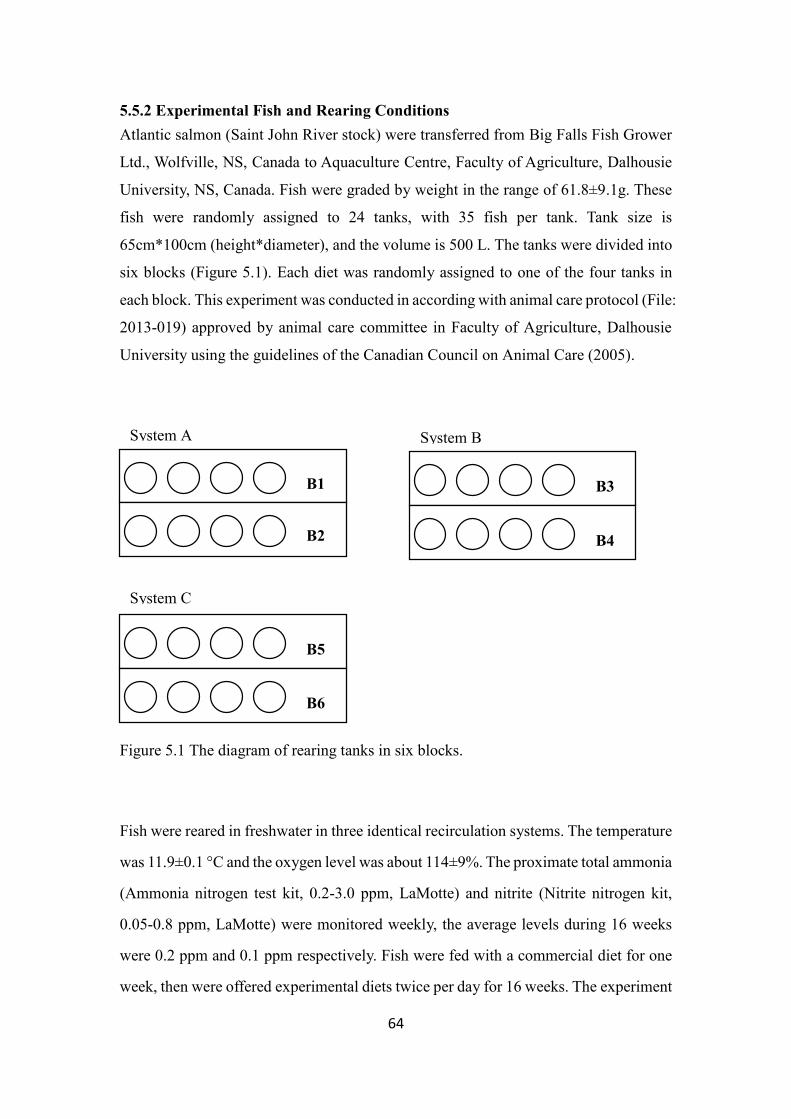
64
5.5.2 Experimental Fish and Rearing Conditions
Atlantic salmon (Saint John River stock) were transferred from Big Falls Fish Grower
Ltd., Wolfville, NS, Canada to Aquaculture Centre, Faculty of Agriculture, Dalhousie
University, NS, Canada. Fish were graded by weight in the range of 61.8±9.1g. These
fish were randomly assigned to 24 tanks, with 35 fish per tank. Tank size is
65cm*100cm (height*diameter), and the volume is 500 L. The tanks were divided into
six blocks (Figure 5.1). Each diet was randomly assigned to one of the four tanks in
each block. This experiment was conducted in according with animal care protocol (File:
2013-019) approved by animal care committee in Faculty of Agriculture, Dalhousie
University using the guidelines of the Canadian Council on Animal Care (2005).
Figure 5.1 The diagram of rearing tanks in six blocks.
Fish were reared in freshwater in three identical recirculation systems. The temperature
was 11.9±0.1 °C and the oxygen level was about 114±9%. The proximate total ammonia
(Ammonia nitrogen test kit, 0.2-3.0 ppm, LaMotte) and nitrite (Nitrite nitrogen kit,
0.05-0.8 ppm, LaMotte) were monitored weekly, the average levels during 16 weeks
were 0.2 ppm and 0.1 ppm respectively. Fish were fed with a commercial diet for one
week, then were offered experimental diets twice per day for 16 weeks. The experiment
B1
System A
B3
B4
B5
B6
B2
System B
System C

65
stated on August 3, 2013. All the tanks were purged twice per day to remove solid
waste. Due to a fungus infection, fish in each tank were treated three times (August 15-
18) with formalin (36.5% formaldehyde solution + 10-15% methanol) bath (1:4000).
To reduce the risk of further fungal infections, the salinity was elevated to 2 ppt at week
5 until the end of the trial.
5.5.3 Sampling
Fish mean body weight was measured in batches in each tank at the beginning of the
trial and subsequently every four weeks. Feed consumption was measured weekly.
Eight fish from the fish population (week 1), three fish per tank (week 8) and six fish
per tank (week 16) were euthanized by an overdose of buffered tricaine methane
sulfonate (TMS). The body weight and fork length of each fish were measured
individually. Hindgut samples were collected from these fish, and stored in 10% neutral
buffered formalin. The weight of liver was measured in triplicate in each tank at week
16. The carcass of each fish without viscera and kidney, was weighed and stored at -
20 °C.
5.5.4 Calculations
The weight gain, feed consumption, specific growth ratio (SGR), and feed conversion
ratio (FCR) were calculated at weeks 4, 8 and 16. Condition factor (CF) at was
calculated at week 16. Viscera index (VI) and Hepatosomatic index (HSI) were
calculated at week 16. Protein retention ratio (PRR) was calculated at week 16.
SGR = ln 𝑀𝑓−ln 𝑀𝑖
𝑡∗ 100 ; Mf and Mi are the mean final and initial individual masses, t
refers to time
FCR = Total feed fed to tank
tank biomass gain∗ 100
CF = body weight
fork length^3∗ 100
Viscera index (VI) = viscera weight
body weight∗ 100%
HSI = liver weight
body weight∗ 100
66
PRR=
(final body weight*final body protein content as wet weight basis)-(initial body weight*initial protein content as wet weight basis)
total feed intake*protein content in diet
5.5.5 Carcass Analysis
Eight fish were collected for carcass analysis at the beginning, two fish carcasses were
pooled as one sample. Each fish carcass (week 8 and week 16) was ground individually
using a manual meat grinder. Two fish carcasses from week 16 were pooled as one
sample. The ground carcass was weighed and stored at -20 °C for at least 24 hours. The
loss of weight measured after 24 hours of freeze drying was calculated as the moisture
content in the carcass. The procedures were described in Chapter 4. All samples were
analysed in duplicate for each procedure
5.5.6 Hindgut Histology Evaluation
The detail of slide preparation was described in Chapter 3. Nikon Coolscan 4000ED
was used to scan the slides in the image analysis lab, Haley Institute, Faculty of
Agriculture, Dalhousie University. Five simple villi and one complex villus were
selected clockwise in each slide. SigmaScan Pro 5 program was used to measure the
length, width and area of each villus and the thickness of the intestine wall. A semi-
quantitative scoring system (Uran et al., 2008b) was adopted to evaluate mucosal fold
(MF), supranuclear vacuoles (SNV), lamina propria (LP), goblet cells (GC), and sub-
epithelial mucosa (SM). The scale of score ranged from 1 to 5, half point was given if
necessary. An increased score reflected an increased inflammation process.
5.5.7 Post Mortem Evaluation
Two fish per tank were randomly sampled at the end of the trial, all fish were euthanized
by overdose of buffered tricaine methane sulfonate (TMS). These samples were stored
in a cooler with ice and sent to Nova Scotia Department of Fisheries and Aquaculture
for post mortem evaluation on the same day. Evaluation included necropsy,
bacteriology (kidney), histopathology (liver), and gill and skin wet mounts.
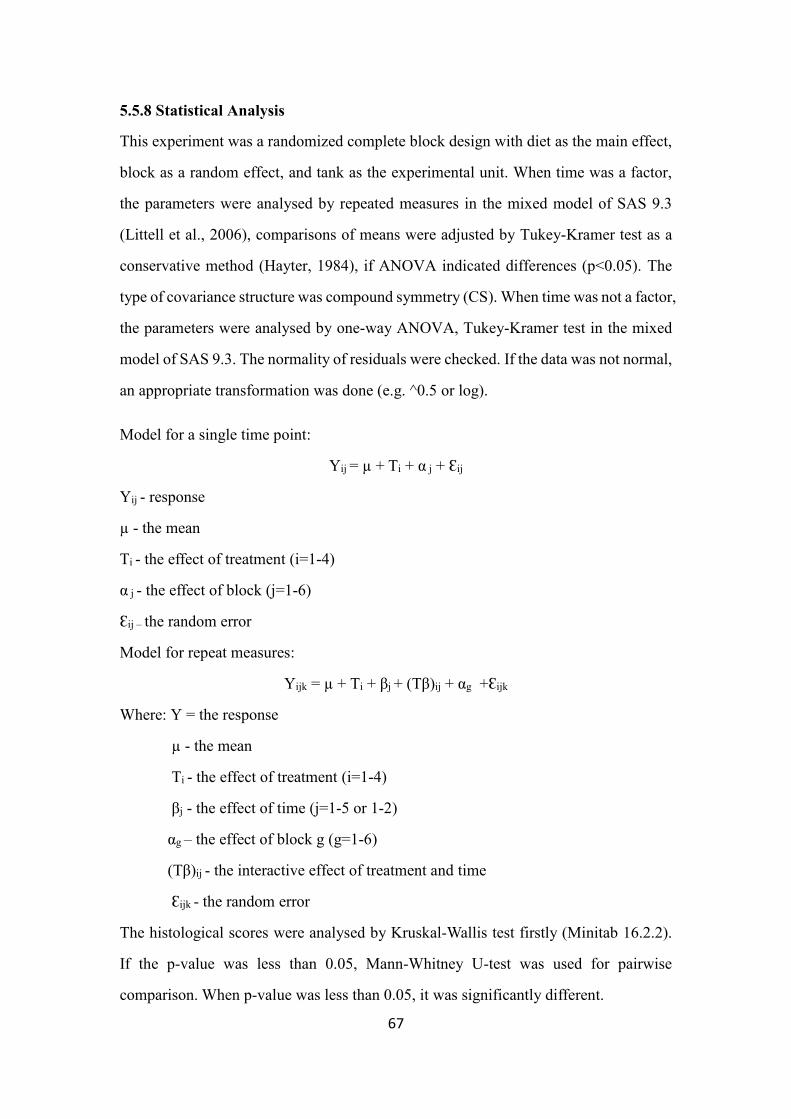
67
5.5.8 Statistical Analysis
This experiment was a randomized complete block design with diet as the main effect,
block as a random effect, and tank as the experimental unit. When time was a factor,
the parameters were analysed by repeated measures in the mixed model of SAS 9.3
(Littell et al., 2006), comparisons of means were adjusted by Tukey-Kramer test as a
conservative method (Hayter, 1984), if ANOVA indicated differences (p<0.05). The
type of covariance structure was compound symmetry (CS). When time was not a factor,
the parameters were analysed by one-way ANOVA, Tukey-Kramer test in the mixed
model of SAS 9.3. The normality of residuals were checked. If the data was not normal,
an appropriate transformation was done (e.g. ^0.5 or log).
Model for a single time point:
Yij = µ + Ti + α j + Ɛij
Yij - response
µ - the mean
Ti - the effect of treatment (i=1-4)
α j - the effect of block (j=1-6)
Ɛij – the random error
Model for repeat measures:
Yijk = µ + Ti + βj + (Tβ)ij + αg +Ɛijk
Where: Y = the response
µ - the mean
Ti - the effect of treatment (i=1-4)
βj - the effect of time (j=1-5 or 1-2)
αg – the effect of block g (g=1-6)
(Tβ)ij - the interactive effect of treatment and time
Ɛijk - the random error
The histological scores were analysed by Kruskal-Wallis test firstly (Minitab 16.2.2).
If the p-value was less than 0.05, Mann-Whitney U-test was used for pairwise
comparison. When p-value was less than 0.05, it was significantly different.

68
5.6 Results
5.6.1 Experimental Diets
The protein content in each diet (Table 5.4) ranged from 44.6-45.5%. The crude fat
increased as the HOCM level increased in the diets. The mineral content were similar
among all diets (Table 5.4). The levels of zinc and manganese were about five-fold and
thirteen-fold respectively as the requirements, but the toxic levels were unknown. This
occurred in the two previous studies, but no toxic symptoms were found. The increased
level of glucosinolates reflected the graded level of HOCM in the diet, but 8% HOCM
contained much higher level than expected (4.9 vs 2.87 μmol/g).
Table 5.4 Nutrient analyses of Atlantic salmon smolt experimental diets (% as fed basis).
HOCM (%) Requirementsβ
Control 8 16 24
DM 92.8 94.0 93.6 94.1 -
Crude Protein 44.6 45.2 45.1 45.5 44
Crude Fat 18.6 21.3 22.9 22.6 -
Calcium (%) 1.5 1.3 1.2 1.2 -
Total phosphorus (%) 1.0 0.9 0.9 1.0 0.8
Potassium (%) 0.5 0.6 0.6 0.7 -
Magnesium (%) 0.1 0.1 0.1 0.2 0.04
Sodium (%) 0.3 0.2 0.2 0.2 -
Manganese (mg/kg) 128.1 135.7 132.9 143.7 10
Copper (mg/kg) 8.4 7.5 8.4 10.3 5
Zinc (mg/kg) 178.2 173.9 184.8 183.2 37
Glucosinolates (μmol/g)α 0.0 4.9 5.7 8.7
HOCM: high oil residue camelina meal, - not available
Feed was analysed at Nova Scotia Agriculture quality evaluation division laboratory
services, 176 College Road, Harlow Institute, Truro, NS, Canada. α The glucosinolates were analysed by HPLC at Agriculture and Agri-Food Canada,
Saskatoon. β Nutrients requirements for Atlantic salmon, National Research Council (NRC, 2011)
5.6.2 Mortality
Fungus (Saprolegnia sp.) on skin was first observed on one fish during week 2, and a
7.9% mortalities as whole population subsequently occurred in the next two weeks
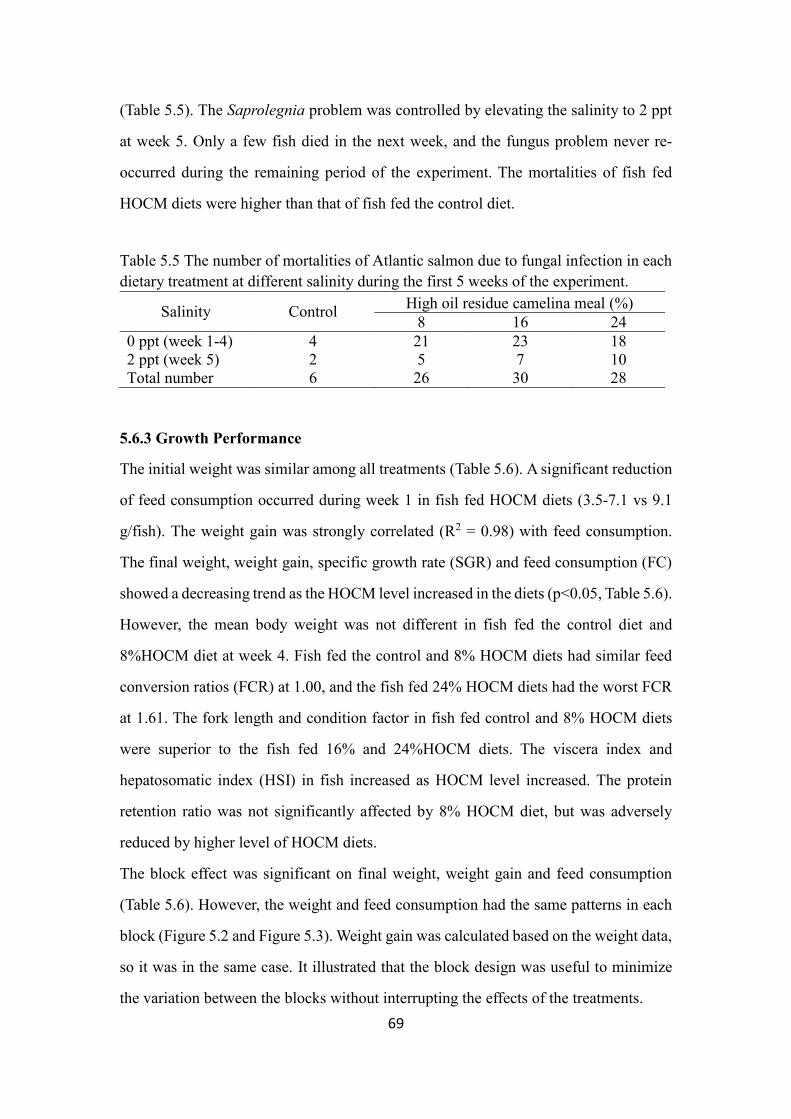
69
(Table 5.5). The Saprolegnia problem was controlled by elevating the salinity to 2 ppt
at week 5. Only a few fish died in the next week, and the fungus problem never re-
occurred during the remaining period of the experiment. The mortalities of fish fed
HOCM diets were higher than that of fish fed the control diet.
Table 5.5 The number of mortalities of Atlantic salmon due to fungal infection in each
dietary treatment at different salinity during the first 5 weeks of the experiment.
Salinity Control High oil residue camelina meal (%)
8 16 24
0 ppt (week 1-4) 4 21 23 18
2 ppt (week 5) 2 5 7 10
Total number 6 26 30 28
5.6.3 Growth Performance
The initial weight was similar among all treatments (Table 5.6). A significant reduction
of feed consumption occurred during week 1 in fish fed HOCM diets (3.5-7.1 vs 9.1
g/fish). The weight gain was strongly correlated (R2 = 0.98) with feed consumption.
The final weight, weight gain, specific growth rate (SGR) and feed consumption (FC)
showed a decreasing trend as the HOCM level increased in the diets (p<0.05, Table 5.6).
However, the mean body weight was not different in fish fed the control diet and
8%HOCM diet at week 4. Fish fed the control and 8% HOCM diets had similar feed
conversion ratios (FCR) at 1.00, and the fish fed 24% HOCM diets had the worst FCR
at 1.61. The fork length and condition factor in fish fed control and 8% HOCM diets
were superior to the fish fed 16% and 24%HOCM diets. The viscera index and
hepatosomatic index (HSI) in fish increased as HOCM level increased. The protein
retention ratio was not significantly affected by 8% HOCM diet, but was adversely
reduced by higher level of HOCM diets.
The block effect was significant on final weight, weight gain and feed consumption
(Table 5.6). However, the weight and feed consumption had the same patterns in each
block (Figure 5.2 and Figure 5.3). Weight gain was calculated based on the weight data,
so it was in the same case. It illustrated that the block design was useful to minimize
the variation between the blocks without interrupting the effects of the treatments.

70
Table 5.6 The growth performance, viscera index, hepatosomatic index, and protein retention ratio (mean/fish) of Atlantic salmon smolts in
freshwater fed four experimental diets for 16 weeks.
Control
High oil residue camelina meal (%) p-value
8 16 24 block trt
Initial body weight (g/fish) β 61.2±1.6 61.4±0.8 61.4±1.1 61.9±1.1 0.0538 0.1902
Body weight at week 4 α 116.2±5.3 a 107.6±1.9 a 95.72±2.7 b 82.6±1.2 c <.0001 <.0001
Final weight (g/fish) α 439.4±31.7 a 321.3±30.2 b 191.4±6.9 c 130.3±8.2 d <.0001 <.0001
Weight gain (g/fish) β 378.2±31.8 a 259.8±30 b 129.0±6.1 c 68.4±9.1 d 0.0312 <.0001
SGR (% day-1) β 1.65±0.07 a 1.39±0.08 b 0.94±0.02 c 0.62±0.07 d 0.0872 <.0001
FC (g/fish) during week 1 β 9.1±1.1 a 7.1±0.5 b 4.3±0.3 c 3.5±0.4 c 0.4386 <.0001
FC (g/fish) β 378.5±33.5 a 273.0±32 b 154.6±9.8 c 110.1±18 d 0.0044 <.0001
FCR β 1.00±0.04 c 1.05±0.10 bc 1.20±0.08 b 1.61±0.14 a 0.4977 <.0001
Final fork length (cm) β 33.0±1.0 a 31.2±1.1 a 26.8±1.5 b 24.0±1.4 c 0.4132 <.0001
Condition factor α 1.19±0.04 a 1.12±0.04 a 0.98±0.04 b 0.89±0.04 c 0.8484 <.0001
Viscera index (%) β 11.8±0.5 c 13.4±0.6 b 13.8±0.5 ab 14.8±0.7 a 0.7478 <.0001
HSI (%) β 1.21±0.04 b 1.26±0.06 ab 1.28±0.08 ab 1.37±0.09 a 0.4693 0.0099
PRR β 42.2±2.1 a 40.8±5.1 a 32.9±1.8 b 23.8±2.0 c 0.062 <.0001
SGR: specific growth rate;
FC: feed consumption;
FCR: feed conversion ratio;
HSI: hepatosomatic index;
PRR: protein retention ratio
a-d: mean±SD. Tank as a unit, n=3 per treatment. Means with different letters in each row are significantly different. α repeated measurement analysis β one-way ANOVA analysis
70
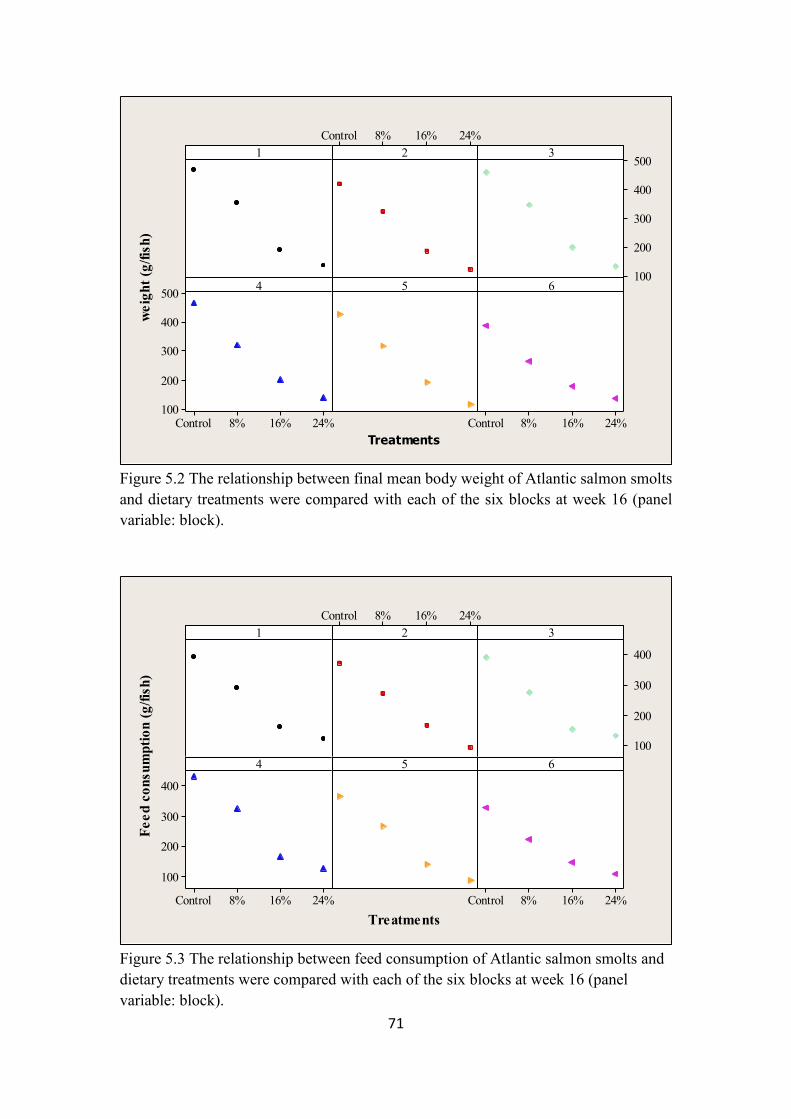
71
Figure 5.2 The relationship between final mean body weight of Atlantic salmon smolts
and dietary treatments were compared with each of the six blocks at week 16 (panel
variable: block).
Figure 5.3 The relationship between feed consumption of Atlantic salmon smolts and
dietary treatments were compared with each of the six blocks at week 16 (panel
variable: block).
24%16%8%Control
500
400
300
200
100
24%16%8%Control
500
400
300
200
10024%16%8%Control
1
Treatments
we
igh
t (g
/fis
h)
2 3
4 5 6
24%16%8%Control
400
300
200
100
24%16%8%Control
400
300
200
100
24%16%8%Control
1
Treatments
Fe
ed
co
nsu
mp
tio
n (
g/f
ish
)
2 3
4 5 6

72
5.6.4 Carcass Composition
Fish carcass initially contained 17% crude protein (Table 5.7). There was significant
interaction effect on carcass protein (p<0.05). The carcass protein content was similar
in all fish at week 8, and the average was 17.3%. There was a decreasing trend at week
16. Fish fed the control diet had higher crude protein (18.6%) than the fish fed 16% and
24% SECM diets (~17.5%), but was similar to the fish fed 8% SECM (18.3%). The
initial crude lipid content was 4.7% (Table 5.7). It was affected by the interaction of
time and treatments (p<0.05). The carcass lipid content decreased as the level of HOCM
increased at both week 8 and week 16. Fish fed the control (11.1%) and 8% SECM
(10.4%) diets contained similar lipid level, and they were higher than the fish fed 16%
(8.4%) and 24% SECM (6.0%) diets. Carcass ash content did not change by time, with
initial ash 2.2% (Table 5.7), but the mean by treatment was higher in the fish fed 16%
and 24% SECM diets compared to the fish fed the control and 8% SECM diets. Carcass
moisture content was highest at the beginning with 75.5% (Table 5.7). It was affected
by the interaction of time and treatment (p<0.05). An increasing trend was seen at either
week 8 or week 16. The final carcass moisture level was lowest in the fish fed control
diet (67.5%), and highest in the fish fed 24% SECM (74%).

73
Table 5.7 The carcass composition (crude protein, crude lipid, ash and moisture) of Atlantic salmon smolts fed four experimental diets at
initial day, week 8 and week 16 (% on wet weight basis).
High oil residue camelina meal p-value
Control 8% 16% 24% Mean by time time*trt trt time
Crude protein
Initial 17.0±0.4
Week 8 17.5±0.3 c 17.2±0.2 c 17.4±0.5 c 17.2±0.5 c 17.3±0.4 0.0078 0.0002 <0.0001
Week 16 18.6±0.6 a 18.3±0.5 ab 17.6±0.3 bc 17.3±0.3 c 18.0±0.7
Mean by trt 18.1±0.7 17.8±0.7 17.5±0.4 17.3±0.4
Crude lipid
Initial 4.7±0.4
Week 8 9.2±0.6 bc 8.3±0.8 cd 7.4±0.8 d 5.7±0.8 e 7.6±1.5 0.0092 <0.0001 <0.0001
Week 16 11.1±0.2 a 10.4±0.6 ab 8.4±0.5 cd 6.0±1.0 e 9.0±2.1
Mean by trt 10.2±1.1 9.4±1.3 7.9±0.8 5.9±0.9
Ash
Initial 2.2±0.4
Week 8 2.1±0.3 2.3±0.2 2.3±0.2 2.3±0.2 2.2±0.2 0.3905 0.001 0.5640
Week 16 2.0±0.2 2.2±0.1 2.4±0.2 2.6±0.3 2.3±0.3
Mean by trt 2.0±0.2 b 2.2±0.2 ab 2.3±0.2 a 2.4±0.2 a
Moisture
Initial 75.5±0.9
Week 8 70.6±0.6 d 71.7±0.8 cd 72.8±0.9 bc 74.5±0.9 a 72.4±1.7 0.0002 <0.0001 <0.0001
Week 16 67.5±0.2 e 68.4±0.7 e 70.9±0.6 d 74.0±1.0 ab 70.2±2.7
Mean by trt 69.0±1.7 70.1±1.9 71.8±1.2 74.3±1.0
Initial: n=8; week 8: n=18 per treatment; week 16: n=36 per treatment.
a-e: mean±SD. Means with different letters were significantly different in each panel.
73
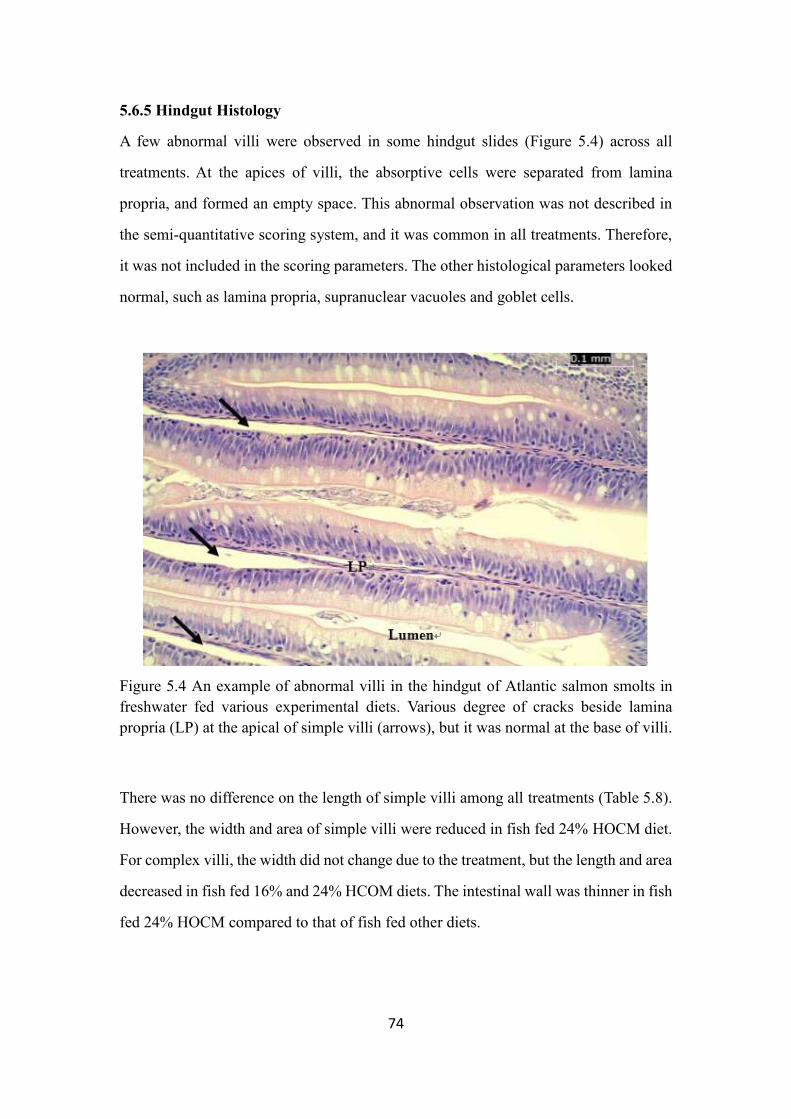
74
5.6.5 Hindgut Histology
A few abnormal villi were observed in some hindgut slides (Figure 5.4) across all
treatments. At the apices of villi, the absorptive cells were separated from lamina
propria, and formed an empty space. This abnormal observation was not described in
the semi-quantitative scoring system, and it was common in all treatments. Therefore,
it was not included in the scoring parameters. The other histological parameters looked
normal, such as lamina propria, supranuclear vacuoles and goblet cells.
Figure 5.4 An example of abnormal villi in the hindgut of Atlantic salmon smolts in
freshwater fed various experimental diets. Various degree of cracks beside lamina
propria (LP) at the apical of simple villi (arrows), but it was normal at the base of villi.
There was no difference on the length of simple villi among all treatments (Table 5.8).
However, the width and area of simple villi were reduced in fish fed 24% HOCM diet.
For complex villi, the width did not change due to the treatment, but the length and area
decreased in fish fed 16% and 24% HCOM diets. The intestinal wall was thinner in fish
fed 24% HOCM compared to that of fish fed other diets.
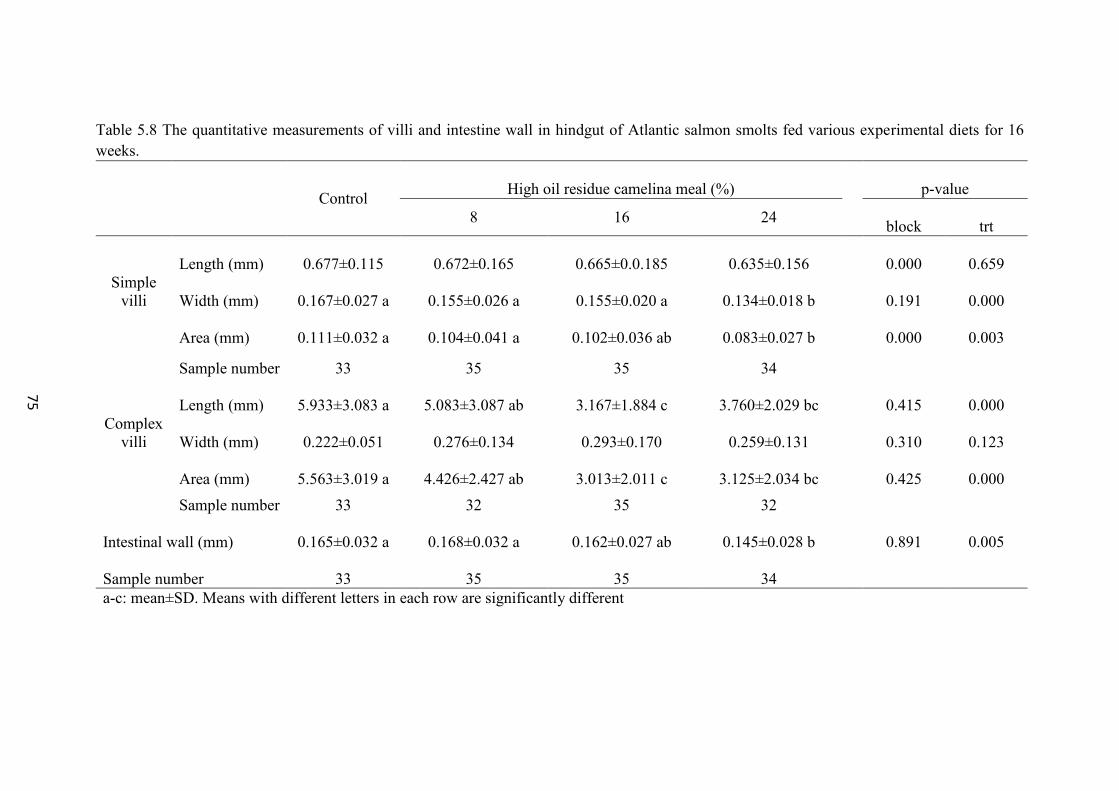
75
Table 5.8 The quantitative measurements of villi and intestine wall in hindgut of Atlantic salmon smolts fed various experimental diets for 16
weeks.
Control
High oil residue camelina meal (%) p-value
8 16 24
block trt
Simple
villi
Length (mm) 0.677±0.115 0.672±0.165 0.665±0.0.185 0.635±0.156 0.000 0.659
Width (mm) 0.167±0.027 a 0.155±0.026 a 0.155±0.020 a 0.134±0.018 b 0.191 0.000
Area (mm) 0.111±0.032 a 0.104±0.041 a 0.102±0.036 ab 0.083±0.027 b 0.000 0.003
Sample number 33 35 35 34
Complex
villi
Length (mm) 5.933±3.083 a 5.083±3.087 ab 3.167±1.884 c 3.760±2.029 bc 0.415 0.000
Width (mm) 0.222±0.051 0.276±0.134 0.293±0.170 0.259±0.131 0.310 0.123
Area (mm) 5.563±3.019 a 4.426±2.427 ab 3.013±2.011 c 3.125±2.034 bc 0.425 0.000
Sample number 33 32 35 32
Intestinal wall (mm) 0.165±0.032 a 0.168±0.032 a 0.162±0.027 ab 0.145±0.028 b 0.891 0.005
Sample number 33 35 35 34
a-c: mean±SD. Means with different letters in each row are significantly different
75
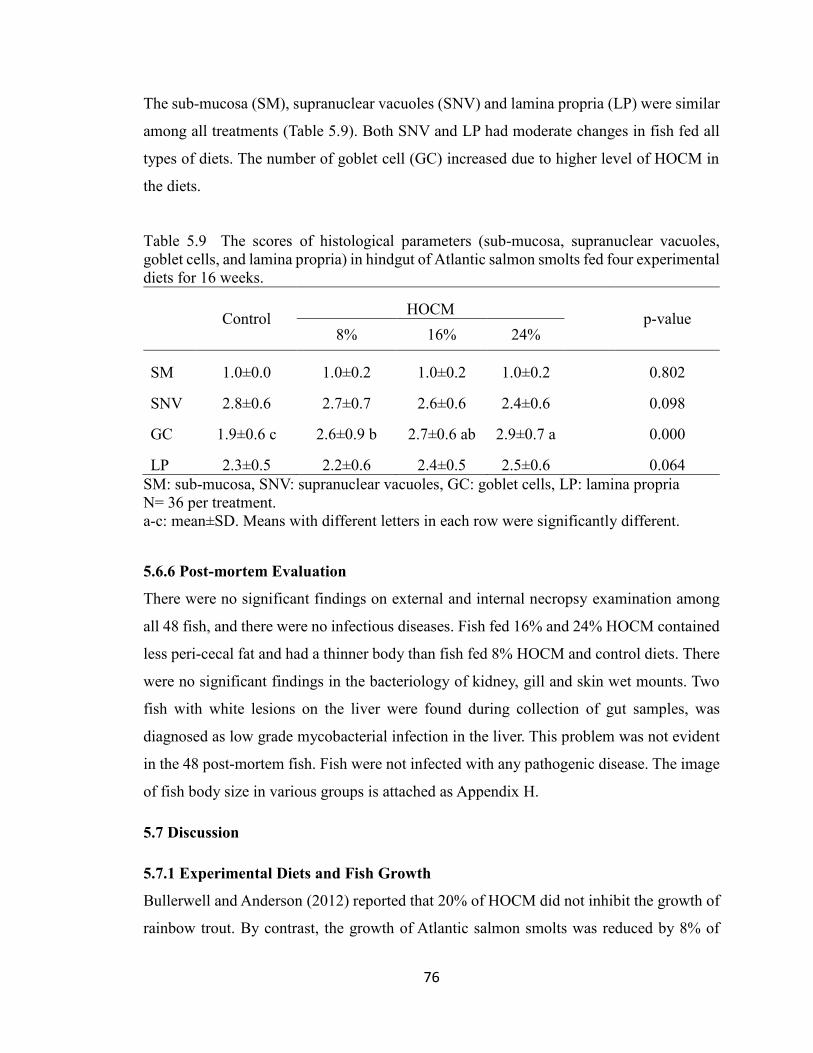
76
The sub-mucosa (SM), supranuclear vacuoles (SNV) and lamina propria (LP) were similar
among all treatments (Table 5.9). Both SNV and LP had moderate changes in fish fed all
types of diets. The number of goblet cell (GC) increased due to higher level of HOCM in
the diets.
Table 5.9 The scores of histological parameters (sub-mucosa, supranuclear vacuoles,
goblet cells, and lamina propria) in hindgut of Atlantic salmon smolts fed four experimental
diets for 16 weeks.
Control
HOCM p-value
8% 16% 24%
SM 1.0±0.0 1.0±0.2 1.0±0.2 1.0±0.2 0.802
SNV 2.8±0.6 2.7±0.7 2.6±0.6 2.4±0.6 0.098
GC 1.9±0.6 c 2.6±0.9 b 2.7±0.6 ab 2.9±0.7 a 0.000
LP 2.3±0.5 2.2±0.6 2.4±0.5 2.5±0.6 0.064
SM: sub-mucosa, SNV: supranuclear vacuoles, GC: goblet cells, LP: lamina propria
N= 36 per treatment.
a-c: mean±SD. Means with different letters in each row were significantly different.
5.6.6 Post-mortem Evaluation
There were no significant findings on external and internal necropsy examination among
all 48 fish, and there were no infectious diseases. Fish fed 16% and 24% HOCM contained
less peri-cecal fat and had a thinner body than fish fed 8% HOCM and control diets. There
were no significant findings in the bacteriology of kidney, gill and skin wet mounts. Two
fish with white lesions on the liver were found during collection of gut samples, was
diagnosed as low grade mycobacterial infection in the liver. This problem was not evident
in the 48 post-mortem fish. Fish were not infected with any pathogenic disease. The image
of fish body size in various groups is attached as Appendix H.
5.7 Discussion
5.7.1 Experimental Diets and Fish Growth
Bullerwell and Anderson (2012) reported that 20% of HOCM did not inhibit the growth of
rainbow trout. By contrast, the growth of Atlantic salmon smolts was reduced by 8% of
77
HOCM in the current study. The effects of HOCM on fish growth may be different in
various species. Body weight gain was driven by the rate of amino acid deposition (Dumas
et al., 2007). The lower levels of protein retention ratio in the fish fed 16% and 24% HOCM
diets was correlated with the decreased body weight gain. Lall and Anderson (2005)
indicated that the availability of amino acids in plant protein was not as high as that in
fishmeal. Although the calculated amino acids met the requirements of Atlantic salmon, the
actual availability of amino acids may decrease due to the increased level of HOCM in the
diets. The various levels of poultry byproduct meal (<15%) in the experimental diets should
not cause the reduction of growth, since poultry byproduct meal can be effectively included
up to 20% in the salmonid diet (Fowler, 1991; Steffens, 1994). The fish fed 8% HOCM had
similar protein retention ratio to the fish fed control, but lower weight gain. This result
revealed that there must be other factors inhibiting the growth.
The potential antinutrional factors in HOCM included tannins, sinapine, phytic acid, and
glucosinolates. The harmful levels of tannins and sinapine for Atlantic salmon are unknown.
The phytic acid level in all diets was under the safe upper limit level of 1% as fed (Denstadli
et al., 2006). The level of glucosinolates in HOCM diets (4.9-8.7µmol/g) was over the safe
upper limit level of 1.4 µmol/g reported for rainbow trout fed rapeseed meal (Burel et al.,
2000; NRC, 2011), and also higher than 2.6 µmol/g recommended in Chapter 4. In addition,
Burel et al (2000) reported 30 µmol/ kg fish body weight/day glucosinolates impaired the
feed efficiency, and it was found at 35µmol/kg fish body weight/day of glucosinolates
(8%HOCM diet, not reported in the results section) in the current study. The variation might
be due to the significantly different composition of glucosinolates between rapeseed and
camelina, different fish species and interaction with other antinutrient factors. In general,
glucosinolates impair the growth of animals via two ways, one is the reduction of feed
intake due to the bitterness, and another is the interruption of thyroid function. The decrease
of feed consumption was evident in rats, dairy cows, and pigs (Korsrud and Bell, 1967;
Mawson et al., 1993). In the current study, fish consumed a significantly lower amounts of
HOCM diets compared to control diet, and weight gain was highly dependent on the feed
consumption over the time (R2=0.98). This result indicated that glucosinolates may be
reducing the feed palatability to fish, and subsequently decreased weight gain.
Glucosinolates induced hypothyroid condition was reported by several workers (Hardy and
78
Sullivan, 1983; Burel et al., 2000; 2001). The levels of triiodothyronine (T3) and thyroxine
(T4) in plasma decreased, associated with hyperactivity in the thyroid tissue. This is because
thiocyanate anions, metabolic byproducts from glucosinolates, compete for iodine (Burel
et al., 2001). Self-compensation of T3 could ensure a normal growth of rainbow trout in two
months, when the fish fed a diet containing 7.3 µmol/g of glucosinolates (Burel et al., 2000;
2001). T4 can partly convert to T3 via desiodination, and the level of T3 was unchanged
(Burel et al., 2001). In the current study, the weight of fish fed 8% HOCM (4.9 µmol/g of
glucosinolates) was reduced after four weeks. In addition, other antinutritional factors in
camelina meal, such as non-starch polysaccharides (NSP), phytic acid, sinapine and tannins
could contribute to the poor voluntary feed consumption and growth. This issue needs
further studies to isolate the effect of each factor on salmon.
5.7.2 Carcass Composition
The carcass composition (DM basis) of rainbow trout fed HOCM diets was similar (Pan et
al., 2011). However, it was affected by the dietary treatments in the current study, which
was associated with severe reduction in the feed consumption and final weight. For growing
fish, fish size, life cycle stage and energy intake play primary role in proximate composition
in fish (Shearer, 1994b). It seems that the dietary treatments affected the growth firstly, and
then altered the carcass composition in the current study. The fast growing fish tended to
increase the lipid deposition in their body, because the addition energy intake promoted the
lipid deposition and fat tissue growth when the protein deposition reached the maximal
level (Dumas et al., 2007). On the contrary, the fish fed 16% and 24% SECM diets had
poor feed consumption and growth, thus the protein and lipid deposition rates in these fish
were relatively low.
5.7.3 Hindgut Histology
The hindgut in fish fed the control diet showed moderate changes in supranuclear vacuoles
(SNV), goblet cells (GC), and lamina propria (LP). The starvation (Baeverfjord and
Krogdahl, 1996) and acute stress (Olsen et al., 2005) contributed some degree of
histological changes in the fish hindgut. The cracks between absorptive cells and lamina
propria among all treatments in present study were not described in the soybean induced
enteritis in Atlantic salmon (Baeverfjord and Krodahl, 1996; Bakke-McKellep et al., 2007;
79
Uran et al., 2008b, 2009). The cause was undetermined. It might be caused by the multiple
stresses, such as fungal infections, formalin bath, and frequently inevitable handlings in the
early period of experiment.
Goblet cells (GC) play an important role by secreting mucus as part of the innate defense
system (Marchetti et al., 2006). Supranuclear vacuoles (SNV) and GC were believed to be
the first locations exhibiting enteritis features, and villi could not recover when Atlantic
salmon were continually fed with soybean meal (Uran et al., 2008b). Both abnormalities of
GC and SNV were evident in Atlantic salmon fed full fat soybean meal (Van den Ingh et
al., 1991). The increased number of GC when graded levels of HOCM were fed implied
that enteritis was initiated. The hindgut was a major site of endocytosis of intact proteins
in teleosts (Stroband and Van der veen, 1981; Rombout, et al., 1985). The soybean induced
enteritis caused reduction of microvilli, which resulted in exposure of enterocyte tight
junctions, and led to the loss of the protective barrier on the intestinal epithelium in rainbow
trout (Merrifield et al., 2009). Uran et al. (2009) found the damage on microvilli, and
subsequently the disappearance of SNV reflected that the endocytosis was completely
blocked (Uran et al., 2008a). Mucilage in camelina may be responsible for the decreased
size of SNV as discussed in Chapter 4. In the diet formulation, pregelatinized starch was
added at 2.5% as a binding agent. Wheat also has a binding function, and its content
decreased from 12.62 to 0.43% as HOCM level increased in the diet (Table 5.1). NSP exist
in these ingredients, and the soluble NSP increase the viscosity of digesta (NRC, 2011).
This may explain the observation of diffused size reduction of SNV was independent with
the dietary treatments. The higher level of poultry meal in control diet should be considered,
but the effects of poultry meal on the gut histology of Atlantic salmon has not been
described in the scientific literature. Plant lipid also increased the number of GC (Caballero
et al., 2002; Merida et al., 2010), but it did not occur in fish fed CO diets in previous two
studies (Chapter 3 and Chapter 4). Overall, the enteritis was developing in fish fed HOCM
diets during the experiment, and it was dose dependent. Theoretically, the following
changes in the hindgut of Atlantic salmon might have occurred in the present study: the
enteritis was accompanied with reduction of microvilli and shrinkage of villi (Uran et al.,
2009), reduction of digestive enzyme activity (Krogdahl et al., 2003), increased
permeability of hindgut epithelium, inhibition of nutrient absorption (Knudsen et al., 2008;
80
Nordrum, et al., 2000), and changes in intestinal microbiota (Merrifield et al., 2009; Green
et al., 2013). The hindgut was not considered a major site for uptake of nutrients, but
exhibited immune function in Atlantic salmon (reviewed by Rombout et al., 2011).
Nevertheless, the decrease of villi area due to HOCM in the present study implied that the
absorptive area decreased, and it might be associated with the decreased mean body weight.
5.7.4 Mortality
Atlantic salmon smolts were reared in freshwater in the first four weeks at 12 °C. Those
fish were supposed to lose some smolt characteristics, such as decrease in Na+/K+-ATPase
activity (Duston et al., 1991). A large number of dead fish due to fungus were seen in the
first five weeks. One reason might be the weakened immune system during the reversal of
physiology. Furthermore, some inadequate essential nutrients could weaken the immune
system, for example the compromise of physical barriers including skin and mucus (Lall,
2000). However, current diets were nutritionally balanced, the problem related to mortality
maybe due to factors in camelina other than inadequate nutrients. It indicated that it is
unsafe to use this formulation when Atlantic salmon are at stressed/delicate state. The
salinity was adjusted from 0 to 2 ppt, which was not considered to impair the growth
(Duston, 1994). In addition, the low salinity succeeded in inhibiting the growth of fungus
(Saprolegnia sp.) on the fish.
5.8 Conclusion
The growth of Atlantic salmon smolts in freshwater was impaired by high oil residue
camelina meal due to low feed consumption. Carcass protein, lipid and protein retention
ratio were not compromised by 8%HOCM diet, but was reduced by higher level HOCM.
The onset of enteritis was observed in fish fed diets containing HOCM. An investigation
of a satisfactory level of HOCM less than 8% is needed. The causative agents of enteritis
and the cracks between lamina propria and enterocytes in the hindgut villi need further
study. This study suggests a study with lower levels of HOCM from 0 to 10% in the diet.
81
Chapter 6 : Conclusion
6.1 Outcomes of Current Study
The camelina byproducts in the present studies included camelina oil (CO), solvent
extracted camelina meal (SECM) and high oil residue camelina meal (HOCM). The life
stages of Atlantic salmon tested were parr (initial weight: 8.4 g) and smolts (initial weight:
61.8 g) and post-smolts (initial weight: 242 g).
In the parr study, experimental diets were control, 50% CO, 100% CO, and 5, 10, 15 and
20% SECM. Camelina oil was successful in replacing 50% and 100% fish oil. Ten percent
SECM could be included in the diet without compromising the growth, carcass composition,
and hindgut histology of Atlantic salmon parr in 16 weeks.
In the post-smolt study in seawater, control, 8%, 16%, 24% SECM, 100% CO+SEFM, 100%
CO+10% SECM+SEFM, 100% CO+FM, and 100% CO+10% SECM+FM diets were
tested. Only 100% CO and 8% SECM diets were found satisfactory by evaluating the
growth, carcass composition, and hindgut histology. The combination of 100% CO and 10%
SECM inhibited the growth of fish. The supranuclear vacuoles tended to disappear, and the
sub-mucosa increased in fish fed 24% SECM.
In the smolt trial in freshwater, fish were fed control, 8%, 16% and 24% HOCM diets.
Growth performance was inhibited by HOCM in a dose-dependent manner. The reduced
growth was caused by the poor feed intake. Carcass composition was affected by HOCM.
The protein retention ratio, carcass protein and fat decreased as the level of HOCM
increased. The area of hindgut villi decreased in fish fed 24% HOCM diet. The number of
goblet cells increased by dietary treatments. Overall, HOCM was not accepted, even at 8%
of the diet.
In all the three experiments, CO could effectively replace 100% of fish oil in the diet
without compromising the growth of Atlantic salmon parr and smolts, µbut it did not show
the same response as the combination with camelina meal. The variation of growth
performance in fish fed SECM diets between different experiments may have been due to
various factors, such as life stage, rearing conditions, variety of camelina seed, and
differences in the diet formulation. In general, the acceptable level of SECM for Atlantic
82
salmon was up to 8-10% in the diet. Multiple antinutritional factors induced the reduction
in feed intake and growth, the effect of each single factor needs to be addressed in the future.
The effect of glucosinolates was suspected to be one of the major antinutritional factors
and the adverse effects were discussed in this thesis. The safe range of glucosinolates was
1.8 to 2.6 µmolg/g in the diet. The effect of camelina meal on the carcass composition was
not consistent in three experiments. The enteritis in distal intestine was not observed in fish
fed diets containing CO and the combination of CO and SECM, but various degrees of
enteritis were found in fish fed the diets with more than 15% of SECM and the diets with
more than 8% of HOCM. The causative agents of enteritis need to be identified in the future.
6.2 Future Directions
In general, there are three directions for future studies: the optimal levels of camelina
byproducts for the various life stages/fish size that the current studies have not covered, the
efficient procedures to reduce antinutritional factors in camelina meal, and the causative
agents of hindgut enteritis in Atlantic salmon fed camelina meals.
The investigation of camelina byproducts fed to first feeding salmon has been conducted.
In commercial production, the parr are reared to 80-100g in the hatchery, and transferred
to the sea cages. The size of fish in the first experiment (Chapter 3) reached 50 g after 16
weeks. A similar design, but in a longer feed period maybe needed to cover the entire parr
stage. A graded levels of HOCM up to 8% need to be investigated. Once the optimal level
of HOCM for Atlantic salmon smolts was found, it should be evaluated on the large post-
smolts (>500 g fish). The effects of 10% SECM and 100% CO on the large post-smolts
need to be investigated, since the period of grow-out is about 1.5 years, and current studies
are restricted to the early part of this period. How long does a fish oil diet restore the levels
of EPA and DHA in Atlantic salmon flesh remains unknown, since the EPA and DHA
levels were reduced due to the 100% CO. The camelina protein concentrate with higher
protein content should be developed and tested in salmon diets.
Comparisons of pre-treated camelina meal fed to Atlantic salmon are needed. Factors such
as heat, solvent extraction, and enzyme treatments need to be evaluated. The changes of
thyroid morphology and thyroid hormones in Atlantic salmon fed camelina need to be
investigated, regarding the negative effects of glucosinolates.
83
References
Anderson, J. S., Lall, S. P., Anderson, D. M. and McNiven, M. A., 1995. Availability of
amino acids from various fish meals fed to Atlantic salmon (Salmo salar).
Aquaculture. 138: 291-301.
Anderson, D. M., MacPherson, M. J. and MacIsaac, P. F., 2008. Feeding full-fat
oilseeds as partial replacement for fish meal and fish oil in practical diets for
rainbow trout fingerlings. Can. J. Anim. Sci. 88: 166.
AOAC International. (2011). Official methods of analysis of AOAC International. 18th
Edition, Revision 4. Arlington, Va: AOAC International.
Aslaksen, M. A., Kraugerud, O. F., Penn, M., Svihus, B., Denstadli, V., Jorgensen, H.
Y., Hillestad, M., Krogdahl, A. and Storebakken, T., 2007. Screening of nutrient
digestibilities and intestinal pathologies in Atlantic salmon, Salmo salar, fed diets
with legumes, oilseeds, or cereals. Aquaculture. 272: 541-555.
Aziza, A. E., Quezada, N. and Cherian, G., 2010. Feeding Camelina sativa meal to meat-
type chickens: effect on production performance and tissue fatty acid composition.
J. Appl. Poultry. Res. 19: 157-168.
Baeverfjord, G. and Krogdahl, A., 1996. Development and regression of soybean meal
induced enteritis in Atlantic salmon, Salmo salar L., distal intestine: a comparison
with the intestines of fasted fish. J. Fish. Biol. 19: 375-387.
Bakke-McKellep, A. M., Press, C. M., Baeverfjord, G., Krogdahl, A. and Landsverk,
T., 2000. Changes in immune and enzyme histochemical phenotypes of cells in the
intestinal mucosa of Atlantic salmon, Salmo salar L., with soybean meal-induced
enteritis. J. Fish. Biol. 23: 115-127.
Bakke-McKellep, A. M., Penn, M. H., Salas, P. M., Refstie, S., Sperstad, S., Landsverk,
T. Ringo, E. and Krogdahl, A., 2007. Effects of dietary soyabean meal, inulin and
oxytetracycline on intestinal microbiota and epithelial cell stress, apoptosis and
proliferation in the teleost Atlantic salmon (Salmo salar L.). Brit. J. Nutr. 97:699-
713.
Bell, J. M., and Keith, M. O., 1991. A survey of variation in the chemical composition of
commercial canola meal produced in Western Canadian crushing plants. Can. J.
Anim. Sci.71: 469-480.
84
Bell, M. V., Dick, J. R. and Porter, A. E. A., 2001. Biosynthesis and tissue deposition of
docosahexaenoic acid (22:6n-3) in rainbow trout (Oncorhynchus mykiss). Lipids.
36: 1153-1159.
Bell, J. G., McGhee, F., Campbell, P. J. and Sargent, J. R., 2003. Rapeseed oil as an
alternative to marine fish oil in diets of post-smolt Atlantic salmon (Salmo salar L.):
changes in flesh fatty acid composition and effectiveness of subsequent fish oil
“wash out”. Aquaculture. 218: 515-528.
Bell, J. G., Henderson, R. J., Tocher, D. R. and Sargent, J. R., 2004. Replacement of
dietary fish oil with increasing levels of linseed oil: modification of flesh fatty acid
compositions in Atlantic salmon (Salmo salar) using a fish oil finishing diet. Lipid.
39: 223-232.
Bell, J. G., Pratoomyot, J., Strachan, F., Henderson, R. J., Fontanillas, R., Hebard, A.,
Guy, D. R., Hunter, D. and Tocher, D. R., 2010. Growth, flesh adiposity and fatty
acid composition of Atlantic salmon (Salmo salar) families with contrasting flesh
adiposity: Effects of replacement of dietary fish oil with vegetable oils. Aquaculture.
306: 225-232.
Bransden, M. P., Carter, C. G., and Nichols, P. D., 2003. Replacement of fish oil with
sunflower oil in feeds for Atlantic salmon (Salmo salar L.): effect on growth
performance, tissue fatty acid composition and disease resistance. Comp. Biochem.
Phys. B, 135: 611-625.
Budin, J. T., Breene, W. M. and Putnam, D. H., 1995. Some compositional properties
of camelina (Camelina sativa L. Grantz) seeds and oils. J. Am. Oil. Chem. Soc., 72:
309-315.
Bullerwell, C. and Anderson, D. M., 2012. Performance of rainbow trout (Oncorhynchus
mykiss) fed camelina sativa seeds and high oil residue meal. Proc. Aquaculture
Association of Canada Annual Conference, Charlottetown, PEI. pp:137.
Burel, C., Boujard, T., Escaffre, A. M., Kaushik, S. J., Boeuf, G., Mol, K. A., Van der
Geyten, S. and Kuhn, E. R., 2000. Dietary low-glucosinolate rapeseed meal
affects thyroid status and nutrient utilization in rainbow trout (Oncorhynchus
mykiss). Brit. J. Nutr. 83: 653-664.
85
Burel, C., Boujard, T., Kaushik, S. J., Boeuf, G., Mol, K. A., Van der Geyten, S. V.,
Darras, V. M., Kuhn, E. R., Pradet-Balade, B. P., Querat, B., Quinsac, A.,
Krouti, M. and Ribaillier, D., 2001. Effects of rapeseed meal-glucosinolates on
thyroid metabolism and feed utilization in rainbow trout. General and Comparative
Endocrinology. 124: 343-358.
Burr, G. S., Wolters, W. R., Barrows, F. T., and Hardy, R. W., 2012. Replacing
fishmeal with blends of alternative proteins on growth performance of rainbow trout
(Oncorhynchus mykiss), and early or late stage juvenile Atlantic salmon (Salmo
salar). Aquaculture. 334-337: 110-116.
Burr, G. S., Wolters, W. R., Barrows, F. T. and Donkin, A. W., 2013. Evaluation of a
canola protein concentrate as a replacement for fishmeal and poultry by-product
meal in a commercial production diet for Atlantic salmon (Salmo salar). Int. Aquat.
Res. 5: 5.
Buzzi, M., Henderson, R. J. and Sargent, R., 1997. Biosynthesis of docosahexaenoic
acid in trout hepatocytes proceeds via 24-carbon intermediates. Comp. Biochem.
Physiol. 116B: 263-267.
Caballero, M. J., Obach, A., Rosenlund, G., Montero, D., Gisvold, M. and Lzquierdo,
M. S., 2002. Impact of different dietary lipid sources on growth, lipid digestibility,
tissue fatty acid composition and histology of rainbow trout, Oncorhynchus mykiss.
Aquaculture. 214: 253-271.
Canadian Council on Animal Care (CCAC), 2005. Guidelines on: the care and use of
fish in research, teaching and testing.
Canola Council of Canada. Health benefits of canola oil. http://www.canolacouncil.org/
oil-and-meal/canola-oil/health-benefits-of-canola-oil/. Accessed on March 30,
2014.
Cao, L., Wang, W. M., Yang, C. T., Yang, Y., Diana, J., Yakupitiyage, A., Luo, Z. and
Li, D. P., 2007. Review: Application of microbial phytase in fish feed. Enzyme.
Microb. Tech. 40: 497-507.
Carter, C. G. and Hauler, R. C., 2000. Fish meal replacement by plant meals in extruded
feeds for Atlantic salmon, Salmo salar L. Aquaculture. 185: 299-311.

86
Carey, J. B. and McCormick, S. D., 1998. Atlantic salmon smolts are more responsive to
an acute handling and confinement stress than parr. Aquaculture. 168: 237-253.
Cherian, G., Campbell, A. and Parker, T., 2009. Egg quality and lipid composition of
eggs from hens fed Camelina sativa. J. Appl. Poultry. Res. 18: 143-150.
Collins, S. A., Desai, A. R., Mansfield, G. S., Hill, J. E., Van Kessel, A. G. and Drew,
M. D., 2012. The effect of increasing inclusion rates of soybean, pea and canola
meals and their protein concentrates on the growth of rainbow trout: Concepts in
diet formulation and experimental design for ingredient evaluation. Aquaculture.
90-99: 344-349.
Connor, W. E., 2000. Importance of n-3 fatty acids in health and disease. Am. J. Clin.
Nutr. 71 (suppl): 171s-175s.
Corner, A. H., 1983. Cardio pathology associated with the feeding of vegetable and marine
oils. In Kramer, J. K. G. (ed.), Sauer, F. D. (ed.) and Pigden, W. J. (ed.). High and
low erucic acid rapeseed oils. Pp: 293-313. Academic Press.
Crowley, J. G. and Frohlich, A., 1998. Factors affecting the composition and use of
camelina. ISBN 19001138666. Crops Research Centre, Teagasc. Dublin, Ireland.
Daxenbichler, M. E., Vanetten, C. H. and Brown, F. S., 1964. Oxazolidinethiones and
volatile isothiocyanates in enzyme-treated seed meals from 65 species of Cruciferae.
J. Agr. Food. Chem. 12: 127-130.
Deng, Q., Huang, F., Huang, Q, Xu, J. and Liu, C., 2011. Lipid-lowering evaluation of
cold-pressed Camelina sativa oil. J. Food. Agric. Environ. 9: 157-162.
Denstadli, V., Skrede, A., Krogdahl, Sahlstrom, S. and Storebakken, T., 2006. Feed
intake, growth, feed conversion, digestibility, enzyme activities and intestinal
structure in Atlantic salmon (Salmo salar L.). Aquaculture, 256: 365-376.
Downey, R. K., 1971. Agricultural and genetic potentials of cruciferous oilseed crops. J.
Am. Oil. Chem. Soc. 48: 718-722.
Drew, M. D., Ogunkoya, A. E., Janz, D. M. and Kessel, A. G. V., 2007. Dietary influence
of replacing fish meal and oil with canola protein concentrate and vegetable oils on
growth performance, fatty acid composition and organochlorine residues in rainbow
trout (Oncorhynchus mykiss). Aquaculture. 267: 260-268.

87
Dumas, A., De Lange, C. F. M., France, J. and Bureau, D. P., 2007. Quantitative
description of body composition and rates of nutrient deposition in rainbow trout
(Oncorhynchus mykiss). Aquaculture. 273: 165-181.
Duston, J., 1994. Effect of salinity on survival and growth of Atlantic salmon (Salmo salar)
parr and smolts, 1994. Aquaculture. 121: 115-124.
Duston, J., Saunders, R. L. and Knox, D. E., 1991. Effects of increases in freshwater
temperature on loss of smolt characteristics in Atlantic salmon (Salmo salar). Can.
J. Fish. Aquat. Sci. 48: 164-169.
Eidhin, D. H., Burke, J. and O’Beirne, D., 2003. Oxidative stability of ω3-rich camelina
oil and camelina oil-based spread compared with plant and fish oils and sunflower
spread. J. Food. Sci. 68: 345-353.
Ellis, A. E., Roberts, R. F. and Tyler, P., 1978. Chapter 2: The anatomy and physiology
of teleosts In Roberts, R. J. (ed.). Fish pathology. Pp: 37. London: Bailliere Tindall.
Espe, M., Lemme, A., Petri, A. and EI-Mowafi, A., 2006. Can Atlantic salmon (Salmo
salar) grow on diets devoid of fish meal? Aquaculture. 255: 255-262.
European Food Safety Authority (EFSA), 2010. Scientific opinion on the safety of allyl
isothiocyanate for the proposed uses as a food additive. EFSA journal. 8:1943.
EWOS Reporting Centre, 2013. http://www.reporting.ewos.com/sustainability-
reports/gri-report-2013/performance/?id=ew-i08. Accessed on August 13, 2014.
Food and Agriculture Organization (FAO), Fisheries and Aquaculture Department,
2010. The state of world fisheries and aquaculture. Food and Agriculture
organization of the United Nations, Rome. Pp: 3, 38-44.
Food and Agriculture Organization (FAO), Fisheries and Aquaculture Department,
2012. The state of world fisheries and aquaculture. Food and Agriculture
organization of the United Nations, Rome. Pp: 3, 65, 81 172-177.
Food and Agriculture Organization (FAO), 2014. The state of world fisheries and
aquaculture: opportunities and challenges. Food and Agriculture organization of the
United Nations, Rome. Pp: 61-62, 201.
Fowler, L. G., 1991. Poultry by-product meal as a dietary protein in fall chinook salmon
diets. Aquaculture. 99: 309-321.

88
Frame, D. D., Palmer, M. and Peterson, B., 2007. Use of Camelina sativa in the diets of
young turkeys. J. Appl. Poultry. Res. 16: 381-386.
Francis, G., Makkar, H. P. S. and Becker, K., 2001. Antinutritional factors present in
plant-derived alternate fish feed ingredients and their effects in fish. Aquaculture.
199: 197-227.
Francis, C. M. and Campbell, M. C., 2003. New high quality oil seed crops for temperate
and tropical Australia. RIRDC Publication NO 03/045. Rural Industries Research
and Development Corporation.
Green, T. J., Smullen, R. and Barnes, A. C., 2013. Dietary soybean protein concentrate-
induced intestinal disorder in marine farmed Atlantic salmon, Salmo salar is
associated with alterations in gut microbiota. Vet. Microbiol. 166: 286-292.
Gugel, R. K. and Falk, K. C., 2006. Agronomic and seed quality evaluation of Camelina
sativa in western Canada. Can. J. Plant. Sci. 86: 1047-1058.
Handeland, S. O. and Stefansson, S. O., 2002. Effects of salinity acclimation on pre-
smolt growth, smolting and post-smolt performance in off-season Atlantic salmon
smolts (Salmo salar L.). Aquaculture. 209: 125-137.
Hardy, R.W. and Sullivan, C. V., 1983. Canola meal in rainbow trout (Salmo gairdneri)
production diets. Can. J. Fish. Aquat. Sci. 40: 281-286.
Hastings, N., Agaba, M. K., Tocher, D. R., Zheng, X. Z., Dickson, C. A. 2004.
Molecular cloning and functional characterization of fatty acyl desaturase and
elongase cDNAs involved in the production of eicosapentaenoic and
docosahexaenoic acids from α-linolenic acid in Atlantic salmon (Salmo salar). Mar.
Biotechnol. 6: 463-474.
Hayter, A. J., 1984. A proof of the conjecture that the Tukey-Kramer multiple
comparisions procedure is conservative. Ann. Stat. 12: 61-75.
Hendricks, J. D., 2002. Adventitious toxins. In Halver, J. E. (ed.) and Hardy, R. W. (ed.)
Fish Nutrition, 3rd Edition. Pp: 602-041. Academic Press.
Higgs, D. A., McBride, J. R., Markert, J. R., Dosanjh, B. S., Plotnikoff, M. D., and
Clarke, W. C., 1982. Evaluation of tower and candle rapeseed (canola) meal and
Bronowski rapseed protein concentrate as protein supplements in practical dry
89
diets for juvenile Chinook salmon (Oncorhynchus tshawytscha). Aquaculture. 29:
1-31.
Hixson, S. M., Parrish, C. C. and Anderson, D. M., 2013. Effect of replacement of fish
oil with camelina (Camelina sativa) oil on growth, lipid class and fatty acid
composition of farmed juvenile Atlantic cod (Gadus morhua). Fish. Physiol.
Biochem. 39: 1441-1456.
Hixson, S. M., Parrish, C. C. and Anderson, D. M., 2014a. Changes in tissue lipid and
fatty acid composition of farmed rainbow trout in response to dietary camelina oil
as a replacement of fish oil. Lipids. 49: 97-111.
Hixson, S. M., Parrish, C. C. and Anderson, D. M., 2014b. Full substitution of fish oil
with camelina (Camelina sativa) oil, with partial substitution of fish meal with
camelina meal, in diets for farmed Atlantic salmon (Salmo salar) and its effect on
tissue lipids and sensory quality. Food. Chem. 157: 51-61.
Hixson, S. M., Parrish, C. C. and Anderson, D. M., 2014c. Use of camelina oil to replace
fish oil in diets for farmed salmonids and Atlantic cod. Aquaculture. 431: 44-52.
Hossain, M. A., and Jauncey, K., 1989. Nutritional evaluation of some Bangladeshi
oilseed meals as partial substitutes for fish meal in the diet of common carp,
Cyprinus carpio L. Aquacult. Fish. Manage. 20: 255-268.
Jiang, Y. F., Caldwell, C. D. and Falk, K. C., 2014. Camelina seed quality in response to
applied nitrogen, genotype and environment. Can. J. Plant. Sci. 94: 971-980.
Jobling, M., 1993. Nutrition, diet formulation and feeding practices. In Heen, K. (ed.),
Monahan, R. L. (ed.), and Utter, F. (ed.). Salmon Aquaculture. Oxford: Fishing
News Books. pp: 83-126.
Johnson, A., personal communication. Analytical services supervisor, POS Bio-Science,
118 Veterinary Road, Saskatoon, SK, Canada. S7N 2R4.
Kjaer, A., Gmelin, R. and Jensen, R. B., 1956. Isothiocyanates XXI. (-)-10-
methylsulphinyldecyl isothiocyanate, a new mustard oil present as a glucoside
(Glucocamelinin) in Camelina species. Acta Chemica Scandinavica. 10: 1614-1619.
Knudsen, D., Uran, P. A., Arnous, A., Koppe, W. and Frokiaer, H., 2007. Saponin-
containing subfractions of soybean molasses induce enteritis in the distal intestine
of Atlantic salmon. J. Arg. Food. Chem. 55: 2261-2267.
90
Knudsen, D., Jutfelt, F., Sundh, H., Sundell, K., Koppe, W. and Frokiaer, H., 2008.
Dietary soya saponins increase gut permeability and play a key role in the onset of
soyabean-induced enteritis in Atlantic salmon (Salmo salar L.). Brit. J. Nutr. 100:
120-129.
Korsrud, G. O. and Bell, J. M., 1967. The feeding value of solvent-extracted camelina
meal effects of levels fed, heat treatments and flavor supplements. Can. J. Anim.
Sci. 47: 109-114.
Korsrud, G. O., Keith, M. O. and Bell, J. M., 1978. A comparison of the nutritional
value of crambe and camelina seed meals with egg and casein. Can. J. Anim. Sci.
58: 493-499.
Krogdahl, A., Bakke-McKellep, A. M., Roed, K. H. and Baeverfjord, G., 2000. Feeding
Atlantic salmon Salmo salar L. soybean produts: effects on disease resistance
(furunculosis), and lysozyme and IgM levels in the intestinal mucosa. Aquacult.
Nutr. 6: 77-84.
Krogdahl, A., Bakke-McKellep, A. M. and Baeverfjord, G., 2003. Effects of graded
levels of standard soybean meal on intestinal structure, mucosal enzyme activities,
and pancreatic response in Atlantic salmon (Salmo salar L.). Aquacult. Nutr. 9:
361-371.
Lakshmy, R., Rao, P. S., Sesikeran, B., and Suryaprakash, P., 1995. Iodine metabolism
in response to goitrogen induced altered thyroid status under conditions of moderate
and high intake of iodine. Horm. Metab. Res. 27: 450-454.
Lall, S. P., 2000. Nutrition and health of fish. In: Cruz -Suárez, L.E., Ricque-Marie, D.,
Tapia-Salazar, M., Olvera-Novoa, M.A. y Civera-Cerecedo, R., (Eds.). Avances
en Nutrición Acuícola V. Memorias del V Simposium Internacional de Nutrición
Acuícola. 19-22.
Lall, S. P. and Anderson, S., 2005. Amino acid nutrition of salmonids: Dietary
requirements and bioavailability. In Monter, D. (ed.), Basurco, B. (ed.), Nengas, I.
(ed.), Alexis, M. (ed.), and Izquierdo, M. (ed.). Mediterranean fish nutrition. 63 (pp:
73-90). International centre for Advanced Mediterranean Agronomic Studies
(CIHEAM).

91
Landero, J. L., Beltranena, E., Cervantes, M., Araiza, A. B. and Zijlstra, R. T., 2012.
The effect of feeding expeller-pressed canola meal on growth performance and diet
nutrient digestibility in weaned pigs. Anim. Feed. Sci. Technol. 171: 240-245.
Littell, R. C., Milliken, G. A., Stroup, W. W., Wolfinger, R. D. and Schabenberger, O.,
2006. SAS for mixed models (2nd ed). Cary, NC, USA: SAS institute.
Lokka, G., Austbo, L., Falk, K., Bjerkas, I. and Koppang, E. O., 2013. Intestinal
morphology of the wild Atlantic salmon (Salmo salar). J. Morphol. 274: 859-876.
Mandal, S. and Ghosh, K., 2010. Inhibitory effect of Pistia tannin on digestive enzymes
of Indian major carps: an in vitro study. Fish. Physiol. Biochem. 36: 1171-1180.
Marchetti, L., Capacchietti, M., Sabbieti, M. G., Accili, D., Materazzi, G. and Menghi,
G., 2006. Histology and carbohydrate histochemistry of the alimentary canal in the
rainbow trout Oncorhynchus mykiss. J. Fish. Biol. 68: 1808-1821.
Matthaus, B., 1997. Antinutritive compounds in different oilseeds. Lipid/Fett. 99: 170-
174.
Matthaus, B. and Zubr, J., 2000. Variability of specific components in Camelina sativa
oilseed cakes. Ind. Crop. Prod. 12: 9-18.
Mawson, R., Heaney, R. K., Zdunczyk. Z. and Kozlowska, H., 1993. Rapeseed meal-
glucosinolates and their antinutritional effects. Part 2. Flavour and Palatability.
Molecular Nutrition. 37: 336-334.
Mazza, G and Biliaderis, C. G., 1989. Functional properties of flax seed mucilage. J. Food.
Sci. 54: 1302-1305.
McCormick, S. D., and Saunders, R. L., 1987. Preparatory physiological adaptation for
marine life of salmonids: Osmoregulation, Growth, and Metabolism. Am. Fish. Soc.
Symp. 1: 211-229.
McCormick, S. D., Shrimpton, J. M., Moriyama, S. and Bjornsson, B.T., 2007.
Differential hormonal responses of Atlantic salmon parr and smolt to increased
daylength: A possible developmental basis for smolting. Aquaculture. 273: 337-344.
McCurdy, S. M. and March, B. E., 1992. Processing of canola meal for incorporation in
trout and salmon diets. J. Am. Oil. Chem. Soc. 69: 213-220.
92
Merida, S. N., Vidal, A. T., Llorens, S. M., and Cerda, M. J., 2010. Sunflower meal as
a partial substitute in juvenile sharpsnout sea bream (Diplodus puntazzo) diets:
amino acid retention, gut and liver histology. Aquaculture. 298: 275-281.
Merrifield, D. L., Dimitroglou, A., Bradley, G., Baker, R. T. M. and Davies, S. J., 2009.
Soybean meal alters autochthonous microbial populations, microvilli morphology
and compromises intestinal enterocyte integrity of rainbow trout, Oncorhynchus
mykiss (Walbaum). J. Fish. Biol. 32: 755-766.
Merrifield, D. L., Rolf, E. O., Myklebust, R. and Ringo, E., 2011. Dietary effect of
soybean (Glycine max) products on gut histology and microbiota of fish. In El-
Shemy, H. (ed.) Soybean and Nutrition, Chapter 12 (231-250). ISBN 978-953-307-
536-5: InTech.
Miller, R. W., VanEtten, C. H., McGrew, C., Wolff, I. A., and Jones, Q., 1962. Seed
meal amino acids, amino acid composition of seed meals from forty-one Species of
Cruciferae. J. Agr. Food. Chem. 10, 426-430.
Mithen, R. F., Dekker, M., Verkerk, R., and Rabot, S., 2000. Review: The nutritional
significance, biosynthesis and bioavailability of glucosinolates in human foods. J.
Sci. Food. Agr. 80: 967-984.
Morais, S., Edvardsen, R. B., Tocher, D. R. and Bell, J. G., 2012. Transcriptiomic
analyses of intestinal gene expression of juvenile Atlantic cod (Gadus morhua) fed
diets with camelina oil as replacement for fish oil. Comp. Biochem. Physiol. 161:
283-293.
National Research Council (NRC, U.S.), 2011. Nutrient requirements of fish and shrimp.
Washington, D.C: National Academies Press. Pp: 70, 236-237, 327-347.
Newkirk, R. W., Classen, H. L., Scott, T. A. and Edney, M. J., 2003. The digestibility
and content of amino acids in toasted and non-toasted canola meals. Can. J. Anim.
Sci. 83: 131-139.
Nordrum, S., Bakke-McKellep, A. M., Krogdahl, A. and Buddington, R. K., 2000.
Effects of soybean meal and salinity on intestinal transport of nutrients in Atlantic
salmon (Salmo salar L.) and rainbow trout (Oncorhynchus mykiss). Comp.
Biochem. Physiol. B: Biochem Mol Biol. 125:317-335.
93
Olli, J. J. and Krogdahl, A., 1995. Alcohol soluble components of soybeans seem to
reduce fat digestibility in fish-meal-based diets for Atlantic salmon, Salmo salar L.
Aquac. Res. 26: 831-835.
Olin, P. G., Smith, J., and Nabi, R., 2010. Regional review on status and trends in
aquaculture development in North American: Canada and the United States of
American. FAO Fisheries and Aquculture Circular NO. 1061/2, Pp 9-11.
Olsen, R. E., Sundell, K., Mayhew, T. M., Myklebust, R. and Ringo, E., 2005. Acute
stress alters intestinal function of rainbow trout, Oncorhynchus mykiss (Walbaum).
Aquaculture. 250: 480-495.
Overland, M., Sorensen, M., Storebakken, T., Penn, M., Krogdahl, A. and Skrede, A.,
2009. Pea protein concentrate substituting fish meal or soybean meal in diets for
Atlantic salmon, (Salmo salar)-effect on growth performance, nutrient digestibility,
carcass composition, gut health, and physical feed quality. Aquaculture. 288: 305-
311.
Pan, W., Xie, W., Caldwell, C. D. and Anderson, D. M., 2011. Growth performance and
carcass composition of rainbow trout (Oncorhynchus mykiss) fed practical diets
containing graded levels of high fat residue Camelina meal. Can. J. Anim. Sci. 91:
484.
Peiretti, P. G., Mussa, P. P., Prola, L. and Meineri, G., 2007a. Use of different levels of
false flax (Camelina sativa L.) seed in diets for fattening rabbits. Livest. Sci. 107:
192-198.
Peiretti, P. G., Mussa, P. P., Meineri, G. and Perona, G., 2007b. Apparent digestibility
of mixed feed with increasing levels of false flax (Camelina sativa L.) seeds in
rabbit diets. J. Food. Agric. Environ. 5: 58-88.
Plessers, A. G., McGregor, W. G., Carson, R. B. and Nakoneshny, W., 1962. Species
trials with oilseed plants: II Camelina. Can. J. Plant. Sci. 42: 452-458.
Putnam, D. H., Budin, J. T., Field, L. A. and Breene, W. M., 1993. Camelina: A
promising low-input oilseed. Pp: 314-322. In: J. Janick and J.E. Simon (eds.), New
crops. Wiley, New York.
94
Rask, L., Andreasson, E., Ekbom, B., Eriksson, S., Pontoppidan, B. and Meijer, J.,
2000. Myrosinase: gene family evolution and herbivore defense in Brassicaceae.
Plant. Mol. Biol. 42: 93-113.
Redovnikovic, I. R., Glivetic, T. J., Delonga, K. and Vorkapic-Furac, J., 2008.
Glucosinolates and their potential role in plant. Period Biol. 110: 297-309.
Reed, J. D., 1995. Nutritional toxicology of tannins and related polyphenols in forage
legumes. J. Anim. Sci. 73: 1516-1528.
Refstie, S., Svihus, B., Shearer, K. D., and Storebakken, T., 1999. Nutrient digestibility
in Atlantic salmon and broiler chickens related to viscosity and non-starch
polysaccharide content in different soyabean products. Animal Feed Science and
Technology. 79: 331-345.
Refstie, S., Korsoen, O. J., Storebakken, T., Baeverfjord, G., Lein, I. and Roem, A. J.,
2000. Differing nutritional responses to dietary soybean meal in rainbow trout
(Oncorhynchus mykiss) and Atlantic salmon (Salmo salar). Aquaculture. 190: 49-
63.
Richardson, N. L., Higgs, D. A., Beames, R. M. and McBride, J. R., 1985. Influence of
dietary calcium, phosphorus, zinc and sodium phytate level on cataract incidence,
growth and histopathology in juvenile chinook salmon (Oncorhynchus
tshawytscha). J. Nutr. 115: 553-567.
Robin, J. H., Regost, C., Arzel, J. and Kaushik, S. J., 2003. Fatty acid profile of fish
following a change in dietary fatty acid source: model of fatty acid composition
with a dilution hypothesis. Aquaculture. 225: 283-293.
Robinson, R. G., 1987. Camelina: A useful research crop and a potential oilseed crop.
Minnesota Agricultural Experiment Station. 579: 1-12.
Rombout, J. H. W. M., Lamers, C. H. J., Helfrich, M. H., Dekker, A. and Taverne-
Thiele, J. J., 1985. Uptake and transport of intact macromolecules in the intestinal
epithelium of carp (Cyprinus carpio L.) and the possible immunological
implications. Cell. Tissue. Res. 239: 519-530.
Rombout, J. H. W. M., Abelli, L., Picchietti, S., Scapigliati, G. and Kiron, V., 2011.
Teleost intestinal immunology. Fish. Shellfish. Immun. 31: 616-626.

95
Ruxton, C. H. S. and Derbyshire, E., 2009. Latest evidence on omega-3 fatty acids and
health. Nutr. Food. Sci. 39: 423-438
Sanden, M., Berntssen, M. H. G., Krogdahl, A., Hemre, G-I.and Bakke-McKellep, A-
M., 2005. An examination of the intestinal tract of Atlantic salmon, Salmo salar L.,
parr fed different varieties of soy and maize. J. Fish. Biol. 28: 317-330.
Sauer, F. D. and Kramer, J. K. G., 1983. The problems associated with the feeding of
high erucic acid rapeseed oils and some fish oils to experimental animals. In Kramer,
J. K. G., Sauer, F. D. and Pigden, W. J. (eds.). High and low erucic acid rapeseed
oils. Pp: 253-291. Academic Press.
Schuster, A. and Friedt, W., 1998. Glucosinolate content and composition as parameters
of quality of Camelina seed. Ind. Crop. Prod. 7: 297-302.
Shafaeipour, A., Yavari, V., Falahatkar, B., Maremmazi, J. G. H. and Gorjipour, E.,
2007. Effects of canola meal on physiological and biochemical parameters in
rainbow trout (Oncorhynchus mykiss). Aquacult. Nutr. 14: 110-119.
Shapiro, T. A., Fahey, J. W., Wade, K. L., Stephenson, K. K. and Talalay, P., 2001.
Chemoprotecitve glucosinolates and isothiocyanates of broccoli sprouts:
metabolism and excretion in Humans. Cancer. Epidem. Biomar. 10: 501-508.
Shearer, K. D., Asgard, T., Andorsdottir, G. and Aas, G. H., 1994a. Whole body
elemental and proximate composition of Atlantic salmon (Salmo salar) during the
life cycle. J. Fish. Biol. 44: 785-797.
Shearer, K. D., 1994b. Factors affecting the proximate composition of cultured fishes with
emphasis on salmonids. Aquaculture. 119: 63-88.
Stefansson, S. O., Bjornsson, B. T., Ebbesson, L. O. E. and McCormick, S. D., 2008.
Smoltification. In Finn, R. N. and Kappor, B. G. (Eds). Fish larval physiology.
Enfield, NH: Science Publishers. Pp: 640-681.
Stefansson, S. O., Bjornsson, B. T., Sundell, K., Nyhammer, G. and McCormick, S.
D., 2003. Physiological characteristics of wild Atlantic salmon post-smolts during
estuarine and coastal migration. J. Fish. Bio. 63: 942-955.
Steffens, W., 1994. Replacing fish meal with poultry by-product meal in diets for rainbow
trout, Oncorhynchus mykiss. Aquaculture. 124: 27-34.
96
Stobiecki, M., and Makkar, H. P. S., 2004. Recent advances in analytical methods for
identification and quantification of phenolic compounds. In Muzquiz, M., Hill, G.
D., Cuadrado, C., Pedrosa, M. M. and Burbano, C., (Eds). Recent advances of
research in antinutritional factors in legume seeds and oilseeds: Proceedings of the
Fourth International Workshop on Antinutritional Factors in Legume Seeds and
Oilseeds, Toledo, Spain, 8-10 March 2004. Wageningen, Netherlands: Wageningen
Academic Publishers. Pp 11-28.
Storebakken, T., 1985. Binders in fish feeds: 1. Effect of alginate and guar gum on growth,
digestibility, feed intake and passage through the gastrointestinal tract of rainbow
trout. Aquaculture. 47: 11-26.
Stroband, H. W. J. and Van der veen, F. H., 1981. Localization of protein absorption
during transport of food in the intestine of the grasscarp, Ctenopharyngodon idella
(Val.). J. Exp. Zool. 218: 149-156.
Sundell, K., Jutfelt, F., Agustsson, T., Olsen, R. E., Sandblom, E., Hansen, T. and
Bjomsson, B. J., 2003. Intestinal transport mechanisms and plasma cortisol levels
during normal and out-of-season parr-smolt transformation of Atlantic salmon,
Salmo salar. Aquaculture. 222: 265-285.
Swanson, D., Block, R. and Mousa, S. A., 2012. Omega-3 fatty acid EPA and DHA:
health benefits throughout life. Adv. Nutr. 3: 1-7.
Tacon, A. G. J., 2005. Salmon aquaculture dialogue: State of Information on salmon
aquaculture feed and the environment. International Aquafeed. 8: 22-37.
Tacon, A. G. J., and Metian, M., 2008. Global overview on the use of fish meal and fish
oil in industrially compounded aquafeeds: Trends and future prospects. Aquaculture.
285: 146—158.
Tacon, A. G. J., Hasan, M. R. and Metian, M., 2011. Demand and supply of feed
ingredients for farmed fish and crustaceans - trends and prospects. FAO Fisheries
and Aquculture Technical paper. 564: 24, 54, 61-62.
Talalay, P. and Fahey, J. W., 2001. Phytochemicals from cruciferous plants protect
against cancer by modulating carcinogen metabolism. J. Nutr. 131:3027S-3033S.

97
Thiessen, D. L., Maenz, D. D., Newkirk, R. W., Classen, H. L. and Drew, M. D., 2004.
Replacement of fishmeal by canola protein concentrate in diets fed to rainbow trout
(Oncorhynchus mykiss). Aquacult. Nutr. 10: 379-388.
Tocher, D. R., Bell, J. G., Dick, J. R. and Sargent, J. R. 1997. Fatty acyl desaturation in
isolated hepatocytes from Atlantic salmon (Salmo salar): Stimulation by dietary
borage oil containing γ-linolenic acid. Lipids. 32: 1237-1247.
Tocher, D. R., Madrigal, J. F., Bell, J. G., Dick, J. R., Henderson, R. J. and Sargent,
J. R., 2002. Effects of diets containing linseed oil on fatty acid desaturation and
oxidation in hepatocytes and intestinal enterocytes in Atlantic salmon (Salmo salar).
Fish. Physiol. Biochem. 26: 157-170.
Tocher, D. R., 2003. Metabolism and function of lipids and fatty acids in teleost fish.
Reviews in Fisheries Science. 11. 107-184.
Tocher, D. R., Bell, J. G., McGhee, F, Dick, J. R. and Madrigal, J. F., 2003. Effects of
dietary lipid level and vegetable oil on fatty acid metabolism in Atlantic salmon
(Salmo salar L.) over the whole production cycle. Fish. Physiol. Biochem. 29: 193-
209.
Torstensen, B. E., Froyland, L. and Lie, O., 2004. Replacing dietary of fish oil with
increasing levels of rapeseed oil and olive oil – effects on Atlantic salmon (Salmo
salar L.) tissue and lipoprotein lipid composition and lipogenic enzyme activities.
Aquacult. Nutr. 10: 175-192.
Tripathi, M. K. and Mishra, A. S., 2007. Glucosinolates in animal nutrition: A review.
Anim. Feed. Sci. Tech. 132: 1-27.
Tzeng, Y. M., Diosady, L. L. and Rubin, L. J., 1990. Production of canola protein
materials by alkaline extraction, precipitation, and membrane processing. J. Food.
Sci. 55: 1147-1156.
Uran, P. A., Aydin, R., Schrama, J. W., Verreth, J. A. J. and Rombout, J. H. W. M.,
2008a. Soybean meal-induced uptake block in Atlantic salmon Salmo salar distal
enterocytes. J. Fish. Biol. 73: 2571-2579.
Uran, P. A., Schrama, J. W., Rombout, J. H. W. M., Obach, A., Jensen, L., Koppe, W.
and Verreth, J. A. J., 2008b. Soybean meal-induced enteritis in Atlantic salmon
(Salmo salar L.) at different temperatures. Aquacult. Nutr. 14: 324-330.

98
Uran, P. A., Schrama, J. W., Rombout, J. H. W. M., Taverne-Thiele, J. J., Obach, A.,
Koppe, W. and Verreth, J. A., 2009. Time-related changes of the intestinal
morphology of Atlantic salmon, Salmo salar L., at two different soybean meal
inclusion levels. J. Fish. Biol. 32: 733-744.
Van den Ingh, T. S. G. A. M., Krogdahl, A., Olli, J. J., Hendriks, H. G. C. J. M. and
Koninkx, J. G. J. F., 1991. Effects of soybean-containning diets on the proximal
and distal intestine in Atlantic salmon (Salmo salar): a morphological study.
Aquaculture. 94: 297-305.
Van den Ingh, T. S. G. A. M., Olli, J. J. and Krogdahl, A. 1996. Alcohol-soluble
components in soybeans cause morphological changes in the distal intestine of
Atlantic salmon, Salmo salar L. J. Fish. Biol. 19: 47-53.
Varsamos, S., Nebel, C. and CharmantieR, G., 2005. Ontogeny of osmoregulation in
postembryonic fish: A review. Comp. Biochem. Phys. A. 141: 401-429.
Vaughn, S. and Berhow, M. A., 2005. Glucosinolate hydrolysis products from various
plant sources: pH effects, isolation, and purification. Ind. Crop. Prod..21: 193-202.
Vogtmann, H., Clandinin, D. R. and Hardin, R. T., 1974. The influence of high and low
erucic acid rapeseed oils on the productive performance of laying hens and on the
lipid fraction of egg yolk. Can. J. Anim. Sci. 54: 403-410.
Wanasundara, P. K. J. P. D. and Shahidi, F., 1997. Removal of flaxseed mucilage by
chemical and enzymatic treatments. Food. Chem, 59: 47-55.
Wilson, J. M. and Castro, L. F. C., 2010. Morphological diversity of the gastrointestinal
tract in fishes. Fish physiology (pp. 1-55) Academic Press. DOI: http: // dx.doi.org
/10.1016 /S1 546-5098(10)03001-3.
Zubr, J., 1997. Oil-seed crop: Camelina sativa. Ind. Crop. Prod. 6: 113-119.
Zubr, J. and Matthaus, B., 2002. Effects of growth conditions on fatty acids and
tocopherols in Camelina sativa oil. Ind. Crop. Prod. 15: 155-162.
Zubr, J., 2003a. Qualitative variation of Camelina sativa seed from different locations.
Ind. Crop. Prod. 17: 161-169.
Zubr, J., 2003b. Dietary fatty acids and amino acids of Camelina sativa seed. J. Food
Quality. 26: 451-462.
99
Zubr, J., 2010. Carbohydrates, vitamins and minerals of Camelina sativa seed. Nutr.
Food. Sci. 40: 523-531.

100
Appendix A. The Composition of Solvent Extracted Camelina Meal (SECM)
SECM (Calena cultivar)
Typical analysis (% as fed basis)
Crude lipid 3.0 ADF 25.4
Crude protein 39.0 ANF 39.9
Moisture 7.5
Gross energy
(kcal/kg) 4320
Amino acids % protein % As-is
ASP 8.21 3.2
THR 4.12 1.61
SER 4.83 1.89
GLU 16.93 6.60
PRO 5.32 2.08
GLY 4.92 1.92
ALA 4.26 1.66
CYS 2.08 0.81
VAL 4.45 1.73
MET 1.60 0.62
ILE 3.11 1.21
LEU 6.21 2.42
TYR 2.48 0.97
PHE 3.88 1.52
HIS 2.88 1.12
LYS 4.55 1.78
ARG 8.37 3.27
TRP 0.96 0.37
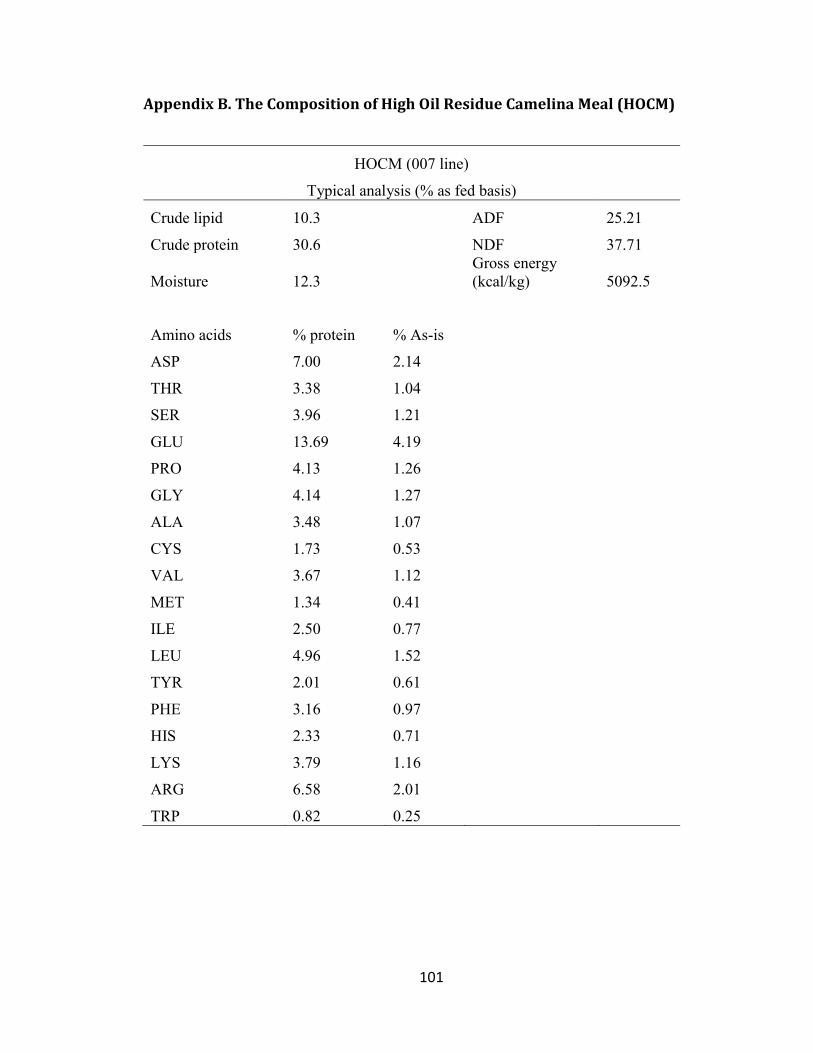
101
Appendix B. The Composition of High Oil Residue Camelina Meal (HOCM)
HOCM (007 line)
Typical analysis (% as fed basis)
Crude lipid 10.3 ADF 25.21
Crude protein 30.6 NDF 37.71
Moisture 12.3
Gross energy
(kcal/kg) 5092.5
Amino acids % protein % As-is
ASP 7.00 2.14
THR 3.38 1.04
SER 3.96 1.21
GLU 13.69 4.19
PRO 4.13 1.26
GLY 4.14 1.27
ALA 3.48 1.07
CYS 1.73 0.53
VAL 3.67 1.12
MET 1.34 0.41
ILE 2.50 0.77
LEU 4.96 1.52
TYR 2.01 0.61
PHE 3.16 0.97
HIS 2.33 0.71
LYS 3.79 1.16
ARG 6.58 2.01
TRP 0.82 0.25

102
Appendix C. The Scores of Mucosal Fold (MF) in Semi-quantitative Scoring System
1
Normal MF
2
Some shrinkage and bloating
3
On set of MF disruption
4
MF disruption
5
Total disruption
Bar is 0.2 mm
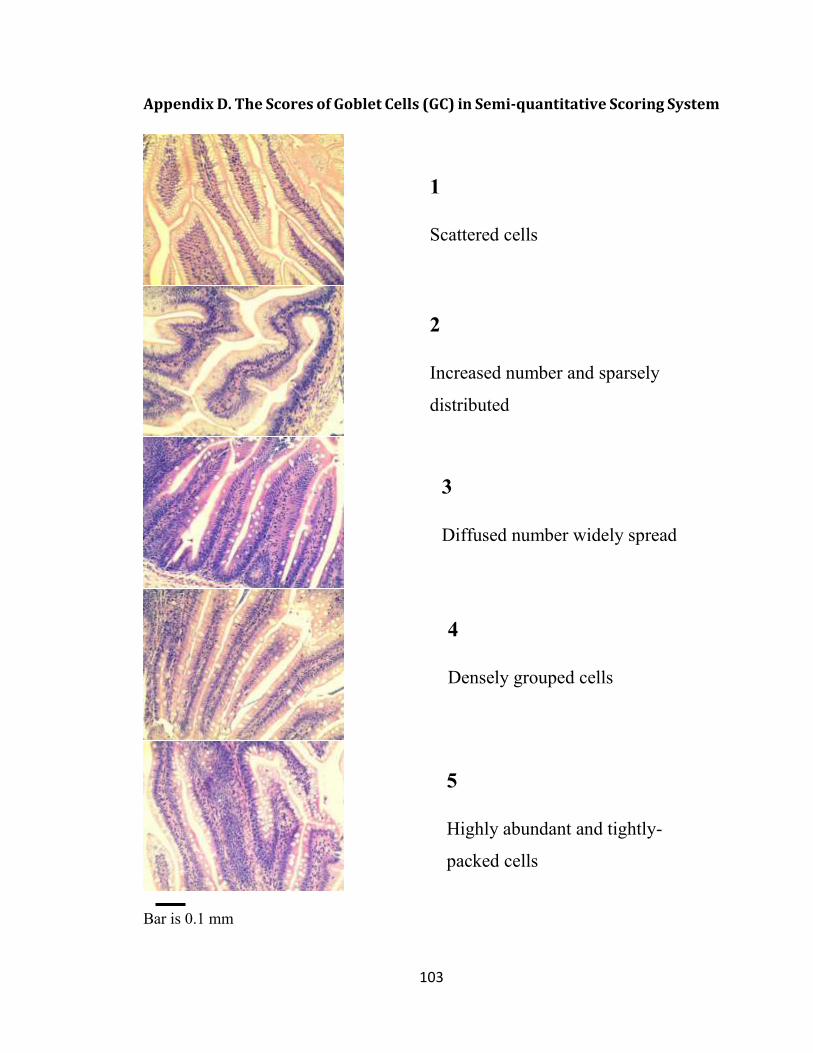
103
Appendix D. The Scores of Goblet Cells (GC) in Semi-quantitative Scoring System
Bar is 0.1 mm
1
Normal mucosal fold
1
Scattered cells
3
Diffused number widely spread
2
Increased number and sparsely
distributed
5
Highly abundant and tightly-
packed cells
4
Densely grouped cells

104
Appendix E. The Scores of Supranuclear Vacuoles (SNV) in Semi-quantitative Scoring System
Bar is 0.05 mm
1
Normal SNV
3
Diffused size reduction
2
Some size reduction
4
Onset of extinction
5
No SNV

105
Appendix F. The Scores of Lamina Propria (LP) in Semi-quantitative Scoring System
Bar is 0.05 mm
1
Normal LP
3
Medium size
2
Increased size
4
Large LP
5
Largest LP
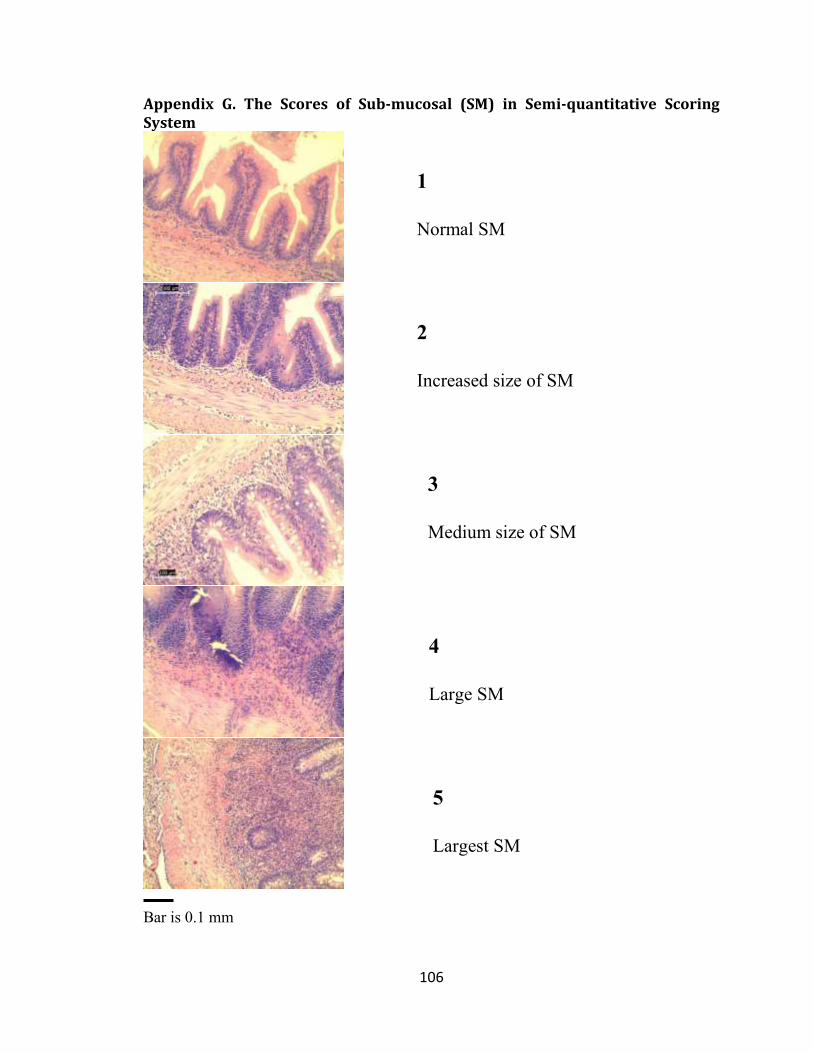
106
Appendix G. The Scores of Sub-mucosal (SM) in Semi-quantitative Scoring System
Bar is 0.1 mm
1
Normal SM
3
Medium size of SM
2
Increased size of SM
4
Large SM
5
Largest SM
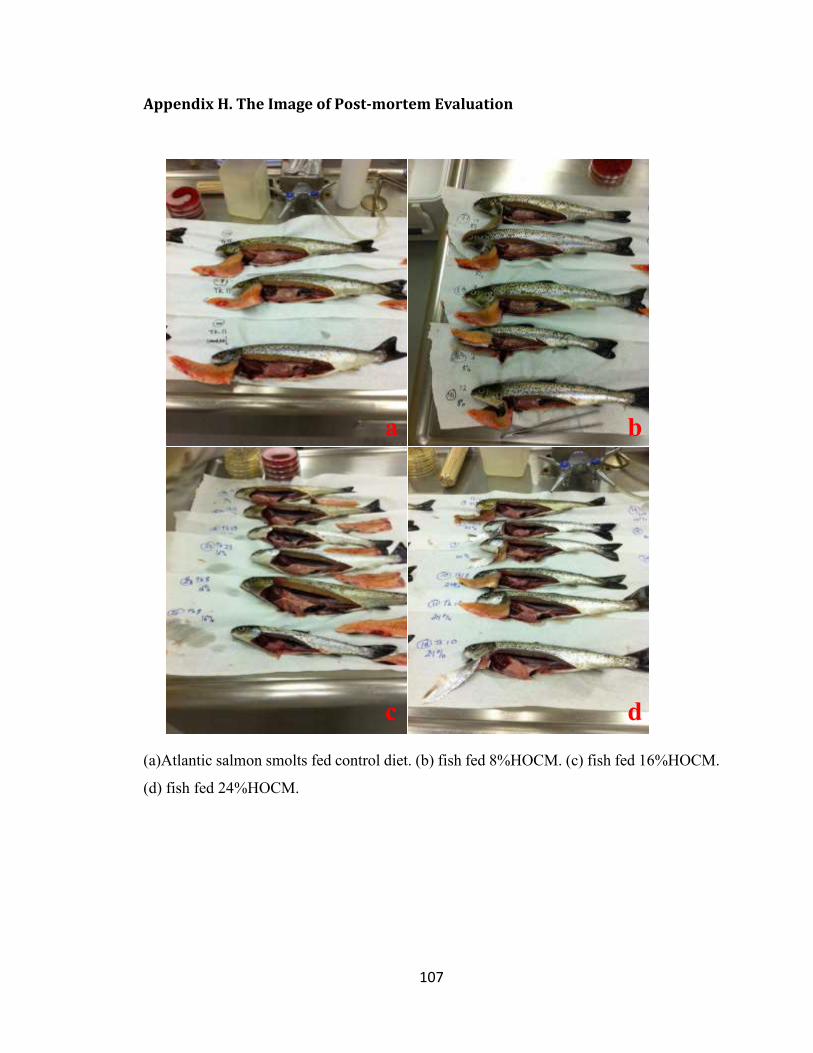
107
Appendix H. The Image of Post-mortem Evaluation
(a)Atlantic salmon smolts fed control diet. (b) fish fed 8%HOCM. (c) fish fed 16%HOCM.
(d) fish fed 24%HOCM.
a b
c d


![Mixed cropping systems in organic farming Improving green ... fileMixed cropping systems in organic farming 0 10 20 30 Pisum sativum Camelina sativa Mischfrucht-anbau [dt ha-1] a b](https://img.pdfslide.us/doc/110x75/5cc8797f88c993d63c8d38fe/mixed-cropping-systems-in-organic-farming-improving-green-cropping-systems-in.jpg)