Embed Size (px)
Citation preview
Evaluation of Blue Confirmation Lights on Red Light Running at Signalized Intersections in
Lawrence, Kansas: A Case Study
By
©2014
Kwaku Frimpong Boakye
Submitted to the graduate degree program in Civil, Environmental and Architectural Engineering
and the Graduate Faculty of the University of Kansas in partial fulfillment of the requirement
for the degree of Master of Science.
Chairperson: Dr. Steven D. Schrock
Dr. Eric J. Fitzsimmons
Dr. Thomas E. Mulinazzi
Dr. Daniel Tran
Date Defended: July 11, 2014
ii
The Thesis Committee for Kwaku Frimpong Boakye
certifies that this is the approved version of the following thesis:
Evaluation of Blue Confirmation Lights on Red Light Running at Signalized Intersections in
Lawrence, Kansas: A Case Study
Chairperson: Dr. Steven D. Schrock
Date approved: July 22, 2014
iii
DEDICATION
This thesis is dedicated to my parents, Kwaku Adu Frimpong and Juliana Kumi Darkowaa.
I could not have made it this far without you. God bless you.
iv
TABLE OF CONTENTS
LIST OF FIGURES ........................................................................................................................ x
LIST OF TABLES ....................................................................................................................... xiv
ABSTRACT ................................................................................................................................. xvi
ACKNOWLEDGEMENTS ....................................................................................................... xviii
CHAPTER 1: INTRODUCTION ................................................................................................... 1
1.1 Background .......................................................................................................................... 1
1.2 Research Objective ............................................................................................................... 3
1.3 Thesis Organization .............................................................................................................. 3
CHAPTER 2: LITERATURE REVIEW ........................................................................................ 5
2.1 Red Light Running ............................................................................................................... 5
2.2 Frequency of Red Light Running ......................................................................................... 6
2.3 Characteristics of Red Light Runners .................................................................................. 7
2.4 Factors Contributing to Red Light Running ......................................................................... 8
2.5 Red Light Running Countermeasures ................................................................................ 10
2.6 Engineering Countermeasures ............................................................................................ 11
2.6.1 Signal Operation ........................................................................................................... 12
2.6.1.1 Yellow Change Interval .......................................................................................... 12
2.6.1.2 All-Red Clearance Interval ..................................................................................... 14
2.6.1.3 Green Extension ..................................................................................................... 15
v
2.6.1.4 Signal Operation and Coordination ........................................................................ 15
2.6.2 Motorist Information .................................................................................................... 16
2.6.2.1 Improve Signal Visibility ....................................................................................... 16
2.6.2.2 Improve Signal Conspicuity ................................................................................... 17
2.6.2.3 Advance Warning Signs ......................................................................................... 20
2.6.3 Physical Improvements ................................................................................................ 23
2.7 Enforcement Countermeasures. .......................................................................................... 24
2.7.1 Automated Enforcement ............................................................................................... 24
2.7.2 Targeted Enforcement .................................................................................................. 25
2.7.3 Confirmation Lights ..................................................................................................... 25
2.8 Public Education ................................................................................................................. 28
2.9 Literature Review Summary .............................................................................................. 28
CHAPTER 3: PROBLEM STATEMENT.................................................................................... 29
CHAPTER 4: RESEARCH APPROACH .................................................................................... 31
4.1 Measure of Safety ............................................................................................................... 31
4.2 Site Selection ...................................................................................................................... 32
4.3 Site Category ...................................................................................................................... 33
4.3.1 Treatment Sites ............................................................................................................. 33
4.3.2 Spillover Sites ............................................................................................................... 33
4.3.3 Control Sites ................................................................................................................. 35
vi
4.4 Site Description .................................................................................................................. 36
4.4.1 Treatment Sites ............................................................................................................. 37
4.4.1.1 23rd
Street & Iowa Street ........................................................................................ 37
4.4.1.2 23rd
Street & Louisiana Street ................................................................................ 39
4.4.2 Spillover Sites ............................................................................................................... 41
4.4.2.1 19th
Street & Louisiana Street ................................................................................ 41
4.4.2.2 23rd
Street & Alabama Street .................................................................................. 44
4.4.2.3 23rd
Street and Ousdahl Road ................................................................................. 46
4.4.2.4 Clinton Parkway & Crestline Drive ....................................................................... 48
4.4.2.5 19th
Street & Iowa Street ........................................................................................ 50
4.4.2.6 25th
Street & Iowa Street ........................................................................................ 52
4.4.3 Control Sites ................................................................................................................. 54
4.4.3.1 6th
Street & Kasold Drive ....................................................................................... 54
4.4.3.2 6th
Street & Wakarusa Drive .................................................................................. 57
4.4.3.3 6th
Street and Michigan Street. ............................................................................... 59
4.4.3.4 31st Street & Iowa Street ........................................................................................ 61
4.4.3.5 Clinton Parkway & Kasold Drive .......................................................................... 63
4.5 Field Data Collection .......................................................................................................... 65
4.6 Data Reduction ................................................................................................................... 70
4.7 Data Collection and Reduction Limitations ....................................................................... 72
vii
4.8 Installation of Confirmation Lights .................................................................................... 74
4.9 Public Awareness of the Confirmation Lights ................................................................... 75
CHAPTER 5: RESULTS .............................................................................................................. 78
5.1. RLR Violation Rates by Intersection Lane ....................................................................... 78
5.1.1 Background .................................................................................................................. 78
5.1.2 Methodology ................................................................................................................ 78
5.1.3 Results .......................................................................................................................... 79
5.1.3.1 Left-turn RLR Violation Rates ............................................................................... 79
5.1.3.2 Through-movement RLR Violation Rates ............................................................. 81
5.1.3.3 Right-turn Violation Rates ..................................................................................... 83
5.2. Violation by Time of the Day ............................................................................................ 85
5.2.1 Background .................................................................................................................. 85
5.2.2 Results .......................................................................................................................... 86
5.2.2.1 Morning Peak RLR Violation ................................................................................ 86
5.2.3.2 Evening Peak RLR Violation ................................................................................. 87
5.3. Time into Red Analysis ..................................................................................................... 87
5.3.1 Background .................................................................................................................. 87
5.3.2 Methodology ................................................................................................................ 88
5.3.3 Results .......................................................................................................................... 89
5.3.3.1 Left-turning Movement .......................................................................................... 89
viii
5.3.3.2 Through Movement ................................................................................................ 92
5.4. Violation Configurations and Vehicle Types .................................................................... 94
5.4.1 Background .................................................................................................................. 94
5.4.2 Methodology ................................................................................................................ 95
5.4.3 Results .......................................................................................................................... 95
5.4.3.1 Violation Configurations ........................................................................................ 95
5.4.3.2 Violation by Vehicle Type ..................................................................................... 97
CHAPTER 6: STATISTICAL ANALYSIS OF RLR VIOLATIONS ......................................... 99
6.1 Comparison of RLR Violation Rates after Installation of Confirmation Lights. ............... 99
6.2 Methodology ...................................................................................................................... 99
6.3 Results of RLR Violations ............................................................................................... 101
6.3.1 Analysis of Left-turning Movement Red Light Running Violations ......................... 101
6.3.2 Analysis of Through-movement RLR Violations ...................................................... 104
6.4 Before-After Effect on Violation Time into Red ............................................................. 107
6.5 Methodology .................................................................................................................... 107
6.6. Results ............................................................................................................................. 109
6.6.1 Chi Square Test for Before and 1 Month After Study ............................................... 109
6.6.2 Chi Square Test for Before and 3 Months After Study .............................................. 110
CHAPTER 7: CONCLUSIONS AND RECOMMENDATIONS .............................................. 112
7.1 Summary of Findings ....................................................................................................... 113
ix
7.1.1 General Conclusions ................................................................................................... 113
7.1.2 Left-turn and Through-movement RLR Violations ................................................... 114
7.1.3 Left-turn and Through-movement RLR Violations Time into Red ........................... 115
7.2 Contributions to Highway Safety ..................................................................................... 116
7.3 Future Research ................................................................................................................ 116
REFERENCES ........................................................................................................................... 117
APPENDIX A ............................................................................................................................. 124
Characteristics and Aerial Views of Intersections ...................................................................... 124
APPENDIX B ............................................................................................................................. 136
Reduced RLR Violation Data for Before and After Studies....................................................... 136
APPENDIX C ............................................................................................................................. 185
Press Releases ............................................................................................................................. 185
x
LIST OF FIGURES
Figure 1. Varieties of confirmation lights ....................................................................................... 3
Figure 2. Retroreflective backplate border (FDOT, 2014) ........................................................... 17
Figure 3. Redundant red light signal configurations (MUTCD 2009).......................................... 18
Figure 4. Lighted stop bar system (active) in Houston, Texas (Tydlacka et al., 2011) ................ 19
Figure 5. LED backplate (Active) in Houston, Texas (Tydlacka et al., 2011) ............................. 19
Figure 6. Signal Ahead sign, W3-3 (MUTCD 2009) .................................................................... 20
Figure 7. Be prepared to stop sign, W3-4 (MUTCD 2009) .......................................................... 21
Figure 8. “Be prepared to stop” sign supplemented with flashing beacons and when flashing
plaque (MUTCD 2009) ................................................................................................................. 21
Figure 9. Design features and layout of AWEGS (Messer et al., 2004) ....................................... 22
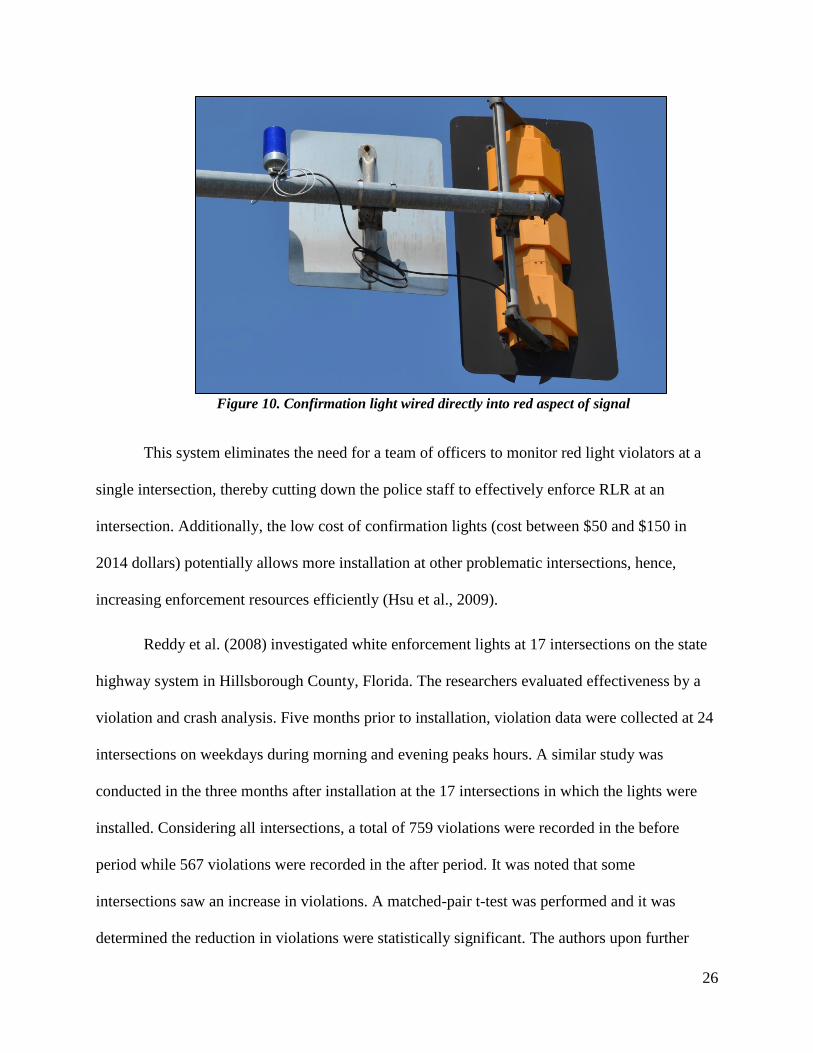
Figure 10. Confirmation light wired directly into red aspect of signal ......................................... 26
Figure 11. Layout of treatment and spillover intersections in Lawrence, KS
(Google maps, 2013) ..................................................................................................................... 34
Figure 12. Layout of the control and treatment sites in Lawrence, KS (Google maps, 2013). .... 36
Figure 13. Aerial view of 23rd
Street and Iowa Street (Google maps, 2013) ............................... 38
Figure 14. Ground view of the intersection of 23rd
Street and Iowa Street (northbound) ............ 39
Figure 15. Aerial view of the intersection of 23rd
Street and Louisiana Street
(Google maps, 2013) ..................................................................................................................... 40
Figure 16. Ground view of the intersection of 23rd
Street and Louisiana Street (eastbound)....... 41
Figure 17. Aerial view of the intersection of 19th
Street and Louisiana Street
(Google maps, 2013) ..................................................................................................................... 43
Figure 18. Ground view of the intersection of 19th
Street and Louisiana Street (eastbound) ....... 44
xi
Figure 19. Aerial view of the intersection of 23rd
Street and Alabama Street
(Google maps, 2013) ..................................................................................................................... 45
Figure 20. Ground view of the intersection of 23rd
Street and Alabama Street (westbound) ....... 46
Figure 21. Aerial view of the intersection of 23rd
Street and Ousdahl Road
(Google maps, 2013) ..................................................................................................................... 47
Figure 22. Ground view of the intersection of 23rd
Street and Ousdahl Road (eastbound) .......... 48
Figure 23. Aerial view of the intersection of Clinton Parkway and Crestline Drive
(Google maps, 2013) ..................................................................................................................... 49
Figure 24. Ground view of the intersection of Clinton Parkway and Crestline Drive
(westbound)................................................................................................................................... 50
Figure 25. Aerial view of the intersection of 19th
Street and Iowa Street (Google maps, 2013) .. 51
Figure 26. Ground view of the intersection of 19th
Street and Iowa Street (northbound) ............ 52
Figure 27. Aerial view of the intersection of 25th
Street and Iowa Street (Google maps, 2013) .. 53
Figure 28. Ground view of the intersection of 25th
Street & Iowa Street (northbound) ............... 54
Figure 29. Aerial view of the intersection of 6th
Street and Kasold Drive (Google maps, 2013). 56
Figure 30. Ground view of the intersection of 6th
Street and Kasold Drive (eastbound) ............. 57
Figure 31. Aerial view of the intersection of 6th
Street and Wakatrusa Drive
(Google maps, 2013) ..................................................................................................................... 58
Figure 32. Ground view of the intersection of 6th
Street and Wakarusa Drive (eastbound) ......... 59
Figure 33. Aerial view of the intersection of 6th
Street and Michigan Street
(Google maps, 2013) ..................................................................................................................... 60
Figure 34. Ground view of the intersection of 6th
Street and Michigan Street (eastbound) ......... 61
Figure 35. Aerial view of the intersection of 31st Street and Iowa Street (Google maps, 2013) .. 62
xii
Figure 36. Ground view of the intersection of 31st Street and Iowa Street (northbound) ............. 63
Figure 37. Aerial view of the intersection of Clinton Parkway and Kasold Drive
(Google maps, 2013) ..................................................................................................................... 64
Figure 38. Ground view of the intersection of Clinton Parkway and Kasold Drive (westbound) 65
Figure 39. Camera view of an intersection approach ................................................................... 66
Figure 40. Equipment used for field data collection effort ........................................................... 67
Figure 41. Camera positions at intersection .................................................................................. 68
Figure 42. Setting-up of a camera to record RLR violations. ....................................................... 69
Figure 43. RLR violation configurations ...................................................................................... 71
Figure 44. Sample of reduced data in Microsoft Excel sheet ....................................................... 72
Figure 45. Field installation of the confirmation light .................................................................. 75
Figure 46. Daytime operation at 23rd
Street and Louisiana Street ................................................ 76
Figure 47. Nighttime operation at 23rd
Street and Louisiana Street ............................................. 76
Figure 48. Project investigator meeting with the media at one of the treatment intersections ..... 77
Figure 49. Left-turn RLR violations rates per study intersection for before-after study
(Morning). ..................................................................................................................................... 80
Figure 50. Left-turn RLR violations rates per study intersection for before-after study
(Evening)....................................................................................................................................... 81
Figure 51.Through-movement RLR violation rates per study intersection for before-after study
(Morning). ..................................................................................................................................... 82
Figure 52. Through-movement RLR violation rates per study intersection for before-after study
(Evening)....................................................................................................................................... 83
xiii
Figure 53. Right-turn RLR violation rate per study intersection for before-after study
(Morning). ..................................................................................................................................... 84
Figure 54. Right turn RLR violation rate per study intersection for before-after study
(Evening)....................................................................................................................................... 85
Figure 55. Distribution of RLR violation by time of the day during the morning peak ............... 86
Figure 56. Distribution of RLR violation by time of the day during the evening peak ................ 87
Figure 57. Left-turning movement time into red at treatment intersections ................................. 89
Figure 58. Left-turning movement time into red at spillover intersections .................................. 90
Figure 59. Left-turning movement time into red at control intersections ..................................... 90
Figure 60. Through-movement time into red at treatment intersections ...................................... 92
Figure 61. Through-movement time into red at spillover intersections........................................ 93
Figure 62. Through-movement time into red at control intersections .......................................... 93
xiv
LIST OF TABLES
Table 1. Intersection, Traffic and Environmental Factors to RLR (Yang and Najm, 2006) .......... 9
Table 2. Possible Causes and Appropriate Countermeasures for RLR (Hallmark et al., 2012) ... 11
Table 3. Engineering Countermeasures to Red Light Running .................................................... 12
Table 4. Characteristics of the Intersection of 23rd
Street and Iowa Street ................................... 37
Table 5. Characteristics of the Intersection of 23rd
Street and Louisiana Street ........................... 40
Table 6. Characteristics of the Intersection of 23rd
Street and Louisiana Street ........................... 42
Table 7. Characteristics of the Intersection of 23rd
Street and Alabama Street ............................ 44
Table 8. Characteristics of the Intersection of 23rd
Street and Ousdahl Road .............................. 46
Table 9. Characteristics of the Intersection of Clinton Parkway and Crestline Drive .................. 49
Table 10. Characteristics of the Intersection of 19th
Street and Iowa Street ................................. 51
Table 11. Characteristics of the Intersection of 25th
Street and Iowa Street ................................. 53
Table 12. Characteristics of the Intersection of 6th
Street and Kasold Drive ................................ 55
Table 13. Characteristics of the Intersection of 6th
Street and Wakarusa Drive ........................... 57
Table 14. Characteristics of the Intersection of 6th
Street and Michigan Street ........................... 60
Table 15. Characteristics of the Intersection of 31st Street and Iowa Street ................................. 62
Table 16. Characteristics of the Intersection of Clinton Parkway and Kasold Drive ................... 64
Table 17. RLR Violation Configuration Description ................................................................... 71
Table 18. Violation Configuration ................................................................................................ 96
Table 19. RLR Violation by Vehicle Type ................................................................................... 98
Table 20. Results of the RLR Violation Analysis for Left-turning Movements ........................ 102
Table 21. Results of the RLR Violation Analysis for Through Movements .............................. 105
Table 22. Contingency Table for RLR Violation Frequency at the Treatment Sites. ................ 108
xv
Table 23. Expected Frequencies ................................................................................................. 109
Table 24. Chi Square Test for Before and 1 Month after Study ................................................. 110
Table 25. Chi Square Test for Before and 3 months After Study ............................................... 111
xvi
ABSTRACT
Red light running (RLR) continues to be a safety concern for many communities in the
United States. The Insurance Institute for Highway Safety reported in 2012 that RLR resulted in
683 fatalities and an estimated 133,000 injuries nationwide. Currently, a wide range of
countermeasures from low-cost strategies (e.g. signal timing adjustments, signal backplates,
signage improvements, and targeted enforcement) to high-cost strategies (e.g. automated
enforcement, lighted stop bar systems and intersection geometric improvements) exists to
mitigate RLR violations and their related crashes.
The severity of RLR crashes and high societal cost (about 14 billion dollars annually)
have provided the impetus for increased red light enforcement programs throughout the country.
In the State of Kansas, where automated red light cameras are not authorized, communities rely
on targeted traffic law enforcement. Traditionally, red light enforcement has required a police
officer to be located upstream of an intersection to observe the violation and another officer
located downstream to pullover the offender and issue a ticket. This enforcement approach is
labor intensive. In locations where enforcement resources are limited, having a single police
officer monitor RLR raises intersection safety concerns. Confirmation light systems can aid a
single police officer located downstream of an intersection to monitor RLR violations without
having to travel through an intersection to pullover the offender.
The city of Lawrence installed confirmation lights at six left-turn approaches of two
signalized intersections (treatment sites) where RLR was prevalent. This study was conducted to
evaluate the effectiveness of the confirmation lights. RLR violation data were collected before,
one and three months after installation of the lights at the two treatment sites and 11 non-treated
intersections which included six spillover sites (intersections nearby the treatment sites) and five
xvii
control sites (intersections located far from the treatment sites or corridor under investigation). A
Z test of proportion was used to determine if the changes in RLR violation rates from the before
period to the after periods were statistically significant at the 95 percent level of confidence. The
violation rates at the two treated sites were then compared to non-treated sites. Violation time
into red (how long it took a driver to run a red light after red signal indication) was used as a
secondary performance matrix to evaluate the confirmation lights. A Chi Square Test of
Independence was used to analyze the violation times into red at the 95 percent level of
confidence.
Results of the analysis showed a 57.4 percent reduction in left-turn RLR violation rates at
the treatment sites and a 55.7 percent reduction at the spillover sites one month after installation
of the confirmation lights. The three months after study indicated a 42.7 percent decrease in
violation rates at the treatment sites and a 31.7 percent decrease at spillover sites. Considering
RLR violations in the City of Lawrence as a whole, the control sites showed no significant
change in left-turn RLR violations during the study periods. Although the treatment intersections
did not have confirmation lights installed for the through movement, the lights were effective in
the short term for reducing RLR violations (84.1 percent reduction). The Chi Square Test
showed that that the confirmation lights had no significant effect on the RLR violation times into
red.
In conclusion, the findings of this research study indicated that confirmation lights (both
self-enforcing and aiding police officers) have a positive effect in reducing RLR violations at
targeted signalized intersections.
xviii
ACKNOWLEDGEMENTS
This thesis would not have been possible without the assistance from a number of
sources. First, I would like to thank my program of study committee members: Dr. Steven D.
Schrock (Associate Professor, Chairman), Dr. Thomas E. Mulinazzi (Professor), Dr. Daniel Tran
(Assistant Professor), and Dr. Eric J. Fitzsimmons (Post-Doctoral Researcher) for their support,
guidance and advice to complete this project.
I would also like to thank the following students for their commitments in assisting me
collect and reduce field video data. These include: Eric Kocher, Huan Cheng, Ibraheem
AlJulaijel, Lauren Marcucci, Mazharali Udaipurwala, Prathmesh Argade, Shivraj Patil, Tamara
Jerjawi, Tomas Lindheimer, and Vishal Reddy.
I especially want to thank the Mid America Transportation Center for sponsoring this
project. I would also like to thank the Lawrence Police Department and the Lawrence Traffic
Engineering Department for their inputs in providing information, guidance, technical expertise
and their assistance in deploying the blue confirmation lights. Their contributions are really
appreciated.
I would like to thank the University of Kansas (KU) for providing me the learning
environment to pursue my academic dreams. Again, my special thanks goes to KU
Transportation Research Institute for providing me with a graduate research assistantship. This
assistantship relieved me of the financial burdens towards my education.
Finally, I cannot conclude this section without recognizing the love my family, friends
and staff of KU demonstrated towards me while I spent my life here. My social and spiritual life
would not have been complete without you. You all gave me a balanced lifestyle.
1
CHAPTER 1: INTRODUCTION
1.1 Background
Vehicles running red lights is the leading cause of vehicle crashes at urban signalized
intersections (Insurance Institute of Highway Safety (IIHS), 2013). Red light running (RLR) is a
serious traffic safety issue that many communities in the United States are facing. RLR is a
common event or situation where a vehicle proceeds through a signalized intersection when the
red aspect of the signal is shown. In 2012, RLR resulted in 683 fatalities and an estimated
133,000 injuries nationwide (IIHS, 2013). Approximately half of the fatalities reported in 2012
were not the drivers, but were passengers, pedestrians, cyclists and other road users. The
consequences of RLR crashes also have had a negative effect on the U.S. economy. According to
the Federal Highway Administration (FHWA), the annual societal cost of RLR is approximately
14 billion dollars (FHWA, 2005). In 2013, the AAA Foundation for Traffic Safety (2014)
conducted a survey to assess how Americans value and pursue road safety. Results of the study
indicated that 93.1 percent of drivers believed running a red light was unacceptable, yet 35.2
percent of the same drivers polled admitted doing so at least once in the previous month when it
was safe to stop.
Due to the seriousness of RLR, considerable efforts have been taken by states and local
agencies to explore and implement strategies to reduce RLR violations and associated crashes.
Currently, a wide range of countermeasures exists to mitigate RLR violations and crashes. These
include low-cost strategies such as traffic signal timing adjustments, signage improvements,
targeted police enforcement, public awareness campaigns, and high-cost strategies, such as
improvements to the physical geometric and operational characteristics of intersection
approaches, and automated enforcement. These countermeasures have been implemented across
2
the country and previous studies have showed their measure of effectiveness (Institute of
Transportation Engineers, 2003; Bonneson et al., 2004; Hallmark et al., 2012).
As of May 2014, 503 communities in the United States have red light camera programs in
place to capture drivers running red lights (IIHS, 2014). However, automated red light cameras
are sometimes not practical, feasible or legal in some communities. The high cost of installation,
state statutes and the controversies surrounding their implementations have hindered their usage
nationwide. In these circumstances, communities without automated enforcement rely on
low-cost countermeasures to reduce RLR crashes at signalized intersections.
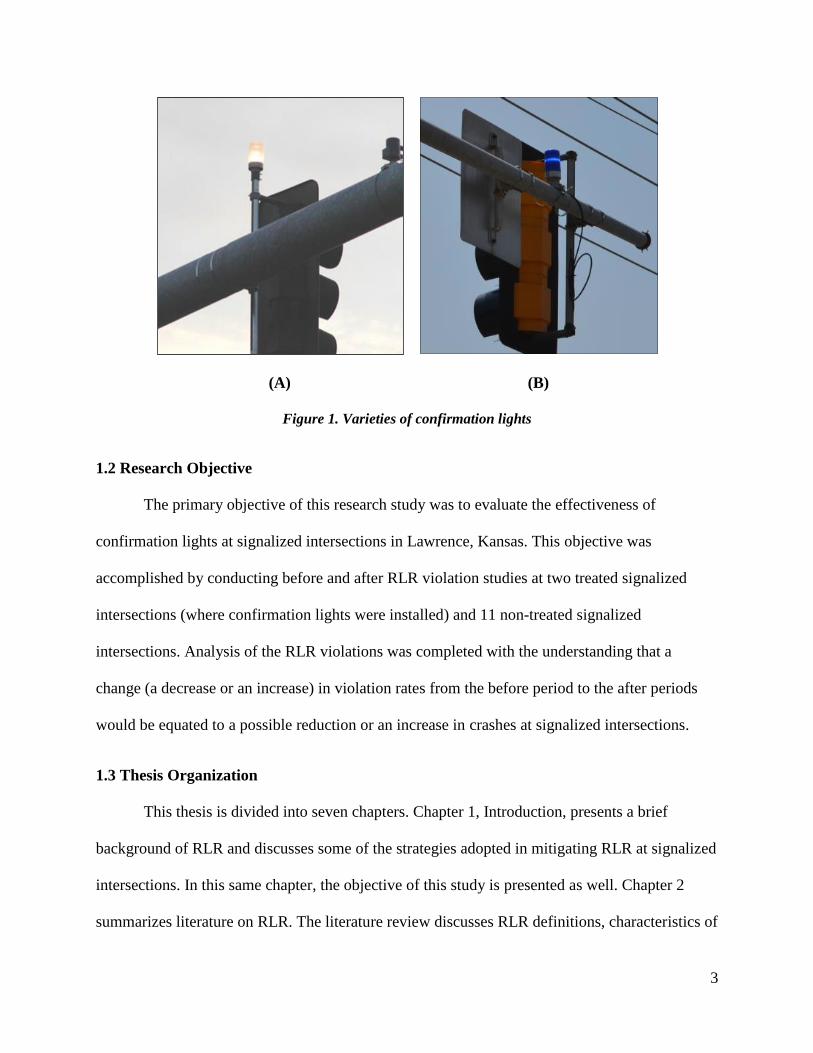
A low-cost RLR countermeasure that has been found to have limited research are
confirmation lights, sometimes referred to as enforcement lights. Confirmation lights come in
variety of colors. For example, Figure 1 (A) shows a white confirmation light in Florida and
Figure 1 (B) shows a blue confirmation light in Kansas. This countermeasure has been deployed
widely in communities located in California, Florida, and Texas (FHWA, 2009).
3
(A)
(B)
Figure 1. Varieties of confirmation lights
1.2 Research Objective
The primary objective of this research study was to evaluate the effectiveness of
confirmation lights at signalized intersections in Lawrence, Kansas. This objective was
accomplished by conducting before and after RLR violation studies at two treated signalized
intersections (where confirmation lights were installed) and 11 non-treated signalized
intersections. Analysis of the RLR violations was completed with the understanding that a
change (a decrease or an increase) in violation rates from the before period to the after periods
would be equated to a possible reduction or an increase in crashes at signalized intersections.
1.3 Thesis Organization
This thesis is divided into seven chapters. Chapter 1, Introduction, presents a brief
background of RLR and discusses some of the strategies adopted in mitigating RLR at signalized
intersections. In this same chapter, the objective of this study is presented as well. Chapter 2
summarizes literature on RLR. The literature review discusses RLR definitions, characteristics of
4
the RLR violators, RLR violation and crash rates, and explains some of the countermeasures that
have been implemented and evaluated by other researchers. Chapter 3 introduces the problem
statement and the need for this research. Chapter 4 outlines the methodology used in gathering
and analyzing field video data from the study intersections. Chapter 5 presents descriptive
statistics of the RLR violation data. Chapter 6 presents the analyses of RLR violation data using
statistical methods and discusses the key findings from this research. Finally, Chapter 7 presents
the general conclusions, contributions of this study to highway safety, and proposes future
studies.
5
CHAPTER 2: LITERATURE REVIEW
This chapter reviews current literature on RLR. It cites information from articles,
technical reports, research journals and other relevant publications pertaining to RLR. The
objectives of this literature review were to:
Define RLR;
Identify characteristics of red light runners;
Determine how frequently drivers run red lights;
Determine factors that contribute to RLR; and
Explore some of the strategies that have been implemented in reducing RLR violations
and associated crashes.
2.1 Red Light Running
RLR is one of the leading causes of vehicle crashes at urban signalized intersections
(IIHS, 2013). The definition of RLR differs from state to state based on whether “permissive
yellow” or “restrictive yellow” laws are in effect.
According to the FHWA (2013), under the “permissive yellow” rule as stated in the
Manual on Uniform Traffic Control Device (MUTCD) and Uniform Vehicle Code (UVC));
“Driver can legally enter intersection during the entire yellow interval and violation occurs if
driver enters intersection after onset of red. Under the “restrictive yellow” rule, driver can neither
enter nor be in intersection on red and violation occurs if driver has not cleared intersection after
onset of red.”
In most states, vehicles that are within the intersection waiting to make a left-turn when
the signal changes from yellow to red are not considered to be running a red light, and are
6
encouraged to clear the intersection. At intersections where a right-turn on red is permitted, a
vehicle must come to a complete stop; failure to do so is also considered a violation
(IIHS, 2013).
2.2 Frequency of Red Light Running
The AAA Foundation for Traffic Safety conducted a national survey in 2013 to assess the
degree to which Americans value and pursue traffic safety. A sample size of 3,103 U.S. residents
aged 16 years and older was asked to complete a web-based survey for this study. It was found
that approximately 93 percent of drivers considered RLR as an aggressive and unacceptable way
of driving. However, 35 percent of the same drivers admitted doing so when it was safe to stop at
least once in the previous month (AAA Foundation for Traffic Safety, 2014).
McCartt and Eichelberge (2011) conducted a study to evaluate the attitudes of motorists
towards red light camera programs in 15 cities in the United States. A sample size of 3,411
drivers participated in the telephone survey study. Results of the study indicated that 82 percent
of the drivers said running a red light was a serious threat to their personal safety, and 93 percent
said it was unacceptable to society.
Hill and Lindly (2003) performed a study to develop models in predicting RLR violation
rates at four-leg intersections based on their traffic operational and geometry characteristics.
They collected RLR violation data at 19 study intersections in four states (Alabama, California,
Iowa, and Texas) for a period of six hours on weekdays (2 p.m. to 8 p.m.). They observed 1,775
violations in 554 hours representing a rate of 3.2 violations per hour per intersection.
Retting et al. (1998) conducted a study to analyze RLR violation data at two busy
intersections equipped with red light cameras in Arlington, Virginia. They collected data
7
between November 1994 and 1995. The study found a total of 8,121 RLR violations over a
period of 2,694 hours, representing an average of 3.0 red light runners per hour (Retting et al.,
1998).
2.3 Characteristics of Red Light Runners
Porter et al. (1999) conducted a telephone survey study to identify red light runners and
their characteristics. Out of the 5,024 respondents who completed the survey, 4,007 were
concentrated in ten target states and 1,017 in the remaining 40 states. Based on national data, the
authors concluded that a driver running a red light was more likely to be:
A younger driver;
A driver without a child or children (less than 20 years old);
Driving alone;
In a rush to school or work in the morning on weekdays;
Unemployed or employed in jobs requiring less education;
Driving more than two miles from home; and
Previously ticketed for RLR.
Retting and Williams (1996) also conducted a similar study to investigate the behavior of
red light runners in Arlington, Virginia. They asked trained observers to collect RLR violation
data at an intersection equipped with red light enforcement cameras. During each cycle length,
the observers recorded the characteristics of the drivers that ran the red lights and the type of
vehicles they were driving. Out of 1,373 observations, the observers recorded 462 RLR
violations at the study location. Findings from their study indicated that red light runners
generally were drivers below 30 years of age, who drove small cars and had multiple convictions
8
for speeding and moving violations. They also found out that violations were common for
drivers with car models manufactured after 1991 and the drivers were less likely to be wearing
seat belts.
Retting et al. (1999c) extracted data from the Fatality Analysis Reporting System (FARS,
1992 to 1996) and the General Estimates System (GES) to review the characteristics of red light
runners. They found that red light runners were more likely to be a male driver under 30 years of
age, more likely to have been ticketed for moving violations and more likely to have been
convicted for driving while intoxicated. The authors also found that the violators were more
likely to run red lights in the nighttime than in the daytime, and 53 percent of such drivers were
believed to have a high blood alcohol concentration.
2.4 Factors Contributing to Red Light Running
In the previous section, it was found that a majority of the RLR violations and crashes
were human related. However, many studies have identified other contributing factors that lead
to the frequency of RLR.
Traffic operation characteristics such as approach volume and speed and intersection
features such as signal timing, approach grade, and sight distance affect drivers’ behavior as they
approach an intersection. Additionally, environmental factors such as time of day and weather
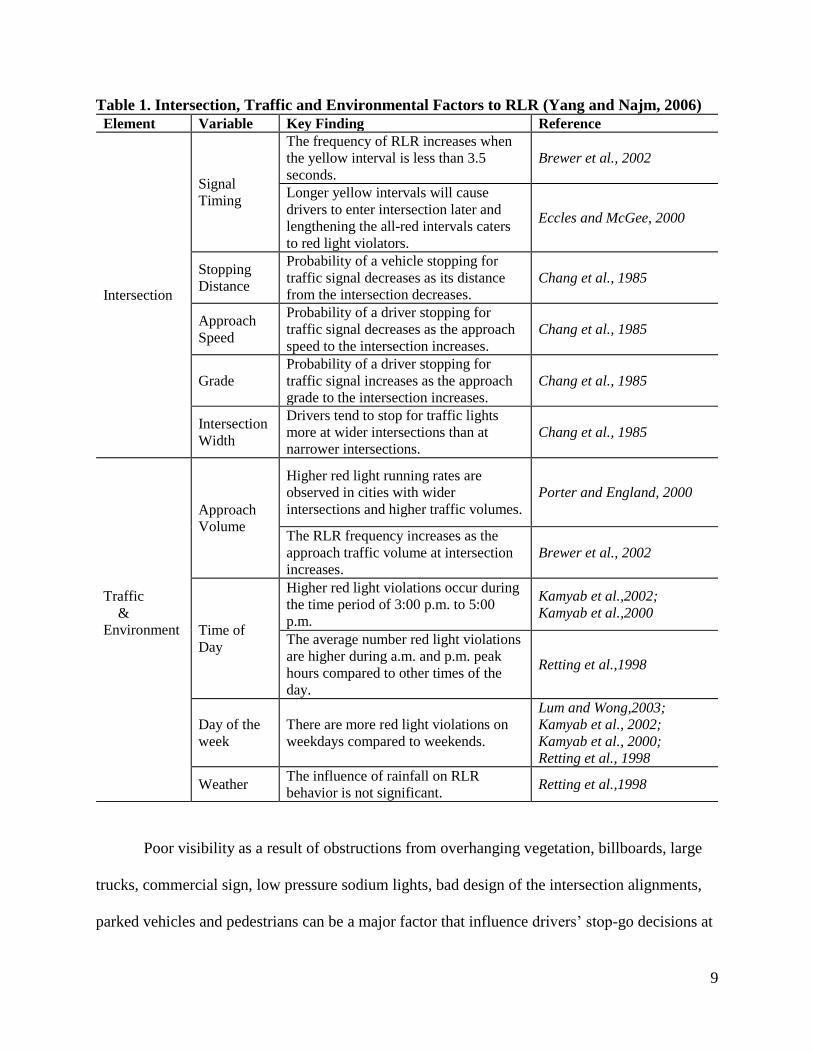
conditions may also influence driving behavior (Yang and Najm, 2006). Table 1 explains how
intersection, traffic and environmental factors contribute to the frequency of RLR.
9
Table 1. Intersection, Traffic and Environmental Factors to RLR (Yang and Najm, 2006)
Element Variable Key Finding Reference
Intersection
Signal
Timing
The frequency of RLR increases when
the yellow interval is less than 3.5
seconds.
Brewer et al., 2002
Longer yellow intervals will cause
drivers to enter intersection later and
lengthening the all-red intervals caters
to red light violators.
Eccles and McGee, 2000
Stopping
Distance
Probability of a vehicle stopping for
traffic signal decreases as its distance
from the intersection decreases.
Chang et al., 1985
Approach
Speed
Probability of a driver stopping for
traffic signal decreases as the approach
speed to the intersection increases.
Chang et al., 1985
Grade
Probability of a driver stopping for
traffic signal increases as the approach
grade to the intersection increases.
Chang et al., 1985
Intersection
Width
Drivers tend to stop for traffic lights
more at wider intersections than at
narrower intersections.
Chang et al., 1985
Traffic
&
Environment
Approach
Volume
Higher red light running rates are
observed in cities with wider
intersections and higher traffic volumes.
Porter and England, 2000
The RLR frequency increases as the
approach traffic volume at intersection
increases.
Brewer et al., 2002
Time of
Day
Higher red light violations occur during
the time period of 3:00 p.m. to 5:00
p.m.
Kamyab et al.,2002;
Kamyab et al.,2000
The average number red light violations
are higher during a.m. and p.m. peak
hours compared to other times of the
day.
Retting et al.,1998
Day of the
week
There are more red light violations on
weekdays compared to weekends.
Lum and Wong,2003;
Kamyab et al., 2002;
Kamyab et al., 2000;
Retting et al., 1998
Weather The influence of rainfall on RLR
behavior is not significant. Retting et al.,1998
Poor visibility as a result of obstructions from overhanging vegetation, billboards, large
trucks, commercial sign, low pressure sodium lights, bad design of the intersection alignments,
parked vehicles and pedestrians can be a major factor that influence drivers’ stop-go decisions at
10
intersections. Clearing these obstacles enhance safety and traffic operations at intersections
(FHWA, 2005).
2.5 Red Light Running Countermeasures
Successful RLR countermeasures including engineering, education and enforcement, and
have been implemented in many communities across the United States. Studies have been
conducted to investigate the effectiveness of these countermeasures and sometimes results
showed a positive effect in reducing RLR violations and associated crashes. Prior to
implementation of any of the countermeasures, studies investigating possible causes of red light
running should be carried out and then appropriate countermeasures be selected to mitigate the
problem (Bonneson et al., 2004).
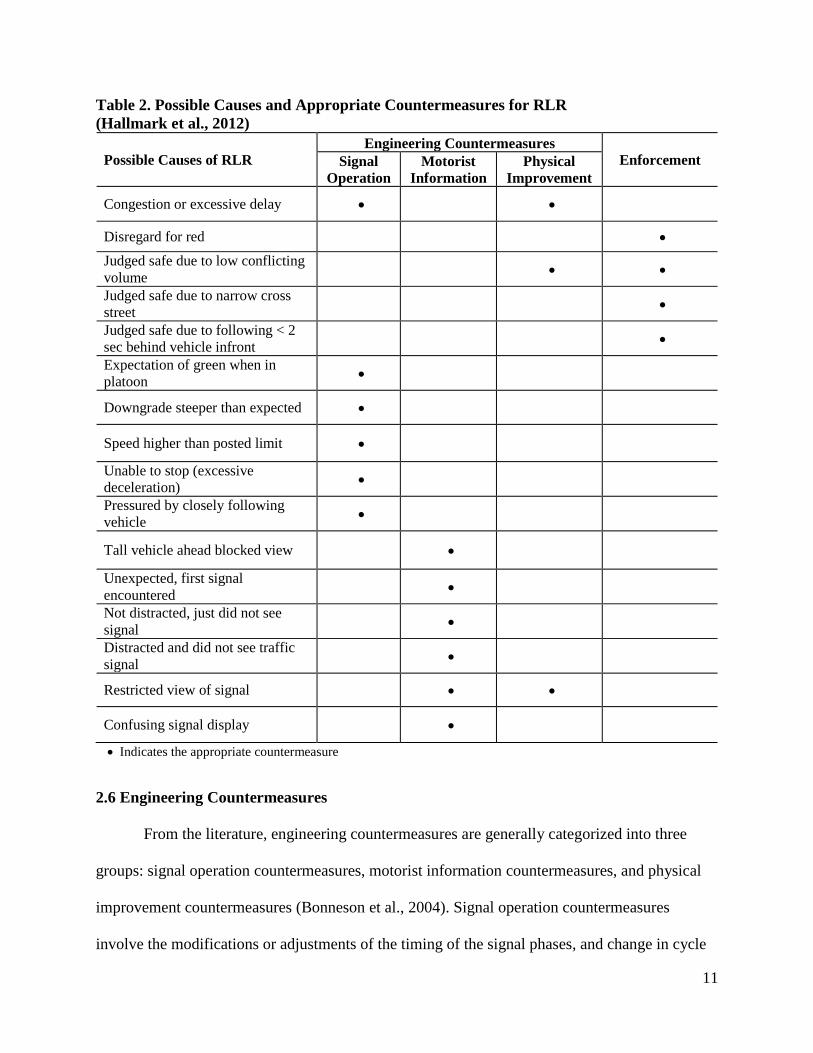
Table 2 shows the possible causes of RLR and correlates the appropriate countermeasures
that are likely or could address the cause (Hallmark et al., 2012).
11
Table 2. Possible Causes and Appropriate Countermeasures for RLR
(Hallmark et al., 2012)
Possible Causes of RLR
Engineering Countermeasures
Enforcement Signal
Operation
Motorist
Information
Physical
Improvement
Congestion or excessive delay
Disregard for red
Judged safe due to low conflicting
volume
Judged safe due to narrow cross
street
Judged safe due to following < 2
sec behind vehicle infront
Expectation of green when in
platoon
Downgrade steeper than expected
Speed higher than posted limit
Unable to stop (excessive
deceleration)
Pressured by closely following
vehicle
Tall vehicle ahead blocked view
Unexpected, first signal
encountered
Not distracted, just did not see
signal
Distracted and did not see traffic
signal
Restricted view of signal
Confusing signal display
Indicates the appropriate countermeasure
2.6 Engineering Countermeasures
From the literature, engineering countermeasures are generally categorized into three
groups: signal operation countermeasures, motorist information countermeasures, and physical
improvement countermeasures (Bonneson et al., 2004). Signal operation countermeasures
involve the modifications or adjustments of the timing of the signal phases, and change in cycle
12
interval. With motorist information countermeasures, drivers are provided with advance
information about existing traffic signals ahead for drivers to respond appropriately as they
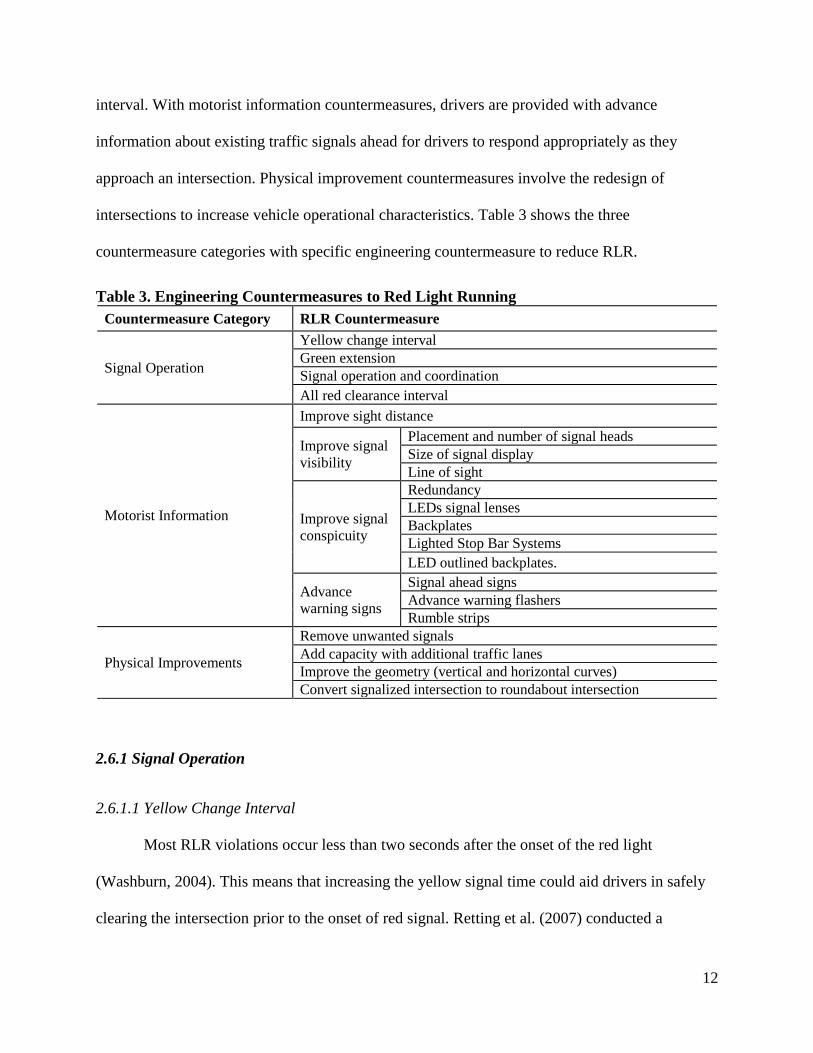
approach an intersection. Physical improvement countermeasures involve the redesign of
intersections to increase vehicle operational characteristics. Table 3 shows the three
countermeasure categories with specific engineering countermeasure to reduce RLR.
Table 3. Engineering Countermeasures to Red Light Running
Countermeasure Category RLR Countermeasure
Signal Operation
Yellow change interval
Green extension
Signal operation and coordination
All red clearance interval
Motorist Information
Improve sight distance
Improve signal
visibility
Placement and number of signal heads
Size of signal display
Line of sight
Improve signal
conspicuity
Redundancy
LEDs signal lenses
Backplates
Lighted Stop Bar Systems
LED outlined backplates.
Advance
warning signs
Signal ahead signs
Advance warning flashers
Rumble strips
Physical Improvements
Remove unwanted signals
Add capacity with additional traffic lanes
Improve the geometry (vertical and horizontal curves)
Convert signalized intersection to roundabout intersection
2.6.1 Signal Operation
2.6.1.1 Yellow Change Interval
Most RLR violations occur less than two seconds after the onset of the red light
(Washburn, 2004). This means that increasing the yellow signal time could aid drivers in safely
clearing the intersection prior to the onset of red signal. Retting et al. (2007) conducted a
13
before-after comparison study to determine the effects of lengthening the yellow change time
interval at two study intersections in Philadelphia, Pennsylvania. The yellow time was increased
by one second, followed by red light camera enforcement several months later. They conducted
similar study at comparison intersections without any treatment. Results of their study showed a
36 percent reduction in violations when the yellow change interval was increased by one second.
With the addition of red light enforcement, they observed a further reduction in RLR violations
by 96 percent beyond the implemented yellow time change.
The MUTCD provides guidance with regards to minimum and maximum yellow interval.
It recommends a minimum yellow change interval of three seconds and a maximum of six
seconds. It also suggests that longer intervals should be reserved for use on approaches with
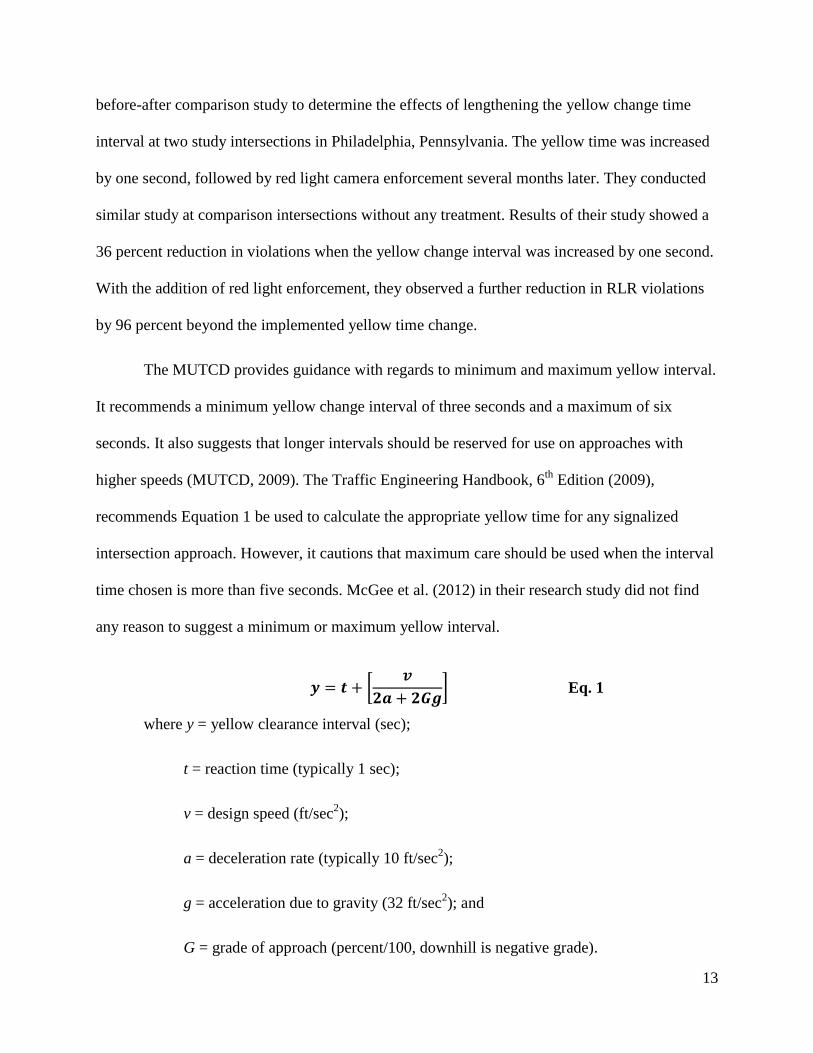
higher speeds (MUTCD, 2009). The Traffic Engineering Handbook, 6th
Edition (2009),
recommends Equation 1 be used to calculate the appropriate yellow time for any signalized
intersection approach. However, it cautions that maximum care should be used when the interval
time chosen is more than five seconds. McGee et al. (2012) in their research study did not find
any reason to suggest a minimum or maximum yellow interval.
[
] Eq. 1
where y = yellow clearance interval (sec);
t = reaction time (typically 1 sec);
v = design speed (ft/sec2);
a = deceleration rate (typically 10 ft/sec2);
g = acceleration due to gravity (32 ft/sec2); and
G = grade of approach (percent/100, downhill is negative grade).
14
2.6.1.2 All-Red Clearance Interval
An all-red phase is defined as when all the approaches at an intersection have a red-signal
display for a very short period of time. If a vehicle enters an intersection without all-red interval
at the end of the yellow phase, it is more likely to result in a crash when vehicles in conflicting
approaches receive a green light (McGee et al., 2003).
Schattler et al. (2003) conducted a study at three signalized intersections in Oakland
County, Michigan. The purpose of the study was to evaluate the impact of all-red clearance
intervals on RLR violations and the late exit of vehicles within the intersections when the red
light was indicated. They used video cameras to collect data before and after the implementation
of the clearance intervals. They found that the implementation of all-red clearance intervals
which ranged from two to three seconds significantly reduced the risk of late exiting of vehicles
being struck by opposing traffic streams that have a green signal.
According to the MUTCD (2009), “Except when clearing a one-lane, two-way facility or
when clearing an exceptionally wide intersection, a red clearance interval should have a duration
not exceeding 6 seconds.” However, in the Traffic Engineering Handbook, 6th
Edition (2009), it
is suggested that equation 2 should be used to calculate the appropriate all-red clearance interval.
McGee et al. (2012) also recommended a minimum of one second time to be used for all-red
clearance intervals. They suggested that providing additional time for vehicles that are legally in
an intersection at the onset of red light allows drivers to clear the intersection in order to avoid
conflict with adjacent traffic stream with a given green light.
Eq. 2
where R = all red interval (sec);
15
w = width of stop line to far side non-conflict point (ft);
v = design speed (ft/sec); and
L = length of vehicle.
2.6.1.3 Green Extension
Green-extension systems (GES) extend the green phase of traffic signals before the
yellow aspect of the signal is shown. This allows a vehicle or platoon of vehicles to clear the
intersection before the yellow indication is shown. With this technology, advance detectors are
deployed on major roads at actuated-signaled intersection approaches to change the signal phase
or increase the green time when a vehicle passes over them. Approaches are cleared of vehicles
that might have been in the dilemma zone until the green phase is maxed-out.
Zegeer and Deen (1978) conducted a study to evaluate how GES could reduce RLR
crashes at three signalized intersections in Kentucky. They used about nine years of before crash
data and about four years of crash data after the installation of the GES at the three study sites.
Results of their study showed 54 percent reduction in total crashes.
2.6.1.4 Signal Operation and Coordination
Two or more adjacent signalized intersections are sometimes coordinated to move
platoons of vehicles along a corridor in order to minimize delays and increase traffic flow. At
isolated locations where signalized intersections are not in coordination, it may result in
excessive delays and impatient drivers may violate a red light when they arrive at an intersection
near the end of the green interval (Bonneson et al., 2002). For this reason, adjacent intersections
should be coordinated so that the likelihood of drivers running a red light is minimized. Changes
16
in signal phasing or cycle length can also reduce delays which potentially may reduce the
frequency of RLR (Bonneson et al., 2002).
2.6.2 Motorist Information
The common reason drivers give for frequently running a red light is that “I did not see
the signal” (McGee et al., 2003). Poor signal visibility and conspicuity, lack of advance warning
signs and inadequate sight distance at signalized intersections influence driving behavior
(Fitzsimmons et al., 2007).
2.6.2.1 Improve Signal Visibility
The positioning of signals either overhead or pole-mounted impacts driving behavior. An
overhead signal display provides a clear meaning, good visibility, and eliminates the blockage of
drivers’ line-of-sight to the signal head when tall vehicles such as trucks are present in the traffic
stream.
Schattler et al. (2011) investigated how different signal mounting configurations affect
RLR at urban signalized intersections in Illinois and Michigan. The researchers focused on three
types of signal mounting configurations: mast arm, diagonal span wire and near-side/far-side
post mount. They collected data at 12 study intersections looking for red light runners and yellow
light runners (YLR) using video cameras. Data collections were for three hours (noon to 3 p.m.)
on weekdays in the spring and summer of 2007. A comparative parallel analysis of their data
showed a significantly fewer RLR and YLR at the intersections with mast arm configurations
than at intersections with span wire configurations. At the near-side/far-side post mounted
signalized intersections, the authors found a higher rate of RLR and YLR. Their study showed
that post-mounted configurations reduced the visibility of signal heads, which may result in an
increase in the frequency of RLR.
17
When considering the location to mount a signal at an intersection, a driver’s line of sight
is a critical factor that should not be overlooked. The closer the signal heads are installed to a
driver’s line of sight, the more visible the signal heads become.
2.6.2.2 Improve Signal Conspicuity
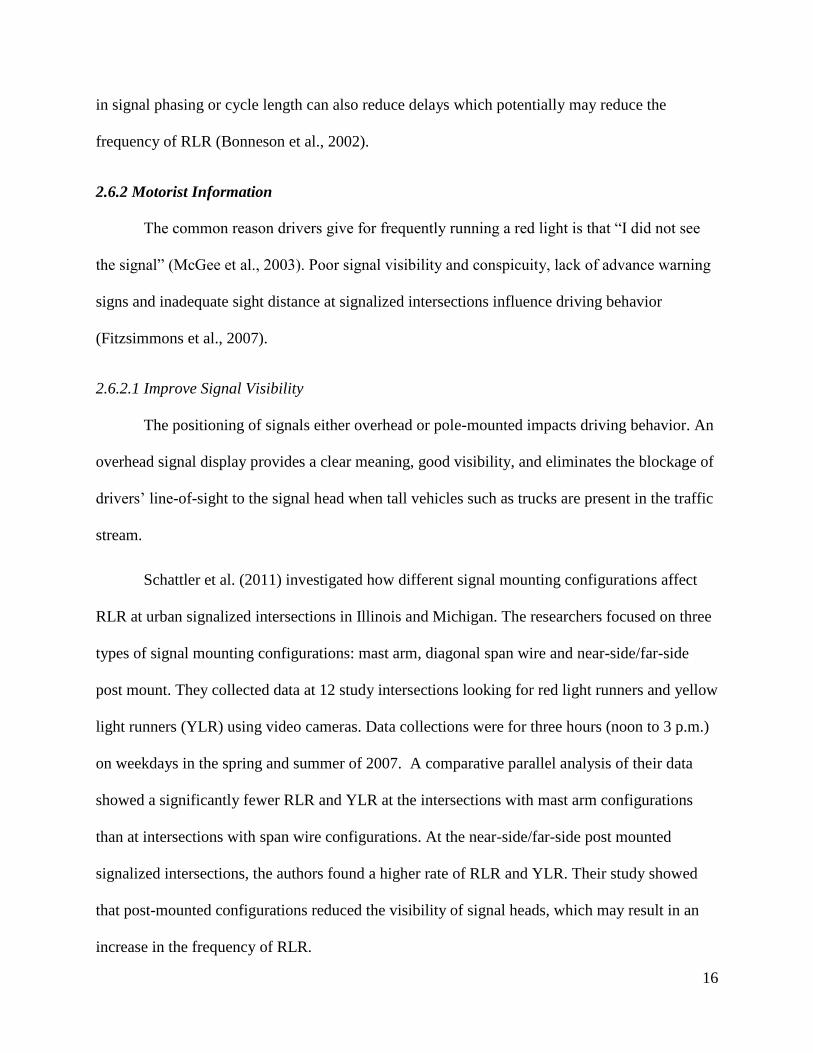
Another technique for making signal heads conspicuous is to use retroreflective materials
on the borders of backplates as shown in Figure 2.
Figure 2. Retroreflective backplate border (FDOT, 2014)
The MUTCD (Section 4D.18) requires the front surface of the backplate to have a dull
black finish “to minimize light reflection and to increase contrast between the signal indication
and its background.” Research has shown that signal head backplates have the effect of reducing
the frequency of crashes at intersections by 32 percent (Bonneson et al., 2002). In 2010, the
FHWA reported a before-after study at three intersections in Columbia, South Carolina, on the
effectiveness of retroreflective borders on the backplates. The study found a 28.6 percent
reduction in total crashes, 36.7 percent reduction in injury crashes and 49.6 percent in
late-night/early-morning crashes. (FHWA, 2010)
18
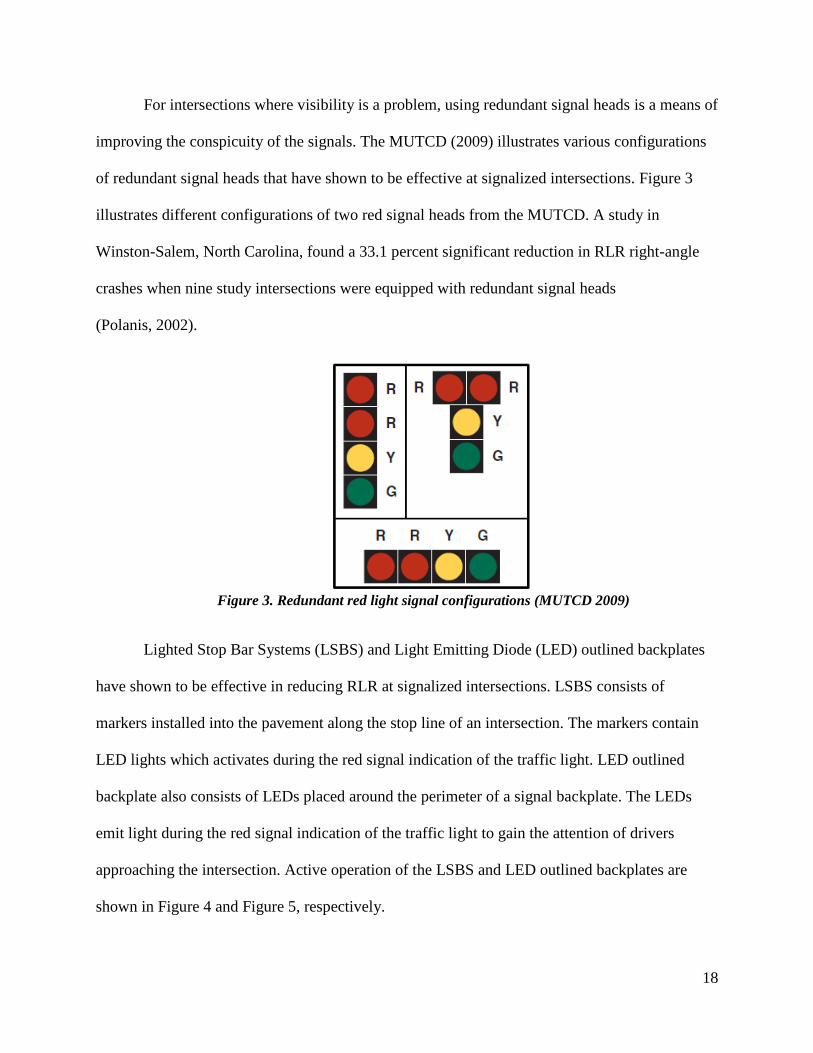
For intersections where visibility is a problem, using redundant signal heads is a means of
improving the conspicuity of the signals. The MUTCD (2009) illustrates various configurations
of redundant signal heads that have shown to be effective at signalized intersections. Figure 3
illustrates different configurations of two red signal heads from the MUTCD. A study in
Winston-Salem, North Carolina, found a 33.1 percent significant reduction in RLR right-angle
crashes when nine study intersections were equipped with redundant signal heads
(Polanis, 2002).
Figure 3. Redundant red light signal configurations (MUTCD 2009)
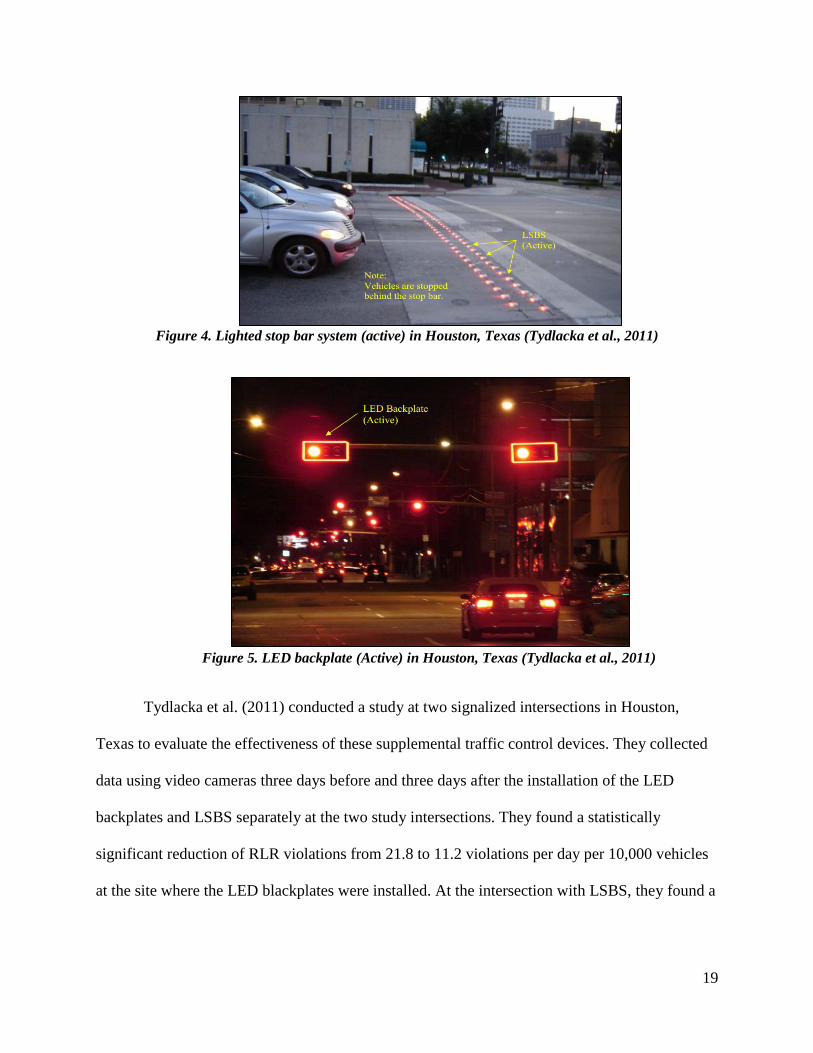
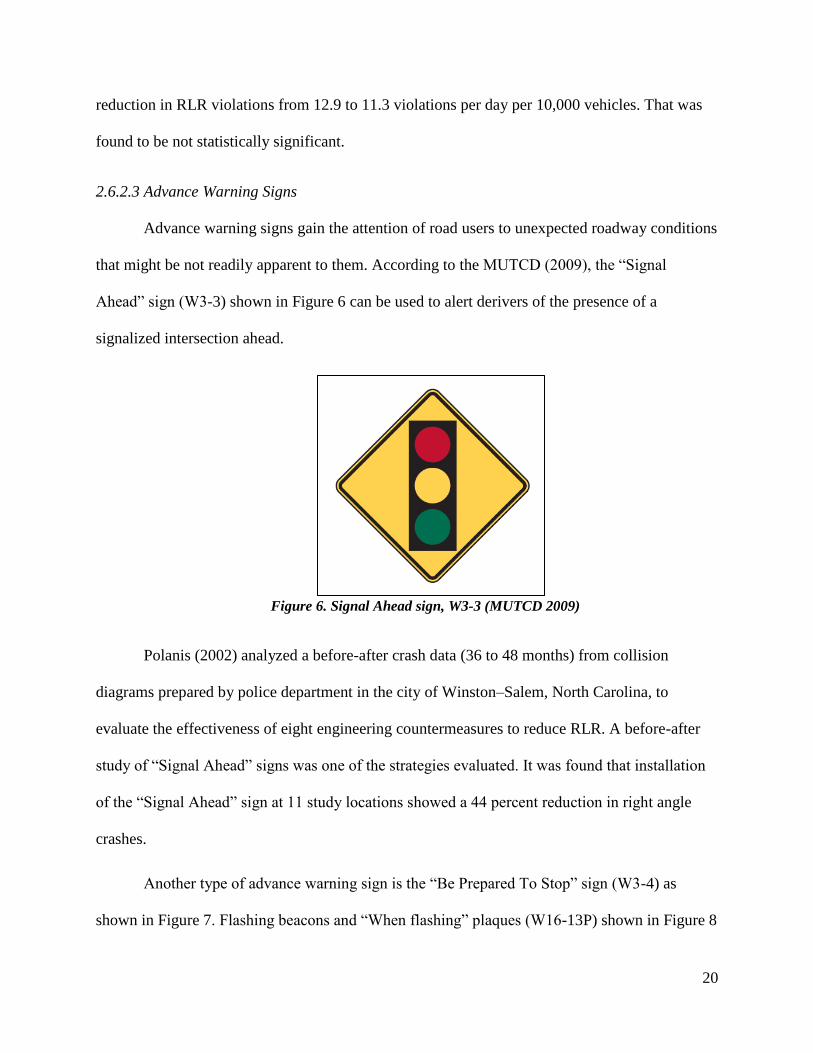
Lighted Stop Bar Systems (LSBS) and Light Emitting Diode (LED) outlined backplates
have shown to be effective in reducing RLR at signalized intersections. LSBS consists of
markers installed into the pavement along the stop line of an intersection. The markers contain
LED lights which activates during the red signal indication of the traffic light. LED outlined
backplate also consists of LEDs placed around the perimeter of a signal backplate. The LEDs
emit light during the red signal indication of the traffic light to gain the attention of drivers
approaching the intersection. Active operation of the LSBS and LED outlined backplates are
shown in Figure 4 and Figure 5, respectively.
19
Figure 4. Lighted stop bar system (active) in Houston, Texas (Tydlacka et al., 2011)
Figure 5. LED backplate (Active) in Houston, Texas (Tydlacka et al., 2011)
Tydlacka et al. (2011) conducted a study at two signalized intersections in Houston,
Texas to evaluate the effectiveness of these supplemental traffic control devices. They collected
data using video cameras three days before and three days after the installation of the LED
backplates and LSBS separately at the two study intersections. They found a statistically
significant reduction of RLR violations from 21.8 to 11.2 violations per day per 10,000 vehicles
at the site where the LED blackplates were installed. At the intersection with LSBS, they found a
20
reduction in RLR violations from 12.9 to 11.3 violations per day per 10,000 vehicles. That was
found to be not statistically significant.
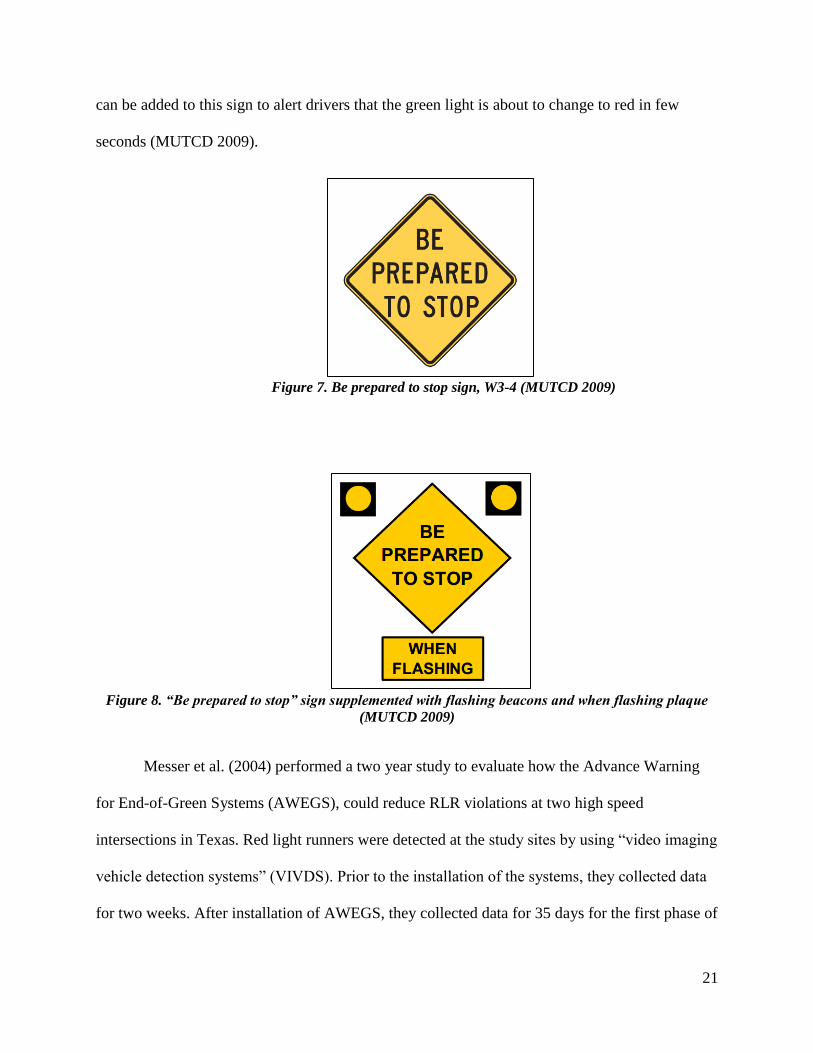
2.6.2.3 Advance Warning Signs
Advance warning signs gain the attention of road users to unexpected roadway conditions
that might be not readily apparent to them. According to the MUTCD (2009), the “Signal
Ahead” sign (W3-3) shown in Figure 6 can be used to alert derivers of the presence of a
signalized intersection ahead.
Figure 6. Signal Ahead sign, W3-3 (MUTCD 2009)
Polanis (2002) analyzed a before-after crash data (36 to 48 months) from collision
diagrams prepared by police department in the city of Winston–Salem, North Carolina, to
evaluate the effectiveness of eight engineering countermeasures to reduce RLR. A before-after
study of “Signal Ahead” signs was one of the strategies evaluated. It was found that installation
of the “Signal Ahead” sign at 11 study locations showed a 44 percent reduction in right angle
crashes.
Another type of advance warning sign is the “Be Prepared To Stop” sign (W3-4) as
shown in Figure 7. Flashing beacons and “When flashing” plaques (W16-13P) shown in Figure 8
21
can be added to this sign to alert drivers that the green light is about to change to red in few
seconds (MUTCD 2009).
Figure 7. Be prepared to stop sign, W3-4 (MUTCD 2009)
Figure 8. “Be prepared to stop” sign supplemented with flashing beacons and when flashing plaque
(MUTCD 2009)
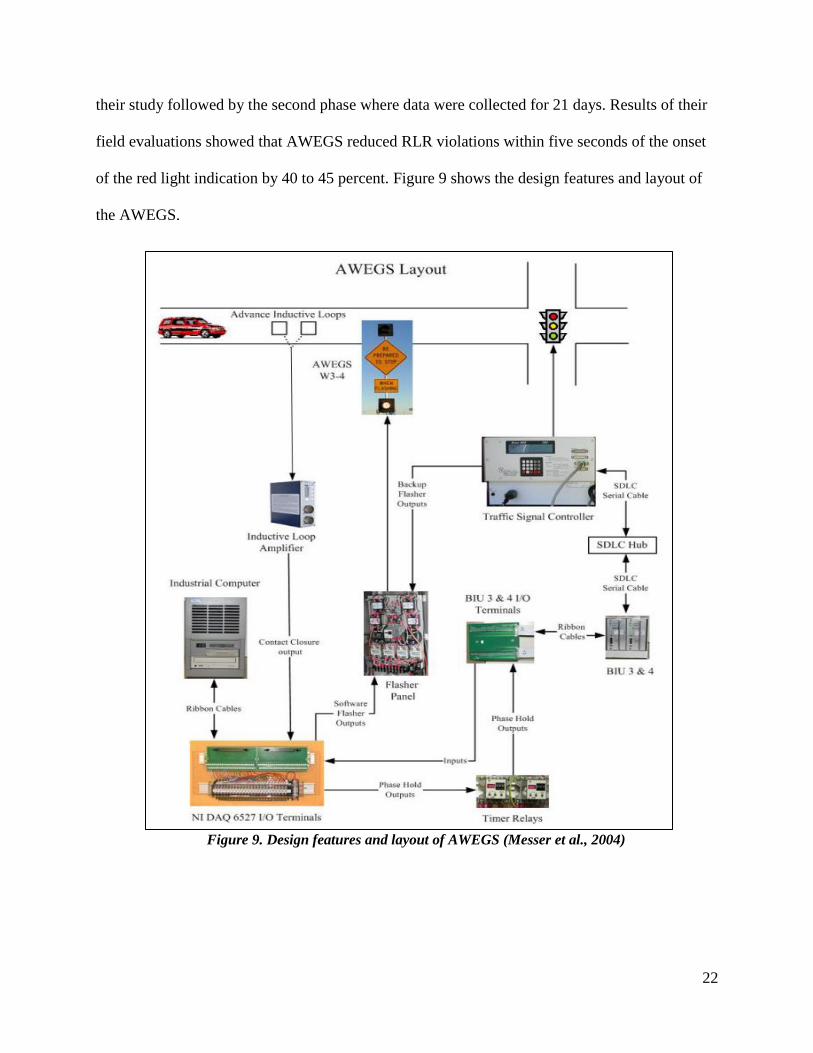
Messer et al. (2004) performed a two year study to evaluate how the Advance Warning
for End-of-Green Systems (AWEGS), could reduce RLR violations at two high speed
intersections in Texas. Red light runners were detected at the study sites by using “video imaging
vehicle detection systems” (VIVDS). Prior to the installation of the systems, they collected data
for two weeks. After installation of AWEGS, they collected data for 35 days for the first phase of
22
their study followed by the second phase where data were collected for 21 days. Results of their
field evaluations showed that AWEGS reduced RLR violations within five seconds of the onset
of the red light indication by 40 to 45 percent. Figure 9 shows the design features and layout of
the AWEGS.
Figure 9. Design features and layout of AWEGS (Messer et al., 2004)
23
2.6.3 Physical Improvements
At low-volume intersections where traffic signals are unwarranted, removing the signals
can be an effective measure to reducing crashes at such locations provided the safety and the
operational characteristics of the intersections are not compromised. Before traffic signals are
installed at any intersection, warrant studies should be conducted based on pedestrian volumes,
traffic volumes and safety measures at the intersection. A study in Philadelphia showed that the
removal of unwanted signals at 199 low-volume intersections contributed to a crash reduction of
24 percent at those intersections (Retting et al., 1998).
Additional traffic lanes for maneuvering through or making right-turns or left-turns at
signalized intersections is an effective measure of reducing congestion. Most traffic delays occur
at intersections and when drivers stay in queues for longer periods, they might run red lights to
avoid waiting for the next cycle. When additional lanes are added to intersections to increase
their capacity, the problem of congestion will be reduced.
A modern roundabout is another alternative to reduce the severity of a crash such as
right-angle that are common at signalized intersections. Converting a signalized intersection into
a roundabout has shown to increase safety.
In NCHRP Report 572-Roundabouts in the United States, Rodegerdts et al. (2007) found
a 48 percent reduction in all crash types and a 77.7 percent reduction in injury and fatal crashes
when nine signalized intersections were converted to a roundabout. Persaud et al. (2001)
performed a study to evaluate the change in vehicle crashes when 23 signalized or
stop-controlled intersections were converted to roundabouts at urban, suburban and rural
locations in the United States. They performed a before-after Empirical Bayes analysis of the
24
data they gathered. Results of their study showed a 40 percent reduction of all crash types and an
80 percent reduction of all injury crashes at the 23 intersections combined.
2.7 Enforcement Countermeasures.
Enforcement countermeasures are those that include the use of a police officer, or a
device which acts as a surrogate to a police officer. Several studies have been conducted to
investigate the effectiveness of these two countermeasures or combination of the
countermeasures in reducing RLR at signalized intersections.
2.7.1 Automated Enforcement
Automated enforcement is a highly effective way of using cameras to enforce RLR at
signalized intersections. As of May 2014, 503 communities in the United States had red light
camera programs (IIHS, 2014).
Several studies have shown that using automated enforcement is an effective tool in
reducing RLR violations and associated crashes at signalized intersections. Fitzsimmons et al.
(2007) found 44 percent, 90 percent and 40 percent reductions in total, right-angle and rear-end
crashes, respectively, in a study they conducted in Council Bluffs, Iowa. Similarly, a study
conducted in North Carolina at red light camera equipped intersections showed a 17 percent
reduction in total crashes, 22 percent reduction in RLR related crashes, 42 percent reduction in
angle crashes and 25 percent reduction in rear-end crashes (Cunningham and Hummer, 2004).
Studies in Oxnard, California and Fairfax, Virginia found red light cameras reduced RLR
violations by approximately 40 percent (Retting et al., 1999a, Retting et al., 1999b).
25
2.7.2 Targeted Enforcement
The goal of targeted enforcement is to make the public become more aware of RLR
through an increase in ticketed violations or the presence of traffic enforcement agent at an
intersection Targeted enforcement is designed to target an identified signalized intersection or
corridor where RLR has recently become a problem, or has been identified as a problem through
a crash and/or violation study. With this technique, one officer stationed upstream of an
intersection will observe the violation, then send a radio message to another officer stationed
downstream of the same intersection to pullover the offender and issue a ticket. This technique is
regarded as effective in reducing RLR violations however, it is labor-intensive. In some
communities, confirmation lights are used as an alternative to team enforcement (Bonneson et
al., 2004).
2.7.3 Confirmation Lights
Confirmation lights are a relatively small, low-cost light mounted on the top or the
bottom of a traffic signal head or mast arm. This light is sometimes referred to as “Red-Signal
Enforcement Lights” or “Red Indication Lights” or “Rat Boxes” or “Tattletale Lights” (Hsu et
al., 2009). The confirmation light activates simultaneously during the red signal phase to aid a
police officer located downstream of the intersection in observing a RLR violation. After the
confirmation light turns on, it is visible 360 degrees from any intersection approach. The
confirmation light is wired directly into the red signal aspect and only activates when red light is
indicated as shown in Figure 10.
26
Figure 10. Confirmation light wired directly into red aspect of signal
This system eliminates the need for a team of officers to monitor red light violators at a
single intersection, thereby cutting down the police staff to effectively enforce RLR at an
intersection. Additionally, the low cost of confirmation lights (cost between $50 and $150 in
2014 dollars) potentially allows more installation at other problematic intersections, hence,
increasing enforcement resources efficiently (Hsu et al., 2009).
Reddy et al. (2008) investigated white enforcement lights at 17 intersections on the state
highway system in Hillsborough County, Florida. The researchers evaluated effectiveness by a
violation and crash analysis. Five months prior to installation, violation data were collected at 24
intersections on weekdays during morning and evening peaks hours. A similar study was
conducted in the three months after installation at the 17 intersections in which the lights were
installed. Considering all intersections, a total of 759 violations were recorded in the before
period while 567 violations were recorded in the after period. It was noted that some
intersections saw an increase in violations. A matched-pair t-test was performed and it was
determined the reduction in violations were statistically significant. The authors upon further
27
analysis found that the reduction in violations during the morning peak hour were not statistically
significant while the evening violations were at the 95 percent level of confidence.
Crash data were obtained from the Florida Department of Transportation for a period of
six years (2000-2005). Data from 2000-2002 were considered the before period in which 828
crashes per year occurred at the study intersections of which 56 crashes per year were due to
RLR. Data from January 2004 to December 2004 were considered the after period with 2003
being considered the installation period. An average of 860 crashes per year at the study
intersections was recorded with 52 crashes per year due to RLR. The authors further broke down
the crash analysis and investigated approaches with white enforcement lights and found crashes
were reduced from approximately 40 crashes per year to 28 crashes per year.
The Minnesota Local Technical Assistance Program (2009) summarized a completed
study conducted by the University of Minnesota and City of Burnsville, Minnesota in which blue
confirmation lights were installed at two signalized intersections on County Roads 5 and 11. An
investigation assisted by the University of Minnesota saw the daily violation rate reduced by 41
percent. Research also found that violations increased in heavy traffic and most violations
occurred during peak hours.
Although confirmation lights have been largely deployed throughout the United States
including communities in Florida, Texas, Minnesota, Kentucky and California, limited research
studies have been published to determine the effectiveness of the countermeasure in reducing
RLR violations or crashes.
28
2.8 Public Education
Reaching out and educating the public is an effective way to communicate the
seriousness of a driver running red light at a signalized intersection. Public education could
include media campaigns, grants for targeted enforcement, commercials, further instruction
during drivers’ education classes, and/or television newscast segments on high crash intersection
locations.
2.9 Literature Review Summary
As reported in the literature search, RLR continues to be a serious safety concern and
many communities and researchers have investigated countermeasures ranging from low-cost
signal timing adjustments to expensive intersection geometric improvements or automated
enforcement. To fully address RLR, it takes all aspects of the three Es (Engineering,
Enforcement, and Education). As stated previously, this research project is intended to
investigate a low-cost countermeasure to aid police officers and make the public aware of RLR
at designated intersections in Kansas. This research will provide additional information into the
effectiveness of the confirmation light system.
29
CHAPTER 3: PROBLEM STATEMENT
RLR continues to be a serious safety concern for many communities across the United
States. Traditionally, when signalized intersections have been identified as a location with a high
number of RLR violations, traditional targeted enforcement is used to reduce the number of
violations.
To safely and efficiently enforce RLR at targeted intersections, multiple police officers
are needed to verify whether a vehicle ran a red light and to correctly issue a ticket to the
offender. Many times, this has required at least one officer watching the signal and stop line
while another is waiting downstream of the targeted approach and/or movement. In some
instances, an officer observing a RLR violation will chase an offending driver through the
intersection, thus exposing him or her to crossing vehicular traffic.
Also stated in the literature search, many communities have turned to automated
enforcement to monitor and ticket red light runners at signalized intersections. Automated
enforcement, although found by many research studies to be effective at reducing RLR violations
and related crashes, have become a target of driver privacy. The State of Kansas currently has
legislation that prohibits the use of automated enforcement (State of Kansas, 2013 Statute,
21-6101, subsection (a) (6)), unless deemed essential for safety by a community and all other
options have been exhausted. However, automated enforcement can be found in the neighboring
state of Missouri.
The objective of this study was to investigate the effectiveness of a low-cost signalized
intersection treatment to reduce RLR at signalized intersections. Confirmation lights were chosen
as a low-cost option to aid police officers in more easily observing RLR violations when
positioned downstream from the intersection. Confirmation lights have been deployed in many
30
communities across the United States. However, limited effectiveness data has been published
that can support the effectiveness of this device. Two busy signalized intersections in Lawrence,
Kansas were selected as the treatment sites to test the effectiveness of this device.
Effectiveness of the confirmation lights was determined by a before-after violation study.
The changes in violations were used as a safety surrogate for the potential changes in crashes. A
secondary performance measure that was used included the changes of violation time into red,
which is an indicator of how long after the red signal a vehicle violated the red light.
31
CHAPTER 4: RESEARCH APPROACH
The research study was conducted in Lawrence, Kansas. The City of Lawrence has a
population of over 87,000 residents and is the location of the University of Kansas. Kansas
Highway 10 (K-10) runs east-west and connects Lawrence to the Kansas City Metropolitan area.
Iowa Street (US 59) runs north-south and connects traffic to Interstate 70 (I-70) in the north of
Lawrence.
The study intersections were located within city limits, were similar in operation, and had
no current or planned construction at the intersection during the study period. Since the project
was limited to a 12 month study, a violation study was conducted in place of a crash study which
would require multiple years of before and after crash data.
4.1 Measure of Safety
Typical countermeasure effectiveness studies rely on three to six years of before and after
crash data (Tarko et al., 2009). However, crash data may be limited due to small sample size and
lack of details to explain the mechanisms of crash failures and driver crash avoidance behaviors
(Tarko et al., 2009). To measure the safety effect of a treatment, a significant number of crashes
need to have been recorded before an action is taken. In situations where a recent
countermeasure is implemented such as was the case in this study, it is difficult to measure the
safety effect of that countermeasure if crash data from the period prior to and after installation
are limited. Because of these issues, other observable non–crash traffic events and surrogate data
instead of crash data can be used in road safety analysis. In this research study, before-after
violation data were used as a surrogate measure to evaluate the effectiveness of the confirmation
light system since crash data were limited.
32
4.2 Site Selection
Prior to meeting with city officials, 22 intersections were identified as possible sites for
installation of the confirmation lights. A set of variables that were investigated at each of the
intersections included: approach geometry (e.g. number of lanes, pavement markings, tapers, and
right turning lanes), posted speed limited between 30 and 50 mph, protected and/or
protected/permitted left turning lanes, a safe location where a police car could be positioned near
the intersection approaches, and moderate to high peak hour volumes. Appendix A shows the
characteristics and aerial views of the 22 intersections.
The 22 intersections were reduced to 13 candidate sites. This was accomplished by
eliminating intersections which did not meet the set of variables explained above. To verify
similarities in traffic volumes at specific intersections which were deemed to have the most
promise for treatment, nine intersections peak hour traffic counts were collected during the
morning and evening peak hours on either a Tuesday, Wednesday, or Thursday between August
and September of 2012.
After the manual traffic counts were conducted, it was agreed with the City of Lawrence
officials (including the city traffic engineer, traffic signal technician, and the police lieutenant in
charge of traffic enforcement), the two treatment sites where the confirmation lights would be
installed. Other intersections to be studied to investigate possible spillover effects of the
treatment, and control intersections located in different areas of the city were also identified. A
total of two treatments sites, six spillover sites, and five control sites were selected as
appropriated sites for this study.
33
4.3 Site Category
4.3.1 Treatment Sites
As stated previously, two signalized intersections in Lawrence were determined to be
optimal locations for the confirmation lights to be installed. These included:
23rd
Street and Iowa Street; and
23rd
Street and Louisiana Street.
Both of these intersections are located on K-10 which passes through Lawrence. The
intersection of 23rd
Street and Iowa Street is the highest volume intersection in the city with also
the most crashes. Detailed information on each intersection can be found in the following
sections. At the request of the Lawrence Police Department, the research team equipped both of
these intersections’ protected left-turning-movement-only approaches with confirmation lights
due to the highest number of red light violations for these movements. Additionally, the
intersection of 23rd
Street and Iowa Street has a high percentage of heavy vehicles. Heavy
vehicles predominantly travel through this intersection by making a left turn from southbound on
Iowa Street to eastbound on 23rd
Street as a way to access the southern Kansas City Metropolitan
area.
4.3.2 Spillover Sites
Spillover sites are signalized intersections located directly adjacent to the two treatment
intersections in Lawrence. These included the following locations:
19th
Street and Iowa Street;
19th
Street and Louisiana Street;
23rd
Street and Ousdahl Road;
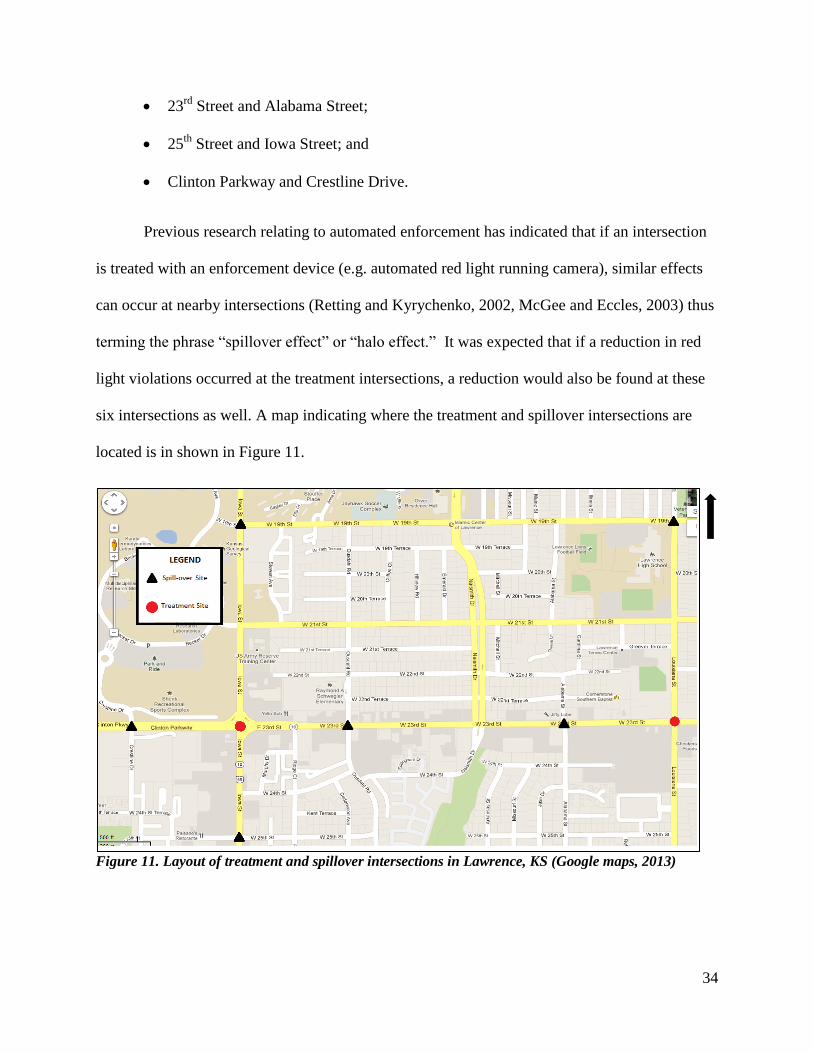
34
23rd
Street and Alabama Street;
25th
Street and Iowa Street; and
Clinton Parkway and Crestline Drive.
Previous research relating to automated enforcement has indicated that if an intersection
is treated with an enforcement device (e.g. automated red light running camera), similar effects
can occur at nearby intersections (Retting and Kyrychenko, 2002, McGee and Eccles, 2003) thus
terming the phrase “spillover effect” or “halo effect.” It was expected that if a reduction in red
light violations occurred at the treatment intersections, a reduction would also be found at these
six intersections as well. A map indicating where the treatment and spillover intersections are
located is in shown in Figure 11.
Figure 11. Layout of treatment and spillover intersections in Lawrence, KS (Google maps, 2013)
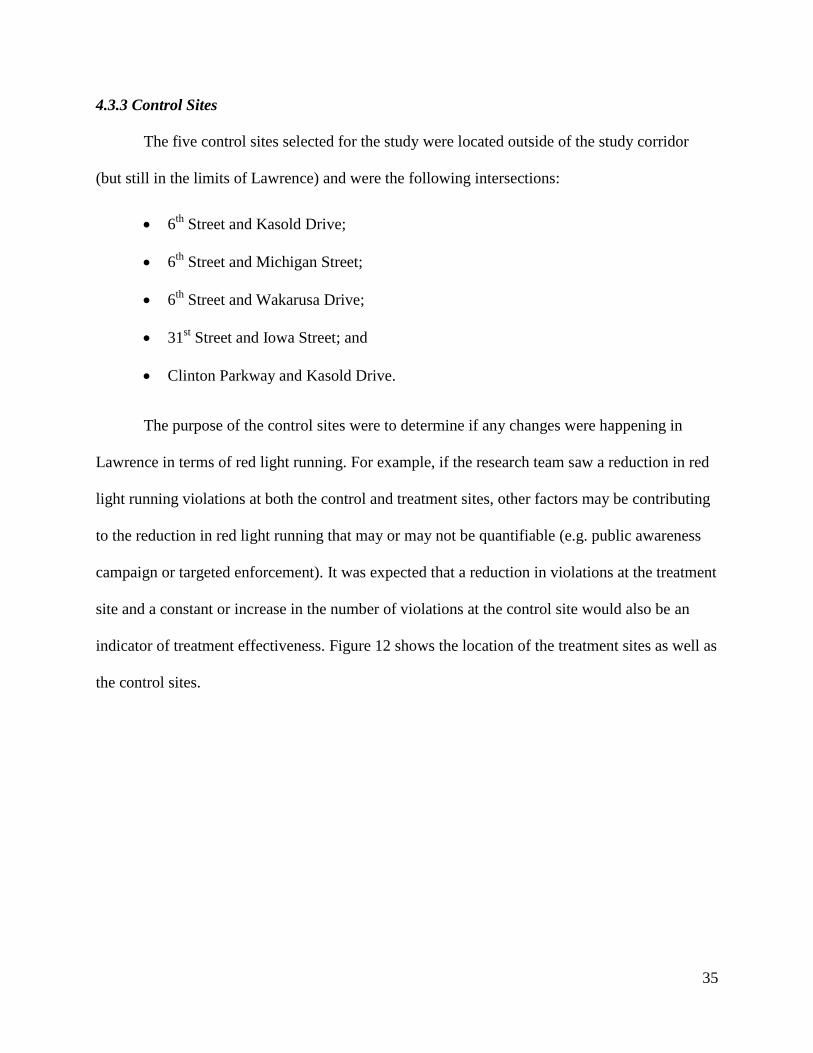
35
4.3.3 Control Sites
The five control sites selected for the study were located outside of the study corridor
(but still in the limits of Lawrence) and were the following intersections:
6th
Street and Kasold Drive;
6th
Street and Michigan Street;
6th
Street and Wakarusa Drive;
31st Street and Iowa Street; and
Clinton Parkway and Kasold Drive.
The purpose of the control sites were to determine if any changes were happening in
Lawrence in terms of red light running. For example, if the research team saw a reduction in red
light running violations at both the control and treatment sites, other factors may be contributing
to the reduction in red light running that may or may not be quantifiable (e.g. public awareness
campaign or targeted enforcement). It was expected that a reduction in violations at the treatment
site and a constant or increase in the number of violations at the control site would also be an
indicator of treatment effectiveness. Figure 12 shows the location of the treatment sites as well as
the control sites.
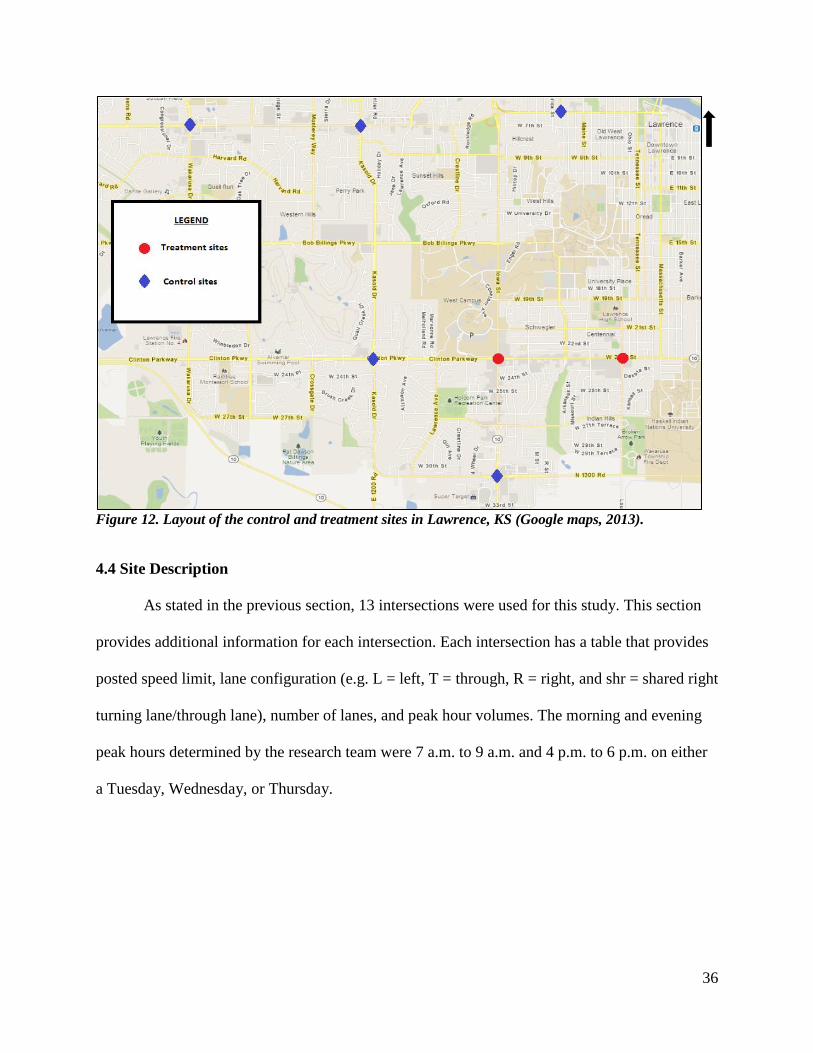
36
Figure 12. Layout of the control and treatment sites in Lawrence, KS (Google maps, 2013).
4.4 Site Description
As stated in the previous section, 13 intersections were used for this study. This section
provides additional information for each intersection. Each intersection has a table that provides
posted speed limit, lane configuration (e.g. L = left, T = through, R = right, and shr = shared right
turning lane/through lane), number of lanes, and peak hour volumes. The morning and evening
peak hours determined by the research team were 7 a.m. to 9 a.m. and 4 p.m. to 6 p.m. on either
a Tuesday, Wednesday, or Thursday.
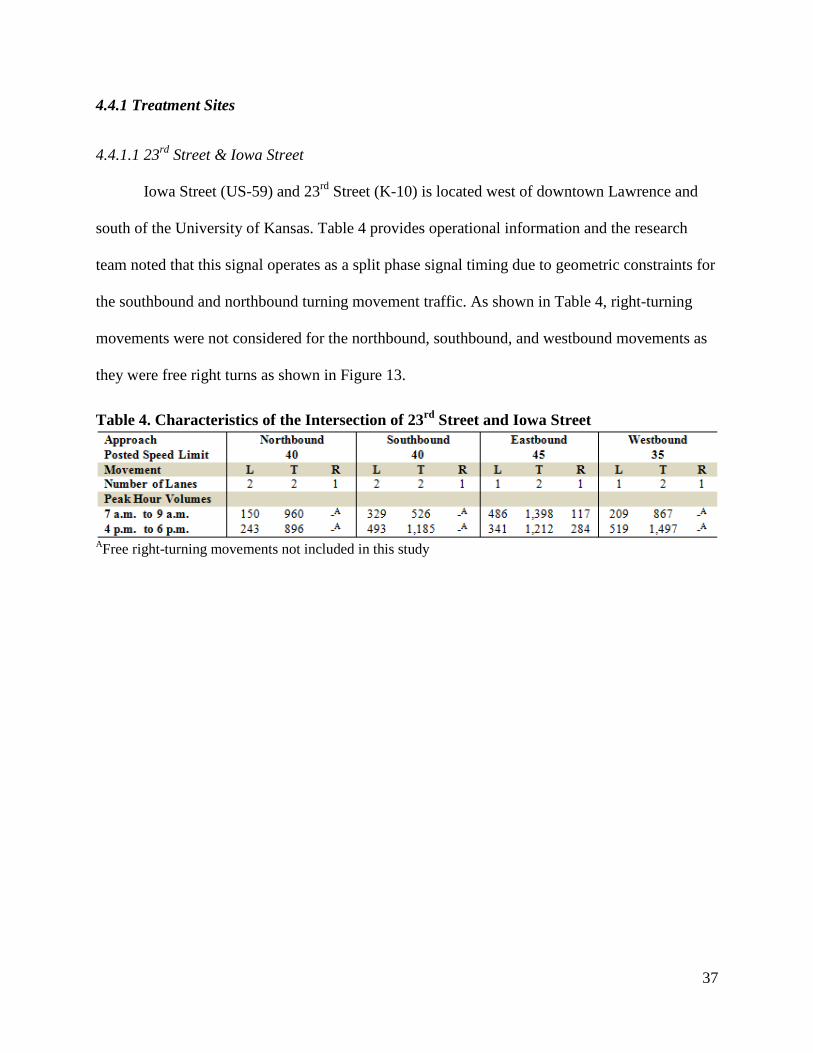
37
4.4.1 Treatment Sites
4.4.1.1 23rd
Street & Iowa Street
Iowa Street (US-59) and 23rd
Street (K-10) is located west of downtown Lawrence and
south of the University of Kansas. Table 4 provides operational information and the research
team noted that this signal operates as a split phase signal timing due to geometric constraints for
the southbound and northbound turning movement traffic. As shown in Table 4, right-turning
movements were not considered for the northbound, southbound, and westbound movements as
they were free right turns as shown in Figure 13.
Table 4. Characteristics of the Intersection of 23rd
Street and Iowa Street
AFree right-turning movements not included in this study
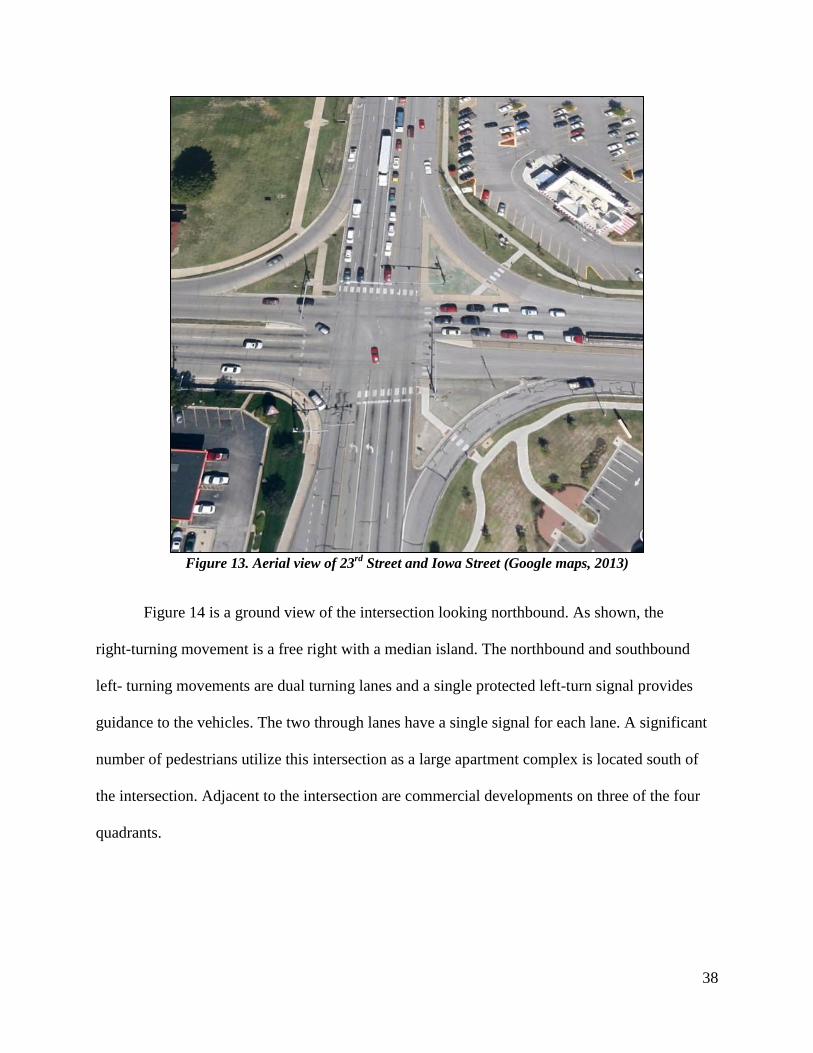
38
Figure 13. Aerial view of 23
rd Street and Iowa Street (Google maps, 2013)
Figure 14 is a ground view of the intersection looking northbound. As shown, the
right-turning movement is a free right with a median island. The northbound and southbound
left- turning movements are dual turning lanes and a single protected left-turn signal provides
guidance to the vehicles. The two through lanes have a single signal for each lane. A significant
number of pedestrians utilize this intersection as a large apartment complex is located south of
the intersection. Adjacent to the intersection are commercial developments on three of the four
quadrants.
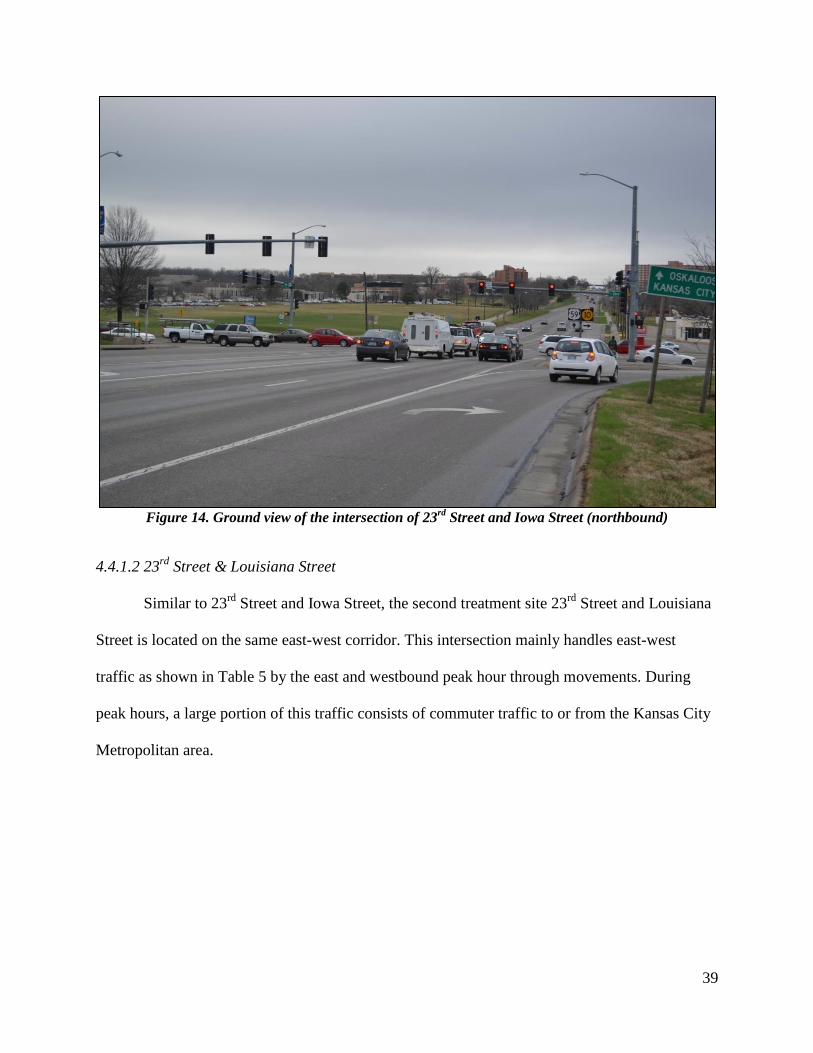
39
Figure 14. Ground view of the intersection of 23
rd Street and Iowa Street (northbound)
4.4.1.2 23rd
Street & Louisiana Street
Similar to 23rd
Street and Iowa Street, the second treatment site 23rd
Street and Louisiana
Street is located on the same east-west corridor. This intersection mainly handles east-west
traffic as shown in Table 5 by the east and westbound peak hour through movements. During
peak hours, a large portion of this traffic consists of commuter traffic to or from the Kansas City
Metropolitan area.
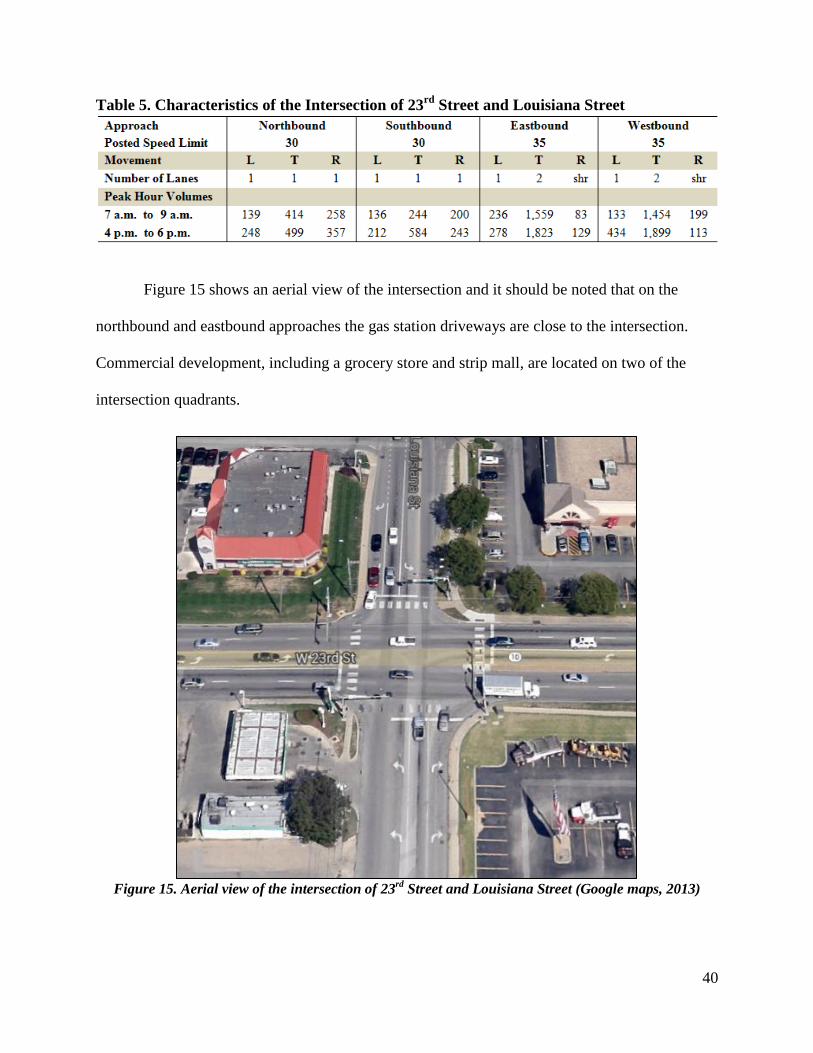
40
Table 5. Characteristics of the Intersection of 23rd
Street and Louisiana Street
Figure 15 shows an aerial view of the intersection and it should be noted that on the
northbound and eastbound approaches the gas station driveways are close to the intersection.
Commercial development, including a grocery store and strip mall, are located on two of the
intersection quadrants.
Figure 15. Aerial view of the intersection of 23
rd Street and Louisiana Street (Google maps, 2013)
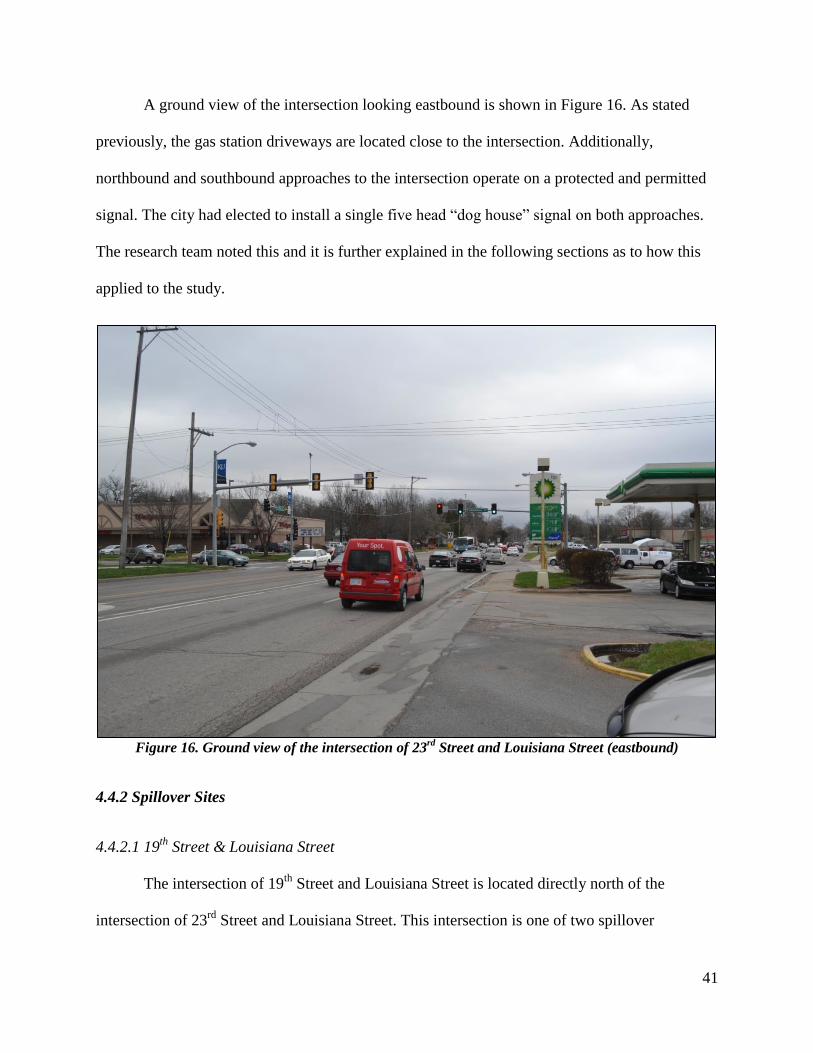
41
A ground view of the intersection looking eastbound is shown in Figure 16. As stated
previously, the gas station driveways are located close to the intersection. Additionally,
northbound and southbound approaches to the intersection operate on a protected and permitted
signal. The city had elected to install a single five head “dog house” signal on both approaches.
The research team noted this and it is further explained in the following sections as to how this
applied to the study.
Figure 16. Ground view of the intersection of 23
rd Street and Louisiana Street (eastbound)
4.4.2 Spillover Sites
4.4.2.1 19th
Street & Louisiana Street
The intersection of 19th
Street and Louisiana Street is located directly north of the
intersection of 23rd
Street and Louisiana Street. This intersection is one of two spillover
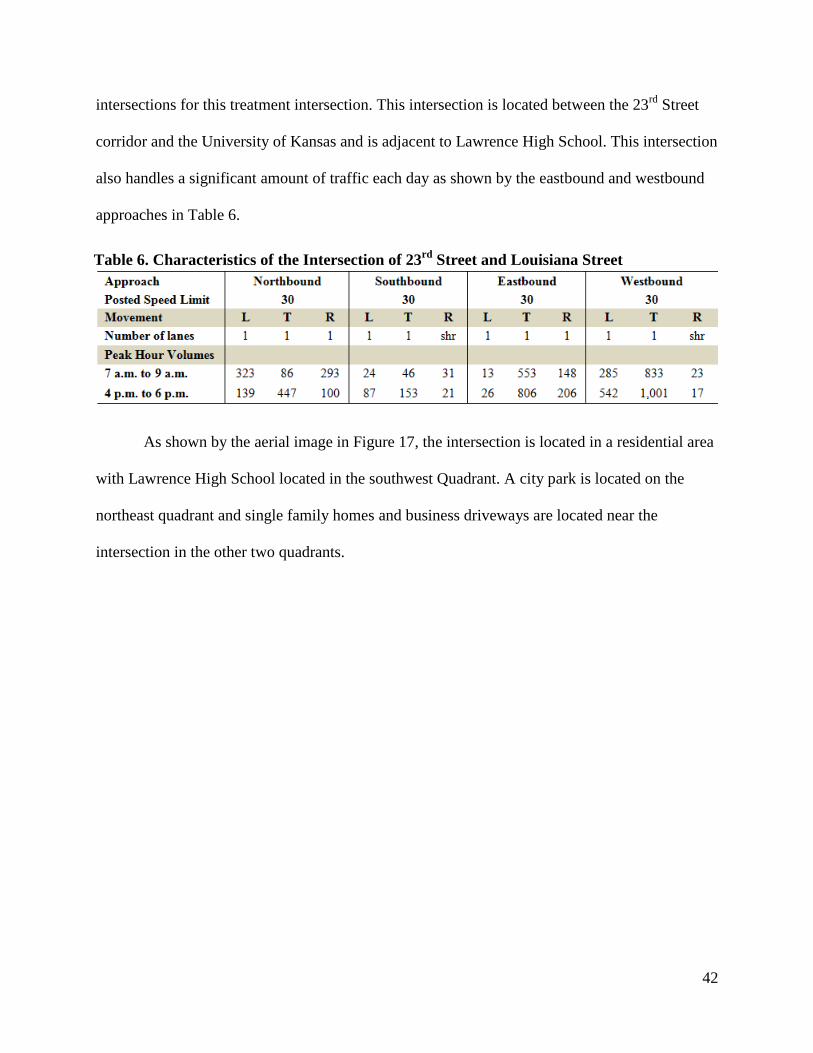
42
intersections for this treatment intersection. This intersection is located between the 23rd
Street
corridor and the University of Kansas and is adjacent to Lawrence High School. This intersection
also handles a significant amount of traffic each day as shown by the eastbound and westbound
approaches in Table 6.
Table 6. Characteristics of the Intersection of 23rd
Street and Louisiana Street
As shown by the aerial image in Figure 17, the intersection is located in a residential area
with Lawrence High School located in the southwest Quadrant. A city park is located on the
northeast quadrant and single family homes and business driveways are located near the
intersection in the other two quadrants.
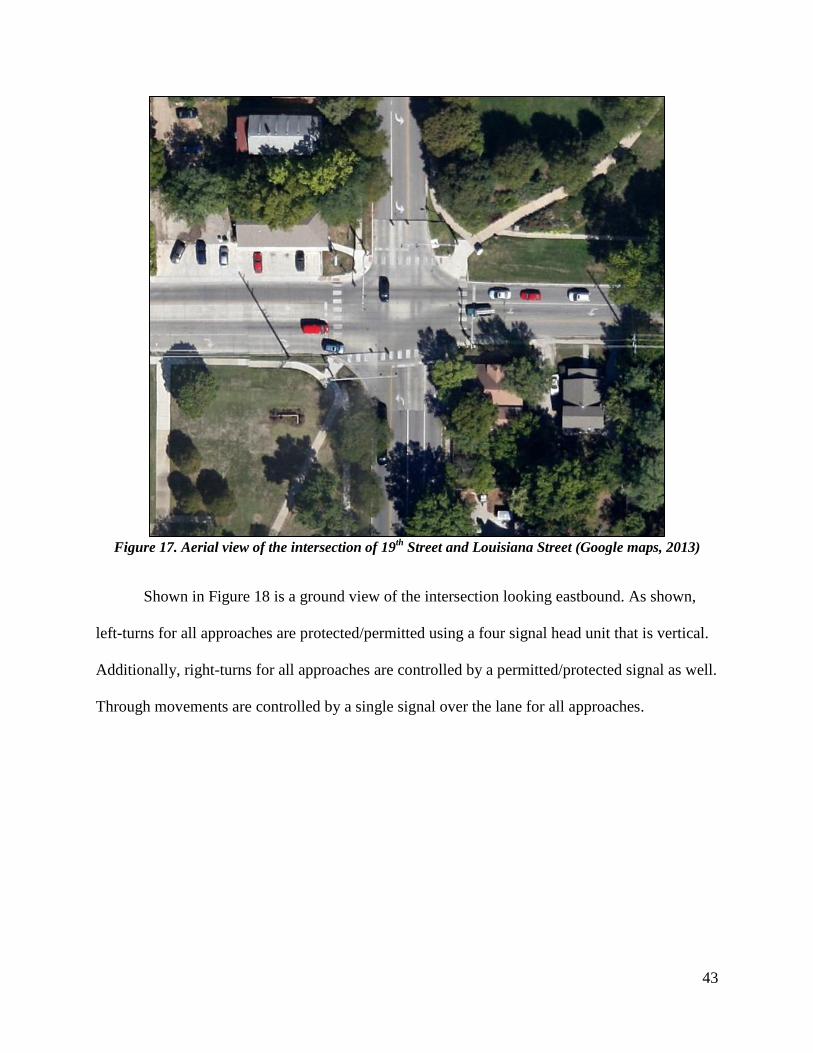
43
Figure 17. Aerial view of the intersection of 19
th Street and Louisiana Street (Google maps, 2013)
Shown in Figure 18 is a ground view of the intersection looking eastbound. As shown,
left-turns for all approaches are protected/permitted using a four signal head unit that is vertical.
Additionally, right-turns for all approaches are controlled by a permitted/protected signal as well.
Through movements are controlled by a single signal over the lane for all approaches.
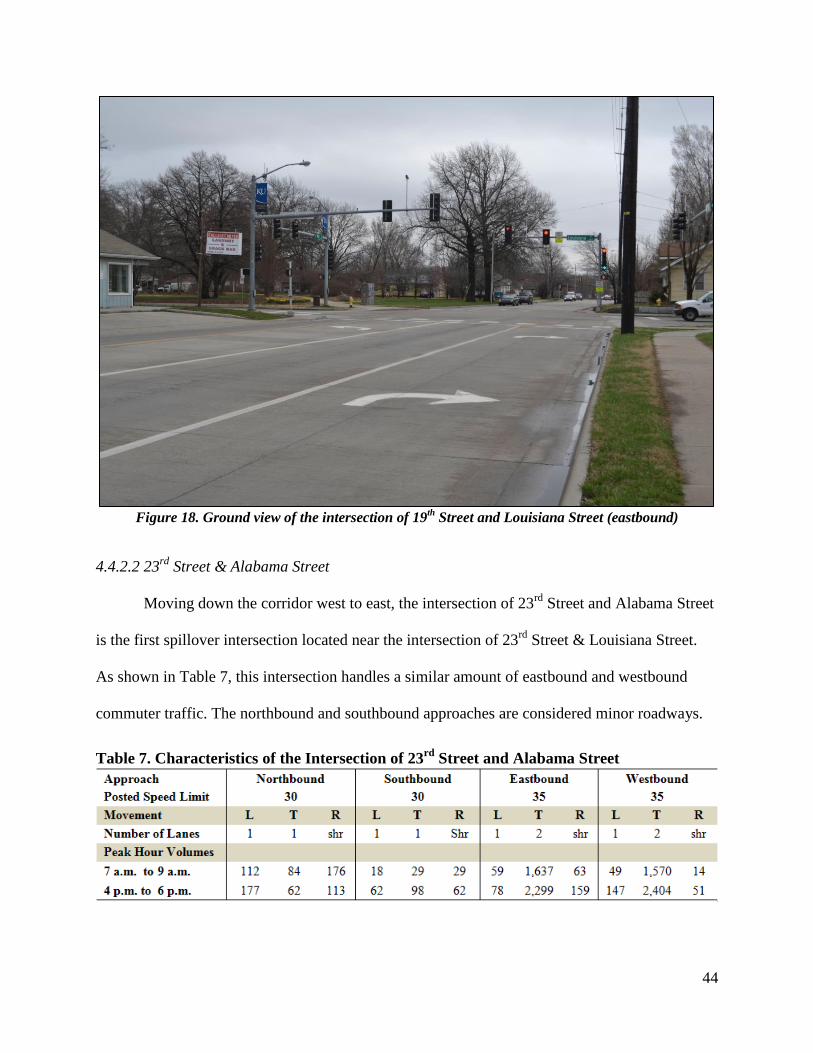
44
Figure 18. Ground view of the intersection of 19
th Street and Louisiana Street (eastbound)
4.4.2.2 23rd
Street & Alabama Street
Moving down the corridor west to east, the intersection of 23rd
Street and Alabama Street
is the first spillover intersection located near the intersection of 23rd
Street & Louisiana Street.
As shown in Table 7, this intersection handles a similar amount of eastbound and westbound
commuter traffic. The northbound and southbound approaches are considered minor roadways.
Table 7. Characteristics of the Intersection of 23rd
Street and Alabama Street
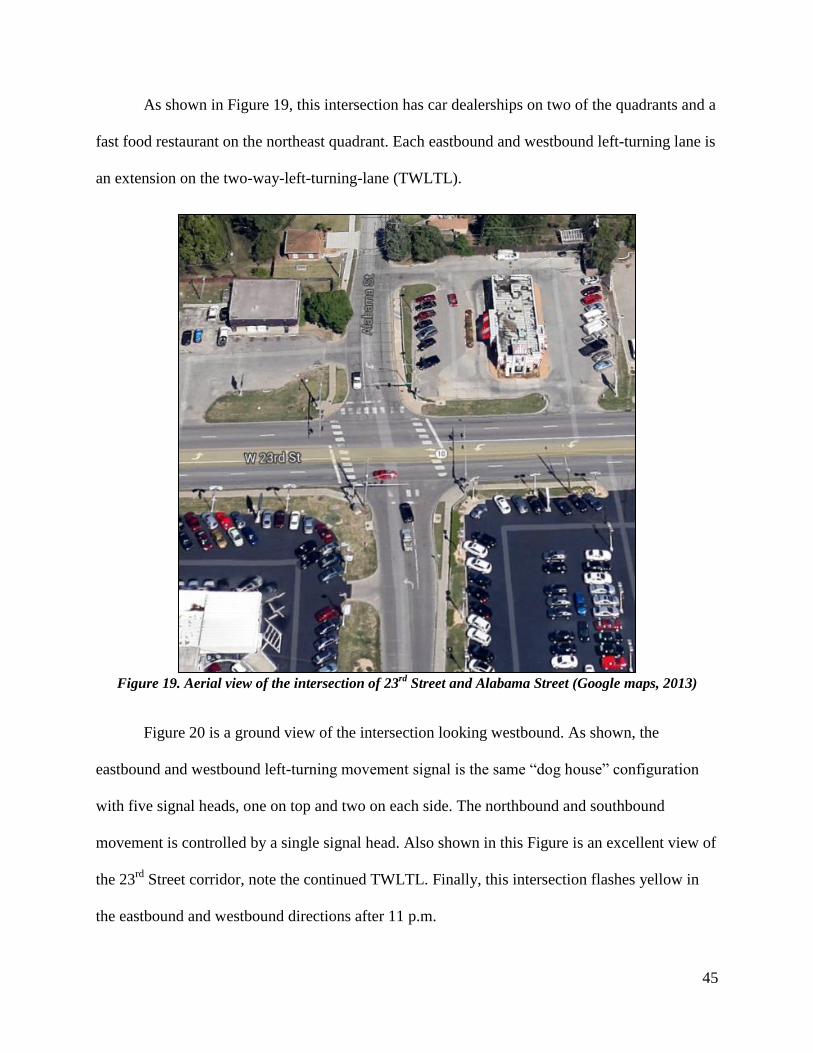
45
As shown in Figure 19, this intersection has car dealerships on two of the quadrants and a
fast food restaurant on the northeast quadrant. Each eastbound and westbound left-turning lane is
an extension on the two-way-left-turning-lane (TWLTL).
Figure 19. Aerial view of the intersection of 23
rd Street and Alabama Street (Google maps, 2013)
Figure 20 is a ground view of the intersection looking westbound. As shown, the
eastbound and westbound left-turning movement signal is the same “dog house” configuration
with five signal heads, one on top and two on each side. The northbound and southbound
movement is controlled by a single signal head. Also shown in this Figure is an excellent view of
the 23rd
Street corridor, note the continued TWLTL. Finally, this intersection flashes yellow in
the eastbound and westbound directions after 11 p.m.
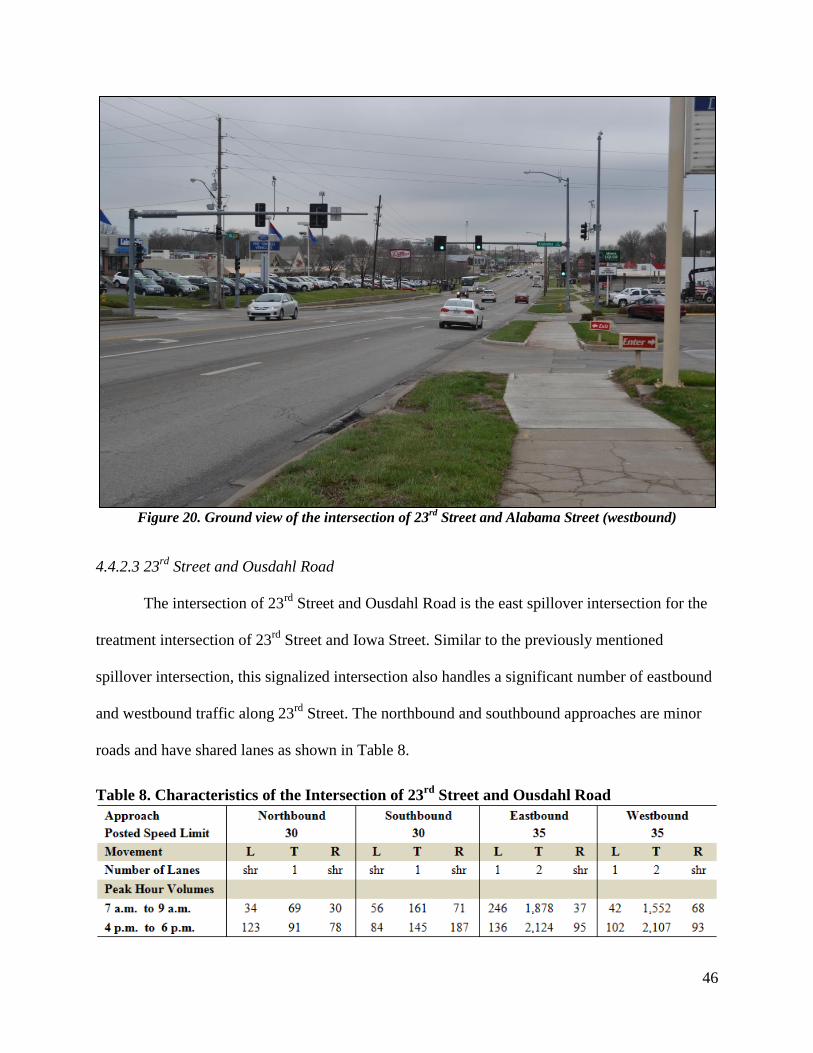
46
Figure 20. Ground view of the intersection of 23
rd Street and Alabama Street (westbound)
4.4.2.3 23rd
Street and Ousdahl Road
The intersection of 23rd
Street and Ousdahl Road is the east spillover intersection for the
treatment intersection of 23rd
Street and Iowa Street. Similar to the previously mentioned
spillover intersection, this signalized intersection also handles a significant number of eastbound
and westbound traffic along 23rd
Street. The northbound and southbound approaches are minor
roads and have shared lanes as shown in Table 8.
Table 8. Characteristics of the Intersection of 23rd
Street and Ousdahl Road
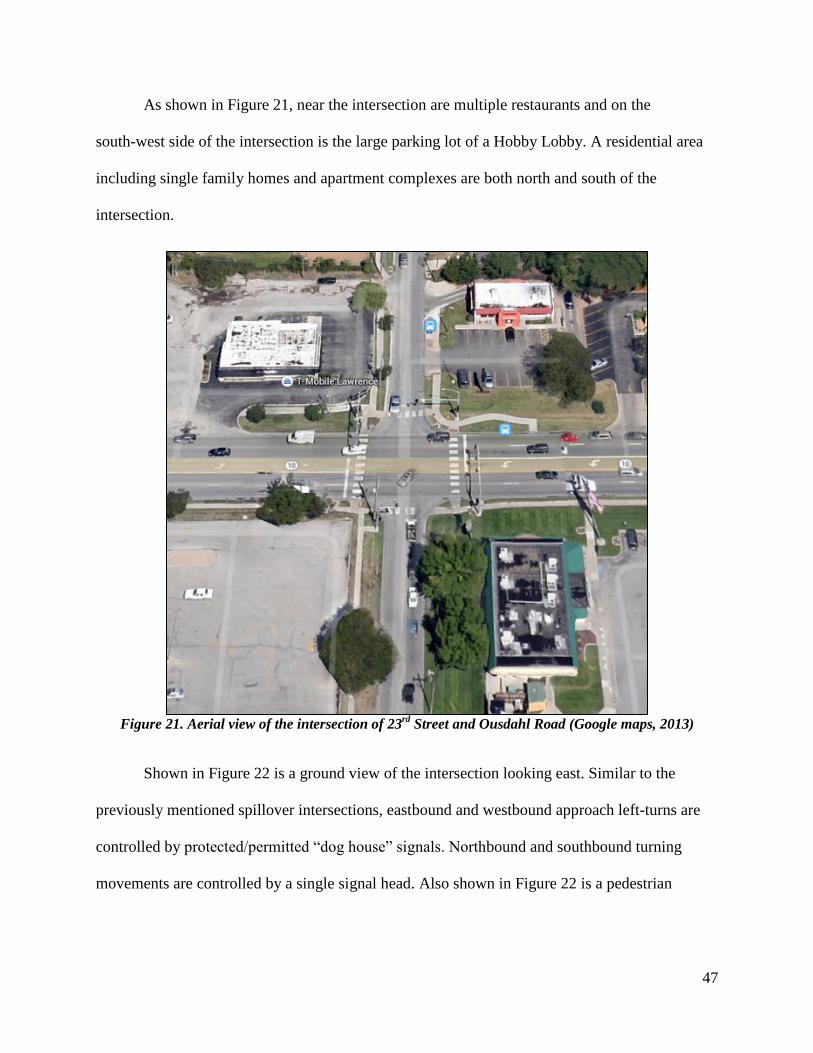
47
As shown in Figure 21, near the intersection are multiple restaurants and on the
south-west side of the intersection is the large parking lot of a Hobby Lobby. A residential area
including single family homes and apartment complexes are both north and south of the
intersection.
Figure 21. Aerial view of the intersection of 23
rd Street and Ousdahl Road (Google maps, 2013)
Shown in Figure 22 is a ground view of the intersection looking east. Similar to the
previously mentioned spillover intersections, eastbound and westbound approach left-turns are
controlled by protected/permitted “dog house” signals. Northbound and southbound turning
movements are controlled by a single signal head. Also shown in Figure 22 is a pedestrian
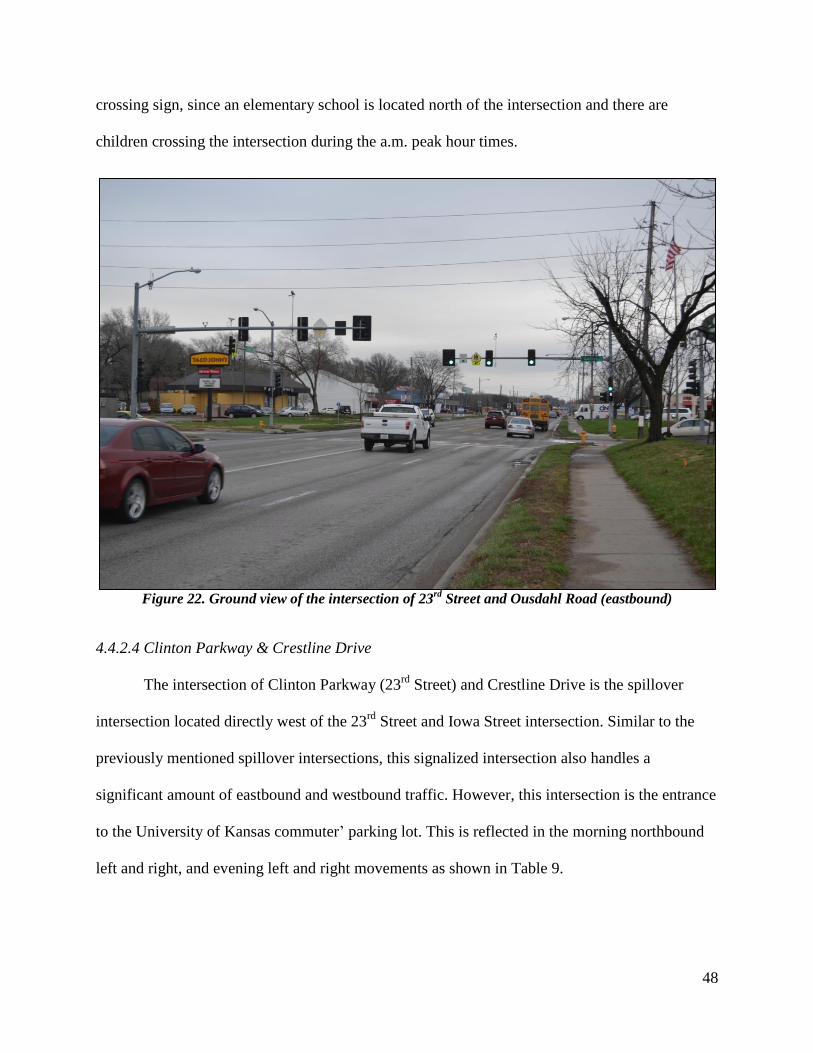
48
crossing sign, since an elementary school is located north of the intersection and there are
children crossing the intersection during the a.m. peak hour times.
Figure 22. Ground view of the intersection of 23
rd Street and Ousdahl Road (eastbound)
4.4.2.4 Clinton Parkway & Crestline Drive
The intersection of Clinton Parkway (23rd
Street) and Crestline Drive is the spillover
intersection located directly west of the 23rd
Street and Iowa Street intersection. Similar to the
previously mentioned spillover intersections, this signalized intersection also handles a
significant amount of eastbound and westbound traffic. However, this intersection is the entrance
to the University of Kansas commuter’ parking lot. This is reflected in the morning northbound
left and right, and evening left and right movements as shown in Table 9.
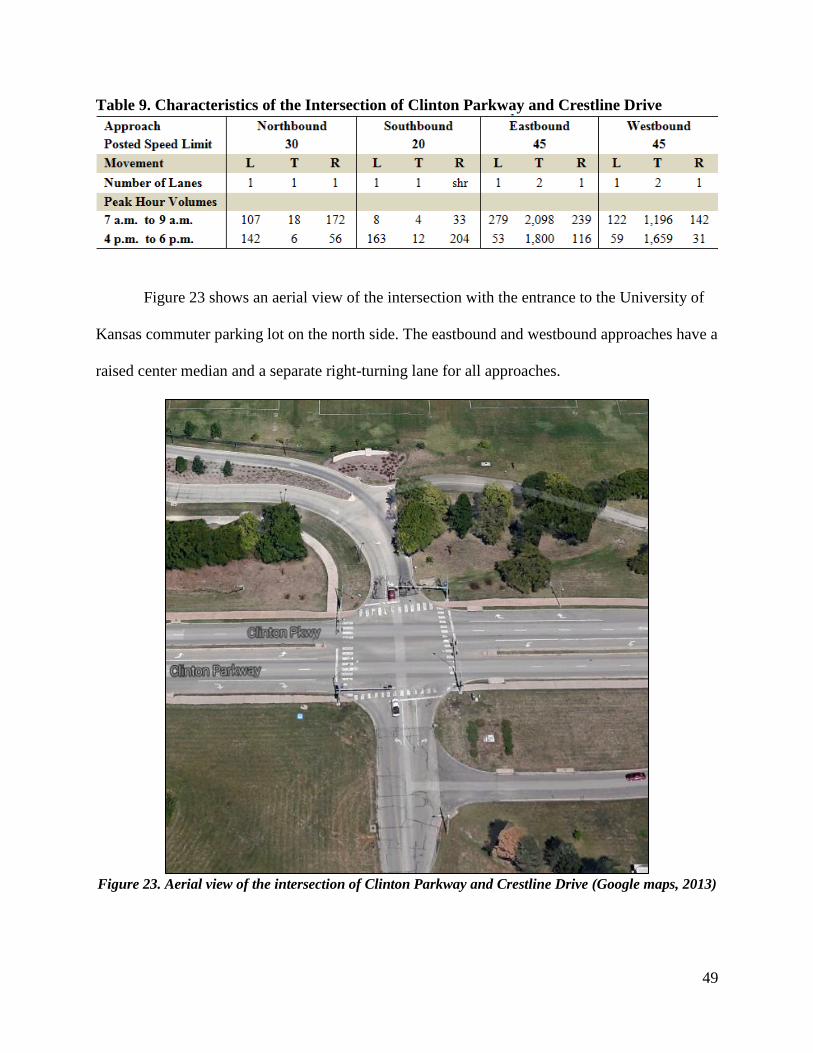
49
Table 9. Characteristics of the Intersection of Clinton Parkway and Crestline Drive
Figure 23 shows an aerial view of the intersection with the entrance to the University of
Kansas commuter parking lot on the north side. The eastbound and westbound approaches have a
raised center median and a separate right-turning lane for all approaches.
Figure 23. Aerial view of the intersection of Clinton Parkway and Crestline Drive (Google maps, 2013)
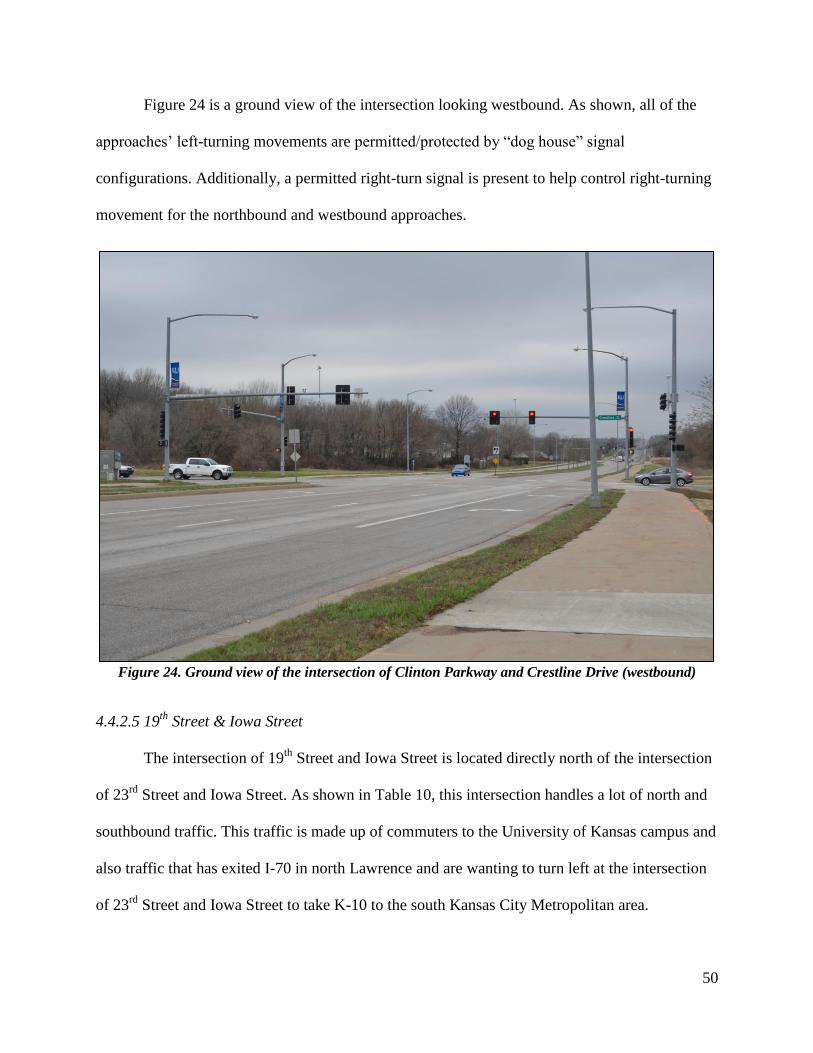
50
Figure 24 is a ground view of the intersection looking westbound. As shown, all of the
approaches’ left-turning movements are permitted/protected by “dog house” signal
configurations. Additionally, a permitted right-turn signal is present to help control right-turning
movement for the northbound and westbound approaches.
Figure 24. Ground view of the intersection of Clinton Parkway and Crestline Drive (westbound)
4.4.2.5 19th
Street & Iowa Street
The intersection of 19th
Street and Iowa Street is located directly north of the intersection
of 23rd
Street and Iowa Street. As shown in Table 10, this intersection handles a lot of north and
southbound traffic. This traffic is made up of commuters to the University of Kansas campus and
also traffic that has exited I-70 in north Lawrence and are wanting to turn left at the intersection
of 23rd
Street and Iowa Street to take K-10 to the south Kansas City Metropolitan area.
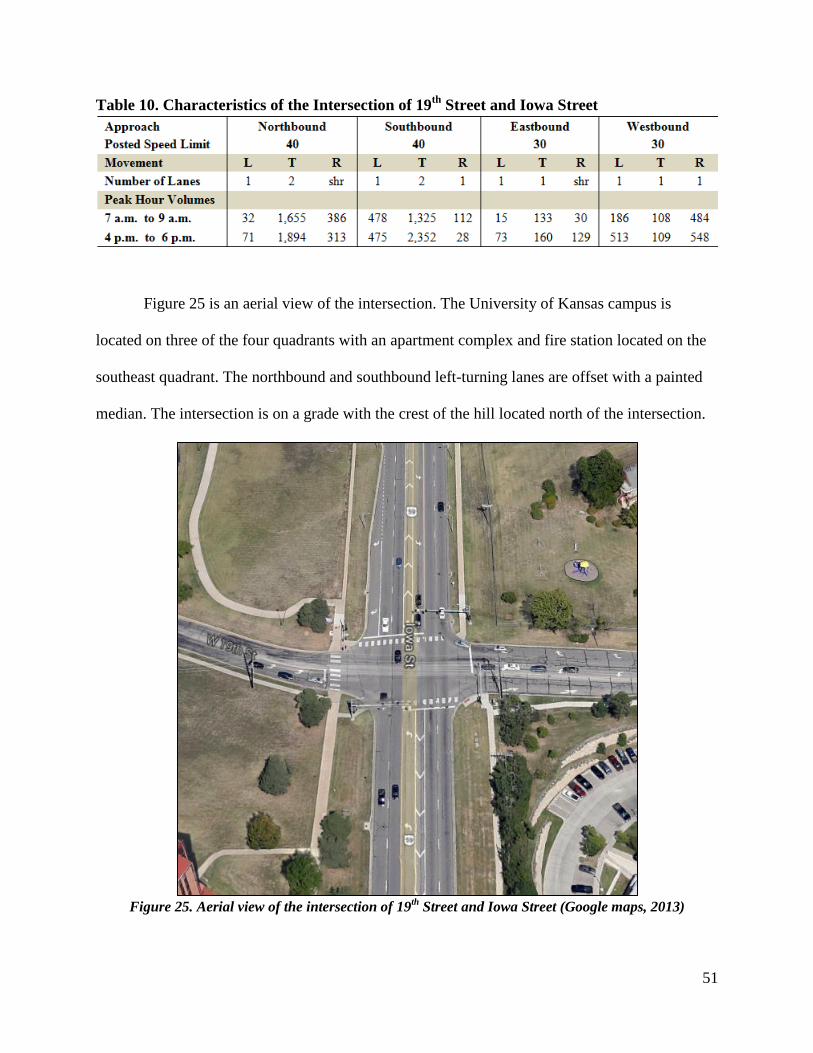
51
Table 10. Characteristics of the Intersection of 19th
Street and Iowa Street
Figure 25 is an aerial view of the intersection. The University of Kansas campus is
located on three of the four quadrants with an apartment complex and fire station located on the
southeast quadrant. The northbound and southbound left-turning lanes are offset with a painted
median. The intersection is on a grade with the crest of the hill located north of the intersection.
Figure 25. Aerial view of the intersection of 19
th Street and Iowa Street (Google maps, 2013)
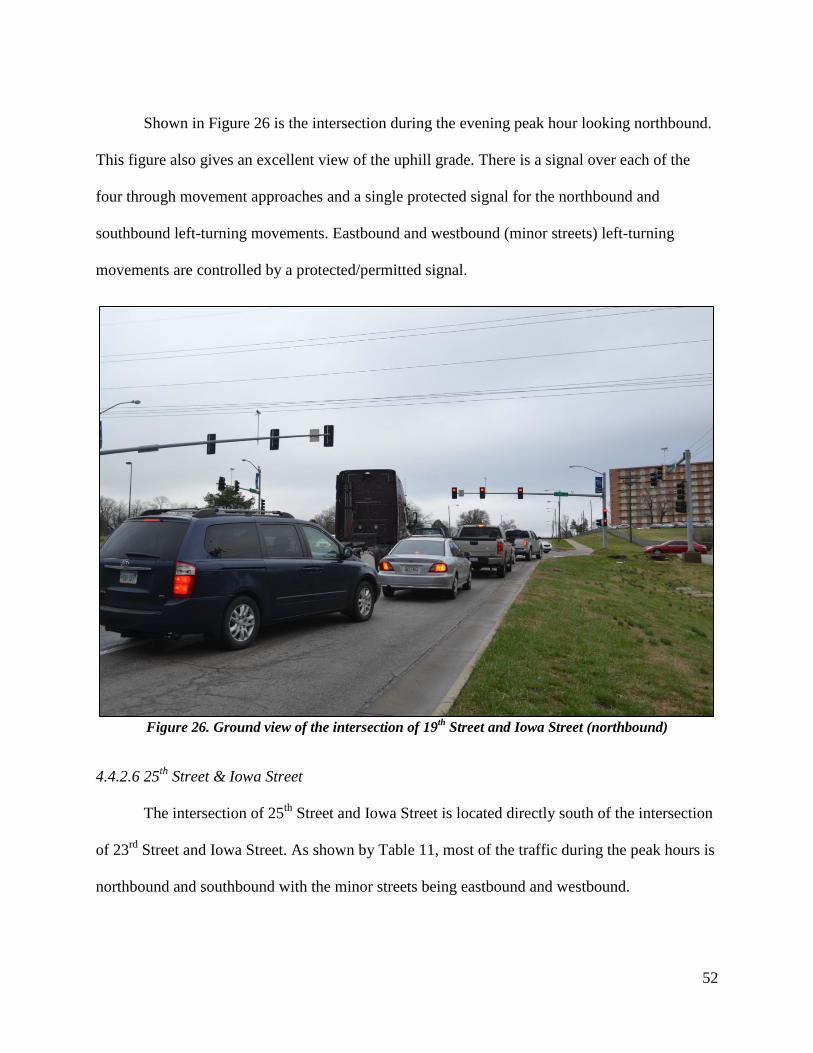
52
Shown in Figure 26 is the intersection during the evening peak hour looking northbound.
This figure also gives an excellent view of the uphill grade. There is a signal over each of the
four through movement approaches and a single protected signal for the northbound and
southbound left-turning movements. Eastbound and westbound (minor streets) left-turning
movements are controlled by a protected/permitted signal.
Figure 26. Ground view of the intersection of 19
th Street and Iowa Street (northbound)
4.4.2.6 25th
Street & Iowa Street
The intersection of 25th
Street and Iowa Street is located directly south of the intersection
of 23rd
Street and Iowa Street. As shown by Table 11, most of the traffic during the peak hours is
northbound and southbound with the minor streets being eastbound and westbound.
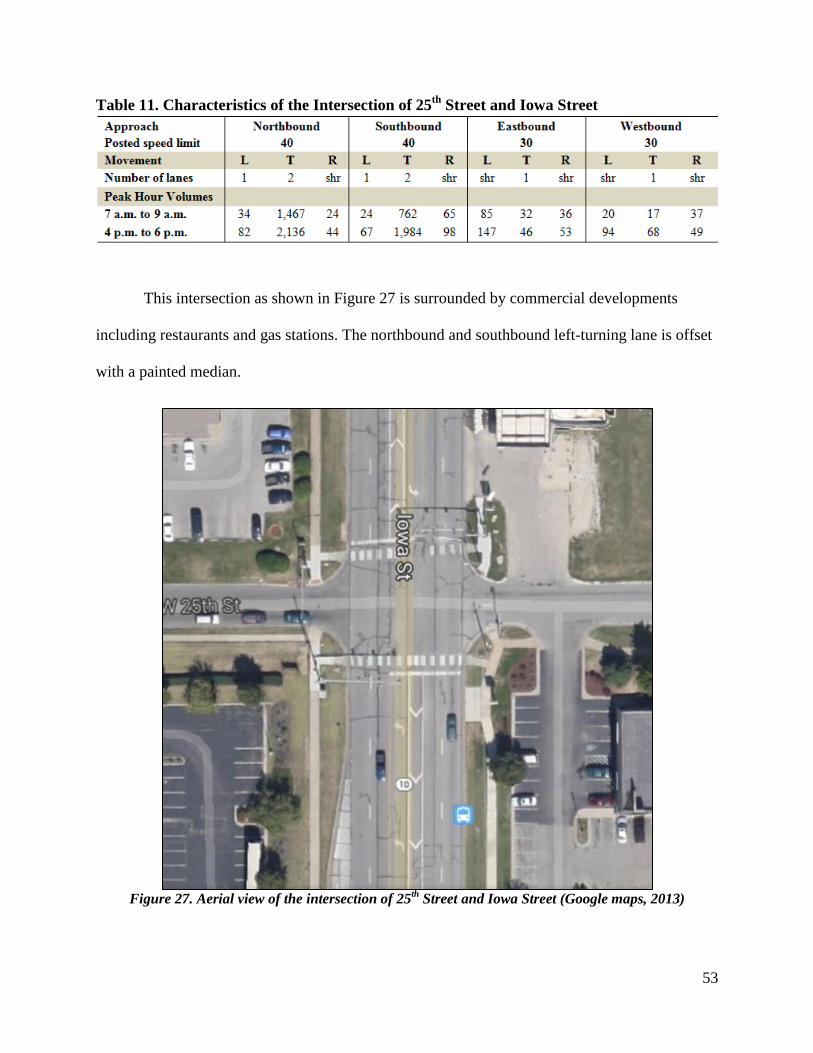
53
Table 11. Characteristics of the Intersection of 25th
Street and Iowa Street
This intersection as shown in Figure 27 is surrounded by commercial developments
including restaurants and gas stations. The northbound and southbound left-turning lane is offset
with a painted median.
Figure 27. Aerial view of the intersection of 25
th Street and Iowa Street (Google maps, 2013)
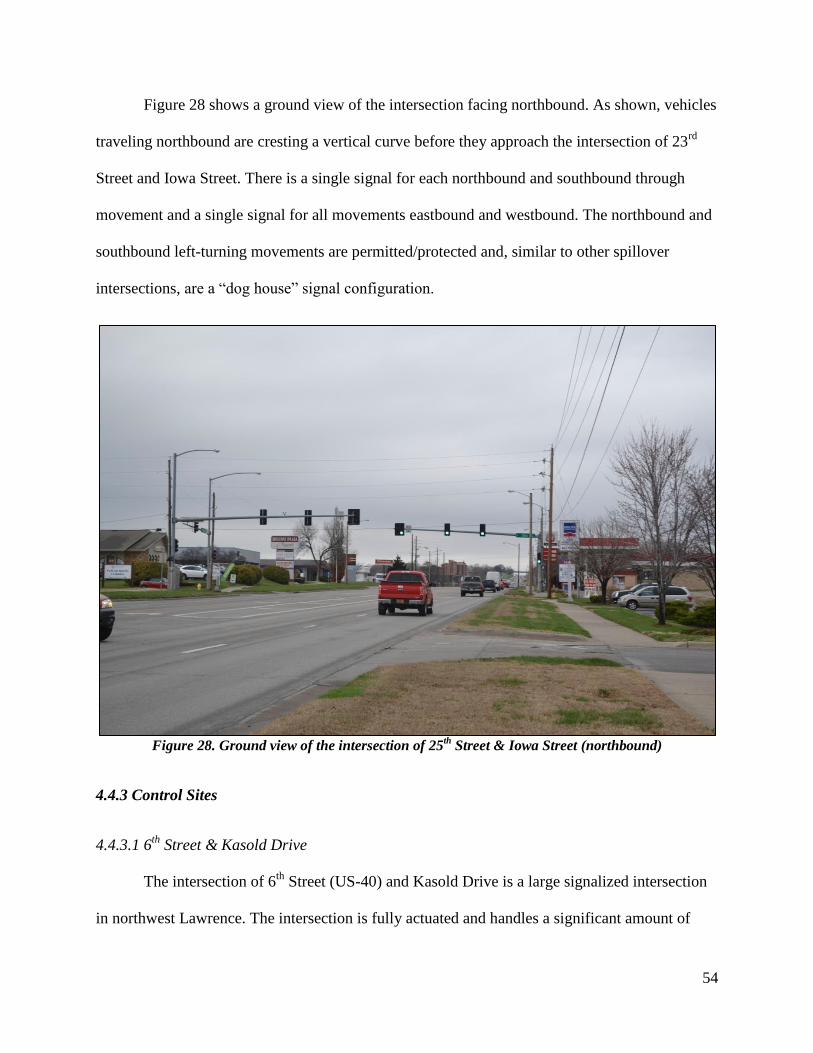
54
Figure 28 shows a ground view of the intersection facing northbound. As shown, vehicles
traveling northbound are cresting a vertical curve before they approach the intersection of 23rd
Street and Iowa Street. There is a single signal for each northbound and southbound through
movement and a single signal for all movements eastbound and westbound. The northbound and
southbound left-turning movements are permitted/protected and, similar to other spillover
intersections, are a “dog house” signal configuration.
Figure 28. Ground view of the intersection of 25
th Street & Iowa Street (northbound)
4.4.3 Control Sites
4.4.3.1 6th
Street & Kasold Drive
The intersection of 6th
Street (US-40) and Kasold Drive is a large signalized intersection
in northwest Lawrence. The intersection is fully actuated and handles a significant amount of
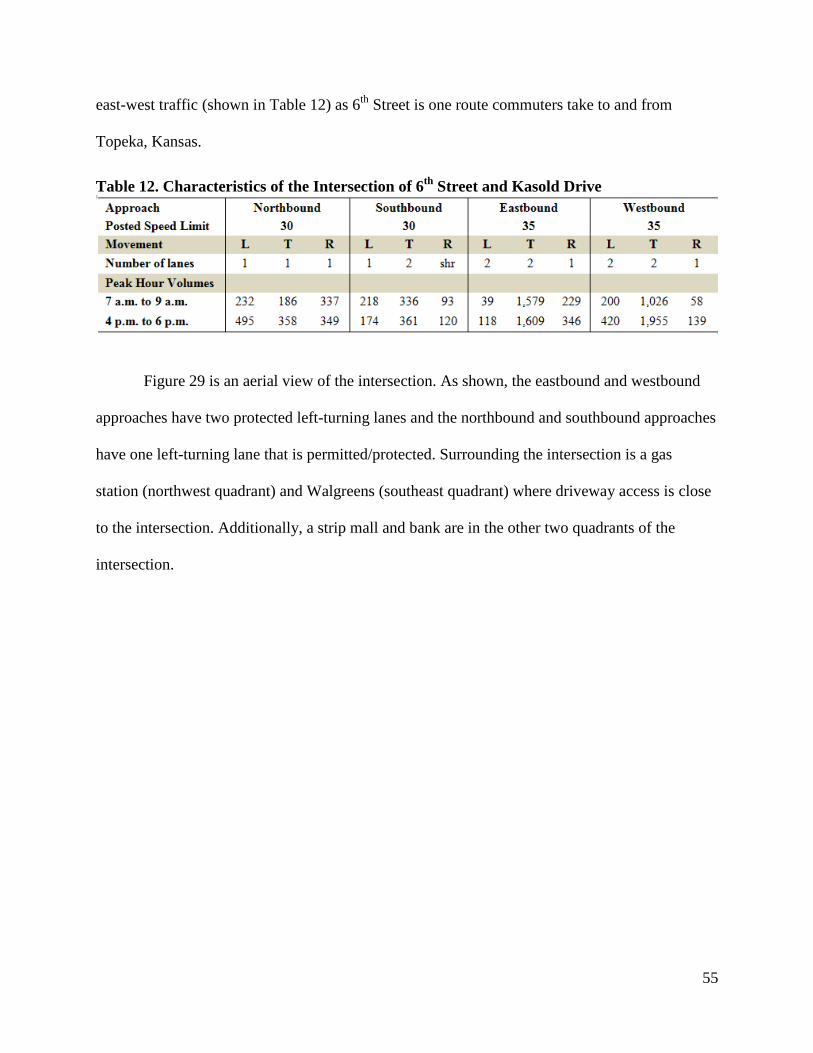
55
east-west traffic (shown in Table 12) as 6th
Street is one route commuters take to and from
Topeka, Kansas.
Table 12. Characteristics of the Intersection of 6th
Street and Kasold Drive
Figure 29 is an aerial view of the intersection. As shown, the eastbound and westbound
approaches have two protected left-turning lanes and the northbound and southbound approaches
have one left-turning lane that is permitted/protected. Surrounding the intersection is a gas
station (northwest quadrant) and Walgreens (southeast quadrant) where driveway access is close
to the intersection. Additionally, a strip mall and bank are in the other two quadrants of the
intersection.
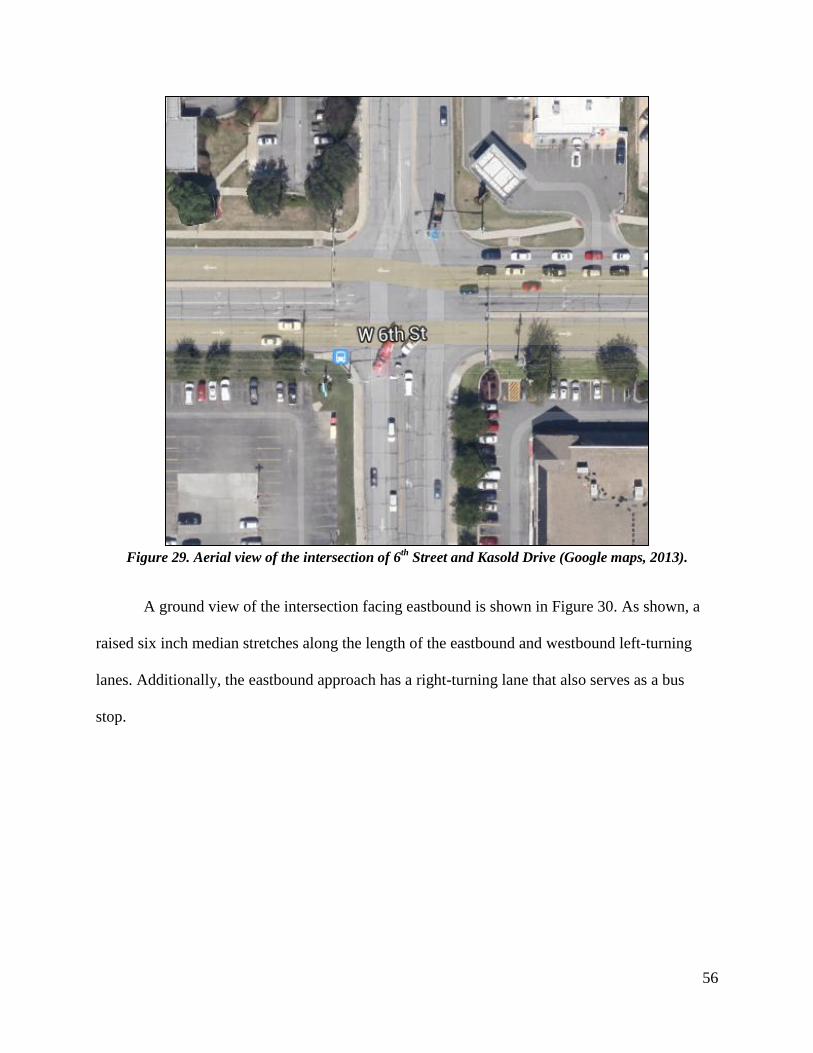
56
Figure 29. Aerial view of the intersection of 6
th Street and Kasold Drive (Google maps, 2013).
A ground view of the intersection facing eastbound is shown in Figure 30. As shown, a
raised six inch median stretches along the length of the eastbound and westbound left-turning
lanes. Additionally, the eastbound approach has a right-turning lane that also serves as a bus
stop.
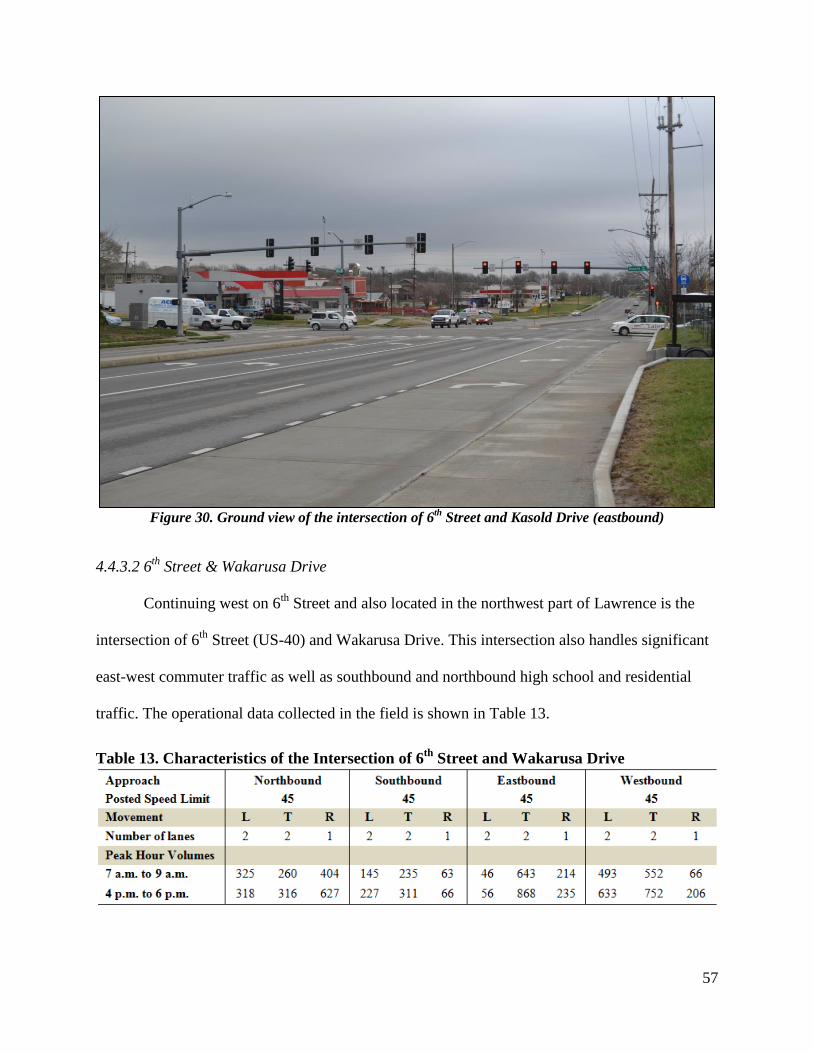
57
Figure 30. Ground view of the intersection of 6
th Street and Kasold Drive (eastbound)
4.4.3.2 6th
Street & Wakarusa Drive
Continuing west on 6th
Street and also located in the northwest part of Lawrence is the
intersection of 6th
Street (US-40) and Wakarusa Drive. This intersection also handles significant
east-west commuter traffic as well as southbound and northbound high school and residential
traffic. The operational data collected in the field is shown in Table 13.
Table 13. Characteristics of the Intersection of 6th
Street and Wakarusa Drive
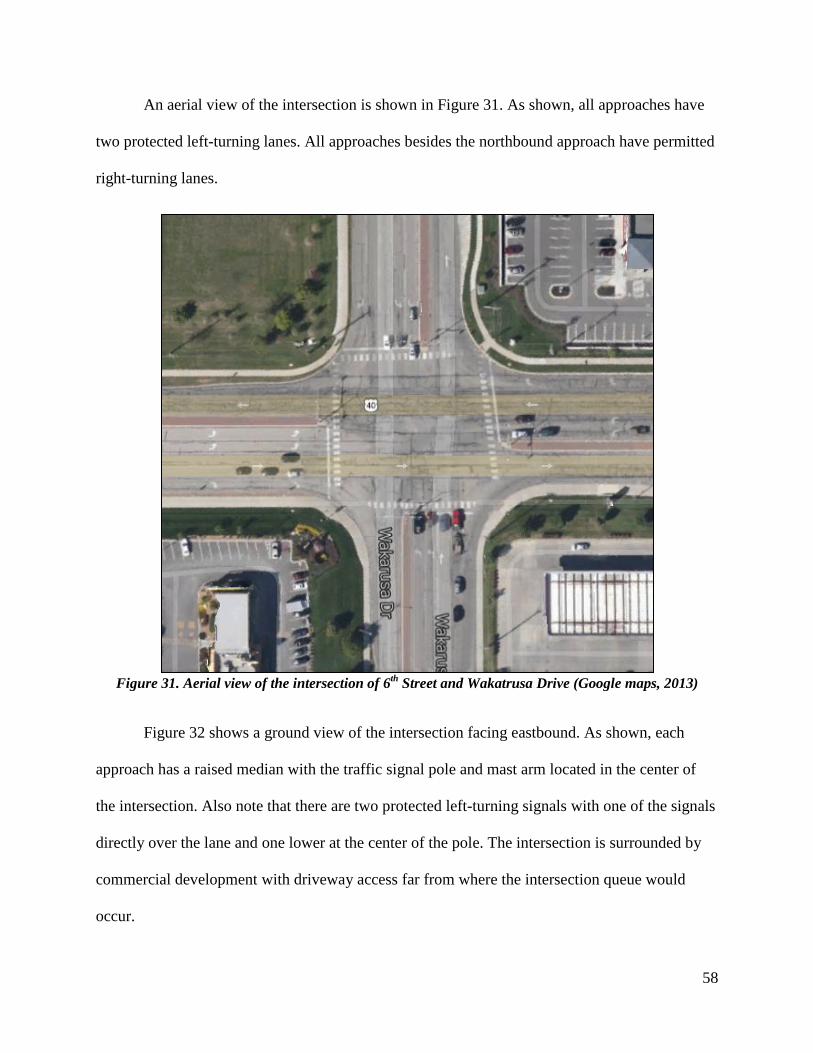
58
An aerial view of the intersection is shown in Figure 31. As shown, all approaches have
two protected left-turning lanes. All approaches besides the northbound approach have permitted
right-turning lanes.
Figure 31. Aerial view of the intersection of 6
th Street and Wakatrusa Drive (Google maps, 2013)
Figure 32 shows a ground view of the intersection facing eastbound. As shown, each
approach has a raised median with the traffic signal pole and mast arm located in the center of
the intersection. Also note that there are two protected left-turning signals with one of the signals
directly over the lane and one lower at the center of the pole. The intersection is surrounded by
commercial development with driveway access far from where the intersection queue would
occur.
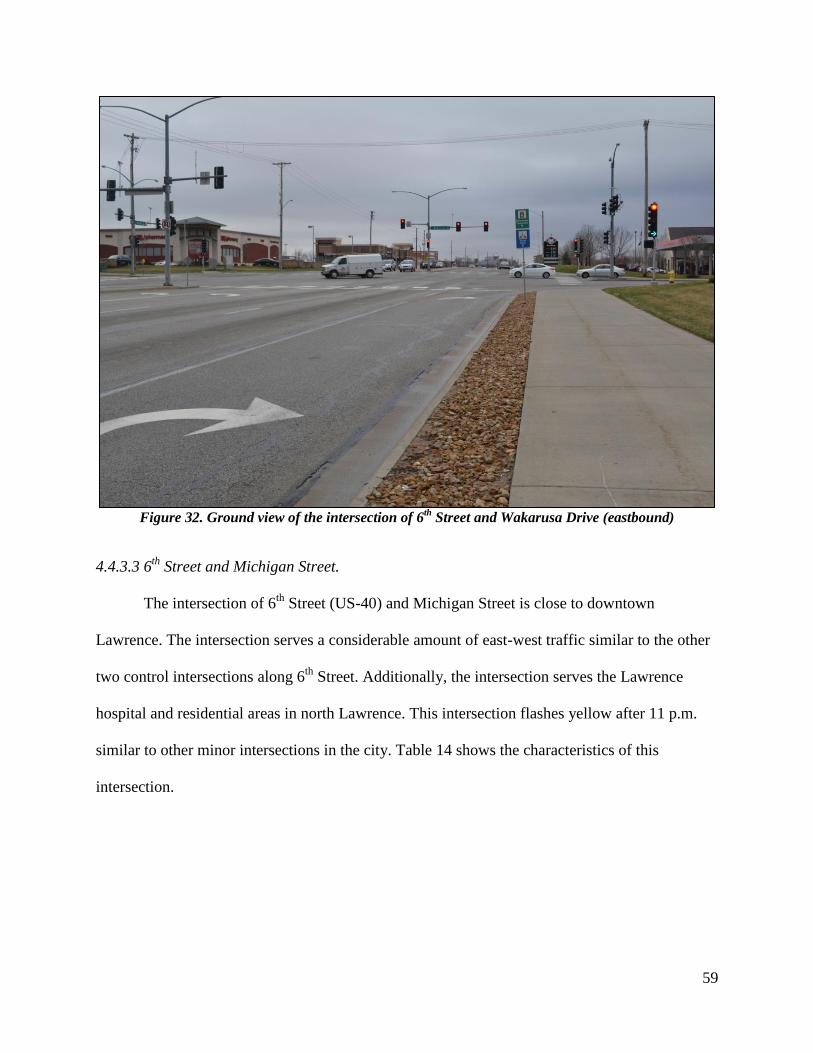
59
Figure 32. Ground view of the intersection of 6
th Street and Wakarusa Drive (eastbound)
4.4.3.3 6th
Street and Michigan Street.
The intersection of 6th
Street (US-40) and Michigan Street is close to downtown
Lawrence. The intersection serves a considerable amount of east-west traffic similar to the other
two control intersections along 6th
Street. Additionally, the intersection serves the Lawrence
hospital and residential areas in north Lawrence. This intersection flashes yellow after 11 p.m.
similar to other minor intersections in the city. Table 14 shows the characteristics of this
intersection.
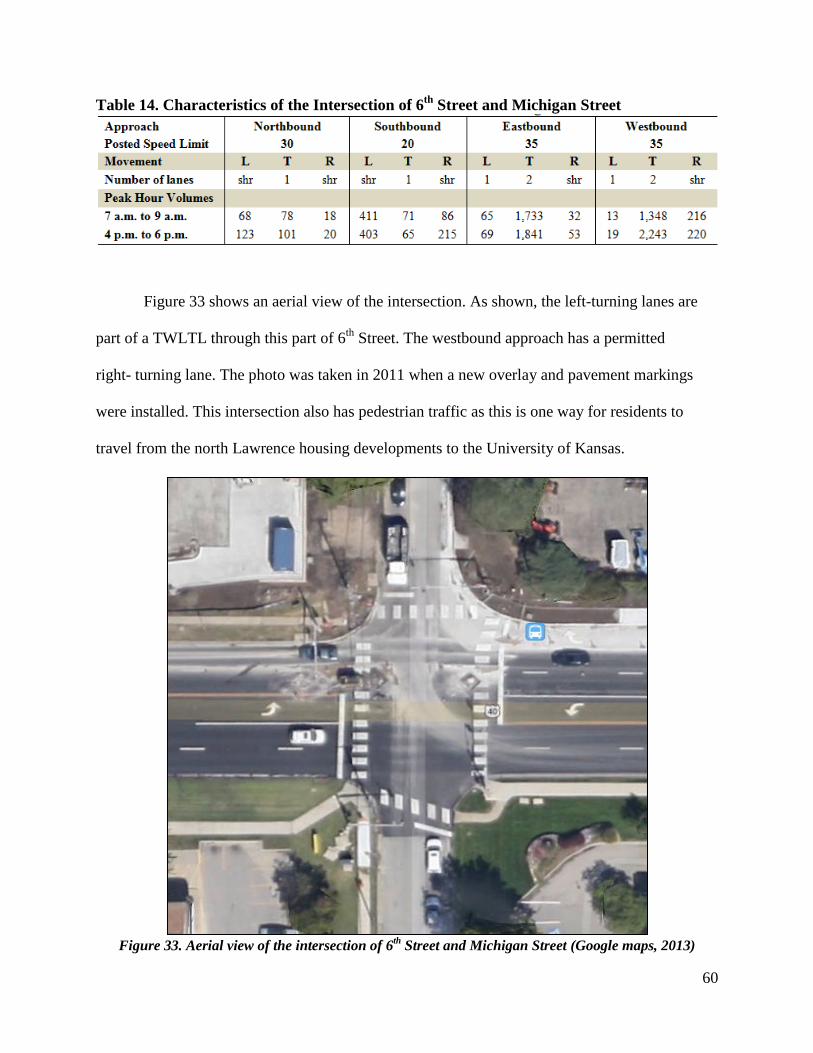
60
Table 14. Characteristics of the Intersection of 6th
Street and Michigan Street
Figure 33 shows an aerial view of the intersection. As shown, the left-turning lanes are
part of a TWLTL through this part of 6th
Street. The westbound approach has a permitted
right- turning lane. The photo was taken in 2011 when a new overlay and pavement markings
were installed. This intersection also has pedestrian traffic as this is one way for residents to
travel from the north Lawrence housing developments to the University of Kansas.
Figure 33. Aerial view of the intersection of 6
th Street and Michigan Street (Google maps, 2013)
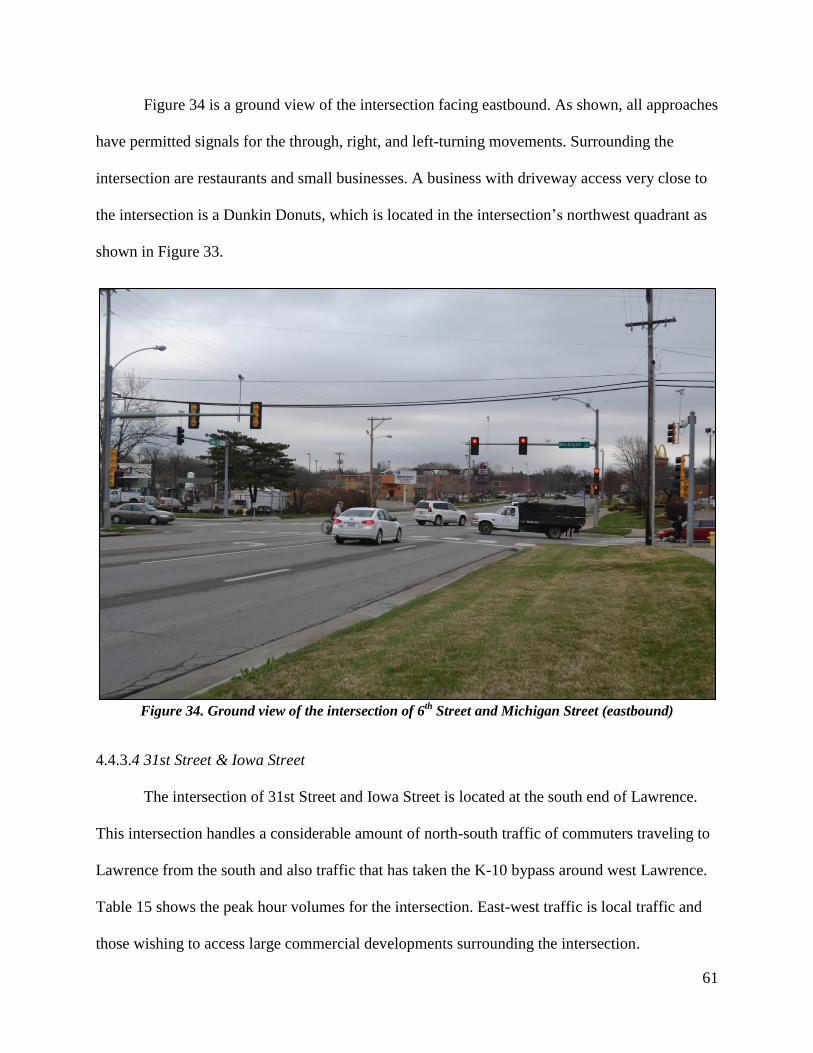
61
Figure 34 is a ground view of the intersection facing eastbound. As shown, all approaches
have permitted signals for the through, right, and left-turning movements. Surrounding the
intersection are restaurants and small businesses. A business with driveway access very close to
the intersection is a Dunkin Donuts, which is located in the intersection’s northwest quadrant as
shown in Figure 33.
Figure 34. Ground view of the intersection of 6
th Street and Michigan Street (eastbound)
4.4.3.4 31st Street & Iowa Street
The intersection of 31st Street and Iowa Street is located at the south end of Lawrence.
This intersection handles a considerable amount of north-south traffic of commuters traveling to
Lawrence from the south and also traffic that has taken the K-10 bypass around west Lawrence.
Table 15 shows the peak hour volumes for the intersection. East-west traffic is local traffic and
those wishing to access large commercial developments surrounding the intersection.
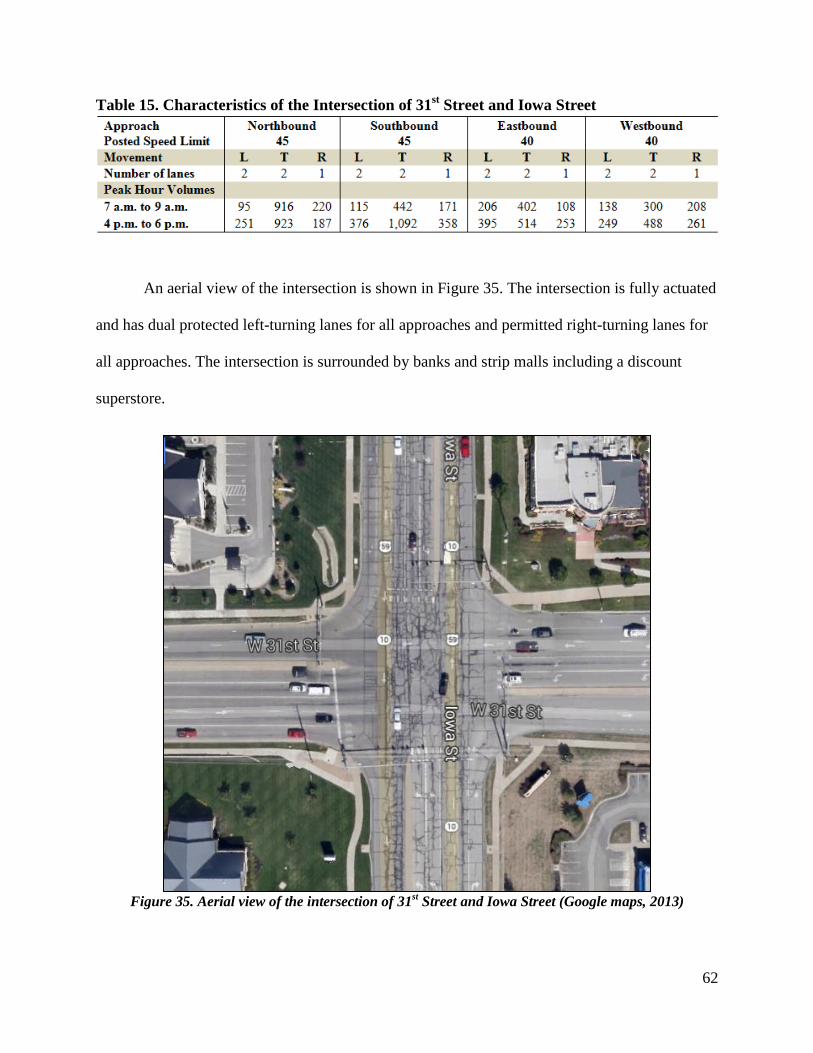
62
Table 15. Characteristics of the Intersection of 31st Street and Iowa Street
An aerial view of the intersection is shown in Figure 35. The intersection is fully actuated
and has dual protected left-turning lanes for all approaches and permitted right-turning lanes for
all approaches. The intersection is surrounded by banks and strip malls including a discount
superstore.
Figure 35. Aerial view of the intersection of 31
st Street and Iowa Street (Google maps, 2013)
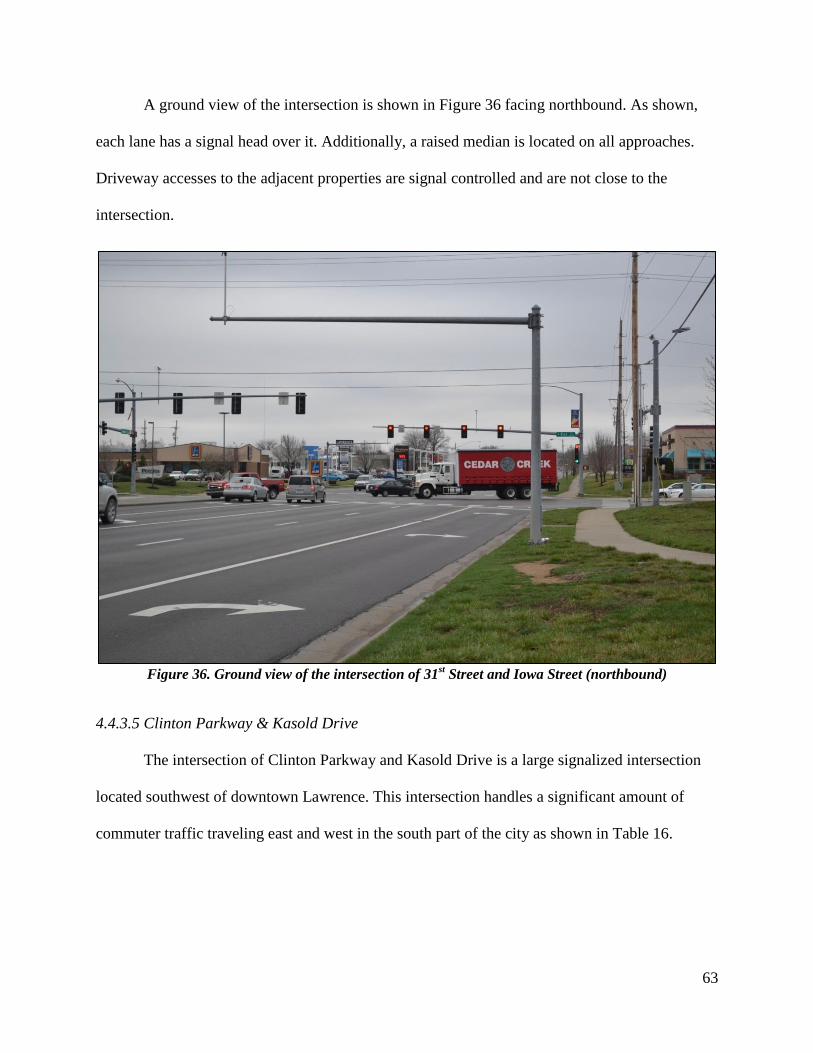
63
A ground view of the intersection is shown in Figure 36 facing northbound. As shown,
each lane has a signal head over it. Additionally, a raised median is located on all approaches.
Driveway accesses to the adjacent properties are signal controlled and are not close to the
intersection.
Figure 36. Ground view of the intersection of 31
st Street and Iowa Street (northbound)
4.4.3.5 Clinton Parkway & Kasold Drive
The intersection of Clinton Parkway and Kasold Drive is a large signalized intersection
located southwest of downtown Lawrence. This intersection handles a significant amount of
commuter traffic traveling east and west in the south part of the city as shown in Table 16.
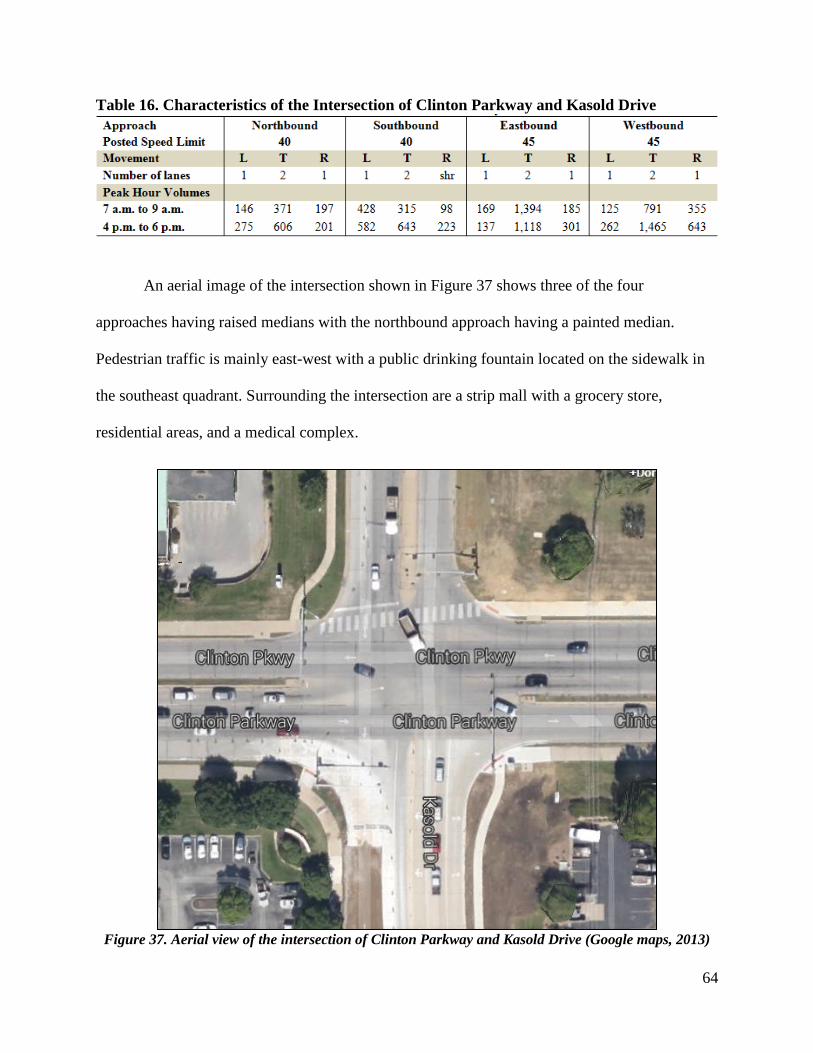
64
Table 16. Characteristics of the Intersection of Clinton Parkway and Kasold Drive
An aerial image of the intersection shown in Figure 37 shows three of the four
approaches having raised medians with the northbound approach having a painted median.
Pedestrian traffic is mainly east-west with a public drinking fountain located on the sidewalk in
the southeast quadrant. Surrounding the intersection are a strip mall with a grocery store,
residential areas, and a medical complex.
Figure 37. Aerial view of the intersection of Clinton Parkway and Kasold Drive (Google maps, 2013)
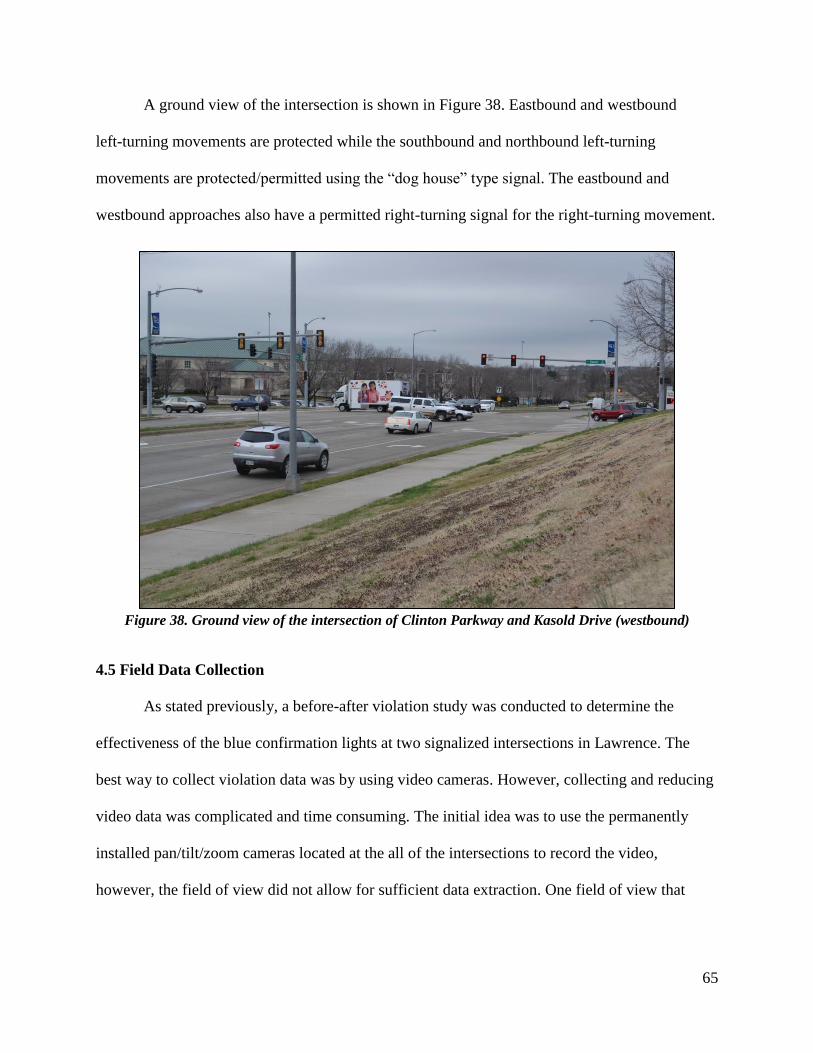
65
A ground view of the intersection is shown in Figure 38. Eastbound and westbound
left-turning movements are protected while the southbound and northbound left-turning
movements are protected/permitted using the “dog house” type signal. The eastbound and
westbound approaches also have a permitted right-turning signal for the right-turning movement.
Figure 38. Ground view of the intersection of Clinton Parkway and Kasold Drive (westbound)
4.5 Field Data Collection
As stated previously, a before-after violation study was conducted to determine the
effectiveness of the blue confirmation lights at two signalized intersections in Lawrence. The
best way to collect violation data was by using video cameras. However, collecting and reducing
video data was complicated and time consuming. The initial idea was to use the permanently
installed pan/tilt/zoom cameras located at the all of the intersections to record the video,
however, the field of view did not allow for sufficient data extraction. One field of view that
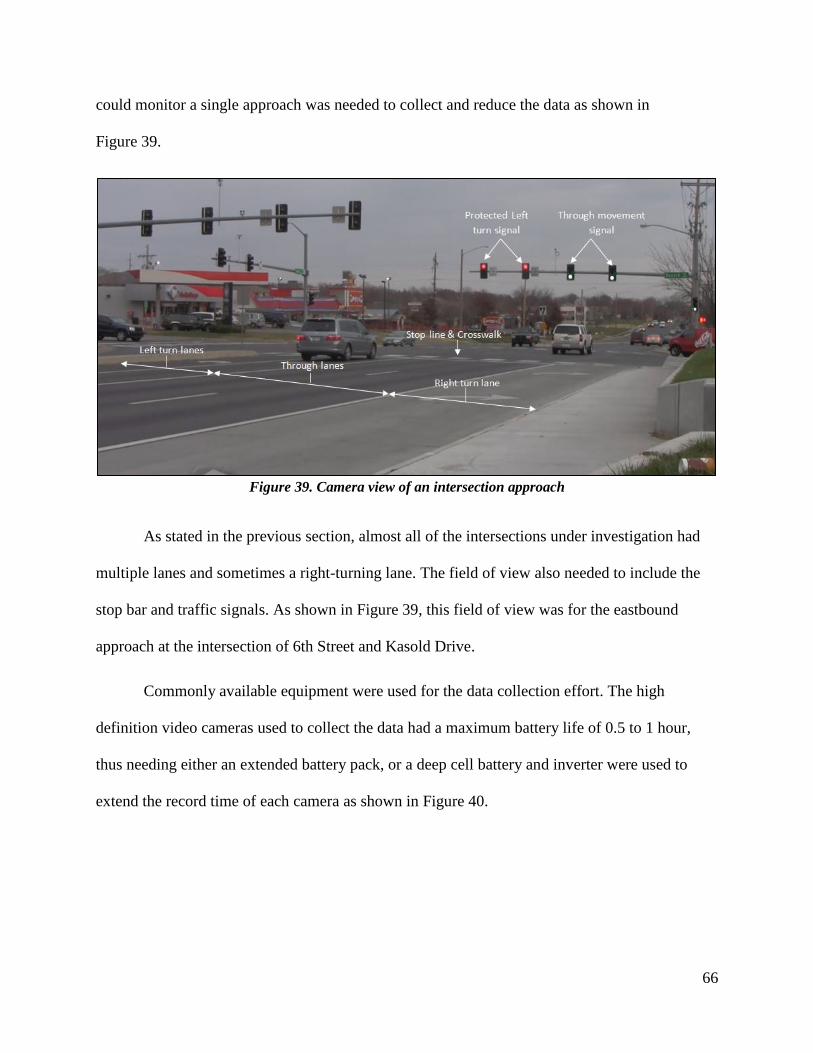
66
could monitor a single approach was needed to collect and reduce the data as shown in
Figure 39.
Figure 39. Camera view of an intersection approach
As stated in the previous section, almost all of the intersections under investigation had
multiple lanes and sometimes a right-turning lane. The field of view also needed to include the
stop bar and traffic signals. As shown in Figure 39, this field of view was for the eastbound
approach at the intersection of 6th Street and Kasold Drive.
Commonly available equipment were used for the data collection effort. The high
definition video cameras used to collect the data had a maximum battery life of 0.5 to 1 hour,
thus needing either an extended battery pack, or a deep cell battery and inverter were used to
extend the record time of each camera as shown in Figure 40.
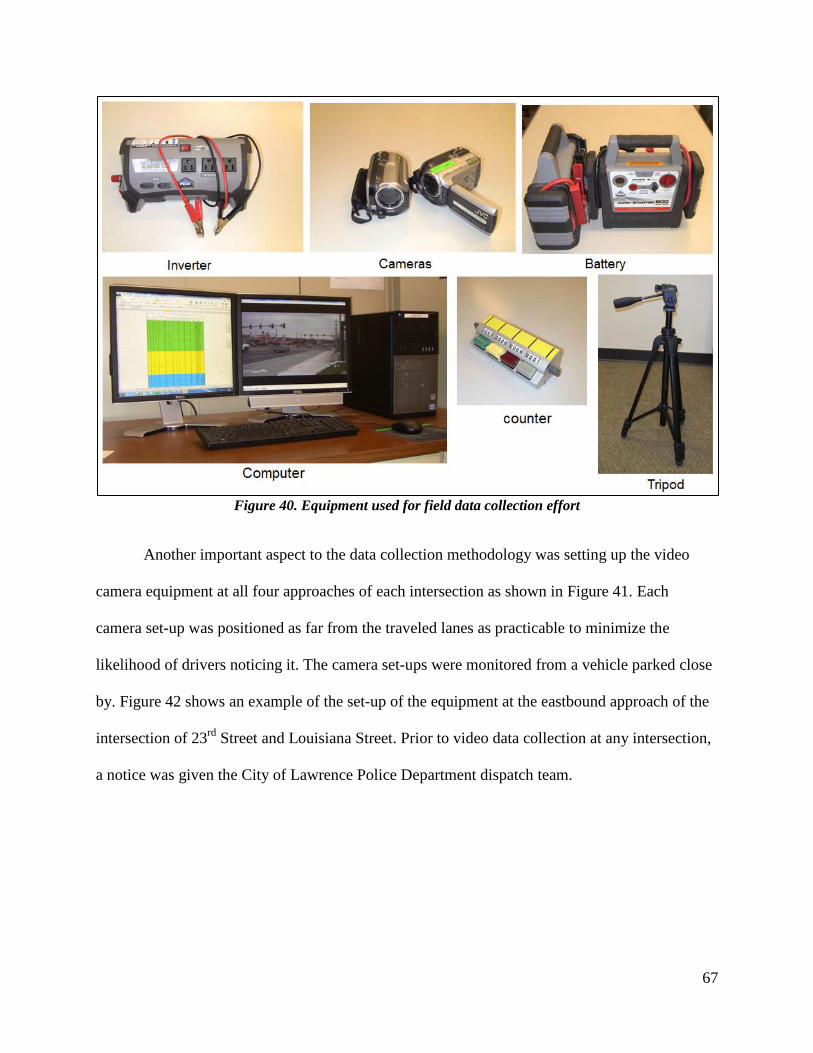
67
Figure 40. Equipment used for field data collection effort
Another important aspect to the data collection methodology was setting up the video
camera equipment at all four approaches of each intersection as shown in Figure 41. Each
camera set-up was positioned as far from the traveled lanes as practicable to minimize the
likelihood of drivers noticing it. The camera set-ups were monitored from a vehicle parked close
by. Figure 42 shows an example of the set-up of the equipment at the eastbound approach of the
intersection of 23rd
Street and Louisiana Street. Prior to video data collection at any intersection,
a notice was given the City of Lawrence Police Department dispatch team.
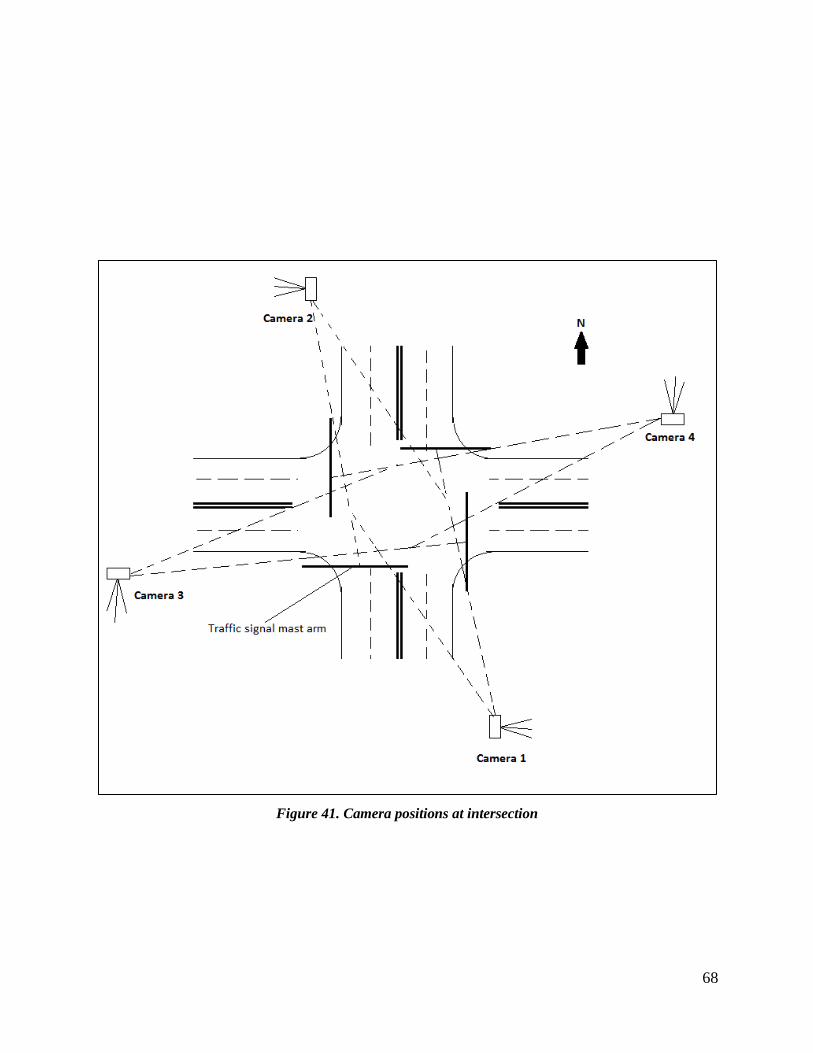
68
Figure 41. Camera positions at intersection
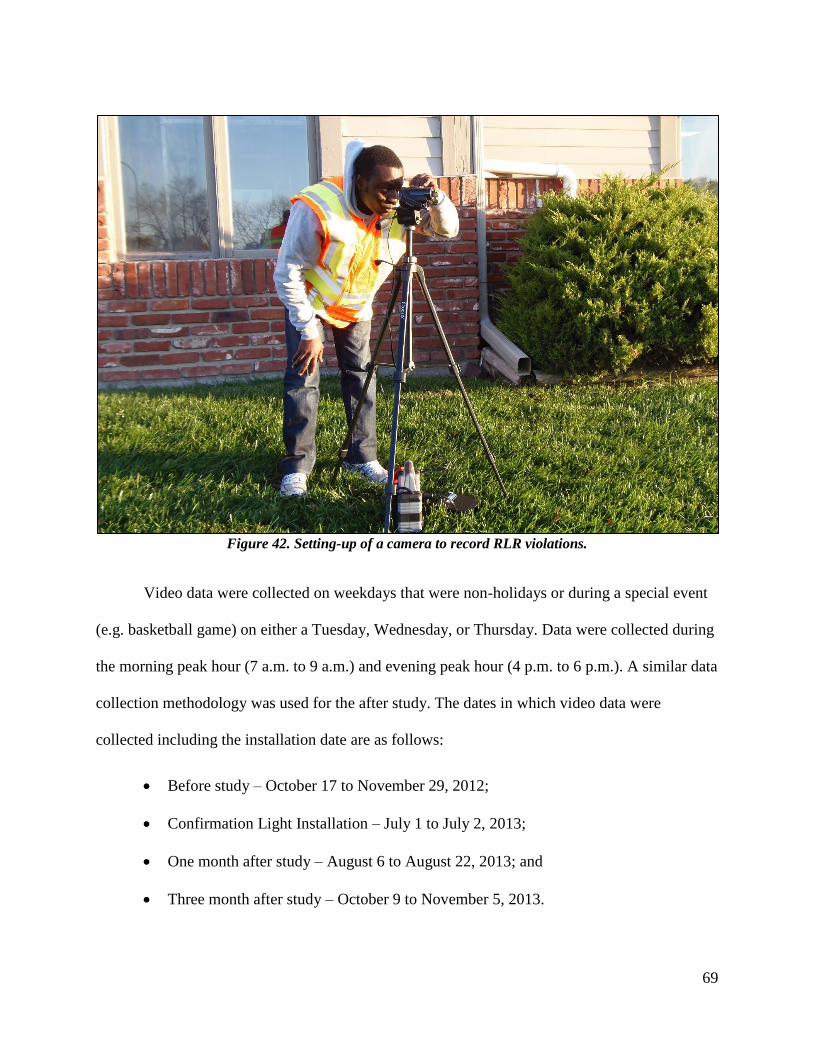
69
Figure 42. Setting-up of a camera to record RLR violations.
Video data were collected on weekdays that were non-holidays or during a special event
(e.g. basketball game) on either a Tuesday, Wednesday, or Thursday. Data were collected during
the morning peak hour (7 a.m. to 9 a.m.) and evening peak hour (4 p.m. to 6 p.m.). A similar data
collection methodology was used for the after study. The dates in which video data were
collected including the installation date are as follows:
Before study – October 17 to November 29, 2012;
Confirmation Light Installation – July 1 to July 2, 2013;
One month after study – August 6 to August 22, 2013; and
Three month after study – October 9 to November 5, 2013.
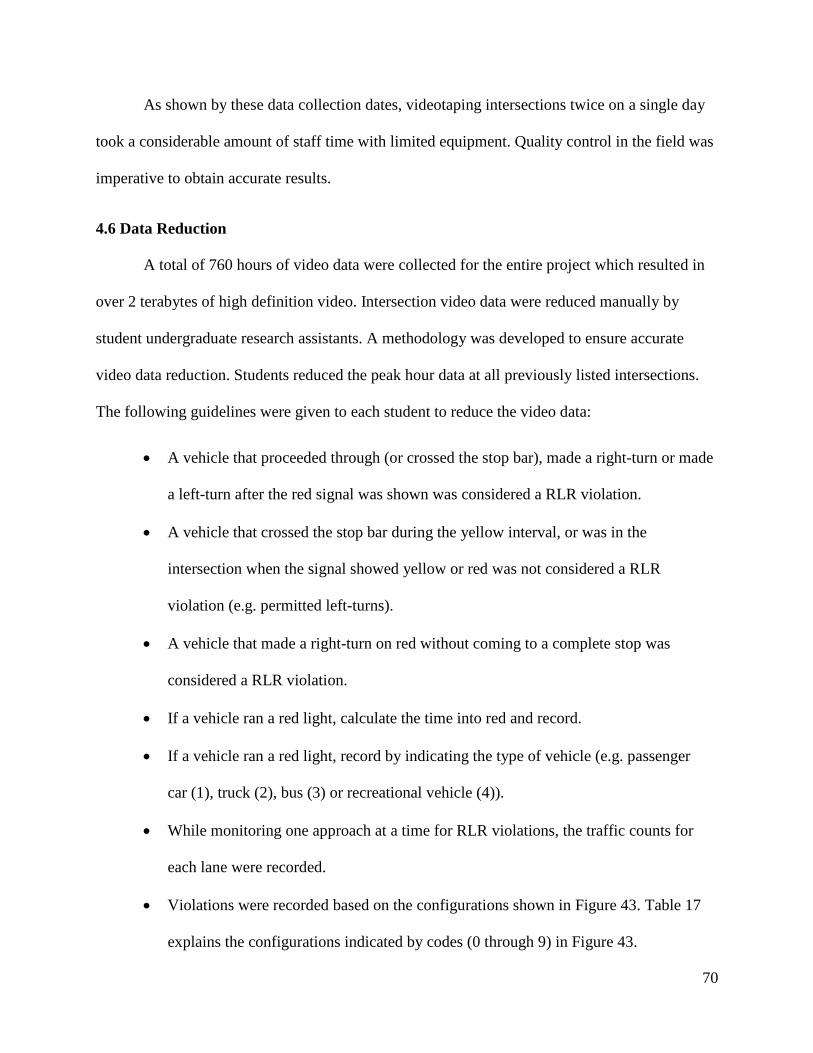
70
As shown by these data collection dates, videotaping intersections twice on a single day
took a considerable amount of staff time with limited equipment. Quality control in the field was
imperative to obtain accurate results.
4.6 Data Reduction
A total of 760 hours of video data were collected for the entire project which resulted in
over 2 terabytes of high definition video. Intersection video data were reduced manually by
student undergraduate research assistants. A methodology was developed to ensure accurate
video data reduction. Students reduced the peak hour data at all previously listed intersections.
The following guidelines were given to each student to reduce the video data:
A vehicle that proceeded through (or crossed the stop bar), made a right-turn or made
a left-turn after the red signal was shown was considered a RLR violation.
A vehicle that crossed the stop bar during the yellow interval, or was in the
intersection when the signal showed yellow or red was not considered a RLR
violation (e.g. permitted left-turns).
A vehicle that made a right-turn on red without coming to a complete stop was
considered a RLR violation.
If a vehicle ran a red light, calculate the time into red and record.
If a vehicle ran a red light, record by indicating the type of vehicle (e.g. passenger
car (1), truck (2), bus (3) or recreational vehicle (4)).
While monitoring one approach at a time for RLR violations, the traffic counts for
each lane were recorded.
Violations were recorded based on the configurations shown in Figure 43. Table 17
explains the configurations indicated by codes (0 through 9) in Figure 43.
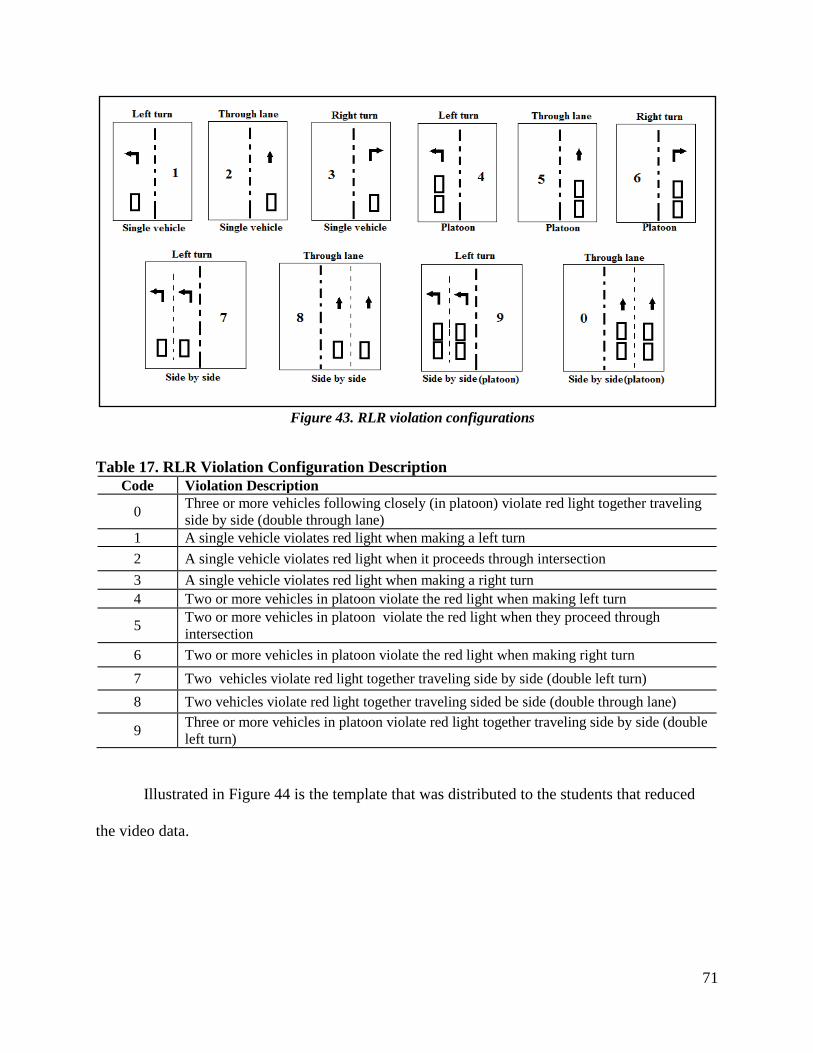
71
Figure 43. RLR violation configurations
Table 17. RLR Violation Configuration Description
Code Violation Description
0 Three or more vehicles following closely (in platoon) violate red light together traveling
side by side (double through lane)
1 A single vehicle violates red light when making a left turn
2 A single vehicle violates red light when it proceeds through intersection
3 A single vehicle violates red light when making a right turn
4 Two or more vehicles in platoon violate the red light when making left turn
5 Two or more vehicles in platoon violate the red light when they proceed through
intersection
6 Two or more vehicles in platoon violate the red light when making right turn
7 Two vehicles violate red light together traveling side by side (double left turn)
8 Two vehicles violate red light together traveling sided be side (double through lane)
9 Three or more vehicles in platoon violate red light together traveling side by side (double
left turn)
Illustrated in Figure 44 is the template that was distributed to the students that reduced
the video data.
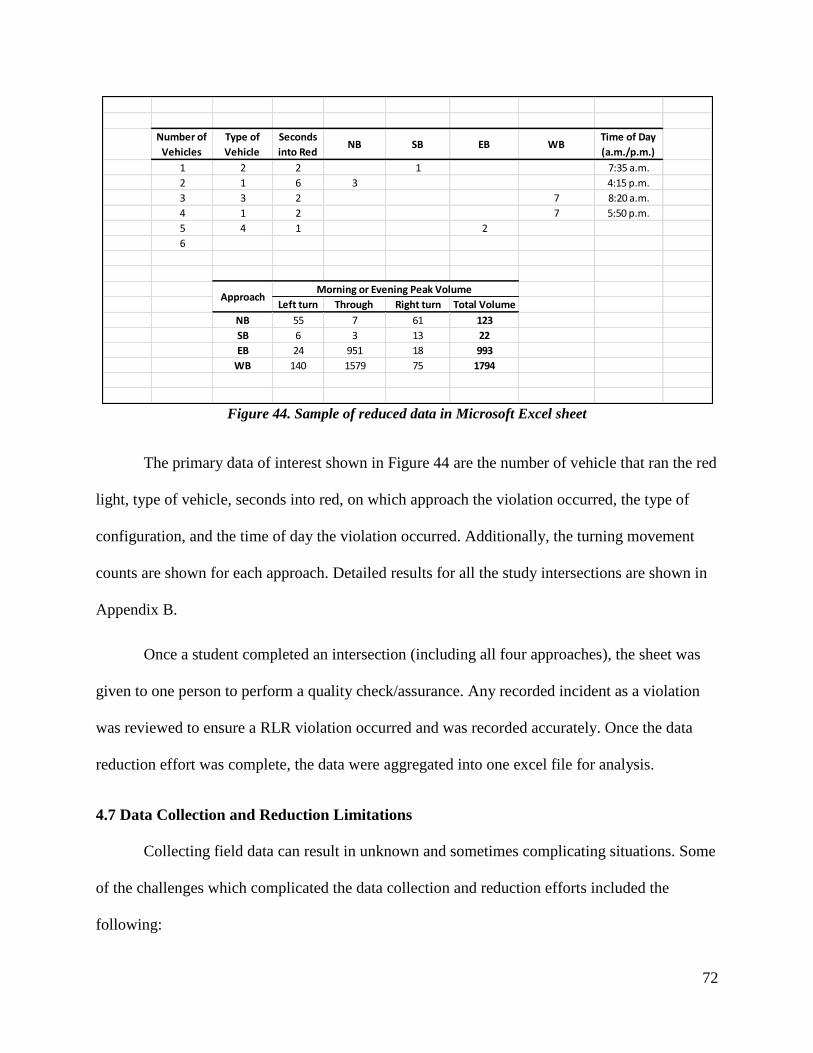
72
Figure 44. Sample of reduced data in Microsoft Excel sheet
The primary data of interest shown in Figure 44 are the number of vehicle that ran the red
light, type of vehicle, seconds into red, on which approach the violation occurred, the type of
configuration, and the time of day the violation occurred. Additionally, the turning movement
counts are shown for each approach. Detailed results for all the study intersections are shown in
Appendix B.
Once a student completed an intersection (including all four approaches), the sheet was
given to one person to perform a quality check/assurance. Any recorded incident as a violation
was reviewed to ensure a RLR violation occurred and was recorded accurately. Once the data
reduction effort was complete, the data were aggregated into one excel file for analysis.
4.7 Data Collection and Reduction Limitations
Collecting field data can result in unknown and sometimes complicating situations. Some
of the challenges which complicated the data collection and reduction efforts included the
following:
Number of
Vehicles
Type of
Vehicle
Seconds
into RedNB SB EB WB
Time of Day
(a.m./p.m.)
1 2 2 1 7:35 a.m.
2 1 6 3 4:15 p.m.
3 3 2 7 8:20 a.m.
4 1 2 7 5:50 p.m.
5 4 1 2
6
Left turn Through Right turn Total Volume
NB 55 7 61 123
SB 6 3 13 22
EB 24 951 18 993
WB 140 1579 75 1794
Morning or Evening Peak Volume Approach
73
A RLR crash was observed at one of the treatment sites (23rd
Street and Iowa Street)
during the 3 months after data collection during the morning peak hour. Prior to this
crash, video data were only collected for an hour. Due to the intersection being shut
down temporarily by the Lawrence Police Department, video data were recollected on
a different week day.
At the intersection of 6th Street and Kasold Drive, the video camera monitoring the
eastbound approach was stolen. The data stored on the camera were lost and data
were collected at the intersection the following day.
After 45 minutes of data collection at the intersection of 23rd Street and Louisiana
Street during the 3 months period, a contractor entered the intersection to setup a
temporary work zone, delaying the data collection effort for another weekday.
During the data collection effort, Kansas weather brought rain, wind, sleet, and snow.
In those circumstances, the set-ups were either shut down early, or readjusted (e.g.
using plastic bags to cover cameras or chain the set-ups tied down).
Since the research project utilized commonly available video recording and power
source equipment, limitations on equipment reliability was an issue during some
recording sessions. This included malfunctioning batteries, inverters, or cameras.
Identified equipment failure was noted either in the field or during the data reduction
process and data recollection occurred as quickly as possible.
At many locations, pedestrian’s passing by the camera setups began to tamper with
the units. Once they see someone monitoring the set-ups, they left the area. Camera
equipment was checked immediately every time this happened.
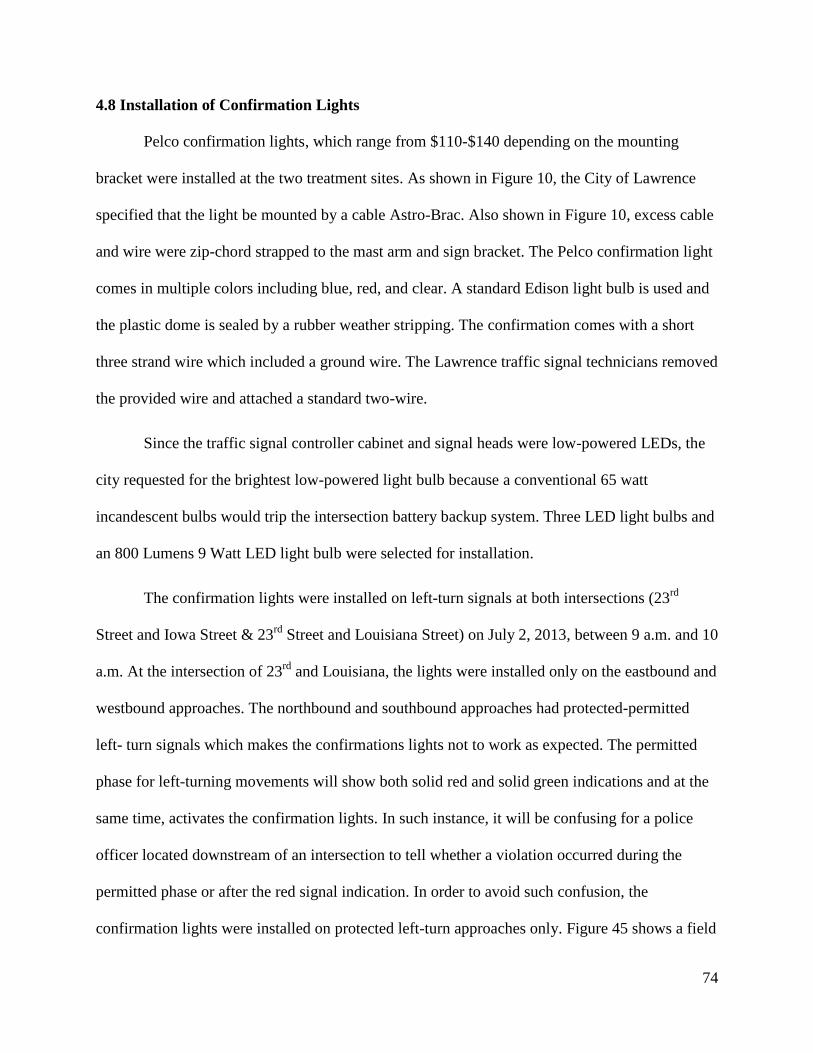
74
4.8 Installation of Confirmation Lights
Pelco confirmation lights, which range from $110-$140 depending on the mounting
bracket were installed at the two treatment sites. As shown in Figure 10, the City of Lawrence
specified that the light be mounted by a cable Astro-Brac. Also shown in Figure 10, excess cable
and wire were zip-chord strapped to the mast arm and sign bracket. The Pelco confirmation light
comes in multiple colors including blue, red, and clear. A standard Edison light bulb is used and
the plastic dome is sealed by a rubber weather stripping. The confirmation comes with a short
three strand wire which included a ground wire. The Lawrence traffic signal technicians removed
the provided wire and attached a standard two-wire.
Since the traffic signal controller cabinet and signal heads were low-powered LEDs, the
city requested for the brightest low-powered light bulb because a conventional 65 watt
incandescent bulbs would trip the intersection battery backup system. Three LED light bulbs and
an 800 Lumens 9 Watt LED light bulb were selected for installation.
The confirmation lights were installed on left-turn signals at both intersections (23rd
Street and Iowa Street & 23rd
Street and Louisiana Street) on July 2, 2013, between 9 a.m. and 10
a.m. At the intersection of 23rd
and Louisiana, the lights were installed only on the eastbound and
westbound approaches. The northbound and southbound approaches had protected-permitted
left- turn signals which makes the confirmations lights not to work as expected. The permitted
phase for left-turning movements will show both solid red and solid green indications and at the
same time, activates the confirmation lights. In such instance, it will be confusing for a police
officer located downstream of an intersection to tell whether a violation occurred during the
permitted phase or after the red signal indication. In order to avoid such confusion, the
confirmation lights were installed on protected left-turn approaches only. Figure 45 shows a field
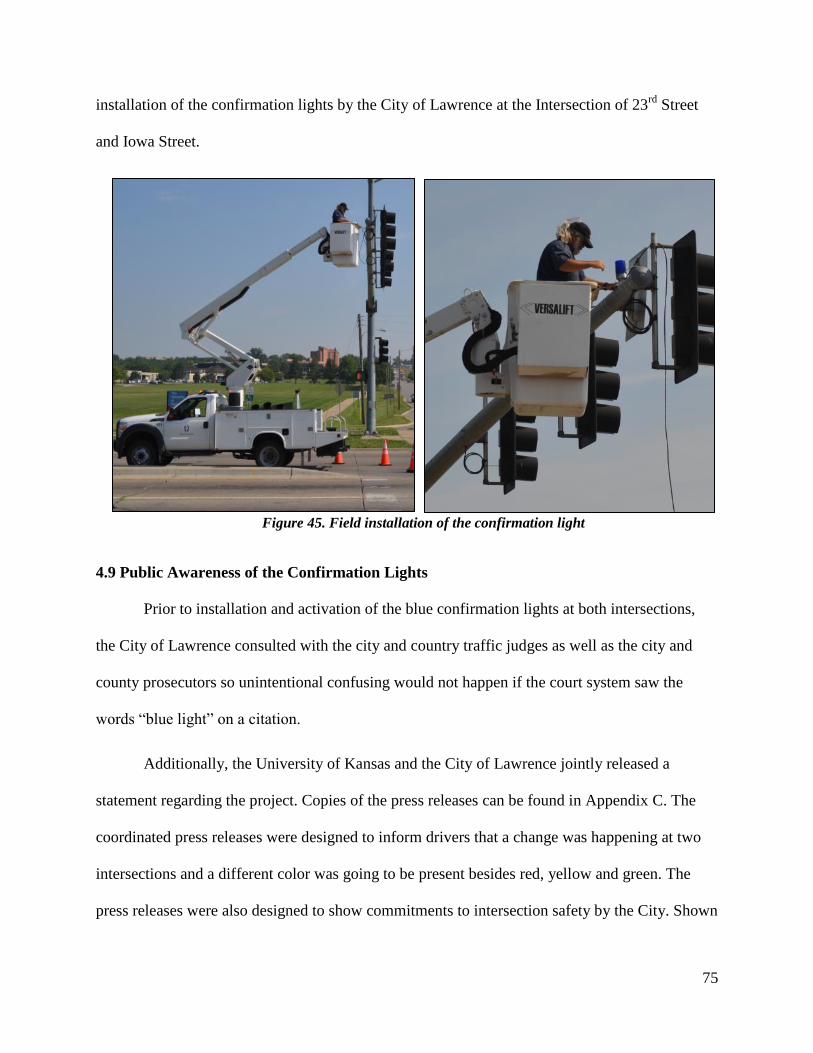
75
installation of the confirmation lights by the City of Lawrence at the Intersection of 23rd
Street
and Iowa Street.
Figure 45. Field installation of the confirmation light
4.9 Public Awareness of the Confirmation Lights
Prior to installation and activation of the blue confirmation lights at both intersections,
the City of Lawrence consulted with the city and country traffic judges as well as the city and
county prosecutors so unintentional confusing would not happen if the court system saw the
words “blue light” on a citation.
Additionally, the University of Kansas and the City of Lawrence jointly released a
statement regarding the project. Copies of the press releases can be found in Appendix C. The
coordinated press releases were designed to inform drivers that a change was happening at two
intersections and a different color was going to be present besides red, yellow and green. The
press releases were also designed to show commitments to intersection safety by the City. Shown
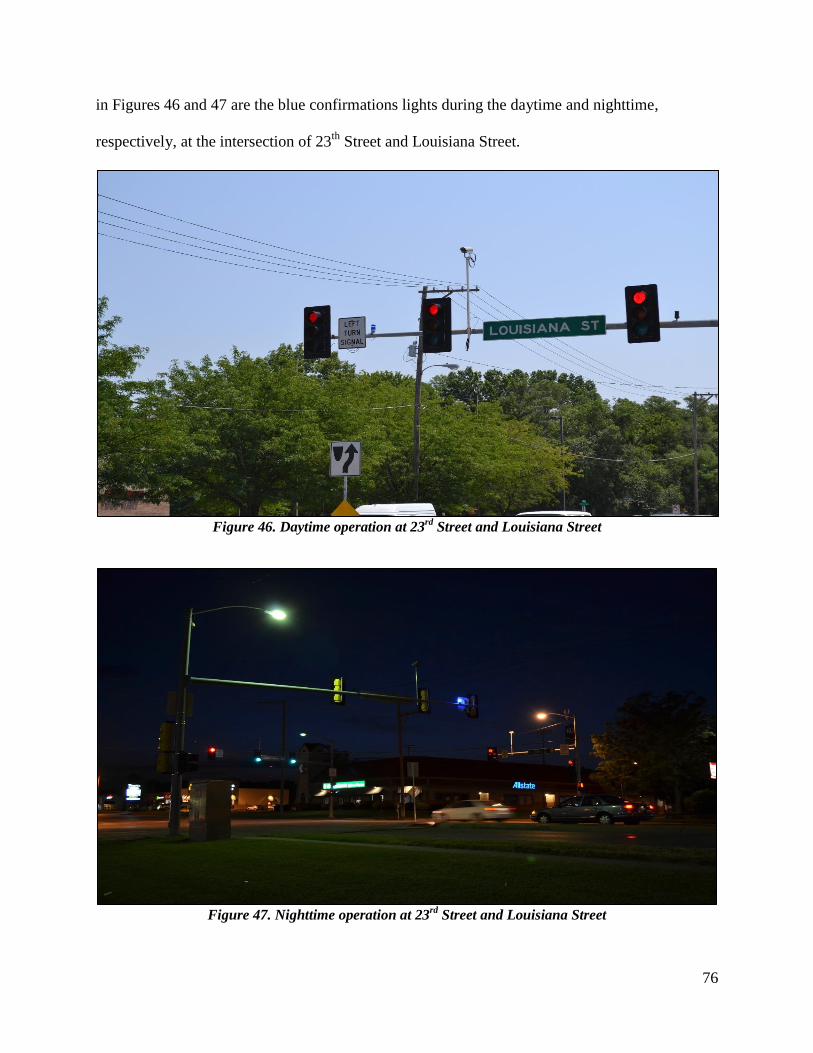
76
in Figures 46 and 47 are the blue confirmations lights during the daytime and nighttime,
respectively, at the intersection of 23th
Street and Louisiana Street.
Figure 46. Daytime operation at 23
rd Street and Louisiana Street
Figure 47. Nighttime operation at 23
rd Street and Louisiana Street
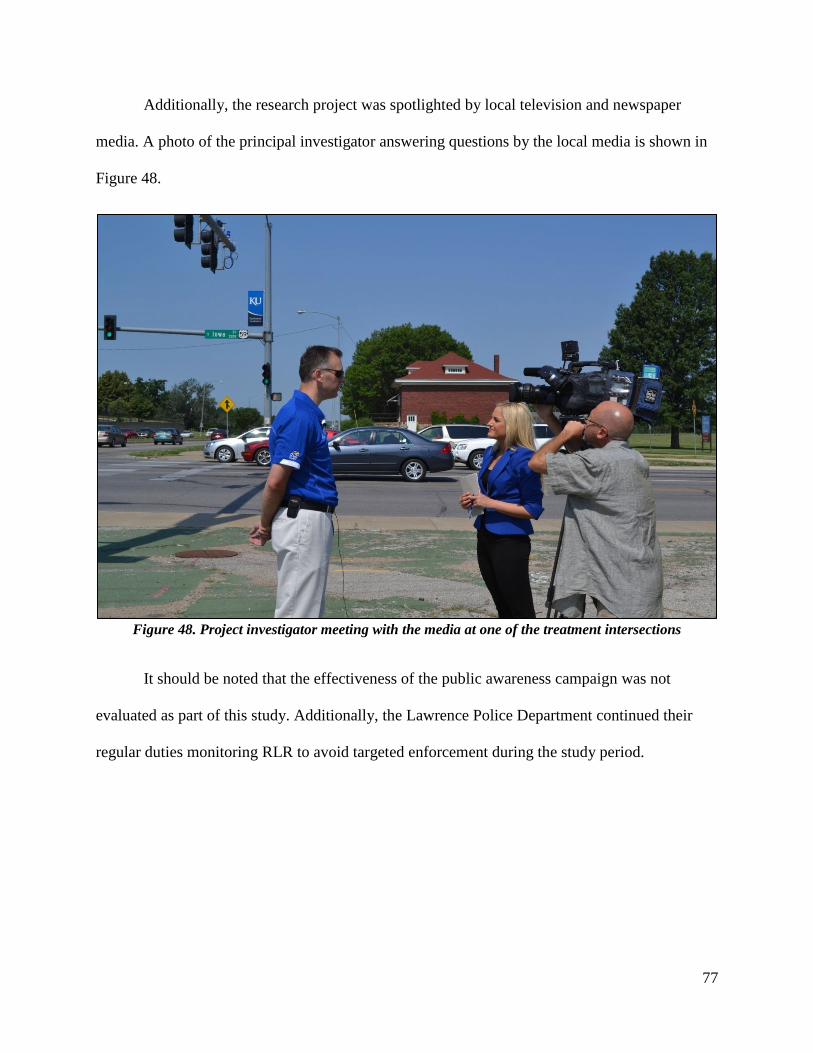
77
Additionally, the research project was spotlighted by local television and newspaper
media. A photo of the principal investigator answering questions by the local media is shown in
Figure 48.
Figure 48. Project investigator meeting with the media at one of the treatment intersections
It should be noted that the effectiveness of the public awareness campaign was not
evaluated as part of this study. Additionally, the Lawrence Police Department continued their
regular duties monitoring RLR to avoid targeted enforcement during the study period.
78
CHAPTER 5: RESULTS
This chapter presents the descriptive statistics of all the before and after RLR violation
data collected at the 13 study intersections. Variables including: RLR violation rates by
intersection lane, time of the day when RLR violations occurred, time into red, the vehicle types
involved in RLR violations, and the RLR violations by configuration type, are presented in this
chapter.
5.1. RLR Violation Rates by Intersection Lane
5.1.1 Background
The severity of RLR crashes depends on typical signalized intersection crash types such
as right-angle, rear end, left turn and/or sideswipe. Right-angle crashes have more serious safety
implications than other crash types. Since signalized intersection crash type largely depends on
vehicle movement at a signalized intersection, the violation rates by lane were investigated to
determine how serious RLR violations are for each of the three possible movements: left turn,
right turn, and through.
5.1.2 Methodology
Data were reduced as described in Chapter 4. RLR violations were expressed as a rate
(violations per 10,000 entering vehicles) by using Equation 3.
Eq. 3
Where: Ni = total number of violations (N) observed during the study period i
Vi = total number of entering vehicles (V) during the study period i
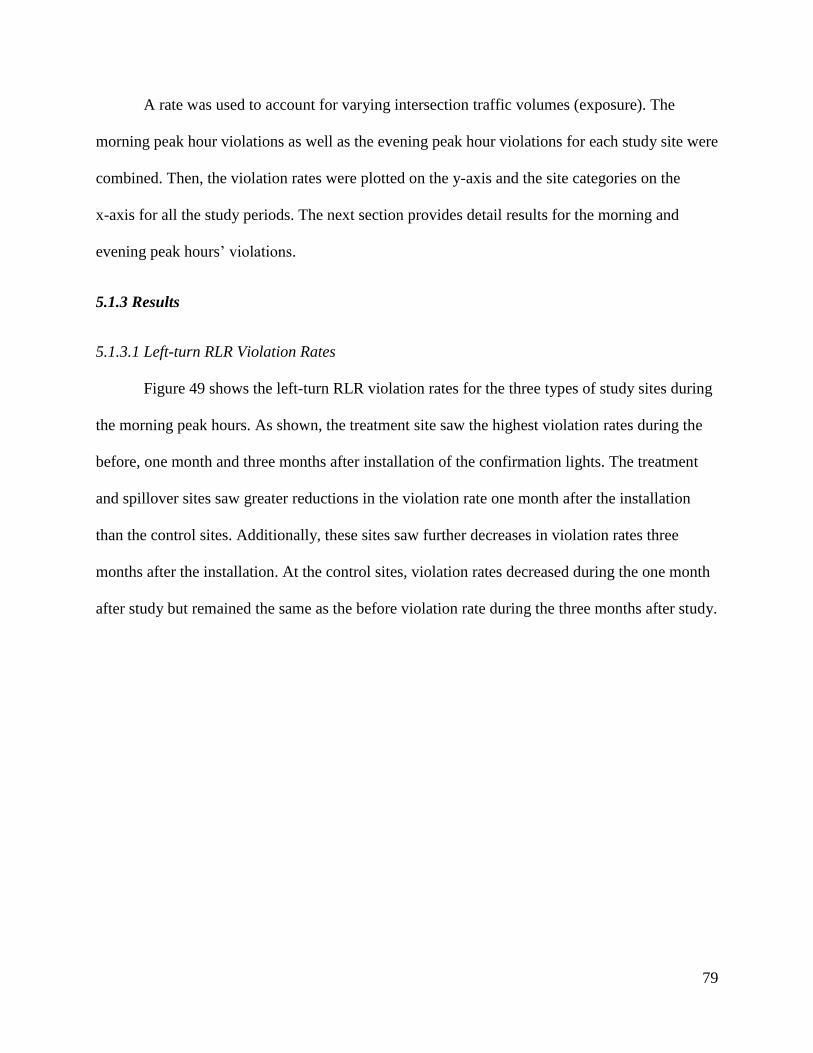
79
A rate was used to account for varying intersection traffic volumes (exposure). The
morning peak hour violations as well as the evening peak hour violations for each study site were
combined. Then, the violation rates were plotted on the y-axis and the site categories on the
x-axis for all the study periods. The next section provides detail results for the morning and
evening peak hours’ violations.
5.1.3 Results
5.1.3.1 Left-turn RLR Violation Rates
Figure 49 shows the left-turn RLR violation rates for the three types of study sites during
the morning peak hours. As shown, the treatment site saw the highest violation rates during the
before, one month and three months after installation of the confirmation lights. The treatment
and spillover sites saw greater reductions in the violation rate one month after the installation
than the control sites. Additionally, these sites saw further decreases in violation rates three
months after the installation. At the control sites, violation rates decreased during the one month
after study but remained the same as the before violation rate during the three months after study.
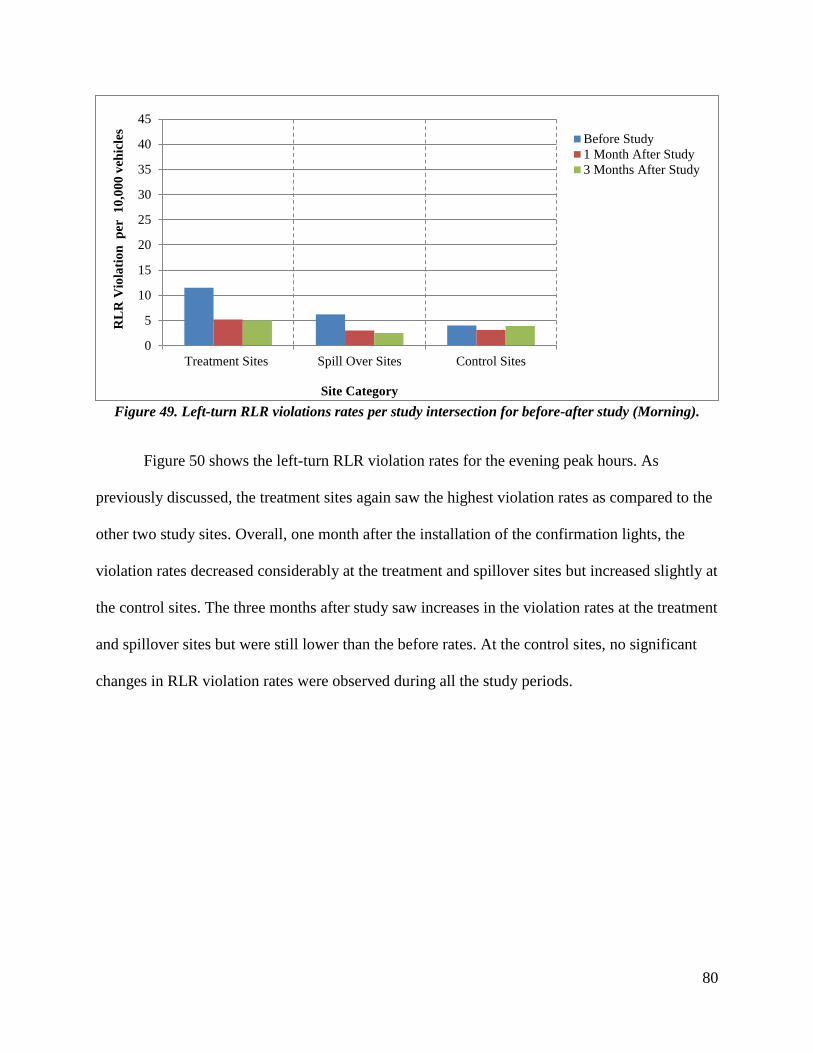
80
Figure 49. Left-turn RLR violations rates per study intersection for before-after study (Morning).
Figure 50 shows the left-turn RLR violation rates for the evening peak hours. As
previously discussed, the treatment sites again saw the highest violation rates as compared to the
other two study sites. Overall, one month after the installation of the confirmation lights, the
violation rates decreased considerably at the treatment and spillover sites but increased slightly at
the control sites. The three months after study saw increases in the violation rates at the treatment
and spillover sites but were still lower than the before rates. At the control sites, no significant
changes in RLR violation rates were observed during all the study periods.
0
5
10
15
20
25
30
35
40
45
Treatment Sites Spill Over Sites Control Sites
RL
R V
iola
tio
n p
er
10
,00
0 v
ehic
les
Site Category
Before Study
1 Month After Study
3 Months After Study
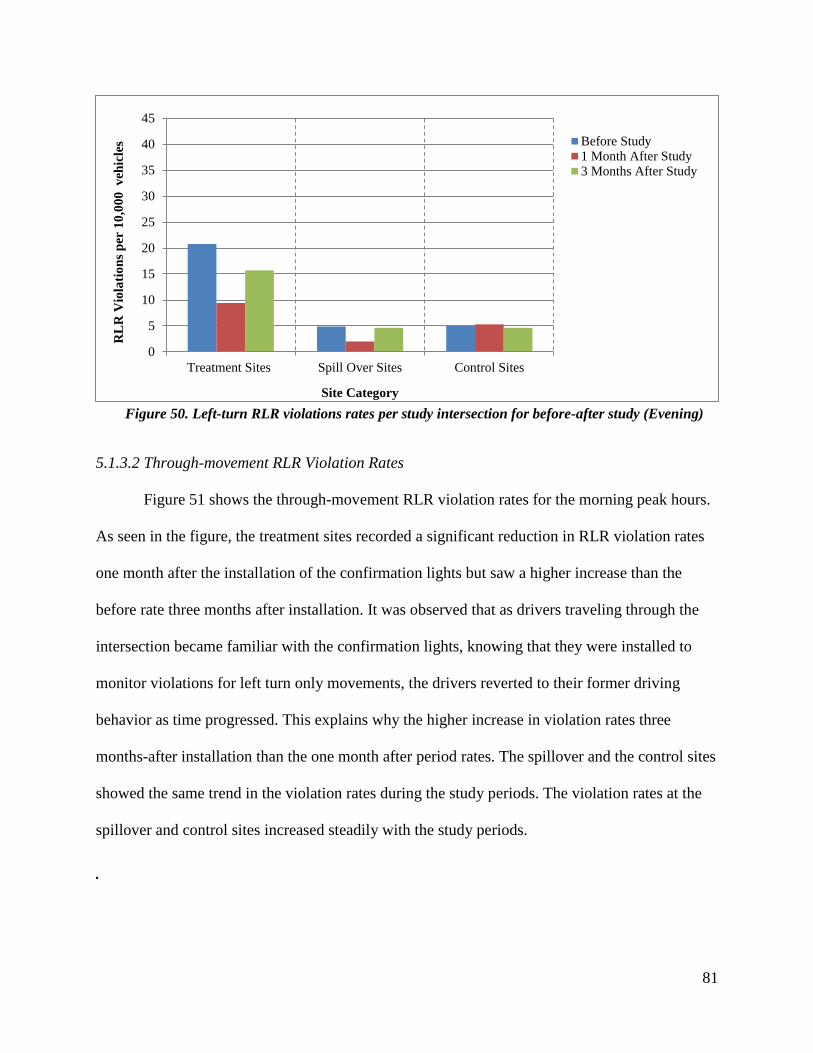
81
Figure 50. Left-turn RLR violations rates per study intersection for before-after study (Evening)
5.1.3.2 Through-movement RLR Violation Rates
Figure 51 shows the through-movement RLR violation rates for the morning peak hours.
As seen in the figure, the treatment sites recorded a significant reduction in RLR violation rates
one month after the installation of the confirmation lights but saw a higher increase than the
before rate three months after installation. It was observed that as drivers traveling through the
intersection became familiar with the confirmation lights, knowing that they were installed to
monitor violations for left turn only movements, the drivers reverted to their former driving
behavior as time progressed. This explains why the higher increase in violation rates three
months-after installation than the one month after period rates. The spillover and the control sites
showed the same trend in the violation rates during the study periods. The violation rates at the
spillover and control sites increased steadily with the study periods.
.
0
5
10
15
20
25
30
35
40
45
Treatment Sites Spill Over Sites Control Sites
RL
R V
iola
tio
ns
per
10
,00
0 v
ehic
les
Site Category
Before Study1 Month After Study3 Months After Study
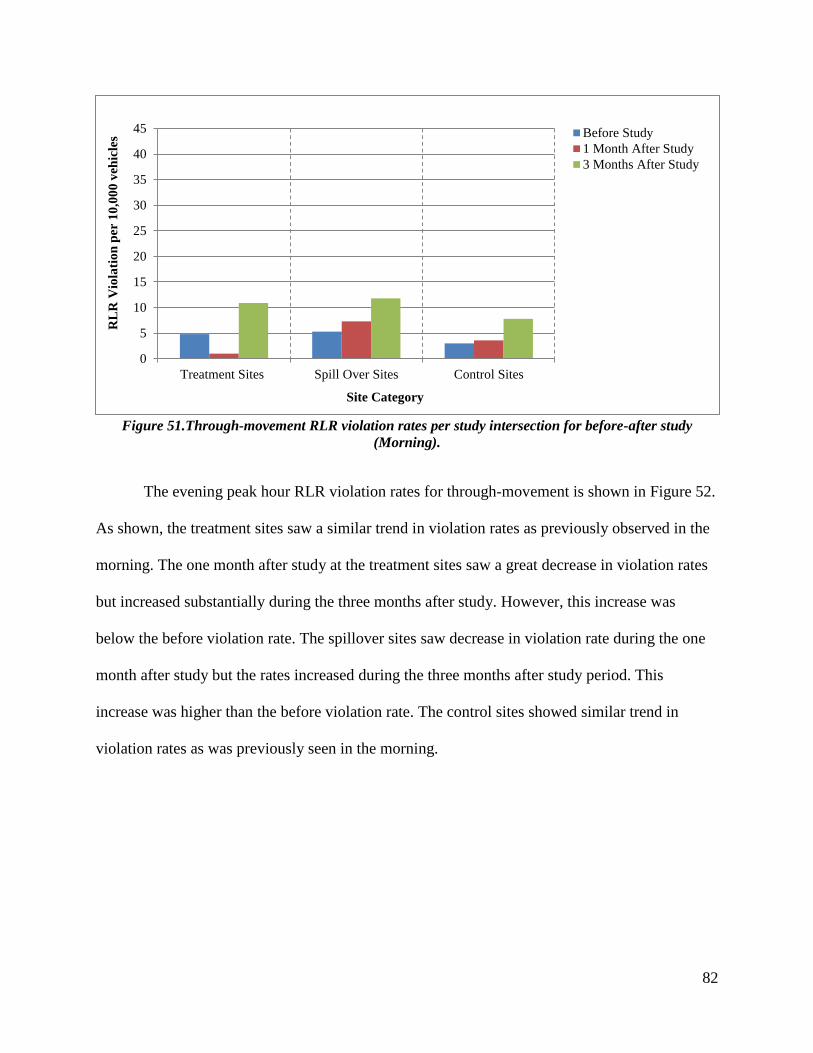
82
Figure 51.Through-movement RLR violation rates per study intersection for before-after study
(Morning).
The evening peak hour RLR violation rates for through-movement is shown in Figure 52.
As shown, the treatment sites saw a similar trend in violation rates as previously observed in the
morning. The one month after study at the treatment sites saw a great decrease in violation rates
but increased substantially during the three months after study. However, this increase was
below the before violation rate. The spillover sites saw decrease in violation rate during the one
month after study but the rates increased during the three months after study period. This
increase was higher than the before violation rate. The control sites showed similar trend in
violation rates as was previously seen in the morning.
0
5
10
15
20
25
30
35
40
45
Treatment Sites Spill Over Sites Control Sites
RL
R V
iola
tio
n p
er 1
0,0
00
veh
icle
s
Site Category
Before Study
1 Month After Study
3 Months After Study
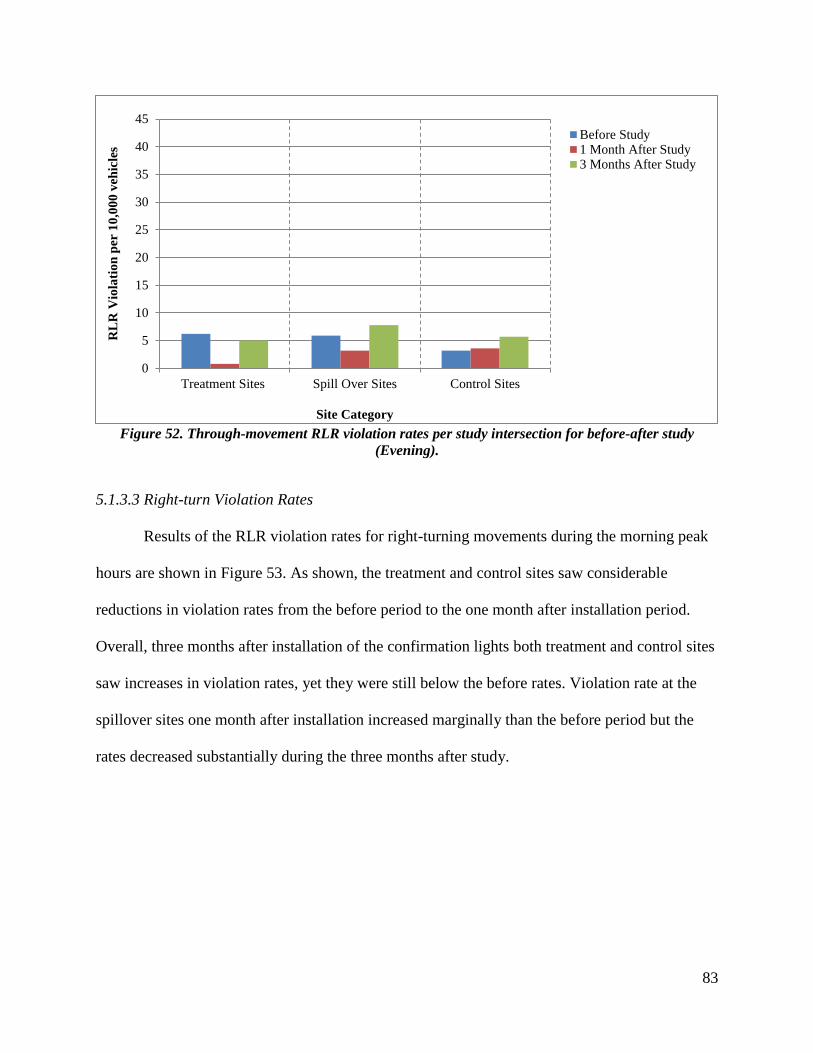
83
Figure 52. Through-movement RLR violation rates per study intersection for before-after study
(Evening).
5.1.3.3 Right-turn Violation Rates
Results of the RLR violation rates for right-turning movements during the morning peak
hours are shown in Figure 53. As shown, the treatment and control sites saw considerable
reductions in violation rates from the before period to the one month after installation period.
Overall, three months after installation of the confirmation lights both treatment and control sites
saw increases in violation rates, yet they were still below the before rates. Violation rate at the
spillover sites one month after installation increased marginally than the before period but the
rates decreased substantially during the three months after study.
0
5
10
15
20
25
30
35
40
45
Treatment Sites Spill Over Sites Control Sites
RL
R V
iola
tio
n p
er 1
0,0
00
veh
icle
s
Site Category
Before Study1 Month After Study3 Months After Study
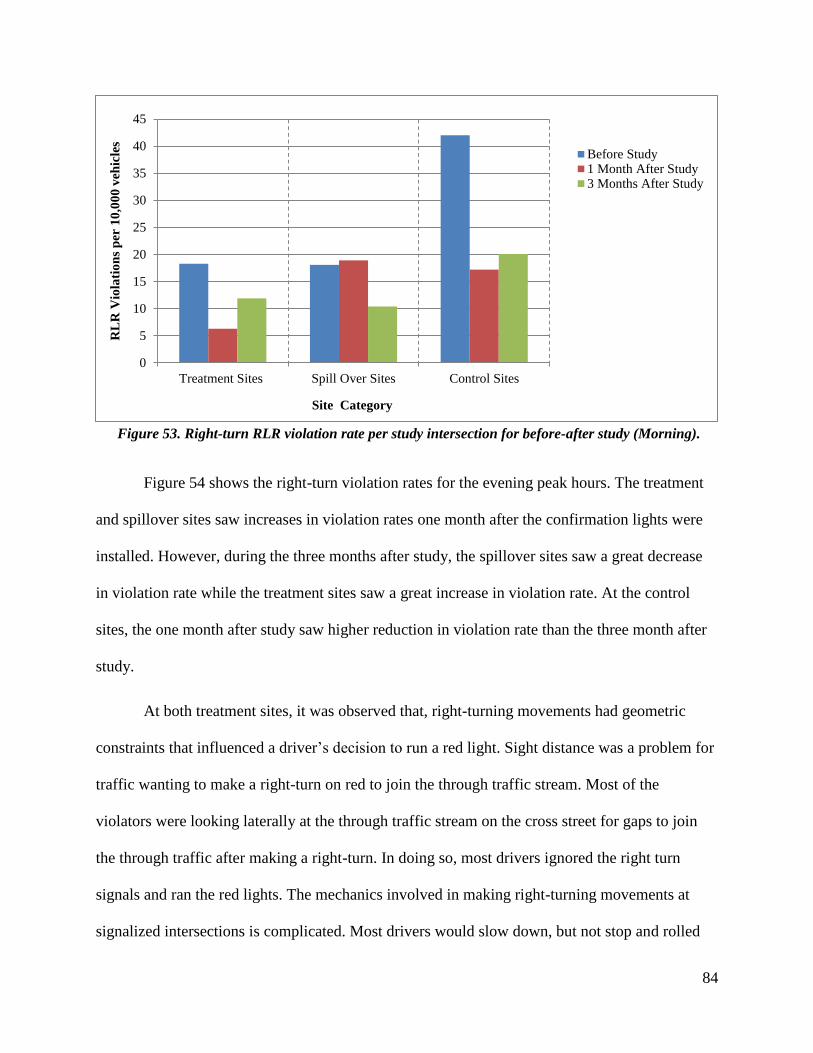
84
Figure 53. Right-turn RLR violation rate per study intersection for before-after study (Morning).
Figure 54 shows the right-turn violation rates for the evening peak hours. The treatment
and spillover sites saw increases in violation rates one month after the confirmation lights were
installed. However, during the three months after study, the spillover sites saw a great decrease
in violation rate while the treatment sites saw a great increase in violation rate. At the control
sites, the one month after study saw higher reduction in violation rate than the three month after
study.
At both treatment sites, it was observed that, right-turning movements had geometric
constraints that influenced a driver’s decision to run a red light. Sight distance was a problem for
traffic wanting to make a right-turn on red to join the through traffic stream. Most of the
violators were looking laterally at the through traffic stream on the cross street for gaps to join
the through traffic after making a right-turn. In doing so, most drivers ignored the right turn
signals and ran the red lights. The mechanics involved in making right-turning movements at
signalized intersections is complicated. Most drivers would slow down, but not stop and rolled
0
5
10
15
20
25
30
35
40
45
Treatment Sites Spill Over Sites Control Sites
RL
R V
iola
tio
ns
per
10
,00
0 v
ehic
les
Site Category
Before Study1 Month After Study3 Months After Study
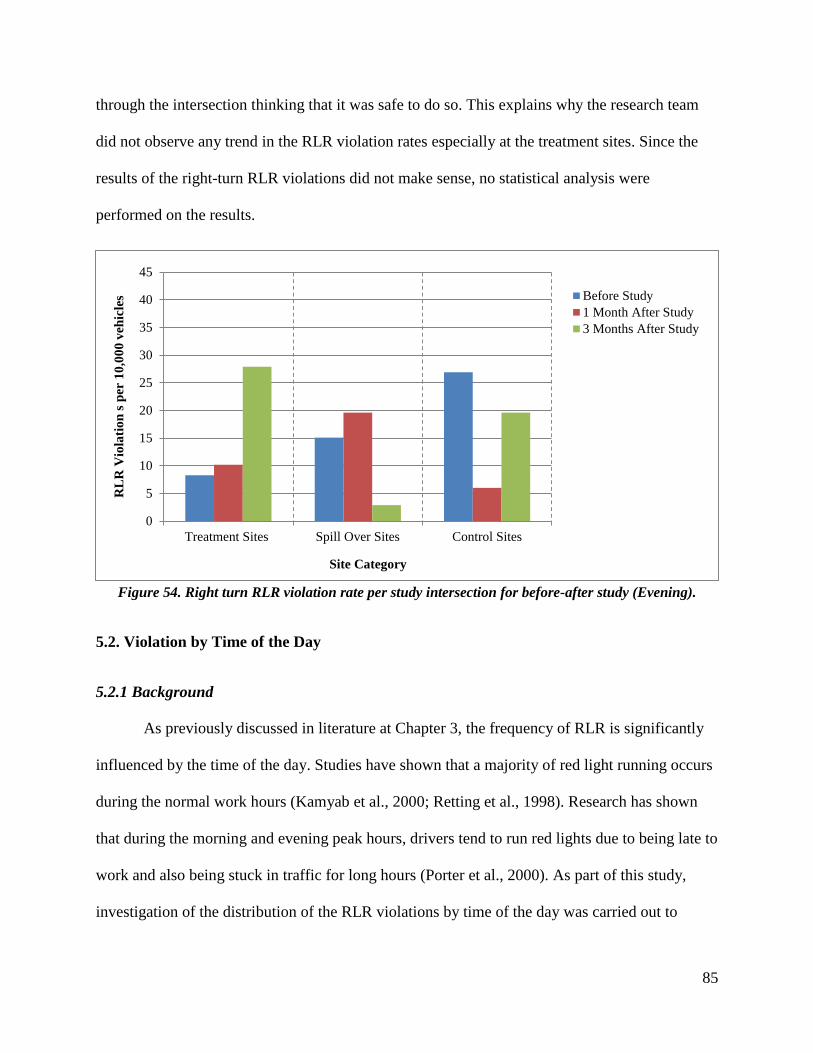
85
through the intersection thinking that it was safe to do so. This explains why the research team
did not observe any trend in the RLR violation rates especially at the treatment sites. Since the
results of the right-turn RLR violations did not make sense, no statistical analysis were
performed on the results.
Figure 54. Right turn RLR violation rate per study intersection for before-after study (Evening).
5.2. Violation by Time of the Day
5.2.1 Background
As previously discussed in literature at Chapter 3, the frequency of RLR is significantly
influenced by the time of the day. Studies have shown that a majority of red light running occurs
during the normal work hours (Kamyab et al., 2000; Retting et al., 1998). Research has shown
that during the morning and evening peak hours, drivers tend to run red lights due to being late to
work and also being stuck in traffic for long hours (Porter et al., 2000). As part of this study,
investigation of the distribution of the RLR violations by time of the day was carried out to
0
5
10
15
20
25
30
35
40
45
Treatment Sites Spill Over Sites Control Sites
RL
R V
iola
tio
n s
per
10
,00
0 v
ehic
les
Site Category
Before Study
1 Month After Study
3 Months After Study
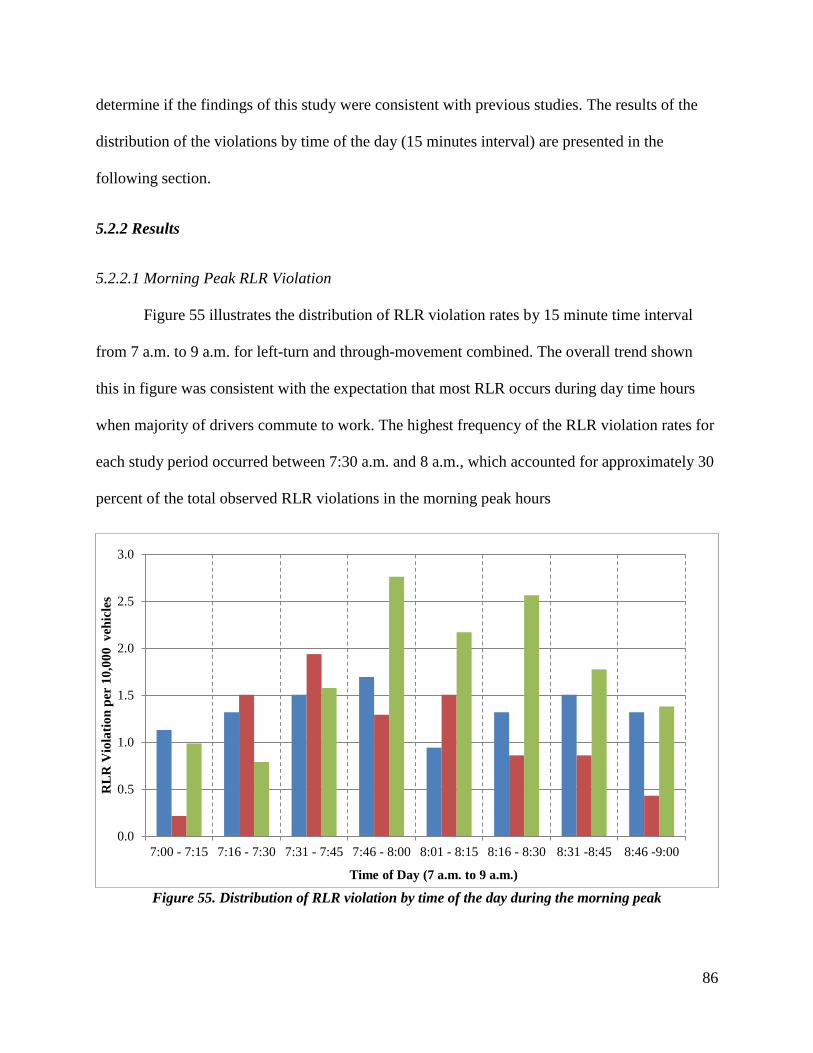
86
determine if the findings of this study were consistent with previous studies. The results of the
distribution of the violations by time of the day (15 minutes interval) are presented in the
following section.
5.2.2 Results
5.2.2.1 Morning Peak RLR Violation
Figure 55 illustrates the distribution of RLR violation rates by 15 minute time interval
from 7 a.m. to 9 a.m. for left-turn and through-movement combined. The overall trend shown
this in figure was consistent with the expectation that most RLR occurs during day time hours
when majority of drivers commute to work. The highest frequency of the RLR violation rates for
each study period occurred between 7:30 a.m. and 8 a.m., which accounted for approximately 30
percent of the total observed RLR violations in the morning peak hours
Figure 55. Distribution of RLR violation by time of the day during the morning peak
0.0
0.5
1.0
1.5
2.0
2.5
3.0
7:00 - 7:15 7:16 - 7:30 7:31 - 7:45 7:46 - 8:00 8:01 - 8:15 8:16 - 8:30 8:31 -8:45 8:46 -9:00
RL
R V
iola
tio
n p
er 1
0,0
00
v
ehic
les
Time of Day (7 a.m. to 9 a.m.)
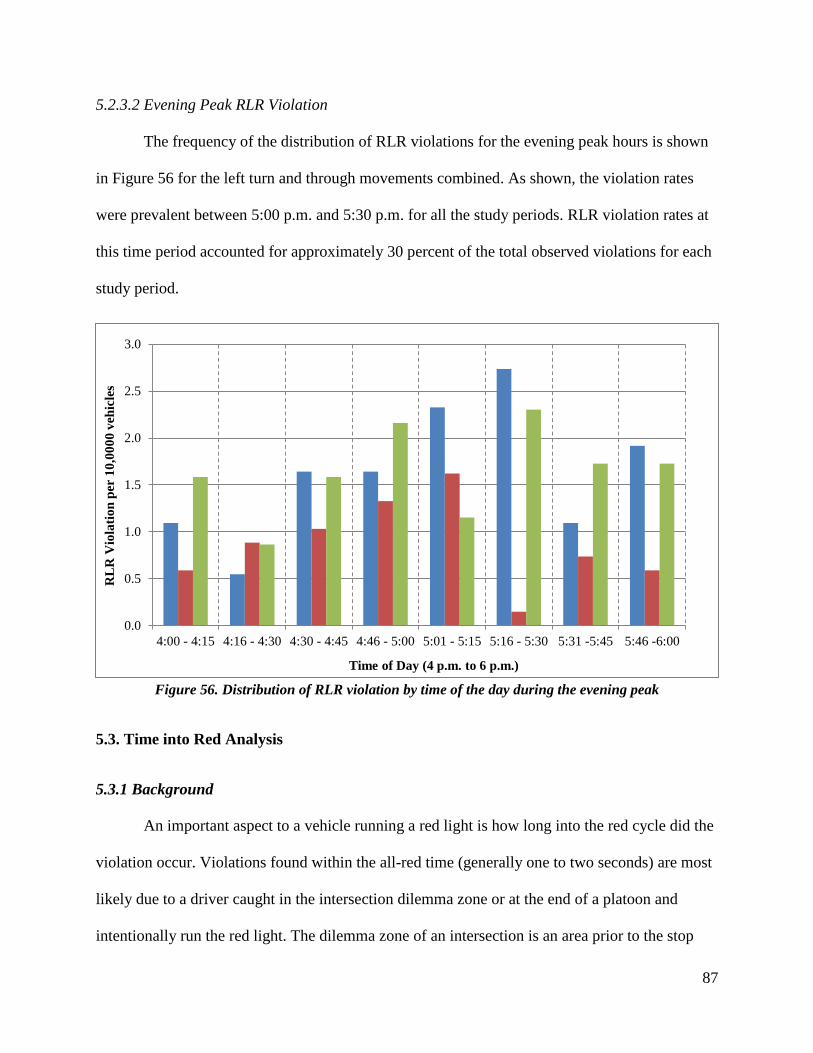
87
5.2.3.2 Evening Peak RLR Violation
The frequency of the distribution of RLR violations for the evening peak hours is shown
in Figure 56 for the left turn and through movements combined. As shown, the violation rates
were prevalent between 5:00 p.m. and 5:30 p.m. for all the study periods. RLR violation rates at
this time period accounted for approximately 30 percent of the total observed violations for each
study period.
Figure 56. Distribution of RLR violation by time of the day during the evening peak
5.3. Time into Red Analysis
5.3.1 Background
An important aspect to a vehicle running a red light is how long into the red cycle did the
violation occur. Violations found within the all-red time (generally one to two seconds) are most
likely due to a driver caught in the intersection dilemma zone or at the end of a platoon and
intentionally run the red light. The dilemma zone of an intersection is an area prior to the stop
0.0
0.5
1.0
1.5
2.0
2.5
3.0
4:00 - 4:15 4:16 - 4:30 4:30 - 4:45 4:46 - 5:00 5:01 - 5:15 5:16 - 5:30 5:31 -5:45 5:46 -6:00
RL
R V
iola
tio
n p
er 1
0,0
00
0 v
ehic
les
Time of Day (4 p.m. to 6 p.m.)
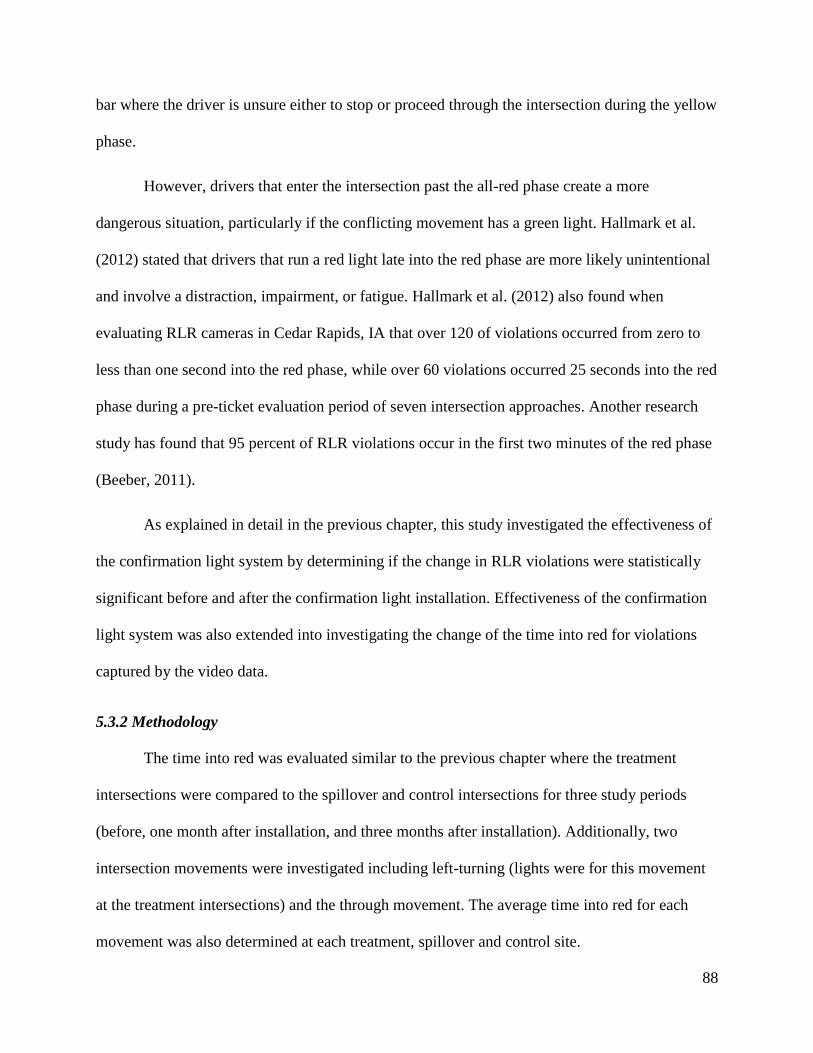
88
bar where the driver is unsure either to stop or proceed through the intersection during the yellow
phase.
However, drivers that enter the intersection past the all-red phase create a more
dangerous situation, particularly if the conflicting movement has a green light. Hallmark et al.
(2012) stated that drivers that run a red light late into the red phase are more likely unintentional
and involve a distraction, impairment, or fatigue. Hallmark et al. (2012) also found when
evaluating RLR cameras in Cedar Rapids, IA that over 120 of violations occurred from zero to
less than one second into the red phase, while over 60 violations occurred 25 seconds into the red
phase during a pre-ticket evaluation period of seven intersection approaches. Another research
study has found that 95 percent of RLR violations occur in the first two minutes of the red phase
(Beeber, 2011).
As explained in detail in the previous chapter, this study investigated the effectiveness of
the confirmation light system by determining if the change in RLR violations were statistically
significant before and after the confirmation light installation. Effectiveness of the confirmation
light system was also extended into investigating the change of the time into red for violations
captured by the video data.
5.3.2 Methodology
The time into red was evaluated similar to the previous chapter where the treatment
intersections were compared to the spillover and control intersections for three study periods
(before, one month after installation, and three months after installation). Additionally, two
intersection movements were investigated including left-turning (lights were for this movement
at the treatment intersections) and the through movement. The average time into red for each
movement was also determined at each treatment, spillover and control site.
89
Time into red was plotted where the x-axis was the number of violations and the y-axis
was time into red (in seconds). Violations were aggregated in the y-axis for seconds with a
maximum time plotted of greater than five seconds. It should be noted as stated in the previous
section that the number of violations in each study period changed, so the total number of
violations plotted in the following figures is not a consistent number for each study period.
5.3.3 Results
5.3.3.1 Left-turning Movement
Figures 57, 58, and 59 show the results of the RLR time into red for the left-turning
movement for all of the intersections studied. Figure 57 shows the left-turning movement time
into red for the two treatment intersections.
Figure 57. Left-turning movement time into red at treatment intersections
0
5
10
15
20
25
30
35
40
45
<1 1 to < 2 2 to < 3 3 to < 4 4 to < 5 >5
Nu
mb
er o
f R
LR
Vio
lati
on
s
Time Into Red (seconds)
Before1 month After Study3 months After Study
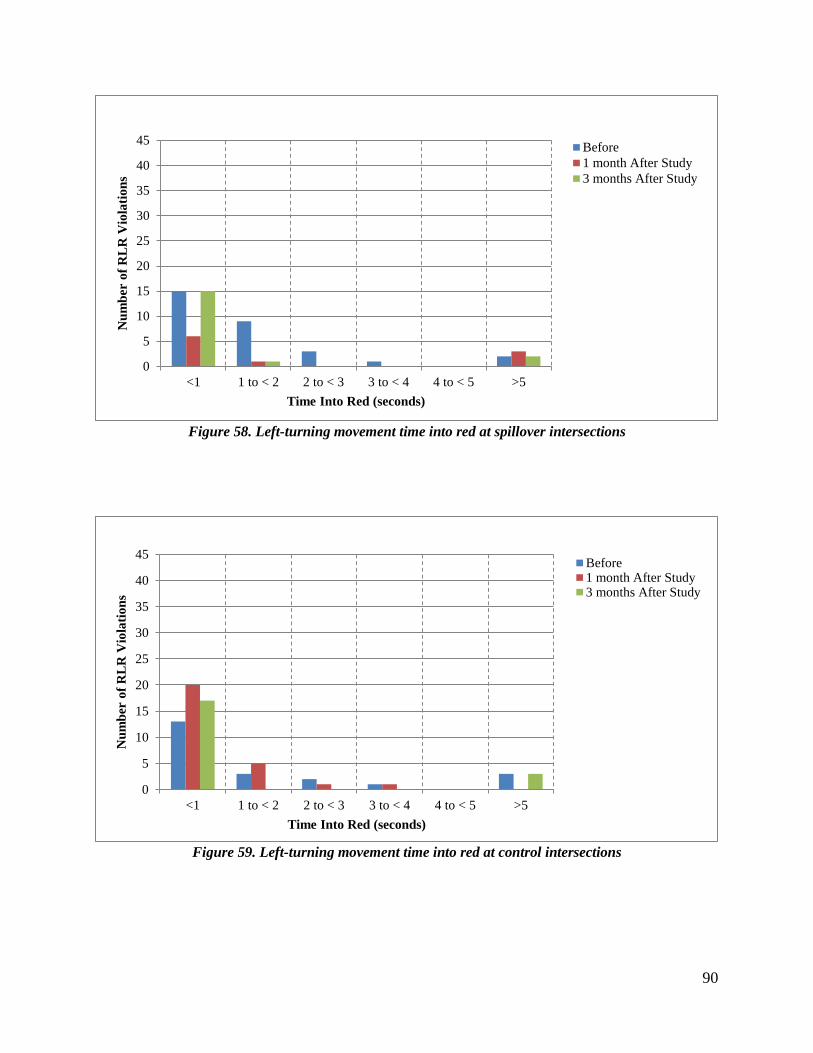
90
Figure 58. Left-turning movement time into red at spillover intersections
Figure 59. Left-turning movement time into red at control intersections
0
5
10
15
20
25
30
35
40
45
<1 1 to < 2 2 to < 3 3 to < 4 4 to < 5 >5
Nu
mb
er o
f R
LR
Vio
lati
on
s
Time Into Red (seconds)
Before
1 month After Study
3 months After Study
0
5
10
15
20
25
30
35
40
45
<1 1 to < 2 2 to < 3 3 to < 4 4 to < 5 >5
Nu
mb
er o
f R
LR
Vio
lati
on
s
Time Into Red (seconds)
Before1 month After Study3 months After Study
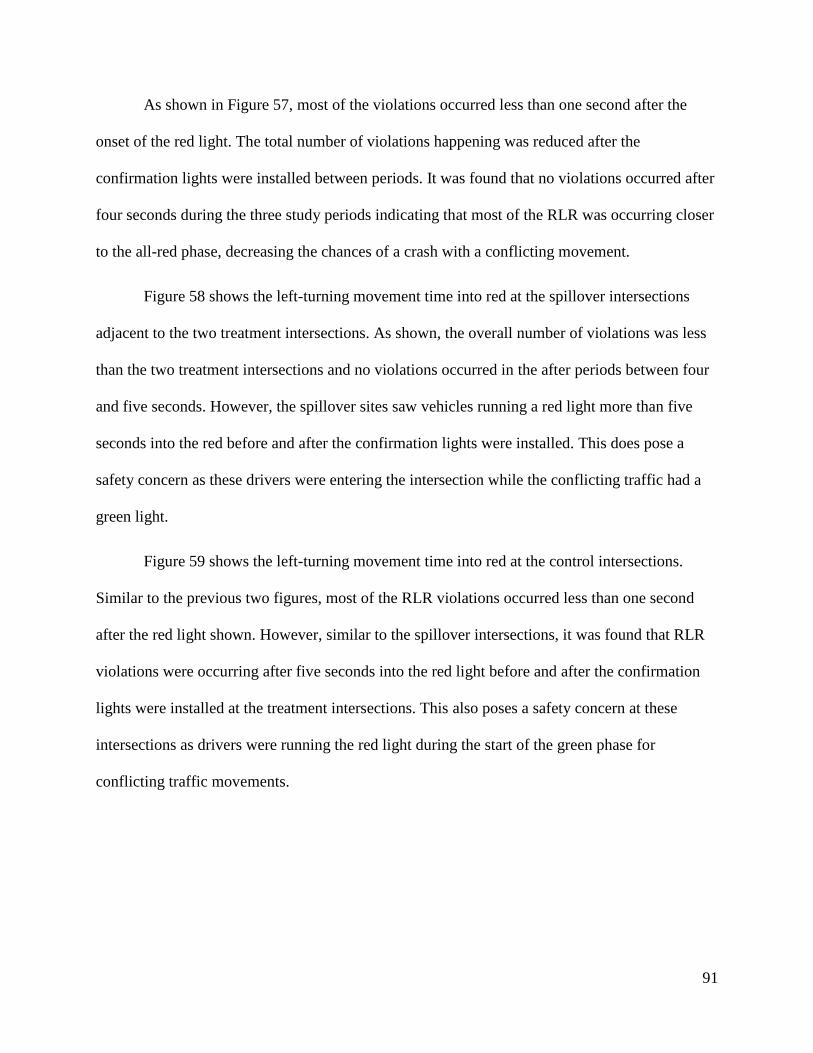
91
As shown in Figure 57, most of the violations occurred less than one second after the
onset of the red light. The total number of violations happening was reduced after the
confirmation lights were installed between periods. It was found that no violations occurred after
four seconds during the three study periods indicating that most of the RLR was occurring closer
to the all-red phase, decreasing the chances of a crash with a conflicting movement.
Figure 58 shows the left-turning movement time into red at the spillover intersections
adjacent to the two treatment intersections. As shown, the overall number of violations was less
than the two treatment intersections and no violations occurred in the after periods between four
and five seconds. However, the spillover sites saw vehicles running a red light more than five
seconds into the red before and after the confirmation lights were installed. This does pose a
safety concern as these drivers were entering the intersection while the conflicting traffic had a
green light.
Figure 59 shows the left-turning movement time into red at the control intersections.
Similar to the previous two figures, most of the RLR violations occurred less than one second
after the red light shown. However, similar to the spillover intersections, it was found that RLR
violations were occurring after five seconds into the red light before and after the confirmation
lights were installed at the treatment intersections. This also poses a safety concern at these
intersections as drivers were running the red light during the start of the green phase for
conflicting traffic movements.
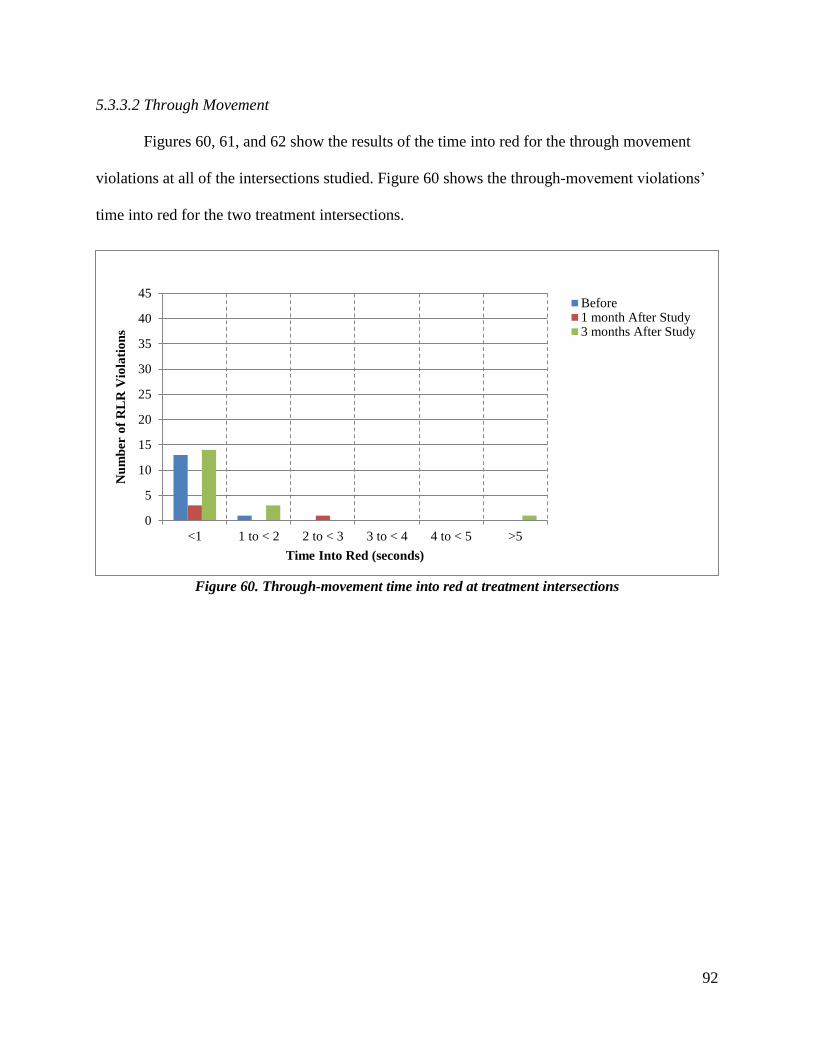
92
5.3.3.2 Through Movement
Figures 60, 61, and 62 show the results of the time into red for the through movement
violations at all of the intersections studied. Figure 60 shows the through-movement violations’
time into red for the two treatment intersections.
Figure 60. Through-movement time into red at treatment intersections
0
5
10
15
20
25
30
35
40
45
<1 1 to < 2 2 to < 3 3 to < 4 4 to < 5 >5
Nu
mb
er o
f R
LR
Vio
lati
on
s
Time Into Red (seconds)
Before1 month After Study3 months After Study
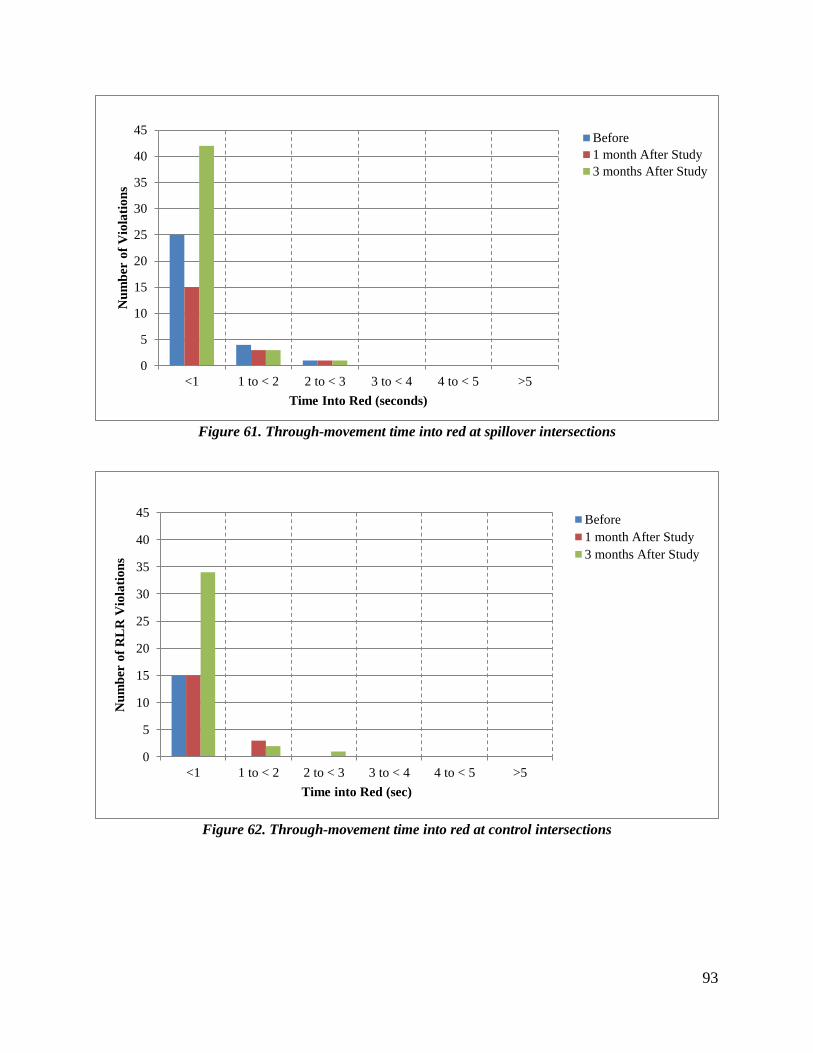
93
Figure 61. Through-movement time into red at spillover intersections
Figure 62. Through-movement time into red at control intersections
0
5
10
15
20
25
30
35
40
45
<1 1 to < 2 2 to < 3 3 to < 4 4 to < 5 >5
Nu
mb
er o
f V
iola
tio
ns
Time Into Red (seconds)
Before
1 month After Study
3 months After Study
0
5
10
15
20
25
30
35
40
45
<1 1 to < 2 2 to < 3 3 to < 4 4 to < 5 >5
Nu
mb
er o
f R
LR
Vio
lati
on
s
Time into Red (sec)
Before
1 month After Study
3 months After Study
94
As shown in Figure 60, most of the through-movement violations occurred under a
second into the red at the treatment intersections. Other violations were found to occur between
one and three seconds into the red. The research team did find violations occurring after five
seconds into the red 3 months after installation, meaning there were some unintentional
violations during that period.
Figure 61 shows the through-movement RLR violations at the spillover intersections.
Similar to the treatment intersections, most of the through-movement violations occurred under
one second into the red, and no violations were found after three seconds into the red indicating
that the violations were intentional.
Similar to the treatment and spillover intersections, the control intersections saw many
through-movement violations occurring less than one second into the red phase indicating that
RLR violations were intentional. Violations between one and three seconds into the red were
observed at the control sites which was also common at the other two site categories. No
violations occurred after 5 seconds into the red at the control intersections during any of the
study periods as shown in Figure 62.
5.4. Violation Configurations and Vehicle Types
5.4.1 Background
How do RLR violations occur? Are the violations committed by a driver of a single
vehicle or multiple vehicles traveling in a platoon or side by side and violating the red aspect of
the traffic signal together? As previously reviewed from the literature, little or no studies have
been conducted to address these questions. This study investigated how the RLR violations
which were recorded during the before-after study periods occurred. Retting et al. (1996)
95
reported in their study that most red light runners were more likely to be drivers driving small
cars One of the focuses of this study was to investigate the types of vehicles driven by the red
light runners.
5.4.2 Methodology
During the field video data reductions, students were also given guidelines to group the
violations by the configuration types shown in Figure 43. The violation configurations were
coded 0 to 9 and were explained to each student using Table 17 as well. Additionally, students
were then asked to record the type of vehicle involved in the RLR violation. The types of
vehicles included passenger cars, buses, trucks and recreational vehicles.
5.4.3 Results
5.4.3.1 Violation Configurations
Table 18 shows the number of violations (in percentage) for each of the ten configuration
types during the study periods. Morning and evening peak hour violations for all the 13 study
intersections were combined. For each configuration type, the percentage of RLR violations were
then calculated by dividing the number of violations that occurred in that configuration type by
the total number of violations for that study period and multiplying the result by 100. For
example, if 82 violations were recorded for the violation type coded 1 during the before study,
and the total number of violations observed was 420, then the percentage of the violations that
occurred for configuration type 1 was expressed as (82/420)*100, yielding 20 percent. RLR
violation by configuration type was not considered by site category. All the violations for the
treatment, spillover and control sites were combined for the before, one month after (1 mo) and
three months after (3 mo) study periods, respectively.
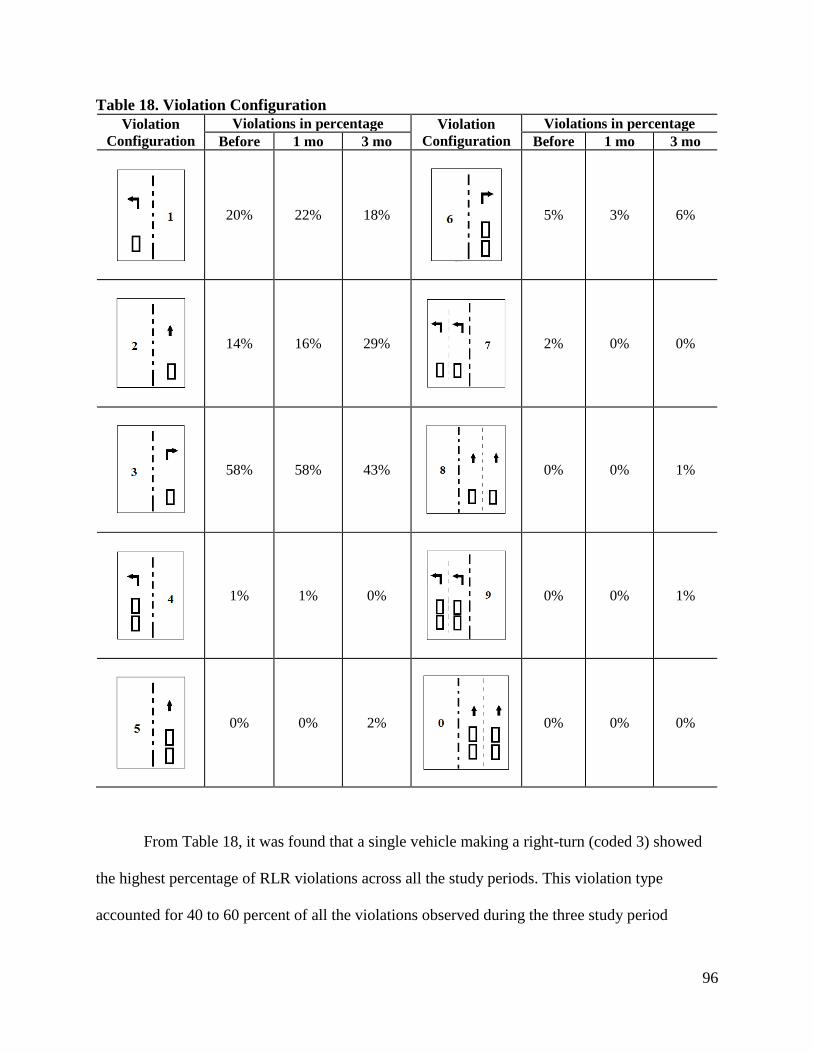
96
Table 18. Violation Configuration
Violation
Configuration
Violations in percentage Violation
Configuration
Violations in percentage
Before 1 mo 3 mo Before 1 mo 3 mo
20% 22% 18%
5% 3% 6%
14% 16% 29%
2% 0% 0%
58% 58% 43%
0% 0% 1%
1% 1% 0%
0% 0% 1%
0% 0% 2%
0% 0% 0%
From Table 18, it was found that a single vehicle making a right-turn (coded 3) showed
the highest percentage of RLR violations across all the study periods. This violation type
accounted for 40 to 60 percent of all the violations observed during the three study period
97
(before, one month after installation, and three months after installation).It was observed that at
locations where right-turns on red were permitted, the majority of the drivers rolled through the
intersections without initially coming to a complete stop.
A single vehicle making a left-turn (coded 1) showed the second highest percentage of
RLR violations during the before and one month after study periods, followed by a single vehicle
traversing through the intersection (coded 2). However, during the three months after study, the
through-movement violation by a single vehicle showed a higher percentage in RLR violation
than a single vehicle making a left-turn.
As shown in Table 18, violation configuration types 4, 5, 7, 8 and 9 saw less than
three percent of the total violations observed for each before-after study period. This small
percentage showed that drivers following too closely to each other in a platoon or traveling side
by side seldom ran the red lights together. However, the violation configuration type 6 (a platoon
of vehicles making a right turn) saw three to six percent of the total observed violations during
the before-after study periods. No violations were recorded for violation configuration type 0.
5.4.3.2 Violation by Vehicle Type
The percentages of RLR violations categorized by type of vehicle driven by the violators
are shown in Table 19. Over 98 percent of the RLR violations were committed by drivers of
passenger cars during all the study periods. This finding is consistent with a previous study by
Retting et al. (1996), where they reported that drivers who run red lights were more likely to be
driving small vehicles. From Table 19, it is shown that trucks and buses accounted for less than
two percent of the entire vehicles that were involved in RLR. There was no instance of a
recreational vehicle running a red light during each study period.
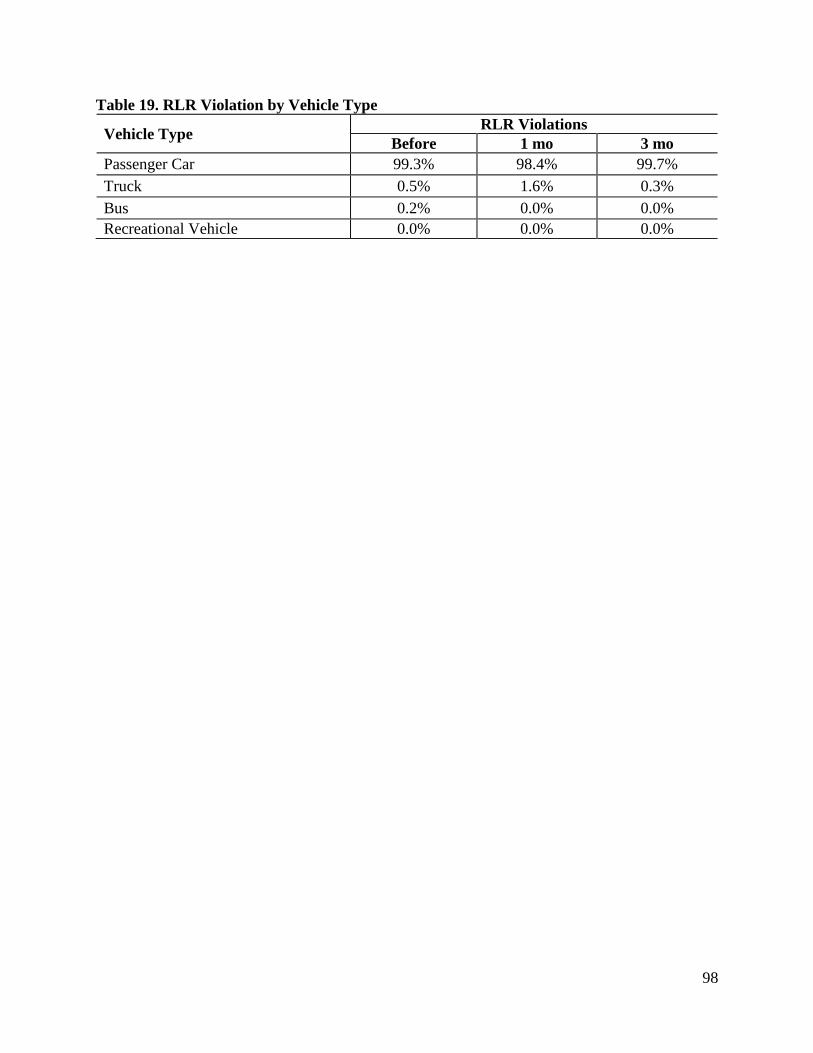
98
Table 19. RLR Violation by Vehicle Type
Vehicle Type RLR Violations
Before 1 mo 3 mo
Passenger Car 99.3% 98.4% 99.7%
Truck 0.5% 1.6% 0.3%
Bus 0.2% 0.0% 0.0%
Recreational Vehicle 0.0% 0.0% 0.0%
99
CHAPTER 6: STATISTICAL ANALYSIS OF RLR VIOLATIONS
6.1 Comparison of RLR Violation Rates after Installation of Confirmation Lights.
Studies that have assessed the effectiveness of a roadway safety device rely on a
before-after crash analysis. These studies involve at least three years of before data and three
years of after data (Nicholson, 1985). However, many communities want to know the
effectiveness of a device or treatment shortly after installation to determine if the investment in
the device was a good decision. Many times, in place of a before-after crash analysis, researchers
will use a safety surrogate measure in its place.
Researchers have previously used the reduction in RLR violations as a crash surrogate for
a reduction in RLR crashes. This relationship is not direct due to the fact that RLR violations
occur more frequent than RLR crashes since they are rare and random events. Research has also
shown that red light runners tend to have common traits such as age, driving experience, speed
convictions, and vehicle type (Retting and Williams, 1996). However, a reduction in violations
means there is a reduction in exposure, or a reduction in the chances of a RLR crash to occur.
Additionally, besides considering a change in RLR violations before and one month after
the confirmation lights were installed, a change in violations three months after installation was
investigated. Unlike previous research studies, it is unknown if the confirmation lights (or really
any safety countermeasure) become less effective over time as drivers become accustom to the
treatment and associated enforcement. However, changes in driver behavior or changes in
enforcement using the confirmation lights may be more effective over time.
6.2 Methodology
The RLR violation rate was the metric used to compare changes during the before, 1
month after, and 3 months after installation of the confirmation lights. Violation rate was used
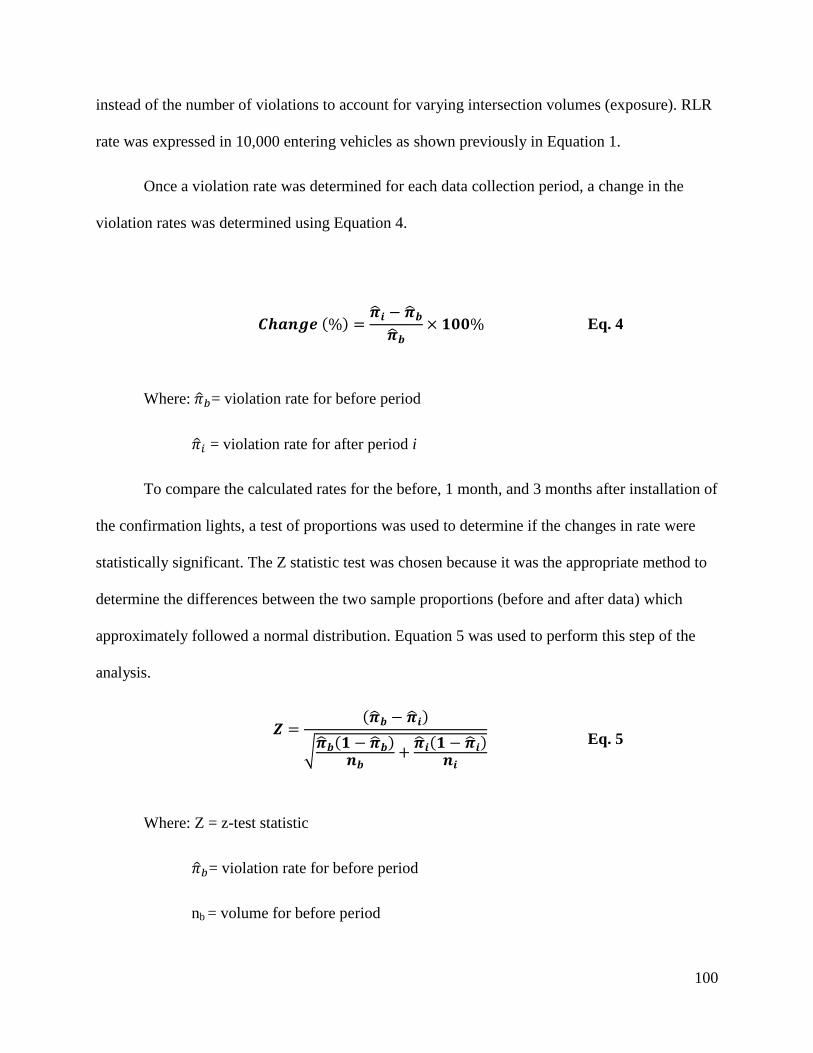
100
instead of the number of violations to account for varying intersection volumes (exposure). RLR
rate was expressed in 10,000 entering vehicles as shown previously in Equation 1.
Once a violation rate was determined for each data collection period, a change in the
violation rates was determined using Equation 4.
Eq. 4
Where: = violation rate for before period
= violation rate for after period i
To compare the calculated rates for the before, 1 month, and 3 months after installation of
the confirmation lights, a test of proportions was used to determine if the changes in rate were
statistically significant. The Z statistic test was chosen because it was the appropriate method to
determine the differences between the two sample proportions (before and after data) which
approximately followed a normal distribution. Equation 5 was used to perform this step of the
analysis.
√
Eq. 5
Where: Z = z-test statistic
= violation rate for before period
nb = volume for before period
101
= violation rate for after period i
ni = volume for after period i
The calculated z-test statistic was compared to a Z table with α = 0.05 to determine
significance at the 95 percent level of confidence. If the Z was greater than 1.96, the resulting
decrease in violation rate was statistically significant. Similarly, if the Z was less than -1.96 the
resulting increase in violation rate was statistically significant.
6.3 Results of RLR Violations
The results of the violation study for all intersections are presented in this section. As
stated previously, the blue confirmation lights were installed at two intersections for the
left-turning movement. A total of six approaches were treated, four at the intersections of 23rd
Street and Iowa Street and two at the intersection of 23rd
Street and Louisiana Street.
Since the intersection of 23rd
Street and Iowa Street had two approaches that were not
treated with the blue confirmation light, it was determined that these two approaches would be
considered as “not treated approaches” and would act as immediate spillover sites. Additionally,
six spillover and five control intersections were investigated. The changes in violations for
left-turning movement and through-movement were evaluated separately and the results are
presented in the following sections.
6.3.1 Analysis of Left-turning Movement Red Light Running Violations
Table 20 shows the results of the analysis for the left-turning movements only. Morning
and evening peak hours were combined. The table shows: the intersection, RLR violations
recorded, number of vehicles counted, RLR rates per 10,000 vehicles, and percent change in
violation rates between periods. For the percent change in violation rates, a period represents an
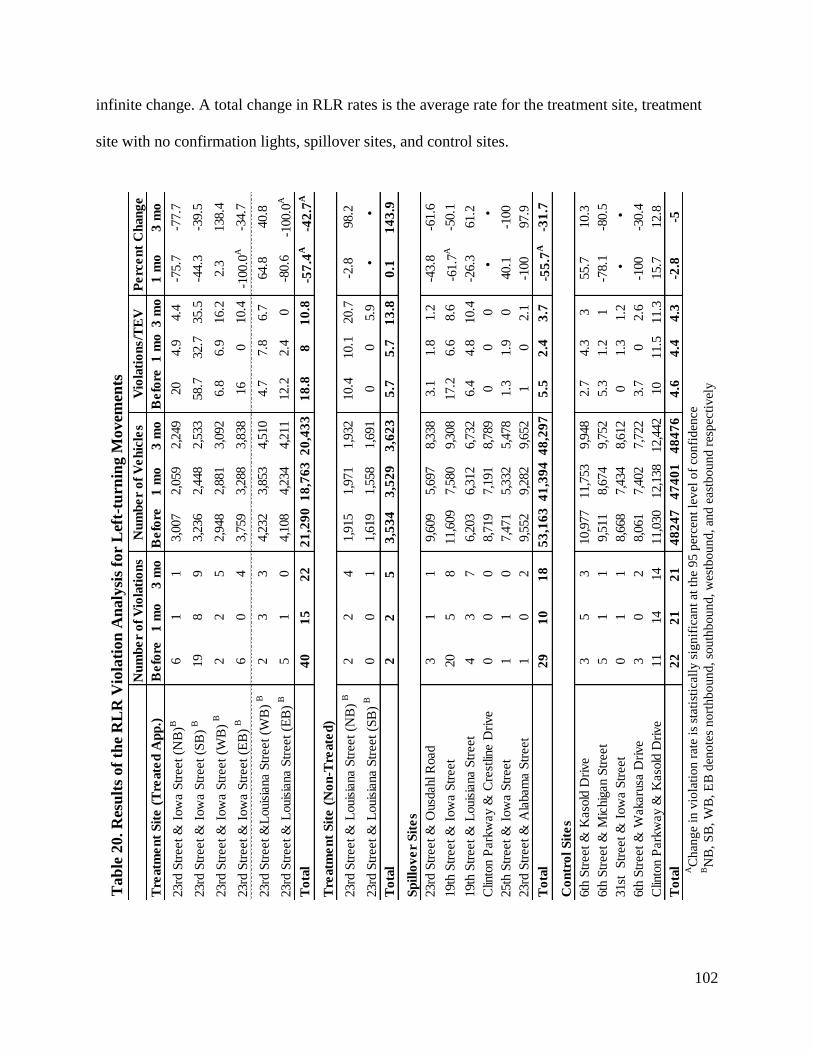
102
infinite change. A total change in RLR rates is the average rate for the treatment site, treatment
site with no confirmation lights, spillover sites, and control sites.
Tre
atm
en
t S
ite
(T
reate
d A
pp
.)B
efo
re1
mo
3 m
oB
efo
re1
mo
3 m
oB
efo
re1
mo
3 m
o1
mo
3 m
o
23rd
Str
eet
& I
ow
a S
treet
(NB
)B6
11
3,0
07
2,0
59
2,2
49
20
4.9
4.4
-75.7
-77.7
23rd
Str
eet
& I
ow
a S
treet
(SB
) B19
89
3,2
36
2,4
48
2,5
33
58.7
32.7
35.5
-44.3
-39.5
23rd
Str
eet
& I
ow
a S
treet
(WB
) B2
25
2,9
48
2,8
81
3,0
92
6.8
6.9
16.2
2.3
138.4
23rd
Str
eet
& I
ow
a S
treet
(EB
) B6
04
3,7
59
3,2
88
3,8
38
16
010.4
-100.0
A-3
4.7
23rd
Str
eet
&L
ouis
iana S
treet
(WB
) B2
33
4,2
32
3,8
53
4,5
10
4.7
7.8
6.7
64.8
40.8
23rd
Str
eet
& L
ouis
iana S
treet
(EB
) B5
10
4,1
08
4,2
34
4,2
11
12.2
2.4
0-8
0.6
-100.0
A
To
tal
40
15
22
21
,29
01
8,7
63
20
,43
31
8.8
81
0.8
-5
7.4
A
-42
.7A
Tre
atm
en
t S
ite
(N
on
-Tre
ate
d)
23rd
Str
eet
& L
ouis
iana S
treet
(NB
) B2
24
1,9
15
1,9
71
1,9
32
10.4
10.1
20.7
-2.8
98.2
23rd
Str
eet
& L
ouis
iana S
treet
(SB
) B0
01
1,6
19
1,5
58
1,6
91
00
5.9
•
•
To
tal
22
53
,53
43
,52
93
,62
35
.75
.71
3.8
0.1
14
3.9
Sp
illo
ve
r S
ite
s
23rd
Str
eet
& O
usd
ahl R
oad
31
19,6
09
5,6
97
8,3
38
3.1
1.8
1.2
-43.8
-61.6
19th
Str
eet
& I
ow
a S
treet
20
58
11,6
09
7,5
80
9,3
08
17.2
6.6
8.6
-6
1.7
A-5
0.1
19th
Str
eet
& L
ouis
iana S
treet
43
76,2
03
6,3
12
6,7
32
6.4
4.8
10.4
-26.3
61.2
Clin
ton P
ark
way &
Cre
stlin
e D
rive
00
08,7
19
7,1
91
8,7
89
00
0
•
•
25th
Str
eet
& I
ow
a S
treet
11
07,4
71
5,3
32
5,4
78
1.3
1.9
040.1
-100
23rd
Str
eet
& A
labam
a S
treet
10
29,5
52
9,2
82
9,6
52
10
2.1
-100
97.9
To
tal
29
10
18
53
,16
34
1,3
94
48
,29
75
.52
.43
.7
-5
5.7
A-3
1.7
Co
ntr
ol
Sit
es
6th
Str
eet
& K
aso
ld D
rive
35
310,9
77
11,7
53
9,9
48
2.7
4.3
355.7
10.3
6th
Str
eet
& M
ichig
an S
treet
51
19,5
11
8,6
74
9,7
52
5.3
1.2
1-7
8.1
-80.5
31st
S
treet
& I
ow
a S
treet
01
18,6
68
7,4
34
8,6
12
01.3
1.2
• •
6th
Str
eet
& W
akaru
sa D
rive
30
28,0
61
7,4
02
7,7
22
3.7
02.6
-100
-30.4
Clin
ton P
ark
way &
Kaso
ld D
rive
11
14
14
11,0
30
12,1
38
12,4
42
10
11.5
11.3
15.7
12.8
To
tal
22
21
21
48
24
74
74
01
48
47
64
.64
.44
.3-2
.8-5
Nu
mb
er
of
Vio
lati
on
sN
um
be
r o
f V
eh
icle
sV
iola
tio
ns/T
EV
Pe
rce
nt
Ch
an
ge
AC
han
ge
in v
iola
tion
rat
e is
sta
tist
ical
ly s
ign
ific
ant
at t
he
95 p
erce
nt
lev
el o
f co
nfi
den
ce
BN
B,
SB
, W
B,
EB
den
ote
s n
ort
hb
oun
d,
sou
thb
ou
nd,
wes
tbou
nd
, an
d e
astb
ou
nd
res
pec
tiv
ely
Tab
le 2
0. R
esu
lts
of
the
RL
R V
iola
tion
An
aly
sis
for
Lef
t-tu
rnin
g M
ovem
ents
103
Overall, the blue confirmation lights showed promising results at the treatment
intersections/approaches for left turning movements. Two of the left-turn treated approaches saw
an increase in violations while four approaches saw a decrease in violations. When the total
change in left-turning violations at all treated approaches was compared, the number of
left-turning violations decreased, and it was statistically significant at the 95 percent level of
confidence.
The results indicated that the two left-turning intersection approaches that experienced an
increase at both treatment intersections were westbound. Based on heavy commuter traffic both
eastbound and westbound at both intersections, it can be speculated that commuter traffic during
the peak hours may have influenced the increase in RLR violations for this movement. Overall,
the decrease in left-turn RLR violation rates were substantial with east and northbound
approaches having a greater than 40 percent reduction in left-turning RLR violations with
eastbound approaches having a 100 percent reduction in violations.
The northbound non-treated intersection approach at the intersection of 23th
Street and
Louisiana Street saw a minor decrease (1 month after) and a major increase (3 months after) in
left-turning RLR violations. It should be noted that substantial increase in the violation rates did
not represent a significant safety issue due to small numbers of violations observed for that
approach.
The spillover intersections found an overall reduction in left-turn RLR violations at the
spillover intersections. Similar to the non-treated intersection approaches, many of the spillover
intersections saw minimal RLR violations. However, based on an overall analysis, it can be
speculated that driver behavior may have changed due to the confirmation lights being present at
the treatment intersections located nearby. It should be noted that a substantial reduction in
104
left-turning RLR violations occurred at the spillover intersection of 19th
Street and Iowa Street,
and that the blue lights can clearly be seen by the drivers at this intersection.
Analysis of the data showed a slight decrease in left-turn RLR violations at the control
intersections located far away from the treatment and spillover intersections. As shown, the
intersection of Clinton Parkway and Kasold Drive saw a large number of left-turning RLR
violations throughout the study, indicating that although this was a positive effect in the
reduction of RLR violations, there are some major intersections in Lawrence that are seeing an
increase.
6.3.2 Analysis of Through-movement RLR Violations
Table 21 shows the results of the analysis for the through movements only. The morning
and evening peak hours were combined. Table 21 shows: the intersection, RLR violations
recorded, number of vehicles counted, RLR rates per 10,000 vehicles, and percent change in
violation rates between periods. For the percent change in violation rates, a period represents an
infinite change. A total change in RLR rates is the average rate for the treatment site, treatment
site with no confirmation lights, spillover sites, and control sites
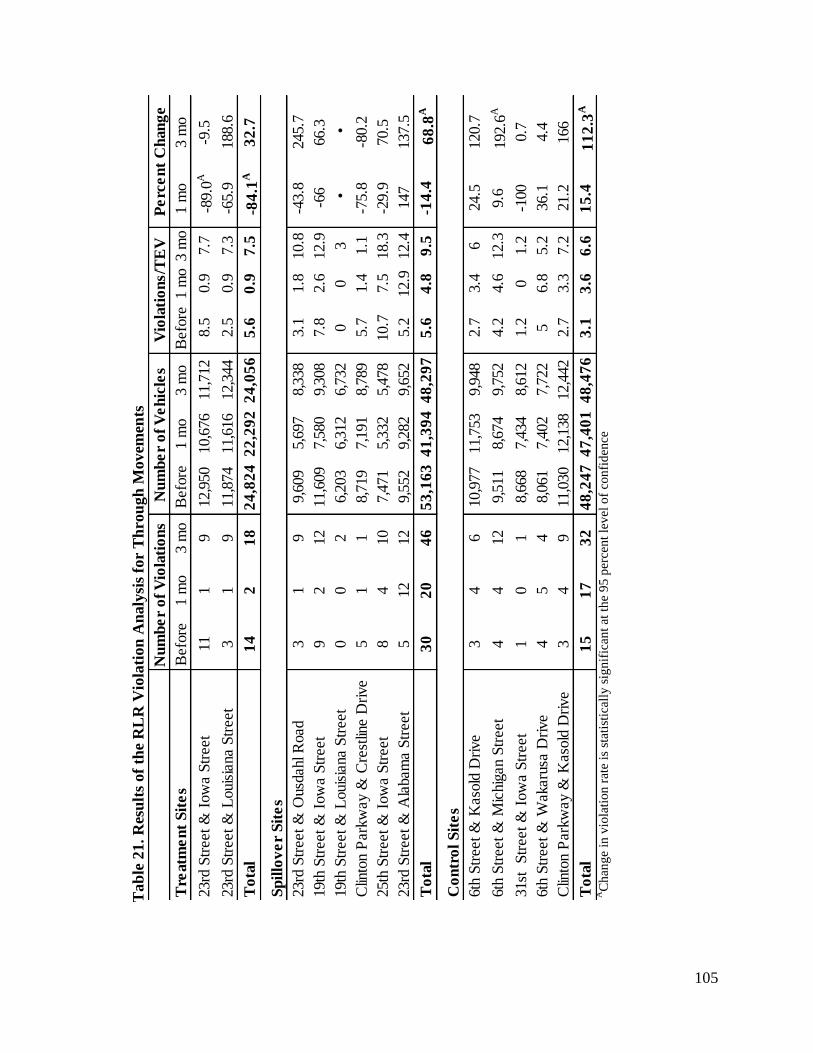
105
Tre
atm
en
t S
ite
sB
efo
re1 m
o3 m
oB
efo
re1 m
o3 m
oB
efo
re1 m
o3 m
o1 m
o3 m
o
23rd
Str
eet
& I
ow
a S
treet
11
19
12,9
50
10,6
76
11,7
12
8.5
0.9
7.7
-8
9.0
A-9
.5
23rd
Str
eet
& L
ouis
iana S
treet
31
911,8
74
11,6
16
12,3
44
2.5
0.9
7.3
-65.9
188.6
To
tal
14
21
82
4,8
24
22
,29
22
4,0
56
5.6
0.9
7.5
-8
4.1
A3
2.7
Sp
illo
ve
r S
ite
s
23rd
Str
eet
& O
usd
ahl R
oad
31
99,6
09
5,6
97
8,3
38
3.1
1.8
10.8
-43.8
245.7
19th
Str
eet
& I
ow
a S
treet
92
12
11,6
09
7,5
80
9,3
08
7.8
2.6
12.9
-66
66.3
19th
Str
eet
& L
ouis
iana S
treet
00
26,2
03
6,3
12
6,7
32
00
3 •
•
Clin
ton P
ark
way &
Cre
stlin
e D
rive
51
18,7
19
7,1
91
8,7
89
5.7
1.4
1.1
-75.8
-80.2
25th
Str
eet
& I
ow
a S
treet
84
10
7,4
71
5,3
32
5,4
78
10.7
7.5
18.3
-29.9
70.5
23rd
Str
eet
& A
labam
a S
treet
512
12
9,5
52
9,2
82
9,6
52
5.2
12.9
12.4
147
137.5
To
tal
30
20
46
53
,16
34
1,3
94
48
,29
75
.64
.89
.5-1
4.4
6
8.8
A
Co
ntr
ol
Sit
es
6th
Str
eet
& K
aso
ld D
rive
34
610,9
77
11,7
53
9,9
48
2.7
3.4
624.5
120.7
6th
Str
eet
& M
ichig
an S
treet
44
12
9,5
11
8,6
74
9,7
52
4.2
4.6
12.3
9.6
192.6
A
31st
S
treet
& I
ow
a S
treet
10
18,6
68
7,4
34
8,6
12
1.2
01.2
-100
0.7
6th
Str
eet
& W
akaru
sa D
rive
45
48,0
61
7,4
02
7,7
22
56.8
5.2
36.1
4.4
Clin
ton P
ark
way &
Kaso
ld D
rive
34
911,0
30
12,1
38
12,4
42
2.7
3.3
7.2
21.2
166
To
tal
15
17
32
48
,24
74
7,4
01
48
,47
63
.13
.66
.61
5.4
1
12
.3A
Nu
mb
er
of
Vio
lati
on
sN
um
be
r o
f V
eh
icle
sV
iola
tio
ns/T
EV
P
erc
en
t C
han
ge
AC
han
ge
in v
iola
tion
rat
e is
sta
tist
ical
ly s
ign
ific
ant
at t
he
95 p
erce
nt
lev
el o
f co
nfi
den
ce
Tab
le 2
1. R
esu
lts
of
the
RL
R V
iola
tion
An
aly
sis
for
Th
rou
gh
Movem
ents
106
As shown in Table 21, the treatment intersections saw a decrease in RLR violation one
month after installation of the confirmation lights. An increase in violation rate was observed at
23rd
Street and Louisiana Street and a decrease in violation rate at 23rd
Street and Iowa Street
during the three months after study. An overall reduction in through-movement RLR violations
of 84.1 percent was found in the one month after study and a 32.7 percent increase in
through-movement RLR violations for the three months after study period. It is speculated that
the through-movement traffic noticed the blue lights immediately after installation and then got
accustomed to the treatment. The decrease in through-movement RLR violations for the
intersection of 23rd
Street and Iowa Street as well as the overall decrease in through-movement
red light running violations for one month after study was statistically significant at the 95
percent level of confidence.
The spillover intersections followed a similar trend as the treatment intersections in that
the through-movement RLR violations decreased one month after the blue confirmation light
installation and then saw an increase in through-movement RLR violations for the three month
study. It should be noted that the decrease was smaller than the treatment intersections and the
increase was larger (and statistically significant at the 95 percent level of confidence) as
compared to the treatment intersections.
Considering the control intersections, it was found that through-movement RLR
violations increased in both study periods, with the overall three month percentage being
statistically significant at the 95 percent level of confidence. In general, the blue confirmation
lights had a positive impact on the RLR violations for the through-movement traffic at the
treatment and spillover intersections even though the lights were installed for the left-turning
movements only.
107
6.4 Before-After Effect on Violation Time into Red
A secondary performance matrix that was used in evaluating the confirmation lights was the
violation time into red, which was defined as the time elapsed prior to a violation occurring.
Studies have shown that RLR violations occurring more than two seconds after the red signal
indication are more dangerous compared to violations occurring less than a second after the all-
red phase (Fitzsimmons et al., 2007; Lum and Wong, 2003). During an all-red phase, vehicles
that enter the intersection less than a second after the red indication normally clear the
intersection before vehicles currently stopped at the cross street get the green light to start. In
such instances, drivers of vehicles in the cross street are not exposed to potential conflicts that
could result in crashes. However, drivers who enter the intersection late may put themselves and
other road users at risk. An analysis of a before-after effect on RLR violation time into red was
conducted to determine whether confirmation lights have the potential to change driver behavior
when a violation occurred. The null and alternate hypotheses were stated respectively as:
Ho : Confirmation lights have no effect on the frequency of RLR violation time into red
Ha: Confirmation lights have effect on the frequency of RLR violation time into red
6.5 Methodology
After the video data were reduced, RLR violations for left-turn and through-movement were
combined and categorized into two groups. Group 1 consisted of all the RLR violations which
occurred within two seconds after the onset of the red signal and group 2 consisted of the
violations which occurred more than two seconds after the red indication. Two seconds was
chosen because in the City of Lawrence, a minimum of 1.5 seconds is used for the all red
interval. This means that any RLR violation after 1.5 seconds into red has a high probability of
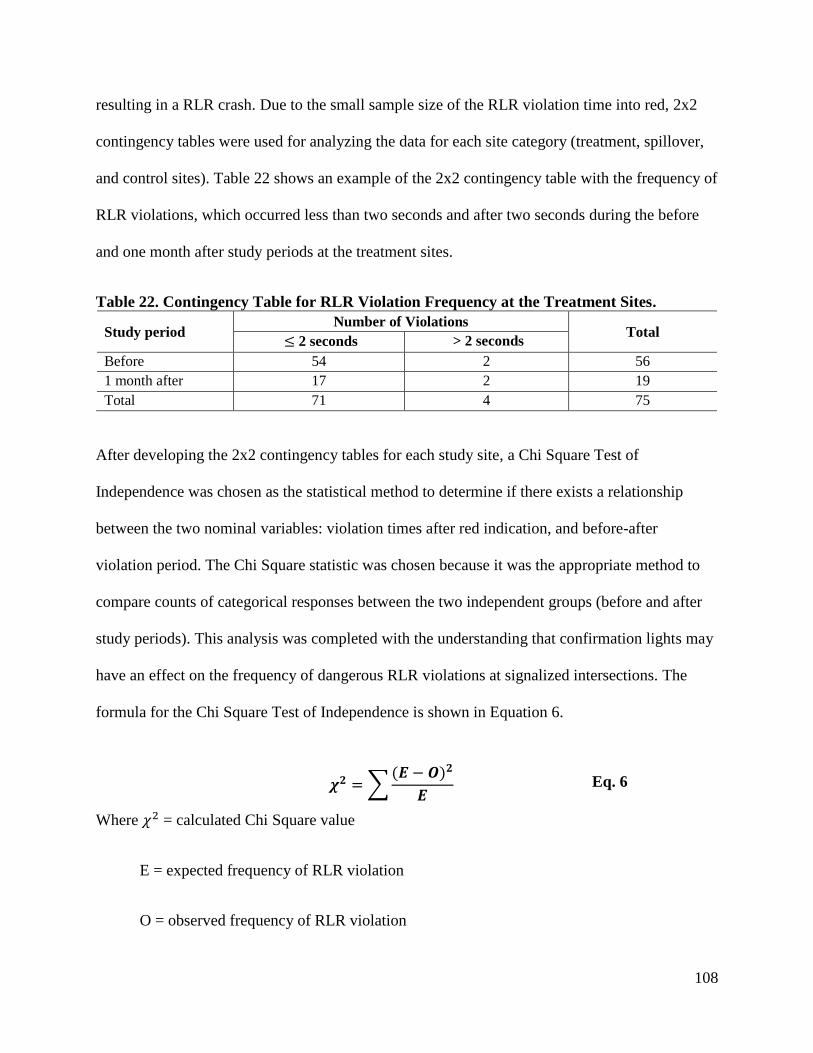
108
resulting in a RLR crash. Due to the small sample size of the RLR violation time into red, 2x2
contingency tables were used for analyzing the data for each site category (treatment, spillover,
and control sites). Table 22 shows an example of the 2x2 contingency table with the frequency of
RLR violations, which occurred less than two seconds and after two seconds during the before
and one month after study periods at the treatment sites.
Table 22. Contingency Table for RLR Violation Frequency at the Treatment Sites.
Study period Number of Violations
Total 2 seconds > 2 seconds
Before 54 2 56
1 month after 17 2 19
Total 71 4 75
After developing the 2x2 contingency tables for each study site, a Chi Square Test of
Independence was chosen as the statistical method to determine if there exists a relationship
between the two nominal variables: violation times after red indication, and before-after
violation period. The Chi Square statistic was chosen because it was the appropriate method to
compare counts of categorical responses between the two independent groups (before and after
study periods). This analysis was completed with the understanding that confirmation lights may
have an effect on the frequency of dangerous RLR violations at signalized intersections. The
formula for the Chi Square Test of Independence is shown in Equation 6.
∑
Eq. 6
Where = calculated Chi Square value
E = expected frequency of RLR violation
O = observed frequency of RLR violation
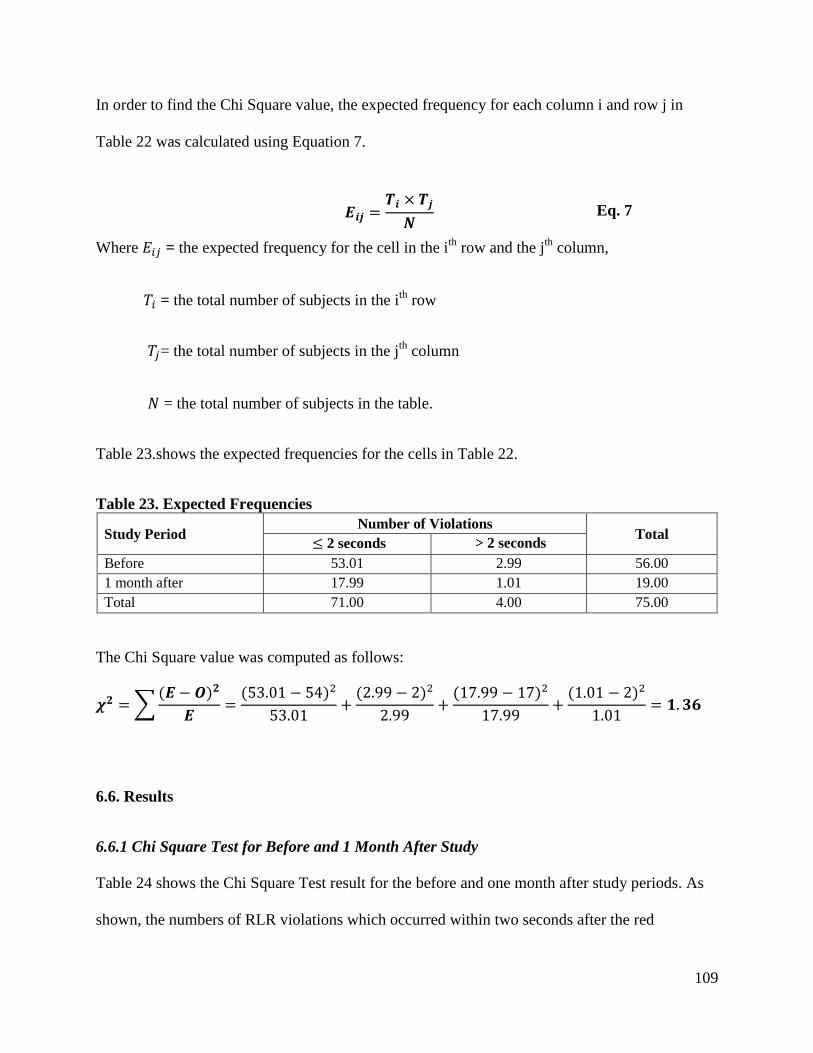
109
In order to find the Chi Square value, the expected frequency for each column i and row j in
Table 22 was calculated using Equation 7.
Eq. 7
Where = the expected frequency for the cell in the ith
row and the jth
column,
= the total number of subjects in the ith
row
= the total number of subjects in the jth
column
= the total number of subjects in the table.
Table 23.shows the expected frequencies for the cells in Table 22.
Table 23. Expected Frequencies
Study Period Number of Violations
Total 2 seconds > 2 seconds
Before 53.01 2.99 56.00
1 month after 17.99 1.01 19.00
Total 71.00 4.00 75.00
The Chi Square value was computed as follows:
∑
6.6. Results
6.6.1 Chi Square Test for Before and 1 Month After Study
Table 24 shows the Chi Square Test result for the before and one month after study periods. As
shown, the numbers of RLR violations which occurred within two seconds after the red
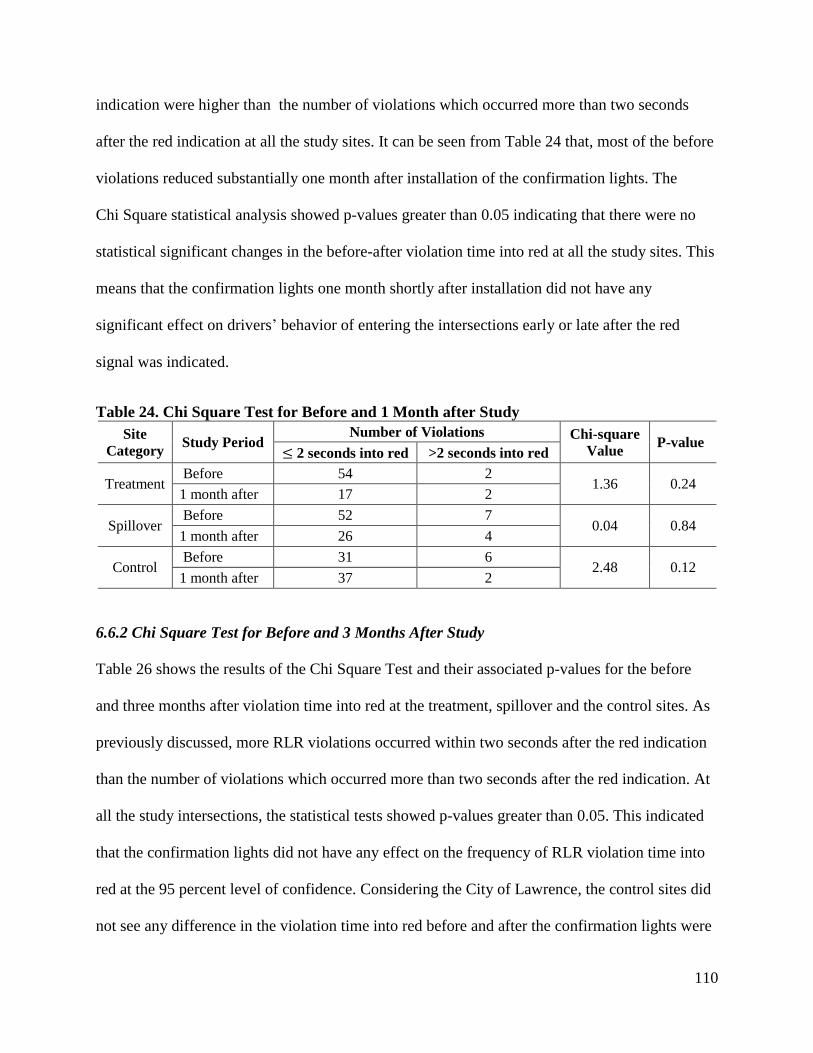
110
indication were higher than the number of violations which occurred more than two seconds
after the red indication at all the study sites. It can be seen from Table 24 that, most of the before
violations reduced substantially one month after installation of the confirmation lights. The
Chi Square statistical analysis showed p-values greater than 0.05 indicating that there were no
statistical significant changes in the before-after violation time into red at all the study sites. This
means that the confirmation lights one month shortly after installation did not have any
significant effect on drivers’ behavior of entering the intersections early or late after the red
signal was indicated.
Table 24. Chi Square Test for Before and 1 Month after Study
Site
Category Study Period
Number of Violations Chi-square
Value P-value
2 seconds into red >2 seconds into red
Treatment Before 54 2
1.36 0.24 1 month after 17 2
Spillover Before 52 7
0.04 0.84 1 month after 26 4
Control Before 31 6
2.48 0.12 1 month after 37 2
6.6.2 Chi Square Test for Before and 3 Months After Study
Table 26 shows the results of the Chi Square Test and their associated p-values for the before
and three months after violation time into red at the treatment, spillover and the control sites. As
previously discussed, more RLR violations occurred within two seconds after the red indication
than the number of violations which occurred more than two seconds after the red indication. At
all the study intersections, the statistical tests showed p-values greater than 0.05. This indicated
that the confirmation lights did not have any effect on the frequency of RLR violation time into
red at the 95 percent level of confidence. Considering the City of Lawrence, the control sites did
not see any difference in the violation time into red before and after the confirmation lights were
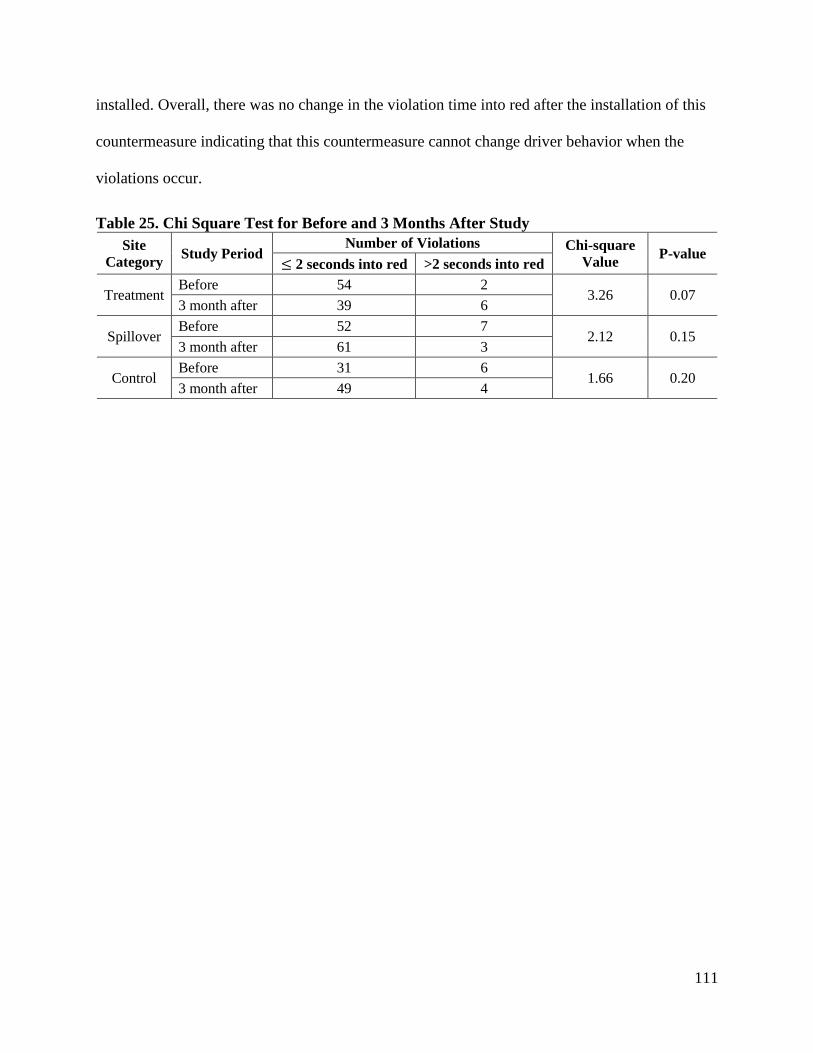
111
installed. Overall, there was no change in the violation time into red after the installation of this
countermeasure indicating that this countermeasure cannot change driver behavior when the
violations occur.
Table 25. Chi Square Test for Before and 3 Months After Study
Site
Category Study Period
Number of Violations Chi-square
Value P-value
2 seconds into red >2 seconds into red
Treatment Before 54 2
3.26 0.07
3 month after 39 6
Spillover Before 52 7
2.12 0.15 3 month after 61 3
Control Before 31 6
1.66 0.20 3 month after 49 4
112
CHAPTER 7: CONCLUSIONS AND RECOMMENDATIONS
RLR continues to be a safety concern for many communities in the United States. The
consequences of RLR violations each year results in hundreds of fatalities and severe injury
crashes. Many communities have turned to automated red light cameras (high-cost
countermeasure) which studies have shown to be an effective system in reducing RLR violations
and related crashes. However, automated red light cameras are sometimes not practical, feasible
or legal in some communities. Confirmation light system, a low-cost engineering
countermeasures (both self-enforcing and aiding law enforcement), is another alternative to
automated red light cameras in mitigating RLR violations and associated crashes.
This research study evaluated blue confirmation lights at two signalized intersections in
the City of Lawrence, Kansas. The two treatment sites were identified by working directly with
the City of Lawrence Traffic Engineering Department, and the Lawrence Police Department. In
addition to the two treatment intersections, spillover intersections next to the treatment
intersections were selected to determine if the confirmation lights have any on RLR violations at
nearby intersections. Also, control intersections were identified within the City of Lawrence but
were located far from the treatment intersections or the corridor under investigation.
Typical countermeasure effectiveness studies usually rely on three to six years of before
and after crash data. Since crash data were limited to this study, a before-after violation study
was used as a surrogate measure to evaluate the effectiveness of the blue confirmation lights.
This study was completed with the understanding that a decrease or an increase in RLR
violations would be equated to a possible decrease or increase RLR crashes based on traffic
exposure.
113
Prior to installation of the confirmation lights in July 2013, field video data were
collected at the study sites and considered as the before study period. One month after and three
months after installation of the confirmation lights, RLR violation data were collected at the
study sites to determine the short-term and long-term effectiveness of the lights. A test of
proportion was used to analyze the changes in violation rates from the before period to each after
period. Moreover, a Chi Square Test of Independence was also utilized to analyze the RLR
violation times into red as a secondary performance matrix to evaluate whether confirmation
lights had any effects on driver behavior.
7.1 Summary of Findings
7.1.1 General Conclusions
Right-turn violation by a single vehicle was the most common type of RLR violation in
the City of Lawrence. This violation type contributed to approximately half of the RLR
violations observed during each study period. The before and one month after study periods
showed left-turn RLR violation by a single vehicle as the second most observed violation type
followed by a through-movement violation by a single vehicle. However, the three months after
study saw more through-movement violation by a single vehicle than left-turn violation by a
single vehicle.
Multiple vehicles running red lights either in a platoon or traveling side by side on the left
and through lanes accounted for less than two percent of the total observed violations for each
study period. The percentage of right-turn violations by multiple vehicles in platoon ranged from
three to six percent.
114
During each study period, more than 98 percent of the RLR violations were committed
by drivers of passenger cars. Buses, trucks and recreational vehicles were less involved in the
observed RLR violations (accounted for about two percent of the total entering vehicles).
The frequency of the RLR violations was highest in the morning between 7:30 a.m. and 8
a.m. and in the evening between 5 p.m. and 5:30 p.m. for each study period.
7.1.2 Left-turn and Through-movement RLR Violations
In general, the one month after violation study saw a 57.4 percent reduction in the
left-turn RLR violation rates at the treatment sites and a 55.7 percent reduction at the spillover
sites. Both of these reductions were statistically significant at the 95 percent level of confidence.
At the treatment sites, the violation study three months after the installation of the confirmation
lights saw a 42.7 percent decrease in RLR violation rates, which was statistically significant, and
a 31.7 percent decrease (not statistically significant) at spillover sites. Considering the control
sites, there was minimal reduction in left-turn RLR violations, which indicate that confirmation
lights had a positive effective in reducing RLR violation in the short and long term periods.These
findings are consistent or similar with the study reported by Reddy et al. (2008), where they saw
a 25 percent reduction in violations after the implementation of confirmation lights.
The presence of the confirmation lights (installed on left-turning approaches at the
treatment sites) had a positive impact on through-movement traffic at treatment and spillover
sites in the short term period. One month after installation of the confirmation lights, the
treatment sites saw 84.1 percent overall reduction in violations which was statistically
significant. However, the three month after study did not see any significant change. The
spillover sites saw 14.4 percent overall reductions (not statistically significant) in violations
during the one month after study but saw an overall increase (68.8 percent) in violation rates
115
during the three months after study which was statistically significant. At the control sites, the
violation rates increased during both one month after study (not statistically significant) and
three months after study (statistically significant) periods. Although the treatment intersections
did not have confirmation lights installed for the through movement, the lights were effective in
the short term for reducing RLR violations.
7.1.3 Left-turn and Through-movement RLR Violations Time into Red
Results of the analysis of the RLR violation time into red showed that most violations
occurred less than one second after the onset of the red phase of the signal. This indicated that
the violations were most likely intentional. RLR violations more than five seconds after the
indication of the red signal indication were also observed at the study intersections. These
violations were all early departures, thus, violators initially stopped on red but ran the red light
upon waiting for more than five seconds after the red signal was indicated.
The Chi Square Test showed no statistical significant effect (at 95 percent level of
confidence) on RLR violation time into red one month after and three months after installation of
the confirmation lights. No significant relation was found between RLR violation time into red
and the treatment (blue confirmation lights). This means that this countermeasure is less effective
in changing driver behavior when a violation occurs.
Overall, the finding of this study showed that confirmation lights when used in
combination with normal enforcement can have a positive impact in reducing RLR violations
and related crashes at signalized intersections.
116
7.2 Contributions to Highway Safety
This research study has shown that confirmation lights, when used in combination with
target enforcement efforts can provide the intersection safety, efficiency and cost benefits in the
following ways:
Confirmation lights reduce RLR violations which may result in serious crashes. Thereby
promoting safety at signalized intersections.
Confirmation lights are low-cost (cost range between $110 and $140) alternative to
automated enforcement. They are also easy to install and maintain.
Confirmation lights can potentially replace a police officer (located upstream of an
intersection observing RLR violations). This will maximize the efficient use of police
enforcement resources.
Confirmation lights have no privacy issues of controversial automated photography.
7.3 Future Research
This study evaluated the effectiveness of confirmation lights at signalized intersections in
Lawrence, Kansas after one and three months after installation. It is recommended that
Crash data analysis should be conducted to evaluate the effectiveness of confirmation
lights in reducing RLR crashes if crash data become available.
Additional violation study one year or more after the installation should be conducted to
determine if confirmation lights have long lasting impacts on reducing RLR violations in
order to avoid any seasonal changes that may be present in this current research. This
study may also be conducted to include off-peak hours if possible.
117
REFERENCES
AAA Foundation for Traffic Safety. 2013 Traffic Safety Culture Index. Washington, DC,
January, 2014.
Beeber, J. Safer Streets in Los Angeles: Why Engineering Countermeasures are More Effective
than Photo Enforcement in Reducing Red Light Related Crashes. Safety Streets L.A.
www.saferstreetsla.org. Accessed May 15, 2014.
Bonneson, J., and K. Zimmerman. Red Light Running Handbook: An Engineer's Guide to
Reduce Red Light Related Crashes. Report FHWA/TX-05/0-4196-P1. Texas Transportation
Institute, Texas A&M University, College Station, TX, 2004.
Bonneson, J.A., and K.H. Zimmermann. Effect of Yellow Interval Timing on Red Light Violation
Frequency at Urban Intersections. Texas Transportation Institute, Texas A&M University,
College Station, TX, 2003.
Bonneson, J.A., and K. Zimmermann, M. Brewer. Engineering Countermeasures to Reduce Red
Light Running. Texas Transportation Institute, Texas A&M University, College Station, 2002.
Cunningham, C.M., and J.S. Hummer. Evaluating the Use of Red Light Running Photographic
Enforcement Using Collisions and Red Light Running Violations. Institute for Transportation
Research and Education, North Carolina State University, Raleigh, NC, 2004.
Datta, K.T., K. Schattler, and S. Datta. Red Light Violations and Crashes at Urban Intersections.
In Transportation Research Record: Journal of the Transportation Research Board, No. 7134,
Transportation Research Board of National Academies, Washington, D.C., 2000, pp. 52-58.
Eccles, P.L., and H.W. McGee. A History of the Yellow and All-Red Intervals for Traffic Signals.
Washington D.C: Institute of Transportation Engineers, 2001
118
Federal Highway Administration. How Red-Light Running is Defined and How Crash Figures
Are Determined. FHWA, U.S. Department of Transportation, Washington D.C.
http://safety.fhwa.dot.gov/intersection/redlight/howto/ Accessed January 10, 2014.
Federal Highway Administration. Manual on Uniform Traffic Control Device (MUTCD) 2009.
U.S. Department of Transportation, Washington, D.C., 2009.
http://mutcd.fhwa.dot.gov/ Accessed October 24, 2013.
Federal Highway Administration. Red Light Camera Systems Operational Guidelines. U.S.
Department of Transportation, Washington, D.C., 2005.
http://safety.fhwa.dot.gov/intersection/redlight/cameras/fhwasa05002/fhwasa05002.pdf
Accessed February 10, 2014.
Federal Highway Administration. Red-Signal Enforcement Lights. U.S. Department of
Transportation, Washington, D.C., 2009.
http://safety.fhwa.dot.gov/intersection/resources/techsum/fhwasa09005/ Accessed January 15,
2014.
Federal Highway Administration. Retroflective Borders on Traffic Signal Backplates. U.S.
Department of Transportation, Washington, D.C, 2010.
http://www.dot.state.fl.us/trafficoperations/operations/safetyisgolden_rdwy_improvements.shtm
Accessed February 10, 2014
Fitzsimmons, E.J., S. Hallmark, T. McDonald, M. Orellana, and D. Matulac. The Effectiveness of
Iowa's Automated Red Light Running Enforcement Programs. Center for Transportation
Research and Education, Iowa State University, Ames, IA, 2007.
Hallmark, S., N. Oneyear, and T. McDonald. Toolbox of Countermeasures to Reduce Red Light
Running. Center for Transportation Research and Education, Iowa State University, Ames, IA,
2012.
119
Hill, S.E, and J.K. Lindly. Red Light Running Prediction and Analysis. Report FHWA/CA/OR-.
University Transportation Centre for Alabama, University of Alabama, Tuscaloosa, AL, 2003.
Hsu, P., J. Smith, and E. Rice. Red Light Signal Enforcement. FHWA, U.S. Department of
Transportation, Washington, D.C., 2009.
Insurance Institute for Highway Safety. Q&A Red light Cameras.
http://www.iihs.org/iihs/topics/t/red-light-running/qanda. Accessed April 15, 2014
Kamyab, A., T. McDonald, and J.J. Stribiak. Red Light Running in Iowa: The Scope, Impact,
and Possible Implications. Center for Transportation Research and Education, Iowa State
University, Ames, 2000.
Lum, K. M. and Wong, Y. D. (2003). Impacts of Red Light Camera on Violation Characteristics.
Journal of Transportation Engineering, November/December, 648-656
Manual on Uniform Traffic Control Device (MUTCD). 2009 Edition.
http://mutcd.fhwa.dot.gov/ Accessed October 24, 2013.
McCartt, T.A., and A. Eichelberge. Attitudes Towards Red Light Cameras in Large Cities with
Camera Programs.In Traffic Injury Prevention. Vol 13, 2012, pp. 14-23.
McCartt, T.A., and W. Hu. Effects of Red Light Camera Enforcement on Red Light Violations in
Arlington County, Virginia. Journal of Safety Research. Vol 48, 2014, pp. 57-62.
McGee, H., K. Moriarty, K. Eccles, M. Liu, T. Gates, and R. Retting. NCHRP Report 731:
Guidelines for Timing Yellow and All-Red Intervals at Signalized Intersections. Transportation
Research Board, Washington, D.C., 2012.
120
McGee, H.W., K. Eccles, J. Clark, L.prothe, and C. O'Connell. Making Intersections Safer: A
Toolbox of Engineering Countermeasures. Informational Report. Federal Highway
Administration, Institute of Transportation Engineers, Washington, D.C., 2003.
Messer, C.J., S.R. Sunkari, H.A. Charara, and R.T. Parker. Development of Advanced Warnining
Systems for End-of-Green Phase at High Speed Traffic Signals. Report FHWA/TX-04/0-4260-4.
Texas Transportation Institute, Texas A&M Universtiy, College Station, TX, 2004.
Minnesota Local Technical Assistance Program. 2009 Local Operational Research Assistance
(OPERA) Program Annual Report. University of Minnesota, Minneapolis, Minnesota, 2009.
Nicolson, A.J. The Variability of Accident Counts. Accident Analysis and Prevention, Vol. 17,
No. 1, 1985, pp. 47-56.
Lum, K. M. and Wong, Y. D. (2003). Impacts of Red Light Camera on Violation Characteristics.
Journal of Transportation Engineering, November/December, 648-656.
Persaud, N.B., R.A. Retting, P.E. Garder, and D. Lord. Safety Effect of Roundabout Conversions
in the United States, Empirical Bayes Observational Before-After Study. In Transportation
Research Record: Journal of Transportation Research Board, No. 1751, Transportation
Research Board of National Academies, Washington, D.C., 2007, pp. 1- 8.
Polanis, Stanley F. Improving Intersection Safety Through Design and Operations
(EXAMPLES). ITE Spring Conference and Exhibit, Palm Harbor, FL, 2002.
Porter, B.E., and K.J. England. Predicting Red-Light Running Behavior: A Traffic Safety Study
in Three Urban Settings. National Safety Council and Elsevier Science Ltd. Journal of Safety
Research.. Vol. 31, No. 1. 2000, pp. 1-8.
121
Porter, B.E., T.D. Berry, J. Harlow, and T. Vandecar. A Nationwide Survey of Red Light
Running: Measuring Driver Behaviors for the “Stop Red Light Running” Program. Old
Dominion University, Norfolk, VA, 1999.
Reddy, V., P. Datta, D. McAvoy, P. Savolainen, M. Abdel-Aty, and S. Pinapaka. Evaluation of
Innovative Safety Treatments. HNTB Corporation, Fort Lauderdale, FL, 2008.
Retting, R.A., and A.F. Williams. Characteristics of Red Light Violators: Results of a Field
Investigation. National Safety Council and Elsevier Science Ltd. Journal of Safety Research.
Vol. 27, No. 1. 1996, pp. 9-15.
Retting, Richard A., A .F. Williams, C. M. Farmer, and A. F Feldman. Evaluation of Red Light
Camera Enforcement in Oxnard, California. Accident Analysis and Prevention, Vol 31, No. 3,
1999(a), pp.169-174.
Retting, Richard A., A. F. Williams, C. M. Farmer, and A .F. Feldman. Evaluation of Red Light
Camera Enforcment in Fairfax, VA, USA. In ITE Journal, Vol 69, No. 8, 1999 (b), pp. 30-34
Retting, R.A., A.F Williams, and M.A. Greene. Red-Light Running and Sensible
Countermeasures: Summary of Research Findings. In Transportation Research Record: Journal
of Transportation Research Board, No. 1640, Transportaion Research Board of National
Academies, Washington, D.C., 1998, pp. 23-26.
Retting, R.A., and M.A. Greene. Influence of Traffic Signal Timing on Red Light Running and
Potential vehicle Conflicts at Urban Intersections. In Transportation Research Record: Journal
of Transportation Research Board, No. 1595, Transportaion Research Board of National
Academies, Washington, D.C., 1997, pp. 1-7.

122
Retting, R.A., and R.G. Ulmer, A.F. Williams. Prevalence and Characteristics of red Light
running crashes in the United States. Accident Analysis and Prevention, Vol 31, No. 6, 1999 (c),
pp. 687-694.
Retting, R. A., S. A. Ferguson, and C.M. Farmer. Reducing Red light Running Through Longer
Yellow Signal Timing and Red Light Camera Enforcement: Results of Field Investigation.
Insurance Institute for Highway Safety, Arlington, VA, 2007.
Retting, R. A., and S. Y. Kyrychenko. Reductions in Injury Crashes Associated With Red Light
Camera Enforcement in Oxnard, California. American Journal of Public Health, Vol 92, No.11,
2002, pp.1822-182.
Roadway Improvements. Traffic Engineering and Operation Office. Florida Department of
Transportation.
http://www.dot.state.fl.us/trafficoperations/operations/safetyisgolden_rdwy_improvements.shtm
Accessed January 12, 2014.
Rodegerdts, L., M. Blogg, E. Wemple, E. Myers, M. Kyte, M. Dixon, G. List, A. Flannery, R.
Troutbeck,, W. Brilon, N. Wu, B. Persaud, C. Lyon, D. Harkey, and D. Carter. NCHRP Report
572, Roundabouts in the United States. Transportation Research Board, Washington, D.C., 2007.
Schattler, K.L., D. McAVOY, M.T. Christ, and C.M. Glauber. Impact of Signal Mounting
Configurations on Red-Light Running at Urban Signalized Intersections. ITE Journal, Vol. 81,
No. 2, 2011, pp.22-24, 29-30.
Schattler, K.L., T.K. Datta, and C.L. Hill. Change and Clearance Interval Design on Red Light
Running and Late Exits. In Transportation Research Record: Journal of Transportation
Research Board, No. 1856, Transportaion Research Board of National Academies, Washington,
D.C., 2003, pp. 193-201.
123
State of Kansas, 2013 Statute, 21-6101, subsection (a)(6).
http://kslegislature.org/li/b2013_14/statute/021_000_0000_chapter/021_061_0000_article/021_0
61_0001_section/021_061_0001_k/. Accessed May 9, 2014.
Tarko, A., G. Davis, N. Saunier, T. Sayed, and S. Washington. White Paper. Surrogate Measures
of Safety. ANB20(3) Subcommittee on Surrogate Measures of Safety. ANB20 Committee on
Safety Data Evaluation and Analysis, 2009.
Traffic Engineering Handbook. 6th Edition. Institute of Transportation Engineers, 2009.
Tydlacka, J., A.P. Voigt, and W.C. Langford III. Evaluation of Lighted Pavement Marker Stop
Bars and LED Outlined Traffic Signal Backplates. IMSA Journal, Vol. 49, No. 3, 2011,
pp. 44-50.
Washburn, S.S., and K.G. Courage. Investigation of Red Light Running Factors. Department of
Civil and Coastal Engineering, University of Florida, Gainesville, FL, 2004.
Yang, C.Y., and W. Najm. Analysis of Red Light Violation Data Collected from Intersections
Equipped with Red Light Photo Enforcement Cameras. Report DOT-VNTSC-NHTSA-05-01.
U.S. Department of Transportation, Research and Innovative Technology Administration, John
A. Volpe National Transportation Systems Center, Cambridge, MA, 2006.
Zegeer, C.V., and R.C. Deen. Green-Extension Systems at High-Speed Intersections. ITE
Journal, 1978, pp.19-24.
124
APPENDIX A
Characteristics and Aerial Views of Intersections
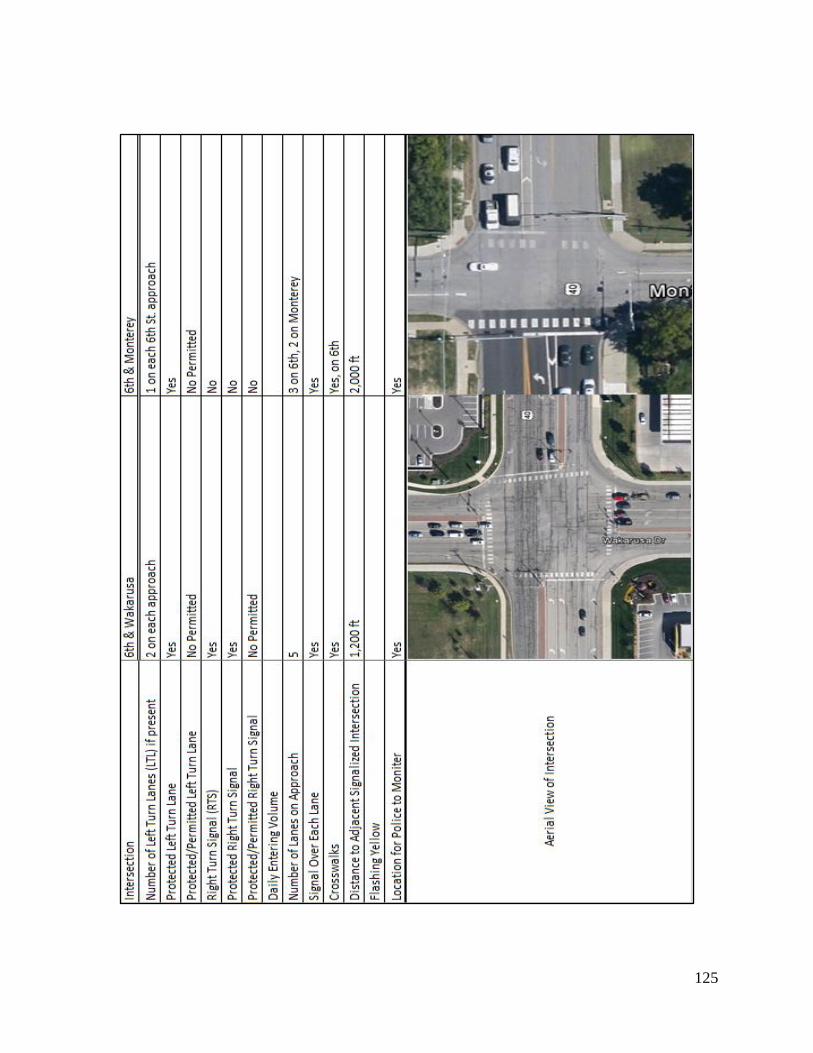
125
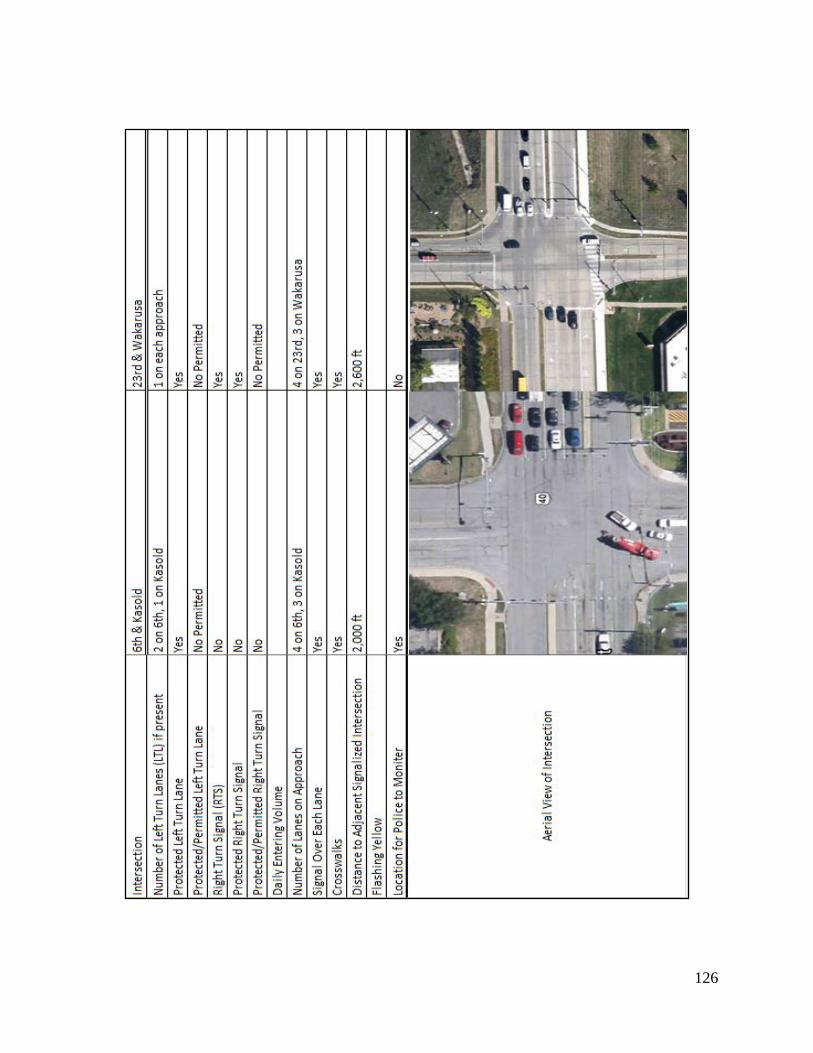
126
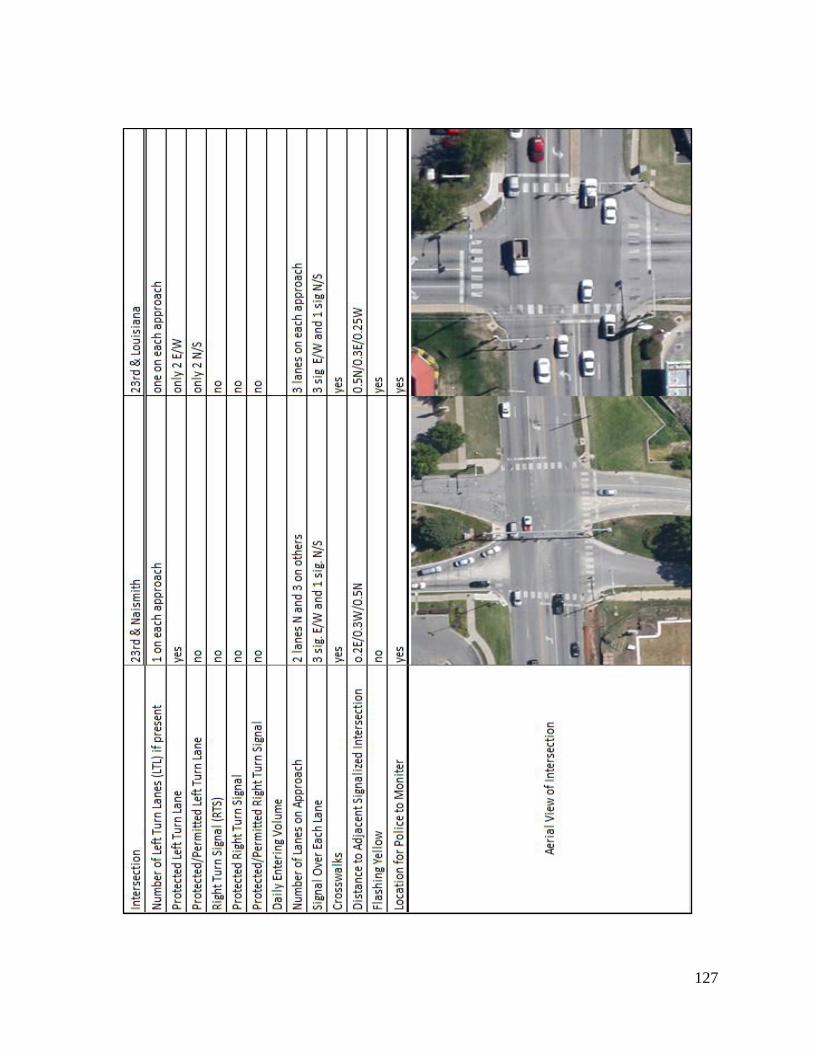
127
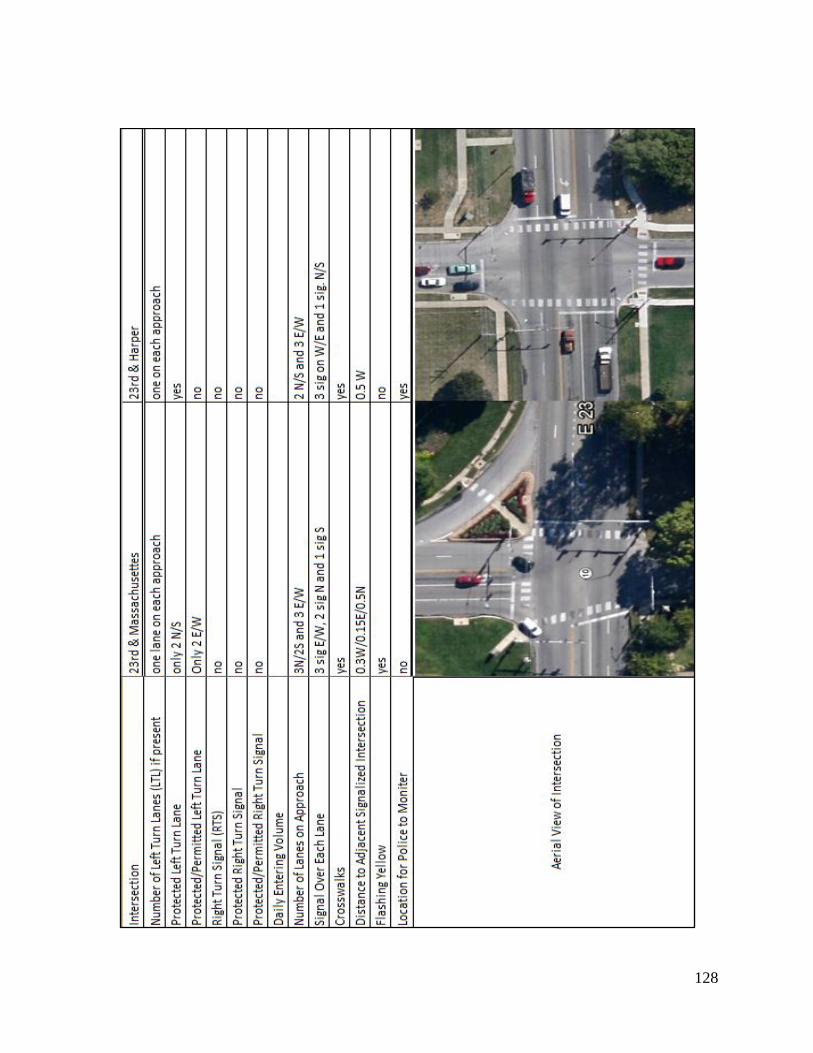
128
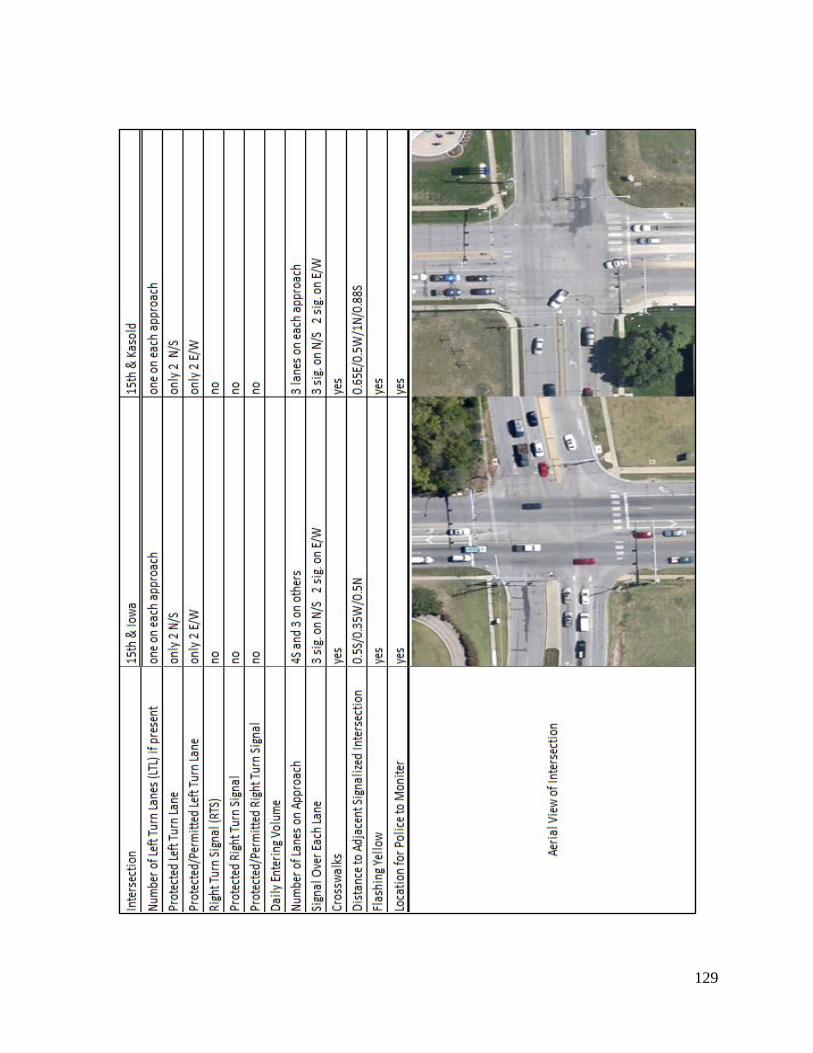
129
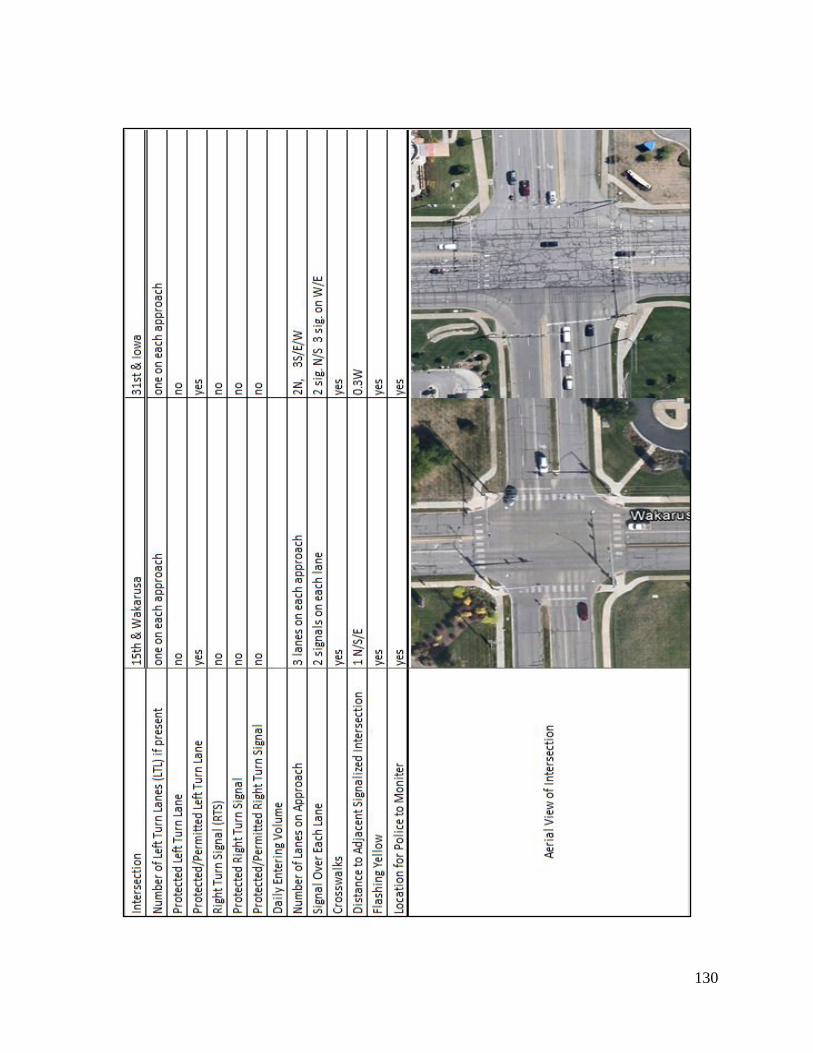
130
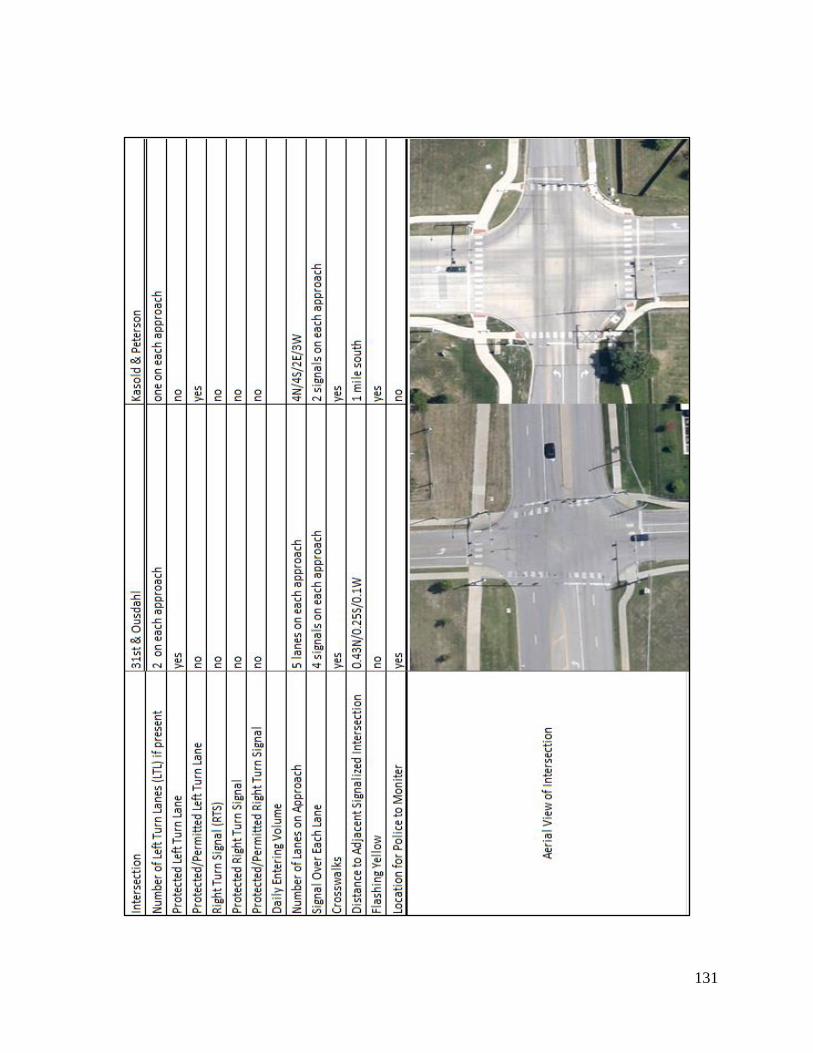
131
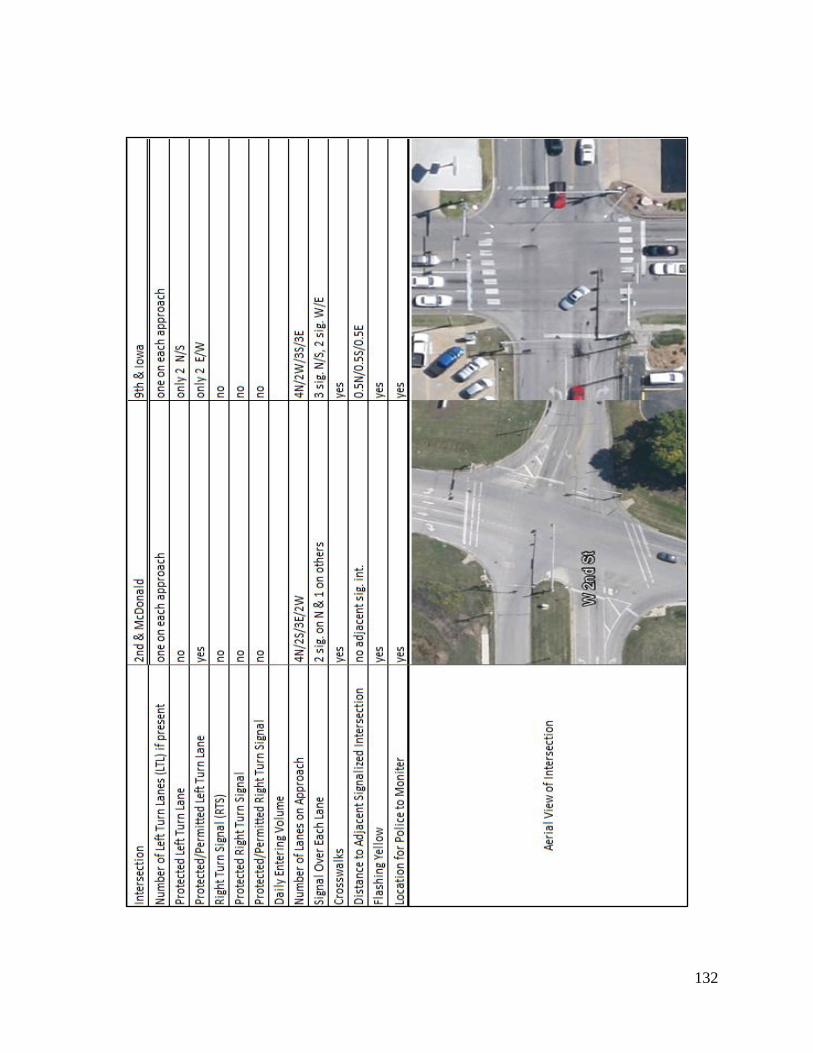
132
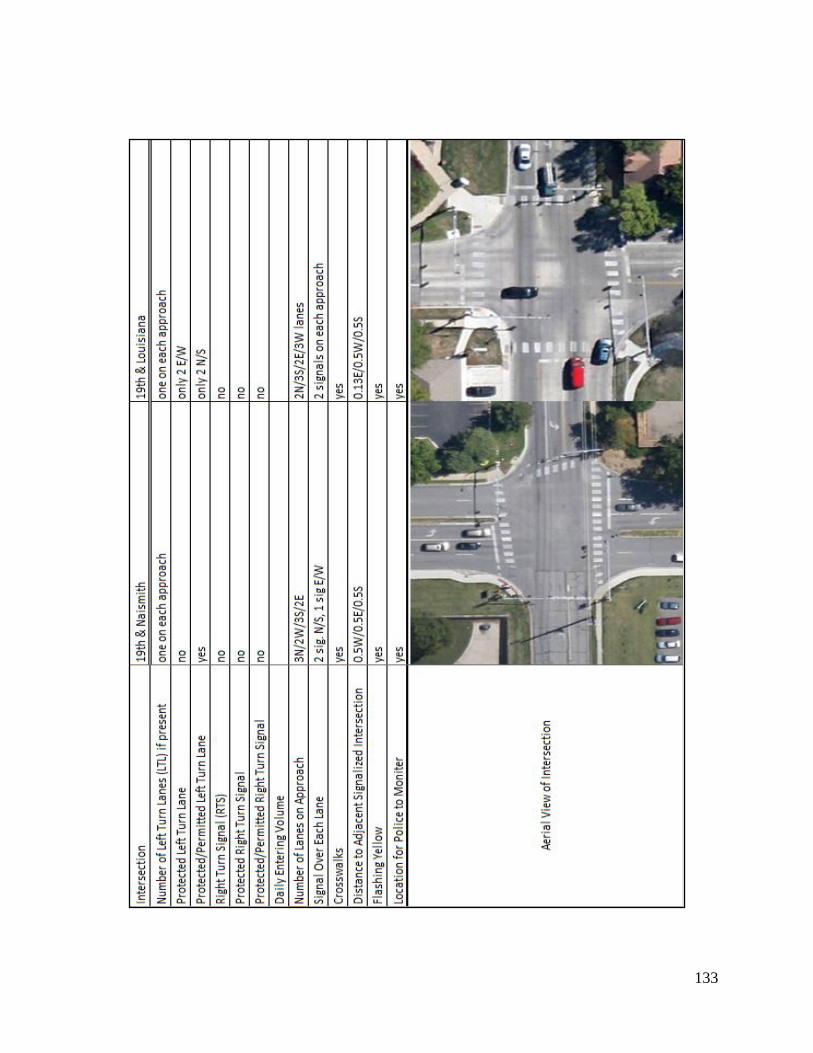
133
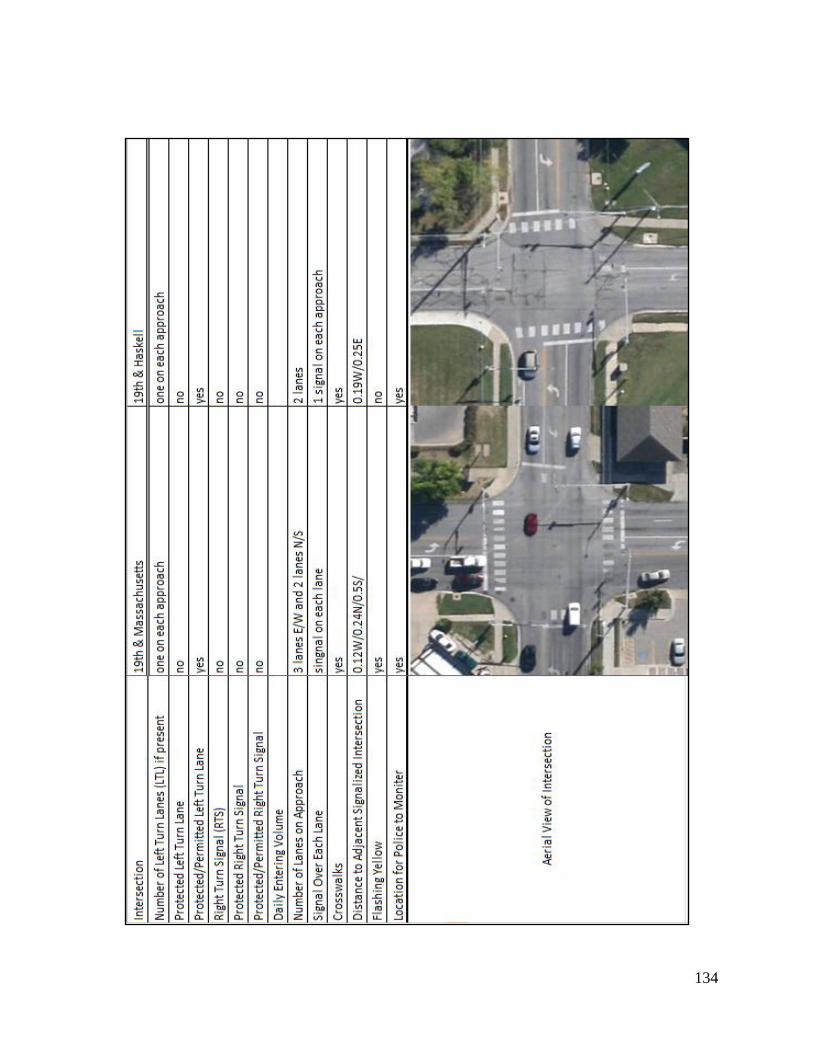
134
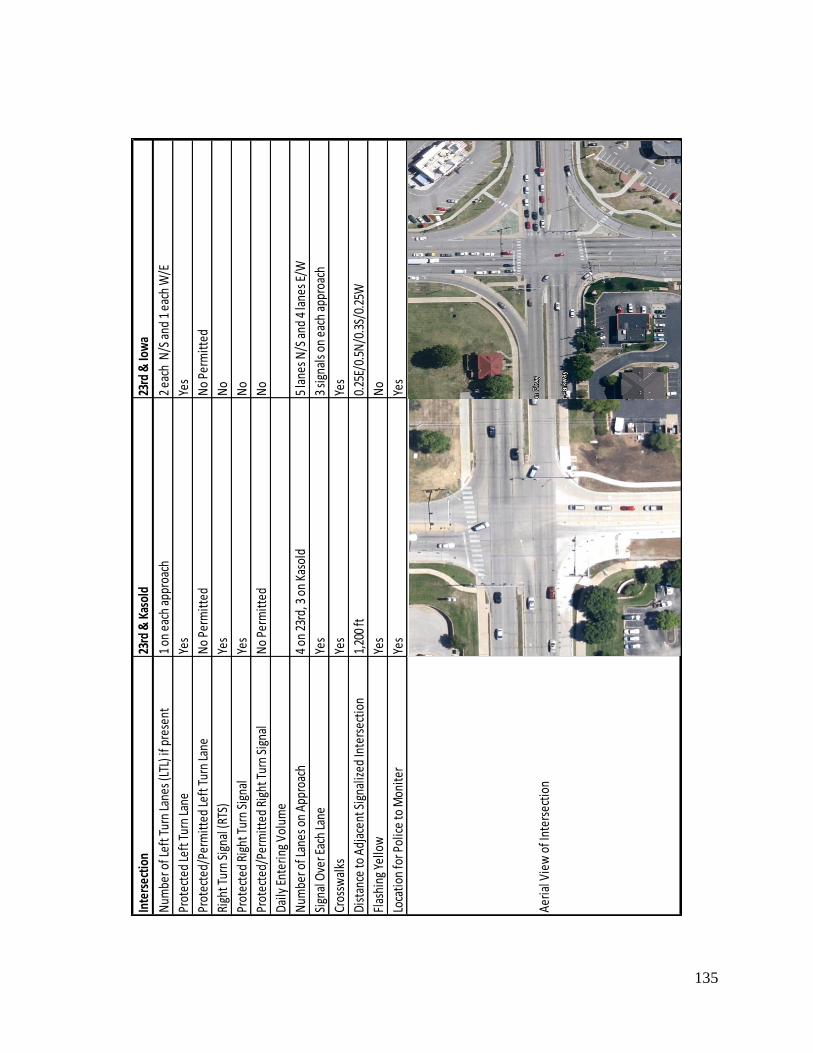
135
Inte
rsec
tion
23rd
& K
asol
d23
rd &
Iow
a
Num
ber o
f Lef
t Tur
n La
nes (
LTL)
if p
rese
nt1
on e
ach
appr
oach
2 ea
ch N
/S a
nd 1
eac
h W
/E
Prot
ecte
d Le
ft T
urn
Lane
Yes
Yes
Prot
ecte
d/Pe
rmitt
ed Le
ft T
urn
Lane
No
Perm
itted
No
Perm
itted
Righ
t Tur
n Si
gnal
(RTS
)Ye
sN
o
Prot
ecte
d Ri
ght T
urn
Sign
alYe
sN
o
Prot
ecte
d/Pe
rmitt
ed R
ight
Tur
n Si
gnal
No
Perm
itted
No
Daily
Ent
erin
g Vo
lum
e
Num
ber o
f Lan
es o
n Ap
proa
ch4
on 2
3rd,
3 o
n Ka
sold
5 la
nes N
/S a
nd 4
lane
s E/W
Sign
al O
ver E
ach
Lane
Yes
3 si
gnal
s on
each
app
roac
h
Cros
swal
ksYe
sYe
s
Dist
ance
to A
djac
ent S
igna
lized
Inte
rsec
tion
1,20
0 ft
0.25
E/0.
5N/0
.3S/
0.25
W
Flas
hing
Yel
low
Yes
No
Loca
tion
for P
olic
e to
Mon
iter
Yes
Yes
Aeria
l Vie
w o
f Int
erse
ctio
n
136
APPENDIX B
Reduced RLR Violation Data for Before and After Studies
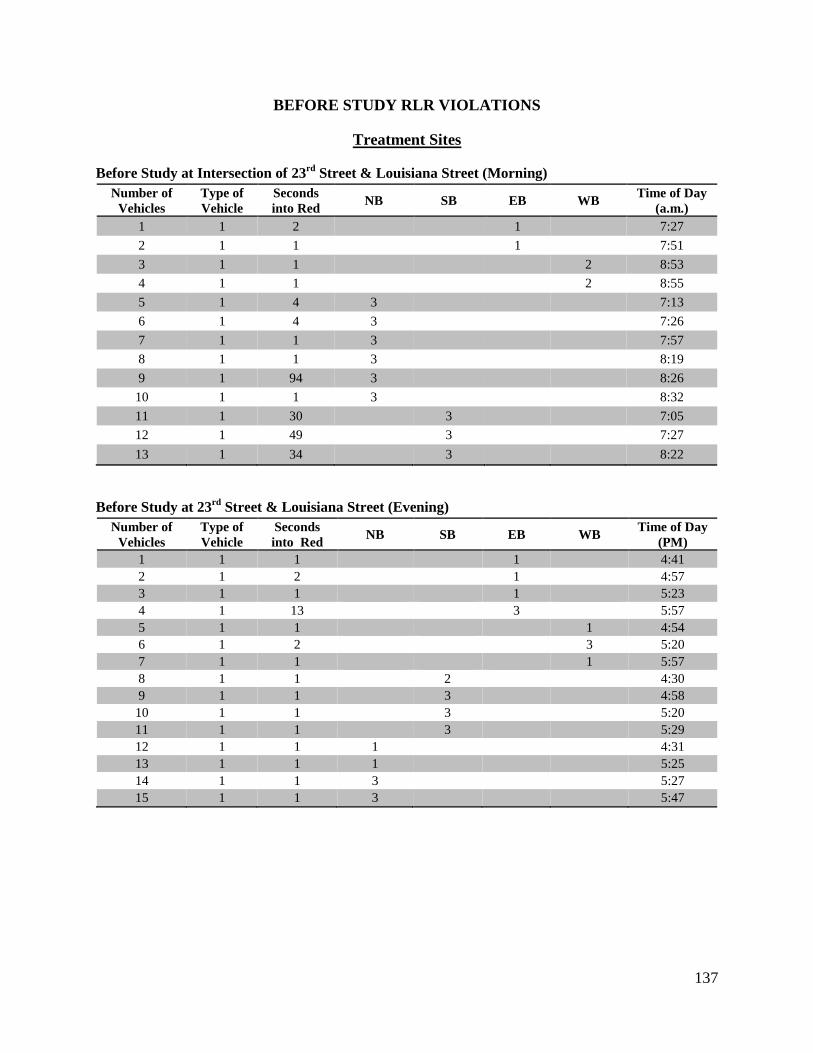
137
BEFORE STUDY RLR VIOLATIONS
Treatment Sites
Before Study at Intersection of 23rd
Street & Louisiana Street (Morning)
Number of
Vehicles
Type of
Vehicle
Seconds
into Red NB SB EB WB
Time of Day
(a.m.)
1 1 2
1
7:27
2 1 1
1
7:51
3 1 1
2 8:53
4 1 1
2 8:55
5 1 4 3
7:13
6 1 4 3
7:26
7 1 1 3
7:57
8 1 1 3
8:19
9 1 94 3
8:26
10 1 1 3
8:32
11 1 30
3
7:05
12 1 49
3
7:27
13 1 34
3
8:22
Before Study at 23rd
Street & Louisiana Street (Evening)
Number of
Vehicles
Type of
Vehicle
Seconds
into Red NB SB EB WB
Time of Day
(PM)
1 1 1
1
4:41
2 1 2
1
4:57
3 1 1
1
5:23
4 1 13
3
5:57
5 1 1
1 4:54
6 1 2
3 5:20
7 1 1
1 5:57
8 1 1
2
4:30
9 1 1
3
4:58
10 1 1
3
5:20
11 1 1
3
5:29
12 1 1 1
4:31
13 1 1 1
5:25
14 1 1 3
5:27
15 1 1 3
5:47
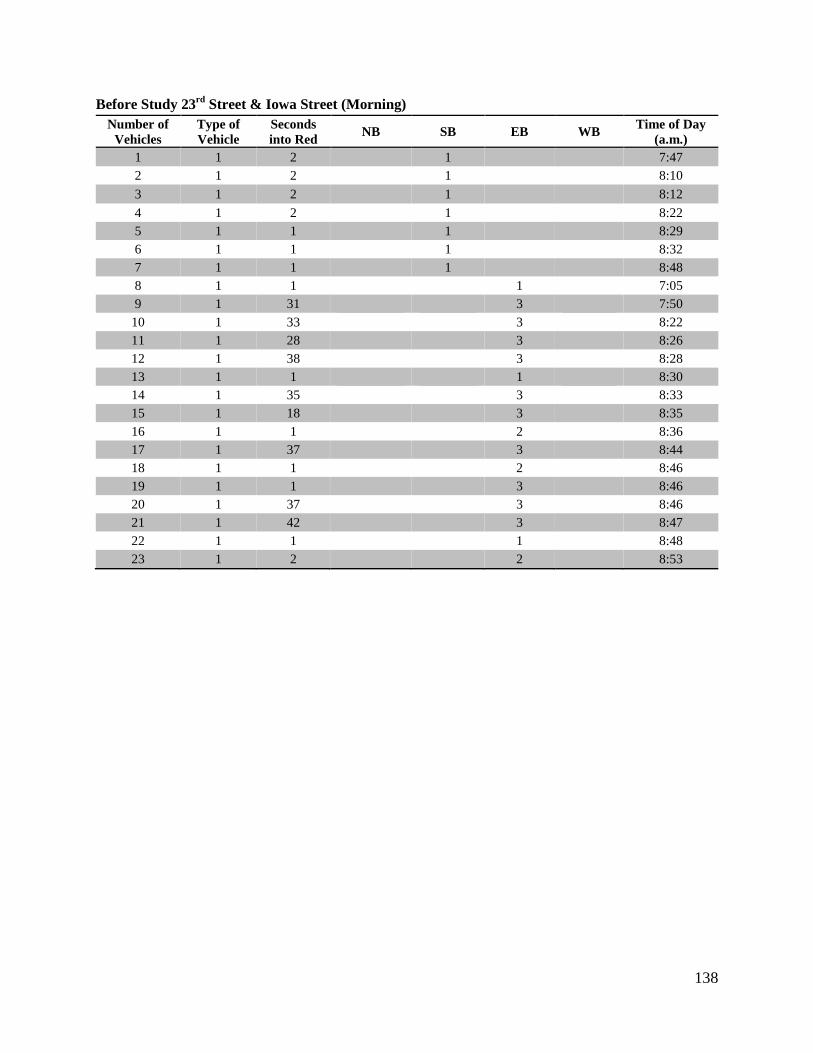
138
Before Study 23rd
Street & Iowa Street (Morning)
Number of
Vehicles
Type of
Vehicle
Seconds
into Red NB SB EB WB
Time of Day
(a.m.)
1 1 2
1
7:47
2 1 2
1
8:10
3 1 2
1
8:12
4 1 2
1
8:22
5 1 1
1
8:29
6 1 1
1
8:32
7 1 1
1
8:48
8 1 1
1
7:05
9 1 31
3
7:50
10 1 33
3
8:22
11 1 28
3
8:26
12 1 38
3
8:28
13 1 1
1
8:30
14 1 35
3
8:33
15 1 18
3
8:35
16 1 1
2
8:36
17 1 37
3
8:44
18 1 1
2
8:46
19 1 1
3
8:46
20 1 37
3
8:46
21 1 42
3
8:47
22 1 1
1
8:48
23 1 2
2
8:53
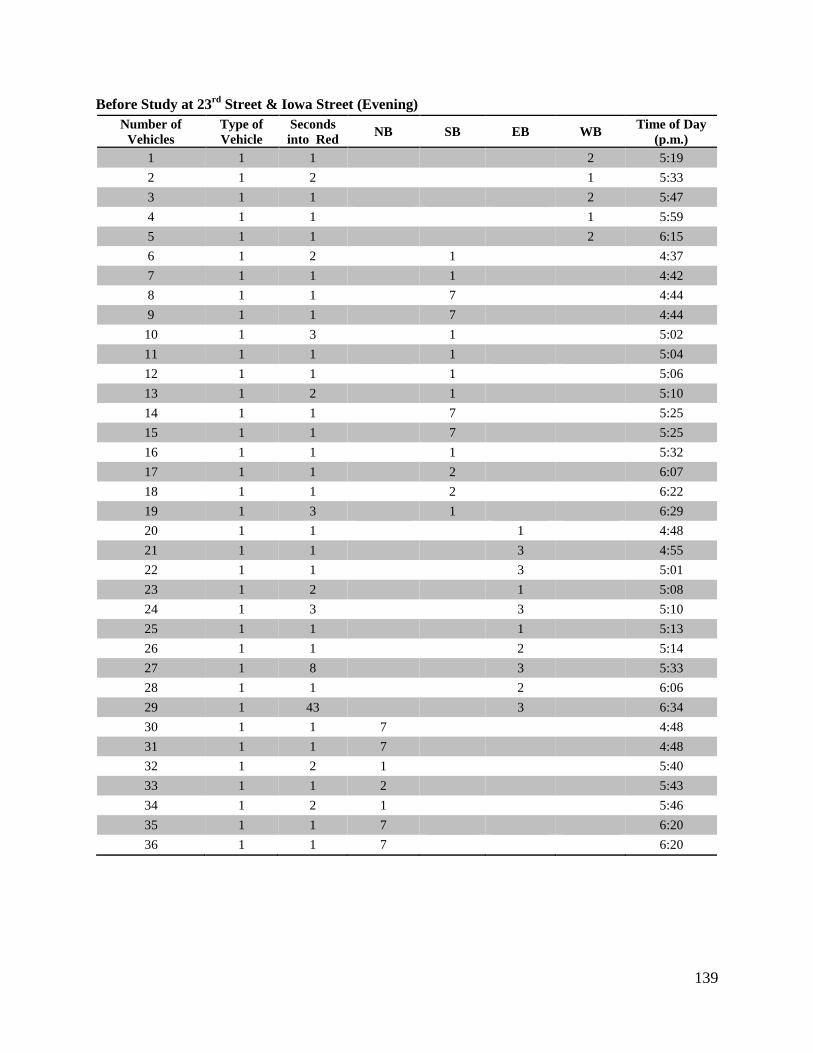
139
Before Study at 23rd
Street & Iowa Street (Evening)
Number of
Vehicles
Type of
Vehicle
Seconds
into Red NB SB EB WB
Time of Day
(p.m.)
1 1 1
2 5:19
2 1 2
1 5:33
3 1 1
2 5:47
4 1 1
1 5:59
5 1 1
2 6:15
6 1 2
1
4:37
7 1 1
1
4:42
8 1 1
7
4:44
9 1 1
7
4:44
10 1 3
1
5:02
11 1 1
1
5:04
12 1 1
1
5:06
13 1 2
1
5:10
14 1 1
7
5:25
15 1 1
7
5:25
16 1 1
1
5:32
17 1 1
2
6:07
18 1 1
2
6:22
19 1 3
1
6:29
20 1 1
1
4:48
21 1 1
3
4:55
22 1 1
3
5:01
23 1 2
1
5:08
24 1 3
3
5:10
25 1 1
1
5:13
26 1 1
2
5:14
27 1 8
3
5:33
28 1 1
2
6:06
29 1 43
3
6:34
30 1 1 7
4:48
31 1 1 7
4:48
32 1 2 1
5:40
33 1 1 2
5:43
34 1 2 1
5:46
35 1 1 7
6:20
36 1 1 7
6:20
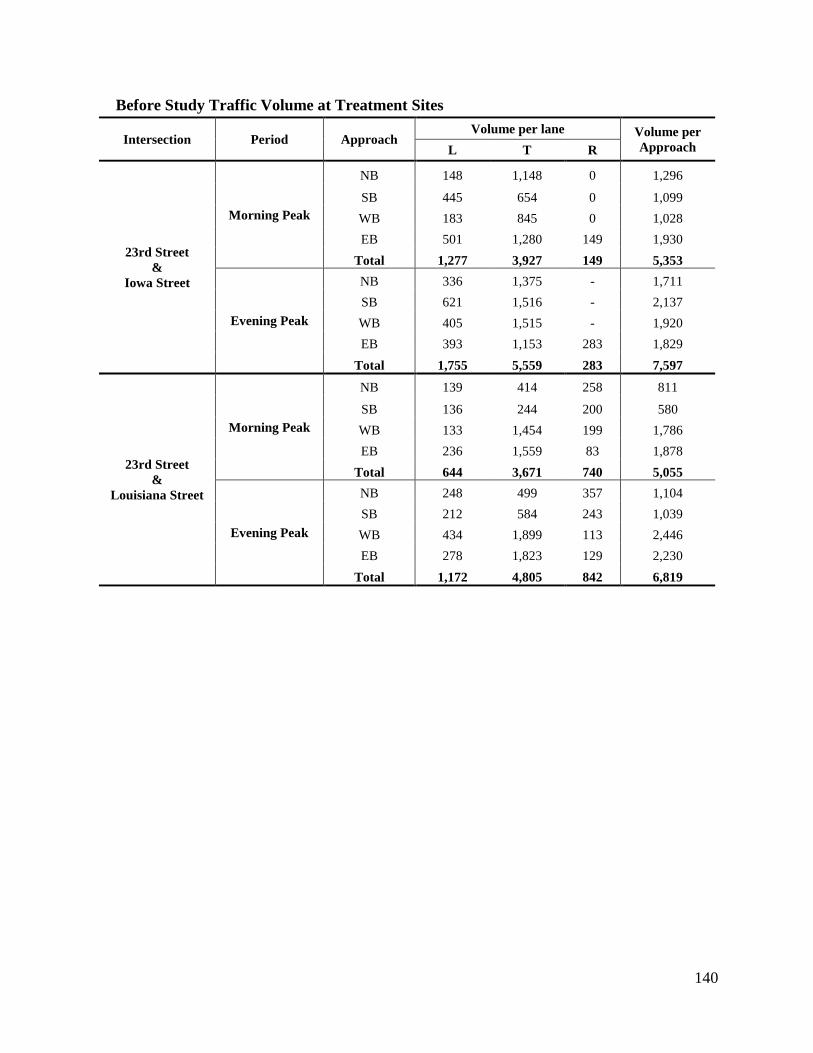
140
Before Study Traffic Volume at Treatment Sites
Intersection Period Approach Volume per lane Volume per
Approach L T R
23rd Street
&
Iowa Street
Morning Peak
NB 148 1,148 0 1,296
SB 445 654 0 1,099
WB 183 845 0 1,028
EB 501 1,280 149 1,930
Total 1,277 3,927 149 5,353
Evening Peak
NB 336 1,375 - 1,711
SB 621 1,516 - 2,137
WB 405 1,515 - 1,920
EB 393 1,153 283 1,829
Total 1,755 5,559 283 7,597
23rd Street
&
Louisiana Street
Morning Peak
NB 139 414 258 811
SB 136 244 200 580
WB 133 1,454 199 1,786
EB 236 1,559 83 1,878
Total 644 3,671 740 5,055
Evening Peak
NB 248 499 357 1,104
SB 212 584 243 1,039
WB 434 1,899 113 2,446
EB 278 1,823 129 2,230
Total 1,172 4,805 842 6,819
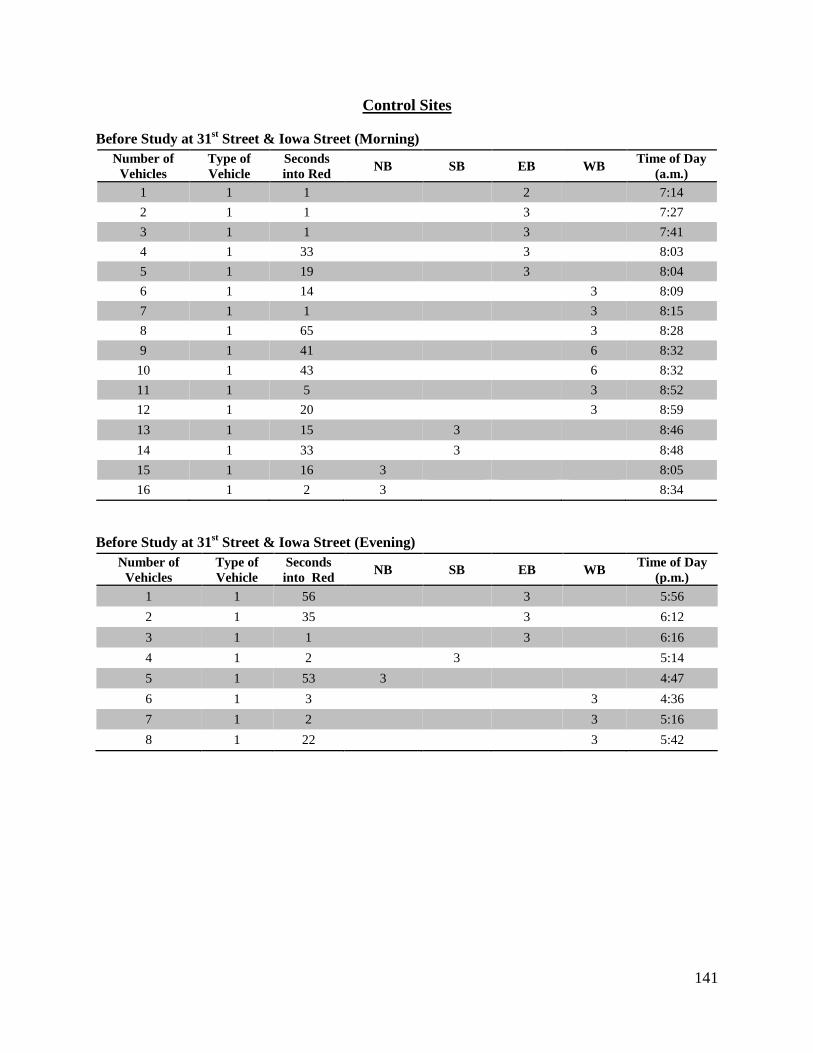
141
Control Sites
Before Study at 31st Street & Iowa Street (Morning)
Number of
Vehicles
Type of
Vehicle
Seconds
into Red NB SB EB WB
Time of Day
(a.m.)
1 1 1
2
7:14
2 1 1
3
7:27
3 1 1
3
7:41
4 1 33
3
8:03
5 1 19
3
8:04
6 1 14
3 8:09
7 1 1
3 8:15
8 1 65
3 8:28
9 1 41
6 8:32
10 1 43
6 8:32
11 1 5
3 8:52
12 1 20
3 8:59
13 1 15
3
8:46
14 1 33
3
8:48
15 1 16 3
8:05
16 1 2 3
8:34
Before Study at 31st Street & Iowa Street (Evening)
Number of
Vehicles
Type of
Vehicle
Seconds
into Red NB SB EB WB
Time of Day
(p.m.)
1 1 56
3
5:56
2 1 35
3
6:12
3 1 1
3
6:16
4 1 2
3
5:14
5 1 53 3
4:47
6 1 3
3 4:36
7 1 2
3 5:16
8 1 22
3 5:42
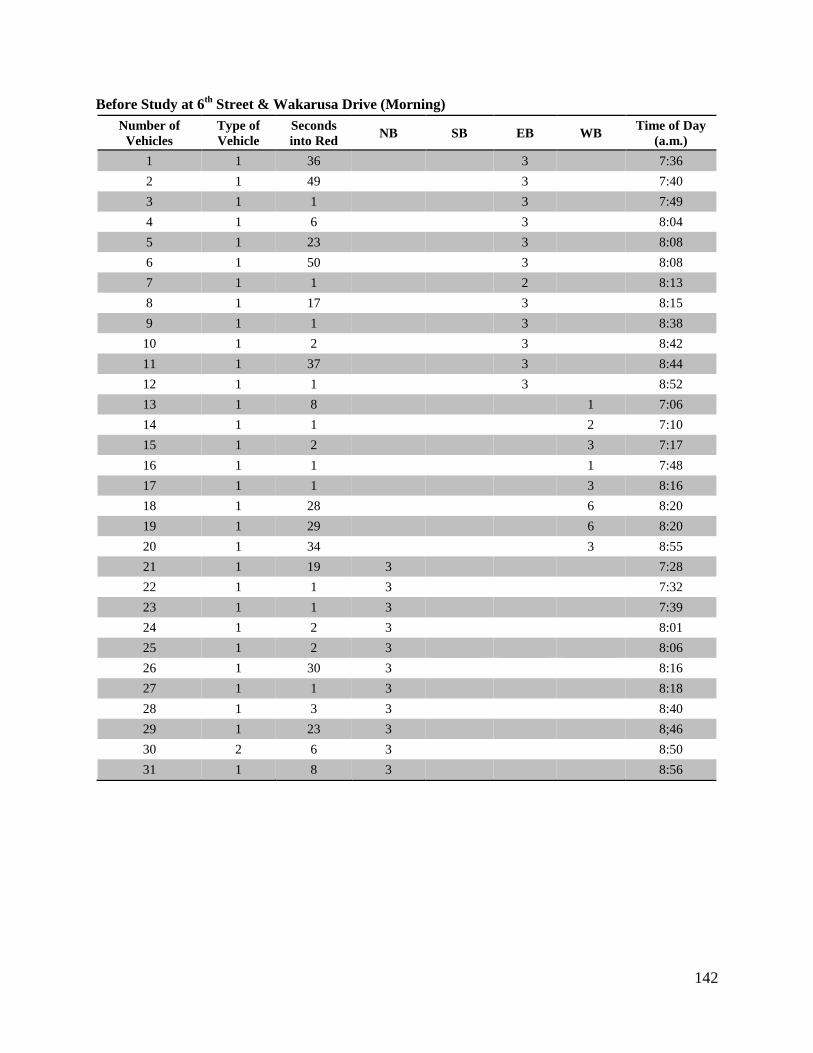
142
Before Study at 6th
Street & Wakarusa Drive (Morning)
Number of
Vehicles
Type of
Vehicle
Seconds
into Red NB SB EB WB
Time of Day
(a.m.)
1 1 36
3
7:36
2 1 49
3
7:40
3 1 1
3
7:49
4 1 6
3
8:04
5 1 23
3
8:08
6 1 50
3
8:08
7 1 1
2
8:13
8 1 17
3
8:15
9 1 1
3
8:38
10 1 2
3
8:42
11 1 37
3
8:44
12 1 1
3
8:52
13 1 8
1 7:06
14 1 1
2 7:10
15 1 2
3 7:17
16 1 1
1 7:48
17 1 1
3 8:16
18 1 28
6 8:20
19 1 29
6 8:20
20 1 34
3 8:55
21 1 19 3
7:28
22 1 1 3
7:32
23 1 1 3
7:39
24 1 2 3
8:01
25 1 2 3
8:06
26 1 30 3
8:16
27 1 1 3
8:18
28 1 3 3
8:40
29 1 23 3
8;46
30 2 6 3
8:50
31 1 8 3
8:56
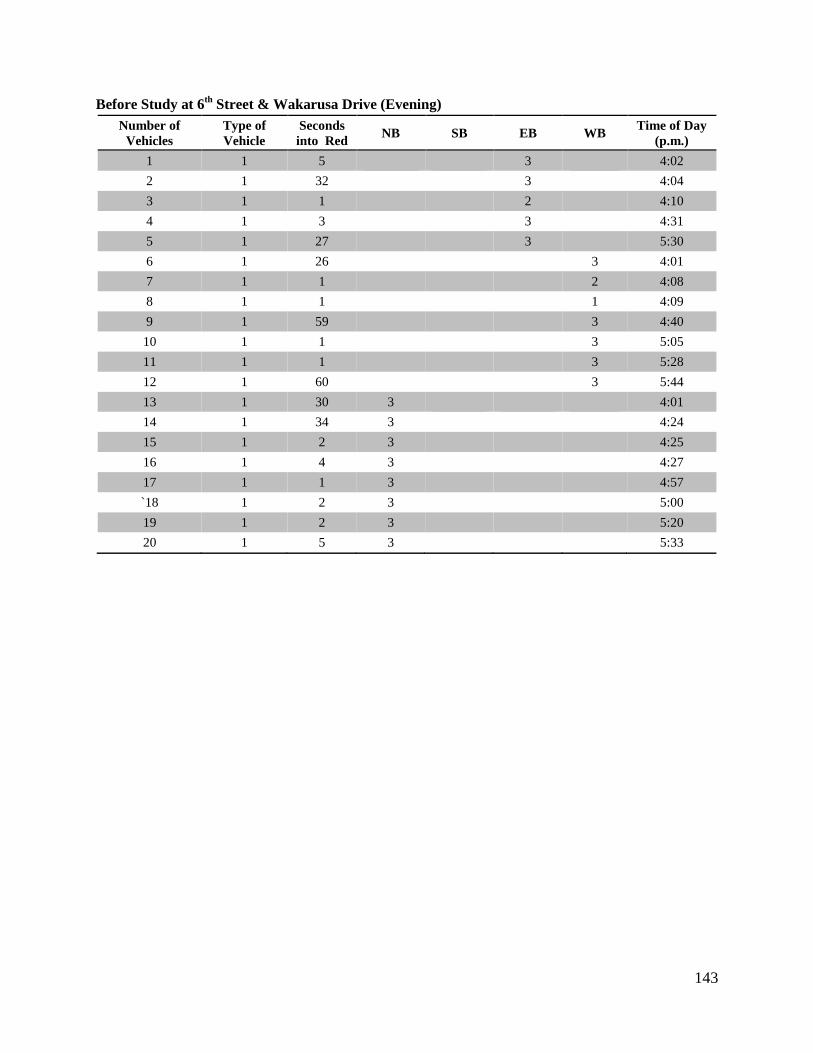
143
Before Study at 6th
Street & Wakarusa Drive (Evening)
Number of
Vehicles
Type of
Vehicle
Seconds
into Red NB SB EB WB
Time of Day
(p.m.)
1 1 5
3
4:02
2 1 32
3
4:04
3 1 1
2
4:10
4 1 3
3
4:31
5 1 27
3
5:30
6 1 26
3 4:01
7 1 1
2 4:08
8 1 1
1 4:09
9 1 59
3 4:40
10 1 1
3 5:05
11 1 1
3 5:28
12 1 60
3 5:44
13 1 30 3
4:01
14 1 34 3
4:24
15 1 2 3
4:25
16 1 4 3
4:27
17 1 1 3
4:57
`18 1 2 3
5:00
19 1 2 3
5:20
20 1 5 3
5:33
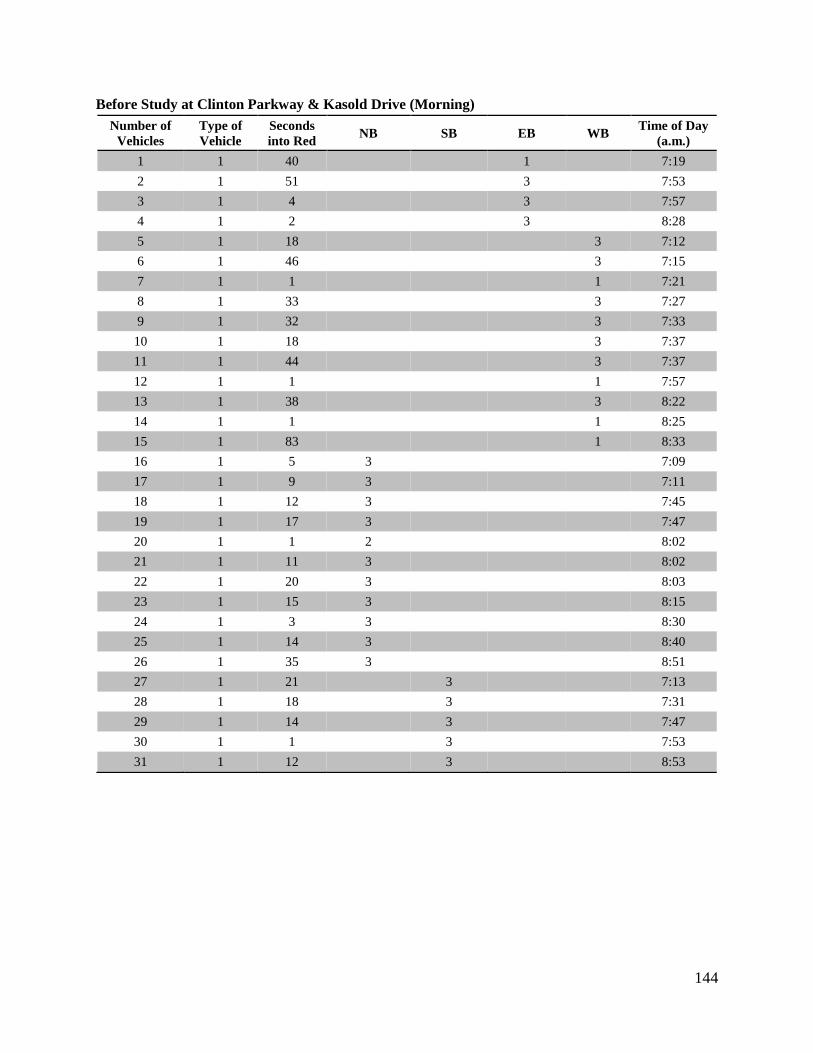
144
Before Study at Clinton Parkway & Kasold Drive (Morning)
Number of
Vehicles
Type of
Vehicle
Seconds
into Red NB SB EB WB
Time of Day
(a.m.)
1 1 40
1
7:19
2 1 51
3
7:53
3 1 4
3
7:57
4 1 2
3
8:28
5 1 18
3 7:12
6 1 46
3 7:15
7 1 1
1 7:21
8 1 33
3 7:27
9 1 32
3 7:33
10 1 18
3 7:37
11 1 44
3 7:37
12 1 1
1 7:57
13 1 38
3 8:22
14 1 1
1 8:25
15 1 83
1 8:33
16 1 5 3
7:09
17 1 9 3
7:11
18 1 12 3
7:45
19 1 17 3
7:47
20 1 1 2
8:02
21 1 11 3
8:02
22 1 20 3
8:03
23 1 15 3
8:15
24 1 3 3
8:30
25 1 14 3
8:40
26 1 35 3
8:51
27 1 21
3
7:13
28 1 18
3
7:31
29 1 14
3
7:47
30 1 1
3
7:53
31 1 12
3
8:53
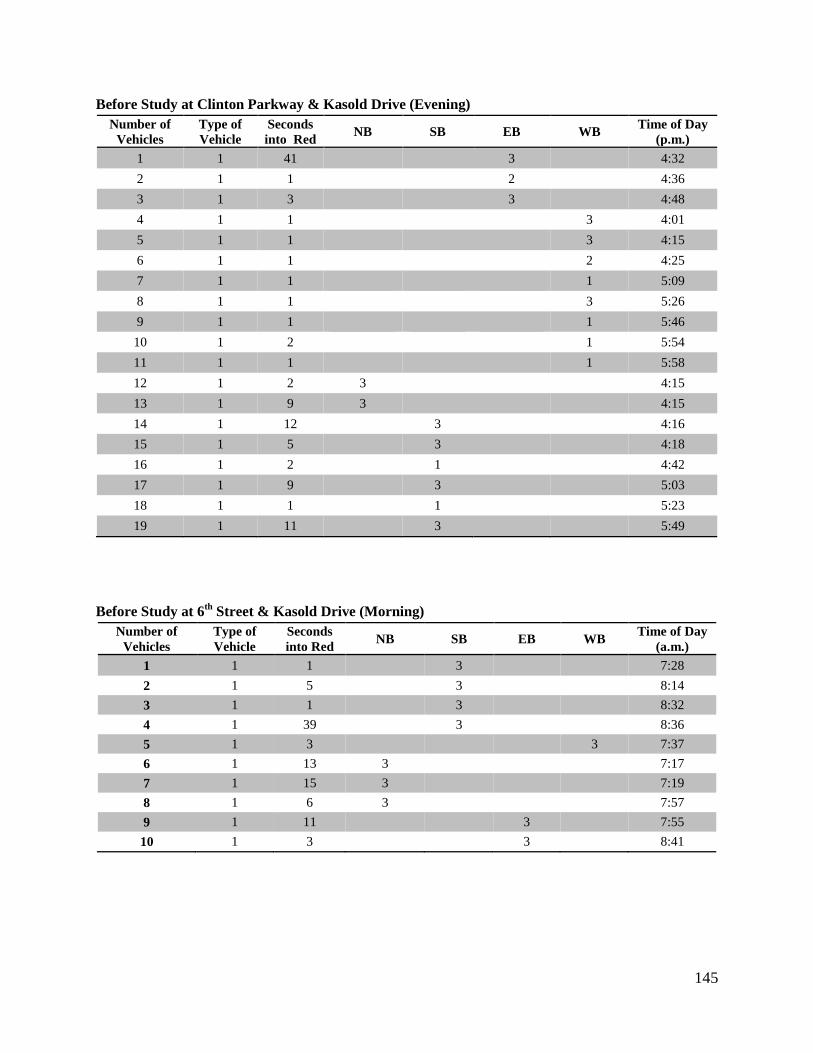
145
Before Study at Clinton Parkway & Kasold Drive (Evening)
Number of
Vehicles
Type of
Vehicle
Seconds
into Red NB SB EB WB
Time of Day
(p.m.)
1 1 41
3
4:32
2 1 1
2
4:36
3 1 3
3
4:48
4 1 1
3 4:01
5 1 1
3 4:15
6 1 1
2 4:25
7 1 1
1 5:09
8 1 1
3 5:26
9 1 1
1 5:46
10 1 2
1 5:54
11 1 1
1 5:58
12 1 2 3
4:15
13 1 9 3
4:15
14 1 12
3
4:16
15 1 5
3
4:18
16 1 2
1
4:42
17 1 9
3
5:03
18 1 1
1
5:23
19 1 11
3
5:49
Before Study at 6th
Street & Kasold Drive (Morning)
Number of
Vehicles
Type of
Vehicle
Seconds
into Red NB SB EB WB
Time of Day
(a.m.)
1 1 1
3
7:28
2 1 5
3
8:14
3 1 1
3
8:32
4 1 39
3
8:36
5 1 3
3 7:37
6 1 13 3
7:17
7 1 15 3
7:19
8 1 6 3
7:57
9 1 11
3
7:55
10 1 3
3
8:41
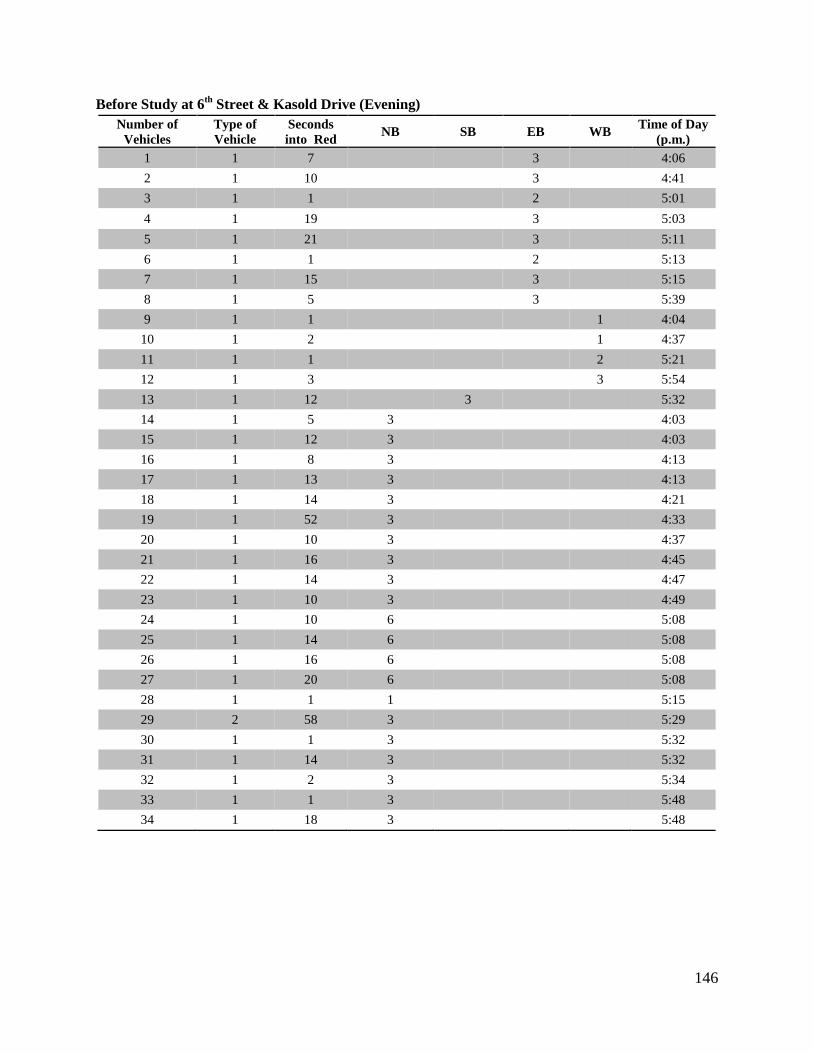
146
Before Study at 6th
Street & Kasold Drive (Evening)
Number of
Vehicles
Type of
Vehicle
Seconds
into Red NB SB EB WB
Time of Day
(p.m.)
1 1 7
3
4:06
2 1 10
3
4:41
3 1 1
2
5:01
4 1 19
3
5:03
5 1 21
3
5:11
6 1 1
2
5:13
7 1 15
3
5:15
8 1 5
3
5:39
9 1 1
1 4:04
10 1 2
1 4:37
11 1 1
2 5:21
12 1 3
3 5:54
13 1 12
3
5:32
14 1 5 3
4:03
15 1 12 3
4:03
16 1 8 3
4:13
17 1 13 3
4:13
18 1 14 3
4:21
19 1 52 3
4:33
20 1 10 3
4:37
21 1 16 3
4:45
22 1 14 3
4:47
23 1 10 3
4:49
24 1 10 6
5:08
25 1 14 6
5:08
26 1 16 6
5:08
27 1 20 6
5:08
28 1 1 1
5:15
29 2 58 3
5:29
30 1 1 3
5:32
31 1 14 3
5:32
32 1 2 3
5:34
33 1 1 3
5:48
34 1 18 3
5:48
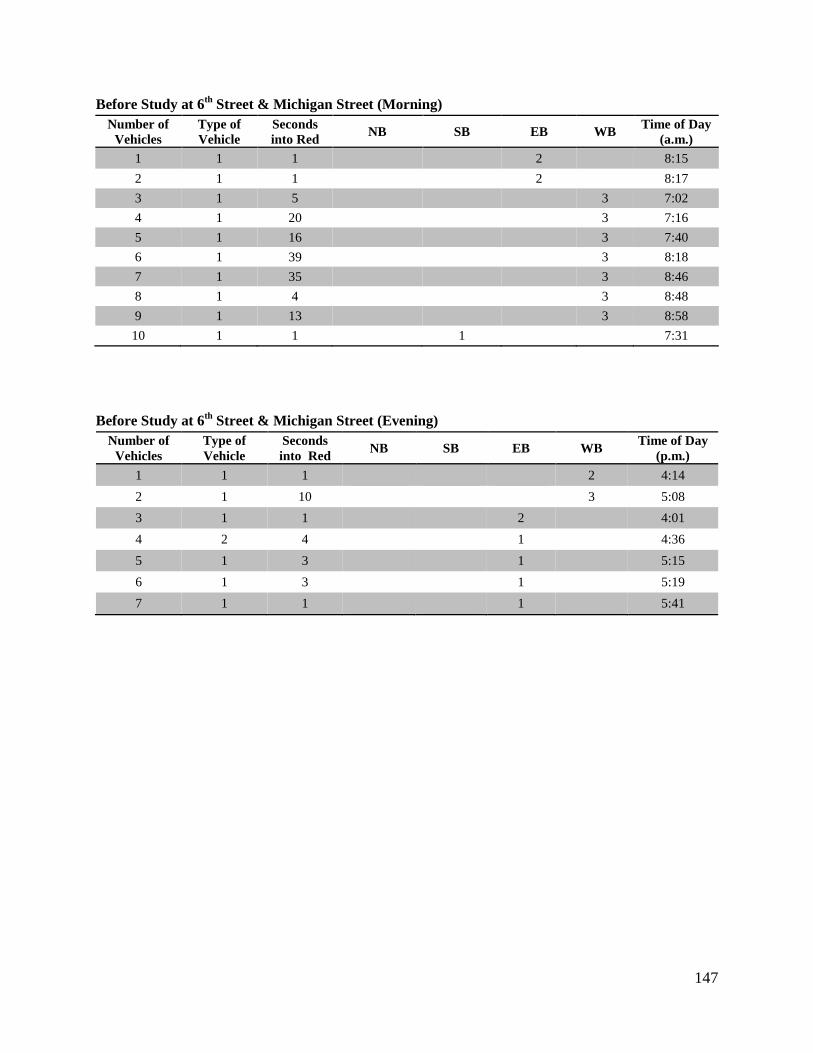
147
Before Study at 6th
Street & Michigan Street (Morning)
Number of
Vehicles
Type of
Vehicle
Seconds
into Red NB SB EB WB
Time of Day
(a.m.)
1 1 1
2
8:15
2 1 1
2
8:17
3 1 5
3 7:02
4 1 20
3 7:16
5 1 16
3 7:40
6 1 39
3 8:18
7 1 35
3 8:46
8 1 4
3 8:48
9 1 13
3 8:58
10 1 1
1
7:31
Before Study at 6th
Street & Michigan Street (Evening)
Number of
Vehicles
Type of
Vehicle
Seconds
into Red NB SB EB WB
Time of Day
(p.m.)
1 1 1
2 4:14
2 1 10
3 5:08
3 1 1
2
4:01
4 2 4
1
4:36
5 1 3
1
5:15
6 1 3
1
5:19
7 1 1
1
5:41
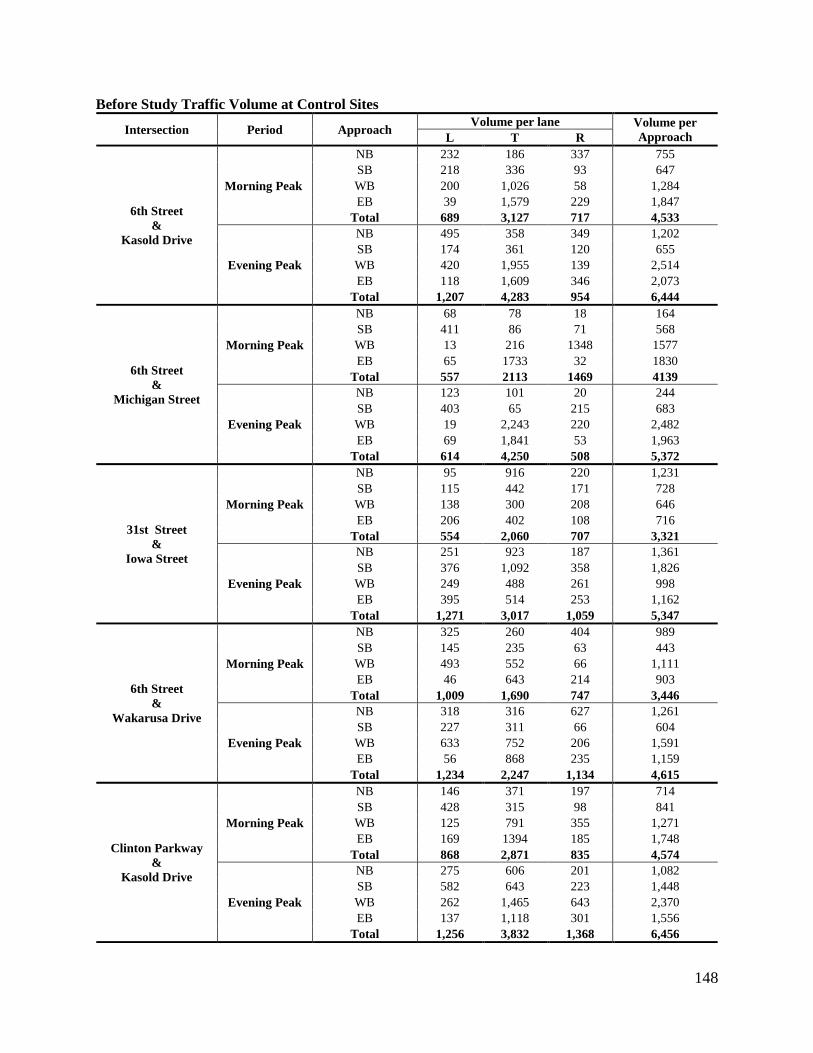
148
Before Study Traffic Volume at Control Sites
Intersection Period Approach Volume per lane Volume per
Approach L T R
6th Street
&
Kasold Drive
Morning Peak
NB 232 186 337 755
SB 218 336 93 647
WB 200 1,026 58 1,284
EB 39 1,579 229 1,847
Total 689 3,127 717 4,533
Evening Peak
NB 495 358 349 1,202
SB 174 361 120 655
WB 420 1,955 139 2,514
EB 118 1,609 346 2,073
Total 1,207 4,283 954 6,444
6th Street
&
Michigan Street
Morning Peak
NB 68 78 18 164
SB 411 86 71 568
WB 13 216 1348 1577
EB 65 1733 32 1830
Total 557 2113 1469 4139
Evening Peak
NB 123 101 20 244
SB 403 65 215 683
WB 19 2,243 220 2,482
EB 69 1,841 53 1,963
Total 614 4,250 508 5,372
31st Street
&
Iowa Street
Morning Peak
NB 95 916 220 1,231
SB 115 442 171 728
WB 138 300 208 646
EB 206 402 108 716
Total 554 2,060 707 3,321
Evening Peak
NB 251 923 187 1,361
SB 376 1,092 358 1,826
WB 249 488 261 998
EB 395 514 253 1,162
Total 1,271 3,017 1,059 5,347
6th Street
&
Wakarusa Drive
Morning Peak
NB 325 260 404 989
SB 145 235 63 443
WB 493 552 66 1,111
EB 46 643 214 903
Total 1,009 1,690 747 3,446
Evening Peak
NB 318 316 627 1,261
SB 227 311 66 604
WB 633 752 206 1,591
EB 56 868 235 1,159
Total 1,234 2,247 1,134 4,615
Clinton Parkway
&
Kasold Drive
Morning Peak
NB 146 371 197 714
SB 428 315 98 841
WB 125 791 355 1,271
EB 169 1394 185 1,748
Total 868 2,871 835 4,574
Evening Peak
NB 275 606 201 1,082
SB 582 643 223 1,448
WB 262 1,465 643 2,370
EB 137 1,118 301 1,556
Total 1,256 3,832 1,368 6,456
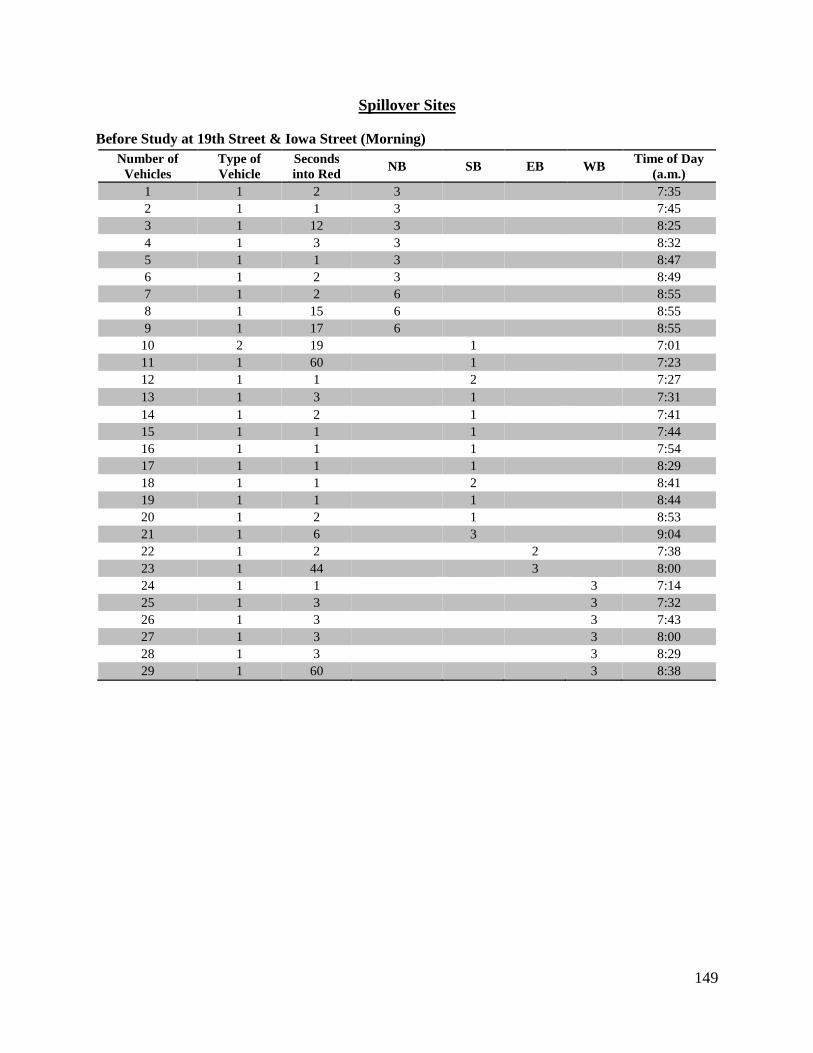
149
Spillover Sites
Before Study at 19th Street & Iowa Street (Morning)
Number of
Vehicles
Type of
Vehicle
Seconds
into Red NB SB EB WB
Time of Day
(a.m.)
1 1 2 3
7:35
2 1 1 3
7:45
3 1 12 3
8:25
4 1 3 3
8:32
5 1 1 3
8:47
6 1 2 3
8:49
7 1 2 6
8:55
8 1 15 6
8:55
9 1 17 6
8:55
10 2 19
1
7:01
11 1 60
1
7:23
12 1 1
2
7:27
13 1 3
1
7:31
14 1 2
1
7:41
15 1 1
1
7:44
16 1 1
1
7:54
17 1 1
1
8:29
18 1 1
2
8:41
19 1 1
1
8:44
20 1 2
1
8:53
21 1 6
3
9:04
22 1 2
2
7:38
23 1 44
3
8:00
24 1 1
3 7:14
25 1 3
3 7:32
26 1 3
3 7:43
27 1 3
3 8:00
28 1 3
3 8:29
29 1 60
3 8:38
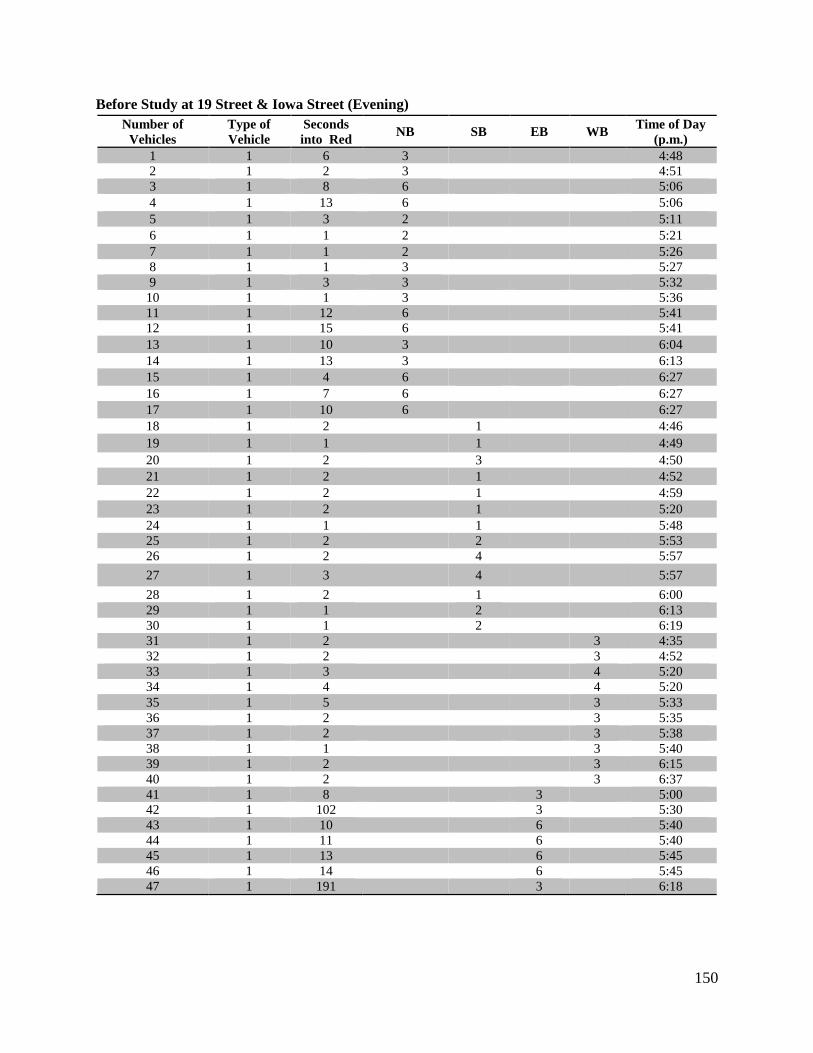
150
Before Study at 19 Street & Iowa Street (Evening)
Number of
Vehicles
Type of
Vehicle
Seconds
into Red NB SB EB WB
Time of Day
(p.m.)
1 1 6 3
4:48
2 1 2 3
4:51
3 1 8 6
5:06
4 1 13 6
5:06
5 1 3 2
5:11
6 1 1 2
5:21
7 1 1 2
5:26
8 1 1 3
5:27
9 1 3 3
5:32
10 1 1 3
5:36
11 1 12 6
5:41
12 1 15 6
5:41
13 1 10 3
6:04
14 1 13 3
6:13
15 1 4 6
6:27
16 1 7 6
6:27
17 1 10 6
6:27
18 1 2
1
4:46
19 1 1
1
4:49
20 1 2
3
4:50
21 1 2
1
4:52
22 1 2
1
4:59
23 1 2
1
5:20
24 1 1
1
5:48
25 1 2
2
5:53
26 1 2
4
5:57
27 1 3
4
5:57
28 1 2
1
6:00
29 1 1
2
6:13
30 1 1
2
6:19
31 1 2
3 4:35
32 1 2
3 4:52
33 1 3
4 5:20
34 1 4
4 5:20
35 1 5
3 5:33
36 1 2
3 5:35
37 1 2
3 5:38
38 1 1
3 5:40
39 1 2
3 6:15
40 1 2
3 6:37
41 1 8
3
5:00
42 1 102
3
5:30
43 1 10
6
5:40
44 1 11
6
5:40
45 1 13
6
5:45
46 1 14
6
5:45
47 1 191
3
6:18
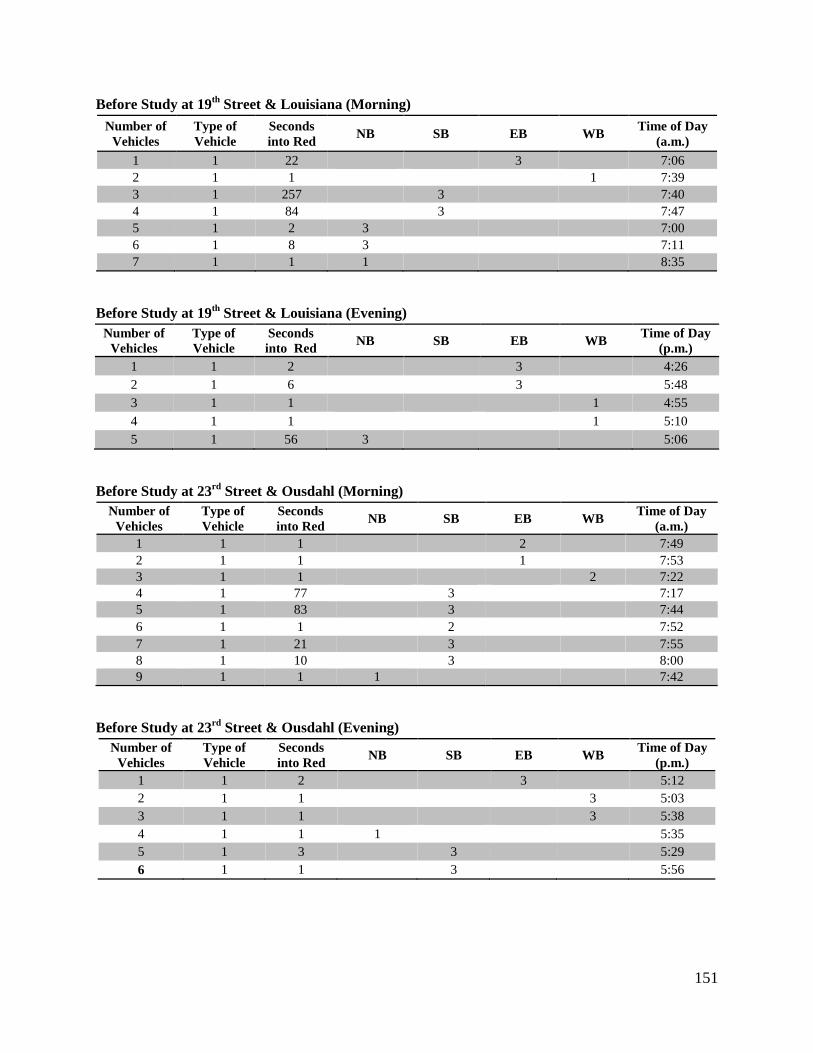
151
Before Study at 19th
Street & Louisiana (Morning)
Number of
Vehicles
Type of
Vehicle
Seconds
into Red NB SB EB WB
Time of Day
(a.m.)
1 1 22
3
7:06
2 1 1
1 7:39
3 1 257
3
7:40
4 1 84
3
7:47
5 1 2 3
7:00
6 1 8 3
7:11
7 1 1 1
8:35
Before Study at 19th
Street & Louisiana (Evening)
Number of
Vehicles
Type of
Vehicle
Seconds
into Red NB SB EB WB
Time of Day
(p.m.)
1 1 2
3
4:26
2 1 6
3
5:48
3 1 1
1 4:55
4 1 1
1 5:10
5 1 56 3
5:06
Before Study at 23rd
Street & Ousdahl (Morning)
Number of
Vehicles
Type of
Vehicle
Seconds
into Red NB SB EB WB
Time of Day
(a.m.)
1 1 1
2
7:49
2 1 1
1
7:53
3 1 1
2 7:22
4 1 77
3
7:17
5 1 83
3
7:44
6 1 1
2
7:52
7 1 21
3
7:55
8 1 10
3
8:00
9 1 1 1
7:42
Before Study at 23rd
Street & Ousdahl (Evening)
Number of
Vehicles
Type of
Vehicle
Seconds
into Red NB SB EB WB
Time of Day
(p.m.)
1 1 2
3
5:12
2 1 1
3 5:03
3 1 1
3 5:38
4 1 1 1
5:35
5 1 3
3
5:29
6 1 1
3
5:56
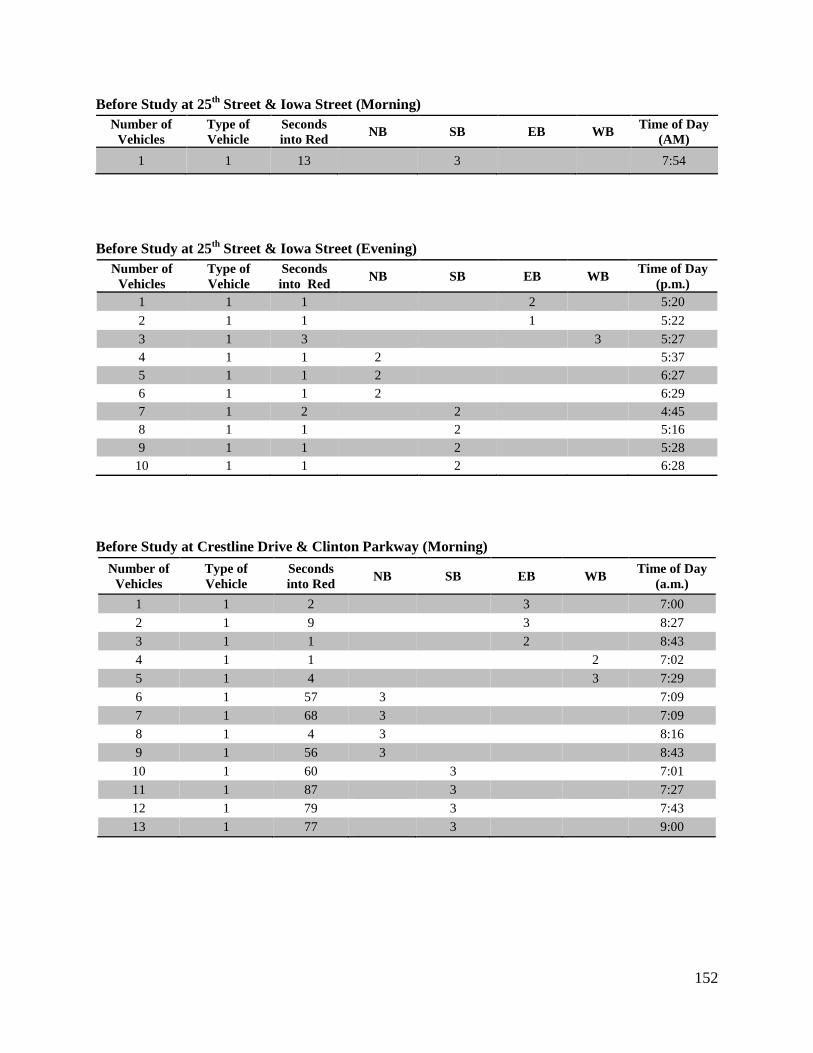
152
Before Study at 25th
Street & Iowa Street (Morning)
Number of
Vehicles
Type of
Vehicle
Seconds
into Red NB SB EB WB
Time of Day
(AM)
1 1 13
3
7:54
Before Study at 25th
Street & Iowa Street (Evening)
Number of
Vehicles
Type of
Vehicle
Seconds
into Red NB SB EB WB
Time of Day
(p.m.)
1 1 1
2
5:20
2 1 1
1
5:22
3 1 3
3 5:27
4 1 1 2
5:37
5 1 1 2
6:27
6 1 1 2
6:29
7 1 2
2
4:45
8 1 1
2
5:16
9 1 1
2
5:28
10 1 1
2
6:28
Before Study at Crestline Drive & Clinton Parkway (Morning)
Number of
Vehicles
Type of
Vehicle
Seconds
into Red NB SB EB WB
Time of Day
(a.m.)
1 1 2
3
7:00
2 1 9
3
8:27
3 1 1
2
8:43
4 1 1
2 7:02
5 1 4
3 7:29
6 1 57 3
7:09
7 1 68 3
7:09
8 1 4 3
8:16
9 1 56 3
8:43
10 1 60
3
7:01
11 1 87
3
7:27
12 1 79
3
7:43
13 1 77
3
9:00
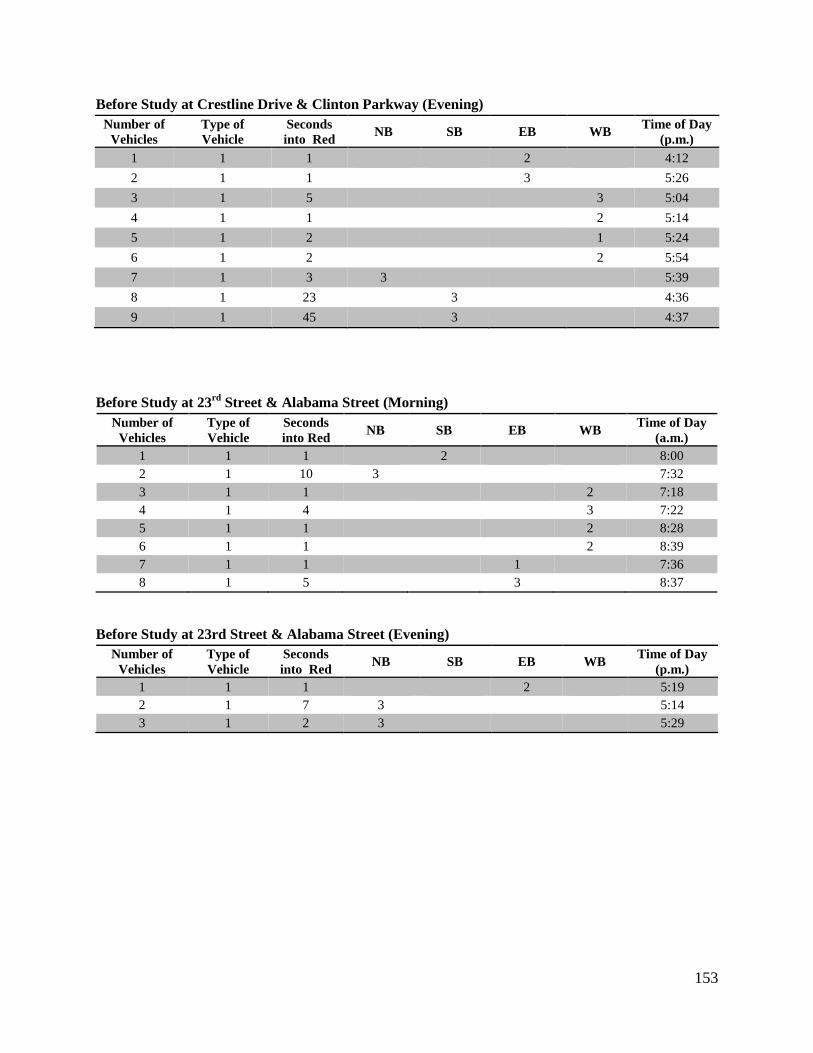
153
Before Study at Crestline Drive & Clinton Parkway (Evening)
Number of
Vehicles
Type of
Vehicle
Seconds
into Red NB SB EB WB
Time of Day
(p.m.)
1 1 1
2
4:12
2 1 1
3
5:26
3 1 5
3 5:04
4 1 1
2 5:14
5 1 2
1 5:24
6 1 2
2 5:54
7 1 3 3
5:39
8 1 23
3
4:36
9 1 45
3
4:37
Before Study at 23rd
Street & Alabama Street (Morning)
Number of
Vehicles
Type of
Vehicle
Seconds
into Red NB SB EB WB
Time of Day
(a.m.)
1 1 1
2
8:00
2 1 10 3
7:32
3 1 1
2 7:18
4 1 4
3 7:22
5 1 1
2 8:28
6 1 1
2 8:39
7 1 1
1
7:36
8 1 5
3
8:37
Before Study at 23rd Street & Alabama Street (Evening)
Number of
Vehicles
Type of
Vehicle
Seconds
into Red NB SB EB WB
Time of Day
(p.m.)
1 1 1
2
5:19
2 1 7 3
5:14
3 1 2 3
5:29
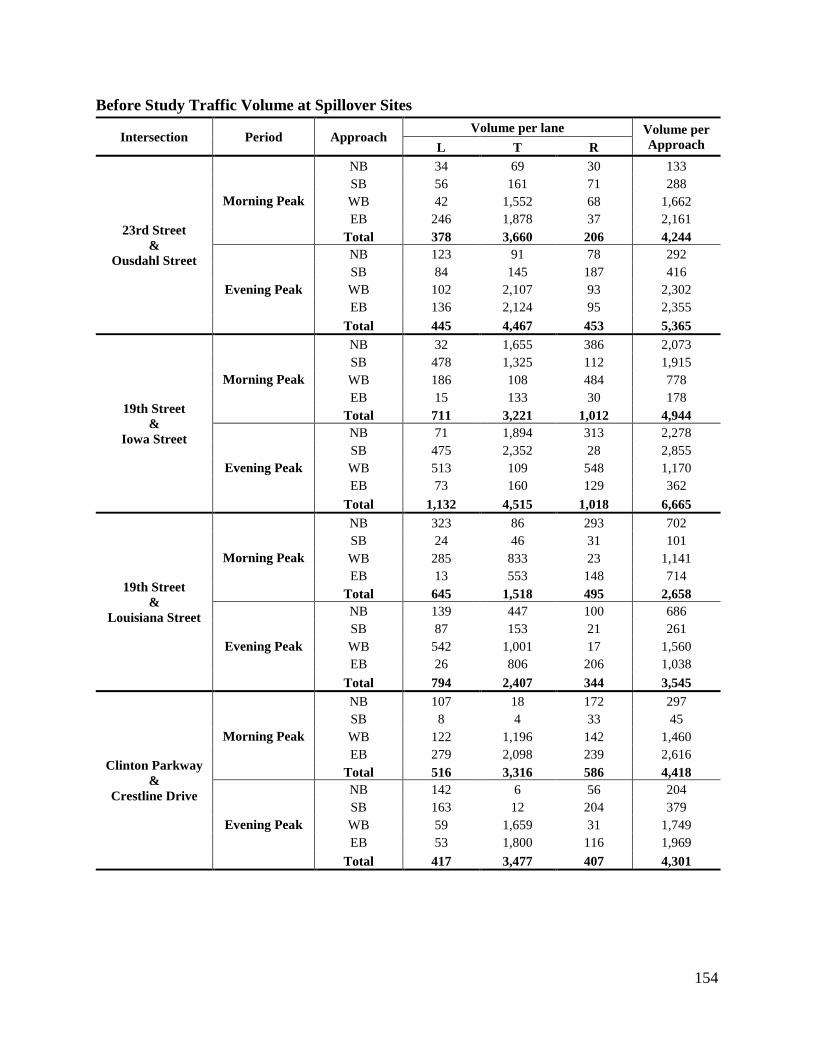
154
Before Study Traffic Volume at Spillover Sites
Intersection Period Approach Volume per lane Volume per
Approach L T R
23rd Street
&
Ousdahl Street
Morning Peak
NB 34 69 30 133
SB 56 161 71 288
WB 42 1,552 68 1,662
EB 246 1,878 37 2,161
Total 378 3,660 206 4,244
Evening Peak
NB 123 91 78 292
SB 84 145 187 416
WB 102 2,107 93 2,302
EB 136 2,124 95 2,355
Total 445 4,467 453 5,365
19th Street
&
Iowa Street
Morning Peak
NB 32 1,655 386 2,073
SB 478 1,325 112 1,915
WB 186 108 484 778
EB 15 133 30 178
Total 711 3,221 1,012 4,944
Evening Peak
NB 71 1,894 313 2,278
SB 475 2,352 28 2,855
WB 513 109 548 1,170
EB 73 160 129 362
Total 1,132 4,515 1,018 6,665
19th Street
&
Louisiana Street
Morning Peak
NB 323 86 293 702
SB 24 46 31 101
WB 285 833 23 1,141
EB 13 553 148 714
Total 645 1,518 495 2,658
Evening Peak
NB 139 447 100 686
SB 87 153 21 261
WB 542 1,001 17 1,560
EB 26 806 206 1,038
Total 794 2,407 344 3,545
Clinton Parkway
&
Crestline Drive
Morning Peak
NB 107 18 172 297
SB 8 4 33 45
WB 122 1,196 142 1,460
EB 279 2,098 239 2,616
Total 516 3,316 586 4,418
Evening Peak
NB 142 6 56 204
SB 163 12 204 379
WB 59 1,659 31 1,749
EB 53 1,800 116 1,969
Total 417 3,477 407 4,301
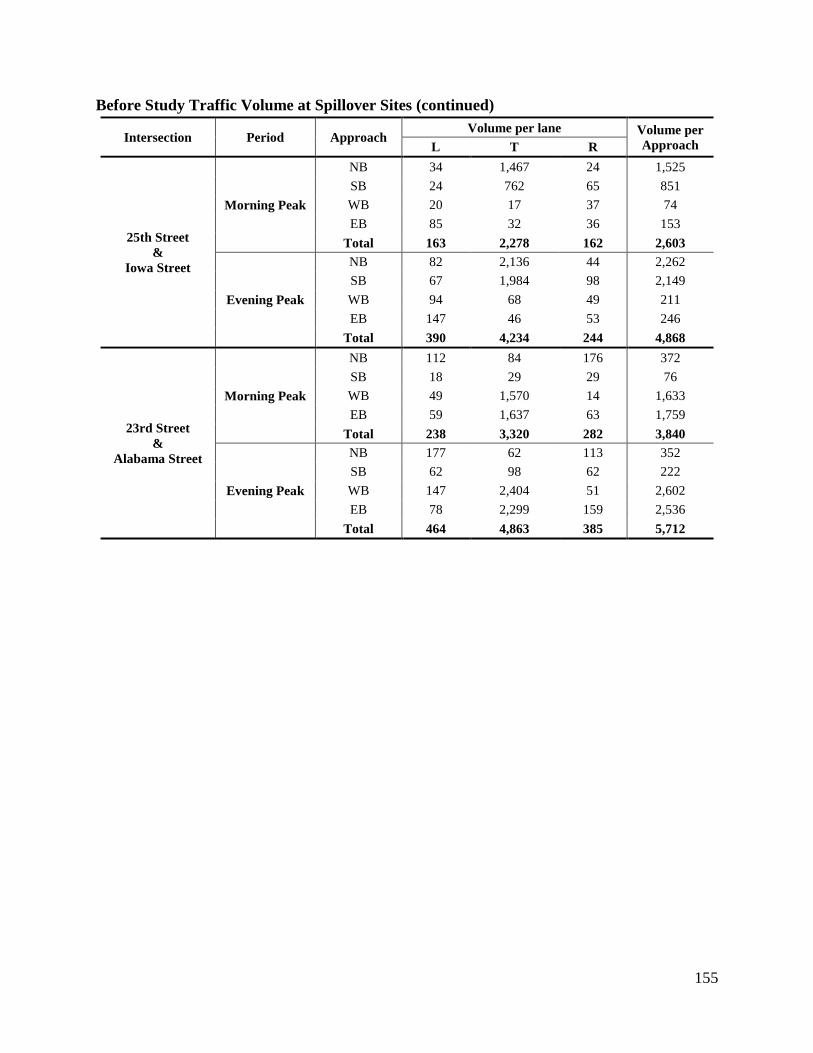
155
Before Study Traffic Volume at Spillover Sites (continued)
Intersection Period Approach Volume per lane Volume per
Approach L T R
25th Street
&
Iowa Street
Morning Peak
NB 34 1,467 24 1,525
SB 24 762 65 851
WB 20 17 37 74
EB 85 32 36 153
Total 163 2,278 162 2,603
Evening Peak
NB 82 2,136 44 2,262
SB 67 1,984 98 2,149
WB 94 68 49 211
EB 147 46 53 246
Total 390 4,234 244 4,868
23rd Street
&
Alabama Street
Morning Peak
NB 112 84 176 372
SB 18 29 29 76
WB 49 1,570 14 1,633
EB 59 1,637 63 1,759
Total 238 3,320 282 3,840
Evening Peak
NB 177 62 113 352
SB 62 98 62 222
WB 147 2,404 51 2,602
EB 78 2,299 159 2,536
Total 464 4,863 385 5,712
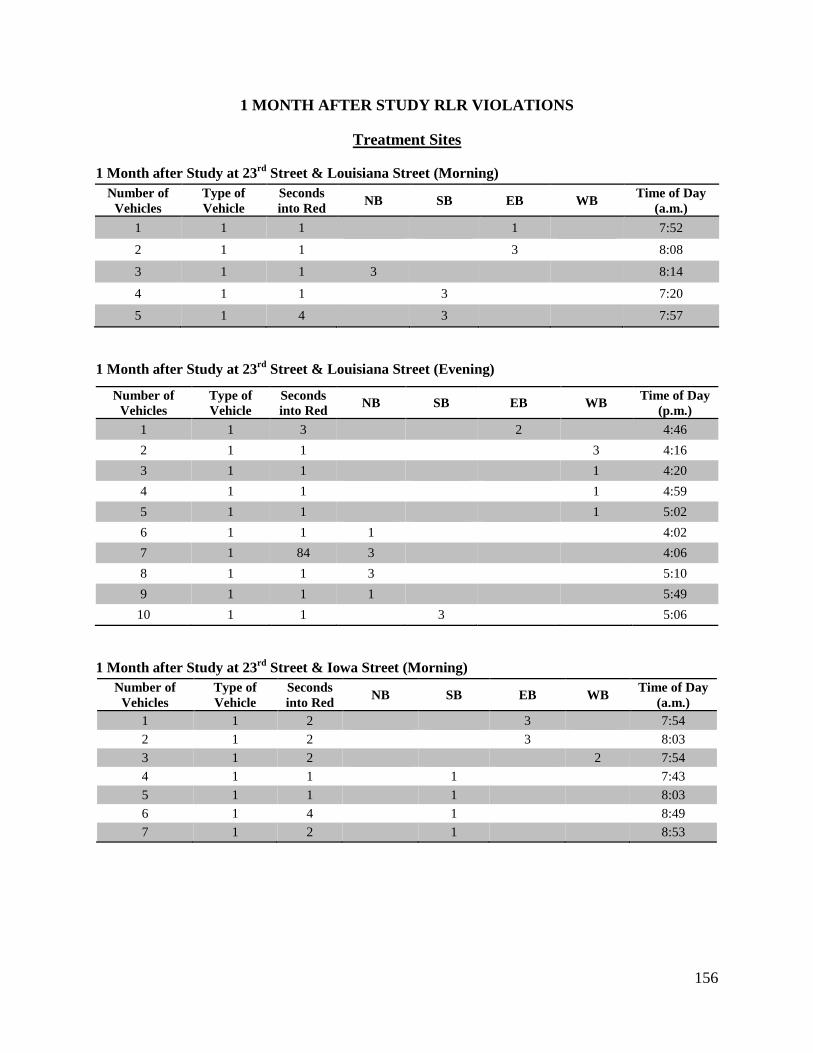
156
1 MONTH AFTER STUDY RLR VIOLATIONS
Treatment Sites
1 Month after Study at 23rd
Street & Louisiana Street (Morning)
Number of
Vehicles
Type of
Vehicle
Seconds
into Red NB SB EB WB
Time of Day
(a.m.)
1 1 1
1
7:52
2 1 1
3
8:08
3 1 1 3
8:14
4 1 1
3
7:20
5 1 4
3
7:57
1 Month after Study at 23rd
Street & Louisiana Street (Evening)
1 Month after Study at 23rd
Street & Iowa Street (Morning)
Number of
Vehicles
Type of
Vehicle
Seconds
into Red NB SB EB WB
Time of Day
(a.m.)
1 1 2
3
7:54
2 1 2
3
8:03
3 1 2
2 7:54
4 1 1
1
7:43
5 1 1
1
8:03
6 1 4
1
8:49
7 1 2
1
8:53
Number of
Vehicles
Type of
Vehicle
Seconds
into Red NB SB EB WB
Time of Day
(p.m.)
1 1 3
2
4:46
2 1 1
3 4:16
3 1 1
1 4:20
4 1 1
1 4:59
5 1 1
1 5:02
6 1 1 1
4:02
7 1 84 3
4:06
8 1 1 3
5:10
9 1 1 1
5:49
10 1 1
3
5:06
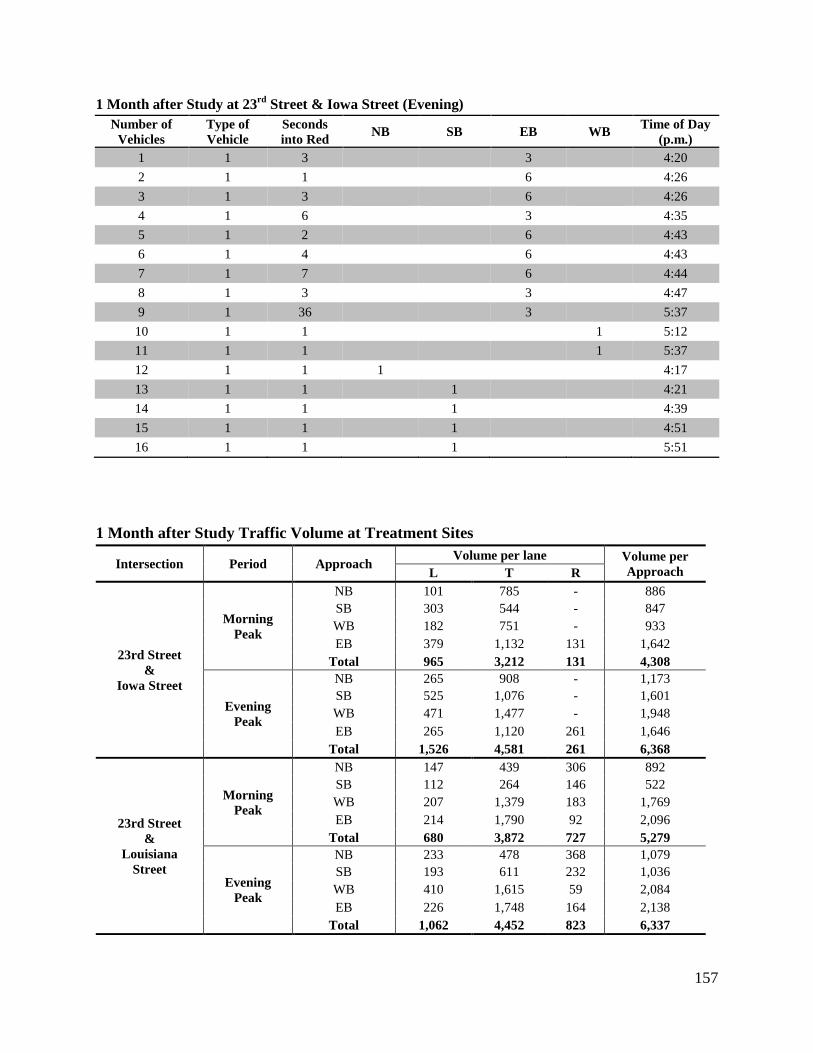
157
1 Month after Study at 23rd
Street & Iowa Street (Evening)
Number of
Vehicles
Type of
Vehicle
Seconds
into Red NB SB EB WB
Time of Day
(p.m.)
1 1 3
3
4:20
2 1 1
6
4:26
3 1 3
6
4:26
4 1 6
3
4:35
5 1 2
6
4:43
6 1 4
6
4:43
7 1 7
6
4:44
8 1 3
3
4:47
9 1 36
3
5:37
10 1 1
1 5:12
11 1 1
1 5:37
12 1 1 1
4:17
13 1 1
1
4:21
14 1 1
1
4:39
15 1 1
1
4:51
16 1 1
1
5:51
1 Month after Study Traffic Volume at Treatment Sites
Intersection Period Approach Volume per lane Volume per
Approach L T R
23rd Street
&
Iowa Street
Morning
Peak
NB 101 785 - 886
SB 303 544 - 847
WB 182 751 - 933
EB 379 1,132 131 1,642
Total 965 3,212 131 4,308
Evening
Peak
NB 265 908 - 1,173
SB 525 1,076 - 1,601
WB 471 1,477 - 1,948
EB 265 1,120 261 1,646
Total 1,526 4,581 261 6,368
23rd Street
&
Louisiana
Street
Morning
Peak
NB 147 439 306 892
SB 112 264 146 522
WB 207 1,379 183 1,769
EB 214 1,790 92 2,096
Total 680 3,872 727 5,279
Evening
Peak
NB 233 478 368 1,079
SB 193 611 232 1,036
WB 410 1,615 59 2,084
EB 226 1,748 164 2,138
Total 1,062 4,452 823 6,337
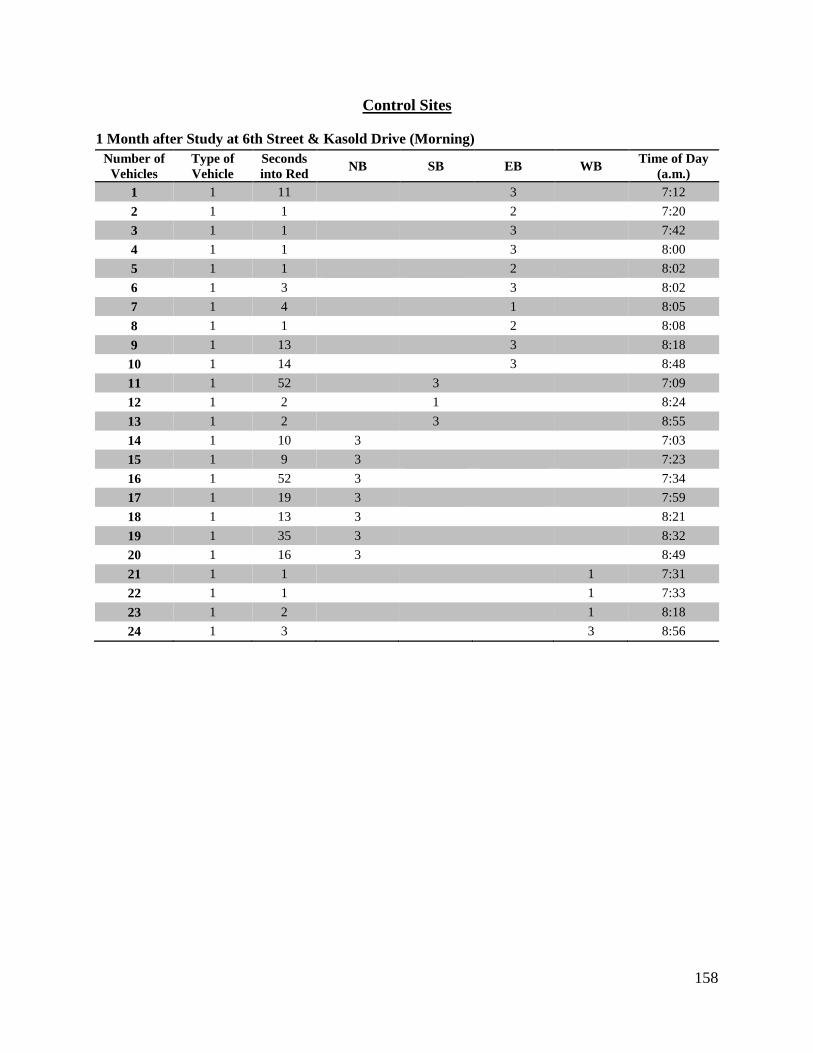
158
Control Sites
1 Month after Study at 6th Street & Kasold Drive (Morning)
Number of
Vehicles
Type of
Vehicle
Seconds
into Red NB SB EB WB
Time of Day
(a.m.)
1 1 11
3
7:12
2 1 1
2
7:20
3 1 1
3
7:42
4 1 1
3
8:00
5 1 1
2
8:02
6 1 3
3
8:02
7 1 4
1
8:05
8 1 1
2
8:08
9 1 13
3
8:18
10 1 14
3
8:48
11 1 52
3
7:09
12 1 2
1
8:24
13 1 2
3
8:55
14 1 10 3
7:03
15 1 9 3
7:23
16 1 52 3
7:34
17 1 19 3
7:59
18 1 13 3
8:21
19 1 35 3
8:32
20 1 16 3
8:49
21 1 1
1 7:31
22 1 1
1 7:33
23 1 2
1 8:18
24 1 3
3 8:56
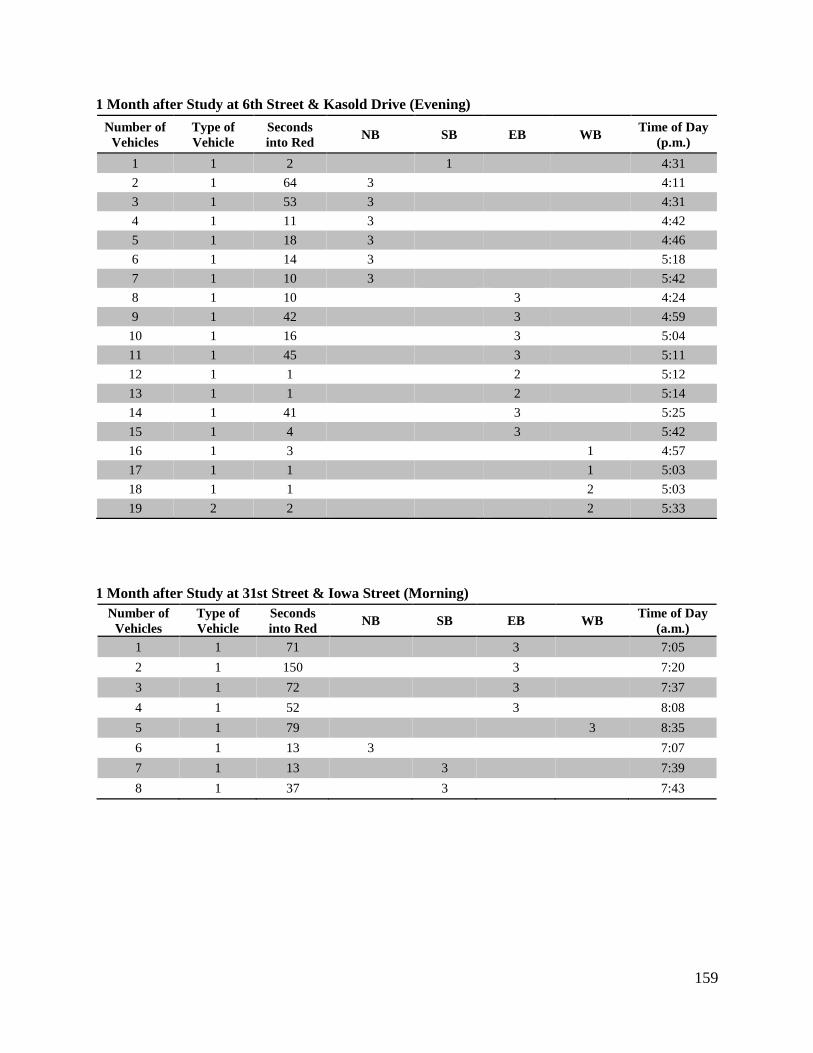
159
1 Month after Study at 6th Street & Kasold Drive (Evening)
Number of
Vehicles
Type of
Vehicle
Seconds
into Red NB SB EB WB
Time of Day
(p.m.)
1 1 2
1
4:31
2 1 64 3
4:11
3 1 53 3
4:31
4 1 11 3
4:42
5 1 18 3
4:46
6 1 14 3
5:18
7 1 10 3
5:42
8 1 10
3
4:24
9 1 42
3
4:59
10 1 16
3
5:04
11 1 45
3
5:11
12 1 1
2
5:12
13 1 1
2
5:14
14 1 41
3
5:25
15 1 4
3
5:42
16 1 3
1 4:57
17 1 1
1 5:03
18 1 1
2 5:03
19 2 2
2 5:33
1 Month after Study at 31st Street & Iowa Street (Morning)
Number of
Vehicles
Type of
Vehicle
Seconds
into Red NB SB EB WB
Time of Day
(a.m.)
1 1 71
3
7:05
2 1 150
3
7:20
3 1 72
3
7:37
4 1 52
3
8:08
5 1 79
3 8:35
6 1 13 3
7:07
7 1 13
3
7:39
8 1 37
3
7:43
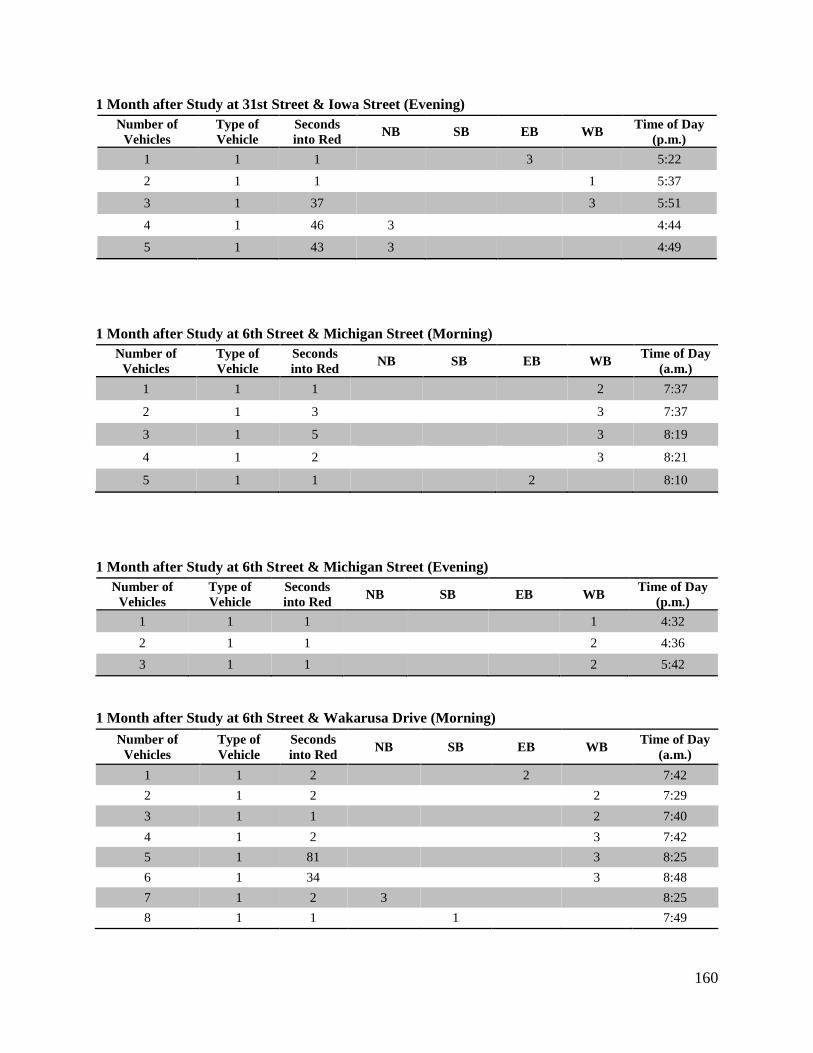
160
1 Month after Study at 31st Street & Iowa Street (Evening)
Number of
Vehicles
Type of
Vehicle
Seconds
into Red NB SB EB WB
Time of Day
(p.m.)
1 1 1
3
5:22
2 1 1
1 5:37
3 1 37
3 5:51
4 1 46 3
4:44
5 1 43 3
4:49
1 Month after Study at 6th Street & Michigan Street (Morning)
Number of
Vehicles
Type of
Vehicle
Seconds
into Red NB SB EB WB
Time of Day
(a.m.)
1 1 1
2 7:37
2 1 3
3 7:37
3 1 5
3 8:19
4 1 2
3 8:21
5 1 1
2
8:10
1 Month after Study at 6th Street & Michigan Street (Evening)
Number of
Vehicles
Type of
Vehicle
Seconds
into Red NB SB EB WB
Time of Day
(p.m.)
1 1 1
1 4:32
2 1 1
2 4:36
3 1 1
2 5:42
1 Month after Study at 6th Street & Wakarusa Drive (Morning)
Number of
Vehicles
Type of
Vehicle
Seconds
into Red NB SB EB WB
Time of Day
(a.m.)
1 1 2
2
7:42
2 1 2
2 7:29
3 1 1
2 7:40
4 1 2
3 7:42
5 1 81
3 8:25
6 1 34
3 8:48
7 1 2 3
8:25
8 1 1
1
7:49
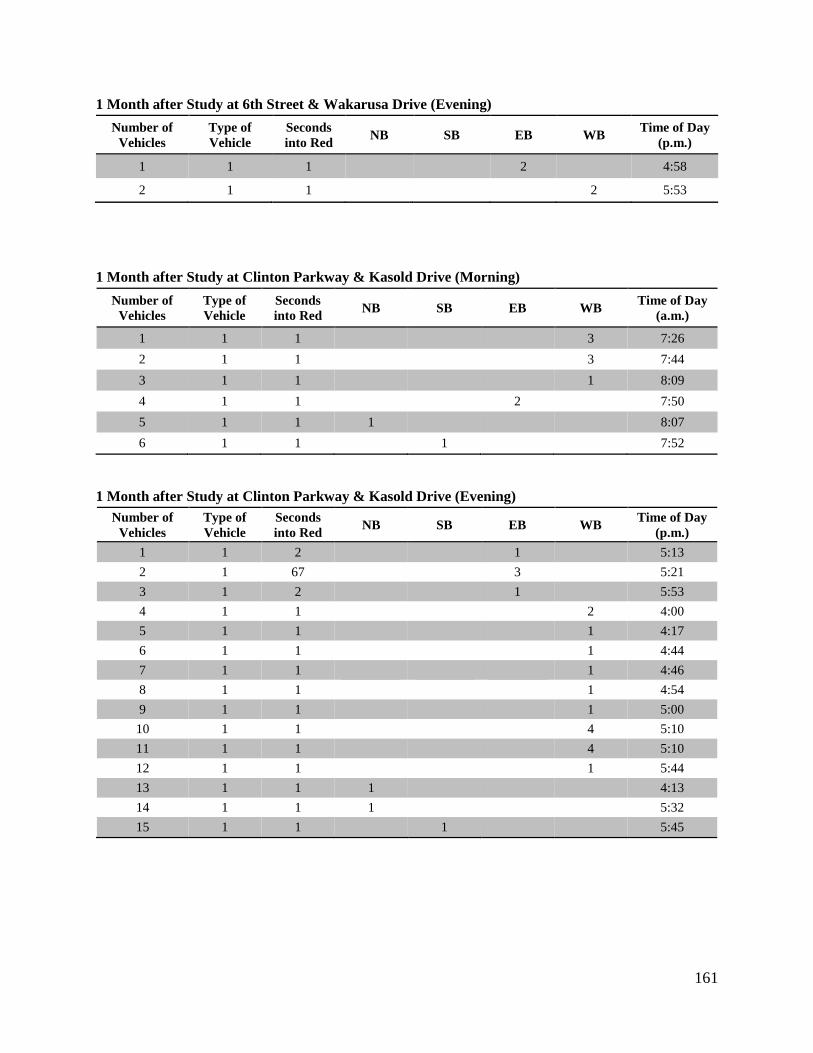
161
1 Month after Study at 6th Street & Wakarusa Drive (Evening)
Number of
Vehicles
Type of
Vehicle
Seconds
into Red NB SB EB WB
Time of Day
(p.m.)
1 1 1
2
4:58
2 1 1
2 5:53
1 Month after Study at Clinton Parkway & Kasold Drive (Morning)
Number of
Vehicles
Type of
Vehicle
Seconds
into Red NB SB EB WB
Time of Day
(a.m.)
1 1 1
3 7:26
2 1 1
3 7:44
3 1 1
1 8:09
4 1 1
2
7:50
5 1 1 1
8:07
6 1 1
1
7:52
1 Month after Study at Clinton Parkway & Kasold Drive (Evening)
Number of
Vehicles
Type of
Vehicle
Seconds
into Red NB SB EB WB
Time of Day
(p.m.)
1 1 2
1
5:13
2 1 67
3
5:21
3 1 2
1
5:53
4 1 1
2 4:00
5 1 1
1 4:17
6 1 1
1 4:44
7 1 1
1 4:46
8 1 1
1 4:54
9 1 1
1 5:00
10 1 1
4 5:10
11 1 1
4 5:10
12 1 1
1 5:44
13 1 1 1
4:13
14 1 1 1
5:32
15 1 1
1
5:45
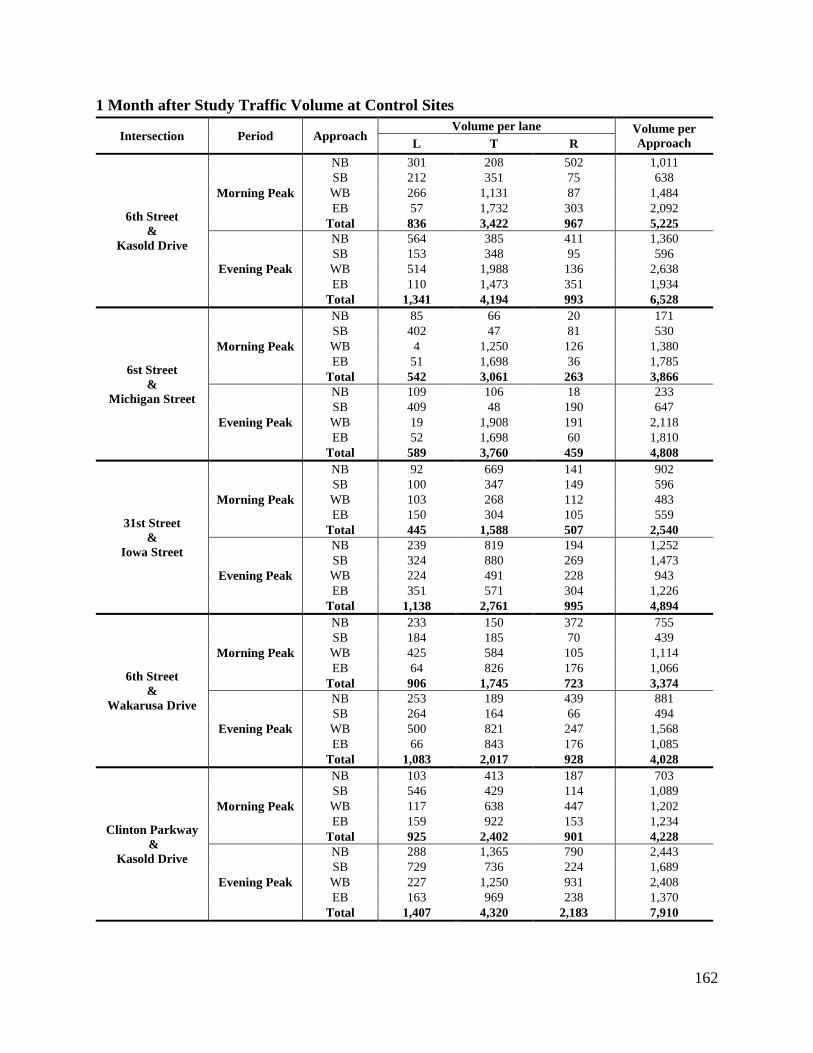
162
1 Month after Study Traffic Volume at Control Sites
Intersection Period Approach Volume per lane Volume per
Approach L T R
6th Street
&
Kasold Drive
Morning Peak
NB 301 208 502 1,011
SB 212 351 75 638
WB 266 1,131 87 1,484
EB 57 1,732 303 2,092
Total 836 3,422 967 5,225
Evening Peak
NB 564 385 411 1,360
SB 153 348 95 596
WB 514 1,988 136 2,638
EB 110 1,473 351 1,934
Total 1,341 4,194 993 6,528
6st Street
&
Michigan Street
Morning Peak
NB 85 66 20 171
SB 402 47 81 530
WB 4 1,250 126 1,380
EB 51 1,698 36 1,785
Total 542 3,061 263 3,866
Evening Peak
NB 109 106 18 233
SB 409 48 190 647
WB 19 1,908 191 2,118
EB 52 1,698 60 1,810
Total 589 3,760 459 4,808
31st Street
&
Iowa Street
Morning Peak
NB 92 669 141 902
SB 100 347 149 596
WB 103 268 112 483
EB 150 304 105 559
Total 445 1,588 507 2,540
Evening Peak
NB 239 819 194 1,252
SB 324 880 269 1,473
WB 224 491 228 943
EB 351 571 304 1,226
Total 1,138 2,761 995 4,894
6th Street
&
Wakarusa Drive
Morning Peak
NB 233 150 372 755
SB 184 185 70 439
WB 425 584 105 1,114
EB 64 826 176 1,066
Total 906 1,745 723 3,374
Evening Peak
NB 253 189 439 881
SB 264 164 66 494
WB 500 821 247 1,568
EB 66 843 176 1,085
Total 1,083 2,017 928 4,028
Clinton Parkway
&
Kasold Drive
Morning Peak
NB 103 413 187 703
SB 546 429 114 1,089
WB 117 638 447 1,202
EB 159 922 153 1,234
Total 925 2,402 901 4,228
Evening Peak
NB 288 1,365 790 2,443
SB 729 736 224 1,689
WB 227 1,250 931 2,408
EB 163 969 238 1,370
Total 1,407 4,320 2,183 7,910
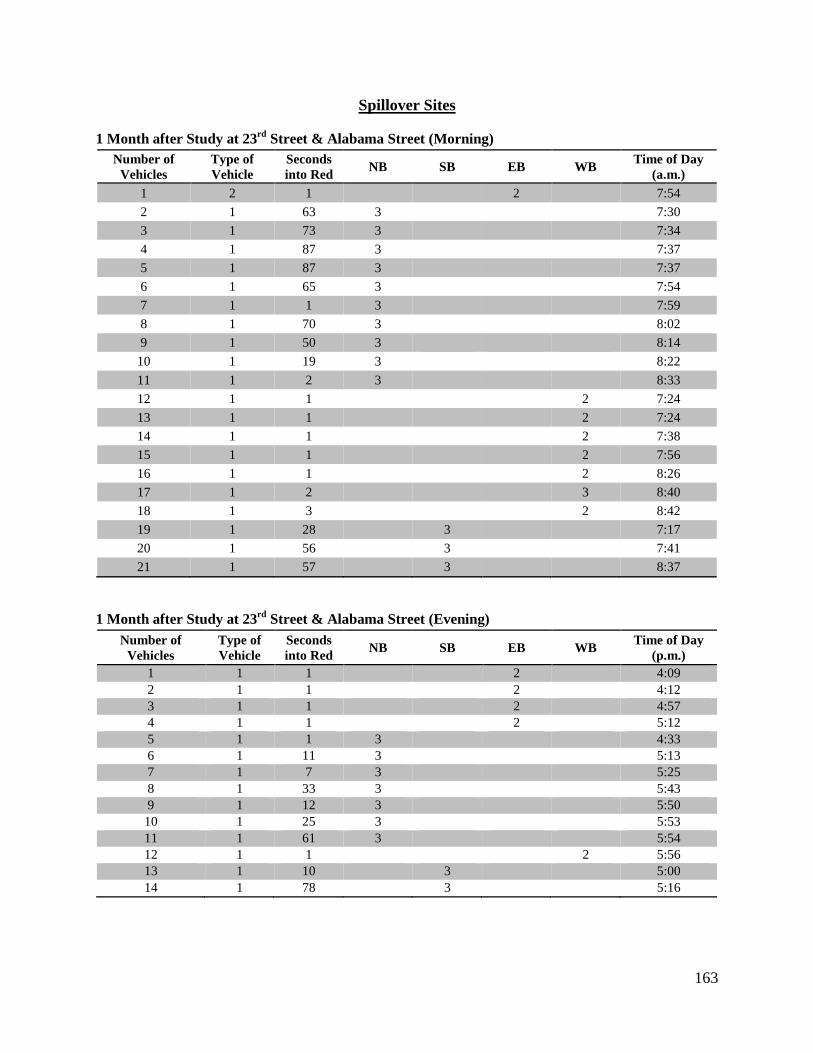
163
Spillover Sites
1 Month after Study at 23rd
Street & Alabama Street (Morning)
Number of
Vehicles
Type of
Vehicle
Seconds
into Red NB SB EB WB
Time of Day
(a.m.)
1 2 1
2
7:54
2 1 63 3
7:30
3 1 73 3
7:34
4 1 87 3
7:37
5 1 87 3
7:37
6 1 65 3
7:54
7 1 1 3
7:59
8 1 70 3
8:02
9 1 50 3
8:14
10 1 19 3
8:22
11 1 2 3
8:33
12 1 1
2 7:24
13 1 1
2 7:24
14 1 1
2 7:38
15 1 1
2 7:56
16 1 1
2 8:26
17 1 2
3 8:40
18 1 3
2 8:42
19 1 28
3
7:17
20 1 56
3
7:41
21 1 57
3
8:37
1 Month after Study at 23rd
Street & Alabama Street (Evening)
Number of
Vehicles
Type of
Vehicle
Seconds
into Red NB SB EB WB
Time of Day
(p.m.)
1 1 1 2 4:09
2 1 1 2 4:12
3 1 1 2 4:57
4 1 1 2 5:12
5 1 1 3 4:33
6 1 11 3 5:13
7 1 7 3 5:25
8 1 33 3 5:43
9 1 12 3 5:50
10 1 25 3 5:53
11 1 61 3 5:54
12 1 1 2 5:56
13 1 10 3 5:00
14 1 78 3 5:16
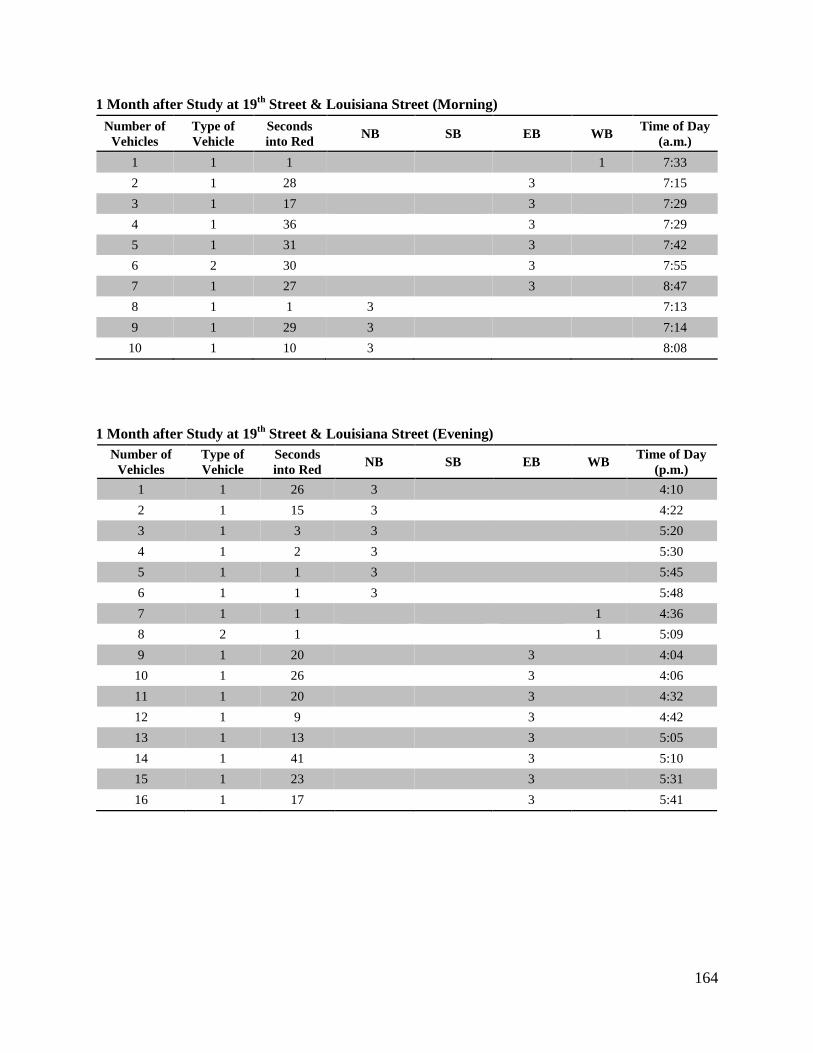
164
1 Month after Study at 19th
Street & Louisiana Street (Morning)
Number of
Vehicles
Type of
Vehicle
Seconds
into Red NB SB EB WB
Time of Day
(a.m.)
1 1 1
1 7:33
2 1 28
3
7:15
3 1 17
3
7:29
4 1 36
3
7:29
5 1 31
3
7:42
6 2 30
3
7:55
7 1 27
3
8:47
8 1 1 3
7:13
9 1 29 3
7:14
10 1 10 3
8:08
1 Month after Study at 19th
Street & Louisiana Street (Evening)
Number of
Vehicles
Type of
Vehicle
Seconds
into Red NB SB EB WB
Time of Day
(p.m.)
1 1 26 3
4:10
2 1 15 3
4:22
3 1 3 3
5:20
4 1 2 3
5:30
5 1 1 3
5:45
6 1 1 3
5:48
7 1 1
1 4:36
8 2 1
1 5:09
9 1 20
3
4:04
10 1 26
3
4:06
11 1 20
3
4:32
12 1 9
3
4:42
13 1 13
3
5:05
14 1 41
3
5:10
15 1 23
3
5:31
16 1 17
3
5:41
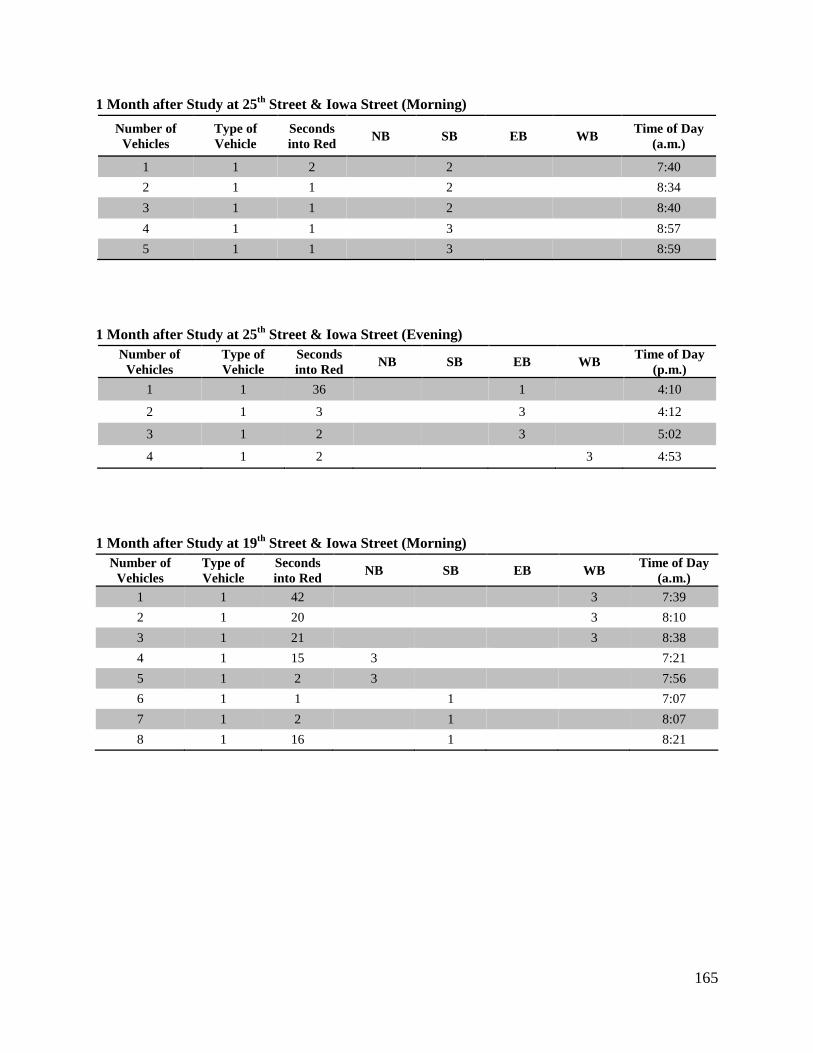
165
1 Month after Study at 25th
Street & Iowa Street (Morning)
Number of
Vehicles
Type of
Vehicle
Seconds
into Red NB SB EB WB
Time of Day
(a.m.)
1 1 2
2
7:40
2 1 1
2
8:34
3 1 1
2
8:40
4 1 1
3
8:57
5 1 1
3
8:59
1 Month after Study at 25th
Street & Iowa Street (Evening)
Number of
Vehicles
Type of
Vehicle
Seconds
into Red NB SB EB WB
Time of Day
(p.m.)
1 1 36
1
4:10
2 1 3
3
4:12
3 1 2
3
5:02
4 1 2
3 4:53
1 Month after Study at 19th
Street & Iowa Street (Morning)
Number of
Vehicles
Type of
Vehicle
Seconds
into Red NB SB EB WB
Time of Day
(a.m.)
1 1 42
3 7:39
2 1 20
3 8:10
3 1 21
3 8:38
4 1 15 3
7:21
5 1 2 3
7:56
6 1 1
1
7:07
7 1 2
1
8:07
8 1 16
1
8:21
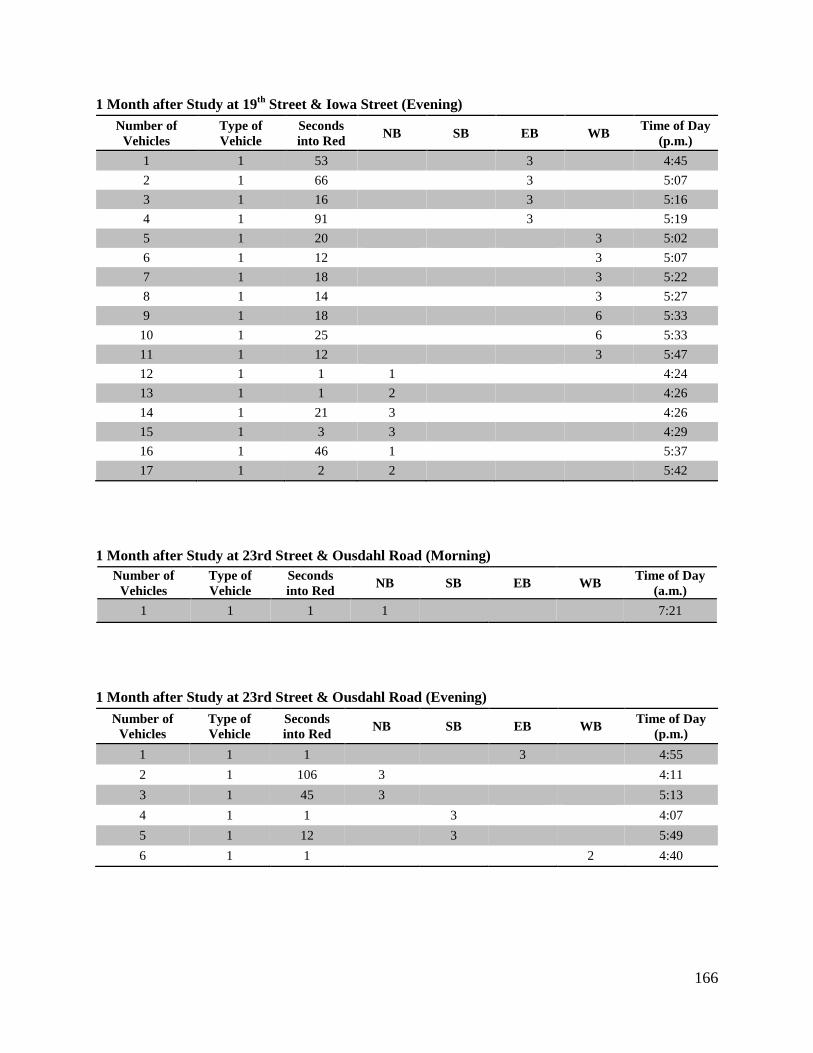
166
1 Month after Study at 19th
Street & Iowa Street (Evening)
Number of
Vehicles
Type of
Vehicle
Seconds
into Red NB SB EB WB
Time of Day
(p.m.)
1 1 53
3
4:45
2 1 66
3
5:07
3 1 16
3
5:16
4 1 91
3
5:19
5 1 20
3 5:02
6 1 12
3 5:07
7 1 18
3 5:22
8 1 14
3 5:27
9 1 18
6 5:33
10 1 25
6 5:33
11 1 12
3 5:47
12 1 1 1
4:24
13 1 1 2
4:26
14 1 21 3
4:26
15 1 3 3
4:29
16 1 46 1
5:37
17 1 2 2
5:42
1 Month after Study at 23rd Street & Ousdahl Road (Morning)
Number of
Vehicles
Type of
Vehicle
Seconds
into Red NB SB EB WB
Time of Day
(a.m.)
1 1 1 1
7:21
1 Month after Study at 23rd Street & Ousdahl Road (Evening)
Number of
Vehicles
Type of
Vehicle
Seconds
into Red NB SB EB WB
Time of Day
(p.m.)
1 1 1
3
4:55
2 1 106 3
4:11
3 1 45 3
5:13
4 1 1
3
4:07
5 1 12
3
5:49
6 1 1
2 4:40
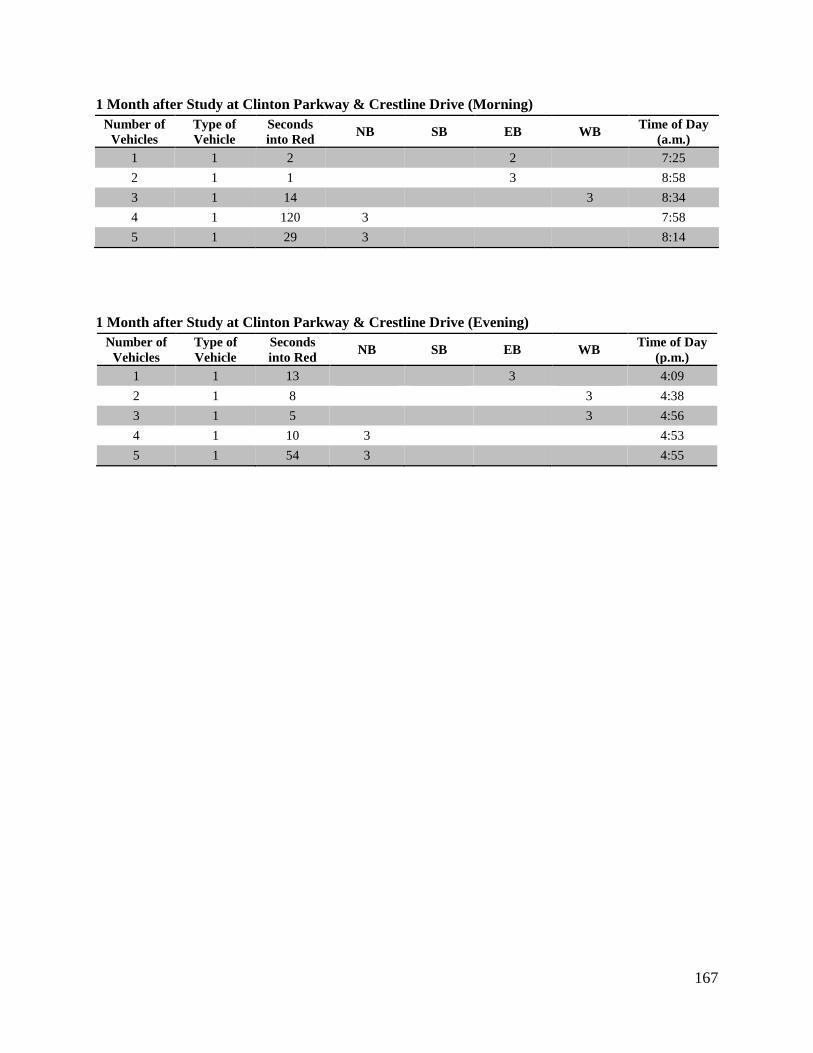
167
1 Month after Study at Clinton Parkway & Crestline Drive (Morning)
Number of
Vehicles
Type of
Vehicle
Seconds
into Red NB SB EB WB
Time of Day
(a.m.)
1 1 2
2
7:25
2 1 1
3
8:58
3 1 14
3 8:34
4 1 120 3
7:58
5 1 29 3
8:14
1 Month after Study at Clinton Parkway & Crestline Drive (Evening)
Number of
Vehicles
Type of
Vehicle
Seconds
into Red NB SB EB WB
Time of Day
(p.m.)
1 1 13
3
4:09
2 1 8
3 4:38
3 1 5
3 4:56
4 1 10 3
4:53
5 1 54 3
4:55
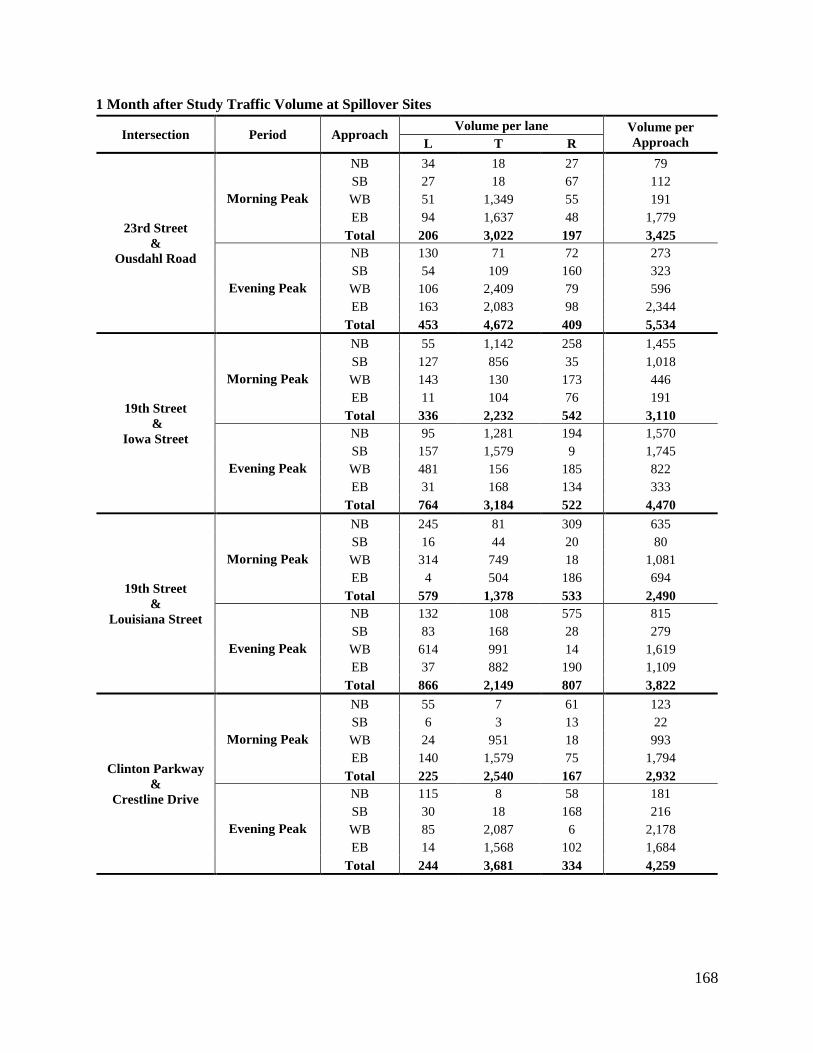
168
1 Month after Study Traffic Volume at Spillover Sites
Intersection Period Approach Volume per lane Volume per
Approach L T R
23rd Street
&
Ousdahl Road
Morning Peak
NB 34 18 27 79
SB 27 18 67 112
WB 51 1,349 55 191
EB 94 1,637 48 1,779
Total 206 3,022 197 3,425
Evening Peak
NB 130 71 72 273
SB 54 109 160 323
WB 106 2,409 79 596
EB 163 2,083 98 2,344
Total 453 4,672 409 5,534
19th Street
&
Iowa Street
Morning Peak
NB 55 1,142 258 1,455
SB 127 856 35 1,018
WB 143 130 173 446
EB 11 104 76 191
Total 336 2,232 542 3,110
Evening Peak
NB 95 1,281 194 1,570
SB 157 1,579 9 1,745
WB 481 156 185 822
EB 31 168 134 333
Total 764 3,184 522 4,470
19th Street
&
Louisiana Street
Morning Peak
NB 245 81 309 635
SB 16 44 20 80
WB 314 749 18 1,081
EB 4 504 186 694
Total 579 1,378 533 2,490
Evening Peak
NB 132 108 575 815
SB 83 168 28 279
WB 614 991 14 1,619
EB 37 882 190 1,109
Total 866 2,149 807 3,822
Clinton Parkway
&
Crestline Drive
Morning Peak
NB 55 7 61 123
SB 6 3 13 22
WB 24 951 18 993
EB 140 1,579 75 1,794
Total 225 2,540 167 2,932
Evening Peak
NB 115 8 58 181
SB 30 18 168 216
WB 85 2,087 6 2,178
EB 14 1,568 102 1,684
Total 244 3,681 334 4,259
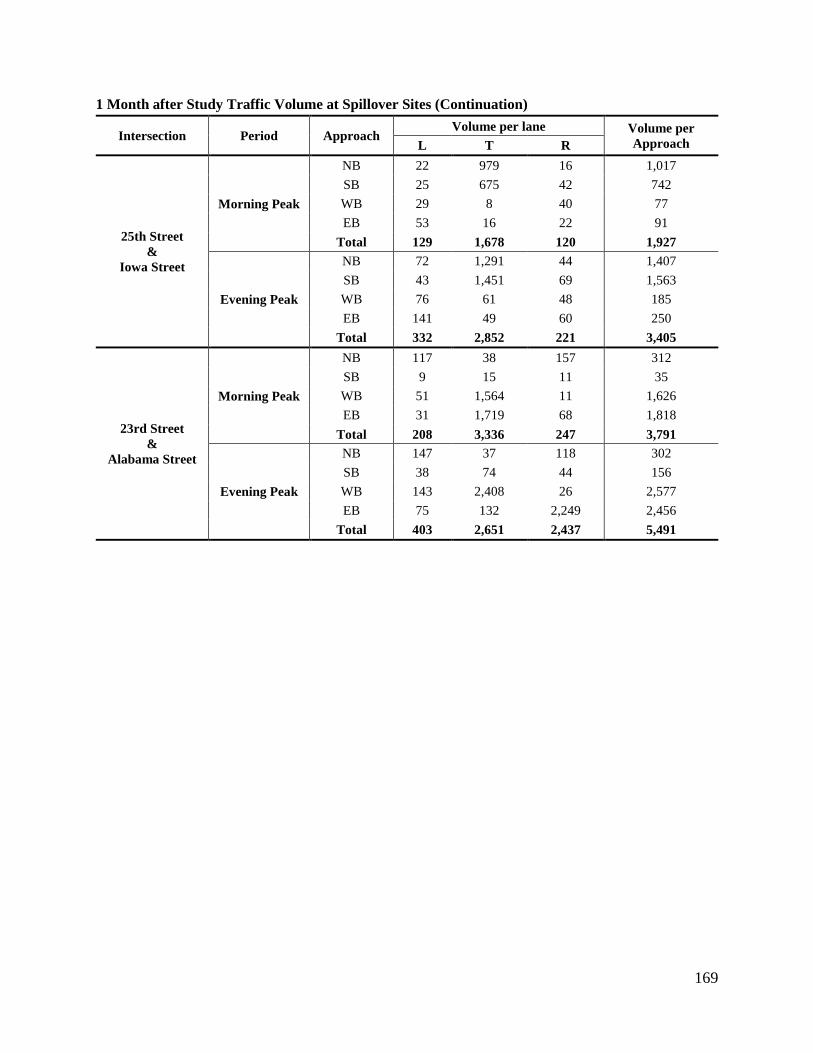
169
1 Month after Study Traffic Volume at Spillover Sites (Continuation)
Intersection Period Approach Volume per lane Volume per
Approach L T R
25th Street
&
Iowa Street
Morning Peak
NB 22 979 16 1,017
SB 25 675 42 742
WB 29 8 40 77
EB 53 16 22 91
Total 129 1,678 120 1,927
Evening Peak
NB 72 1,291 44 1,407
SB 43 1,451 69 1,563
WB 76 61 48 185
EB 141 49 60 250
Total 332 2,852 221 3,405
23rd Street
&
Alabama Street
Morning Peak
NB 117 38 157 312
SB 9 15 11 35
WB 51 1,564 11 1,626
EB 31 1,719 68 1,818
Total 208 3,336 247 3,791
Evening Peak
NB 147 37 118 302
SB 38 74 44 156
WB 143 2,408 26 2,577
EB 75 132 2,249 2,456
Total 403 2,651 2,437 5,491

170
3 MONTHS AFTER STUDY RLR VIOLATIONS
Treatment Sites
3 Months after Study at 23rd
Street & Louisiana Street (Morning)
Number of
Vehicles
Type of
Vehicle
Seconds
into Red NB SB EB WB
Time of Day
(a.m.)
1 1 2
2
7:15
2 1 1
2
8:53
3 1 1
2 7:53
4 1 1
1 8:56
5 1 2
3
7:03
6 1 1
3
7:44
7 1 2
3
8:07
8 1 2
3
8:33
9 1 1 2
7:39
10 1 1 3
8:43
11 1 1 3
8:51
12 1 1 3
8:53
3 Months after Study at 23rd
Street & Louisiana Street (Evening)
Number of
Vehicles
Type of
Vehicle
Seconds
into Red NB SB EB WB
Time of Day
(p.m.)
1 1 1
2
5:17
2 1 1
2 4:09
3 1 7
2 4:41
4 1 1
1 5:08
5 1 1
1 5:25
6 1 2
3 5:34
7 1 1
2 5:39
8 1 1
1
4:30
9 1 1
3
4:40
10 1 2
3
5:50
11 1 1 1
4:04
12 1 1 4
4:44
13 1 3 4
4:44
14 1 3 1
5:21
15 1 1 2
5:39
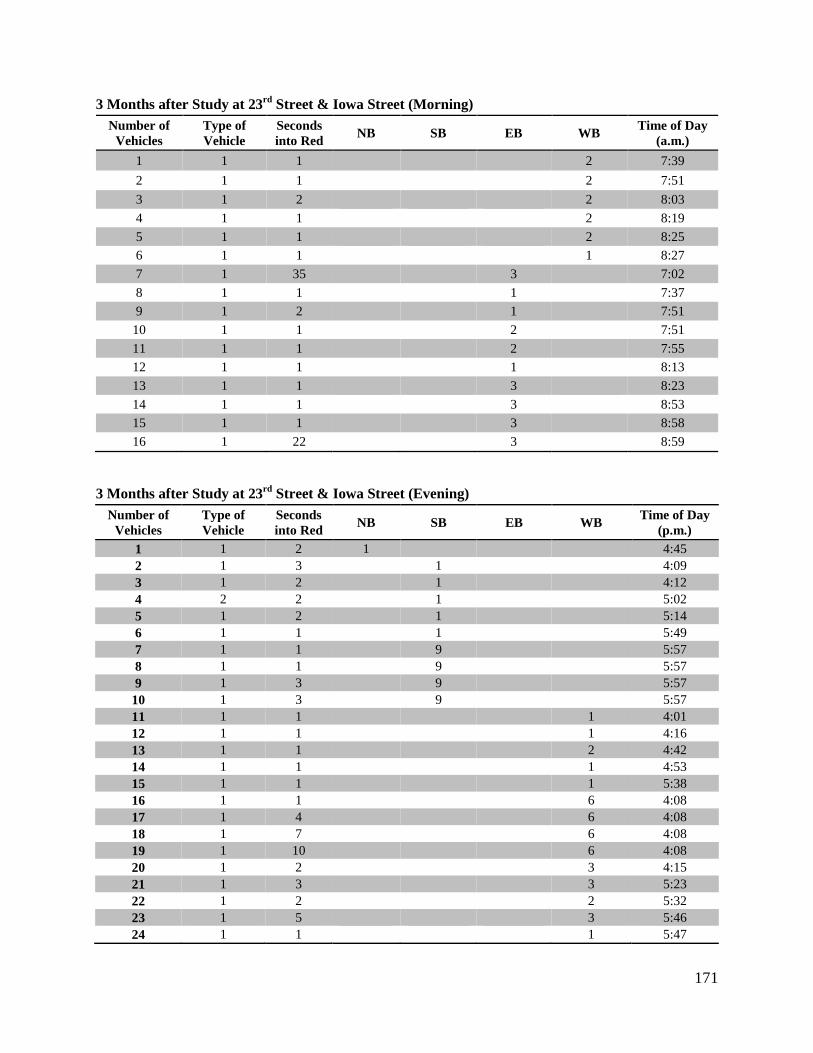
171
3 Months after Study at 23rd
Street & Iowa Street (Morning)
Number of
Vehicles
Type of
Vehicle
Seconds
into Red NB SB EB WB
Time of Day
(a.m.)
1 1 1
2 7:39
2 1 1
2 7:51
3 1 2
2 8:03
4 1 1
2 8:19
5 1 1
2 8:25
6 1 1
1 8:27
7 1 35
3
7:02
8 1 1
1
7:37
9 1 2
1
7:51
10 1 1
2
7:51
11 1 1
2
7:55
12 1 1
1
8:13
13 1 1
3
8:23
14 1 1
3
8:53
15 1 1
3
8:58
16 1 22
3
8:59
3 Months after Study at 23rd
Street & Iowa Street (Evening)
Number of
Vehicles
Type of
Vehicle
Seconds
into Red NB SB EB WB
Time of Day
(p.m.)
1 1 2 1
4:45
2 1 3
1
4:09
3 1 2
1
4:12
4 2 2
1
5:02
5 1 2
1
5:14
6 1 1
1
5:49
7 1 1
9
5:57
8 1 1
9
5:57
9 1 3
9
5:57
10 1 3
9
5:57
11 1 1
1 4:01
12 1 1
1 4:16
13 1 1
2 4:42
14 1 1
1 4:53
15 1 1
1 5:38
16 1 1
6 4:08
17 1 4
6 4:08
18 1 7
6 4:08
19 1 10
6 4:08
20 1 2
3 4:15
21 1 3
3 5:23
22 1 2
2 5:32
23 1 5
3 5:46
24 1 1
1 5:47
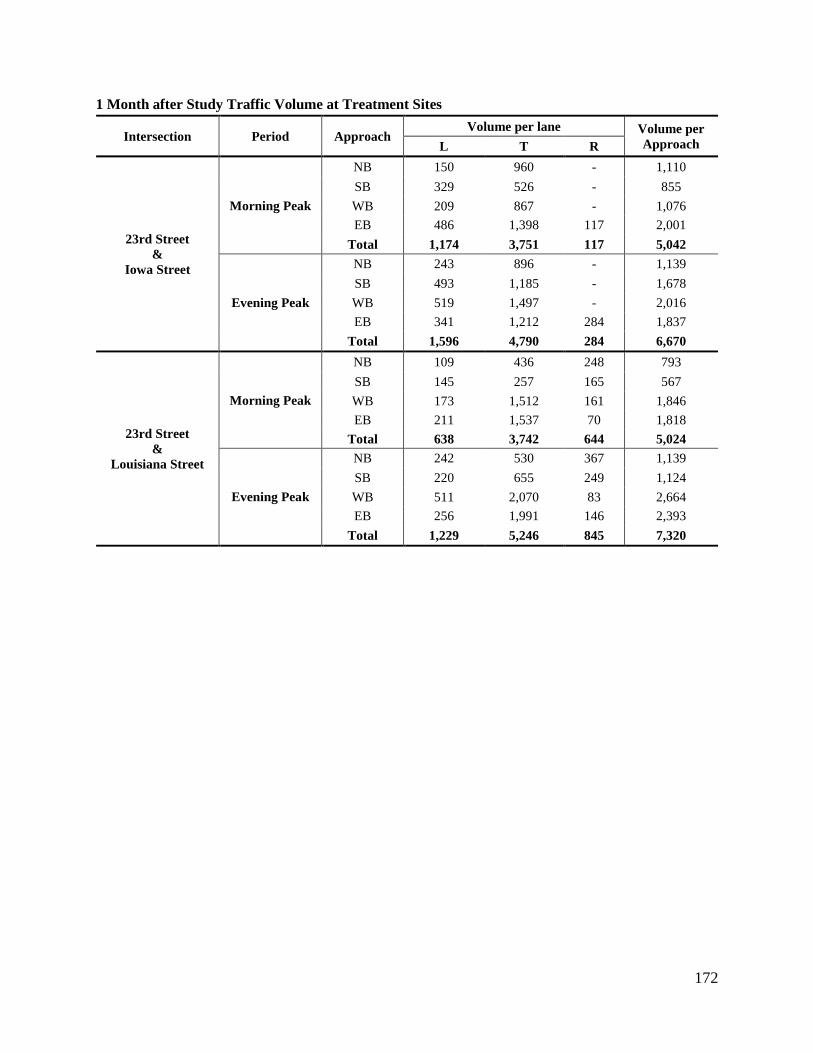
172
1 Month after Study Traffic Volume at Treatment Sites
Intersection Period Approach Volume per lane Volume per
Approach L T R
23rd Street
&
Iowa Street
Morning Peak
NB 150 960 - 1,110
SB 329 526 - 855
WB 209 867 - 1,076
EB 486 1,398 117 2,001
Total 1,174 3,751 117 5,042
Evening Peak
NB 243 896 - 1,139
SB 493 1,185 - 1,678
WB 519 1,497 - 2,016
EB 341 1,212 284 1,837
Total 1,596 4,790 284 6,670
23rd Street
&
Louisiana Street
Morning Peak
NB 109 436 248 793
SB 145 257 165 567
WB 173 1,512 161 1,846
EB 211 1,537 70 1,818
Total 638 3,742 644 5,024
Evening Peak
NB 242 530 367 1,139
SB 220 655 249 1,124
WB 511 2,070 83 2,664
EB 256 1,991 146 2,393
Total 1,229 5,246 845 7,320
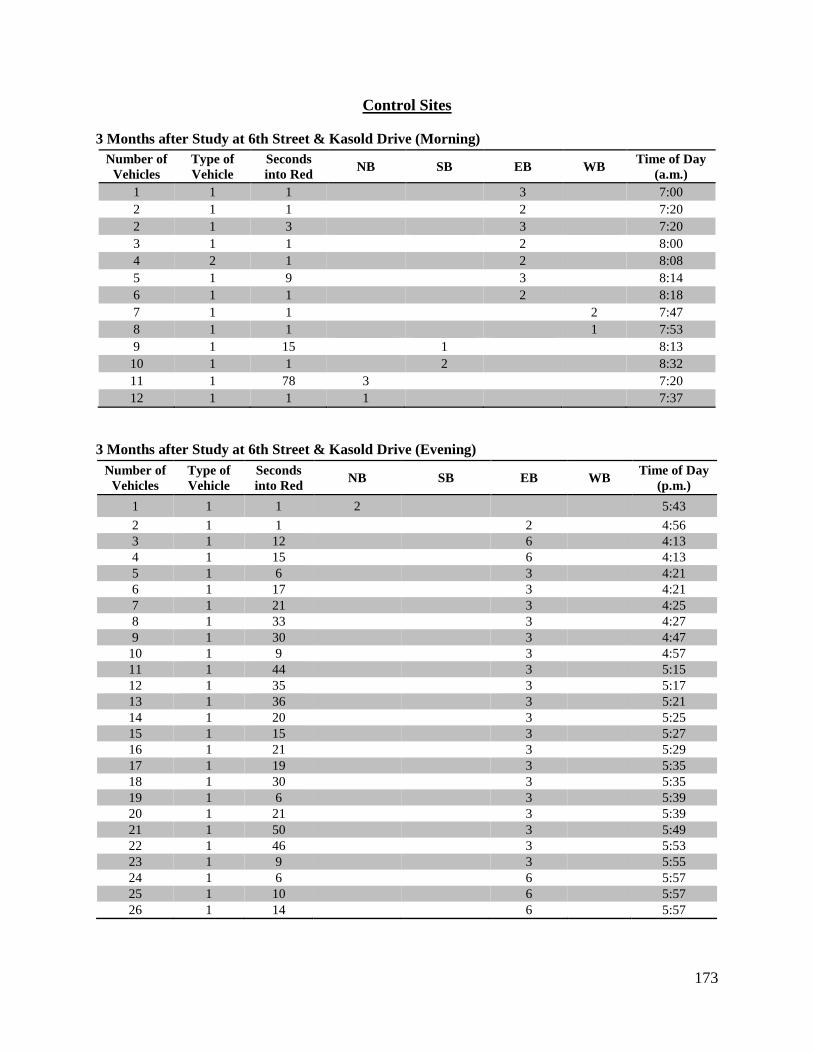
173
Control Sites
3 Months after Study at 6th Street & Kasold Drive (Morning)
Number of
Vehicles
Type of
Vehicle
Seconds
into Red NB SB EB WB
Time of Day
(a.m.)
1 1 1
3
7:00
2 1 1
2
7:20
2 1 3
3
7:20
3 1 1
2
8:00
4 2 1
2
8:08
5 1 9
3
8:14
6 1 1
2
8:18
7 1 1
2 7:47
8 1 1
1 7:53
9 1 15
1
8:13
10 1 1
2
8:32
11 1 78 3
7:20
12 1 1 1
7:37
3 Months after Study at 6th Street & Kasold Drive (Evening)
Number of
Vehicles
Type of
Vehicle
Seconds
into Red NB SB EB WB
Time of Day
(p.m.)
1 1 1 2
5:43
2 1 1
2
4:56
3 1 12
6
4:13
4 1 15
6
4:13
5 1 6
3
4:21
6 1 17
3
4:21
7 1 21
3
4:25
8 1 33
3
4:27
9 1 30
3
4:47
10 1 9
3
4:57
11 1 44
3
5:15
12 1 35
3
5:17
13 1 36
3
5:21
14 1 20
3
5:25
15 1 15
3
5:27
16 1 21
3
5:29
17 1 19
3
5:35
18 1 30
3
5:35
19 1 6
3
5:39
20 1 21
3
5:39
21 1 50
3
5:49
22 1 46
3
5:53
23 1 9
3
5:55
24 1 6
6
5:57
25 1 10
6
5:57
26 1 14
6
5:57
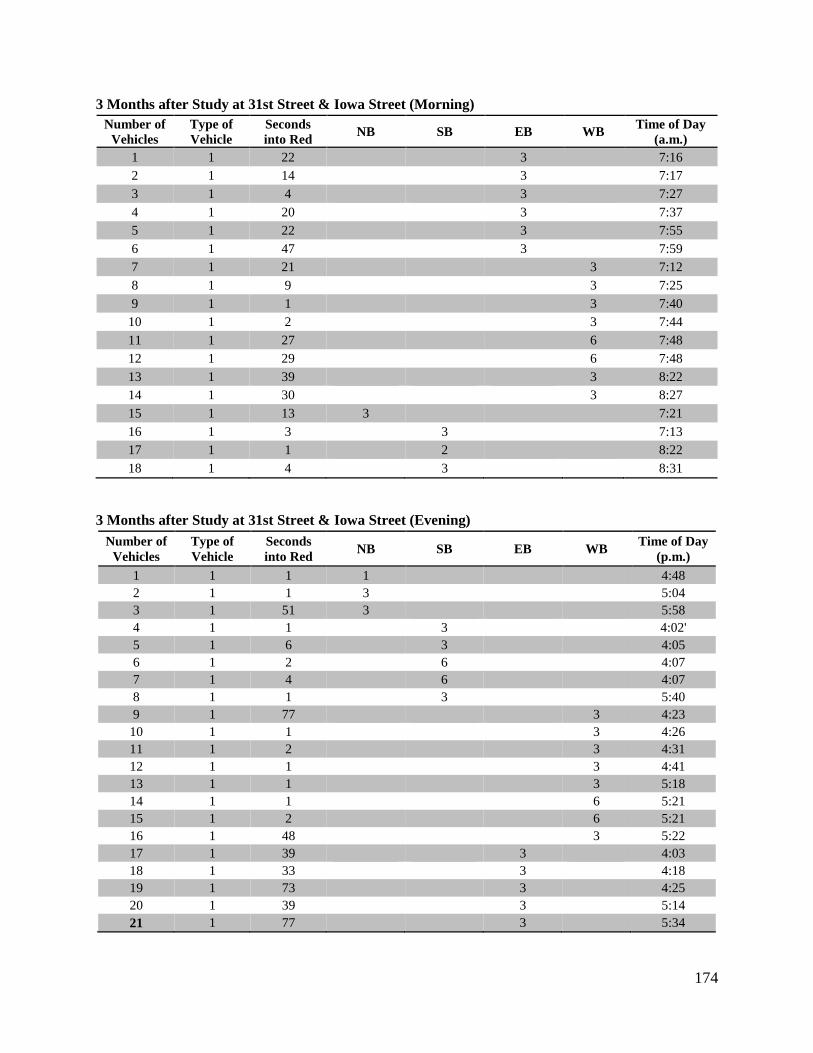
174
3 Months after Study at 31st Street & Iowa Street (Morning)
Number of
Vehicles
Type of
Vehicle
Seconds
into Red NB SB EB WB
Time of Day
(a.m.)
1 1 22
3
7:16
2 1 14
3
7:17
3 1 4
3
7:27
4 1 20
3
7:37
5 1 22
3
7:55
6 1 47
3
7:59
7 1 21
3 7:12
8 1 9
3 7:25
9 1 1
3 7:40
10 1 2
3 7:44
11 1 27
6 7:48
12 1 29
6 7:48
13 1 39
3 8:22
14 1 30
3 8:27
15 1 13 3
7:21
16 1 3
3
7:13
17 1 1
2
8:22
18 1 4
3
8:31
3 Months after Study at 31st Street & Iowa Street (Evening)
Number of
Vehicles
Type of
Vehicle
Seconds
into Red NB SB EB WB
Time of Day
(p.m.)
1 1 1 1
4:48
2 1 1 3
5:04
3 1 51 3
5:58
4 1 1
3
4:02'
5 1 6
3
4:05
6 1 2
6
4:07
7 1 4
6
4:07
8 1 1
3
5:40
9 1 77
3 4:23
10 1 1
3 4:26
11 1 2
3 4:31
12 1 1
3 4:41
13 1 1
3 5:18
14 1 1
6 5:21
15 1 2
6 5:21
16 1 48
3 5:22
17 1 39
3
4:03
18 1 33
3
4:18
19 1 73
3
4:25
20 1 39
3
5:14
21 1 77
3
5:34
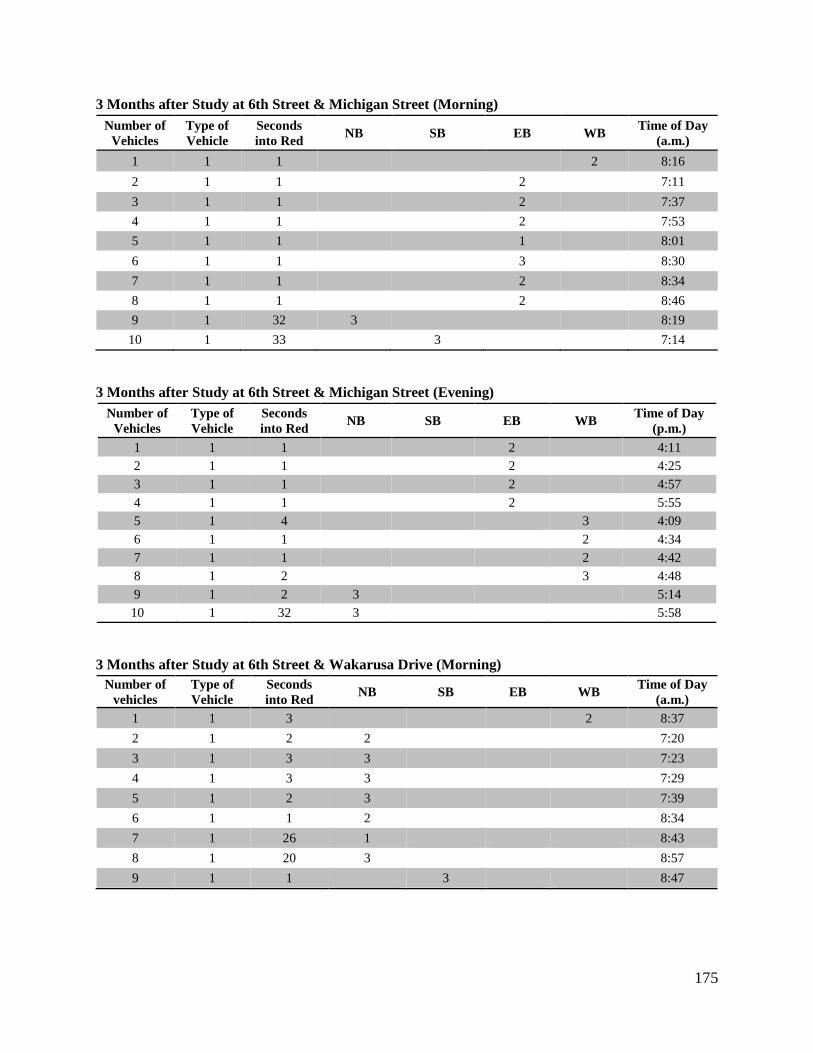
175
3 Months after Study at 6th Street & Michigan Street (Morning)
Number of
Vehicles
Type of
Vehicle
Seconds
into Red NB SB EB WB
Time of Day
(a.m.)
1 1 1
2 8:16
2 1 1
2
7:11
3 1 1
2
7:37
4 1 1
2
7:53
5 1 1
1
8:01
6 1 1
3
8:30
7 1 1
2
8:34
8 1 1
2
8:46
9 1 32 3
8:19
10 1 33
3
7:14
3 Months after Study at 6th Street & Michigan Street (Evening)
Number of
Vehicles
Type of
Vehicle
Seconds
into Red NB SB EB WB
Time of Day
(p.m.)
1 1 1
2
4:11
2 1 1
2
4:25
3 1 1
2
4:57
4 1 1
2
5:55
5 1 4
3 4:09
6 1 1
2 4:34
7 1 1
2 4:42
8 1 2
3 4:48
9 1 2 3
5:14
10 1 32 3
5:58
3 Months after Study at 6th Street & Wakarusa Drive (Morning)
Number of
vehicles
Type of
Vehicle
Seconds
into Red NB SB EB WB
Time of Day
(a.m.)
1 1 3
2 8:37
2 1 2 2
7:20
3 1 3 3
7:23
4 1 3 3
7:29
5 1 2 3
7:39
6 1 1 2
8:34
7 1 26 1
8:43
8 1 20 3
8:57
9 1 1
3
8:47
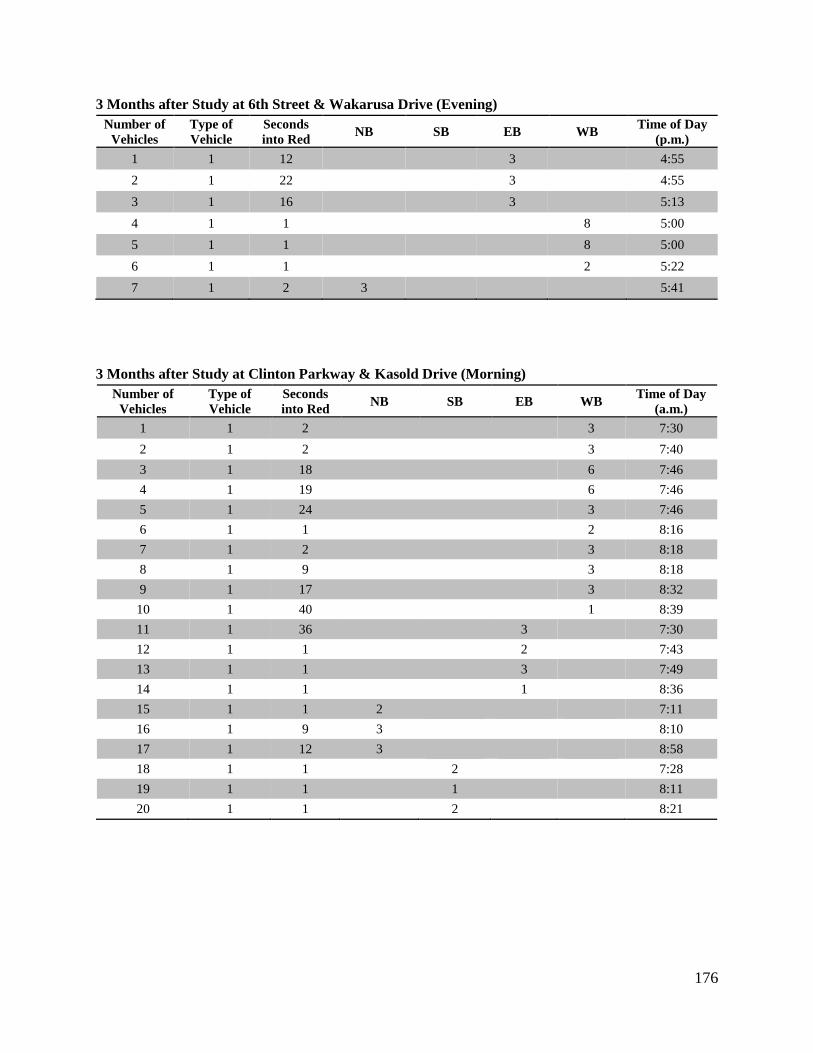
176
3 Months after Study at 6th Street & Wakarusa Drive (Evening)
Number of
Vehicles
Type of
Vehicle
Seconds
into Red NB SB EB WB
Time of Day
(p.m.)
1 1 12
3
4:55
2 1 22
3
4:55
3 1 16
3
5:13
4 1 1
8 5:00
5 1 1
8 5:00
6 1 1
2 5:22
7 1 2 3
5:41
3 Months after Study at Clinton Parkway & Kasold Drive (Morning)
Number of
Vehicles
Type of
Vehicle
Seconds
into Red NB SB EB WB
Time of Day
(a.m.)
1 1 2
3 7:30
2 1 2
3 7:40
3 1 18
6 7:46
4 1 19
6 7:46
5 1 24
3 7:46
6 1 1
2 8:16
7 1 2
3 8:18
8 1 9
3 8:18
9 1 17
3 8:32
10 1 40
1 8:39
11 1 36
3
7:30
12 1 1
2
7:43
13 1 1
3
7:49
14 1 1
1
8:36
15 1 1 2
7:11
16 1 9 3
8:10
17 1 12 3
8:58
18 1 1
2
7:28
19 1 1
1
8:11
20 1 1
2
8:21
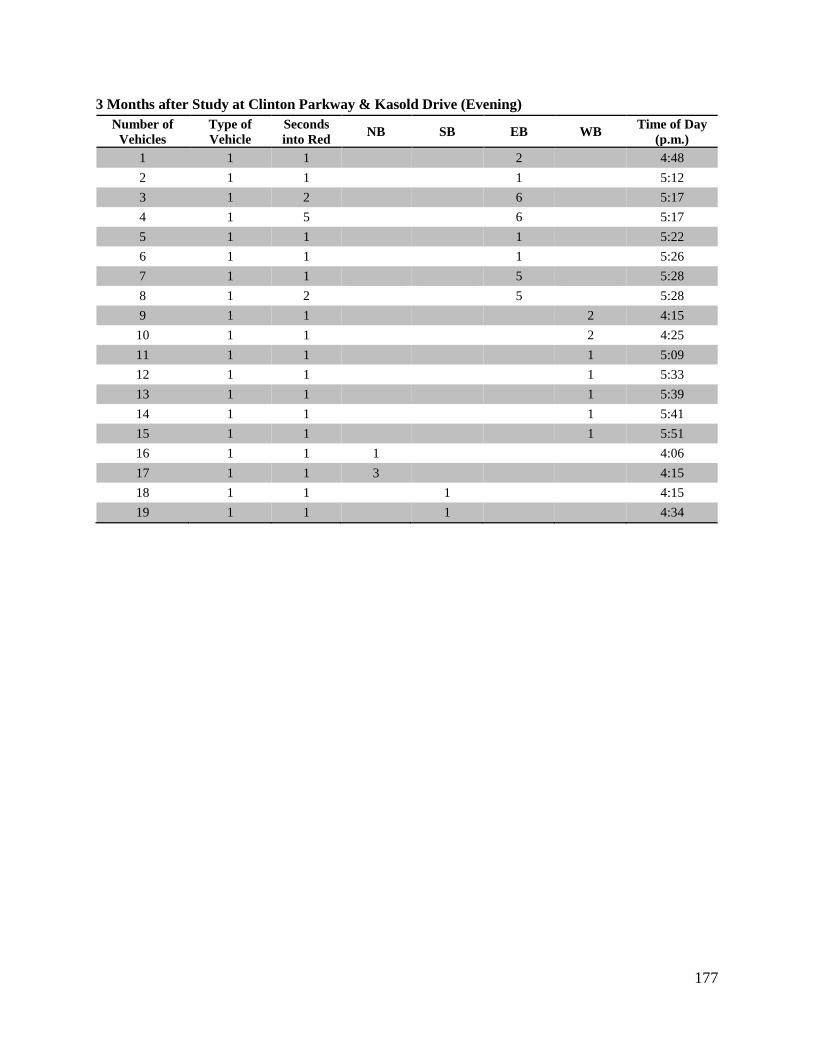
177
3 Months after Study at Clinton Parkway & Kasold Drive (Evening)
Number of
Vehicles
Type of
Vehicle
Seconds
into Red NB SB EB WB
Time of Day
(p.m.)
1 1 1
2
4:48
2 1 1
1
5:12
3 1 2
6
5:17
4 1 5
6
5:17
5 1 1
1
5:22
6 1 1
1
5:26
7 1 1
5
5:28
8 1 2
5
5:28
9 1 1
2 4:15
10 1 1
2 4:25
11 1 1
1 5:09
12 1 1
1 5:33
13 1 1
1 5:39
14 1 1
1 5:41
15 1 1
1 5:51
16 1 1 1
4:06
17 1 1 3
4:15
18 1 1
1
4:15
19 1 1
1
4:34
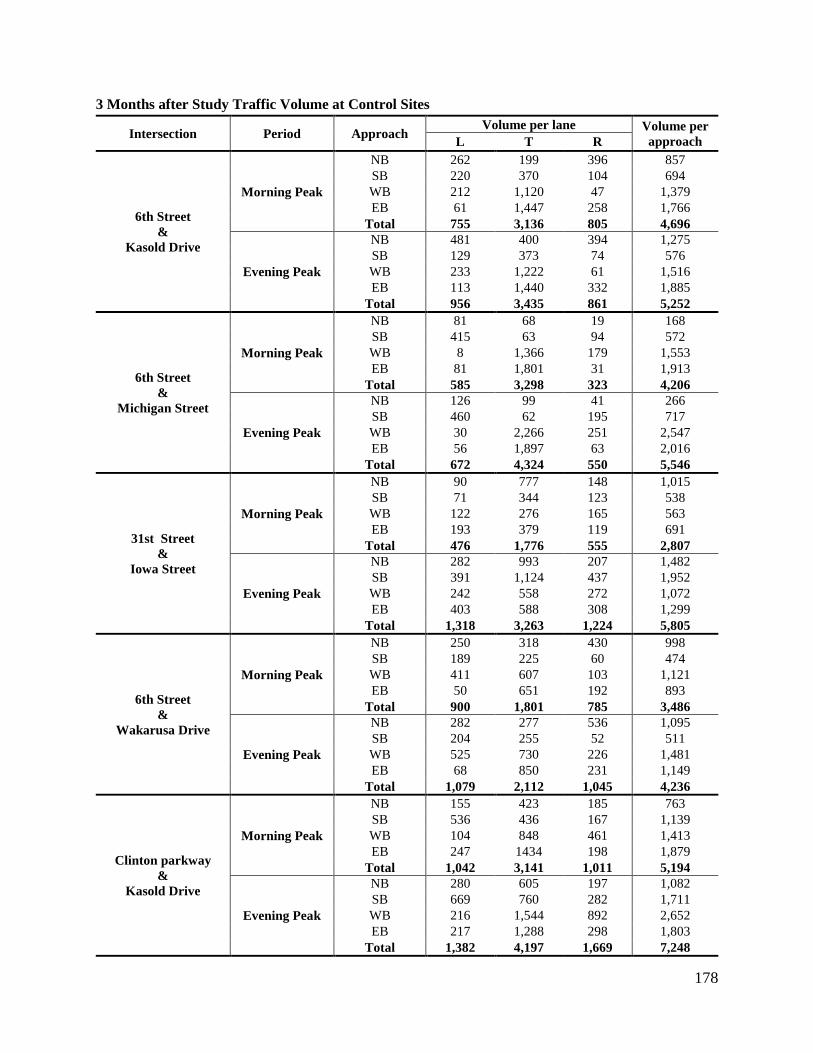
178
3 Months after Study Traffic Volume at Control Sites
Intersection Period Approach Volume per lane Volume per
approach L T R
6th Street
&
Kasold Drive
Morning Peak
NB 262 199 396 857
SB 220 370 104 694
WB 212 1,120 47 1,379
EB 61 1,447 258 1,766
Total 755 3,136 805 4,696
Evening Peak
NB 481 400 394 1,275
SB 129 373 74 576
WB 233 1,222 61 1,516
EB 113 1,440 332 1,885
Total 956 3,435 861 5,252
6th Street
&
Michigan Street
Morning Peak
NB 81 68 19 168
SB 415 63 94 572
WB 8 1,366 179 1,553
EB 81 1,801 31 1,913
Total 585 3,298 323 4,206
Evening Peak
NB 126 99 41 266
SB 460 62 195 717
WB 30 2,266 251 2,547
EB 56 1,897 63 2,016
Total 672 4,324 550 5,546
31st Street
&
Iowa Street
Morning Peak
NB 90 777 148 1,015
SB 71 344 123 538
WB 122 276 165 563
EB 193 379 119 691
Total 476 1,776 555 2,807
Evening Peak
NB 282 993 207 1,482
SB 391 1,124 437 1,952
WB 242 558 272 1,072
EB 403 588 308 1,299
Total 1,318 3,263 1,224 5,805
6th Street
&
Wakarusa Drive
Morning Peak
NB 250 318 430 998
SB 189 225 60 474
WB 411 607 103 1,121
EB 50 651 192 893
Total 900 1,801 785 3,486
Evening Peak
NB 282 277 536 1,095
SB 204 255 52 511
WB 525 730 226 1,481
EB 68 850 231 1,149
Total 1,079 2,112 1,045 4,236
Clinton parkway
&
Kasold Drive
Morning Peak
NB 155 423 185 763
SB 536 436 167 1,139
WB 104 848 461 1,413
EB 247 1434 198 1,879
Total 1,042 3,141 1,011 5,194
Evening Peak
NB 280 605 197 1,082
SB 669 760 282 1,711
WB 216 1,544 892 2,652
EB 217 1,288 298 1,803
Total 1,382 4,197 1,669 7,248
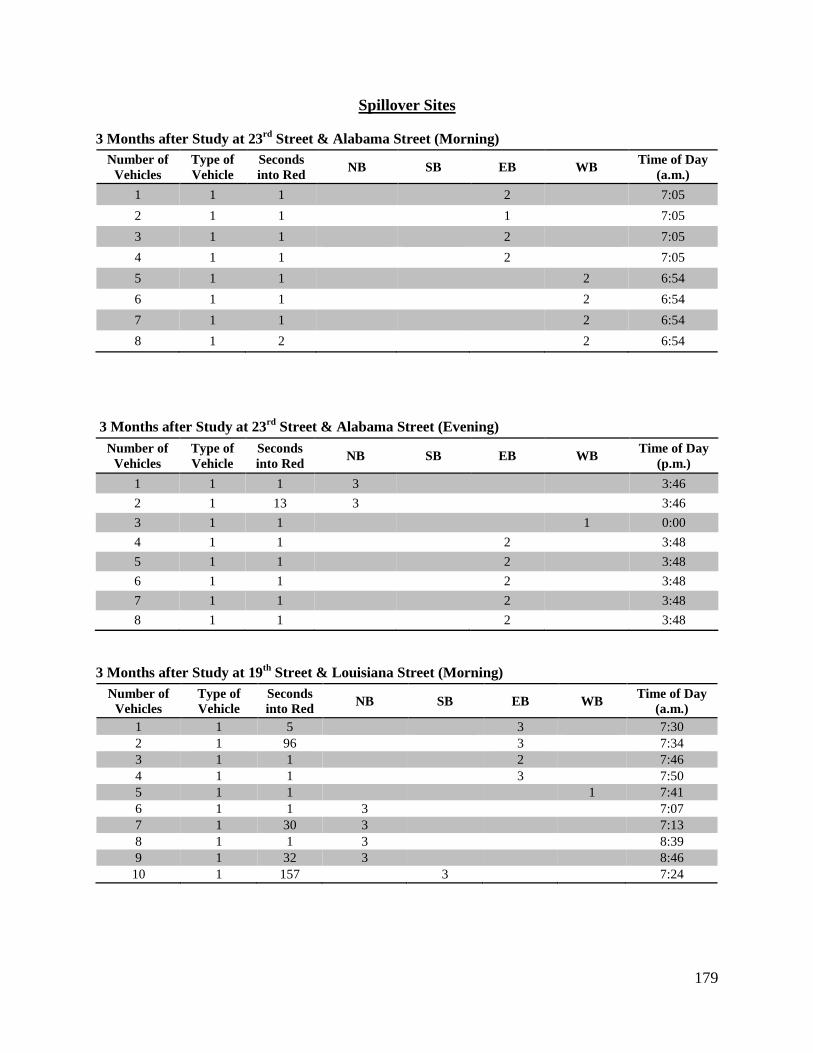
179
Spillover Sites
3 Months after Study at 23rd
Street & Alabama Street (Morning)
Number of
Vehicles
Type of
Vehicle
Seconds
into Red NB SB EB WB
Time of Day
(a.m.)
1 1 1
2
7:05
2 1 1
1
7:05
3 1 1
2
7:05
4 1 1
2
7:05
5 1 1
2 6:54
6 1 1
2 6:54
7 1 1
2 6:54
8 1 2
2 6:54
3 Months after Study at 23rd
Street & Alabama Street (Evening)
Number of
Vehicles
Type of
Vehicle
Seconds
into Red NB SB EB WB
Time of Day
(p.m.)
1 1 1 3
3:46
2 1 13 3
3:46
3 1 1
1 0:00
4 1 1
2
3:48
5 1 1
2
3:48
6 1 1
2
3:48
7 1 1
2
3:48
8 1 1
2
3:48
3 Months after Study at 19th
Street & Louisiana Street (Morning)
Number of
Vehicles
Type of
Vehicle
Seconds
into Red NB SB EB WB
Time of Day
(a.m.)
1 1 5
3
7:30
2 1 96
3
7:34
3 1 1
2
7:46
4 1 1
3
7:50
5 1 1
1 7:41
6 1 1 3
7:07
7 1 30 3
7:13
8 1 1 3
8:39
9 1 32 3
8:46
10 1 157
3
7:24
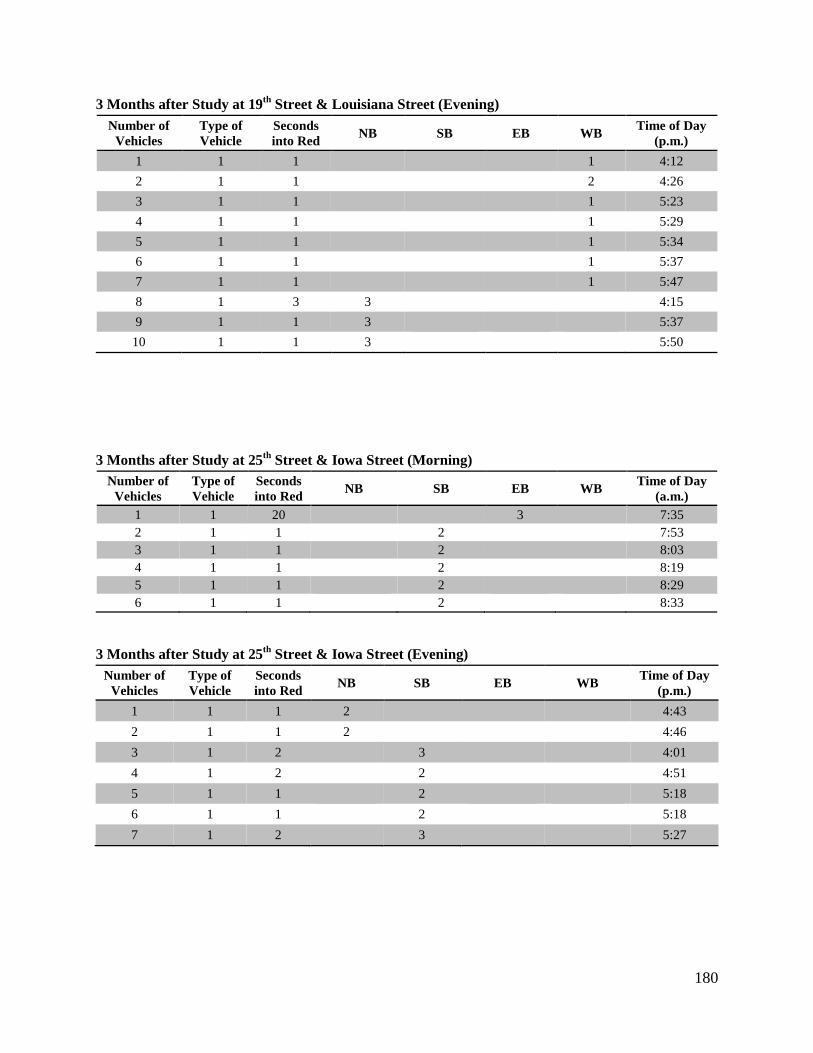
180
3 Months after Study at 19th
Street & Louisiana Street (Evening)
Number of
Vehicles
Type of
Vehicle
Seconds
into Red NB SB EB WB
Time of Day
(p.m.)
1 1 1
1 4:12
2 1 1
2 4:26
3 1 1
1 5:23
4 1 1
1 5:29
5 1 1
1 5:34
6 1 1
1 5:37
7 1 1
1 5:47
8 1 3 3
4:15
9 1 1 3
5:37
10 1 1 3
5:50
3 Months after Study at 25th
Street & Iowa Street (Morning)
Number of
Vehicles
Type of
Vehicle
Seconds
into Red NB SB EB WB
Time of Day
(a.m.)
1 1 20
3
7:35
2 1 1
2
7:53
3 1 1
2
8:03
4 1 1
2
8:19
5 1 1
2
8:29
6 1 1
2
8:33
3 Months after Study at 25th
Street & Iowa Street (Evening)
Number of
Vehicles
Type of
Vehicle
Seconds
into Red NB SB EB WB
Time of Day
(p.m.)
1 1 1 2
4:43
2 1 1 2
4:46
3 1 2
3
4:01
4 1 2
2
4:51
5 1 1
2
5:18
6 1 1
2
5:18
7 1 2
3
5:27
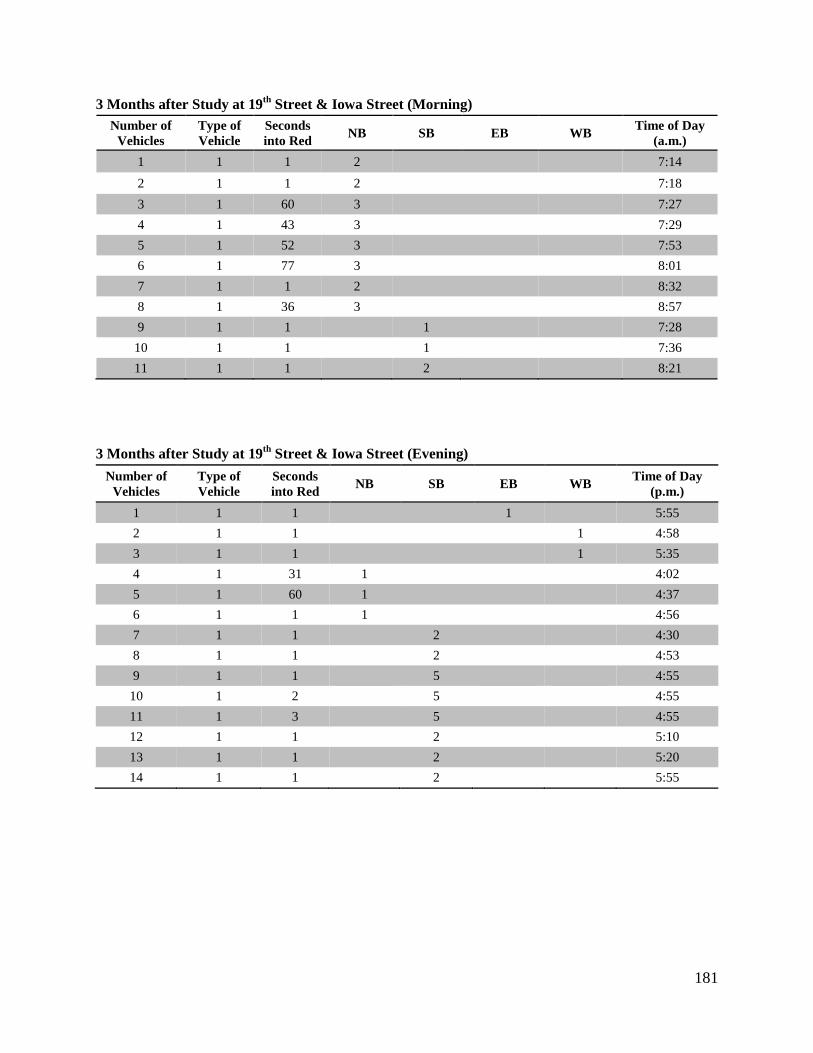
181
3 Months after Study at 19th
Street & Iowa Street (Morning)
Number of
Vehicles
Type of
Vehicle
Seconds
into Red NB SB EB WB
Time of Day
(a.m.)
1 1 1 2
7:14
2 1 1 2
7:18
3 1 60 3
7:27
4 1 43 3
7:29
5 1 52 3
7:53
6 1 77 3
8:01
7 1 1 2
8:32
8 1 36 3
8:57
9 1 1
1
7:28
10 1 1
1
7:36
11 1 1
2
8:21
3 Months after Study at 19th
Street & Iowa Street (Evening)
Number of
Vehicles
Type of
Vehicle
Seconds
into Red NB SB EB WB
Time of Day
(p.m.)
1 1 1
1
5:55
2 1 1
1 4:58
3 1 1
1 5:35
4 1 31 1
4:02
5 1 60 1
4:37
6 1 1 1
4:56
7 1 1
2
4:30
8 1 1
2
4:53
9 1 1
5
4:55
10 1 2
5
4:55
11 1 3
5
4:55
12 1 1
2
5:10
13 1 1
2
5:20
14 1 1
2
5:55
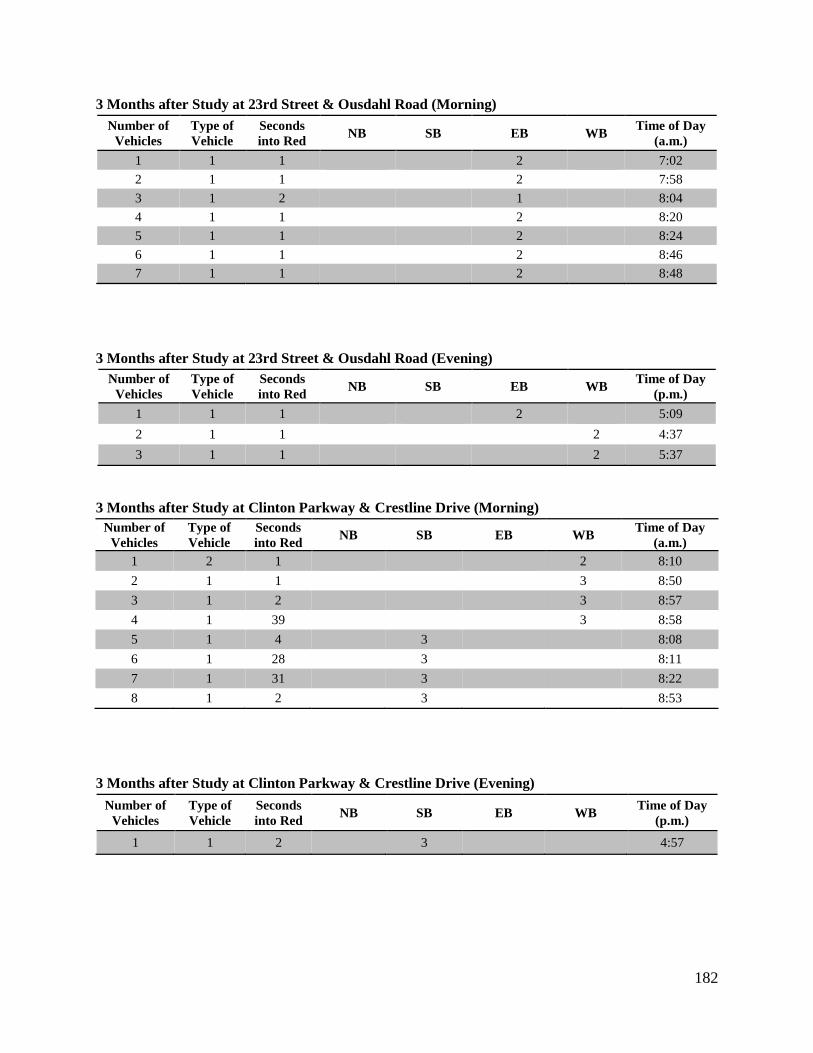
182
3 Months after Study at 23rd Street & Ousdahl Road (Morning)
Number of
Vehicles
Type of
Vehicle
Seconds
into Red NB SB EB WB
Time of Day
(a.m.)
1 1 1
2
7:02
2 1 1
2
7:58
3 1 2
1
8:04
4 1 1
2
8:20
5 1 1
2
8:24
6 1 1
2
8:46
7 1 1
2
8:48
3 Months after Study at 23rd Street & Ousdahl Road (Evening)
Number of
Vehicles
Type of
Vehicle
Seconds
into Red NB SB EB WB
Time of Day
(p.m.)
1 1 1
2
5:09
2 1 1
2 4:37
3 1 1
2 5:37
3 Months after Study at Clinton Parkway & Crestline Drive (Morning)
Number of
Vehicles
Type of
Vehicle
Seconds
into Red NB SB EB WB
Time of Day
(a.m.)
1 2 1
2 8:10
2 1 1
3 8:50
3 1 2
3 8:57
4 1 39
3 8:58
5 1 4
3
8:08
6 1 28
3
8:11
7 1 31
3
8:22
8 1 2
3
8:53
3 Months after Study at Clinton Parkway & Crestline Drive (Evening)
Number of
Vehicles
Type of
Vehicle
Seconds
into Red NB SB EB WB
Time of Day
(p.m.)
1 1 2
3
4:57
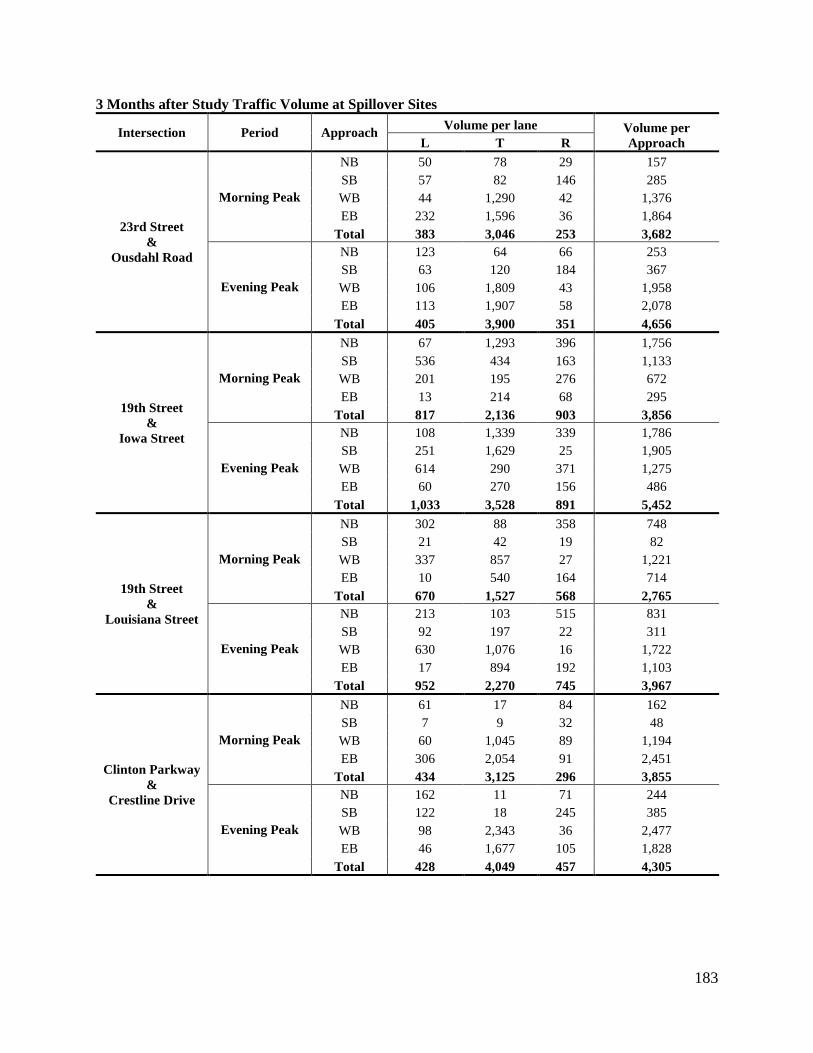
183
3 Months after Study Traffic Volume at Spillover Sites
Intersection Period Approach Volume per lane Volume per
Approach L T R
23rd Street
&
Ousdahl Road
Morning Peak
NB 50 78 29 157
SB 57 82 146 285
WB 44 1,290 42 1,376
EB 232 1,596 36 1,864
Total 383 3,046 253 3,682
Evening Peak
NB 123 64 66 253
SB 63 120 184 367
WB 106 1,809 43 1,958
EB 113 1,907 58 2,078
Total 405 3,900 351 4,656
19th Street
&
Iowa Street
Morning Peak
NB 67 1,293 396 1,756
SB 536 434 163 1,133
WB 201 195 276 672
EB 13 214 68 295
Total 817 2,136 903 3,856
Evening Peak
NB 108 1,339 339 1,786
SB 251 1,629 25 1,905
WB 614 290 371 1,275
EB 60 270 156 486
Total 1,033 3,528 891 5,452
19th Street
&
Louisiana Street
Morning Peak
NB 302 88 358 748
SB 21 42 19 82
WB 337 857 27 1,221
EB 10 540 164 714
Total 670 1,527 568 2,765
Evening Peak
NB 213 103 515 831
SB 92 197 22 311
WB 630 1,076 16 1,722
EB 17 894 192 1,103
Total 952 2,270 745 3,967
Clinton Parkway
&
Crestline Drive
Morning Peak
NB 61 17 84 162
SB 7 9 32 48
WB 60 1,045 89 1,194
EB 306 2,054 91 2,451
Total 434 3,125 296 3,855
Evening Peak
NB 162 11 71 244
SB 122 18 245 385
WB 98 2,343 36 2,477
EB 46 1,677 105 1,828
Total 428 4,049 457 4,305
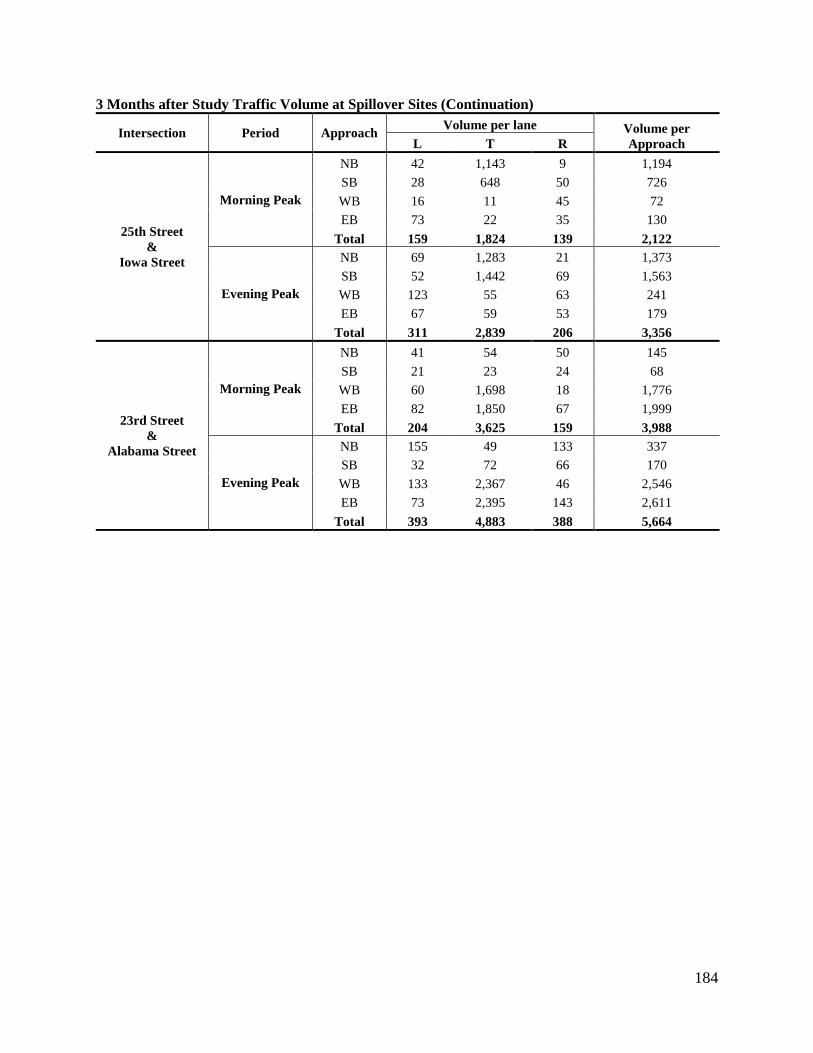
184
3 Months after Study Traffic Volume at Spillover Sites (Continuation)
Intersection Period Approach Volume per lane Volume per
Approach L T R
25th Street
&
Iowa Street
Morning Peak
NB 42 1,143 9 1,194
SB 28 648 50 726
WB 16 11 45 72
EB 73 22 35 130
Total 159 1,824 139 2,122
Evening Peak
NB 69 1,283 21 1,373
SB 52 1,442 69 1,563
WB 123 55 63 241
EB 67 59 53 179
Total 311 2,839 206 3,356
23rd Street
&
Alabama Street
Morning Peak
NB 41 54 50 145
SB 21 23 24 68
WB 60 1,698 18 1,776
EB 82 1,850 67 1,999
Total 204 3,625 159 3,988
Evening Peak
NB 155 49 133 337
SB 32 72 66 170
WB 133 2,367 46 2,546
EB 73 2,395 143 2,611
Total 393 4,883 388 5,664
185
APPENDIX C
Press Releases
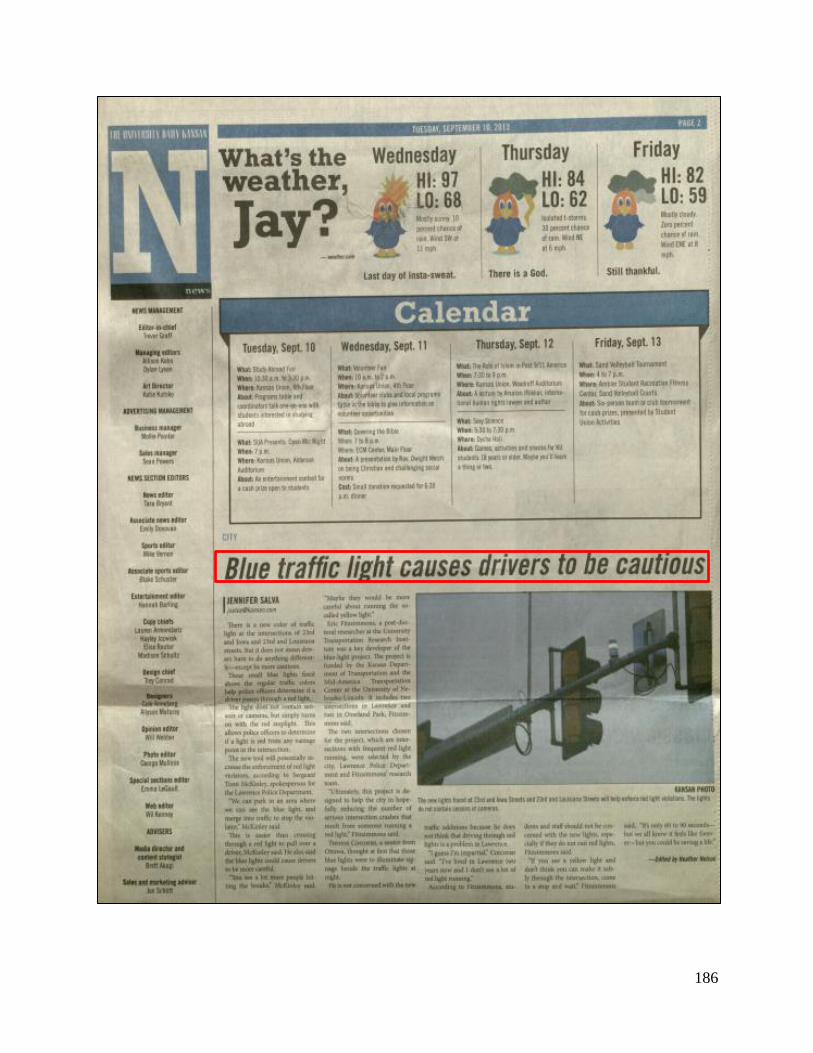
186
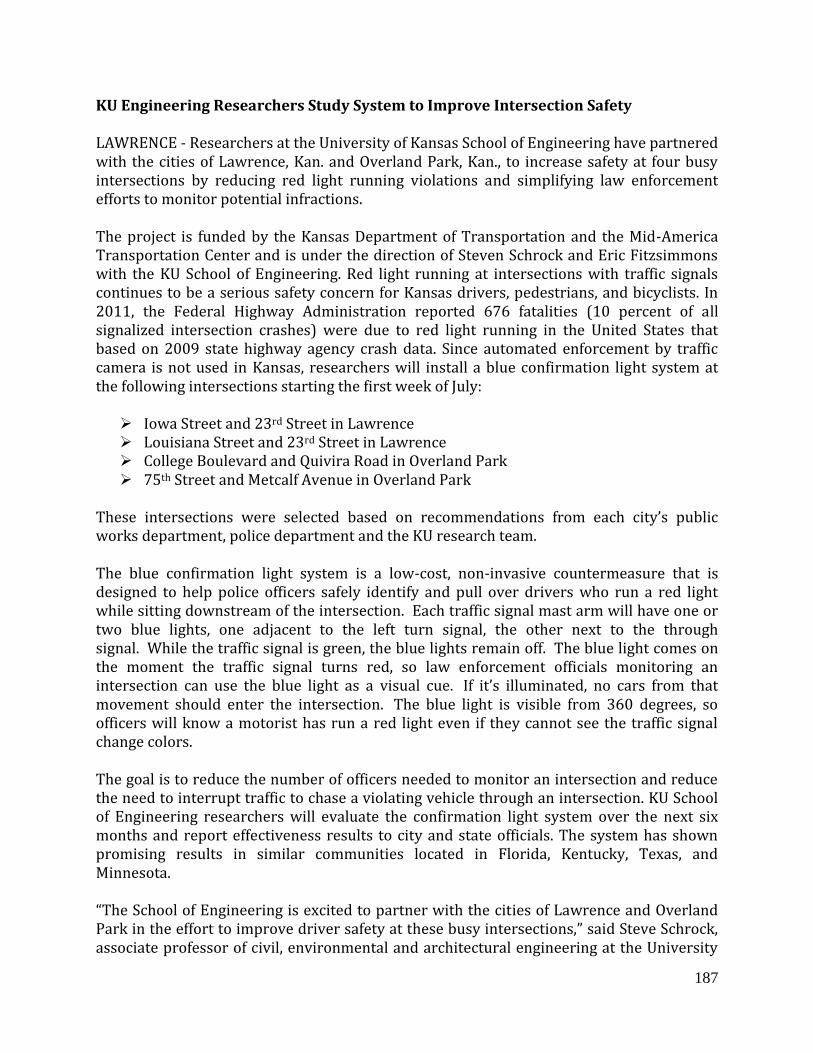
187
KU Engineering Researchers Study System to Improve Intersection Safety LAWRENCE - Researchers at the University of Kansas School of Engineering have partnered with the cities of Lawrence, Kan. and Overland Park, Kan., to increase safety at four busy intersections by reducing red light running violations and simplifying law enforcement efforts to monitor potential infractions. The project is funded by the Kansas Department of Transportation and the Mid-America Transportation Center and is under the direction of Steven Schrock and Eric Fitzsimmons with the KU School of Engineering. Red light running at intersections with traffic signals continues to be a serious safety concern for Kansas drivers, pedestrians, and bicyclists. In 2011, the Federal Highway Administration reported 676 fatalities (10 percent of all signalized intersection crashes) were due to red light running in the United States that based on 2009 state highway agency crash data. Since automated enforcement by traffic camera is not used in Kansas, researchers will install a blue confirmation light system at the following intersections starting the first week of July:
Iowa Street and 23rd Street in Lawrence Louisiana Street and 23rd Street in Lawrence College Boulevard and Quivira Road in Overland Park 75th Street and Metcalf Avenue in Overland Park
These intersections were selected based on recommendations from each city’s public works department, police department and the KU research team. The blue confirmation light system is a low-cost, non-invasive countermeasure that is designed to help police officers safely identify and pull over drivers who run a red light while sitting downstream of the intersection. Each traffic signal mast arm will have one or two blue lights, one adjacent to the left turn signal, the other next to the through signal. While the traffic signal is green, the blue lights remain off. The blue light comes on the moment the traffic signal turns red, so law enforcement officials monitoring an intersection can use the blue light as a visual cue. If it’s illuminated, no cars from that movement should enter the intersection. The blue light is visible from 360 degrees, so officers will know a motorist has run a red light even if they cannot see the traffic signal change colors. The goal is to reduce the number of officers needed to monitor an intersection and reduce the need to interrupt traffic to chase a violating vehicle through an intersection. KU School of Engineering researchers will evaluate the confirmation light system over the next six months and report effectiveness results to city and state officials. The system has shown promising results in similar communities located in Florida, Kentucky, Texas, and Minnesota. “The School of Engineering is excited to partner with the cities of Lawrence and Overland Park in the effort to improve driver safety at these busy intersections,” said Steve Schrock, associate professor of civil, environmental and architectural engineering at the University
188
of Kansas. “We believe this system can be a valuable tool for law enforcement, while substantially reducing the instances of red light running and making the roads safer for everyone.” Overland Park Police Chief John Douglass had this to say about the concept: “The safety of our citizens and the officers who serve them are paramount to what we do on a daily basis. This simple, yet innovative system will allow us to safely monitor and enforce traffic violations at two of the city’s busiest intersections in regard to traffic accidents”.
# # #