Embed Size (px)
Citation preview

DOT HS 812 232 January 2016
Evaluation of Belted and Unbelted Safety Requirements
Disclaimer
This publication is distributed by the U.S. Department of Transportation, National Highway Traffic Safety Administration, in the interest of information exchange. The opinions, findings, and conclusions expressed in this publication are those of the authors and not necessarily those of the Department of Transportation or the National Highway Traffic Safety Administration. The United States Government assumes no liability for its contents or use thereof. If trade or manufacturers’ names or products are mentioned, it is because they are considered essential to the object of the publication and should not be construed as an endorsement. The United States Government does not endorse products or manufacturers.
Suggested APA Format Citation:
Hu, J., Klinich, K. D., Manary, M. A., Flannagan, C. A. C., Narayanaswamy, P., Reed, M. P., … Lin, C-H. (2016,
January). Evaluation of belted and unbelted safety requirements (Report No. DOT HS 812 232). Washington, DC: National Highway Traffic Safety Administration.
i
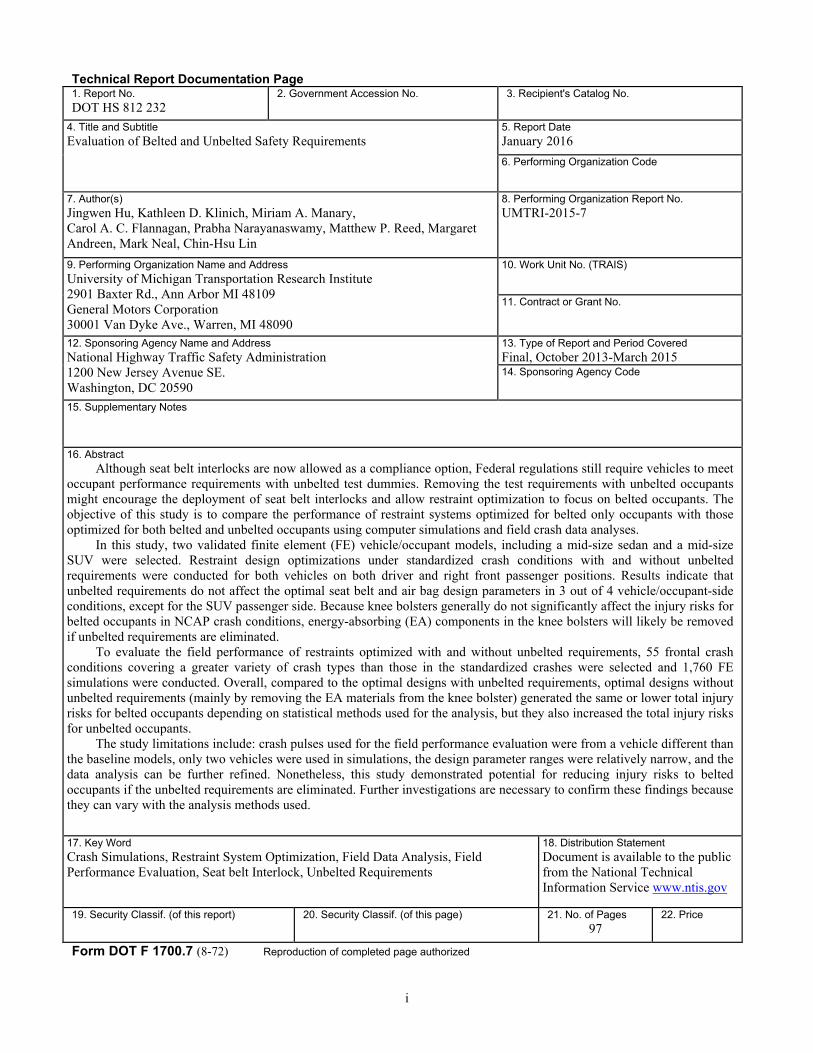
Technical Report Documentation Page 1. Report No. DOT HS 812 232
2. Government Accession No.
3. Recipient's Catalog No.
4. Title and Subtitle Evaluation of Belted and Unbelted Safety Requirements
5. Report Date January 2016 6. Performing Organization Code
7. Author(s) Jingwen Hu, Kathleen D. Klinich, Miriam A. Manary, Carol A. C. Flannagan, Prabha Narayanaswamy, Matthew P. Reed, Margaret Andreen, Mark Neal, Chin-Hsu Lin
8. Performing Organization Report No. UMTRI-2015-7
9. Performing Organization Name and Address University of Michigan Transportation Research Institute 2901 Baxter Rd., Ann Arbor MI 48109 General Motors Corporation 30001 Van Dyke Ave., Warren, MI 48090
10. Work Unit No. (TRAIS) 11. Contract or Grant No.
12. Sponsoring Agency Name and Address National Highway Traffic Safety Administration 1200 New Jersey Avenue SE. Washington, DC 20590
13. Type of Report and Period Covered Final, October 2013-March 2015 14. Sponsoring Agency Code
15. Supplementary Notes
16. Abstract Although seat belt interlocks are now allowed as a compliance option, Federal regulations still require vehicles to meet
occupant performance requirements with unbelted test dummies. Removing the test requirements with unbelted occupants might encourage the deployment of seat belt interlocks and allow restraint optimization to focus on belted occupants. The objective of this study is to compare the performance of restraint systems optimized for belted only occupants with those optimized for both belted and unbelted occupants using computer simulations and field crash data analyses.
In this study, two validated finite element (FE) vehicle/occupant models, including a mid-size sedan and a mid-size SUV were selected. Restraint design optimizations under standardized crash conditions with and without unbelted requirements were conducted for both vehicles on both driver and right front passenger positions. Results indicate that unbelted requirements do not affect the optimal seat belt and air bag design parameters in 3 out of 4 vehicle/occupant-side conditions, except for the SUV passenger side. Because knee bolsters generally do not significantly affect the injury risks for belted occupants in NCAP crash conditions, energy-absorbing (EA) components in the knee bolsters will likely be removed if unbelted requirements are eliminated.
To evaluate the field performance of restraints optimized with and without unbelted requirements, 55 frontal crash conditions covering a greater variety of crash types than those in the standardized crashes were selected and 1,760 FE simulations were conducted. Overall, compared to the optimal designs with unbelted requirements, optimal designs without unbelted requirements (mainly by removing the EA materials from the knee bolster) generated the same or lower total injury risks for belted occupants depending on statistical methods used for the analysis, but they also increased the total injury risks for unbelted occupants.
The study limitations include: crash pulses used for the field performance evaluation were from a vehicle different than the baseline models, only two vehicles were used in simulations, the design parameter ranges were relatively narrow, and the data analysis can be further refined. Nonetheless, this study demonstrated potential for reducing injury risks to belted occupants if the unbelted requirements are eliminated. Further investigations are necessary to confirm these findings because they can vary with the analysis methods used.
17. Key Word Crash Simulations, Restraint System Optimization, Field Data Analysis, Field Performance Evaluation, Seat belt Interlock, Unbelted Requirements
18. Distribution Statement Document is available to the public from the National Technical Information Service www.ntis.gov
19. Security Classif. (of this report) 20. Security Classif. (of this page) 21. No. of Pages 97
22. Price
Form DOT F 1700.7 (8-72) Reproduction of completed page authorized
ii
ACKNOWLEDGMENTS This work was funded by National Highway Traffic Safety Administration under contract DTNH22-13-C-00333. The opinions expressed in this report are those of the authors and do not necessarily represent NHTSA. The authors thank Aida Barsan-Anelli from NHTSA for providing the vehicle crash pulse data for field performance evaluation. The authors also thank Narasimha Rao and Venkatsubramanian R of GM Technical Center India for their help on model validation and field performance analysis.
iii
CONTENTS
Acknowledgments........................................................................................................................... ii List of Figures ................................................................................................................................. v
List of Tables ................................................................................................................................ vii Introduction ..................................................................................................................................... 1
Method Overview ........................................................................................................................... 2
Design optimization ........................................................................................................................ 3
Baseline Model Selection and Validation ................................................................................... 3
Crash Conditions ......................................................................................................................... 6
Design Parameters ...................................................................................................................... 6
Injury Assessment ....................................................................................................................... 7
Response Surface Model............................................................................................................. 9
Design Optimizations................................................................................................................ 10
Belted and unbelted optimizations ........................................................................................ 10
Belted-only optimizations ..................................................................................................... 11
Optimization Results ............................................................................................................. 12
Checking Robustness of the Optimal Designs .......................................................................... 14
Selecting Final Optimal Designs .............................................................................................. 17
Field Performance Evaluation ....................................................................................................... 18
Extracting Crash Pulse From NHTSA Vehicle Crash Simulations .......................................... 19
Determining Air bag Firing Times ........................................................................................... 22
Field Simulation Matrix ............................................................................................................ 23
Field Simulation Results ........................................................................................................... 25
Injury differences for systems optimized with and without unbelted requirements ................. 30
Original strategy .................................................................................................................... 30
Revised Strategies ................................................................................................................. 31
Application to NASS-CDS Data ............................................................................................... 33
Injury risk curves .................................................................................................................. 33
Performing statistical simulations using NASS-CDS frontal crashes as standard population ............................................................................................................... 34
Field Analysis Results .......................................................................................................... 37
iv
Discussion ..................................................................................................................................... 45
Effects From Unbelted Requirements on the Optimal Designs ................................................ 45
Nij Effect ................................................................................................................................... 45
Dealing with negative HIC ....................................................................................................... 46
Field analysis ............................................................................................................................ 46
Limitations ................................................................................................................................ 47
Conclusions ................................................................................................................................... 49
References ..................................................................................................................................... 50
Appendix A ................................................................................................................................... 51
Appendix B ................................................................................................................................... 85
Appendix C ................................................................................................................................... 87
v
LIST OF FIGURES Figure 1. Schematic of project technical plan .............................................................................. 2
Figure 2. Seating environment comparison between the mid-size sedan and SUV ..................... 3
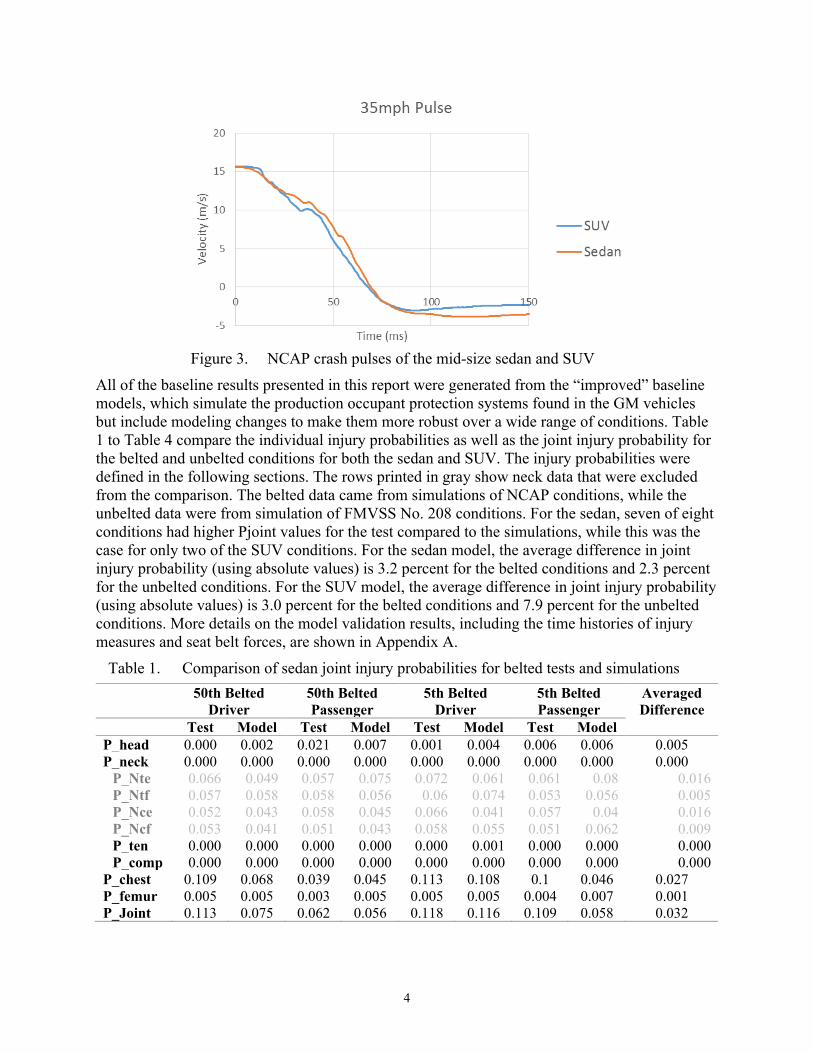
Figure 3. NCAP crash pulses of the mid-size sedan and SUV .................................................... 4
Figure 4. Results of the final optimizations for the sedan driver side ........................................ 13
Figure 5. Results of the final optimizations for the sedan passenger side ................................. 13
Figure 6. Results of the final optimizations for the SUV driver side ......................................... 13
Figure 7. Results of the final optimizations for the SUV passenger side .................................. 14
Figure 8. Injury probabilities for sedan driver from robustness optimization and original optimization ................................................................................................... 15
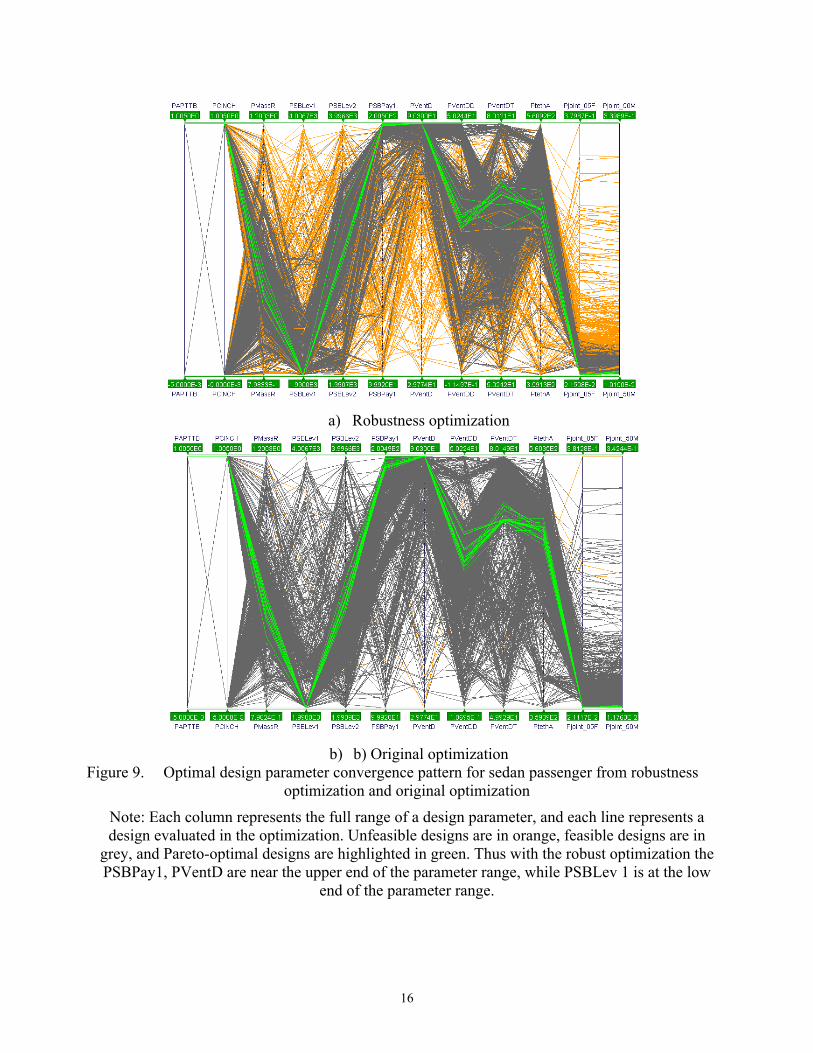
Figure 9. Optimal design parameter convergence pattern for sedan passenger from robustness optimization and original optimization ..................................................... 16
Figure 11. Locations of nodes where rigid accelerometer elements were defined in the Venza model ........................................................................................ 20
Figure 12. Sedan model (yellow) and Venza model (red) before (left) and after (right) alignment ................................................................................................. 20
Figure 13. Differences in crash pulses for different crash partners. ............................................ 22
Figure 14. Applying the T125-30 criteria to determine air bag firing time for different field conditions............................................................................................. 23
Figure 15. EA materials removed from the knee bolsters of the sedan for belted-only optimal design ......................................................................................... 24
Figure 16. EA materials removed from the knee bolsters of the SUV for belted-only optimal design ......................................................................................... 24
Figure 17. Probability of head injury predicted by simulations versus delta V for belted and unbelted occupants, with and without unbelted requirement ..................................... 26
Figure 18. Distribution of Phead from simulations ...................................................................... 26
Figure 19. Probability of neck injury predicted by simulations versus delta V for belted and unbelted occupants, with and without unbelted requirement ..................................... 27
Figure 20. Distribution of Pneck from simulations ...................................................................... 27
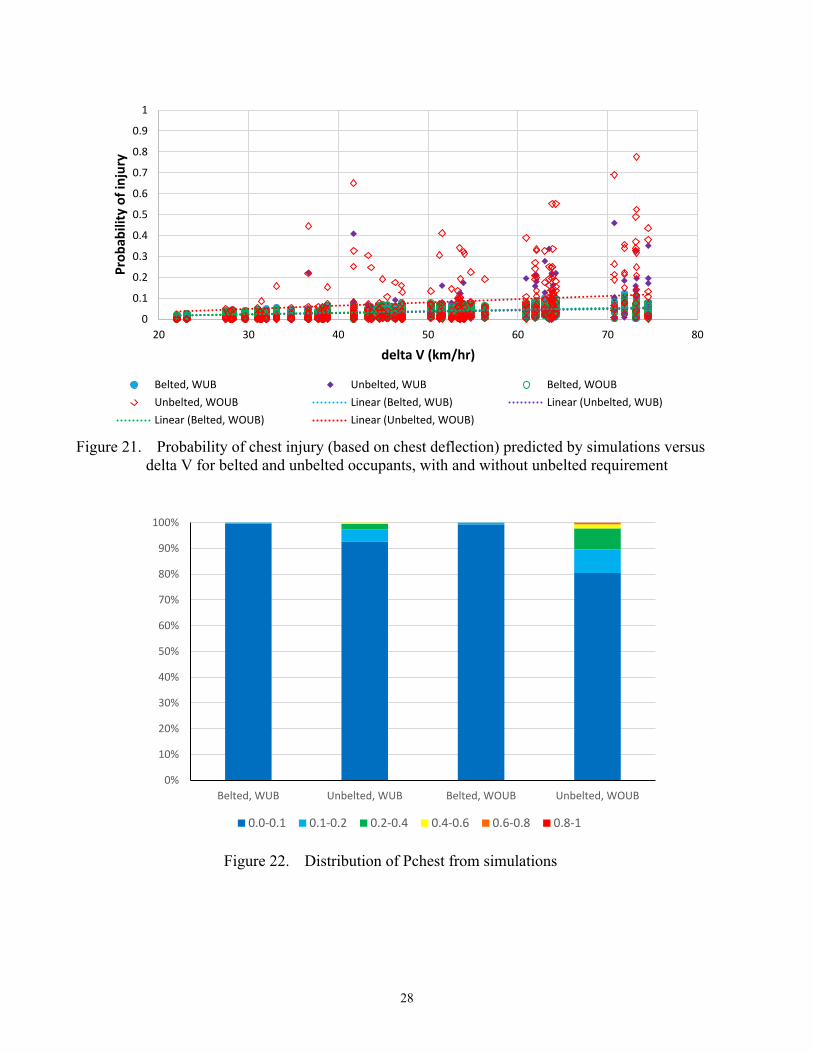
Figure 21. Probability of chest injury (based on chest deflection) predicted by simulations versus delta V for belted and unbelted occupants, with and without unbelted requirement ...................................................................... 28
Figure 22. Distribution of Pchest from simulations ..................................................................... 28
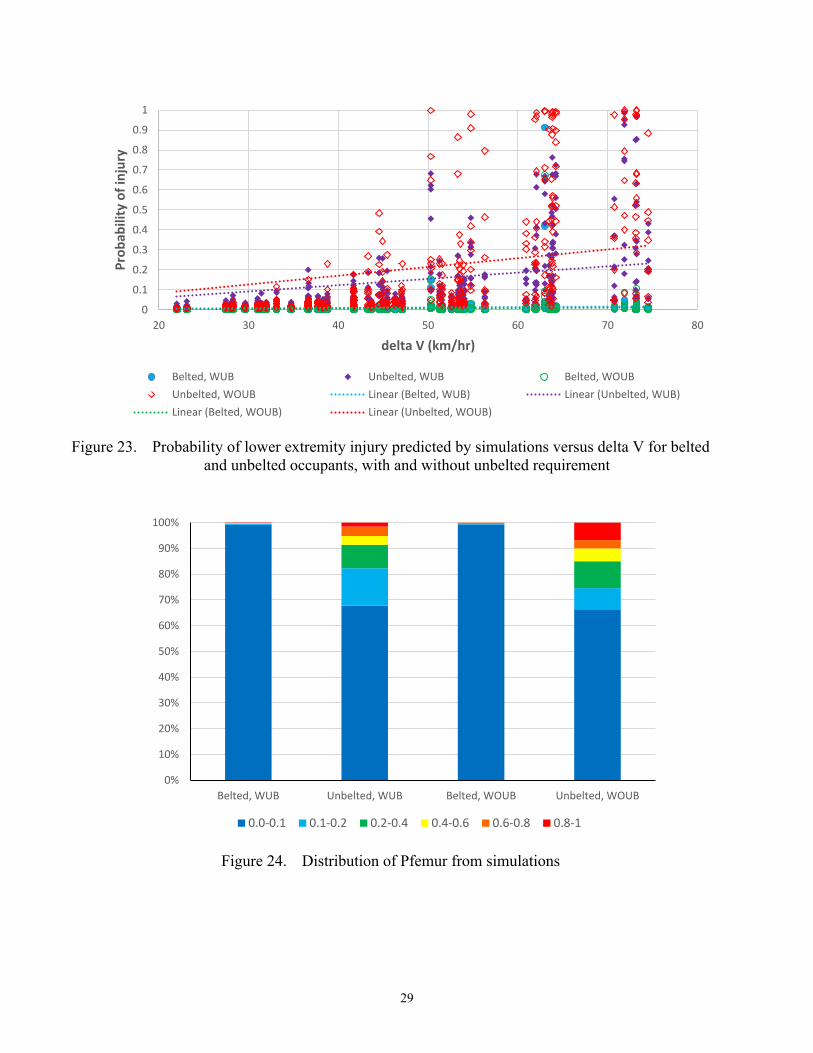
Figure 23. Probability of lower extremity injury predicted by simulations versus delta V for belted and unbelted occupants, with and without unbelted requirement .................... 29
Figure 24. Distribution of Pfemur from simulations .................................................................... 29
vi
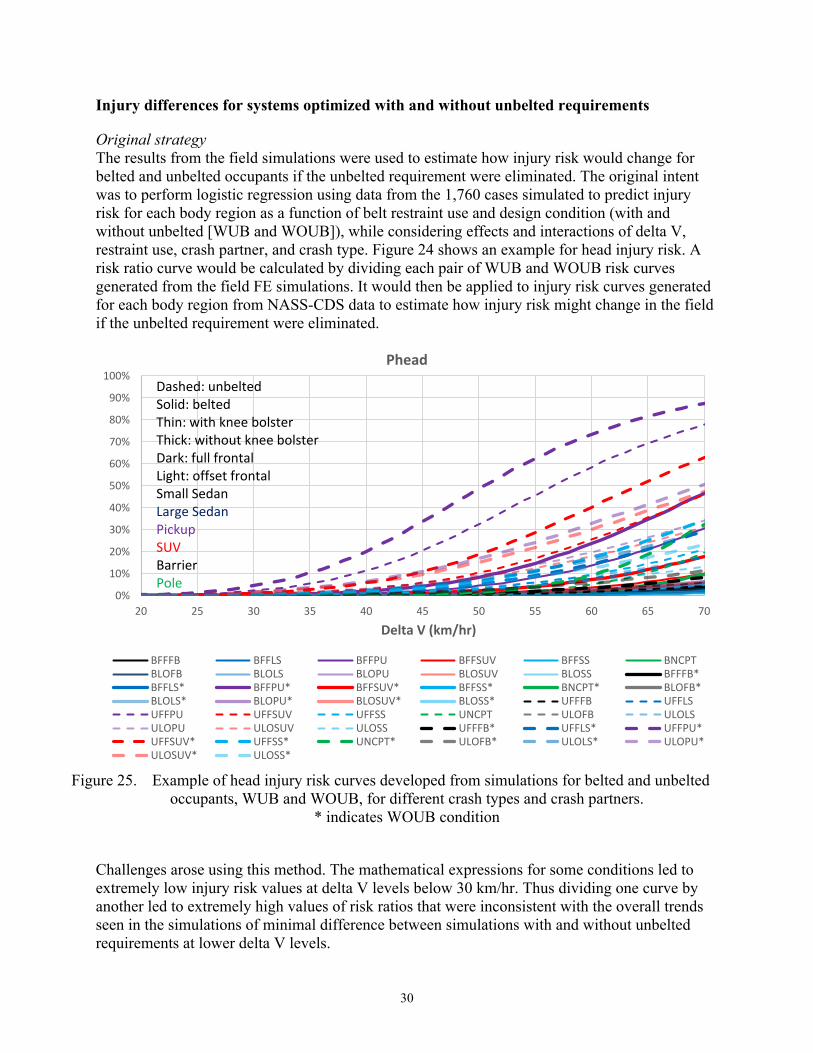
Figure 25. Example of head injury risk curves developed from simulations for belted and unbelted occupants, WUB and WOUB, for different crash types and crash partners. * indicates WOUB condition .................................... 30
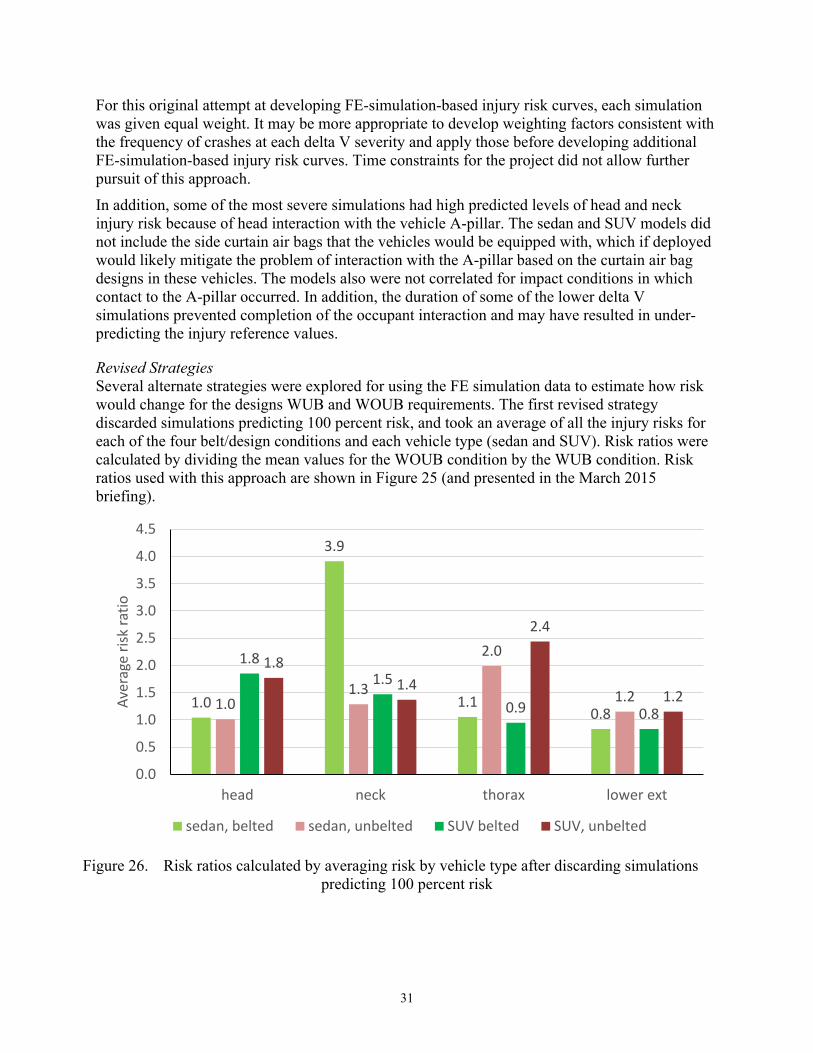
Figure 26. Risk ratios calculated by averaging risk by vehicle type after discarding simulations predicting 100 percent risk ...................................................................... 31
Figure 27. Overall injury rates by body region for baseline CDS (with 80% belt use) plus estimates for 100 percent belt use, 0 percent belt use, and 95 percent belt use .......... 37
Figure 28. Effect of varying belt use rate and eliminating unbelted test requirement on head injury, normalized to current number of occupants sustaining head injury at 86 percent belt use using three methods of estimation ............................................... 39
Figure 29. Effect of varying belt use rate and eliminating unbelted test requirement on neck injury, normalized to current number of occupants sustaining neck injury at 86 percent belt use using three methods of estimation ............................................... 41
Figure 30. Effect of varying belt use rate and eliminating unbelted test requirement on thorax injury, normalized to current number of occupants sustaining thorax injury at 86 percent belt use using three methods of estimation ............................................... 42
Figure 31. Effect of varying belt use rate and eliminating unbelted test requirement on lower extremity, normalized to current number of occupants sustaining lower extremity injury at 86 percent belt use using three methods of estimation ................................. 43
Figure 32. Effect of varying belt use rate and eliminating unbelted test requirement on overall injury, normalized to current number of occupants sustaining overall injury at 86 percent belt use using three methods of estimation ............................................... 44
Figure 33. Using Nij (left) rather than maximum tension/compression (right) would substantially overestimate risk of neck injury ............................................................ 45
Figure 34. Venza NCAP crash pulses versus two baseline vehicles............................................ 48
Figure 35. For some runs with lower impact speed, simulation duration of 150 ms may not have captured all significant parts of test ............................................................. 49
vii
LIST OF TABLES Table 1. Comparison of sedan joint injury probabilities for belted tests and simulations .......... 4
Table 2. Comparison of sedan joint injury probabilities for unbelted tests and simulations ...... 5
Table 3. Comparison of SUV joint injury probabilities for belted tests and simulations ........... 5
Table 4. Comparison of SUV joint injury probabilities for unbelted tests and simulations ....... 5
Table 5. Crash conditions for belted occupants .......................................................................... 6
Table 6. Crash conditions for unbelted occupants ...................................................................... 6
Table 7. Parameter range for driver simulations......................................................................... 7
Table 8. Initial parameter range for passenger simulations ........................................................ 7
Table 9. Injury risk curves in NCAP frontal crash tests ............................................................. 8
Table 10. Injury rating in IIHS frontal offset tests ....................................................................... 8
Table 11. IIHS Crashworthiness Evaluation – Frontal Offset Crash Test .................................... 8
Table 12. IARVs in the 25-mph offset and rigid-barrier tests ...................................................... 9
Table 13. NSGA-II parameters used in this study ...................................................................... 12
Table 14. Summary of optimum parameter values for each condition ....................................... 17
Table 15. Eleven combinations of crash partner and crash type ................................................ 19
Table 16. Comparison of NHTSA Model and Sled Model Kinematics ..................................... 21
Table 17. Risks, risk ratios, and risk differences by delta V category and body region predicted using median values of simulation results ....................................... 33
Table 18. Example spreadsheet used to apply injury risk curves and evaluate risk difference effects using NASS-CDS occupants as standard population .................... 36
1
INTRODUCTION Increasing seat belt use for front seat occupants from the 2012 level of 86 percent to near 100 percent would have substantial benefits in terms of injury and fatality reduction. In 2012 the Moving Ahead for Progress in the 21st Century Act (P.L. 112-141), MAP–21, legislation removed restrictions that kept NHTSA from allowing seat belt interlocks designed to prevent operation of motor vehicles (if front-seat occupants do not wear their belt restraints) as a means of standards compliance . Although belt use is higher now than ever before and seat belt interlocks may be considered more acceptable, Federal regulations still require vehicles to meet occupant performance requirements with unbelted test dummies. Removing the test requirements with unbelted dummies might encourage the deployment of seat belt interlocks and allow optimization of restraints to focus on belted occupants.
Computational models and optimization technologies play an increasingly significant role in restraint system designs. In recent years, automotive companies have routinely used finite element (FE) anthropomorphic test devices (ATDs) models for optimizing occupant compartments and restraint systems in their vehicle safety designs. More in-depth investigations on optimization methods and their efficacy in optimizing occupant restraints have also been performed in the academia.
The objective of this research project is to compare the results of occupant simulation models that have been set up for optimal performance for existing unbelted and belted requirements with systems optimized for belted-only requirements. Results were used to explore the potential benefits that could be achieved with use of belt interlocks and restraint systems designed to focus on belted occupants. Specifically, in this project, occupant restraint simulations were conducted to understand the safety implications of optimizing restraint systems for belted-only requirements as compared with systems optimized for current belted and unbelted requirements. These simulation models were used to optimize occupant safety in U.S.New Car Assessment Program (NCAP) frontal crash conditions while ensuring best Insurance Institute for Highway Safety (IIHS) rating and compliance with regulated crash conditions. Optimized solutions that are subject to, and free from, constraints of unbelted compliance test requirements were further compared in various real-world frontal crash scenarios to consider the implications of permitting the use of interlock systems in lieu of unbelted occupant safety tests. This research task did not consider the performance of interlock systems, but evaluated the relative safety of occupant restraints that are optimized for belted-only occupants versus both belted and unbelted occupants.
2
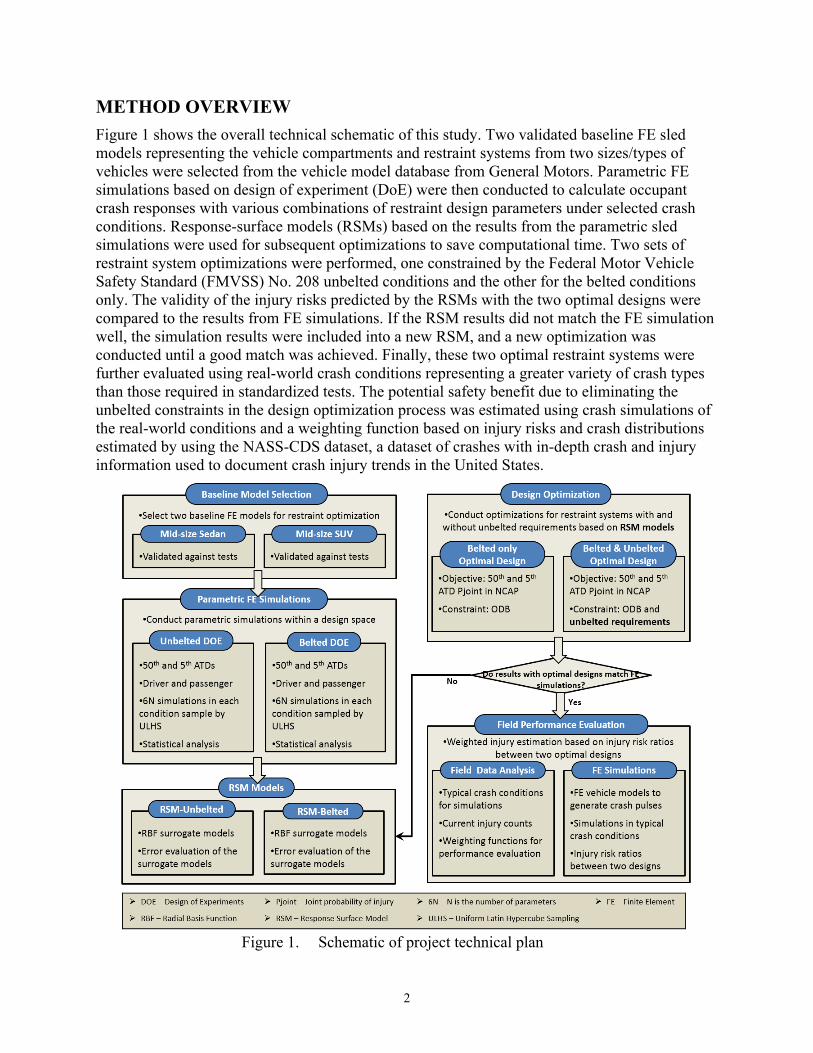
METHOD OVERVIEW Figure 1 shows the overall technical schematic of this study. Two validated baseline FE sled models representing the vehicle compartments and restraint systems from two sizes/types of vehicles were selected from the vehicle model database from General Motors. Parametric FE simulations based on design of experiment (DoE) were then conducted to calculate occupant crash responses with various combinations of restraint design parameters under selected crash conditions. Response-surface models (RSMs) based on the results from the parametric sled simulations were used for subsequent optimizations to save computational time. Two sets of restraint system optimizations were performed, one constrained by the Federal Motor Vehicle Safety Standard (FMVSS) No. 208 unbelted conditions and the other for the belted conditions only. The validity of the injury risks predicted by the RSMs with the two optimal designs were compared to the results from FE simulations. If the RSM results did not match the FE simulation well, the simulation results were included into a new RSM, and a new optimization was conducted until a good match was achieved. Finally, these two optimal restraint systems were further evaluated using real-world crash conditions representing a greater variety of crash types than those required in standardized tests. The potential safety benefit due to eliminating the unbelted constraints in the design optimization process was estimated using crash simulations of the real-world conditions and a weighting function based on injury risks and crash distributions estimated by using the NASS-CDS dataset, a dataset of crashes with in-depth crash and injury information used to document crash injury trends in the United States.
Figure 1. Schematic of project technical plan
3
DESIGN OPTIMIZATION
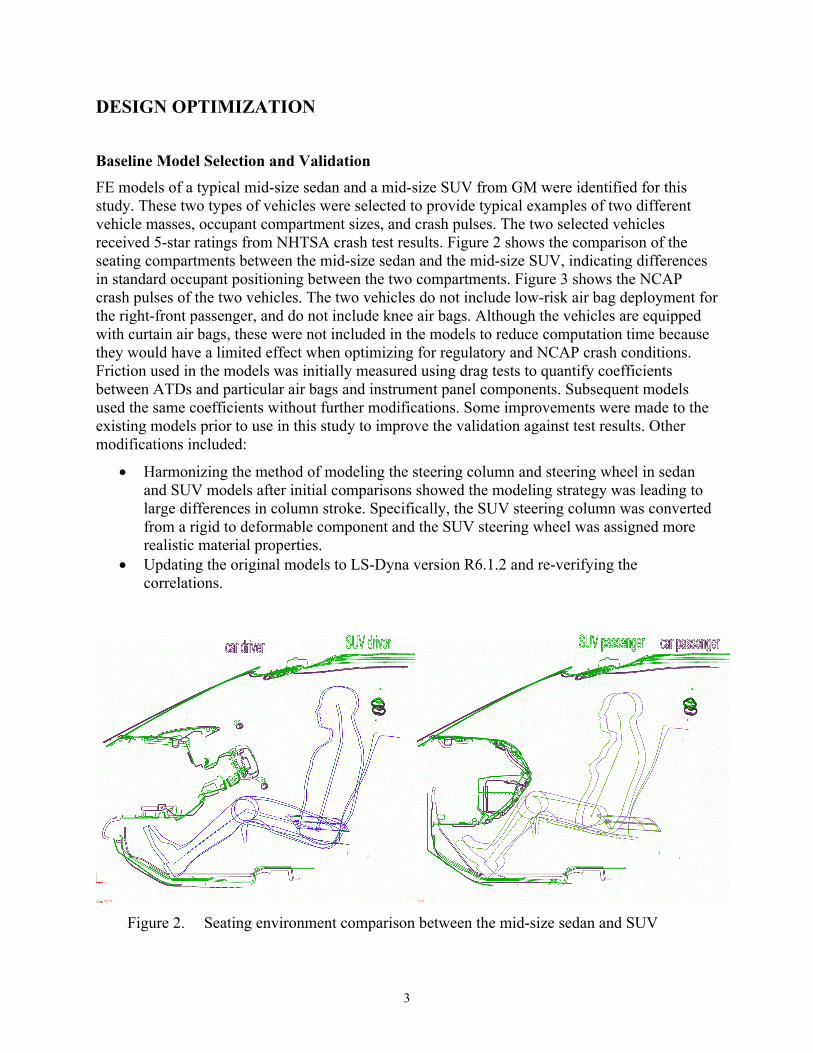
Baseline Model Selection and Validation FE models of a typical mid-size sedan and a mid-size SUV from GM were identified for this study. These two types of vehicles were selected to provide typical examples of two different vehicle masses, occupant compartment sizes, and crash pulses. The two selected vehicles received 5-star ratings from NHTSA crash test results. Figure 2 shows the comparison of the seating compartments between the mid-size sedan and the mid-size SUV, indicating differences in standard occupant positioning between the two compartments. Figure 3 shows the NCAP crash pulses of the two vehicles. The two vehicles do not include low-risk air bag deployment for the right-front passenger, and do not include knee air bags. Although the vehicles are equipped with curtain air bags, these were not included in the models to reduce computation time because they would have a limited effect when optimizing for regulatory and NCAP crash conditions. Friction used in the models was initially measured using drag tests to quantify coefficients between ATDs and particular air bags and instrument panel components. Subsequent models used the same coefficients without further modifications. Some improvements were made to the existing models prior to use in this study to improve the validation against test results. Other modifications included:
• Harmonizing the method of modeling the steering column and steering wheel in sedan and SUV models after initial comparisons showed the modeling strategy was leading to large differences in column stroke. Specifically, the SUV steering column was converted from a rigid to deformable component and the SUV steering wheel was assigned more realistic material properties.
• Updating the original models to LS-Dyna version R6.1.2 and re-verifying the correlations.
Figure 2. Seating environment comparison between the mid-size sedan and SUV
4
Figure 3. NCAP crash pulses of the mid-size sedan and SUV
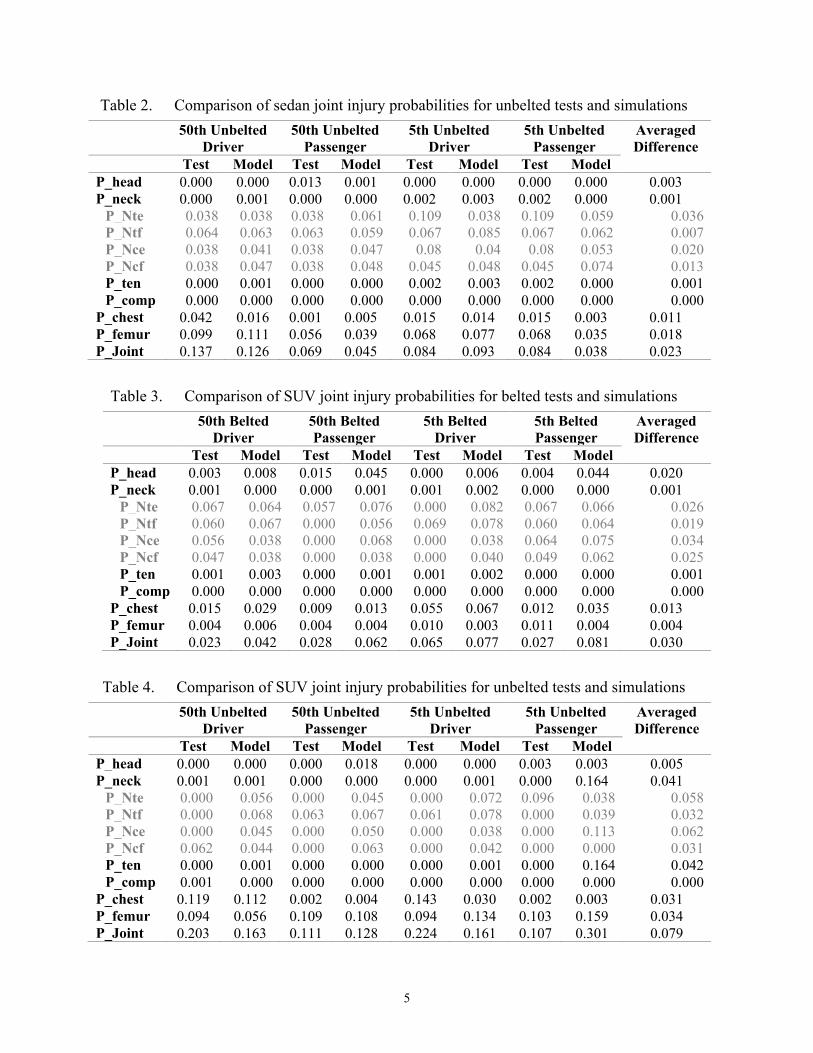
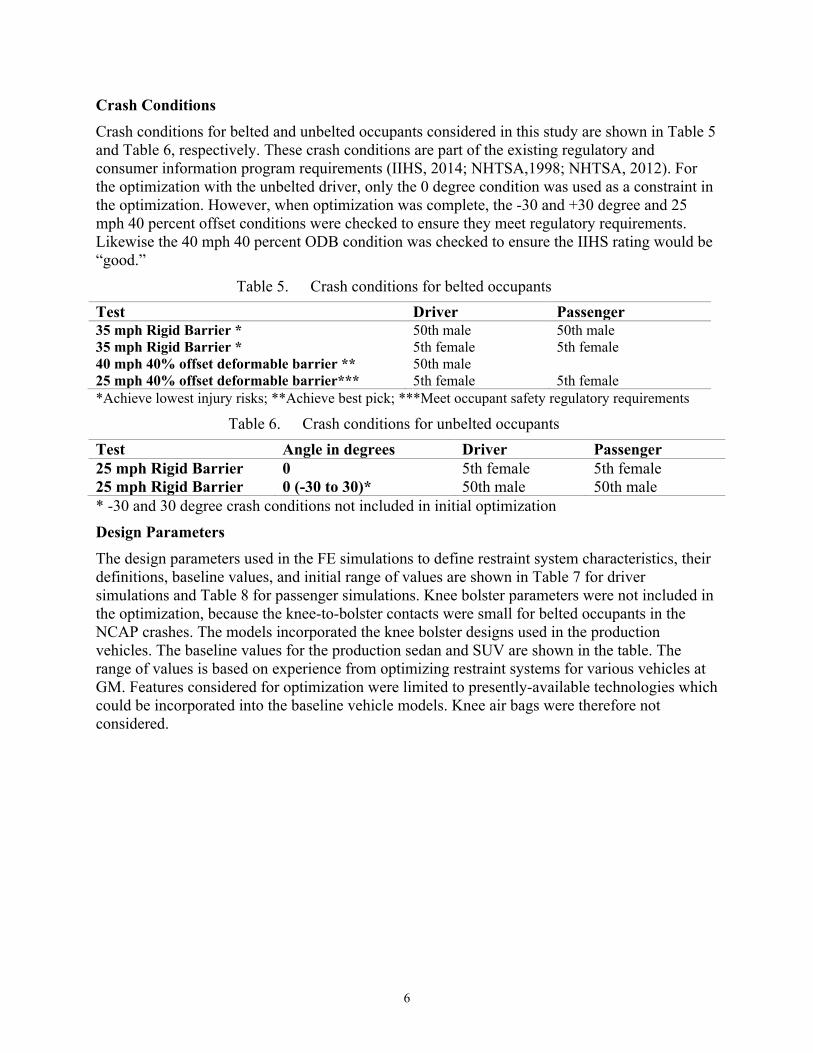
All of the baseline results presented in this report were generated from the “improved” baseline models, which simulate the production occupant protection systems found in the GM vehicles but include modeling changes to make them more robust over a wide range of conditions. Table 1 to Table 4 compare the individual injury probabilities as well as the joint injury probability for the belted and unbelted conditions for both the sedan and SUV. The injury probabilities were defined in the following sections. The rows printed in gray show neck data that were excluded from the comparison. The belted data came from simulations of NCAP conditions, while the unbelted data were from simulation of FMVSS No. 208 conditions. For the sedan, seven of eight conditions had higher Pjoint values for the test compared to the simulations, while this was the case for only two of the SUV conditions. For the sedan model, the average difference in joint injury probability (using absolute values) is 3.2 percent for the belted conditions and 2.3 percent for the unbelted conditions. For the SUV model, the average difference in joint injury probability (using absolute values) is 3.0 percent for the belted conditions and 7.9 percent for the unbelted conditions. More details on the model validation results, including the time histories of injury measures and seat belt forces, are shown in Appendix A.
Table 1. Comparison of sedan joint injury probabilities for belted tests and simulations 50th Belted
Driver 50th Belted Passenger
5th Belted Driver
5th Belted Passenger
Averaged Difference
Test Model Test Model Test Model Test Model P_head 0.000 0.002 0.021 0.007 0.001 0.004 0.006 0.006 0.005 P_neck 0.000 0.000 0.000 0.000 0.000 0.000 0.000 0.000 0.000
P_Nte 0.066 0.049 0.057 0.075 0.072 0.061 0.061 0.08 0.016 P_Ntf 0.057 0.058 0.058 0.056 0.06 0.074 0.053 0.056 0.005 P_Nce 0.052 0.043 0.058 0.045 0.066 0.041 0.057 0.04 0.016 P_Ncf 0.053 0.041 0.051 0.043 0.058 0.055 0.051 0.062 0.009 P_ten 0.000 0.000 0.000 0.000 0.000 0.001 0.000 0.000 0.000 P_comp 0.000 0.000 0.000 0.000 0.000 0.000 0.000 0.000 0.000
P_chest 0.109 0.068 0.039 0.045 0.113 0.108 0.1 0.046 0.027 P_femur 0.005 0.005 0.003 0.005 0.005 0.005 0.004 0.007 0.001 P_Joint 0.113 0.075 0.062 0.056 0.118 0.116 0.109 0.058 0.032
5
Table 2. Comparison of sedan joint injury probabilities for unbelted tests and simulations 50th Unbelted
Driver 50th Unbelted
Passenger 5th Unbelted
Driver 5th Unbelted
Passenger Averaged Difference
Test Model Test Model Test Model Test Model P_head 0.000 0.000 0.013 0.001 0.000 0.000 0.000 0.000 0.003 P_neck 0.000 0.001 0.000 0.000 0.002 0.003 0.002 0.000 0.001
P_Nte 0.038 0.038 0.038 0.061 0.109 0.038 0.109 0.059 0.036 P_Ntf 0.064 0.063 0.063 0.059 0.067 0.085 0.067 0.062 0.007 P_Nce 0.038 0.041 0.038 0.047 0.08 0.04 0.08 0.053 0.020 P_Ncf 0.038 0.047 0.038 0.048 0.045 0.048 0.045 0.074 0.013 P_ten 0.000 0.001 0.000 0.000 0.002 0.003 0.002 0.000 0.001 P_comp 0.000 0.000 0.000 0.000 0.000 0.000 0.000 0.000 0.000
P_chest 0.042 0.016 0.001 0.005 0.015 0.014 0.015 0.003 0.011 P_femur 0.099 0.111 0.056 0.039 0.068 0.077 0.068 0.035 0.018 P_Joint 0.137 0.126 0.069 0.045 0.084 0.093 0.084 0.038 0.023
Table 3. Comparison of SUV joint injury probabilities for belted tests and simulations 50th Belted
Driver 50th Belted Passenger
5th Belted Driver
5th Belted Passenger
Averaged Difference
Test Model Test Model Test Model Test Model P_head 0.003 0.008 0.015 0.045 0.000 0.006 0.004 0.044 0.020 P_neck 0.001 0.000 0.000 0.001 0.001 0.002 0.000 0.000 0.001
P_Nte 0.067 0.064 0.057 0.076 0.000 0.082 0.067 0.066 0.026 P_Ntf 0.060 0.067 0.000 0.056 0.069 0.078 0.060 0.064 0.019 P_Nce 0.056 0.038 0.000 0.068 0.000 0.038 0.064 0.075 0.034 P_Ncf 0.047 0.038 0.000 0.038 0.000 0.040 0.049 0.062 0.025 P_ten 0.001 0.003 0.000 0.001 0.001 0.002 0.000 0.000 0.001 P_comp 0.000 0.000 0.000 0.000 0.000 0.000 0.000 0.000 0.000
P_chest 0.015 0.029 0.009 0.013 0.055 0.067 0.012 0.035 0.013 P_femur 0.004 0.006 0.004 0.004 0.010 0.003 0.011 0.004 0.004 P_Joint 0.023 0.042 0.028 0.062 0.065 0.077 0.027 0.081 0.030
Table 4. Comparison of SUV joint injury probabilities for unbelted tests and simulations 50th Unbelted
Driver 50th Unbelted
Passenger 5th Unbelted
Driver 5th Unbelted
Passenger Averaged Difference
Test Model Test Model Test Model Test Model P_head 0.000 0.000 0.000 0.018 0.000 0.000 0.003 0.003 0.005 P_neck 0.001 0.001 0.000 0.000 0.000 0.001 0.000 0.164 0.041
P_Nte 0.000 0.056 0.000 0.045 0.000 0.072 0.096 0.038 0.058 P_Ntf 0.000 0.068 0.063 0.067 0.061 0.078 0.000 0.039 0.032 P_Nce 0.000 0.045 0.000 0.050 0.000 0.038 0.000 0.113 0.062 P_Ncf 0.062 0.044 0.000 0.063 0.000 0.042 0.000 0.000 0.031 P_ten 0.000 0.001 0.000 0.000 0.000 0.001 0.000 0.164 0.042 P_comp 0.001 0.000 0.000 0.000 0.000 0.000 0.000 0.000 0.000
P_chest 0.119 0.112 0.002 0.004 0.143 0.030 0.002 0.003 0.031 P_femur 0.094 0.056 0.109 0.108 0.094 0.134 0.103 0.159 0.034 P_Joint 0.203 0.163 0.111 0.128 0.224 0.161 0.107 0.301 0.079
6
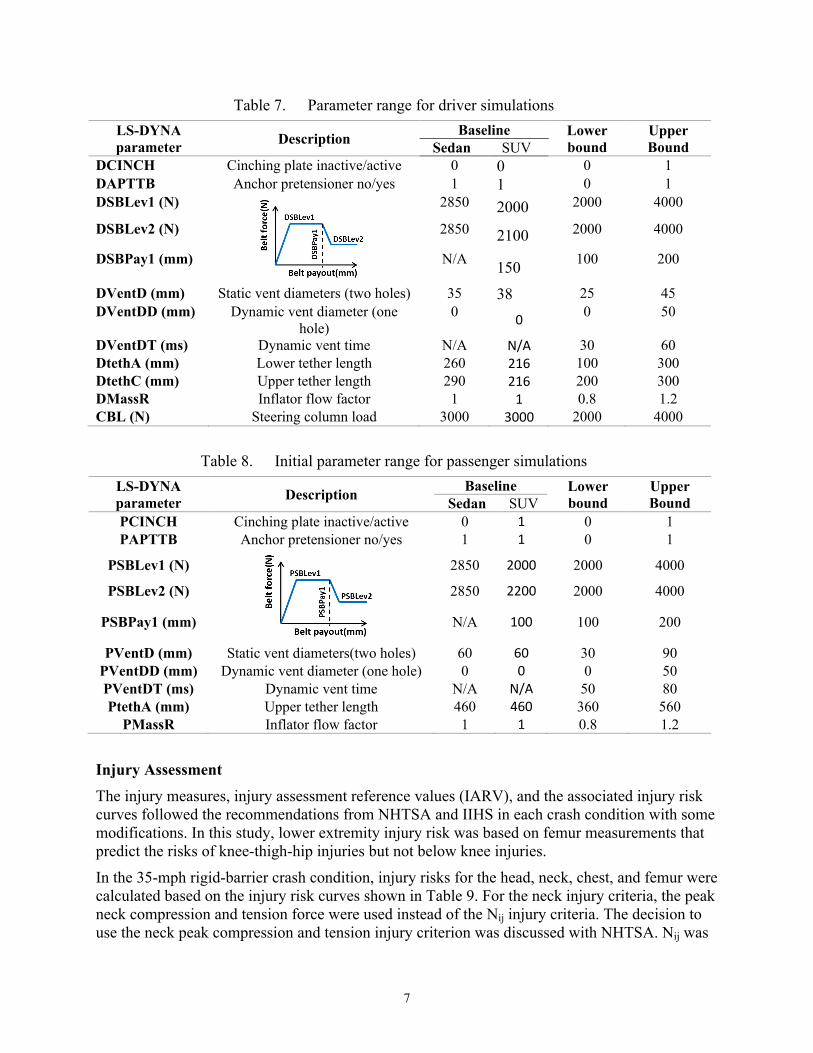
Crash Conditions Crash conditions for belted and unbelted occupants considered in this study are shown in Table 5 and Table 6, respectively. These crash conditions are part of the existing regulatory and consumer information program requirements (IIHS, 2014; NHTSA,1998; NHTSA, 2012). For the optimization with the unbelted driver, only the 0 degree condition was used as a constraint in the optimization. However, when optimization was complete, the -30 and +30 degree and 25 mph 40 percent offset conditions were checked to ensure they meet regulatory requirements. Likewise the 40 mph 40 percent ODB condition was checked to ensure the IIHS rating would be “good.”
Table 5. Crash conditions for belted occupants Test Driver Passenger 35 mph Rigid Barrier * 50th male 50th male 35 mph Rigid Barrier * 5th female 5th female 40 mph 40% offset deformable barrier ** 50th male 25 mph 40% offset deformable barrier*** 5th female 5th female *Achieve lowest injury risks; **Achieve best pick; ***Meet occupant safety regulatory requirements
Table 6. Crash conditions for unbelted occupants Test Angle in degrees Driver Passenger 25 mph Rigid Barrier 0 5th female 5th female 25 mph Rigid Barrier 0 (-30 to 30)* 50th male 50th male * -30 and 30 degree crash conditions not included in initial optimization
Design Parameters The design parameters used in the FE simulations to define restraint system characteristics, their definitions, baseline values, and initial range of values are shown in Table 7 for driver simulations and Table 8 for passenger simulations. Knee bolster parameters were not included in the optimization, because the knee-to-bolster contacts were small for belted occupants in the NCAP crashes. The models incorporated the knee bolster designs used in the production vehicles. The baseline values for the production sedan and SUV are shown in the table. The range of values is based on experience from optimizing restraint systems for various vehicles at GM. Features considered for optimization were limited to presently-available technologies which could be incorporated into the baseline vehicle models. Knee air bags were therefore not considered.
7
Table 7. Parameter range for driver simulations LS-DYNA parameter Description Baseline Lower
bound Upper Bound Sedan SUV
DCINCH Cinching plate inactive/active 0 0 0 1 DAPTTB Anchor pretensioner no/yes 1 1 0 1 DSBLev1 (N)
2850 2000 2000 4000
DSBLev2 (N) 2850 2100 2000 4000
DSBPay1 (mm) N/A 150 100 200
DVentD (mm) Static vent diameters (two holes) 35 38 25 45 DVentDD (mm) Dynamic vent diameter (one
hole) 0 0 0 50
DVentDT (ms) Dynamic vent time N/A N/A 30 60 DtethA (mm) Lower tether length 260 216 100 300 DtethC (mm) Upper tether length 290 216 200 300 DMassR Inflator flow factor 1 1 0.8 1.2 CBL (N) Steering column load 3000 3000 2000 4000
Table 8. Initial parameter range for passenger simulations
LS-DYNA parameter Description Baseline Lower
bound Upper Bound Sedan SUV
PCINCH Cinching plate inactive/active 0 1 0 1 PAPTTB Anchor pretensioner no/yes 1 1 0 1
PSBLev1 (N)
2850 2000 2000 4000
PSBLev2 (N) 2850 2200 2000 4000
PSBPay1 (mm) N/A 100 100 200
PVentD (mm) Static vent diameters(two holes) 60 60 30 90 PVentDD (mm) Dynamic vent diameter (one hole) 0 0 0 50 PVentDT (ms) Dynamic vent time N/A N/A 50 80 PtethA (mm) Upper tether length 460 460 360 560
PMassR Inflator flow factor 1 1 0.8 1.2
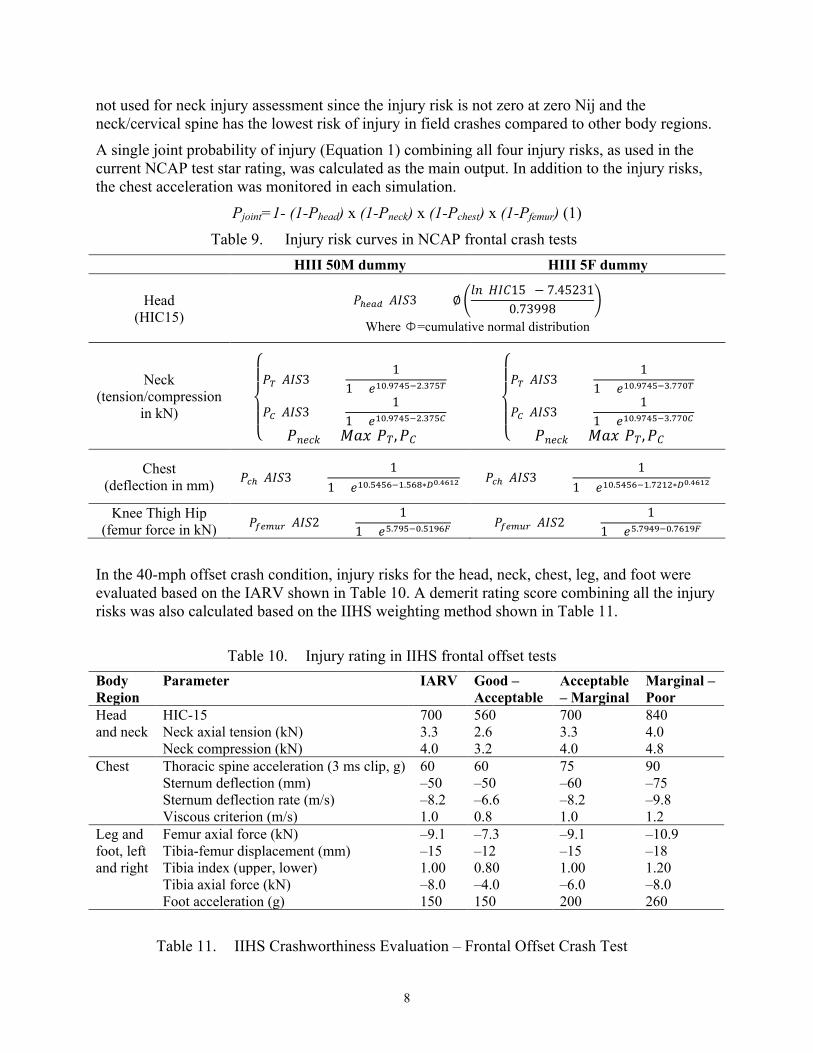
Injury Assessment The injury measures, injury assessment reference values (IARV), and the associated injury risk curves followed the recommendations from NHTSA and IIHS in each crash condition with some modifications. In this study, lower extremity injury risk was based on femur measurements that predict the risks of knee-thigh-hip injuries but not below knee injuries.
In the 35-mph rigid-barrier crash condition, injury risks for the head, neck, chest, and femur were calculated based on the injury risk curves shown in Table 9. For the neck injury criteria, the peak neck compression and tension force were used instead of the Nij injury criteria. The decision to use the neck peak compression and tension injury criterion was discussed with NHTSA. Nij was
8
not used for neck injury assessment since the injury risk is not zero at zero Nij and the neck/cervical spine has the lowest risk of injury in field crashes compared to other body regions.
A single joint probability of injury (Equation 1) combining all four injury risks, as used in the current NCAP test star rating, was calculated as the main output. In addition to the injury risks, the chest acceleration was monitored in each simulation.
Pjoint=1- (1-Phead) x (1-Pneck) x (1-Pchest) x (1-Pfemur) (1)
Table 9. Injury risk curves in NCAP frontal crash tests HIII 50M dummy HIII 5F dummy
Head (HIC15)
𝑃𝑃ℎ𝑒𝑒𝑒𝑒𝑒𝑒(𝐴𝐴𝐴𝐴𝐴𝐴3 +) = ∅�𝑙𝑙𝑙𝑙(𝐻𝐻𝐴𝐴𝐻𝐻15) − 7.45231
0.73998 �
Where Ф=cumulative normal distribution
Neck (tension/compression
in kN) ⎩⎪⎨
⎪⎧𝑃𝑃𝑇𝑇(𝐴𝐴𝐴𝐴𝐴𝐴3 +) =
11 + 𝑒𝑒10.9745−2.375𝑇𝑇
𝑃𝑃𝐶𝐶(𝐴𝐴𝐴𝐴𝐴𝐴3 +) =1
1 + 𝑒𝑒10.9745−2.375𝐶𝐶
𝑃𝑃𝑙𝑙𝑒𝑒𝑛𝑛𝑛𝑛 = 𝑀𝑀𝑀𝑀𝑀𝑀(𝑃𝑃𝑇𝑇,𝑃𝑃𝐻𝐻)
⎩⎪⎨
⎪⎧𝑃𝑃𝑇𝑇(𝐴𝐴𝐴𝐴𝐴𝐴3 +) =
11 + 𝑒𝑒10.9745−3.770𝑇𝑇
𝑃𝑃𝐶𝐶(𝐴𝐴𝐴𝐴𝐴𝐴3 +) =1
1 + 𝑒𝑒10.9745−3.770𝐶𝐶
𝑃𝑃𝑙𝑙𝑒𝑒𝑛𝑛𝑛𝑛 = 𝑀𝑀𝑀𝑀𝑀𝑀(𝑃𝑃𝑇𝑇,𝑃𝑃𝐻𝐻)
Chest (deflection in mm) 𝑃𝑃𝑐𝑐ℎ(𝐴𝐴𝐴𝐴𝐴𝐴3 +) =
11 + 𝑒𝑒10.5456−1.568∗𝐷𝐷0.4612 𝑃𝑃𝑐𝑐ℎ(𝐴𝐴𝐴𝐴𝐴𝐴3 +) =
11 + 𝑒𝑒10.5456−1.7212∗𝐷𝐷0.4612
Knee Thigh Hip (femur force in kN) 𝑃𝑃𝑓𝑓𝑒𝑒𝑓𝑓𝑓𝑓𝑓𝑓(𝐴𝐴𝐴𝐴𝐴𝐴2 +) =
11 + 𝑒𝑒5.795−0.5196𝐹𝐹 𝑃𝑃𝑓𝑓𝑒𝑒𝑓𝑓𝑓𝑓𝑓𝑓(𝐴𝐴𝐴𝐴𝐴𝐴2 +) =
11 + 𝑒𝑒5.7949−0.7619𝐹𝐹
In the 40-mph offset crash condition, injury risks for the head, neck, chest, leg, and foot were evaluated based on the IARV shown in Table 10. A demerit rating score combining all the injury risks was also calculated based on the IIHS weighting method shown in Table 11.
Table 10. Injury rating in IIHS frontal offset tests
Body Region
Parameter IARV Good – Acceptable
Acceptable – Marginal
Marginal – Poor
Head and neck
HIC-15 700 560 700 840 Neck axial tension (kN) 3.3 2.6 3.3 4.0 Neck compression (kN) 4.0 3.2 4.0 4.8
Chest Thoracic spine acceleration (3 ms clip, g) 60 60 75 90 Sternum deflection (mm) –50 –50 –60 –75 Sternum deflection rate (m/s) –8.2 –6.6 –8.2 –9.8 Viscous criterion (m/s) 1.0 0.8 1.0 1.2
Leg and foot, left and right
Femur axial force (kN) –9.1 –7.3 –9.1 –10.9 Tibia-femur displacement (mm) –15 –12 –15 –18 Tibia index (upper, lower) 1.00 0.80 1.00 1.20 Tibia axial force (kN) –8.0 –4.0 –6.0 –8.0 Foot acceleration (g) 150 150 200 260
Table 11. IIHS Crashworthiness Evaluation – Frontal Offset Crash Test
9
Rating Component Good Acceptable Marginal Poor Vehicle structure 0 2 6 10 Head and neck 0 2 10 20 Chest 0 2 10 20 Left leg and foot 0 1 2 4 Right leg and foot 0 1 2 4
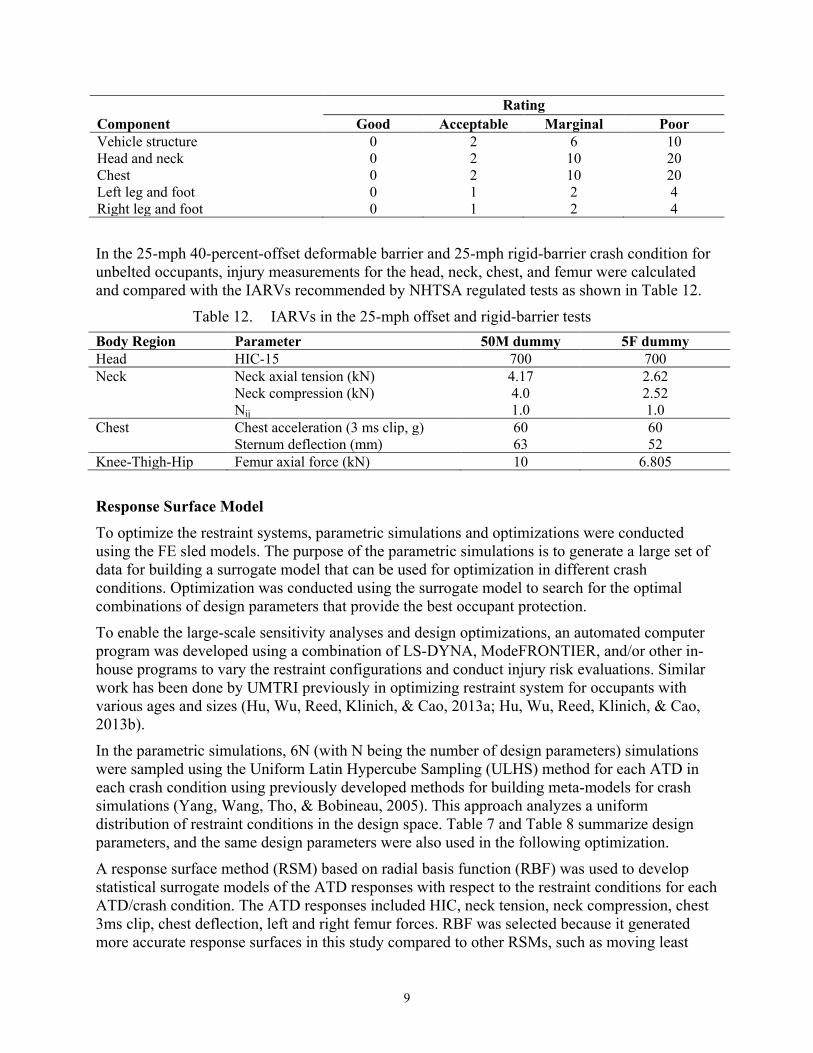
In the 25-mph 40-percent-offset deformable barrier and 25-mph rigid-barrier crash condition for unbelted occupants, injury measurements for the head, neck, chest, and femur were calculated and compared with the IARVs recommended by NHTSA regulated tests as shown in Table 12.
Table 12. IARVs in the 25-mph offset and rigid-barrier tests Body Region Parameter 50M dummy 5F dummy Head HIC-15 700 700 Neck Neck axial tension (kN) 4.17 2.62
Neck compression (kN) Nij
4.0 1.0
2.52 1.0
Chest Chest acceleration (3 ms clip, g) 60 60 Sternum deflection (mm) 63 52
Knee-Thigh-Hip Femur axial force (kN) 10 6.805
Response Surface Model To optimize the restraint systems, parametric simulations and optimizations were conducted using the FE sled models. The purpose of the parametric simulations is to generate a large set of data for building a surrogate model that can be used for optimization in different crash conditions. Optimization was conducted using the surrogate model to search for the optimal combinations of design parameters that provide the best occupant protection.
To enable the large-scale sensitivity analyses and design optimizations, an automated computer program was developed using a combination of LS-DYNA, ModeFRONTIER, and/or other in-house programs to vary the restraint configurations and conduct injury risk evaluations. Similar work has been done by UMTRI previously in optimizing restraint system for occupants with various ages and sizes (Hu, Wu, Reed, Klinich, & Cao, 2013a; Hu, Wu, Reed, Klinich, & Cao, 2013b).
In the parametric simulations, 6N (with N being the number of design parameters) simulations were sampled using the Uniform Latin Hypercube Sampling (ULHS) method for each ATD in each crash condition using previously developed methods for building meta-models for crash simulations (Yang, Wang, Tho, & Bobineau, 2005). This approach analyzes a uniform distribution of restraint conditions in the design space. Table 7 and Table 8 summarize design parameters, and the same design parameters were also used in the following optimization.
A response surface method (RSM) based on radial basis function (RBF) was used to develop statistical surrogate models of the ATD responses with respect to the restraint conditions for each ATD/crash condition. The ATD responses included HIC, neck tension, neck compression, chest 3ms clip, chest deflection, left and right femur forces. RBF was selected because it generated more accurate response surfaces in this study compared to other RSMs, such as moving least
10
square (MLS), Kriging, and multiquadric methods. Because negative HIC values may be predicted by the RSM, log (HIC) was used to build the RSM in the current study, which ensured a positive HIC to be predicted by the RSM. The purpose of the surrogate model is to set up the relationship between restraint system design parameters and the occupant injury risks. These surrogate models were used for the following optimizations to save computational time.
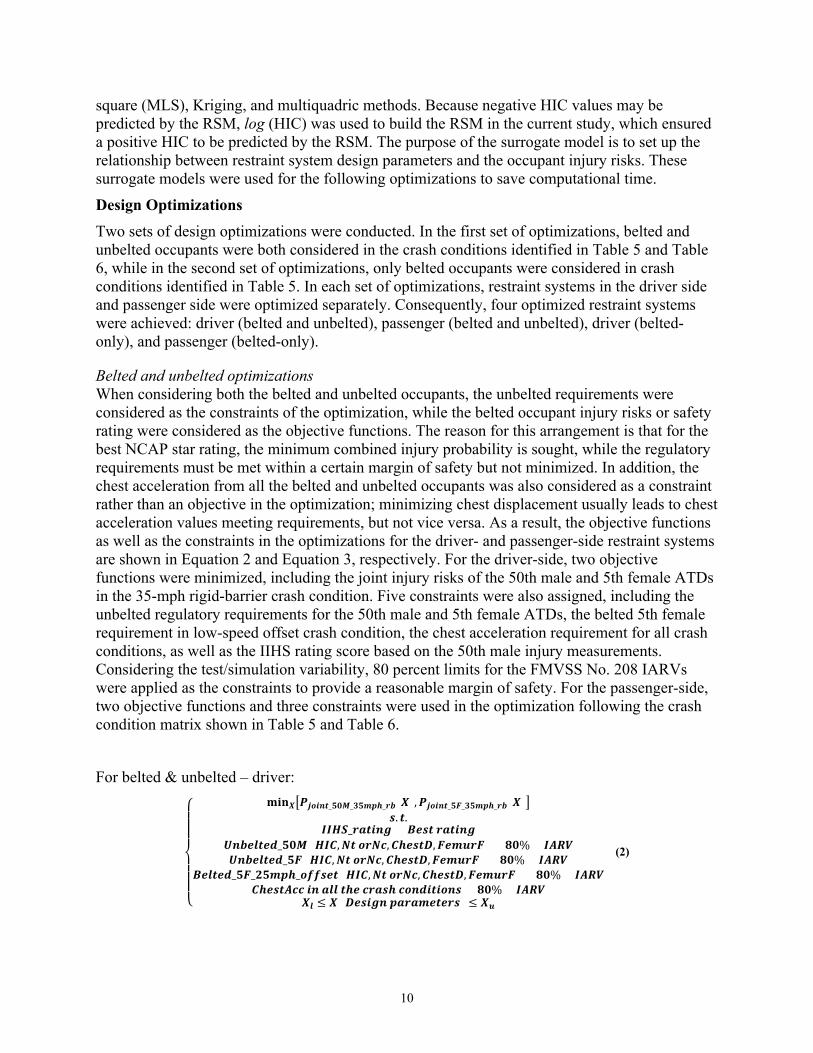
Design Optimizations Two sets of design optimizations were conducted. In the first set of optimizations, belted and unbelted occupants were both considered in the crash conditions identified in Table 5 and Table 6, while in the second set of optimizations, only belted occupants were considered in crash conditions identified in Table 5. In each set of optimizations, restraint systems in the driver side and passenger side were optimized separately. Consequently, four optimized restraint systems were achieved: driver (belted and unbelted), passenger (belted and unbelted), driver (belted-only), and passenger (belted-only).
Belted and unbelted optimizations When considering both the belted and unbelted occupants, the unbelted requirements were considered as the constraints of the optimization, while the belted occupant injury risks or safety rating were considered as the objective functions. The reason for this arrangement is that for the best NCAP star rating, the minimum combined injury probability is sought, while the regulatory requirements must be met within a certain margin of safety but not minimized. In addition, the chest acceleration from all the belted and unbelted occupants was also considered as a constraint rather than an objective in the optimization; minimizing chest displacement usually leads to chest acceleration values meeting requirements, but not vice versa. As a result, the objective functions as well as the constraints in the optimizations for the driver- and passenger-side restraint systems are shown in Equation 2 and Equation 3, respectively. For the driver-side, two objective functions were minimized, including the joint injury risks of the 50th male and 5th female ATDs in the 35-mph rigid-barrier crash condition. Five constraints were also assigned, including the unbelted regulatory requirements for the 50th male and 5th female ATDs, the belted 5th female requirement in low-speed offset crash condition, the chest acceleration requirement for all crash conditions, as well as the IIHS rating score based on the 50th male injury measurements. Considering the test/simulation variability, 80 percent limits for the FMVSS No. 208 IARVs were applied as the constraints to provide a reasonable margin of safety. For the passenger-side, two objective functions and three constraints were used in the optimization following the crash condition matrix shown in Table 5 and Table 6.
For belted & unbelted – driver:
⎩⎪⎪⎪⎨
⎪⎪⎪⎧ 𝐦𝐦𝐦𝐦𝐦𝐦𝑿𝑿�𝑷𝑷𝒋𝒋𝒋𝒋𝒋𝒋𝒋𝒋𝒋𝒋_𝟓𝟓𝟓𝟓𝟓𝟓_𝟑𝟑𝟓𝟓𝟑𝟑𝟑𝟑𝟑𝟑_𝒓𝒓𝒓𝒓(𝑿𝑿),𝑷𝑷𝒋𝒋𝒋𝒋𝒋𝒋𝒋𝒋𝒋𝒋_𝟓𝟓𝟓𝟓_𝟑𝟑𝟓𝟓𝟑𝟑𝟑𝟑𝟑𝟑_𝒓𝒓𝒓𝒓(𝑿𝑿)�
𝒔𝒔. 𝒋𝒋.𝑰𝑰𝑰𝑰𝑰𝑰𝑰𝑰_𝒓𝒓𝒓𝒓𝒋𝒋𝒋𝒋𝒋𝒋𝒓𝒓 = 𝑩𝑩𝑩𝑩𝒔𝒔𝒋𝒋 𝒓𝒓𝒓𝒓𝒋𝒋𝒋𝒋𝒋𝒋𝒓𝒓
𝑼𝑼𝒋𝒋𝒓𝒓𝑩𝑩𝑼𝑼𝒋𝒋𝑩𝑩𝑼𝑼_𝟓𝟓𝟓𝟓𝟓𝟓 (𝑰𝑰𝑰𝑰𝑯𝑯,𝑵𝑵𝒋𝒋 𝒋𝒋𝒓𝒓𝑵𝑵𝒐𝒐,𝑯𝑯𝟑𝟑𝑩𝑩𝒔𝒔𝒋𝒋𝑪𝑪,𝟓𝟓𝑩𝑩𝟑𝟑𝑭𝑭𝒓𝒓𝟓𝟓) < 𝟖𝟖𝟓𝟓% × 𝑰𝑰𝑰𝑰𝑹𝑹𝑹𝑹𝑼𝑼𝒋𝒋𝒓𝒓𝑩𝑩𝑼𝑼𝒋𝒋𝑩𝑩𝑼𝑼_𝟓𝟓𝟓𝟓 (𝑰𝑰𝑰𝑰𝑯𝑯,𝑵𝑵𝒋𝒋 𝒋𝒋𝒓𝒓𝑵𝑵𝒐𝒐,𝑯𝑯𝟑𝟑𝑩𝑩𝒔𝒔𝒋𝒋𝑪𝑪,𝟓𝟓𝑩𝑩𝟑𝟑𝑭𝑭𝒓𝒓𝟓𝟓) < 𝟖𝟖𝟓𝟓% × 𝑰𝑰𝑰𝑰𝑹𝑹𝑹𝑹
𝑩𝑩𝑩𝑩𝑼𝑼𝒋𝒋𝑩𝑩𝑼𝑼_𝟓𝟓𝟓𝟓_𝟐𝟐𝟓𝟓𝟑𝟑𝟑𝟑𝟑𝟑_𝒋𝒋𝒐𝒐𝒐𝒐𝒔𝒔𝑩𝑩𝒋𝒋 (𝑰𝑰𝑰𝑰𝑯𝑯,𝑵𝑵𝒋𝒋 𝒋𝒋𝒓𝒓𝑵𝑵𝒐𝒐,𝑯𝑯𝟑𝟑𝑩𝑩𝒔𝒔𝒋𝒋𝑪𝑪,𝟓𝟓𝑩𝑩𝟑𝟑𝑭𝑭𝒓𝒓𝟓𝟓) < 𝟖𝟖𝟓𝟓% × 𝑰𝑰𝑰𝑰𝑹𝑹𝑹𝑹𝑯𝑯𝟑𝟑𝑩𝑩𝒔𝒔𝒋𝒋𝑰𝑰𝒐𝒐𝒐𝒐 𝒋𝒋𝒋𝒋 𝒓𝒓𝑼𝑼𝑼𝑼 𝒋𝒋𝟑𝟑𝑩𝑩 𝒐𝒐𝒓𝒓𝒓𝒓𝒔𝒔𝟑𝟑 𝒐𝒐𝒋𝒋𝒋𝒋𝑼𝑼𝒋𝒋𝒋𝒋𝒋𝒋𝒋𝒋𝒋𝒋𝒔𝒔 < 𝟖𝟖𝟓𝟓% × 𝑰𝑰𝑰𝑰𝑹𝑹𝑹𝑹
𝑿𝑿𝑼𝑼 ≤ 𝑿𝑿 (𝑪𝑪𝑩𝑩𝒔𝒔𝒋𝒋𝒓𝒓𝒋𝒋 𝟑𝟑𝒓𝒓𝒓𝒓𝒓𝒓𝟑𝟑𝑩𝑩𝒋𝒋𝑩𝑩𝒓𝒓𝒔𝒔) ≤ 𝑿𝑿𝑭𝑭
(2)
11
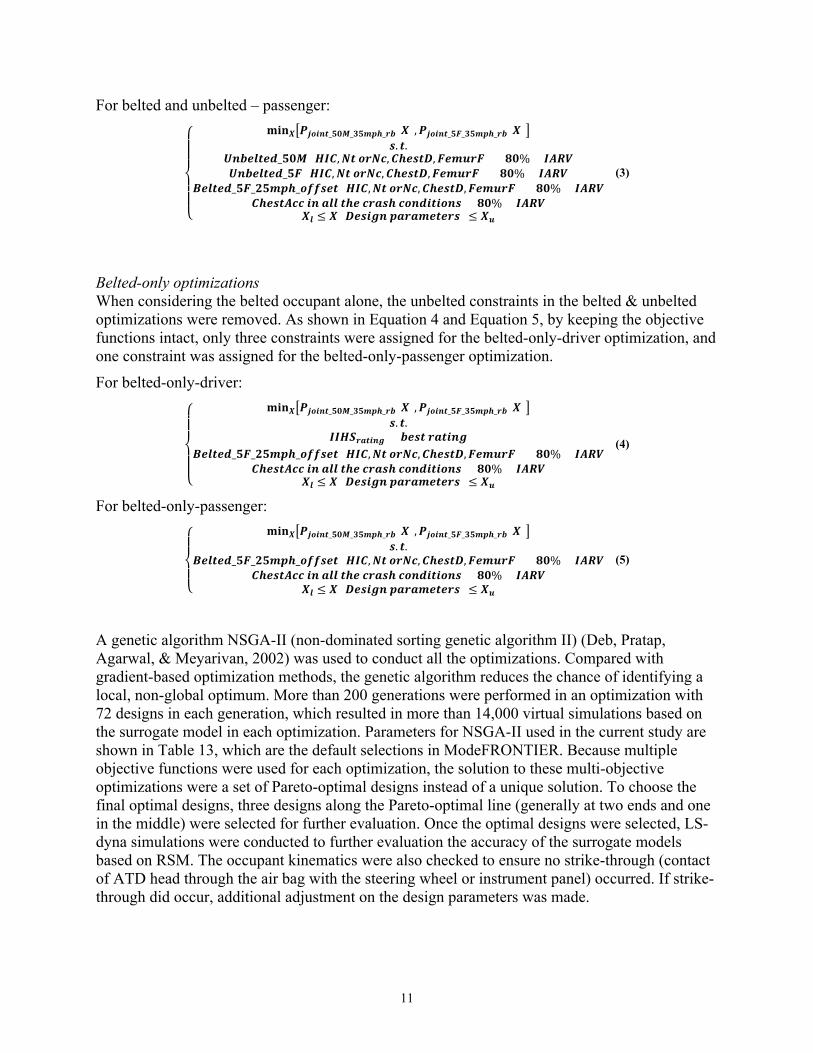
For belted and unbelted – passenger:
⎩⎪⎪⎨
⎪⎪⎧ 𝐦𝐦𝐦𝐦𝐦𝐦𝑿𝑿�𝑷𝑷𝒋𝒋𝒋𝒋𝒋𝒋𝒋𝒋𝒋𝒋_𝟓𝟓𝟓𝟓𝟓𝟓_𝟑𝟑𝟓𝟓𝟑𝟑𝟑𝟑𝟑𝟑_𝒓𝒓𝒓𝒓(𝑿𝑿),𝑷𝑷𝒋𝒋𝒋𝒋𝒋𝒋𝒋𝒋𝒋𝒋_𝟓𝟓𝟓𝟓_𝟑𝟑𝟓𝟓𝟑𝟑𝟑𝟑𝟑𝟑_𝒓𝒓𝒓𝒓(𝑿𝑿)�
𝒔𝒔. 𝒋𝒋.𝑼𝑼𝒋𝒋𝒓𝒓𝑩𝑩𝑼𝑼𝒋𝒋𝑩𝑩𝑼𝑼_𝟓𝟓𝟓𝟓𝟓𝟓 (𝑰𝑰𝑰𝑰𝑯𝑯,𝑵𝑵𝒋𝒋 𝒋𝒋𝒓𝒓𝑵𝑵𝒐𝒐,𝑯𝑯𝟑𝟑𝑩𝑩𝒔𝒔𝒋𝒋𝑪𝑪,𝟓𝟓𝑩𝑩𝟑𝟑𝑭𝑭𝒓𝒓𝟓𝟓) < 𝟖𝟖𝟓𝟓% × 𝑰𝑰𝑰𝑰𝑹𝑹𝑹𝑹𝑼𝑼𝒋𝒋𝒓𝒓𝑩𝑩𝑼𝑼𝒋𝒋𝑩𝑩𝑼𝑼_𝟓𝟓𝟓𝟓 (𝑰𝑰𝑰𝑰𝑯𝑯,𝑵𝑵𝒋𝒋 𝒋𝒋𝒓𝒓𝑵𝑵𝒐𝒐,𝑯𝑯𝟑𝟑𝑩𝑩𝒔𝒔𝒋𝒋𝑪𝑪,𝟓𝟓𝑩𝑩𝟑𝟑𝑭𝑭𝒓𝒓𝟓𝟓) < 𝟖𝟖𝟓𝟓% × 𝑰𝑰𝑰𝑰𝑹𝑹𝑹𝑹
𝑩𝑩𝑩𝑩𝑼𝑼𝒋𝒋𝑩𝑩𝑼𝑼_𝟓𝟓𝟓𝟓_𝟐𝟐𝟓𝟓𝟑𝟑𝟑𝟑𝟑𝟑_𝒋𝒋𝒐𝒐𝒐𝒐𝒔𝒔𝑩𝑩𝒋𝒋 (𝑰𝑰𝑰𝑰𝑯𝑯,𝑵𝑵𝒋𝒋 𝒋𝒋𝒓𝒓𝑵𝑵𝒐𝒐,𝑯𝑯𝟑𝟑𝑩𝑩𝒔𝒔𝒋𝒋𝑪𝑪,𝟓𝟓𝑩𝑩𝟑𝟑𝑭𝑭𝒓𝒓𝟓𝟓) < 𝟖𝟖𝟓𝟓% × 𝑰𝑰𝑰𝑰𝑹𝑹𝑹𝑹𝑯𝑯𝟑𝟑𝑩𝑩𝒔𝒔𝒋𝒋𝑰𝑰𝒐𝒐𝒐𝒐 𝒋𝒋𝒋𝒋 𝒓𝒓𝑼𝑼𝑼𝑼 𝒋𝒋𝟑𝟑𝑩𝑩 𝒐𝒐𝒓𝒓𝒓𝒓𝒔𝒔𝟑𝟑 𝒐𝒐𝒋𝒋𝒋𝒋𝑼𝑼𝒋𝒋𝒋𝒋𝒋𝒋𝒋𝒋𝒋𝒋𝒔𝒔 < 𝟖𝟖𝟓𝟓% × 𝑰𝑰𝑰𝑰𝑹𝑹𝑹𝑹
𝑿𝑿𝑼𝑼 ≤ 𝑿𝑿 (𝑪𝑪𝑩𝑩𝒔𝒔𝒋𝒋𝒓𝒓𝒋𝒋 𝟑𝟑𝒓𝒓𝒓𝒓𝒓𝒓𝟑𝟑𝑩𝑩𝒋𝒋𝑩𝑩𝒓𝒓𝒔𝒔) ≤ 𝑿𝑿𝑭𝑭
(3)
Belted-only optimizations When considering the belted occupant alone, the unbelted constraints in the belted & unbelted optimizations were removed. As shown in Equation 4 and Equation 5, by keeping the objective functions intact, only three constraints were assigned for the belted-only-driver optimization, and one constraint was assigned for the belted-only-passenger optimization.
For belted-only-driver:
⎩⎪⎪⎨
⎪⎪⎧ 𝐦𝐦𝐦𝐦𝐦𝐦𝑿𝑿�𝑷𝑷𝒋𝒋𝒋𝒋𝒋𝒋𝒋𝒋𝒋𝒋_𝟓𝟓𝟓𝟓𝟓𝟓_𝟑𝟑𝟓𝟓𝟑𝟑𝟑𝟑𝟑𝟑_𝒓𝒓𝒓𝒓(𝑿𝑿),𝑷𝑷𝒋𝒋𝒋𝒋𝒋𝒋𝒋𝒋𝒋𝒋_𝟓𝟓𝟓𝟓_𝟑𝟑𝟓𝟓𝟑𝟑𝟑𝟑𝟑𝟑_𝒓𝒓𝒓𝒓(𝑿𝑿)�
𝒔𝒔. 𝒋𝒋.𝑰𝑰𝑰𝑰𝑰𝑰𝑰𝑰𝒓𝒓𝒓𝒓𝒋𝒋𝒋𝒋𝒋𝒋𝒓𝒓 = 𝒓𝒓𝑩𝑩𝒔𝒔𝒋𝒋 𝒓𝒓𝒓𝒓𝒋𝒋𝒋𝒋𝒋𝒋𝒓𝒓
𝑩𝑩𝑩𝑩𝑼𝑼𝒋𝒋𝑩𝑩𝑼𝑼_𝟓𝟓𝟓𝟓_𝟐𝟐𝟓𝟓𝟑𝟑𝟑𝟑𝟑𝟑_𝒋𝒋𝒐𝒐𝒐𝒐𝒔𝒔𝑩𝑩𝒋𝒋 (𝑰𝑰𝑰𝑰𝑯𝑯,𝑵𝑵𝒋𝒋 𝒋𝒋𝒓𝒓𝑵𝑵𝒐𝒐,𝑯𝑯𝟑𝟑𝑩𝑩𝒔𝒔𝒋𝒋𝑪𝑪,𝟓𝟓𝑩𝑩𝟑𝟑𝑭𝑭𝒓𝒓𝟓𝟓) < 𝟖𝟖𝟓𝟓% × 𝑰𝑰𝑰𝑰𝑹𝑹𝑹𝑹𝑯𝑯𝟑𝟑𝑩𝑩𝒔𝒔𝒋𝒋𝑰𝑰𝒐𝒐𝒐𝒐 𝒋𝒋𝒋𝒋 𝒓𝒓𝑼𝑼𝑼𝑼 𝒋𝒋𝟑𝟑𝑩𝑩 𝒐𝒐𝒓𝒓𝒓𝒓𝒔𝒔𝟑𝟑 𝒐𝒐𝒋𝒋𝒋𝒋𝑼𝑼𝒋𝒋𝒋𝒋𝒋𝒋𝒋𝒋𝒋𝒋𝒔𝒔 < 𝟖𝟖𝟓𝟓% × 𝑰𝑰𝑰𝑰𝑹𝑹𝑹𝑹
𝑿𝑿𝑼𝑼 ≤ 𝑿𝑿 (𝑪𝑪𝑩𝑩𝒔𝒔𝒋𝒋𝒓𝒓𝒋𝒋 𝟑𝟑𝒓𝒓𝒓𝒓𝒓𝒓𝟑𝟑𝑩𝑩𝒋𝒋𝑩𝑩𝒓𝒓𝒔𝒔) ≤ 𝑿𝑿𝑭𝑭
(4)
For belted-only-passenger:
⎩⎪⎨
⎪⎧ 𝐦𝐦𝐦𝐦𝐦𝐦𝑿𝑿�𝑷𝑷𝒋𝒋𝒋𝒋𝒋𝒋𝒋𝒋𝒋𝒋_𝟓𝟓𝟓𝟓𝟓𝟓_𝟑𝟑𝟓𝟓𝟑𝟑𝟑𝟑𝟑𝟑_𝒓𝒓𝒓𝒓(𝑿𝑿),𝑷𝑷𝒋𝒋𝒋𝒋𝒋𝒋𝒋𝒋𝒋𝒋_𝟓𝟓𝟓𝟓_𝟑𝟑𝟓𝟓𝟑𝟑𝟑𝟑𝟑𝟑_𝒓𝒓𝒓𝒓(𝑿𝑿)�
𝒔𝒔. 𝒋𝒋.𝑩𝑩𝑩𝑩𝑼𝑼𝒋𝒋𝑩𝑩𝑼𝑼_𝟓𝟓𝟓𝟓_𝟐𝟐𝟓𝟓𝟑𝟑𝟑𝟑𝟑𝟑_𝒋𝒋𝒐𝒐𝒐𝒐𝒔𝒔𝑩𝑩𝒋𝒋 (𝑰𝑰𝑰𝑰𝑯𝑯,𝑵𝑵𝒋𝒋 𝒋𝒋𝒓𝒓𝑵𝑵𝒐𝒐,𝑯𝑯𝟑𝟑𝑩𝑩𝒔𝒔𝒋𝒋𝑪𝑪,𝟓𝟓𝑩𝑩𝟑𝟑𝑭𝑭𝒓𝒓𝟓𝟓) < 𝟖𝟖𝟓𝟓% × 𝑰𝑰𝑰𝑰𝑹𝑹𝑹𝑹
𝑯𝑯𝟑𝟑𝑩𝑩𝒔𝒔𝒋𝒋𝑰𝑰𝒐𝒐𝒐𝒐 𝒋𝒋𝒋𝒋 𝒓𝒓𝑼𝑼𝑼𝑼 𝒋𝒋𝟑𝟑𝑩𝑩 𝒐𝒐𝒓𝒓𝒓𝒓𝒔𝒔𝟑𝟑 𝒐𝒐𝒋𝒋𝒋𝒋𝑼𝑼𝒋𝒋𝒋𝒋𝒋𝒋𝒋𝒋𝒋𝒋𝒔𝒔 < 𝟖𝟖𝟓𝟓% × 𝑰𝑰𝑰𝑰𝑹𝑹𝑹𝑹𝑿𝑿𝑼𝑼 ≤ 𝑿𝑿 (𝑪𝑪𝑩𝑩𝒔𝒔𝒋𝒋𝒓𝒓𝒋𝒋 𝟑𝟑𝒓𝒓𝒓𝒓𝒓𝒓𝟑𝟑𝑩𝑩𝒋𝒋𝑩𝑩𝒓𝒓𝒔𝒔) ≤ 𝑿𝑿𝑭𝑭
(5)
A genetic algorithm NSGA-II (non-dominated sorting genetic algorithm II) (Deb, Pratap, Agarwal, & Meyarivan, 2002) was used to conduct all the optimizations. Compared with gradient-based optimization methods, the genetic algorithm reduces the chance of identifying a local, non-global optimum. More than 200 generations were performed in an optimization with 72 designs in each generation, which resulted in more than 14,000 virtual simulations based on the surrogate model in each optimization. Parameters for NSGA-II used in the current study are shown in Table 13, which are the default selections in ModeFRONTIER. Because multiple objective functions were used for each optimization, the solution to these multi-objective optimizations were a set of Pareto-optimal designs instead of a unique solution. To choose the final optimal designs, three designs along the Pareto-optimal line (generally at two ends and one in the middle) were selected for further evaluation. Once the optimal designs were selected, LS-dyna simulations were conducted to further evaluation the accuracy of the surrogate models based on RSM. The occupant kinematics were also checked to ensure no strike-through (contact of ATD head through the air bag with the steering wheel or instrument panel) occurred. If strike-through did occur, additional adjustment on the design parameters was made.
12
Table 13. NSGA-II parameters used in this study NSGA-II Parameters Value
Generation size 200 Number of Generations 72 Crossover Probability 0.9 Mutation Probability 1.0
Distribution Index for Crossover 20 Distribution Index for Mutation 20
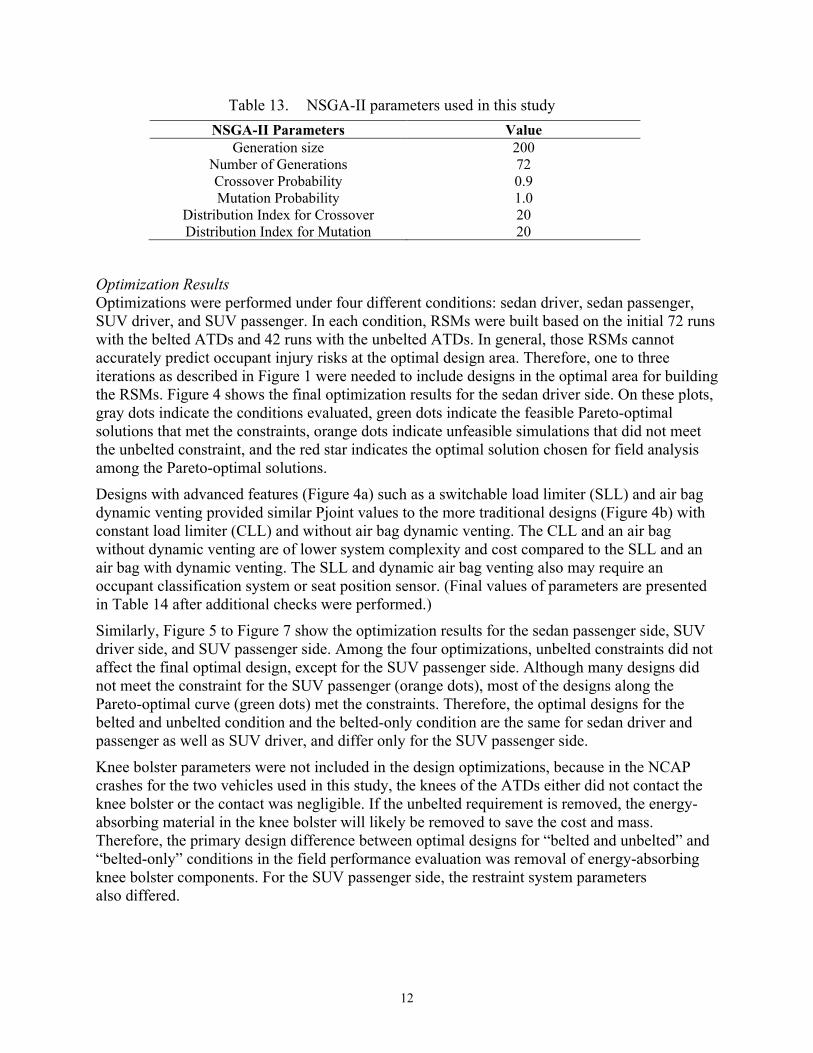
Optimization Results Optimizations were performed under four different conditions: sedan driver, sedan passenger, SUV driver, and SUV passenger. In each condition, RSMs were built based on the initial 72 runs with the belted ATDs and 42 runs with the unbelted ATDs. In general, those RSMs cannot accurately predict occupant injury risks at the optimal design area. Therefore, one to three iterations as described in Figure 1 were needed to include designs in the optimal area for building the RSMs. Figure 4 shows the final optimization results for the sedan driver side. On these plots, gray dots indicate the conditions evaluated, green dots indicate the feasible Pareto-optimal solutions that met the constraints, orange dots indicate unfeasible simulations that did not meet the unbelted constraint, and the red star indicates the optimal solution chosen for field analysis among the Pareto-optimal solutions.
Designs with advanced features (Figure 4a) such as a switchable load limiter (SLL) and air bag dynamic venting provided similar Pjoint values to the more traditional designs (Figure 4b) with constant load limiter (CLL) and without air bag dynamic venting. The CLL and an air bag without dynamic venting are of lower system complexity and cost compared to the SLL and an air bag with dynamic venting. The SLL and dynamic air bag venting also may require an occupant classification system or seat position sensor. (Final values of parameters are presented in Table 14 after additional checks were performed.)
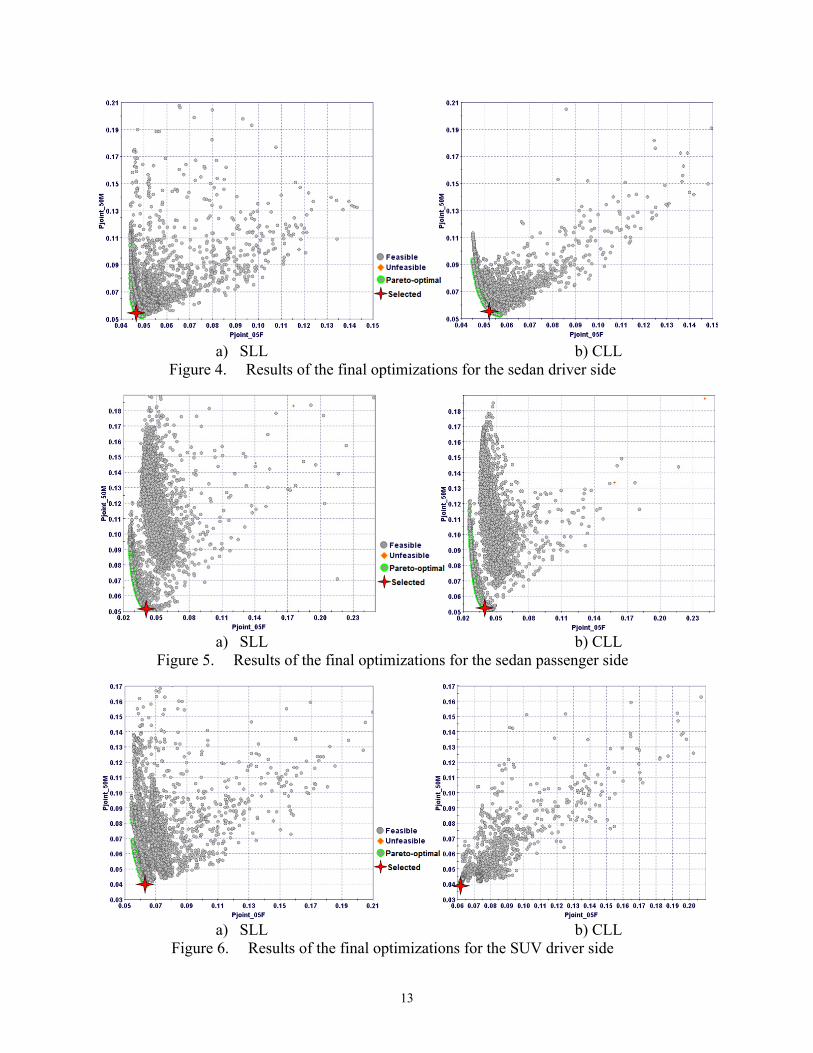
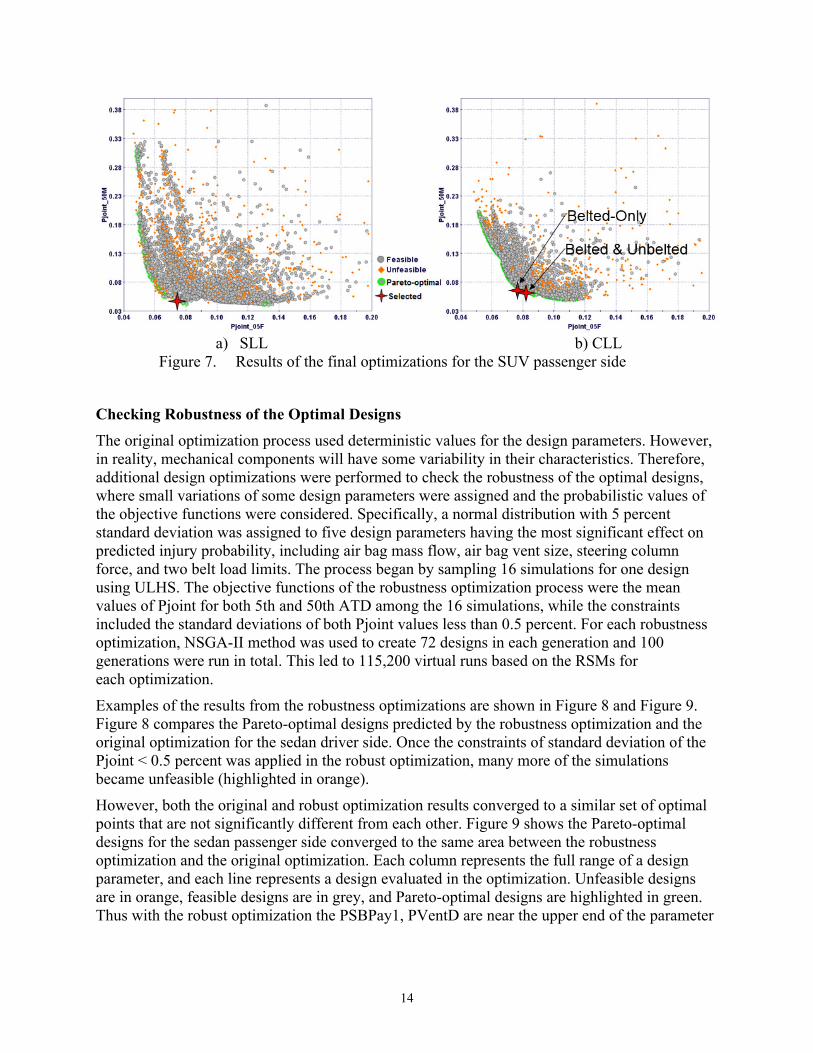
Similarly, Figure 5 to Figure 7 show the optimization results for the sedan passenger side, SUV driver side, and SUV passenger side. Among the four optimizations, unbelted constraints did not affect the final optimal design, except for the SUV passenger side. Although many designs did not meet the constraint for the SUV passenger (orange dots), most of the designs along the Pareto-optimal curve (green dots) met the constraints. Therefore, the optimal designs for the belted and unbelted condition and the belted-only condition are the same for sedan driver and passenger as well as SUV driver, and differ only for the SUV passenger side.
Knee bolster parameters were not included in the design optimizations, because in the NCAP crashes for the two vehicles used in this study, the knees of the ATDs either did not contact the knee bolster or the contact was negligible. If the unbelted requirement is removed, the energy-absorbing material in the knee bolster will likely be removed to save the cost and mass. Therefore, the primary design difference between optimal designs for “belted and unbelted” and “belted-only” conditions in the field performance evaluation was removal of energy-absorbing knee bolster components. For the SUV passenger side, the restraint system parameters also differed.
13
a) SLL b) CLL
Figure 4. Results of the final optimizations for the sedan driver side
a) SLL b) CLL
Figure 5. Results of the final optimizations for the sedan passenger side
a) SLL b) CLL
Figure 6. Results of the final optimizations for the SUV driver side
14
a) SLL b) CLL
Figure 7. Results of the final optimizations for the SUV passenger side
Checking Robustness of the Optimal Designs The original optimization process used deterministic values for the design parameters. However, in reality, mechanical components will have some variability in their characteristics. Therefore, additional design optimizations were performed to check the robustness of the optimal designs, where small variations of some design parameters were assigned and the probabilistic values of the objective functions were considered. Specifically, a normal distribution with 5 percent standard deviation was assigned to five design parameters having the most significant effect on predicted injury probability, including air bag mass flow, air bag vent size, steering column force, and two belt load limits. The process began by sampling 16 simulations for one design using ULHS. The objective functions of the robustness optimization process were the mean values of Pjoint for both 5th and 50th ATD among the 16 simulations, while the constraints included the standard deviations of both Pjoint values less than 0.5 percent. For each robustness optimization, NSGA-II method was used to create 72 designs in each generation and 100 generations were run in total. This led to 115,200 virtual runs based on the RSMs for each optimization.
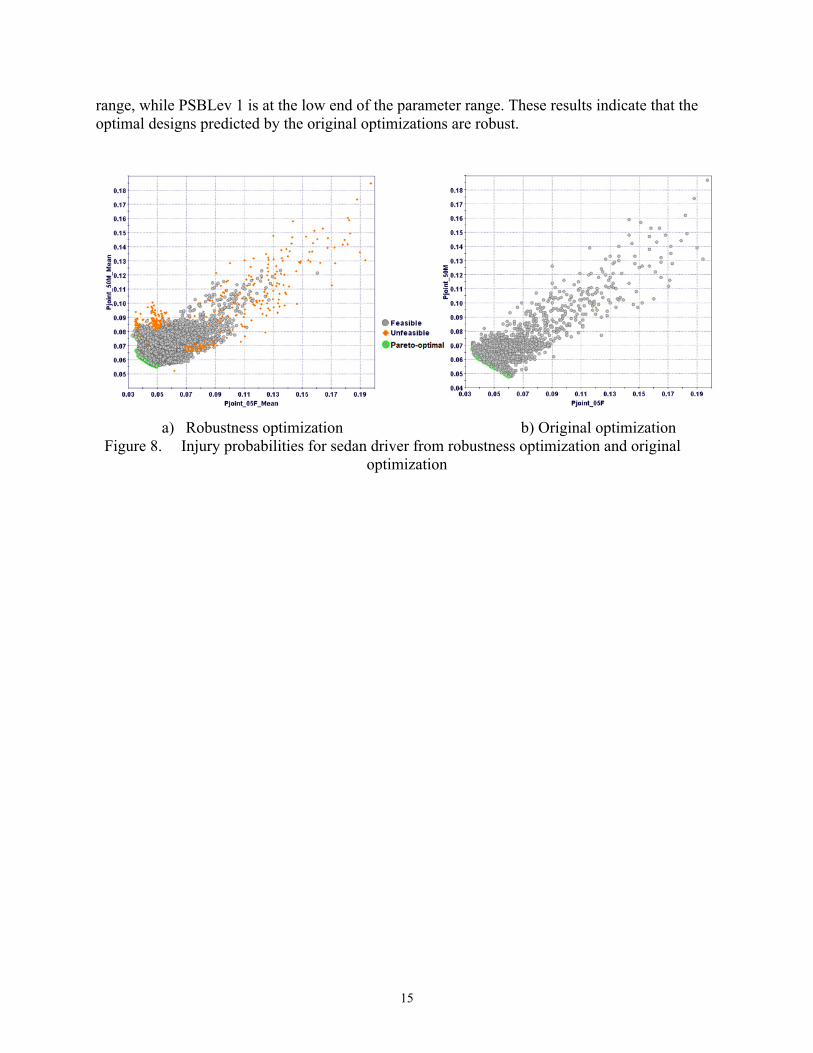
Examples of the results from the robustness optimizations are shown in Figure 8 and Figure 9. Figure 8 compares the Pareto-optimal designs predicted by the robustness optimization and the original optimization for the sedan driver side. Once the constraints of standard deviation of the Pjoint < 0.5 percent was applied in the robust optimization, many more of the simulations became unfeasible (highlighted in orange).
However, both the original and robust optimization results converged to a similar set of optimal points that are not significantly different from each other. Figure 9 shows the Pareto-optimal designs for the sedan passenger side converged to the same area between the robustness optimization and the original optimization. Each column represents the full range of a design parameter, and each line represents a design evaluated in the optimization. Unfeasible designs are in orange, feasible designs are in grey, and Pareto-optimal designs are highlighted in green. Thus with the robust optimization the PSBPay1, PVentD are near the upper end of the parameter
15
range, while PSBLev 1 is at the low end of the parameter range. These results indicate that the optimal designs predicted by the original optimizations are robust.
a) Robustness optimization b) Original optimization
Figure 8. Injury probabilities for sedan driver from robustness optimization and original optimization
16
a) Robustness optimization
b) b) Original optimization
Figure 9. Optimal design parameter convergence pattern for sedan passenger from robustness optimization and original optimization
Note: Each column represents the full range of a design parameter, and each line represents a design evaluated in the optimization. Unfeasible designs are in orange, feasible designs are in
grey, and Pareto-optimal designs are highlighted in green. Thus with the robust optimization the PSBPay1, PVentD are near the upper end of the parameter range, while PSBLev 1 is at the low
end of the parameter range.
17
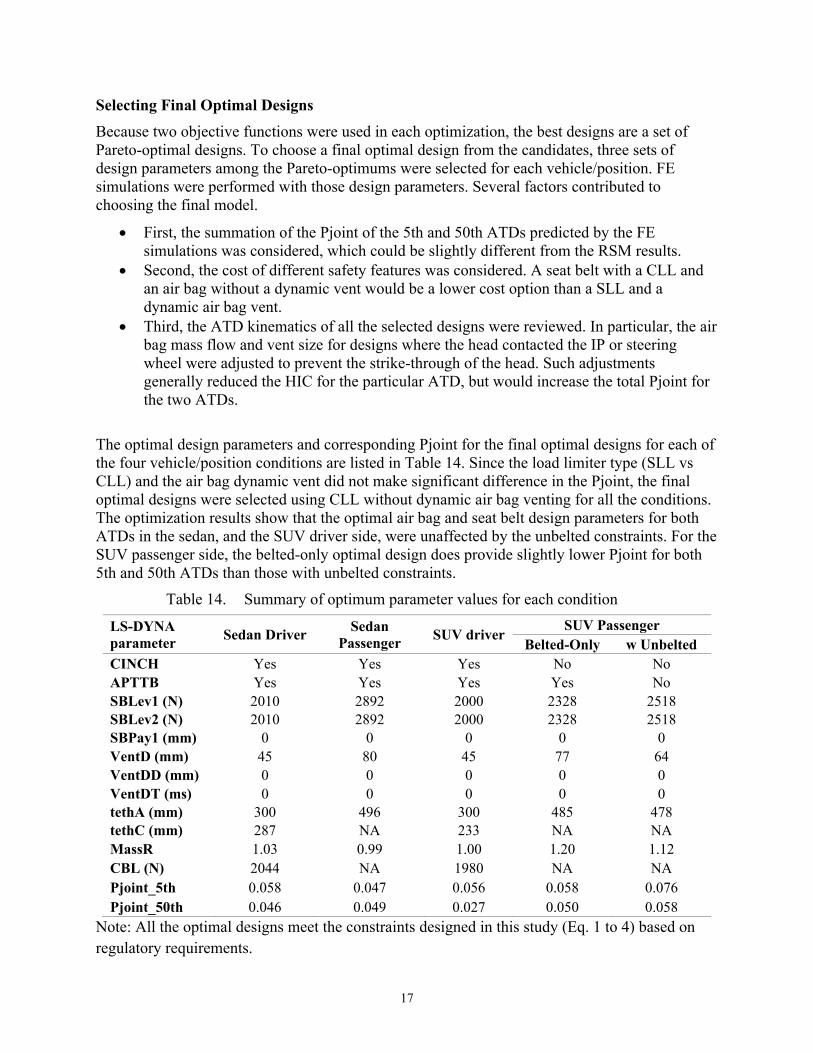
Selecting Final Optimal Designs Because two objective functions were used in each optimization, the best designs are a set of Pareto-optimal designs. To choose a final optimal design from the candidates, three sets of design parameters among the Pareto-optimums were selected for each vehicle/position. FE simulations were performed with those design parameters. Several factors contributed to choosing the final model.
• First, the summation of the Pjoint of the 5th and 50th ATDs predicted by the FE simulations was considered, which could be slightly different from the RSM results.
• Second, the cost of different safety features was considered. A seat belt with a CLL and an air bag without a dynamic vent would be a lower cost option than a SLL and a dynamic air bag vent.
• Third, the ATD kinematics of all the selected designs were reviewed. In particular, the air bag mass flow and vent size for designs where the head contacted the IP or steering wheel were adjusted to prevent the strike-through of the head. Such adjustments generally reduced the HIC for the particular ATD, but would increase the total Pjoint for the two ATDs.
The optimal design parameters and corresponding Pjoint for the final optimal designs for each of the four vehicle/position conditions are listed in Table 14. Since the load limiter type (SLL vs CLL) and the air bag dynamic vent did not make significant difference in the Pjoint, the final optimal designs were selected using CLL without dynamic air bag venting for all the conditions. The optimization results show that the optimal air bag and seat belt design parameters for both ATDs in the sedan, and the SUV driver side, were unaffected by the unbelted constraints. For the SUV passenger side, the belted-only optimal design does provide slightly lower Pjoint for both 5th and 50th ATDs than those with unbelted constraints.
Table 14. Summary of optimum parameter values for each condition
LS-DYNA parameter Sedan Driver Sedan
Passenger SUV driver SUV Passenger Belted-Only w Unbelted
CINCH Yes Yes Yes No No APTTB Yes Yes Yes Yes No SBLev1 (N) 2010 2892 2000 2328 2518 SBLev2 (N) 2010 2892 2000 2328 2518 SBPay1 (mm) 0 0 0 0 0 VentD (mm) 45 80 45 77 64 VentDD (mm) 0 0 0 0 0 VentDT (ms) 0 0 0 0 0 tethA (mm) 300 496 300 485 478 tethC (mm) 287 NA 233 NA NA MassR 1.03 0.99 1.00 1.20 1.12 CBL (N) 2044 NA 1980 NA NA Pjoint_5th 0.058 0.047 0.056 0.058 0.076 Pjoint_50th 0.046 0.049 0.027 0.050 0.058
Note: All the optimal designs meet the constraints designed in this study (Eq. 1 to 4) based on regulatory requirements.
18
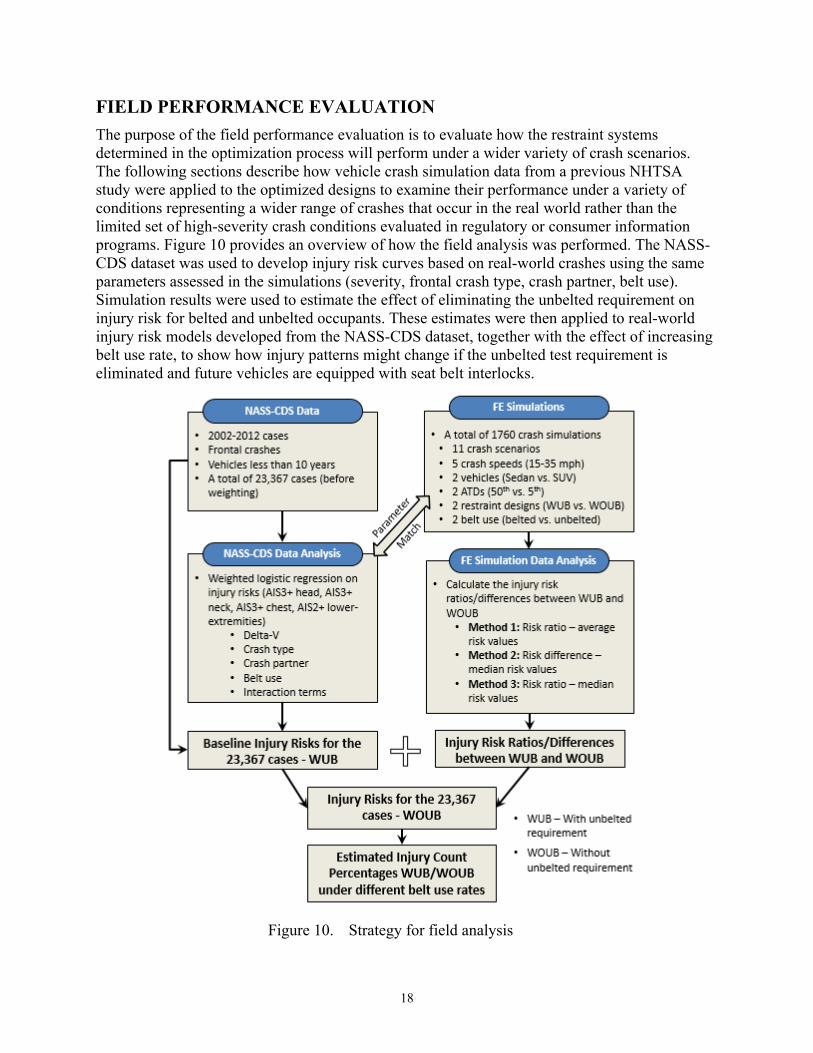
FIELD PERFORMANCE EVALUATION The purpose of the field performance evaluation is to evaluate how the restraint systems determined in the optimization process will perform under a wider variety of crash scenarios. The following sections describe how vehicle crash simulation data from a previous NHTSA study were applied to the optimized designs to examine their performance under a variety of conditions representing a wider range of crashes that occur in the real world rather than the limited set of high-severity crash conditions evaluated in regulatory or consumer information programs. Figure 10 provides an overview of how the field analysis was performed. The NASS-CDS dataset was used to develop injury risk curves based on real-world crashes using the same parameters assessed in the simulations (severity, frontal crash type, crash partner, belt use). Simulation results were used to estimate the effect of eliminating the unbelted requirement on injury risk for belted and unbelted occupants. These estimates were then applied to real-world injury risk models developed from the NASS-CDS dataset, together with the effect of increasing belt use rate, to show how injury patterns might change if the unbelted test requirement is eliminated and future vehicles are equipped with seat belt interlocks.
Figure 10. Strategy for field analysis
19
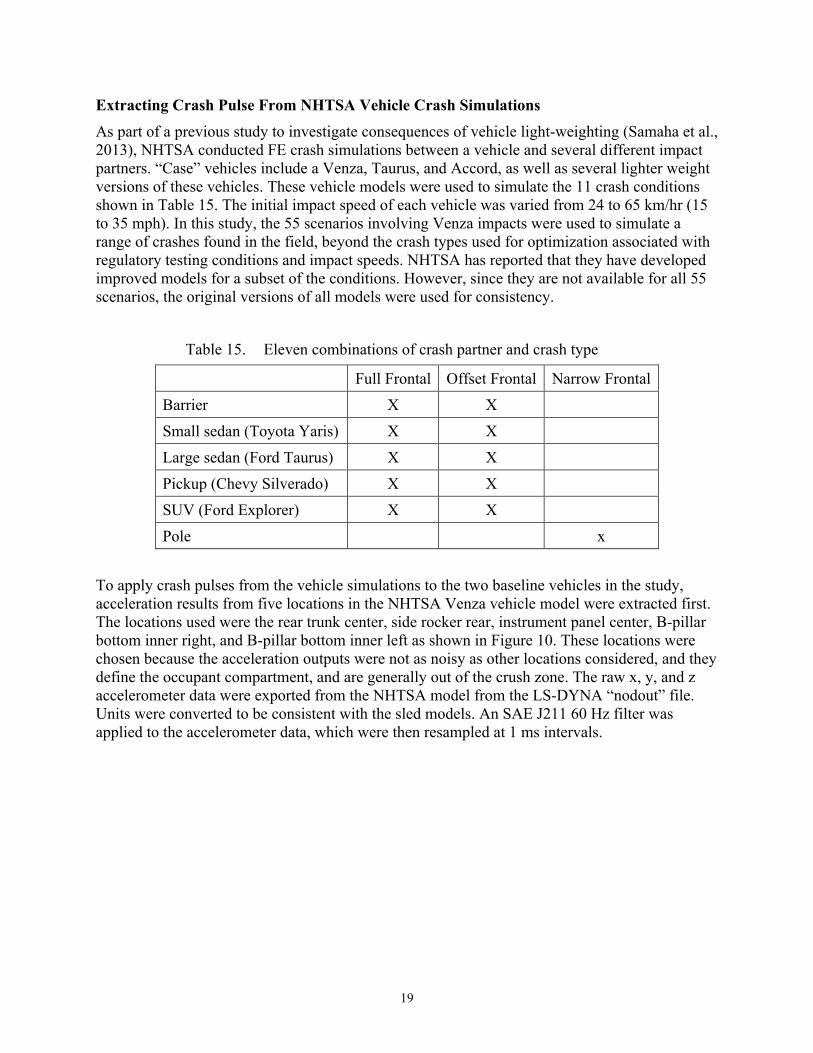
Extracting Crash Pulse From NHTSA Vehicle Crash Simulations As part of a previous study to investigate consequences of vehicle light-weighting (Samaha et al., 2013), NHTSA conducted FE crash simulations between a vehicle and several different impact partners. “Case” vehicles include a Venza, Taurus, and Accord, as well as several lighter weight versions of these vehicles. These vehicle models were used to simulate the 11 crash conditions shown in Table 15. The initial impact speed of each vehicle was varied from 24 to 65 km/hr (15 to 35 mph). In this study, the 55 scenarios involving Venza impacts were used to simulate a range of crashes found in the field, beyond the crash types used for optimization associated with regulatory testing conditions and impact speeds. NHTSA has reported that they have developed improved models for a subset of the conditions. However, since they are not available for all 55 scenarios, the original versions of all models were used for consistency.
Table 15. Eleven combinations of crash partner and crash type
Full Frontal Offset Frontal Narrow Frontal
Barrier X X
Small sedan (Toyota Yaris) X X
Large sedan (Ford Taurus) X X
Pickup (Chevy Silverado) X X
SUV (Ford Explorer) X X
Pole x
To apply crash pulses from the vehicle simulations to the two baseline vehicles in the study, acceleration results from five locations in the NHTSA Venza vehicle model were extracted first. The locations used were the rear trunk center, side rocker rear, instrument panel center, B-pillar bottom inner right, and B-pillar bottom inner left as shown in Figure 10. These locations were chosen because the acceleration outputs were not as noisy as other locations considered, and they define the occupant compartment, and are generally out of the crush zone. The raw x, y, and z accelerometer data were exported from the NHTSA model from the LS-DYNA “nodout” file. Units were converted to be consistent with the sled models. An SAE J211 60 Hz filter was applied to the accelerometer data, which were then resampled at 1 ms intervals.
20
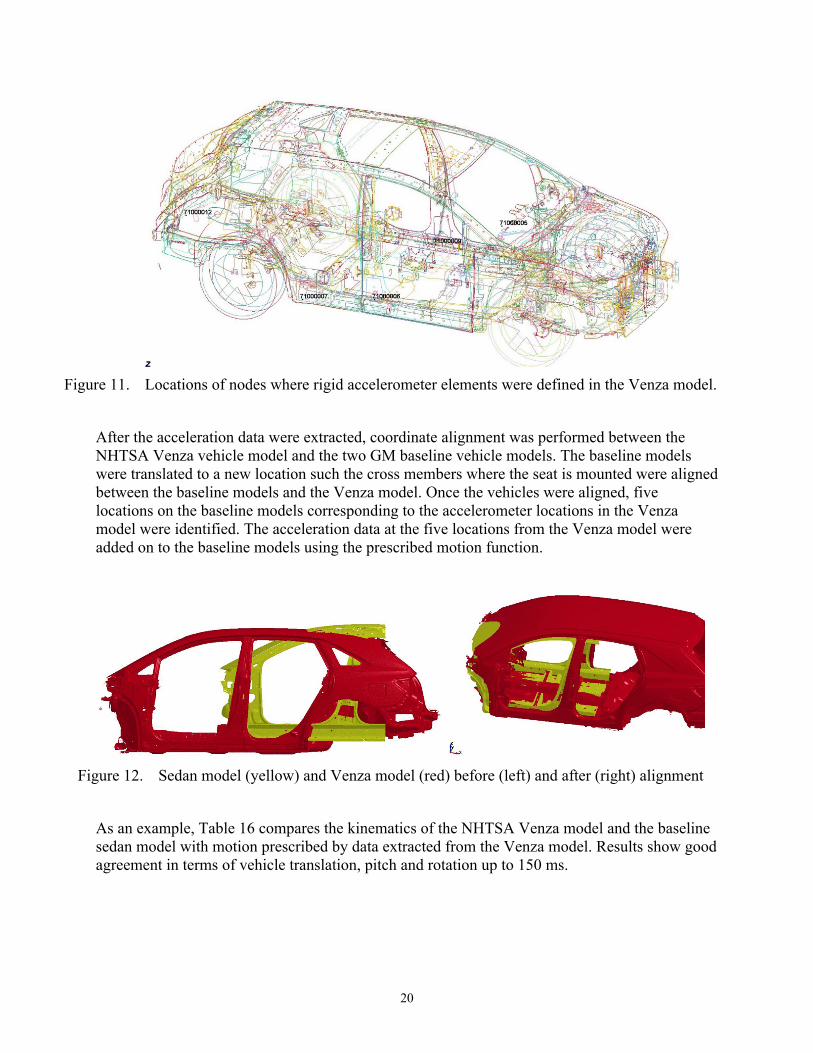
Figure 11. Locations of nodes where rigid accelerometer elements were defined in the Venza model.
After the acceleration data were extracted, coordinate alignment was performed between the NHTSA Venza vehicle model and the two GM baseline vehicle models. The baseline models were translated to a new location such the cross members where the seat is mounted were aligned between the baseline models and the Venza model. Once the vehicles were aligned, five locations on the baseline models corresponding to the accelerometer locations in the Venza model were identified. The acceleration data at the five locations from the Venza model were added on to the baseline models using the prescribed motion function.
Figure 12. Sedan model (yellow) and Venza model (red) before (left) and after (right) alignment
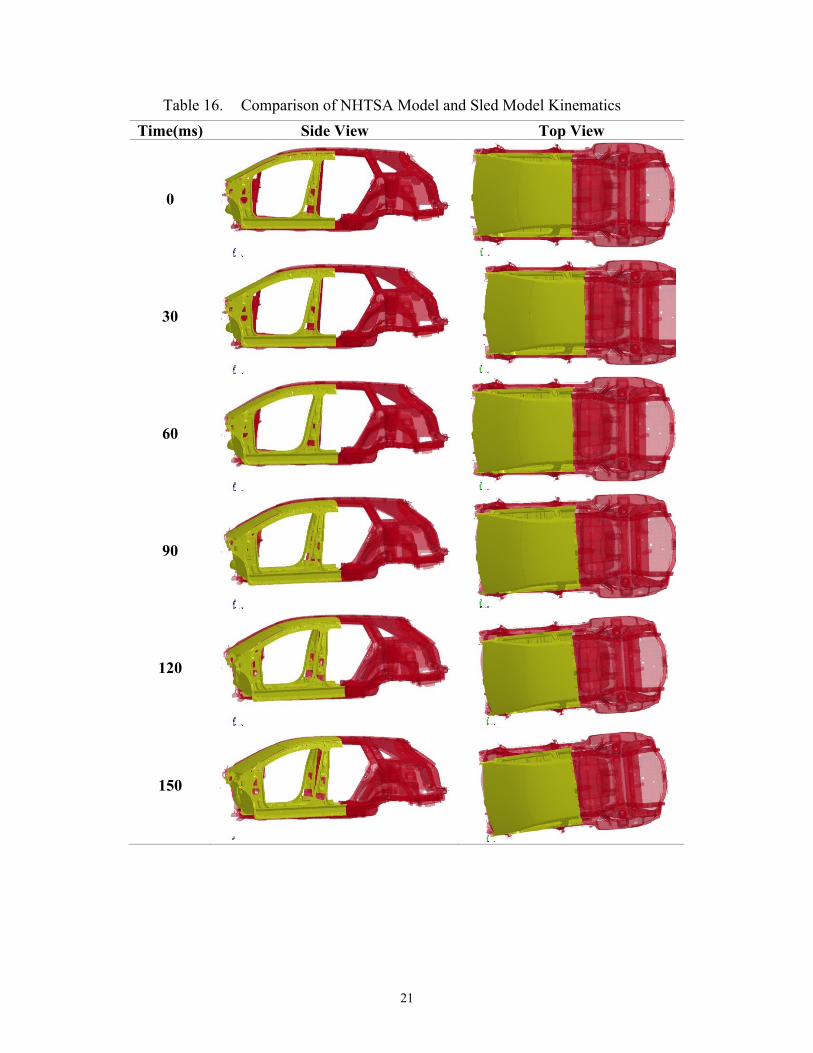
As an example, Table 16 compares the kinematics of the NHTSA Venza model and the baseline sedan model with motion prescribed by data extracted from the Venza model. Results show good agreement in terms of vehicle translation, pitch and rotation up to 150 ms.
21
Table 16. Comparison of NHTSA Model and Sled Model Kinematics Time(ms) Side View Top View
0
30
60
90
120
150
22
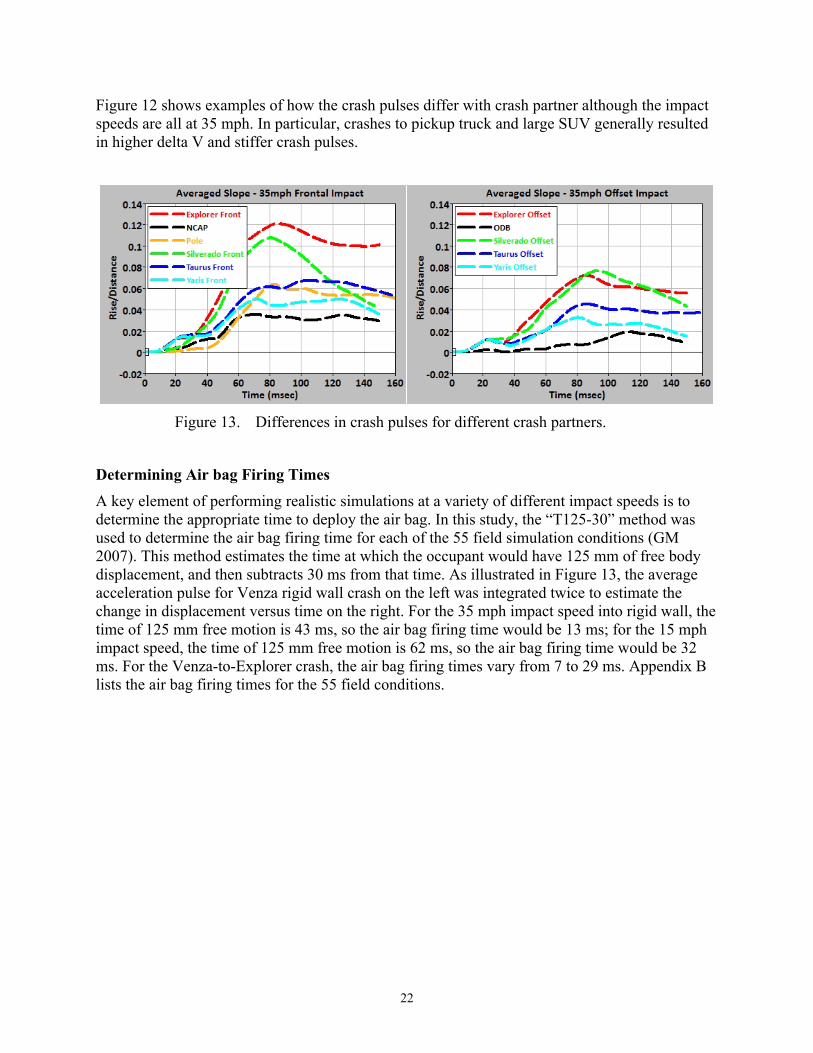
Figure 12 shows examples of how the crash pulses differ with crash partner although the impact speeds are all at 35 mph. In particular, crashes to pickup truck and large SUV generally resulted in higher delta V and stiffer crash pulses.
Figure 13. Differences in crash pulses for different crash partners.
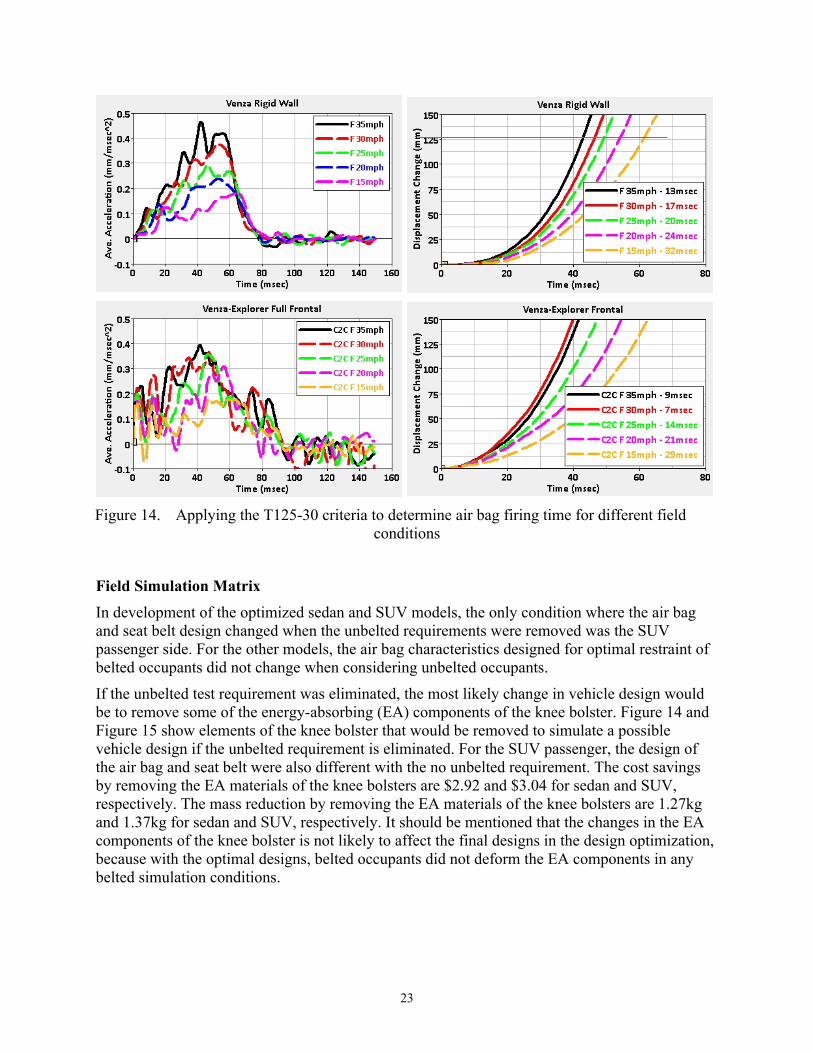
Determining Air bag Firing Times A key element of performing realistic simulations at a variety of different impact speeds is to determine the appropriate time to deploy the air bag. In this study, the “T125-30” method was used to determine the air bag firing time for each of the 55 field simulation conditions (GM 2007). This method estimates the time at which the occupant would have 125 mm of free body displacement, and then subtracts 30 ms from that time. As illustrated in Figure 13, the average acceleration pulse for Venza rigid wall crash on the left was integrated twice to estimate the change in displacement versus time on the right. For the 35 mph impact speed into rigid wall, the time of 125 mm free motion is 43 ms, so the air bag firing time would be 13 ms; for the 15 mph impact speed, the time of 125 mm free motion is 62 ms, so the air bag firing time would be 32 ms. For the Venza-to-Explorer crash, the air bag firing times vary from 7 to 29 ms. Appendix B lists the air bag firing times for the 55 field conditions.
23
Figure 14. Applying the T125-30 criteria to determine air bag firing time for different field
conditions
Field Simulation Matrix In development of the optimized sedan and SUV models, the only condition where the air bag and seat belt design changed when the unbelted requirements were removed was the SUV passenger side. For the other models, the air bag characteristics designed for optimal restraint of belted occupants did not change when considering unbelted occupants.
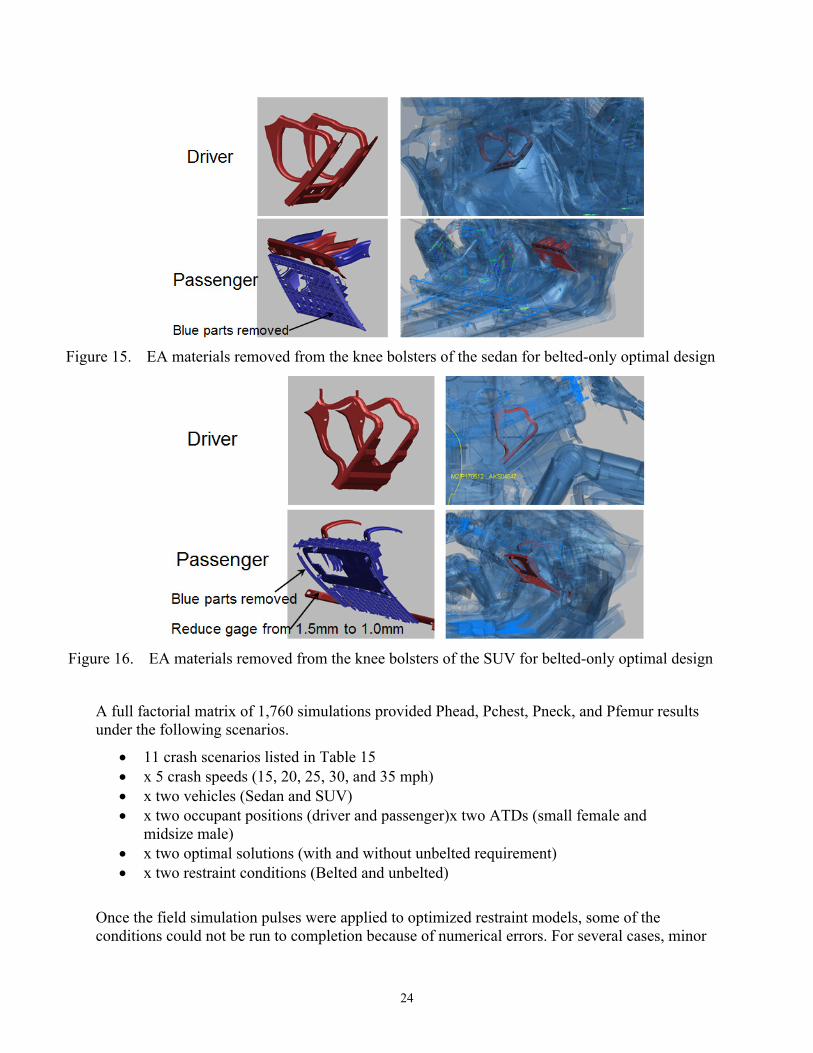
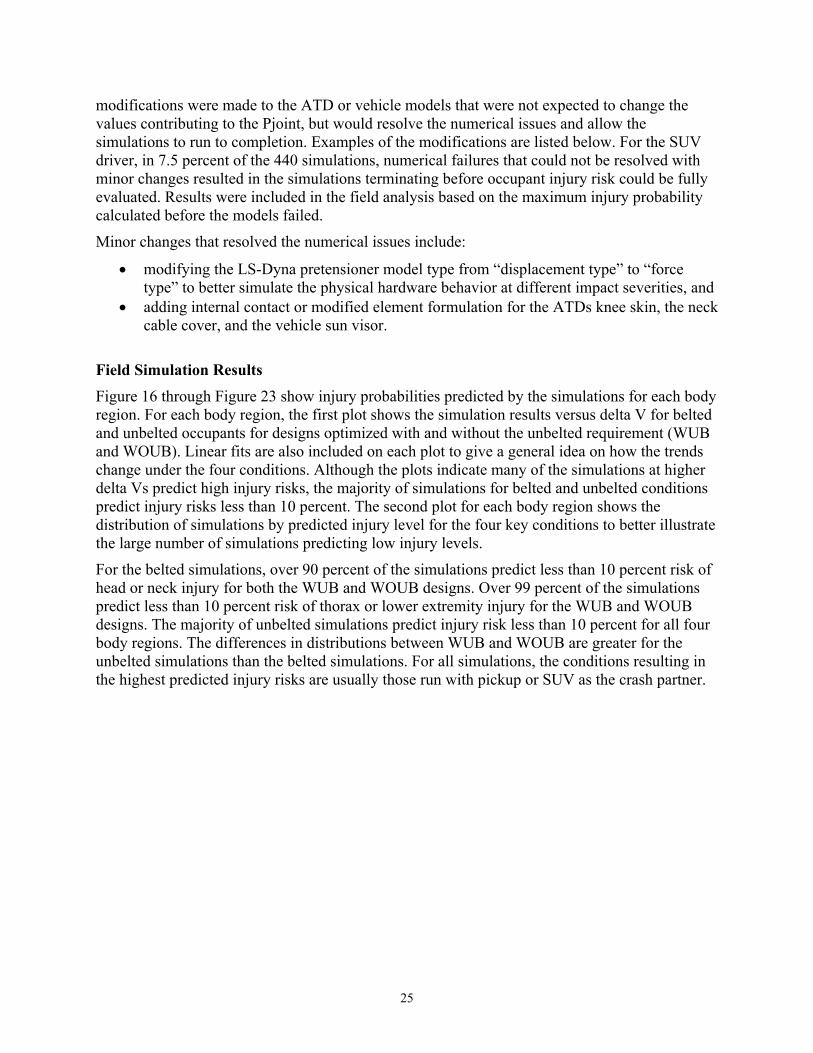
If the unbelted test requirement was eliminated, the most likely change in vehicle design would be to remove some of the energy-absorbing (EA) components of the knee bolster. Figure 14 and Figure 15 show elements of the knee bolster that would be removed to simulate a possible vehicle design if the unbelted requirement is eliminated. For the SUV passenger, the design of the air bag and seat belt were also different with the no unbelted requirement. The cost savings by removing the EA materials of the knee bolsters are $2.92 and $3.04 for sedan and SUV, respectively. The mass reduction by removing the EA materials of the knee bolsters are 1.27kg and 1.37kg for sedan and SUV, respectively. It should be mentioned that the changes in the EA components of the knee bolster is not likely to affect the final designs in the design optimization, because with the optimal designs, belted occupants did not deform the EA components in any belted simulation conditions.
24
Figure 15. EA materials removed from the knee bolsters of the sedan for belted-only optimal design
Figure 16. EA materials removed from the knee bolsters of the SUV for belted-only optimal design
A full factorial matrix of 1,760 simulations provided Phead, Pchest, Pneck, and Pfemur results under the following scenarios.
• 11 crash scenarios listed in Table 15 • x 5 crash speeds (15, 20, 25, 30, and 35 mph) • x two vehicles (Sedan and SUV) • x two occupant positions (driver and passenger)x two ATDs (small female and
midsize male) • x two optimal solutions (with and without unbelted requirement) • x two restraint conditions (Belted and unbelted)
Once the field simulation pulses were applied to optimized restraint models, some of the conditions could not be run to completion because of numerical errors. For several cases, minor
25
modifications were made to the ATD or vehicle models that were not expected to change the values contributing to the Pjoint, but would resolve the numerical issues and allow the simulations to run to completion. Examples of the modifications are listed below. For the SUV driver, in 7.5 percent of the 440 simulations, numerical failures that could not be resolved with minor changes resulted in the simulations terminating before occupant injury risk could be fully evaluated. Results were included in the field analysis based on the maximum injury probability calculated before the models failed.
Minor changes that resolved the numerical issues include:
• modifying the LS-Dyna pretensioner model type from “displacement type” to “force type” to better simulate the physical hardware behavior at different impact severities, and
• adding internal contact or modified element formulation for the ATDs knee skin, the neck cable cover, and the vehicle sun visor.
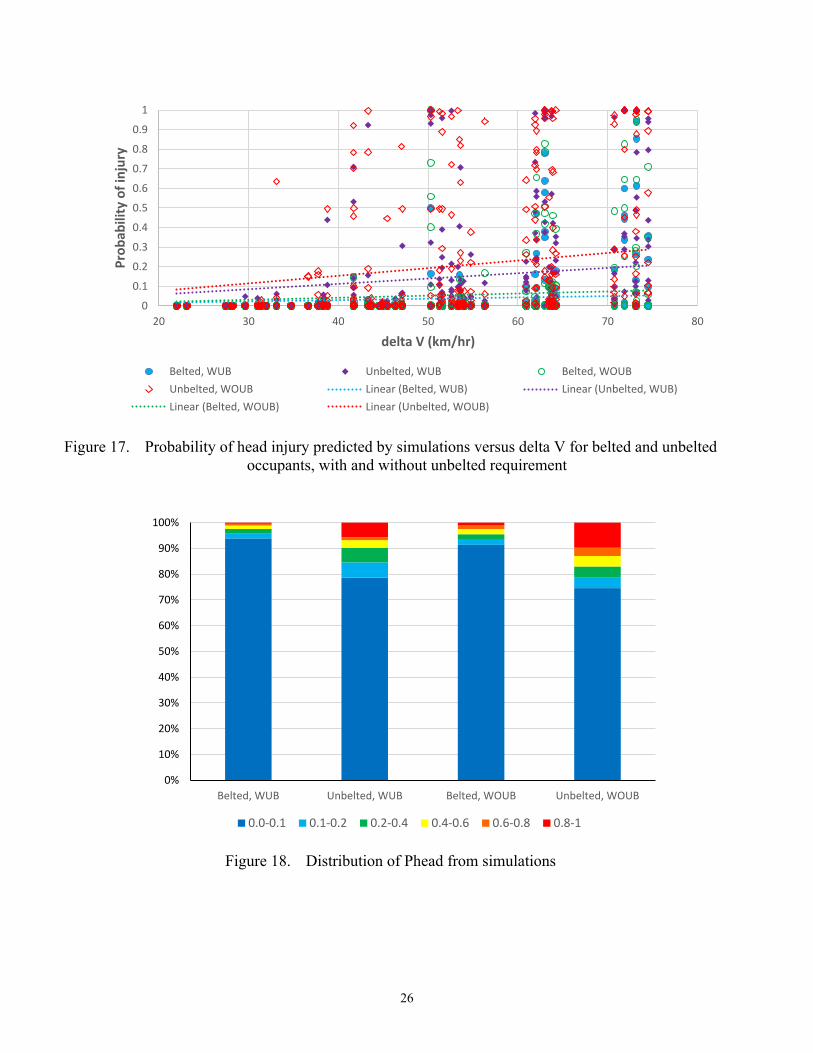
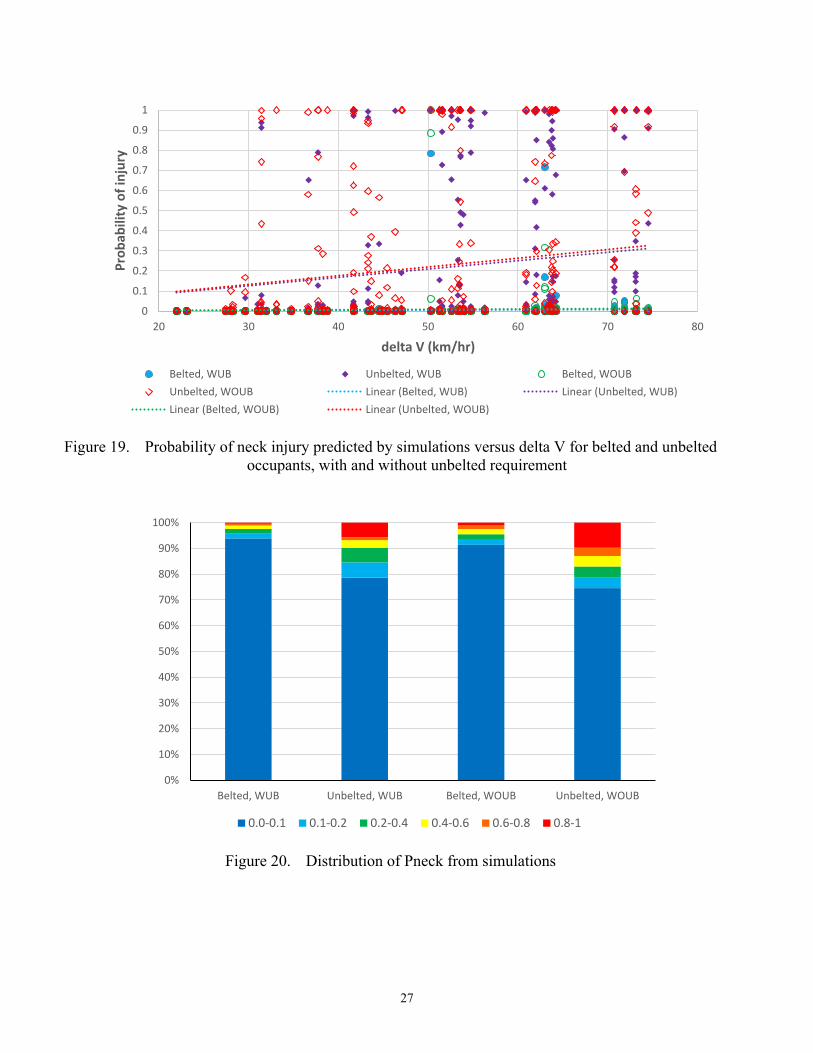
Field Simulation Results Figure 16 through Figure 23 show injury probabilities predicted by the simulations for each body region. For each body region, the first plot shows the simulation results versus delta V for belted and unbelted occupants for designs optimized with and without the unbelted requirement (WUB and WOUB). Linear fits are also included on each plot to give a general idea on how the trends change under the four conditions. Although the plots indicate many of the simulations at higher delta Vs predict high injury risks, the majority of simulations for belted and unbelted conditions predict injury risks less than 10 percent. The second plot for each body region shows the distribution of simulations by predicted injury level for the four key conditions to better illustrate the large number of simulations predicting low injury levels.
For the belted simulations, over 90 percent of the simulations predict less than 10 percent risk of head or neck injury for both the WUB and WOUB designs. Over 99 percent of the simulations predict less than 10 percent risk of thorax or lower extremity injury for the WUB and WOUB designs. The majority of unbelted simulations predict injury risk less than 10 percent for all four body regions. The differences in distributions between WUB and WOUB are greater for the unbelted simulations than the belted simulations. For all simulations, the conditions resulting in the highest predicted injury risks are usually those run with pickup or SUV as the crash partner.
26
Figure 17. Probability of head injury predicted by simulations versus delta V for belted and unbelted
occupants, with and without unbelted requirement
Figure 18. Distribution of Phead from simulations
0
0.1
0.2
0.3
0.4
0.5
0.6
0.7
0.8
0.9
1
20 30 40 50 60 70 80
Prob
abili
ty o
f inj
ury
delta V (km/hr)
Belted, WUB Unbelted, WUB Belted, WOUBUnbelted, WOUB Linear (Belted, WUB) Linear (Unbelted, WUB)Linear (Belted, WOUB) Linear (Unbelted, WOUB)
0%
10%
20%
30%
40%
50%
60%
70%
80%
90%
100%
Belted, WUB Unbelted, WUB Belted, WOUB Unbelted, WOUB
0.0-0.1 0.1-0.2 0.2-0.4 0.4-0.6 0.6-0.8 0.8-1
27
Figure 19. Probability of neck injury predicted by simulations versus delta V for belted and unbelted
occupants, with and without unbelted requirement
Figure 20. Distribution of Pneck from simulations
0
0.1
0.2
0.3
0.4
0.5
0.6
0.7
0.8
0.9
1
20 30 40 50 60 70 80
Prob
abili
ty o
f inj
ury
delta V (km/hr)
Belted, WUB Unbelted, WUB Belted, WOUBUnbelted, WOUB Linear (Belted, WUB) Linear (Unbelted, WUB)Linear (Belted, WOUB) Linear (Unbelted, WOUB)
0%
10%
20%
30%
40%
50%
60%
70%
80%
90%
100%
Belted, WUB Unbelted, WUB Belted, WOUB Unbelted, WOUB
0.0-0.1 0.1-0.2 0.2-0.4 0.4-0.6 0.6-0.8 0.8-1
28
Figure 21. Probability of chest injury (based on chest deflection) predicted by simulations versus
delta V for belted and unbelted occupants, with and without unbelted requirement
Figure 22. Distribution of Pchest from simulations
0
0.1
0.2
0.3
0.4
0.5
0.6
0.7
0.8
0.9
1
20 30 40 50 60 70 80
Prob
abili
ty o
f inj
ury
delta V (km/hr)
Belted, WUB Unbelted, WUB Belted, WOUBUnbelted, WOUB Linear (Belted, WUB) Linear (Unbelted, WUB)Linear (Belted, WOUB) Linear (Unbelted, WOUB)
0%
10%
20%
30%
40%
50%
60%
70%
80%
90%
100%
Belted, WUB Unbelted, WUB Belted, WOUB Unbelted, WOUB
0.0-0.1 0.1-0.2 0.2-0.4 0.4-0.6 0.6-0.8 0.8-1
29
Figure 23. Probability of lower extremity injury predicted by simulations versus delta V for belted
and unbelted occupants, with and without unbelted requirement
Figure 24. Distribution of Pfemur from simulations
0
0.1
0.2
0.3
0.4
0.5
0.6
0.7
0.8
0.9
1
20 30 40 50 60 70 80
Prob
abili
ty o
f inj
ury
delta V (km/hr)
Belted, WUB Unbelted, WUB Belted, WOUBUnbelted, WOUB Linear (Belted, WUB) Linear (Unbelted, WUB)Linear (Belted, WOUB) Linear (Unbelted, WOUB)
0%
10%
20%
30%
40%
50%
60%
70%
80%
90%
100%
Belted, WUB Unbelted, WUB Belted, WOUB Unbelted, WOUB
0.0-0.1 0.1-0.2 0.2-0.4 0.4-0.6 0.6-0.8 0.8-1
30
Injury differences for systems optimized with and without unbelted requirements
Original strategy The results from the field simulations were used to estimate how injury risk would change for belted and unbelted occupants if the unbelted requirement were eliminated. The original intent was to perform logistic regression using data from the 1,760 cases simulated to predict injury risk for each body region as a function of belt restraint use and design condition (with and without unbelted [WUB and WOUB]), while considering effects and interactions of delta V, restraint use, crash partner, and crash type. Figure 24 shows an example for head injury risk. A risk ratio curve would be calculated by dividing each pair of WUB and WOUB risk curves generated from the field FE simulations. It would then be applied to injury risk curves generated for each body region from NASS-CDS data to estimate how injury risk might change in the field if the unbelted requirement were eliminated.
Figure 25. Example of head injury risk curves developed from simulations for belted and unbelted
occupants, WUB and WOUB, for different crash types and crash partners. * indicates WOUB condition
Challenges arose using this method. The mathematical expressions for some conditions led to extremely low injury risk values at delta V levels below 30 km/hr. Thus dividing one curve by another led to extremely high values of risk ratios that were inconsistent with the overall trends seen in the simulations of minimal difference between simulations with and without unbelted requirements at lower delta V levels.
0%
10%
20%
30%
40%
50%
60%
70%
80%
90%
100%
20 25 30 35 40 45 50 55 60 65 70
Delta V (km/hr)
Phead
BFFFB BFFLS BFFPU BFFSUV BFFSS BNCPTBLOFB BLOLS BLOPU BLOSUV BLOSS BFFFB*BFFLS* BFFPU* BFFSUV* BFFSS* BNCPT* BLOFB*BLOLS* BLOPU* BLOSUV* BLOSS* UFFFB UFFLSUFFPU UFFSUV UFFSS UNCPT ULOFB ULOLSULOPU ULOSUV ULOSS UFFFB* UFFLS* UFFPU*UFFSUV* UFFSS* UNCPT* ULOFB* ULOLS* ULOPU*ULOSUV* ULOSS*
Dashed: unbelted Solid: belted Thin: with knee bolster Thick: without knee bolster Dark: full frontal Light: offset frontal Small Sedan Large Sedan Pickup SUV Barrier Pole
31
For this original attempt at developing FE-simulation-based injury risk curves, each simulation was given equal weight. It may be more appropriate to develop weighting factors consistent with the frequency of crashes at each delta V severity and apply those before developing additional FE-simulation-based injury risk curves. Time constraints for the project did not allow further pursuit of this approach.
In addition, some of the most severe simulations had high predicted levels of head and neck injury risk because of head interaction with the vehicle A-pillar. The sedan and SUV models did not include the side curtain air bags that the vehicles would be equipped with, which if deployed would likely mitigate the problem of interaction with the A-pillar based on the curtain air bag designs in these vehicles. The models also were not correlated for impact conditions in which contact to the A-pillar occurred. In addition, the duration of some of the lower delta V simulations prevented completion of the occupant interaction and may have resulted in under-predicting the injury reference values.
Revised Strategies Several alternate strategies were explored for using the FE simulation data to estimate how risk would change for the designs WUB and WOUB requirements. The first revised strategy discarded simulations predicting 100 percent risk, and took an average of all the injury risks for each of the four belt/design conditions and each vehicle type (sedan and SUV). Risk ratios were calculated by dividing the mean values for the WOUB condition by the WUB condition. Risk ratios used with this approach are shown in Figure 25 (and presented in the March 2015 briefing).
Figure 26. Risk ratios calculated by averaging risk by vehicle type after discarding simulations
predicting 100 percent risk
1.0
3.9
1.1 0.8 1.0
1.3
2.0
1.2
1.8 1.5
0.9 0.8
1.8 1.4
2.4
1.2
0.0
0.5
1.0
1.5
2.0
2.5
3.0
3.5
4.0
4.5
head neck thorax lower ext
Aver
age
risk
ratio
sedan, belted sedan, unbelted SUV belted SUV, unbelted
32
This approach still led to some risk ratio calculations inconsistent with overall trends. For example, the belted sedan condition without the unbelted requirement had a risk ratio of 3.9 compared to simulations with the unbelted requirement (because all of the risks are so low) even though very few simulations produced worse outcomes. Since each simulation result was given equal weight, values from the most severe simulation conditions contributed as much as those from the least severe simulations, even though the lower severity crashes in the field are much more likely to occur.
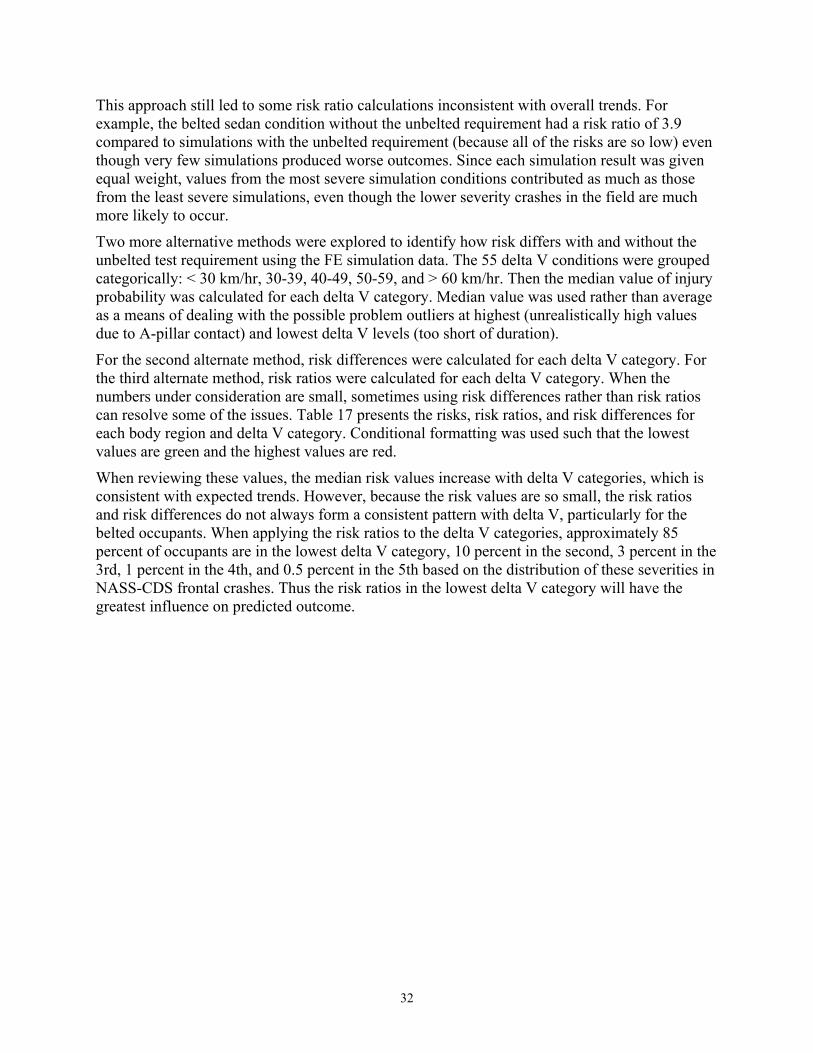
Two more alternative methods were explored to identify how risk differs with and without the unbelted test requirement using the FE simulation data. The 55 delta V conditions were grouped categorically: < 30 km/hr, 30-39, 40-49, 50-59, and > 60 km/hr. Then the median value of injury probability was calculated for each delta V category. Median value was used rather than average as a means of dealing with the possible problem outliers at highest (unrealistically high values due to A-pillar contact) and lowest delta V levels (too short of duration).
For the second alternate method, risk differences were calculated for each delta V category. For the third alternate method, risk ratios were calculated for each delta V category. When the numbers under consideration are small, sometimes using risk differences rather than risk ratios can resolve some of the issues. Table 17 presents the risks, risk ratios, and risk differences for each body region and delta V category. Conditional formatting was used such that the lowest values are green and the highest values are red.
When reviewing these values, the median risk values increase with delta V categories, which is consistent with expected trends. However, because the risk values are so small, the risk ratios and risk differences do not always form a consistent pattern with delta V, particularly for the belted occupants. When applying the risk ratios to the delta V categories, approximately 85 percent of occupants are in the lowest delta V category, 10 percent in the second, 3 percent in the 3rd, 1 percent in the 4th, and 0.5 percent in the 5th based on the distribution of these severities in NASS-CDS frontal crashes. Thus the risk ratios in the lowest delta V category will have the greatest influence on predicted outcome.
33
Table 17. Risks, risk ratios, and risk differences by delta V category and body region predicted using median values of simulation results
Delta V (km/hr)
Belted risk Unbelted risk Risk ratio: WOUB/WUB Risk difference: WOUB-WUB
WUB WOUB WUB WOUB Belted Unbelted Belted Unbelted
Head
<30 0.00000 0.00000 0.00000 0.00000 0.47 1.29 -0.000000007 0.000000002
30-39 0.00000 0.00000 0.00000 0.00000 0.82 3.02 -0.000000078 0.000001442
40-49 0.00001 0.00001 0.00048 0.00065 0.56 1.35 -0.000006335 0.000171143
50-59 0.00011 0.00010 0.01741 0.01666 0.90 0.96 -0.000010876 -0.000755025
60+ 0.00351 0.00427 0.13486 0.21657 1.22 1.61 0.000759429 0.081711316
Nec
k
<30 0.00009 0.00009 0.00012 0.00011 1.01 0.91 0.000001259 -0.000010191
30-39 0.00013 0.00014 0.00032 0.00051 1.09 1.61 0.000011368 0.000193030
40-49 0.00022 0.00024 0.00079 0.00489 1.07 6.20 0.000016307 0.004104628
50-59 0.00037 0.00040 0.01640 0.01693 1.09 1.03 0.000031928 0.000537482
60+ 0.00123 0.00119 0.48916 0.95405 0.97 1.95 -0.000039936 0.464890173
Ches
t
<30 0.01585 0.01571 0.00101 0.00134 0.99 1.32 -0.000136991 0.000325820
30-39 0.02197 0.02370 0.00228 0.00351 1.08 1.54 0.001729390 0.001224886
40-49 0.03102 0.03182 0.00707 0.01986 1.03 2.81 0.000795091 0.012794987
50-59 0.04381 0.04458 0.01071 0.02302 1.02 2.15 0.000774217 0.012303391
60+ 0.05339 0.05130 0.04009 0.10543 0.96 2.63 -0.002087440 0.065340587
KTH
<30 0.00349 0.00353 0.02257 0.01043 1.01 0.46 0.000037675 -0.012139698
30-39 0.00369 0.00348 0.03437 0.01834 0.94 0.53 -0.000213252 -0.016022602
40-49 0.00428 0.00404 0.05565 0.04062 0.94 0.73 -0.000248150 -0.015029232
50-59 0.00539 0.00444 0.08700 0.09028 0.82 1.04 -0.000945790 0.003273093
60+ 0.00741 0.00667 0.22055 0.39542 0.90 1.79 -0.000744889 0.174869503
Application to NASS-CDS Data
Injury risk curves For the current project, frontal crashes in NASS-CDS from 2002 to 2012 were used to develop injury risk curves as well as to provide a standard population on which to perform statistical simulations of the effect of different belt use rates and the estimated change of removing the unbelted requirement. Crashes with known delta V and occupant restraint were included. Vehicles older than 10 years at the time of the crash were excluded to provide consistency with more recent data collection strategies. Code provided by NHTSA to categorize frontal crash type (developed for another project) was applied to the dataset (Hallman et al., 2011). The number of unweighted cases was 27,367 and the number of weighted cases was 8,463,603. First, injury risk curves were developed using logistic regression to predict risk of injury as a function of delta V, belt use, crash partner (barrier, pole/tree, small sedan, large sedan, pickup, SUV, and crash type (full frontal, narrow/center, left offset, right offset, left SOI, right SOI). Main effects and interactions were considered. The following injuries and severities were used to predict injury risk for the four body regions currently regulated.
34
• MAIS3+ Head and face injuries • MAIS3+ Neck and cervical spine injuries • MAIS3+ Thorax injuries • MAIS2+ Knee, thigh, and hip injuries
The equation to calculate injury risk developed for this study is:
• P=1/{1+EXP[-(intercept+ ln(dV) x (A + Bn x crash type + Cn x crash partner + D x belt use) + En x (crash partner) + Fn x (crash type) + Gn x (crash partner) x (crash type) + belt use x (Hn +Jn x crash type + Kn * crash partner) )]}
The coefficients for each injury risk curve are attached in Appendix C.
Other significant parameters were considered as predictors, such as occupant position and vehicle type. However, these were not significant predictors of injury once the crash type and crash partner were considered. Though age is a strong predictor of injury, it was deliberately not explicitly included in the model because there is no way to use FE simulations with the small female and midsize male ATDs to predict how the effect of WOUB would vary with age.
Performing statistical simulations using NASS-CDS frontal crashes as standard population Occupants in frontal crashes from the 2002 to 2012 NASS-CDS database were used as the standard population to explore how different belt use rates and estimated differences in injury risk (based on FE simulations optimized with and without the unbelted requirement) might change overall injury trends. To begin, the NASS-CDS dataset of frontal occupants was exported to an Excel spreadsheet to allow simulation. A portion of an example spreadsheet is shown in Table 18 for reference. To perform the calculations, the following information is included for each occupant
• Delta V • Crash partner • Crash type • Belt restraint use • NASS-CDS weighting factor (ratwgt)
Separate worksheets were used for each occupant body region. The coefficients for the injury risk curve were imported into each relevant spreadsheet from Appendix C (highlighted in cyan in Table 18). In each row of the spreadsheet, the expression to calculate risk of injury was used with these coefficients and each occupant’s condition to estimate each individual’s estimating risk of injury (blue column of Table 18; formula of blue column overlaid in blue text box). For example, using the equation and coefficients, the risk of a belted occupant in a right SOI crash into a large sedan at a delta V of 17 km/hr is 0.09 percent. Each occupant’s injury risk was multiplied by the ratwgt value as seen in the peach column; therefore occupants with high ratwgt values have correspondingly high weighted risks. These weighted injury risks were summed at the top (pink cells), and divided by the sum of all the ratwgt values (green cells). This produces an overall baseline risk of injury to NASS-CDS frontal crash population of 0.64 percent (yellow) with the combination of delta V, belt use rates, crash partners, and crash types seen in the dataset.
35
Now statistical estimations can be performed. Injury risk for a 100 percent belted population is calculated by changing all the unbelted occupants to belted occupants mathematically (turning their 0 belt use into 1), weighting each risk, summing weighted risks, and dividing by sum of weights. Injury risk for a 100 percent unbelted occupant population is calculated by changing all the belted occupants to unbelted occupants mathematically (turning all the 1 belt use into 0) and following the same summing and weighting procedure. Estimates of injury risk for intermediate rates of belt use are calculated by a weighted average of the 100 percent and 0 percent belt use rate risks. For example, effects of 95 percent belt use are determined by adding 95 percent of each occupant’s 100 percent belt use injury risk to 5 percent of each occupant’s 100 percent unbelted injury risk.
Estimating the effect of the changes in injury with and without the unbelted requirement were performed using three alternate strategies described previously. The first alternate strategy used the risk ratio calculated for the sedan for passenger cars and the risk ratio calculated for the SUV for occupants in other vehicle types. So each occupant’s weighted risk was multiplied by the relevant risk ratio depending on vehicle type; values were summed and divided by total weight to estimate the total population risk if unbelted requirements were removed. The second alternate method added the belted risk difference to each occupant’s baseline 100 percent belt use risk, using the appropriate risk difference based on the occupant’s delta V; the same was done for the unbelted risk difference and baseline 0 percent belt use risk. These two columns could then be weighted to account for intermediate belt use rates. The third alternate method used applied delta V risk ratios to each occupant’s belted and unbelted baseline injury risk (purple cells in Table 18).

36
Table 18. Example spreadsheet used to apply injury risk curves and evaluate risk difference effects using NASS-CDS occupants as standard population
SS Belt NC LS LOLS LSLS ROLS RSLS NCPU LOPU LSPU ROPU RSPU NCPT LOPT LSPT ROPT
-9.556 -1.4962 0.3794 0.7909 1.4948 -1.1014 2.6779 -3.7524 0.5808 1.5402 -3.528 2.6446 -1.736 0.6323 1.9265 -1.6415
dv1 dv2 dv3 dv4 dv5
sum of weights belted 0.991357 1.078701 1.025629 1.017674 0.960903 8463603 unbelted 1.321427 1.536589 2.810949 2.148464 2.630025 overall risk 0.64%
sum 54424
lndv BeltUse Full Frontal
Center Offset
Left Offset Left SOI Right
Offset Right SOI Full Barrier
Large Sedan
Pick-up Pole/tree SUV Small
Sedan Baseline Risk Weighted
3.97029 0 0 0 0 0 0 1 0 0 0 0 0 0 0.90% 4.64%
3.7612 0 0 0 0 0 0 1 0 0 0 0 1 0 3.33% 54.38%
3.97029 0 0 0 0 0 0 1 0 1 0 0 0 0 13.28% 2275.67%
3.97029 0 0 0 0 0 0 1 0 1 0 0 0 0 13.28% 2275.67%
2.30259 0 0 0 0 0 0 1 0 1 0 0 0 0 0.15% 14.36%
3.98898 0 0 1 0 0 0 0 0 0 0 1 0 0 13.22% 2293.62%
3.09104 0 1 0 0 0 0 0 0 0 0 0 0 1 0.15% 10.07%
3.46574 0 0 0 1 0 0 0 0 1 0 0 0 0 1.54% 99.44%
3.29584 0 0 0 0 0 1 0 0 0 0 0 1 0 0.36% 17.61%
3.29584 0 0 0 1 0 0 0 0 0 0 0 0 1 1.15% 121.31%
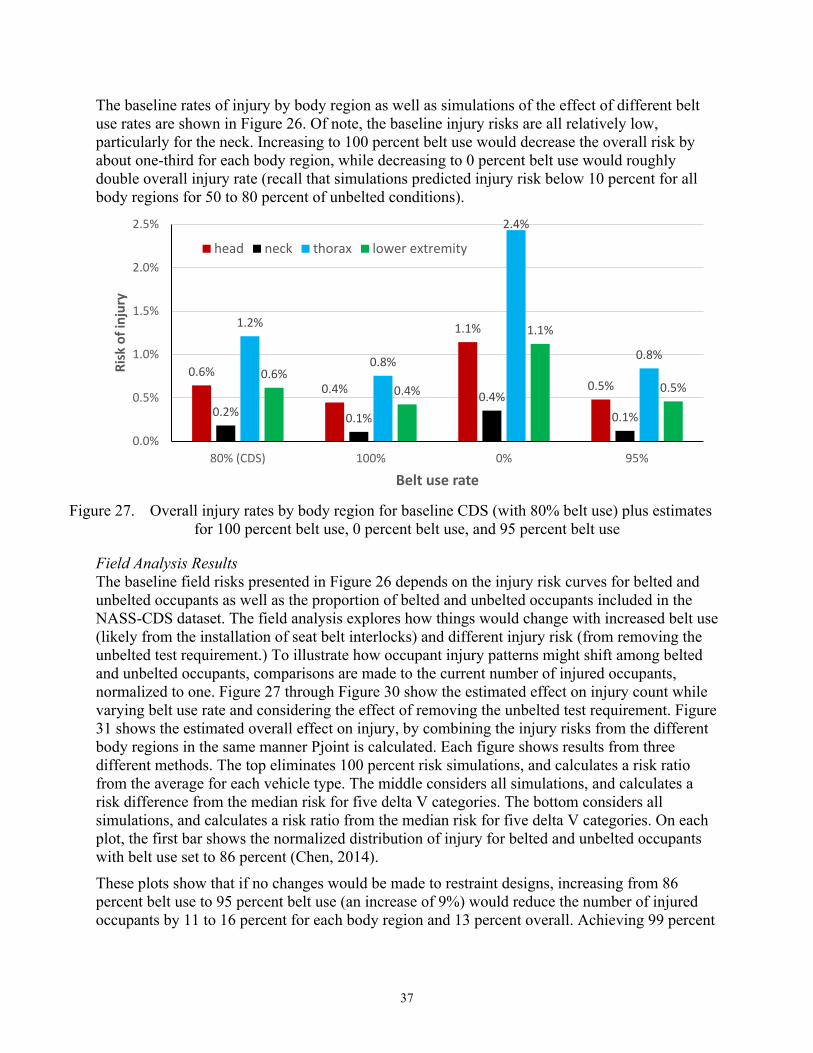
37
The baseline rates of injury by body region as well as simulations of the effect of different belt use rates are shown in Figure 26. Of note, the baseline injury risks are all relatively low, particularly for the neck. Increasing to 100 percent belt use would decrease the overall risk by about one-third for each body region, while decreasing to 0 percent belt use would roughly double overall injury rate (recall that simulations predicted injury risk below 10 percent for all body regions for 50 to 80 percent of unbelted conditions).
Figure 27. Overall injury rates by body region for baseline CDS (with 80% belt use) plus estimates
for 100 percent belt use, 0 percent belt use, and 95 percent belt use
Field Analysis Results The baseline field risks presented in Figure 26 depends on the injury risk curves for belted and unbelted occupants as well as the proportion of belted and unbelted occupants included in the NASS-CDS dataset. The field analysis explores how things would change with increased belt use (likely from the installation of seat belt interlocks) and different injury risk (from removing the unbelted test requirement.) To illustrate how occupant injury patterns might shift among belted and unbelted occupants, comparisons are made to the current number of injured occupants, normalized to one. Figure 27 through Figure 30 show the estimated effect on injury count while varying belt use rate and considering the effect of removing the unbelted test requirement. Figure 31 shows the estimated overall effect on injury, by combining the injury risks from the different body regions in the same manner Pjoint is calculated. Each figure shows results from three different methods. The top eliminates 100 percent risk simulations, and calculates a risk ratio from the average for each vehicle type. The middle considers all simulations, and calculates a risk difference from the median risk for five delta V categories. The bottom considers all simulations, and calculates a risk ratio from the median risk for five delta V categories. On each plot, the first bar shows the normalized distribution of injury for belted and unbelted occupants with belt use set to 86 percent (Chen, 2014).
These plots show that if no changes would be made to restraint designs, increasing from 86 percent belt use to 95 percent belt use (an increase of 9%) would reduce the number of injured occupants by 11 to 16 percent for each body region and 13 percent overall. Achieving 99 percent
0.6% 0.4%
1.1%
0.5%
0.2% 0.1%
0.4% 0.1%
1.2%
0.8%
2.4%
0.8% 0.6%
0.4%
1.1%
0.5%
0.0%
0.5%
1.0%
1.5%
2.0%
2.5%
80% (CDS) 100% 0% 95%
Risk
of i
njur
y
Belt use rate
head neck thorax lower extremity
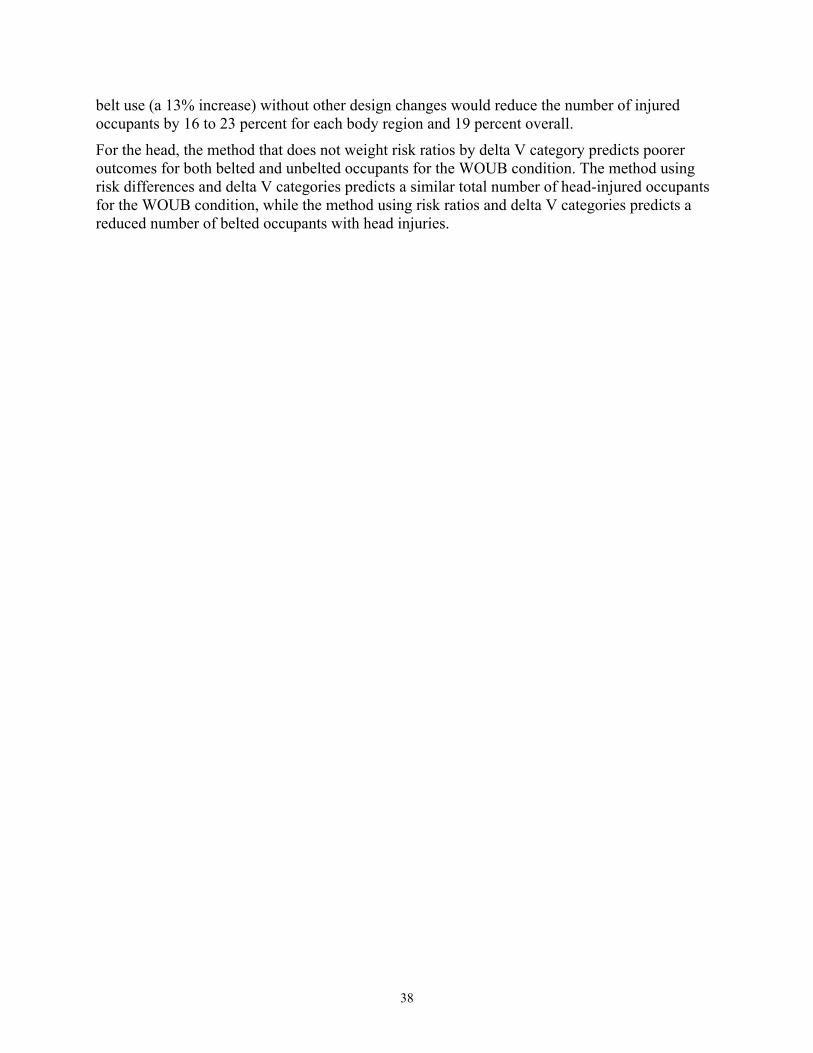
38
belt use (a 13% increase) without other design changes would reduce the number of injured occupants by 16 to 23 percent for each body region and 19 percent overall.
For the head, the method that does not weight risk ratios by delta V category predicts poorer outcomes for both belted and unbelted occupants for the WOUB condition. The method using risk differences and delta V categories predicts a similar total number of head-injured occupants for the WOUB condition, while the method using risk ratios and delta V categories predicts a reduced number of belted occupants with head injuries.
39
Figure 28. Effect of varying belt use rate and eliminating unbelted test requirement on head injury,
normalized to current number of occupants sustaining head injury at 86 percent belt use using three methods of estimation
0.0
0.2
0.4
0.6
0.8
1.0
1.2
1.4
86% 95% 99% 86% 95% 99%
Current WOUB
Head injury counts (briefing), average, truncated, risk ratio
Belted Unbelted1.0
.89 .84 1.27 1.13 1.07
0.0
0.2
0.4
0.6
0.8
1.0
1.2
1.4
86% 95% 99% 86% 95% 99%
Current WOUB
Head injury counts, risk difference, median, dV
Belted Unbelted
1.0 .89 .84 1.02 .89 .84
0.0
0.2
0.4
0.6
0.8
1.0
1.2
86% 95% 99% 86% 95% 99%
Current WOUB
Head injury counts, risk ratio, median, dV
Belted Unbelted
1.0 .89 .84 .60 .47 .42
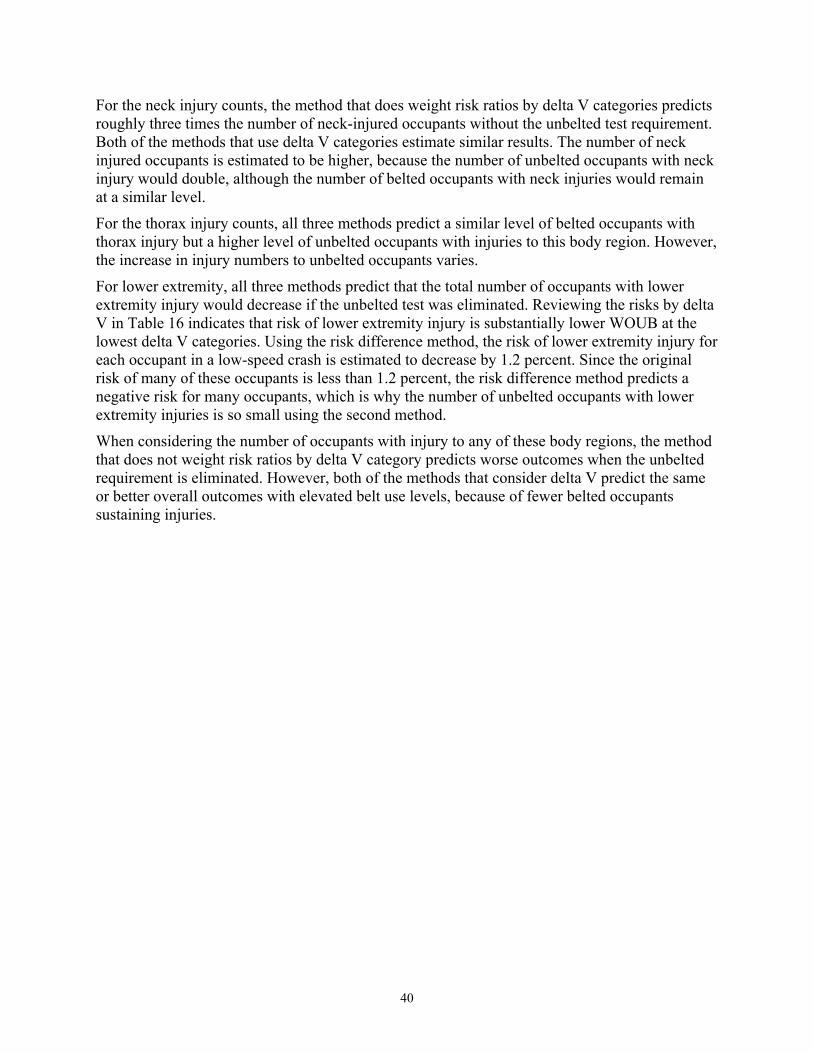
40
For the neck injury counts, the method that does weight risk ratios by delta V categories predicts roughly three times the number of neck-injured occupants without the unbelted test requirement. Both of the methods that use delta V categories estimate similar results. The number of neck injured occupants is estimated to be higher, because the number of unbelted occupants with neck injury would double, although the number of belted occupants with neck injuries would remain at a similar level.
For the thorax injury counts, all three methods predict a similar level of belted occupants with thorax injury but a higher level of unbelted occupants with injuries to this body region. However, the increase in injury numbers to unbelted occupants varies.
For lower extremity, all three methods predict that the total number of occupants with lower extremity injury would decrease if the unbelted test was eliminated. Reviewing the risks by delta V in Table 16 indicates that risk of lower extremity injury is substantially lower WOUB at the lowest delta V categories. Using the risk difference method, the risk of lower extremity injury for each occupant in a low-speed crash is estimated to decrease by 1.2 percent. Since the original risk of many of these occupants is less than 1.2 percent, the risk difference method predicts a negative risk for many occupants, which is why the number of unbelted occupants with lower extremity injuries is so small using the second method.
When considering the number of occupants with injury to any of these body regions, the method that does not weight risk ratios by delta V category predicts worse outcomes when the unbelted requirement is eliminated. However, both of the methods that consider delta V predict the same or better overall outcomes with elevated belt use levels, because of fewer belted occupants sustaining injuries.
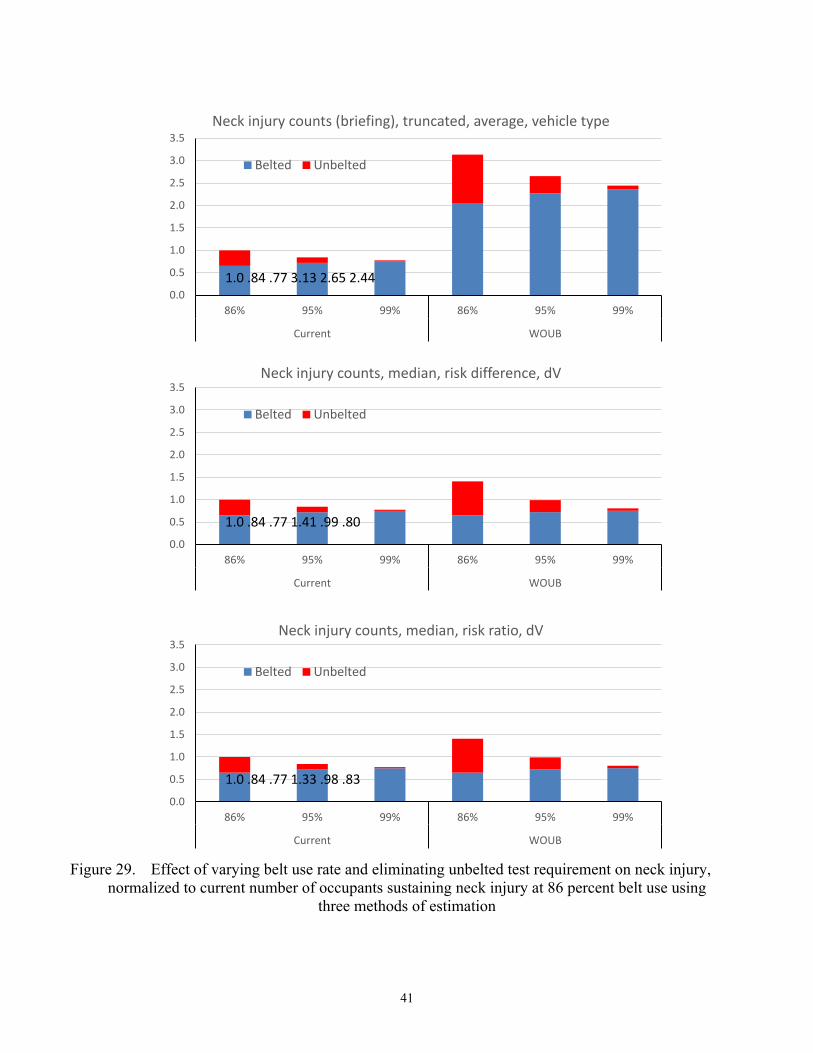
41
Figure 29. Effect of varying belt use rate and eliminating unbelted test requirement on neck injury,
normalized to current number of occupants sustaining neck injury at 86 percent belt use using three methods of estimation
0.0
0.5
1.0
1.5
2.0
2.5
3.0
3.5
86% 95% 99% 86% 95% 99%
Current WOUB
Neck injury counts (briefing), truncated, average, vehicle type
Belted Unbelted
1.0 .84 .77 3.13 2.65 2.44
0.0
0.5
1.0
1.5
2.0
2.5
3.0
3.5
86% 95% 99% 86% 95% 99%
Current WOUB
Neck injury counts, median, risk difference, dV
Belted Unbelted
1.0 .84 .77 1.41 .99 .80
0.0
0.5
1.0
1.5
2.0
2.5
3.0
3.5
86% 95% 99% 86% 95% 99%
Current WOUB
Neck injury counts, median, risk ratio, dV
Belted Unbelted
1.0 .84 .77 1.33 .98 .83
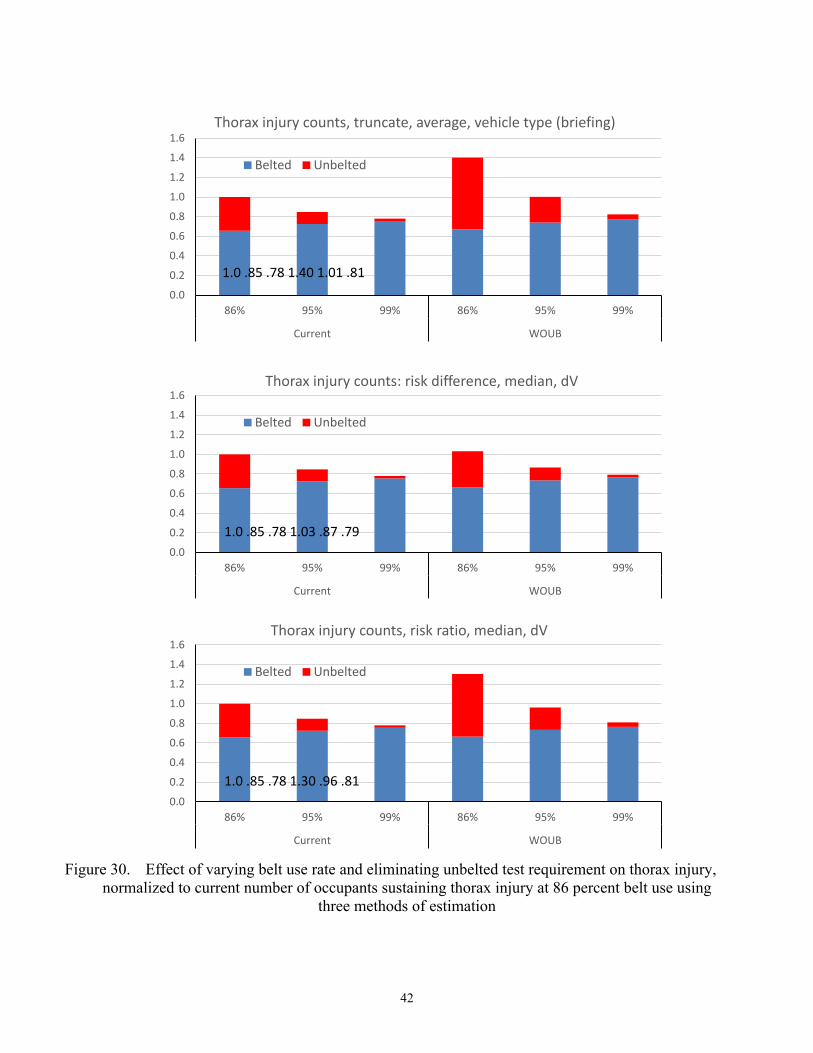
42
Figure 30. Effect of varying belt use rate and eliminating unbelted test requirement on thorax injury,
normalized to current number of occupants sustaining thorax injury at 86 percent belt use using three methods of estimation
0.0
0.2
0.4
0.6
0.8
1.0
1.2
1.4
1.6
86% 95% 99% 86% 95% 99%
Current WOUB
Thorax injury counts, truncate, average, vehicle type (briefing)
Belted Unbelted
1.0 .85 .78 1.40 1.01 .81
0.0
0.2
0.4
0.6
0.8
1.0
1.2
1.4
1.6
86% 95% 99% 86% 95% 99%
Current WOUB
Thorax injury counts: risk difference, median, dV
Belted Unbelted
1.0 .85 .78 1.03 .87 .79
0.0
0.2
0.4
0.6
0.8
1.0
1.2
1.4
1.6
86% 95% 99% 86% 95% 99%
Current WOUB
Thorax injury counts, risk ratio, median, dV
Belted Unbelted
1.0 .85 .78 1.30 .96 .81
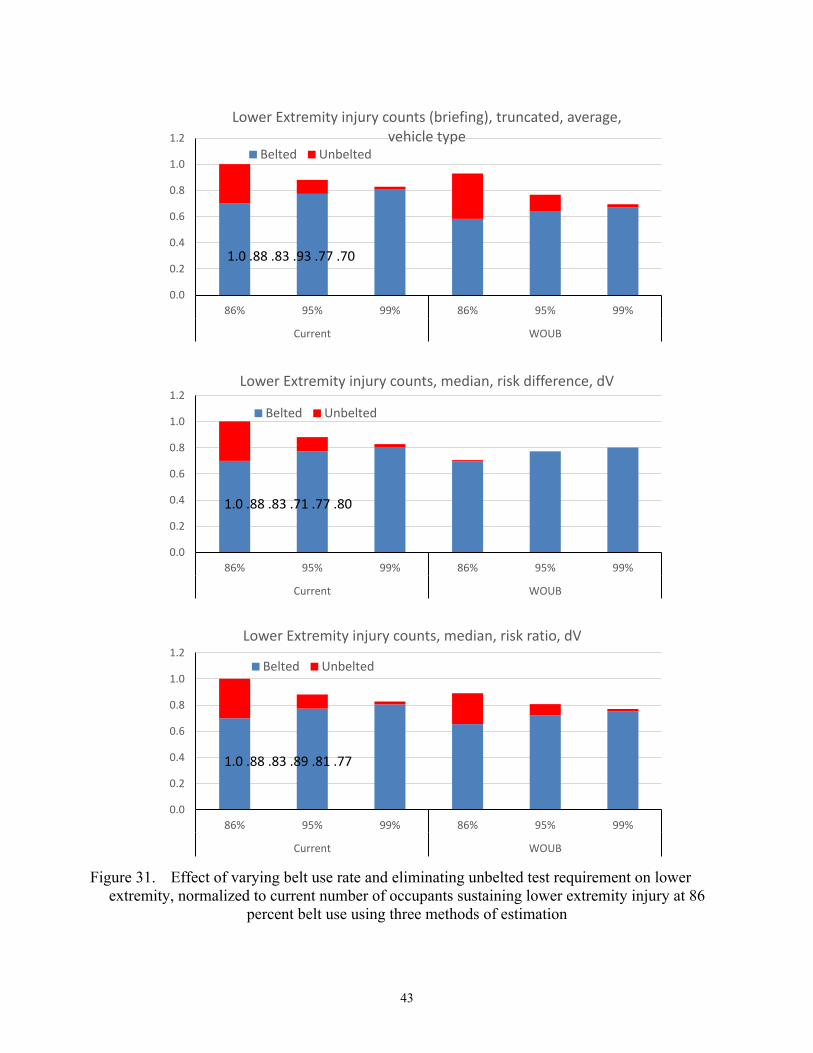
43
Figure 31. Effect of varying belt use rate and eliminating unbelted test requirement on lower
extremity, normalized to current number of occupants sustaining lower extremity injury at 86 percent belt use using three methods of estimation
0.0
0.2
0.4
0.6
0.8
1.0
1.2
86% 95% 99% 86% 95% 99%
Current WOUB
Lower Extremity injury counts (briefing), truncated, average, vehicle type
Belted Unbelted
1.0 .88 .83 .93 .77 .70
0.0
0.2
0.4
0.6
0.8
1.0
1.2
86% 95% 99% 86% 95% 99%
Current WOUB
Lower Extremity injury counts, median, risk difference, dV
Belted Unbelted
1.0 .88 .83 .71 .77 .80
0.0
0.2
0.4
0.6
0.8
1.0
1.2
86% 95% 99% 86% 95% 99%
Current WOUB
Lower Extremity injury counts, median, risk ratio, dV
Belted Unbelted
1.0 .88 .83 .89 .81 .77
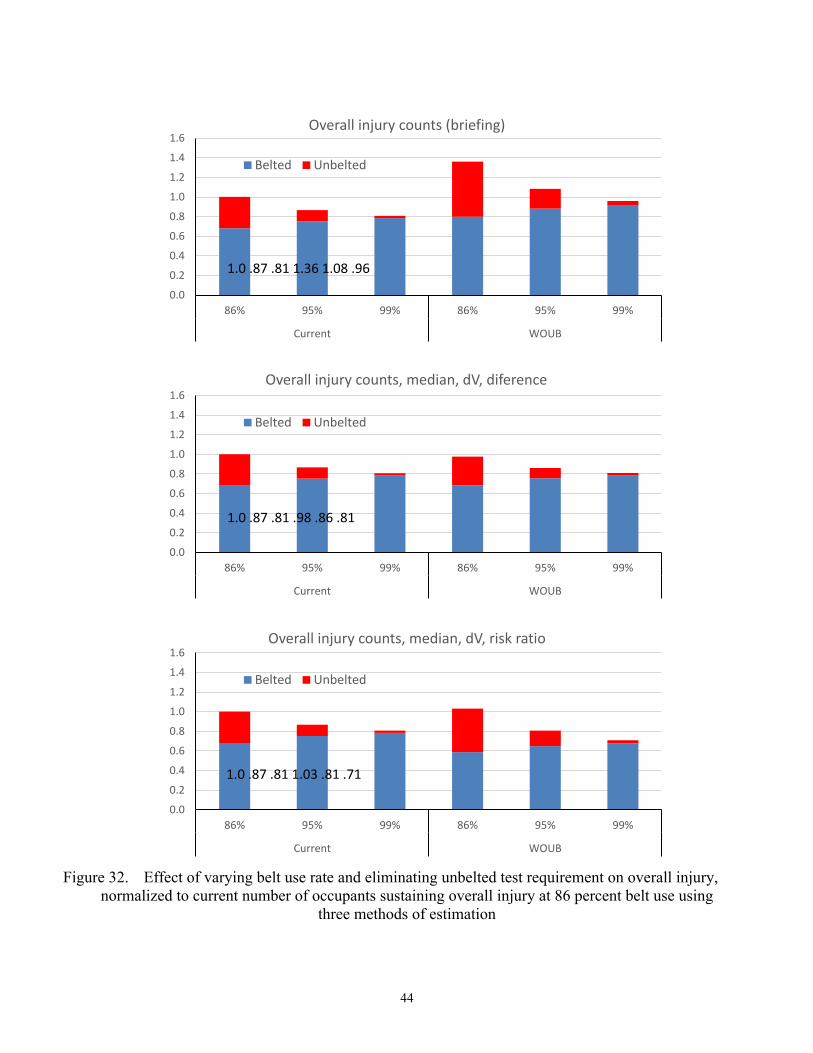
44
Figure 32. Effect of varying belt use rate and eliminating unbelted test requirement on overall injury,
normalized to current number of occupants sustaining overall injury at 86 percent belt use using three methods of estimation
0.0
0.2
0.4
0.6
0.8
1.0
1.2
1.4
1.6
86% 95% 99% 86% 95% 99%
Current WOUB
Overall injury counts (briefing)
Belted Unbelted
1.0 .87 .81 1.36 1.08 .96
0.0
0.2
0.4
0.6
0.8
1.0
1.2
1.4
1.6
86% 95% 99% 86% 95% 99%
Current WOUB
Overall injury counts, median, dV, diference
Belted Unbelted
1.0 .87 .81 .98 .86 .81
0.0
0.2
0.4
0.6
0.8
1.0
1.2
1.4
1.6
86% 95% 99% 86% 95% 99%
Current WOUB
Overall injury counts, median, dV, risk ratio
Belted Unbelted
1.0 .87 .81 1.03 .81 .71
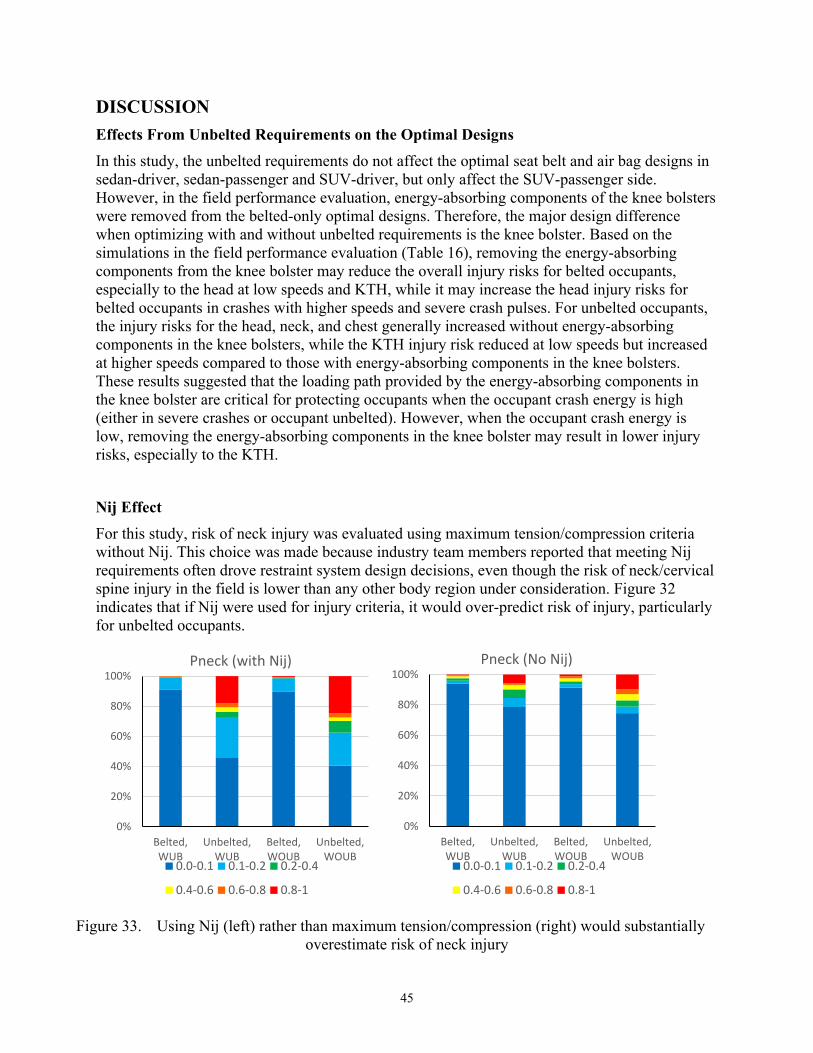
45
DISCUSSION Effects From Unbelted Requirements on the Optimal Designs In this study, the unbelted requirements do not affect the optimal seat belt and air bag designs in sedan-driver, sedan-passenger and SUV-driver, but only affect the SUV-passenger side. However, in the field performance evaluation, energy-absorbing components of the knee bolsters were removed from the belted-only optimal designs. Therefore, the major design difference when optimizing with and without unbelted requirements is the knee bolster. Based on the simulations in the field performance evaluation (Table 16), removing the energy-absorbing components from the knee bolster may reduce the overall injury risks for belted occupants, especially to the head at low speeds and KTH, while it may increase the head injury risks for belted occupants in crashes with higher speeds and severe crash pulses. For unbelted occupants, the injury risks for the head, neck, and chest generally increased without energy-absorbing components in the knee bolsters, while the KTH injury risk reduced at low speeds but increased at higher speeds compared to those with energy-absorbing components in the knee bolsters. These results suggested that the loading path provided by the energy-absorbing components in the knee bolster are critical for protecting occupants when the occupant crash energy is high (either in severe crashes or occupant unbelted). However, when the occupant crash energy is low, removing the energy-absorbing components in the knee bolster may result in lower injury risks, especially to the KTH.
Nij Effect For this study, risk of neck injury was evaluated using maximum tension/compression criteria without Nij. This choice was made because industry team members reported that meeting Nij requirements often drove restraint system design decisions, even though the risk of neck/cervical spine injury in the field is lower than any other body region under consideration. Figure 32 indicates that if Nij were used for injury criteria, it would over-predict risk of injury, particularly for unbelted occupants.
Figure 33. Using Nij (left) rather than maximum tension/compression (right) would substantially
overestimate risk of neck injury
0%
20%
40%
60%
80%
100%
Belted,WUB
Unbelted,WUB
Belted,WOUB
Unbelted,WOUB
Pneck (with Nij)
0.0-0.1 0.1-0.2 0.2-0.4
0.4-0.6 0.6-0.8 0.8-1
0%
20%
40%
60%
80%
100%
Belted,WUB
Unbelted,WUB
Belted,WOUB
Unbelted,WOUB
Pneck (No Nij)
0.0-0.1 0.1-0.2 0.2-0.4
0.4-0.6 0.6-0.8 0.8-1
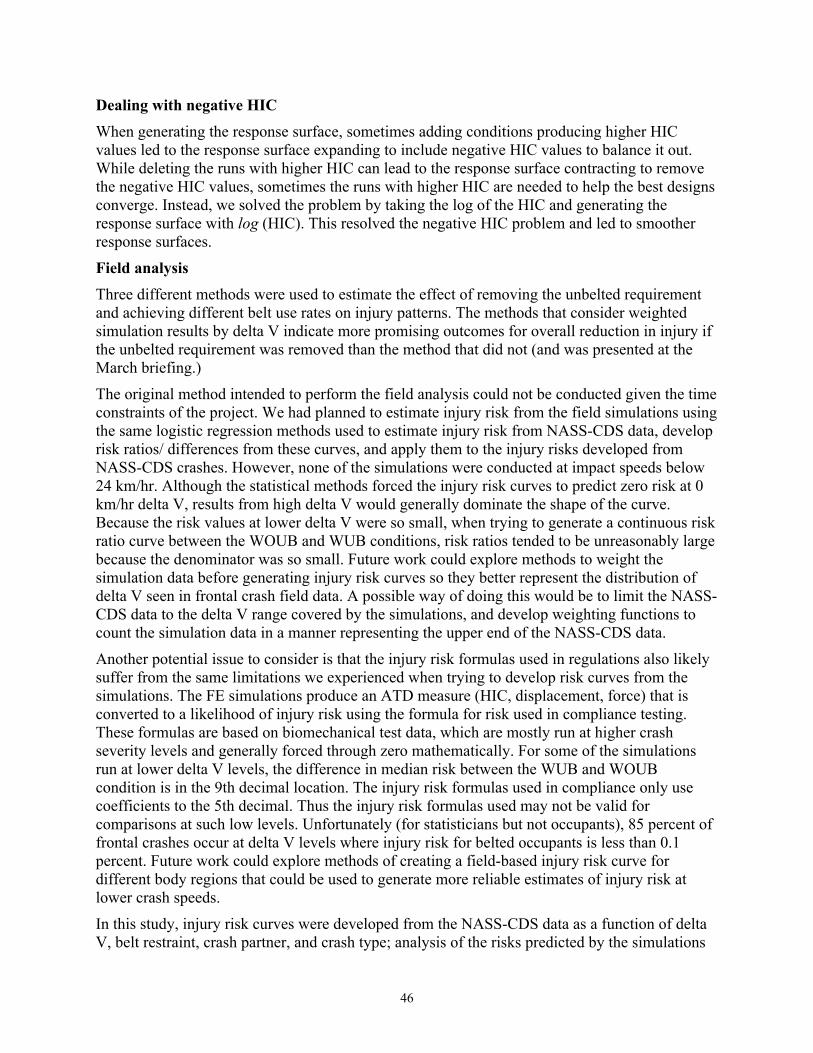
46
Dealing with negative HIC When generating the response surface, sometimes adding conditions producing higher HIC values led to the response surface expanding to include negative HIC values to balance it out. While deleting the runs with higher HIC can lead to the response surface contracting to remove the negative HIC values, sometimes the runs with higher HIC are needed to help the best designs converge. Instead, we solved the problem by taking the log of the HIC and generating the response surface with log (HIC). This resolved the negative HIC problem and led to smoother response surfaces.
Field analysis Three different methods were used to estimate the effect of removing the unbelted requirement and achieving different belt use rates on injury patterns. The methods that consider weighted simulation results by delta V indicate more promising outcomes for overall reduction in injury if the unbelted requirement was removed than the method that did not (and was presented at the March briefing.)
The original method intended to perform the field analysis could not be conducted given the time constraints of the project. We had planned to estimate injury risk from the field simulations using the same logistic regression methods used to estimate injury risk from NASS-CDS data, develop risk ratios/ differences from these curves, and apply them to the injury risks developed from NASS-CDS crashes. However, none of the simulations were conducted at impact speeds below 24 km/hr. Although the statistical methods forced the injury risk curves to predict zero risk at 0 km/hr delta V, results from high delta V would generally dominate the shape of the curve. Because the risk values at lower delta V were so small, when trying to generate a continuous risk ratio curve between the WOUB and WUB conditions, risk ratios tended to be unreasonably large because the denominator was so small. Future work could explore methods to weight the simulation data before generating injury risk curves so they better represent the distribution of delta V seen in frontal crash field data. A possible way of doing this would be to limit the NASS-CDS data to the delta V range covered by the simulations, and develop weighting functions to count the simulation data in a manner representing the upper end of the NASS-CDS data.
Another potential issue to consider is that the injury risk formulas used in regulations also likely suffer from the same limitations we experienced when trying to develop risk curves from the simulations. The FE simulations produce an ATD measure (HIC, displacement, force) that is converted to a likelihood of injury risk using the formula for risk used in compliance testing. These formulas are based on biomechanical test data, which are mostly run at higher crash severity levels and generally forced through zero mathematically. For some of the simulations run at lower delta V levels, the difference in median risk between the WUB and WOUB condition is in the 9th decimal location. The injury risk formulas used in compliance only use coefficients to the 5th decimal. Thus the injury risk formulas used may not be valid for comparisons at such low levels. Unfortunately (for statisticians but not occupants), 85 percent of frontal crashes occur at delta V levels where injury risk for belted occupants is less than 0.1 percent. Future work could explore methods of creating a field-based injury risk curve for different body regions that could be used to generate more reliable estimates of injury risk at lower crash speeds.
In this study, injury risk curves were developed from the NASS-CDS data as a function of delta V, belt restraint, crash partner, and crash type; analysis of the risks predicted by the simulations
47
focused on the same parameters for consistency. Preliminary analysis found no significant difference in estimated injury risk for driver versus passenger once these other factors were considered. Many injury risk studies document increased risk with occupant age, as well as some differences related to occupant size. The decision was deliberately made not to include age or size as a predictor in the NASS-CDS models. In the simulations, two sizes of ATDs in two vehicles were selected to represent all passengers in all vehicles. Since there is currently no method of accounting for age effects with the ATDs, and only limited effects of size, these factors were not considered in the injury risk formulas. Considering results from simulations of both ATDs is consistent with equal consideration given to crash test results from both ATDs in NCAP testing. Future work might allow estimation of IARV scaling factors to use with the ATDs that account for age-related variations in injury risk based on field data.
Overall, the median injury risks shown in Table 16 increase with delta V category for both unbelted and belted occupants in a reasonable manner. However, there are likely simulations at the upper and lower end of the crash severity range with incongruous results. At the lower speeds, some of the pulses provided were not long enough, and may have ended before full loading was achieved. While this would be the case for both the WUB and WOUB conditions, with overall differences so small, this lack of completion may contribute to analysis of outcomes. At the higher speeds, sometimes the head would hit the A-pillar, producing high head and neck injury probabilities. Since the FE models were not correlated for head contact to the A-pillar and did not include a representation of the curtain air bag that would be present in this vehicle and deployed in high severity crashes, likely mitigating the effect of A-pillar impact based on follow-up simulations not analyzed in the initial set of simulations, simulations where A-pillar contact occurred may be over-predicting injury risk.
Ideally, all 1,760 simulations would be reviewed for anomalous results such as those found in these two scenarios. The timeline of the project did not allow this step to be performed completely. For example, the unbelted neck risk ratio for the 40 to 49 delta V category is extremely large and may be due to one or two outlying simulations. The choice to use median rather than average across delta V provides a reasonable preliminary strategy for dealing with outlying conditions. However, review of more simulations in detail may allow development of a better way for choosing which simulations are valid for field analysis. Once the simulation dataset is reviewed, work could be performed to develop more robust methods of estimating the effect of the unbelted requirement on risk.
Limitations There are several limitations in this study that can potentially affect the overall performance evaluation.
First, the crash pulses and vehicle kinematics used in the field performance evaluations are from a vehicle (Venza) that is different to and generally stiffer than the baseline sedan and SUV models. As an example, the NCAP crash pulses for Venza, and the two baseline models used in this study are shown in Figure 33. It is clear that Venza sustained a much stiffer crash pulse than those from the two baseline vehicles. Considering that the deltaV generated by crashing the Venza model into the pickup truck and large SUV at 35mph will be higher than those in the NCAP conditions, the simulations for the field performance evaluations considered several conditions that are more severe than the regulatory and NCAP crash pulses used for optimizing the restraint system. It is likely that removing the EA components in the knee bolster will
48
negatively impact the occupant protection under these more severe Venza pulses due to the lack of an important loading path.
Figure 34. Venza NCAP crash pulses versus two baseline vehicles
The second limitation of this study is that the design parameter ranges are relatively narrow in our design optimizations, and further design changes focusing on the belted occupants are needed. In only one condition, when the unbelted requirement was removed, did the restraint system characteristics change If a larger parameter range was used, it is likely that the restraint system characteristics for the sedan and SUV driver may also have led to multiple designs that showed greater improvement for belted occupants when the unbelted requirement was not considered. This limitation did not demonstrate as strong of a benefit for belted occupants of removing the unbelted requirements as might occur with a larger design space.
The third limitation of this study is that some of the highest and lowest severity simulations may have computational issues. In some high-speed offset field simulations, the ATD’s head may hit the A-pillar which was not correlated to ensure appropriate response for this interaction. The curtain air bag deployment not present in the model could potentially play a role in reducing this interaction. In addition, in some low-speed field simulations, the crash pulse was not long enough for injury measures to reach the peak. Most of the pulses provided by NHTSA had a duration near 150 ms. For some of the lower impact speed conditions, a pulse of this length may not have captured all of the significant parts of the pulse. An example of this is shown in Figure 34. For some of these conditions at both the high and low ends, the injury measures may be underestimated. However, because the estimated Pjoint at these lower impact speeds are well below 10 percent, results would not be expected to change substantially if these simulations were run longer. But as mentioned previously, because the risk differences are so low, it might affect the comparison of trends seen in designs optimized with and without the unbelted requirement.
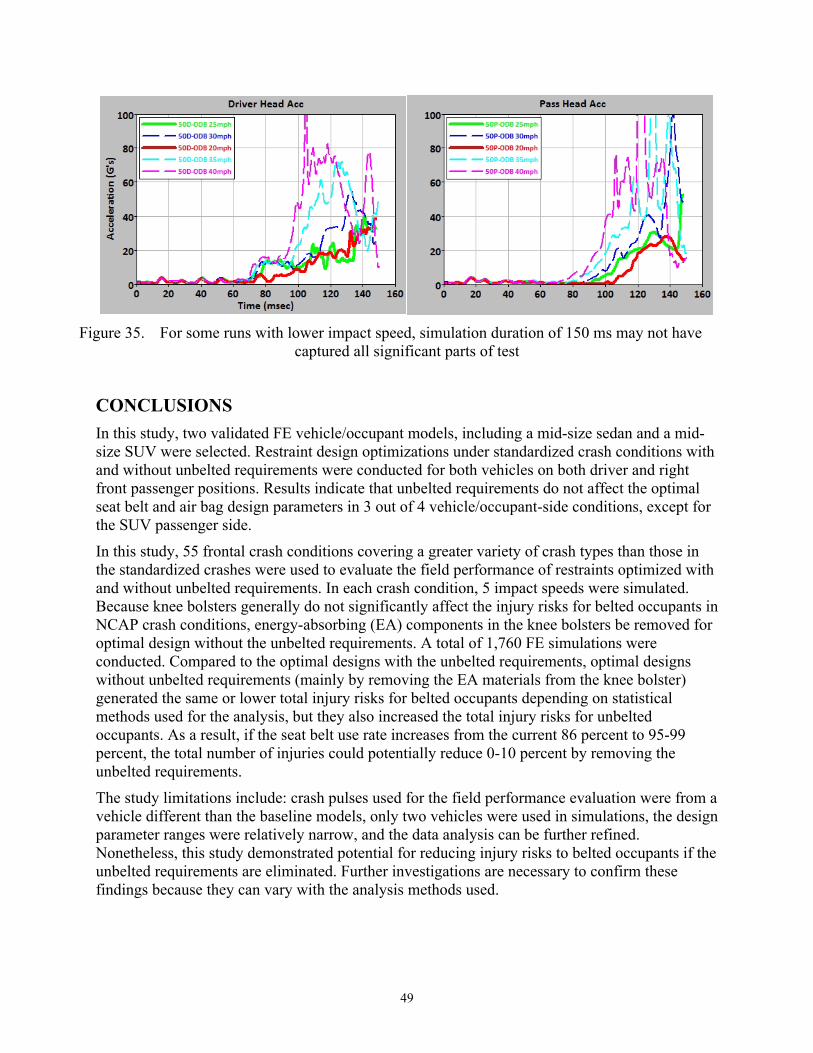
49
Figure 35. For some runs with lower impact speed, simulation duration of 150 ms may not have
captured all significant parts of test
CONCLUSIONS In this study, two validated FE vehicle/occupant models, including a mid-size sedan and a mid-size SUV were selected. Restraint design optimizations under standardized crash conditions with and without unbelted requirements were conducted for both vehicles on both driver and right front passenger positions. Results indicate that unbelted requirements do not affect the optimal seat belt and air bag design parameters in 3 out of 4 vehicle/occupant-side conditions, except for the SUV passenger side.
In this study, 55 frontal crash conditions covering a greater variety of crash types than those in the standardized crashes were used to evaluate the field performance of restraints optimized with and without unbelted requirements. In each crash condition, 5 impact speeds were simulated. Because knee bolsters generally do not significantly affect the injury risks for belted occupants in NCAP crash conditions, energy-absorbing (EA) components in the knee bolsters be removed for optimal design without the unbelted requirements. A total of 1,760 FE simulations were conducted. Compared to the optimal designs with the unbelted requirements, optimal designs without unbelted requirements (mainly by removing the EA materials from the knee bolster) generated the same or lower total injury risks for belted occupants depending on statistical methods used for the analysis, but they also increased the total injury risks for unbelted occupants. As a result, if the seat belt use rate increases from the current 86 percent to 95-99 percent, the total number of injuries could potentially reduce 0-10 percent by removing the unbelted requirements.
The study limitations include: crash pulses used for the field performance evaluation were from a vehicle different than the baseline models, only two vehicles were used in simulations, the design parameter ranges were relatively narrow, and the data analysis can be further refined. Nonetheless, this study demonstrated potential for reducing injury risks to belted occupants if the unbelted requirements are eliminated. Further investigations are necessary to confirm these findings because they can vary with the analysis methods used.
50
REFERENCES 49 CFR 571.208 - [FMVS]Standard No. 208; Occupant crash protection. Chen, Y. Y. (2014, Revised). Seat belt use in 2012-Use rates in the States and Territories>
(Traffic Safety Facts Crash•Stats. Report No. DOT HS 811 809). Wshington, DC: National Highway Traffic Safety Administration. Available at www-nrd.nhtsa.dot.gov/Pubs/811809.pdf
Deb, K., Pratap, A., Agarwal, S., & Meyarivan, T. (2002). A fast and elitist multiobjective genetic algorithm: NSGA-II. Ieee Transactions on Evolutionary Computation;6:182-197.
General Motors (2007, March 29). GM Technical Training: Frontal Air Bag Sensing (PowerPoint presentation). Detroit: Author. Available at www.nhtsa.gov/staticfiles/nvs/pdf/NHTSA-GM-Meeting-March292007.pdf.
Hu J., Wu J., Reed, M., Klinich, K., & Cao, L. (2013a). Optimizing the rear seat environment for older children, adults, and infants. Traffic Injury Prevention;14 Suppl:S13-22.
Hu J., Wu J., Reed, M., Klinich, K., & Cao, L. (2013b). Rear seat restraint system optimization for older children in frontal crashes. Traffic Injury Prevention;14:614-622.
Insurance Institute for Highway Safety. (2014). Moderate overlap frontal crashworthiness evaluation crash test protocol (Version XV). Ruckersville, VA: Author. Available at www.iihs.org/media/f70ff6eb-d7a1-4b60-a82f-e4e8e0be7323/-247595342/Ratings/Protocols/current/test_protocol_high.pdf. Available at www.gpo.gov/fdsys/pkg/CFR-2011-title49-vol6/pdf/CFR-2011-title49-vol6-sec571-208.pdf
National Highway Traffic Safety Administration. (2012, September). Laboratory test procedure for New Car Assessment Program frontal impact testing. Washington, DC: Author. Available at www.safercar.gov/staticfiles/safercar/NCAP/Frontal_TP_NCAP.pdf
Public Law 112-141, Moving Ahead for Progress in the 21st Century Act. Samaha, R. R., Prasad, P., Marzougui, D., Cui, C., Digges, K., Summers, S., … Barsan-Anelli,
A. (2014, August). Methodology for evaluating fleet protection of new vehicle designs: Application to lightweight vehicle designs. (Report No. DOT HS 812 051A). Washington, DC: National Highway Traffic Safety Administration. Available at www.nhtsa.gov/DOT/NHTSA/NVS/Crashworthiness/Vehicle%20Aggressivity%20and%20Fleet%20Compatibility%20Research/812051-FleetModeling.zip
Yang, R. J., Wang, N., Tho, C. H., & Bobineau, J. P. (2005). Metamodeling development for vehicle frontal impact simulation. Journal of Mechanical Design, 127:1014-1020.
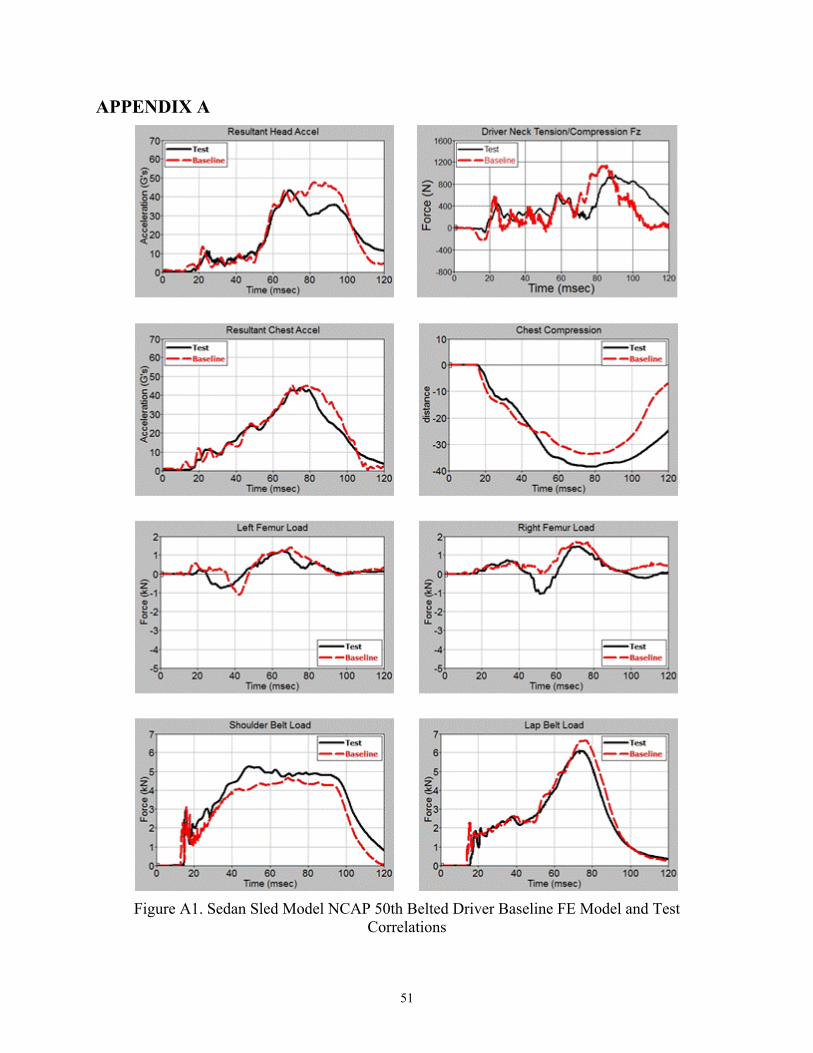
51
APPENDIX A
Figure A1. Sedan Sled Model NCAP 50th Belted Driver Baseline FE Model and Test
Correlations
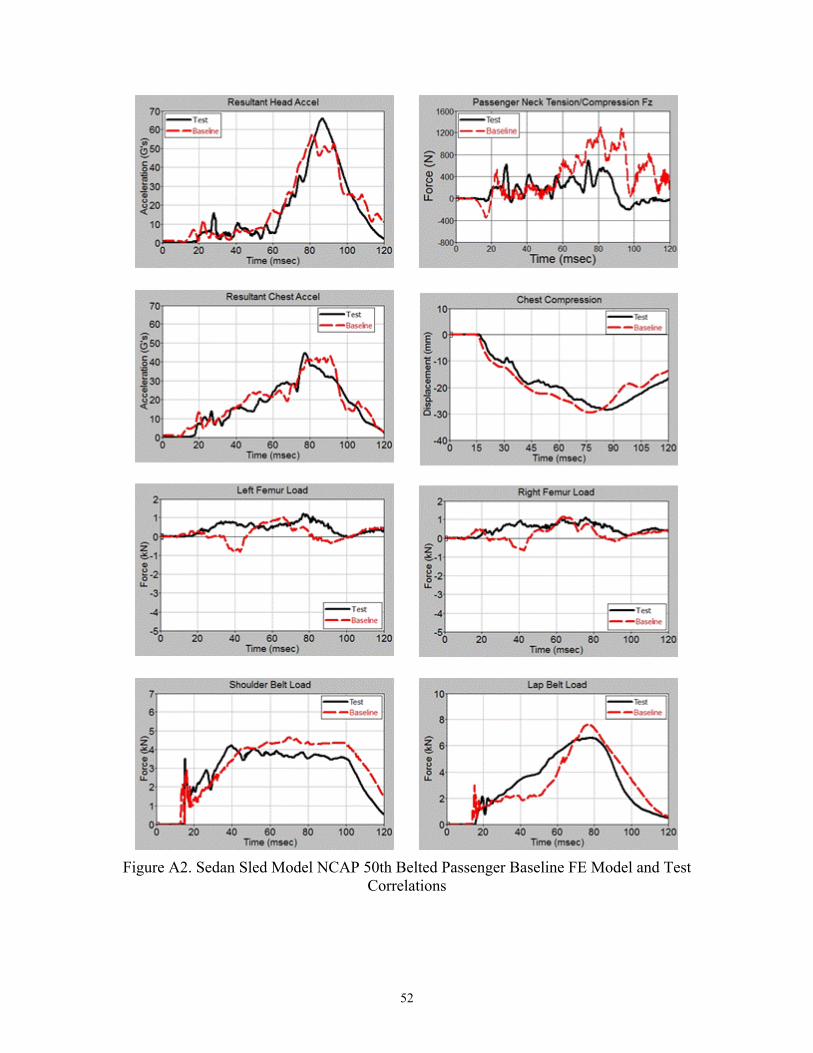
52
Figure A2. Sedan Sled Model NCAP 50th Belted Passenger Baseline FE Model and Test
Correlations
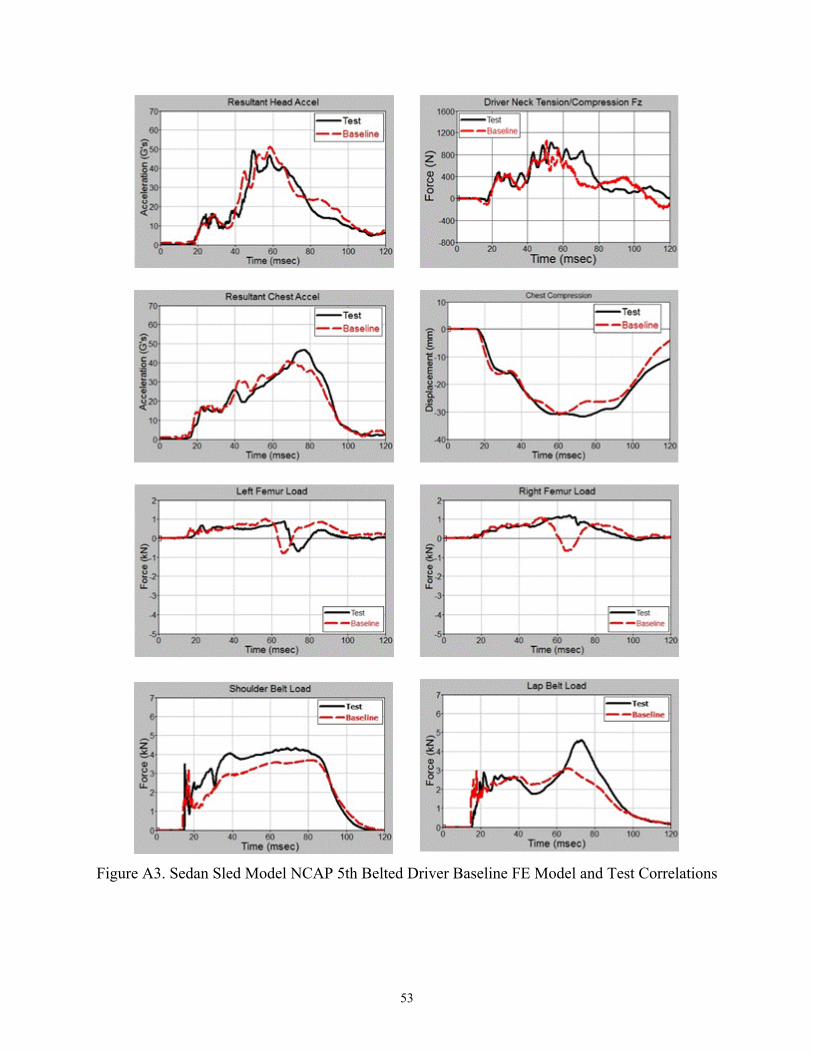
53
Figure A3. Sedan Sled Model NCAP 5th Belted Driver Baseline FE Model and Test Correlations
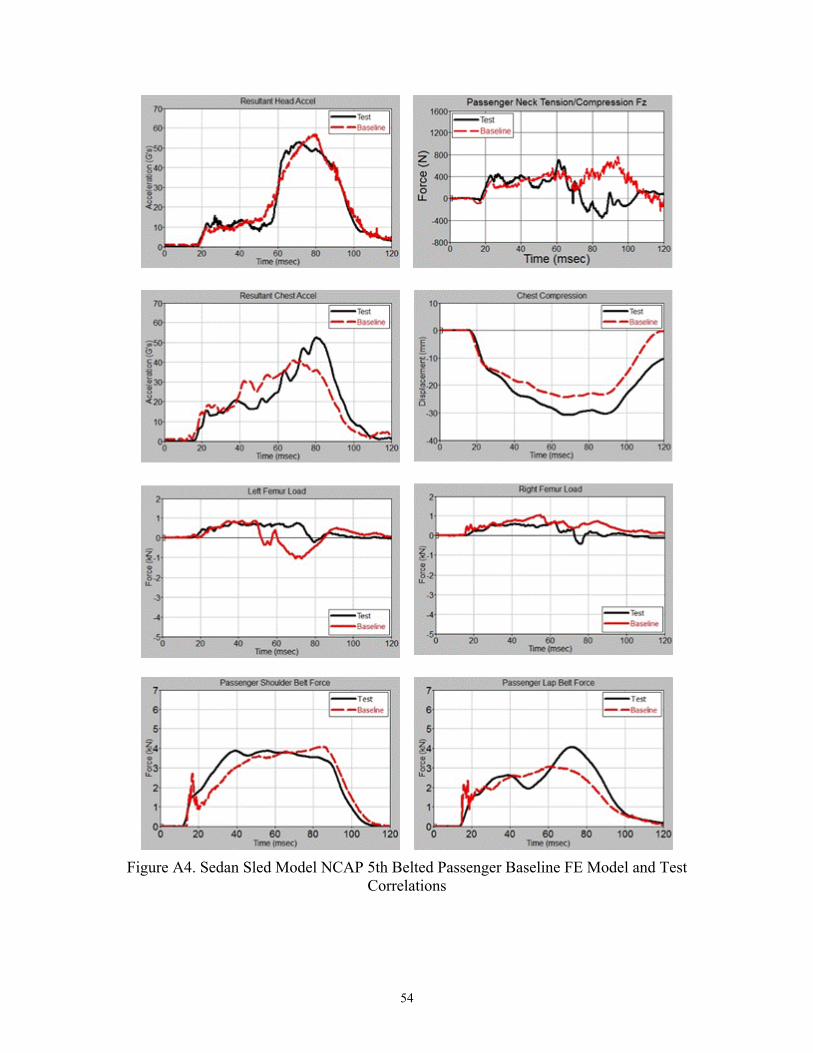
54
Figure A4. Sedan Sled Model NCAP 5th Belted Passenger Baseline FE Model and Test
Correlations
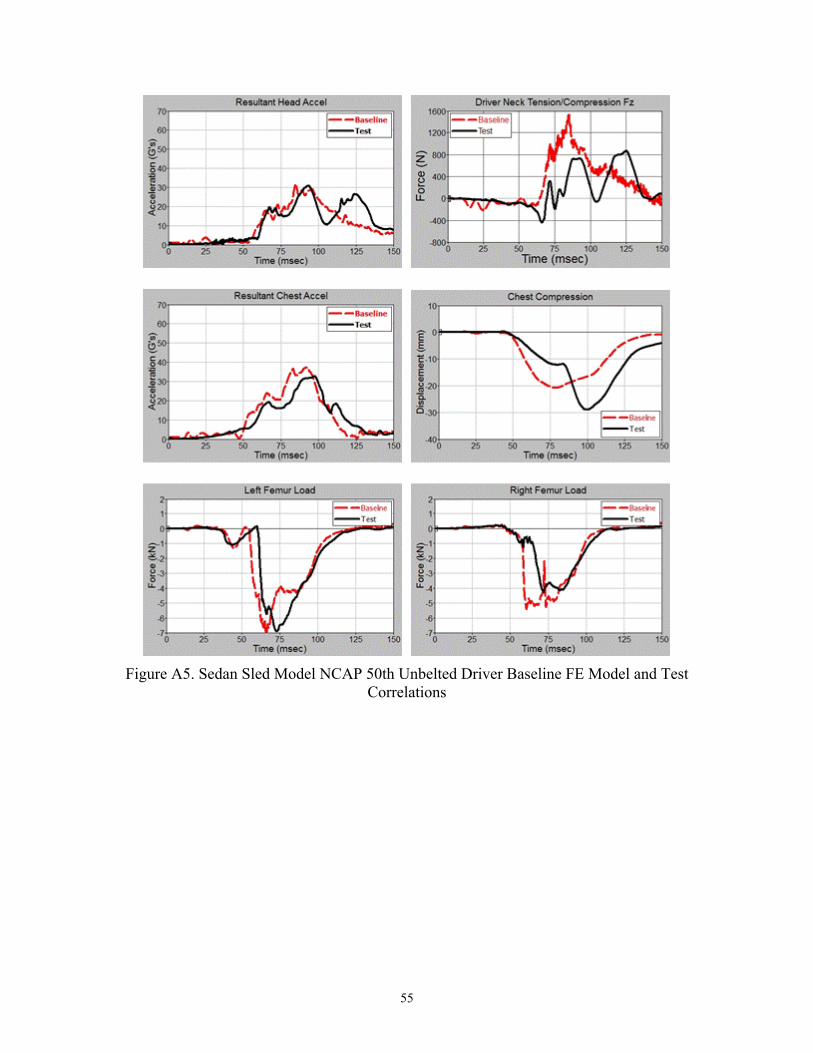
55
Figure A5. Sedan Sled Model NCAP 50th Unbelted Driver Baseline FE Model and Test
Correlations
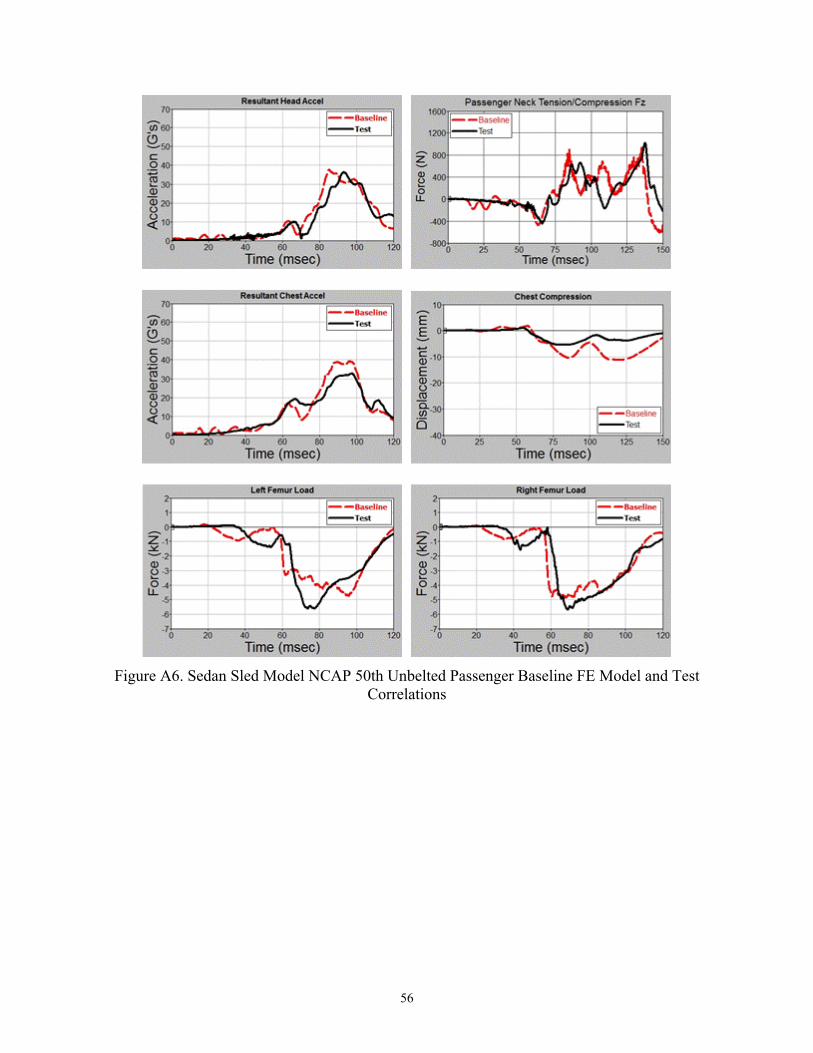
56
Figure A6. Sedan Sled Model NCAP 50th Unbelted Passenger Baseline FE Model and Test
Correlations
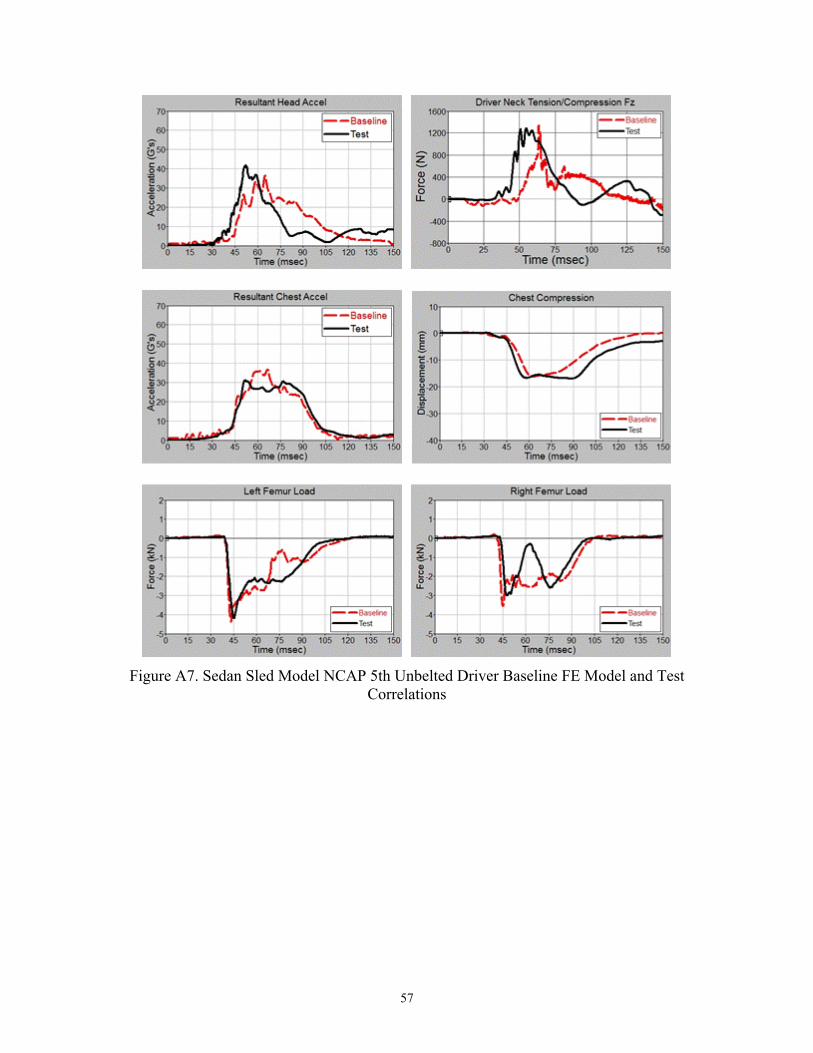
57
Figure A7. Sedan Sled Model NCAP 5th Unbelted Driver Baseline FE Model and Test
Correlations
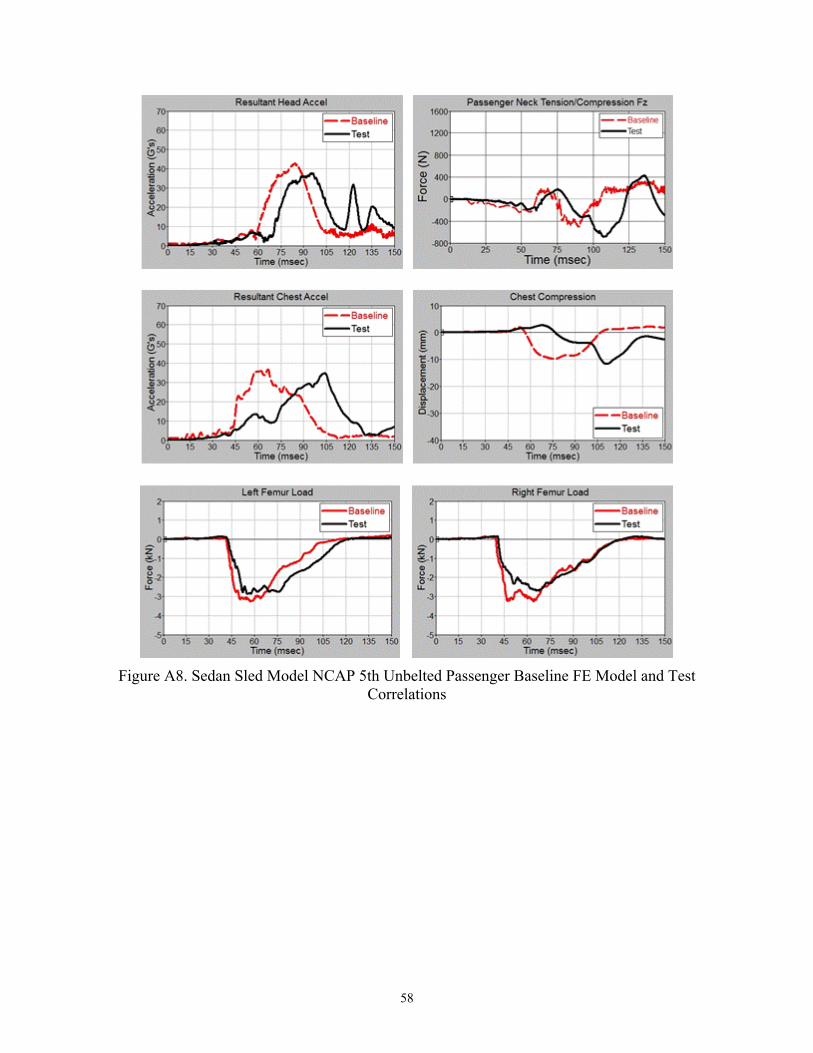
58
Figure A8. Sedan Sled Model NCAP 5th Unbelted Passenger Baseline FE Model and Test
Correlations
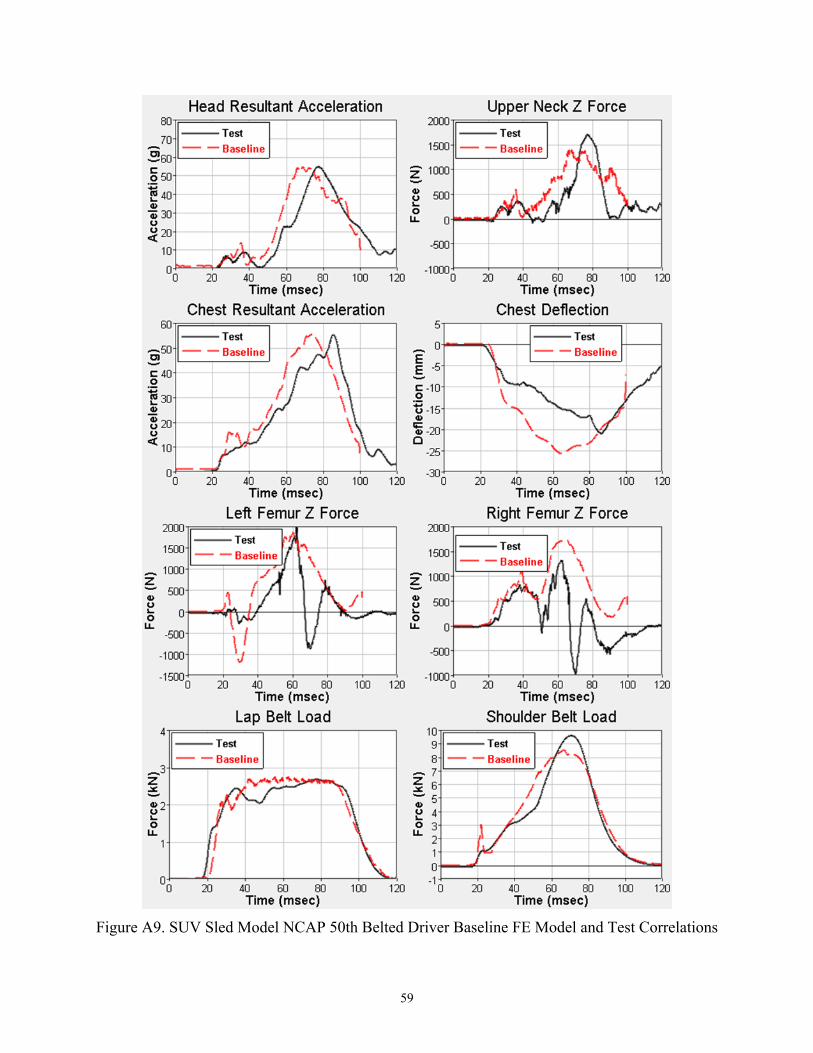
59
Figure A9. SUV Sled Model NCAP 50th Belted Driver Baseline FE Model and Test Correlations
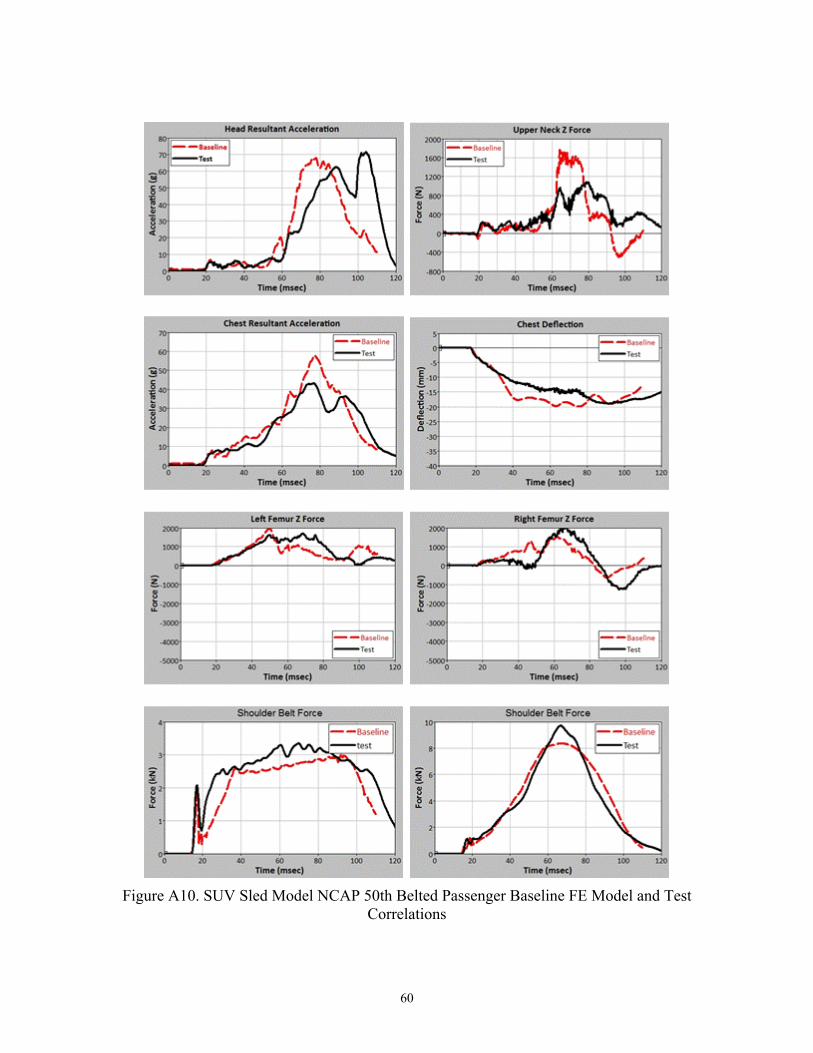
60
Figure A10. SUV Sled Model NCAP 50th Belted Passenger Baseline FE Model and Test
Correlations
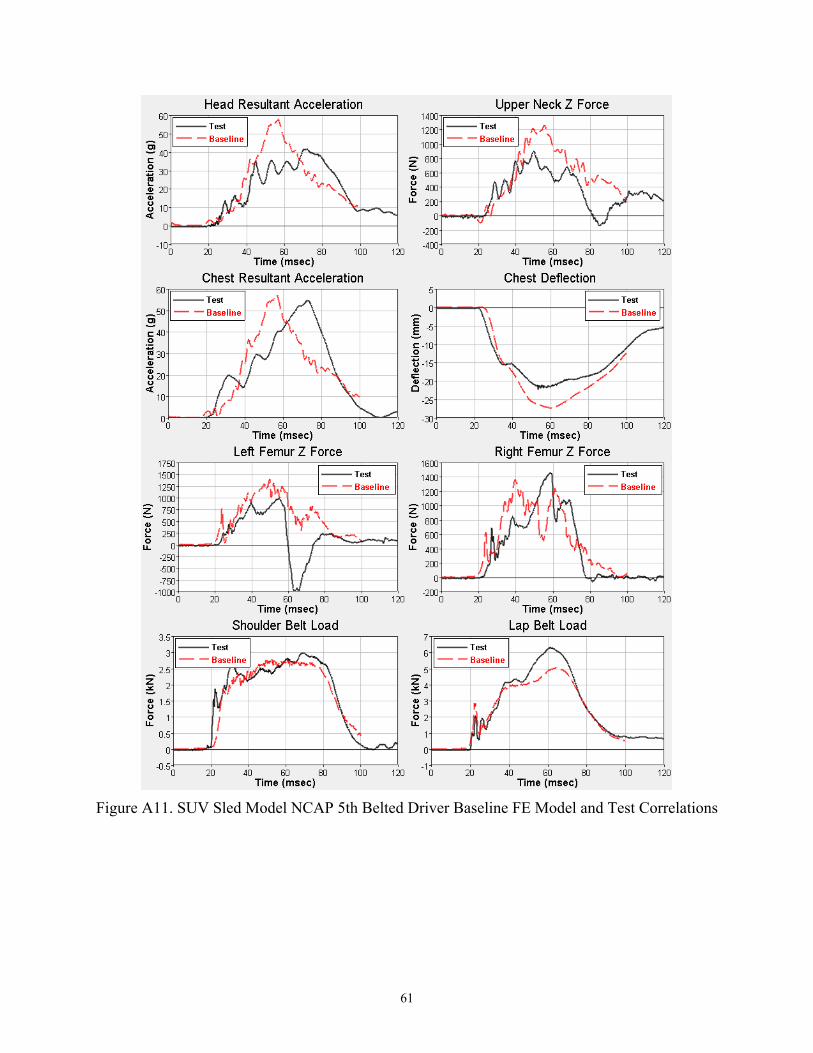
61
Figure A11. SUV Sled Model NCAP 5th Belted Driver Baseline FE Model and Test Correlations
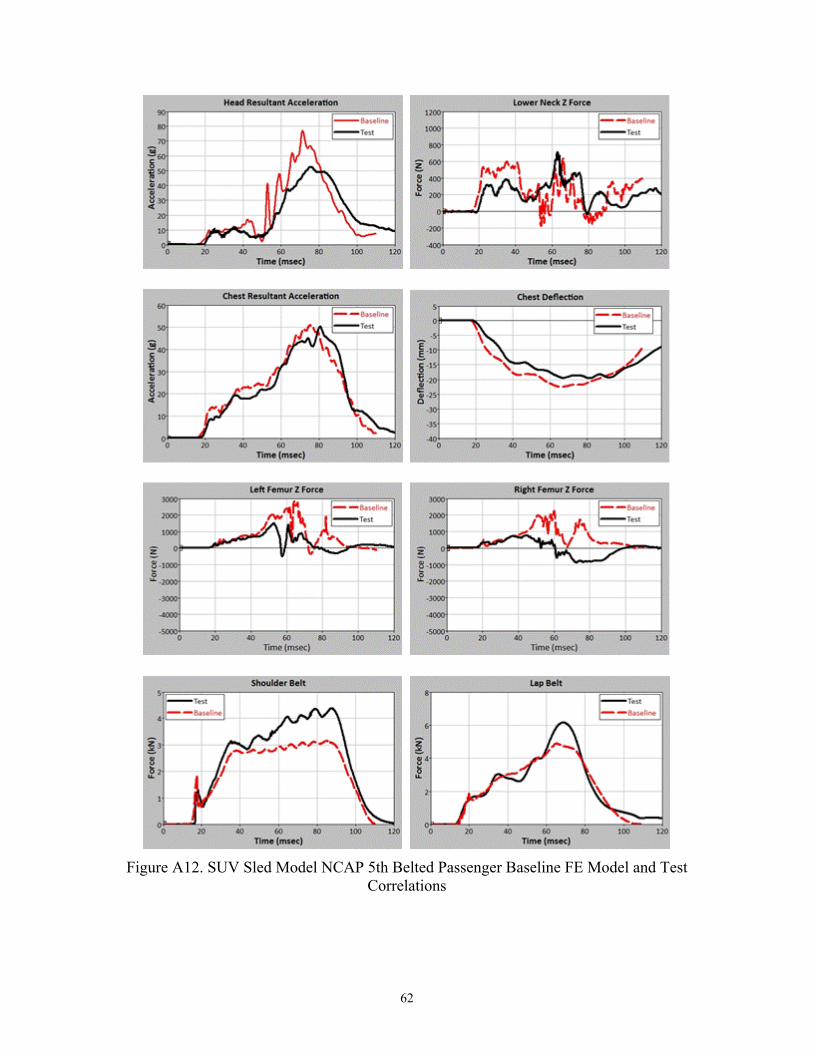
62
Figure A12. SUV Sled Model NCAP 5th Belted Passenger Baseline FE Model and Test
Correlations
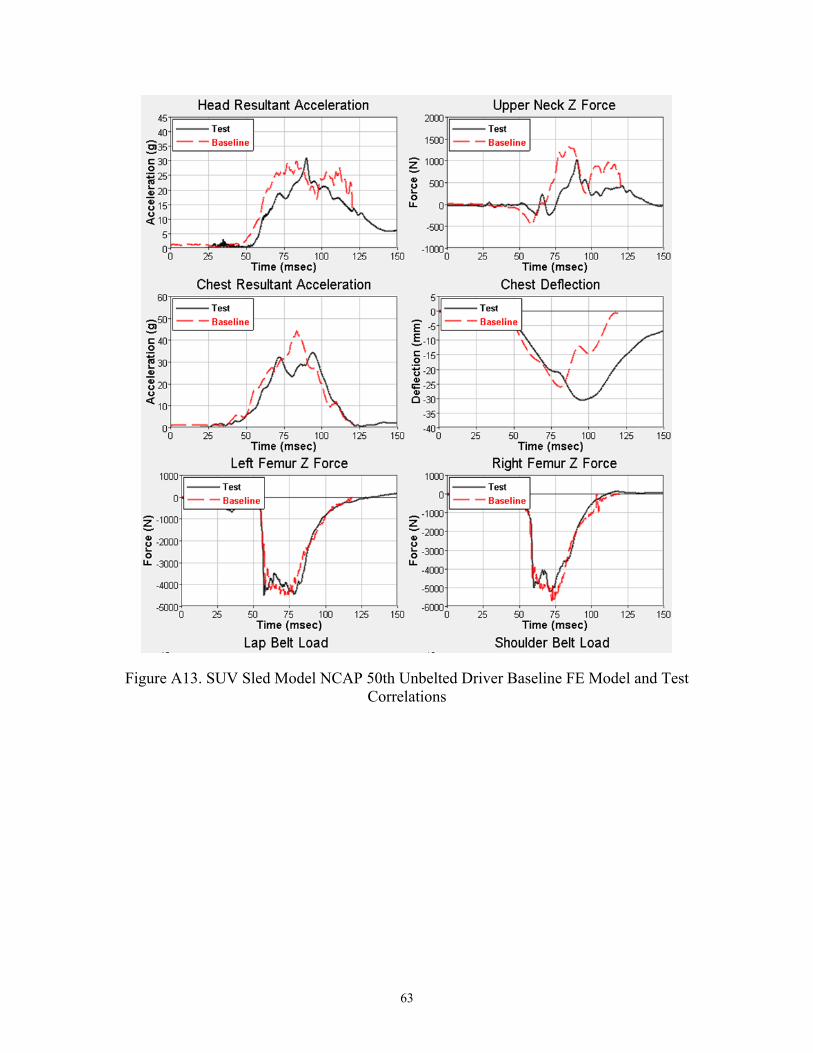
63
Figure A13. SUV Sled Model NCAP 50th Unbelted Driver Baseline FE Model and Test
Correlations
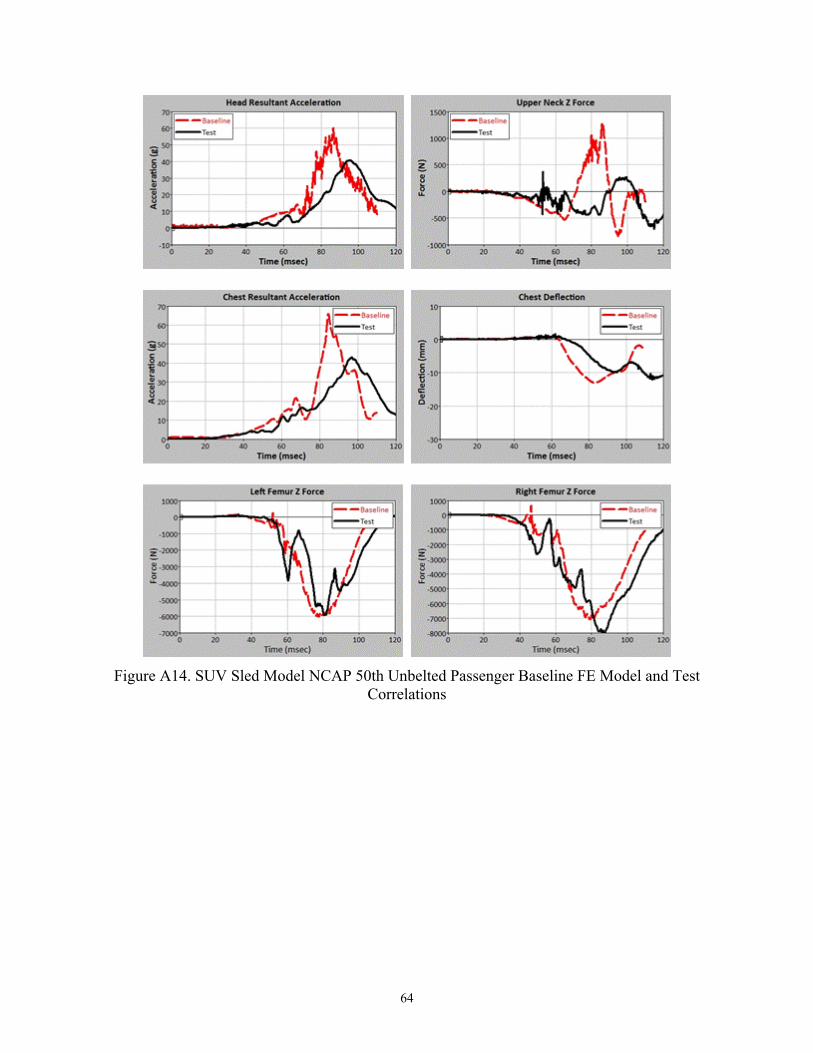
64
Figure A14. SUV Sled Model NCAP 50th Unbelted Passenger Baseline FE Model and Test
Correlations
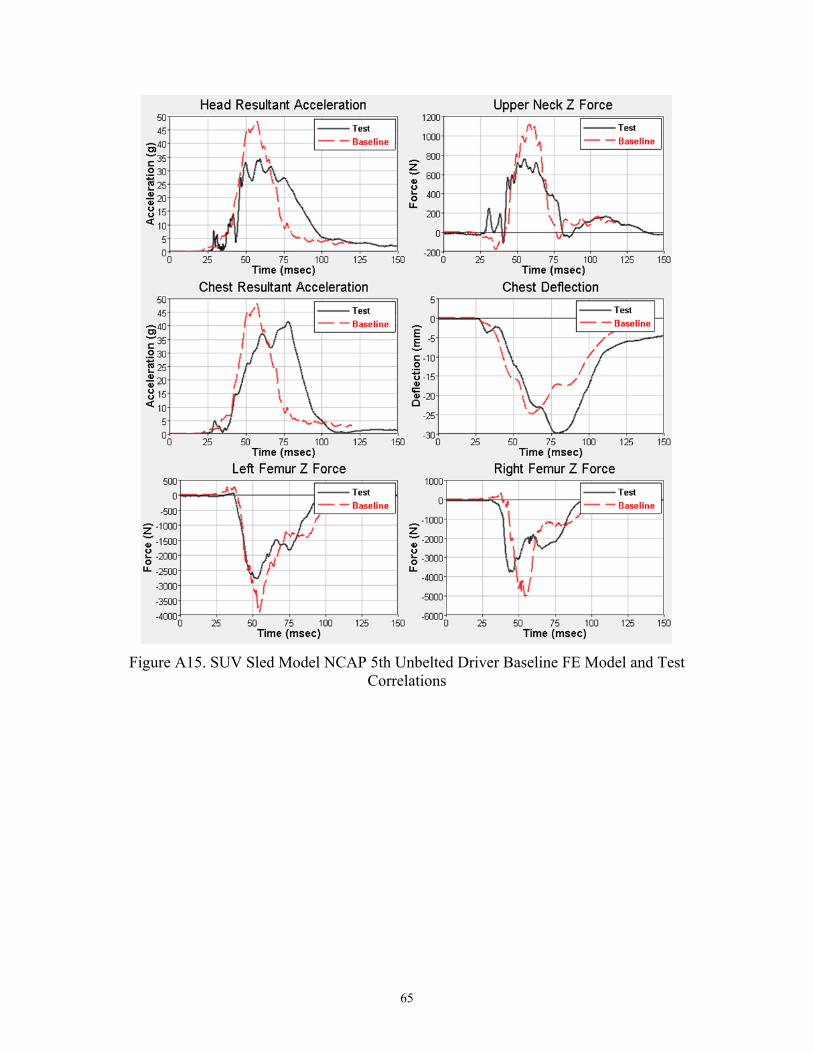
65
Figure A15. SUV Sled Model NCAP 5th Unbelted Driver Baseline FE Model and Test
Correlations
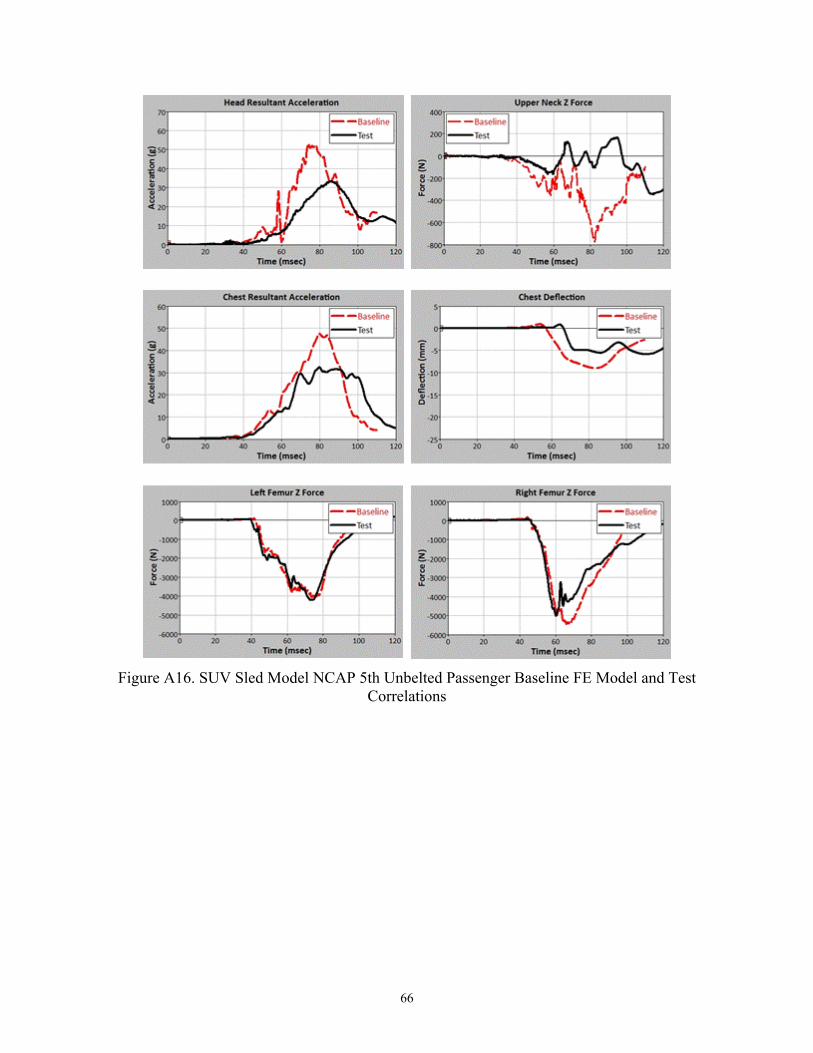
66
Figure A16. SUV Sled Model NCAP 5th Unbelted Passenger Baseline FE Model and Test
Correlations
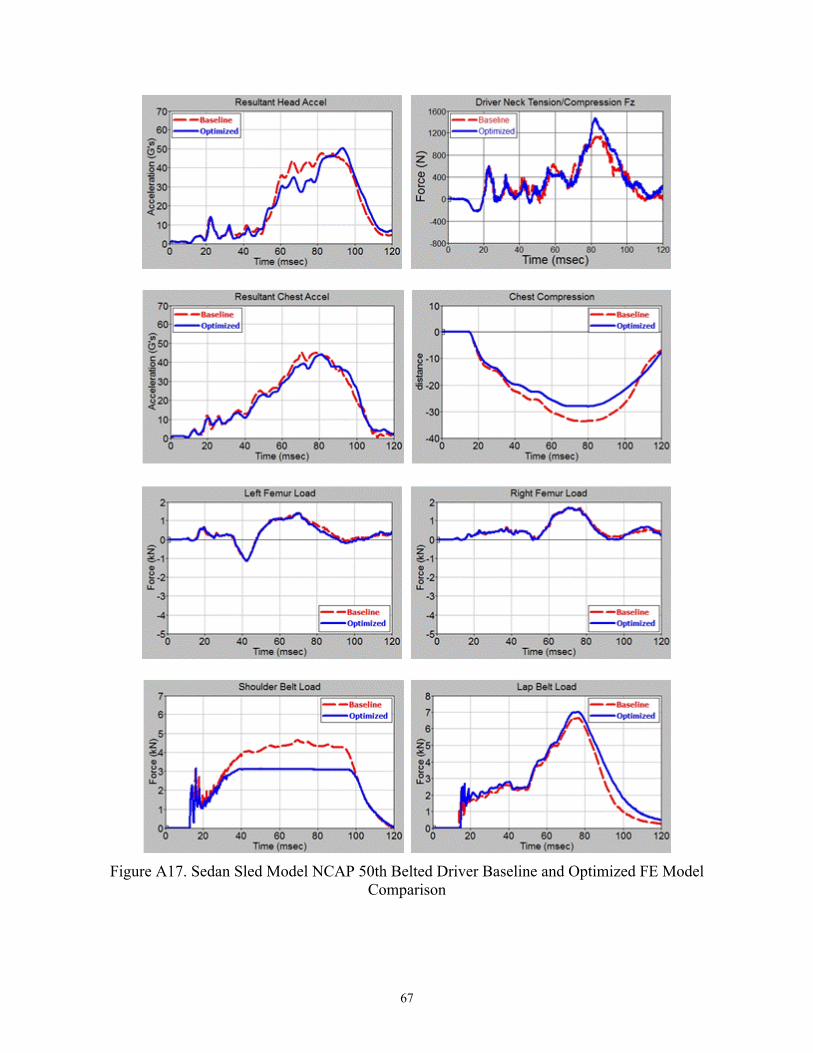
67
Figure A17. Sedan Sled Model NCAP 50th Belted Driver Baseline and Optimized FE Model
Comparison
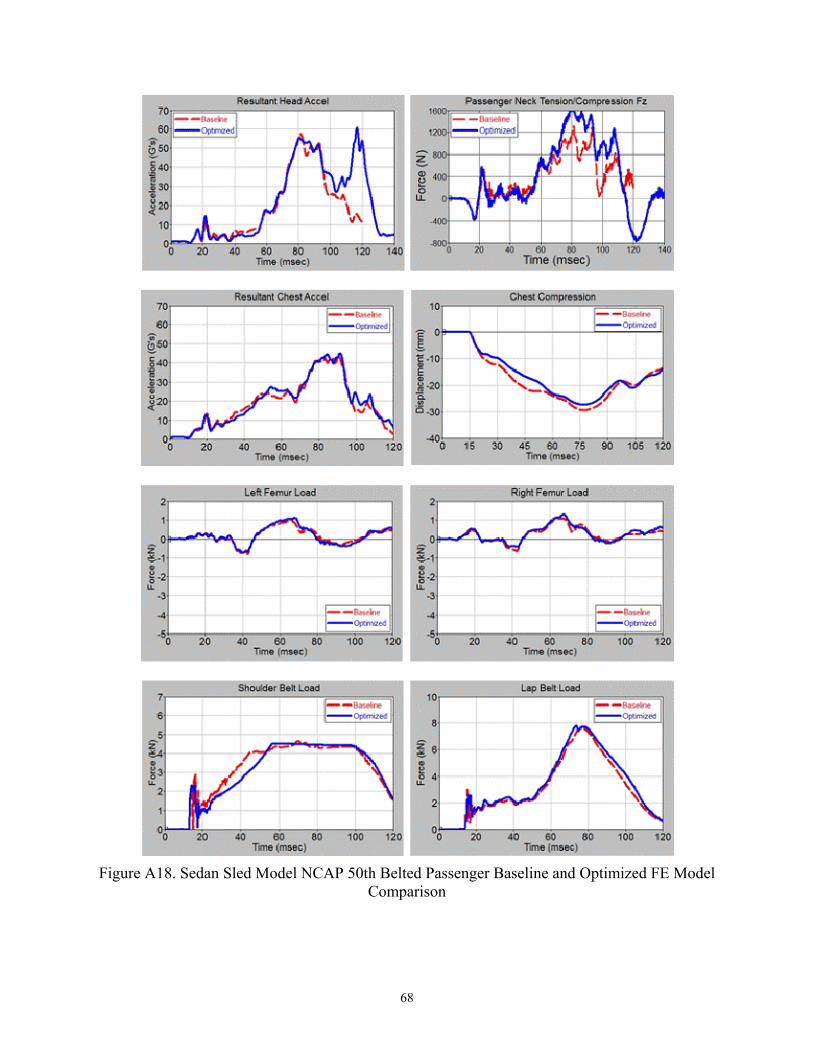
68
Figure A18. Sedan Sled Model NCAP 50th Belted Passenger Baseline and Optimized FE Model Comparison
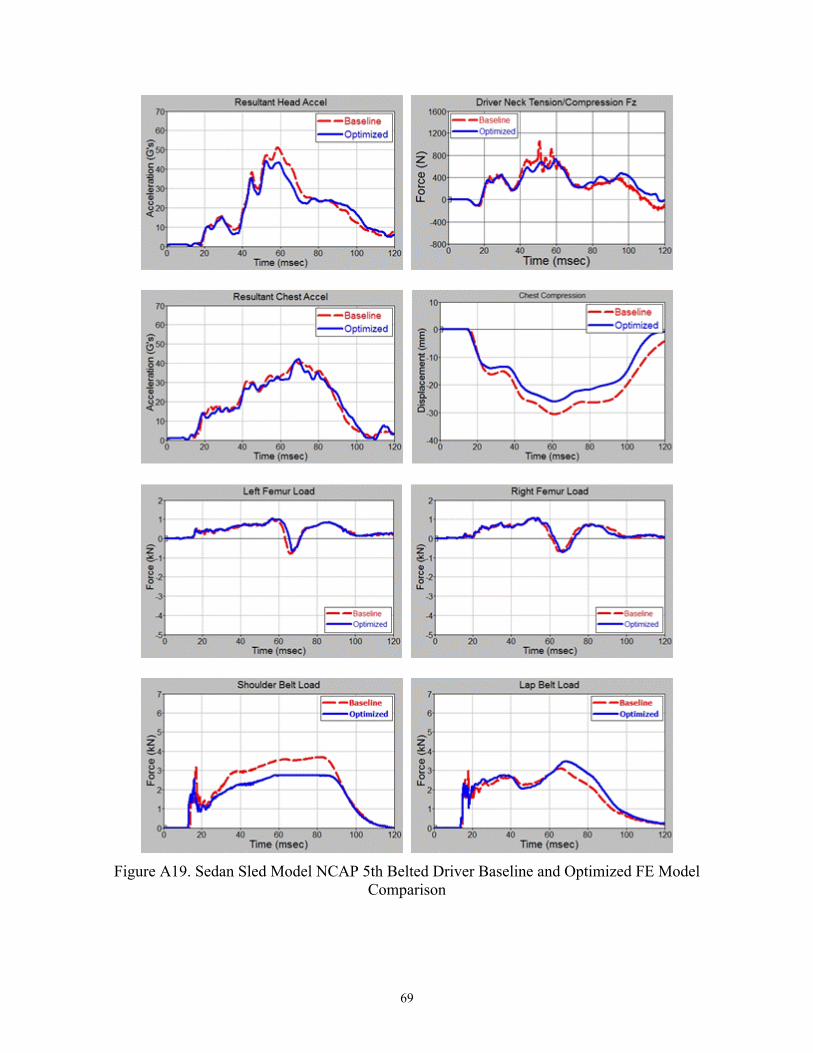
69
Figure A19. Sedan Sled Model NCAP 5th Belted Driver Baseline and Optimized FE Model
Comparison
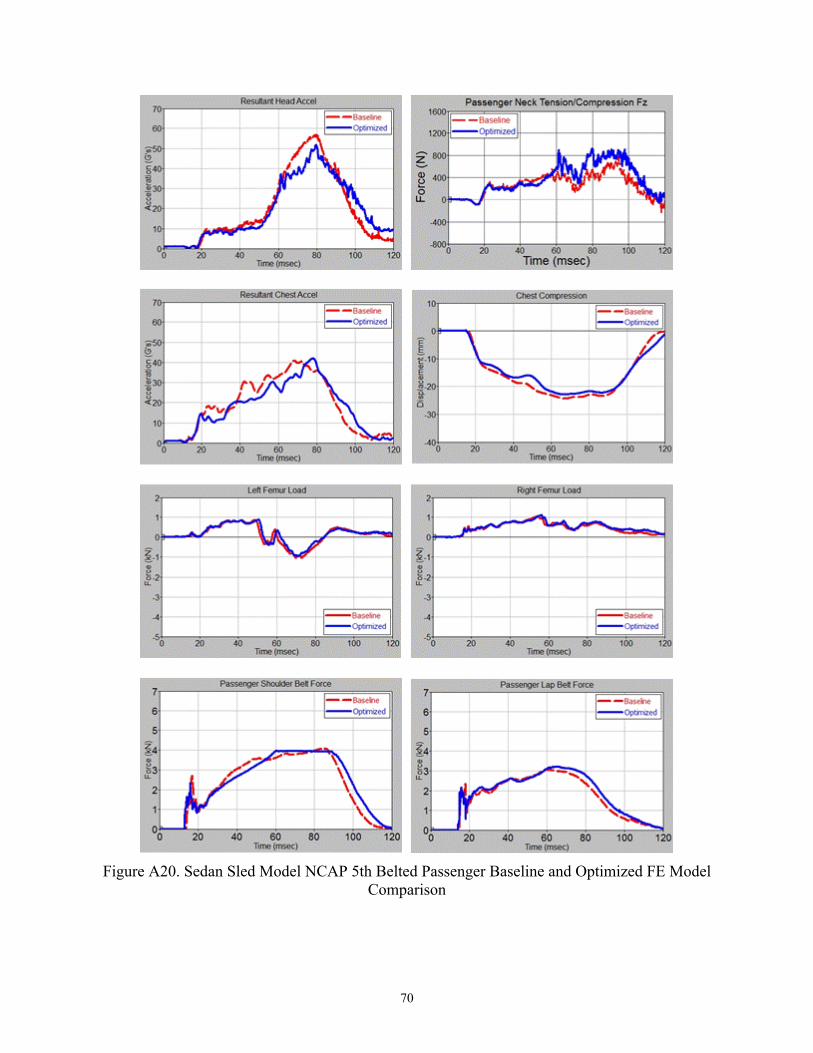
70
Figure A20. Sedan Sled Model NCAP 5th Belted Passenger Baseline and Optimized FE Model
Comparison
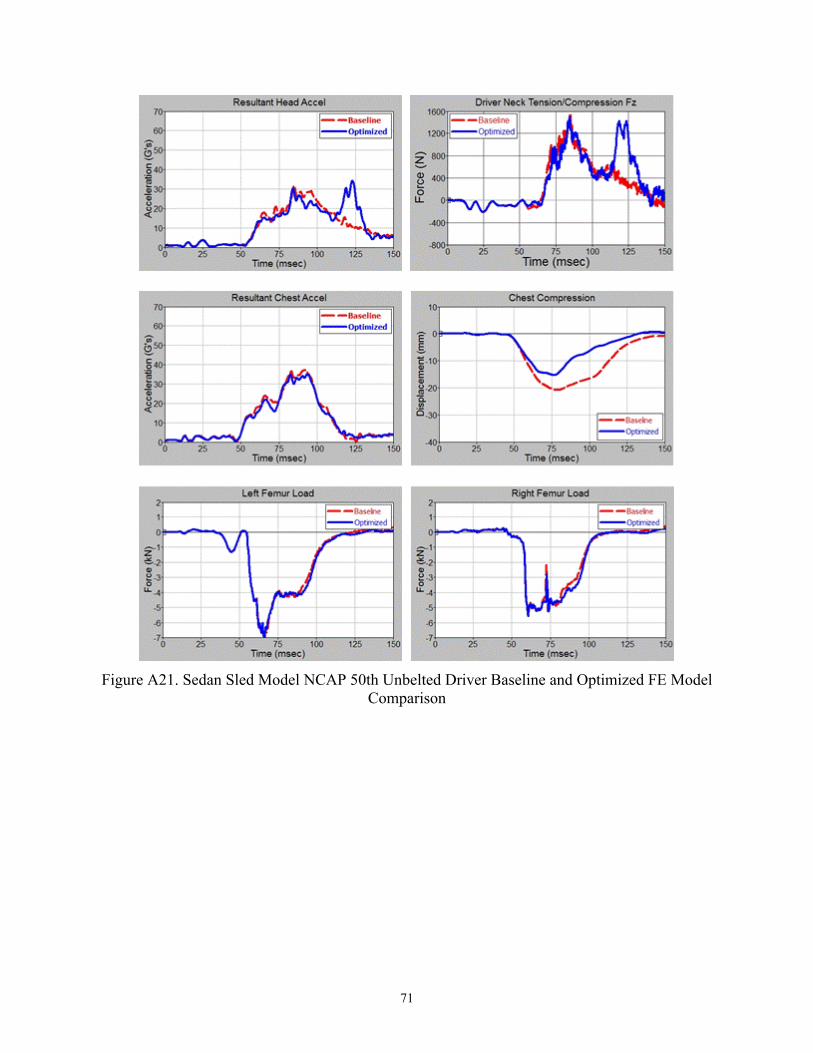
71
Figure A21. Sedan Sled Model NCAP 50th Unbelted Driver Baseline and Optimized FE Model
Comparison
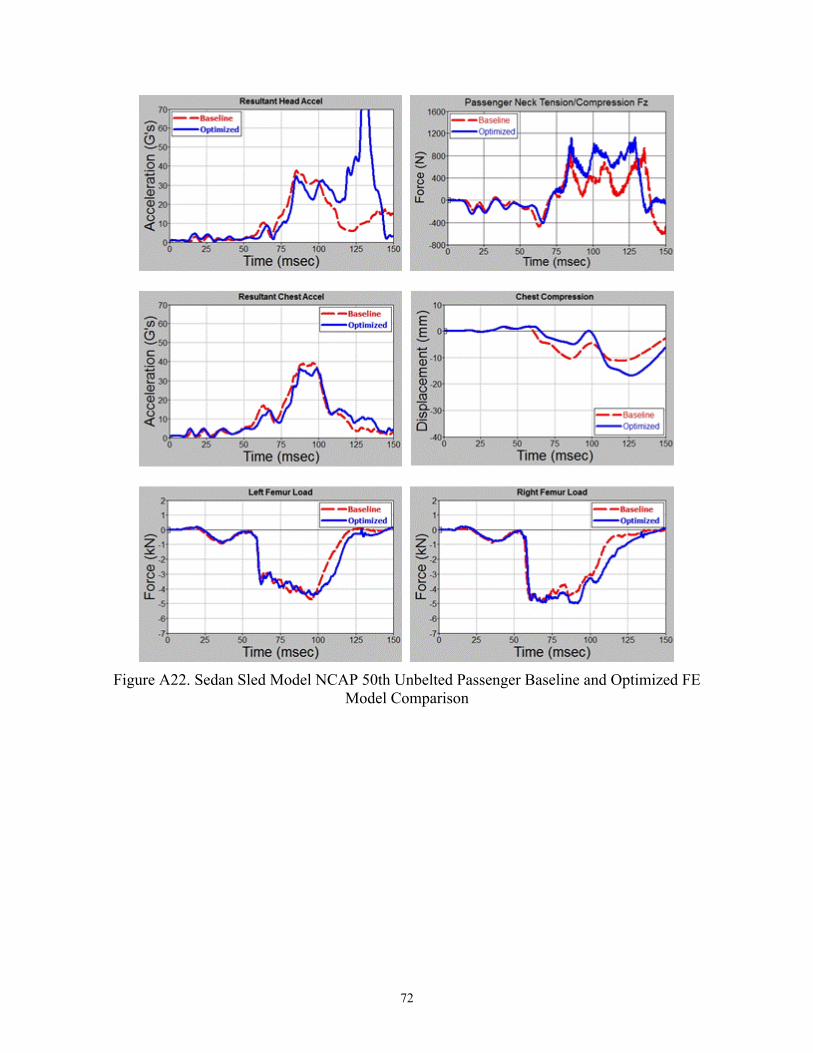
72
Figure A22. Sedan Sled Model NCAP 50th Unbelted Passenger Baseline and Optimized FE
Model Comparison
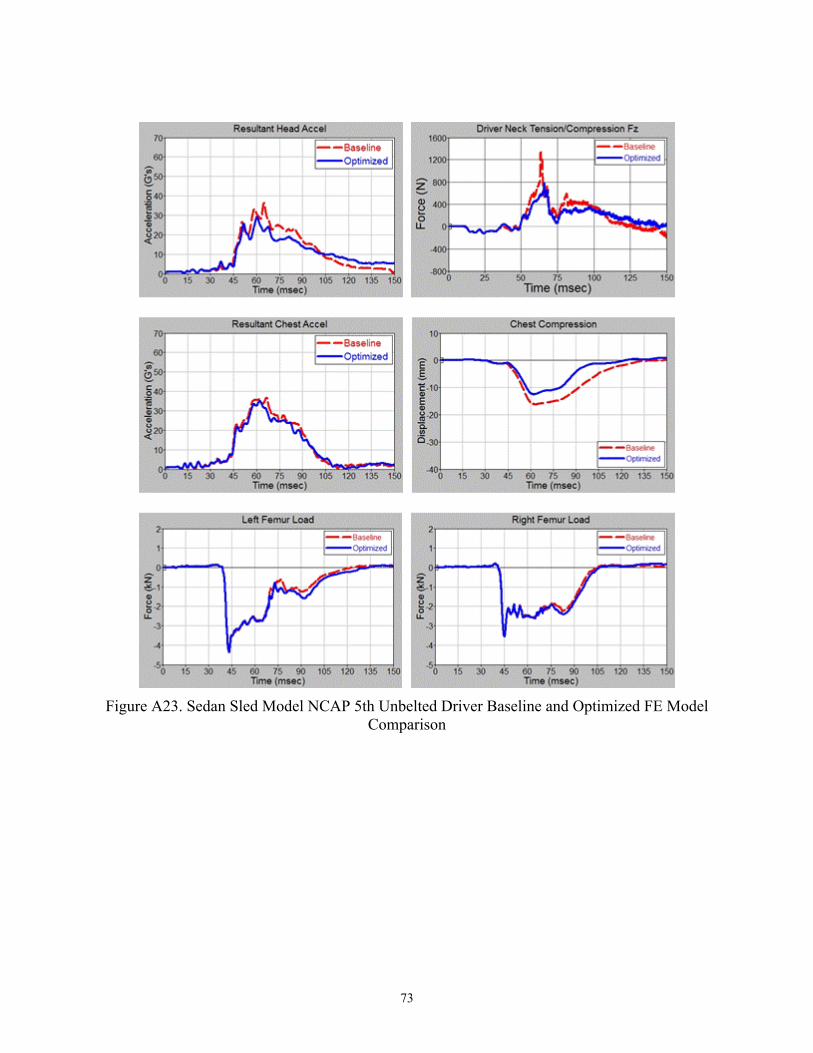
73
Figure A23. Sedan Sled Model NCAP 5th Unbelted Driver Baseline and Optimized FE Model
Comparison
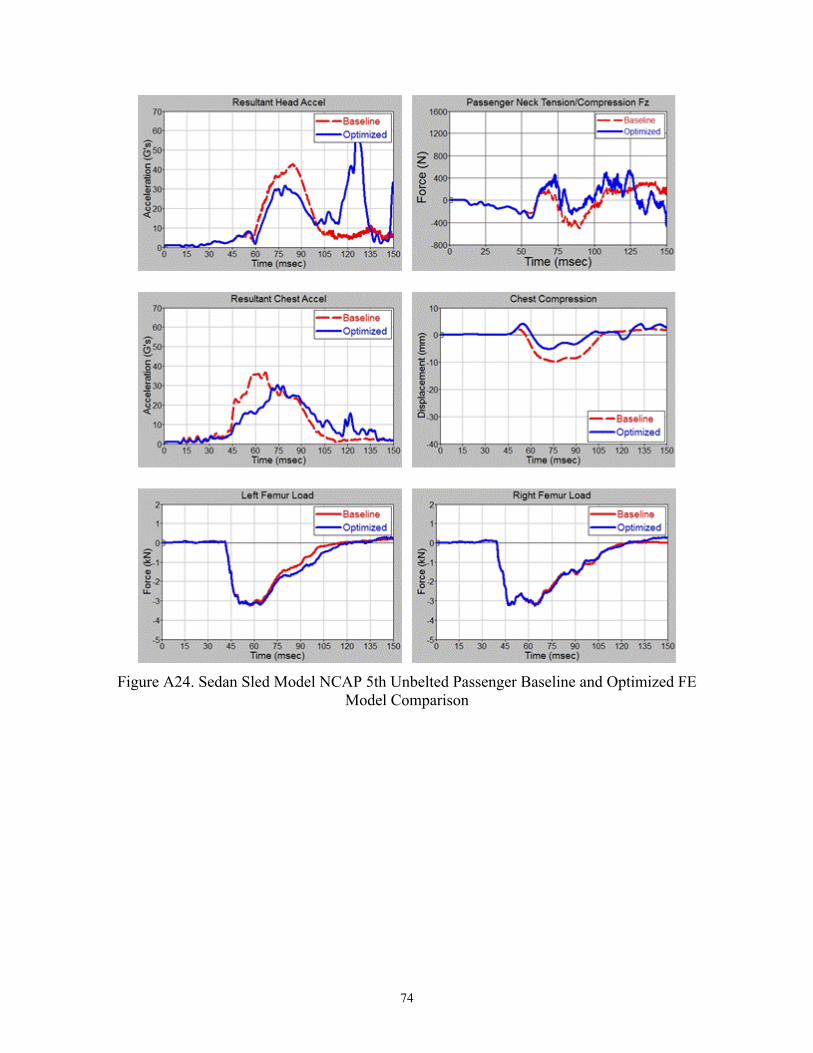
74
Figure A24. Sedan Sled Model NCAP 5th Unbelted Passenger Baseline and Optimized FE
Model Comparison
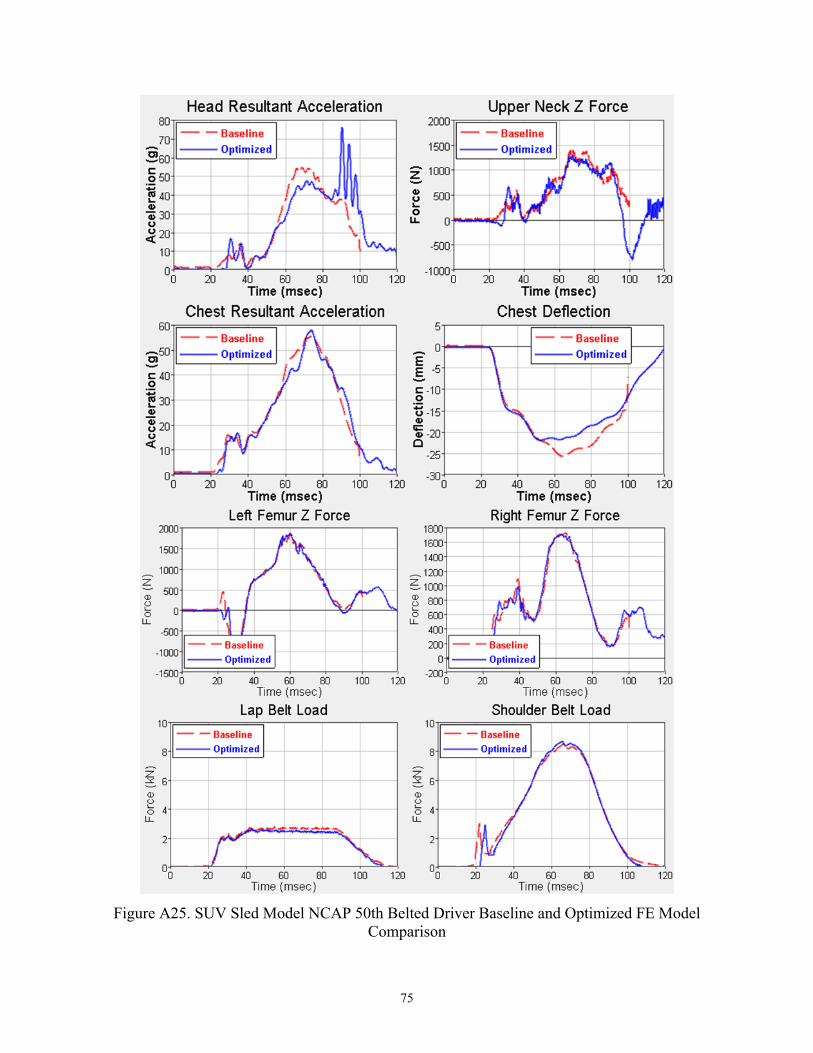
75
Figure A25. SUV Sled Model NCAP 50th Belted Driver Baseline and Optimized FE Model
Comparison
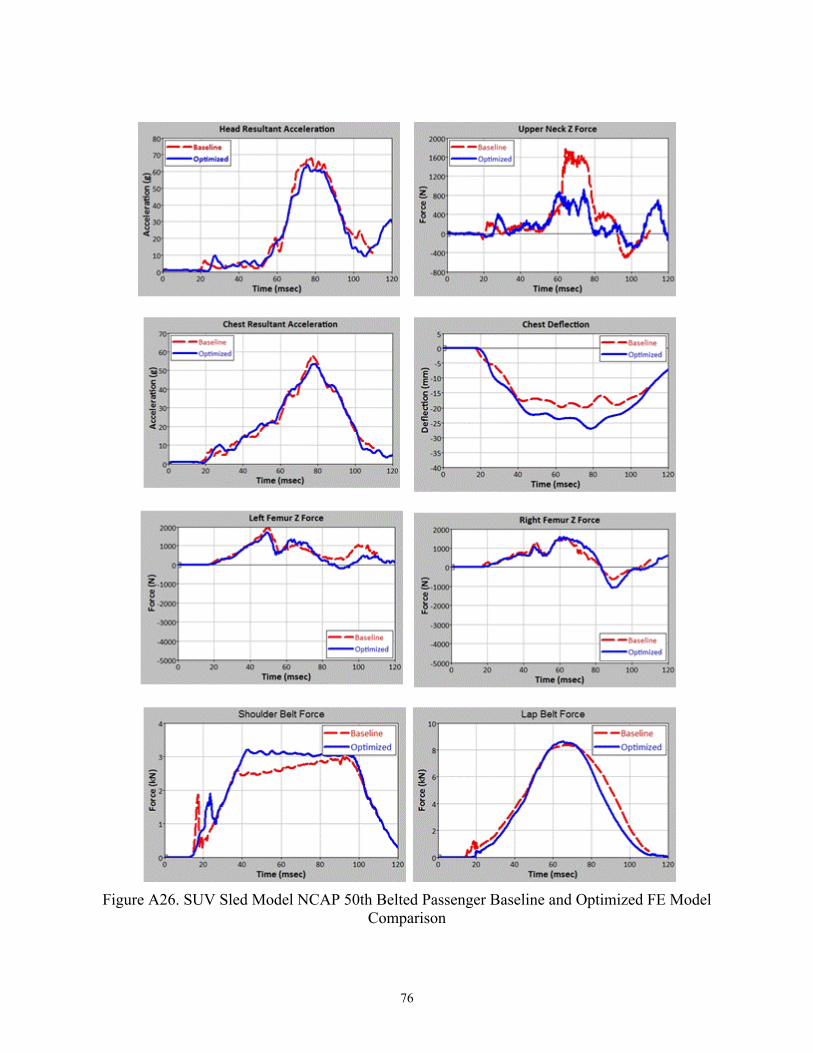
76
Figure A26. SUV Sled Model NCAP 50th Belted Passenger Baseline and Optimized FE Model
Comparison
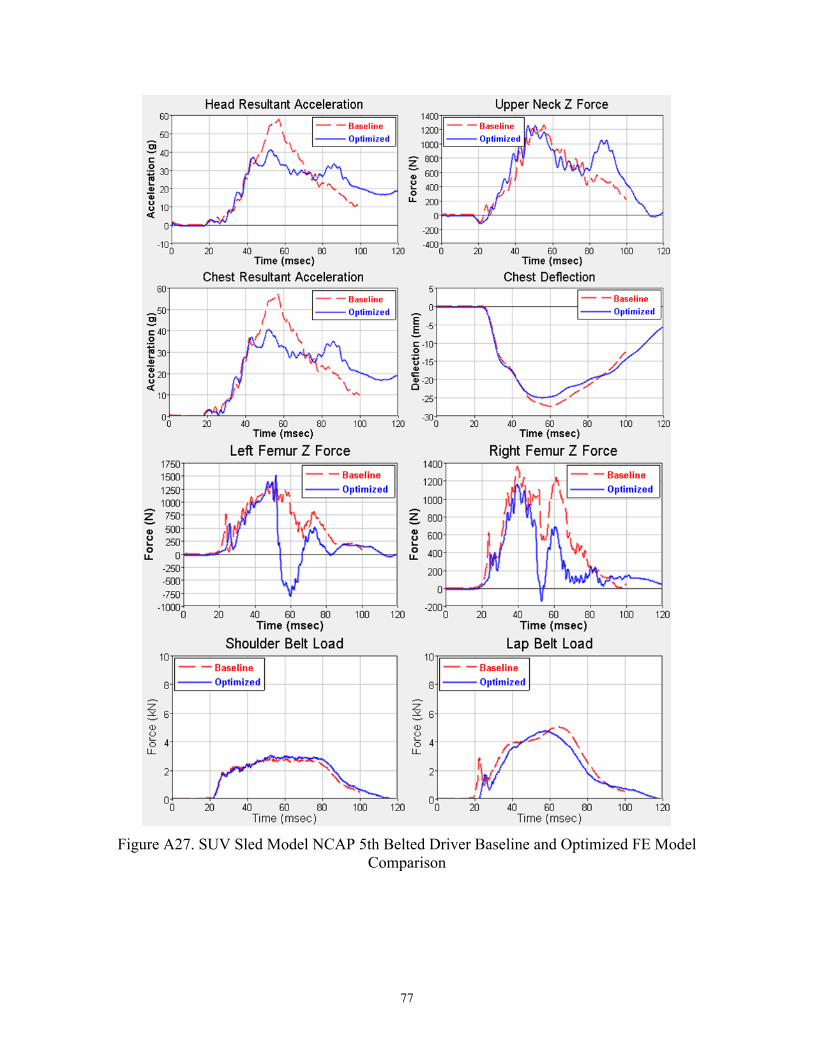
77
Figure A27. SUV Sled Model NCAP 5th Belted Driver Baseline and Optimized FE Model
Comparison
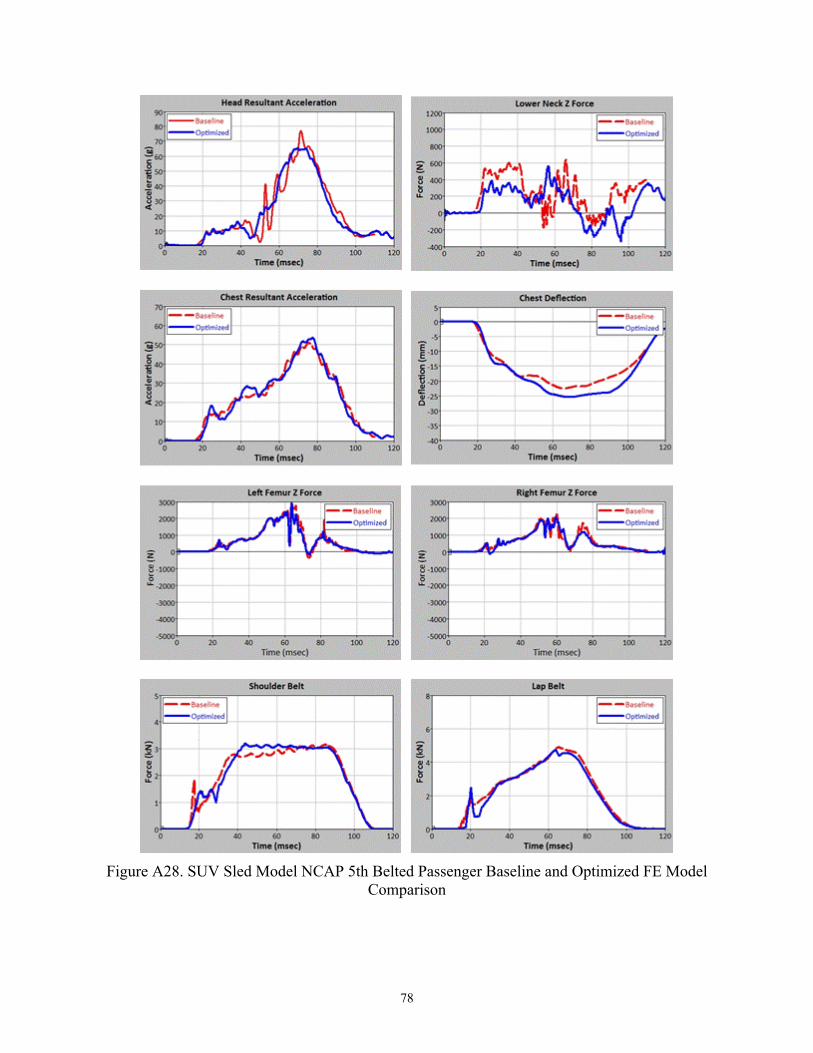
78
Figure A28. SUV Sled Model NCAP 5th Belted Passenger Baseline and Optimized FE Model
Comparison
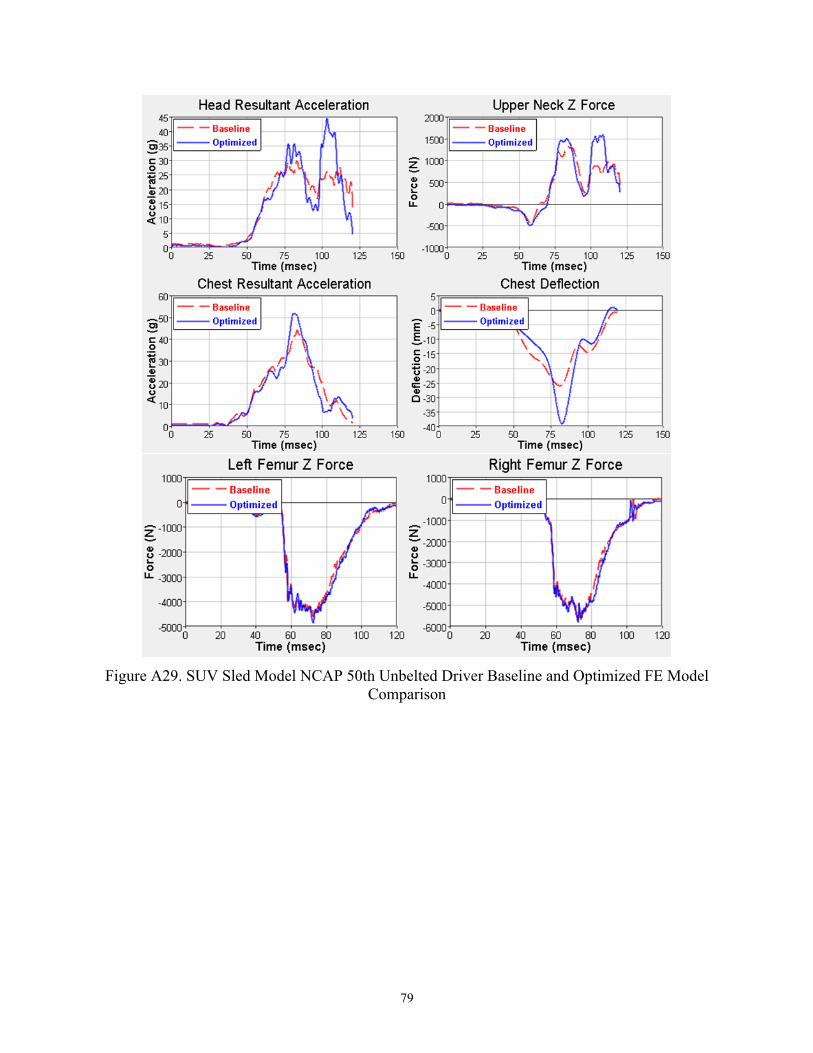
79
Figure A29. SUV Sled Model NCAP 50th Unbelted Driver Baseline and Optimized FE Model
Comparison
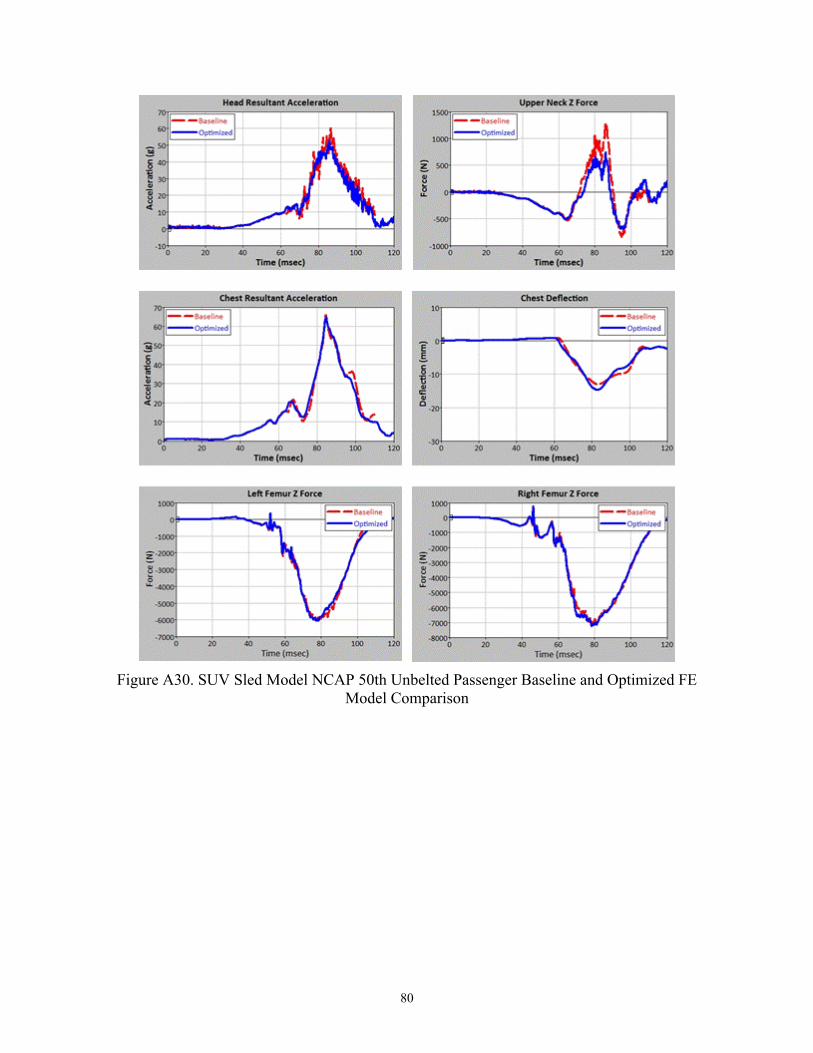
80
Figure A30. SUV Sled Model NCAP 50th Unbelted Passenger Baseline and Optimized FE
Model Comparison
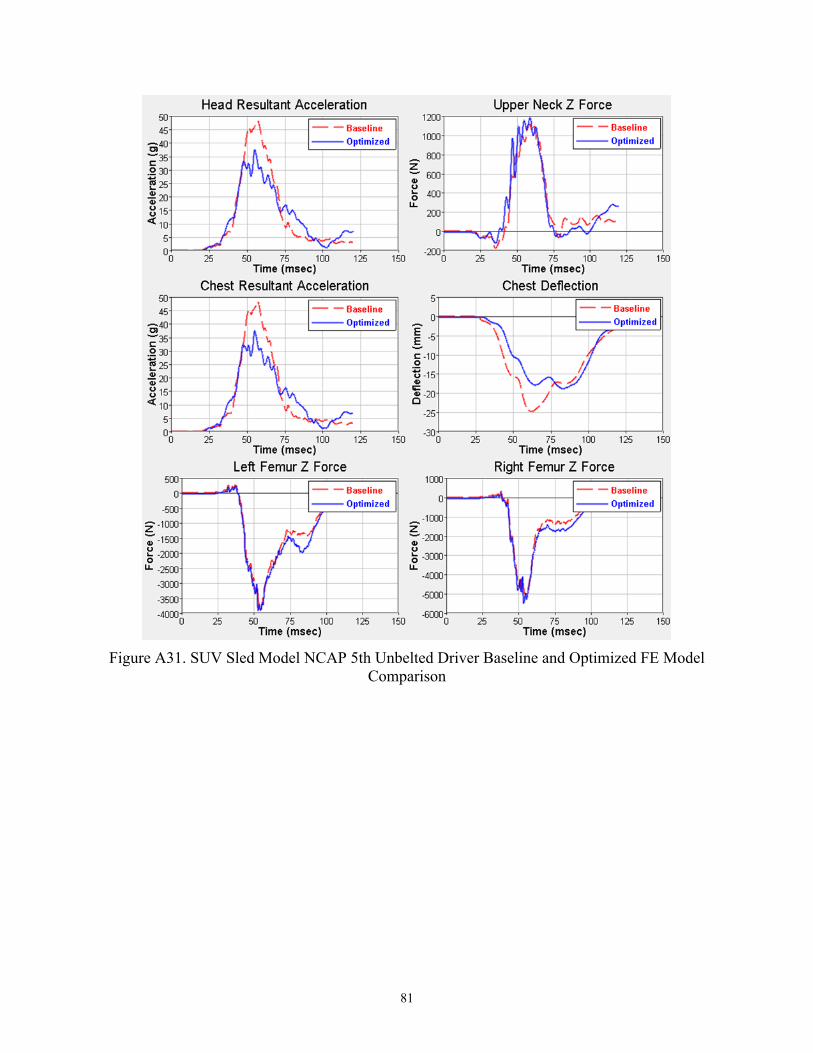
81
Figure A31. SUV Sled Model NCAP 5th Unbelted Driver Baseline and Optimized FE Model
Comparison
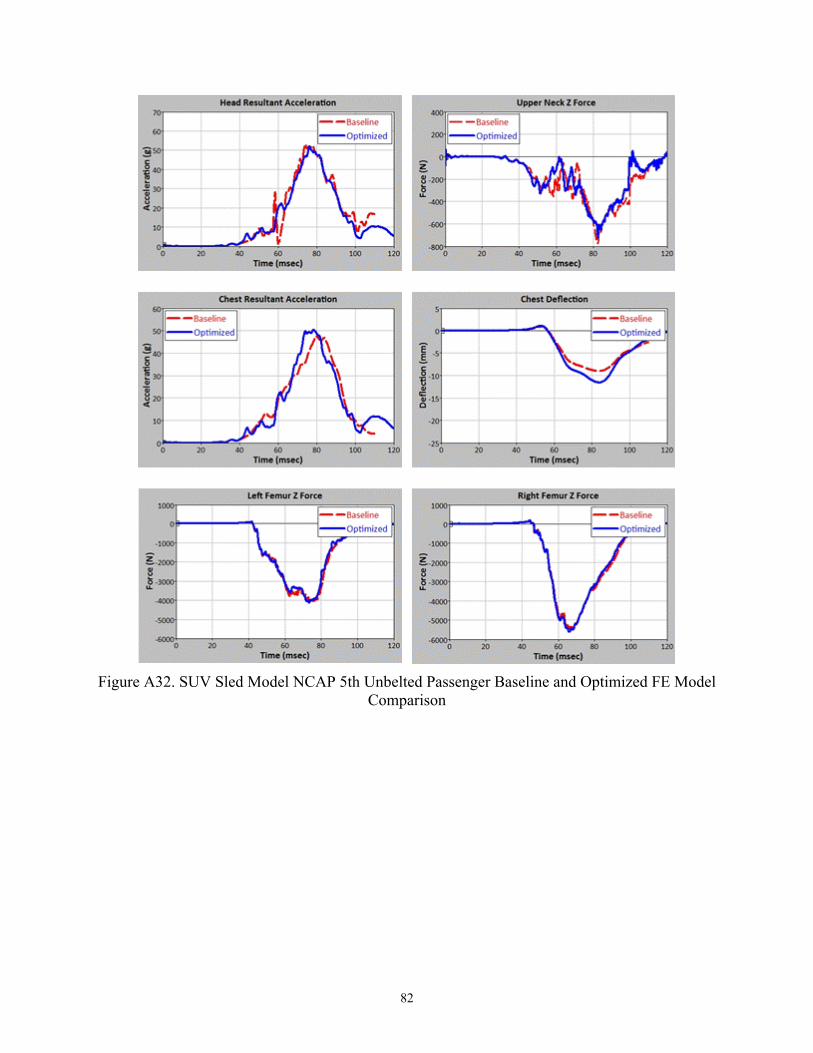
82
Figure A32. SUV Sled Model NCAP 5th Unbelted Passenger Baseline and Optimized FE Model
Comparison
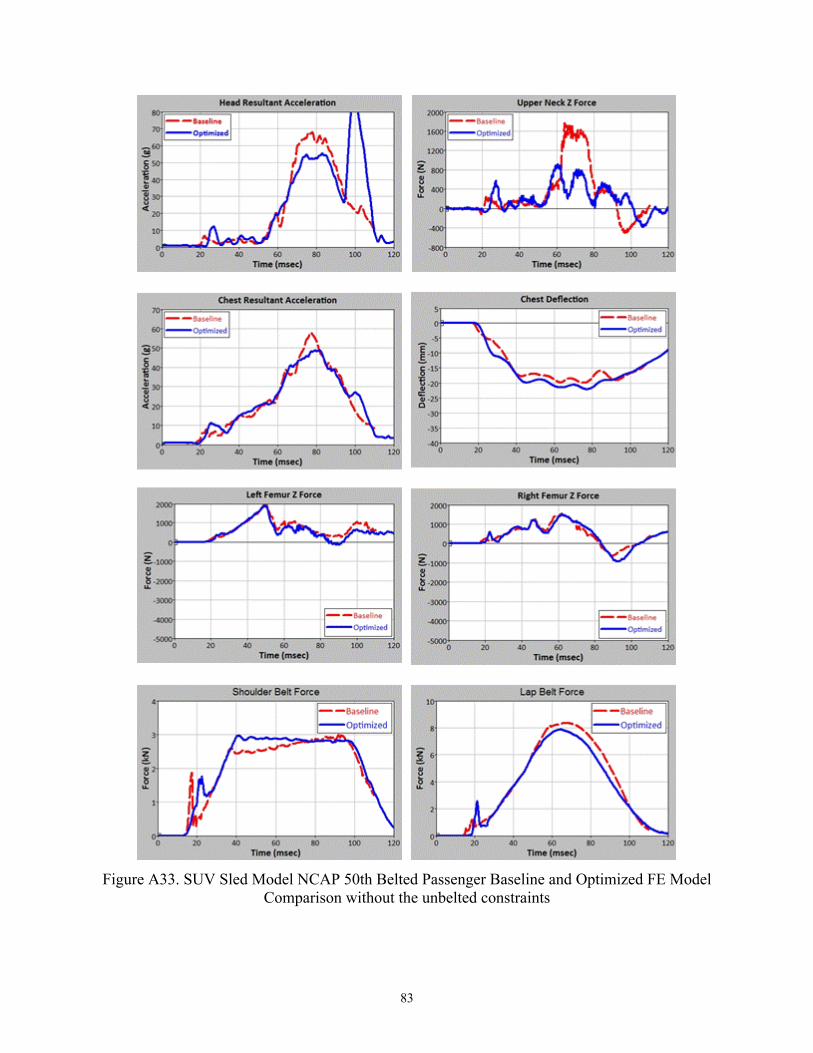
83
Figure A33. SUV Sled Model NCAP 50th Belted Passenger Baseline and Optimized FE Model
Comparison without the unbelted constraints
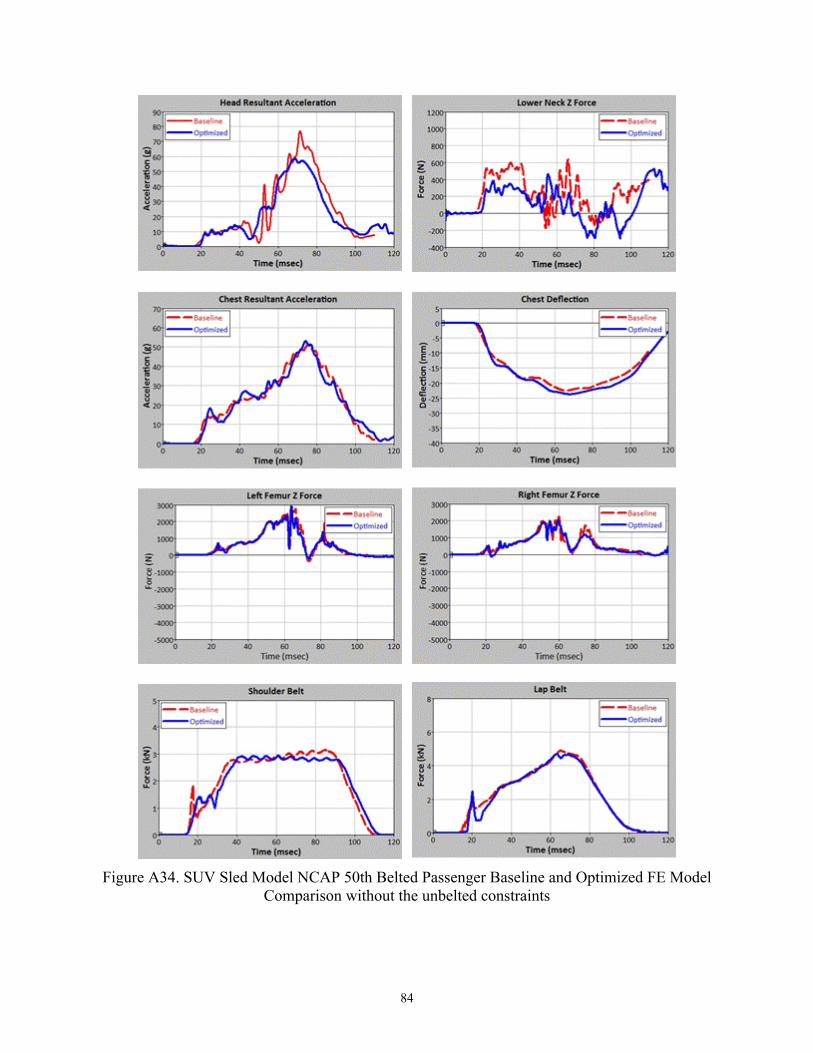
84
Figure A34. SUV Sled Model NCAP 50th Belted Passenger Baseline and Optimized FE Model
Comparison without the unbelted constraints
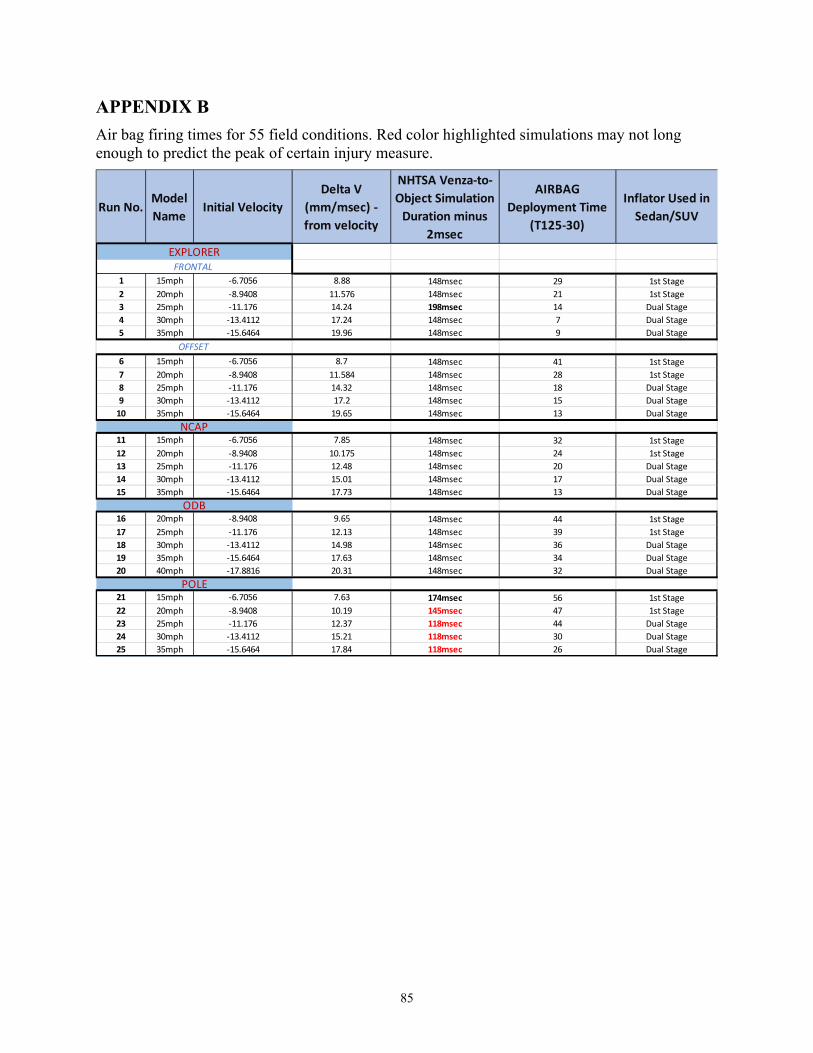
85
APPENDIX B Air bag firing times for 55 field conditions. Red color highlighted simulations may not long enough to predict the peak of certain injury measure.
Run No.Model Name
Initial VelocityDelta V
(mm/msec) - from velocity
NHTSA Venza-to-Object Simulation
Duration minus 2msec
AIRBAG Deployment Time
(T125-30)
Inflator Used in Sedan/SUV
1 15mph -6.7056 8.88 148msec 29 1st Stage2 20mph -8.9408 11.576 148msec 21 1st Stage3 25mph -11.176 14.24 198msec 14 Dual Stage4 30mph -13.4112 17.24 148msec 7 Dual Stage5 35mph -15.6464 19.96 148msec 9 Dual Stage
6 15mph -6.7056 8.7 148msec 41 1st Stage7 20mph -8.9408 11.584 148msec 28 1st Stage8 25mph -11.176 14.32 148msec 18 Dual Stage9 30mph -13.4112 17.2 148msec 15 Dual Stage
10 35mph -15.6464 19.65 148msec 13 Dual Stage
11 15mph -6.7056 7.85 148msec 32 1st Stage12 20mph -8.9408 10.175 148msec 24 1st Stage13 25mph -11.176 12.48 148msec 20 Dual Stage14 30mph -13.4112 15.01 148msec 17 Dual Stage15 35mph -15.6464 17.73 148msec 13 Dual Stage
16 20mph -8.9408 9.65 148msec 44 1st Stage17 25mph -11.176 12.13 148msec 39 1st Stage18 30mph -13.4112 14.98 148msec 36 Dual Stage19 35mph -15.6464 17.63 148msec 34 Dual Stage20 40mph -17.8816 20.31 148msec 32 Dual Stage
21 15mph -6.7056 7.63 174msec 56 1st Stage22 20mph -8.9408 10.19 145msec 47 1st Stage23 25mph -11.176 12.37 118msec 44 Dual Stage24 30mph -13.4112 15.21 118msec 30 Dual Stage25 35mph -15.6464 17.84 118msec 26 Dual Stage
POLE
OFFSET
FRONTALEXPLORER
NCAP
ODB
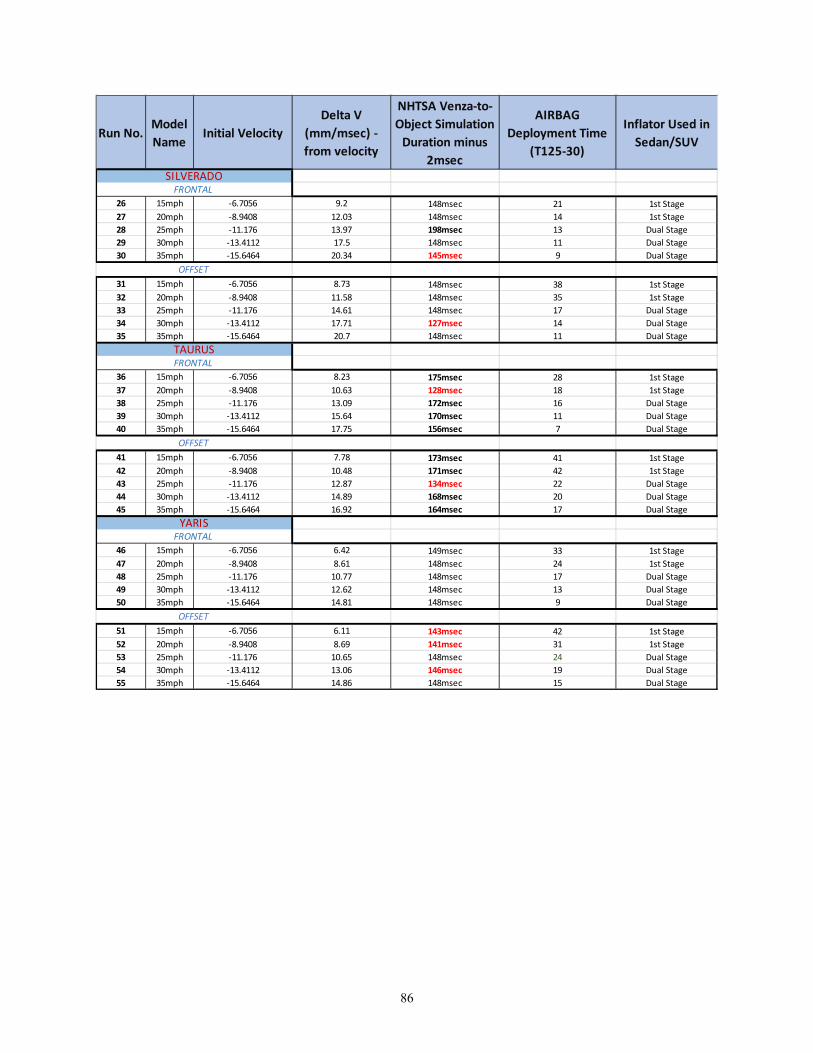
86
Run No.Model Name
Initial VelocityDelta V
(mm/msec) - from velocity
NHTSA Venza-to-Object Simulation
Duration minus 2msec
AIRBAG Deployment Time
(T125-30)
Inflator Used in Sedan/SUV
26 15mph -6.7056 9.2 148msec 21 1st Stage27 20mph -8.9408 12.03 148msec 14 1st Stage28 25mph -11.176 13.97 198msec 13 Dual Stage29 30mph -13.4112 17.5 148msec 11 Dual Stage30 35mph -15.6464 20.34 145msec 9 Dual Stage
31 15mph -6.7056 8.73 148msec 38 1st Stage32 20mph -8.9408 11.58 148msec 35 1st Stage33 25mph -11.176 14.61 148msec 17 Dual Stage34 30mph -13.4112 17.71 127msec 14 Dual Stage35 35mph -15.6464 20.7 148msec 11 Dual Stage
36 15mph -6.7056 8.23 175msec 28 1st Stage37 20mph -8.9408 10.63 128msec 18 1st Stage38 25mph -11.176 13.09 172msec 16 Dual Stage39 30mph -13.4112 15.64 170msec 11 Dual Stage40 35mph -15.6464 17.75 156msec 7 Dual Stage
41 15mph -6.7056 7.78 173msec 41 1st Stage42 20mph -8.9408 10.48 171msec 42 1st Stage43 25mph -11.176 12.87 134msec 22 Dual Stage44 30mph -13.4112 14.89 168msec 20 Dual Stage45 35mph -15.6464 16.92 164msec 17 Dual Stage
46 15mph -6.7056 6.42 149msec 33 1st Stage47 20mph -8.9408 8.61 148msec 24 1st Stage48 25mph -11.176 10.77 148msec 17 Dual Stage49 30mph -13.4112 12.62 148msec 13 Dual Stage50 35mph -15.6464 14.81 148msec 9 Dual Stage
51 15mph -6.7056 6.11 143msec 42 1st Stage52 20mph -8.9408 8.69 141msec 31 1st Stage53 25mph -11.176 10.65 148msec 24 Dual Stage54 30mph -13.4112 13.06 146msec 19 Dual Stage55 35mph -15.6464 14.86 148msec 15 Dual Stage
OFFSET
FRONTAL
OFFSET
SILVERADOFRONTAL
OFFSET
TAURUS
YARISFRONTAL
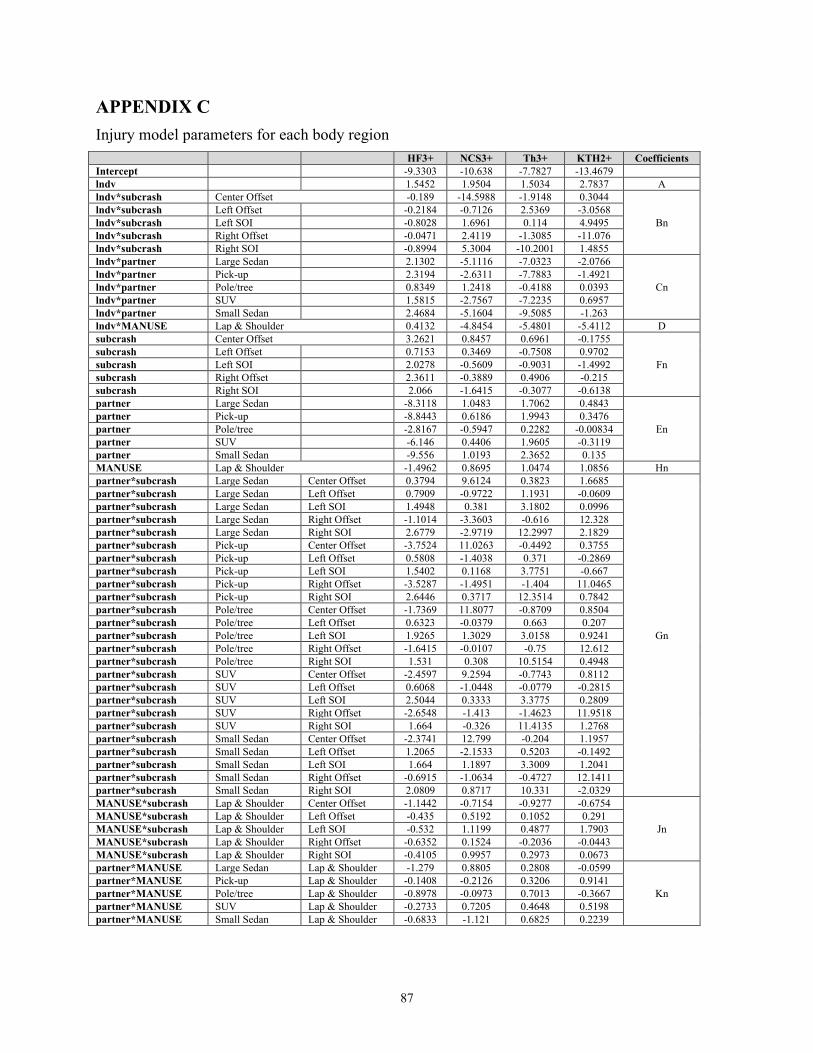
87
APPENDIX C Injury model parameters for each body region HF3+ NCS3+ Th3+ KTH2+ Coefficients Intercept -9.3303 -10.638 -7.7827 -13.4679 lndv 1.5452 1.9504 1.5034 2.7837 A lndv*subcrash Center Offset -0.189 -14.5988 -1.9148 0.3044
Bn lndv*subcrash Left Offset -0.2184 -0.7126 2.5369 -3.0568 lndv*subcrash Left SOI -0.8028 1.6961 0.114 4.9495 lndv*subcrash Right Offset -0.0471 2.4119 -1.3085 -11.076 lndv*subcrash Right SOI -0.8994 5.3004 -10.2001 1.4855 lndv*partner Large Sedan 2.1302 -5.1116 -7.0323 -2.0766
Cn lndv*partner Pick-up 2.3194 -2.6311 -7.7883 -1.4921 lndv*partner Pole/tree 0.8349 1.2418 -0.4188 0.0393 lndv*partner SUV 1.5815 -2.7567 -7.2235 0.6957 lndv*partner Small Sedan 2.4684 -5.1604 -9.5085 -1.263 lndv*MANUSE Lap & Shoulder 0.4132 -4.8454 -5.4801 -5.4112 D subcrash Center Offset 3.2621 0.8457 0.6961 -0.1755
Fn subcrash Left Offset 0.7153 0.3469 -0.7508 0.9702 subcrash Left SOI 2.0278 -0.5609 -0.9031 -1.4992 subcrash Right Offset 2.3611 -0.3889 0.4906 -0.215 subcrash Right SOI 2.066 -1.6415 -0.3077 -0.6138 partner Large Sedan -8.3118 1.0483 1.7062 0.4843
En partner Pick-up -8.8443 0.6186 1.9943 0.3476 partner Pole/tree -2.8167 -0.5947 0.2282 -0.00834 partner SUV -6.146 0.4406 1.9605 -0.3119 partner Small Sedan -9.556 1.0193 2.3652 0.135 MANUSE Lap & Shoulder -1.4962 0.8695 1.0474 1.0856 Hn partner*subcrash Large Sedan Center Offset 0.3794 9.6124 0.3823 1.6685
Gn
partner*subcrash Large Sedan Left Offset 0.7909 -0.9722 1.1931 -0.0609 partner*subcrash Large Sedan Left SOI 1.4948 0.381 3.1802 0.0996 partner*subcrash Large Sedan Right Offset -1.1014 -3.3603 -0.616 12.328 partner*subcrash Large Sedan Right SOI 2.6779 -2.9719 12.2997 2.1829 partner*subcrash Pick-up Center Offset -3.7524 11.0263 -0.4492 0.3755 partner*subcrash Pick-up Left Offset 0.5808 -1.4038 0.371 -0.2869 partner*subcrash Pick-up Left SOI 1.5402 0.1168 3.7751 -0.667 partner*subcrash Pick-up Right Offset -3.5287 -1.4951 -1.404 11.0465 partner*subcrash Pick-up Right SOI 2.6446 0.3717 12.3514 0.7842 partner*subcrash Pole/tree Center Offset -1.7369 11.8077 -0.8709 0.8504 partner*subcrash Pole/tree Left Offset 0.6323 -0.0379 0.663 0.207 partner*subcrash Pole/tree Left SOI 1.9265 1.3029 3.0158 0.9241 partner*subcrash Pole/tree Right Offset -1.6415 -0.0107 -0.75 12.612 partner*subcrash Pole/tree Right SOI 1.531 0.308 10.5154 0.4948 partner*subcrash SUV Center Offset -2.4597 9.2594 -0.7743 0.8112 partner*subcrash SUV Left Offset 0.6068 -1.0448 -0.0779 -0.2815 partner*subcrash SUV Left SOI 2.5044 0.3333 3.3775 0.2809 partner*subcrash SUV Right Offset -2.6548 -1.413 -1.4623 11.9518 partner*subcrash SUV Right SOI 1.664 -0.326 11.4135 1.2768 partner*subcrash Small Sedan Center Offset -2.3741 12.799 -0.204 1.1957 partner*subcrash Small Sedan Left Offset 1.2065 -2.1533 0.5203 -0.1492 partner*subcrash Small Sedan Left SOI 1.664 1.1897 3.3009 1.2041 partner*subcrash Small Sedan Right Offset -0.6915 -1.0634 -0.4727 12.1411 partner*subcrash Small Sedan Right SOI 2.0809 0.8717 10.331 -2.0329 MANUSE*subcrash Lap & Shoulder Center Offset -1.1442 -0.7154 -0.9277 -0.6754
Jn MANUSE*subcrash Lap & Shoulder Left Offset -0.435 0.5192 0.1052 0.291 MANUSE*subcrash Lap & Shoulder Left SOI -0.532 1.1199 0.4877 1.7903 MANUSE*subcrash Lap & Shoulder Right Offset -0.6352 0.1524 -0.2036 -0.0443 MANUSE*subcrash Lap & Shoulder Right SOI -0.4105 0.9957 0.2973 0.0673 partner*MANUSE Large Sedan Lap & Shoulder -1.279 0.8805 0.2808 -0.0599
Kn partner*MANUSE Pick-up Lap & Shoulder -0.1408 -0.2126 0.3206 0.9141 partner*MANUSE Pole/tree Lap & Shoulder -0.8978 -0.0973 0.7013 -0.3667 partner*MANUSE SUV Lap & Shoulder -0.2733 0.7205 0.4648 0.5198 partner*MANUSE Small Sedan Lap & Shoulder -0.6833 -1.121 0.6825 0.2239
DOT HS 812 232 January 2016
11956-010716-v2