Embed Size (px)
Citation preview
Journal of Coastal Research, Special Issue 56, 2009
Journal of Coastal Research SI 56 1607 - 1611 ICS2009 (Proceedings) Portugal ISSN 0749-0258
Evaluation of Beach Hydromorphological Behaviour and Classification Using Image Classification Techniques
A. C. Teodoro † J. Pais-Barbosa † F. Veloso-Gomes ‡ and F. Taveira-Pinto ‡ †Centro de Investigação em Ciências Geo-Espaciais, Faculty of Sciences, University of Porto Porto, 4169-007, Portugal [email protected], [email protected],
‡Hydraulics and Water Resources Institute, Faculty of Engineering, University of Porto Porto, 4200-465, Portugal [email protected], [email protected]
ABSTRACT
TEODORO, A. C., PAIS-BARBOSA, J., VELOSO-GOMES, F., and TAVEIRA-PINTO, F., 2009. Evaluation of Beach Hydromorphological Behaviour and Classification Using Image Classification Techniques. Journal of Coastal Research, SI 56 (Proceedings of the 10th International Coastal Symposium), 1607 – 1611. Lisbon, Portugal, ISSN 0749-0258.
The development of new techniques on coastal studies, such as Geographic Information Technologies (GIT), using aerial photography and high resolution satellite images is an important issue on Coastal Engineering and Geo-Spatial Sciences research. Several aerial photographs (between 1958 and 2003), using visual interpretation on a Geographic Information System (GIS) environment, were used on the identification of the coastal features in a high energetic selected area of the NW Portuguese coast, between Esmoriz and Mira beach. The main goal of this work, based on the image classification techniques, is to identify and to analyse morphological features and hydrodynamic patterns and to compare these results with the visual interpretation. To achieve these objectives different techniques of image analysis were tested. Different supervised classification algorithms such as parallelepiped, minimum distance and maximum likelihood, were applied in order to identify morphological features and hydrodynamic patterns. Unsupervised classification algorithms (clustering) were also employed in order to determine the natural groupings or structures in the aerial photographs. The supervised classification algorithm presents good performance, demonstrated by the results of the confusion matrix, Kappa coefficient and overall accuracy. The parallelepiped classifier presents an overall accuracy of 95.65% and a Kappa statistics of 0.95661. The results for maximum likelihood were similar, 95.85% and 0.95840, respectively. The minimum distance classifier presents lower performance. The unsupervised classification algorithms (K-means and ISODATA) allows for indentify several classes such as breaking zone, beach face and beach. The results of the supervised and unsupervised classification algorithms were compared with the visual identification. The obtained results were in agreement with the visual interpretation. ADITIONAL INDEX WORDS: Coastal features, Image classification algorithms, Geographic information technologies
INTRODUCTION It is noticed for the Portuguese west coast, especially for its
central region, the occurrence of important erosion events since the begging of the XIX century. The reasons pointed out in several works for this process are: the sediment supply reduction as consequence of river Douro dam construction, dredging activities, coastal defences and harbour breakwaters, urban pressure, among others (TEODORO et al., 2007).
The majority of studies done for the Portuguese coastal zone are related with beach and shore, focusing essentially in coastline retreat, beach profile evolution, dune overtopping and overwashing. Only a few studies were related with nearshore, and a restrict number of them used Geographical Information Technologies (GIT).
Evaluation of beach hydromorphological behaviour and its classification is highly complex. This complexity results from the interaction between wave climate and solid boundaries (beaches, groins, seawalls, among others), occurrence of dynamic events, nonlinearity of phenomena and interactions, different temporal scales (from seconds to hundreds of years), and difficulty on
getting historical data (hydrodynamic, geomorphologic and topographic) reliable and continuous in time.
To understand physical, morphological and geomorphologic relationships is vital to know the dynamics of coastal zone as well as the erosion process. Knowledge and understand interaction between land and sea, must include by features and patterns called hydroforms and hydromorphology.
Understanding coastal hydroforms and hydromorphology is also very important to know the behaviour of nearshore and beach. Such knowledge is vital to improve coastal management guidelines definition to medium and long term strategies.
PAIS-BARBOSA et al., (2005a, 2005b and 2007) and PAIS-BARBOSA (2007), developed a methodology to identify, to measure and to classify hydroforms and hydromorphologies, as well as to classify beach morphological stage. This methodology consisted on the visual analysis of vertical aerial photographs datasets in a Geographical Information System (GIS) environment.
One disadvantage of this methodology is the time consumption to analyze the photographs datasets and to measure the hydroforms and hydromorphologies identified. Thus it is important to develop a method that reduce time analyses and that
1607
Journal of Coastal Research, Special Issue 56, 2009
Evaluation of Beach Hydromorphological Behaviour and Classification Using Image Classification Techniques
could easily identify and classify the hydroforms and hydromorphologies.
PAIS-BARBOSA et al., (2005a, 2005b and 2007) and PAIS-BARBOSA (2007), also tested different techniques of image analysis. This former analysis consists in a Matlab® 7.0 script that uses the image processing toolbox (Sobel Edge filter and Canny Edge Detection filter), and in a supervised classification through PCI Geomatica® software, that showed good results on the identification of morphological and hydrodynamic features and patterns. However, the accuracy of the tested algorithms was not evaluated.
Therefore, the main goal of this work is to identify and to analyse morphological features and hydrodynamic patterns, based on the image classification techniques, and to compare with the visual identification results.
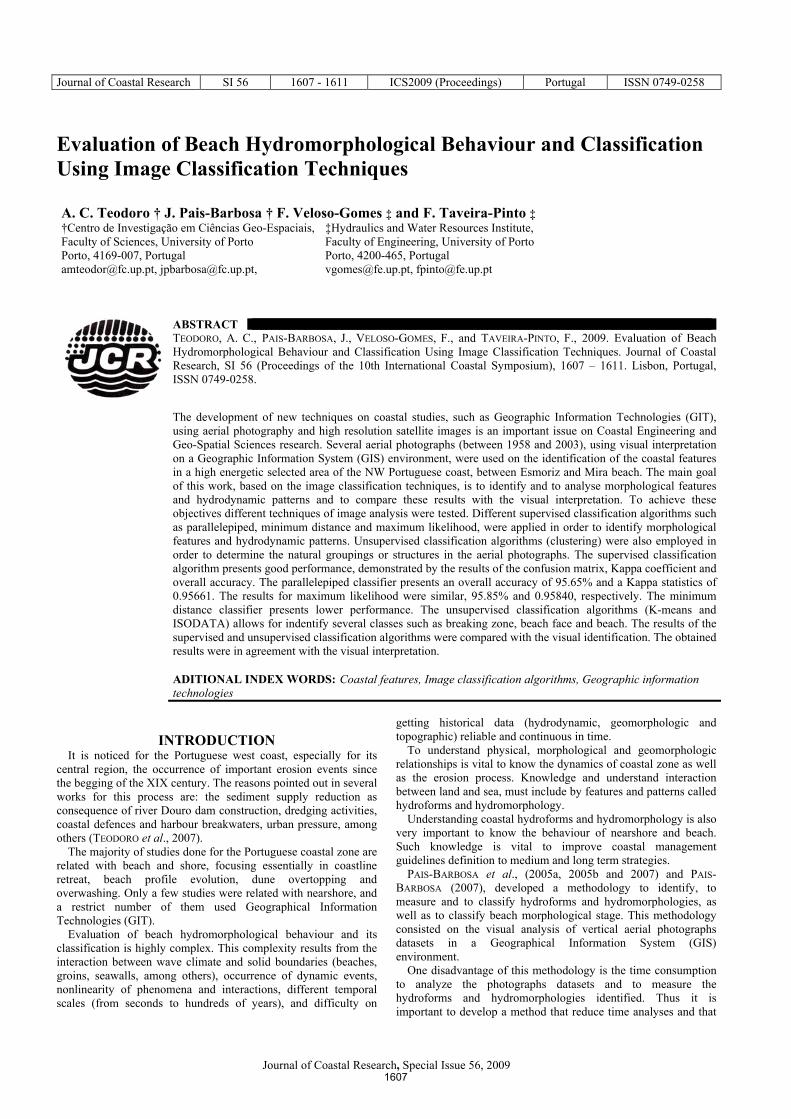
Study Area The coastal area under analysis is located on the Portuguese
northwest coast, a very dynamic and fragile one that is constantly changing. It is bounded by a small lagoon (Barrinha de Esmoriz) in the north and to the south by Furadouro settlement (Figure 1),
with an extension of 11.5 km. The land use includes urban settlement and forest areas.
The study area is composed by beach systems very dynamic, adjusting to the wave climate and tide range. These changes can be so significant that morphological features and hydrodynamic patterns could be replaced in a few days to new ones better adapted to new wave and tidal conditions.
The tide regime is semidiurnal, reaching a range of up to 4.0 m for spring tides (mesotidal). The littoral drift acts mainly in a north-south direction.
The wave climate is characterized by medium significant wave heights from 2 to 3 m, with periods ranging from 8 to 12 s and storm significant wave heights exceeding 8 m, with periods reaching 16 to 18 s. Wave direction exhibits the higher frequencies and intensities in the NW quadrant with 43.8 % of occurrence, WNW with 28.0% and NNW with 21.2% (VELOSO-GOMES et al., 2006).
From a geological point of view, this area is a plain sandy coast, formed by sandy beaches and sandy dunes with small elevations, with highly dynamic coastal hydroforms and hydromorphologies that change continuously.
METHODOLOGY The overall objective of image classification procedures is to automatically categorize all pixels in an image into classes or themes (LILLESAND AND KIERFER, 2000). Classification procedures can be divided in two types: supervised classification and unsupervised classification.
In a supervised classification, the analyst identifies in the imagery homogeneous representative samples of the different surface cover types (information classes) of interest, called training areas. The numerical information in all spectral bands for the pixels comprising these areas are used to "train" the computer to recognize spectrally similar areas for each class. The algorithm determines the numerical "signatures" for each training class. After, each pixel in the image is compared to these signatures and labeled as the class it most closely "resembles" digitally.
Unsupervised classification is a method which examines a large number of unknown pixels and divides into a number of classes based on natural groupings present in the image values. The unsupervised classification does not require analyst-specified training data. The basic premise is that values within a given cover type should be closer in the measurement space, whereas data in different classes should be comparatively well separated. The classes that result from unsupervised classification are spectral classes which are based on natural groupings of the image values, the identity of the spectral class will not be initially known, must be compared with classified data from reference data to determine the identity and informational values of the spectral classes (PCI, 2000; LILLESAND AND KIEFER, 2000).
Supervised Classification In the supervised classification stage, three algorithms were
tested: parallelepiped with maximum likelihood as tie breaker, minimum distance and maximum likelihood.
The parallelepiped classifier uses the threshold of each class signature to determine if a given pixel falls within the class or not. The thresholds specify the dimensions (in standard deviation units) of each side of a parallelepiped surrounding the mean of the class in feature space. If the pixel falls inside the parallelepiped, it is assigned to the class. However, if the pixel falls within more than one class, it is put in the overlap class. If the pixel does not fall inside any class, it is assigned to the null class.
Figure 1. Study area.
1608
Journal of Coastal Research, Special Issue 56, 2009
Teodoro et al.
The full maximum likelihood classifier uses the Gaussian threshold stored in each class signature to determine if a given pixel falls within the class or not. The threshold is the radius (in standard deviation units) of a hyperellipse surrounding the mean of the class in the feature space. If the pixel falls inside the hyperellipse, it is assigned to the class. The class bias is used to resolve overlap between classes, and weights one class in favour of another. If the pixel does not fall inside any class, it is assigned to the null class. The maximum likelihood classifier is considered to give more `accurate' results than parallelepiped classification.
In the minimum distance classifier, the distances between the pixel to be classified and each class centre are compared. The pixel is assigned to the class whose centre is the closest to the pixel.
The Kappa statistic is a measure of the difference between the actual agreement between reference data and an automated classifier and the change agreement between the reference data and a random classifier. Conceptually, it can be defined as:
accuracy change -1
accuracy change -accuracy observedKappa (1)
The Kappa statistics ranges between 0 and 1. A value of 0
suggests that a given classification is no better than a random assignment of pixels. A value between 0.80 and 1.00 means very good agreement.
Unsupervised Classification In the unsupervised classification stage, two algorithms were
tested: K-Means and ISODATA (Iterative Self-Organizing Data Analysis Techniques).
The K-Means algorithm samples a subset of the image during cluster means calculation. The size of each sample depends upon the amount of image data. Each pixel of the image data is assigned to the cluster whose mean vector is closest to the pixel vector. A new set of class mean vector is then calculated from the results of previous classification. The procedure continues until the number of iterations defined was completed.
The ISODATA classifier is identical to the K-Means algorithm. The operator also indicates the number of desired clusters but the difference between the two algorithms is that after each iteration, the ISODATA algorithm statistically examines each cluster (PCI, 2000). This algorithm is useful when the operator is not sure about the number of clusters to use.
RESULTS AND DISCUSSION The algorithms described in the methodology section were
applied to one photograph (year of 1996). The performance and accuracy of the supervised and unsupervised classification algorithms were evaluated in order to validate the visual interpretation already performed.
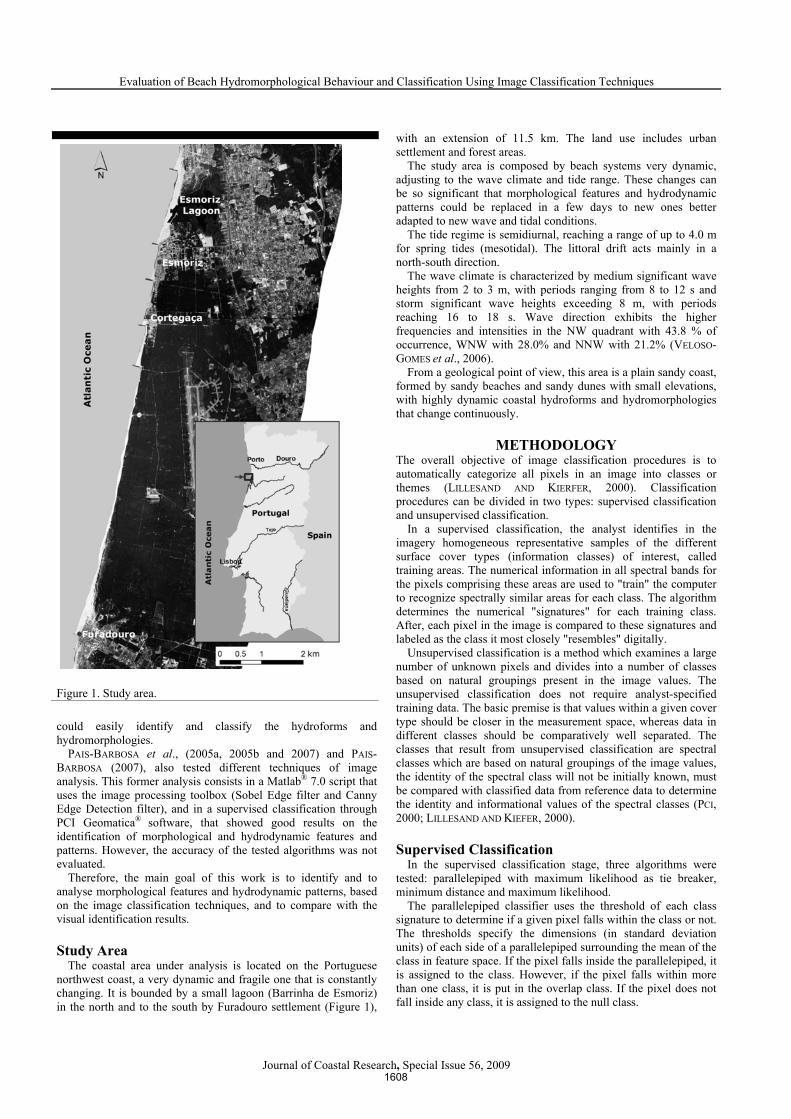
Supervised Classification The visual classification performed by PAIS-BARBOSA (2007)
and PAIS-BARBOSA et al., (2007) allowed the identification of several coastal features such as beach cusps/high tide cusps/erosion cusps (<100), beach megacusps and megacusps (100<<500), gigacusps (>500), berms, erosion berms, dune cliffs, vegetation lines, breaking zone/submerged bars (parallel, crescentic, transversal), mini and rip currents, rip heads, troughs, channels, maximum swash line (Figure 2).
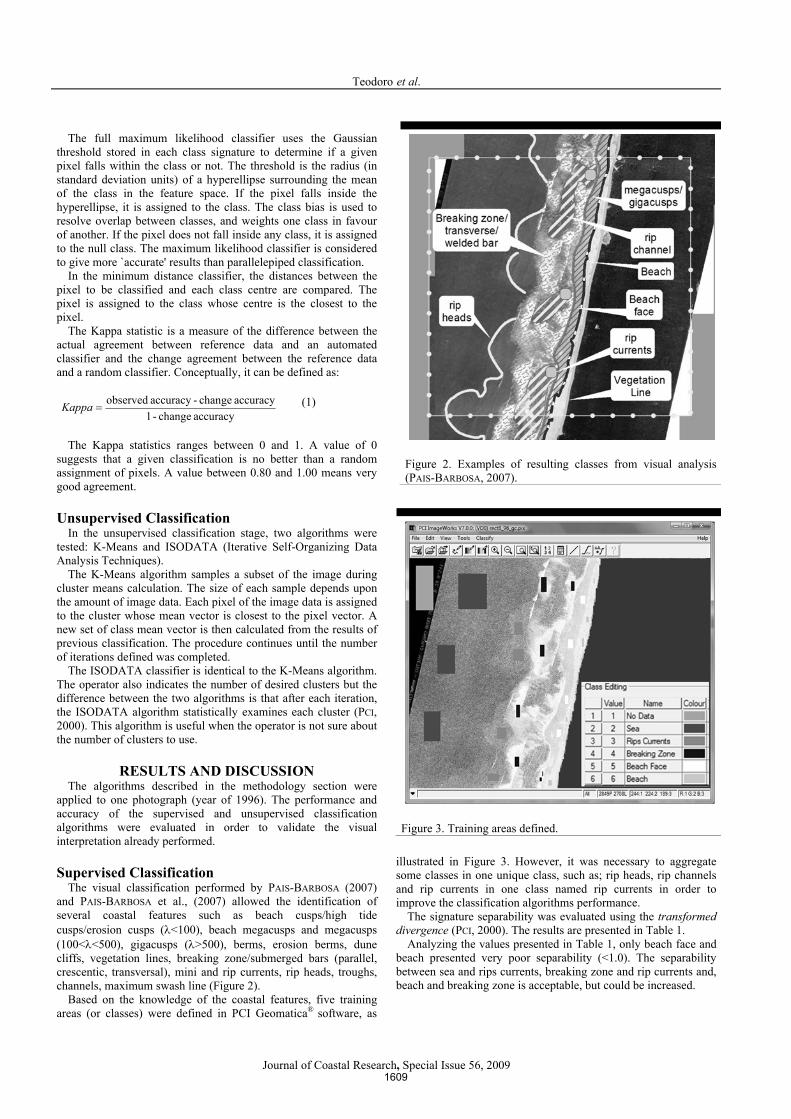
Based on the knowledge of the coastal features, five training areas (or classes) were defined in PCI Geomatica® software, as
illustrated in Figure 3. However, it was necessary to aggregate some classes in one unique class, such as; rip heads, rip channels and rip currents in one class named rip currents in order to improve the classification algorithms performance.
The signature separability was evaluated using the transformed divergence (PCI, 2000). The results are presented in Table 1.
Analyzing the values presented in Table 1, only beach face and beach presented very poor separability (<1.0). The separability between sea and rips currents, breaking zone and rip currents and, beach and breaking zone is acceptable, but could be increased.
Figure 2. Examples of resulting classes from visual analysis (PAIS-BARBOSA, 2007).
Figure 3. Training areas defined.
1609
Journal of Coastal Research, Special Issue 56, 2009
Evaluation of Beach Hydromorphological Behaviour and Classification Using Image Classification Techniques
The performance of the three tested algorithms was evaluated analyzing the confusion matrix (Table 2) and the Kappa coefficient and overall accuracy (Table 3). Table 1: Signature separability (transformed divergence). Class name Sea Rips
Currents Breaking
Zone Beach Face
Rips Currents 1.81850 Breaking Zone 1.99997 1.75614 Beach Face 2.00000 1.99931 1.96288 Beach 2.00000 1.99988 1.80489 0.95618 Table 2: Producer´s accuracy values (%) for supervised classification algorithms. Class name Parallelepiped Maximum
likelihood Minimum distance
Sea 97.36 97.51 90.62 Rips Currents 95.00 95.03 67.50 Breaking Zone 91.41 91.41 82.13 Beach Face 80.31 80.36 62.09 Beach 86.10 86.02 80.04
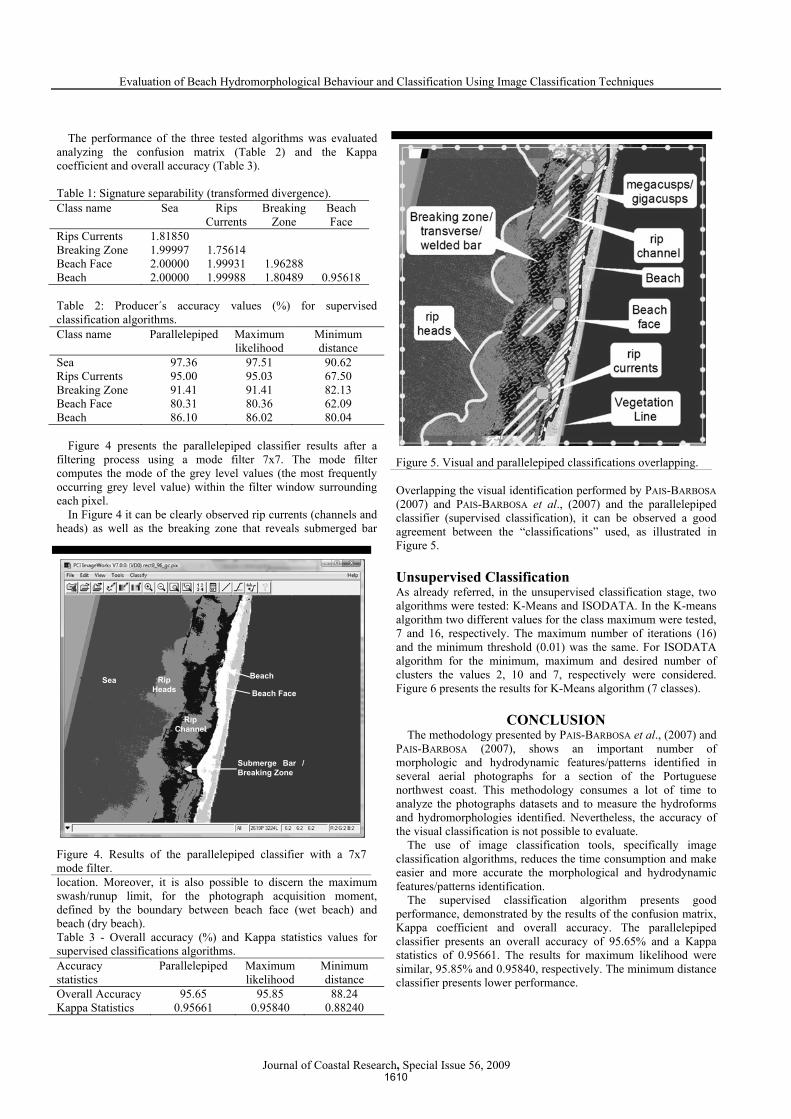
Figure 4 presents the parallelepiped classifier results after a
filtering process using a mode filter 7x7. The mode filter computes the mode of the grey level values (the most frequently occurring grey level value) within the filter window surrounding each pixel.
In Figure 4 it can be clearly observed rip currents (channels and heads) as well as the breaking zone that reveals submerged bar
location. Moreover, it is also possible to discern the maximum swash/runup limit, for the photograph acquisition moment, defined by the boundary between beach face (wet beach) and beach (dry beach). Table 3 - Overall accuracy (%) and Kappa statistics values for supervised classifications algorithms. Accuracy statistics
Parallelepiped Maximum likelihood
Minimum distance
Overall Accuracy 95.65 95.85 88.24 Kappa Statistics 0.95661 0.95840 0.88240
Overlapping the visual identification performed by PAIS-BARBOSA (2007) and PAIS-BARBOSA et al., (2007) and the parallelepiped classifier (supervised classification), it can be observed a good agreement between the “classifications” used, as illustrated in Figure 5.
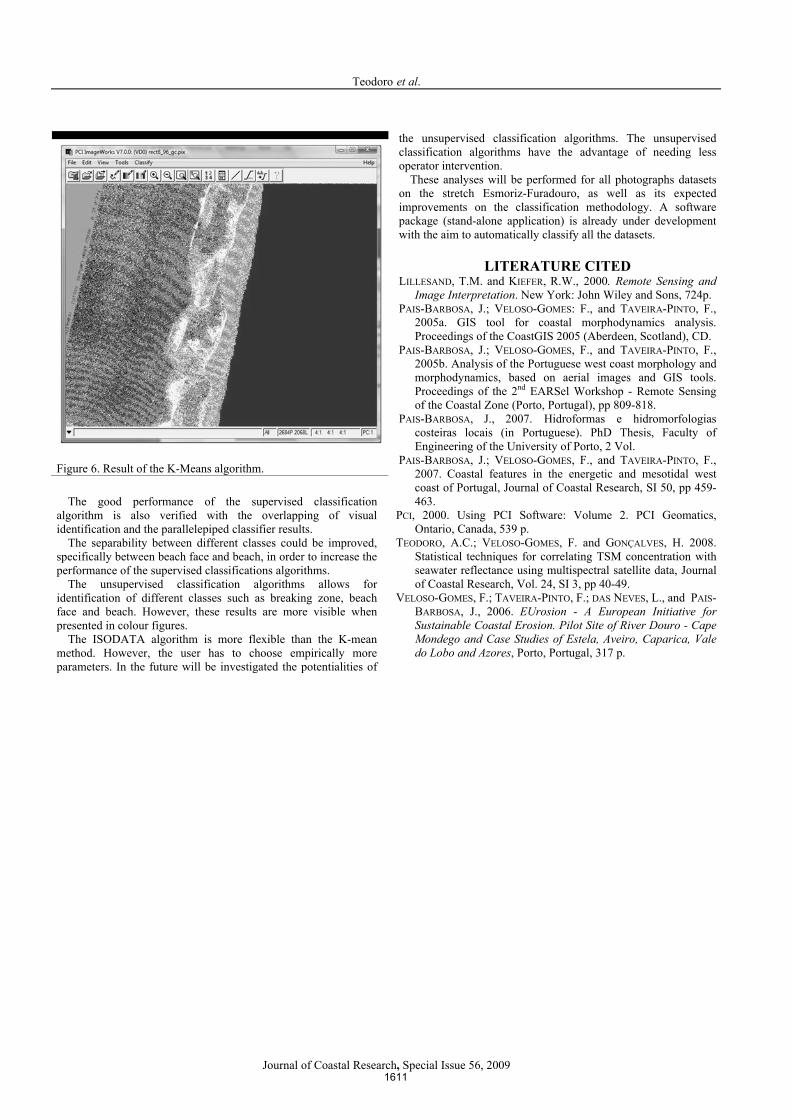
Unsupervised Classification As already referred, in the unsupervised classification stage, two algorithms were tested: K-Means and ISODATA. In the K-means algorithm two different values for the class maximum were tested, 7 and 16, respectively. The maximum number of iterations (16) and the minimum threshold (0.01) was the same. For ISODATA algorithm for the minimum, maximum and desired number of clusters the values 2, 10 and 7, respectively were considered. Figure 6 presents the results for K-Means algorithm (7 classes).
CONCLUSION The methodology presented by PAIS-BARBOSA et al., (2007) and
PAIS-BARBOSA (2007), shows an important number of morphologic and hydrodynamic features/patterns identified in several aerial photographs for a section of the Portuguese northwest coast. This methodology consumes a lot of time to analyze the photographs datasets and to measure the hydroforms and hydromorphologies identified. Nevertheless, the accuracy of the visual classification is not possible to evaluate.
The use of image classification tools, specifically image classification algorithms, reduces the time consumption and make easier and more accurate the morphological and hydrodynamic features/patterns identification.
The supervised classification algorithm presents good performance, demonstrated by the results of the confusion matrix, Kappa coefficient and overall accuracy. The parallelepiped classifier presents an overall accuracy of 95.65% and a Kappa statistics of 0.95661. The results for maximum likelihood were similar, 95.85% and 0.95840, respectively. The minimum distance classifier presents lower performance.
Figure 4. Results of the parallelepiped classifier with a 7x7 mode filter.
Figure 5. Visual and parallelepiped classifications overlapping.
Rip Heads
Rip Channel
Sea Beach
Beach Face
Submerge Bar / Breaking Zone
1610
Journal of Coastal Research, Special Issue 56, 2009
Teodoro et al.
The good performance of the supervised classification algorithm is also verified with the overlapping of visual identification and the parallelepiped classifier results.
The separability between different classes could be improved, specifically between beach face and beach, in order to increase the performance of the supervised classifications algorithms.
The unsupervised classification algorithms allows for identification of different classes such as breaking zone, beach face and beach. However, these results are more visible when presented in colour figures.
The ISODATA algorithm is more flexible than the K-mean method. However, the user has to choose empirically more parameters. In the future will be investigated the potentialities of
the unsupervised classification algorithms. The unsupervised classification algorithms have the advantage of needing less operator intervention.
These analyses will be performed for all photographs datasets on the stretch Esmoriz-Furadouro, as well as its expected improvements on the classification methodology. A software package (stand-alone application) is already under development with the aim to automatically classify all the datasets.
LITERATURE CITED LILLESAND, T.M. and KIEFER, R.W., 2000. Remote Sensing and
Image Interpretation. New York: John Wiley and Sons, 724p. PAIS-BARBOSA, J.; VELOSO-GOMES: F., and TAVEIRA-PINTO, F.,
2005a. GIS tool for coastal morphodynamics analysis. Proceedings of the CoastGIS 2005 (Aberdeen, Scotland), CD.
PAIS-BARBOSA, J.; VELOSO-GOMES, F., and TAVEIRA-PINTO, F., 2005b. Analysis of the Portuguese west coast morphology and morphodynamics, based on aerial images and GIS tools. Proceedings of the 2nd EARSel Workshop - Remote Sensing of the Coastal Zone (Porto, Portugal), pp 809-818.
PAIS-BARBOSA, J., 2007. Hidroformas e hidromorfologias costeiras locais (in Portuguese). PhD Thesis, Faculty of Engineering of the University of Porto, 2 Vol.
PAIS-BARBOSA, J.; VELOSO-GOMES, F., and TAVEIRA-PINTO, F., 2007. Coastal features in the energetic and mesotidal west coast of Portugal, Journal of Coastal Research, SI 50, pp 459-463.
PCI, 2000. Using PCI Software: Volume 2. PCI Geomatics, Ontario, Canada, 539 p.
TEODORO, A.C.; VELOSO-GOMES, F. and GONÇALVES, H. 2008. Statistical techniques for correlating TSM concentration with seawater reflectance using multispectral satellite data, Journal of Coastal Research, Vol. 24, SI 3, pp 40-49.
VELOSO-GOMES, F.; TAVEIRA-PINTO, F.; DAS NEVES, L., and PAIS-BARBOSA, J., 2006. EUrosion - A European Initiative for Sustainable Coastal Erosion. Pilot Site of River Douro - Cape Mondego and Case Studies of Estela, Aveiro, Caparica, Vale do Lobo and Azores, Porto, Portugal, 317 p.
Figure 6. Result of the K-Means algorithm.
1611


![Outstanding Balkan River landscapes a basis for wise ...smallpdf.com].pdf2 1. Hydromorphological intactness of rivers There are four classes characterising the different levels of](https://img.pdfslide.us/doc/110x75/607055892f8058439e131268/outstanding-balkan-river-landscapes-a-basis-for-wise-smallpdfcompdf-2-1.jpg)