Embed Size (px)
Citation preview
REPORT OF INVESTIGATIONS/1994
Evaiuation of Alternative Placement of Longwall Gob Gas Ventholes for Optimum Performance
By William P. Diamond, Paul W. Jeran, and Michael A. Trevits

U.S. Department of the Interior Mission Statement
As the Nation's principal conservation agency, the Department of the Interior has responsibility for most of our nationally-owned public lands and natural resources. This includes fostering sound use of our land and water resources; protecting our fish, wildlife, and biological diversity; preserving the environmental and cultural values of our national parks and historical places; and providing for the enjoyment of life through outdoor recreation. The Department assesses our energy and mineral resources and works to ensure that their development is in the best interests of all our people by encouraging stewardship and citizen participa- tion in their care. The Department also has a major responsibility for American Indian reservation communities and for people who live in island territories under U.S. administration.

Report of Investigations 9500
Evaluation of Alternative Placement of Longwall Gob Gas Ventholes for Optimum Performance
By William P. Diamond, Paul W. Jeran, and Michael A. Trevits
UNITED STATES DEPARTMENT OF THE INTERIOR Bruce Babbitt, Secretary
BUREAU OF MINES

International Standard Serial Number ISSN 1066-5552

Page
Abstract . . . . . . . . . . . . . . . . . . . . . . . . . . . . . . . . . . . . . . . . . . . . . . . . . . . . . . . . . . . . . . . . . . . . . . . . . . . Introduction . . . . . . . . . . . . . . . . . . . . . . . . . . . . . . . . . . . . . . . . . . . . . . . . . . . . . . . . . . . . . . . . . . . . . . . . Acknowledgments .................................................................... Evaluation of production trends ......................................................... Experimental evaluation of near-margin gob gas ventholes ......................................
................................................ Evaluation of subsidence monitoring data ......................................... Field experiment of near-margin gob gas ventholes
Summary .......................................................................... References . . . . . . . . . . . . . . . . . . . . . . . . . . . . . . . . . . . . . . . . . . . . . . . . . . . . . . . . . . . . . . . . . . . . . . . . .
1 . Mapofstudyarea ................................................................ 2 . Histograms of methane production from gob gas ventholes through 12 months and 9 months after
......................... completion of mining for panels 1 through 4. and panel 5. respectively ..... 3 . Schematic diagram of drilling and completion details for gob gas ventholes 174 and 174.B. panel 1
4 . Schematic block diagram of speculated variable drainage patterns for normal and diminished mining- induced fracture permeability .......................................................
............ 5 . Schematic diagram of typical subsidence trough developed over extracted longwall panel . . . . . . . . . . . . . . 6 . Schematic map view of distribution of horizontal strain above extracted longwall panel
. . . . . . . . . . . . . . . . . . . . . . . . . . . 7 . Static surface subsidence curves at completion of mining on panel 3 8 . Dynamic surface subsidence curves. panel 3 .............................................
.............................. 9 . Comparison of measured and predicted static surface subsidence ........... 10 . Histogram of 7 months of methane production from gob gas ventholes on panels 6 and 7
11 . Cumulative methane production curves for gob gas ventholes 156-A and 156.B. panel 6. and horizontal gob gas ventholes. panel 7. relative to panel 7 face position .................................
TABLES
1 . Mining and methane production data for panels 1 through 7 ................................. .................... . 2 Cumulative methane production data for individual gob gas ventholes. panel 7 .................... . 3 Cumulative methane production data for individual gob gas ventholes. panel 6

UNIT OF MEASURE ABBREVIATIONS USED IN THIS REPORT
cm centimeter m3/d cubic meter per day
m meter mm/m millimeterpermeter
m3 cubic meter Pet percent
EVALUATION OF ALTERNATIVE PLACEMENT OF LONGWALL GOB GAS VENTHOLES FOR OPTIMUM PERFORMANCE
By William P. ~iamond,' Paul W. ~eran,' and Michael A. ~ r e v i t r ~
ABSTRACT
In this U.S. Bureau of Mines study, production trends have been analyzed for 82 gob gas ventholes on 7 longwall panels in the Lower Kittanning Coalbed, Pennsylvania. Cumulative production from individual holes was found to vary considerably, ranging from 0.03 x 10⁶ to 10.1 x 10⁶ m3. Peak production rates were generally about 0.03 x 10⁶ to 0.06 x 10⁶ m3/d, but rates over 0.10 x 1@ m3/d were observed. The variability of gas production from individual holes can be attributed to several factors, including completion practices and problems, the extent of fracture development in the strata above the extracted panel, water production, and location on the panel. Of particular significance is hole location. Holes on the ends of the panels, where overburden strata are in tension because of the support of the surrounding pillars, were generally the highest and longest producers. This observation led to the experimental placement of gob gas ventholes in the zone of tension along the margin of a panel, instead of in the traditional centerline location, which is in compression. Analysis of 7 months of gas production data indicates that the experimental near-margin holes produced 77 pct more gas than did centerline holes on the same panel.
'~eolo~is t . 2~upervisory geologist. Pittsburgh Research Center, U.S. Bureau of Mines, Pittsburgh, PA.
INTRODUCTION
The U.S. Bureau of Mines (USBM) and BethEnergy Mines, Inc. began a cooperative research program in 1989 to determine the factors influencing the production of gas from longwall gob gas ventholes. The USBM's initial involvement in this study resulted from a request for as- sistance in evaluating unexpected high methane emissions on the fust of a new series of longwall panels at the Cambria No. 33 Mine, near Ebensburg, PA. In the past, at this mine, it had been sufficient to drill three to four gob gas ventholes per panel to aid the ventilation system in controlling methane emissions underground. On the first longwall panel in the new development area, 12 gob gas ventholes were drilled. Even with this large number of ventholes, mining delays due to high methane emissions were still experienced.
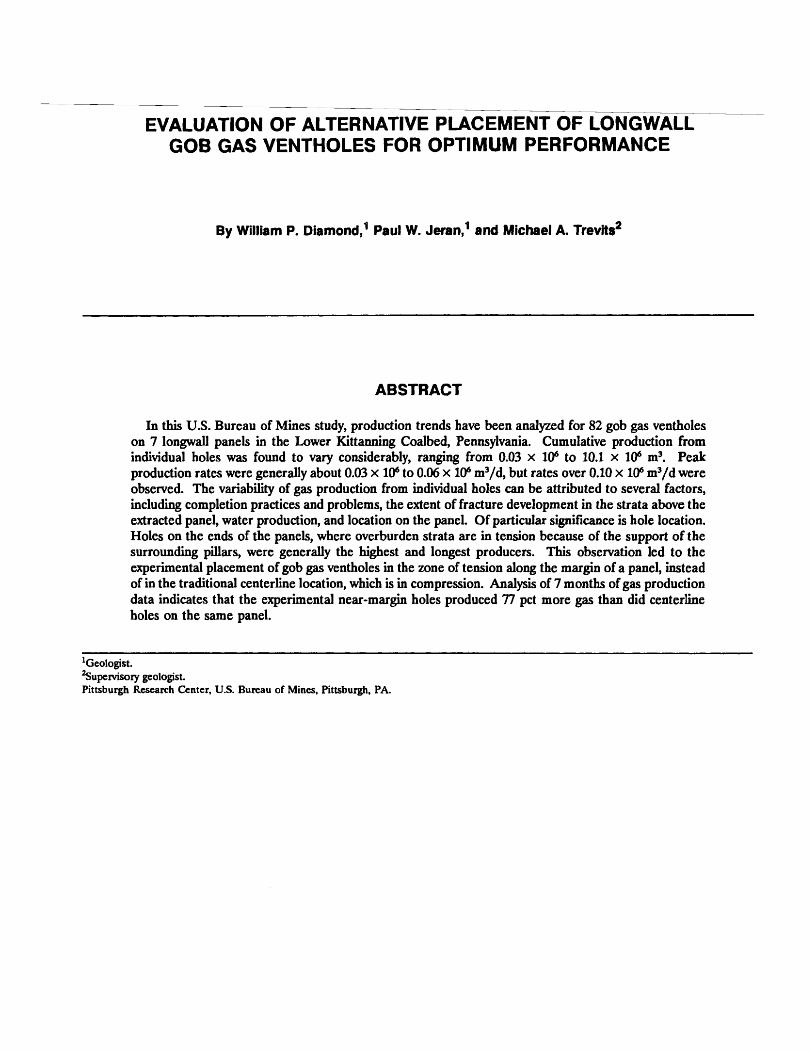
In the 3 years that this study has been in progress, 7 longwall panels have been completed in the study area (fig. 1) and the production results from 82 gob gas vent- holes have been evaluated. The analysis of the production trends has led to several recommendations for alternative methane control practices, including the repositioning of the gob gas ventholes from the traditional centerline loca- tion to locations closer to the margin of the panel. The analysis of the production data and the theory that led to this recommendation, along with the results from the fust application of the concept, are the focus of this report.
This work was done as part of a USBM research pro- gram to prevent or reduce the impact of disaster-causing events, such as explosions caused by the ignition of meth- ane gas.
LEGEND
Gob gas venthole - Direction of Before mining rnlnlng
0 After mining ---- In-mine horizontol gob gas venthole Scolc, rn
ACKNOWLEDGMENTS
The substantial contributions of services and personnel by BethEnergy Mines, Inc., Ebensburg, PA, are gratefully acknowledged.
EVALUATION OF PRODUCTION TRENDS
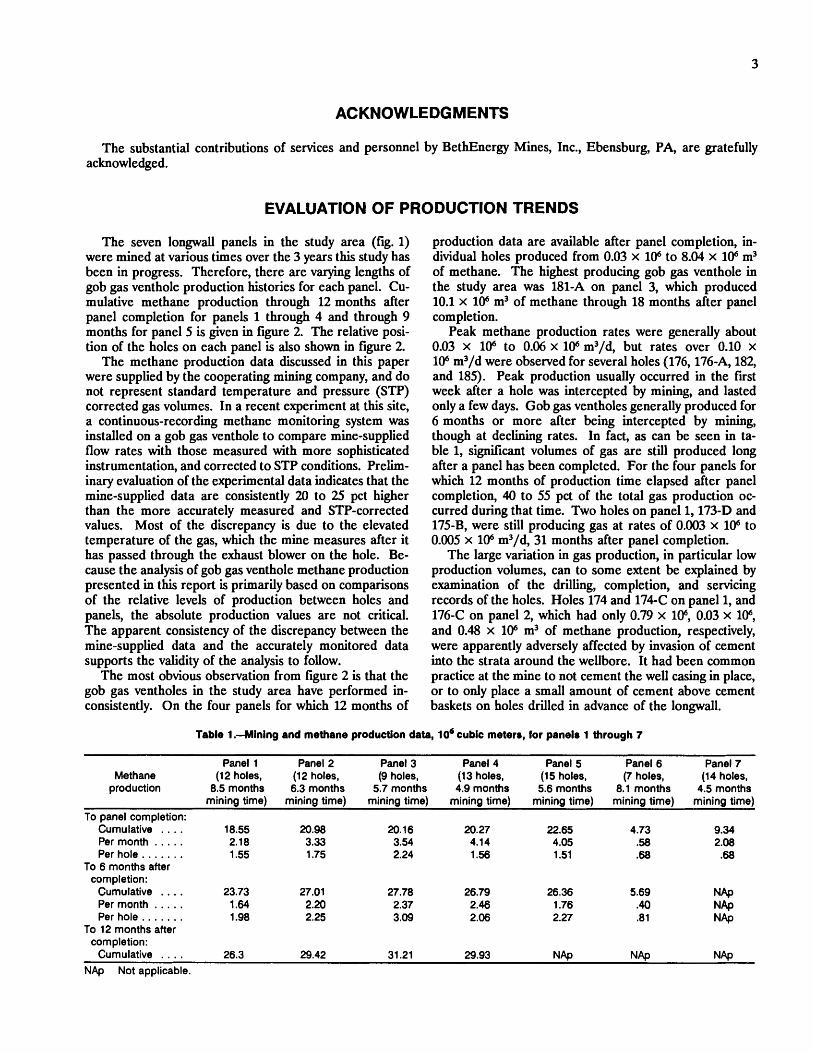
The seven longwall panels in the study area (fig. 1) were mined at various times over the 3 years this study has been in progress. Therefore, there are varying lengths of gob gas venthole production histories for each panel. Cu- mulative methane production through 12 months after panel completion for panels 1 through 4 and through 9 months for panel 5 is given in figure 2. The relative posi- tion of the holes on each panel is also shown in figure 2.
The methane production data discussed in this paper were supplied by the cooperating mining company, and do not represent standard temperature and pressure (STP) corrected gas volumes. In a recent experiment at this site, a continuous-recording methane monitoring system was installed on a gob gas venthole to compare mine-supplied flow rates with those measured with more sophisticated instrumentation, and corrected to STP conditions. Prelim- inary evaluation of the experimental data indicates that the mine-supplied data are consistently 20 to 25 pct higher than the more accurately measured and STP-corrected values. Most of the discrepancy is due to the elevated temperature of the gas, which the mine measures after it has passed through the exhaust blower on the hole. Be- cause the analysis of gob gas venthole methane production presented in this report is primarily based on comparisons of the relative levels of production between holes and panels, the absolute production values are not critical. The apparent consistency of the discrepancy between the mine-supplied data and the accurately monitored data supports the validity of the analysis to follow.
The most obvious observation from figure 2 is that the gob gas ventholes in the study area have performed in- consistently. On the four panels for which 12 months of
production data are available after panel completion, in- dividual holes produced from 0.03 x 10⁶ to 8.04 x 10⁶ m3 of methane. The highest producing gob gas venthole in the study area was 181-A on panel 3, which produced 10.1 x 10⁶ m3 of methane through 18 months after panel completion.
Peak methane production rates were generally about 0.03 x 10⁶ to 0.06 x 10⁶ m3/d, but rates over 0.10 x 10⁶ m3/d were observed for several holes (176,176-A, 182, and 185). Peak production usually occurred in the first week after a hole was intercepted by mining, and lasted only a few days. Gob gas ventholes generally produced for 6 months or more after being intercepted by mining, though at declining rates. In fact, as can be seen in ta- ble 1, significant volumes of gas are still produced long after a panel has been completed. For the four panels for which 12 months of production time elapsed after panel completion, 40 to 55 pct of the total gas production oc- curred during that time. Two holes on panel 1,173-D and 175-B, were still producing gas at rates of 0.003 x 10⁶ to 0.005 x 10⁶ m3/d, 31 months after panel completion.
The large variation in gas production, in particular low production volumes, can to some extent be explained by examination of the drilling, completion, and servicing records of the holes. Holes 174 and 174-C on panel 1, and 176-C on panel 2, which had only 0.79 x 10⁶, 0.03 x 10⁶, and 0.48 x 10⁶ m3 of methane production, respectively, were apparently adversely affected by invasion of cement into the strata around the wellbore. It had been common practice at the mine to not cement the well casing in place, or to only place a small amount of cement above cement baskets on holes drilled in advance of the longwall.
Table 1 .--Mining and methane production data, lo6 cubic meters, for panels 1 through 7
Panel 1 Panel 2 Panel 3 Panel 4 Panel 5 Panel 6 Panel 7 Methane (12 holes, (12 holes, (9 holes, (1 3 holes, (1 5 holes, (7 holes, (1 4 holes,
production 8.5 months 6.3 months 5.7 months 4.9 months 5.6 months 8.1 months 4.5 months mining time) mining time) mining time) mining time) mining time) mining time) mining time)
To panel completion: Cumulative . . . . 18.55 20.98 20.16 20.27 22.65 4.73 9.34 Per month . . . . . 2.18 3.33 3.54 4.14 4.05 .58 2.08 Per hole . . . . . . . 1.55 1.75 2.24 1.56 1.51 -68 .68
To 6 months after completion:
Cumulative . . . . 23.73 27.01 27.78 26.79 26.36 5.69 Per month . . . . . 1.64 2.20 2.37 2.46 1.76 .40
NAP
Per hole . . . . . . . 1.98 2.25 3.09 2.06 2.27 .8 1 NAP
To 12 months after NAp
completion: Cumulative . . . . 26.3 29.42 31.21 29.93 NAP N Ap NAP
NAp Not applicable.

K E Y
I7
Before mining V
I . - After mining
Q
- Direction of mining
9
BOREHOLE DESIGNATION
Total, 26.3 ~ 1 0 m
- - 6.29 - -
3 - 2 8 1 -0.03 Panel 1 - ,-, 4.08 -
Total 29.42 X lo6 rn3
6
3
9
6
3
* In j: g (1,265 mi e t ", ",
BOREHOLE DESIGNATION
2.63
I 1.05 "I3 I
? m 0 c ~ ) c ~ ) 2 : ~ & pL a 4 $ X X <1,301 m $ k $ s cc s s
BOREHOLE DESIGNATION
1 - -
.- 8.04 d
- Panel 2 4.11 Z - 3.43 -
0 J I ? a
6 '? g 1,311 m - - Q, 2 0 E S m P P I $ $ k ",
Scale, m
0 - I
Total 31.21 X lo6
- = - = -
Tot01 29.93 X lo6 m3
9 .-
9 d
Figure 2-HIatograma of methane production from gob gaa venthoka through 12 montha and 9 montha after comphtlon of mining for panda 1 through 4, and p a d 5, respectively.
= - 1.87 1-13 -
p 4 ~ o q m q 0 o r n u o o o A o A o n A & J X I X I N " . * ~ ~ ~
2 s E S 2 S E 2 BOREHOLE DESIGNATION
J 3
6 4 3,
6
3
- - 1.25 2.38 I
8.01 - Panel 3 6.26-
4.02 - 1 3.68
I I
1.25
02
- Panel 4 5.18 - - 5.01 - 5.75 )I
2027 2.0 7 2-27 -
1.42
Total 27.58 lo6 m3
0 -.
- Panel 5 4.67 1
3.68: - 3.94 3.34 a:
i - 3.60
I - .23
a
= .57 a m
3.60
e * ?:' 0 * m a $ 2 CD ,A A ,Ahm'1,301m r- r - r - r - @ E E S E 2 % 2 S E 2 2 2 2 E S
BOREHOLE DESIGNATION 0 200 400 600 800 1,000 1,200 1,400
I 1 1 I I I I I J
1 . 2 2 . ~ ~ ( .17
.54
:
1.53 1-13 1.53 37 1 I 1 $0
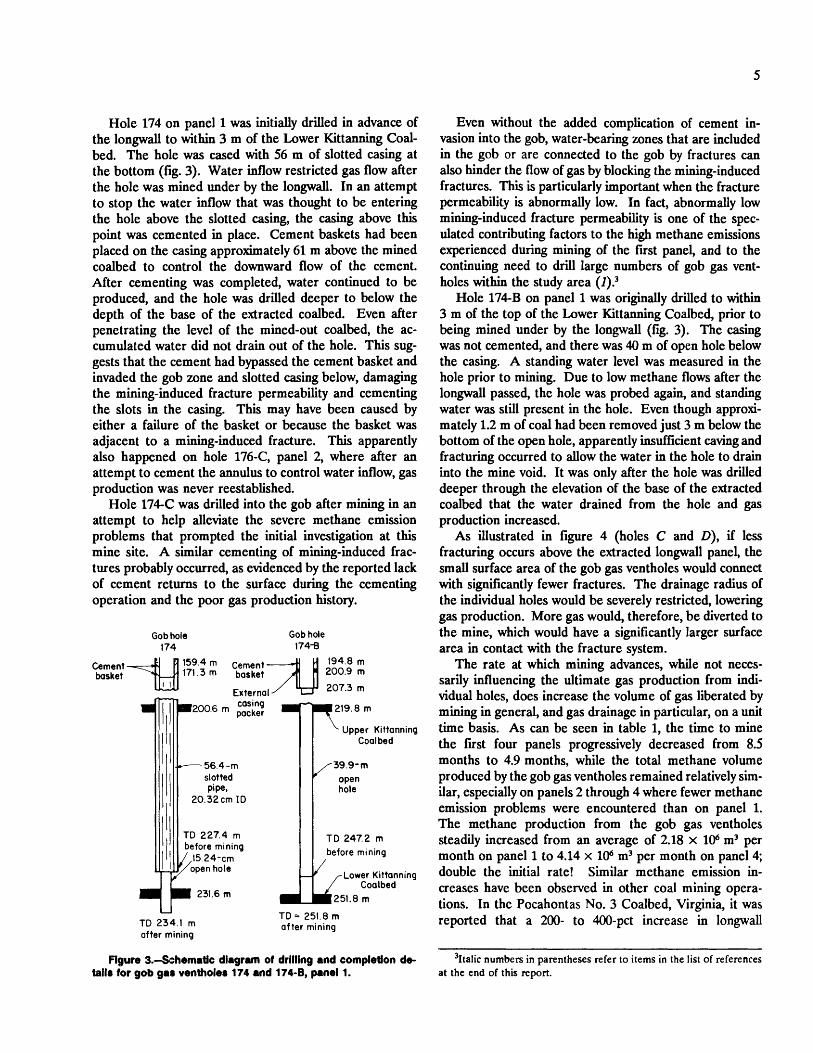
Hole 174 on panel 1 was initially drilled in advance of the longwall to within 3 m of the Lower Kittanning Coal- bed. The hole was cased with 56 m of slotted casing at the bottom (fig. 3). Water inflow restricted gas flow after the hole was mined under by the longwall. In an attempt to stop the water inflow that was thought to be entering the hole above the slotted casing, the casing above this point was cemented in place. Cement baskets had been placed on the casing approximately 61 m above the mined coalbed to control the downward flow of the cement. After cementing was completed, water continued to be produced, and the hole was drilled deeper to below the depth of the base of the extracted coalbed. Even after penetrating the level of the mined-out coalbed, the ac- cumulated water did not drain out of the hole. This sug- gests that the cement had bypassed the cement basket and invaded the gob zone and slotted casing below, damaging the mining-induced fracture permeability and cementing the slots in the casing. This may have been caused by either a failure of the basket or because the basket was adjacent to a mining-induced fracture. This apparently also happened on hole 176-C, panel 2, where after an attempt to cement the annulus to control water inflow, gas production was never reestablished.
Hole 174-C was drilled into the gob after mining in an attempt to help alleviate the severe methane emission problems that prompted the initial investigation at this mine site. A similar cementing of mining-induced frac- tures probably occurred, as evidenced by the reported lack of cement returns to the surface during the cementing operation and the poor gas production history.
Gob hole 174
Gob hole 174-8
Cement 159.4 m cement 194.8 m
basket 171.3 m basket 200.9 m
External 207.3 m - . - casing
- 56.4 -m slotted pipe,
20.32 cm ID
TD 227.4 m
U TD 234.1 m after mining
TD 247.2 m I I , before mining
Lower Kittanning Coalbed
251.8 m
TD= 251.8 m after mining
Even without the added complication of cement in- vasion into the gob, water-bearing zones that are included in the gob or are connected to the gob by fractures can also hinder the flow of gas by blocking the mining-induced fractures. This is particularly important when the fracture permeability is abnormally low. In fact, abnormally low mining-induced fracture permeability is one of the spec- ulated contributing factors to the high methane emissions experienced during mining of the first panel, and to the continuing need to drill large numbers of gob gas vent- holes within the study area (I).'
Hole 174-B on panel 1 was originally drilled to within 3 m of the top of the Lower Kittanning Coalbed, prior to being mined under by the longwall (fig. 3). The casing was not cemented, and there was 40 m of open hole below the casing. A standing water level was measured in the hole prior to mining. Due to low methane flows after the longwall passed, the hole was probed again, and standing water was still present in the hole. Even though approxi- mately 1.2 m of coal had been removed just 3 m below the bottom of the open hole, apparently insufficient caving and fracturing occurred to allow the water in the hole to drain into the mine void. It was only after the hole was dried deeper through the elevation of the base of the extracted coalbed that the water drained from the hole and gas production increased.
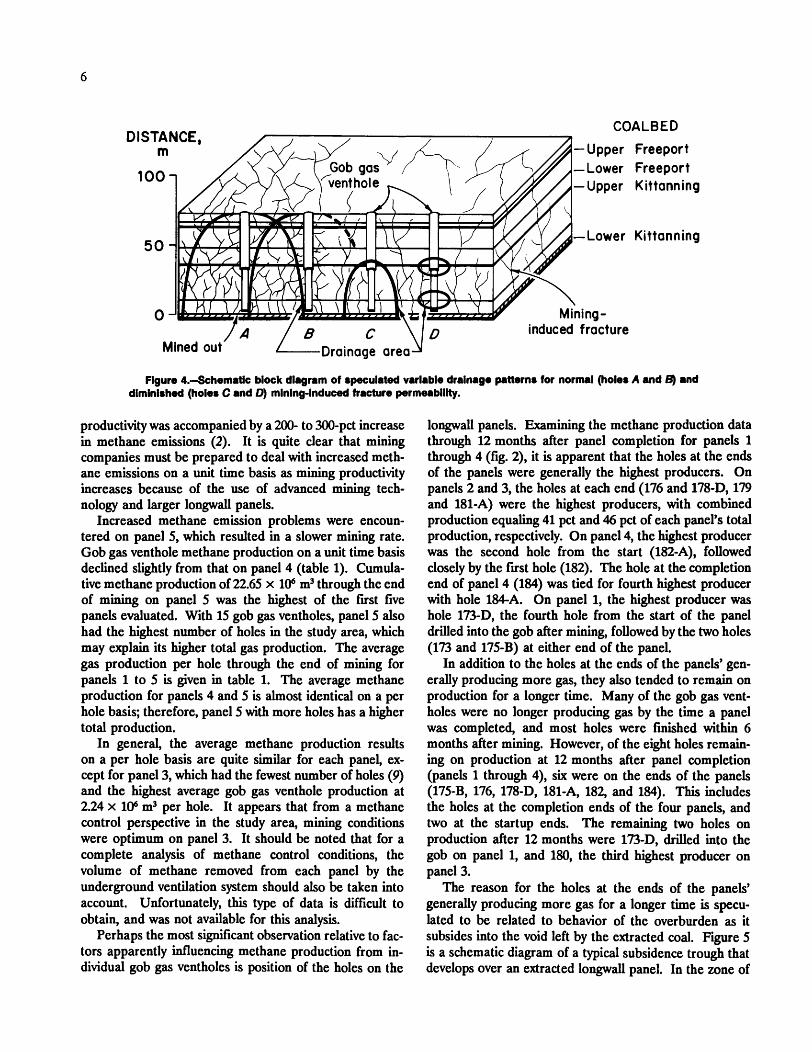
As illustrated in figure 4 (holes C and D), if less fracturing occurs above the extracted longwall panel, the small surface area of the gob gas ventholes would connect with significantly fewer fractures. The drainage radius of the individual holes would be severely restricted, lowering gas production. More gas would, therefore, be diverted to the mine, which would have a significantly larger surface area in contact with the fracture system.
The rate at which mining advances, while not neces- sarily influencing the ultimate gas production from indi- vidual holes, does increase the volume of gas liberated by mining in general, and gas drainage in particular, on a unit time basis. As can be seen in table 1, the time to mine the first four panels progressively decreased from 8.5 months to 4.9 months, while the total methane volume produced by the gob gas ventholes remained relatively sim- ilar, especially on panels 2 through 4 where fewer methane emission problems were encountered than on panel 1. The methane production from the gob gas ventholes steadily increased from an average of 2.18 x 10⁶ m3 per month on panel 1 to 4.14 x 10⁶ m3 per month on panel 4; double the initial rate! Similar methane emission in- creases have been observed in other coal mining opera- tions. In the Pocahontas No. 3 Coalbed, Virginia, it was reported that a 200- to 400-pct increase in longwall
Figure 3.--Schematic diagram of drilling and completion do- tail8 for gob gar venthoier 174 and 174-8, p n d 1.
31talic numbers in parentheses refer to items in the list of references at the end of this report.
induced fracture Mined out Drainage area
Flgure 4.--Schematic block dlagram of speculated varlable dralnage patterns for normal (holes A and B) and diminished (holes C and 0) mlnlng-Induced fracture permeability.
productivity was accompanied by a 200- to 300-pct increase in methane emissions (2). It is quite clear that mining companies must be prepared to deal with increased meth- ane emissions on a unit time basis as mining productivity increases because of the use of advanced mining tech- nology and larger longwall panels.
Increased methane emission problems were encoun- tered on panel 5, which resulted in a slower mining rate. Gob gas venthole methane production on a unit time basis declined slightly from that on panel 4 (table 1). Cumula- tive methane production of 22.65 x 10⁶ m3 through the end of mining on panel 5 was the highest of the first five panels evaluated. With 15 gob gas ventholes, panel 5 also had the highest number of holes in the study area, which may explain its higher total gas production. The average gas production per hole through the end of mining for panels 1 to 5 is given in table 1. The average methane production for panels 4 and 5 is almost identical on a per hole basis; therefore, panel 5 with more holes has a higher total production.
In general, the average methane production results on a per hole basis are quite similar for each panel, ex- cept for panel 3, which had the fewest number of holes (9) and the highest average gob gas venthole production at 2.24 x 10⁶ m3 per hole. It appears that from a methane control perspective in the study area, mining conditions were optimum on panel 3. It should be noted that for a complete analysis of methane control conditions, the volume of methane removed from each panel by the underground ventilation system should also be taken into account. Unfortunately, this type of data is difficult to obtain, and was not available for this analysis.
Perhaps the most significant observation relative to fac- tors apparently influencing methane production from in- dividual gob gas ventholes is position of the holes on the
longwall panels. Examining the methane production data through 12 months after panel completion for panels 1 through 4 (fig. 2), it is apparent that the holes at the ends of the panels were generally the highest producers. On panels 2 and 3, the holes at each end (176 and 178-D, 179 and 181-A) were the highest producers, with combined production equaling 41 pct and 46 pct of each panel's total production, respectively. On panel 4, the highest producer was the second hole from the start (182-A), followed closely by the first hole (182). The hole at the completion end of panel 4 (184) was tied for fourth highest producer with hole 184-A. On panel 1, the highest producer was hole 173-D, the fourth hole from the start of the panel drilled into the gob after mining, followed by the two holes (173 and 175-B) at either end of the panel.
In addition to the holes at the ends of the panels' gen- erally producing more gas, they also tended to remain on production for a longer time. Many of the gob gas vent- holes were no longer producing gas by the time a panel was completed, and most holes were finished within 6 months after mining. However, of the eight holes remain- ing on production at 12 months after panel completion (panels 1 through 4), six were on the ends of the panels (175-B, 176, 178-D, 181-A, 182, and 184). This includes the holes at the completion ends of the four panels, and two at the startup ends. The remaining two holes on production after 12 months were 173-D, drilled into the gob on panel 1, and 180, the third highest producer on panel 3.
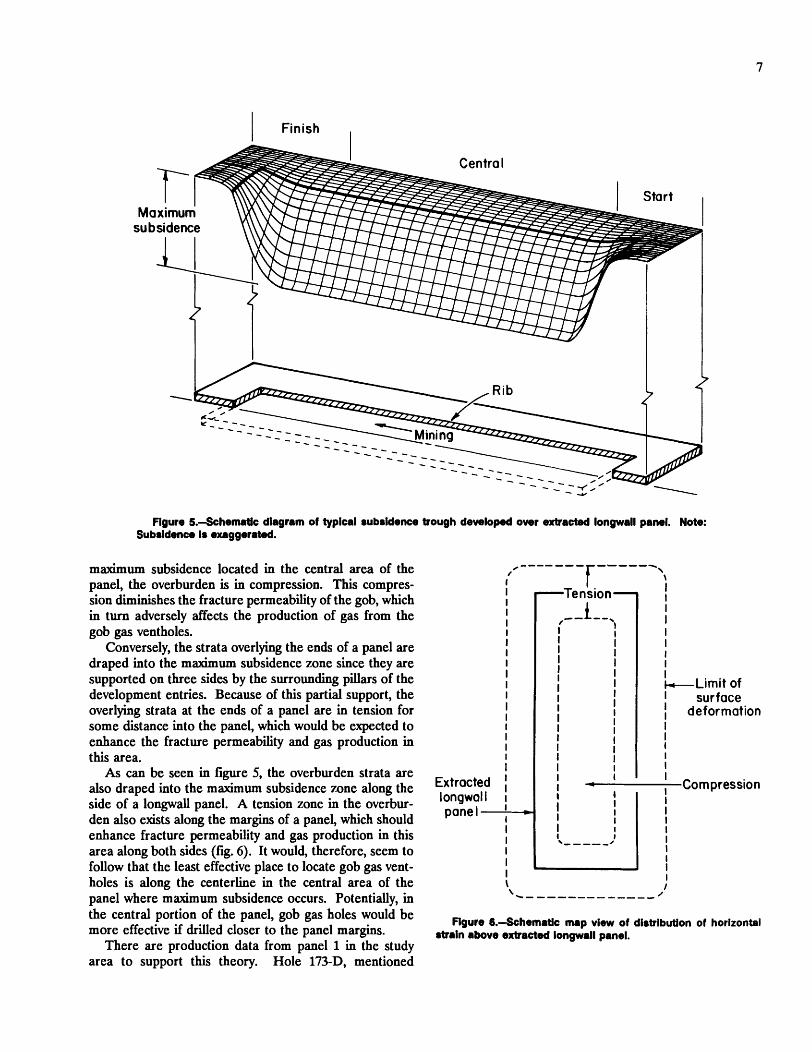
The reason for the holes at the ends of the panels' generally producing more gas for a longer time is specu- lated to be related to behavior of the overburden as it subsides into the void left by the extracted coal. Figure 5 is a schematic diagram of a typical subsidence trough that develops over an extracted longwall panel. In the zone of
I Finish ,
Flgure 5.--Schematic diagram of typical rubridence trough developed over extracted longwall panel. Note: Subridence la exaggerated.
maximum subsidence located in the central area of the /------- r-----‘ t.
panel, the overburden is in compression. This compres- sion diminishes the fracture permeability of the gob, which in turn adversely affects the production of gas from the gob gas ventholes.
Conversely, the strata overlying the ends of a panel are draped into the maximum subsidence zone since they are supported on three sides by the surrounding pillars of the development entries. Because of this partial support, the overlying strata at the ends of a panel are in tension for some distance into the panel, which would be expected to enhance the fracture permeability and gas production in this area.
As can be seen in figure 5, the overburden strata are also draped into the maximum subsidence zone along the side of a longwall panel. A tension zone in the overbur- den also exists along the margins of a panel, which should enhance fracture permeability and gas production in this area along both sides (fig. 6). It would, therefore, seem to follow that the least effective place to locate gob gas vent- holes is along the centerline in the central area of the panel where maximum subsidence occurs. Potentially, in the portion of the pane', gob gas be & a h e m a d c map view of dlrtribuaon of horlzonal more effective if drilled closer to the panel margins. rtrain above extracted longwall panel.
There are production data from panel 1 in the study
I I 1
area to support this theory. Hole 173-D, mentioned
I I I I I I I I I I I I I I I I I I
Extracted I longwall I panel ==
I I I I I \
I I '\ -----,,,,,,,, /
Tension- I
i . /-- -- I I I I I I I I I I I I I I I I I
I I I
I I I I I I I I I I
I I I I I I I I limit of I surface I deformation I I I I I I
I - I Compression
I I I I I
I I I I
\,,-,-/
I I I I I I I I

previously as one of the eight holes to produce a large volume of gas for at least 12 months, was drilled 40 m from the updip margin of the 192-m-wide panel (fig. 1). In fact, this hole was the highest producer on panel 1. Hole 174 was also drilled close to the margin of this panel. However, as discussed previously, it was one of the holes where cement apparently invaded the fractures in the gob, and there was no appreciable gas production.
Geologic factors, in addition to water-bearing zones and variable fracture permeability, may also influence the pro- duction from gob gas ventholes. Any significant variability in the in-place gas volume contained within the overburden strata that is influenced by the panel extraction could
influence the volume of gas available for flow to indi- vidual gob gas ventholes. Examples of this would include changes in the available and/or utilized gas storage ca- pacity of surrounding coalbeds, which in previous studies at this mine site were identified as the primary source of longwall gob gas ( I ) , or the presence or absence of other gas-bearing strata, such as sandstones. Localized geologic anomalies, such as structural faults, clay veins, sandstone channels, and lithologic and permeability variations, could influence the flow of gas to individual gob gas ventholes. No evidence of these additional geologic factors were found within the study area.
EXPERIMENTAL EVALUATION OF NEAR-MARGIN GOB GAS VENTHOLES
A test of the near-margin gob gas venthole concept was implemented on panel 7, adjacent to the line of panels (1 through 5) discussed previously (fig. 1). Subsidence moni- toring data obtained previously by the mine within the study area were evaluated to determine a preliminary opti- mum distance from the panel margin for drilling the test holes. To test the concept, the holes needed to be within the zone of tension, but they could not be too close to the panel margin. If the holes were too close to the panel margin, they would probably pull in mine ventilation air and reduce the gas drainage efficiency.
EVALUATION OF SUBSIDENCE MONITORING DATA
Subsidence over a longwall panel is a dynamic process that is initiated with the collapse of the immediate roof as the face advances (3). As mining progresses and the size of the collapse zone increases, successively higher strata are fractured and sag into the mine void. Eventually the surface is affected. Monitoring of surface subsidence as- sociated with longwall mining is typically conducted in two directions: along the centerline of the panel to obtain data on the dynamic subsidence process, and perpendicular to the centerline across the width of the panel to define static deformation. Regularly spaced monuments are installed along the lines to be monitored prior to surface move- ment. The monuments are periodically surveyed during the subsidence process to detect successive changes in their vertical and horizontal positions.
During dynamic subsidence, which is directly influenced
after subsidence has ended. Typically, the final result is a zone of compression over the centerline of the panel, flanked by a tensional zone in the vicinity of the rib lines (figs. 5-6).
Subsidence monitoring data collected within the study area (figure 1, panels 3 and 4) were used to define the distribution of deformations induced by subsidence. The zone of tension, as defined by the inflection point on the strain curve in figure 7, was estimated to extend about 45.7 m into panel 3 from the rib line. Fractures developed in this zone should remain open and provide effective per- meability for gas flow. In the central area, compression would be expected to close fractures relatively quickly.
Evaluation of the subsidence monitoring data (fig. 8) showed that the dynamic phase was completed after the face had advanced a distance equal to the thickness of the overburden. At this mine site, as is generally the case in the northern Appalachian Coal Basin (9, dynamic tension along the centerline was less than the static tension
KEY --- Strain
t - Subsidence
by the position of the advance longwall face, the over- - -1
burden initially undergoes tensional deformation parallel -4 . 1 b
to the centerline of the panel, followed by compression, o 50 loo 150 200 250
and finally ending in a neutral condition. Perpendicular to LOCATION, m
the centerline across the width of the panel, static defor- Figure ‘1.4tatic rurface rubridence cuwer at completion of mations progress to maximum values that are retained mining on panel 3.

developed over the ribs (figs. 7-8). Therefore, the inten- sity of tensional fracturing in the centerline area where most mining companies place gob gas ventholes should be diminished. It then follows that the centerline would generally be a less than optimum location for gob gas production.
In the study area, one notable exception to the general behavior of subsidence is that only 70 pct of the final ver- tical movement occurred during the dynamic phase, versus the usual 90+ pct (fig. 8). A subsidence monitoring array at another location at this same mine site shows a typical static subsidence profile with about 0.85 m of surface movement (fig. 9B). In contrast, figure 9A shows the
' d ens ion \ Strain 0 - Subsidence
Final subsidence - 6 0 after mining of "'L -18 , , , panel , 4 , - 2 0
-50 0 5 0 100 150 200 250 3 0 0
FACE POSITION, m
Flgure 8.--Dynamic surface subsidence curves, panel 3.
- 1 0 50 100 150 200 250 0 50 100 150 200 250
DISTANCE FROM CENTERLINE, m
,' ! rEdge of
panel
Figure 9.--Comparlwn of measured and predicted static sur- face subsidence. A, On panel 3 within study area; 8, at another locatlon on same mine site.
profile for the array in the study area, which at 0.52 m of surface movement is far less than that at the other site as well as what would be predicted by a subsidence model (5). This lends additional support to the previous specu- lation (I) that for some still undefined reason, subsidence is not as great in this area, which in general could diminish the development of fracture permeability.
FIELD EXPERIMENT OF NEAR-MARGIN GOB GAS VENTHOLES
Mining on panel 7 began February 17, 1992. To eval- uate the relative performance of the near-margin holes, several holes at the start of the panel were to be drilled along the traditional centerline location, then holes were drilled along the margin for comparison. Topographic, wetlands, and surface ownership considerations neces- sitated that the near-margin holes be drilled along the downdip headgate side of the panel. This positioning potentially had both positive and negative attributes.
Previous research at this site (I) concluded that the methane emission problems may to some extent be related to a downdip pressure gradient that developed because of extensive old workings updip of the new mining area. This area of reduced reservoir pressure would induce the de- sorption of gas from the downdip coal reserves and, con- sequently, the flow updip toward the pressure sink of the old workings. Gob gas ventholes placed on the downdip margin of panel 7 would more effectively intercept this migrating gas before it crossed through the panel. One problem with having the holes on the downdip headgate side of the panel is that the holes would be working against the mine's ventilation system. The ventilation sys- tem is designed to bring intake air to the active face on the headgate side, and sweep across the face and through the gob to the bleeder entries on the updip tailgate side. Methane production by gob gas ventholes on the tailgate side would therefore be aided by the ventilation system.
As circumstances evolved, neither of these factors prob- ably had any significant influence on the holes. Instead, production of gas from all of the holes was adversely af- fected by high water inflow, with the near-margin holes perhaps being most severely impacted because of their downdip location. Water inflow had sporadically been a problem for gob gas ventholes throughout the study area, as discussed previously, but virtually every hole on panel 7 experienced some degree of water problems. The general lower level of gob gas venthole production on this panel (table 1) increased the level of methane emissions in the mine and adversely affected coal production. Water prob- lems were so severe that the mine attempted to use down- hole pumps to dewater several holes (161-C, 161-F, 162-A, 162-C, and 163-A), and drilled several supplemental gob gas ventholes, after mining, into the gob near the start of the panel.

The severe water problems encountered on this panel made it a less than ideal experimental site to test the concept of near-margin gob gas ventholes. In spite of the problems, analysis of 7 months of gas production data is encouraging. Figure 10 presents 7 months of cumulative methane production for individual gob gas ventholes on panels 6 and 7. Panel 6 was chosen as a general compari- son for the performance of gob gas ventholes on the ex- perimental panel because of its proximity. Also, it appears that, for some unknown reason, the gob gas holes in this part of the study area produce simcantly less gas than those on the five adjacent panels. Gob gas ventholes on
panels 6 and 7 produced only 4.73 x 10⁶ and 9.34 x 10⁶ m3, respectively; whereas panels 1 to 5 produced between 18.55 x 10⁶ and 22.65 x 10⁶ m3 through the completion of mining (table 1).
There are several possible reasons why the gas pro- duction on panel 7 was double that of panel 6. Panel 6 was completed approximately 1.5 years before mining on panel 7 began. This delay may have induced a flow of additional gas from the downdip coal reserves into the area of panel 7, similar to that speculated for panel 1 (I). Another possibility is that more gas was produced simply because 14 holes were drilled on panel 7, compared with
KEY
1.98 40 Before : After I mlnlng mining
Near-margin hole - Direction of mining
BOREHOLE DESIGNATION
3 , 9
- - 2 - Panel 6
1.68 1 - Total
0 2 0 0 400 600 800 1,000 Scale, rn
- 1 -
W
Figure 10.--Histogram of 7 months of methane production from gob gas ventholes on p n d s 6 and 7.
6 3 .71 .Is. 5.32X 10 m
41 - L
1,204m e (0
43 v ; COY)
P In
m m i - z 5s - !c !E 2 BOREHOLE DESIGNATION
2 t; = , J 0 3 - = , g ZcL 2 - Panel 7 3
1.821.98 - 0 - 1.51
Total 1 - .94 .93 .77 -
.25 11.53 x lo6 rn3
-37 .33 .32 'P.24 - I 13 . , 01 Y
7 holes on panel 6. In fact, the average production to panel completion for both panels was identical at 0.68 x lo6 m3 per hole (table 1). A third possibility is that mining time may have been a factor. Panel 6 took 8.1 months to complete, primarily because of equipment and ground con- trol problems. Panel 7, even with the methane control problems, only took 4.5 months to complete. It is possible that with the additional time, a higher proportion of the total gas released during mining of panel 6 was removed by the ventilation system.
The comparison of relative effectiveness of the near- margin holes versus centerline holes on this panel will be made on an actual production time basis for each hole. The comparison of gob gas production between panels 7 and 6 will also be on this basis. This is in contrast to the previous discussion of panels 1 to 5, where the results were evaluated on a time basis relative to completion of each panel.
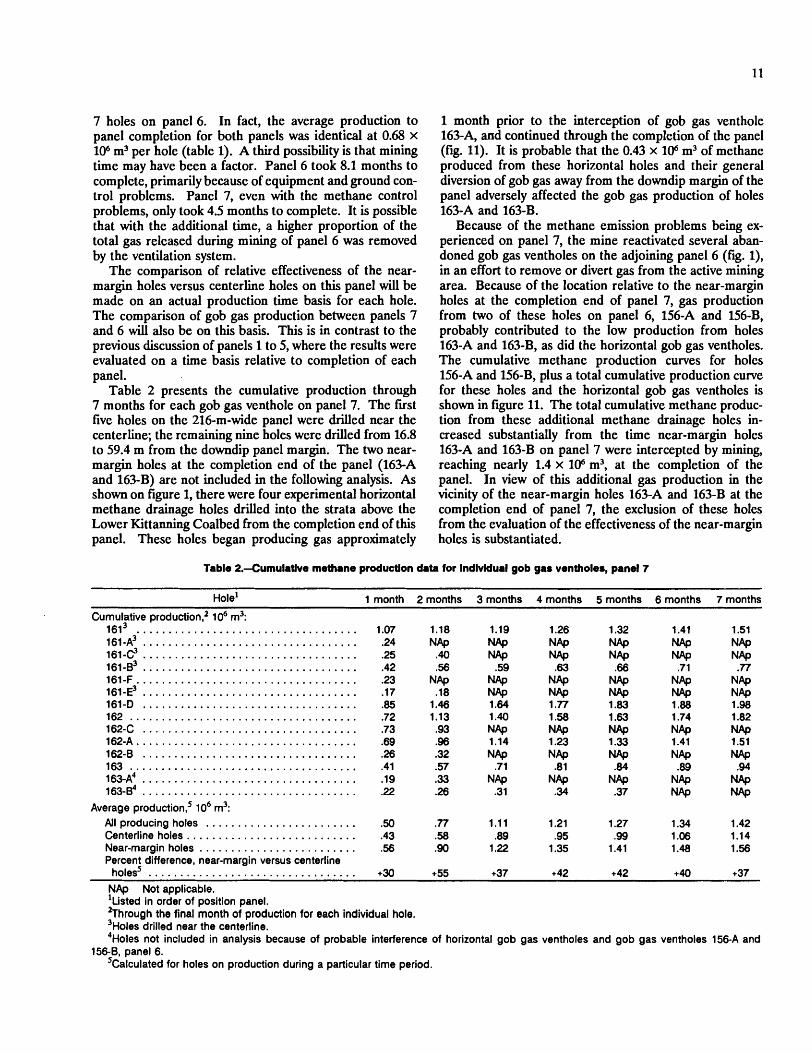
Table 2 presents the cumulative production through 7 months for each gob gas venthole on panel 7. The frrst five holes on the 216-m-wide panel were drilled near the centerline; the remaining nine holes were drilled from 16.8 to 59.4 m from the downdip panel margin. The two near- margin holes at the completion end of the panel (163-A and 163-B) are not included in the following analysis. As shown on figure 1, there were four experimental horizontal methane drainage holes drilled into the strata above the Lower Kittanning Coalbed from the completion end of this panel. These holes began producing gas approximately
1 month prior to the interception of gob gas venthole 163-A, and continued through the completion of the panel (fig. 11). It is probable that the 0.43 x 10⁶ m3 of methane produced from these horizontal holes and their general diversion of gob gas away from the downdip margin of the panel adversely affected the gob gas production of holes 163-A and 163-B.
Because of the methane emission problems being ex- perienced on panel 7, the mine reactivated several aban- doned gob gas ventholes on the adjoining panel 6 (fig. I), in an effort to remove or divert gas from the active mining area. Because of the location relative to the near-margin holes at the completion end of panel 7, gas production from two of these holes on panel 6, 156-A and 156-B, probably contributed to the low production from holes 163-A and 163-B, as did the horizontal gob gas ventholes. The cumulative methane production curves for holes 156-A and 156-B, plus a total cumulative production curve for these holes and the horizontal gob gas ventholes is shown in figure 11. The total cumulative methane produc- tion from these additional methane drainage holes in- creased substantially from the time near-margin holes 163-A and 163-B on panel 7 were intercepted by mining, reaching nearly 1.4 x 10⁶ m3, at the completion of the panel. In view of this additional gas production in the vicinity of the near-margin holes 163-A and 163-B at the completion end of panel 7, the exclusion of these holes from the evaluation of the effectiveness of the near-margin holes is substantiated.
Table 2.--Cumulative methane production data for indlvldual gob gas ventholes, panel 7
Hole1 1 month 2 months 3 months 4 months 5 months 6 months 7 months
Cumulative pr~duction,~ lo6 m3: . . . . . . . . . . . . . . . . . . . . . . . . . . . . . . . . . . . 1613 1.07
161 - A ~ . . . . . . . . . . . . . . . . . . . . . . . . . . . . . . . . . . .24 161-c3 . . . . . . . . . . . . . . . . . . . . . . . . . . . . . . . . . . .25 161 - B ~ . . . . . . . . . . . . . . . . . . . . . . . . . . . . . . . . . . .42 161-F.. . . . . . . . . . . . . . . . . . . . . . . . . . . . . . . . . . .23 161-9 . . . . . . . . . . . . . . . . . . . . . . . . . . . . . . . . . . .17 161-D . . . . . . . . . . . . . . . . . . . . . . . . . . . . . . . . . . .85 162 . . . . . . . . . . . . . . . . . . . . . . . . . . . . . . . . . . . . .72 1624 . . . . . . . . . . . . . . . . . . . . . . . . . . . . . . . . . . .73 162-A . . . . . . . . . . . . . . . . . . . . . . . . . . . . . . . . . . . .69
. . . . . . . . . . . . . . . . . . . . . . . . . . . . . . . . . . 162-8 .26 . . . . . . . . . . . . . . . . . . . . . . . . . . . . . . . . . . . . 163 .41
1 6 % ~ ~ . . . . . . . . . . . . . . . . . . . . . . . . . . . . . . . . . . .19 163-Et . . . . . . . . . . . . . . . . . . . . . . . . . . . . . . . . . . -22
1.19 NAP w
.59 N Ap NAp 1.64 1.40 NAP 1.14 NAP
.71 NAP
.31
1.26 NAp N Ap -63
NAp NAP i .n 1.58 NAP 1.23 N Ap .8 1
NAP .34
1.32 N Ap N Ap -66
NAp NAp 1.83 1.63 NAP 1.33 NAp .84
NAp .37
1.51 NAp NAp .n
NAp NAp 1.98 1.82 NAP 1.51 NAP .94
N Ap NAp
Average production,' lo6 m3: All producing holes . . . . . . . . . . . . . . . . . . . . . . . . .50 .n 1.11 1.21 1.27 1.34 1.42 Centerline holes . . . . . . . . . . . . . . . . . . . . . . . . . . . .43 .58 .89 .95 .99 1.06 1.14 Near-margin holes . . . . . . . . . . . . . . . . . . . . . . . . . .56 .90 1.22 1.35 1.41 1.48 1.56 Percent difference, near-margin versus centerline
holes5 . . . . . . . . . . . . . . . . . . . . . . . . . . . . . . . . . +30 +55 +37 + 42 +42 +40 +37
NAp Not applicable. 'Listed in order of position panel. 2~hrough the final month of production for each individual hole. 3 ~ o l e s drilled near the centerline. 4 ~ o l e s not included in analysis because of probable interference of horizontal gob gas ventholes and gob gas ventholes 156-A and
156-8, panel 6. 'calculated for holes on production during a particular time period.

rn b Relative position of 5 gob gas ventholes , panel 6 J.
KEY - Total ----- 156-A -.- Horizontal gob gas holes - - 156-B
4 3 Position of hori zonta I
2 gob gas ventholes, panel 7 1
90 + Completion * rc) m
? CU Position of gob gas Startup
panel 7 'L) 2 5. 5. f ventholes, panel 7
J panel 7 1
FACE POSITION, date
9 5 5 900 800 700 600 5 0 0 400 300 2 0 0 100 0
DISTANCE FROM STARTUP END OF PANEL 7, m
flgure 11.--Cumulative methane production curves for gob gas venthole8 156-A and 156-8, panel 6, and horizontal gob gas ventholer, panel 7, rdatlve to panel 7 face posttion.
A si@cant volume of methane (0.4 x 10⁶ m3) had been diverted away from the downdip margin of panel 7 by the time near-margin hole 163-A was intercepted by mining and began producing gas. In fact, reactivated gas production from gob gas venthole 156-A on panel 6 began about 2.5 months prior to the start of gas production from hole 163-A on panel 7. It is even possible that this early production from hole 156-A as well as that from hole
156-B and the horizontal gob gas ventholes reduced the gas production from earlier near-margin holes, in partic- ular holes 163 and 162-B (fig. 11). However, these holes were included in the evaluation of the relative production levels of centerline and near-margin gob gas ventholes. All but two holes on panel 7 produced gas for at least
1 full month (table 2). Holes 161-A and 161-F produced for only 9 and 20 days, respectively. The average methane

production for 1 month or less for the 12 holes being evaluated was 0.5 x 10⁶ m3. As on most of the other panels in the study area, a centerline hole on the end of the panel (161) was the highest producer (1.07 x 10⁶ m3). At 1 month of production, the average methane produc- tion from the near-margin holes (0.56 x 10⁶ m3 per hole) was 30 pct greater than that of the centerline holes (0.43 x 10⁶ m3 per hole).
Six holes on panel 7 produced gas for 7 months (ta- ble 2), including two centerline holes and four near-margin holes. The four near-margin holes produced 37 pct more methane (1.56 x lo6 m3 per hole) than did the two holes located near the centerline (1.14 x 10⁶ m3 per hole). If the average cumulative methane production for all the center- line and near-margin holes (except 163-A and 163-B) is compiled over the entire 7 months, then the seven near- margin holes produced an average of 1.10 x 10⁶ m3 per hole, or 77 pct more than the 0.62 x lo6 m3 per hole for five centerline holes.
Of further interest is the observation that the average cumulative methane production (1.56 x lo6 m3) for the four near-margin holes that produced for 7 months was higher than the cumulative production (1.51 x 10⁶ m3) from the best producing centerline hole (161), located at the startup end of the panel. In fact, two near-margin holes (161-D and 162) produced 31 and 21 pct more methane, respectively, than did hole 161. In addition, near-margin hole 162-A produced as much methane as hole 161. This is in marked contrast to the results from the fust five panels, where end holes were predominantly the highest and longest producers.
The methane production results from gob gas ventholes on panel 7 can also be compared with those from panel 6 (table 3). The holes on panel 6 were drilled slightly off the centerline toward the updip tailgate side of the panel (fig. 1). The average methane production for the seven holes on panel 6 after 1 month of production was 0.46 x 10⁶ m3 per hole. This is slightly more than the 0.43 x 10⁶ m3 per hole average for near-centerline holes on panel 7. However, the near-margin holes on panel 7 vented 22 pct more methane through the fust month of production than the average hole on panel 6.
Three holes on panel 6 produced for at least 5 months, for an average cumulative methane production of 0.83 x 10⁶ m3 per hole. The two centerline holes that produced for at least 5 months on panel 7 averaged 0.99 x 10⁶ m3 per hole, or 19 pct more than those on panel 6. The four near-margin holes on panel 7 that vented methane for 5 months averaged 1.41 x 10⁶ m3 per hole, or 70 pct more than the three centerline holes on panel 6.
The supposition that greater fracture permeability exists for a longer time near the panel margins, thus allowing for a longer gas production life, in addition to higher production rates, for near-margin gob gas ventholes can also be evaluated with the available data. Only one gob gas venthole (156-A) out of seven on panel 6 re- mained on production for at least 7 months (table 3). In contrast, 6 gob gas ventholes (out of 14), including 4 near- margin holes (table 2) were still producing methane after 7 months on panel 7.
Table 3.--Cumulative methane production data, lo6 cubic meters, for individual gob gas ventholes, panel 6
- -
Hole1 1 month 2 months 3 months 4 months 5 months 6 months 7 months
Cumulative prod~ction:~ 155 . . . . . . . . . . . . . . . . . . . . . 0.70 0.74 0.76 NAP NAp 1 55-A
NAP NAP . . . . . . . . . . . . . . . . . . . . .39 .4 1 N Ap N Ap NAp NAp NAp
155-5 . . . . . . . . . . . . . . . . . . . -53 .71 NAp NAP N Ap NAp NAp 155-C . . . . . . . . . . . . . . . . . . . .4 1 .50 .5 1 N Ap NAp NAp N Ap 156 . . . . . . . . . . . . . . . . . . . . . -26 .40 .46 .47 0.51 0.55 NAp 156-8 . . . . . . . . . . . . . . . . . . . .32 .57 .67 -69 .70 NAp N Ap 1 56-A . . . . . . . . . . . . . . . . . . . . .63 .86 1 .O1 1.14 1.27 1.48 1.68
Average production3 . . . . . . . . . . . .46 .60 .68 .77 .83 1.02 N&
NAp Not applicable. '~isted in order of position on panel. 2~hrough the final month of production for each individual hole. 'calculated for holes on production during a particular time period.

The evaluation of gob gas venthole methane produc- tion at the Cambria No. 33 Mine has revealed several interesting observations, and has led to a test of a change in hole placement that may improve performance. Per- haps the most obvious observation relative to gob gas venthole production is the large degree of variability. Cumulative production for the 82 holes in the 7-panel study area has ranged from 0.03 x 10⁶ to 10.1 x 10⁶ m3. Low production rates can in some cases be attributed to drilling and completion problems, such as inadvertently cementing the casing slots or the mining-induced fractures in the gob. In several instances, the presence of water in the overlying strata impeded the flow of gob gas.
Mining rates were found to have a general influence on gob gas venthole production rates. As the time to mine a panel decreased, the average gob gas venthole production rate on a unit time basis increased. This is because a relatively finite volume of methane is contained in the strata influenced by the longwall mining of the coalbed. Therefore, if the panel is extracted in a shorter time, the finite volume of gas will be encountered at an accelerated rate. This is of particular concern since the industry trend in coal mining is toward the use of more efficient mining equipment and larger dimension longwalls to increase productivity. It is quite clear that with increased coal production, it is highly likely that a corresponding increase in methane emissions will be encountered on a unit time basis.
The analysis of production volumes within the study area also revealed that gob gas ventholes on the ends of
the panels tended to have the highest cumulative meth- ane production and produced for a longer time. This is probably related to the characteristics of overburden re- sponse after the longwall panel is extracted. A zone of tension and more effective fracture permeability exists close to the ends of the panels because of the support of the overburden on three sides by the surrounding coal pillars. A similar zone of tension also exists along the margins of the panel. This has led to the supposition that gob gas ventholes placed in this area, instead of in the more traditional centerline location, might produce gob gas at a higher rate and for a longer time.
A test of this concept was conducted in the study area. However, the presence of high volumes of water that frequently interfered with gob gas venthole production made this a less than optimum test site. In spite of the problems on the test panel, the test results are encour- aging. The four near-margin holes that produced for 7 months on the test panel had a 37-pct higher average production than the two centerline holes that produced for the same length of time. The average cumulative methane production for the seven near-margin holes on the panel was 77 pct higher than for the five centerline holes. The near-margin holes produced more gas and were on pro- duction for a longer time than the centerline holes. Fur- ther testing of the near-margin gob gas venthole concept is needed to substantiate the results of this study. How- ever, this novel concept of placing gob gas ventholes along the margin of a longwall panel to take advantage of the increased fracture permeability in that area may provide a very cost-effective method of increasing mine safety.
REFERENCES
1. Diamond, W. P., J. P. Ulery, and S. J. Kravits. Evaluation of the Source and Migration of Longwall Gob Gas: Lower Kittanning Coalbed, Cambria County, PA. BuMines RI 9430, 1992, 15 pp.
2. Aul, G. N., and R Ray. Optimizing Methane Drainage Systems T o Reduce Mine Ventilation Requirements. Paper in Proceedings of the 5th U.S. Mine Ventilation Symposium (Morgantown, WV). WV Univ., 1991, pp. 638456.
3. Jeran, P. W., and V. Adamek. Subsidence Over the End of a Longwall Panel. BuMines RI 9338, 1991, 8 pp.
4. Adamek, V., P. W. Jeran, and M. A. Trevits. Static and Dynamic Subsidence Prediction in the Northern Appalachian Coal Region Based on the Use of a Variable Subsidence Coefficient. Paper in Proceedings of the Third Workshop on Surface Subsidence Due to Underground Mining (Morgantown, WV). WV Univ., 1992, pp. 10-21.
5. Jeran, P. W., V. Adamek, and M. A. Trevits. A Subsidence Prediction Model for Longwall Mine Design. Proceedings of the Longwall USA Conference (Pittsburgh, PA). MacLean Hunter, 1986, pp. 101-112.


![Seismic Monitoring Strategies for Deep Longwall Coal … · Seismic Monitoring Strategies for Deep Longwall Coal ... [2016]. Seismic monitoring strategies for deep longwall coal](https://img.pdfslide.us/doc/110x75/5b40c06e7f8b9a2f138d8854/seismic-monitoring-strategies-for-deep-longwall-coal-seismic-monitoring-strategies.jpg)