Embed Size (px)
Citation preview

Evaluation of Agricultural Policy Reforms in Korea
www.oecd.org
Evaluation of Agricultural Policy Reforms in Korea
«E
valuation o
f Ag
ricultural Po
licy Refo
rms in K
orea

Evaluation of Agricultural Policy Reforms in Korea

ORGANISATION FOR ECONOMIC CO-OPERATION AND DEVELOPMENT
The OECD is a unique forum where the governments of 30 democracies work together to
address the economic, social and environmental challenges of globalisation. The OECD is also at
the forefront of efforts to understand and to help governments respond to new developments and
concerns, such as corporate governance, the information economy and the challenges of an
ageing population. The Organisation provides a setting where governments can compare policy
experiences, seek answers to common problems, identify good practice and work to co-ordinate
domestic and international policies.
The OECD member countries are: Australia, Austria, Belgium, Canada, the Czech Republic,
Denmark, Finland, France, Germany, Greece, Hungary, Iceland, Ireland, Italy, Japan, Korea,
Luxembourg, Mexico, the Netherlands, New Zealand, Norway, Poland, Portugal, the Slovak Republic,
Spain, Sweden, Switzerland, Turkey, the United Kingdom and the United States. The Commission of
the European Communities takes part in the work of the OECD.
OECD Publishing disseminates widely the results of the Organisation’s statistics gathering and
research on economic, social and environmental issues, as well as the conventions, guidelines and
standards agreed by its members.
Corrigenda to OECD publications may be found on line at: www.oecd.org/publishing/corrigenda.
© OECD 2008
No reproduction, copy, transmission or translation of this publication may be made without written permission. Applications should be sent to
OECD Publishing [email protected] or by fax 33 1 45 24 99 30. Permission to photocopy a portion of this work should be addressed to the Centre français
d’exploitation du droit de copie (CFC), 20, rue des Grands-Augustins, 75006 Paris, France, fax 33 1 46 34 67 19, [email protected] or (for US only) to
Copyright Clearance Center (CCC), 222 Rosewood Drive, Danvers, MA 01923, USA, fax 1 978 646 8600, [email protected].

Foreword– 3
EVALUATION OF AGRICULTURAL POLICY REFORMS IN KOREA –© OECD 2008
Foreword
This report is an analysis of the Korean agricultural sector and Korean agricultural policy. It was undertaken as part of the OECD’s continuing work on Member countries’ policies and contains evaluation and recommendations based on the principles for agricultural policy reform laid down by OECD ministers in 1987 and developed further in 1998. The last study of agricultural policies in Korea was undertaken in 1998, and this report focuses on policy reforms that occurred after that report was published. In addition to reporting a wide variety of statistics with respect to Korean agriculture, the report describes and makes use of two of the main OECD tools for agricultural policy analysis — the PSE and CSE database and the Policy Evaluation Model (PEM).
The main author of the report is Il Jeong Jeong. Roger Martini also contributed, including the section dealing with the PEM. Editorial assistance was provided by Michèle Patterson and statistical assistance was provided by Alexandra de Matos Nunes. All authors are with the OECD Directorate for Trade and Agriculture. Many other colleagues from the Directorate provided useful comments. The Korea Rural Economic Institute (KREI) also contributed to this report. The report was declassified by the Working Party on Agricultural Policies and Markets of the Committee for Agriculture in February 2008.


Table of contents– 5
EVALUATION OF AGRICULTURAL POLICY REFORMS IN KOREA –© OECD 2008
Table of contents
Executive Summary .................................................................................................................................... 7
Chapter I. The Agricultural Situation in Korea......................................................................................... 11
I.1. Characteristics of Korean Agriculture ........................................................................................ 11 I.2. Agricultural Trade ...................................................................................................................... 21 I.3. Challenges in Korean Agriculture .............................................................................................. 26
Chapter II. Agricultural Policies, 1995-2007 ............................................................................................ 27
II.1. The Objectives of Agricultural Policies and Recent Policy Developments ............................... 27 II.2. Income Policy ............................................................................................................................. 28 II.3. Polices Enhancing Agricultural Competitiveness ...................................................................... 31 II.4. Agro-Food Policy ....................................................................................................................... 33 II.5. Environment Policy .................................................................................................................... 34 II.6. Rural Development Policy ......................................................................................................... 37 II.7. Trade Policy ............................................................................................................................... 38
Chapter III. Analysis of Support to Agriculture ....................................................................................... 43
III.1. Evolution and Decomposition of Support to Agriculture .......................................................... 43 III.2 PEM Analysis of Support to Agriculture .................................................................................. 52
Chapter IV. Evaluation and Recommendations ........................................................................................ 69
IV.1. Evaluation of Agricultural Policies Over the Last Ten Years ................................................... 69 IV.2 Recommendations for the Future Policy Reform ...................................................................... 72
Annex Tables ............................................................................................................................................ 77
References ................................................................................................................................................. 98


Executive Summary– 7
EVALUATION OF AGRICULTURAL POLICY REFORMS IN KOREA –© OECD 2008
Executive Summary
The Korean government has implemented a series of agricultural policy reforms over the last ten years to cope with significant changes in both the international environment and the domestic situation. Through the implementation of the Uruguay Round agreement, import prohibitions on major agricultural products except rice were transformed into a tariff system. As a result, agriculture in Korea is more exposed to international competition and increasing the competitiveness of this sector and adjusting policies accordingly have became urgent goals for policy-makers. The focus of domestic societal interests in the agricultural sector has also changed significantly. Consumer interest in environmentally-friendly agricultural products has increased, outbreaks of animal disease have drawn national attention to food safety, and the rapid migration from rural to urban areas with the increase of industrialization has led to rural areas being left behind and spurred increased interest in rural development. The purpose of this report is to evaluate Korean agricultural policy reforms which were taken to cope with these challenges over the last ten years and to provide recommendations for continuing the reform process in the future.
First, this report provides an overview of the current Korean agricultural situation with respect to average farm size, the age structure of the farm population, the level and distribution of farm household income, grain and livestock production patterns, and international trade in agricultural products. Agriculture in Korea is characterized by small farm size and an ageing farm population. Recent data shows a fall in the dominance of rice and the increasing importance of livestock products in production and consumption.
This report also describes the agricultural policy developments that have taken place over the last ten years in the areas of income, farm consolidation, environmental, and rural development policies. The evolution and decomposition of agricultural support, as measured by the Producer Support Estimate (PSE) and the Consumer Support Estimate (CSE) is described and discussed. The Policy Evaluation Model (PEM) is used to evaluate how variations in support levels affect production, trade, and welfare.
Overall, the Korean government has implemented agricultural policy reforms that in many aspects are broadly consistent with the principles of transparency, targeting, tailoring, flexibility and equity outlined by OECD Ministers. Support through direct payments has increased significantly in recent years, especially after the introduction of the direct payments system for paddy fields in 2005 following the rice negotiation which permitted the suspension of tariffication for rice for another ten years from 2005 to 2014. Several comprehensive agricultural investment plans have been put in place to improve the infrastructure for production, processing, and distribution and have contributed to efficiency gains. Through the increased efforts to promote environmentally-friendly farming, the share of environmentally-friendly products in agricultural production has increased. The newly introduced Good Agricultural Practices (GAP) regulation, Hazard Analysis and Critical Control Point (HACCP) system, and traceability scheme respond to growing consumer concerns about food safety. Regulations on farmland use and

8 – Executive Summary
EVALUATION OF AGRICULTURAL POLICY REFORMS IN KOREA © OECD 2008
ownership have been revised to render them more market oriented. As a result of the 2004 rice negotiation and several FTAs, market opening in agricultural products will continue to increase as these agreements are implemented. These policy changes have been contributing to the modernisation of the Korean agro-food sector, increasing its efficiency, and bringing benefits for producers and consumers.
Despite the progress to date, there remains room for additional reforms aimed at improving the market orientation and economic contribution of the sector. The level of the percentage PSE of Korea remains high compared to other OECD countries and most of this support is in the form of Market Price Support (MPS). The introduction of fixed and variable payments on paddy field is an improvement over continued use of market price support, however the variable payments remain coupled to rice production. The current quota-based system of milk pricing, which was introduced in 2002, has helped to reduce the surplus and the associated budget costs but continues to allow overproduction and provides significant support to producers. While the regulations limiting the total amount of land a farmer may hold have been abolished, urban residents have been allowed to possess farmland for weekend or hobby farming, and agricultural corporations have been allowed to own farmland, quite strict regulations still continue to apply to non-farmer and corporate ownership of farmland.
Agriculture in Korea needs to be allowed to evolve into an efficient, modern enterprise that provides a positive economic contribution to society in line with other sectors of the economy. The OECD makes several recommendations for further policy reform in Korea.
Efforts to open agricultural markets should be continued to reduce the high price gap between domestic and international prices.
• The variable payments which encourage rice production should be reviewed. The role of the fixed payments for paddy fields needs to be clarified so that the objectives of these payments are clearly understood and they can be targeted to meet these objectives.
• Reduction of milk quota to decrease the need for subsidy on manufacturing milk, reducing the out-of-quota price, or balancing the domestic market by reducing the in-quota price of milk would improve economic efficiency in the dairy sector.
• Increased efforts could be made to diversify income sources of agricultural households. Examples include the promotion of agro-tourism and agro-food industries. By promoting investment in education, transport, heath, and housing infrastructure, the desirability of rural areas and the opportunities for off-farm work would be increased.
• Future policies should promote larger farm holdings and farm consolidation. Given the high price of farmland, the further development of the rental market should be pursued. Current restrictions on land ownership by corporations and non-farmers could be further eased. Also, the current definition of a farmer and associated legal, fiscal and financial implications needs to be reviewed, in order to avoid being an impediment to diversification and rural development.
• Environmental policies should respect the polluter-pays principle and care must be taken to ensure that commodity policies do not conflict with environmental goals.

Executive Summary– 9
EVALUATION OF AGRICULTURAL POLICY REFORMS IN KOREA –© OECD 2008
• The provision of safe, high quality agricultural products should be an important aspect of future agricultural policy in Korea. Efforts promoting traditional foods and helping to develop premium products for the domestic market should be intensified.
• Efforts to improve efficiency in upstream and downstream industries in the agricultural production chain should be continued.


Chapter 1. Agricultural Situation in Korea– 11
EVALUATION OF AGRICULTURAL POLICY REFORMS IN KOREA –© OECD 2008
Chapter I.
Agricultural Situation in Korea
I.1. Characteristics of Korean agriculture
The significance of agriculture in the Korean economy
The rapid development of the Korean economy is reflected strongly in the changing role of agriculture. Until the 1960s, agriculture generated almost half of Korea’s GDP and in 1970, agricultural production continued to contribute 25.5% of GDP and the labour force employed in the agricultural sector accounted for 50.5% of the country’s total labour force. As the industrialization process progressed, however, the share of agriculture in the national economy declined sharply. In 2005, the share of agricultural production in GDP was 2.9% and the agricultural population accounted for 7.1% of the total population. Nevertheless, despite this decline agriculture continues to play an important role in the Korean national economy, accounting for a relatively large share of GDP, and with a large rural population and employment as compared to other OECD countries.
As a large net importer of food products, agricultural imports are important in Korea’s overall trade balance. They represented around 18% of merchandise imports in 1970, but dropped to 4% in 2005 as non-agricultural imports grew at a much faster rate. In current US dollars, agricultural imports were valued at about USD 9.8 billion in 2005 making Korea one of the largest importing countries of agricultural products in OECD. Korea exports small quantities of specialty agricultural products mostly to Japan and the United States. These exports, valued at USD 2.1 billion in 2005, were – at 0.7% – unimportant relative to total exports and to Korea’s agricultural production.
In 1970, almost half of all urban household expenditure was on food. Reflecting economic development, the share of food in consumption expenditures has fallen dramatically over this same period (19% in 2005). The indicators of the role of agriculture in the Korean economy are shown in Annex Table I.3.

12 – Chapter 1. Agricultural Situation in Korea
EVALUATION OF AGRICULTURAL POLICY REFORMS IN KOREA © OECD 2008
Graph I.1. Contribution of agriculture to the economy, 1970-2005
,0
,10
,20
,30
,40
,50
,60
1970 1975 1980 1985 1990 1995 2000 2005
%Share of agriculture in GDP Share of agriculture in employment
Source: MAF, Statistical Yearbook of Agriculture and Forestry, various years, Seoul.
Graph I.2. Contribution of agriculture to trade, 1970-2005
0
5 000
10 000
15 000
20 000
0
5
10
15
20
1970 1975 1980 1985 1990 1995 2000 2005
Million USD %
Share of agricultural exports in total exportsShare of agricultural imports in total importsValue of agricultural exports Value of agricultural imports
Source: MAF, Statistical Yearbook of Agriculture and Forestry, various years, Seoul.

Chapter 1. Agricultural Situation in Korea– 13
EVALUATION OF AGRICULTURAL POLICY REFORMS IN KOREA –© OECD 2008
Farmland structure
As of 2005, the total cultivated area in Korea was 1.8 million hectares, or 18% of the total land area (Annex Table I.1). Despite intensive efforts to increase this area through drainage, irrigation and reclamation, the cultivated area has tended to decline due to industrial and urban development. The share of cultivated land in total land area fell from 23% in 1970 to 18% in 2005. Of the 1.8 million hectares of cultivated land, 61% is paddy field and 39% is upland. Rice is the dominant crop and occupies 51% of cultivated land.
Korean agriculture is characterized by small farms. A combination of factors, including regulations governing the sale and transfer of land and the role of land as a family asset to be preserved, means that the average farm size is extremely small. Although the average area farmed per household in 2005 was almost 50% higher than in 1970, it was still only 1.4 hectares (Graph I.3, Annex Table I.6). More than 60% of farms have less than 1 hectare and only 7% have more than 3 hectares, although this latter category shows the most rapid increase. Korea has a relatively equal distribution of holdings, with little variation between regions and farm types. Most Korean farms are mixed general farms although the number of specialised farms, notably in the production of livestock and greenhouse vegetables, has increased.
Graph I.3. Evolution of average farm size, 1970-2005
0.0
0.2
0.4
0.6
0.8
1.0
1.2
1.4
1.6
1970 1975 1980 1985 1990 1995 2000 2005
Hectares
Source: MAF, Statistical Yearbook of Agriculture and Forestry, various years, Seoul.
Characteristics of the agricultural labour force
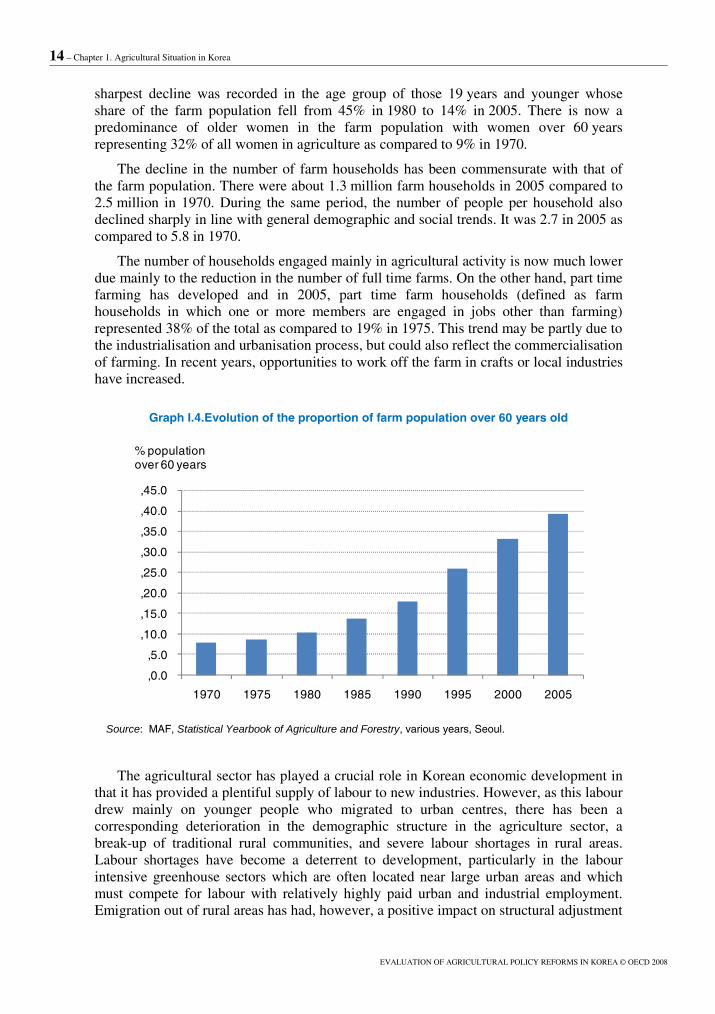
Since the industrialisation process in the Korean economy began in the 1960s, there has been a rapid decline in the agricultural labour force, both in absolute terms and relative to the total labour force. The farm population in 2005, at 3.4 million persons or about 7.1% of the total population, was less than a quarter of its 1970 level (Annex Table I.6). The proportion of the farm population over 60 years old is increasing rapidly: indeed, it has quintupled between 1980 and 2005 and is now around 40% (Graph I.4). All other age groups have experienced a fall in absolute as well as relative terms, but the
14 – Chapter 1. Agricultural Situation in Korea
EVALUATION OF AGRICULTURAL POLICY REFORMS IN KOREA © OECD 2008
sharpest decline was recorded in the age group of those 19 years and younger whose share of the farm population fell from 45% in 1980 to 14% in 2005. There is now a predominance of older women in the farm population with women over 60 years representing 32% of all women in agriculture as compared to 9% in 1970.
The decline in the number of farm households has been commensurate with that of the farm population. There were about 1.3 million farm households in 2005 compared to 2.5 million in 1970. During the same period, the number of people per household also declined sharply in line with general demographic and social trends. It was 2.7 in 2005 as compared to 5.8 in 1970.
The number of households engaged mainly in agricultural activity is now much lower due mainly to the reduction in the number of full time farms. On the other hand, part time farming has developed and in 2005, part time farm households (defined as farm households in which one or more members are engaged in jobs other than farming) represented 38% of the total as compared to 19% in 1975. This trend may be partly due to the industrialisation and urbanisation process, but could also reflect the commercialisation of farming. In recent years, opportunities to work off the farm in crafts or local industries have increased.
Graph I.4.Evolution of the proportion of farm population over 60 years old
,0.0
,5.0
,10.0
,15.0
,20.0
,25.0
,30.0
,35.0
,40.0
,45.0
1970 1975 1980 1985 1990 1995 2000 2005
% population over 60 years
Source: MAF, Statistical Yearbook of Agriculture and Forestry, various years, Seoul.
The agricultural sector has played a crucial role in Korean economic development in that it has provided a plentiful supply of labour to new industries. However, as this labour drew mainly on younger people who migrated to urban centres, there has been a corresponding deterioration in the demographic structure in the agriculture sector, a break-up of traditional rural communities, and severe labour shortages in rural areas. Labour shortages have become a deterrent to development, particularly in the labour intensive greenhouse sectors which are often located near large urban areas and which must compete for labour with relatively highly paid urban and industrial employment. Emigration out of rural areas has had, however, a positive impact on structural adjustment

Chapter 1. Agricultural Situation in Korea– 15
EVALUATION OF AGRICULTURAL POLICY REFORMS IN KOREA –© OECD 2008
in the agricultural sector by increasing farm size and, therefore, farm income in the last forty years.
Agricultural production
As a result of improvements in land and labour productivity, agricultural production has increased about 1.7 times between 1980 and 2005. In 2005, agricultural production was valued at KRW 35 trillion (USD 34 billion) (Annex Table I.3), of which a quarter consisted of rice. Over the period 1980-2005, the share of fruits and vegetables, milk, meat and eggs in total production grew faster than that of cereals and soybeans as the former require less land, are more labour intensive, and are subject to rapidly growing consumer demand linked to rising incomes (Graph I.5).
While consumer demand for food has been diversified, production capacity has decreased for the major crops and has shifted towards more profitable crops. Korea’s self sufficiency ratio for basic foodstuffs fell from 81% in 1970 to 29% in 2005. When feed grains are excluded, self-sufficiency was 52% in 2005 as compared to 86% in 1970.
Rice is by far the most important single product and the dominant grain in Korea as shown by its contribution to agricultural production and land use. In 2005, it accounted for 24% of total production and about 51% of total cultivated area. However, the importance of rice in the value of agricultural production decreased rapidly over the last forty years. Rice production rose to a peak of 6 million tonnes in 1988 and then declined as profitability fell relative to fruits and vegetables and the high yielding tong-il rice variety was abandoned. In 2005, rice production was 4.7 million tonnes. In recent years, the area occupied by paddy fields, used mainly for rice production, has decreased by 10 000 hectares, which represents about 1% of the total area, per year.
The production of barley and soybeans was 1.1 million tonnes and 216 000 tonnes respectively in 1980, but their total production has fallen over the last twenty years. In 2005, the production of barley and soybeans was only 59 000 tonnes and 105 000 tonnes respectively. In parallel, there has been a significant fall in the area planted to barley and soybeans between 1980-2005 as the relative profitability of these crops has decreased. The decline in barley production has been spectacular: in 1980 barley production was worth 17% of the value of rice production but fell to less than 3% by 2005. Production of other grains is negligible in Korea. In 2005, wheat production was only 8 000 tonnes and maize production 73 000 tonnes.

16 – Chapter 1. Agricultural Situation in Korea
EVALUATION OF AGRICULTURAL POLICY REFORMS IN KOREA © OECD 2008
Graph I.5. Value of agricultural production
2005
Rice 24%
Vegetables20%
Fruits9%
Milk4%
Beef & veal9%
Pork11%
Chicken meat3%
Other crops14%
Eggs and other livestock
6%
1985
Rice36%
Vegetables18%
Fruits6%
Other crops15%
Milk3%
Beef8%
Pork7%
Chicken meat5%
Eggs and other livestock
2%
Source: MAF, Statistical Yearbook of Agriculture and Forestry, various years, Seoul.
Chapter 1. Agricultural Situation in Korea– 17
EVALUATION OF AGRICULTURAL POLICY REFORMS IN KOREA –© OECD 2008
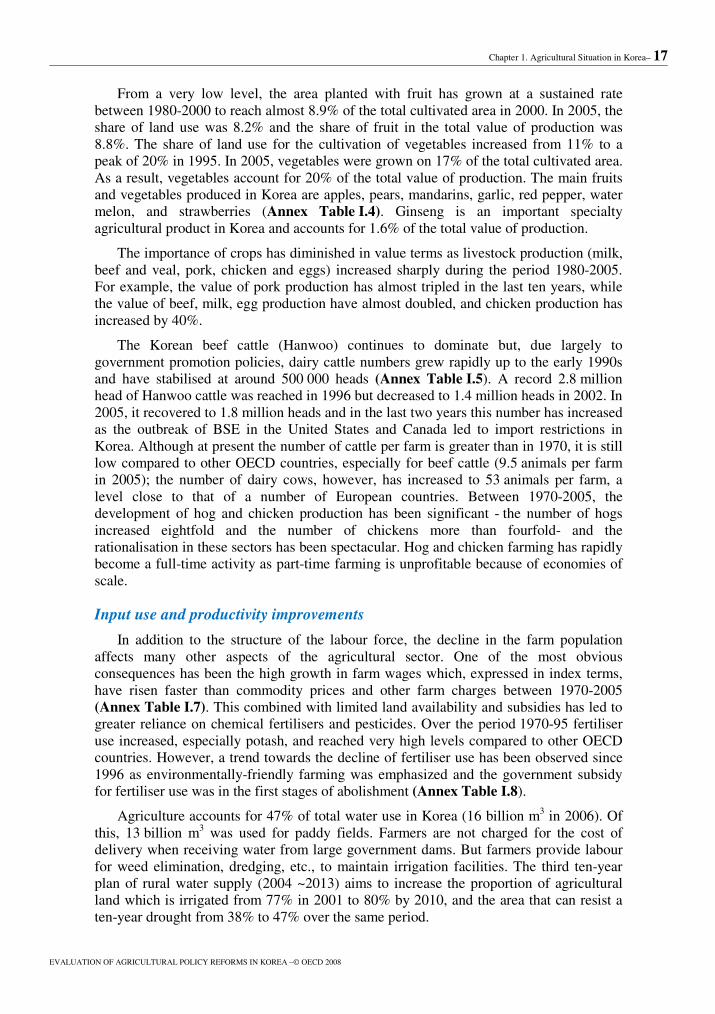
From a very low level, the area planted with fruit has grown at a sustained rate between 1980-2000 to reach almost 8.9% of the total cultivated area in 2000. In 2005, the share of land use was 8.2% and the share of fruit in the total value of production was 8.8%. The share of land use for the cultivation of vegetables increased from 11% to a peak of 20% in 1995. In 2005, vegetables were grown on 17% of the total cultivated area. As a result, vegetables account for 20% of the total value of production. The main fruits and vegetables produced in Korea are apples, pears, mandarins, garlic, red pepper, water melon, and strawberries (Annex Table I.4). Ginseng is an important specialty agricultural product in Korea and accounts for 1.6% of the total value of production.
The importance of crops has diminished in value terms as livestock production (milk, beef and veal, pork, chicken and eggs) increased sharply during the period 1980-2005. For example, the value of pork production has almost tripled in the last ten years, while the value of beef, milk, egg production have almost doubled, and chicken production has increased by 40%.
The Korean beef cattle (Hanwoo) continues to dominate but, due largely to government promotion policies, dairy cattle numbers grew rapidly up to the early 1990s and have stabilised at around 500 000 heads (Annex Table I.5). A record 2.8 million head of Hanwoo cattle was reached in 1996 but decreased to 1.4 million heads in 2002. In 2005, it recovered to 1.8 million heads and in the last two years this number has increased as the outbreak of BSE in the United States and Canada led to import restrictions in Korea. Although at present the number of cattle per farm is greater than in 1970, it is still low compared to other OECD countries, especially for beef cattle (9.5 animals per farm in 2005); the number of dairy cows, however, has increased to 53 animals per farm, a level close to that of a number of European countries. Between 1970-2005, the development of hog and chicken production has been significant - the number of hogs increased eightfold and the number of chickens more than fourfold- and the rationalisation in these sectors has been spectacular. Hog and chicken farming has rapidly become a full-time activity as part-time farming is unprofitable because of economies of scale.
Input use and productivity improvements
In addition to the structure of the labour force, the decline in the farm population affects many other aspects of the agricultural sector. One of the most obvious consequences has been the high growth in farm wages which, expressed in index terms, have risen faster than commodity prices and other farm charges between 1970-2005 (Annex Table I.7). This combined with limited land availability and subsidies has led to greater reliance on chemical fertilisers and pesticides. Over the period 1970-95 fertiliser use increased, especially potash, and reached very high levels compared to other OECD countries. However, a trend towards the decline of fertiliser use has been observed since 1996 as environmentally-friendly farming was emphasized and the government subsidy for fertiliser use was in the first stages of abolishment (Annex Table I.8).
Agriculture accounts for 47% of total water use in Korea (16 billion m3 in 2006). Of this, 13 billion m3 was used for paddy fields. Farmers are not charged for the cost of delivery when receiving water from large government dams. But farmers provide labour for weed elimination, dredging, etc., to maintain irrigation facilities. The third ten-year plan of rural water supply (2004 ~2013) aims to increase the proportion of agricultural land which is irrigated from 77% in 2001 to 80% by 2010, and the area that can resist a ten-year drought from 38% to 47% over the same period.

18 – Chapter 1. Agricultural Situation in Korea
EVALUATION OF AGRICULTURAL POLICY REFORMS IN KOREA © OECD 2008
Mechanisation has been significant over the last 20 years as shown in Annex Table I.9. In addition to high producer prices, mechanisation has been encouraged by government programmes, including access to credit, training, establishment of farm machinery service centres in rural areas, and promotion of co-operative machinery ownership and utilisation. As shown in Annex Table I.9, the number of power tillers per 100 farms increased from 13.7 in 1980 to 66.1 in 2005. The number of rice transplanters and harvesting machines per 100 farms increased from 0.5 in 1980 to 26.8 and 7.0 respectively in 2005. In addition, since contract farming and cooperative use of machine is widespread, the degree of mechanisation in Korean agriculture is very high. For example, one farmer often uses his own equipment to perform the major rice farming tasks for several neighbours and almost all rice in Korea is now transplanted and harvested by machines. In effect, the increase of contract farming leads to large-scale consolidation de facto, without the transfer of land titles.
As a result of all these developments in input use, there have been significant improvements in crop yields over the period 1970-2005 (Annex Table I.10). Most of the increase in rice yield occurred before 1985 brought about by the development of high yielding varieties and the adoption of modern farming technologies such as water management, land improvement, and fertiliser use. Progress in milk production has been considerable as milk yields increased from about 3 300 kilograms per cow, per year in 1970 to nearly 9 000 kilograms in 2005, levels comparable to those attained in the most technically efficient OECD countries.
Prices and income
On average, over the period 1970-2005 farm gate prices of all farm products increased but at a slower rate than farm wages and charges (Annex Table I.7). Farm gate prices of rice and other grains increased up until 2000 but have since stabilised. Although the price of fruit and vegetables fluctuates considerably according to changes in production which result from weather conditions, prices have been stagnant in recent years. Prices of livestock products have shown steady increase and they have become more profitable to produce with respect to grain, vegetables, or fruit.
As a result of increased agricultural productivity and higher prices, real agricultural income (deflated by the Consumer Price Index) has increased by close to one and half times over the last 20 years. However, it continues to be extremely difficult to generate income from agricultural activities comparable to what can be earned outside the agricultural sector on such small holdings; hence, farm households have strongly diversified their income sources and now depend on agriculture for around 40% of their total incomes on average, compared to more than three-quarters in 1970 (Graph I.6).
Over the last 20 years, the non-agricultural income of farm households grew more than nine fold while agricultural income has increased by a multiple of three. The increasing importance of non-agricultural income has been facilitated since the 1970s by initiatives taken to improve rural industrialisation and to create off-farm job opportunities in rural areas. Non-business income accounted for 24% of total farm household income and salaries accounted for 81% of the total non-business receipts in 2005 (Annex Table I.12).
The degree of dependency on farm income increases with farm size. Annex Table I.13 shows that in 2005, farm households with more than 5 hectares of land earned 55% of their income from agricultural activities while this share was only 15% for

Chapter 1. Agricultural Situation in Korea– 19
EVALUATION OF AGRICULTURAL POLICY REFORMS IN KOREA –© OECD 2008
households farming less than 0.5 hectares. On average, farm households have been able to achieve income levels broadly comparable to urban households until the early 1990s (Annex Table I.11). However, the income gap between farm and urban households has widened since the beginning of the 1990s and farm household income was only 78% of urban household income in 2005.
In 2005, farm household debt as a share of total farm asset values was 9%. Of the average farm debt of KRW 27.2 million (USD 27 000), 84% of this amount was borrowed from credit institutions (mostly the National Agriculture Co-operatives Federation) and the remaining 16% from private sources. Over the last ten years, farm debt increased at an average rate of 11.5% per year. The origin of the increase is mainly commercial farmers, the increase of mechanization in farming, new investments, and occasional price drops of certain products due to oversupply or outbreak of disease. Chronic farm debt has been a serious problem for many years and a number of policy measures have been implemented to alleviate farm debt.
Graph I.6. Share of agricultural income to farm household income, 1970-2005
0
10
20
30
40
50
60
70
80
90
1970 1975 1980 1985 1990 1995 2000 2005
%
Source: MAF, Statistical Yearbook of Agriculture and Forestry, various years, Seoul.
Food consumption
Although rice consumption per capita has been declining sharply and is likely to continue to do so, rice still dominates the Korean diet with consumption at over 80 kilograms per capita in 2005. Vegetable consumption has increased dramatically over the last thirty years and now represents around 170 kilograms per person, per year (Annex Table I.15). The fourfold increase in fruit consumption over the last 30 years is also remarkable, but Korean dietary traditions persist and rice does not seem to have been replaced by any other cereal. The highest consumption growth has been recorded in livestock products, which increased five-fold over the period 1970-95 and at a slower pace since. Over the years, the predominance of pork in meat consumption has been confirmed. Almost zero in 1970, milk consumption is now almost 63 kilograms per

20 – Chapter 1. Agricultural Situation in Korea
EVALUATION OF AGRICULTURAL POLICY REFORMS IN KOREA © OECD 2008
person, per year. In contrast with most OECD countries, milk is mainly consumed as fluid.
The movement towards livestock products, fruits and vegetables reflects mainly income growth. However, the Korean diet is still high in carbohydrates and low in fat as compared to most other OECD countries. An increase in Western-style and processed food consumption can also be observed as convenience and quick preparation have become more important. The demographic shift occurring in Korea will have a great impact on food consumption patterns in the future. Population growth is coming to an end and an older population may shift preferences to more healthy and nutritious food.
Agro-food sector
Food processing industries are not yet fully developed in Korea. Their contribution to the economy in terms of GDP and employment is small relative to primary agriculture (Annex Table I.18). The share of food processing industries in GDP was 2.4% in 2005 and total gross sales of the food processing industry were KRW 49.4 trillion (USD 48.2 billion). Value-added in the food processing sector nevertheless grew over the last three decades, although more slowly than in other manufacturing industries. The number of employees in the food processing industry represented only 0.8% of total employment in 2005.
According to a mining and manufacturing survey, the number of food processing companies with more than five employees has risen by 34% over the last ten years (Annex Table I.19). At the same time, the total number of employees in food processing industry has fallen from 206 200 in 1995 to 185 900 in 2005. As a result, the number of employees per company declined from 33 to 22. Value-added as a proportion of gross sales fell slightly from 41.5% in 1995 to 39.5% in 2005. Compared to other manufacturing industries, food processing companies are smaller in size and R&D investment is much lower. In particular, food processing companies in rural areas also lack capital to adopt modern technologies, especially for transportation and packaging. In addition, those in rural areas are penalised by poor infrastructure and lack of information.
Compared to the slow development in the food processing industry, the retail sector, particularly hypermarkets and convenience stores, has been developing very rapidly. Compared to 1996, the sales of hypermarkets and convenience stores have increased 960% and 210% respectively by 2006. The traditional markets have lost share and around 80 000 small scale stores among 706 000 small scale retail stores with less than four employees left the market since 1996. The number of hypermarkets has increased from 28 in 1996 to more than 300 in 2006 and this trend will continue as lower price and one-stop shopping become increasingly the norm. The consolidation of retail marketing offers opportunities and challenges to farmers in Korea. Large scale retail entrepreneurs have increased their influence on quality control and price setting. As Private Brands (PB) are developed by the hypermarkets, they are providing strong competition to producer brands.
Upstream industries are dominated by the production of feedstuffs with sales of KRW 4.8 trillion (USD 4.7 billion) followed by fertilisers at over KRW 1 trillion (USD 1 billion) and machinery at KRW 207 billion (USD 202 million) in 2005 (Annex Table I.20). The National Agricultural Co-operatives Federation (NACF) and local agricultural co-operatives play an important role in delivering these inputs to farmers.

Chapter 1. Agricultural Situation in Korea– 21
EVALUATION OF AGRICULTURAL POLICY REFORMS IN KOREA –© OECD 2008
I.2. Agricultural Trade
Imports and exports of agricultural products
Although agricultural production has more than doubled over the period 1970-2005 and self-sufficiency has been attained for some major products such as rice, the volume of Korean imports of agricultural products has increased strongly. This largely reflects rapid income growth and changes in dietary patterns and has been facilitated by a degree of agricultural trade liberalisation. Korea is thus a significant net food importer. With a population of about 48 million and a rapidly growing standard of living, Korea is a very important market for exporters of cereals, including feed grains and livestock products (Graph I.7).
Graph I.7. Imports of agricultural products, 1980-2005
0
2 000
4 000
6 000
8 000
10 000
12 000
14 000
16 000
1980 1982 1984 1986 1988 1990 1992 1994 1996 1998 2000 2002 2004
Million USD Total All grains Livestock
Source: MAF, Statistical Yearbook of Agriculture and Forestry, various years, Seoul.
The top ten imported agricultural goods by value account for 64% of the total in 1992-1994 and 51% of total in 2004-2006 (Table I.1). The decreasing dominance of the top ten goods shows the trend of diversification of imported agricultural products, although the dominance rate is still very high. Cereals, mainly wheat and maize, represent a large but decreasing proportion of agricultural imports: from almost half of the total at the beginning of the 1980s, they now account for less than a fifth. Korea imported about 3.6 million tonnes of wheat in 2005 and imports of maize, mainly used for animal feed, increased to 8.5 million tonnes. At 1.3 million tonnes in 2005, imports of soybeans are also significant. The second main imported item in value terms is livestock products, mainly beef and veal, which in 2005 accounted for 17% of all agricultural imports. In recent years, imports of all products, in particular fruits, vegetables and livestock products have increased, leading to a higher trade deficit (Annex Table I.16).

22 – Chapter 1. Agricultural Situation in Korea
EVALUATION OF AGRICULTURAL POLICY REFORMS IN KOREA © OECD 2008
Table I.1. Main imports of agricultural goods to Korea
1992-1994 Million USD
Part (%) 2004-2006 Million USD
Part (%)
Maize 749 16.7 Maize 1 309 13.2Wheat 483 10.8 Beef 738 7.4Beef 414 9.3 Wheat 670 6.7Soyabean 324 7.3 Pork 583 5.9Cane sugar 320 7.2 Cane sugar 415 4.2Cigarettes 148 3.3 Soyabean 406 4.1Oil-cakes of soyabean 147 3.3 Oil cake of soyaban 394 4.0Coffee 106 2.4 Whiskey 223 2.2Palm oil 89 2.0 Royal gelly 200 2.0Oranges 74 1.7 Oranges 171 1.7Bananas 62 1.4 Soyabean oil 143 1.4Tobacco 55 1.2 Cheese 137 1.4Whiskey 54 1.2 Coffee 133 1.3Oil cakes of rape or colza seeds 53 1.2 Fodder roots 133 1.3Young antlers 48 1.1 Bananas 115 1.2Beef fallow 44 1.0 Palm oil 111 1.1Wheat of brans/sharps/residues 43 1.0 Tobacco 110 1.1Sesame seeds 39 0.9 Other fruit 109 1.1Royal gelly 39 0.9 Fowl 96 1.0Tapioca 38 0.9 Ethyl alcohol 88 0.9Molasses 38 0.8 Olive oil 86 0.9Oil cakes of cotton seeds 36 0.8 Chocolate 86 0.9Pork 35 0.8 Rice 84 0.8Ethyl alcohol 31 0.7 Sesame seeds 72 0.7Other pharmaceutical plants 29 0.6 Food preparations 72 0.7Turkey 29 0.6 Wine 71 0.7Chocolate 26 0.6 Molasses 68 0.7Cocoa preparations 26 0.6 Other sauce preparations 60 0.6Other pharmaceutical plants 1 137 19.9 Other 3 057 30.7Total 4 719 100.0 Total 9 941 100.0
Source: MAF, Database on trade in agriculture, Seoul.
The top ten exported agricultural goods by value account for 63% of the total in 1992-1994 and 49% of total in 2004-2006 (Table I.2). As in the case of imports, there is a tendency towards diversification. However, compared to the stable composition of imported products, there is a significant fluctuation in the composition of the top ten export products which reflects the situation of world markets. Only three items in the top exported goods in 1992-1994 survived in the top ten lists in 2004-2006. Outstanding examples are the cases of chestnuts and pork. These accounted for 13.5% of total exports in 1992-1994, but its share shrank to only 1.8% in 2004-2006 as China started to intensify exports of this item to Japan. Also, the outbreak of swine fever had a significant impact on Korea’s export markets. Overall, the evolution of the composition of exports has been a shift towards higher value products, such as processed goods.
The direction of trade flows of agricultural products has changed very little since the early 1990s, implying that the increase in trade has been distributed fairly evenly among trading partners (Table I.3). Japan was the main destination for Korean agricultural exports, accounting for 31% of the total, and the United States has provided a quarter of Korea’s imports in 2004-2006.

Chapter 1. Agricultural Situation in Korea– 23
EVALUATION OF AGRICULTURAL POLICY REFORMS IN KOREA –© OECD 2008
Table I.2. Main exports of agricultural goods from Korea
1992-1994 Million USD
Part (%) 2004-2006 Million USD
Part (%)
Chestnuts 113 13.5 Cigarettes 271 13.2Cane or beet sugar 88 10.5 Ramen 132 6.4
Pigmeat 57 6.8 Soju 122 5.9
Ramen 47 5.6 Coffee preparations 104 5.1
Red gingseng 45 5.4 Cane or beet surgar 98 4.8
Pine mushrooms 43 5.1 Kiml-chi 89 4.3
Gum 37 4.4 Royal jelly 51 2.5
White gingseng extract 35 4.2 Biscuits 50 2.4
Kim-chi 34 4.0 Sweet peppers 47 2.3
Fruit juice beverage 26 3.1 Pears 43 2.1
Sheep meat 19 2.3 Other sugar confectionary 39 1.9
Other pharmaceutical plants 19 2.3 Chestnuts 38 1.8
Mixes and doughs for bakery 17 2.1 Beer 36 1.8
Candies 17 2.0 Red ginseng 36 1.7
Other dairy preparations 16 2.0 Mixes and doughs for bakery 35 1.7
White gingseng preparations 16 1.9 Prepared food of cereals 34 1.6
Beer 16 1.9 Mayonnaise 29 1.4
Coffee preparations 15 1.8 Pigmeat 28 1.4
Oak mushrooms 14 1.7 Gum 28 1.4
Other sugar confectionary 14 1.7 Other vegetables 25 1.2
Cocoa powder 14 1.7 Fruit juice 25 1.2
Soyu 13 1.5 Lentils 24 1.2
Apples 12 1.5 Other pasta 22 1.1
Biscuits 12 1.4 Other bakery products 21 1.0
White gingseng 10 1.2 Water 19 0.9
Prepared foods of cereals 10 1.2 Other sugar 17 0.8
Other vegetables 10 1.2 Vegetable seeds 17 0.8
Vegetable seeds 9 1.1 Cocoa powder 16 0.8
Other 58 6.9 Others 562 27.3
Total 837 100.0 Total 2 058 100.0
Source: MAF, Database on trade in agriculture, Seoul.
Table I.3. Main agricultural trading partners with Korea (based on trade valued in US dollars)
Exports 1992-1994 2004-2006 Imports 1992-1994 2004-2006
World 100.0 100.0 World 100.0 100.0
Japan 38.5 31.4 United States 28.5 23.7
United States 9.2 13.3 China 20.3 15.5
Russia 6.0 9.4 Australia 10.3 13.3
China 1.0 9.2 European Union 7.8 13.1
Hong Kong - China 17.4 6.2 Brazil 3.1 6.1
United Emirates 0.9 5.3 New Zealand 2.4 3.6
Chinese Taipei 4.9 4.1 Canada 5.3 3.0
European Union 8.6 2.4 Argentina 0.3 2.6
Rest of world 13.6 18.8 Rest of world 22.0 18.9
(per cent) (per cent)
Source: MAF, Database on trade in agriculture, Seoul.

24 – Chapter 1. Agricultural Situation in Korea
EVALUATION OF AGRICULTURAL POLICY REFORMS IN KOREA © OECD 2008
Tariff structure and imports mechanism
In accordance with the Uruguay Round Agreement on Agriculture, import restrictions on all agricultural products, with the exception of rice and rice products, were converted to tariffs by July 1997 (January 2001 for beef). As Korea has developing country status in the WTO, it was given a ten-year period (from 1995 to 2004) to implement its commitments. Reduction requirements for tariffs were 24% on average, with a minimum of 10% per tariff line. In 2004, after fulfilling its ten-year tariff reduction commitments of URAA, the bound tariffs for agricultural products remained at the same level. Among the 1 698 tariff lines of agricultural products, a total of 121 tariff lines (those applying to products that have been tariffied) are subject to the special agricultural safeguard clause (SSG).
Tariff rate quotas were established on 67 product groups under the current and minimum access provisions of URAA. Quotas also cover the most important agricultural product, rice. In compliance with the special treatment provision in the Uruguay Round Agreement on Agriculture, Korea had not converted rice import restrictions to tariffs but has established a minimum access quota. Minimum access for rice is fixed at 1% of the average 1988-90 domestic consumption, rising to 4% by 2004. In 2004, these special provisions were re-negotiated and an agreement was reached to continue special treatment for another ten years from 2005 to 2014. Under this new agreement, the Minimum Market Access volume would be increased from 4.4% of domestic consumption in the year 2005 to about 8% of domestic consumption in the year 2014. Table I.4 presents a summary of market access commitments with WTO member countries for selected products and their tariffs. The fill rate of tariff-rate quota was around 65% in 2005. Out of 63 agricultural products currently subject to TRQ, 26 were completely filled, 22 were partially filled and there were no imports of 15 products.
Korea uses three different procedures for quota administration. There are state-trading agencies for 17 products, including rice, barley, soybeans, oranges and sesame. For 40 products, tariff quota entitlements are distributed on a first-come first-served basis or are based on historical imports. For the remaining 6 products, including sesame oil and milk powder, an auction system is employed (Table I.5). Tariff quota administration has typically been delegated to the same State-trading agencies, agricultural associations or marketing organisations traditionally responsible for domestic marketing.

Chapter 1. Agricultural Situation in Korea– 25
EVALUATION OF AGRICULTURAL POLICY REFORMS IN KOREA –© OECD 2008
Table I.4. Market access commitments for selected commodities
In-quota (MT) In-quota tariff rates, % Tariffs/TEs
Initial Final Implemen-
tation period
Base rate Bound rate
Reduction rate
Rice 51 307 5% 102 614 5% 225 575 5%
102 614 5%205 228 5%408 700 5%
1995~19992000~20042005~2014
Special treatment (neither tariffied nor bound)
Barley 14 150 20% 23 582 20% 1995~2004 333% or 401 KRW/kg
299.7% or 361 KRW/kg 10
Soybean 1 032 152 5% 1 032 152 5% 1995~2004 541% or 1 062 KRW/kg
487% or 956 KRW/kg 10
Maize 6 102 100 3% 6 102 100 3% 1995~2004 365% 328% 10
Beef 123 000 43.6% 225 000 41.6% 1995~2000 44.5% 40% 10
Frozen Pork 21 930 25% 18 275 25% 1995~1997.6 37% 25% 19
Frozen Chicken 7 700 20% 6 500 20% 1995~1997.6 35% 20% 43
SMP 621 20% 1 034 20% 1995~2004 220% 176% 20
Orange 15 000 50% 57 107 50% 1995~2004 99% 50% 50
Red-pepper 4 311 50% 7 185 50% 1995~2004 300% or 6 900 KRW/kg
270% or 6 210 KRW/kg 10
Garlic 8 680 50% 14 467 50% 1995~2004 400% or 2 000 KRW/kg
360% or 1 800 KRW/kg 10
Onions 12 369 50% 20 645 50% 1995~2004 150% or 200 KRW/kg
135%or 180 KRW/kg 10
Source: Korea’s GATT and WTO Schedules.
Table I.5. Features of State Trading for imports of TRQ in Korea
State trading agency Items Legal basis
Ministry of Agriculture and Forestry (MAF)
Rice, barley Food Grain Management Act
Korea Agro-Fisheries Trade Corporation (aT)
Beans, buckwheat, soya beans, potatoes, onions, garlic, fruits of genus capsicum, ginger, groundnuts, sesame seeds
The Act for Supply and Demand and Price Stabilisation of Agricultural and Fisheries Products
National Agricultural Co-operatives Federation (NACF)
Natural honey Livestock Farming Act
Cheju Citrus Growers’ Agricultural Co-operative
Oranges, Korean citrus fruits Agro-Fisheries Marketing and Price Stabilisation Act
National Ginseng Co-operatives Federation
Ginseng Ginseng Industry Act
National Forestry Co-operatives Federation
Pine nuts Forestry Act

26 – Chapter 1. Agricultural Situation in Korea
EVALUATION OF AGRICULTURAL POLICY REFORMS IN KOREA © OECD 2008
I.3. Challenges in Korean agriculture
Korean agriculture faces many challenges at both the domestic and international levels. The implementation of the Uruguay Round agreement led to important changes in its agriculture. Greater exposure to international competition means that increasing competitiveness, together with appropriate adjustment policies, have become urgent goals.
However, increasing the competitiveness of agriculture is a major challenge given the prevalence of small farms and the high proportion of older farmers. About 62% of Korean farms are less than 1 hectare in size. In spite of policy reforms to facilitate structural adjustment, the average farm size has only increased from 0.94 hectare in 1975 to 1.43 hectare in 2005. At the same time, the average age of farmers has been increasing; currently, about 30% of farmers are more than 65 years old.
Another key challenge for policy makers is the gap in income between farm and urban households. Although the gap has narrowed a little in recent years, the average farm household income is still only 78% of urban household incomes, which is low when compared to almost all other OECD countries. Increasing the possibilities for farm households to earn alternative sources of income in rural areas is a challenge that has been taken up by Korean policy makers.
Recent changes in consumer needs pose another important challenge for the Korean agriculture sector. Consumer interest in environmentally-friendly agricultural products has increased. outbreaks of animal disease have also drawn national attention to food safety.
Investments in the distribution system over the last decades have created a vastly improved infrastructure for distribution of agricultural products. However, the agro-food sector and its associated distribution system remain underdeveloped relative to other sectors of the economy.
Rapid industrialization and the consequent migration from rural to urban areas have led to rural areas being left behind. Policy makers are increasingly interested in rural development as a way to tackle problems in rural areas, such as the lack of good quality in education and medical services.

Chapter II. Agricultural Policies, 1995-2007– 27
EVALUATION OF AGRICULTURAL POLICY REFORMS IN KOREA –© OECD 2008
Chapter II.
AGRICULTURAL POLICIES, 1995-2007
II.1. The objectives of agricultural policies and recent policy developments
Although food security, income parity between farm and urban households, increased competitiveness, and rural development have remained as policy objectives throughout the past fifty years, the emphasis among the objectives of agricultural policies in Korea has changed over this period. From the 1950s to the 1970s, efforts were concentrated primarily on increasing productivity of crops as well as achieving self-sufficiency in rice. Since the 1980s, the issue of income parity between farm and urban households has emerged following GDP growth and industrialization. In the late 1980s and through the 1990s, the focus shifted to structural adjustment and competitiveness in order to prepare for the opening of agricultural markets. In recent years, the emphasis has shifted to a broader set of objectives related to enhancing the quality of life in rural areas, agricultural competitiveness, environment, farm household income and food safety.
From the mid-1980s, the Korean government began to develop comprehensive plans for the agricultural sector. To prepare for the challenges of market liberalization following the Uruguay Round negotiations, the “Agricultural and Rural Structure Improvement Plan” was established in 1991. This plan included a KRW 42 trillion (USD 47 billion) investment plan for the agricultural sector. Its main objective was to strengthen the competitiveness of the agricultural sector. Once the Uruguay Round was concluded, the Korean government established the “Comprehensive Rural Development Plan” in 1994, the aim of which was to implement the KRW 42 trillion investment scheme as well as to introduce a KRW 15 trillion (USD 17 billion) special rural development tax. These expanded investments and loans increased the share of the budget set-aside for agriculture and forestry in the total national budget to 13-15% during 1994-97 from 9% in 1993.
From 1998, the Korean government implemented the second phase of the structural adjustment plan, which included another KRW 45 trillion (USD 37 billion) investment plan to strengthen the agricultural sector and rural development. A new legal framework for Korean agriculture and rural policies, the Agricultural and Rural Basic Law, came into effect in January 2000. This introduced direct income payments and support for environmentally-friendly farming practices.
In 2004, the government introduced the “Comprehensive Plan on Agriculture and Rural Communities” and established the “Ten-Year Mid and Long-Term Policy Framework on Agriculture and Rural Communities.” In this latest plan, the Korean government envisioned a policy roadmap in three areas—the agro-food sector, agriculture and rural development. In order to implement this roadmap, the Korean government will

28 – Chapter II. Agricultural Policies, 1995-2007
EVALUATION OF AGRICULTURAL POLICY REFORMS IN KOREA © OECD 2008
invest KRW 119 trillion (USD 104 billion) in the agricultural sector between 2004 and 2013. To promote rural development and to improve the quality of life of rural residents, a comprehensive law titled the Special Act for Improving the Quality of Life of Farmers and Fishermen and Promoting Development in Rural, Mountainous and Fishing Communities was established in 2004. The implementation of the Special Act, involving fifteen Ministries and one government agency, began in 2005.
Under these three comprehensive plans covering the last ten years, several policies were implemented related to farm household income, agricultural competitiveness, agro-food sector, environment, rural development, and agricultural trade. The following section contains a description of these.
II.2. Income policy
Reducing the income disparity between urban and rural areas has been a very important policy item in Korea. To improve farm household income, significant policy efforts have been made over the last ten years.
The expansion of the direct payment program
A number of different direct payments have been introduced since the late 1990s, with a variety of objectives. The first of these was introduced in 1997 in the form of early retirement payments with a view to facilitating structural adjustment. Farmers over 65 years of age who were willing to sell or rent their land to full time farmers for a period of more than five years were eligible to receive a lump-sum payment of KRW 258 per m2 of farmland either sold or leased (or USD 2 713 per hectare), calculated as the difference between annual farming income and rent during three years. The amount of payments increased over time; currently farmers who plan to retire could receive annual payments of around KRW 2.9 million (USD 3 000) per hectare for eight years in 2006.
A direct payment for less favoured areas programme, introduced on a pilot basis in 2004, became a national programme in 2006. Its budget increased from KRW 10 billion (USD 8.7 million) in 2004 to KRW 52 billion (USD 54.4 million) and the participating areas increased from 29 742 hectares to 119 000 hectares in the same period. In 2006, 2 779 villages, where the share of arable land was below 22% and the land gradient is over 14%, were eligible to receive KRW 400 000 (USD 418) per hectare for dry fields and KRW 200 000 (USD 209) per hectare for pasture.
Following the 2004 rice negotiation, the most important direct payment in the Korean agricultural sector, a direct income support mechanism for paddy field was introduced. This mechanism includes both fixed and variable payment systems from the 2005/06 crop year. To be eligible for the fixed payment, paddy fields had to be in production during the period 1998-2000. The fixed payment per hectare for registered paddy fields was KRW 600 000 (USD 586) in 2005 and increased to KRW 700 000 (USD 732) in 2006. Expenditure in 2006 was KRW 716.8 billion (USD 750 million) for 1 024 000 hectares. The variable payment is given only to farmers who are currently producing rice on registered farmland. The amount of the variable payment is determined according to the difference between a target price and each year’s post-harvest price. For the years 2005-07, the target price is KRW 170 083 (USD 178) per 80 kilograms of rice, determined by adding the income effect of past government purchasing and paddy-field environmental conservation payments to the three year average of the harvest price from 2001 to 2003.

Chapter II. Agricultural Policies, 1995-2007– 29
EVALUATION OF AGRICULTURAL POLICY REFORMS IN KOREA –© OECD 2008
If the post-harvest price is lower than the target price, farmers receive 85% of the difference, after deduction of the fixed payment, which is multiplied by a fixed national reference yield to calculate the payment per hectare. The variable payment per hectare was KRW 958 310 (USD 936) in 2005 and fell to KRW 459 757 (USD 481) in 2006.
Protecting farm income from natural disasters
Programmes to protect farm household income from natural disasters have been reinforced in recent years. A crop insurance scheme, introduced for apples and pears in 2001, was implemented for seven agricultural products in 2006. The farmers’ share of the premium decreased from 41% in 2002 to 31% in 2006 with the remainder paid by the government. The Korean government plans to increase product coverage to 30 items by 2011 and to introduce an all-risks damage estimation system for paddy rice and several crops.1 Also, the product coverage of the livestock insurance scheme to protect farmers’ income from outbreaks of animal disease and natural disaster increased from four livestock products (cattle, pigs, chicken and horses) in 2002 to nine livestock products, including deer, duck, pheasant, quail and turkey, in 2006.
Stabilising the price of agricultural products
Government purchase programmes for barley, maize and soybeans operated continuously over the last ten years, managed by the National Agricultural Cooperative Federation (NACF). The purchase prices of barley and maize have been held constant since 2001. Government purchases of barley have decreased from 247 000 tonnes from 2004 to 124 000 tonnes in 2006. Also, government purchases of maize have decreased sharply from 4 000 tonnes in 2004 to 600 tonnes in 2006, reflecting the sharp fall in domestic production in recent years. However, the quantity of government purchase of soybeans has increased in recent years as domestic production increased (Table 2.1). From 2005, the government purchase programme for rice, in which the government paid a higher price than the market price, was abolished and a Public Stockholding Scheme, which is a purchase and release mechanism based on the current market price, was implemented. The purpose of the public stockholding scheme is the food security of major staples in the event of natural disasters or other unexpected circumstances. The target amount of public stockholding for rice is 864 000 tonnes, which amounts to two months national consumption. To keep this amount in good edible condition, the government needs to purchase 432 000 tonnes (half of 864 000 tonnes) during the harvest season and release the same amount during the non-harvest season each year.
The price stabilisation activities for vegetables are funded by the Agricultural Products Price Stabilisation Fund which is financed partly by the government and partly by the revenue from sales of products purchased domestically for buffer stocks and the mark-up on imports of state traded items such as beans, soybeans, potatoes, onions, garlic, etc., which are managed by the Korea Agro-Fisheries Trade Corporation. Price stabilisation operations are sporadic and the main crops affected have been red pepper, garlic and onions.

30 – Chapter II. Agricultural Policies, 1995-2007
EVALUATION OF AGRICULTURAL POLICY REFORMS IN KOREA © OECD 2008
Table 2.1. Government purchase prices and quantities of major cereals in recent years
Units 20021 20031 20041 20051 2006p1
Percentage change
2003 to
2004
2004 to
2005
2005 to
2006p Barley2
Purchase price
’000 KRW/t
1 109 1 109 1 109 1 109 1 109 0.0 0.0 0.0
USD/t 886 931 968 1 083 1 160
Purchase quantity
’000 t 247 162 180 181 124 11.1 0.6 -31.5
Maize3
Purchase price
’000 KRW/t
580 580 580 580 580 0.0 0.0 0.0
USD/t 464 487 506 566 606
Purchase quantity
’000 t 3 4 2.5 1.7 0.6 -37.5 -32.0 -64.7
Soybeans3
Purchase price
’000 KRW/t
2 296 2 296 2 296 2 877 2 877 0.0 25.3 0.0
USD/t 1 835 1 928 2 005 2 809 3 009
Purchase quantity
’000 t 4.8 5.4 10.5 12.6 14.1 94.4 20.0 11.9
1. Calendar year basis. 2. Polished-grain equivalent in the case of price, and unhulled-grain equivalent in the case of quantity.
3. Polished-grain equivalent.
Source: Ministry of Agriculture and Forestry.
Developing and expanding off-farm income sources
The government has been implementing programmes to expand off-farm income sources, including establishing Agricultural Industrial Complexes and Regional Specialty Products Complexes. These allow the industrial sector to use agricultural resources in a specific region more efficiently and provide another income source for rural communities. This project started in 1984 and 322 Agricultural Industrial Complexes were built by 2006.
The Korean government has encouraged diversified programmes such as agro-tourism in order to promote off-farm income and has supported infrastructure investments for agro-tourism in selected counties. During 2002~2006, 190 Green Tour Villages were built with government support and regional festivals were promoted as tourist attractions. In 2004, the government revised the Act for the Improvement of Infrastructure in Rural Community so as to ensure that farm-stay businesses are operated only by rural residents.

Chapter II. Agricultural Policies, 1995-2007– 31
EVALUATION OF AGRICULTURAL POLICY REFORMS IN KOREA –© OECD 2008
II.3. Polices enhancing agricultural competitiveness
As an effort to strengthen the competitiveness of Korean agriculture, a variety of agricultural and forestry programs have been implemented that reduce production cost through farm consolidation, foster competitive farm managing entities, encourage farmers to specialise, as well as promote the development of agricultural technology.
Promoting farm consolidation
Korea maintained strict farmland ownership rules under the land-to-tiller principle, such that farmers could not own more than three hectares of farmland until 1992. In order to get around the former 3 hectare ownership limit, some farm families used strategies such as assigning land holdings to different family members. In 1993, the farm size ownership limit was increased from 3 hectares to 10 hectares within the Agriculture Development Region (ADR). However, with permission from the county head, farmers could own up to 20 ha inside the ADR. The ADR is designated by municipalities and provinces according to the Farmland Act; within the ADR, conversion of farmland to non-agricultural uses is prohibited. In 1999, the ownership limit outside the ADR was increased from 3 ha to 5 ha and in 2002, the limit on farm size was abolished both inside and outside the ADR, and farmers may now own farmland without any size limitations. Only farm households could own farmland until 1990. However, this system was changed in 1990 as farmer’s association corporations, of which all members must be farmers, were allowed to own farmland. In 2002, the Farmland Act was revised to allow farmland to be owned by agricultural corporations under the conditions that investment by farmers represented at least half of the total investment, the representative of the corporation is a farmer and more than half of the executive board are farmers.
The Korea Rural Community and Agricultural Corporation (KRC), a non-profit public body, has played an important role in farm consolidation. One major KRC project involves enlarging farm size to improve productivity and rural income through economies of scale and the consolidation of farmland. Under this project, farmers are provided financial support for leasing and acquiring farmland through low interest loans, with a focus on young, full-time rice producers. Between 1995 and 2004, the KRC selected 84 831 rice farmers and provided these farmers with loans totalling KRW 3 trillion (USD 2.7 billion). Over this period, the average farm in this group increased from 2.2 ha to 4.3 ha and the average income increased to about KRW 12 million (USD 11 000) per farm, in part due to cost savings resulting from increased size of the farm. The efficiency of agricultural management through consolidation of farmland also increased; 85% of the supported farms were adjacent (within a radius of 500 metres) to the existing farmland.
To facilitate farm enlargement and farmland mobility, a new farmland banking system, which is run by the Korean Rural Community and Agricultural Corporation (KRC), was introduced in 2005. It provides information to farmers who wish to own or rent farmland from the KRC or others who want to sell or lease farmland and plays a role as mediator in the farmland market. Although non-farmers are prohibited from holding farmland in principle, they may hold more than 1 hectare of farmland acquired by inheritance or out-migration as long as they lease it to KRC. This change has been in effect since October 2005 as a result of the revision of the Farmland Act. Its aim is to minimize the fragmentation of farmland and encourage young full-time farmers to increase the scale of their farms more easily through a farmland banking system. In 2006,

32 – Chapter II. Agricultural Policies, 1995-2007
EVALUATION OF AGRICULTURAL POLICY REFORMS IN KOREA © OECD 2008
a new program was introduced whereby the KRC will buy farmland from farmers who hold a significant amount of debt. If viable, the KRC will then lease the farmland back to them. This program aims to stabilize the farmland market and support farmers who are in temporary financial difficulty.
Recruiting young farmers and promoting specialization
To encourage new farmers, the Korean government has implemented several policies. Between 1981 and 2006, 125 000 future farmers were selected and supported with loans totalling KRW 2 438 billion (USD 2 653 million). Every year, about 1 000 new farmers under 35 years can receive a loan of a maximum KRW 200 million (USD 175 000) to start farming and repay it over the next 15 years. To smooth the path for new entrants, a guardianship system for new entrants was introduced in 2005. Under this system, experienced farmers or specialists such as professors in agricultural studies can be designated as guardians for new farmers with the government financing consultation and educational expenses.
To promote specialized farmers, special loans were provided to rice, livestock, fruit and vegetable farmers to support expansion of farm size, the purchase of new machines, and the renovation of orchard facilities. Loans totalling approximately KRW 1 476 billion (USD 1 587 million) will be provided to these selected specialized farmers at a special interest rate of 3% in 2007. From 1998, subsidies have been provided to cover management consulting fees.
The promotion of agricultural technology development
To promote R&D in the agricultural sector, the Agricultural Research and Development Promotion Center (ARPC) was established in 1995. Through this new agency, KRW 391 billion (USD 358 million) was attributed to 3 005 research projects. Through 2002-2006, the government budget for R&D increased at an average rate of 6.4%, which is higher than the national budget increase rate of 4.1%.
To develop regional networks among the academic community, research institutes, the industrial sector and local governments for the provision of technical and marketing assistance to farmers, the government launched the regional agriculture cluster programme with a budget of KRW 12 billion (USD 12.6 million) in 2005 and KRW 20 billion (USD 20.9 million) in 2006.

Chapter II. Agricultural Policies, 1995-2007– 33
EVALUATION OF AGRICULTURAL POLICY REFORMS IN KOREA –© OECD 2008
II.4. Agro-food policy
Enhancing food safety
Policies to cope with growing consumer concerns about food safety have been intensified. The traceability scheme for agricultural and livestock products, launched in 2004 on a pilot basis for beef, has begun to be applied throughout the market. The breeding and movement history of branded cattle has begun to be computerized in an electronic database. After slaughtering, meat cuts will carry an identification number all the way to the retail stage. The government established a system of DNA tests to identify beef quality as of 2005. In 2006, the government established a traceability information system for agricultural products (www.farm2table.kr) and about 8 800 farm households and 800 distributors are participating in this programme.
The HACCP (Hazard Analysis Critical Control Point) system was introduced in 1997 and applied to all slaughtering houses as of 2003. It is now being applied widely in the livestock and milk industry. After three years of preparation, the government launched the Good Agricultural Practices (GAP) regulation and designated 21 institutions as GAP certification agencies in 2006. About 3 700 farm households participated in this programme. The number of safety tests for agricultural products rose from 43 000 items in 2000 to 66 000 items in 2006.
The outbreaks of foot and mouth disease in 2002 and Avian Influenza (AI) in 2003 seriously concerned Korean society. To cope with the potential increased inflows of damaging infectious diseases due to growing international movement of people and products, the “Comprehensive Livestock Disease Control Plan” was established in 2004; this plan has improved the disease control response system, its organization as well as human resources allocated to this sector.
Modernizing distribution channels for agricultural products
In 1998, the Korean government established a Committee for reform of the distribution system for agricultural products and began a drive to modernize the distribution system. More public wholesale markets were constructed and an electronic auction system was implemented in 1999. In response to changing market conditions a direct transaction system was put in place alongside the auction system from 2000 and a real-time information network was established in order to improve the transparency and flow of market information.
The number of Agricultural products Processing Centers (APCs) which manage systematically the selection, storage, packaging and marketing of specific products in the region has increased from 134 in 1998 to 253 in 2006. The number of specialized local distributing companies has also increased from 99 in 2000 to 658 in 2005. The Geographical Indication (GI) system was introduced in 1999 and 54 regional products were certified as GI products by 2007.
With a view to ensuring an optimum level of production of perishable commodities, including vegetables and fruits, and to stabilizing their prices, the government introduced a marketing orders system in 2000. Under this system, farmers are prohibited from selling commodities which do not meet certain quality standards when demand and supply are highly unstable.

34 – Chapter II. Agricultural Policies, 1995-2007
EVALUATION OF AGRICULTURAL POLICY REFORMS IN KOREA © OECD 2008
To promote e-commerce in agricultural products and direct sale from producers to consumers, a nationwide e-commerce shopping mall (www.a-peace.com) was established in 2000. The system of quality standards for agricultural products has been accelerated and now more than half of agricultural products are marketed following national standards on agricultural products. Also, marketing of agricultural products under specific brand names has increased significantly in recent years.
Promotion of the agro-food industry
Through the Law of Promotion of the Agricultural Products Processing Industry, in place since 1993, the Korean government has promoted the establishment of local food companies which use agricultural products in their region. The system of traditional food designation was started in 1999, with 43 items selected by 2007. Currently 271 traditional food factories can use the mark of quality certification of traditional foods from the Ministry of Agriculture and Forestry on their products.
Recently, the Korean government has recognized that the agro-food industry will be important in the future. In 2005, it established a “Comprehensive Plan for Promotion of the Agro-Food Industry,” the aims of which are to increase R&D in the food industry, to promote the globalization of Korean traditional food, to improve human capital and skills in the agro-food sector, and to improve the connection between regional specialty agriculture and the food industry. Through the institutional change giving the Ministry of Agriculture and Forestry responsibility for the food industry and the establishment of the Agro Food Promotion Act in 2007, the Korean government is trying to strengthen links between agriculture and the food industry.
II.5. Environment policy
Fertilizer and pesticide use in agriculture in Korea is among the most intensive in the world. Agriculture accounts for nearly 50% of total water use and, with growing competition for water resources nationally, agriculture is under pressure to manage water more efficiently. Trends in water quality indicate that agriculture is an important source of pollutants. The principal pollutants are nitrates and phosphates, especially from livestock operations and to a lesser extent fertilisers, with concentrations increasing in some rivers, lakes and reservoirs. There is also an accumulation of phosphorus, heavy metals in agricultural soils. The build-up of phosphorus in agricultural soils from the overuse of fertilisers and livestock manure is more than twice that required for the optimal level of growth in some areas. Korea had provided support that has important environmental implications including fertilisers, pesticides, irrigation and energy.
To cope with environmental concerns in society, the Korean government established the Environmentally Friendly Agriculture Promotion Act in 1997 and launched its Mid-term (five year) Plan for environment-friendly farming practices in 2001. Policy objectives are to stimulate the adoption of sustainable farming practices, cut chemical input use, encourage the adoption of soil conservation practices, and address biodiversity concerns.
Reducing the use of fertilisers and pesticides
The objective of achieving self sufficiency in rice and increasing the productivity of crops led to a policy of subsidizing fertilisers and pesticides and resulted in Korean

Chapter II. Agricultural Policies, 1995-2007– 35
EVALUATION OF AGRICULTURAL POLICY REFORMS IN KOREA –© OECD 2008
farmers being the most intensive users of fertilisers and pesticides in the world. From the mid-1990s, efforts have been made to reverse this situation. Integrated Pest Management (IPM) and Integrated Nutrient Management (INM) programmes were introduced in 1993. Since 1997 pesticides have been subject to an environmental charge per container of KRW 6 (USD 0.006) (less than 500 ml) to KRW 16 (USD 0.014) (more than 500 ml). Subsidies to fertilisers decreased from 1996 and were stopped by 2005. Through these efforts, the average usage of chemical fertilisers per hectare decreased from 424 kg in 1995 to 376 kg in 2005 and the average use of chemical pesticides per hectare decreased from 11.1 kg in 2000 to 10.7 kg in 2005.
The expansion of environmentally-friendly farming
Since the introduction of the Environmentally-friendly Agriculture Promotion Act of 1997, several measures have been introduced to encourage environmentally-friendly farming practices. From 1999, direct payments for environmentally friendly farming were introduced to compensate for the reduction of yields brought by the adoption of environmentally friendly farming practices. In 2006, the payment per hectare for environmentally friendly farming was increased to between KRW 524 and 794 000 (USD 548 to 831) for dry fields and between KRW 217 and 392 000 (USD 227 to 410) for paddy fields. About 27 000 farm households who produced low-chemical, chemical-free and organic products received total payments of KRW 11.4 billion (USD 11.9 million) in 2006. Government supports were provided to local governments to finance facilities and equipment in designated environmentally-friendly farming areas. During the period 2001-2005, 191 environmentally-friendly areas were built up. A pilot programme providing direct payments for environmentally-friendly livestock practices, introduced in 2004, was continued for nine hundred livestock-producing farm households with a budget of KRW 5.8 billion (USD 6 million) in 2006.
A labelling system was introduced in 1999 to enhance consumer recognition of organically grown produce. Through these efforts, the share of environmentally-friendly products in all agricultural products has increased from 0.2% in 2000 to 4.4% in 2005. The number of stores which sell these environmentally-friendly products increased from 352 in 2000 to 1 200 in 2005 and the number of farmers who produce environmentally-friendly products increased from 2 000 in 2000 to 53 000 in 2005.
The management of livestock manure
Surpluses of both nitrogen and phosphate from agriculture have grown rapidly, mainly due to rising pig and poultry numbers. Agricultural water pollution from livestock operations has been identified as a serious environmental issue that farmers need to address. In 2006, 44 million metric tonnes of livestock manure was produced, of which 42% was from the hog industry. To build facilities and equipment for the processing of livestock manure, more than KRW 1 trillion (USD 1 billion) was provided to livestock farmers during 1991-2005. By 2002, 98% of livestock farmers were equipped with a processing system. A comprehensive plan for efficient management and utilization of livestock manure was established in 2004. The implementation of the plan concentrates on establishing a system of efficient utilization of livestock manure for crop production. Advice to farmers on the efficient management of livestock manure and the development of new technology are also the main objectives of the plan. A pilot programme of direct payments for environmentally-friendly livestock practices was implemented during the

36 – Chapter II. Agricultural Policies, 1995-2007
EVALUATION OF AGRICULTURAL POLICY REFORMS IN KOREA © OECD 2008
period 2004-2006. To promote efficient management of livestock manure and food safety, a registration system for livestock farmers was introduced from 2005.
Around 44 million tonnes of livestock manure was produced in 2006, of which 2.6 million metric tonnes was dumped into the sea causing harmful effects on coastal fisheries. In June 2007 the Korean government introduced a special plan to reduce dumping of livestock manure into the sea and to bring the practice to a complete stop by 2012. According to this plan, the government will try to decrease sea dumping by 0.5 million tonnes each year by investing around KRW 60 billion (USD 63 million) in the management of livestock manure each year until 2011.
Overall National agro-environmental performance
Figure 2.1 shows agro-environmental performance compared to the OECD average. The agricultural nitrogen and phosphorus balance has decreased between 1990-92 and 2002-04. While there was a small reduction in agricultural greenhouse gas (GHGs) emissions, Korea experienced the highest increase in ammonia emissions among OECD countries. On-farm energy consumption has increased 43% over the period 1990-92 to 2002-04. Overall, the net burden on the environment from agriculture is significant in Korea, but recent policy developments are beginning to address the issue.
Figure 2.1. National agri-environmental performance compared to the OECD average
Unit Years Korea OECD
kg N/hectare 2002-04 240 74
kg P/hectare 2002-04 48 10
Tonnes1990-92
to 2001-03
-2 276 -46 762
000 Tonnes of oil equivalent
1990-92 to
2002-04+805 +2 218
Million m31990-92
to 2001-03
+1 100 +8 102
000 Tonnes1990-92
to 2001-03
+38 +169
Million tonnes CO2 equivalent
1990-92 to
2002-04-271 -31 493
Agricultural nitrogen (N)
balance
On-farm energy consumption
Agricultural pesticide use
Agricultural ammonia emissions
Agricultural greenhouse gas emissions
Percentage change 1990-92 to 2002-041
Variable
Absolute and economy-wide change/level
Agricultural water use
Agricultural phosphorus (P) balance
-6
27
7
43
-8
-11
-2
-3
2
2
4
-5
-19
-4
-60 -10 40 90
(2)
(2)
%
OECD Korea
n.a. Data not available. 1. For agricultural water use, pesticide use, and agricultural ammonia emissions, the % change is over the period 1990-92 to 2001-03. 2. Percentage change in nitrogen and phosphorus balances in tonnes.
Source: OECD (2008), Environmental Performance of OECD Agriculture since 1990: Main Report, Paris, France.

Chapter II. Agricultural Policies, 1995-2007– 37
EVALUATION OF AGRICULTURAL POLICY REFORMS IN KOREA –© OECD 2008
II.6. Rural development policy
Rapid industrialization of the Korean economy started from the 1960s. Korea is a rare example of a country that experienced rapid industrialization in one generation. The rapid migration from rural to urban areas with industrialization has led to rural areas being left behind. In the more recent period, this has led to increased interest in rural development.
Improving rural infrastructure
To improve rural infrastructure such as dwellings, roads, drinking water installations and sewage facilities, the Ministry of Agriculture chose 770 rural areas and invested on average KRW 3 billion (USD 3 million) in each area (total KRW 2 335 billion) during the period 1990-2004. Also, a special development plan was put in place for 361 specially lagging rural areas with a total budget of KRW 1 709 billion (USD 1 715 million) during 1990-2004. From 2004, new comprehensive development projects for selected rural villages were launched. Through these projects, selected hub villages which have the potential to become rural cultural leaders can receive government support from KRW 4 billion to KRW 7 billion (USD 4 million to USD 7 million). How the government support is invested is decided by villagers themselves. Under this project, 36 villages were chosen as rural hubs in 2004, 40 villages in 2005, and 20 villages in 2006. There are plans to increase the number of these hub villages to 1 000 by 2017.
Promoting agro-tourism
From the mid-1980s, agro-tourism was pursued as another source of income for farmers. Government support to Green Tour Villages was introduced in 2002. These villages provide programmes for urban people to experience agriculture and rural life. By 2006, the number of these villages had increased to 190 and the number of visitors had increased to 1.3 million. There are plans to increase the number of green tour villages to 850 by 2017. Support is granted for the construction of facilities and for professional advice on the effective management of the tour villages. To promote rural tourism, regional festivals are widely used as tourist attractions. From 2004, the government started a nation-wide campaign to promote summer vacations in rural areas.
The Korean government introduced a new pilot project of direct payments for landscape conservation in 2005 with a budget of KRW 600 million (USD 586 000). It consists of a payment per hectare to farmers who cultivate plants to preserve the traditional landscape in selected villages. About 470 hectares from 1 000 farm households participated in this pilot programme in 2006.
A “One Company, One Village Community Movement” was begun as a new tool for rural development in 2004. This programme succeeded in attracting the attention of Korean companies and 14 498 sponsor-relationships were made by 2006. Through this programme, the employees of the participating companies visit the related rural areas at least once a year and contribute to increasing rural incomes by buying agricultural produce directly from farmers.
Improving the welfare system in rural areas
To construct an effective social safety net in the rural areas, the level of several supports was increased recently. In 2006, the government lowered health insurance premiums for farmers by 50% (the other 50% is paid by the government) and expanded government support of pension payments. Also, the maximum level of compensation
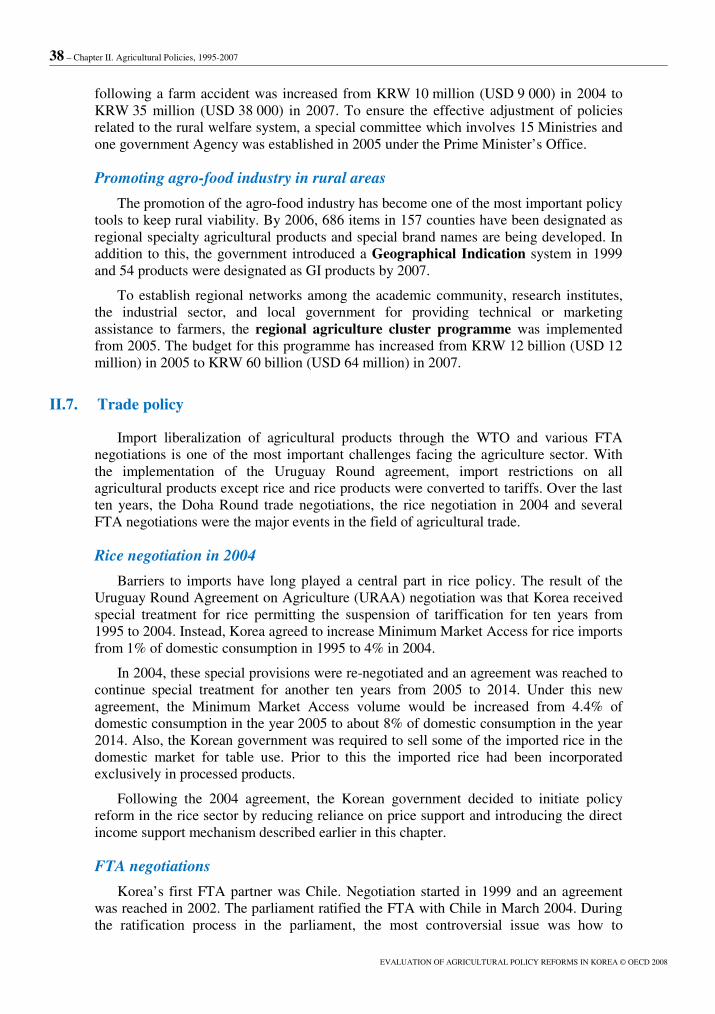
38 – Chapter II. Agricultural Policies, 1995-2007
EVALUATION OF AGRICULTURAL POLICY REFORMS IN KOREA © OECD 2008
following a farm accident was increased from KRW 10 million (USD 9 000) in 2004 to KRW 35 million (USD 38 000) in 2007. To ensure the effective adjustment of policies related to the rural welfare system, a special committee which involves 15 Ministries and one government Agency was established in 2005 under the Prime Minister’s Office.
Promoting agro-food industry in rural areas
The promotion of the agro-food industry has become one of the most important policy tools to keep rural viability. By 2006, 686 items in 157 counties have been designated as regional specialty agricultural products and special brand names are being developed. In addition to this, the government introduced a Geographical Indication system in 1999 and 54 products were designated as GI products by 2007.
To establish regional networks among the academic community, research institutes, the industrial sector, and local government for providing technical or marketing assistance to farmers, the regional agriculture cluster programme was implemented from 2005. The budget for this programme has increased from KRW 12 billion (USD 12 million) in 2005 to KRW 60 billion (USD 64 million) in 2007.
II.7. Trade policy
Import liberalization of agricultural products through the WTO and various FTA negotiations is one of the most important challenges facing the agriculture sector. With the implementation of the Uruguay Round agreement, import restrictions on all agricultural products except rice and rice products were converted to tariffs. Over the last ten years, the Doha Round trade negotiations, the rice negotiation in 2004 and several FTA negotiations were the major events in the field of agricultural trade.
Rice negotiation in 2004
Barriers to imports have long played a central part in rice policy. The result of the Uruguay Round Agreement on Agriculture (URAA) negotiation was that Korea received special treatment for rice permitting the suspension of tariffication for ten years from 1995 to 2004. Instead, Korea agreed to increase Minimum Market Access for rice imports from 1% of domestic consumption in 1995 to 4% in 2004.
In 2004, these special provisions were re-negotiated and an agreement was reached to continue special treatment for another ten years from 2005 to 2014. Under this new agreement, the Minimum Market Access volume would be increased from 4.4% of domestic consumption in the year 2005 to about 8% of domestic consumption in the year 2014. Also, the Korean government was required to sell some of the imported rice in the domestic market for table use. Prior to this the imported rice had been incorporated exclusively in processed products.
Following the 2004 agreement, the Korean government decided to initiate policy reform in the rice sector by reducing reliance on price support and introducing the direct income support mechanism described earlier in this chapter.
FTA negotiations
Korea’s first FTA partner was Chile. Negotiation started in 1999 and an agreement was reached in 2002. The parliament ratified the FTA with Chile in March 2004. During the ratification process in the parliament, the most controversial issue was how to

Chapter II. Agricultural Policies, 1995-2007– 39
EVALUATION OF AGRICULTURAL POLICY REFORMS IN KOREA –© OECD 2008
implement a compensation policy in the agricultural sector. This first FTA negotiation experience boosted confidence to continue FTA negotiations with other countries. As the multilateral negotiations under the Doha Round have fallen behind schedule, the Korean government has started to pursue FTA negotiations more vigorously with several countries simultaneously.
Currently, three FTAs with Chile, Singapore, EFTA (European Free Trade Association) and an FTA on commodity sector with ASEAN are in effect. An FTA agreement with the United States was reached in April 2007. FTA negotiations are currently under way with EU, Canada, India, Japan and Mexico (Table 2.2). The start of FTA negotiations with China, Australia, New Zealand, GCC (Gulf Cooperation Council) is under consideration. The results of the two most important FTAs in the agricultural sector (with Chile and the United States) are discussed below.
Table 2. 2. calendar of FTA negotiations
(1) Currently Effective FTA
Chile
1999 12. Negotiation started
2002 10. Agreement reached
2004 3. Ratification from Korean parliament
2004 4. Effective
Singapore
2004 1. Negotiation started
2004 11. Agreement reached
2005 12. Ratification from Korean parliament
2006 3. Effective
EFTA
2005 1. Negotiation started
2005 7. Agreement reached
2006 6. Ratification from Korean parliament
2006 9. Effective
ASEAN
2005 2. Negotiation started
2006 4. Agreement reached on commodity sector
2007 5. Ratification from Korean parliament
2007 6. Effective
(2) Agreement Reached
United States 2006 6. Negotiation started
2007 4. Agreement reached
(3) Under Negotiation
Japan 2004 1. Negotiation started
Canada 2005 7. Negotiation started
Mexico 2006 2. Negotiation started
India 2006 3. Negotiation started
EU 2007 5. Negotiation started
Source: Ministry of Agriculture and Forestry

40 – Chapter II. Agricultural Policies, 1995-2007
EVALUATION OF AGRICULTURAL POLICY REFORMS IN KOREA © OECD 2008
The results of the FTA with Chile
No concessions were granted on the most sensitive products in Korea (mainly rice, apples, and pears). Garlic, onions, mandarins, dairy products, chicken meat and beef were also excluded but the tariff elimination schedule for these products will be negotiated after the end of the Doha Development Agenda negotiations of the WTO. Tariffs for grape, kiwi, wine and pork will be reduced over the next ten years and eliminated by 2014. In 2006, the tariff on grapes and kiwi from Chile was 33.1% (compared to 45% from other countries), the tariff for wine from Chile was 7.5% (compared to 15% from other countries), and the tariff for pork from Chile was 16% (compared to 22.5% from other countries). While imports from all sources have been increasing for these products, growth in imports from Chile has been particularly high compared to other countries since the start of the implementation of the agreement in 2004. In 2006, imports of kiwi were seven times higher than in 2003 and imports of wine were five times higher than in 2003. Total imports of agricultural products from Chile in 2006 increased about three times compared to 2003 (Table 2.3).
Table 2.3. Imports of agricultural products from Chile to Korea
(thousand USD)
2003 (A)
2004
2005
2006 (B)
Increase ratio (B/A)
Total agricultural products 52 355 81 507 125 179 148 557 2.8
Kiwi 1 758 2 885 7 996 12 255 7.0
Grape 13 656 13 133 19 158 27 835 2.0
Wine 2 990 8 008 11 884 15 376 5.1
Pork 30 237 54 725 80 627 83 557 2.8
Source: Ministry of Agriculture and Forestry.
During the ratification process in 2004, the Korean parliament introduced a new Law for Implementing Free Trade Agreement. This law established a new fund totalling KRW 1.2 trillion (USD 1.1 billion) to compensate domestic fruit producers. By 2006, KRW 465 billion (USD 446 million) was used to compensate retiring fruit farmers and to support projects to increase competitiveness of the fruit industry such as the construction of new marketing facilities.
Exports of Korean industrial products to Chile have increased significantly due to the reduction of tariffs after the FTA became effective. Exports of automobiles to Chile have increased from 22 510 cars in 2003 to 48 925 cars in 2006 and Korea’s share of car imports to Chile has increased from 18.8% in 2003 to 25.7% in 2006. Also, exports of mobile phones and TV sets have increased by an average of 108% and 24% respectively per year over the past three years. Total exports from Korea to Chile have increased around three-fold over the last three years.

Chapter II. Agricultural Policies, 1995-2007– 41
EVALUATION OF AGRICULTURAL POLICY REFORMS IN KOREA –© OECD 2008
The results of the FTA with the United States
Negotiations with the United States were concluded in April 2007 and the resulting FTA is currently in the process of ratification in the Korean parliament. The agricultural sector was the main issue in the negotiations. The United States agreed to eliminate the tariffs for 1 065 items among its 1 813 agricultural products from the effective year and to eliminate tariffs for all agricultural products within 15 years. Korea agreed to eliminate tariffs for 578 items among its 1 531 agricultural products from the effective year. Table 3.4 shows Korean concessions for major agricultural products.
Table 2. 4. Korea’s concessions on major agricultural products in FTA with the United States
Type of concession Major agricultural products
Exemption from concession
Rice
Reduce to zero the in-quota tariff while maintaining the current out-of -quota tariff
Edible maize, edible potatoes, Skim milk power, whole milk power, natural honey
Reduce to zero the in-quota tariff and gradual decrease of out-of-quota tariff to zero by the target year (within 10-18 years)
Cheese, butter, barley, starches, ginseng, red-bean, green peas, sweet potatoes, buckwheat
Gradual decrease of tariff to zero by the target year
-- within 20 years: fuji apple, oriental pear -- within 15 years: beef, egg, red pepper, garlic, ginger, kiwi, tangerine, green tea, chestnut, sesame, sesame oil -- within 12 years: chicken meat, frozen duck meat, frozen onion, melon -- within 10 years: pork, sheep meat, peach, persimmon
Establishment of seasonal tariff Orange, Grape
Zero-tariff from the effective year
Orange juice, grape juice, flowers, eggplants, Coffee, wine, wheat, live animals, tomato paste
Source: Ministry of Agriculture and Forestry.
The Korea Rural Economic Institute (KREI) estimated that implementation of this agreement with the United States will result in reductions in the value of domestic production of KRW 447 billion (USD 481 million) in the fifth year, KRW 896 billion (USD 963 million) in the tenth year, and KRW 1 036 billion (USD 1 117 million) in the fifteenth year and afterwards. Currently, a specific compensation plan is being prepared for ratification by parliament.
The Korea Institute for International Economic Policy (KIEP) estimated that Korea’s exports of automobiles, fibers, and electronic products to the United States would increase by USD 836 million, USD 194 million, and USD 160 million per year respectively due to the reduction of tariffs. It also estimated that exports of industrial

42 – Chapter II. Agricultural Policies, 1995-2007
EVALUATION OF AGRICULTURAL POLICY REFORMS IN KOREA © OECD 2008
goods to the United States would increase by USD 1 387 million per year and boost industrial production in Korea by KRW 5 532 billion (USD 5 948 million) per year when the agreements with United States are implemented.
NOTE
1. Currently, the seven products in the crop insurance scheme are fruits; apples, pears, peaches, grapes, tangerines, and persimmons (sweet and astringent). In the current individual-risk estimation system for fruits, yield loss is estimated each time a hailstorm, typhoon, or frost damage occurs. If an all-risks damage estimation system is introduced for certain crops in the future, the damage would be assessed only once in the harvest season by comparing difference between standard yields and actual yields.

Chapter III. Analysis of Support to Agriculture– 43
EVALUATION OF AGRICULTURAL POLICY REFORMS IN KOREA –© OECD 2008
Chapter III.
ANALYSIS OF SUPPORT TO AGRICULTURE
This chapter is composed of two sections. The first section discusses the support measures in terms of quantitative estimates of the transfers to producers from consumers and taxpayers. For this purpose, the key indicators are the Producer Support Estimate (PSE) and the Consumer Support Estimate (CSE). The second section utilizes the Policy Evaluation Model (PEM) to evaluate how variations in support levels affect production, trade, and welfare. For this purpose, a new Korean module covering the rice, milk, beef, grains and oilseeds sectors was developed and added to the OECD PEM model.
III.1. Evolution and decomposition of support to agriculture
Evolution of support
The Producer Support Estimator (PSE) is the monetary value of gross transfers from consumers and taxpayers to agricultural producers, measured at the farm gate level, arising from policy measures that support agriculture. It includes market price support (MPS) and budgetary payments.1 The PSE indicators are expressed in both absolute monetary terms (in national currencies, in US dollars and in Euros) and in relative terms – in the case of the % PSE as a percentage of the value of gross farm receipts (including support payments) in each country for which the estimates are made. The percentage PSE shows the degree to which farmers are supported in a way that is not influenced by the sectoral structure and inflation rate of the country concerned, making this estimate the most widely acceptable and useful indicator for comparisons of support across countries and time.
Graph 3.1 shows the evolution of the percentage PSE over the time period from 1986 to 2006. From 65% at the beginning of the period, it peaked at 75% in 1988 and gradually declined thereafter. From 1988 to 1995, the percentage PSE was higher than 70% and remained in the range of 60 to 67% during the period from 1996 to 2006 with the exception of the year 1998 when Korea was hit by a financial crisis and its exchange rates were exceptionally high. The percentage PSE for Korea was more than double the OECD average at the end of the period. In the period 2004-06, Korea had the fourth highest percentage PSE, following Iceland, Norway and Switzerland (Graph 3.2).

44 – Chapter III. Analysis of Support to Agriculture
EVALUATION OF AGRICULTURAL POLICY REFORMS IN KOREA © OECD 2008
Graph 3.1. Percentage PSE in Korea and in the OECD area, 1986-2006
0
10
20
30
40
50
60
70
801
986
19
87
19
88
19
89
19
90
19
91
19
92
19
93
19
94
19
95
19
96
19
97
19
98
19
99
20
00
20
01
20
02
20
03
20
04
20
05
20
06
Korea OECD
Source: OECD, PSE/CSE database, 2007.
Graph 3.2. Percentage PSE in Korea and in other OECD countries, 2004-2006
0
10
20
30
40
50
60
70
80%
Source: OECD, PSE/CSE database, 2007.
The Producer Nominal Assistance Coefficient (producer NAC) is the ratio between the value of gross farm receipts including support and gross farm receipts (at farm gate) valued at border prices (measured at farm gate). In general, changes in producer Nominal Assistance Coefficients (NAC) have followed the evolution of the percentage PSE. The producer NAC increased from 2.9 in 1986 to 4.1 in 1988 and it remained above 3.5 until 1995. It fell sharply in 1996 and remained in the range of 2.5 to 3.0 until 2006 (except in the year 1998). The Producer Nominal Protection Coefficient

Chapter III. Analysis of Support to Agriculture– 45
EVALUATION OF AGRICULTURAL POLICY REFORMS IN KOREA –© OECD 2008
(producer NPC) is the ratio between the average price received by producers (at farm gate), including payments per tonne of current output, and the border price (measured at farm gate). Since MPS is the dominant factor in the PSE for Korea, the evolution of the producer NPC through time follows closely that of the producer NAC (Graph 3.3).
Graph 3.3. Producer NAC and producer NPC in Korea
1986-2006
0.0
0.5
1.0
1.5
2.0
2.5
3.0
3.5
4.0
0.0
10.0
20.0
30.0
40.0
50.0
60.0
70.0
80.0
19
86
19
87
19
88
19
89
19
90
19
91
19
92
19
93
19
94
19
95
19
96
19
97
19
98
19
99
20
00
20
01
20
02
20
03
20
04
20
05
20
06
%
Percentage CSE Consumer NAC
Source: OECD, PSE/CSE database, 2007.
The changes in support to agriculture are essentially the result of variations in the gap between world prices and domestic prices, as measured by market price support. These changes are also reflected in the evolution of transfers from consumers to producers, the main component of the Consumer Support Estimate (CSE). Starting from 63% in 1986, the percentage CSE reached the highest point of 71% in 1993. It fell to as low as 53% in 1998 and has remained around 60% in recent years. The percentage CSE is lower than the percentage PSE in Korea. The gap between the PSE and the CSE is mainly due to a large and increasing proportion of domestic consumption of soybeans and other crops that are imported and these imports are subject to a low level of border protection. Changes in the Consumer Nominal Assistance Coefficient (consumer NAC) have followed the evolution of the percentage CSE. The consumer NAC was 2.9 on average in 1986-88. A peak of 3.5 was reached in 1993 and it fell to 2.1 in 1998. It was around 2.6 in 2006 (Graph 3.4).

46 – Chapter III. Analysis of Support to Agriculture
EVALUATION OF AGRICULTURAL POLICY REFORMS IN KOREA © OECD 2008
Graph 3.4. Percentage CSE and consumer NAC in Korea
1986-2006
,0.0
,0.5
,1.0
,1.5
,2.0
,2.5
,3.0
,3.5
,4.0
0.0
10.0
20.0
30.0
40.0
50.0
60.0
70.0
80.01
98
6
19
87
19
88
19
89
19
90
19
91
19
92
19
93
19
94
19
95
19
96
19
97
19
98
19
99
20
00
20
01
20
02
20
03
20
04
20
05
20
06
%
Percentage CSE Consumer NAC
Source: OECD, PSE/CSE database, 2007.
Decomposition of support
Graph 3.5 shows the changes in the share of the main support components in the PSE between the period 1986-88 and 2004-06. In the period 1986-88, the market price support (MPS) was the dominant factor accounting for 99% of the PSE. Payments based on input use composed the other 1%. The share of MPS fell significantly to 91% in 2004-06 as other budgetary payment programmes were introduced. Payments based on input use increased from 1% in 1986-88 to 2% in 2004-06. Payments based on current factors (production required) accounted for 5% of PSE in 2004-06. This reflects increased area payments for paddy field, disaster payments, and payments for social programmes. Support based on non-current factors and not requiring production made up 2% of the PSE in 2004-06. This reflects the recently introduced fixed payment for paddy field.

Chapter III. Analysis of Support to Agriculture – 47
EVALUATION OF AGRICULTURAL POLICY REFORMS IN KOREA –© OECD 2008
Graph 3.5. Breakdown of PSE in Korea, by category
Market Price Support
Payments based on input use
Payments based on current A/An/R/I, production required
Payments based on non-current A/An/R/I, production not required
91%
2%
5%
2%
2004-06
99%
1%
1986-88
Source: OECD, PSE/CSE database, 2007.

48 – Chapter III. Analysis of Support to Agriculture
EVALUATION OF AGRICULTURAL POLICY REFORMS IN KOREA © OECD 2008
The PSE contribution analysis helps to identify the relative importance of changes in the various PSE components in explaining the overall changes in PSE, ceteris paribus. The three year average of the PSE in Korea increased 150% from KRW 9 635 billion (USD 11 874 million) in 1986-88 to KRW 24 109 billion (USD 23 140 million) in 2004-06.2 Table 3.1 shows the relative contributions of the MPS and budgetary payments. If budgetary payments had remained constant at the 1986-88 level, the change in the MPS would have contributed to a 128% increase in the PSE. Alternatively, if the MPS had remained constant, the change in budgetary payments would have contributed to a 22% increase in the PSE. The contribution of the budgetary payments to the change in PSE is dominated by payments based on current area/animal/receipts/income (A/An/R/I), which accounts for 12% or more than half of the 22% contribution from all budgetary payments.
Table 3.2 shows the contribution of the changes in quantity and unit MPS to the changes in MPS between the periods 1986-88 and 2004-06 by commodity. The MPS increased significantly for all commodities with the exception of barley. While the contribution of the production quantity of crops (rice, barley and soybean) would have implied a decrease in the MPS, ceteris paribus, this effect was dominated by a larger positive contribution from unit MPS (rice and soybean). For livestock products (pork, poultry, beef, milk, eggs) both the quantities produced and unit MPS contributed positively to the observed increase in MPS, but the dominant factor was in most cases the unit MPS (pork, beef, milk, eggs). A weighted average % change for all commodities can be constructed using as weights individual commodity MPS in the previous period. The result, an increase of 81%, is composed of a negative contribution from quantity produced (-5%) and a much larger positive contribution from unit MPS (86%). This implies that the increase of unit MPS was the dominant factor contributing to the increase in MPS.
Unit MPS represents the price gap between the producer price and the border price. The weighted average increase in producer prices was 94% between 1986-88 and 2004-06. Similarly, the weighted average increase in border prices was 166% over the same time period. However, because producer prices were on average 3.3 times higher than border prices during the 1986-88 base period, unit MPS increased significantly as well.3 The contribution of the world price expressed in US dollars (122%) dominated the contribution from the won/US dollar exchange rate (43%, see Table 3.3). In conclusion, the increase of the PSE in Korea was due to significant increases in MPS for most commodities which were in turn mainly the result of increases in the price gap between producer and border prices.
Table 3.1. Contribution to change in Producer Support Estimate in Korea, 1986-88 to 2004-06
Contribution of Contribution of budgetary payments (BP) based on:
Value of Producer Support1
MPS BP ProductionInput use
Current A/An/R/I
production required
Non current A/AN/R/I
production required
Non-current A/AN/R/I
production required
Non-commodity
criteria
Miscel-laneous
% change % change in PSE if all other variables are held constant
150.2 128.5 21.7 0.0 4.7 12.1 0.0 4.8 0.1 0.0 1.% changes in national currency.
Source: OECD, PSE/CSE database, 2007.

Chapter III. Analysis of Support to Agriculture– 49
EVALUATION OF AGRICULTURAL POLICY REFORMS IN KOREA –© OECD 2008
Table 3.2.Contribution to change in Market Price Support, 1986-88 to 2004-06
Contribution to % change in MPS of:
Quantity Unit MOS
% change if all other variables are held constant
Soyabean 152.4 -55.9 208.3
Barley -27.5 -102.3 74.8
Rice 39.2 -20.9 60.1
Milk 205.2 85.7 119.5
Beef 209.8 20.6 189.2
Pigmeat 376.3 159.5 216.8
Poultry 145.5 117.5 28.0
Egg 20 097.4 3 099.1 16 998.3
Chinese cabbage 46.7 -8.4 55.1
Garlic 56.0 -1.2 57.2
Pepper 44.6 -29.0 73.5
Market Price Support
(MPS)1
1.% changes in national currency.
Source: OECD, PSE/CSE database, 2007.
Table 3.3. Contribution to change in Unit MPS, 1986-88 to 2004-06
Producer price1 Border price1
% change % change Exchange rate World price (USD)
if all other variables are held constant
Korea 94.4 165.6 43.3 122.4
Contribution to % change in border price of:
1.% changes in national currency.
Source: OECD, PSE/CSE database, 2007.
Single Commodity Transfers (SCT) are the annual monetary value of gross transfers from policies linked to the production of a single commodity such that the producer must produce the designated commodity in order to receive the payment. The %SCT is the SCT expressed as a share of gross farm receipts for the specific commodity (including support in the denominator). The percentage SCT by commodity was more than 70% for rice, barley and soybean in the time period 2004-06. It was around 60% for milk and beef, and less than 40% for poultry and eggs (Graph 3.6).4

50 – Chapter III. Analysis of Support to Agriculture
EVALUATION OF AGRICULTURAL POLICY REFORMS IN KOREA © OECD 2008
Graph 3.6. Producer SCT by commodity, 2004-06
0 10 20 30 40 50 60 70 80 90 100
Other cereal
Soyabeans
Rice
Milk
Beef and veal
Pigmeat
Poultry
Eggs
Other commodities
SCT as a % of PSE
% of commodity gross farm receipts
MPS
Other SCT
SCT as a % of PSE
Source: OECD, PSE/CSE database, 2007.
Evolution of total transfers
Total Support Estimate (TSE) is the annual monetary value of all gross transfers from taxpayers and consumers arising from policy measures that support agriculture. It includes PSE and General Services Support Estimate (GSSE). General Services Support Estimate (GSSE) is the annual monetary value of gross transfers to general services provided to agriculture as a sector (such as research, development, training, inspection, marketing and promotion), arising from policy measures that support agriculture.
Between the period 1986-88 and the period 2004-06, the total support estimate in Korean won has increased 2.6 times from KRW 10 539 billion (USD 12 988 million) to KRW 27 456 billion (USD 26 352 million) (Graph 3.7). The GSSE has increased faster than the PSE. During this period, the GSSE in Korean won increased about four fold and, as a result, the share of GSSE in TSE increased from 8.0% in 1986-88 to 11.9% in 2004-06.
Percentage TSE (expressed as share of GDP) has declined steadily over the period, from 9% in 1986 to 3.3% in 2006, although the TSE in Korean won increased significantly as the economy developed. The percentage TSE for the OECD as a whole was about 1.1 in 2004-06, with only Turkey being close to the level in Korea (Graph 3.8).

Chapter III. Analysis of Support to Agriculture– 51
EVALUATION OF AGRICULTURAL POLICY REFORMS IN KOREA –© OECD 2008
Graph 3.7. Evolution of Total Support Estimate and Percentage TSE
0
5 000
10 000
15 000
20 000
25 000
30 000
0
1
2
3
4
5
6
7
8
9
101
986
198
7
198
8
198
9
199
0
199
1
199
2
199
3
199
4
199
5
199
6
199
7
199
8
199
9
200
0
200
1
200
2
200
3
200
4
200
5
200
6
% TSE TSE KRW billion%
Graph 3.8. Total Support Estimate by country (Percentage of GDP)
0% 2% 4% 6% 8% 10%
Australia
New Zealand
Canada
Mexico (2)
United States
OECD (3)
Norway
European Union (1)
Japan
Iceland
Switzerland
Korea
Turkey
1986-88
2004-2006
Countries are ranked according to 2004-06 levels. 1. EU12 for 1986-94 including ex-GDR from 1990; EU15 for 1995-2003; EU25 from 2004. 2. For Mexico, 1986-88 is replaced by 1991-93. 3. Austria, Finland and Sweden are included in the OECD total for all years and in the EU from 1995. The OECD total does not include the six non-OECD EU member states. TSE as a share of GDP for the OECD total in 1986-88 excludes the Czech Republic, Hungary, Poland and Slovak Republic as GDP data is not available for this period.
Source: OECD, PSE/CSE database, 2007.

52 – Chapter III. Analysis of Support to Agriculture
EVALUATION OF AGRICULTURAL POLICY REFORMS IN KOREA © OECD 2008
III.2 PEM analysis of support to Agriculture
The OECD Policy Evaluation Model (PEM) was modified for this study to include Korea. The model contains representations of the rice, milk, beef, grains, and oilseeds sectors for Korea. The work to expand the PEM was undertaken in cooperation with the Korean Rural Economic Institute (KREI), who provided information and guidance during the development process.
The PEM is a partial equilibrium model of agricultural production that is designed to connect the data in the PSE database with economic outcomes in terms of production, trade and welfare in a stylised manner. This version of the PEM model for Korea uses the standard PEM structure for all commodities except rice and milk. A discussion of the structure of the PEM model can be found in [AGR/CA/APM(2005)30]. The rice market is autarkic while the milk market is designed to take into account the milk marketing structure which typically involves a quota system that sets in- and out-of quota prices.
Representation of rice markets in the PEM
The PEM representation of Korean trade measures for rice involves quantitative restrictions that specify the allowable level of imports. This border measure structure effectively isolates the domestic market from the world market such that the domestic market price for rice is determined internally. Thus, there is no price transmission from world markets to the Korean domestic market for rice. The domestic price is determined by a market clearing condition that states that domestic production plus allowed imports must equal the quantity consumed (Graph 3.9). In this manner, the domestic price is fully endogenous to the model and cannot be controlled as a matter of policy without leading to a surplus or deficit in the domestic market. The level of market price support is observed as an outcome of a policy scenario, but cannot be the subject of a policy shock. This is only the case for rice; for coarse grains, oilseeds, and beef, full transmission of world prices to the domestic market is assumed. The milk market has special pricing arrangements discussed below.
To alter the level of MPS in a policy scenario in the Korean model requires changing the level of imports, which is an exogenous policy variable. Increasing allowed imports would lower the domestic price to allow the domestic market to clear the increased supply of rice. This would lower domestic production and increase consumption. The reduction of the domestic price relative to the world price would indicate a reduction in MPS support to rice.
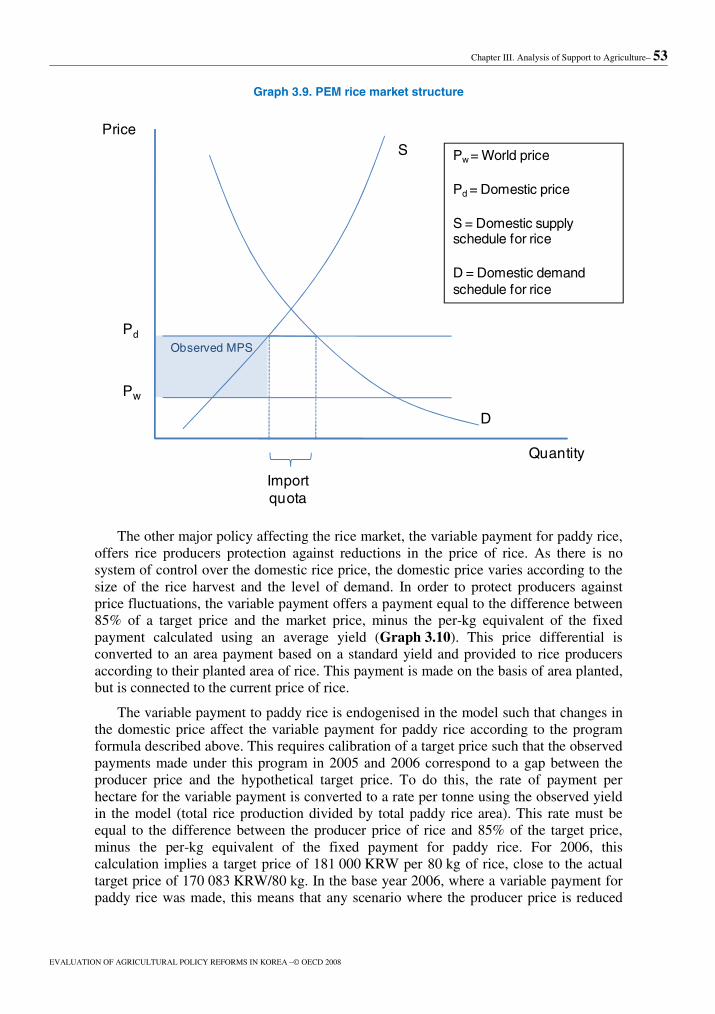
Chapter III. Analysis of Support to Agriculture– 53
EVALUATION OF AGRICULTURAL POLICY REFORMS IN KOREA –© OECD 2008
Graph 3.9. PEM rice market structure
Observed MPS
S
D
Importquota
Pd
Pw
Price
Quantity
Pw = World price
Pd = Domestic price
S = Domestic supply schedule for rice
D = Domestic demand schedule for rice
The other major policy affecting the rice market, the variable payment for paddy rice, offers rice producers protection against reductions in the price of rice. As there is no system of control over the domestic rice price, the domestic price varies according to the size of the rice harvest and the level of demand. In order to protect producers against price fluctuations, the variable payment offers a payment equal to the difference between 85% of a target price and the market price, minus the per-kg equivalent of the fixed payment calculated using an average yield (Graph 3.10). This price differential is converted to an area payment based on a standard yield and provided to rice producers according to their planted area of rice. This payment is made on the basis of area planted, but is connected to the current price of rice.
The variable payment to paddy rice is endogenised in the model such that changes in the domestic price affect the variable payment for paddy rice according to the program formula described above. This requires calibration of a target price such that the observed payments made under this program in 2005 and 2006 correspond to a gap between the producer price and the hypothetical target price. To do this, the rate of payment per hectare for the variable payment is converted to a rate per tonne using the observed yield in the model (total rice production divided by total paddy rice area). This rate must be equal to the difference between the producer price of rice and 85% of the target price, minus the per-kg equivalent of the fixed payment for paddy rice. For 2006, this calculation implies a target price of 181 000 KRW per 80 kg of rice, close to the actual target price of 170 083 KRW/80 kg. In the base year 2006, where a variable payment for paddy rice was made, this means that any scenario where the producer price is reduced

54 – Chapter III. Analysis of Support to Agriculture
EVALUATION OF AGRICULTURAL POLICY REFORMS IN KOREA © OECD 2008
below its 2006 level will result in an increase in the variable payment, as the condition for triggering the variable payment has already been met.5
Graph 3.10. Calculation of variable payment for paddy rice
Per tonne equivalent of
payment using average yield
This amount is converted to a
per hectare payment
15% of target price
Producer Price
Fixed Payment
Variable Payment
Target PriceP
rice
dif
fere
ntia
l bet
wee
n ac
tual
an
d ta
rget
pric
e
Representation of milk markets in the PEM
The current dairy policy was instituted in 2002 after the creation of the Korean Dairy Commission (KDC) in 1999. The KDC was put in place to handle the marketing of milk between producers and processors. Producers of milk were assigned a quota for milk production based on their production in a base period. Deliveries within 106% of the quota amount receive an in-quota price, with production between 106% and 117% of quota receiving 70% of the in-quota price. Deliveries over 117% of quota receive a price close to the import (world) price (Graph 3.11).
Currently, only 27% of milk deliveries are made through the KDC, with the rest being made through a number of different marketing organizations. These other marketing groups typically have a pricing structure that is similar in nature to that of the KDC (though usually without the intermediate quota price and quantity, and an over-quota price that may be below the world price) and the KDC operates as a price leader in the market. The KDC price and quota structure cannot be used directly in the PEM as it is valid for only about one quarter of domestic milk deliveries, but the idea of a high in-quota price and low out-of-quota price holds in general for the Korean milk sector, and this structure is adopted in the PEM representation of the Korean milk market.

Chapter III. Analysis of Support to Agriculture– 55
EVALUATION OF AGRICULTURAL POLICY REFORMS IN KOREA –© OECD 2008
Graph 3.11. Price and quota structure of KDC System
MC
P
Q
P
Pw
0.7 P
q*1.17 q1.06q
Source: Adapted from Song, Joo-Ho, Min-Kook Jeong, Hyun-Joong Kim, Hyun-Ok Lee, and Byeong-Il Ahn (2005).
Most milk produced is intended for the domestic fluid milk market, with domestic production in excess of domestic demand used for processing into manufactured milk products. Domestic milk processors are also able to import milk products from the world market under a modest tariff, which leaves the raw-milk equivalent price of imported milk for manufacturing well below the domestic price received by producers. To make up the difference, a subsidy is paid to processors using domestic milk.
The price differential between the domestic and import (world) price is measured in the PSE as market price support. The subsidy paid for domestic milk used for processing is not currently in the PSE and is added using Korean data. The PEM model reconciles this data with the milk market structure by solving for the quota amount and in-quota price that exhausts both the MPS level and manufacturing subsidy level given total milk production and fluid milk deliveries. That is, using the definitions for MPS and the manufacturing subsidy, Pd and Q can be uniquely solved for, thereby calibrating the model.6 The final structure of the model defines MPS as the difference between the world price and the domestic price, multiplied by the quota level. The manufacturing subsidy is the excess of domestic milk production over fluid use, also multiplied by the difference between domestic and world price (Graph 3.12). Producers are assumed to respond to the average price received for milk, the so-called “blend price.”

56 – Chapter III. Analysis of Support to Agriculture
EVALUATION OF AGRICULTURAL POLICY REFORMS IN KOREA © OECD 2008
Graph 3.12. Korea milk market representation in PEM
MPS Mfg. subsidy
Ph
Qf
P
Pw
Quota
Df
Dm
MC
Qp Qm
Blend price
Ph In-quota pricePw World priceDf Fluid milk demandDm Manufactured milk demandMC Marginal cost scheduleQf Fluid milk consumptionQm Manufactured. milk consumptionQp Domestic milk production
Policy scenario analysis
This section describes the results of policy scenarios generated using the PEM. The first scenario takes a historical perspective on Korean agricultural policy, inquiring as to the effects of the full set of agricultural policies represented in the PSE database on the welfare of different participants in the agro-economy. The second scenario takes a forward-looking approach to the situation facing the rice market after 2014 according to certain assumptions. The third scenario takes a counterfactual look at rice policies, investigating three alternatives that adjust the amount of transfers arising from the different policies currently in use. The fourth scenario is also counterfactual, considering some policy alternatives in the milk market. Counterfactual scenarios are not themselves recommendations for particular changes in policies. Rather, these are intended to illustrate the issues particular to these policies and markets, which provide insight into fruitful approaches to policy reform in the future.
Policy representation in the PEM is carried out in a stylised and aggregate manner. All models are simpler than the reality they attempt to represent and their limitations must be taken into account when considering the results. The PEM is designed to measure the effects on production and prices in aggregate national markets and does not consider other factors that policy makers may consider important, for example distributional effects or the multifunctional role of agriculture. Given these general caveats, the scenarios in this section are designed to illustrate some of the consequences of agricultural policies and the implications of certain changes in those policies.

Chapter III. Analysis of Support to Agriculture– 57
EVALUATION OF AGRICULTURAL POLICY REFORMS IN KOREA –© OECD 2008
Scenario 1: Measuring welfare effects of agricultural policies
Agricultural policies affect farm household income in different ways, and the PSE is not by itself a measure of the income changes that result from agricultural policies. The deadweight losses that occur from the economic distortions caused by agricultural policies and the ability of suppliers of purchased inputs to capture some of the rents from agricultural programs through higher prices for their products are the main reasons that agricultural policies are less than perfectly “transfer efficient”.7 Moreover, agricultural policies are directed at a number of different objectives, and farm income may or may not be dominant among those objectives.
Nevertheless, it is worthwhile to ask the question of what impact do agricultural policies have on the income of farmers, as well as the benefits (or costs) to consumers and taxpayers, and their overall impact on social welfare. In this scenario, the impacts of the policy set for commodities included in the PEM (grains and oilseeds, rice, milk, beef) on the welfare of producers, consumers, taxpayers, and input suppliers is considered for the years 1986 to 2006. This includes most of the policies reported in the PSE for these commodities: MPS, the fixed and variable payments to paddy rice, the subsidy to milk used for manufacturing, and payments affecting farm income or revenue (disaster payments, social programmes).
The effects of the policy set can be assessed by conducting a thought experiment: “What if these policies did not exist?” The welfare impacts of the policies assessed by investigating the impact of their elimination. The model results indicate that consumers are the most impacted by agricultural policies paying between KRW 12 087 billion (USD 8 640 million in 1998) and KRW 19 409 billion (USD 17 331 million in 2000) in higher prices for agricultural products (Results are converted to real 2000 KRW using a GDP deflator) (Graph 3.13).8 Farmers gain on average KRW 5 998 billion (USD 6 675 million) through higher prices and budgetary transfers, suppliers of purchased inputs gain on average KRW 1 399 billion (USD 1 568 million) through increased demand for farm inputs while taxpayers receive KRW 2 364 billion (USD 2 475 million) on average from import tariff receipts. Overall, the costs to consumers outweigh the benefits to other economic agents, and the result is a net welfare cost ranging between KRW 3 713 billion (USD 2 654 million) in 1998 and KRW 8 572 billion (USD 11 117 million) in 1995—the result of deadweight losses due to resource misallocation. The results indicate a stable policy environment in real terms, with no major trends in the level of policy transfers over the period. Exchange rate movements have a strong influence on the results, in particular for consumers, as does the somewhat greater variability of support in the form of MPS for beef compared with other policies in place over the study period. The period between 1996 and 2000 is noteworthy because of the substantial exchange rate movements that took place at that time. In particular, this short period contains both the highest and lowest consumer welfare numbers.

58 – Chapter III. Analysis of Support to Agriculture
EVALUATION OF AGRICULTURAL POLICY REFORMS IN KOREA © OECD 2008
Graph 3.13. Welfare impacts of Korean Agricultural policy, 1986-2006
Real 2000 KRW billions
-20 000 -15 000 -10 000 -5 000 0 5 000 10 000 15 000
1986
1987
1988
1989
1990
1991
1992
1993
1994
1995
1996
1997
1998
1999
2000
2001
2002
2003
2004
2005
2006
2007
Farmers
Input suppliers
Consumers
Taxpayers
Net welfare change, KRW billions-5087
-5986
-7186
-8158
-7448
-7408
-6791
-8158
-8576
-7022
-5700
-8475
-3717
-7190
-7270
-6527
-5415
-5541
-7136
-6056
-8236
Source : OECD PEM.
The high cost to consumers of agricultural policies relative to the benefits gained by producers indicates a level of transfer efficiency of approximately 50%. In fact, the degree of transfer efficiency of agricultural policy has been fairly constant over the study period (Graph 3.14). The variation in the measured transfer efficiency is driven by changes in the level of MPS for beef, which has been the most volatile element of the policy mix in the PSE. Recent improvements in transfer efficiency resulting from the introduction of the fixed payment for paddy land in 2005 and 2006 have been counterbalanced by higher MPS levels for beef in the same period.9 The degree of measured transfer efficiency is in line with that for other countries represented in PEM [AGR/CA/APM(2005)30]. The dominance of MPS in the Korean PSE would normally indicate lower transfer efficiency, but this is mitigated by the assumption maintained here that agricultural land is exclusively owned by farmers as a matter of law. The absence of non-farming landowners improves the measured transfer efficiency markedly.10

Chapter III. Analysis of Support to Agriculture– 59
EVALUATION OF AGRICULTURAL POLICY REFORMS IN KOREA –© OECD 2008
Graph 3.14. Transfer efficiency of agricultural policies, 1986-2006
Per cent
0
0.1
0.2
0.3
0.4
0.5
0.6
19
86
19
87
19
88
19
89
19
90
19
91
19
92
19
93
19
94
19
95
19
96
19
97
19
98
19
99
20
00
20
01
20
02
20
03
20
04
20
05
20
06
Source : OECD PEM.
In the absence of non-farming landowners, the level of transfer efficiency is determined by the scale of deadweight losses and the gains to input suppliers from higher input prices. Deadweight losses from economic inefficiencies arising from market distortions appear to be the dominant factor, accounting for almost 80% of the difference between PSE transfers and increased farm welfare (Graph 3.15). This is explained by the dominance of MPS in the policy mix; this form of support tends to introduce significant market distortions.
The welfare impacts measured in this scenario (and the others that follow) are a measurement of the impact of changes in prices in markets on the individuals who participate in them. It does not include the benefits or costs of policies that occur outside of those markets. For this reason, it is not a measure of whether a policy set is worthwhile from the perspective of national welfare; it simply enumerates the costs and benefits that accrue from markets to the directly participating actors. For example, the effects on food security, rural economy, landscape amenity, and so on do not form part of the welfare calculations.

60 – Chapter III. Analysis of Support to Agriculture
EVALUATION OF AGRICULTURAL POLICY REFORMS IN KOREA © OECD 2008
Graph 3.15. Sources of inefficiency in transfers from consumers and taxpayers to producers
Per cent
Losses due to economic
inefficiency
Rents captured by input supplers
Source : OECD PEM.
Scenario 2: Looking forward to 2014
This scenario considers the impact of two significant trends in Korean rice markets. The first is the change in the level of imports of rice under a quota that is set under an increasing schedule up to 2014. The second is the longstanding downward trend in domestic rice consumption, the result of changing consumption patterns that is magnified by changing population demographics. These two trends will put pressure on Korean agricultural policy from two sides: both increasing imports, which will crowd out domestic production, and reduced consumption levels will put pressure on domestic prices.11 As seen in the previous scenario, the highly inelastic nature of domestic demand and the relatively closed domestic market are important factors that will drive the results of the model. This scenario considers the effect of the increase in allowed imports and reduced consumption levels on the domestic rice price, production and welfare. The approach to producing this policy scenario is to increase allowed imports of rice by 162 000 tonnes, the difference between the quota level in 2006 and 2014. The trend in domestic consumption comes from data from KREI, which estimates a decline in consumption of 238 000 tonnes between 2007 and 2014. This amount is deducted from demand as an exogenous shift in the demand curve. The increase in imports is significant in percentage terms, 66% greater than the 2006 level, while the decline in consumption is approximately 5%. All other aspects of the model are left unchanged.

Chapter III. Analysis of Support to Agriculture– 61
EVALUATION OF AGRICULTURAL POLICY REFORMS IN KOREA –© OECD 2008
Two possible cases in this scenario are considered. These have to do with the operation of the variable payment to paddy land, which provides payments to producers of rice to compensate for price declines relative to a historical reference price. When this system operates according to its design (using the 2006 price as the reference), it compensates producers for a large part of any decline in the domestic price of rice. To isolate its impact, the scenario is run with the variable payment endogenously related to the domestic price, and again with this payment fixed at its 2006 level.
The estimated market impacts are similar under both alternatives. Production is forecast to decline by around 6%, consumption decreases by around 2.5%, and the price of rice declines by between 12% and 14%. Increasing the variable payment to paddy rice (as compared to leaving it constant) results in slightly more domestic production and a slightly lower domestic price to clear the domestic market (Table 3.4).
Table 3.4. Simulating the 2014 Market situation for rice
…with variable payment rate adjusting to maintain target price constant at 2006 level
…keeping the variable payment rate to paddy constant at 2006 levels
Market impacts
Rice production -5.8 -6.3
Rice consumption -2.2 -2.7
Rice price -14.0 -11.9
Rice imports 66.2 66.2
Welfare changes
Producers -20.9 -922.5
Consumers 1 148.4 976.8
Taxpayers -956.5 105.8
Input Suppliers -175.7 -161.1
Net Welfare -4.6 -0.9
PSE changes
MPS -1 355.0 -1 220.5
Variable payment 1 040.0 -6.9
Simulate 2014 situation in rice markets
~ change, per cent ~
~ change, KRW billions ~
~ change, KRW billions ~
Source : OECD PEM.
The real difference between the two cases can be seen in the welfare results. The variable payment program, when allowed to adjust for the change in domestic price of rice, effectively eliminates the negative impact on domestic producers of changes in imports and consumption levels. Of course, taxpayers pay the cost of this, incurring a net cost of KRW 956 billion (USD 1 billion). Taxpayers benefit from increased import tariff revenue from the higher level of imports in both cases. Consumers benefit from lower prices, and are the main beneficiaries in both cases. Producers and input suppliers are made worse off as a result of lower prices and production levels, respectively. In both

62 – Chapter III. Analysis of Support to Agriculture
EVALUATION OF AGRICULTURAL POLICY REFORMS IN KOREA © OECD 2008
cases, the net welfare change is negligible. The results show that the operation of the variable payment program can be effective in preventing producers’ welfare from being impacted by market changes, but at a significant cost to taxpayers.
The effects on market outcomes and the PSE changes can be decomposed into those caused by the increase in imports and by the trend in consumption. Fully 60% of the change in rice price results from the predicted decline in consumption, and 40% from the change in import quota. Autonomous trends in the rice market will clearly put a strain on the current system involving a target price and variable payment. Either the target price will have to trend down with the consumption trend, or the budget outlays for the variable payment program will have to significantly increase. The domestic rice price will come under significant pressure over the next decade and beyond.
Scenario 3: Extension of fixed payment for paddy rice
Recent reforms to rice policy introduced a fixed and variable payment to paddy land used in rice production. For the fixed payment, the basis and condition for eligibility for the payment is historical production of rice in a reference period. As explained earlier, the variable payment provides a counter-cyclical payment determined by the difference between the current and reference price for rice (adjusted by the amount of the fixed payment). The fixed payment is classified in the PSE in category E, payments based on non-current area, production not required, typically considered to represent more decoupled programs. The fixed payment is a relatively transfer-efficient means of increasing producer welfare, and more decoupled programs are typically considered preferable by virtue of their lower market distortions and associated deadweight loss. For this reason, this scenario considers three alternatives, each involving an increase in the fixed payment to paddy land. The first alternative also eliminates the variable payment, effectively transferring the budgetary outlay from the variable payment to the fixed payment. The second alternative builds upon the first by increasing imports to hold MPS constant. The third alternative increases the fixed payment, holds the variable payment constant, and reduces MPS through higher imports.
Alternative A eliminates the variable payment entirely, moving the expenditure on this program to the fixed payment (KRW 438.8 billion (USD 458.9 million), an amount that will remain constant for all three alternatives in this scenario). Farm welfare is increased in this scenario by KRW 56 billion (USD 59 million), reflecting the increased transfer efficiency of the fixed payment, but also the fact that eliminating the variable payment causes the domestic price to increase. The increase in price harms rice consumers, resulting in a welfare loss of KRW 64.7 billion (USD 67.7 million) (Table 3.5). This reveals an interesting element of the rice market in Korea: the closed rice market can lead to strong domestic price movements as the market attempts to clear in the face of highly inelastic demand. For rice policy, the government faces duel objectives; to support producer income but also to manage the domestic market such that supply and demand remain at reasonable levels. This leads to consequences from policy changes that other countries typically do not face.
The variable payment makes producing rice relatively more attractive, and so leads to increased production of rice.12 When the incentive of this payment is eliminated, production moves from rice to other products, contracting domestic supply of rice. The lower supply in the domestic market forces the price to rise in order for the market to clear. This additional increase over the world price amounts to an imputed increase in

Chapter III. Analysis of Support to Agriculture– 63
EVALUATION OF AGRICULTURAL POLICY REFORMS IN KOREA –© OECD 2008
MPS of KRW 54 billion (USD 56 million), enough to lead to a small net decline in welfare in this alternative, driven by declining consumer surplus.
To see the connection between policies affecting the producer’s incentives and outcomes in the domestic market for rice, consider alternative B. This alternative is the same as alternative A except imports are allowed to increase enough to maintain a constant level of market price support to rice.13 That is, the import quota is increased in order to moderate the domestic price increase such that the level of effective protection in the market is the same. This requires an increase in the import quota of 6.6%.
Table 3.5. Shifting support from alternatives to Fixed Payment
Alternative A Alternative B Alternative C
…by eliminating the variable payment
…by eliminating the variable payment with constant MPS
…adjusting imports so MPS is reduced a like amount
Market impactsRice production -0.14 -0.40 -2.03Rice consumption -0.13 -0.05 0.74Rice price 0.78 0.27 -4.23Rice imports 0.00 6.60 53.46
Welfare changesProducers 55.95 15.67 102.06Consumers -64.68 -22.72 353.00Taxpayers -1.67 14.34 -320.02Input Suppliers 6.02 -0.89 -55.74Net Welfare -4.38 6.39 79.30
PSE changesFixed Payment 438.80 438.80 438.80MPS 54.04 0.00 -439.12Variable payment -438.80 -438.80 -1.57
Increase payment levels for the fixed payment to paddy programme…
~ change, per cent ~
~ change, KRW billions ~
~ change, KRW billions ~
Source : OECD PEM.
Alternative B disconnects the changes in domestic policy from changes in the effective level of trade protection. In this case, producer welfare increases from the transfer efficiency gains of the fixed payments, and there is a net welfare gain from increased allocative efficiency. Consumers are worse off as a result of a higher domestic price for rice, but to a much smaller extent than was the case in alternative A. increased tariff revenue from the higher import volume benefits taxpayers.
In alternative C, some support currently provided through trade protection via the import quota for rice is moved to being provided through the fixed payment. Specifically, the fixed payment is increased by a like amount as for the other alternatives, and the level of trade protection is reduced by the same amount, leaving total transfers to producers at

64 – Chapter III. Analysis of Support to Agriculture
EVALUATION OF AGRICULTURAL POLICY REFORMS IN KOREA © OECD 2008
the same level.14 As before, the reduction in trade protection is achieved by increasing the size of the import quota for rice, by 53% to 377 000 tonnes in this case.
Alternative C brings about substantial benefits to producers, from the significantly better transfer efficiency of the fixed payment when compared with MPS, and as well for consumers, who enjoy a reduction in the price of rice of about 4%. Taxpayers must pay the added cost of the higher fixed payment, but this is partially compensated by higher tariff revenue from the increased import volume. Net welfare increases by KRW 79 billion (USD 83 million) as deadweight losses from trade protection are reduced.
The results of the scenario indicate that net welfare gains are available from improved allocative efficiency and reduced market distortions, whether they come from improving the efficiency of domestic budgetary payments or from lower trade distortions. However, it is difficult to realise these benefits in the absence of freer trade, as a closed market always forces a trade-off between domestic consumers and producers. In particular, moving support provided to agriculture from domestic market protection to decoupled payments yields the highest potential welfare gains, while adjusting domestic policies in the context of continued market protection will yield only modest results.
A move from market price support to payments that are based on land, such as the fixed payment to paddy land, in addition to improving net farm income, reduces the incentive to maximise yield and promotes more extensive use of land. This is because with such payments a farmer cannot increase the amount of policy support he receives by increasing production. Also, the price of land is reduced relative to other inputs in the production process, such as fertiliser or chemicals, so the farmer has an incentive to use a more extensive production technology. Specifically, in alternative C the use of fertilizer per hectare declines by 3.5%, and rice yield declines by 1.6%, while land used in the production of rice decreases by only 0.3%. Therefore, a policy reform of this nature contributes towards the policy objective of enhancing farm income, may be expected to help maintain land in agricultural production, and help reduce the environmental pressures that come from intensive use of farm inputs. The tradeoffs are lower domestic production and the long-term problem of targeting the beneficiaries of highly decoupled payments. As discussed in [AGR/CA/APM(2006)19/FINAL], while highly decoupled payments based on historical parameters are highly transfer efficient, over time the owners of the land are likely to become less connected with farming and some of the recipients of payments will be non-farming households.
Scenario 4: Equating domestic fluid demand to the quota for milk
The Korean Dairy Commission, which markets milk to manufacturers on behalf of producers, receives a subsidy to dispose of milk in excess of domestic fluid demand into the manufacturing market, where it is used to produce butter and skim milk powder. The subsidy is required because the domestic producer price for in-quota milk is higher than the price paid for manufacturing milk, which is close to the world price, and so a subsidy makes up the difference in cost of purchasing the higher-priced domestic milk. The KDC must dispose of excess deliveries because the quota level assigned to milk producers has been set structurally above domestic demand. In the first years of the quota system in Korea, this subsidy was unexpectedly high, KRW 148 billion (USD 118 million). In recent years, the amount of the subsidy has fallen, and now stands around KRW 27 billion (USD 28 million).

Chapter III. Analysis of Support to Agriculture– 65
EVALUATION OF AGRICULTURAL POLICY REFORMS IN KOREA –© OECD 2008
By better aligning the domestic quota and domestic fluid demand, the subsidy would no longer be required. This scenario considers two different approaches to balancing the domestic quota and domestic fluid demand--by reducing the quota level in the dairy market to equal domestic demand for milk for fluid use, or by reducing the in-quota price of milk to stimulate domestic demand. In point of fact, the cyclical nature of milk production implies that a surplus of supply over demand is to be expected at certain times of the year. This scenario does not capture this intra-year effect. Rather, it should be seen as representing a balance of quota level and domestic demand at the time of year when supply is at its lowest level.
The amount of the manufacturing milk subsidy in 2006 is relatively small, especially compared with its historical levels, and also in comparison with the level of MPS in the milk market. This means that reducing the quota level to equal domestic fluid demand requires a reduction in the quota of around 5%. Changing the quota does not affect fluid demand, as domestic consumers pay the same in-quota price as before. Neither does it affect the amount of milk used for domestic manufacturing uses, as the world price still prevails in this market and domestic manufacturers can replace the loss of some domestic supply with additional imports. This is seen in the results as the reduction in domestic production is exactly balanced by increased imports. Domestic production declines by 1% in response to the lower average revenue received for milk resulting from the lower amount of milk eligible to receive the higher price (Table 3.6, Alternative A).
Table 3.6. Equating production quota to fluid milk demand
Alternative A Alternative B
Reduce milk quota Reduce in-quota price
Market impacts
Milk production -1.0 -1.5
Fluid Milk consumption 0.0 4.2
Manufactured milk consumption 0.0 0
Milk blend price -1.8 -2.9
Milk imports 2.3 11.1
Welfare changes
Dairy Producers -17.4 -27.8
Dairy Consumers 0.0 56.1
Dairy Input Suppliers -4.4 -7.1
Subsidy savings 35.7 35.8
~ change, per cent ~
~ change, KRW billions ~
Dairy consumers include both processors and final consumers. Welfare results are for the dairy sector only to simplify the presentation.
Source : OECD PEM.
The elimination of the subsidy reduces the welfare of milk producers, but benefits taxpayers who no longer need to finance the subsidy. The welfare results indicate that the consumer subsidy is a poor method of transferring income to producers, as the loss to dairy producers is just over half of the value of the subsidy, indicating a low transfer efficiency. This is not entirely surprising, as the intent of the subsidy is to dispose of surplus production, and not to support farm income. On the other hand, the need for the

66 – Chapter III. Analysis of Support to Agriculture
EVALUATION OF AGRICULTURAL POLICY REFORMS IN KOREA © OECD 2008
subsidy arises from the effects of the quota programme, which is aimed at increasing the income of milk producers.
Alternative A brought about a balance between domestic production quota and domestic fluid demand through directly reducing the quota level. Alternative B achieves this result by reducing the in-quota price (which determines the consumer price of fluid milk) to stimulate domestic demand. As before, this has the effect of eliminating the subsidy to consumers of domestic milk used for manufacturing.
The reduction of the in-quota price also has the effect of reducing the average revenue to producers. This leads to a reduction in output of just under 2%. Demand for fluid milk increases by 4% to equal the quota level by design of the scenario (Table 3.6, Alternative B). When compared with reducing the quota, producers lose somewhat more, KRW 27 billion (USD 28 million), but consumers are better off as the price they pay for fluid milk has declined by over 4%. As before, taxpayers benefit from not having to fund the consumer subsidy.

Chapter III. Analysis of Support to Agriculture– 67
EVALUATION OF AGRICULTURAL POLICY REFORMS IN KOREA –© OECD 2008
NOTES
1. Several issues are raised concerning limitations of the PSE concept, in particular having to do with the role of exchange rates, international prices and multifunctionality. For a discussion of these issues, see Stefan Tangermann (2005), Is the Concept of the Producer Support Estimate in Need of Revision?, OECD Food, Agriculture and Fisheries Working Papers No. 1, Paris.
2. The change in the PSE described here is in nominal terms. Between 1986-88 and 2004-06, the GDP deflator increased by 140%. The increase in the PSE in real terms, calculated using this deflator, is 4.2% over the period. When Table 3.1 is interpreted, it should be noted that the analysis of the relative contribution is based on nominal values.
3. When producer prices are higher than border prices (MPS is positive), an equivalent percentage increase in both implies an increase in the price gap. Therefore, when producer prices are significantly higher than border prices, the price gap can increase even if the percentage increase in producer prices is significantly less than the percentage increase in producer prices.
4. In Graph 3.6, the % SCT of other commodities is around 60%. This fact can explain to some degree why only comparatively small changes occurred in the standard OECD indicators of percentage the MPS and the share of MPS in PSE (The percentage PSE decreased only 10 percentage points over the last fifteen years from 74% to 64% and the share of MPS in PSE remains very high) despite policy reforms which were described in Chapter 2. The PSE product coverage of Korea is only 53% and, as a result, 47% of the MPS is calculated using the extrapolation methodology. Rice comprises one-third of agricultural GDP in Korea and is the only product for which imports are still subject to quantity restriction. Therefore, the PSE for Korea may overstate the actual figure by extrapolating the protection of highly protected products (rice) to other commodities not covered by the PSE. Another problem comes from the initial high percentage PSE. When the PSE is large relative to market receipts, changes in the PSE will move the %PSE by a relatively small amount as the change in PSE impacts both the numerator and denominator of the ratio that defines the %PSE. As a result, the %PSE is relatively insensitive to PSE changes when the PSE is significantly larger than market receipts. When these factors are considered, the impact of the reforms may be more significant than is implied by the relatively small changes in the PSE indicators which were described in this chapter.
5. The model is defined with respect to aggregate commodities and average annual prices which will always differ slightly from observed prices for specific markets. Part of the process of calibrating the model is ensuring internal consistency, which can lead to the values of some model variables differing from their real-world analogues. This does not in general affect the quality of the results. In fact, the target price is implicit in the model design in the calculation of the variable payment rate. It is explicitly calculated and shown here only as a check of the data.
6. Total MPS defines the area of the square labelled “MPS” in Figure 3.4, defined by the difference between P (the domestic in-quota price) and Pw (the world price), and the origin and the quota level, labelled “quota”. The manufacturing subsidy is defined by

68 – Chapter III. Analysis of Support to Agriculture
EVALUATION OF AGRICULTURAL POLICY REFORMS IN KOREA © OECD 2008
a square of the same height (P-Pw), and width defined by the difference between quota production and fluid milk consumption. Pw and the quantity consumed as fluid milk is known, as are the level of MPS and manufacturing subsidy, which taken together imply unique values of P and “quota” by solving a system of two equations (the definitions of MPS and subsidy levels) and two unknowns (the in-quota price and quota level).
7. Transfer efficiency is defined as the ratio of the change in net farm household welfare to the size of the policy transfer that brings it about. Policies may be poorly transfer efficient when they result in large market distortions and corresponding loss in allocative efficiency, or their benefits are captured by individuals other than the target of the transfer. For more information, see OECD (2001) Market effects of Crop Support Policies.
8. US dollar equivalents are calculated using the same GDP deflator and the exchange rate for the year in question.
9. In fact, excluding beef MPS from the simulation results in an improvement of transfer efficiency of 9% (from 46% to 54%) between 2004 and 2005, the year the fixed payment to paddy rice was introduced. MPS for beef increased from KRW 1 004 billion to KRW 1 784 billion in 2005, while the payments to paddy fields introduced in 2005 amounted to KRW 1 514 billion.
10. The standard approach used in PEM to allocate welfare between farmers and non-farming landowners is to allocate the welfare gains derived from changes in producer surplus to land ownership according to the percentage of land that is rented. Thus, if half of the land in a particular country was rented, then 50% of the welfare change accruing from changes in the land market would be considered to be “leaving” the agricultural sector, thereby reducing measured transfer efficiency.
11. Market segmentation between table rice and rice used for processed products introduces an element of uncertainty regarding the impact of increased rice imports on the domestic price in different rice markets. The current import quota schedule specifies a percentage of imported rice that must enter the table rice market (and this share increases over the 2007-2014 period), but the majority of rice imports will be used to supply the processing market. The model currently does not differentiate between rice for table use and rice for manufacturing use.
12. Indeed, this effect is underestimated in the model, which ignores the impact on production of the risk-reducing effect of the variable payments. Such counter-cyclical payments have additional value to risk-averse producers. See OECD Papers (2001) Decoupling: A Conceptual Overview, Volume 5, N°11.
13. As discussed elsewhere, rice imports are governed by an import quota with a defined schedule to 2014 that is unlikely to be altered in practice.
14. The change in the fixed payment and the change in MPS differ by KRW 320 million, or 0.07%. The difference is an approximation error coming from the scenario design.
Chapter IV. Evaluation and Recommendations– 69
EVALUATION OF AGRICULTURAL POLICY REFORMS IN KOREA –© OECD 2008
Chapter IV.
EVALUATION AND RECOMMENDATIONS
This chapter evaluates Korean agricultural policy reforms over the last ten years and provides recommendations for continuing the reform process in the future. The evaluation is based on the operational criteria of transparency, targeting, tailoring, flexibility and equity which were agreed by OECD Agricultural Ministers in 1998. These criteria are designed to support an economically healthy sector that contributes to the wider economy, respects natural resources and uses inputs effectively without resorting to distorting subsidies. Following the evaluation of the recent agricultural policy reforms in Korea, specific recommendations for future agricultural policy are made.
IV.1. Evaluation of agricultural policies over the last ten years
Key reform initiatives
The previous OECD study of Korean agricultural policy, published in 1998 under the title “Review of Agricultural Policies in Korea”, made ten policy recommendations. The list of OECD recommendations and the corresponding policies that have been implemented are shown in Table 4.1.
Over the last ten years, the Korean government has implemented agricultural policy reforms broadly consistent with the principles outlined by OECD Ministers. The introduction of direct payments was an important first step. Support through direct payments has increased significantly in recent years, especially after the introduction of the direct payments system for paddy fields in 2005 following the rice negotiation. The share of direct payments in the national agricultural budget has increased to 24% and the share of direct payments in farm household income has increased to 5.3% in 2006. The abolition of government purchasing and the introduction of a public stockholding system for rice in 2005 is a significant step towards finding an alternative way to achieve food security. The new system is more market oriented and less expensive than the previous one.
Several comprehensive agricultural investment plans have been put in place to improve the infrastructure for production, processing, and distribution and have contributed to efficiency gains. The productivity of agricultural labour has increased from KRW 9 897/hour (USD 7/hour) in 1998 to KRW 12 297/hour (USD 12/hour) in 2005 and the productivity of land has increased from KRW 8.8 million/hectare (USD 6.3 thousand /hectare) in 1998 to KRW 11.4 million/hectare (USD 11.1 thousand/hectare) in 2005. Almost all rice is currently processed through modernized Rice Processing Centers (RPC). A large share of livestock is processed through Livestock Processing Centers (LPC) or modernized slaughterhouses and distributed as box meat. The introduction of

70 – Chapter IV. Evaluation and Recommendations
EVALUATION OF AGRICULTURAL POLICY REFORMS IN KOREA © OECD 2008
the total management fund system and making public the manual for implementation of agricultural projects has increased transparency in the budget allocation process.
Table 4.1. OECD Recommendations of 1998 and implemented policies
Recommendations Implemented Policies
(1) Increase direct payments
Introduction of several direct payment schemes: early retirement payments (1997), direct payments for environmentally-friendly farming (1999), direct payments for environmentally-friendly livestock practices (2004), direct payments for less favoured areas (2004), direct payments for landscape conservation (2005), fixed and variable payments for paddy field (2005)
(2) Increase market opening efforts
Implementation of the Uruguay Round Agreement (1995-2004)
Implementation of the result of the 2004 Rice negotiations (2005-2014)
Implementation of FTAs with Chile (2004), Singapore (2006), EFTA (2006), and ASEAN (2007)
FTA with the United States (2007)
(3) Find alternative ways to ensure food security
Abolition of government purchasing and introduction of public stockholding system for rice (2005)
(4) Develop downstream industries Restructuring of the food distribution system (1998)
Introduction of a regional agriculture cluster programme (2005)
(5) Reduce input subsidies Abolition of the subsidy on purchasing agricultural machines (2001)
Abolition of the subsidy on chemical fertilizers (2005)
(6) Improve infrastructure
Introduction of an electronic auction system in the wholesale market (1999)
Introduction of a comprehensive nation-wide e-market system for agricultural products (2000)
(7) Implement effective structural adjustment policy
Launch of farm consolidation projects (1988)
Introduction of the farmland bank system (2005)
(8) Promote sustainable agriculture
Introduction of direct payments for environmentally -friendly farming (1999) and direct payments for environmentally-friendly livestock practices (2004)
Introduction of IPM and INM (1993)
Abolition of the subsidy on chemical fertilizers (2005)
(9) Accelerate regulatory reform Several revisions of farm land acts to increase the maximum size of farmland holdings (1999, 2002, 2006)
(10) Increase transparency in policy implementation
Introduction of the total management funding system (1999)
Merging of the Seeds Fund and Ginseng Fund into the Agricultural products price stabilization funds (2000)
Revision of the agricultural projects evaluation system (2005)
Through the increased efforts to promote environmentally-friendly farming, the share of environmentally-friendly products in all agricultural products has increased to 4.4% in 2005. The complete withdrawal of subsidies on chemical fertilizers in 2005 has increased the price of fertilizer by 18% leading to a decline in their use.

Chapter IV. Evaluation and Recommendations– 71
EVALUATION OF AGRICULTURAL POLICY REFORMS IN KOREA –© OECD 2008
Regulations on farmland use and ownership have been revised to render them more market oriented. One key aspect of regulation, the maximum size of farmer’s farmland holding, was eliminated with the revision of the Farmland Act in 2002. Korea’s constitution enshrines the principle of “farmland to the tillers”. Recent reforms attempt to introduce a degree of flexibility into the laws governing land use while remaining faithful to the constitutional principle. For example, agricultural corporations were permitted to own farmland from 2002 and non-farmers were allowed to own up to 0.1 hectare of farmland for the purpose of weekend farming from 2003. The introduction of the farmland banking system in 2005 has facilitated farm enlargement and farmland mobility between different owners.
As a result of the 2004 rice negotiation and several FTAs, market opening in agricultural products will continue to increase as these agreements are implemented. In particular, the FTA with the United States will bring significant market opening and introduce competition in the domestic market when the agreement begins to be implemented. This will contribute to the modernisation of the Korean agro-food sector, increase its efficiency, and result in benefits for consumers through lower food prices.
The need for continuing reform
The general direction and progress of agricultural policy reform in Korea since the mid-1990s is broadly consistent with the policy principles as defined by OECD Ministers. Despite the progress to date, there remains room for additional reforms aimed at improving the market orientation and economic contribution of the sector. The level of the percentage PSE of Korea remains high compared to other OECD countries, despite a decline of about 10 percentage points over the last fifteen years. Furthermore, most of this support is in the form of MPS (91%), one of the most production and trade distorting types of support. While this is a decrease from 99% in 1986, there is much more scope for reduction.
Although the introduction of fixed and variable payments on paddy field is an improvement over continued use of market price support, these policies are not without problems. While the fixed payment is more decoupled from production, it has the potential to cause land prices to rise. The variable payments remain connected to rice production, and offer a form of price support that reduces farmer’s risks, an insurance effect that can magnify the distorting effect of the policy. The incentive toward rice production created by this policy occurs in a situation where Korea currently has a surplus of rice production over domestic needs, while self-sufficiency in other commodities remains low. While paddy fields were once exclusively used for growing rice, about 10% of paddy fields are currently used for cultivating other agricultural products, including strawberry, melon, and paprika, and this share is growing every year. The variable payment for rice may have the effect of retarding this positive development.
As is the case for rice, policies in the dairy sector have led to high domestic prices and a surplus of milk production over domestic demand. This has resulted in high subsidy payments to dispose of the surplus. The current quota-based system of milk pricing, which was introduced in 2002, has helped to reduce the surplus and the associated budget costs but continues to allow overproduction and provides significant support to producers. Reducing support levels and deregulating the marketing of milk would likely improve efficiency and equity, as well as leading to considerable budget savings.

72 – Chapter IV. Evaluation and Recommendations
EVALUATION OF AGRICULTURAL POLICY REFORMS IN KOREA © OECD 2008
While intensive policy efforts have been made to decrease the use of chemical fertilisers and pesticides and to promote environmentally-friendly farming practices, agriculture in Korea remains one of the most fertiliser and pesticide intensive in the world. The cause of this may be found in the high levels of commodity support, in particular to rice, that promote intensive production practices and prevent conversion of land to more environmentally sustainable uses.1
Current agricultural policy is influenced by the evolution of agricultural tenure in Korea. A system historically dominated by large landowners and tenant farmers led to poverty and inequality. From 1950 the system was changed to provide a more equitable distribution of assets, and to enshrine the principle of the independence and self-sufficiency of the small farmer. This principle has led to controls on the land market designed to ensure land ownership by farmers of small-scale plots and policy objectives that focus on narrowing the income gap between small farmers and the rest of Korean society. The costs of attempting to ensure income parity given the persistence of so many small farmers and the growing gap in productivity growth between agriculture and other sectors is onerous on society. In recognition of these problems, the regulations limiting the total amount of land a farmer may hold have been abolished, urban residents have been allowed to possess farmland for weekend or hobby farming, and agricultural corporations have been allowed to own farmland. However, quite strict regulations continue to apply to non-farmer and corporate ownership of farmland. These regulations may reduce growth in the sector by restricting entry of new people, ideas and investment.
While agriculture will continue to play an important role in rural society, there is an urgent need for diversification of the economic base to support a strong and vibrant rural economy. This means focussing rural development policy on providing the services that will make rural communities attractive and competitive--transport, health, education, and recreational opportunities. This will benefit farm families and others.
IV.2 Recommendations for the future policy reform
The OECD proposes several recommendations for policy reform in Korea.
1) Support to agricultural producers in Korea, as estimated by the percentage PSE, is amongst the highest (fourth highest) of the countries in the OECD. Moreover, 91% of the PSE is made up of market price support, one of the most production and trade distorting forms of subsidy. As a result, the price gap between domestic and international prices is very high, and should be reduced. These policies could be replaced where necessary by payments that are decoupled from commodity production decisions and to the extent that their objective is compensation should be time-limited in nature. This will allow a smooth transition to market-orientation for farmers while delivering immediate benefits to Korean consumers.
2) Efforts to open agricultural markets should be continued. For example, Korea may pursue additional bilateral trade agreements such as the one recently agreed with the United States, while at the same time working towards a successful conclusion of the Doha round of multilateral trade negotiations. State trading enterprises could be reformed to allow for increased competition, and tariff systems modified to reduce tariff peaks, and increase trade generally.

Chapter IV. Evaluation and Recommendations– 73
EVALUATION OF AGRICULTURAL POLICY REFORMS IN KOREA –© OECD 2008
3) The introduction of fixed payments for paddy fields was an important step away from market price support towards more decoupled approaches. However, given the already high levels of rice production, related environmental impacts, and the forecasted continuing fall in consumption, the variable payments which encourage rice production should be reviewed. The role of the fixed payments also needs to be clarified so that the objectives of these payments are clearly understood and they can be targeted to meet these objectives. Some portion of the fixed payment goes to non-farming land owners who are not in the target group for income support. Also, the capitalization of payments will have an impact on the price of farmland. Clear objectives and targeting can help mitigate these problems.
4) Since the introduction of the quota system in 2002, surplus production has been reduced and budget costs have fallen accordingly. Reduction of milk quota to decrease the need for subsidy on manufacturing milk, reducing the out-of-quota price, or balancing the domestic market by reducing the in-quota price of milk could be better policy choices which would increase net welfare as a whole. Fluid milk prices need to be set in a more market oriented way and domestically-produced fluid milk should enjoy only a natural premium over the world price due to limited transportability of fluid milk from other countries.
5) Incomes for agricultural households are 78% of urban households. This income gap has been the source of much concern for Korean policy makers. Increased efforts could be made to diversify income sources of agricultural households. Examples include the promotion of agro-tourism and agro-food industries which utilize specialty produce in rural areas.
6) Rural policies should be distinguished from agricultural policies and the view that agriculture is the only or main driver of the rural economy needs to be revised. The interdependence between agriculture and rural polices should be recognized. Part of the solution to increasing the income of agricultural households is to improve the opportunities to supplement farm income with off-farm work. This requires the development of a robust rural economy. Key elements to promote development are investment in education, transport, heath, and housing infrastructure that will increase the desirability of rural areas. In some cases, freeing up agricultural land for new uses will also help drive the rural economy, for example by developing the industrial complex or by making rural areas important recreational destinations through the development of sports resorts or other tourist attractions. Decisions of this nature should reflect the needs and the context in the rural areas themselves and be made locally.
7) The average farm size in Korea is only 1.4 hectares – not large enough to benefit from economies of scale. Future policies should promote larger farm holdings and farm consolidation. Given the high price of farmland, the further development of the rental market should be pursued. In addition, current restrictions on land ownership by corporations and non-farmers could be further eased. Policy reforms removing size limitations are an important first step, but land markets would need to be further liberalised to improve competition and participation. Careful use of zoning regulations will be essential to ensure that land is used in a way that respects the needs of the local community and preserves areas with a high social value.

74 – Chapter IV. Evaluation and Recommendations
EVALUATION OF AGRICULTURAL POLICY REFORMS IN KOREA © OECD 2008
8) The current definition of a farmer needs to be reviewed. Currently, a farmer is defined as having more than 1 000 m2 (0.1 hectare) of farmland or more than KRW 1 million (USD 1 000) in sales of agricultural products including livestock products or engaging in farming more than 90 days per year. Since farm households enjoy significant social benefits, including reduced health insurance premiums, educational loans and other social safety nets, this provides an incentive for households to keep the status of “farm” household. As a result, a large amount of land is held in small, non-economic units. Redefining farm households in line with what might be considered a business-oriented farm household would eliminate this distortion, free up land to be used more efficiently, and save unwarranted social expenditures.
9) Fertilizer and pesticide use in agriculture in Korea is among the most intensive in the world. Where the use of these chemicals is causing environmental harm, effective measures must be put in place to reduce both their use and their impact. For example, promoting or requiring the use of buffer strips between agricultural fields and waterways to absorb excess nutrients and collect pesticide runoff, requiring fertiliser application to better match the nutrient requirements of crops, the use of soil testing for fertiliser and economic thresholds for the use of pesticides, and the creation of watershed-based nutrient-management plans. Also, efforts for the efficient management of livestock manure need to be continued. Environmental policies should respect the polluter-pays principle; otherwise they risk being ineffective or at worst counter-productive, as well as inequitable and expensive. Care must be taken to ensure that commodity policies do not conflict with environmental goals.
10) The provision of safe, high quality agricultural products is an important aspect of agricultural policy in Korea. Future efforts should be concentrated on the streamlining of the certification system in order to increase the confidence of consumers in Korean food and agriculture products and to build a strong reputation for quality in Korean products. Recent institutional changes, giving the Ministry of Agriculture and Forestry responsibility for the food industry, should assist in achieving these objectives for the agro-food sector.
11) Korean traditional food and cuisine has a growing reputation in the global market place. Efforts to promote Korean cuisine should be deepened and expanded. Also, efforts promoting the advantages of traditional foods and helping to develop premium products for the domestic market should be continued. Policies directed towards market development and promotion are an important part of supporting the transition of agriculture towards a more market-oriented future.
12) Co-operatives, farmer’s organization, regional agro-business clusters and innovative entrepreneurial farmers are a growing part of the ago-business and agro-tourism area. Policy efforts should be made to promote consulting activities in the field of the management of farm production, marketing, and income risk in order to help promote entrepreneurship in the agricultural sector. Efforts to improve efficiency in upstream and downstream industries in the agricultural production chain should be continued.
Agriculture in Korea needs to be allowed to evolve into an efficient, modern enterprise that provides a positive economic contribution to society in line with other sectors of the economy. Fundamentally, this means reducing agricultural support to improve the market-orientation and environmental sustainability of the sector. It means

Chapter IV. Evaluation and Recommendations– 75
EVALUATION OF AGRICULTURAL POLICY REFORMS IN KOREA –© OECD 2008
reforming land markets to allow more people to participate and to allow other potential users of land to acquire it. It means recognising that it will become increasingly difficult to achieve the dual objectives of maintaining a large number of small independent family farms and closing the income gap with urban households. It also requires a recognition that agriculture will not be the only or main driver of rural jobs and wealth creation and that improved infrastructure and diversified non-farming activities in rural areas will be essential both in retaining farm households and in attracting others. A positive vision of agriculture is needed that will allow it to move away from current high levels of support and protection, towards the production of unique and high quality Korean products that are desirable to Korean consumers and consumers abroad.
NOTE
1. In countries where land is relatively scarce compared to other production factors, the market induces farmers to substitute land with other factors of productions and intensify purchased inputs application. This factor endowment may also explain the relatively higher fertilizer and pesticide intensity in Korea as explained in Chapter 1.


Annex Tables– 77
EVALUATION OF AGRICULTURAL POLICY REFORMS IN KOREA –© OECD 2008
ANNEX TABLES

78 –
Ann
ex T
able
s
EV
AL
UA
TIO
N O
F A
GR
ICU
LT
UR
AL
PO
LIC
Y R
EFO
RM
S IN
KO
RE
A ©
OE
CD
200
8
An
nex
Tab
le I.
1. L
and
use
19
7019
7519
8019
8519
9019
9520
0020
05
To
tal a
rea
('000
Ha)
9 84
89
881
9 89
99
914
9 92
79
927
9 94
69
965
of w
hich
fore
st (
%)
67.1
67.2
66.3
65.9
65.3
65.0
64.6
64.2
of w
hich
cul
tivat
ed la
nd (
%)
23.3
22.7
22.2
21.6
21.2
20.0
19.0
18.3
To
tal c
ult
ivat
ed la
nd
('0
00 H
a)2
298
2 24
02
196
2 14
42
109
1 98
51
889
1 82
4
Pad
dy fi
elds
(%
)55
.457
.059
.561
.863
.860
.860
.860
.6
Upl
and
(%)
44.6
43.0
40.5
38.2
36.2
39.3
39.2
39.4
of w
hich
Ric
e (%
)52
.854
.456
.257
.759
.053
.256
.753
.7
Bar
ley
(%)
36.3
34.0
16.4
11.3
7.6
4.5
3.6
3.3
Soy
bean
s (%
)15
.914
.511
.19.
18.
96.
65.
76.
5
Veg
etab
les
(%)
11.1
10.9
16.4
15.7
13.1
16.2
15.7
13.2
Fru
its (
%)
2.6
3.3
4.5
5.1
6.2
8.8
8.9
8.2
Sou
rce:
MA
F, S
tatis
tical
Yea
rboo
k of
Agr
icul
ture
and
For
estr
y, v
ario
us y
ears
, Seo
ul.

Annex Tables – 79
EVALUATION OF AGRICULTURAL POLICY REFORMS IN KOREA –© OECD 2008
Annex Table I.2. Main Economic Indicators
1970 1975 1980 1985 1990 1995 2000 2005
Population, mid-year2,4
(Million persons) 32.2 35.3 38.1 40.8 42.9 45.1 47.0 48.3Population density2,4
(persons per sq. km) 328 357 385 412 432 454 473 485Dependency ratio2, a (%) 83.8 72.5 60.7 52.5 44.3 41.4 41.5 42.0Index of ageing1, b (%) n.a. 9.0 11.2 14.2 20.0 25.2 39.1 54.6
GNI, current2 (Trillion KRW) 2.8 10.3 38.1 82 186.6 397.5 576.2 809.3GDP, current1, 2, 3 (Trillion KRW) 2.8 10.4 38.8 84.1 186.7 398.8 578.7 810.5GDP growthc, d, annual1 (%) n.a. 2.8 7.1 8.1 10.0 9.2 5.7 6.9GDP per capita2 (USD) 277 608 1,673 2,366 6,151 11,471 10,888 16,306
Exchange rate won/USD3 310.6 484.0 607.9 870.6 708.0 771.0 1259.7 1031
GDP deflator3 (2000=100) 4.0 10.5 27.9 41.5 58.2 85.4 100 112.1GDP deflator growth1,d n.a. 23.2 21.6 8.4 7.0 5.6 2.1 2.5CPI (2005 = 100) 6.2 12.7 28.2 39.7 51.7 69.9 84.9 100
Employment1,2 (Million persons) 9.6 11.7 13.7 15.0 18.1 20.4 21.2 22.9 Annual growth rated n.a. 4.0 3.2 1.8 3.9 2.7 0.0 1.2Unemployment rate1,2 (%) 4.4 4.1 5.2 4.0 2.4 2.1 4.4 3.7Wages ('000 KRW)1,e 14 38 147 270 591 1,124 1,314 1,888 % changed n.a. 21.8 30.7 13.0 17.0 9.9 6.7 44Nominal Wage Index (2000 = 100) n.a. n.a. 11.2 20.5 45.0 85.5 100.0 143.7Real earningsf n.a. n.a. 520.2 679.3 1,142.7 1,607.9 1,547.7 1,888.0
Budget deficit (Billion KRW)1 n.a. -337 -584 644 755 1,712 726 1,008External debt (Billion USD)2 2.2 8.4 27.2 46.8 31.7 78.4 148.1 187.8 % of GDP 25.2 39.7 43.3 49.6 12.5 17.2 25.6 23.2
Current account2, 3, g (Billion USD) n.a. n.a. -5.3 -0.8 -2.2 -8.5 12.2 15Trade balance2, 3, g (Billion USD) n.a. n.a. -4.6 0.4 -3.1 -7.4 14.1 19Imports, fob2, 3, g
Billion USD n.a. n.a. 21.9 26.7 66.1 129.1 160.481 261.238 % of GDP n.a. n.a. 34.9 28.3 26.1 28.3 27.7 32.2Exports, fob2, 3, g Billion USD n.a. n.a. 17.2 26.6 63.7 124.6 172.2 284.1 % of GDP n.a. n.a. 27.4 28.2 25.1 27.3 29.8 35.1Average tariff rate (%) All products n.a. n.a. n.a. n.a. 11.4 7.9 n.a. n.a. Agricultural products n.a. n.a. n.a. n.a. 19.9 16.6 n.a. n.a.
General Government Budget2
as a % of GDP n.a. 24.1 27.6 24.5 24.9 33.1 29.4 28.1
Gross fixed capital formation3
Trillion KRW 0.7 2.7 12.2 23.4 66.6 128.7 179.9 236.4 % of GDP 25.1 26.7 32.1 28.6 37.1 36.6 31.1 29.2 % growth rated n.a. 31.6 34.8 13.9 23.2 17.6 2.4 6.2Household saving3 Trillion KRW n.a. 0.6 2.5 7.5 23.9 40.7 61.4 50.9
% of GDP n.a. 5.4 6.5 9.1 13.3 11.6 10.6 6.3 % growth rated n.a. n.a. 34.9 24.8 26.0 13.4 n.a. -17.1Direct Investment2,3
Outward (Million USD) 0 -4 -13 -34 -820 -3,120 -5076 -6719
Inward (Million USD) 66 62 96 250 715 1,240 n.a. n.a.
n.a.: not available.
a. Younger than 14 years old plus older than 65 as a proportion of 15-64 years old.
b. Older than 65 years old as a proportion of younger than 14.
c. GDP (Market Price), Volume, 2000, constant price.
d. For 1975, 1980, 1985,1990, 1995, 2000 and 2005, the annual growth is calculated as an average rate of the five previous years value.
e. Monthly earnings of regular employees in manufacturing. Data from Jan. 1993 are based on the revised Korean Standard Industrial Classification.
f. Wages deflated by consumer price index.
g. Revised by the Bank of Korea in January 1998 in accordance with IMF calculations of Balance of Payments.
Sources: 1. Bank of Korea (2006), Economic Statistics Yearbook 2006, Seoul.2. National Statistical Office (2006), Major Statistics of Korean Economy 2006 , Seoul.3. OECD (2007), OECD Economic Survey of Korea , Paris.4. MAF (2006), Statistical Yearbook of Agriculture and Forestry , Seoul.

80 –
Ann
ex T
able
s
EV
AL
UA
TIO
N O
F A
GR
ICU
LT
UR
AL
PO
LIC
Y R
EFO
RM
S IN
KO
RE
A ©
OE
CD
200
8
An
nex
Tab
le I.
3. C
on
trib
uti
on
of
agri
cult
ure
to
th
e ec
on
om
y
1970
1975
1980
1985
1990
1995
2000
2005
Far
m p
op
ula
tio
n3
(Mill
ion
)14
.413
.210
.88.
56.
74.
94.
03.
4
Ave
rage
ann
ual %
cha
nge
n.a.
-1.6
-3.7
-4.2
-4.4
-5.4
-4.2
-3.0
As
a pe
rcen
tage
of t
otal
pop
ulat
ion
(%)
44.7
37.5
28.4
20.9
15.5
10.8
8.6
7.1
Far
m h
ou
seh
old
s3 ('0
00)
2 48
32
379
2 15
51
926
1 76
71
501
1 38
31
273
Ave
rage
ann
ual %
cha
nge
n.a.
-0.8
-1.9
-2.1
-1.6
-3.0
0.1
-1.6
As
a pe
rcen
tage
of t
otal
hou
seho
lds
(%)
42.4
35.2
27.0
20.1
15.6
11.6
9.7
8.0
Ag
ricu
ltu
ral p
rod
uct
ion
3, b
(T
rilli
on
KR
W)
0.8
2.7
6.4
12.3
17.9
26.6
32.0
35.1
Ind
ex o
f pro
duct
ion
(200
4-20
06=
100)
44.3
57.1
57.0
80.4
82.1
93.6
103.
810
0.8
Ag
ricu
ltu
ral G
DP
3 (T
rilli
on
KR
W)
0.6
2.3
4.8
8.7
13.0
19.9
21.7
21.8
Ave
rage
ann
ual %
cha
nge
n.a.
56.7
21.7
16.3
9.9
10.6
2.9
0.1
As
a pe
rcen
tage
of t
otal
GD
P1 (
%)
25.5
24.0
13.8
11.6
7.8
5.5
4.2
2.9
Ave
rage
ann
ual %
cha
nge
n.a.
-1.2
-8.5
-3.2
-6.6
-5.9
-6.7
-6.2
Far
m e
mp
loym
ent3
('0
00)
4 84
65
339
4 65
43
733
3 23
72
403
2 24
31
815
Ave
rage
ann
ual %
cha
nge
n.a.
2.0
-2.6
-4.0
-2.7
-5.2
-2.6
-3.8
Sha
re o
f agr
icul
ture
in e
mpl
oym
ent1,
3 (%
)50
.445
.734
.024
.917
.911
.810
.67.
9
Ave
rage
ann
ual %
cha
nge
n.a.
-1.9
-5.1
-5.3
-5.6
-6.8
-6.5
-25.
1
Sh
are
of
foo
d in
co
nsu
mp
tio
n e
xpen
dit
ure
s2, a
(%
)45
.947
.336
.828
.423
.521
.120
.218
.8 A
vera
ge a
nnua
l % c
hang
en.
a.0.
9-4
.4-4
.6-3
.5-2
.0-4
.7-1
.4
n.a.
: no
t ava
ilabl
e.
a.
Bas
ed o
n m
onth
ly c
onsu
mpt
ion
expe
nditu
re p
er h
ouse
hold
for
all h
ouse
hold
s in
all
citie
s.
b.
Exc
ludi
ng fo
rest
ry a
nd fi
sher
ies.
S
ourc
es:
1. B
ank
of K
orea
(20
06),
Eco
nom
ic S
tatis
tics
Yea
rboo
k 20
06, S
eoul
.
2. N
atio
nal S
tatis
tical
Offi
ce (
2006
), M
ajor
Sta
tistic
s of
Kor
ean
Eco
nom
y 20
06, S
eoul
.
3. M
AF
, Sta
tistic
al Y
earb
ook
of A
gric
ultu
re a
nd F
ores
try,
var
ious
yea
rs, S
eoul
.

Ann
ex T
able
s – 81
E
VA
LU
AT
ION
OF
AG
RIC
UL
TU
RA
L P
OL
ICY
RE
FOR
MS
IN K
OR
EA
–©
OE
CD
200
8
An
nex
Tab
le I.
4. P
rod
uct
ion
( '0
00 T
onne
s)
1970
1975
1980
1985
1990
1995
2000
2005
Ric
e3
939
4 66
93
550
5 62
65
606
4 69
55
291
4 76
8
Whe
at21
997
9211
110
28
Mai
ze68
5415
413
212
074
6473
Bar
ley
1 59
01
700
811
571
416
282
161
193
Soy
bean
232
311
216
234
233
160
113
183
Gar
lic78
103
253
256
417
462
474
375
Red
pep
per
5312
812
516
513
319
319
416
1
App
les
212
280
410
533
629
716
489
368
Wat
erm
elon
148
139
362
556
593
1 12
092
390
5
Man
darin
es5
6716
137
149
361
556
363
8
Ses
ame
1025
741
3832
3124
Milk
4816
045
21
006
1 75
21
998
2 25
32
229
Bee
f and
vea
l37
7093
118
9515
521
415
2
Por
k83
9923
934
650
863
971
470
1
Pou
ltry
(chi
cken
)45
5692
126
172
265
261
298
Egg
s12
314
823
628
638
645
448
659
1
n.a.
not
ava
ilabl
e S
ourc
e: M
AF
Kor
ea, S
eoul
.
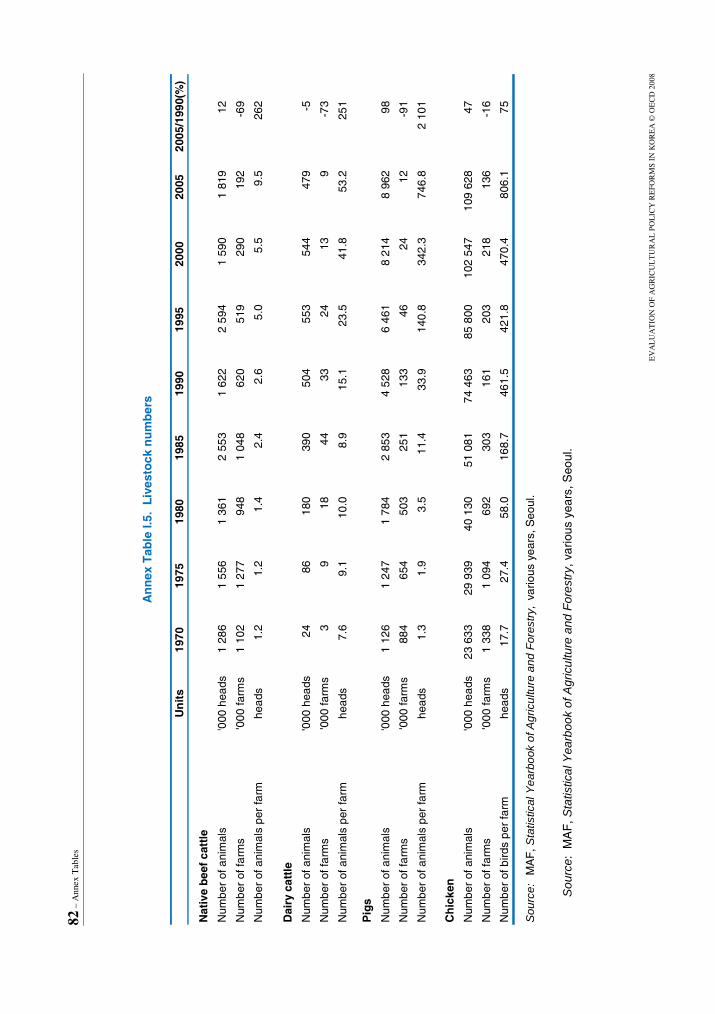
82 –
Ann
ex T
able
s
EV
AL
UA
TIO
N O
F A
GR
ICU
LT
UR
AL
PO
LIC
Y R
EFO
RM
S IN
KO
RE
A ©
OE
CD
200
8
An
nex
Tab
le I.
5. L
ives
tock
nu
mb
ers
Un
its
1970
1975
1980
1985
1990
1995
2000
2005
2005
/199
0(%
)
Nat
ive
bee
f ca
ttle
Num
ber
of a
nim
als
'000
hea
ds1
286
1 55
61
361
2 55
31
622
2 59
41
590
1 81
912
Num
ber
of fa
rms
'000
farm
s1
102
1 27
794
81
048
620
519
290
192
-69
Num
ber
of a
nim
als
per
farm
head
s1.
21.
21.
42.
42.
65.
05.
59.
526
2
Dai
ry c
attl
e
Num
ber
of a
nim
als
'000
hea
ds24
8618
039
050
455
354
447
9-5
Num
ber
of fa
rms
'000
farm
s3
918
4433
2413
9-7
3
Num
ber
of a
nim
als
per
farm
head
s7.
69.
110
.08.
915
.123
.541
.853
.225
1
Pig
s
Num
ber
of a
nim
als
'000
hea
ds1
126
1 24
71
784
2 85
34
528
6 46
18
214
8 96
298
Num
ber
of fa
rms
'000
farm
s88
465
450
325
113
346
2412
-91
Num
ber
of a
nim
als
per
farm
head
s1.
31.
93.
511
.433
.914
0.8
342.
374
6.8
2 10
1
Ch
icke
n
Num
ber
of a
nim
als
'000
hea
ds23
633
29 9
3940
130
51 0
8174
463
85 8
0010
2 54
710
9 62
847
Num
ber
of fa
rms
'000
farm
s1
338
1 09
469
230
316
120
321
813
6-1
6
Num
ber
of b
irds
per
farm
head
s17
.727
.458
.016
8.7
461.
542
1.8
470.
480
6.1
75
Sou
rce:
MA
F, S
tatis
tical
Yea
rboo
k of
Agr
icul
ture
and
For
estr
y, v
ario
us y
ears
, Seo
ul.
Sou
rce:
MA
F, S
tatis
tical
Yea
rboo
k of
Agr
icul
ture
and
For
estr
y, v
ario
us y
ears
, Seo
ul.

Ann
ex T
able
s – 83
E
VA
LU
AT
ION
OF
AG
RIC
UL
TU
RA
L P
OL
ICY
RE
FOR
MS
IN K
OR
EA
–©
OE
CD
200
8
An
nex
Tab
le I.
6. C
har
acte
rist
ics
of
the
farm
po
pu
lati
on
Un
its
1970
1975
1980
1985
1990
1995
2000
2005
Far
m p
op
ula
tio
n
'000
14 4
2213
244
10 8
278
521
6 66
14
851
4 03
13
434
Mal
e%
49.7
50.2
50.0
49.8
49.2
48.9
48.9
48.8
Fem
ale
%50
.349
.850
.050
.250
.851
.151
.151
.2
< 19
yea
rs o
ld%
53.9
51.0
45.4
39.7
31.6
22.7
17.9
14.4
20 -
49
%30
.531
.834
.233
.233
.933
.532
.328
.8
50 -
59
%7.
78.
49.
913
.216
.717
.916
.817
.5
> 60
%7.
98.
810
.513
.817
.825
.933
.139
.3
Far
m h
ou
seh
old
s'0
002
483
2 37
92
155
1 92
61
767
1 50
11
384
1 27
3 F
ull t
ime
1%
67.7
80.6
76.2
78.8
59.6
56.6
65.2
62.5
Par
t tim
e I
2%
19.7
12.5
13.7
8.7
22.0
18.5
16.3
13.0
Par
t tim
e II
3%
12.6
6.9
10.1
12.5
18.4
25.0
18.6
24.5
Non
cro
plan
d 4
%2.
94.
01.
32.
41.
31.
61.
01.
3
< 0
.5 h
a%
31.7
29.0
28.4
27.7
27.3
28.9
31.8
36.0
0.5
- 1
.0 h
a%
33.2
34.8
34.7
35.6
30.8
28.8
27.4
26.0
1.0
- 2
.0 h
a%
25.7
26.0
29.2
28.6
30.7
27.9
25.4
22.1
2.0
- 3
.0 h
a%
5.0
4.7
5.1
4.5
7.3
8.2
8.2
7.3
> 3
ha
%1.
51.
51.
41.
22.
54.
76.
17.
3
Ave
rage
num
ber
of h
ouse
hold
mem
bers
5.8
5.6
5.0
4.4
3.8
3.2
2.9
2.7
Ave
rage
siz
eH
a0.
930.
941.
021.
111.
191.
321.
371.
43
1. F
arm
hou
seho
lds
who
se m
embe
rs a
re o
nly
enga
ged
in a
gric
ultu
re. (
the
num
ber
of d
ays
spen
t on
non-
agric
ultu
ral a
ctiv
ities
by
any
mem
ber
in th
e ho
useh
old
shou
ld b
e le
ss th
an 3
0 da
ys)
2. F
arm
hou
seho
lds
with
mem
bers
who
are
eng
aged
in n
on-a
gric
ultu
ral a
ctiv
ities
for
mor
e th
an 3
0 da
ys a
nnua
lly a
nd w
hose
inco
me
from
agr
icul
ture
is h
ighe
r th
an th
at
from
non
-agr
icul
tura
l act
iviti
es.
3. F
arm
hou
seho
lds
with
mem
bers
who
are
eng
aged
in n
on-a
gric
ultu
ral a
ctiv
ities
for
mor
e th
an 3
0 da
ys a
nnua
lly a
nd w
hose
inco
me
from
agr
icul
ture
is s
mal
ler
than
that
fr
om n
on-a
gric
ultu
ral a
ctiv
ities
. 4.
Non
-cro
p fa
rm h
ouse
hold
s ar
e fa
rm h
ouse
hold
s w
ithou
t cul
tivat
ed la
nd.
Sou
rce:
MA
F, S
tatis
tical
Yea
rboo
k of
Agr
icul
ture
and
For
estr
y, v
ario
us y
ears
, Seo
ul.
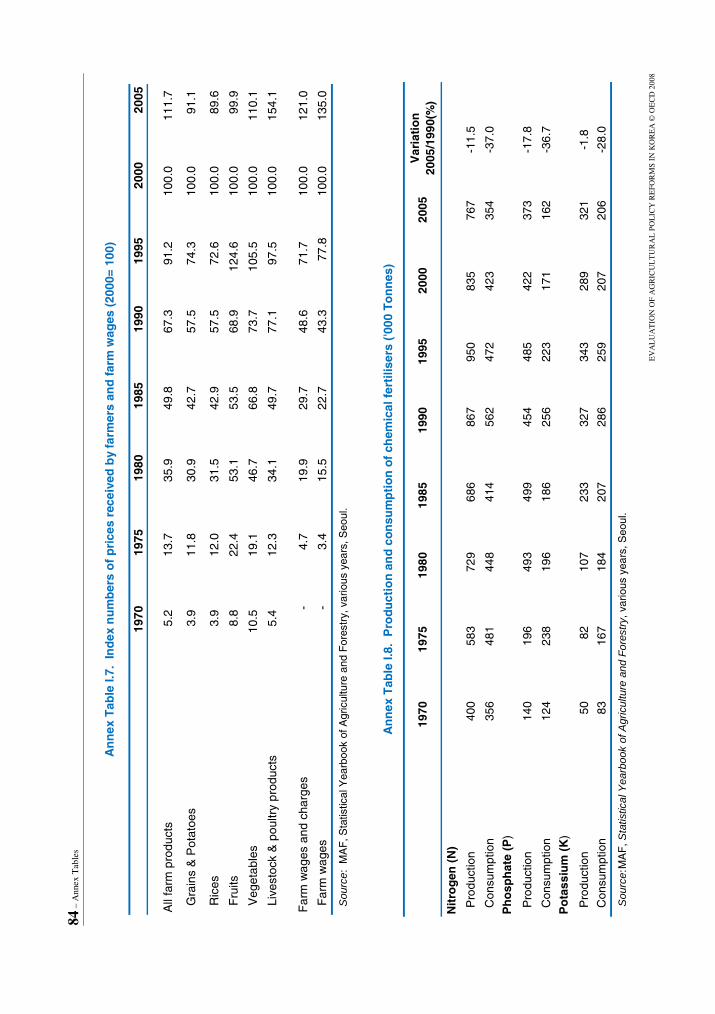
84 –
Ann
ex T
able
s
EV
AL
UA
TIO
N O
F A
GR
ICU
LT
UR
AL
PO
LIC
Y R
EFO
RM
S IN
KO
RE
A ©
OE
CD
200
8
An
nex
Tab
le I.
7. I
nd
ex n
um
ber
s o
f p
rice
s re
ceiv
ed b
y fa
rmer
s an
d f
arm
wag
es (
2000
= 10
0)
1970
1975
1980
1985
1990
1995
2000
2005
All
farm
pro
duct
s 5.
213
.735
.949
.867
.391
.210
0.0
111.
7
Gra
ins
& P
otat
oes
3.9
11.8
30.9
42.7
57.5
74.3
100.
091
.1
Ric
es3.
912
.031
.542
.957
.572
.610
0.0
89.6
Fru
its8.
822
.453
.153
.568
.912
4.6
100.
099
.9
Veg
etab
les
10.5
19.1
46.7
66.8
73.7
105.
510
0.0
110.
1
Liv
esto
ck &
pou
ltry
prod
ucts
5.4
12.3
34.1
49.7
77.1
97.5
100.
015
4.1
Far
m w
ages
and
cha
rges
-
4.7
19.9
29.7
48.6
71.7
100.
012
1.0
Far
m w
ages
-3.
415
.522
.743
.377
.810
0.0
135.
0
Sou
rce:
MA
F, S
tatis
tical
Yea
rboo
k of
Agr
icul
ture
and
For
estr
y, v
ario
us y
ears
, Seo
ul.
An
nex
Tab
le I.
8. P
rod
uct
ion
an
d c
on
sum
pti
on
of
chem
ical
fer
tilis
ers
('000
To
nn
es)
1970
1975
1980
1985
1990
1995
2000
2005
Var
iati
on
20
05/1
990(
%)
Nit
rog
en (
N)
Pro
duct
ion
400
583
729
686
867
950
835
767
-11.
5
Con
sum
ptio
n35
648
144
841
456
247
242
335
4-3
7.0
Ph
osp
hat
e (P
)
Pro
duct
ion
140
196
493
499
454
485
422
373
-17.
8
Con
sum
ptio
n12
423
819
618
625
622
317
116
2-3
6.7
Po
tass
ium
(K
)
Pro
duct
ion
5082
107
233
327
343
289
321
-1.8
Con
sum
ptio
n83
167
184
207
286
259
207
206
-28.
0
Sou
rce:
MA
F, S
tatis
tical
Yea
rboo
k of
Agr
icul
ture
and
For
estr
y, v
ario
us y
ears
, Seo
ul.

Ann
ex T
able
s – 85
E
VA
LU
AT
ION
OF
AG
RIC
UL
TU
RA
L P
OL
ICY
RE
FOR
MS
IN K
OR
EA
–©
OE
CD
200
8
An
nex
Tab
le I.
9. F
arm
mac
hin
ery
equ
ipm
ent
per
100
far
ms
1980
1985
1990
1995
2000
2005
Pow
er ti
llers
13.7
30.6
42.5
55.8
68.0
66.1
Far
m tr
acto
rs0.
10.
62.
76.
413
.918
.4
Ric
e tr
ansp
lant
ers
0.5
2.2
7.8
15.9
24.8
26.8
Com
bine
har
vest
er0.
10.
62.
74.
66.
37.
0
Cul
tivat
orn.
a.n.
a.4.
215
.427
.431
.7
Gra
in d
ryer
0.1
0.3
1.1
1.8
4.0
5.7
n.a.
Not
ava
ilabl
e
Sou
rces
:
MA
F, S
tatis
tical
Yea
rboo
k of
Agr
icul
ture
and
For
estr
y, v
ario
us y
ears
, Seo
ul.
MA
F (
2006
) D
ata
on a
gric
ultu
ral m
achi
nery
, Seo
ul
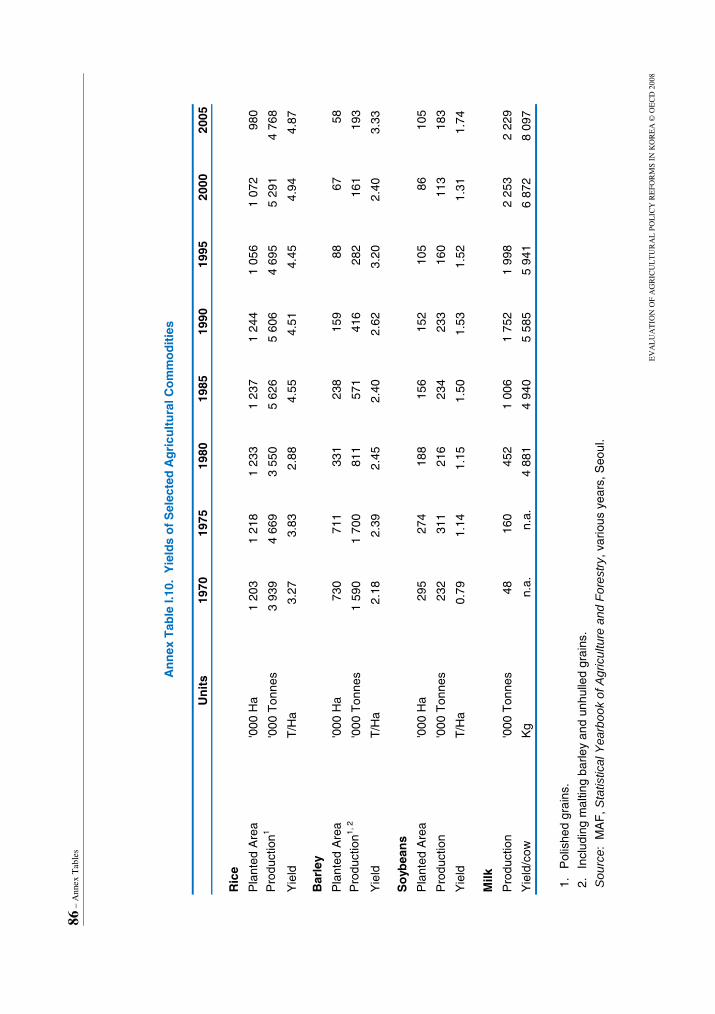
86 –
Ann
ex T
able
s
EV
AL
UA
TIO
N O
F A
GR
ICU
LT
UR
AL
PO
LIC
Y R
EFO
RM
S IN
KO
RE
A ©
OE
CD
200
8
An
nex
Tab
le I.
10.
Yie
lds
of
Sel
ecte
d A
gri
cult
ura
l Co
mm
od
itie
s
Un
its
1970
1975
1980
1985
1990
1995
2000
2005
Ric
e
Pla
nted
Are
a'0
00 H
a1
203
1 21
81
233
1 23
71
244
1 05
61
072
980
Pro
duct
ion1
'000
Ton
nes
3 93
94
669
3 55
05
626
5 60
64
695
5 29
14
768
Yie
ldT
/Ha
3.27
3.83
2.88
4.55
4.51
4.45
4.94
4.87
Bar
ley
Pla
nted
Are
a'0
00 H
a73
071
133
123
815
988
6758
Pro
duct
ion1,
2'0
00 T
onne
s1
590
1 70
081
157
141
628
216
119
3
Yie
ldT
/Ha
2.18
2.39
2.45
2.40
2.62
3.20
2.40
3.33
So
ybea
ns
Pla
nted
Are
a'0
00 H
a29
527
418
815
615
210
586
105
Pro
duct
ion
'000
Ton
nes
232
311
216
234
233
160
113
183
Yie
ldT
/Ha
0.79
1.14
1.15
1.50
1.53
1.52
1.31
1.74
Milk
Pro
duct
ion
'000
Ton
nes
4816
045
21
006
1 75
21
998
2 25
32
229
Yie
ld/c
owK
gn.
a.n.
a.4
881
4 94
05
585
5 94
16
872
8 09
7
1.
Pol
ishe
d gr
ains
.
2.
Incl
udin
g m
altin
g ba
rley
and
unhu
lled
grai
ns.
Sou
rce:
MA
F, S
tatis
tical
Yea
rboo
k of
Agr
icul
ture
and
For
estr
y, v
ario
us y
ears
, Seo
ul.

Ann
ex T
able
s – 87
E
VA
LU
AT
ION
OF
AG
RIC
UL
TU
RA
L P
OL
ICY
RE
FOR
MS
IN K
OR
EA
–©
OE
CD
200
8
An
nex
Tab
le I.
11.
Far
m a
nd
urb
an h
ou
seh
old
inco
me
(Ave
rage
per
hou
seho
ld in
'000
KR
W)
1965
1970
1975
1980
1985
1990
1995
2000
2005
Agr
icul
tura
l inc
ome
(A)
8919
471
51
755
3 69
96
264
10 4
6910
897
11 8
15
Non
-far
m in
com
e1 (B
)23
6215
893
81
060
2 84
16
931
7 43
29
884
Tra
nsfe
r in
com
e1 (C
)
-
-
-
-97
71
921
4 40
34
743
4 07
8
Irre
gula
r in
com
e (D
)-
--
--
--
-4
725
Far
m h
ou
seh
old
inco
me
(E)
112
256
873
2 69
35
736
11 0
2621
803
23 0
7230
503
Rat
io A
/E (
%)
79.5
75.8
81.9
65.2
64.5
56.8
48.0
47.2
38.7
Dis
po
sab
le in
com
e (F
)10
824
985
32
579
5 69
010
965
21 6
2922
838
23 2
32
Urb
an h
ou
seh
old
inco
me
(G)
101
338
786
2 80
95
085
11 3
2922
933
28 6
4339
010
Rat
io E
/G (
%)
110.
775
.611
1.0
95.9
112.
897
.495
.180
.578
.2
In 2
005
pri
ces2
Agr
icul
tura
l inc
ome
n.a.
n.a.
n.a.
6 22
39
317
12 1
1614
977
12 8
3511
815
Far
m h
ouse
hold
inco
me
n.a.
n.a.
n.a.
9 55
014
448
21 3
2731
192
27 1
7630
503
Urb
an h
ouse
hold
inco
me
n.a.
n.a.
n.a.
9 96
112
809
21 9
1332
808
33 7
3739
010
n.a.
Not
ava
ilabl
e
1.
Bef
ore
1983
non
-agr
icul
tura
l inc
ome
incl
udes
tran
sfer
inco
me.
2.
Def
late
d us
ing
the
Con
sum
er P
rice
Inde
x, 2
005
= 1
00.
Sou
rce:
MA
F, S
tatis
tical
Yea
rboo
k of
Agr
icul
ture
and
For
estr
y, v
ario
us y
ears
, 200
6.

88 – Annex Tables
EVALUATION OF AGRICULTURAL POLICY REFORMS IN KOREA © OECD 2008
Annex Table I.12. Composition of non agricultural income, 2005
(Average per household in '000 KRW)
Receipts Expenditures Income Share (%)
Side Business 7 186 4 655 2 531 100.0
Forestry &fishery 858 395 463 18.3
Manufacturing 372 201 171 6.8
Construction 434 217 218 8.6
Others 5 521 3 842 1 679 66.3
Non-business income 7 353
Non business receipts 7 416 100.0
Agricultural wages 368 5.0
Salary 6 003 81.0
Dividence & Interest 374 5.0
Securities 33 0.4
Land Rental 214 2.9
Other rentals 424 5.7
Non business expenses 62 100.0
Non farm job expenses 11 17.7
A loss from the difference of quotation (securities) 1 2.2
Interest 14 22.0
Other 36 58.1
Transfer income 4 078 100.0
Agri investment 254 6.2
Other agri-investment 793 19.5
Other 1 327 32.5
Private subsidy 1 704 41.8
Irregular income 4 725 100.0
Receipts for congratulations and condolences 1288 27.3
Retirement allowance 151 3.2
Accident compensation 131 2.8
Other 3 154 66.8
Source: MAF (2006), Statistical Yearbook of Agriculture and Forestry 2006, Seoul.

Ann
ex T
able
s – 89
E
VA
LU
AT
ION
OF
AG
RIC
UL
TU
RA
L P
OL
ICY
RE
FOR
MS
IN K
OR
EA
–©
OE
CD
200
8
An
nex
Tab
le I.
13.
Dis
trib
uti
on
of
ho
use
ho
ld in
com
e b
y fa
rm s
ize,
200
5
(Ave
rage
per
hou
seho
ld in
'000
KR
W)
All
farm
s<
0.5
ha
0.5
- 1.
0 h
a1.
0 -
1.5
ha
1.5
- 2.
0 h
a2.
0 -
3.0
ha
3.0
- 5.
0 h
a5.
0-7.
0ha
7.0-
10.0
ha
>10.
0ha
Agr
icul
tura
l inc
ome
11 8
153
634
6 06
29
706
13 5
8116
627
19 6
1022
303
30 2
0128
354
Non
farm
inco
me
9 88
413
246
10 9
8910
110
8 21
37
482
8 18
19
561
10 3
224
868
Tra
nsfe
rred
inco
me
4 07
83
678
4 31
64
110
3 88
03
310
4 73
23
835
5 67
95
776
Irre
gula
r in
com
e4
725
4 48
64
262
4 68
84
579
5 76
34
904
4 30
94
956
5 23
8
Far
m h
ouse
hold
inco
me
30 5
0325
045
25 6
2928
614
30 2
5333
181
37 4
2740
007
51 1
5844
235
Sha
re o
f agr
icul
tura
l inc
ome
in to
tal i
ncom
e (%
)39
1524
3445
5052
5659
64
Tax
es a
nd p
ublic
cha
rges
7 27
14
808
6 18
78
141
7 37
87
546
10 4
5883
5753
6999
30
Dis
posa
ble
inco
me
23 2
3220
237
19 4
4220
473
22 8
7525
636
26 9
6931
471
45 7
8934
306
Sou
rce:
MA
F (
2006
), S
tatis
tical
Yea
rboo
k of
Agr
icul
ture
and
For
estr
y 20
06, S
eoul
.

90 –
Ann
ex T
able
s
EV
AL
UA
TIO
N O
F A
GR
ICU
LT
UR
AL
PO
LIC
Y R
EFO
RM
S IN
KO
RE
A ©
OE
CD
200
8
An
nex
Tab
le I.
14. D
istr
ibu
tio
n o
f h
ou
seh
old
inco
me
by
the
typ
e o
f sp
ecia
lizat
ion
in a
gri
cult
ure
, 200
5
(Ave
rag
e p
er h
ou
seh
old
in '0
00 K
RW
)
Sp
ecia
lizd
F.H
. 1G
ener
al F
.H. 2
Sid
e-B
usi
nes
s F
.H.
3S
elf
Su
ffic
ien
t F
.H. 4
Agr
icul
tura
l inc
ome
25 5
778
049
2 95
148
7
Non
agr
icul
ture
inco
me
4 63
52
322
24 8
7415
238
Tra
nsfe
rred
inco
me
3 77
54
639
3 70
84
026
Far
m h
ouse
hold
inco
me
38 4
9719
283
37 4
8222
600
Sha
re o
f agr
icul
tura
l inc
ome
in to
tal i
ncom
e (%
)66
428
2
Non
con
sum
ptio
n ex
pend
iture
8 13
85
719
8 58
54
793
1.
Far
m h
ouse
hold
s w
ith f
arm
siz
e la
rger
tha
n 3
ha o
r w
ith a
nnua
l sa
les
of m
ore
than
KR
W 2
0 m
illio
n, a
nd w
hose
agr
icul
tura
l in
com
e ex
ceed
s no
n ag
ricul
tura
l in
com
e.
2.
Far
m h
ouse
hold
s w
ith f
arm
siz
e be
twee
n 0.
3 -
3ha
and
annu
al s
ales
bet
wee
n K
RW
2 m
illio
n -
KR
W 2
0 m
illio
n, a
nd w
hose
agr
icul
tura
l in
com
e ex
ceed
s no
n ag
ricul
tura
l inc
ome.
3.
Far
m h
ouse
hold
s w
ith f
arm
siz
e 0.
3 ha
or
larg
er o
r an
nual
sal
es m
ore
than
KR
W 2
mill
ion,
and
who
se a
gric
ultu
ral
inco
me
is s
mal
ler
than
non
agr
icul
tura
l in
com
e.
4. F
arm
hou
seho
lds
with
farm
siz
e is
sm
alle
r th
an 0
.3 h
a an
d w
hose
ann
ual s
ales
is le
ss th
an K
RW
2 m
illio
n.
Sou
rce:
MA
F (
2006
), S
tatis
tical
Yea
rboo
k of
Agr
icul
ture
and
For
estr
y 20
06, S
eoul
.

Ann
ex T
able
s – 91
E
VA
LU
AT
ION
OF
AG
RIC
UL
TU
RA
L P
OL
ICY
RE
FOR
MS
IN K
OR
EA
–©
OE
CD
200
8
An
nex
Tab
le I.
15.
Co
nsu
mp
tio
n p
er c
apit
a
(K
g)
1970
1975
1980
1985
1990
1995
2000
2005
2005
/199
0(%
)
Fo
od
cro
ps
219.
420
7.3
195.
218
1.7
167.
016
0.5
153.
313
5.5
-18.
9
Ric
e13
6.4
123.
613
2.4
128.
111
9.6
106.
593
.680
.7-3
2.5
Whe
at26
.129
.529
.432
.129
.833
.935
.931
.86.
7
Veg
etab
les
59.9
62.5
120.
398
.613
2.6
160.
616
5.9
144.
99.
3
Fru
its13
.115
.022
.336
.041
.854
.858
.462
.750
.0
Liv
esto
ck (
reta
il w
eig
ht
equ
ival
ent)
M
eat
5.2
6.4
11.3
14.4
19.9
27.4
31.9
31.9
60.3
Bee
f1.
22.
02.
62.
94.
16.
78.
56.
763
.4
Por
k2.
62.
86.
38.
411
.814
.816
.517
.850
.8
Chi
cken
mea
t1.
41.
62.
43.
14.
06.
06.
97.
587
.5
D
airy
Pro
du
cts
n.a.
n.a.
10.8
23.8
42.8
47.8
59.2
62.7
46.5
Flu
id m
ilkn.
a.n.
a.7.
218
.131
.234
.835
.635
.012
.2
Pro
cess
ed m
ilkn.
a.n.
a.3.
65.
712
.612
.723
.627
.711
9.7
E
gg
s 4.
24.
66.
57.
29.
210
.110
.112
.131
.5
Sou
rce:
MA
F, M
ain
Agr
icul
tura
l Ind
icat
ors,
var
ious
yea
rs, S
eoul
.

92 – Annex Tables
EVALUATION OF AGRICULTURAL POLICY REFORMS IN KOREA © OECD 2008
Annex Table I.16. mports and exports of agricultural products1
(Millions USD)
Exports (A) Imports (B) Balance (A-B)
Total All grains Vegetables Fruits Livestock
1992 775 4 278 1 336 71 256 874 -3 503
1993 784 4 471 1 782 66 192 632 -3 687
1994 951 5 408 1 937 152 250 932 -4 457
1995 1 237 6 762 2 273 132 315 1 224 -5 525
1996 1 416 8 107 3 239 175 323 1 240 -6 691
1997 1 508 7 609 2 566 180 347 1 324 -6 101
1998 1 391 5 420 2 111 138 194 756 -4 029
1999 1 411 5 927 1 931 175 286 1 245 -4 516
2000 1 255 6 781 1 958 187 349 1 676 -5 526
2001 1 370 6 792 1 946 192 354 1 466 -5 422
2002 1 473 7 650 2 056 195 419 1 948 -6 177
2003 1 683 8 328 2 285 279 507 2 116 -6 645
2004 1 921 9 200 2 882 361 564 1 755 -7 279
2005 2 072 9 758 2 535 381 616 2 360 -7 686
1. Agricultural products in this table does not include forest products
Source: MAF, Database on Trade in Agriculture, Seoul.

Ann
ex T
able
s – 93
E
VA
LU
AT
ION
OF
AG
RIC
UL
TU
RA
L P
OL
ICY
RE
FOR
MS
IN K
OR
EA
–©
OE
CD
200
8
An
nex
Tab
le I.
17.
Tra
de
('000
Ton
nes)
Yea
r 119
7019
7519
8019
8519
9019
9520
0020
05
Imp
ort
s
Ric
e254
148
158
00
00
112
214
Whe
at1
254
1 58
41
810
2 99
62
239
2 81
03
357
3 55
4
Mai
ze28
453
22
234
3 03
56
198
8 62
08
907
8 48
9
Bar
ley
035
40
064
200
182
213
Soy
bean
3661
417
885
1 09
21
360
1 59
01
254
Dai
ry p
rodu
cts
00
02
766
141
178
Bee
f and
vea
l0
00
011
716
926
419
6
Por
k0
00
03
5314
527
9
Pou
ltry
n.a.
n.a.
00
06
6859
Egg
s0
00
00
11
1
Exp
ort
s P
ork
00
00
715
2415
n.a.
: no
t ava
ilabl
e.
1.
Gra
in:
mar
ketin
g ye
ars
Nov
./Oct
. (19
80 =
Nov
. 197
9 to
Oct
ober
198
0);
lives
tock
: ca
lend
ar y
ears
.
2.
The
re w
ere
no im
port
s of
ric
e du
ring
the
mar
ketin
g ye
ar 1
995,
bec
ause
the
min
imum
acc
ess
quan
titie
s, d
efin
ed in
cal
enda
r ye
ars,
wer
e im
port
ed a
fter
Nov
embe
r 19
95 a
nd
are
ther
efor
e ac
coun
ted
for
in th
e m
arke
ting
year
199
6.
Sou
rce:
MA
F, D
atab
ase
on T
rade
in A
gric
ultu
re, S
eoul
.

94 –
Ann
ex T
able
s
EV
AL
UA
TIO
N O
F A
GR
ICU
LT
UR
AL
PO
LIC
Y R
EFO
RM
S IN
KO
RE
A ©
OE
CD
200
8
An
nex
Tab
le I.
18.
Co
ntr
ibu
tio
n o
f th
e A
gro
-fo
od
Sec
tor
to t
he
Eco
no
my
Un
its
1975
1980
1985
1990
1995
2000
2005
To
tal G
DP
Tri
llio
n K
RW
10.4
38.8
84.1
186.
739
8.8
578.
781
0.5
Agr
icul
ture
, For
estr
y, F
ishe
ries
Tril
lion
KR
W2.
65.
610
.215
.022
.825
.024
.6
-
Agr
icul
ture
Tril
lion
KR
W2.
34.
88.
713
.019
.921
.721
.8
Man
ufac
turin
g in
dust
ries
Tril
lion
KR
W2.
08.
420
.545
.799
.415
1.2
204.
7
-
Foo
d pr
oces
sing
indu
strie
s1T
rillio
n K
RW
0.6
2.1
3.9
6.9
10.3
10.5
12.4
Sh
are
in t
ota
l GD
P
Agr
icul
ture
, For
estr
y, F
ishe
ries
%27
.116
.213
.58.
96.
34.
93.
4
-
Agr
icul
ture
%24
.013
.811
.67.
85.
54.
22.
9
Man
ufac
turin
g in
dust
ries
%21
.624
.427
.327
.327
.629
.428
.4
-
Foo
d pr
oces
sing
indu
strie
s1%
5.8
5.4
4.6
3.7
2.6
1.8
1.5
Em
plo
ymen
t'0
0011
691
13 6
8314
970
18 0
8520
414
21 1
5622
856
Agr
icul
ture
, For
estr
y, F
ishe
ries
'000
5 33
94
654
3 73
33
237
2 40
322
4318
15
-
Agr
icul
ture
, For
estr
y'0
005
041
4 42
93
554
3 10
02
289
3 16
21
747
Man
ufac
turin
g in
dust
ries
'000
1 42
02
014
2 43
73
019
2 95
126
5228
65
-
Foo
d pr
oces
sing
indu
strie
s1'0
0014
518
119
120
921
118
018
8
Sh
are
in t
ota
l em
plo
ymen
t
Agr
icul
ture
, For
estr
y, F
ishe
ries
%45
.734
.024
.917
.911
.810
.67.
9
-
Agr
icul
ture
, For
estr
y%
43.1
32.4
23.7
17.1
11.2
10.2
7.6
Man
ufac
turin
g in
dust
ries
%12
.114
.716
.316
.714
.512
.512
.5
- F
ood
proc
essi
n g in
dust
ries1
%1.
21.
31.
31.
21.
00.
90.
8
n.a.
: no
t ava
ilabl
e. 1
. In
clud
ing
toba
cco.
S
ourc
es:
Nat
iona
l Sta
tistic
al O
ffice
(20
06),
Maj
or S
tatis
tics
of K
orea
n E
cono
my
2006
, Seo
ul.
N
atio
nal S
tatis
tical
Offi
ce (
2006
), R
epor
t on
Min
ing
and
Man
ufac
turin
g S
urve
y 20
06, S
eoul
.
Nat
iona
l Sta
tistic
al O
ffice
, Ann
ual R
epor
t on
the
Eco
nom
ical
ly A
ctiv
e P
opul
atio
n S
urve
y, v
ario
us y
ears
, Seo
ul.
M
AF
, Sta
tistic
al Y
earb
ook
of A
gric
ultu
re a
nd F
ores
try,
var
ious
yea
rs, S
eoul
.
Ban
k O
f Kor
ea, N
atio
nal A
ccou
nt, v
ario
us y
ears
, Seo
ul.

Ann
ex T
able
s – 95
E
VA
LU
AT
ION
OF
AG
RIC
UL
TU
RA
L P
OL
ICY
RE
FOR
MS
IN K
OR
EA
–©
OE
CD
200
8
An
nex
Tab
le I.
19. C
har
acte
rist
ics
of
Fo
od
Pro
cess
ing
Ind
ust
ries
1
Un
its
1975
1980
1985
1990
1995
2000
2005
Num
ber
of fi
rms
3
865
4 59
54
637
4 65
46
250
6 42
18
389
Num
ber
of e
mpl
oyee
s'0
0013
4.4
168.
218
5.8
207.
020
6.2
177.
718
5.9
Gro
ss s
ales
Bill
ion
KR
W1
111
3 86
17
676
14 7
1126
222
37 2
0048
264
Val
ue-a
dded
Bill
ion
KR
W36
41
274
4 05
45
617
10 8
7315
745
19 0
76
1. F
ood
excl
udin
g to
bacc
o.
Sou
rce:
Nat
iona
l Sta
tistic
al O
ffice
, Rep
ort o
n M
inin
g an
d M
anuf
actu
ring
Sur
vey,
var
ious
yea
rs, S
eoul
.
.

96 – Annex Tables
EVALUATION OF AGRICULTURAL POLICY REFORMS IN KOREA © OECD 2008
Annex Table I.20. Production of upstream and downstream industries, 2005
(Billion KRW)
Gross output
Upstream industries
Fertilisers n.a.
Chemicals 1 044
Feedstuffs 4 755
Machinery 207
Other inputs n.a.
Total n.c.
Downstream industries
Food 48 399
Grains 4 933
Bakery/noodles 3 142
Edible oils 733
Sugar and confectionary 638
Fruits and vegetables 1 439
Dairy products 5 614
Meat 6 191
Marine products 3 118
Preparations 588
Others n.a.
Beverages 6 469
Total n.c.
n.a.: not available. n.c.: not computable.
Source: National Statistical Office, Report on Mining and Manufacturing Survey 2006, Seoul.

Ann
ex T
able
s – 97
E
VA
LU
AT
ION
OF
AG
RIC
UL
TU
RA
L P
OL
ICY
RE
FOR
MS
IN K
OR
EA
–©
OE
CD
200
8
An
nex
Tab
le I.
21.
Nu
mb
er o
f C
o-o
per
ativ
es
1975
1980
1985
1990
1995
2000
2005
Tot
al n
umbe
r of
co-
oper
ativ
es1
588
1 52
71
656
1 63
51
591
1 37
31
298
In th
e N
AC
F1
588
1 52
71
505
1 46
81
401
1 18
01
137
G
ener
al-p
urpo
se
1 54
51
485
1 46
41
425
1 35
61
132
1 08
8
S
peci
alis
ed43
4241
4345
4849
In th
e N
LCF
1n.
a.n.
a.15
116
719
019
314
9
G
ener
al-p
urpo
se
n.a.
n.a.
137
144
146
146
124
S
peci
alis
edn.
a.n.
a.14
2344
4725
n.a.
: no
t app
licab
le.
1. T
he N
LCF
was
cre
ated
in 1
981.
Sou
rce:
NA
CF
and
NLC
F.

98 – References
EVALUATION OF AGRICULTURAL POLICY REFORMS IN KOREA OECD 2008
REFERENCES
Ahn, Byeongil, Hyunok Lee, Joo-Ho Song (2006), Analysis of Korean Dairy Industry, Korea Rural Economic Institute, 2006, Seoul, Korea.
Bank of Korea (2006a), Economic Statistics Yearbook 2006, Seoul, Korea
Bank of Korea (2006b), National Account 2006, Seoul, Korea
KIEP, KLI, KIET, KREI, KMI, KISDI, KBC, KCTI, KIF, KHIDI, and KDI. (2007), Analysis on the economic effects of FTA with the United States, Seoul, Korea
Kim, Chang-Gil (2007a), Policies on environmentally friendly agricultural practices in developed countries and their policy implications for Korea, Korea Rural Economic Institute, Seoul, Korea.
Kim, Chang-Gil (2007b), Strategy for environmentally friendly agriculture in Korea, Korea Rural Economic Institute, Seoul, Korea.
Kim, Yeon, David Barrett, and Jammie Penm (2007), Korean agriculture – implications of structural change for Australian agriculture in ABARE, Australian Commodities, vol. 14, no 3, September quarter, Canberra, Australia
KREI (1999), Agriculture in Korea, Korea Rural Economic Institute, Seoul, Korea
KREI (2006), Outlook of Korean agriculture in 2006, Korea Rural Economic Institute, Seoul, Korea.
MAF (1997), White paper on agricultural policy reforms in Korea , Seoul, Korea.
MAF (2005a), Manual on the implementation of agricultural projects, Seoul, Korea.
MAF (2005b), Korean Agriculture, Seoul, Korea.
MAF (2006a), Statistical Yearbook of Agriculture and Forestry, Seoul, Korea.
MAF (2006b), Major statistics of Korean Agriculture and Forestry, Seoul, Korea.
National Statistical Office (2006a), Major Statistics of Korean Economy, Seoul, Korea.
National Statistical Office (2006b), Report on Mining and Manufacturing Survey, Seoul, Korea.
OECD (1998), Review of Agricultural Policies in Korea, Paris.
OECD (2001), Decoupling : A conceptual overview, OECD Papers Volume 5, No.11, Paris.
OECD (2002), Agricultural policies in OECD countries. A positive reform agenda, Paris.
OECD (2003a), Farm household income: issues and policy responses, Paris.
OECD (2003b), Multifunctionality: the policy implications, Paris.
OECD (2006a), Special issue on decoupling and agricultural support, OECD Papers, Vol. 5, No. 11, Paris.

References – 99
EVALUATION OF AGRICULTURAL POLICY REFORMS IN KOREA –© OECD 2008
OECD (2006b), Coherence of agricultural and rural development policies, Paris.
OECD (2006c), Agricultural policies in OECD countries: At a glance 2006, Paris.
OECD (2006d), Agricultural and fisheries policies in Mexico, Paris.
OECD (2006e), Adjustment options and strategies in the context of agricultural policy reform and trade liberalisation, AGR/CA/APM(2005)18/FINAL, Paris.
OECD (2007a), Effective targeting of agricultural policies: Best practices for policy design and implementation, Paris.
OECD (2007b), The role of compensation in policy reform, AGR/CA/APM/WP(2007)7, Paris.
OECD (2007c), The implementation costs of agricultural policies, Paris.
OECD (2007d), Agricultural support, farm land values and sectoral adjustment; implications for policy reform, AGR/CA/APM(2006)19/FINAL, Paris.
OECD (2007e), OECD Economic Survey of Korea 2007, Paris.
OECD (2008), Environmental Performance of OECD Agriculture since 1990: Main Report, Paris.
Song, Joo-Ho, Min-Kook Jeong, Hyun-Joong Kim, Hyun-Ok Lee, and Byeong-Il Ahn (2005), A study on the prospectives and policy alternatives for dairy demand and supply, KREI working paper series No. R495, Korea Rural Economic Institute, Seoul, Korea.
Sung, Myeong Hwan, Ho-Sup Yoon, Hyeong-Young Kim (2003), A study on the development of policy evaluation model for Korean rice policy, KREI Working Paper Series No. R454, Korea Rural Economic Institute, Seoul, Korea.
Tangermann, Stefan (2005), Is the Concept of the Producer Support Estimate in Need of Revision?, OECD Food, Agriculture and Fisheries Working Papers N°1, Paris.

OECD PUBLICATIONS, 2, rue André-Pascal, 75775 PARIS CEDEX 16
PRINTED IN FRANCE
(00 2008 38 1 P1) – No. 88717 2008

Evaluation of Agricultural Policy Reforms in Korea
www.oecd.org
Evaluation of Agricultural Policy Reforms in Korea
«E
valuation o
f Ag
ricultural Po
licy Refo
rms in K
orea