Embed Size (px)
Citation preview
Evaluation of Affymetrix array normalization procedures based on spiked cRNAs
Andrew Hill
Expression Profiling Informatics
Genetics Institute/Wyeth-Ayerst Research
October 11, 2001 2
Outline
• The GI/Harvard C. elegans array dataset as a normalization testbed
• Some general challenges of array data reduction• GeneChip Scaled Average Difference (ADs)
– the constant mean assumption• A purely spike-based normalization strategy
(Frequency)• A hybrid normalization (Scaled Frequency)• Conclusions
October 11, 2001 3
GI/Harvard C. elegans dataset• This data set used to evaluate several normalization procedures• Experiments:
– 8 developmental stages of the worm C. elegans were profiled, ranging from egg to adult worm
– n=2-4 replicate hybridizations for most array designs at most stages– 52 total arrays
• Arrays:– Three custom worm GeneChip designs (A, B, and C)– Each array monitors between 5700-6700 ORFs, in aggregate ~98% of the
worm genome– Chip A: ORFs with cDNA/EST matches in AceDB– Chips B/C: other ORFs– Several worm ORFs tiled on all 3 arrays for across-array-design comparisons
Science 290 809-812; Genome Biology (in the press)
October 11, 2001 4
Some challenges of Affymetrix GeneChip data reduction
• Array data from Affymetrix GeneChip sofware (pre-MAS 5.0):– negative low intensity signals
– lack of across-design normalization standard
– limited QC information
• Spike-based normalization methods can help to address each of these challengesNormalization: array scaling of average difference data from multiple
arrays/designs to minimize technical noise among arrays
• Current “standard” normalization procedure is a global scaling procedure: the GeneChip scaled average difference (ADs)
October 11, 2001 5
GeneChip Scaled Average Difference (ADs)
• The trimmed (2%) mean intensity of all probesets on all arrays is scaled to a constant target level.
• Works well in many cases (e.g. replicates)
• Some obvious situations where the “constant mean assumption” may not be well supported.
October 11, 2001 6
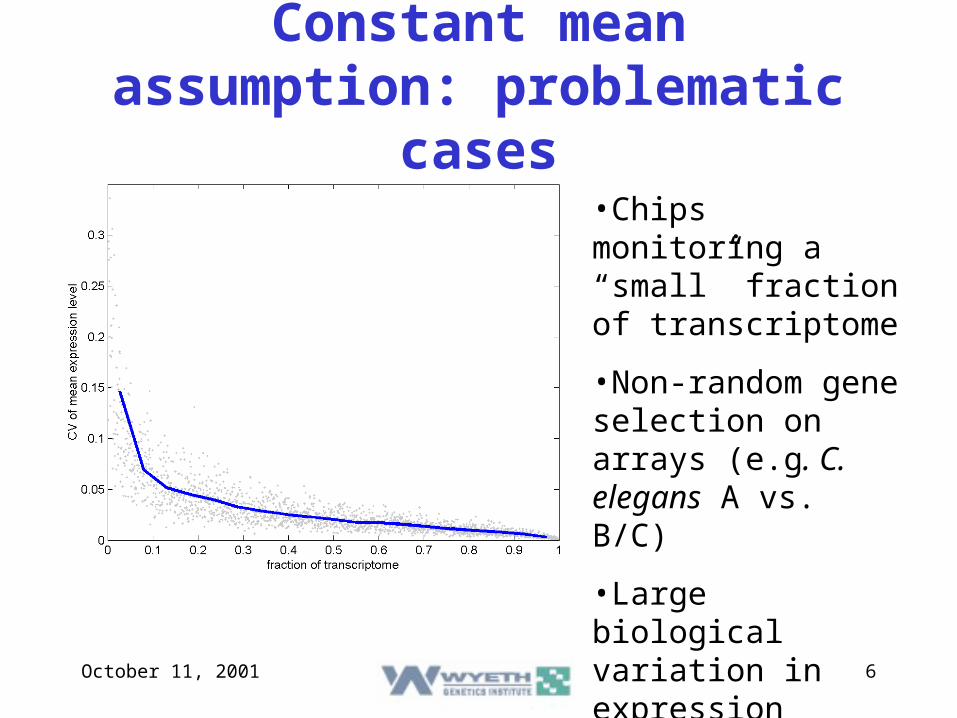
Constant mean assumption: problematic cases
•Chips monitoring a “small” fraction of transcriptome
•Non-random gene selection on arrays (e.g. C. elegans A vs. B/C)
•Large biological variation in expression
October 11, 2001 7
A cRNA spike-based normalization procedure (Frequency)
• Add 11 biotin-labeled cRNA spikes to each hybridization cocktail
• Construct a calibration curve• Use the Absent/Present calls for the
spikes to estimate array sensitivity• Dampen AD signals below the sensitivity
level to eliminate negative AD values.
October 11, 2001 8
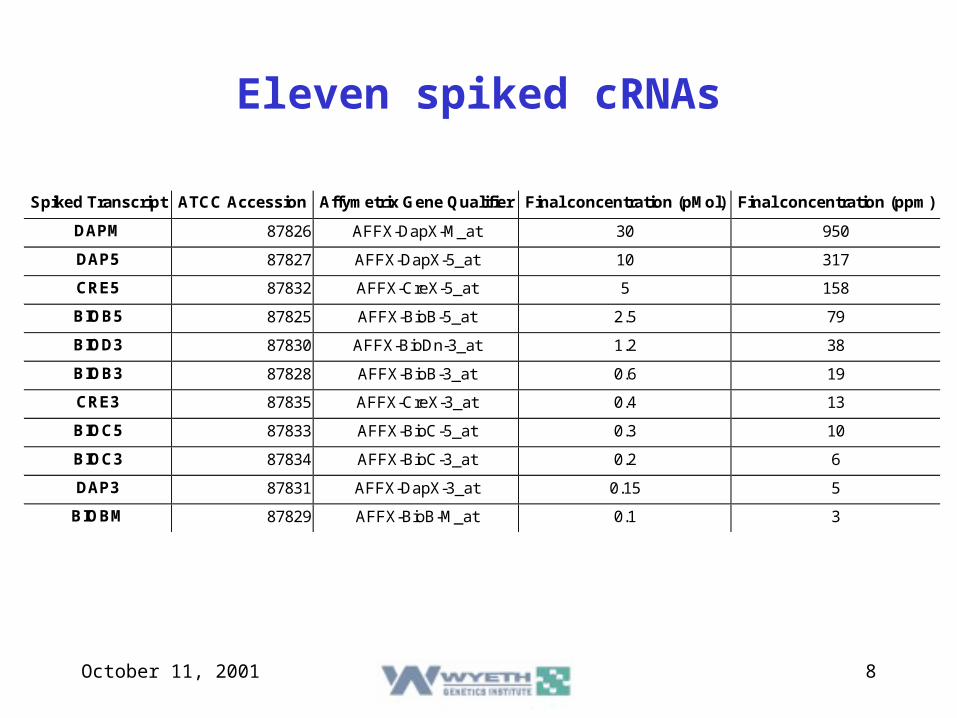
Spiked Transcript ATCC Accession Affymetrix Gene Qualifier Final concentration (pMol) Final concentration (ppm)
DAPM 87826 AFFX-DapX-M_at 30 950
DAP5 87827 AFFX-DapX-5_at 10 317
CRE5 87832 AFFX-CreX-5_at 5 158
BIOB5 87825 AFFX-BioB-5_at 2.5 79
BIOD3 87830 AFFX-BioDn-3_at 1.2 38
BIOB3 87828 AFFX-BioB-3_at 0.6 19
CRE3 87835 AFFX-CreX-3_at 0.4 13
BIOC5 87833 AFFX-BioC-5_at 0.3 10
BIOC3 87834 AFFX-BioC-3_at 0.2 6
DAP3 87831 AFFX-DapX-3_at 0.15 5
BIOBM 87829 AFFX-BioB-M_at 0.1 3
Eleven spiked cRNAs
October 11, 2001 9
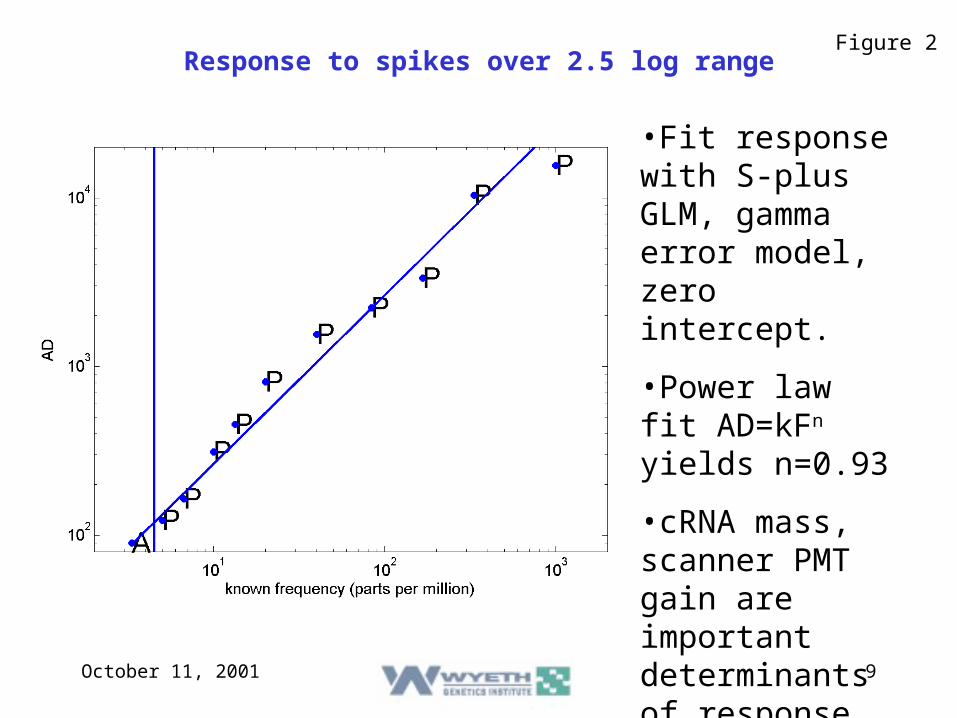
Figure 2Response to spikes over 2.5 log range
•Fit response with S-plus GLM, gamma error model, zero intercept.
•Power law fit AD=kFn yields n=0.93
•cRNA mass, scanner PMT gain are important determinants of response
October 11, 2001 10
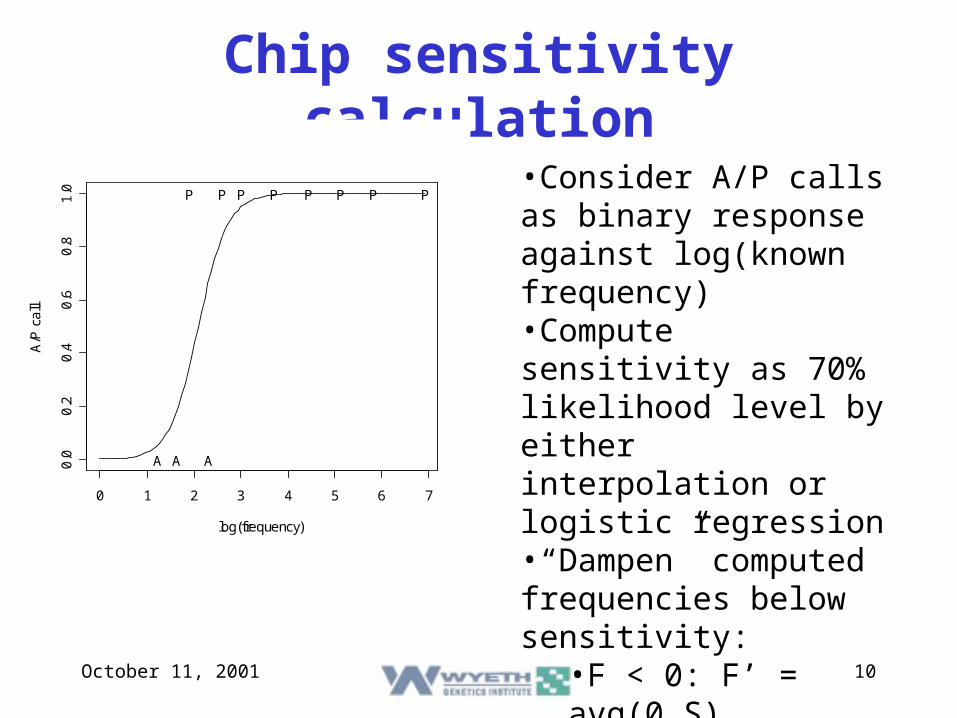
Chip sensitivity calculation
0 1 2 3 4 5 6 7
0.0
0.2
0.4
0.6
0.8
1.0
log(frequency)
A/P
ca
ll
PPPPPPP
A
P
AA
•Consider A/P calls as binary response against log(known frequency)•Compute sensitivity as 70% likelihood level by either interpolation or logistic regression•“Dampen” computed frequencies below sensitivity:
•F < 0: F’ = avg(0,S)•0<F<S: F’=avg(F,S)

October 11, 2001 11
How well does it work?
October 11, 2001 12
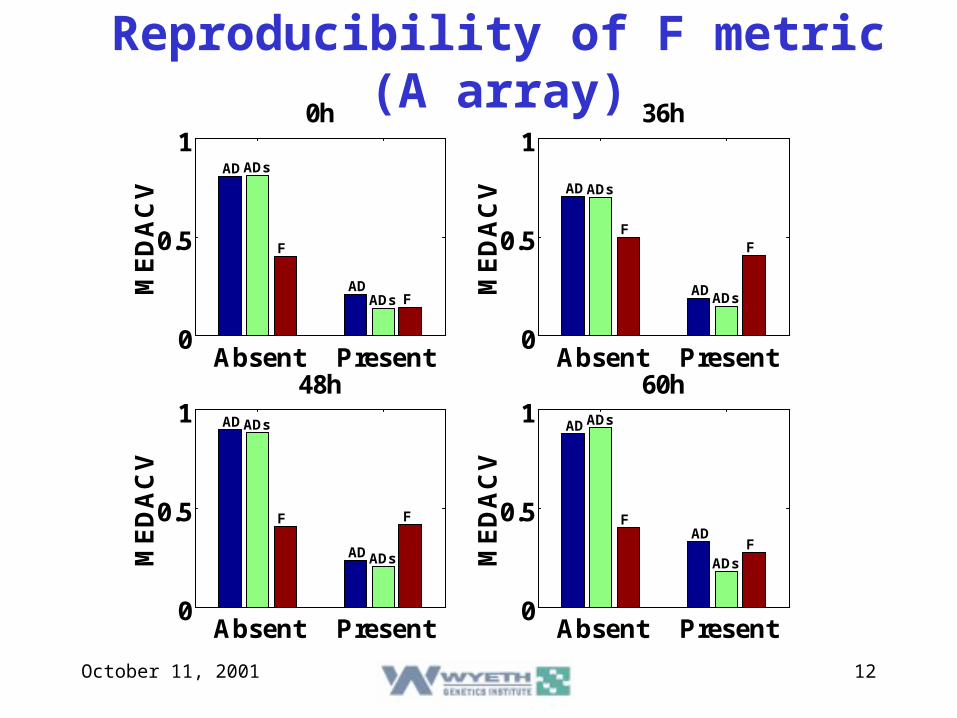
Reproducibility of F metric (A array)
Absent Present0
0.5
1ADADs
F
ADADs F
0hM
ED
AC
V
Absent Present0
0.5
1
ADADs
F
ADADs
F
36h
ME
DA
CV
Absent Present0
0.5
1 ADADs
F
ADADs
F
48h
ME
DA
CV
Absent Present0
0.5
1ADADs
FAD
ADsF
60h
ME
DA
CV
October 11, 2001 13
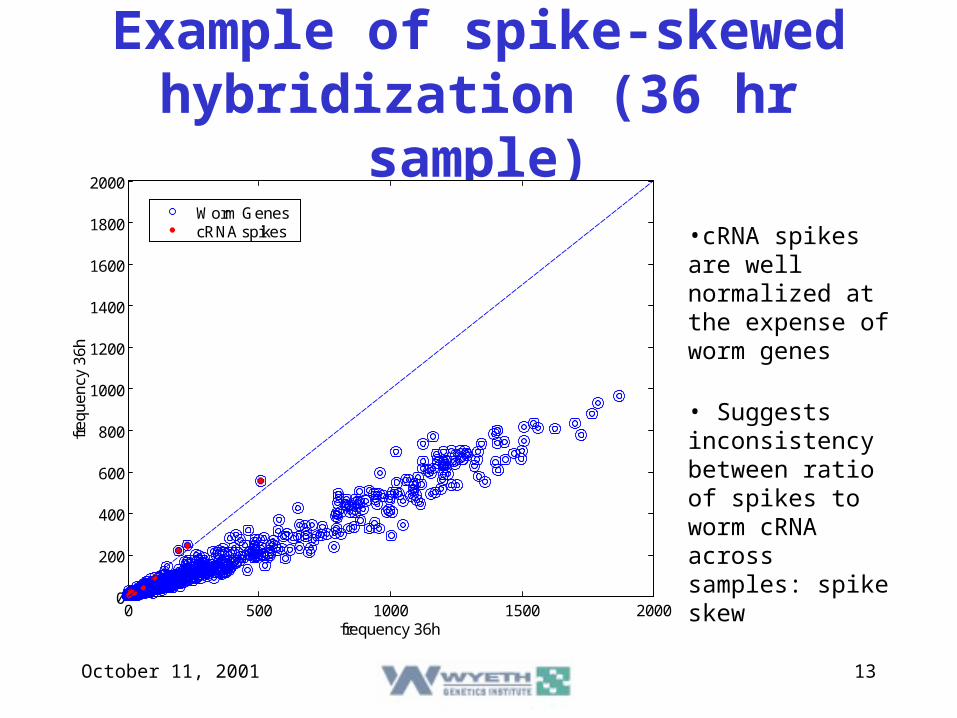
Example of spike-skewed hybridization (36 hr sample)
0 500 1000 1500 20000
200
400
600
800
1000
1200
1400
1600
1800
2000
frequency 36h
freq
uenc
y 36
h
Worm GenescRNA spikes •cRNA spikes are
well normalized at the expense of worm genes
• Suggests inconsistency between ratio of spikes to worm cRNA across samples: spike skew
October 11, 2001 14
Sources of spike skew• Actual concentration of spikes may not be
nominal due to variation in cRNA “purity”
• Causes: liquid handling of small microlitre volumes, side reactions in cDNA/IVT process produce UV-absorbing, non-hybridizable contaminants
• Result: random per-hybe noise term introduced into normalized frequencies
October 11, 2001 15
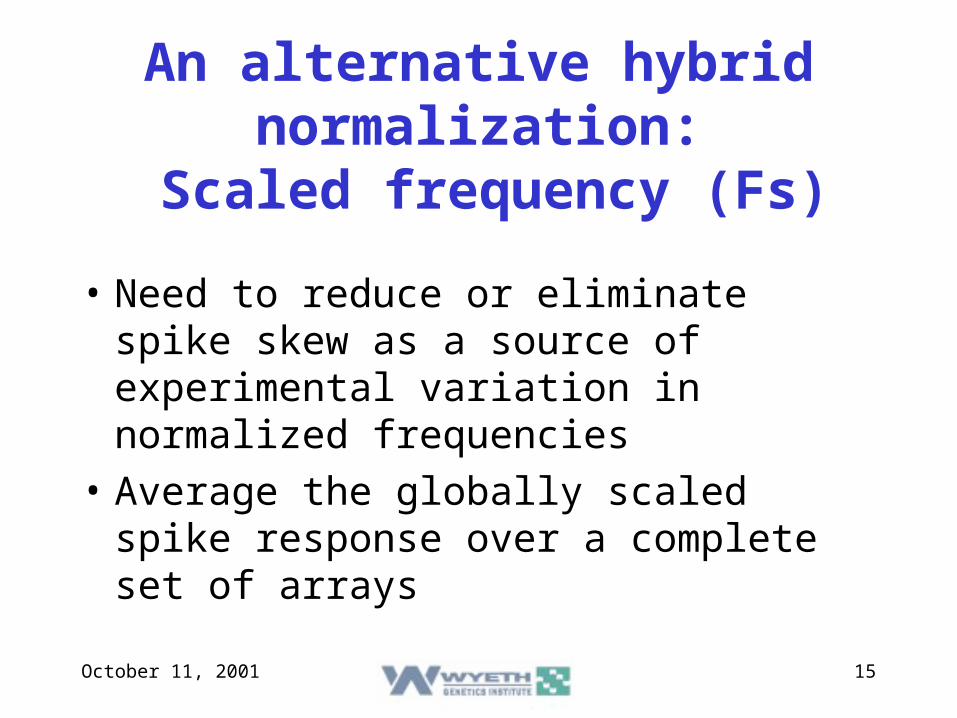
An alternative hybrid normalization:
Scaled frequency (Fs)
• Need to reduce or eliminate spike skew as a source of experimental variation in normalized frequencies
• Average the globally scaled spike response over a complete set of arrays
October 11, 2001 16
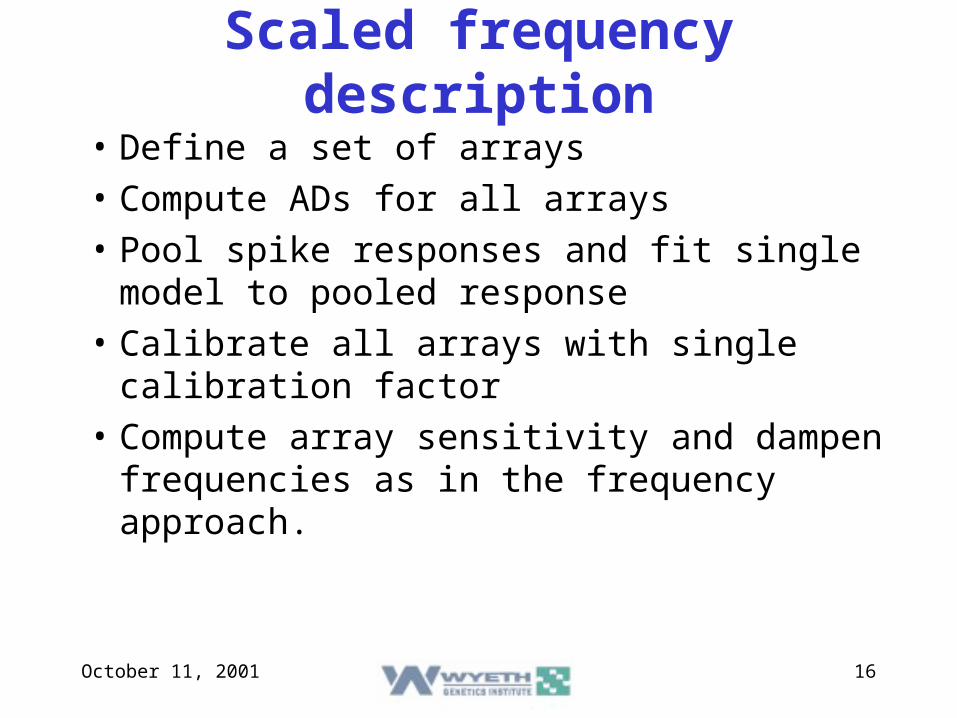
Scaled frequency description
• Define a set of arrays
• Compute ADs for all arrays
• Pool spike responses and fit single model to pooled response
• Calibrate all arrays with single calibration factor
• Compute array sensitivity and dampen frequencies as in the frequency approach.
October 11, 2001 17
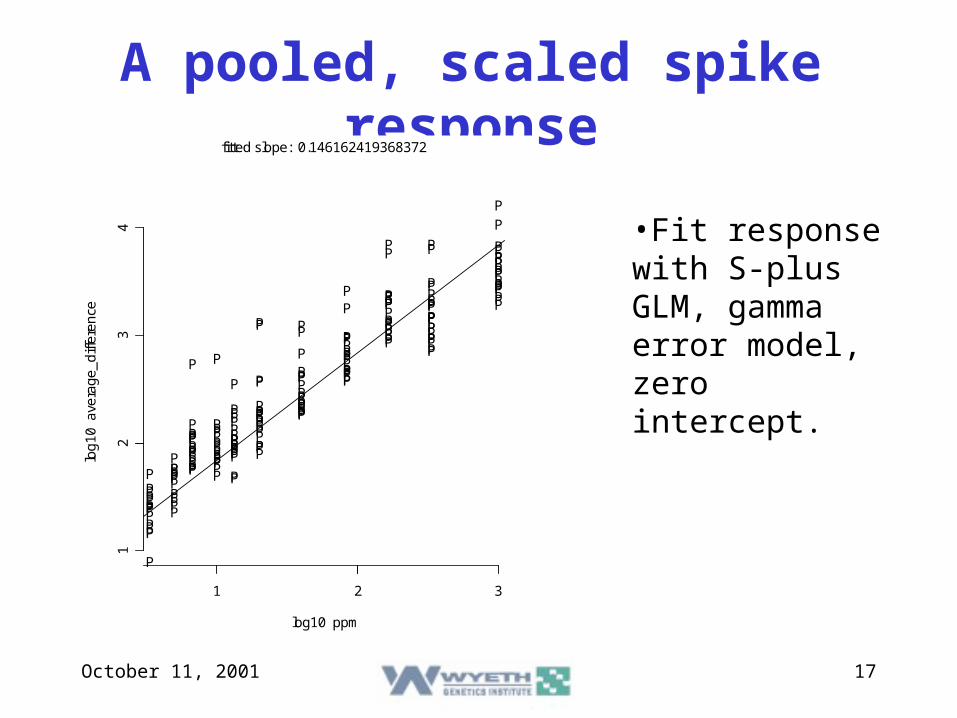
A pooled, scaled spike response
P
PP
PPP
P
PP
P
PP
PPP
P
P
P
PP
P
PP
PP
P
P
P
PP
P
PP
P
PP
P
P
P
PP
P
P
PP
PP
P
P
P
PP
PP
PPP
PP
P
P
PP
P
P
P
PPP
P
PP
P
P
P
P
PP
P
P
PP
P
P
PPPP
PP
P
PP
P
PP
PP
P
P
P
PP
P
PP
PPP
P
P
P
PP
P
P
P
PPP
P
P
PP
P
P
PP
PP
P
P
P
PP
P
P
PPP
P
P
P
P
PP
P
PP
PPP
PP
P
PP
P
P
PPP
P
P
P
PP
P
P
PPPP
P
P
PP
P
P
PPPP
P
P
P
PP
P
PP
P
PP
P
PP
P
PP
PPP
P
P
P
PP
P
PP
PPP
P
P
1 2 3
12
34
log10 ppm
log
10
ave
rag
e_
diff
ere
nce
fitted slope: 0.146162419368372
•Fit response with S-plus GLM, gamma error model, zero intercept.
October 11, 2001 18
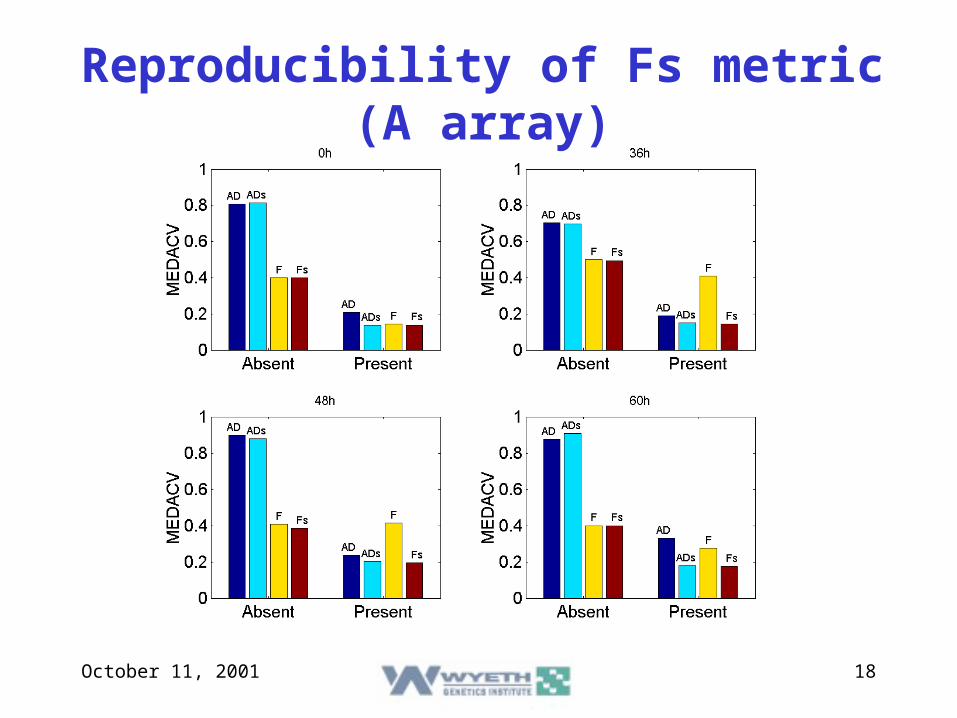
Reproducibility of Fs metric (A array)
October 11, 2001 19
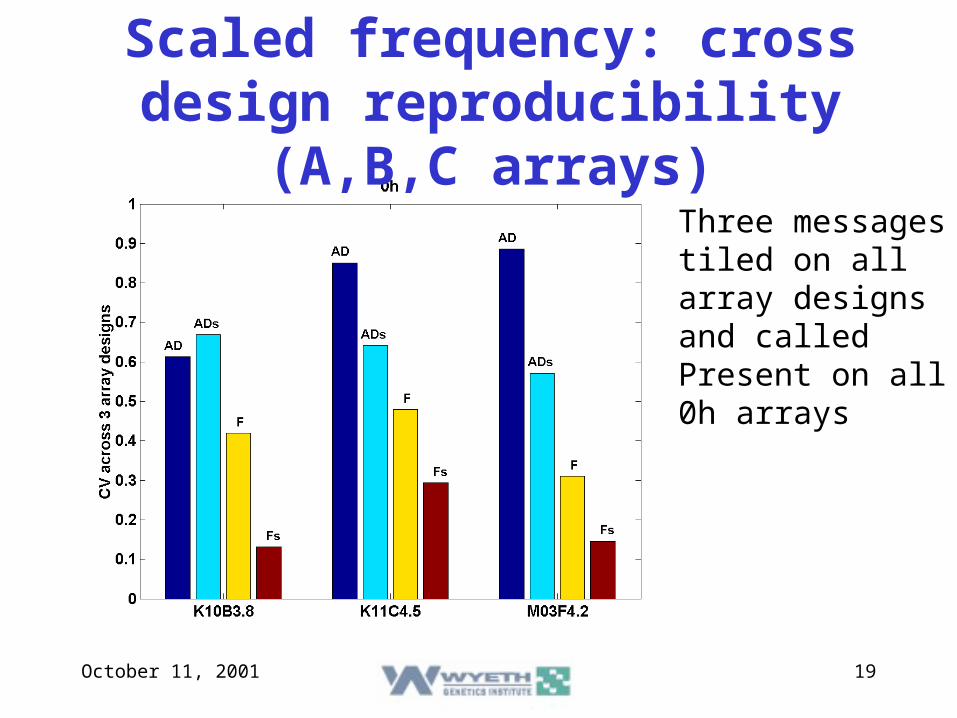
Scaled frequency: cross design reproducibility (A,B,C arrays)
Three messages tiled on all array designs and called Present on all 0h arrays
October 11, 2001 20
Conclusions
• Array response to spiked cRNAs can be close to linear over 2.5 logs of concentration.
• A chip sensitivity metric can be computed from Absolute Decisions associated with spikes; a very useful QC metric.
• Normalization based only on spikes performs inconsistently in some cases due to ill-quantitation of cRNAs, but can still be valuable when constant-mean assumption is violated. Better cRNA quantitation and process control will help.
• A hybrid approach based on global scaling and spikes performs the same as global AD scaling for single designs, and also allows cross-design comparisons

October 11, 2001 21
Acknowledgements
• Donna Slonim
• Maryann Whitley
• Yizheng Li
• Bill Mounts
• Scott Jelinsky
• Gene Brown
Harvard University:•Craig Hunter•Ryan Baugh
October 11, 2001 22
Extra slides follow ( not part of presentation)
October 11, 2001 23
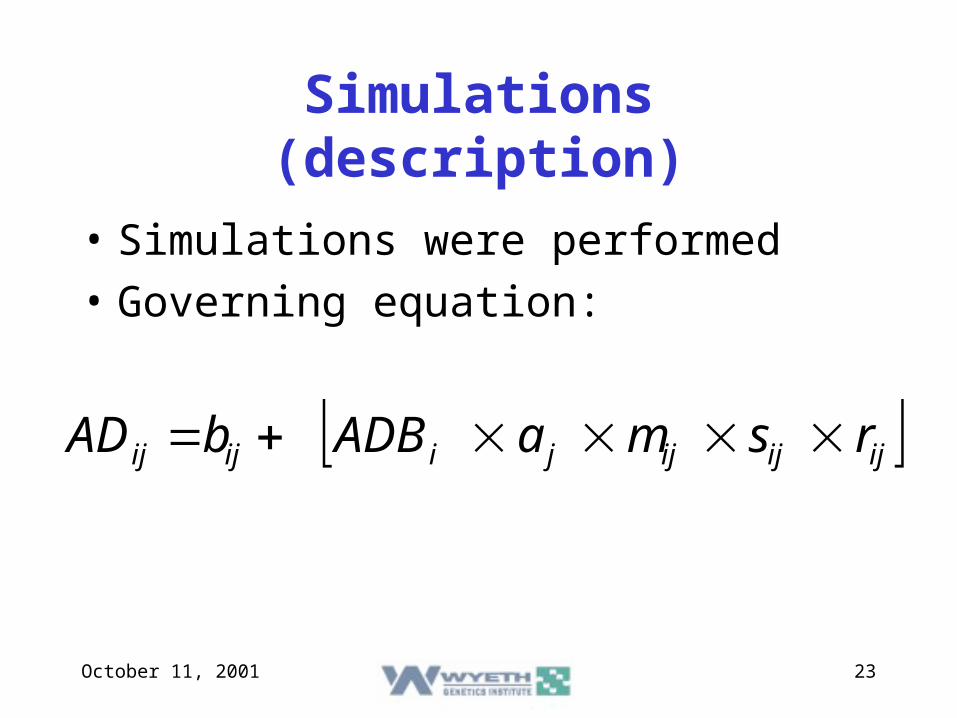
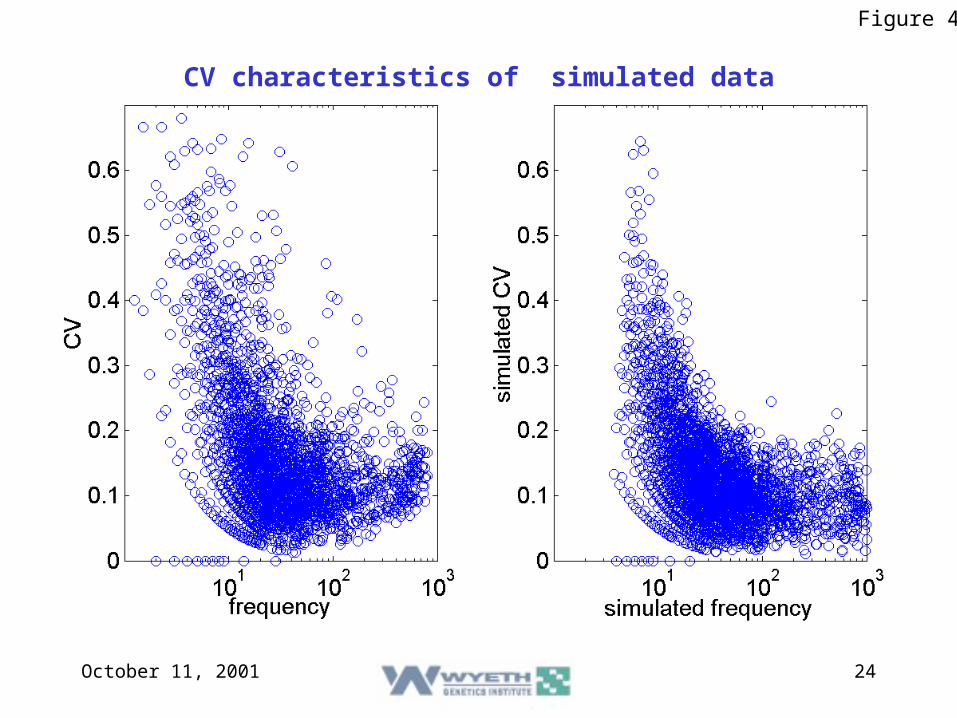
Simulations (description)
• Simulations were performed
• Governing equation:
ijijijjiijij r s m a ADB bAD
October 11, 2001 24
Figure 4
CV characteristics of simulated data
October 11, 2001 25
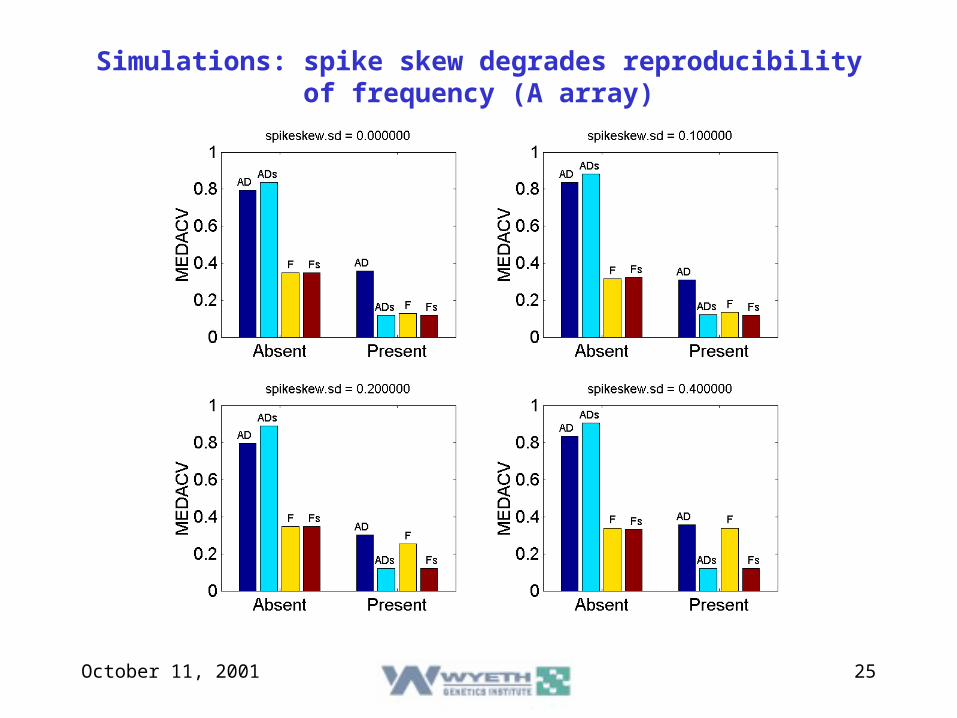
Simulations: spike skew degrades reproducibility of frequency (A array)
October 11, 2001 26
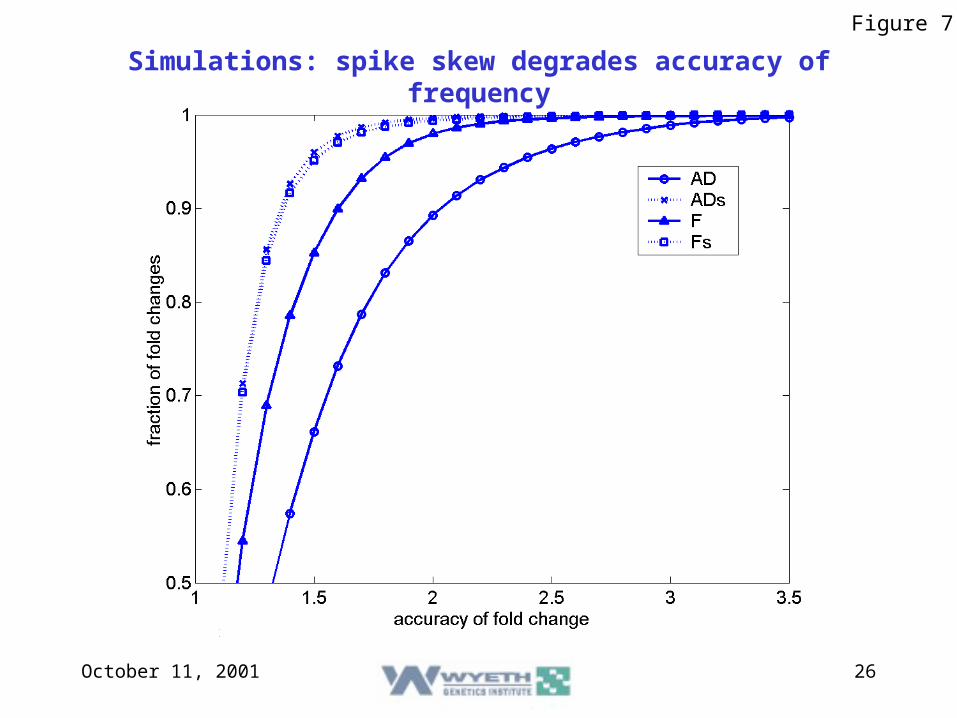
Figure 7
Simulations: spike skew degrades accuracy of frequency