Embed Size (px)
Citation preview
University of ConnecticutOpenCommons@UConn
Master's Theses University of Connecticut Graduate School
5-9-2015
Evaluation of a Sport-Specific Performance TaskAssociated with a Lower Extremity InjuryPrevention ProgramEric C. RouxUniversity of Connecticut - Storrs, [email protected]
This work is brought to you for free and open access by the University of Connecticut Graduate School at OpenCommons@UConn. It has beenaccepted for inclusion in Master's Theses by an authorized administrator of OpenCommons@UConn. For more information, please [email protected].
Recommended CitationRoux, Eric C., "Evaluation of a Sport-Specific Performance Task Associated with a Lower Extremity Injury Prevention Program"(2015). Master's Theses. 774.https://opencommons.uconn.edu/gs_theses/774
Evaluation of a Sport-Specific Performance Task Associated with a Lower Extremity Injury Prevention Program
Eric Christopher Roux
B.S., LAT, ATC, High Point University, 2013
A Thesis
Submitted in Partial Fulfillment of the
Requirements for the Degree of
Master of Science
At the
University of Connecticut
2015
ii
APPROVAL PAGE
Masters of Science Thesis
Evaluation of a Sport-Specific Performance Task Associated with a Lower Extremity Injury Prevention Program
Presented by
Eric Roux, B.S., LAT, ATC Major Advisor________________________________________________________________ Lindsay J. DiStefano Associate Advisor_____________________________________________________________ Douglas J. Casa Associate Advisor_____________________________________________________________ Craig R. Denegar
University of Connecticut
2015
iii
ACKNOWLEDGEMENTS
I’d like to thank the members of my committee, Dr. Lindsay DiStefano, Dr. Douglas
Casa, and Dr. Craig Denegar for all their input, motivation, and priceless advisement during the
thesis process and throughout Graduate School. I’d also like to thank Jessica Martinez, without
her help, this study would have never came into fruition. Additionally her mentorship during the
writing process and graduate school as a whole can never be thanked enough.
I’d like to thank all my friends and family for their support during this process. I’d like to
thank all of my professors from High Point University, without them I would never be on the
path I am now and will be forever grateful. Thank you to the University of Connecticut for
providing me with an outstanding environment to learn and amazing professors to help further
my education in this field.
iv
TABLE OF CONTENTS
ABSTRACT ................................................................................................................................... v
CHAPTER 1: REVIEW OF THE LITERATURE ................................................................... 1 Epidemiology ............................................................................................................................. 1 Epidemiology Across Genders ................................................................................................. 1 Knee Anatomy ........................................................................................................................... 3 Risk Factors ............................................................................................................................... 4 Extrinsic Risk Factors ............................................................................................................... 4 Intrinsic Risk Factors ................................................................................................................ 5 The Landing Error Scoring System (LESS) ........................................................................... 8 Intervention Programs .............................................................................................................. 9 Program Components ............................................................................................................... 9 Program Effectiveness ............................................................................................................ 11 Program Compliance .............................................................................................................. 11 Performance Measures ........................................................................................................... 12 Program Specific Performance Benefits ............................................................................... 14 Sport-Specific Performance ................................................................................................... 14 Conclusion ................................................................................................................................ 16
References ................................................................................................................................ 17
CHAPTER II: INTRODUCTION ............................................................................................ 23
CHAPTER III: METHODS ...................................................................................................... 25 Design ....................................................................................................................................... 25 Participants .............................................................................................................................. 25 Procedures ................................................................................................................................ 26 Warm-Up Programs ............................................................................................................... 26 Movement Assessment ............................................................................................................ 28 Sport-specific Performance Measures ................................................................................... 29 Data Reduction ........................................................................................................................ 30 Data Analyses .......................................................................................................................... 30
CHAPTER IV: RESULTS ......................................................................................................... 32
CHAPTER V: DISCUSSION .................................................................................................... 34 Limitations ............................................................................................................................... 37 Delimitations ............................................................................................................................ 39 Future Considerations ............................................................................................................ 39
APPENDIX .................................................................................................................................. 41
REFERENCES ............................................................................................................................ 50
v
ABSTRACT
Evaluation of a Sport-Specific Performance Task Associated with a Lower Extremity Injury Prevention Program Eric C. Roux, University of Connecticut Lower extremity injuries are occurring in youth sports. Injury prevention programs (IPPs) designed to prevent these injuries are being underutilized from lack of buy-in. Evidence suggests that IPPs can improve general performance and reduce injury risk. Sports-specific performance benefits could prove to be a bartering tool in coach support. The purpose of this study was to explore the effects of an IPP on sport-specific performance in high school aged females. Additionally the study assessed the relationship between sport-specific performance and landing biomechanics. Seventy-four athletes participated in this study (age = 15.0 ± 1.0 years, height = 65.7 ± 2.5 in, weight = 60.3 ± 10.4 kg). Participants were randomized into groups and performed an IPP (Focused (FOC), Traditional (F11+), or Control (CON)) during the course of their season. Variables included the elements of the Landing Error Scoring System (LESS), performance on a Shuttle Dribble Task (SDT), before IPP implementation (PRE) and at the conclusion of their sports season (POST). Change scores for the SDT were calculated. A univariate analysis of variance was used to evaluate differences in SDT while controlling for baseline variables. The association between SDTBEST and LESSAVG at PRE was assessed using a Pearson product-moment correlation. No significant differences were observed between groups for any of the dependent variables (SDTBEST, SDTAVG) (P>0.05). A positive correlation (R2= 0.11, P=0.004) was found between LESSAVG and SDTBEST. This study shows that there is a relationship between landing biomechanics and sport-specific performance, identifying a further need of IPP implementation. The study showed no detrimental effects on sport-specific performance by implementing IPPs over the duration of the season.
WORD COUNT. 265
KEY WORDS. Biomechanics, Landing Error, Soccer, Field Hockey, Volleyball
1
CHAPTER 1
REVIEW OF THE LITERATURE
Epidemiology
A large number of sport related injuries are occurring high school athletics in the United
States. The National High School Sports-Related Injury Surveillance System estimates
approximately 1.4 million injuries occur each year.1–3 This surveillance system uses an online
injury reporting system to track injuries occurring in nine high school sports; boy’s football,
soccer, basketball, wrestling, and baseball, girl’s soccer, volleyball, basketball, and softball. All
injuries are documented and recorded by Athletic Trainers. The Surveillance System estimates
775,000 – 790,000 injuries occur during competition while 580,000 – 635,000 occur during a
practice. Some research indicates that lower extremity injuries account for more than 47% of all
athletic injuries.1,3,4 Regardless of exact percentages, lower extremity injuries are the
overwhelming majority of total injuries by a significant margin.4–7
Ankle and knee injuries account for 200,000 knee injuries occurring each year, with
many involving the patella/patellar tendon, anterior cruciate ligament, medial collateral ligament,
lateral collateral ligament, posterior cruciate ligament, menisci, or combination of structural
injuries often result in significant time loss or require surgical interventions.1,2,4,8–11
Epidemiology Across Genders
Youth athletes are specifically vulnerable to these lower extremity injuries. Moses et al.12
found an incident rate of anterior cruciate ligament (ACL) injuries of 0.03% for the entire United
States. The annual incidence rates in professional sports ranged from 0.15% to 3.67% and 0.03%
2
to 1.62% in amateur athletes. Younger athletes have a higher incident rate for ACL injuries
compared to other groups.12
Incident rates of ACL injuries vary by sport. Boys’ soccer have an injury rate of 1.52 per
1000 athlete exposures and is higher during competition play (3.28 per 1000 athlete exposures)
than (0.78 per 1000 exposures) practice. Knee injuries make up 14.5% of total injuries while
12.4% occur at the ankle. In boy’s soccer 56.8% of all injuries occur to the lower extremity. The
injury rate in boy’s basketball is 1.47 per 100 athlete exposures with 2.44 per 1000 athlete
exposures during games and 1.04 per 1000 athlete exposures during practice. 55.1% of all
injuries occur at the lower extremity for boy’s basketball. Knee injuries made up 12.4% of all
injuries and 30.1% occur at the ankle. In girls’ soccer there is an injury rate of 2.29 per 1000
athlete exposures. During competition the injury rate is higher (5.54 per 1000 athlete exposures)
than (0.92 per 1000 athlete exposures) practice. In girls’ soccer 59.8% of all injuries occurred at
the lower extremity. Knee injuries account for 17.5% of all injuries, and 14.1% occur at the
ankle. Girls’ basketball has an injury rate of 1.83 per 1000 athlete exposures with competition
play (3.13 per 1000 athlete exposures) higher than (1.24 per 1000 athlete exposures) practice.
Girl’s basketball had 56.4% of all injuries occur in the lower extremity injuries. Knee injuries
account for 16.3% of total injuries and 27.3% of total injuries occur at the ankle.1,3 Although
differences can be seen across males and females, there is a consistent incidence of lower
extremity injuries in sport.
Adolescent females, ages 12-17, suffer 0.71 to 2.55 injuries per 1000 athletic exposures
compared to 0.31 to 1.89 injuries per 1000 athletic exposures found in adolescent males.13
Fernandez et al.4 reported that female soccer players carry higher than 3.5 times likelihood of
suffering a soccer related injury compared to males. When comparing males and females by
3
sport, in 2012 - 2013, girls’ soccer had a 1.51 times higher injury rate. Girls were 1.21 times
more likely to a knee and had almost twice the rate of strains and sprains. In basketball, girls
have an injury rate 1.25 times boys, a 1.32 times greater knee injury rate, and 1.19 times the
injury rate for strains and sprains.1 Data for 2013 -2014 are similar.3 Adolescent females see
more injuries than males. There is a greater need for reducing the injury risk in females.14
Knee Anatomy
Knee strains and sprains are the 3rd most common diagnoses in high school sports.1 The
knee consists of four main ligaments to maintain structural integrity. The ACL and Posterior
Cruciate Ligament (PCL), prevent anterior and posterior translation of the femur on the tibia.
The knee receives lateral support from the medial collateral ligament (MCL) and lateral
collateral ligament (LCL). The joint is also stabilized through dynamic muscle activation of the
quadriceps, hamstring, and gastroc-soleus muscle groups crossing the joint. The 2 menisci on the
plateau of the tibia act as a shock absorbers.6 All of these structures play an important role in
stabilizing and maintaining structural integrity. Throughout sport movements however, the ACL
and collateral ligaments are more heavily relied upon.
The ACL is made up of an anteromedial bundle and a posterolateral bundle. The bundles
are identified from their attachment on the tibia. The anteromedial bundle is tightest during knee
flexion, whereas the posterolateral bundle is tightest in full knee extension. Shearing forces to the
knee during any lower extremity movement can cause the ligaments to fail resulting in injury.15
Most ACL injuries occur without any contact between the athlete and another player and are
defined as non-contact mechanism injuries. Non-contact injuries commonly occur during
planting maneuvers, while cutting or changing direction, or landing.6

4
Injuries to the MCL account for 30.5% of all knee injuries (34.6% and 21.4% in males
and females). The ACL accounts for 25.6% of all knee injuries. ACL injuries account for a
higher portion of knee injuries in females than males (38.6% vs. 19.8% respectably). Meniscal
injuries account for 24.0% of all knee injuries while injuries involving the patella, LCL, and PCL
account for 15.6%, 7.6%, and 1.5% of knee injuries.1
Risk Factors
Lower extremity injuries could be the result of numerous risk factors. Several risk factors
for lower extremity injuries have been identified. These can be labeled as extrinsic or intrinsic in
nature.16
Extrinsic Risk Factors
Extrinsic risk factors refer to factors outside of human body. This category would include
contact ACL injuries, because there is no control on the interaction between players. Playing
surface is the most commonly investigated extrinsic risk factor. There is conflicting evidence on
whether artificial versus natural playing surface increase injury risk. There are studies to show
that artificial surfaces can reduce ACL injury rate while studies show they increase injury rates
compared to natural outdoor grass.2,12,17–19 Evidence shows that differences in playing surfaces,
in regards to weather, can contribute to injury risk. Drier surfaces increase the amount of friction
on footwear and can result in more injury.6,16,17,20 The factors are all beyond human control.
Literature on player surfaces goes beyond natural and artificial grass. Playing surfaces
other than natural or artificial grass can play a role in increasing injury risk. Different slope
conditions in skiing results in different reactions with skis causing a higher injury risk.21 Ice in
sports like hockey and figure skating can increase in risk of injury with ice skate contact,
5
although more research is needed. Indoor playing surfaces, wooden and synthetic floors, affect
injury risk. Synthetic indoor surfaces carry a 2.35 times greater injury risk in females compared
to wooden indoor surfaces for Norwegian Handball players.12,20,22,23 More conclusive evidence is
needed on these surfaces injury risk compared to natural and artificial grass. It is clear that
surface plays an uncontrollable role.
Cleat style on playing surfaces has been another topic of interest for extrinsic risk factors.
There has been correlation to the cleat size and total number of cleats in American Football
players.6,20 Smaller and fewer cleats have the lowest injury risk. Cleat patterns that place cleats at
the peripheral margin of the sole with smaller cleats placed interiorly create the highest injury
risk versus other cleat patterns. The reaction between footwear and surface varies in many ways.
With cleats having different wear patterns it is difficult determine which cleat and surfaces create
the highest of risk. It is known that the least amount of resistance is found in footwear designed
for natural grass surfaces on natural grass surface. The least amount of resistance is ideal in
prevention of ACL injuries.6,16,17,20
Intrinsic Risk Factors
In simplicity, intrinsic risk factors are found within the body. They can be labeled as
anatomical, neuromuscular, or biomechanical in nature.
Intrinsic Risk Factors – Anatomical
In anatomy, femur length can contribute to ACL tears.6 Hip width to femur length ratio is
predictor of injury risk.16 The quadriceps femoris angle (Q angle) is the angle of pull of the
quadriceps group from its origin at the hip to its insertion below the knee. The larger the Q angle
6
pulls the patella laterally. This places medial stress on the knee joint and increases the injury risk.
Women have larger Q angles than males because of differences in hip anatomy.14,17,24
The intercondylar notch, the anchor point of the ACL, usually increases in height and
width during growth in males but not in females. Taller women (whom would have a smaller
intercondylar notch relative to their height) have a higher risk of ACL injury. Shape of the
intercondylar notch affects injury rate. A female athlete with a small notch width and A-shaped
is at the highest risk.6,15,16,25–28
There is a positive correlation of body weight and ACL size, the heavier a person is the
thicker the ACL becomes. When normalizing for weight, females have smaller ACLs than males.
A thinner ACL results in a higher injury risk.16,17,29 Joint laxity is associated with ACL injury
risk. Laxity is a measure mobility of joint’s integrity (bony structure, ligaments, and
musculature). Adolescent females are more lax than males during the same maturity range. The
increased muscle tonicities in males protect the knee joint by dissipating some of the forces
during dynamical stabilization. Females with greater joint laxity and flexibility at the knee are
2.7 times more likely to have an ACL injury.6,16,17,20
Intrinsic Risk Factors – Neuromuscular
Neuromuscular factors contribute to lower extremity injury risk.30 Males neuromuscular
systems adapt to growth during developmental stages where females delay. Lack of
neuromuscular control can reduce dynamic control at the knee.31 Females have shorter activation
durations in the gluteal and gastroc-soleus group than males. Females maintain lower extremity
stiffness while males utilize motion in their lower extremity segments. Females are more likely
to exhibit leg dominance, a contralateral weakness in leg strength. These muscle imbalances can
7
result in a higher injury risk in the non-dominant/weaker leg14,24,31,32. Damage to proprioceptors
and mechanoreceptors at the knee can predispose ACL injuries. Reduced proprioception at the
knee can result in lower extremity injury. When mechanoreceptors try to elicit a reflex response
to stretching ACL, weakened or damaged proprioception results in an elongated response time.
The protective muscle contraction delays which allows the ACL to be stressed.6,33 These
differences across genders establish a need for lower extremity injury prevention programs
(IPPs) in females.
Intrinsic Risk Factors – Biomechanics
Biomechanics play another role in injury risk. Changes in posture and alignment can
force an individual to activate different muscles, compensate, to perform a task. These
compensations are not always optimal. Most commonly biomechanical components are
evaluated through landing and/or cutting tasks34. Poorer mechanics such as decreased hip and
knee motion, result in greater stress on the knee, resulting in greater injury risk.34 No one specific
component contributes alone to the increasing injury risk. It is often a combination or
components that create the perfect storm for injuries.
Females have differences in muscle recruitment and activation. Females are quadriceps
dominant during cutting and landing tasks while males use hamstrings and quadriceps in union
for stability.7,17 Through co-contraction, the hamstrings can counteract the shearing forces at the
knee during cutting and landing tasks. The co-contraction in males helps reduce their injury
risk.30 A greater angle of knee flexion when landing from a jump, particularly in single leg
activity, can create a posterior knee shift and counteract the anterior shearing forces.35 The
extremes of the knee angle, landing closer to full knee extension or full knee flexion, is
associated in increased risk.6
8
Valgus force, opening the knee to an anteromedial shearing force (an ACL mechanism of
injury), is commonly seen in females. This valgus stress results from poor muscular control at
the hip6,17,28 and/or lower activation of the vastus medialis muscle compared to the vastus
lateralis muscle.16,35 In landing tasks females activate their rectus femoris and decrease gluteal
activation16,36 placing more stress on the knee instead of dissipating force over the hip and rest
of the lower extremity.6
Biomechanics are assessed for entire lower extremity, with the foot and ankle often
creating the problem and translating its effects up the kinetic chain. Excess foot pronation can
affect tibial translation and alter lower extremity alignment through the lower extremity.
Navicular drop, commonly called flat feet, can result in internal rotation of the tibia, placing the
knee in an valgus position and making injury more susceptible.6 Fatigue may play a part in injury
risk, especially during landing and cutting tasks. Muscular fatigue can result in delay or absence
of preventative muscle activation resulting in injury.16,24,26,27,35
The Landing Error Scoring System (LESS)
The LESS is a clinical assessment tool that measures potentially dangerous jump-landing
movement patterns that lead to lower extremity injuries. Padua et al.34 validated this tool by
creating scoring quartiles. In the LESS, a lower score represents better jump-landing technique
resulting in lower injury risk. The LESS quartiles identify an excellent score (<4), a good score
(≥4 but ≤5), a moderate score (> 5 but ≤6), and a poor score (>6). A series of variance tests
between quartiles and known risk factors proved the LESS’s validity, where a poor score would
be associated with the presence of risk factors. The LESS accurately differentiates between
numerous biomechanical risk factors that have previously shown to be related lower extremity
9
injuries. The LESS demonstrated significant interrater and intrarater reliability and proves to be a
reliable clinical assessment tool for detecting poor jump-landing technique/biomechanics.27,34
The LESS can be used to predict injuries across all performance levels.37 Females have
higher LESS scores, meaning females land with more errors than males.38 When controlling for
activity level, females are more likely to score higher in the LESS and are placed in the poorest
quartile.34 Females land poorer than males, the poorer jump-landing technique the more likely
injury will occur.
Intervention Programs
Intervention programs have been designed to combat the risk of injury across all ages.
Intervention programs are multifaceted to address any deficiency an individual may have. IPPs
have components of strength training, neuromuscular training, proprioception or balance
training, plyometric training, and flexibility training. Each component plays and integral part in
reducing the injury risk because each individual has different deficiencies. A multifaceted
program can address multiple areas of concern for multiple people at the same time.
Program Components
Strengthening components improve gluteal deficits than create valgus stress on the knee.
Exercises such as double and single leg squats, single leg deadlift, and side planks help
strengthen the gluteal group. Strengthening components address hamstring decifits, increasing
the likelihood of co-contract during jump landing and cutting.39,40 The increase in knee flexion
and reduction of knee stiffness diminishes valgus loading and anterior shearing. Common
hamstring exercises use eccentric loading to increase strength. An exercise such as Russian
hamstring curls are effective in strengthening the hamstrings.7,41 Utilization of single leg
10
movements reduce bilateral strength deficits, or leg dominance.7 Strength is crucial in the
rehabilitation process after an injury, regaining strength after muscle atrophy aids in stability.25
Strengthening components in IPPs reduce risk factors associated to weakness and activation, but
they alone cannot reduce total injury risk.
Neuromuscular components, through feedback and proper coaching during exercises,
instill ideal movement patterns. Proper and efficient movement habits elicits better lower
extremity mechanics.24,27,38,42 Feedback commonly occurs on squatting and jump landing.
Feedback plays a role in reducing ground reaction forces, by coaching participants to land softer,
dissipating the force across multiple joints and reducing injury risk.27,41
Proprioception and balance training, in conjunction with neuromuscular training,
provides a consistent base of support throughout the kinetic chain. Flexibility training allows
greater knee flexion during cutting and landing maneuvers.16,19,43–45 Increasing quadriceps and
hamstring flexibility allows for greater co-contraction and reduction of muscular dominance.40,41
Proprioception is an important measure in return to play following an ACL injury, because it
provides the body with awareness in space.46 This awareness helps an athlete place their
extremity in a safer position.
There is no singular component of an IPP that is the most effective in reducing injury, but
plyometric training is often the largest component because of its crossover to sport
activity.19,22,31,35,47–50 Plyometric training mimics performance components found in sport,
allowing for neuromuscular adaption to occur during an common sport activity.26 Examples of
plyometric training exercises include box jumps, jump squats, single leg hops, and broad
11
jumps.36,41 Strength, neuromuscular, proprioceptive, balance, and plyometric components in IPPs
address the broad spectrum of known risk factors in lower extremity.
Program Effectiveness
IPPs are effective in reducing injury risk8,26,28,30 and correcting poor knee
biomechanics.28,35,44 Mandelbaum et al.19 determined that IPPs directly benefit participants by
reducing the number of injuries, and injury risk could be reduced by 74% - 88%. Emery et al.10
discovered an association between balance training and injury prevention. After an IPP,
improvements in balance training correlated with a reduction in injury risk related movement
patterns. Myklebust et al.23 assessed IPPs effectiveness in female team handball players, finding
a reduction of injuries during each of the IPP seasons. Lower extremities IPP are effective in
reducing injuries and correcting poor movement mechanics.
Program Compliance
Even with the proven effectiveness of IPPs, there is a lack of utilization. Time is a large
barrier in implementation and compliance. Intervention programs are time consuming, some
programs need to be implemented everyday and take more than 2 hours to implement. IPPs
require training to implement the programs properly. Time is valuable especially at the high
school level. To reduce time many new programs are designed to be used as a warm-up,
consuming only 10-15 minutes of a practice session.29,41 IPPs differ based on age and sport to
address specific concerns.44,51 IPPs begin prior to the sport season and are used as the team’s
warm-up for the duration of the season.28 With IPPs condensed into warm-up programs, 62% of
coaches state that time is still factor in implementing the IPP.52
12
IPPs cannot eliminate all injuries because of non-modifiable risk factors. IPPs are only
effective in reducing modifiable risk factors if an individual has poor mechanics, or attributes
that be altered. Individuals with excellent mechanics would not be considered at risk. The adage
“You cannot fix what is not broken” comes to mind. It is difficult to get coaches to utilize IPPs
because there is no “need” for improvement. Coach buy-in often follows a player sustaining an
ACL injury instead of proactive buy-in. Universal utilization of programs would reduce overall
ACL injury incidence.53
An unpublished work by Martinez et al.54 determined youth sport coaches’ willingness to
utilize an IPP. More than 90% of coaches are willing to implement IPPs. Coaches are willing to
implement a program that takes 5 or 10 minutes (88% and 79% acceptance) but not willing to
implement a 20 or 30 minute IPP (26% and 20% acceptance). Coaches are not against IPPs but
identify duration as a limiting factor. Coaches identify other areas that affect their willingness to
implement programs. Coaches are heavily influenced by performance factors such as; running
faster (79%), cutting/changing direction faster (82%), fewer injury risk factors (94%), less ACL
injuries (94%), and fewer leg injuries (94%). Time is precious to coaches, especially in youth
sports, busy schedules, resources, venues, and league regulations limit athlete exposures.
Coaches’ unwillingness to implement extended duration programs are due to these time
constraints. Coaches are influenced by performance outcomes and injury reduction. Coaches
should be educated on the outcomes associated with IPPs to garner more compliance and
utilization.
Performance Measures
Buy-in for IPP use could increase with performance based outcomes. Programs are
effective in reducing injury risk, but performance outcomes are a bonus incentive. Performance
13
is the difference between skill levels across multiple sports and age levels. Performance makes
the difference between being a starter or a bench as a secondary player. Silvestre et al.55
compared measures of performance in starters and non-starters on a NCAA Division I soccer
team. Starters outperform non-starters in every performance variable except for a short distance
(9.1m) sprint. Starters have faster sprint times (36.5m), higher vertical jumps, and higher
maximal oxygen uptake. Starters have higher total lower body power, measured by vertical jump
tests.55 In American collegiate football athletes, performance is the difference between Division
I, II, and III levels. Division I athletes outperformed the Division II group which than
outperformed Division III.56 Performance outcomes could be the means to more successful team
compliance in IPPs.
Total performance is difficult to measure. Performance differs from sport to sport and
individual to individual. The main components of performance are power/explosiveness and
endurance. Power is work over time. Power often is commonly associated as strength and speed.
Jumping, sprinting, and one-repetition maximal resistance tasks typically measure power
performance. The most common performance tasks for power include; vertical jump testing, a
test in which an individual will jump as high as possible with their net vertical jump recorded
after subtracting their height with a full extension reach; standing long jump tests, where an
individual will maximally jump horizontally for distance; grip strength, measuring strength as a
one-repetition maximal trial; and sprint distances, 40 yard dash is most commonly used.50,56,57
Endurance pertains to aerobic capacity, the ability to maintain a training volume over time.
Common tests for endurance include; endurance running, measuring the time it takes to complete
a required distance; maximal oxygen uptake tasks, these tasks measure total aerobic capacity;
and standardized non-maximal resistant lifts, for example, using a specific weight for bench
14
press and counted completed repetitions over a time or bout.56,58 Repetitive sprint drills, where an
individual will maximally sprint a distance and then repeat the drill and compare times across
each trial, measures muscular endurance and power in combination because speed is needed over
multiple trials.
Program Specific Performance Benefits
IPP studies have measured performance as an outcome.59 Performance measures for
strength, agility, endurance, speed, and limb symmetry have conflicting benefits. However there
are no detrimental effects on performance from the IPPs. DiStefano et al.45 concluded that IPPs
improve vertical jump height, improving overall power. Vescovi et al.60 showed improvements
in agility tests (27.3m and 36.6m sprints) during the first 6 weeks of the season and a plateauing
of improvements for counter movement jumping where control groups decline.60 Improvements
in balance testing and improvements in the T-Test, a test designed to evaluate agility, are found
after an IPP implementation in coed basketball players.11 The FIFA 11+ program, a commonly
researched IPP, effectively improves concentric quad strengthening on dominant and non-
dominant legs and improvements to core stability associate with improvements in strength/power
and agility.61 General performance is important in all sports. Sport-specific skills can make or
break an athletes success. These sport-specific skills are labeled as sport-specific performance, or
performance in their relative sport.
Sport-Specific Performance
Performance in sport is pivotal, the deference between starting for the team or being on
the bench. Measures of power and endurance alone are not appropriate in measuring sport-
specific performance. In sport-specific performance, star athletes excel. Sports specific tasks
15
need to relate directly to tasks repeatedly performed in a sport.50 The NFL Combine is notable
for its display of sports-specific performance. The combine measures power and endurance for
general performance but include drills for football including throwing, catching, running, and
footwork.62 Lateral shuffle time and side cut performance, a task in which a participant laterally
move between two points as fast as possible, are critical in cutting sports. The shuffle and side
cut associate with changing direction, potentially faster than an opponent. This task is a
functional measure of a sport-specific task.63 The shuttle run, similar to the shuffle and side cut,
is a task where individual will sprint between 2 points rather than lateral movement back and
forth for time. Shuttle runs measure speed, agility, and the ability to quickly change direction.
This task is realistic for all sports that require change of speed and direction.39
There is only one study to date that evaluates lower extremity IPPs and sport-specific
performance. In a 2-hour IPP implemented 3 times a week, no improvements were seen in
shooting accuracy in adolescent female soccer players.64 Shooting is a specific skill in soccer,
however not all players shoot the ball, nor do they shoot often. Sport-specific drills should
incorporate infinitely repeatable tasks. The shuttle sprint and dribble test (SDT) was designed as
a reliable measure for field hockey performance. The task required an individual to dribble a ball
on a grass surface to multiple touchlines and back to the starting position for time. This task not
only measures agility and speed but also added a component of ball handling. Ball handling is
required any time a player receives the ball making is infinitely repeatable. The slalom sprint and
dribble test was created as another reliable measure of speed, agility, and ball handling. The task
requires the participant to weave in and out of cones over a distance for time.18 These sport-
specific tasks were also adapted for soccer players to measure soccer ball handling performance
16
during a shuttle run task. This task would mimic changes in speed, direction, and ball handling
performance mimicking on field play.65
Conclusion
The current literature makes an abundantly clear need for IPP utilization on injury data
alone. The number of injuries that affect adolescent athletes each year are alarming, specifically
in females. Although there is no clear individual risk factor that plays a role in these injuries
there is evidence to show a number of potential causes. Clinical assessment tools have been
established to help determine injury risk and have been useful in determining the effectiveness of
IPPs. IPPs however are being underutilized in youth sports for reasons such as time, cost,
education, and a lack of desire to utilize the protocols. IPPs have be proven to be effective in
increasing performance and reducing injury, sport-specific performance benefits may hold the
key to increasing program utilization and compliance.
17
REFERENCES
1. Comstock RD, Collins CL, Currie DW. National High School Sports-Related Injury Surveillance Study 2012-2013. 2014.
2. Yard EE, Collins CL, Comstock RD. A comparison of high school sports injury surveillance data reporting by certified athletic trainers and coaches. J Athl Train. 2009;44(6):645–52. doi:10.4085/1062-6050-44.6.645.
3. Comstock RD, Currie DW, Pierpoint LA. National High School Sports-Related Injury Surveillance Study 2013-2014. 2015.
4. Fernandez WG, Yard EE, Comstock RD. Epidemiology of lower extremity injuries among U.S. high school athletes. Acad Emerg Med. 2007;14(7):641–5. doi:10.1197/j.aem.2007.03.1354.
5. Daneshjoo a, Mokhtar A, Rahnama N, Yusof a. The effects of injury prevention warm-up programmes on knee strength in male soccer players. Biol Sport. 2013;30(4):281–8. doi:10.5604/20831862.1077554.
6. Giugliano DN, Solomon JL. ACL tears in female athletes. Phys Med Rehabil Clin N Am. 2007;18(3):417–38, viii. doi:10.1016/j.pmr.2007.05.002.
7. Graziano J, Green D, Cordasco F. Anterior Cruciate Ligament Injury Prevention in the Young Athlete: Evidence-Based Application. Strength Cond J. 2013:89–97. Available at: http://scholar.google.com/scholar?hl=en&btnG=Search&q=intitle:Anterior+Cruciate+Ligament+Injury+Prevention+in+the+Young+Athlete+:+Evidence-Based+Application#0. Accessed December 5, 2013.
8. Hewett TE, Johnson DL. ACL prevention programs: fact or fiction? Orthopedics. 2010;33(1):36–9. doi:10.3928/01477447-20091124-19.
9. Walden M, Atroshi I, Magnusson H, Wagner P, Hagglund M. Republished research: Prevention of acute knee injuries in adolescent female football players: cluster randomised controlled trial. Br J Sports Med. 2012;46(13):904–904. doi:10.1136/bjsports-2012-e3042rep.
10. Emery C a., Cassidy JD, Klassen TP, Rosychuk RJ, Rowe BH. Effectiveness of a home-based balance-training program in reducing sports-related injuries among healthy adolescents: A cluster randomized controlled trial. Cmaj. 2005;172(6):749–754. doi:10.1503/cmaj.1040805.
11. Fisher P, Paton B, Mias E. The effects of an eight week ankle injury prevention pilot porgramme on recreational basketball players balance and agility: a within subject design.
18
Br J Sports Med. 2014;34(7):592–594. Available at: http://bjsm.bmj.com/content/48/7/592.3.short. Accessed November 29, 2014.
12. Moses B, Orchard J, Orchard J. Systematic review: Annual incidence of ACL injury and surgery in various populations. Res Sports Med. 2012;20(3-4):157–79. doi:10.1080/15438627.2012.680633.
13. Louw Q, Manilall J, Grimmer K. Epidemiology of knee injuries in adolescents: a review. Clin J Sport Med. 2009;19(2):150–154. doi:10.1136/bmj.a439.Objective.
14. Devan M, Pescatello L. A prospective study of overuse knee injuries among female athletes with muscle imbalances and structural abnormalities. J Athl …. 2004;39(3):263–267. Available at: http://www.ncbi.nlm.nih.gov/pmc/articles/pmc522150/. Accessed November 29, 2014.
15. Zantop T, Petersen W, Sekiya JK, Musahl V, Fu FH. Anterior cruciate ligament anatomy and function relating to anatomical reconstruction. Knee Surg Sports Traumatol Arthrosc. 2006;14(10):982–92. doi:10.1007/s00167-006-0076-z.
16. Ireland ML. The female ACL: why is it more prone to injury? Orthop Clin North Am. 2002;33(4):637–51. Available at: http://www.ncbi.nlm.nih.gov/pubmed/12528906.
17. Silvers HJ, Mandelbaum BR. ACL Injury Prevention in the Athlete. Sport - Sport - Sport Orthop Traumatol. 2011;27(1):18–26. doi:10.1016/j.orthtr.2011.01.010.
18. Lemmink K a PM. Evaluation of the reliability of two field hockey specific sprint and dribble tests in young field hockey players. Br J Sports Med. 2004;38(2):138–142. doi:10.1136/bjsm.2002.001446.
19. Mandelbaum BR, Silvers HJ, Watanabe DS, et al. Effectiveness of a neuromuscular and proprioceptive training program in preventing anterior cruciate ligament injuries in female athletes: 2-year follow-up. Am J Sports Med. 2005;33(7):1003–10. doi:10.1177/0363546504272261.
20. Smith HC, Vacek P, Johnson RJ, et al. Risk factors for anterior cruciate ligament injury: a review of the literature-part 2: hormonal, genetic, cognitive function, previous injury, and extrinsic risk factors. Sports Health. 2012;4(2):155–61. doi:10.1177/1941738111428282.
21. Ruedl G, Ploner P, Linortner I, et al. Interaction of potential intrinsic and extrinsic risk factors in ACL injured recreational female skiers. Int J Sports Med. 2011;32(8):618–22. doi:10.1055/s-0031-1275355.
22. Ter Stege MHP, Dallinga JM, Benjaminse A, Lemmink K a PM. Effect of interventions on potential, modifiable risk factors for knee injury in team ball sports: a systematic review. Sports Med. 2014;44(10):1403–26. doi:10.1007/s40279-014-0216-4.
19
23. Myklebust G, Engebretsen L, Braekken IH, Skjølberg A, Olsen O-E, Bahr R. Prevention of anterior cruciate ligament injuries in female team handball players: a prospective intervention study over three seasons. Clin J Sport Med. 2003;13(2):71–78. doi:10.1097/00042752-200303000-00002.
24. Yeung SS, Suen a MY, Yeung EW. A prospective cohort study of hamstring injuries in competitive sprinters: preseason muscle imbalance as a possible risk factor. Br J Sports Med. 2009;43(8):589–94. doi:10.1136/bjsm.2008.056283.
25. Kobayashi A, Higuchi H, Terauchi M, Kobayashi F, Kimura M, Takagishi K. Muscle performance after anterior cruciate ligament reconstruction. Int Orthop. 2004;28(1):48–51. doi:10.1007/s00264-003-0502-5.
26. McLean SG, Beaulieu ML. Complex integrative morphological and mechanical contributions to ACL injury risk. Exerc Sport Sci Rev. 2010;38(4):192–200. doi:10.1097/JES.0b013e3181f450b4.
27. Padua D a, Distefano LJ. Sagittal Plane Knee Biomechanics and Vertical Ground Reaction Forces Are Modified Following ACL Injury Prevention Programs: A Systematic Review. Sports Health. 2009;1(2):165–73. doi:10.1177/1941738108330971.
28. Voskanian N. ACL Injury prevention in female athletes: review of the literature and practical considerations in implementing an ACL prevention program. Curr Rev Musculoskelet Med. 2013;6(2):158–63. doi:10.1007/s12178-013-9158-y.
29. Giza ER, Silvers HJ, Mandelbaum BR. Anterior cruciate ligament tear prevention in the female athlete. Curr Sports Med Rep. 2005;4(6):341–3. Available at: http://www.ncbi.nlm.nih.gov/pubmed/16282037.
30. Lamontagne M, Caraffa A, Cerulli G. Neuromuscular strategy to prevent ACL injury. Gait Posture. 2009;30(2009):S23–S24. doi:10.1016/j.gaitpost.2009.07.106.
31. Paterno M V, Rauh MJ, Schmitt LC, Ford KR, Hewett TE. Incidence of contralateral and ipsilateral anterior cruciate ligament (ACL) injury after primary ACL reconstruction and return to sport. Clin J Sport Med. 2012;22(2):116–21. doi:10.1097/JSM.0b013e318246ef9e.
32. Franettovich M. Muscle imbalance among elite athletes. Br J Sport …. 2011:348–350. doi:10.1136/bjsm.2011.084038.
33. Dai B, Herman D, Liu H, Garrett WE. Research in Sports Medicine : An Prevention of ACL Injury , Part II : Effects of ACL Injury Prevention Programs on Neuromuscular Risk Factors and Injury Rate. 2012;(December 2013):37–41.
34. Padua D a, Marshall SW, Boling MC, Thigpen C a, Garrett WE, Beutler AI. The Landing Error Scoring System (LESS) Is a valid and reliable clinical assessment tool of jump-
20
landing biomechanics: The JUMP-ACL study. Am J Sports Med. 2009;37(10):1996–2002. doi:10.1177/0363546509343200.
35. Laughlin W a, Weinhandl JT, Kernozek TW, Cobb SC, Keenan KG, O’Connor KM. The effects of single-leg landing technique on ACL loading. J Biomech. 2011;44(10):1845–51. doi:10.1016/j.jbiomech.2011.04.010.
36. Engelen-van Melick N, van Cingel REH, Tijssen MPW, Nijhuis-van der Sanden MWG. Assessment of functional performance after anterior cruciate ligament reconstruction: a systematic review of measurement procedures. Knee Surg Sports Traumatol Arthrosc. 2013;21(4):869–79. doi:10.1007/s00167-012-2030-6.
37. Harmon K, Dick R. The Relationship of Skill Level to Anterior Cruciate Ligament Injury. Clin J Sport Med. 1998. Available at: http://www.bmhlibrary.info/9884789.pdf. Accessed March 23, 2014.
38. Theiss J, Gerber P. Jump-Landing Differences between Varsity, Club, and Intramural Athletes: The Jump-ACL study. J strength …. 2013. Available at: http://europepmc.org/abstract/MED/23820560. Accessed March 10, 2014.
39. Kong DH, Yang SJ, Ha JK, Jang SH, Seo JG, Kim JG. Validation of functional performance tests after anterior cruciate ligament reconstruction. Knee Surg Relat Res. 2012;24(1):40–5. doi:10.5792/ksrr.2012.24.1.40.
40. Hewett TE, Myer GD, Ford KR, Paterno M V, Quatman CE. The 2012 ABJS Nicolas Andry Award: The sequence of prevention: a systematic approach to prevent anterior cruciate ligament injury. Clin Orthop Relat Res. 2012;470(10):2930–40. doi:10.1007/s11999-012-2440-2.
41. Macaluso T. Anterior Cruciate Ligament Injury Prevention for Female High School Athletes. Strength Cond J. 2012;34(5):56–59. Available at: http://scholar.google.com/scholar?hl=en&btnG=Search&q=intitle:Anterior+Cruciate+Ligament+Injury+Prevention+for+Female+High+School+Athletes#0. Accessed December 5, 2013.
42. Theiss JL, Gerber PJ, Cameron KL, et al. Jump-Landing Differences between Varsity, Club, and Intramural Athletes: The Jump-ACL study. J Strength Cond Res. 2013. doi:10.1519/JSC.0b013e3182a1fdcd.
43. Van Beijsterveldt a MC, van der Horst N, van de Port IGL, Backx FJG. How effective are exercise-based injury prevention programmes for soccer players? : A systematic review. Sports Med. 2013;43(4):257–65. doi:10.1007/s40279-013-0026-0.
44. DiStefano LJ, Blackburn JT, Marshall SW, Guskiewicz KM, Garrett WE, Padua D a. Effects of an age-specific anterior cruciate ligament injury prevention program on lower
21
extremity biomechanics in children. Am J Sports Med. 2011;39(5):949–57. doi:10.1177/0363546510392015.
45. DiStefano LJ, Padua DA, Blackburn JT, Garrett WE, Guskiewicz KM, Marshall SW. Intergrated Injury Prevention Program Improves Balance and Vertical Jump Height in Children. J Strength Cond Res. 2010;24(2):332–342.
46. Katayama M, Higuchi H, Kimura M, et al. Proprioception and performance after anterior cruciate ligament rupture. Int Orthop. 2004;28(5):278–81. doi:10.1007/s00264-004-0583-9.
47. Stojanovic MD, Ostojic SM. Preventing ACL injuries in team-sport athletes: a systematic review of training interventions. Res Sports Med. 2012;20(3-4):223–38. doi:10.1080/15438627.2012.680988.
48. FIFA, F-MARC. The “11+” Manual.; 2007.
49. Soligard T, Myklebust G, Steffen K, et al. Comprehensive warm-up programme to prevent injuries in young female footballers: cluster randomised controlled trial. 2008;(December). doi:10.1136/bmj.a2469.
50. Nikolenko M, Brown L. Relationship between core power and measures of sport performance. Kinesiol ( …. 2011;43:163–168. Available at: http://www.researchgate.net/publication/228462932_RELATIONSHIP_BETWEEN_CORE_POWER_AND_MEASURES_OF_SPORT_PERFORMANCE/file/32bfe5137a40a0dc2a.pdf. Accessed December 6, 2013.
51. Trojian T, DiStefano L. Prevention of Anterior Cruciate Ligament Injury in Athletes : A Review. Clin J Sport Med. 2013;23(2):120–121. doi:10.1136/bjsports-2011-090664.2.
52. Saunders N, Otago L, Romiti M, Donaldson a, White P, Finch C. Coaches’ perspectives on implementing an evidence-informed injury prevention programme in junior community netball. Br J Sports Med. 2010;44(15):1128–1132. doi:10.1136/bjsm.2009.069039.
53. Verhagen E, Finch CF. Setting our minds to implementation. Br J Sports Med. 2011;45(13):1015–6. doi:10.1136/bjsports-2011-090485.
54. Martinez JC. Youth Sport Coaches’ Beliefs and Influences on Injury Prevention Program Implementation.; 2015.
55. SILVESTRE R, WEST C. Body Composition and Physical Performance in Men’s Soccer: A Study of a National Collegiate Athletic Association Division I Team. J …. 2006;20(1):177–183. Available at: http://journals.lww.com/nsca-jscr/Abstract/2006/02000/Body_Composition_and_Physical_Performance_in_Men_s.29.aspx. Accessed March 23, 2014.
22
56. Fry A, Kraemer W. Physical Performance Characteristics of American Collegiate Football Players. J Strength Cond …. 1991. Available at: http://journals.lww.com/nsca-jscr/Abstract/1991/08000/Physical_Performance_Characteristics_of_American.4.aspx. Accessed March 23, 2014.
57. Coburn JW. Measuring power. Strength Cond J. 2012;34:25–28. Available at: http://citeseerx.ist.psu.edu/viewdoc/download?doi=10.1.1.1.1998&rep=rep1&type=pdf. Accessed March 10, 2014.
58. Buchheit M. Repeated-sprint performance in team sport players: associations with measures of aerobic fitness, metabolic control and locomotor function. Int J Sports Med. 2012;33(3):230–9. doi:10.1055/s-0031-1291364.
59. Noyes FR, Barber Westin SD. Anterior Cruciate Ligament Injury Prevention Training in Female Athletes: A Systematic Review of Injury Reduction and Results of Athletic Performance Tests. Sport Heal A Multidiscip Approach. 2012;4(1):36–46. doi:10.1177/1941738111430203.
60. Vescovi JD, VanHeest JL. Effects of an anterior cruciate ligament injury prevention program on performance in adolescent female soccer players. Scand J Med Sci Sports. 2010;20(3):394–402. doi:10.1111/j.1600-0838.2009.00963.x.
61. McGill S. Core Training: Evidence Translating to Better Performance and Injury Prevention. Strength Cond J. 2010;32(3):33–46. doi:10.1519/SSC.0b013e3181df4521.
62. Robbins D. The National Football League (NFL) Combine: Does Normalized Data Better Predict Performance in the NFL Draft? J Strength Cond Res. 2010:2888–2899. Available at: http://journals.lww.com/nsca-jscr/Abstract/2010/11000/The_National_Football_League__NFL__Combine__Does.2.aspx. Accessed March 23, 2014.
63. Whitting J. Measuring Lateral Shuffle and Side Cut Performance. J …. 2013;27(11):3197–3203. Available at: http://journals.lww.com/nsca-jscr/Abstract/2013/11000/Measuring_Lateral_Shuffle_and_Side_Cut_Performance.34.aspx. Accessed March 10, 2014.
64. Steffen K, Bakka HM, Myklebust G, Bahr R. Performance aspects of an injury prevention program: A ten-week intervention in adolescent female football players. Scand J Med Sci Sport. 2008;18(5):596–604. doi:10.1111/j.1600-0838.2007.00708.x.
65. Huijgen BCH, Elferink-Gemser MT, Post WJ, Visscher C. Soccer skill development in professionals. Int J Sports Med. 2009;30(8):585–91. doi:10.1055/s-0029-1202354.
23
CHAPTER II
INTRODUCTION
An estimated 1.4 million injuries occur each year in high school athletics.1–3 Nearly 50%
of these injuries occur to the lower extremity.2–4 Among high school athletes, females have a
higher risk of injury than males when participating in the same sport.5–14 In soccer, females had a
3.5 times greater incidence of injuries requiring surgery.4 These injuries are associated with time-
loss from the sport1,3,15 as well as cost to individual from surgery and rehabilitative services.16,17
Exercise-based injury prevention programs (IPPs) have been designed to alter biomechanics and
prevent lower extremity injury.
IPPs have been proven to reduce the risk of injury across age groups.5,6,18,19 Almost all of
the intervention programs have components of strength training, proprioception or balance
training, plyometric training, and flexibility training, and are designed to emphasize proper
neuromuscular control and improve biomechanics.5,14,16,17,20–22 These multifaceted programs are
often adopted into a warm-up performed prior to sport participation, combining the programs
into warm-ups save time which may increase compliance of the part of coaches and athletes.20,23–
25 Although IPPs reduce injury up to 64% in female soccer athletes,26,27 several studies11,28 have
reported poor compliance with these programs.
To promote adoption and adherence to IPPs potential benefits to performance were
explored. IPPs have been demonstrated to improve strength, speed, agility, endurance, core
strength, balance, and reduce leg dominance in adolescent athletes.8,28–33 Adolescent females
soccer players have demonstrated improved sprint performance,8 vertical jumping, and balance.28
Research has shown that performance tasks play a pivotal role in sports,30,34–36 especially in
24
determining starting versus non-starting players.37 However, measures of general performance
alone are not appropriate in determining a players’ success in a sport. IPPs can help improve
general performance but there is no literature to support any improvement in sport-specific
performance skills. Sport-specific performance can be defined as a skill needed to perform a
specific task during participation in sport that is infinitely repeatable.30 Evidence to support
sport-specific skill improvement could offer more adoption of IPPs.
The primary purpose of this study was to evaluate the effect of IPPs on sport-specific
performance, measured through a sports-specific shuttle dribble task, in high school female
athletes. It was hypothesized that the 2 IPPs performed as a sport warm-up will elicit
improvements in the Shuttle Dribble Test (SDT)38,39 compared to an active control group.
Additionally, the association between performance on the SDT and reduced lower extremity
injury risk, as measured by the Landing Error Scoring System (LESS)13,40 was evaluated in high
school female athletes. We hypothesized that faster performers in the sport-specific task will
exhibit better landing technique, as measured by lower scores on the LESS, compared to high
school female athletes who perform on the sport-specific task.
25
CHAPTER III
METHODS
Design
A cluster-randomized controlled trial study design was used to evaluate sport-specific
performance outcomes in participants before and after a high school interscholastic sports
season. Players were recruited from a local high school (female soccer, volleyball, or field
hockey). After the baseline test session, participants were stratified by sport and interscholastic
level (freshmen, junior varsity, and varsity teams) and then randomized into three warm-up
groups. The groups were made up of two IPPs; a focused IPP (FOC) (n=25) and traditional IPP
(F11+) (n=24), and an active control group (CON) (n=26).
Participants
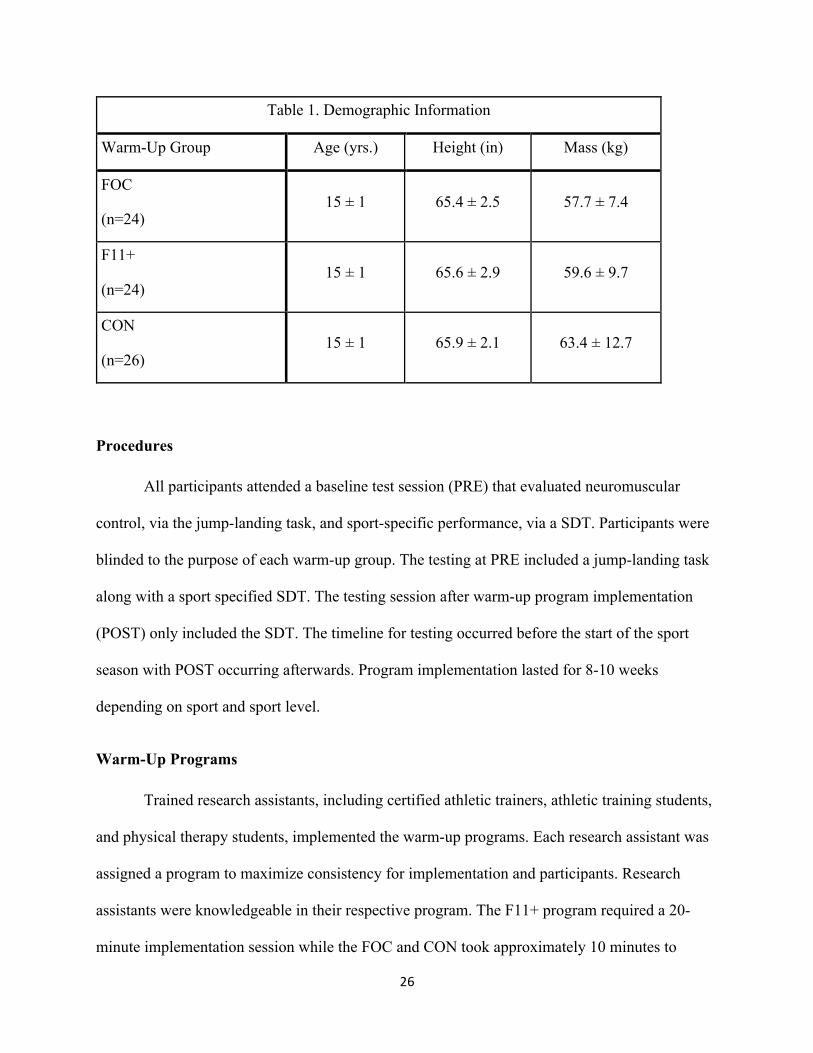
Seventy-four high school aged female athletes volunteered to participate in this study
(Table 1. Demographic Information). Participants were free from any injury or illness that
prohibited sport participation at the time of baseline testing. Written informed assent and consent
were obtained from all participants and their legal guardians, respectively. This study was
approved by the university’s institutional review board.
26
Table 1. Demographic Information
Warm-Up Group Age (yrs.) Height (in) Mass (kg)
FOC
(n=24) 15 ± 1 65.4 ± 2.5 57.7 ± 7.4
F11+
(n=24) 15 ± 1 65.6 ± 2.9 59.6 ± 9.7
CON
(n=26) 15 ± 1 65.9 ± 2.1 63.4 ± 12.7
Procedures
All participants attended a baseline test session (PRE) that evaluated neuromuscular
control, via the jump-landing task, and sport-specific performance, via a SDT. Participants were
blinded to the purpose of each warm-up group. The testing at PRE included a jump-landing task
along with a sport specified SDT. The testing session after warm-up program implementation
(POST) only included the SDT. The timeline for testing occurred before the start of the sport
season with POST occurring afterwards. Program implementation lasted for 8-10 weeks
depending on sport and sport level.
Warm-Up Programs
Trained research assistants, including certified athletic trainers, athletic training students,
and physical therapy students, implemented the warm-up programs. Each research assistant was
assigned a program to maximize consistency for implementation and participants. Research
assistants were knowledgeable in their respective program. The F11+ program required a 20-
minute implementation session while the FOC and CON took approximately 10 minutes to
27
complete. Coaches of the three sports included in this study agreed to adopt these warm-up
programs as part of their daily practice plan. Exercises were implemented using a script for all
warm-up programs. Instructions included telling participants to “land softly” “keep their feet
forward” and “keep your knees over your feet/toes”. Attendance for each warm-up group was
taken prior to the start of the program. A participant lost attendance if they were later than
halfway through the warm-up program or did not attend the session at all.
Focused (FOC) Program
This experimental warm-up program used similar tasks to found in the F11+ but in a
condensed 10-minute version. Specific Tasks are depicted in Figure 4 of the Appendix. Field set-
up also corresponded with the set-up for the F11+. The FOC included core strengthening, leg
strengthening, balance, plyometrics, and brief running tasks.
Traditional (F11+) Program
The traditional warm-up program used the 11+ program, formulated by Fédération
Internationale de Football Association (FIFA) and it’s Medical Assessment and Research Centre
(F-MARC). Research demonstrated that utilization of the program resulted in a 30% - 50%
reduction of lower extremity injuries.41 The program consists of 15 exercises, performed in their
designated sequence prior to each of the teams’ daily practice. Part 1 includes running
exercises at a relaxed pace combined with active stretching and controlled partner contacts, Part
2 consists of 6 sets of exercises focusing on core strength, leg strength, balance and plyometrics,
each with three levels of increasing difficulty; and finally Part 3 includes running exercises at
moderate/high speed combined with planting and cutting movements. Specific tasks are depicted
28
in Figure 5 of the Appendix.11,41 Field set-up corresponded precisely with the set up in the F11+
Workbook.
Control (CON)
This active control warm-up consisted of 10 minutes of guided dynamic stretching and
flexibility training. Instructors did not give individualized feedback on movement, instructors
could used the scripted descriptions for the movements to remind athletes on the proper method
of completing the exercise. This warm-up program was similar to warm-up techniques already
being utilized by these interscholastic teams. Specific Tasks are depicted in Figure 6 of the
Appendix.
Movement Assessment
Movement assessment was examined using the LESS. Participants were asked to perform
3 trials of the jump-landing task. Participants were instructed to jump outward from a 30-
centimeter high box, past a distance half of their height, marked by a line. Immediately following
that jump, participants were instructed to jump vertically for maximal height. Participants
received no feedback on technique but were instructed to perform another trial if they did not
jump with both feet from the box, did not jump past their indicated distance with both feet, or did
not complete the task in a fluid motion. Participants were allowed practice attempts as needed
until they verbally indicated that they were comfortable with the task and performed it correctly.
The jump-landing task was video recorded by two standard digital video cameras (Canon FS400,
Canon U.S.A. Inc., Lake Success, NY, USA) placed approximately 12 feet from the front of
jump box and approximately 12 feet beside of the participant to record frontal and sagittal plane
movements. Video footage was analyzed at a later date by one blinded rater using the
29
standardized LESS scoring sheet (Figure 7 in Appendix). All of the participants’ trials were
averaged into a singular composite score.
Sport-specific Performance Measures
The SDT, consisted of 3 trials of maximal sprints covering 30 meters while performing a
sport-specific task. Participants were allowed a practice session before the 3 trials began to
reduce the learning effect. Timed rests of approximately 20 seconds were given between each
trial to correspond with the original study. For soccer and field hockey participants, each trial of
the SDT required 3 changes of direction, players were required to cross the line with the ball in
order to be valid. The participants were given no feedback during the trial on technique. The only
verbal instruction was to keep the ball within the coned area. Field set-up was altered for ease of
testing but all components of the original test were consistent, the set-up is depicted below. Time
was measured using photoelectric timing gates (TC-Speed-Trap II Wireless Timing System,
Brower Timing Systems, Draper, UT, USA) placed at approximately hip height above the
ground. The timing gates were not placed at the start and finish of the task but at the 1m mark in
order to eliminate reaction timing, starting speed, and make the distance the required 30m. The
SDT measured peak sport-specific performance (SDTBEST), indicated by fastest trial time, and an
average sport-specific performance outcome (SDTAVG), indicated by the average time of all 3
trials. The SDT was originally developed for use in field hockey however was validated for use
in soccer in which dribbling was quantified as a adequate sport performance measure because it
incorporated speed and ball control while changing directions38,39. Volleyball, however, lacks a
dribbling component therefore the test could not be easily adapted. In order to keep consistency
across all participants, volleyball players performed commonly repeatable task (with coach and
player input) with the same field set-up. Instead of being instructed to control a ball throughout
30
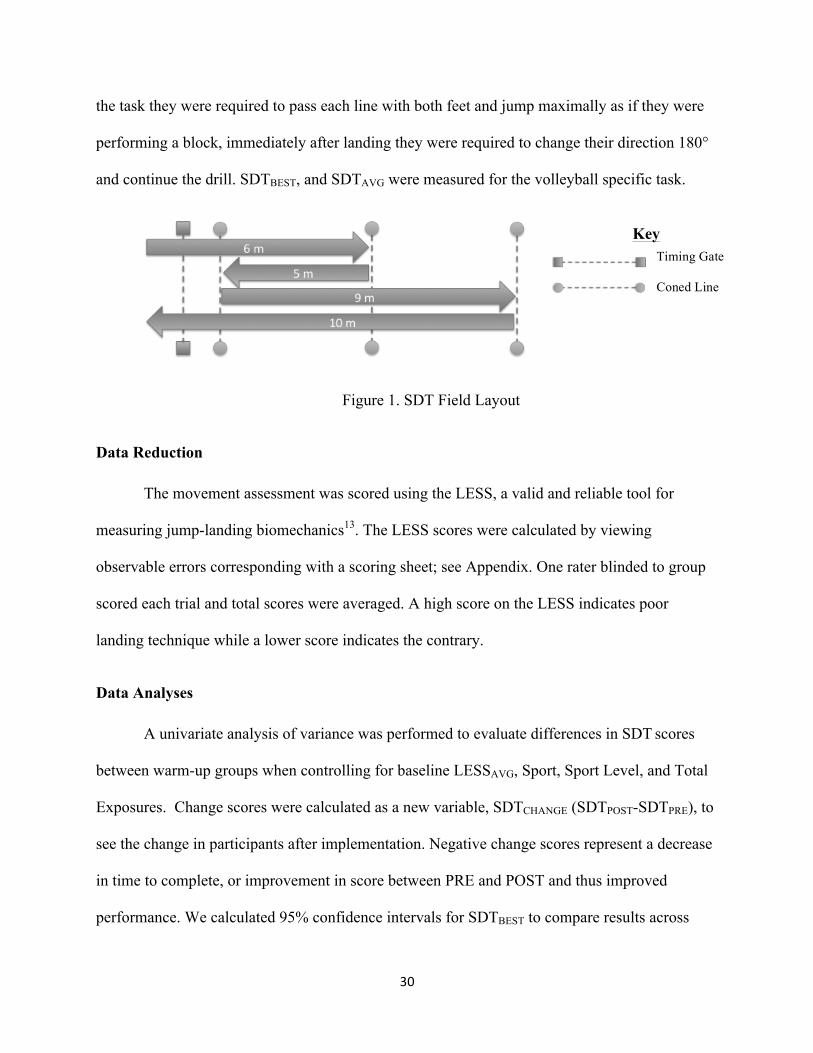
the task they were required to pass each line with both feet and jump maximally as if they were
performing a block, immediately after landing they were required to change their direction 180°
and continue the drill. SDTBEST, and SDTAVG were measured for the volleyball specific task.
Figure 1. SDT Field Layout
Data Reduction
The movement assessment was scored using the LESS, a valid and reliable tool for
measuring jump-landing biomechanics13. The LESS scores were calculated by viewing
observable errors corresponding with a scoring sheet; see Appendix. One rater blinded to group
scored each trial and total scores were averaged. A high score on the LESS indicates poor
landing technique while a lower score indicates the contrary.
Data Analyses
A univariate analysis of variance was performed to evaluate differences in SDT scores
between warm-up groups when controlling for baseline LESSAVG, Sport, Sport Level, and Total
Exposures. Change scores were calculated as a new variable, SDTCHANGE (SDTPOST-SDTPRE), to
see the change in participants after implementation. Negative change scores represent a decrease
in time to complete, or improvement in score between PRE and POST and thus improved
performance. We calculated 95% confidence intervals for SDTBEST to compare results across
Timing Gate
Coned Line
Key

31
warm-up groups. We calculated a correlation of SDTBEST and LESSAVG at PRE to determine if
there were any relationships between the two dependent measures. All data were analyzed using
SPSS (version 22.0, SPSS Inc., Chicago, Illinois).
32
CHAPTER IV
RESULTS
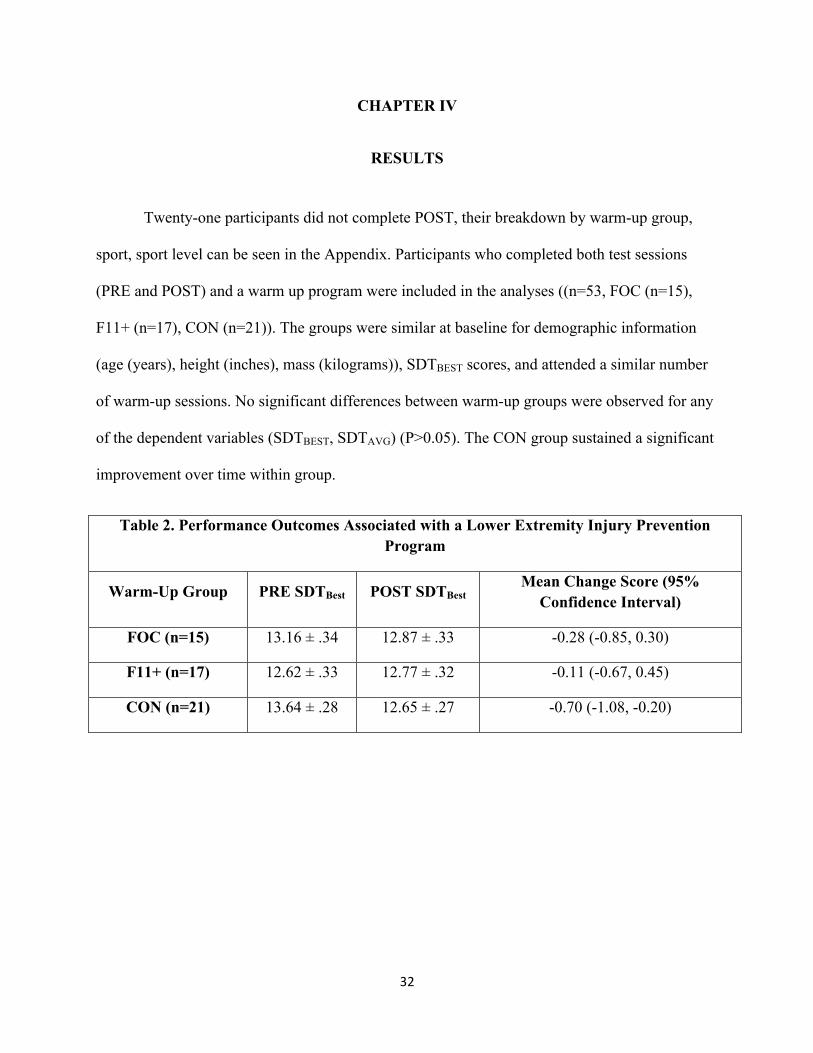
Twenty-one participants did not complete POST, their breakdown by warm-up group,
sport, sport level can be seen in the Appendix. Participants who completed both test sessions
(PRE and POST) and a warm up program were included in the analyses ((n=53, FOC (n=15),
F11+ (n=17), CON (n=21)). The groups were similar at baseline for demographic information
(age (years), height (inches), mass (kilograms)), SDTBEST scores, and attended a similar number
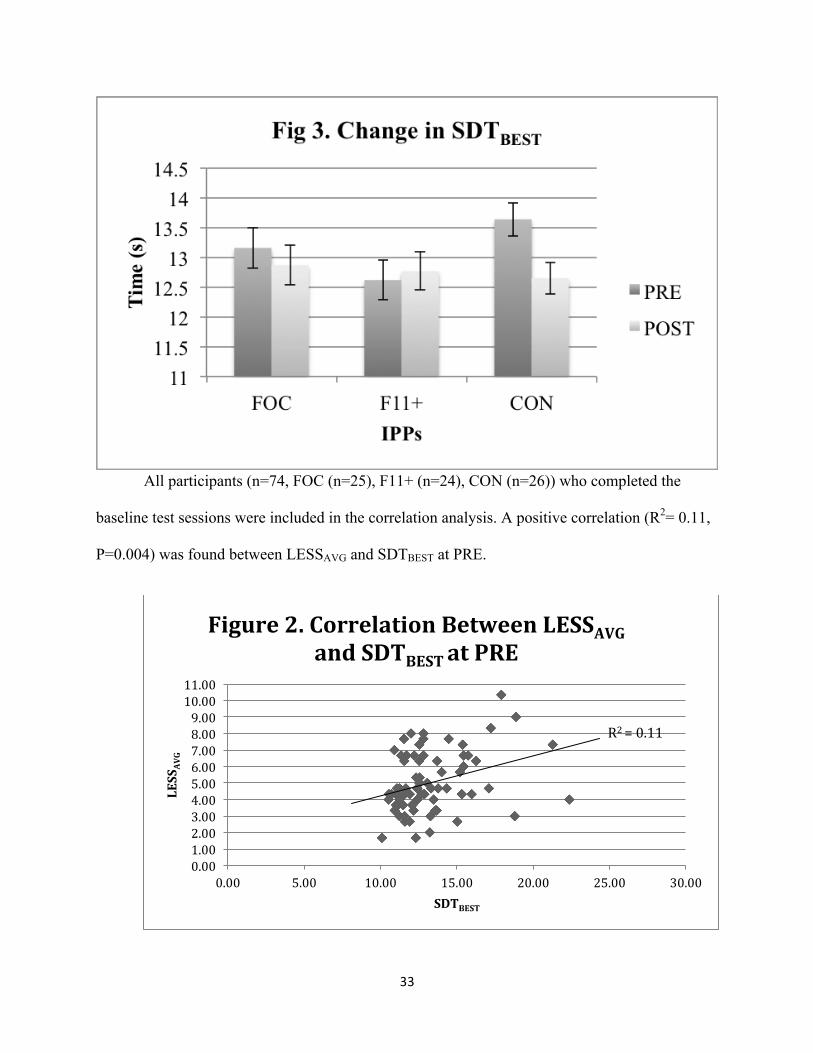
of warm-up sessions. No significant differences between warm-up groups were observed for any
of the dependent variables (SDTBEST, SDTAVG) (P>0.05). The CON group sustained a significant
improvement over time within group.
Table 2. Performance Outcomes Associated with a Lower Extremity Injury Prevention Program
Warm-Up Group PRE SDTBest POST SDTBest Mean Change Score (95%
Confidence Interval)
FOC (n=15) 13.16 ± .34 12.87 ± .33 -0.28 (-0.85, 0.30)
F11+ (n=17) 12.62 ± .33 12.77 ± .32 -0.11 (-0.67, 0.45)
CON (n=21) 13.64 ± .28 12.65 ± .27 -0.70 (-1.08, -0.20)
33
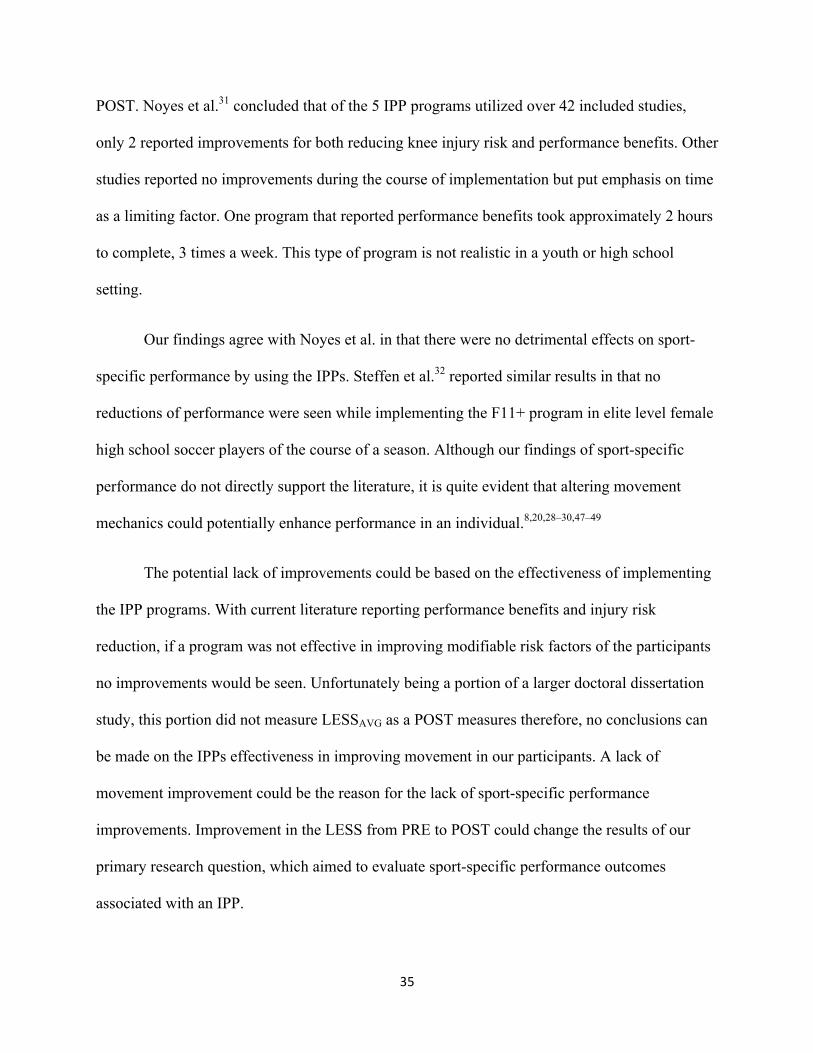
All participants (n=74, FOC (n=25), F11+ (n=24), CON (n=26)) who completed the
baseline test sessions were included in the correlation analysis. A positive correlation (R2= 0.11,
P=0.004) was found between LESSAVG and SDTBEST at PRE.
0.00 1.00 2.00 3.00 4.00 5.00 6.00 7.00 8.00 9.00 10.00 11.00
0.00 5.00 10.00 15.00 20.00 25.00 30.00
LESS
AVG
SDTBEST
Figure 2. Correlation Between LESSAVG and SDTBEST at PRE
R2 = 0.11

34
CHAPTER V
DISCUSSION
The current literature makes it abundantly clear that there is a need for IPPs based on
injury data alone.1–4,7,42 Injuries affect adolescent athletes each year, with the female population
at the highest risk. No individual risk factor alone has been show to play a specific role in these
injuries however there is evidence to show potential causes in culmination.6,9,12,40,43,44 Clinical
assessment tools have been established to help access injury risk and have been useful in
determining the effectiveness of IPPs.13 These same IPPs, even with their injury risk reduction,
are being underutilized in youth sports for reasons such as time, cost, education, and a lack of
desire to adopt the programs.45,46 In attempt to combat the lack of IPP utilization, researchers
began to assess IPPs effects on performance.5,8,15,31,32 IPPs displayed improvements in
performance for strength, speed, agility, endurance, and balance8,28–33 and play a role in all
sports. 30,34–36
Sport-specific performance benefits may hold the key to increasing program utilization
and compliance. Performance in sport is crucial to success; however, basic measures of
performance alone are not appropriate measures one’s success in a sport. Current evidence shows
that IPPs can help improve general performance but there is no current literature to support any
improvement in sport-specific performance skills.30 Evidence to support sport-specific skill
improvement could offer advocacy for adherence for IPPs.
Despite not identifying any improvements in sport-specific performance with IPPs, our
results indicated that there were no negative impacts by implementing these IPPs on sport-
specific performance, seen by negative average SDTCHANGE scores for all warm-up groups at
35
POST. Noyes et al.31 concluded that of the 5 IPP programs utilized over 42 included studies,
only 2 reported improvements for both reducing knee injury risk and performance benefits. Other
studies reported no improvements during the course of implementation but put emphasis on time
as a limiting factor. One program that reported performance benefits took approximately 2 hours
to complete, 3 times a week. This type of program is not realistic in a youth or high school
setting.
Our findings agree with Noyes et al. in that there were no detrimental effects on sport-
specific performance by using the IPPs. Steffen et al.32 reported similar results in that no
reductions of performance were seen while implementing the F11+ program in elite level female
high school soccer players of the course of a season. Although our findings of sport-specific
performance do not directly support the literature, it is quite evident that altering movement
mechanics could potentially enhance performance in an individual.8,20,28–30,47–49
The potential lack of improvements could be based on the effectiveness of implementing
the IPP programs. With current literature reporting performance benefits and injury risk
reduction, if a program was not effective in improving modifiable risk factors of the participants
no improvements would be seen. Unfortunately being a portion of a larger doctoral dissertation
study, this portion did not measure LESSAVG as a POST measures therefore, no conclusions can
be made on the IPPs effectiveness in improving movement in our participants. A lack of
movement improvement could be the reason for the lack of sport-specific performance
improvements. Improvement in the LESS from PRE to POST could change the results of our
primary research question, which aimed to evaluate sport-specific performance outcomes
associated with an IPP.
36
Our secondary purpose, exploring the relationship between sport-specific performance
and movement mechanics, showed a connection between proper movement and high sport-
specific performance. The results indicated a positive relationship between sport-specific
performance and movement, identified by the SDTBEST and LESS. The results identify a
statistically significant relation in which participants with higher, or worse, LESSPRE scores
correlated with slower, or worse, SDTBEST at PRE. Although correlation does not identify
causation, with the LESS only contributed determining a small amount of the SDT scores, it
supports current literature identifying a significant relationship between proper and ideal
biomechanics and improvements in performance outcomes10,11,20,22,33. Our sport-specific
performance measure was made up of general movement demands, athleticism, and repeatable
sport-specific skills needed to complete a sport task. Because of our measures components,
improvements of sport-specific performance and proper biomechanical movement could be
associated with one another.
Our sport-specific task, SDT, required participants to display athleticism, through general
performance, and decision-making within the scope of their respective sport. Our criteria for the
SDT’s effectiveness was measured by achieving faster shuttle dribble task scores on average
while advancing the sport level; varsity level participants being the best performers compared to
junior varsity who performed better than freshman level participants. The SDT was found to be a
successful tool in evaluating sport-specific performance between groups across all sports because
we did see a pattern of faster SDTBEST times as sport level increased (see Table 3 in Appendix).
Additionally the SDT developed for volleyball was developed to duplicate the SDT task
for soccer and field hockey38,39. The scores for volleyball were in between the minimum and
maximum scores seen in soccer and field hockey, showing that the time the task took to
37
complete was no more or less taxing than what had been previously developed. The task was
developed through observation of commonly seen movements within volleyball and drills
typically used in a practice. The task proved to be effective for volleyball players by displaying a
similar trend of scores based on sporting level. Although junior varsity volleyball had the fastest
SDT time, they were not significantly different than the varsity team. The high school in this
study has an extremely competitive program and commonly added players from the junior
varsity to the varsity roster for state playoffs. The similarity between the two sport levels is likely
due to their common skill level. The SDT should continue to be used as a tool for measuring
sport-specific performance for soccer, field hockey, and volleyball.
This study provides a new path towards gathering better program compliance. Coaches
most commonly excuse their lack of program utilization to the time it takes away from their
practices.10,50 Results across groups for the SDT can show that the IPP warm up groups versus
the control group do not diminish an athletes’ ability to perform within their sport. Even though
there were no direct improvements in sport-specific performance found in this study, its
contribution to the literature could offer a justification that implementing IPPs will not “take
away” from practice time. Regardless to our findings, the literature shows that IPPs programs
benefit our athletes with improvements in performance and injury reduction. Therefore the
benefits of the IPPs outweigh the falsely proposed time lost from practice.
Limitations
As a true field study, limitations were found and improvements could be made in the
future. First and foremost we saw a dropout of 21 participants from PRE to POST. The loss of
those 21 participants greatly affected the variability of the groups. There was a 9 participant
reduction in the FOC group, 7 participant reductions in the F11+ group, and a 5 participant
38
reduction in the CON group. Having data for all 74 participants may have yielded different
results.
During the implementation of the warm-ups, we often found low attendance from some
participants due to conflicts of seasonal schedules. Participants were not required to attend the
daily implementation session if they were travelling for practice off of school grounds,
participating in a game, injured, or receiving athletic training services before practice. This left a
finite number of sessions each participant could attend. Missing any of the required
implementation sessions would negatively our results. Participants were encouraged to attend the
implementation at a designated time so practice could begin at the time coaches had determined
daily. The stipulations put in place significantly lowered our compliance because few
participants attended all of their required sessions. If our participants had more opportunities to
attend the warm-up sessions or warm up sessions occurred during games our results may have
differed and followed results seen in current literature.
Testing surface was limitations noted by participants from field hockey that identified
that the length of the grass was longer than they normally practiced upon. Players from all sports
were testing outside for the ease of data collection. Some PRE testing sessions included just
volleyball players, which perform their test indoors. All participants were tested on the same
surface for PRE and POST. Weather proved to be an issue during post testing of the SDT task
for a small number of participants. A light drizzle may have affected the grass on the outdoor
task resulting in suboptimal scoring for some participants in soccer, field hockey, and volleyball.
Volleyball participants who performed the SDT indoors were not affected. Although the study
did not differentiate by position within a sport, some position players, specifically goalies, noted
that the task was not completely indicative of their sport-specific performance.
39
Delimitations
There was a homogeneous population of only high school female athletes that were
randomized into groups to reduce any preexisting confounding factors between the groups.
Future Considerations
The study explored sport-specific performance outcomes associated with lower extremity
warm-up style IPPs, which has not been previously studied. Further improvements could be
made in warm-up implementation in regards to time of the programs, duration of the
implementation programs (more than just the sporting season), and addition of biomechanical
and performance measurements. Further studies need to focus on a method of acquiring better
attendance to implementation settings. Even if the coaches are on board with the program
adolescent players may not have the discipline to attend the sessions on their own free will. Our
study included only females; further research could explore similar outcomes and their
association with males. Additional sports where IPPs are commonly used could prove to be
beneficial for a broader population. Further studies exploring the improvements to performance
and biomechanics associated with IPPs and the possible long-term retention improvements on
sport-specific performance may offer different outcomes than the results found in this study.
Additionally our secondary research question offers insight for future research. We did
find a correlation between good biomechanics and better sport-specific performance, as
measured by the SDT, however we did not measure the biomechanical adaptations seen
following IPP implementation. In this case we cannot assume that our IPP was effective in
improving biomechanics. Fortunately the sport-specific performance measure was taken before
the IPP implementation therefore our correlation could still validate a sport-specific performance

40
outcome associated with proper IPP implementation. These findings can prove that there is a
direct sport-specific crossover benefit that can be associated with IPP implementation if it is an
effect improver of an athlete’s biomechanics.
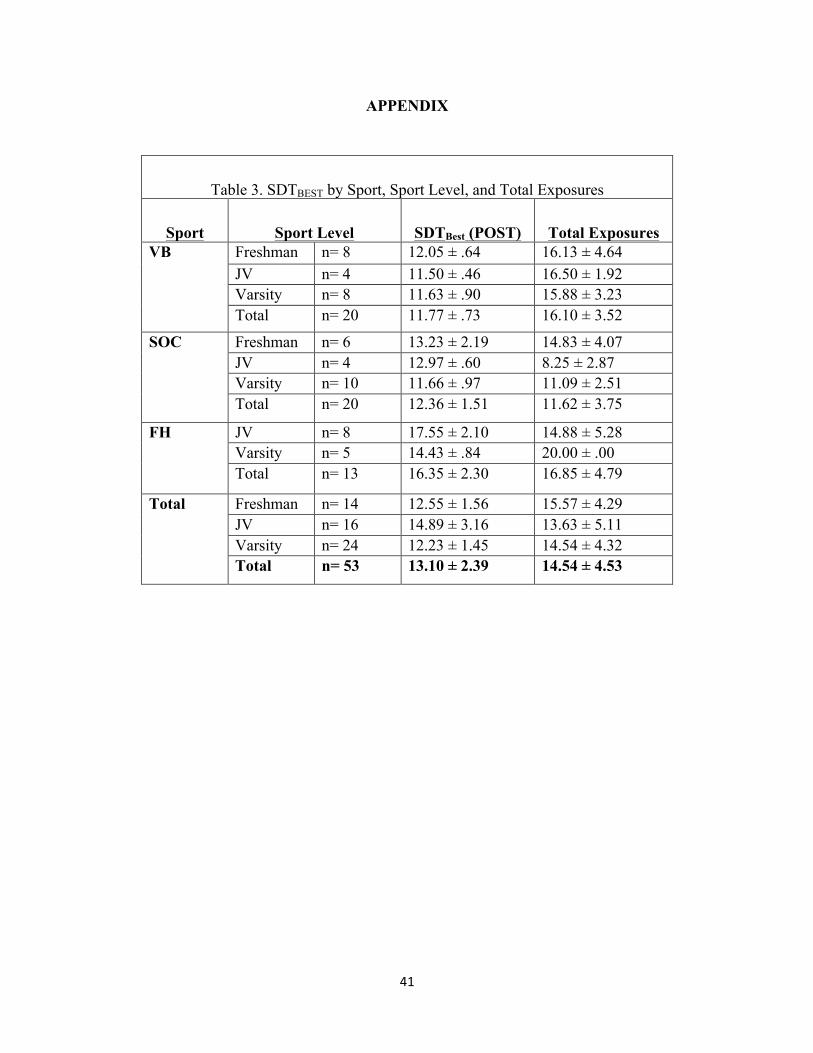
41
APPENDIX
Table 3. SDTBEST by Sport, Sport Level, and Total Exposures
Sport Sport Level SDTBest (POST) Total Exposures VB
Freshman n= 8 12.05 ± .64 16.13 ± 4.64 JV n= 4 11.50 ± .46 16.50 ± 1.92 Varsity n= 8 11.63 ± .90 15.88 ± 3.23 Total n= 20 11.77 ± .73 16.10 ± 3.52
SOC
Freshman n= 6 13.23 ± 2.19 14.83 ± 4.07 JV n= 4 12.97 ± .60 8.25 ± 2.87 Varsity n= 10 11.66 ± .97 11.09 ± 2.51 Total n= 20 12.36 ± 1.51 11.62 ± 3.75
FH
JV n= 8 17.55 ± 2.10 14.88 ± 5.28 Varsity n= 5 14.43 ± .84 20.00 ± .00 Total n= 13 16.35 ± 2.30 16.85 ± 4.79
Total
Freshman n= 14 12.55 ± 1.56 15.57 ± 4.29 JV n= 16 14.89 ± 3.16 13.63 ± 5.11 Varsity n= 24 12.23 ± 1.45 14.54 ± 4.32 Total n= 53 13.10 ± 2.39 14.54 ± 4.53
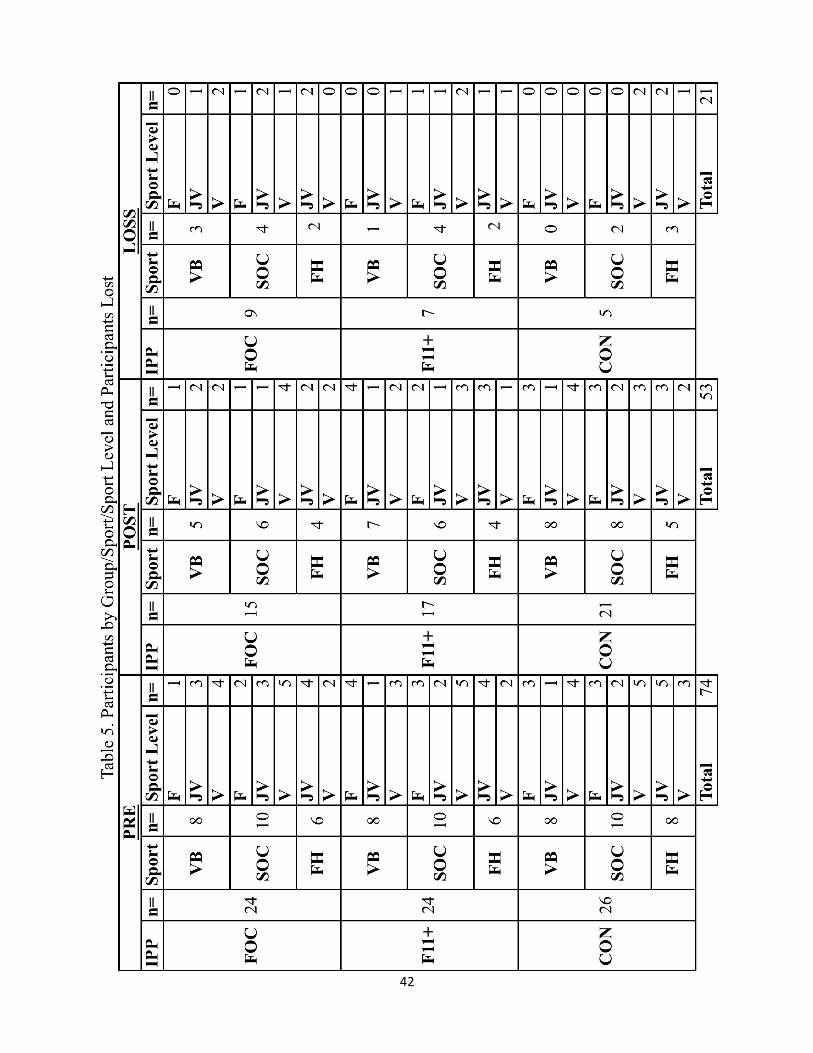
42
2 2
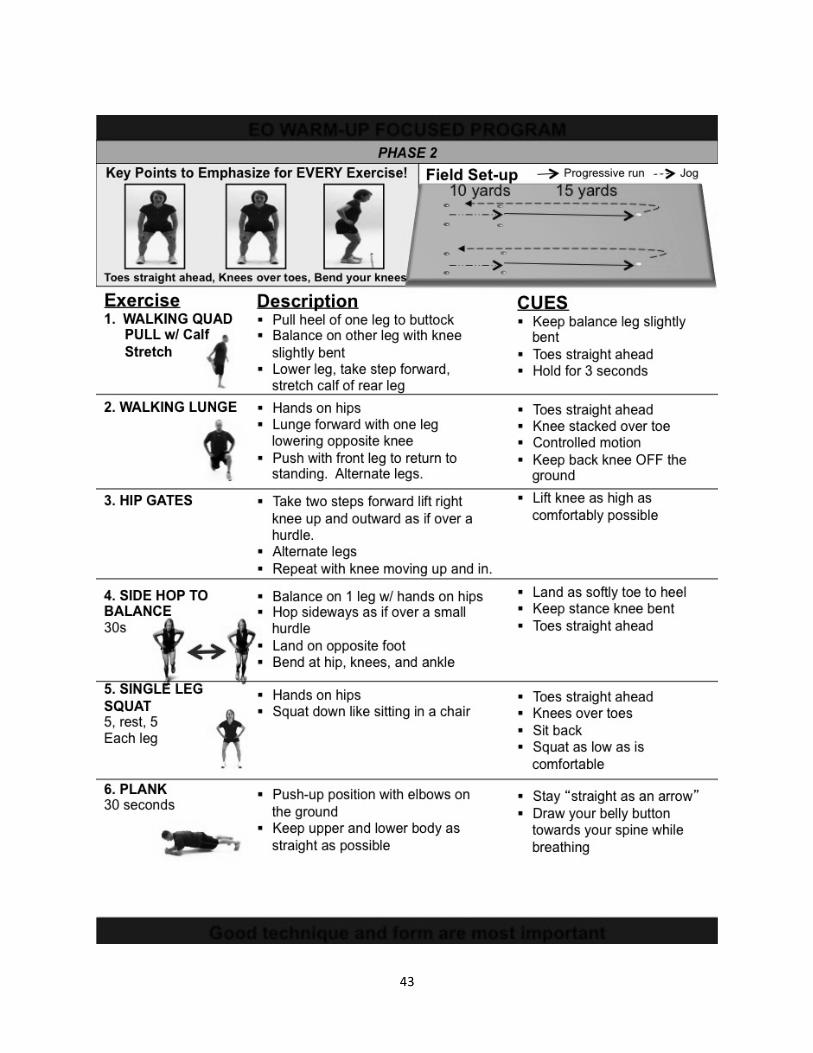
43
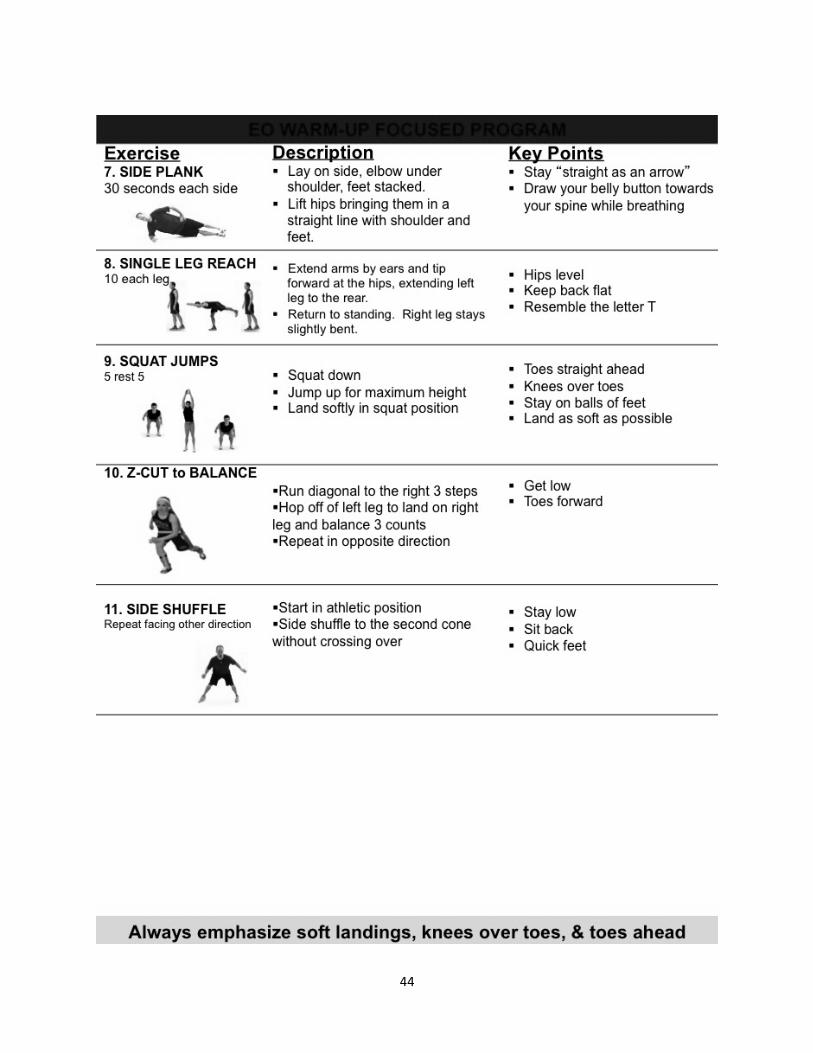
44
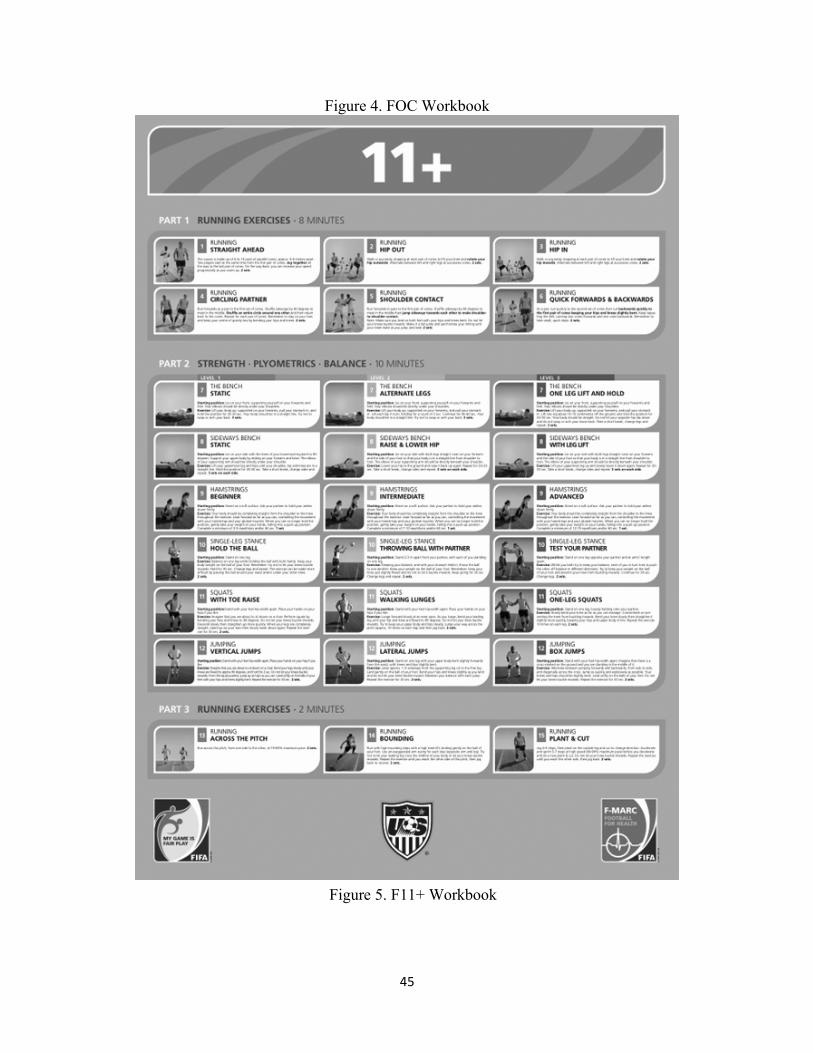
45
Figure 4. FOC Workbook
Figure 5. F11+ Workbook
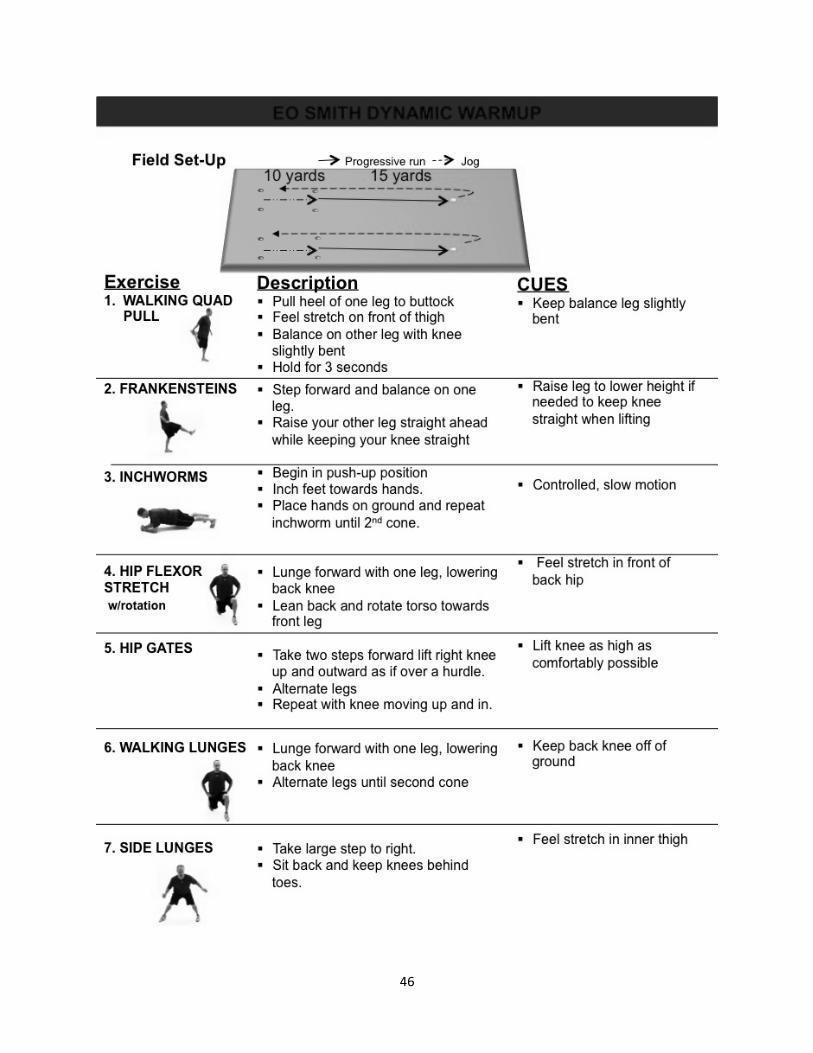
46
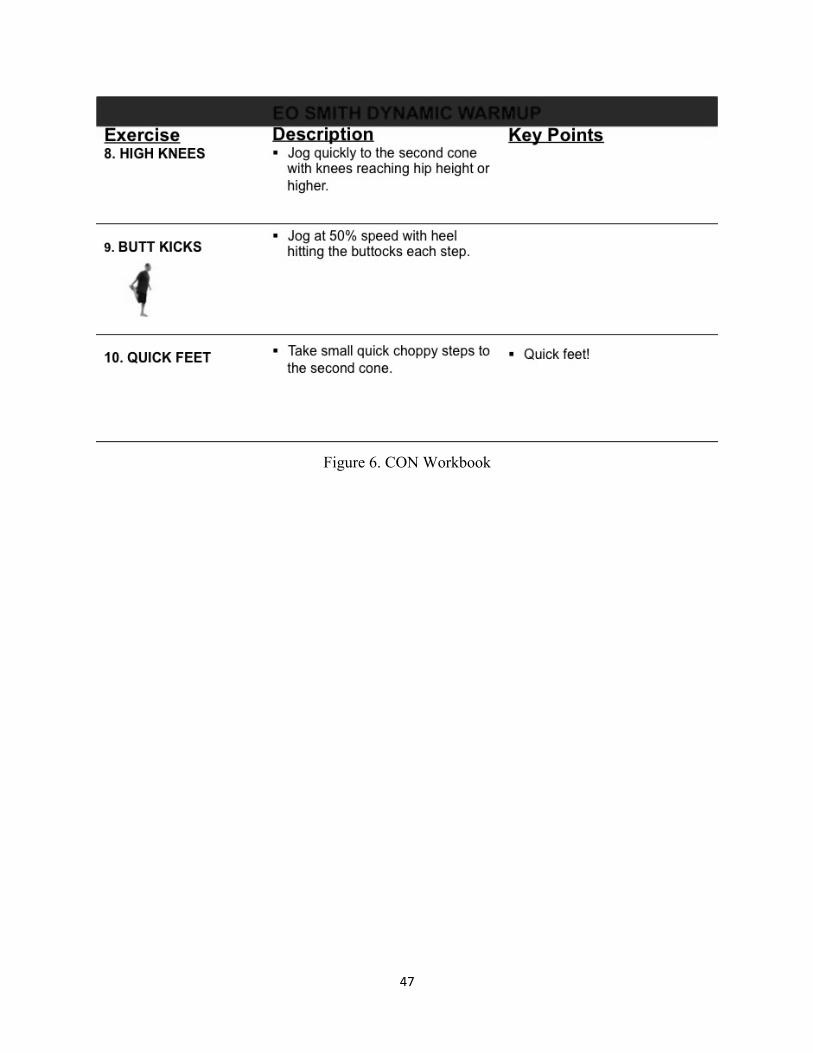
47
Figure 6. CON Workbook
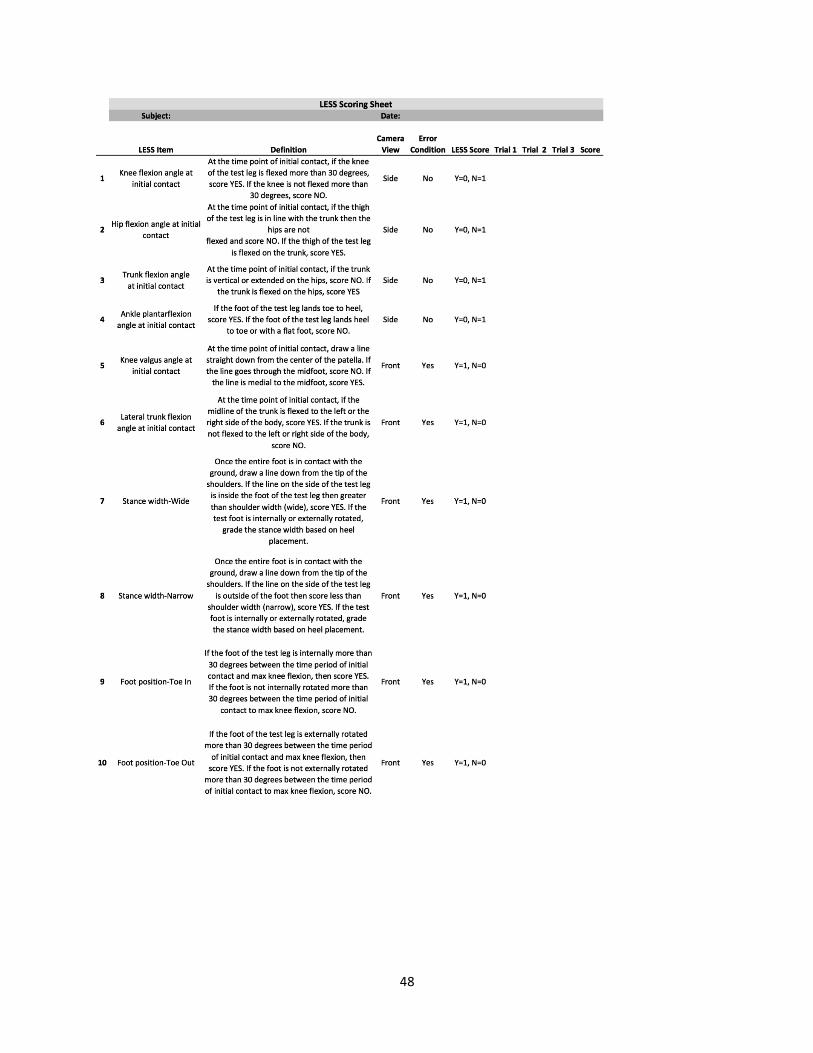
48
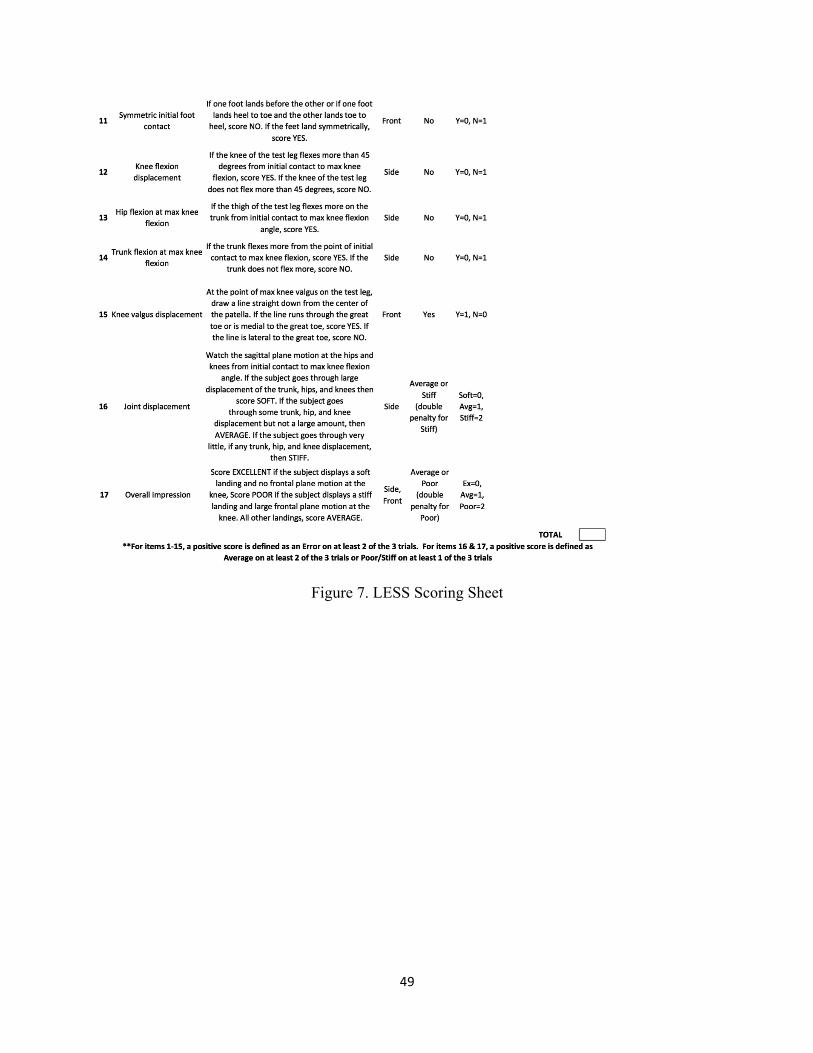
49
Figure 7. LESS Scoring Sheet
50
REFERENCES
1. Yard EE, Collins CL, Comstock RD. A comparison of high school sports injury surveillance data reporting by certified athletic trainers and coaches. J Athl Train. 2009;44(6):645–52. doi:10.4085/1062-6050-44.6.645.
2. Comstock RD, Collins CL, Currie DW. National High School Sports-Related Injury Surveillance Study 2012-2013. 2014.
3. Comstock RD, Currie DW, Pierpoint LA. National High School Sports-Related Injury Surveillance Study 2013-2014. 2015.
4. Fernandez WG, Yard EE, Comstock RD. Epidemiology of lower extremity injuries among U.S. high school athletes. Acad Emerg Med. 2007;14(7):641–5. doi:10.1197/j.aem.2007.03.1354.
5. Voskanian N. ACL Injury prevention in female athletes: review of the literature and practical considerations in implementing an ACL prevention program. Curr Rev Musculoskelet Med. 2013;6(2):158–63. doi:10.1007/s12178-013-9158-y.
6. McLean SG, Beaulieu ML. Complex integrative morphological and mechanical contributions to ACL injury risk. Exerc Sport Sci Rev. 2010;38(4):192–200. doi:10.1097/JES.0b013e3181f450b4.
7. Ireland ML. The female ACL: why is it more prone to injury? Orthop Clin North Am. 2002;33(4):637–51. Available at: http://www.ncbi.nlm.nih.gov/pubmed/12528906.
8. Vescovi JD, VanHeest JL. Effects of an anterior cruciate ligament injury prevention program on performance in adolescent female soccer players. Scand J Med Sci Sports. 2010;20(3):394–402. doi:10.1111/j.1600-0838.2009.00963.x.
9. Ter Stege MHP, Dallinga JM, Benjaminse A, Lemmink K a PM. Effect of interventions on potential, modifiable risk factors for knee injury in team ball sports: a systematic review. Sports Med. 2014;44(10):1403–26. doi:10.1007/s40279-014-0216-4.
10. Myklebust G, Engebretsen L, Braekken IH, Skjølberg A, Olsen O-E, Bahr R. Prevention of anterior cruciate ligament injuries in female team handball players: a prospective intervention study over three seasons. Clin J Sport Med. 2003;13(2):71–78. doi:10.1097/00042752-200303000-00002.
11. Soligard T, Myklebust G, Steffen K, et al. Comprehensive warm-up programme to prevent injuries in young female footballers: cluster randomised controlled trial. 2008;(December). doi:10.1136/bmj.a2469.
51
12. Yeung SS, Suen a MY, Yeung EW. A prospective cohort study of hamstring injuries in competitive sprinters: preseason muscle imbalance as a possible risk factor. Br J Sports Med. 2009;43(8):589–94. doi:10.1136/bjsm.2008.056283.
13. Padua D a, Marshall SW, Boling MC, Thigpen C a, Garrett WE, Beutler AI. The Landing Error Scoring System (LESS) Is a valid and reliable clinical assessment tool of jump-landing biomechanics: The JUMP-ACL study. Am J Sports Med. 2009;37(10):1996–2002. doi:10.1177/0363546509343200.
14. Padua D a, Distefano LJ. Sagittal Plane Knee Biomechanics and Vertical Ground Reaction Forces Are Modified Following ACL Injury Prevention Programs: A Systematic Review. Sports Health. 2009;1(2):165–73. doi:10.1177/1941738108330971.
15. Graziano J, Green D, Cordasco F. Anterior Cruciate Ligament Injury Prevention in the Young Athlete: Evidence-Based Application. Strength Cond J. 2013:89–97. Available at: http://scholar.google.com/scholar?hl=en&btnG=Search&q=intitle:Anterior+Cruciate+Ligament+Injury+Prevention+in+the+Young+Athlete+:+Evidence-Based+Application#0. Accessed December 5, 2013.
16. Laughlin W a, Weinhandl JT, Kernozek TW, Cobb SC, Keenan KG, O’Connor KM. The effects of single-leg landing technique on ACL loading. J Biomech. 2011;44(10):1845–51. doi:10.1016/j.jbiomech.2011.04.010.
17. Silvers HJ, Mandelbaum BR. ACL Injury Prevention in the Athlete. Sport - Sport - Sport Orthop Traumatol. 2011;27(1):18–26. doi:10.1016/j.orthtr.2011.01.010.
18. Hewett TE, Johnson DL. ACL prevention programs: fact or fiction? Orthopedics. 2010;33(1):36–9. doi:10.3928/01477447-20091124-19.
19. Lamontagne M, Caraffa A, Cerulli G. Neuromuscular strategy to prevent ACL injury. Gait Posture. 2009;30(2009):S23–S24. doi:10.1016/j.gaitpost.2009.07.106.
20. DiStefano LJ, Blackburn JT, Marshall SW, Guskiewicz KM, Garrett WE, Padua D a. Effects of an age-specific anterior cruciate ligament injury prevention program on lower extremity biomechanics in children. Am J Sports Med. 2011;39(5):949–57. doi:10.1177/0363546510392015.
21. Kiani A, Hellquist E. Prevention of soccer-related knee injuries in teenaged girls. Arch …. 2010;170(1):43–49. Available at: http://archpsyc.jamanetwork.com/article.aspx?articleid=481521. Accessed November 28, 2014.
22. Mandelbaum BR, Silvers HJ, Watanabe DS, et al. Effectiveness of a neuromuscular and proprioceptive training program in preventing anterior cruciate ligament injuries in female athletes: 2-year follow-up. Am J Sports Med. 2005;33(7):1003–10. doi:10.1177/0363546504272261.
52
23. Giza ER, Silvers HJ, Mandelbaum BR. Anterior cruciate ligament tear prevention in the female athlete. Curr Sports Med Rep. 2005;4(6):341–3. Available at: http://www.ncbi.nlm.nih.gov/pubmed/16282037.
24. Macaluso T. Anterior Cruciate Ligament Injury Prevention for Female High School Athletes. Strength Cond J. 2012;34(5):56–59. Available at: http://scholar.google.com/scholar?hl=en&btnG=Search&q=intitle:Anterior+Cruciate+Ligament+Injury+Prevention+for+Female+High+School+Athletes#0. Accessed December 5, 2013.
25. Trojian T, DiStefano L. Prevention of Anterior Cruciate Ligament Injury in Athletes : A Review. Clin J Sport Med. 2013;23(2):120–121. doi:10.1136/bjsports-2011-090664.2.
26. Walden M, Atroshi I, Magnusson H, Wagner P, Hagglund M. Republished research: Prevention of acute knee injuries in adolescent female football players: cluster randomised controlled trial. Br J Sports Med. 2012;46(13):904–904. doi:10.1136/bjsports-2012-e3042rep.
27. Waldén M, Atroshi I, Magnusson H, Wagner P, Hägglund M. Prevention of acute knee injuries in adolescent female football players: cluster randomised controlled trial. BMJ. 2012;344(May):e3042. doi:10.1136/bmj.e3042.
28. DiStefano LJ, Padua DA, Blackburn JT, Garrett WE, Guskiewicz KM, Marshall SW. Intergrated Injury Prevention Program Improves Balance and Vertical Jump Height in Children. J Strength Cond Res. 2010;24(2):332–342.
29. McGill S. Core Training: Evidence Translating to Better Performance and Injury Prevention. Strength Cond J. 2010;32(3):33–46. doi:10.1519/SSC.0b013e3181df4521.
30. Nikolenko M, Brown L. Relationship between core power and measures of sport performance. Kinesiol ( …. 2011;43:163–168. Available at: http://www.researchgate.net/publication/228462932_RELATIONSHIP_BETWEEN_CORE_POWER_AND_MEASURES_OF_SPORT_PERFORMANCE/file/32bfe5137a40a0dc2a.pdf. Accessed December 6, 2013.
31. Noyes FR, Barber Westin SD. Anterior Cruciate Ligament Injury Prevention Training in Female Athletes: A Systematic Review of Injury Reduction and Results of Athletic Performance Tests. Sport Heal A Multidiscip Approach. 2012;4(1):36–46. doi:10.1177/1941738111430203.
32. Steffen K, Bakka HM, Myklebust G, Bahr R. Performance aspects of an injury prevention program: A ten-week intervention in adolescent female football players. Scand J Med Sci Sport. 2008;18(5):596–604. doi:10.1111/j.1600-0838.2007.00708.x.
33. Emery C a., Cassidy JD, Klassen TP, Rosychuk RJ, Rowe BH. Effectiveness of a home-based balance-training program in reducing sports-related injuries among healthy
53
adolescents: A cluster randomized controlled trial. Cmaj. 2005;172(6):749–754. doi:10.1503/cmaj.1040805.
34. Buchheit M. Repeated-sprint performance in team sport players: associations with measures of aerobic fitness, metabolic control and locomotor function. Int J Sports Med. 2012;33(3):230–9. doi:10.1055/s-0031-1291364.
35. Coburn JW. Measuring power. Strength Cond J. 2012;34:25–28. Available at: http://citeseerx.ist.psu.edu/viewdoc/download?doi=10.1.1.1.1998&rep=rep1&type=pdf. Accessed March 10, 2014.
36. Fry A, Kraemer W. Physical Performance Characteristics of American Collegiate Football Players. J Strength Cond …. 1991. Available at: http://journals.lww.com/nsca-jscr/Abstract/1991/08000/Physical_Performance_Characteristics_of_American.4.aspx. Accessed March 23, 2014.
37. SILVESTRE R, WEST C. Body Composition and Physical Performance in Men’s Soccer: A Study of a National Collegiate Athletic Association Division I Team. J …. 2006;20(1):177–183. Available at: http://journals.lww.com/nsca-jscr/Abstract/2006/02000/Body_Composition_and_Physical_Performance_in_Men_s.29.aspx. Accessed March 23, 2014.
38. Lemmink K a PM. Evaluation of the reliability of two field hockey specific sprint and dribble tests in young field hockey players. Br J Sports Med. 2004;38(2):138–142. doi:10.1136/bjsm.2002.001446.
39. Huijgen BCH, Elferink-Gemser MT, Post WJ, Visscher C. Soccer skill development in professionals. Int J Sports Med. 2009;30(8):585–91. doi:10.1055/s-0029-1202354.
40. Theiss JL, Gerber PJ, Cameron KL, et al. Jump-Landing Differences between Varsity, Club, and Intramural Athletes: The Jump-ACL study. J Strength Cond Res. 2013. doi:10.1519/JSC.0b013e3182a1fdcd.
41. FIFA, F-MARC. The “11+” Manual.; 2007.
42. Louw Q, Manilall J, Grimmer K. Epidemiology of knee injuries in adolescents: a review. Clin J Sport Med. 2009;19(2):150–154. doi:10.1136/bmj.a439.Objective.
43. Ruedl G, Ploner P, Linortner I, et al. Interaction of potential intrinsic and extrinsic risk factors in ACL injured recreational female skiers. Int J Sports Med. 2011;32(8):618–22. doi:10.1055/s-0031-1275355.
44. Smith HC, Vacek P, Johnson RJ, et al. Risk factors for anterior cruciate ligament injury: a review of the literature-part 2: hormonal, genetic, cognitive function, previous injury, and extrinsic risk factors. Sports Health. 2012;4(2):155–61. doi:10.1177/1941738111428282.
54
45. Soligard T, Nilstad A, Steffen K, et al. Compliance with a comprehensive warm-up programme to prevent injuries in youth football. Br J Sports Med. 2010;44(11):787–793. doi:10.1136/bjsm.2009.070672.
46. Van Beijsterveldt a MC, van der Horst N, van de Port IGL, Backx FJG. How effective are exercise-based injury prevention programmes for soccer players? : A systematic review. Sports Med. 2013;43(4):257–65. doi:10.1007/s40279-013-0026-0.
47. Kong DH, Yang SJ, Ha JK, Jang SH, Seo JG, Kim JG. Validation of functional performance tests after anterior cruciate ligament reconstruction. Knee Surg Relat Res. 2012;24(1):40–5. doi:10.5792/ksrr.2012.24.1.40.
48. Katayama M, Higuchi H, Kimura M, et al. Proprioception and performance after anterior cruciate ligament rupture. Int Orthop. 2004;28(5):278–81. doi:10.1007/s00264-004-0583-9.
49. Engelen-van Melick N, van Cingel REH, Tijssen MPW, Nijhuis-van der Sanden MWG. Assessment of functional performance after anterior cruciate ligament reconstruction: a systematic review of measurement procedures. Knee Surg Sports Traumatol Arthrosc. 2013;21(4):869–79. doi:10.1007/s00167-012-2030-6.
50. Martinez JC. Youth Sport Coaches’ Beliefs and Influences on Injury Prevention Program Implementation.; 2015.