Embed Size (px)
Citation preview

ABSTRACT
Title of thesis: THE EVALUATION OF A PERFORMANCE-BASED DESIGN
PROCESS FOR A HOTEL BUILDING: THE COMPARISON OF TWO EGRESS MODELS
Erica Dawn Kuligowski, Master of Science, 2003
Thesis directed by: Professor James A. Milke Department of Fire Protection Engineering This work emphasizes the importance for egress model users to choose a model
for each project with the appropriate input features and simulation capabilities. This
report also gives model users a mechanism for choosing the appropriate model by
providing a detailed egress model review (Chapter 2).
Specifically this report focuses on the ability of two egress models, EXIT89 and
Simulex, to simulate a high-rise hotel building evacuation. When EXIT89 and Simulex
are used to 1) simulate the same design scenarios and 2) perform a bounding analysis of
the hotel building, significant differences in egress times were identified. EXIT89’s
evacuation times were found to be 25-40% lower than Simulex for the design scenarios,
attributed to differences in unimpeded speeds, movement algorithms, methods of
simulating slow occupants, density in the stairs, and stair configuration input between the
models. For the bounding analysis, EXIT89 produced maximum evacuation times 30-
40% lower than Simulex.


THE EVALUATION OF A PERFORMANCE-BASED DESIGN PROCESS FOR A
HOTEL BUILDING: THE COMPARISON OF TWO EGRESS MODELS
by
Erica D. Kuligowski
Thesis submitted to the Faculty of the Graduate School of the University of Maryland, College Park in partial fulfillment
of the requirements for the degree of Master of Science
2003
Advisory Committee: Professor James A. Milke, Chair
Professor Emeritus John L. Bryan Dr. Kathy A. Notarianni, NIST


i
ACKNOWLEDGEMENTS
I would like to extend a special thanks to my committee members, Dr. James
Milke, Dr. John Bryan, and Dr. Kathy Notarianni (NIST). Your comments and
suggestions along the way were insightful and motivational.
Thank you to Dr. Rita Fahy from the National Fire Protection Association
(developer of EXIT89) and Dr. Peter Thompson from Integrated Environmental
Solutions (developer of Simulex) for your guidance in the use of your models and egress
modeling in general. Also thanks to Dr. Steve Gwynne from the University of
Greenwich, Dr. Ed Galea from the University of Greenwich, and Dr. David Purser from
the Building Research Establishment for your guidance and work in the field of egress
modeling.
I would like to extend a special thanks to all of the model developers who aided in
my understanding of their individual models by answering emails, phone calls, and/or
sending publications. These individuals are the following:
• Dr. Ai Sekizawa, National Research Institute of Fire and Disaster, Japan
• Dr. Mina Nakano, Konoike Construction, Japan
• Dr. Leong Poon, Warrington Fire Research (Aust) Pty Ltd
• Dr. Volker Schneider, I.S.T. Integrierte Sicherheits-Technik GmbH, Germany
• Mr. Joseph A. Cappuccio, P.E., Rolf Jensen & Associates, Inc.
• Dr. Geir Jensen, Interconsult, ASA, Norway
• Dr. Takeyoshi Tanaka, Kyoto University
• Dr. Filiz Ozel, Arizona State University, School of Architecture

ii
• Mr. Peter Simenko, SimCo Consulting, AU
• Dr. G. Keith Still, Crowd Dynamics Ltd., UK
• Mr. Eric Pellissier, Simulation Group - Mott MacDonald
• Mr. Chris du Sautoy, Halcrow, Inc.
Also, I would like to extend thanks to a group of individuals who provided me
with the necessary pieces of information to put this entire thesis together. These
individuals provided sources of data, information about certain egress models, statistical
information on the use of hotels in the U.S., and key contacts to obtain needed
information. These individuals are the following:
• Mr. Jamie Lord, Arup
• Mr. Jarrod Alston, Arup
• Dr. Brian Meacham, Arup
• Mrs. Stacy Welsh, Marriott Corporate Fire Protection
• Mr. David Hang, Marriott Corporate Fire Protection
• Ms. Christina Shumacher, Marriott International
• Mr. Harold E. Nelson, contractor with the National Institute of Standards and
Technology
• Mr. Richard Peacock, National Institute of Standards and Technology
• Mr. Richard Bukowski, National Institute of Standards and Technology
• Mr. Grunde Jomass, PhD student at Princeton
• Dr. Guylene Proulx, National Research Council, Canada
• Dr. Karen Boyce, University of Ulster

iii
Lastly, I would like to thank Charles Rivet and my mother and father, Vivian and
George Kuligowski. You are very dear to me . . . thank you so much for your love and
support.

iv
TABLE OF CONTENTS
List of Tables and Figures................................................................................................. vii Executive Summary ............................................................................................................ 1 Introduction to Thesis ......................................................................................................... 7 Chapter 1: Introduction to Evacuation Modeling ............................................................ 13
Purpose of Evacuation Models ..................................................................................... 15 Evacuation Model History ............................................................................................ 17 Categorization of Evacuation Models........................................................................... 23 SFPE Guidelines for Choosing a Model....................................................................... 37 Evacuation Modeling Limitations................................................................................. 38
Chapter 2: Comprehensive Review of Past and Present Evacuation Models.................. 45
Movement Models ........................................................................................................ 49 Section 2.1 Egress Section in FPETool .................................................................... 49 Section 2.2 EVACNET4........................................................................................... 54 Section 2.3 Takahashi’s Fluid Model ....................................................................... 59 Section 2.4 PathFinder .............................................................................................. 63 Section 2.5 TIMTEX ................................................................................................ 66 Section 2.6 WAYOUT.............................................................................................. 69 Section 2.7 Magnetic Model ..................................................................................... 73 Section 2.8 EESCAPE (Emergency Escape) ............................................................ 77 Section 2.9 EgressPro ............................................................................................... 79 Section 2.10 ENTROPY ........................................................................................... 82 Section 2.11 STEPs................................................................................................... 87
Partial Behavioral Models............................................................................................. 94 Section 2.12 PEDROUTE and PAXPORT............................................................... 94 Section 2.13 EXIT89 ................................................................................................ 98 Section 2.14 Simulex .............................................................................................. 106 Section 2.15 GridFlow............................................................................................ 116 Section 2.16 ALLSAFE.......................................................................................... 123
Behavioral Models ...................................................................................................... 128 Section 2.17 CRISP3 .............................................................................................. 128 Section 2.18 ASERI ................................................................................................ 136 Section 2.19 BFIRES-2........................................................................................... 145 Section 2.20 buildingEXODUS.............................................................................. 154 Section 2.21 EGRESS............................................................................................. 162 Section 2.22 EXITT................................................................................................ 169 Section 2.23 VEgAS,,:............................................................................................. 175 Section 2.24 E-SCAPE ........................................................................................... 180 Section 2.25 BGRAF .............................................................................................. 185 Section 2.26 EvacSim ............................................................................................. 192 Section 2.27 Legion ................................................................................................ 198

v
Section 2.28 Myriad................................................................................................ 201 Summary ..................................................................................................................... 206
Chapter 3: Four Factors of Egress Modeling.................................................................. 215 Chapter 4: Four Factors of Egress Related to a Hotel Evacuation ................................. 219 Chapter 5: Description of EXIT89 and Simulex and Key Features Relating to a Hotel Evacuation....................................................................................................................... 227
EXIT89 ....................................................................................................................... 227 Features of EXIT89 that are Specific to a Hotel Evacuation...................................... 234 Simulex ....................................................................................................................... 235 Features of Simulex that are Specific to a Hotel Evacuation...................................... 240
Chapter 6: Using EXIT89 and Simulex in a Performance-Based Design ...................... 242
Performance-Based Design Process ........................................................................... 242 Overview of the Input Matrix for Each Model ........................................................... 246 Examples of Evacuation Scenarios for a Hotel Building............................................ 250 Input Matrices for Best and Worst Case Scenarios using EXIT89 and Simulex........ 252 Missing Egress Factors from EXIT89 or Simulex...................................................... 254 Current Evacuation Models that can Account for Some of these Missing Factors .... 257
Chapter 7: Design Scenario for Guest Bedroom Hotel Fire ........................................... 261
The Fire....................................................................................................................... 261 Delay Times ................................................................................................................ 265 Occupant Distribution for Fire Scenario..................................................................... 268 Building Configuration ............................................................................................... 271
Chapter 8: Description of the Evacuation Simulations Run with EXIT89 and Simulex 275
Comparison Run for Simulex: .................................................................................... 276 Simulex Input for 3 a.m. Cigarette Burn in a Guest Bedroom: .................................. 279 Comparison Run for EXIT89: .................................................................................... 280 EXIT89 Input for 3 a.m.Cigarette Burn in a Guest Bedroom..................................... 289 Additional Bounding Analysis Runs for Simulex: ..................................................... 289 Additional Bounding Analysis Runs for EXIT89....................................................... 295
Chapter 9: Results and Analysis of Differences in Models ............................................ 300
Fire Comparison Runs ................................................................................................ 301 Possible Reasons for the Differences in the Results Given by Simulex and EXIT89:303
Stair configuration input ......................................................................................... 304 Difference in body sizes.......................................................................................... 311 Difference in unimpeded speeds............................................................................. 312 Difference in the number of occupants in a staircase section at one time .............. 315 Differences in speed on stairs discovered by comparing movement correlations .. 321 Differences in evacuation time when 99% of occupants evacuate the building..... 326 Differences in the way each model handles slower moving occupants.................. 330

vi
Differences in the way each model handles response distributions........................ 335 Bounding Results ........................................................................................................ 335 Difficulties in Analyzing the Output of Each Model.................................................. 339 Discussion of Results.................................................................................................. 340
Chapter 10: Conclusions ................................................................................................. 344
Future Work ................................................................................................................ 353 Recommendations for Model Developers .................................................................. 354
References....................................................................................................................... 356

vii
LIST OF TABLES AND FIGURES Figure 1.1: Primary organization of egress models ......................................................... 13 Figure 1.2: Decomposition diagram showing behaviors from multiple occupancies ..... 14 Figure 2.1: FPETool egress equations ............................................................................. 52 Figure 2.2: EVACNET4 building structure - nodes and arcs ......................................... 55 Table 2.1: EVACNET4 Output........................................................................................ 57 Table 2.2: Results of validation study for EVACNET+.................................................. 58 Figure 2.3: EVACNET diagram incorporating elevator use .......................................... 59 Figure 2.4: Occupant movement in a room following the centripetal approach ............ 61 Table 2.3: Validation results from the Tukuba International Expo ................................. 63 Figure 2.5: Window from output of TIMTEX ................................................................ 68 Figure 2.6: Example of how nodes are labeled in EVACNET4 ..................................... 70 Table 2.4: Milburn House validation results for EVACNET4 ........................................ 72 Table 2.5: EXIT89 validation study results from the 7-story office building ................ 103 Table 2.6: EXIT89 validation study results from the department store......................... 104 Figure 2.9: Example of visualization of the distance map in Simulex ........................... 107 Figure 2.10: Example of the velocity vs. inter-person distance used for the movement
algorithm in Simulex .............................................................................................. 109 Table 2.7: Corresponding body sizes and initial velocity for various occupant types in
Simulex ................................................................................................................... 110 Table 2.8: Body sizes for various occupant types in Simulex ........................................ 111 Table 2.9: Validation study results for the Simulex model ............................................ 114 Table 2.10: Building/Occupant characteristics and the corresponding time effects ..... 125 Figure 2.13: Graphic of collision avoidance in CRISP .................................................. 131 Table 2.11: Matrix of ASERI delay times .................................................................... 137 Figure 2.16: Results from the ASERI validation studies of the theater ......................... 142 Figure 2.17: Behavioral cycle for each occupant in the BFIRES model ...................... 148 Figure 2.18: EXODUS submodel interaction ............................................................... 154 Figure 2.19: Example of cells on an egress plan .......................................................... 163 Table 2.12: Validation results for the EGRESS model.................................................. 168 Figure 2.21: The VEgAS model ................................................................................... 177 Figure 2.22: Examples of possible evacuation tasks for the E-Scape model ................ 182 Figure 2.23: Conceptual Structure of the BGRAF Model ............................................. 189 Table 2.13: Fruin data and corresponding colors for density on walkways used by the
Myriad model.......................................................................................................... 203 Table 2.14: Fruin data and corresponding colors for density on stairs .......................... 203 Table 2.15: Fruin data and corresponding colors for density in queues ........................ 204 Table 2.16: Fruin data and corresponding colors for density on platforms ................... 204 Table 2.17: Easy reference chart of egress models included in Chapter 2. ................... 211 Table 5.1: Input features of EXIT89 for each egress factor .......................................... 228 Table 5.2: Speed vs. density relationship throughout horizontal components and
doorways ................................................................................................................. 231 Table 5.3: Speed vs. density relationship for down stair components........................... 232 Table 5.4: Input features of Simulex for each egress factor .......................................... 236 Figure 5.1: Example graph of inter-person distance vs. velocity ................................. 237

viii
Table 5.5: Body type dimensions.................................................................................... 239 Table 5.6: Occupant types with corresponding body size and velocity.......................... 240 Figure 6.1: Timeline of the evacuation process ............................................................. 243 Table 6.1: Input choices for each model, EXIT89 and Simulex.................................... 250 Table 6.2: Best and worst case scenarios for EXIT89 ................................................... 254 Table 6.3: Best and worst case scenarios for Simulex................................................... 254 Table 6.4: Features of models that contribute to a hotel evacuation ............................. 258 Table 7.1: Top five causes of hotel fires for Years 1994-1998 ..................................... 262 Table 7.2: Top five causes of hotel fires involving civilian deaths ............................... 262 Table 7.3: Top five causes of hotel fires involving civilian injuries ............................. 263 Table 7.4: Top five causes of fires involving direct property damage .......................... 263 Table 7.5: Top five most frequent areas of origin for fires............................................ 263 Table 7.6: Most frequent areas of origin for civilian casualties .................................... 264 Table 7.7: Most frequent areas of origin for civilian injuries ........................................ 264 Table 7.8: Most frequent areas of origin for property damage ...................................... 264 Table 7.9: DIRECTIONS distributions of hotel stays in the U.S. ................................. 268 Table 7.10: AHLA distributions of hotel stays in the U.S............................................. 268 Table 7.11: Business stay distribution ........................................................................... 269 Table 7.12: Leisure stay distribution ............................................................................. 270 Table 7.13: Overall distribution of the hotel occupants - business and leisure ............. 270 Figure 7.1: An AutoCAD drawing of Floor 4 – changed to Floor 1 .............................. 272 Figure 7.2: An AutoCAD drawing of Floor 3 – adjusted to Floor 0 .............................. 273 Figure 7.3: Occupant Load on Floor 4 (adjusted to Floor 1) .......................................... 273 Figure 8.1: Simulex snapshot of separate stair building input....................................... 277 Figure 8.2: 7 nodes in hallway of 1st floor .................................................................... 281 Figure 8.3: 6 nodes in hallway of 1st floor ..................................................................... 282 Figure 8.4: 5 nodes in hallway of 1st floor .................................................................... 282 Figure 8.5: 4 nodes in hallway of 1st floor .................................................................... 283 Figure 8.6: 3 nodes in hallway of 1st floor .................................................................... 284 Figure 8.7: 2 nodes in hallway of 1st floor – Configuration 1....................................... 284 Figure 8.8: 2 nodes in hallway of 1st floor - Configuration 2 ....................................... 285 Figure 8.9: 1 node in center of hallway of 1st floor....................................................... 285 Table 8.1: Results of altering number of nodes in the hallway from 7 to 1................... 286 Table 9.1: Results of fire comparison run and additional disabled simulations ............ 302 Table 9.2: Simulex bounding simulations, no delay, used to compare the separated and
continuous stair configurations ............................................................................... 306 Table 9.3: Results of fire comparison run and additional disabled simulations with
addition of continuous stair simulations ................................................................. 311 Table 9.4: Body size comparison for each simulation................................................... 312 Table 9.5: Average unimpeded speeds on horizontal and stair components for each
model....................................................................................................................... 314 Table 9.6: Numbers of occupants inside the Left and Right Stairs sections (measuring
occupants on one story of stairs only) at specific points in time throughout the "hotel" simulation for EXIT89................................................................................ 317

ix
Table 9.7: Numbers of occupants inside the Left and Right Stairs (in between floors 2 and 3) at specific points in time throughout the "hotel" simulation for Simulex – Separate Stair .......................................................................................................... 318
Table 9.8: Numbers of occupants inside the Left and Right Stairs (in between floors 2 and 3) at specific points in time throughout the "hotel" simulation for Simulex – Continuous Stair...................................................................................................... 319
Figure 9.6: Graph showing velocity on horizontal components vs. Inter-person distance for both models ....................................................................................................... 324
Figure 9.7: Graph showing velocity on stairs vs. Inter-person distance for both models................................................................................................................................. 325
Table 9.9: Evacuation time when 99% of the occupants have evacuated the building . 327 Figure 9.8: A small portion of the population still left to evacuation in Simulex ......... 328 Figure 9.10: Snapshots taken from "hotel with disabled" simulation showing how slow
movers affect stair movement ................................................................................. 331 Figure 9.11: Snapshots taken from "hotel with disabled" simulation showing how slow
movers affect stair movement ................................................................................. 332 Table 9.10: Average stair section travel times for disabled vs. able occupants in Stair 3,
EXIT89 ................................................................................................................... 334 Table 9.11: Bounding results from the Simulex model ................................................. 336 Table 9.12: Bounding results from the EXIT89 model ................................................. 337 Figure 9.15: Evacuation times for simulations with no delay time ............................... 341 Figure 9.16: Evacuation times for simulations with a delay time.................................. 341 Figure 9.17: Evacuation times for the bounding results with and without delay times. 342 Table 10.1: Features of models that contribute to a hotel evacuation ........................... 346 Figure 10.1: Differences in evacuation times between EXIT89 and Simulex for
simulations without delay ....................................................................................... 350 Figure 10.2: Differences in evacuation times between EXIT89 and Simulex for
simulations with a delay.......................................................................................... 350 Figure 10.3: Differences in bounding results for EXIT89 and Simulex with and without
delay times .............................................................................................................. 352

1
EXECUTIVE SUMMARY With the move toward performance-based design, engineers have been looking to
evacuation computer models to assess a building’s life safety. Many times, the engineer
is tasked with the selection of one evacuation model for a specific project. Currently
there is a wide variety of evacuation models for engineers to choose from. However,
with each model containing its own unique features and simulation capabilities,
confusions may arise as to which model is best for the task at hand.
The results gained from this work emphasize the importance for egress model
users to choose a model for each project with the appropriate input features and
simulation capabilities. This report also gives model users a mechanism for choosing the
appropriate model by providing a detailed egress model review (Chapter 2).
Specifically this report focuses on the ability of two egress models, EXIT89 and
Simulex, to simulate a high-rise hotel building evacuation. This thesis aims to answer
two sets of questions. The first and second sets of questions ask the following:
• How does an engineering egress design of a hotel using EXIT89 or Simulex
account for the four factors of egress? What is missing from these models to
capture major factors of a hotel evacuation?
• Will two specific models, EXIT89 and Simulex, give similar output for the same
design scenario? If not, why?
To answer the first set of questions, a comprehensive model review is completed,
as well as an in-depth study of two specific evacuation models, EXIT89 and Simulex.
The focus of the set of questions is whether or not EXIT89 or Simulex can simulate all of
the factors associated with a hotel evacuation, namely the building configuration,

2
procedures of the evacuation, environmental conditions, and behaviors. If not, other
models are listed which have the capabilities of simulating certain factors of a hotel
evacuation.
EXIT89 and Simulex are able to simulate certain features of a hotel evacuation,
however, there are features of a hotel evacuation that these models are not able to
simulate. Some of these factors include an accurate representation of the building when
using a coarse network, the simulation of the presence of hotel staff, the simulation of the
effect of previous experience or training on the occupant, the incorporation of both fire
and smoke conditions and the effects on the occupants’ decision making, exhaustion on
the stairs, social affiliation, the simulation of actual pre-evacuation behaviors, elevator
use, the condition of the occupant at the time of alarm (sleep, intoxicated, etc.), the
simulation of carrying items or a baby, and the option of preparing an area of refuge
instead of full evacuation.
From Chapter 2, it is apparent that other models have certain capabilities lacking
in EXIT89 and Simulex to simulate a hotel evacuation. These models and special
features are expanded upon in Chapters 2 and 6 of this thesis.
Along with choosing a model with the appropriate features for a specific design,
the user must make sure there is an understanding of what data the input variables and
features are based on and the limitations of the model. Depending upon the complexity
of the space and the uncertainty of the occupants who will use the space, it is possibly
more accurate to use models with less complexity, such as the movement models.

3
Now that Chapter 2 has provided the mechanism for choosing the appropriate
model, another question arises. Is using only one model sufficient to evaluate the life
safety of a particular building? The second set of questions discussed in this thesis is the
following:
• Will two specific models, EXIT89 and Simulex, give similar output for the same
design scenario? If not, why?
Since designers use only one model for a performance-based design, there is a
concern about the difference in output from two similar models given the same design
scenario. EXIT89 and Simulex, both partial behavior models, are used to their full
capacity to model the same evacuation design scenario from a hotel building. To
compare the results from EXIT89 and Simulex, a design simulation (labeled as the
“hotel” design simulation) was run, as well as two additional simulations labeled as
“hotel with 3% disabled” and “all disabled” simulations. Also, each simulation described
above is run with and without a time delay. Overall, EXIT89’s evacuation times for
these simulations are 25-40% lower than the times produced by Simulex. However, the
usage of exits (the number of people using exits 1 and 2) are equivalent for both models.
The reasons for these differences in model results are due to the differences in
stair configuration input, the movement algorithm used by each model, differences in
unimpeded speeds of the occupants simulated, the differences in density in the stairwell,
and the differences in the method that each model simulates disabled or slower moving
occupants. An in-depth analysis of each difference is presented and explained in Chapter
9 of this thesis.

4
Overall, it was found that, in the simulations run for this thesis, EXIT89 allows
faster movement of the occupants in the stairwells at increasing density as well as a larger
number of occupants in a stair section (section of stairs between 2 floors of the hotel) at
one time during the evacuation. Also, Simulex simulates slower moving occupants to
cause either slight delays or complete queues behind them in the stairwell, while EXIT89
does not simulate the slower moving occupants to interfere with the able occupants
during the simulation. Lastly, EXIT89 begins occupant movement at higher unimpeded
speeds when compared to the population modeled in Simulex. All of these factors
combined can explain why EXIT89 produces faster evacuation times when compared
with Simulex in this comparison.
Also, in addition to the design scenarios, both models are used in their full
capacity to bound the evacuation results, since this is frequently done in performance-
based design. As mentioned in Chapter 5, Simulex contains a wider range of occupant
characteristic inputs, which is used in the bounding simulations. The ranges of
evacuation time from each model (with and without delays) are also compared. In the
Simulex model, the simulations are varied by occupant speed, occupant type (speed and
body size varied), hotel use, and occupant mobility. In the EXIT89 model, the
simulations are varied by occupant body size and speed and occupant mobility. Results
of the bounding simulations can be seen in Tables 9.11 and 9.12 in Chapter 9.
For the bounding results, the evacuation times of interest are the minimum and
maximum evacuation times for each model (with and without delay times). Simulex still
contains evacuation times larger than EXIT89’s times for each minimum and maximum
value, as shown in Figure 10.3. This is especially seen with Simulex’s maximum value

5
simulations with and without delay times. Larger evacuation times produced by Simulex
are mainly due to the introduction of the slower populations, a known capability of the
model. EXIT89 produces maximum results in the bounding simulations that are
approximately 40% lower than that of Simulex for no delay. In the case of simulated
delay times, EXIT89 produces maximum results that are approximately 30% lower than
Simulex. In both cases of delay and no delay, EXIT89 produces a faster minimum result,
but only by approximately 10%. The bounding maximum and minimum results are
graphed in Chapter 10, Figure 10.3
The question remains whether or not it is sufficient to use only one evacuation
model for a project in a performance-based design. This is a difficult question to answer
due to other factors, such as time and cost. In many cases, evacuation models may be
second to hand calculations. From the analysis done for this thesis, it is important to
make sure that the model has sufficient capabilities and features to capture the scenario(s)
for the specific building. It is recommended for the designer to fully understand the inner
workings of the models and to assess whether or not the movement algorithm and
methods are realistic. For example, in the case of EXIT89, it may not be a realistic
scenario to model occupants who do not interact with each other during movement.
The models in this comparison produced different evacuation results mainly due
to the capabilities of the model to represent an actual hotel simulation. The simulation of
a variety of speed and body sizes by Simulex produced longer evacuation times.
However, a variety of occupant types are realistically seen in evacuation from buildings.
Therefore, instead of focusing on the number of models to use in a design, the
recommendation is to choose a model that is capable of simulating a multitude of

6
scenarios for that building type and is conscious of differences in the population’s
movement. And, by providing the information in Chapter 2, the user now has the
mechanism to choose the appropriate model for the specific project. If time is available
and costs are low, the designers may want to check results with another egress model of
similar capabilities and features.

7
INTRODUCTION TO THESIS
Evacuation calculations are increasingly becoming a part of performance-based
analyses to assess the level of life safety provided in buildings. In some cases, engineers
are using back-of-the-envelope (hand) calculations to assess life safety, and in others,
evacuation models are being used. Hand calculations usually follow the equations given
in the Emergency Movement Chapter of the Society of Fire Protection Engineers (SFPE)
Handbook1 to calculate mass flow evacuation from any height of building. The
occupants are assumed to be standing at the doorway to the stair on each floor as soon as
the evacuation begins. The calculation focuses mainly on points of constriction
throughout the building (commonly the door to the outside) and calculates the time for
the occupants to flow past that point and to the outside.
To achieve a more accurate evacuation calculation, engineers have been looking
to evacuation computer models to assess a building’s life safety. Currently, there are
several different evacuation models to choose from, each with unique characteristics and
specialties. One major question is how do the engineers know which model is the best
model for the task at hand? What resources do they have to consult in order to find
detailed information on the current and available egress models? A concern with current
evacuation models is whether or not they can accurately simulate the unique scenarios
that accompany a certain type of building. For instance, a hotel building is occupied by
sleeping individuals and at least equipped with a limited, 24-hour desk clerk (and/or
security guard) that can aid in arousal of the occupants. Are current models equipped to
simulate the unique characteristics of certain types of buildings?

8
Lastly, it is common for engineers to use only one evacuation model for a
performance-based design of a structure. Several evacuation simulations involving
different scenarios are commonly run and analyzed using that model in order to bound
the evacuation results. These results are then compared with the results from a fire model
in order to understand if occupants have a sufficient amount of time to escape before
encountering life threatening conditions. Is it sufficient to base the acceptability of a
performance-based design on the predictions of a single model? How different are the
results from another possible model? Will two specific models give similar output for the
same design scenario? If the answer is no, what does this mean for current evacuation
models and the design process?
This paper attempts to answer some important questions about current evacuation
models and the performance-based design process. To narrow down the problem and
questions asked above, one type of building is used for this analysis. A high-rise hotel
building residing on the West Coast of the United States is used for this analysis. The
two main questions that are answered are 1) what is missing, if anything, from current
models (specifically two models) in capturing the major factors of a hotel evacuation, and
2) whether or not two specific models will give a similar output for the same hotel design
scenario and if not, why? The two specific evacuation models that are analyzed and used
to simulate the high-rise hotel scenarios are EXIT89 and Simulex. The inputs and unique
characteristics of these two models are described, and explained as to how they relate to
the needs of a hotel evacuation scenario. A list of current models that also address the
characteristics of a hotel evacuation is provided. Also, the simulation results of these two
models are compared and differences between the outputs, if any, are explained. The

9
results of this paper may challenge the current performance-based design process as well
as the current models that are used by showing that two similar models can give
significantly different output for the same building and design scenario. From such
analysis, future needs in evacuation modeling and the design process are recommended.
Structure of the Paper
This paper consists of several chapters relating evacuation models, the
performance-based design, and the application of the models to a high-rise hotel building.
Chapter one of this paper begins with an introduction to evacuation modeling. This
chapter deals with an overview of the design process, a history of evacuation modeling,
limitations, and an explanation of important characteristics helpful in choosing the correct
evacuation model for a specific task. Chapter two contains an extensive review of 28
past and current evacuation models. Each model is described in detail, highlighting
important characteristics. Chapter three introduces Gwynne’s four factors of any
building evacuation. These factors help to organize the essential elements of a building
evacuation that should be captured in a prediction tool. Chapter four is devoted to the
unique elements of a hotel evacuation. This chapter aims to list and explain the essential
elements of a hotel evacuation as they relate to Gwynne’s four factors of egress.
Chapter five is a description of EXIT89 and Simulex. This chapter aims to discuss their
structure and inputs, and also how these models represent the four factors of egress.
Chapter 6 answers the question of what is missing from EXIT89 and Simulex in
capturing a hotel evacuation scenario. The design process and use of evacuation
modeling are described, and an input matrix is established for both models for a hotel

10
evacuation. From this input matrix and the information from Chapter four, inputs lacking
from either model which could more effectively capture factors of a hotel evacuation are
apparent. Also in this chapter, information from chapter two is used to check if other
models are available that would more accurately simulate such a scenario.
Chapters seven, eight, and nine aim to answer question two of this paper; whether
or not two specific models will give a similar output for the same hotel scenario, and if
not, why? A fire scenario for the hotel is described in Chapter 7 which is used to develop
the fire scenario simulations for model comparison. Also, the chapter provides
information about the high-rise hotel building. Chapter eight describes the inputs chosen
for each model to simulate the fire scenario as well as reasons why each input is selected.
In addition, bounding simulations are described for each model in order to achieve high
and low evacuation times that are used to bound the evacuation results. Chapter nine
discusses the differences in the results of the fire comparison run and the bounding results
between the two models. Also, explanations on why any differences occurred are also
included. Chapter ten provides a summary of the results and answers to both questions
posed: 1) How does a performance-based design of a hotel using EXIT89 or Simulex
account for the four factors of egress? and 2) Will two specific models give similar
output for the same design scenario? If not, why?
Limitations of the Study
As with any research project, there are limitations to identify with this evacuation
study. Initially, only two models are being used to run the hotel simulations for
comparison. This certainly requires future work with additional models. Secondly, the

11
blind simulations of the fire scenario in the hotel are run by the same person, the author
of this study. The purpose of a blind simulation is that two different people run different
models in order to reduce bias in the evacuation results. However, because of the
purpose of this thesis, it is necessary for the author to use both models.
As this section explains, the scope of the thesis is limited only to a specific hotel
building. Similar to the addition of evacuation models, future work into other types of
occupancies and buildings with varied performance-based designs should be studied.
Other limitations include the lack of actual fire data from the hotel building
studied in this report. The reason for not using drill or actual fire data is because the
purpose of this thesis revolved around the comparison of results from the two models
only, instead of identifying which model produced more accurate evacuation results
(providing results closer to the evacuation time from an actual fire). Also, since the hotel
building plans were altered significantly to make comparison of model output possible,
the use of actual evacuation data from the entire building was not a viable option.
The remaining limitations are related to the input chosen for the blind run
simulations using Simulex and Exit89. Occupants with disabilities are not explicitly
modeled; however, the bounding analysis is performed by looking at a variety of
occupant speeds. The reason for not including disabled occupants in the blind run is to
limit the amount of input variables that would affect the comparable results. And, it
seems sensible to include this input variable during the attempt to bound the evacuation
results. Also, counterflow issues are not studied for similar reasons of model
comparison. For all model simulations, no smoke or fire is simulated. This is primarily
due to the fact that Simulex does not have this capability, and many times during a

12
performance-based design, the evacuation results are compared with results from a
separate fire model. Lastly, no specific pre-evacuation times were obtained from hotels
with working alarm systems, therefore evacuation data from actual apartment fires has to
be used.

13
CHAPTER 1: INTRODUCTION TO EVACUATION MODELING
Researchers have been building models of human behavior in fire evacuations
since the late 1970s. The two main categories of models used to predict human behavior
and movement are known as conceptual models and computer models. Although
conceptual models are described here briefly, the main purpose of this chapter is to
present the history, purpose, categories, and limitations of evacuation computer models.
A diagram, Figure 1.1, is included here to show the organization of current egress
models. Each category is explained in detail throughout this chapter.
Figure 1.1: Primary organization of egress models
Conceptual models seek to capture the relationship between concepts and/or
behaviors at a more abstract or theoretical level than computer models. These models
have been constructed as an aid in explaining the decision making process2,3,4,5,6, stress7,
and behavioral responses of occupants in an emergency8. The conceptual models, or
decomposition diagrams, produced by Canter, Breaux, and Sime8 are accompanied by
numbers in between each behavior during a certain type of emergency. Figure 1.2 shows
Egress Models
Conceptual Models Computer Models
Movement Models
Partial-Behavioral Models
Behavioral Models

14
a decomposition diagram involving behaviors from multiple occupancies. These
numbers indicate the strength of association between the two actions, which serves as a
step toward quantification of human behavior. Although many of the past and present
computer models lack any inclusion of human behaviors during fires, the models that do
attempt to simulate behavior use this kind of conceptual data as a starting point.
Figure 1.2: Decomposition diagram showing behaviors from multiple occupancies (8, p. 128)

15
Computer models, on the other hand, aim to quantify human movement and
behavior during fire emergencies. A model’s main objective, among others, is to predict
an evacuation time for a certain type of building. As technology and knowledge of
human behavior and movement increased, evacuation models have been able to calculate
and provide other important information, such as the following:
• Flow rates through certain components of the building
• Congestion areas throughout the structure
• The risk to occupants (incapacitation and death) during the evacuation due to
hazardous fire conditions in the building
• Travel distances and times for one occupant to evacuate from certain spaces
• The speed of occupants through all components of the buildings and under various
density situations
• The position of individual occupants throughout all time during the simulation
• Population flow split of occupants to certain routes, exits, stairs, etc.
• Individual movement and routes taken during extreme circumstances such as total
evacuation, counterflow movement, fire conditions, etc.
Purpose of Evacuation Models
There are many reasons for performing evacuation simulations for a building. In
the prescriptive code approach, evacuation models are generally not needed because the
building is designed by following the requirements set by local building codes9.
However, evacuation modeling is increasingly becoming a part of performance-based
analyses to assess the level of life safety provided in buildings. Depending upon when

16
the fire protection engineer is brought into the project, evacuation models can be used
during different stages of the design phase of the building. Evacuation models are key in
allowing the engineers and designers to answer “what if” questions about the building at
hand. If the model is used early enough in the design phase, models can aid in
identifying possible solutions to heavy congestion points inside of the building. In many
of the models available, the engineer can easily change building component dimensions,
add exits, extend or shorten corridors, etc. to alleviate identified problems that arise.
It is most likely, however, that an engineer is brought into a project when the
design is near completion and a problem has been identified9. If the project has reached
the detailed design phase, adding new stairs, exits, or extending means of egress may be
an impossibility9. In this case, the models can be used to make small, but important
changes to the building, and assess the results of such changes. Also, visualization
techniques are helpful in assessing problem areas and the affects of such changes to the
building.
For performance based designs, the engineer is also tasked with deciding if the
building is designed with enough protection to allow the occupants to escape before
incapacitation occurs. The engineer can use evacuation models to simulate several
different egress scenarios in order to bound the evacuation results from a certain building.
Input variables for egress scenarios include building characteristics, such as number of
floors and floor layouts, and occupant characteristics, such as number of occupants,
location of the occupants, speed, and body size. Bounding evacuation results is important
because many different fire scenarios can cause different results, and human behavior in
different fire situations are difficult to predict. Through bounding, the designer attempts

17
to anticipate different types of emergencies and check if the building and occupants will
reach safety in a reasonable amount of time. The egress results are then compared with
fire modeling results for the building in order to establish whether or not the occupants
have a sufficient amount of time to escape before they are faced with hazardous
conditions, such as toxic products from smoke.
Evacuation Model History
Model developers have been working towards building and improving models
that predict evacuation movement and behavior for almost 30 years now. As more
evacuation data has been gathered, computer technology expanded, and the performance-
based approach is more widely used, evacuation model developers constantly look to
expand previous models to meet current needs. However, it is important to understand
how the modeling effort began and what the current state of the art is.
Evacuation modeling aids in understanding the critical time to safety, which
involves the time from awareness to the time to reach a safe location. During a study of
fire safety in buildings used to house the elderly, fire development and evacuation was
considered as a time-structured problem10,11. According to Fahy, this study established
“the variables for the fire on a continuum of a ‘critical time’ and the parameters for the
survival of the occupants on a continuum of a ‘reaction time.’ The definitions of both
times are provided here:
• Critical time – time from the start of the fire to the attainment of intolerable levels
• Reaction time – time used by the occupant to react to the fire and reach safety by
either evacuating the area or establishing an area of refuge.

18
This very timeline has been studied throughout the past thirty years and aided in
the establishment of several computer models since 1967. One such model developer
used these critical times to create the available safe egress time (ASET) model. This
model focused primarily on calculating the conditions that developed during the critical
time as well as an estimated average evacuation time and total evacuation time for the
building.
Four evacuation models have been identified as the “first wave” of models
developed to quantify egress time from buildings in the U.S. These models are known as
BFIRES-II, EVACNET, Escape and Rescue Model, and the Effective-Width
Model11,12,13. Each model is described briefly in the following paragraphs.
BFIRES-II12,14,15,16, developed by Fred Stahl from the National Bureau of
Standards (NBS, now the National Institute of Standards and Technology), is an
evacuation model that was created to simulate evacuation from smaller facilities. Stahl
places an emphasis on the decision process and corresponding actions in response to fire
stimuli. The program was originally designed to handle health care facilities and
incorporates such special activities as rescuing non-ambulatory patients. BFIRES-II
simulates a fire scenario as a chain of discrete “time frames” and a behavioral response
for each occupant is generated for each frame. According to Nelson12, the model concept
and structure is based on the suggestion that occupants “act in accordance with their
perceptions of a constantly changing environment.” Throughout the simulation, the
occupant is in essence gathering information, interpreting the information, evaluating
other options, and finally selecting an action to take. The interpretation phase involves
the occupant comparing current conditions with previous conditions, such as distance
19
between occupants, distance from fire threat, and distance to exit. And, the action
selection involves comparing the current move criteria with alternatives.
BFIRES provides each occupant with a library of responses or actions from which
to choose. Overall, similar to previous conceptual models2, each occupant is routed
through the processes of perception, interpretation, and behavioral response. Nelson12
gives an example of an application with BFIRES, and Chapter 2 of this thesis also
describes this model in more detail.
EVACNET12,17 is an optimization model that is used to evaluate the evacuation of
a homogeneous mass of occupants. Work on this model was initially performed by R.L.
Francis and P.B. Saunders at NBS, and then continued with Francis and Kisko at the
University of Florida. EVACNET is described as a network model that represents the
building as a series of nodes and arcs. The user prescribes the flow and speed by which
the occupants move throughout the space during each time period. Since the model is
used to solve for the minimum time for all of the occupants to evacuate the building, the
model distributes occupants to certain exits to achieve this goal. EVACNET also
identifies bottlenecks, or areas of congestion, throughout the space. This model is also
described in more detail in Chapter 2.
The Escape and Rescue Model (ERM)12,18 is a network model that was designed
at NBS to simulate evacuation from Board and Care Homes by D. Alvord. The model
can simulate both able occupants and those in need of assistance in order to evacuate.
This model also represents the structure using a series of nodes and arcs (network) by
which the occupants must travel. ERM asks the user to specify the impact of residents’
disabilities, the length of pre-evacuation times, the speeds of the residents and staff, and

20
rescue priority for each resident. The model includes the following special activities that
may occur in a Board and Care Home evacuation:
• Staff members can alert residents to evacuate
• Staff members can gather people to evacuate if they are already on the member’s
route of travel
• A resident requires help up or down the stairs only
• Once a wanderer has left the building, a staff member stays outside with that person.
During movement, the occupants take the shortest route to their desired location in the
building. Also, movement on the stairs is decreased by half of the walking speed on
horizontal components. The model includes several different resident types that attempt
to match those mentioned in the Fire Safety Evaluation System for Board and Care
Homes12. Each type is accompanied by a movement speed and response time.
Lastly, the Effective-Width Model for Evacuation Flow12,19 consists of a formula
for determining the evacuation capacity of stairwells. This formula was developed by
J.L. Pauls at the National Research Council of Canada. The model was created from two
types of empirical studies from Canada. The first type of study, from film and video
records, contained observations of where crowds of people walk in relation to each other
and the boundaries of the stair. The other type consisted of graphs of mean egress flow
vs. stair width. According to Pauls19, the model shows the following three phenomena:
• There is an edge effect at both sides of the stairwell, meaning that occupants leave a
certain amount of space between the wall and themselves while walking down the
stairs. The edge effect is also known as “effective width.” Also, people are more

21
likely to walk in a staggered pattern on the stair, rather than shoulder-to-shoulder in
single-file lanes.
• Mean evacuation flow vs. stair width is a linear function instead of a step function, as
previously assumed.
• Mean evacuation flow is influenced non-linearly by the total population per effective
width of stair.
Pauls’ model provides simple formulas that can be used to predict evacuation
flows and select total effective stair widths in order to meet a certain performance
criteria. Like many other models, this model takes the “hydraulic model” approach. This
approach assumes that the occupants flow as a mass of water molecules throughout the
structure. Much more detail listing the formulas and corresponding graphs can be found
in Nelson or Pauls work1,12,19.
Even as early as 1982 with the first publications from the four previously
described models, it can be seen that two types of models had begun to emerge. Two
models (EVACNET and Effective-Width) view the occupants as similar to hydraulic
flow through pipes to the exits. These models primarily focus on the movement of the
occupants to a specific goal. The other two evacuation models featured above (BFIRES
and ERM) concentrate on understanding occupant types and individual characteristics
that would be affected during a fire emergency. These models attempt to incorporate
behaviors and thoughts associated with certain evacuation conditions. Also, with the
exception of BFIRES, the early models represent the building as a network of nodes and
arcs through which the occupants would travel.

22
Another way of categorizing early models was done by Watts13 in 1987. He
introduced early network algorithm models, queuing models, and “simulation” models in
his extensive model review. The label of network algorithm models was used to describe
those that would search all combinations of node/arc paths in order to find the minimum
evacuation time for the occupants of the space17. An example of this type of model is
EVACNET, which was described in the paragraphs above. Queuing models, on the other
hand, use queuing theory which describes the formation of lines when the current demand
for service exceeds the capacity to provide such service20. An example of such a model
is the Queuing network model developed by Smith at the University of Massachusetts,
Amherst. This model examines the overall suitability of the building design as well as
the overall safety of the evacuation population by estimating the worst case exit time,
average queue lengths along routes, potential bottlenecks, and overall probability of a
safe exit20. Simulation models, a more dynamic technique, represent “item-by-item” or
“step-by-step” the features of the evacuation process/system13. An example of this type
of model is the EMBER model developed by Berlin at Modeling Systems, Inc., which is
now Computer Technology International, in Atlanta, GA21. This model performs a
comprehensive fire development and evacuation simulation of the situation. EMBER
incorporates certain features for the building evacuation, such as different types of
occupant characteristics; rescue personnel capabilities; multiple route selections (shortest,
quickest, myopic, and specified routes); user input of preparation times and speeds;
simulation of fire, combustion products, and fire protection systems (detectors and
sprinklers); and a graphical display of the simulation.

23
Lastly, an additional way of categorizing models is by labeling them either
deterministic or probabilistic (stochastic). Deterministic is used to describe those models
that assume that the evacuation situation is determined based on a well-defined physical
situation, while probabilistic models attempt to capture the randomness of the evacuation
situation (movement and behaviors)22. BFIRES could be labeled as the first probabilistic
human behavior model developed in the United States. According to Nelson23, the
EXITT model developed my Bud Levin was the first deterministic evacuation model that
included human behavior.
These different types of categories describing the model type still pertain to
current evacuation models. The method of categorization is dependent upon preference,
since many others have categorized models in completely different ways24,25,33 ,83.
Examples of other categories used in describing egress models are the following: discrete
or continuous, stochastic or deterministic, quantitative or qualitative, and macroscopic or
microscopic. In Chapter 2, an attempt has been made to categorize past and current
evacuation models in various ways. Most of these are microscopic (simulating to the
level of the individual occupant), however a few can be labeled as macroscopic (focus is
on the larger scale of evacuation). As an introduction, the following section will attempt
to describe all major model categories and the techniques used to choose the evacuation
model best suited for a future performance-based design.
Categorization of Evacuation Models
The following categorization is developed to present an organization of the past
and current models. The categorization is also developed to identify the important
characteristics of evacuation models. These characteristics may serve as a checklist for

24
model users when choosing the best model for the design structure. It is beneficial to
understand the differences in characteristics between relevant models before making a
decision.
Modeling method All past and current evacuation models have been categorized using a primary
category labeled Modeling method. This category describes the method that each model
uses to calculate evacuation times for certain types of building. Under the Modeling
method category, models are assigned one of the following three labels:
1. Behavioral models
2. Movement models
3. Partial behavior models
Behavioral models are those models that incorporate occupants performing
actions, in addition to movement toward a specified goal (exit). These models can also
incorporate decision-making by occupants and/or actions that are performed due to
conditions in the building. Movement models are those that move occupants from one
point in the building to another (usually the exit or a position of safety). These models
are key in showing congestion areas, queuing, or bottlenecks within the simulated
building. And, lastly, partial behavior models are those that primarily calculate occupant
movement, but begin to simulate behaviors. Possible behaviors could be implicitly
represented by pre-movement time distributions among the occupants, unique occupant
characteristics, overtaking behavior, and the introduction of smoke or smoke effects to
the occupant. These are models capable of simulating an entire building, and occupants’

25
movements throughout the model are based on research of observed human behavior
data.
Beyond the primary categorization of Modeling method, several subcategories
have been identified as important characteristics. The subcategories are listed below and
explained in the section to follow:
• Purpose
• Availability to the public for use
• Structure of the model
• Perspective of the model
o Method of how the model views the occupants
o Method of how the occupant views the building
• Use of fire data
• Import CAD drawings
• Visualization capability
• Validation studies
• Occupant movement
• Occupant behavior
• Output
• Special features of the model
• Limitations of the model
Purpose of the model: This subcategory describes the use of the model, as it pertains to certain building
types. Some of the models in this organization focus on a specific type of building and

26
others can be used for all building types. The main purpose in using this as a category is
to understand if the model can simulate the design building, for example the World Trade
Center Towers.
The current model categories for purpose involve 1) models that can simulate any
type of building, 2) models that specialize in residences, 3) models that specialize in
public transport stations, 4) models that are capable of simulating low-rise buildings
(under 75 feet) only, and 5) models that only simulate 1-route/exit of the building.
Availability to the public for use: This subcategory becomes important if the user is interested in modeling the
building in-house or hiring the developing company to provide evacuation results. In this
subcategory, some models are available to the public for free or a fee. Others are not
available due to the following circumstances; the model has either not yet been released,
the model is no longer in use, or the company uses the model for the client on a
consultancy basis.
Structure of model: This subcategory is used to assess the accuracy of occupant movement throughout
the building. A fine network model divides a floor plan into a number of grid cells that
the occupants move in and out of. The coarse network models divide the floor plan into
rooms, corridors, stair sections, etc. and the occupants move from one room to another,
instead of one grid cell to another. The advantage of fine network structures over coarse
is that fine networks have the ability to simulate the presence of obstacles and barriers in
building spaces that influence individual path route choice, whereas the coarse networks
“move” occupants only from one portion of a building to another.

27
Perspective of model: This subcategory explains how 1) the model views the occupants and 2) how the
occupants view the building.
How the model views the occupants:
There are two ways that a model can view the occupant; globally and
individually. An individual perspective of the model is where the model tracks the
movement of individuals throughout the simulation and can give information about those
individuals (ex. their positions at points in time throughout the evacuation). When the
model has a global view of the occupants, the model sees its occupants as a mass and
homogeneous group of people moving to the exits. It is clear to see that an individual
perspective of the occupants is more accurate, but it depends on the purpose of the
simulation as to which alternative is best. If the user is not interested in knowing the
position of each occupant throughout the simulation or assigning individual
characteristics to the population, than a global view is sufficient.
How the occupant views the building:
Again, the occupant can view the building in either a global or individual way.
An occupant’s individual view of the building is one where the occupants are NOT all
knowing of the building’s exit paths and decide their route based on information of the
floor, personal experience, and in some models, the information from the occupants
around them. A global perspective of the occupants would be one where they
automatically know their best exit path and seem to have an “all knowing” view of the
building.

28
Fire data: This subcategory explains whether or not the model allows the user to incorporate
fire data with the evacuation simulation. However, the models incorporate fire data in a
variety of ways and it is important for the user to understand the complexity of the
coupling. The model can incorporate fire data in the following ways: Importing fire data
from another model, allowing the user to input specific fire data at certain times
throughout evacuation, or the model has its own simultaneous fire model. If the model
cannot incorporate fire data, it simply runs all simulations in “drill” mode. “Drill” mode
is the equivalent of a fire drill taking place in a building, without the presence of a fire.
The purpose for evacuation models to include such data is ultimately to assess the
safety of the occupants that are traveling through such conditions. Purser has developed
a model to calculate a fractional incapacitating dose for individuals exposed to CO, HCN,
CO2, and reduced O226,27. Many models that incorporate a fire’s toxic products
throughout the building spaces, use Purser’s model to calculate time to incapacitation of
the individual occupants. Purser also developed mechanisms for models to calculate
certain effects due to heat and irritant gases.
Some models also go as far as to use data collected by Jin in Japan28. His work
claims to address the physical and physiological effects of fire smoke on evacuees. Jin
performed experiments with members of his staff, undergraduates, and housewives
subjected to smoke consisting of certain levels of density and irritation. He tested
visibility and walking speed through irritant smoke in 198528 and correct answer rate and
emotional stability through heated, thick, irritant smoke-filled corridors in the late
1980s28. This data is used in certain models to slow occupant movement through smoke

29
and also to change occupant positioning in certain spaces to a crawl position, instead of
upright.
Bryan and Wood data2 concentrated on the correlation between visibility distance
in the smoke and the percentage of occupants within that smoke that would move through
it. This work was done in the United States (Bryan) and the UK (Wood) and was
obtained by occupant self-reporting. This data is used by current models to assess when
certain occupants will turn back, instead of move forward into the smoke-filled space.
Lastly, a few models use the technique for turn back behavior developed by
Levin29 for the EXITT model. Occupant decision-making and movement is based on the
optical density of the smoke in the upper layer using the equation for psychological
impact of smoke, S. More about the calculation is found in Chapter 2. The following
decision rules are incorporated into the model using this technique:
• Occupants do not move to a node where S>0.5 (or into a room where S>0.4) unless
the difference between the height of the room and the depth of the upper layer is at
least 1.2 meters (the occupant can crawl)
• Occupants increase their travel speed by 30% after they encounter smoke of S>0.1
• Occupants stop investigating if they are in a room where S>0.05. They will stop
investigating before entering a room where S>0.1
• If the occupant is in a room where S>0.1, he/she will respond more quickly and
believe the fire is more serious.
• Penalties and demerits are assigned to a route where S>0.4
There is a limited amount of information or data available on the validity of these optical
density and occupant behavior requirements.

30
Import CAD drawings: It is important to note whether or not the model allows the user to import DXF
files from a CAD program into the model. In many instances, this method is time saving
and more accurate. If a user can rely on the CAD drawings (that can come straight from
the architect) instead of laying out the building by hand, there is less room for input error
of the building. In some instances, the model developer is in the process of upgrading
their model to include this capability.
Visualization of the evacuation: Many times it is important for the client to see where the bottlenecks and points of
congestion are inside the space. Many of the models allow for at least 2-D visualization,
and recently more have released versions or collaborate with other virtual programs that
will present results in 3-D. Other models do not have any visualization capabilities.
Validation studies: The importance of validation studies is to show whether or not the model can
simulate accurate movement and (if possible) behavioral actions of the occupants.
Usually, this is done by comparing model results to real life scenarios (mainly fire drills).
Although this method is widely used by model developers, it should be applied
conservatively because this type of validation may not indicate that a model can actually
simulate occupant behavior in a real fire situation.
The current ways of validating evacuation models are included here: validation
against codes, validation against fire drills, validation against literature on past
experiments (flow rates, etc), and validation against other models. For some models, no
indication of validation of the model is provided.

31
As an aside, some of the behavioral models will perform a qualitative analysis on
the behaviors of the population. Although this is problematic since occupant behaviors
are difficult to catch in fire drills, past drill survey data is sometimes used to compare
with model results.
Occupant behavior: Behavior of occupants is represented in many different ways by current
evacuation models. The organization associated with this sub category is the following:
No behavior, Implicit behavior, Rules or Conditional Behavior, Functional Analogy, or
Artificial Intelligence. Also, some models have the capability of assigning probabilities
of performing certain behaviors to specific occupant groups. Many of the partial
behavioral models allow for a probabilistic distribution of the pre-evacuation times, travel
speeds, and/or FED or smoke susceptibility. In addition to these models, rules or
conditional based models are stochastic, allowing for the variations in outcome by
repeating certain simulations.
The following bullets are explanations of each type of behavior listed above:
• No behavior denotes that only the movement aspect of the evacuation is simulated
• Implicit behavior represents those models that attempt to model behavior implicitly
by assigning certain response delays or occupant characteristics that affect movement
throughout the evacuation
• Conditional (or rule) behavior reflects models that assign individual actions to a
person or group of occupants that are affected by structural or environmental
conditions of the evacuation (as an “if, then” behavioral method)

32
• Functional Analogy resembles models that apply a set of equations to the entire
population. Usually the equations are taken from another field of study, such as
Physics, to represent occupant movement.
• Artificial Intelligence resembles the models that attempt to simulate human
intelligence throughout the evacuation.
As expressed in the fire data characteristic, several models use the data from
Bryan, Wood, and Jin2,28 to develop rules for occupants faced with fire conditions. These
behaviors involve turn back behavior, slowing of occupant movement, and the physical
movement of crawling.
Occupant movement: This subcategory organizes how the models move occupants throughout the
building. For most models, occupants are usually assigned a specific unimpeded (low
density) velocity by the user or modeling program. The differences in the models occur
when the occupants become close in a high density situation, resulting in queuing and
congestion within the building. The different ways that models represent occupant
movement and restricted flow throughout the building are listed here:
1) Density correlation: The model assigns a speed and flow to individuals or
populations based on the density of the space.
When calculating movement dependent on the density of the space, three key
players come to mind from which the data originated that is used in current evacuation
models. These three sources of occupant movement for evacuation models are John
Fruin30, Jake Pauls1,3, and Predtechenskii and Milinskii31.
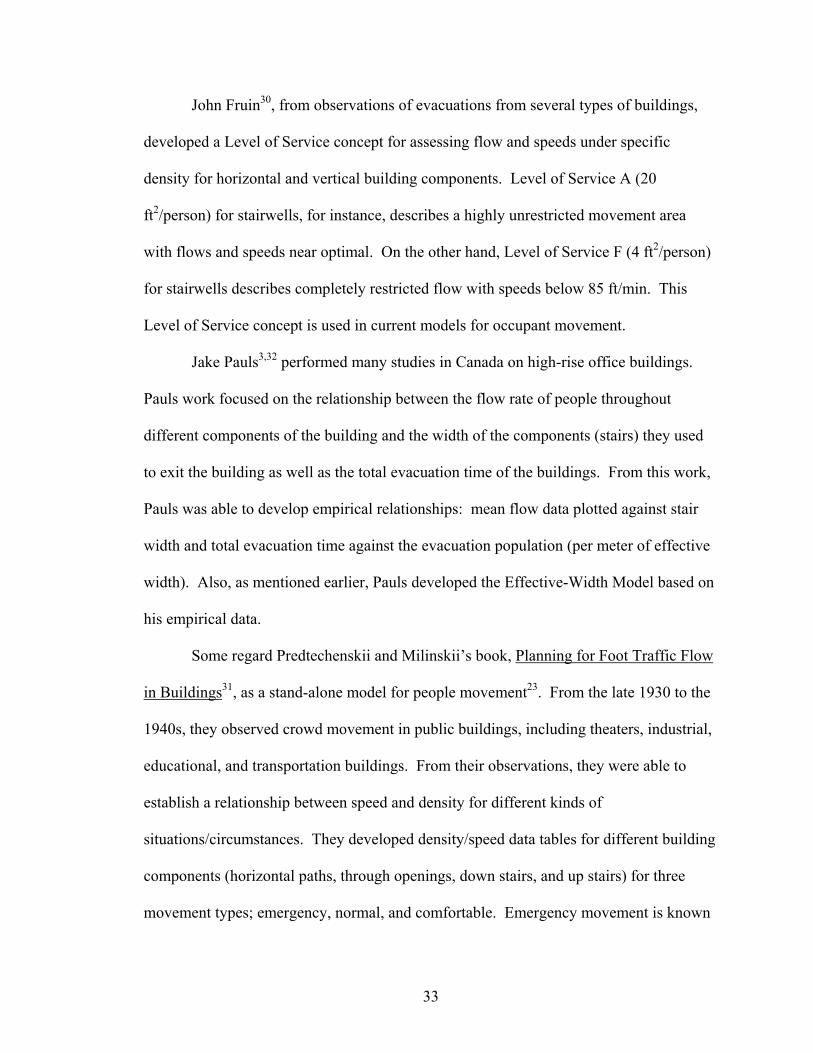
33
John Fruin30, from observations of evacuations from several types of buildings,
developed a Level of Service concept for assessing flow and speeds under specific
density for horizontal and vertical building components. Level of Service A (20
ft2/person) for stairwells, for instance, describes a highly unrestricted movement area
with flows and speeds near optimal. On the other hand, Level of Service F (4 ft2/person)
for stairwells describes completely restricted flow with speeds below 85 ft/min. This
Level of Service concept is used in current models for occupant movement.
Jake Pauls3,32 performed many studies in Canada on high-rise office buildings.
Pauls work focused on the relationship between the flow rate of people throughout
different components of the building and the width of the components (stairs) they used
to exit the building as well as the total evacuation time of the buildings. From this work,
Pauls was able to develop empirical relationships: mean flow data plotted against stair
width and total evacuation time against the evacuation population (per meter of effective
width). Also, as mentioned earlier, Pauls developed the Effective-Width Model based on
his empirical data.
Some regard Predtechenskii and Milinskii’s book, Planning for Foot Traffic Flow
in Buildings31, as a stand-alone model for people movement23. From the late 1930 to the
1940s, they observed crowd movement in public buildings, including theaters, industrial,
educational, and transportation buildings. From their observations, they were able to
establish a relationship between speed and density for different kinds of
situations/circumstances. They developed density/speed data tables for different building
components (horizontal paths, through openings, down stairs, and up stairs) for three
movement types; emergency, normal, and comfortable. Emergency movement is known

34
as movement with increased tension, which was observed as nervous excitement of the
occupants. Normal flow is uniform flow without serious complications31. People in
these scenarios were usually familiar with their destination and how long it would take
them to get there. Lastly, comfortable movement is defined as no need to hurry. An
example of this is the lobby of a theater during intermission.
2) User’s choice: The user assigns speed, flow, and density calculations to certain
spaces of the building
3) Inter-person distance: Each individual is surrounded by a 360° “bubble” that
allows them only a certain minimum distance from other occupants, obstacles,
and components of the building (walls, corners, handrails, etc.)
4) Potential: Each grid cell in the space is given a certain number value, or
potential, from a particular point in the building that will move occupants
throughout the space in a certain direction. Occupants follow a potential map that
lists the exits with a “0” potential and branch out from the exit with higher grid
values, the farther away from the exit. The occupants look to lower their potential
with every step or grid cell they travel to. Potential of the route can be altered by
such variables as patience of the occupant, attractiveness of the exit, familiarity of
the occupant with the building, etc. (which are usually specified by the user).
5) Emptiness of next grid cell: Potential and emptiness of a grid cell usually apply
to the same model. The occupant will most likely not move into a grid cell that is
already occupied by another occupant. buildingEXODUS33, for instance,
incorporates a stochastic conflict resolution (assigned a certain time period) if two
occupants want the same grid cell. In this case, variables such as the drive factor,

35
determine which occupant will occupy that cell and which one will either wait or
travel to another cell (possibly with equivalent or more potential). When potential
and emptiness are used by the model, the user can specify the flow rate at the
exits of the building, and sometimes even at intermediate doors throughout the
space, so that occupants are moving with accurate flow through the building.
6) Conditional: With conditional models, movement throughout the building is
dependent upon the conditions of the environment and fire situation. Not much
emphasis is placed on congestion inside the space.
7) Functional analogy: The occupants follow the movement equations specified by
the topic area, such as fluid movement or magnetism. In some cases, the
equations (such as fluids) depend on the density of the space.
8) Other model link: The movement of the occupants is handled by a link to
another model, such as Pauls’ movement model discussed above19.
9) Acquiring knowledge: Movement is based solely on the amount of knowledge
acquired throughout the evacuation. For this model, there is no real movement
algorithm because evacuation time is not calculated – only areas of congestion,
bottlenecks, etc.
10) Unimpeded flow: For this model, only the unimpeded movement of the
occupants is calculated. From that evacuation time, delays and improvement
times are added or subtracted to produce a final evacuation time result.
ALLSAFE, the model that uses this method, recommends use of another
movement model for complicated spaces.
36
Output: The subcategory of output is important to understand if the model is producing
the kinds of information that the user is interested in knowing for the building scenario.
Types of output include the following: total evacuation time, time for the occupants to
clear each floor, time spent using specific exits, occupant flow split to exits, etc.
Special features: The special features subcategory describes certain options given to the user to
make the evacuation simulation more realistic. Although data may not always be
available for these options, the model allows the user to incorporate these if needed. The
special features highlighted in this section are counterflow, manual exit block, fire
conditions, defining groups, disabled occupants, delays/pre-evacuation time, route
choice, elevator use, toxicity of the occupants, and impatience/drive variables. Each is
described in greater detail below.
• Counterflow: The model has the capability of modeling opposing flows, especially
in the stairwell.
• Manual exit block/obstacles: The model allows the user to manually block exits
from occupants. This is similar to allowing the user to define routes for certain
occupants, however, not the same as simply manually deleting the exit from the
building.
• Fire conditions: The model allows for the inclusion of fire conditions.
• Defining groups: The model allows the user to define groups.
• Disabilities/slow occupants: The model allows the user to enter slower velocities for
certain individuals/groups within the population and/or larger body sizes to account
for wheelchairs, etc.

37
• Delays/pre-evacuation time: The model allows the user to enter pre-evacuation
times (value or distribution of values).
• Elevator use: The model incorporates the use of elevators for evacuation.
• Toxicity of the occupants: The model incorporates toxic effects to the occupants.
• Impatience/drive variables: The model incorporates variables of patience, drive,
awareness, etc. as inputs for occupants.
• Route choice: The model allows the user to choose from multiple route choices.
The most common example is that a user can plan out a defined route for certain
occupants in the simulation.
Limitations: This subcategory specifies the limitations of the model as far as running a
simulation on a desktop PC. Limitations can be placed on the number of occupants,
floors, obstacles, grid cells, nodes/arcs, etc. by the modeling program.
SFPE Guidelines for Choosing a Model
As an aid to users of evacuation models, the SFPE Handbook1 established
“Questions a Potential Model User Should Ask About an Evacuation Model.” This guide
focuses on the mode of model organization used by Gwynne and Galea33 from the
publication entitled “A Review of the Methodologies and Critical Appraisal of Computer
Models Used in the Simulation of Evacuation from the Built Environment.” Similar to
the above subcategories, this guide focuses on the following categories:
• Evacuation Model Type – such as optimization, risk assessment, etc. (following
Gwynne’s model organization33)

38
• Enclosure Representation – how is the building represented?
• Population Perspective – how does the model view the occupants?
• Behavioral Perspective – what type of behavioral modeling mode is used?
• Model Validation – how has the model been validated?
• Model Implementation – what computer platforms will the model support?
• Model Support – is the model currently supported by the developers?
• Model Cost
• Appropriateness to Task
The SFPE handbook describes each category in greater detail and provides a helpful and
complete list of questions that model users should ask before choosing an evacuation
model.
Evacuation Modeling Limitations
Although evacuation modeling has advanced appreciably since 1980, there are
still many obvious limitations to evacuation modeling and specific types of models.
Some limitations include the data used by the model, the model capacity, simulation of
human response and behavior, uncertainty in the models, and individual model
limitations. Each limitation is explained in further detail.
Data Currently, many of the people movement algorithms in the models are based on
data from evacuation drills or non-emergency movement observation. It is unclear how
different this type of movement is from actual emergency movement, of which the data is
lacking. Although Pauls34 does not assert a significant difference between drill data and

39
emergency movement data, other researchers stress the need for further study of
movement during emergencies35. Also, pre-movement or pre-evacuation times from
evacuation drills are being incorporated into models, which also poses a potential
problem with accuracy of results. Like people movement, it is unclear how different drill
and emergency response times are. However, unlike emergency people movement,
emergency pre-evacuation times can possibly be gathered by post-fire interviews.
In some of the more sophisticated models, the user is given input choices upon
which little or no data is available. For instance, some models give the user a choice to
rate the “patience” or “drive” of the occupants in the structure. This seems like an
impossible task for a building in the design phase. It is difficult for the engineer to
predict this kind of information as well as defend choosing one high rating over another.
For behavioral models, a very important set of data missing from current models
is human behavior and decision making under stress and/or fire conditions. It is unclear
how the smoke, heat, and perception of the emergency affects brain activity and decision
making. In current models that incorporate fire conditions, it is most likely that the
model only calculates the risk to the occupant from incapacitation or death. The most
basic attempt is to use data from Purser26 and the Fractional Effective Dose (FED) model
to eliminate occupants from the simulation once they have reached incapacitation. A
more sophisticated modeling technique used involves altering occupant movement under
smoke conditions (i.e., crawling when smoke becomes dense) using data from Japan28
and/or predicting whether or not occupants will walk through a smoke barrier or redirect
using Bryan and Wood’s data2. However, this data is faulted by age, the choice of lab
participants (Jin used housewives, undergraduate students, and staff of his research

40
institute), and the validity of data captured by Bryan and Wood from personal accounts,
particularly on the visibility distances through smoke. Not only do these techniques
simply skim the surface of human behavior under fire conditions, the data sources are
substantially different from real fire scenarios and have not been replicated. It is
recognized that more work and experiments should be done in this area, however, human
subjects testing with fire conditions is an impossibility. Other ways to gather data need to
be explored.
Model capacity Another limitation of evacuation modeling is the capacity of the specific models
to handle the entire building and contents for a design task. It is not uncommon for the
model and/or visualization software to have a limit on the number of floors, size of the
floor plan, number of occupants, etc. In this case, it is important to understand each
model’s capacity limitations when choosing an appropriate model.
Human response/behavior A limitation of evacuation modeling pertains to the modeling of human response
and behavior to evacuation cues. Many models, if not all of them, are not equipped for
many of the response scenarios that occur during an emergency. In an emergency,
people’s responses are different depending on a number of factors that aren’t necessarily
captured by evacuation models. These factors are presented by Proulx3 and are explained
below. The first factor that affects an occupant’s response is their perception of the fire.
If they do not feel threatened (or perceive a high sense of risk) by the emergency or the
sound of the alarm (perhaps it provides false alarms frequently), the occupant is less
likely to promptly begin evacuation. This factor lacks sufficient data to model, but

41
becomes very important in evacuation movement36. Another factor that affects
emergency response is the occupant’s location inside the building relative to the fire. If
the occupant is closer to the fire conditions, they are more likely to perceive a higher
threat and evacuate more quickly. This is not simulated by current models. Also, the
presence of other occupants affects the evacuation response of an occupant. A certain
type of person may wait for the others around him/her to evacuate first before doing so37.
Occupants may also form groups with which they converse and begin the milling
process36 in order to construct an evacuation plan. This allows for the transfer of
information from one occupant to another about fire conditions, evacuation movement,
and thoughts and fears. This is simulated in a few select models in less detail as
described above. Another factor that plays a role in evacuation response is previous
experience in other emergencies, which is difficult to model due to the lack of data.
However, the role of the factor has been proven to be important in response36. As Proulx
states3, the occupant’s role in the building also affects how they respond to an emergency.
For instance, if the occupant is a trained fire warden, they have certain tasks to complete
before beginning their own evacuation. On the other hand, if the occupant is a boss or
superior of the company, they may also take on the role of a fire official to make sure
their employees reach safety before beginning their own evacuation. Familiarity of the
building also plays a role in how the occupant responds to an emergency cue (i.e. alarm).
In the case of delay time, if an occupant is not familiar with the alarm and/or building,
they may wish to seek and consult with other occupants before making a decision on
what to do next. Also, an unfamiliar occupant may unknowingly evacuate via the way
they came in, instead of traveling to a closer fire exit, which would increase their
42
evacuation time. Lastly, factors such as alertness and commitment to a particular activity
affect an occupant’s response to a fire emergency. Both factors will cause a delay in
evacuation time. For example, if an occupant is intoxicated, it may take a longer time to
arouse the occupant with an alarm system. Also, if an occupant is committed to a certain
activity (i.e. grocery shopping or gambling) and does not perceive the emergency as
particularly serious, they may take a longer time to react and evacuate.
The models do implicitly attempt to capture some of this behavior by allowing the
user to designate a response delay distribution across the entire population. Or, in more
sophisticated models, the user can suggest certain activities for the occupants to engage in
and assign particular times to those activities. Although, in this later example, the
activities provided for the user to choose from do not capture many of those described
above in the limitations section. Even with these response time distributions or choice of
certain activities, many of the human response factors discussed above do not have
sufficient data to provide such options to current evacuation models. It is important to
realize that such factors exist. The next step is understanding the circumstances that
cause these factors to emerge and then assigning certain time limits and behaviors as
adequate responses.
Uncertainty Since there is a great deal of uncertainty and variability in the prediction of people
movement and behavior, designers have expressed concerns about a lack of sufficient
understanding of which of the inputs/variables make the most impact on the evacuation
results9. If such information was known, more emphasis in research of past experimental
data could be put into the more influential inputs. This is not to say that the other inputs

43
do not matter, but would be less significant on the evacuation results. The engineers
would be able to focus more on the influential inputs through research and simulation of
a wide variety of potential inputs in order to completely bound the evacuation results.
Work in this area is being performed currently by Arup for a NIST grant.
Model quirks or characteristics As one may deduce, with current technology, there always seem to exist certain
limitations or problems. This is also true with many of the evacuation models that exist
today. Whether it is with the actual model or visualization software, it is important for
the user to be aware of such limitations and make sure that these problems do not affect
the evacuation results. No examples are given here so as not to single out any one model.
It is true that some models are more user-friendly than others. As technology has
increased, many of the models have resorted to a Windows based input screen, whereas
some models still resort to user input via Dos prompts. It is up to the user to decide
which models they feel comfortable using.
Lastly, in some models, buildings may be represented with less accuracy that
others. For instance, the models that use a network system move occupants from one
node to another node, instead of one section of a node to another section of that same
node. It is up to the user to decide which level of accuracy is needed for the particular
building. It may be a very simple building with segregated rooms where a network
model is quite appropriate. For more complex buildings and spaces, more accuracy may
be needed.

44
This chapter has aimed to serve as an overview of evacuation modeling. The
differences between conceptual and computer modeling has been explained. Also, the
early “players” in evacuation modeling have been introduced to serve as a foreshadowing
of the current modeling technology. It is quite interesting to see how the field of
modeling has begun and how far it has come in the last 30 years. Important modeling
characteristics have been introduced and explained in order to point out significant
difference between the current models. These characteristics are used to describe the
models in more detail in the next chapter. Guidelines presented in the SFPE handbook1
have also been introduced in order to give the model user a checklist of questions to
answer before choosing the appropriate model. Lastly, modeling limitations have been
presented as a caution to model users. These items should be taken into account before
attempting to use and understand modeling results.

45
CHAPTER 2: COMPREHENSIVE REVIEW OF PAST AND PRESENT EVACUATION MODELS
Introduction
After reviewing the human behavior and movement sections in the Society of Fire
Protection Engineers (SFPE) Handbook (Section 3, Chapters 12-14)1,2,3, the National Fire
Protection Association (NFPA) Handbook (Section 4, Chapter 2)11, and other seminal
works in human behavior in fire, the need for a comprehensive review of past and current
evacuation models was recognized. There are three evacuation model reviews that have
been written, which were significant in the organization and data gathering found in this
chapter. The most substantial review to date was performed by Gwynne and Galea33 at
the University of Greenwich. This report offers a review of 16 evacuation models and is
referenced throughout this chapter. Second, Combustion Science and Engineering
released an article on a review of fire and evacuation models, as well as developed a
website where this information is available and free to the public38,39. Lastly, Friedman40
also reviewed egress models, much in the same fashion as was performed by Gwynne
and Galea.
However, there is a need for an updated, unbiased, and more detailed review to
aid evacuation model users in choosing the appropriate model for their particular project.
The previous three reviews listed were written before newer models were developed,
showing a need for a more updated review. Also, the most influential review33, was
written by an establishment that has its own successful egress model. Because of this, it
was suggested that a model review be written by an individual without preference to a
certain model to relieve rumors of bias. Lastly, the previous three model reviews can
certainly be expanded as far as providing additional detailed information for each model.

46
Therefore, more explanation was given in this review to the details of interest to model
users, the inner workings of each model, and each model’s validation methods and
limitations.
Another purpose served by this review is to aid current and aspiring model
developers in understanding the latest state-of-the-art in evacuation modeling. Lastly,
this review aims to pinpoint limitations of various input variables due to a lack of data
and limitations on the lack or weakness of validation studies for certain models. These
are two very important areas in evacuation prediction.
There is a process which was followed to conduct this evacuation model review.
First, a list of relevant aspects and features of evacuation models that would be of interest
to any model user was compiled. These features were described in detail in Chapter 1
under the Categorization of Evacuation Models section. A bulleted list is provided here:
• Purpose
• Availability for public use
• Modeling method; movement, partial-behavioral, behavior
• Structure of model
• Perspective of model and perspective of occupants
• Occupant behavior
• Occupant movement
• Use of fire data
• Output
• Use of CAD drawings
• Visualization capabilities

47
• Validation studies
• Special Features
• Limitations
Once the list was deemed exhaustive, articles and previous evacuation model
reviews were gathered for research into each model. Each publication was read in order
to provide data for all relevant features of each evacuation model. In some cases, data
was not available or found, and such is stated in the model review.
This review covers a total of 28 computer models that focus on providing
evacuation data from a specific building. The models are organized in the review by
modeling method; movement models, partial behavioral models, and behavioral models.
A list of the models in the review is provided here, also in the order that they appear in
the review:
Movement models:
FPETool, EVACNET4, Takahashi’s Fluid Model, PathFinder, TIMTEX, WAYOUT,
Magnetic Model, EESCAPE, EgressPro, ENTROPY Model, and STEPs.
Partial Behavioral models:
PEDROUTE/PAXPORT, EXIT89, Simulex, GridFlow, and ALLSAFE.
Behavioral models:
CRISP, ASERI, BFIRES-2, buildingEXODUS, EGRESS, EXITT, VEgAS, E-SCAPE,
BGRAF, EvacSim, Legion, and Myriad (uncategorized).

48
For each model, a special feature section is included in this review. These are
included as features of interest for model users who are searching for the appropriate
model to simulate a certain type of building. In the special features section, there are ten
features of interest for each model. It is of interest whether or not the model can simulate
the first nine features listed and lastly, how the model simulates occupant route choice. It
should be stated, however, that some models attempt to simulate these evacuation
features even without adequate data. The specific features are listed here:
• Counterflow
• Manual exit block/obstacles
• Fire conditions affect behavior?
• Defining groups
• Disabilities/slow occupant groups
• Delays/pre-movement times
• Elevator use
• Toxicity of the occupants
• Impatience/drive variables
• Route choice of the occupants/occupant distribution
For each model, the feature is listed and described only if it is apparent that the
model has the capability of simulating it. Also, for each model, the method of simulating
route choice is listed and described.
Sections 2.1 to 2.28 focus on the individual characteristics of each model that are
important for model users to know and understand. The level of detail included is only as
high in quality as could be extracted from publications on the model and communication

49
with model developers. Sections 2.28 is included for completeness for this model review,
however because of its uniqueness, the model is not categorized with a particular
movement method (even though it resides in the behavioral models section).
Movement Models
Section 2.1 Egress Section in FPETool23,41:
Developer: H.E. Nelson, National Bureau of Standards, U.S.
Purpose of the model: The purpose of FPETool is to estimate the time needed for an
occupant or group of occupants to exit an area.
Availability to the public for use: This model is available on the Fire Research
Information website under the Fire Modeling Programs topic area through NIST:
http://www.bfrl.nist.gov/fris/.
Modeling method: Movement model
Structure of model: N/A. The distance of the route including the distance traveled
over stairwells is input by the user to describe the building.
Perspective of model: The model views the occupants as a mass of people (global)
flowing through doorways with a specified rate. The occupants also have a global view
of the building, since the most efficient exit paths are chosen for egress time calculations.

50
Occupant behavior: None.
Occupant movement: The flow rates through doors are assumed to be one
person/second/door leaf. In the case that a door leaf is less than 34 inches wide, the flow
rates may be less. The model also incorporates effective widths into the exit path. The
user of the model inputs the following items into FPETool:
• Travel speed on level routes (m/min)
• Travel speed on stairs (vertical travel)
• Flow rate through doors (people/min/exit door width)
• Flow rate on stairs (people/min/m Weffective)
• Total number of occupants using the evacuation routes
• Whether disabled occupants are included in the simulation
• The speed of the slowest evacuee
• The number of exit door leaves available to the occupants
• Total length of the route
• Vertical distance moved on stairwell
• Number of stairways used (total width)
• Stairway width (mm)
• Stairway tread depth
Since the model can handle only one stairway width, if a building contains greater
than one stairway with different widths, the user will need to enter an average width for

51
the stairways of the building. This model does not incorporate queuing through various
portions of the building, since the building is only represented by the travel route
distance, the number of stairwells, the exit door width, and the geometry of the stair.
Congestion occurs only at the doors or stairwells. The equations below make up the
calculations made by FPETool to provide egress times (as shown in Figure 2.1).

52
Figure 2.1: FPETool egress equations (41, p.33 )
Equations 1, 5, and 6 (together) provide a first-order estimate of area evacuation times.
Use of fire data: None.

53
Output: The output for the model is the following in minutes:
1. Horizontal and stair travel time – this includes the time for a person to traverse all
stair and horizontal paths without queuing.
2. Time required to pass all occupants through the building exit doors – the time for
the entire population to pass through the exit doors
3. Time required to pass all occupants through the building stair exit doors.
Import CAD drawings: No. The user enters the capacity of the nodes and the initial
contents. Building data is not necessarily supplied because the dynamic capacity (flow)
and the traversal times specified in the input move people throughout the building at
evacuation time progresses.
Visualization capabilities: None.
Validation studies: None known of at this time.
Special features:
• Disabilities/slow occupant groups - The user can input the speed of the slowest
evacuee as a percentage of an able evacuee’s speed.
• Route choice of the occupants/occupant distribution – Most efficient

54
Limitations: There are many assumptions made by the model. These assumptions are
the following: the most efficient exit paths are chosen, no actions such as investigation,
way-finding, etc. are incorporated, flow is ideal without congestion, and there is no
adjustment to flow speed due to density. Nelson notes that it is reasonable to expect
evacuation times that are two to three times greater than the nominal evacuation time
obtained from FPETool.
_____________
Section 2.2 EVACNET417,42,43:
Developers: Kisko, Francis, and Nobel, University of Florida, U.S.
Purpose of the model: EVACNET4 can be used for any type of building, such as office
buildings, hotels, skyscrapers, auditoriums, stadiums, retail establishments, restaurants,
and schools. The purpose of the model is to describe an optimal evacuation from a
building, meaning that the model minimizes the time to evacuate the building.
EVACNET4 replaces the previous version, EVACNET+.
Availability to the public for use: Yes, the model is available for public use. To help
pay for development, a license is $250.00.
Modeling method: Movement model
Structure of model: This is a coarse network model. Figure 2.2 shows the nodes
designations in the rectangles connected by arcs (arrows). Examples of node types are

55
WP (workplaces or rooms), HA (hallway), SW (stairwell), LO (lobby), and DS
(destination node or the outside). The numbers assigned to each node and arc are
provided by the user and are explained in the movement section of this review.
Figure 2.2: EVACNET4 building structure - nodes and arcs (42, p. 3)
Perspective of model: The model views the occupants as a mass of people (global), and
the occupants have a global view of the building, since occupants will move in the most
optimal way throughout the space. Even though this movement may not be the shortest
route, occupants are moved in a certain direction only to achieve occupant distributions
that produce minimal evacuation time. In other words, all exits will have a similar time
of use during the evacuation.
Occupant behavior: None.

56
Occupant movement: For each node, the user specifies its capacity and initial contents,
in number of people. For each arc, the user supplies an arc traversal time and arc flow
capacity. The traversal time is the number of time periods it takes to traverse the
passageway (represented by the arc), which is calculated by using the distance of the arc
and the speed of the occupants. The arc flow capacity is the upper limit on the number of
people that can traverse the passageway per time period, which is calculated using the
width of the arc and the flow (persons/foot-minute) of the occupants through that space.
The data (speed and flow) is provided by the user, meaning that the source of the
movement data is left up to the user to decide. And, once specified for the occupants of
the simulation, the data (speed and flow) remain constant.
Use of fire data: None.
Output: The output is organized and explained in Table 2.1.

57
Table 2.1: EVACNET4 Output
Parameter Description General overview Time to evacuate the building, time of uncongested
evacuation, the congestion factor (building evacuation time divided by uncongested evacuation time), the average time for an evacuee to egress the building, the average number of evacuees per specified time period, the number of successful evacuees
Destination node distribution Number of evacuees that passed through that exit to safety Total arc movement List of arcs and the number of people traveling through each
one Identification of bottlenecks List of arcs that had bottlenecks (queues) and the
corresponding time periods that the arc was a bottleneck Floor clearing time Time period that the last evacuee left that floor Node clearing time Time period that the last evacuee left the node Uncongested evacuation time by node
Number of time periods that the node was uncongested
Building evacuation profile Number of evacuees per time period Destination evacuation profile Number of evacuees per exit per time period Node contents profile Number of people waiting at the end of a time period for a
specified node Arc movement profile Number of people moving at the end of a time period for a
specific arc, respectively Bottleneck information for a specific arc
Number of people waiting at a specific node
Node contents snapshot Number of people at a specific node at a specified time period Non-evacuee allocation Number of people not evacuated by a particular time period
Use of fire data: None.
Import CAD drawings: No. The user enters capacity of the nodes and the initial
contents. Building data is not necessarily supplied because the dynamic capacity (flow)
and the traversal times specified in the input move people throughout the building as
evacuation time progresses.
Visualization capabilities: None.

58
Validation studies: Johnson et al43 provides validation for EVACNET+ (a previous
version of EVACNET4) from an unsuspected evacuation from the National Gallery of
Victoria involving 1014 people. Gwynne33 explains the biases in the write-up due to the
fact that information which would not have been known before the evacuation was
entered into the model, such as the information that one exit was not used, the under-use
of another exit, etc). Gwynne also notes that because EVACNET optimizes an
evacuation, any overestimation by the model is a large error. The results are shown
below in Table 2.2:
Table 2.2: Results of validation study for EVACNET+
Exit Evacuation Time (s) EVACNET+ time (s) A 420 424 B 420 424 C 480 521 D 480 512
Total time 480 521
Special features:
• Elevator use – Yes. The inputs required includes the "down" travel time, the "up"
travel time, the time of the first "down" departure, and the elevator capacity. Given
this information, EVACNET4 runs the elevator on the defined schedule for the
duration of the evacuation. Passengers are carried only on "down" trips. This is
shown in Figure 2.3.

59
Figure 2.3: EVACNET diagram incorporating elevator use (42, p. 66)
• Route choice of the occupants/occupant distribution – Optimal route only
Limitations: The model’s array sizes can be accustomed to fit needs of building. This
simply requires a larger memory. The text input files are arduous to assemble for a
complex building.
____________
Section 2.3 Takahashi’s Fluid Model44,45:
Developers: Takahashi, Tanaka, and Kose, Ministry of Construction, Japan
Purpose of the model: The purpose of this model is to predict and evaluate the
evacuation time of people in a fire, mainly from a low level hazard. The assumption of
this model is that people move like a fluid.

60
Availability to the public for use: An email was received from one of the authors of the
model, Takeyoshi Tanaka. He stated that the model was published for general use about
15 years ago from the Building Center of Japan and was used for a while in research and
practical fire safety design of actual buildings. However, because hand calculation
methods have been widely used among building designers for the estimation of
evacuation time lately, the model has not become as popular in use.
Modeling method: Movement model
Structure of model: This is a coarse network system. The 6 space elements are room,
path, stair, vestibule, hall, and refuge area. The two “imaginary spaces” are link and
crowding.
Perspective of model: The model views the occupants globally as a homogeneous group
with the ability to move like a fluid with a constant speed in each space element. The
occupants view the building globally as well, since they are moved throughout the
building through the most optimal route.
Occupant behavior: No behavior.
Occupant movement: Occupants are uniformly distributed in rooms and given delay
times by the user. Takahashi’s fluid program models the movement of the occupants
throughout the room using two different approaches, depending on the obstacles in a

61
room. The L-shape approach is used for rooms where obstacles are present, which allows
the occupants to approach the exit in an L-shaped or indirect manner. For rooms without
obstacles, the occupants approach the exit directly using the centripetal approach, as
shown in Figure 2.4.
Figure 2.4: Occupant movement in a room following the centripetal approach (44, p. 554)
For both methods, the number of evacuees arriving to the exit after a time (t) is
affected by the length and width of the room, the user specified walking speed, and the
density of the evacuees in the room. Any crowding at the exits from rooms is
redistributed to achieve the minimum or optimal evacuation time from each space. The
fluid movement equations used for the simulation are applied to the entire population.
The assignment of equations to the entire population of a model from another field of
study that can be related to human behavior in a fire, in this case fluid flow, has been
referred to as a functional analogy33. The movement method of this model will be
referred to as the functional analogy of fluid flow, with the underlying method of
assessing the density of the space elements.
When moving from one space to another in the building (through a link), the
movement is dependent upon the number of evacuees ready to move, the availability
capacity of the space they would like to move into, the width of the opening, and the
number of space elements combining in that link. The model incorporates all of this into

62
overriding equations for the entire population to follow. When the evacuees reach the
hall, they use the exits that would minimize egress time, taking into account crowding of
the exits, the number of evacuees reaching the exits, the distance to the exits, and the rate
of egress (persons/second) at each exit.
Output: The output from the model is the total evacuation time and a visualization
presentation. The visualization shows the number of evacuees in each space element
with five levels of density. When crowding forms at the doors of each space element, for
example, blackened arcs can be seen surrounding the doorway to signify higher density.
Use of fire data: None.
Import CAD drawings: No. The user inputs the length and width of space elements.
Not much more information is provided.
Visualization capabilities: 2-D visualization of the levels of density on the floor plan, as
explained in the output section.
Validation studies: Validation studies of the fluid model were performed using
measured evacuation times from the seven pavilions of the Tukuba International Expo in
1985. The egress times of the occupants in each pavilion were calculated using two
different cases, 1) the L-shape approach is considered in the theater area, and 2) the

63
theater spaces consists of space units connected by paths (rooms and paths). The results
are shown below in Table 2.3:
Table 2.3: Validation results from the Tukuba International Expo
Pavilion # Egress Times (s) Average (s) Calculation 1) Calculation 2) 1 61, 71, 75, 60, 64 66.2 52 62 2 174, 154 164 137 275 3 71, 80, 77, 78, 79 77 50 76 4 94, 111, 102 102.3 72 89 5 70, 123, 84, 77 88.5 34 59 6 160, 152, 166, 157 158.8 100 107 7 148, 118, 130, 121, 131 129.6 70 88
Special features:
• Delays/pre-movement time – Yes, the delay time is input into the model.
• Route choice of the occupants/occupant distribution – The optimal route.
Limitations: The model only provides estimates of the general movement pattern of the
occupants.
_____________
Section 2.4 PathFinder46,47,48:
Developer: RJA Group, U.S.
Purpose of the model: The purpose of developing this model is to provide an analytical
egress simulation tool that could be coupled with an external fire model to form a portion
of hazard analysis. The model is used to find bottlenecks and queues in a design. There
is no specific building type specialty.

64
Availability to the public for use: The model is a proprietary software program
developed and used by the RJA Group.
Modeling method: Movement model
Structure of model: This is a fine network system. The model provides a simulation of
the evacuation to visually present the location of the occupants as a function of time.
Perspective of model and occupant: The model views the occupants as individuals.
The model has the capability of tracking individuals’ movements and positions
throughout the simulation. The model views the population through a global view only
to assess the density of certain areas of the building. The occupants, on the other hand,
have a global view of the building because of their route choices. They can choose the
shortest route to the exit or the shortest cue route.
Occupant behavior: No behavior.
Occupant movement: The occupants move toward the exits under the constraints of the
SFPE Handbook1, which incorporates speed reductions based on the density of the space
and the capacity of the doors and stairways. The primary areas of analysis focus on
movement in open spaces, on stairways, and through doorways. The user specifies initial
occupant loading by specifying the density in certain areas (by noting the occupancy of
the room) or by giving discrete number of occupants.

65
Output: Examples of the output are the number of people that have used an exit;
minimum, maximum, and average time for people to exit from a given room (monitoring
the first and last person to leave); the times a room, hall, or stair becomes empty; the time
a floor becomes empty; and total evacuation time.
Use of fire data: None.
Import CAD drawings: Yes, CAD drawings can be imported into the model or the user
can use PathFinder to layout a floor plan.
Visualization capabilities: 2-D visualization
Validation studies: No publications on validation studies were found.
Special features:
• Route choice of the occupants/occupant distribution – 2 choices: shortest distance or
shortest cue
Limitations: None specified as to limitations on model capacity.
_____________

66
Section 2.5 TIMTEX32:
Developer: S.S. Harrington, University of Maryland, U.S.
Purpose of the model: The TIMTEX model was developed to model evacuation from
buildings 4 to 15 stories high with consideration of certain human factors, such as
occupant decision on stair use.
Availability to the public for use: Since it was released as a Master’s thesis, this model
is inherently available to the public.
Modeling method: This is a movement model.
Structure of model: This is a coarse network system. Instead of acknowledging the
entire floor plan, TIMTEX concentrates on movement from the corridor on the floor to
the stairs and then to the exits. The model mainly focuses on the corridor and stair
sections of the building.
Perspective of model: The model views the occupants globally as a certain number of
occupants per floor moving as a homogeneous mass to the exits. The model sees all
occupants as alert and able bodied. The occupants view the building with an individual
perspective because the user can choose the flow split of occupants to the stairs. The
occupants will not necessarily move to the closest stair. Instead, the user can either claim
that a stair is frequently used and TIMTEX will use the default percentage use of the

67
popular stair, which is a 64% increase, or the user can enter any kind of flow split they
want for the floor plans. In this case, it would be possible for the user to model a certain
percentage of the population using the main exit, which may be the most familiar.
Occupant behavior: None.
Occupant movement: TIMTEX uses the equations specified in the SFPE Handbook1 to
move occupants throughout the corridors and stair systems. The speed and flow are
dependent upon density through each component. Also, the model uses the Handbook’s
rules to handle all transition points (i.e., merging streams, where egress elements
dimensions change, etc.). Flow up stairs is 10% slower than down stairs, as specified by
Pauls49. If queuing occurs in the stairs, the model assumes that the upper floors dominate
the flow. There are no variations in the speed, dependent upon the conditions or types of
occupants. Instead, flow and density calculations are based on values from the Handbook
(which have been averaged among occupant types).
The user enters in either the building population per floor or the area of each
floor, and the model will enter in the number of occupants for that occupancy type
(building occupancy uses 212 ft2/person, as an example). Again, it is up to the user to
accept the flow split generated by TIMTEX or enter a new split.
Output: Total evacuation time and individual floor clearing times are included in the
output and are shown in Figure 2.5.

68
Figure 2.5: Window from output of TIMTEX (32, p. 55)
Use of fire data: None.
Import CAD drawings: No. The user supplies the following data to the model: the
corridor length and width, the stair width, the stair door width, the landing length and
width, the floor to floor height, and the riser/tread dimensions. Boundary layers are
automatically subtracted from the building components. The user also supplies the
number of stories and if a stair is frequently used.
Visualization capabilities: None.
Validation studies: The model has been validated for buildings under 15 stories by
comparing results to the work done by Pauls1,3.

69
Special features:
• Route choice of the occupants/occupant distribution – User chooses the flow split of
occupants on the floor.
Limitations: The model should be used for buildings 4-15 stories in height only, since
the model developer has compared her results/output to Pauls’ Canadian fire drill
evacuation data and GSA fire drill evacuation data. The developer has found enough
consistency at those building heights. Also, this model does not actually move people
throughout the floor plan.
_____________
Section 2.6 WAYOUT39,50:
Developer: V.O. Shestopal, Fire Modelling & Computing, AU
Purpose of the model: WAYOUT has been created to compute traffic flow in
emergency situations from a multi-room or multi-story building. In this model, only
merging flows are considered.
Availability to the public for use: The model is available from Fire Modelling &
Computing in Australia as part of FireWind (18 programs) and the price is negotiable.
Modeling method: Movement model

70
Structure of model: This is a coarse network system. The model labels each
compartment of constant width with a number and refers to this compartment as a “twig.”
If the compartment has a variable width, it is divided into multiple twigs. For a building
evacuation with multiple exits, it is up to the user to draw “watersheds” to divide the
flows (on the basis of psychological or other considerations) and compute the route
separately. The method of labeling nodes in WAYOUT is shown in Figure 2.6.
Figure 2.6: Example of how nodes are labeled in EVACNET4 (50, p. 628)
Perspective of model: The model views the occupants globally as “packs.” And, since
the occupants have only one route to choose from, the occupants’ perspective will be
labeled as global, also.
Occupant behavior: None.

71
Occupant movement: The movement of the occupants is based on density vs. speed
data collected by Predtechenskii and Milinskii31. Density is defined as D=Nf/wL, where
N is the number of people in the stream, f is the area of horizontal projection of a person,
w is the width of the stream, and L is the length of the stream of people. The maximum
density of their results is 0.92 m2/m2, and WAYOUT uses the adult in mid-season dress
(0.113 m2) to calculate f. Density is monitored on each building section (Predtechenskii
and Milinskii data distinguishes between travel on horizontal components, through
doorways, down stairs and up stairs). WAYOUT considers flows throughout the route
from door to door of each compartment.
Output: The output from this model is the complete movement time and individual
times when each twig is evacuated.
Use of fire data: None.
Import CAD drawings: No. The user inputs geometrical configuration, including the
length and width of twigs, width of doors, and the population numbers in each twig.
Visualization capabilities: 2-D visualization of the evacuation tree is provided.
Validation studies: An evacuation study was performed on the Milburn House in
Newcastle, UK as a fire drill. The results are provided in Table 2.4. The number of

72
evacuees was monitored at each exit. The fire drill and simulation results are provided
below for this 7-story building:
Table 2.4: Milburn House validation results for EVACNET4
# of Evacuees Time of the gap in flow (s) Time of evacuation (s) Tested Computed Tested Computed
Exit 4 40 - - 60 40 – 99 Exit 8 48 - - 156 164
Exit 10 248 220 168 266 243
The calculations shown in the table were made for those exits that housed a large number
of occupants. The developers note that the occupants may not be moving as fast as they
may in an actual evacuation because of the fact that their movement was a drill. This
may be an explanation for the computed values providing a shorter evacuation time in
most cases. Some difficulties in this validation work were the incomplete response of all
occupants involved, and minor discrepancies in the records of occupants passing through
certain stairs and exit doors. The developers note, though, that this comparison “seems to
be satisfactory.”
Special features:
• Delays/pre-movement time – Yes, user enters start time for evacuation if the twig is a
blind end. This is so the user can incorporate time delays in receiving the alarm cue.
• Route choice of the occupants/occupant distribution – Only 1-route
Limitations: Only merging flows are considered. The model allows for up to 400
“twigs.”
_____________

73
Section 2.7 Magnetic Model51:
Developers: S. Okazaki & S. Matsushita, Fukui University, Japan
Purpose of the model: The purpose of this model is to visualize the movement of each
pedestrian in a floor plan as an animation so that architects and designers can easily find
and understand the problems of their design projects. This model uses the functional
analogy of the motion of a magnetic object in a magnetic field.
Availability to the public for use: Unknown
Modeling method: This is considered to be a movement model because of the use of
magnetism to move occupants throughout the simulation. Queuing “behavior” can be
simulated on the basis of occupants in airports, railway stations, department stores, and
office buildings, however, this is just a piece of the overall model. The model can
simulate groups, yet, it is unclear whether this is used to model affiliation or reduce
computer calculation time33. This model is on the borderline of movement and partial
behavioral categorizations
Structure of model: This is a fine network system. Each occupant is displayed at each
0.1 second time frame at the appropriate location in the plan on the computer display.
Perspective of model: The model views the occupants individually, as noted above,
during visual simulation. Also, the occupants have three different methods of walking

74
throughout the building (showing an individual or local perspective of the building,
depending upon the option chosen). These options are:
• Indicated route – a sequence of corner numbers (vertexes on the walls) is given by the
user and the occupants walk along them
• Shortest route
• Wayfinding – an occupant does not know the route and he/she walks seeking the goal
Occupant behavior: Mainly functional analogy, with an implicit classification for the
incorporation of observed queuing behaviors mentioned in the movement section.
Occupant movement: The initial input given for each occupant includes the following:
the location of the starting point, the maximum walking velocity, time to start walking,
orientation to walk, method to walk, and the destination. If there is a large number of
occupants, groups can be formed and the group will have a common destination,
orientation, start time, and method to walk. The velocity of each occupant in the group is
decided by random values which are normally distributed and the positions of the
occupants are decided by uniform random variables in specific areas set to the group.
The movement of the occupants is analogous to the movement of a magnetized object in
a magnetic field. A positive magnetic pole is given to the occupants, obstacles (walls,
columns, etc.), and handrails. A negative magnetic pole is located at the goal or exit. In
the magnetic field of the building, the occupants move toward the goal and avoid
collisions. A maximum velocity is provided by the user, because if the occupant moved

75
to the goal simply by the force of the magnetic field, his/her velocity could increase
without limit by acceleration, according to Coulomb’s law.
The magnetic force that acts on the occupant from a magnetic pole is calculated by
Coulomb’s Law, shown by Equation 2.1:
F=(k*q1*q2/r3)*r (2.1)
Where F is the magnetic force vector, k is a constant value, q1 is the intensity of
the magnetic load of the occupant, q2 is the intensity of the magnetic pole, r is the vector
from an occupant to a magnetic pole, and r is the length of r.
Another force is used in the evacuation calculation, known as Acceleration, a.
This force acts on an occupant to avoid collision with another occupant. The total of all
forces from the goals, walls, and other occupants on each occupant decides the velocity
of each evacuee at each time. If large values are given to the parameters of intensity of
the magnetic loads of elements and the occupants, the intensities of the repulsive forces
increase. As a result, the evacuees maintain longer distances from each other and from
obstacles, decreasing the density and the flow of the evacuation. All individuals respond
in the same way to the magnetic equations, as a functional analogy would.
The Magnetic model also incorporates a complex queuing system for specialized
spaces. Three types of queuing behavior are used in the model, originating from
observations made on the movement of occupants in airports, railway stations,
department stores, and office building. These three types of queuing systems are 1)
queues in front of a counter, 2) queues in front of gates, and 3) queues in front of doors of
vehicles.

76
Output: The output includes total evacuation time and a visualization presentation.
Use of fire data: None.
Import CAD drawings: No. The user supplies data on the walls and openings in the
floor plan. The walls are given as xy-coordinates on the plan of a building. Data on the
walls also includes handrails and other objects (obstacles). Information is also given to
the model on doors, exits, windows, counters, gates, and exits of vehicles (such as
elevators and trains).
Visualization capabilities: 2-D visualization of occupant movement and areas of
crowding is provided.
Validation studies: None specified
Special features:
• Defining groups – Yes, groups can be defined if a large number of occupants are
included in the simulation. Occupants are then entered as groups and occupant data is
given for each group.
• Disabilities/slow occupant groups – Yes, the user can adjust the maximum walking
velocity of the group.
• Delays/pre-movement time – Yes, the user can input the time to start the evacuation.

77
• Route choice of the occupants/occupant distribution – There are three choices,
indicated route, shortest route, and wayfinding.
Limitations: None provided in documentation.
_____________
Section 2.8 EESCAPE (Emergency Escape)39,52:
Developer: E. Kendik, Cobau Ltd. Argentinierstr. Austria
Purpose of the model: The purpose of this model is to address the time sequence from
the time at which people begin evacuation from the floors until they reach the outside or
approved area of refuge in the building. The program allows the user to change the
dimensions of the building’s means of egress and the occupant load easily to assess the
influence of the variations in the system.
Availability to the public for use: The model is operated by the organization (Cobau
Ltd.) for the outside user.
Modeling method: This is a movement model.
Structure of model: This is a coarse network system. The model seems to
acknowledge only a corridor, stair, and exit arrangement.

78
Perspective of model: The model views the occupants globally as a single group of
occupants per floor moving as a homogeneous mass to the exit. The occupants also view
the building with a global perspective because there is only one exit to travel to.
Occupant behavior: No behavior is modeled.
Occupant movement: As mentioned earlier, the model considers the population to be a
single group of a certain mean density on each section of the escape route. The
calculated density on each component of the escape route is used to calculate the speed of
the occupant through the escape route (Kendik references the work of Pauls and
Predtechenskii and Milinskii). The partial flows from the floor, which are equivalent in
number on each story of the building, evacuate and enter the staircase at the same time.
If the partial flows from each floor interact with each other in the staircase, the model
then uses calculation methods for occupant flow under (stair width is still adequate to
handle merging flow) and above (congestion occurs) maximum flow on stairs. The user
inputs the number of persons using the escape route.
Output: The output from this model is the total evacuation time.
Use of fire data: None.
Import CAD drawings: No. The user supplies the escape route configuration to the
model, which is assumed to be identical on each floor of the building. Also, the number

79
of floors is specified by the user. The user enters the length and width of the corridor
leading to the stairs and door width, the length and width of the stairway, and the greatest
travel distance along the corridor.
Visualization capabilities: None.
Validation studies: The model is calibrated against data from evacuation tests carried out
at the University of Karlsruhe. No further information is supplied.
Special features:
• Route choice of the occupants/occupant distribution – Only one choice is given to the
occupants.
Limitations: Seems to be a simple 1-route configuration.
_____________
Section 2.9 EgressPro39,53:
Developer: P. Simenko, SimCo Consulting, AU
Purpose of the model: The purpose of this model is to predict egress times from a
deterministic time-line analysis for a single user-selected room, corridor, and stair
arrangement. The model is a tool for assessing egress conditions during fire emergencies
in buildings.

80
Availability to the public for use: The model was available through SimCo Consulting,
although the developer has said that the model is over 6 years old and he is no longer
selling it.
Modeling method: This is a movement model.
Structure of model: This is a coarse network system. The model acknowledges only a
room, corridor, and stair arrangement.
Perspective of model: The model views the occupants globally as a certain number of
occupants per floor moving as a homogeneous mass to the exit. The occupants also view
the building with a global perspective because there is only one exit to travel to.
Occupant behavior: No behavior is modeled.
Occupant movement: EgressPro models the process of egress movement by following
the general concepts of traffic flow. The flow of groups is based on the relationship
between speed of movement and the population density in the space. The occupant
density (dependent upon the use of the space) can be chosen by the user from an input
table and the program will multiply the density value by the room area, which determines
the initial number of people in the room. Or, the user may simply choose the number of
occupant in the space.

81
Output: “Stair/Corridor Egress Time” is calculated as the output. This is the time
interval from the time when the first occupant enters the stair to the time when the last
occupant exits the final exit door.
Use of fire data: User input of a specific fire.
Import CAD drawings: No. The user supplies data to the model, such as each
room/space geometry and egress door size. Also, the travel distance along the line of
travel on the stair slope and the riser/tread geometry are entered by the user.
Visualization capabilities: None.
Validation studies: The model’s Help file provides a case study that verifies EgressPro
results. Access to the help file was not available.
Special features:
• Fire conditions affect behavior? Yes, the program calculates the time to alarm by
calculating the time to detection of a t-squared fire. The detector is assumed to be
located in an area so that it is exposed to the maximum ceiling jet velocity and
temperature.
• Delays/pre-movement time – Yes, the pre-movement time is dependent upon the use
of the building and the type of alarm present in the building. Delay values are
obtained from DD-240 guide. From the write-up on the model, it seems that only 1

82
delay time is given for the entire population, instead of distributing a range
throughout the population.
• Route choice of the occupants/occupant distribution – Only one choice is given to the
occupants.
Limitations: The model produces only a “time-line” calculation of movement
throughout the room, corridor, and stair arrangement.
_____________
Section 2.10 ENTROPY54,55:
Developer: H.A. Donegan, University of Ulster, UK
Purpose of the model: The purpose of this model is to encompass egress uncertainty
related to the building and provide a measure of complexity of the building structure.
This is not a traditional egress model in that it does not calculate egress times for a
certain population, but instead uses an entropy probability to simulate the expected
information content, and in turn, the complexity of the floor plan. This model is
considered to be a macroscopic model, which focuses on evacuation routes and the
population as a whole, instead of individual elements (microscopic).
Availability to the public for use: Unknown.
Modeling method: This is a movement model/partial behavioral model

83
Structure of model: This is a coarse network system. Each compartment (room,
stairwell, or area that can be occupied) is labeled as a node. Arcs are then drawn between
the nodes on the floor plan.
Perspective of model and occupant: This model is not a traditional evacuation model
with occupants traveling throughout the building from initial starting points in order to
calculate an evacuation time. This model uses the probabilities of acquiring knowledge
(or not) to calculate the complexity of the space. The model views the occupants (if at
all) in more of a global manner. There are not individual characteristics given to each
person that would make them unique in an evacuation.
The occupants have a semi-individual view of the building because of the fact that
they can backtrack due to a lack of acquiring information. They are simulated as having
an unfamiliar view of the building. On the other hand, in the basic model, the occupants
only have one exit to choose from (all networks are trees).
Occupant behavior: The model is labeled as not simulating behavior.
Occupant movement: The concept of entropy is used in thermodynamics to describe a
measure of disorganization of a physical system. In 1948, the name or label of entropy
was adopted by Shannon as a measure of uncertainty. Shannon entropy is expressed by
the following equation:
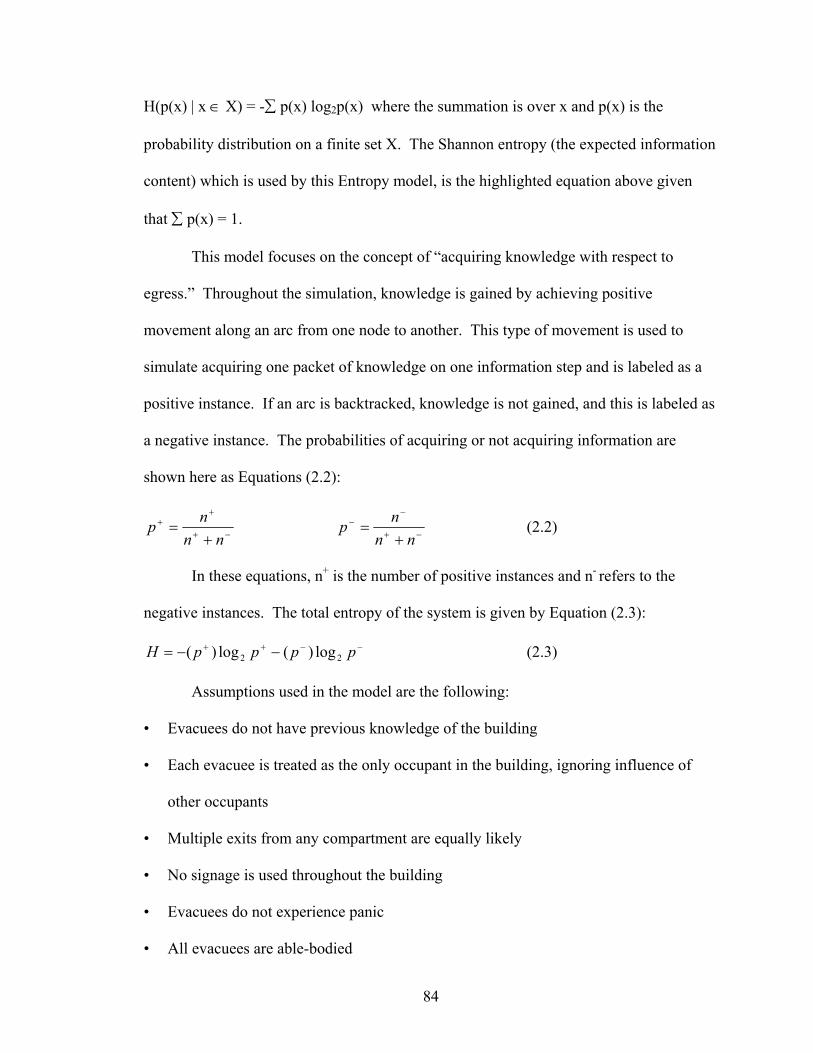
84
H(p(x) | x ∈ X) = -∑ p(x) log2p(x) where the summation is over x and p(x) is the
probability distribution on a finite set X. The Shannon entropy (the expected information
content) which is used by this Entropy model, is the highlighted equation above given
that ∑ p(x) = 1.
This model focuses on the concept of “acquiring knowledge with respect to
egress.” Throughout the simulation, knowledge is gained by achieving positive
movement along an arc from one node to another. This type of movement is used to
simulate acquiring one packet of knowledge on one information step and is labeled as a
positive instance. If an arc is backtracked, knowledge is not gained, and this is labeled as
a negative instance. The probabilities of acquiring or not acquiring information are
shown here as Equations (2.2):
−+
++
+=
nnnp −+
−−
+=
nnnp (2.2)
In these equations, n+ is the number of positive instances and n- refers to the
negative instances. The total entropy of the system is given by Equation (2.3):
−−++ −−= ppppH 22 log)(log)( (2.3)
Assumptions used in the model are the following:
• Evacuees do not have previous knowledge of the building
• Each evacuee is treated as the only occupant in the building, ignoring influence of
other occupants
• Multiple exits from any compartment are equally likely
• No signage is used throughout the building
• Evacuees do not experience panic
• All evacuees are able-bodied

85
• All networks are trees
• A backtrack path is equivalent to one positive and one negative instance
• A forward path resembles a positive instance.
• Each evacuee has a path memory.
An example of the steps taken for the most basic model is shown here. This
example involves a single floor, single exit and the steps that the model takes to reach an
output of entropy and complexity are listed:
1. Selection of a node on the network which is not an exit
2. For the arcs on the path that lead directly from the node to the exit, a single-headed
arrow is drawn in the direction of the exit
3. On all other remaining arcs, a double headed arrow is drawn.
4. Count the number of double-headed arrows and this is the value for n-
5. Count the number of single-headed arrows and this is the value for n+
6. Substitute the values in for n- and n+ to calculate the entropy value for that node
7. Repeat steps 1-6 for each non-exit node
8. Average all nodal entropy values together
9. This results in the average entropy value for each node or the overall complexity
value.
The suggested improvements to the model, such as occupants with disabilities,
buildings with greater than one exit, simulation of locked doors, etc. were listed but not
explained as to how these would alter the simulation and results.

86
Output: The output from the model is an average entropy value for each node, which is
the overall complexity value for each floor.
Use of fire data: None.
Import CAD drawings: No. Nodes and arcs are input into Entropy.
Visualization capabilities: None.
Validation studies: A validation study was performed which compared ENTROPY
results of complexity to EVACNET+ results. The study used a network of nodes and
arcs to represent a building with one fixed exit and one exit which would vary positions.
The comparison consisted of improvements shown by each model (ENTROPY would
show a reduction in complexity and EVACNET+ would show a decrease in time period
and an increase in flow of occupants to exits) with varying placement of the second exit.
Differences in improvements were found for certain positions of the second exit between
the two models.
Special features:
• Manual exit block/obstacles – No, but this was an area of improvement. It is not clear
if this feature has been added (by simulating locked doors).
• Disabilities/slow occupant groups – No, all evacuees are able-bodied, but this topic
was listed as an area of improvement that the model can be extended to cater for.

87
• Route choice of the occupants/occupant distribution – An assumption used is that the
building contains only one exit, but an improvement listed to the model was to
increase the buildings to more than one exit (which gives multiple routes to the
occupants).
Limitations: One limitation is the assumptions made by the model. This is not a
traditional evacuation model, but instead a model used to measure the complexity of the
structure from an evacuation point of view.
_____________
Section 2.11 STEPs56,57,58,59,60,61,62:
Developer: Mott MacDonald, UK
Purpose of the model: The purpose of this model is to simulate occupants in a normal or
emergency situation within different types of buildings, such as stadia or office buildings.
Availability to the public for use: The model is available for use from Mott McDonald.
Modeling method: This is a movement/partial behavioral model. It contains pre-
movement abilities, occupant characteristics, patience factor, and family behavior.
Structure of model: This is a fine network system made up of a series of grid cells, in
which only one occupant can occupy each cell. The common grid cell size is 0.5m by 0.5

88
m. Another “fine grid” option is available where more than one person can occupy a grid
cell, but this option is still in test mode.
Perspective of model: The model views the occupants individually and allows the user
to give individual traits to each person or groups of people in the simulation. The
occupants also have an individual view of the building, because the user can specify each
occupant’s (or group’s) “target” or checkpoint (exit), allowing for the user to aid in the
mapping of a defined route for certain groups of people. Also, for each target, each
occupant group is assigned an awareness factor between 0 and 1, specifying the fraction
of that group which knows about the exit. If a 0 is specified for the occupant group and
target, that denotes that no one in the group knows about the target or exit, and the label
of 1 would specify that everyone in the group knows about the target or exit. The
occupants choose the exit that they travel to according to the score assigned to each exit.
This score is based on the following four factors: 1) the shortest distance to the exit, 2)
familiarity with the exit, 3) the number of occupants around the exit, and 4) the number
of exit lanes.
Occupant behavior: This type of behavior will be labeled as functional analogy, since
the entire population is subjected to the same set of movement equations. Also, decision-
making in the model is not dependent upon certain cues or circumstances of the
evacuation, but rather movement and speed is mainly affected by the availability of the
“next” grid cell. This is the main reason why this model is not labeled as “implicit”
behavior, but rather a functional analogy.

89
Occupant movement: In high density situations or queuing, the movement speed is
affected by the availability of the next grid cell. In a grid cell, the individual has 8
possible decisions surrounding the grid cell and the decision of where to go is based on
which of the adjacent grid cells has the lowest potential. When specifying an exit in
STEPs, the program will calculate the Potential Table which will provide the shortest
distance from each grid cell to the target. A recursive algorithm will be used by the
program to find the distance from each grid cell to the exit. The potential for exit cells is
0, and the program then jumps to each adjacent cell to calculate its potential. If the
program jumps to a cell using a diagonal move, STEPs will add (Grid Size value*(Sqrt.
2)) to the cell’s current potential, and if the program jumps to a cell using a horizontal or
vertical move, STEPS will add the Grid Size value to the cell’s current potential.
When occupants are deciding which route to take and exit to use, they choose the
path with the lowest score. If multiple paths have the same score, the occupants
randomly chose between them. STEPs uses an algorithm to score each Target for each
individual, and this algorithm is divided into 8 stages:
• Time needed to reach the Target.
• Time needed to queue at the Target.
• Adjustment of the walking time to take into account the time that is not actually
walked to reach the end of the queue.
• Calculation of the real time needed to reach the end of the queue.
• Adjustment of the queuing time to take into account the people that will get out while
the person is walking.

90
• Calculation of the real time to queue.
• Incorporate patience levels.
• Calculation of the final score
To calculate the time needed to reach the target, Twalk, the distance to the target
(D, obtained from the potential table described above) is divided by the person’s walking
speed (W, entered by the user). This is shown in Equation (2.4).
Twalk = D/W (2.4)
The time needed to queue at the target (Tqueue) divides the number of people that
will reach the target before the current person (N, by comparing the “time needed to
reach the target” of the current person with all others in the same plane) by the flow rate
of the target (F, also specified by the user in p/s). This is shown in Equation (2.5)
. Tqueue = N/F (2.5)
All occupants with a lower Twalk are considered to be in front of the current
person. Since Twalk gives the total time to walk to the target if there was no queuing, the
additional of Twalk and Tqueue would give a larger evacuation time than needed for the
occupant to reach the exit. The program makes adjustments to these values, naming them
“real time to walk” and “real time to queue.” The “real time to walk” is found by
subtracting off the time to walk through the area where the queue has formed, resulting in
the time to walk until reaching the end of the queue for that current person. The queue
time also has to be adjusted because while the person is walking to the queue, others are
leaving through the exit, reducing the queue. The “real time to queue” is calculated by
subtracting the time it takes for those occupants to leave through the exit before the
current person joins the queue. Patience coefficients are also factored into the score and

91
influence how long the occupant will wait in the queue. There are also walking and
queuing coefficients that are not quite explained in the users manual that also play a role
in the score for route choice.
The user specifies many different attributes for the people, such as body width,
depth, and height, patience, walking speed, and their people type/group. Occupants can
also be introduced into the simulation at a certain time and place, after the evacuation has
begun. When family groups are specified in STEPS, the family moves throughout the
simulation to meet at a certain position in the building before evacuating.
Output: STEPs output includes the total evacuation time, numbers of occupants in
certain areas, planes, paths, and the entire simulation and the number of people that have
left these different fields vs. time.
Use of fire data: None.
Import CAD drawings: Yes, CAD drawings are input in DXF file format.
Visualization capabilities: 3-D
Validation studies63: The case studies written about for STEPs involve a comparison of
its simulations to the method of evacuation calculations outlined by NFPA 130. This
report outlines two examples that demonstrate STEPs’ applicability to station geometries.
The first case, shown in Figure 2.7, involves a center-platform station in which the

92
platform is raised above the
concourse (at grade level) as
shown in the figure. By using
the NFPA calculations for
Case 1, the total time to clear
the platform is 190.7 seconds
and the total time to evacuate
the station is 239.9 seconds. When the identical model of this station is simulated with
STEPs, the mean time to clear the platform is 212.4 seconds and the mean evacuation
time is 257.4 seconds. This case shows a difference of 7.3 to 11.4% between NFPA 130
and STEPs. Also, STEPS is
able to model the natural
imbalance of exit use, while
NFPA 130 calculations
assumes that all exits are used
optimally.
Case 2 involves a more
complex station with a side-platform. As shown in Figure 2.8, the concourse is below
grade level and the platform is below the level of the concourse. Using NFPA 130, the
total time to clear the platform is 179.8 seconds and the total evacuation of the station is
369.8 seconds. Also, when recalculating NFPA evacuation times using a different, more
realistic split, the result is found to be 306.3 seconds. When modeled in STEPS, a mean
Figure 2.7: Case Study 1 (63, p. 130-30)
Figure 2.8: Case Study 2 (63, p. 130-32)

93
platform clearing time of 181.4 seconds is achieved and a mean total evacuation time was
313.2 seconds. This shows a 0.9 – 2.3 % difference between STEPS and NFPA 130
calculation methods.
In both cases, STEPs has given the more conservative result. This comparison
has that STEPs can reproduce similar evacuation times when compared with NFPA 130.
It is not clear what this type of validation exercise shows. This comparison also more
importantly shows that the optimal hand calculations may not always give the most
accurate and realistic evacuation time for the building.
Special features:
• Manual exit block/obstacles – Yes, the user can enter blockages at specific points
throughout the floor plan.
• Defining groups – Yes.
• Disabilities/slow occupant groups – Yes.
• Delays/pre-movement time – Yes, this is specified by the user.
• Elevator use – Yes.
• Impatience/drive variables – There is an impatience factor of 0 to 1 and represents
how prepared the occupants are to queue at the target. The patient people will wait
longer before moving to another target. This coefficient affects the queuing time
calculation for the occupant.
o 0.5 = unbiased level of patience
o >0.5 = patient
o <0.5 = impatient
94
• Route choice of the occupants/occupant distribution – The route choice is varied by
the score of target or is user-defined.
Limitations: One of the limitations of this model is the fact that occupants move only
according to availability of next grid cell. There is no limit on the number of floors to
use. However, the real strain on the computer comes from the number of grid cells and
the number of people specified in the model. If the user has a particularly fast computer,
there is no limit.
Partial Behavioral Models
Section 2.12 PEDROUTE and PAXPORT64,65,66,67,68,69,70:
Developer: Halcrow Fox Associates, UK
Purpose of the model: The purpose of this model is to simulate the passage of travelers
through public transport stations. PEDROUTE has been used to model approximately
100 underground stations in London. PAXPORT, which can model airports or railway
terminals, has the capability of incorporating the movement of passengers in shopping
and waiting areas in the stations. PAXPORT can model aircraft, train, bus, and passenger
movements. The models can be used to show where capacity problems are likely within
the stations, and test improvements.

95
Availability to the public for use: PEDROUTE can be purchased from Halcrow Fox
Associates, as well as yearly maintenance. Or, Halcrow Fox will build a model for the
client directly and test changes in-house. PAXPORT is not commercially available.
Modeling method: This is a partial behavioral model. It relies on speed/flow curves
which have been established from past observations of stations in normal use. Also,
attention is paid to usage of facilities, which is modeled in the form of occupant delays.
Structure of model: This is a coarse network system. The station plans are broken
down into different “blocks” which represent stairs, escalators, platforms, ticket halls, etc.
Each block has a different speed/flow curve associated with it to describe the movement
of the passengers. These speed/flow curves have been established from past surveys at
underground stations.
Perspective of model: The model views the occupants globally because instead of
individually recognizing each occupant, the occupant becomes one of 16 different group
types. Each group type is categorized by flight type (domestic flight, long haul, etc.)
and purpose (business and leisure) and is assumed to have particular characteristics. The
occupants view the building with a global perspective because passengers either travel
through the station on the basis of the quickest journey time (Stochastic assignment) or
the passenger flows are balanced on all routes in order to minimize the total time for all
routes (optimization or equilibrium assignment). The developers suggest that occupants

96
can be forced to follow exit signs as well, which may be considered as an individual
perspective.
Occupant behavior: Implicit behavior is modeled.
Occupant movement: Occupant movement is described by speed/flow curves of each
block obtained by previously observed movement in stations. Also, the model attempts
to represent the delays caused by behaviors of usage of certain facilities in the station.
Each group type is categorized by the flight type and purpose of the trip. The user
identifies initial walking speeds and group size as input.
Each group type requires the user to supply data such as the following:
• Arrival times
• Processes followed by the passenger (i.e., check-in/security and passport control) for
both departing and arriving passengers
• The possibility of escorts (with departing passengers) and greeters (with arriving
passengers)
• The proportion of free time of the passenger spent in lounges, seating areas,
refreshment areas, leisure, etc.
• The proportion of passengers carrying baggage or using baggage carts
• The possibility of using certain facilities, even those who visit the terminal for
shopping reasons only
• Passengers can be forced to follow signage as an option
These traits are distributed throughout the group type.

97
Output: Different output forms are available to the user. The user can view the Fruin
“Level of Service” for any of the blocks in the station. Other output available are details
of peak occupancy and average delay per passenger. The model can produce journey
time savings from improvements made to the station plans.
Use of fire data: None.
Import CAD drawings: Both models require a graphical input of the station layout, and
this layout can be imported from CAD plans. Also, all 1-way movement areas need to be
input. The user identifies the block types on a floor plan, such as passageways, moving
walkways, stairs, escalator, platforms, service desks, lifts, and concourses, and also
defines the coverage of the blocks by tracing over the CAD layout within the program.
This defines their area (length and width) and their connections to each other.
Visualization capabilities: 2-D or 3-D simulation. Data of flow, service levels,
occupancy and delay can be displayed for the entire terminal or sections.
Validation studies: For the PAXPORT model, simulations were run as representations
of North Terminal at London’s Gatwick Airport. However, the results of this study were
not found.

98
Special features:
• Defining groups – Yes.
• Disabilities/slow occupant groups – Yes.
• Delays/pre-movement time – Yes.
• Route choice of the occupants/occupant distribution – Quickest route, Optimization,
or follow exit signs.
Limitations: No individual consideration.
_____________
Section 2.13 EXIT8971,72,73,74,75,76:
Developer: R.F. Fahy, NFPA, U.S.
Purpose of the model: EXIT89 was originally developed as the evacuation model for
Hazard I to simulate large populations in buildings (high-rises). The developer claims
that the model is capable of the following things:
• Handle large populations
• Recalculate exit paths after nodes become blocked by smoke
• Track individual occupants as they move throughout the building
• Vary travel speed as a function of population density.
Availability to the public for use: The program has not been released as of yet by
NFPA. The model can be obtained through special arrangement with Rita Fahy.
Currently, the model is not publicly for sale.

99
Modeling method: This is a partial behavior model. It relies on the density vs. speed
data from Predtechenskii and Milinskii for different building components, such as
horizontal components, doorways, up stairs, and down stairs. It also uses conditional
movement, depending upon the presence and density of smoke in the evacuation path.
Structure of model: This is a coarse network system. The floor plan is divided up into
nodes and arcs, specified by the user of the program. The nodes require the following
input from the user: the node name, the usable floor area, the height of the ceiling,
maximum capacity of the node (number of people), number of people at the node when
evacuation begins, the number of people at the node who are disabled, an ID that notes
whether the node leads to the outside or is part of the stairway, amount of time the people
at that node will delay before evacuating, and the node that occupants at that room will
travel to if the user is defining the exit route. For each arc, the input required is the
distance from the first node to the opening/restriction between the two nodes, the width
of the opening, and the rest of the distance from the opening to the second node.
Perspective of model: The model views the occupants individually because the output
of the model tracks the individuals’ positions throughout the evacuation. Also, the
occupants have an individual view of the building because the route choice can consist of
either the shortest route or a user-defined route for certain nodes. There is a fine line here
because the individual occupants are not given a route, instead all occupants located
initially at a certain node will travel the user-defined route. On the other hand, if an exit

100
is blocked manually or by smoke conditions, the occupant then chooses an alternate route
based on the floor they are on, not a global view of the building. This way, the occupant
may take a longer way out76.
Occupant behavior: Implicit behavior is modeled.
Occupant movement: The model emulates the “shortest route” algorithm that identifies
the exit of the network and then fans out from the exit in an attempt to identify the
shortest routes to all other nodes. EXIT89 calculates the shortest routes on each floor to
the stairs or outside. This is done so that if a node on the floor is blocked by smoke, only
the routes on that floor and the floor above will need to be recalculated. It also allows the
occupants to maintain an individual perspective of the building.
Walking speed throughout the model is a function of density, based on the
observations of Predtechenskii and Milinskii31. EXIT89 allows the user to choose
between three different body sizes labeled American (0.0906 m2), Soviet (0.1130 m2),
and Austrian (0.1458 m2). The calculations used in EXIT89 use the specific body size to
solve for the density of a stream of occupants. This equation is shown here:
D=Nf/wL (m2/m2) where N is the number of people in the stream, f is the area of
horizontal projection of a person, w is the width of the stream, and L is the length of the
stream. Predtechenskii and Milinskii report a maximum density of 0.92 m2/m2. The user
can also specify whether the occupants will move in emergency or normal conditions,
and the difference in calculation is shown below.

101
EXIT89 uses the velocity correlations for horizontal paths, down stairs and
upstairs, depending upon the density calculated in each movement situation, as given by
Predtechenskii and Milinskii31.
Horizontal Paths:
57217434380112 234 +−+−= DDDDV (m/min) (2.6)
for density: 92.00 ≤< D
Down Stairs (↓):
↓↓ =VmV (m/min) (2.7)
where )224.061.5sin(44.0775.0 39.0−⋅+= ↓
−
↓↓ Dem D
Up Stairs (↑):
↑↑ =VmV (m/min) (2.8)
where ↑↑ ⋅+= ↑ Dem D 7.15sin09.0785.0 45.3 for ;6.00 << ↑D
where )57.185.7sin(10.0785.0 +−= ↑↑ Dm for 92.06.0 ≤≤ ↑D
For emergency movement, equations (2.6) to (2.7) are adjusted by equation (2.9):
(2.9)
Where µe = 1.49 – 0.36D for horizontal paths and through openings
µe = 1.21 for descending stairs
µe = 1.26 for ascending stairs
EXIT89 uses tables of velocities (based on occupant densities) for normal,
emergency, and comfortable movement along horizontal paths, openings, and stairways.
v v e e µ =

102
Output: The output consists of a complex occupant movement table that tracks the
position and node movement of each occupant throughout the entire simulation. Also,
the total evacuation time and the number of occupants trapped are provided in the output.
Stair and floor clearing times are also included.
Use of fire data: Importing fire data from CFAST77.
Import CAD drawings: No. Building data is specified through the node and arc inputs.
Visualization capabilities: No visualization
Validation studies: A validation study involves comparing results from a fire drill
involving 100 occupants from a 9-story building. Both the emergency and normal
evacuation speeds were used in two different simulations of the building. An error of
20% was noted from the emergency run (5.6 minutes from EXIT89 and 7 minutes actual
evacuation time), and the normal run overestimated the evacuation time by 43%.
The second validation study was performed using a 7-story office building in
Newcastle-on-Tyne in the UK. The fire brigade captured this data, and during the fire
drill, challenged the occupants by blocking access to one of the stairways. The fire
brigade captured information from different exits as well as surveyed occupants on their
initial location, exit used, and delay times before beginning evacuation. During the fire
drill, the occupants used the most direct route possible out of the building, sometimes
ignoring closer exits and/or climbing stairs to get there. Fahy used EXIT89 to first send

103
all occupants to the closest exit, and second to use the user-defined route option to mimic
the occupant paths during the drill. The results are found in Table 2.5 below.
Table 2.5: EXIT89 validation study results from the 7-story office building
Observed Predicted – Shortest Route Predicted – User Defined People Last Exit People Last Exit People Last Exit
Exit 1 2 45.9 s 2 35.0 2 35.0 2 6 48.0 6 26.0 6 26.0 3 6 90.0 107 148.0 6 36.0 4 40 105.0 124 153.0 51 104.0 5 0 - 7 72.0 7 103.0 6 23 115.0 27 109.0 26 95.0 7 0 - 0 - - - 8 48 190.0 6 60.0 30 120.0 9 8 90.0 11 54.0 11 54.0
10 248 220.0 91 107.0 242 162.0
Total Exited 381 286.0 381 153.0 381 162.0
The predicted results from the shortest route simulation provided a shorter
evacuation and much different flow split than the actual/observed data. Fahy states that
this is due to the unusual use of exits and the overwhelming use of Exit 10 by the
occupants of the building. After running a user-defined simulation, the flow distributions
seemed more reasonable, but the overall evacuation time of the prediction still provided
results of approximately 2 minutes under the observed time. Fahy suggests that the
reason for this discrepancy is that EXIT89 was not equipped with pre-movement or delay
time capabilities at the time of this validation work.
Lastly, Fahy simulated a fire drill conducted in a major department store by the
University of Ulster in the UK. 495 occupants were involved, many of whom were video
taped and interviewed about their evacuation. Fahy used the travel speed that would
provide the longest and most conservative evacuation times (normal evacuation speed),
due to the lack of cues indicated an emergency. Also, the shortest route option was

104
selected for the occupants because of the presence of staff during the evacuation. The
model simulation incorporated delay times for occupants recorded on videotape, as well
as mean delays times for each department and additional random delays for each
occupant. Table 2.6 below shows the results for the observed and simulated evacuations
from the department store:
Table 2.6: EXIT89 validation study results from the department store
Observed Predicted Exit # People First (s) Last (s) # People First (s) Last (s)
1 33 23 83 45 28 64 2 52 31 165 85 43 71 3 32 36 100 16 22 49 4 49 1 104 80 33 83 5 77 17 95 36 39 52 6 41 21 153 26 37 49 7 2 - - - - - 8 23 33 78 23 47 85 9 23 26 119 27 42 111
10 7 50 78 27 37 106 11 6 46 60 5 45 54 12 58 32 119 13 49 83 13 45 14 85 49 31 104 14 29 34 102 63 37 74
Total 495 495
As shown, the observed evacuation ended in 2 minutes, 45 seconds and the
simulation ended in 1 minute 51 seconds. Fahy states that there was good agreement
between the observed and EXIT89 results, and also noted large discrepancies for Exits 2
and 6. Fahy explained these discrepancies as delays prompted by the staff involving the
deactivation of the door alarm, checking shopping baskets of evacuees, and performing
final sweeps of the area for stray occupants.

105
Special features:
• Counterflow – Yes, the user specifies what percentage of the stairwell is blocked and
at what time within the simulation that this occurs. If the obstruction or counterflow
disappears after some time, the user can set the node back to its original area.
• Manual exit block/obstacles – Yes, the user enters the name of the blocked node and
the time from the start of the evacuation that the blockage occurs (in seconds).
Multiple nodes can be blocked at one time.
• Fire conditions affect behavior? Yes, the user can enter the output from CFAST.
EXIT89 uses the smoke densities and depth of the smoke layer from CFAST to
calculate the “psychological impact of smoke, S.” This is done with the following
equation:
S = 2*OD*(D/H) where OD is the optical density of the smoke layer, D is the depth
of the upper layer, and H is the height of the ceiling. This is the same method as is
used in EXITT to calculate S. If S > 0.5, the occupant is stopped and if S > 0.4, the
occupant is prevented from entering the room. Both cases allow for enough clear air
in the lower layer to crawl. EXIT89 does not handle crawling, so a value of S > 0.5 is
used to block the node, which traps everyone currently at that node as a result.
The smoke alarm will operate at S=0.0015 and the depth of the upper layer > 0.5 feet.
EXIT89 assumes that the notification of all occupants occurs when the level for
smoke alarm activation is reached at any node. At this time, movement will begin
after pre-movement delays have passed.

106
• Disabilities/slow occupant groups – Yes, the user specifies the number of disabled
occupants per node and then the percentage of “able-bodied” speed at which they will
walk.
• Delays/pre-movement time – Yes, the user can either specify a delay time per node or
an overall distribution of pre-movement times. In the latter case, the user inputs the
percentage of occupants who will be assigned additional delays, and the minimum
and maximum value for delay (seconds) for the uniform distribution.
• Route choice of the occupants/occupant distribution – Shortest distance or a user-
defined route
Limitations: The limitation of the model is 89 nodes per floor and up to 10 stairways for
the building. The size of the building and the number of occupants is limited by the
storage capacity of the computer used. Once a person enters a stairwell, they will remain
in that stairwell throughout the entire evacuation (unless stairway is blocked). EXIT89 is
set to allow 1000 5-second time steps, 10,000 links, 20,000 occupants and 10,000
building locations. This is hard-wired into the program, but is easily adjusted.
_____________
Section 2.14 Simulex78,79,80,81,82,83,84,85:
Developer: P.Thompson, IES, UK
Purpose of the model: Simulex is an evacuation model with the capability of simulating
a large amount of people from geometrically complex buildings.

107
Availability to the public for use: The program is available from IES, Integrated
Environmental Solutions, Ltd in the UK. Academic licenses are also available for a
lower fee.
Modeling method: This is a partial behavior model. It relies on inter-person distances
to specify walking speed of the occupants. Also, the model allows for overtaking, body
rotation, sideways stepping, and small degrees of back-stepping.
Structure of model: This is a fine network system. The floor plan and staircase are
divided up into a grid of 0.2 by 0.2 m blocks (grid cells). The model contains an
algorithm that will calculate the distance from each block to the nearest exit, and labels
this information on a distance map. This distance map is shown in Figure 2.9 for the
floor plan and staircase.
Figure 2.9: Example of visualization of the distance map in Simulex

108
Perspective of model: The model views the occupants individually. The output of the
model tracks the individuals’ positions throughout the evacuation, as shown during the
visualization. Also, the occupants have an individual view of the building because the
route choice can consist of either the shortest route calculated by the default distance map
or a user-defined route obtained by assigning an alternate distance map to an individual
or group of occupants. The alternate distance map can block certain exits in order to
force or guide an occupant to take a certain route throughout the building.
Occupant behavior: Implicit behavior is modeled.
Occupant movement: From the Simulex website86: “The algorithms in Simulex which
model fluctuations in walking speed, side-stepping, body-twisting, overtaking etc. are
based on a combination of the results of many video-based analyses of individual
movement and the additional results of a number of academic researchers. It is the only
computer program to both accurately model the co-ordinate position of each person to a
fraction of a millimetre and also the relationship between inter-person distance and
changes in walking speed.”
As mentioned earlier, the distance maps are used to direct occupants to the closest
available exit, where each person moves toward an exit by taking the direction that is at
right angles to the constant-distance contours from the exit. The user can create up to 10
different distance maps in the simulation.
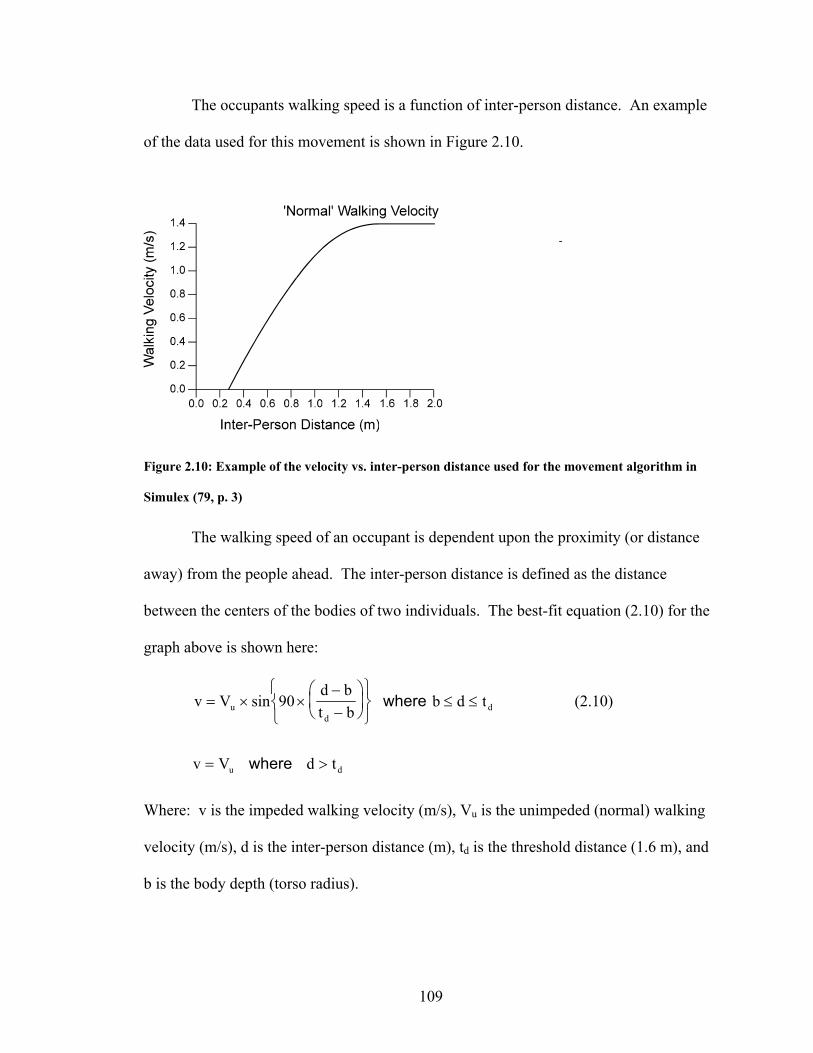
109
The occupants walking speed is a function of inter-person distance. An example
of the data used for this movement is shown in Figure 2.10.
Figure 2.10: Example of the velocity vs. inter-person distance used for the movement algorithm in
Simulex (79, p. 3)
The walking speed of an occupant is dependent upon the proximity (or distance
away) from the people ahead. The inter-person distance is defined as the distance
between the centers of the bodies of two individuals. The best-fit equation (2.10) for the
graph above is shown here:
v V sin 90d bt bu
d= × ×
−−
where b d td≤ ≤ (2.10)
v Vu= where d td>
Where: v is the impeded walking velocity (m/s), Vu is the unimpeded (normal) walking
velocity (m/s), d is the inter-person distance (m), td is the threshold distance (1.6 m), and
b is the body depth (torso radius).

110
The walking velocity on stairs is restricted to 0.6 times the normal unimpeded velocity
assigned to each occupant characteristic/type.
In order to calculate the velocity of the occupants (or groups of occupants) on
certain building components, the occupant type must be selected by the user from the
following list. The occupant type/characteristics then correspond to a particular body
size (or distribution of body sizes) and unimpeded walking speed, which is used in the
velocity equation 2.10. The velocities shown in Table 2.7 are frequently followed by a
(+/-) value. This indicates that a range of velocities are distributed to that specific
occupant type. For instance, for an “all male” group, velocities can range from 1.15 to
1.55 m/s. The chart of occupant characteristics is shown in Table 2.7.
Table 2.7: Corresponding body sizes and initial velocity for various occupant types in Simulex
Occupant Characteristic/
Population
% Median
% Male
% Female
% Child
% Elderly
Body Size (m2)
**Initial Velocity
m/s All Elderly 0 0 0 0 100 0.113 0.8
+- 0.3 All Male 0 100 0 0 0 0.130 1.35
+- 0.2 All Female 0 0 100 0 0 0.101 1.15
+- 0.2 All Children 0 0 0 100 0 0.070 0.9
+- 0.3 All 1.0 m/s 100 0 0 0 0 0.118 1.0 All 1.2 m/s 100 0 0 0 0 0.130 1.2 All 1.3 m/s 100 0 0 0 0 0.118 1.3 All 1.4 m/s 100 0 0 0 0 0.118 1.4 Office Staff 0 60 40 0 0 Multiple Range Commuters 0 50 40 10 0 Multiple Range Shoppers 0 35 40 15 10 Multiple Range School
Population 0 3 7 90 0 Multiple Range
The body sizes, shown in Table 2.8 and labeled in Figure 2.11, are calculated
using an elliptical body size and the equation for the area of an ellipse. The length of the

111
Torso Circle
Shoulder Circle
Body slightly twisted
ellipse (the torso diameter added to 2 shoulder radii) is multiplied time the width of the
ellipse (the torso diameter) which is then multiplied by Pi/4. This gives the specified
body size in m2. The table below also reiterates that each body type is assigned an
unimpeded walking speed, and some of these vary during distribution among the group.
For instance, the adult male body type has an unimpeded velocity of 1.35 m/s which can
vary by +/- 0.2 m/s when distributed among the population group.
Table 2.8: Body sizes for various occupant types in Simulex
Body Type Torso Radius Rt(m)
Shoulder Radius Rs(m)
Unimpeded mean velocity
Vm(m/s)
Variation in velocity +/-(m/s)
Median 0.15 0.10 1.3 0.0 Adult Male 0.16 0.10 1.35 0.2
Adult Female 0.14 0.09 1.15 0.2 Child 0.12 0.07 0.9 0.3
Elderly 0.15 0.09 0.8 0.3 NFPA-1 m/s 0.15 0.10 1.0 0.0 SFPE-1.4 m/s 0.15 0.10 1.4 0.0 SFV-1.2m/s 0.16 0.10 1.2 0.0 SFV-1.2m/s
(+jacket) 0.235 0.10 1.2 0.0
Simulex also attempts to simulate overtaking, body rotation, side-stepping, and
small degrees of back-stepping as it moves occupants throughout the building.
Figure 2.11: Diagram of bodies used in the Simulex model

112
Output: The output consists of a 2-D visualization of the evacuation. Also, the
following is provided as output by Simulex:
• General overview of the building input: including number of floors in the building,
number of created staircases, number of exits in the building, number of created links,
and the number of occupants evacuating from the building.
• Floor input: initial number of occupants placed on that floor, link positions on the
floor plan and connections to the corresponding staircases, and positions of the exits
on that floor (if any).
• Stair input: number of occupants initially located in the stair and the link positions
and corresponding connections to the floor plans.
• Overall evacuation time of all occupants reaching the exits
• Number of people passing through all exits over 5-second intervals
• Number of people through each exit (1 and 2) over 5-second intervals
• Number of people through each link created over 5-second time intervals
• Total number of occupants through each exit, based on the listing of the movement of
each individual per time period.
• Exit clearing times (obtained from analysis of output)
Use of fire data: No.
Import CAD drawings: Yes, CAD drawings can be imported into the program. The
program does not, however, read stair information. This must be provided by the user,

113
such as distance and width. Also, links are specified in the program to link the floor plan
with the stair section, as well as the floor plan to the exit to the outside (or area of safety).
Visualization capabilities: 2-D visualization.
Validation studies: A validation study has been completed from a supermarket as well
as an examination of the flow rates through exits generated by Simulex85. Although the
model developers did not have actual data from the supermarket, they compared Simulex
results to that of simple hand calculations (with a velocity of 1.19 m/s) of optimal
movement for populations of 1097 and 1919 people. These occupant population values
resembled an occupant density of 7.0 m2/person and 4.0 m2/person respectively. Simulex
produced evacuation times, 58.1 seconds for 7.0 m2/person and 105.1 seconds for 4.0
m2/person, that were significantly longer than the hand calculations, which produced
values of 35 seconds and 51.3 seconds. It is unclear as to what this shows as to the
accuracy of the model. For the simulation of flow rates, Simulex used a distribution of
exit widths ranging from 0.7 to 3.0 m for a population of 100 and an occupant density of
4 persons/m2. “The model was found to produce flow rates which were in good
agreement with previously published data”33. The model also showed that the exits
became jammed with widths smaller than 1.1 m.
Evacuation times and occupant movement were also observed in three university
buildings and the modeled in Simulex to compare results. Human behavior and
movement of the occupants were recorded with video cameras and the total evacuation
time, pre-movement times, and other evacuation behavior were noted. The three

114
buildings consisted of a 1-story central lecture theater, an 8-story commerce building
(with lecture halls, seminar rooms, computer labs, offices, etc.), and a 5-story law
building (equipped with the same type rooms as the commerce building) on the
University of Canterbury, Christchurch campus in New Zealand. Each of the observed
evacuations took place between 10 a.m. and 2 p.m. when most of the occupants were
present. The buildings were equipped with different levels of alarm, such as pre-recorded
PA, live directive PA, or a siren alarm. The total evacuation times, presented in Table
2.9, specified in the table below were measured from initiation of alarm until no
occupants were detected in the buildings:
Table 2.9: Validation study results for the Simulex model
Building Observed Total Evacuation Time (s)
Predicted Travel Time (s)
Predicted Total Evacuation Time (s)
Lecture Theater 90 93 131 Law 170 161 188
Commerce 220 178 202
The predicted total evacuation times were obtained by adding the predicted travel times
(since Simulex did not model pre-movement delays) to the observed pre-movement
delays. Simulex used the following assumptions to model the three buildings:
• The occupant type used for the simulations were “office type” which specifies the
walking speed and body size to be 40% male, 30% female, and 30% average (this
distribution was used by Simulex at the time of the validation study)
• The default distance map was used, which assumes the shortest path chosen by
occupants
• Pre-movement times were not simulated by Simulex and were dealt with separately to
the computer modeling.

115
This report87 also discusses simulations run by Simulex using an estimated
(instead of observed) occupant load derived from the Life Safety Code Handbook88 for
assembly space as well as pre-movement delays as suggested by the Fire Safety
Engineering in Buildings89 in order to compare with observed results. The validation
paper also goes on to comment on the conservative values presented in the literature,
however that discussion goes beyond the scope of this review87.
The results of the study show that the simulated evacuation times were similar to
the observed results (as shown in Table 2.9) when Simulex used the observed pre-
movement times and occupant loads. Even though it seemed that Simulex provided a
conservative time for the lecture theater, it underestimated the evacuation time for the law
and commerce buildings. Olssen and Regan stated that Simulex can be used “with
confidence to simulate travel times for buildings” discussed previously87.
Special features:
• Manual exit block/obstacles – Yes, the user can create an alternate distance map for
an individual, group, or several groups in which certain exits are blocked from the
population using the distance map.
• Fire conditions affect behavior? No, the developers are currently working on
importing CFAST data into their evacuation model.
• Defining groups – Yes, groups can be defined and assigned to have a certain occupant
characteristic, distance map, and distribution of pre-movement times.
• Disabilities/slow occupant groups – Yes, the user can assign lower velocities to
individuals or groups in a simulation.

116
• Delays/pre-movement time – Yes, the user can choose either a triangular, random, or
normal distribution for each group of occupants.
• Route choice of the occupants/occupant distribution – Shortest distance or user-
defined route.
Limitations: The only limit to the model is the capacity of the computer used to run the
simulations. However, occupants get “stuck” in the links of the buildings during certain
simulations. The user manual offers solutions to this problem.
_____________
Section 2.15 GridFlow90,91:
Developer: D. Purser & M. Bensilum, BRE, UK
Purpose of the model: The purpose of this model is to represent individual occupants in
building spaces on a grid network. Pre-movement time and pre-movement-travel
interactions are considered central to the evacuation using GridFlow. Purser considers
this model to be as informative as other sophisticated models, but uses “simple,
transparent, and easily verifiable behavioral inputs, derived from empirical data or
specified and justified by the user”90.
Availability to the public for use: This model was developed by David Purser at BRE
in the UK because of the need for an in-house model that can handle pre-movement and
movement times and the interaction between them. Purser claims that it has been

117
developed so that it can now be publicly available (because its ease in use), and is
currently sold as part of a modeling package through BRE.
Modeling method: GridFlow is a
partial behavior model because it
relies on the density of the population
to control the movement of the
population and uses pre-movement
time distributions observed by Purser.
Occupants are also labeled with FED
susceptibility and their travel speeds
are affected according to the FIC due to irritant smoke – as defined by the user.
Structure of model: This is a fine network system. The model overlays a grid of 0.5
by 0.5 m over the floor plan as shown in Figure 2.12. A distance map is also issued to
the floor plan to map the distance from every cell on the floor to all exits. This distance
map is generated using a series of recursive algorithms to determine the direct distance to
the exit from any point on the floor plan, while also working around obstacles present on
the floor.
Perspective of model and occupant: The model views the occupants as individuals by
giving each occupant certain characteristics, such as an xy position in the scenario as the
evacuation progresses, a starting position in the simulation, a destination or exit goal, pre-
Figure 2.12: GridFlow visualization of the distance mapping (90)

118
movement time, unimpeded walking speed, and FED susceptibility. The occupants also
have an individual view of the building during the evacuation because the occupants can
either move to their nearest exit, be randomly distributed to an exit, or follow a user-
defined route.
Occupant behavior: Implicit behavior.
Occupant movement: The occupants move toward the exits under the constraints of the
Nelson and Mowrer chapter of the SFPE handbook1, which incorporates speed reductions
based on the density of the space and the capacity of the doors and stairways. The
unimpeded walking speed for each occupant can be specified as a single number or a
distribution can be specified for the population. The default mean, taken from Nelson
and Mowrer, is 1.19 m/s with a S.D. of 0.2 m/s and a minimum value of 0.3 m/s. Any
specific number or distribution can be input by the user.
Any amount of occupant groups or individuals can be defined by the user. Each
individual or occupant group can have a set of characteristics. The characteristics were
laid out in the Perspective section above. To reiterate, the characteristics of the occupant
are:
• xy coordinates of each occupant in time with the simulation
• Starting position in the simulation
• Destination/exit
• Pre-movement time
• Unimpeded walking speed

119
• FED susceptibility (discrete value or distribution)
Under smoke conditions, the occupants’ movement speed can vary according to
their FIC for the irritant smoke. Also, depending upon their susceptibility, the occupants
will be given a graphical hatched pattern in the scenario when their FED reaches 0.75.
When they become incapacitated, FED=1, their 2-D image will turn black and they will
stop movement.
Also, overtaking of occupants can occur.
GridFlow offers multiple options for how merging flows are simulated1. The first
option is the “free-flow” option, where flows are determined by the personal movement
algorithms alone. When several inlets compete, the physical arrangement of the routes,
widths of the links, and the crowd densities at the inlet and outlet decide the precedence.
In the “controlled” flow option, additional rules are imposed on the competition. For
example, when a stair with two inlets (flow from staircase above and current floor) is
near or at maximum capacity, the outlet flow would balance to half from each inlet.
Lastly, there is an option for assigning weights to certain links manually, so the user can
control the dominance factor.
Output: Output data can be exported from the model into an Excel spreadsheet. The
range of output include a details about the population in every space at every logging
interval after each run and summarized data from a series of batched runs. The output
also provides detailed aspects of the building and occupants (distributions of pre-
movement, exit time, etc.).

120
Use of fire data: No, but the model allows the user to come close to this. A spreadsheet
can be established for every space in the building with 3 columns; time, speed factor, and
FED dose. The time column is equivalent to the time monitored in the evacuation. The
speed factor gives the ability of the user to decrease the speed by a fraction as the
evacuation time increases, to simulate the influence of irritant smoke. If a 0.9 factor is
input by the use at t=60 seconds, the occupants in the specific space will decrease their
individual speed by 10%. The last column, the FED dose, allows the user to input
specific FED doses at different time intervals in the simulation. For instance, if 0.05 is
input at 60 seconds and another 0.05 is input after 80 seconds, the individuals in that
space will obtain an FED of 0.1 by 80 seconds. Within the model, the user then adjusts
the FED susceptibility of each occupant or occupant group, which affects whether the
person become incapacitated or can escape the building space without problem.
Import CAD drawings: Yes, CAD drawings can be imported into the model via
another BRE program, Josephine. Or, the floor plan can be drawn using a graphical
user interface (GUI) within GridFlow. The user specifies links on the floor plan that lead
to the outside or another space in the building. The user is prompted to input the link
width and maximum flow (persons/second) through the link.
Visualization capabilities: 2-D and 3-D capabilities (with Josephine).
Validation studies: The model developer states that GridFlow has undergone many runs
of simple buildings and multi-enclosure spaces for the purpose of four aspects of

121
validation: Component testing (routine checking of major software), functional
validation (checking model capabilities and that these are compatible with intentions),
qualitative testing (comparing predicted human behavior with expectations), and
quantitative verification (comparison of model predictions with experimental data). The
developers have performed component testing and quantitative verification, which
involved simulations from simple and complex building compared against empirical data
from the SFPE Handbook1 and other sources. Functional validation has also been
performed and limitations of the model have been identified (but not included in the
Purser report). Also, human behavior has been validated by using actual pre-movement
data to simulate a scenario and by comparing the model’s evacuation behavior and time
to the observed evacuation and Handbook data.
Purser discusses simulations used to examine the effects of delay time, travel
time, and exit flow capacity for various occupancies and layouts. He outlines the results
of a hypothetical building with 3 different numbers of occupants. In this work, Purser
could understand graphically whether the evacuation was driven by pre-movement time,
travel distributions, or exit flow capacity, depending upon the number of occupants in the
building.
Lastly, a GridFlow simulation was described that was similar to an actual
evacuation incident, the “Sprucefield” evacuation. This included 190 occupants
evacuating from a food hall. GridFlow modeled that 99% of the occupants would
evacuate in 130 seconds with their similar case, when the actual time was 140 seconds.
Purser notes that GridFlow provided reasonable results and they plan to perform direct
simulations on the Sprucefield case, among others.

122
Special features:
• Counterflow – Yes.
• Manual exit block/obstacles – Yes, because the user can specify the destination or
exit choices for each individual or occupant group, certain exits can be “hidden” (or
not given as a choice) from an occupant group as if it does not exist.
• Fire conditions affect behavior? Fire conditions are implicitly incorporated. The user
imports a spreadsheet (created by the user) with speed factors and FED doses with
time for each building space.
• Defining groups – Yes.
• Disabilities/slow occupant groups – Yes. Groups can be defined in which the user
can enter a specific unimpeded walking speed and distribution of pre-movement
times.
• Delays/pre-movement time – Yes, pre-movement times can be specified as a discrete
value or in the form of distributions that have been obtained from direct measurement
during “monitored evacuations” or fire drills. These monitored evacuations have
taken place over a span of 10 years and were taken from a range of different building
occupancies.
• Toxicity of the occupants – Yes.
• Route choice of the occupants/occupant distribution – There are three choices;
shortest distance, random, or user-defined

123
Limitations: Supports occupant populations up to 5000 (as of year 2000) and more
behavioral capabilities are under development.
_____________
Section 2.16 ALLSAFE39,92,93,94:
InterConsult Group ASA, Norway
Purpose of the model: The purpose of this model is to determine whether or not
occupants are at risk depending upon input data for the building, the building use, the
occupants, and the design fire scenario.
Availability to the public for use: This model is available through in-house consultancy
from InterConsult.
Modeling method: This is considered as a partial behavioral model.
Structure of model: This is a coarse network system. The building is input into the
model through a series of nodes. For each node, the user specifies the minimum
clearance width, walking distance to the next node, initial number of occupants at node,
and the area of the node. The model simulates only one exit per node structure, but can
simulate multiple node structures in parallel. Because of this, the occupants in each node
structure head to only one exit.

124
Perspective of model and occupant: The model seems to view the occupants globally
because of the statement saying that ALLSAFE assigns the behavioral characteristics to
groups of occupants or the worst-case scenario group. Also, the times presented in the
output are assigned to the entire population, instead of each individual.
The occupants’ perspective of the floor plan and building is also global since they
only have one exit to choose from.
Occupant behavior: Implicit. ALLSAFE assigns behavioural characteristics to groups
of the population considered to be the worst-case of the evacuation scenario. The model
includes such input data as background noise, social and economic barriers among the
occupants, language, the fire protection system measures, and the fire scenarios. These
input data affect the evacuation time by adding or subtracting times (as obtained from the
database within the model). The model also incorporates time delays and time
improvements due to voice alarm systems, sprinklers, compartmentation, etc. The model
calculates these from tables of data. An example of suggested time effects from different
variables is included in Table 2.10. These effects were gathered from literatures and/or
by using Delphi-panels.

125
Table 2.10: Building/Occupant characteristics and the corresponding time effects (94, p. 676)
Building/Occupant Characteristics ∆Tdet* (min)
∆Trec (min)
∆Tres (min)
∆Tmove (min)
Only one available exit 2.5 Bad layout/geometry of occupancy area 5 Bad layout/geometry of escape routes 2
Unfamiliarity to building 5 5 Not alert (sleeping and/or drunk) 5 5
Social affiliation (family) 2 Social role (customer, visitors, worker, etc.) 5
Unclear visual access of exits from occupancy area 1 *Where “det” refers to detection, “rec” refers to recognition, and “res” refers to response.
Occupant movement: ALLSAFE has been developed to calculate evacuation scenarios
where the occupants are not aware of the fire until later in the situation. The main
calculation is estimating delay time of the occupants during the evacuation. The model
also includes a function of estimating the walking time of the occupants. ALLSAFE
defines the “minimum time of movement” or “unimpeded time” (no behavioral delays)
and this time is subject to flow calculations. The developer admits that these calculations
are simplified and also recommends the use of more advanced flow models to determine
the minimum movement time whenever movement is critical. After determining the
minimum movement time, an ALLSAFE database is used to add delays and subtract
reduction in evacuation times due to different kinds of safety measures, such as alarm
systems, staff guidance, unfamiliarity, immobility, social affiliation, signage, etc. The
final result obtained from the model is the “necessary time to evacuate.”
The model developers state that the input data affects all aspects of the evacuation
process, based on the study of recognized literature on the interaction of behaviour of
evacuation and the fire in actual fire incidents. The developers also state that assigned
delay or pre-movement times are based on real life evacuation experience. From the

126
write-up on ALLSAFE, it seems that the functions of the model based on actual incidents
were determined through studies made by SINTEF on large fire incidents. No further
information is given as to the kinds of incidents studied or the evacuation knowledge
gained from these studies.
Output: The data obtained from the output is the following (for the entire population):
• Time to fire detection
• Time to react to the fire detection by the occupants
• Time to interpret the situation by the occupants
• Time to decide where to escape by the occupants
• Time to evacuate a room or corridor
• Time to evacuate the building
Use of fire data: The fire scenario can be calculated by fire models, such as FAST
(listed by the ALLSAFE write-up) or default values for the scenario can be chosen from
ALLSAFE.
Import CAD drawings: No, this building is input by specifying nodes within the node
structure with the following information: minimum clearance width, walking distance to
next node, initial number of occupants in node, and the area of the node.

127
Visualization capabilities: Visualization of the evacuation can be accomplished by
using AllsafePC. However, since the model considers the population as global, the
developer referred to other advanced flow models in order to visualize evacuation.
Validation studies: Attempts have been made to compare ALLSAFE with other models,
such as Simulex. The model developers consider the model to be better validated by the
use of expert judgments which are used in tabulated values (based on accepted literature
on behavior and evacuation times).
Special features:
• Fire conditions affect behavior? Fire scenarios are input into the evacuation from
either a fire model or from default values in ALLSAFE.
• Defining groups – Yes, the model only recognizes groups.
• Disabilities/slow occupant groups – This does not seem like an option.
• Delays/pre-movement time – Yes, delays such as time to fire detection, time to react
to the detection, time to interpret the situation, and time to decide where to escape are
modeled.
• Route choice of the occupants/occupant distribution – Only one route is available to
the occupants for each node structure.
Limitations: Only one exit per node structure.

128
Behavioral Models
Section 2.17 CRISP339,95,96,97,98:
Developer: J. Fraser-Mitchell, BRE, UK
The stand-alone evacuation model is the focus of this write-up.
Purpose of the model: The purpose of this model is to simulate entire fire scenarios
incorporating a Monte Carlo technique. There is also an option to simulate an evacuation
using the external or “stand-alone” evacuation model, which does not incorporate the
zone fire model effects or the toxicity effects to the occupants. In this mode, the model
will run in fire drill mode, but the Monte Carlo technique can still be used.
Availability to the public for use: CRISP is used only by BRE for in-house
consultancy.
Modeling method: This is a behavioral model.
Structure of model: This is a fine network system. The model uses a 0.5 by 0.5 m grid
over the entire floor plan that is used to move occupants around the building. This grid
size can be larger, but the developers warn that the larger the grid size, the lower the
accuracy of the evacuation results. The occupants follow a contour map that is spread
throughout the floor plan.
Perspective of model and occupant: The model views the occupants as individuals by
giving the occupants certain behavioral roles, and in turn, certain behavioral activities

129
that will take place during the evacuation, in a probabilistic fashion. The user also
specifies the occupant’s walking speed and height (distributions), as well as probabilities
for being asleep and located in certain places throughout the building.
The occupants’ view of the building is also individual because although the model
defaults to move the occupants to the nearest exit, the user can alter the shortest route by
indicating a high “door difficulty” for a certain exit. Also, door difficulties change and
increase with the presence of smoke.
Occupant behavior: Rule-based or conditional behavior. The population is assigned
occupational and role data, on the basis of probabilities. The occupation data determines
the location probabilities, sleeping probabilities, head height, and movement speed of
each group. The role data dictates actions (behaviors of the group) and associated
probabilities of each behavior. Behavior is performed in the model in the form of
actions, which are each associated with a delay time, degree of difficulty, and urgency
level. Actions do not have to continue until they are complete, but may be interrupted by
conditions within the model. In this case, another action will take place. Some example
actions to choose from in the model are search rooms, rescue, investigate, escape,
complete work, trapped, unconscious, asleep, etc. An example of simulated behavior of a
fire fighter is explained here.
Depending upon the conditions – the fire fighters will start off ‘safe’ which
will prompt them to investigate (which has a 100% chance of occurring).
This will lead them to go begin traveling to the room of origin. Under the

130
investigation action, there are three different conditions that will prompt
another action (and order of the conditions matters). If there is a target to
rescue (injured/disabled occupant), they will rescue them. The model will
take the fire fighter to the disabled person and have them escape together.
If the target has been assisted during the rescue, the fire fighter will
continue investigation to the fire floor. (As you can see, these actions can
go back and forth.) If the fire fighter has seen fire or has completed
investigation to the fire floor (reaching the fire floor and remaining there
for the delay time), then the fire fighter will escape96.
Occupant movement: The movement of the occupants throughout the building is based
on local crowd density. Only one occupant can occupy a grid cell at the same time,
which is comprised of a 0.25 m2 area (or a cell sized 0.5 by 0.5 m). When the occupant
approaches a crowded area, he/she makes the decision on which grid cell to move to
based on the simple algorithm “collision avoidance” or local density. The process is
shown in Figure 2.13.

131
Collision Avoidance
Figure 2.13: Graphic of collision avoidance in CRISP (96)
This is a slide taken from a BRE presentation made by Jeremy Fraser-Mitchell96.
The solid blue line shows the preferred direction of the green occupant, but that cell
already contains the maximum allowable number of people (3 people in a 0.75 m2 space
or 3 - 0.5 x 0.5 m spaces). Two other options are those at 45 degree angles to the green
occupant’s position and are scored according to the speed of the occupant, which is a
result of the density of his cell and the next potential cell. A score is calculated for each
of the three possible cells. The preferred solid blue line has a score equal to the
calculated speed of the occupant, and the dotted lines have a score equal to 0.7 * speed of
the occupant. An example calculation is performed for the scenario above giving an
example maximum unimpeded speed of the green occupant as 1.0 m/s. For the cell
following the solid blue line, the green occupant will have a speed 20% (1-(4/5)) of the
maximum speed because there are a total of 4 other occupants (5 including the green
occupant) occupying the current and potential cells. If the green occupant had 2 other
occupants in his cell, his speed toward the solid blue line would equal 0, because both

132
current and potential cells would be at maximum density. As a result, the score for a
move along the blue solid line would be calculated by: 1.0 m/s * 0.2 = 0.2. In order to
move to the upper diagonal, the score would be 0.7 * (1.0 m/s * 0.6) = 0.42. In the upper
diagonal case, there were 2 others in both the current and potential cell, other than the
green man, causing the speed be 60% (1 – (2/5)) of the maximum value. Lastly, the
lower diagonal score is 0.7 * (1.0 m/s * 0.8) = 0.56. In the lower diagonal case, there is
only one other occupant in the current and potential cells, other than the green occupant,
so the speed is decreased to 80% of its maximum value. The highest score of 0.56 is
given to the lower diagonal, so the bottom diagonal cell is chosen.
The choice of an occupant’s route is influenced by both distance and the degree of
difficulty specified for the doors and windows by the user. Occupants can, however,
stray from the minimum distance path to avoid high crowded areas. Also, a specified
behavior may lead the occupants to a specific part of the building before evacuation will
begin.
Output: The output consists of detailed information about each person in the simulation
at every time step. Also included is route information, fire conditions in certain rooms in
the building, summary of every Monte Carlo run, evacuation time, and a pictorial output
(at any time throughout the simulation).
Use of fire data: CRISP3 has its own zone model.

133
Import CAD drawings: Yes, CAD drawings can be imported into the model. The user
must specify the heights of the floor plan and ceilings at different points on each floor
plan. If CAD plans are not used, the user must create a build file which specifies the
building geometry by inputting:
• x,y coordinates of the building layout, such as rooms, stairs, vents
• Height of ceiling and vents
• Connections between rooms and between stairs
The user also specifies the type and location of detection system (in the detection input
file) and if the stand-alone evacuation model in used, the occupants are alerted at the start
of the simulation if no delay time is added. Also, the x,y coordinates of any obstacles on
each floor must be listed in a separate obstacle input file.
Visualization capabilities: 2-D and 3-D capabilities (Josephine)
Validation studies: CRISP’s use has been frequently documented by BRE in such
projects as office buildings, a large exhibition hall, and an airport terminal. These were
done in order to conclude ASET vs. RSET conditions, main factors in the evacuation
(exit routes, width of doors, etc.), and worst scenarios, to name a few.
An evacuation of a 3-story office building95, housing 202 civil service staff, was
performed in 1996, and subsequently modeled in CRISP to develop and improve the
model for use in office buildings. Similar to WAYOUT, questionnaires were
administered to the staff after the drill to obtain information on workplace, location at
time of alarm, and any emergency roles and actions taken when responding to alarm.

134
Respondents consisted of 22 designated emergency staff, one wheelchair user, and 118
staff with no emergency responsibility. In the actual evacuation of the building, all staff,
except the wheelchair user and two assistors, evacuated the building in 90 seconds. From
this and the use of action sequences from the questionnaire, CRISP was used to model the
scenario. At 90 seconds, all but approximately 25 occupants had evacuated the building.
Differences in evacuation times (the total time given by CRISP was 240 seconds) may
result from differences in the “investigate” action in the simulation. The responsible
officers in a real situation may have worked together in a more time efficient manner to
search all rooms, instead of following the CRISP algorithm ensuring that all rooms are
searched. In this scenario, it was the actions of the investigation team that prolonged the
evacuation time and prompted CRISP developers to take another look at action
algorithms.
Special features:
• Counterflow – Yes, this feature was recently incorporated.
• Manual exit block/obstacles – Yes, by inputting an increase in the door difficulty.
• Fire conditions affect behavior? Yes, CRISP has its own zone fire model, but if the
model is used as an external fire model (in fire drill mode), there is not fire or smoke
for the occupants to respond to. In fire drill mode, fire is extinguished immediately
and the alarms sound at t=0.
• Defining groups – Yes.

135
• Disabilities/slow occupant groups – Yes, and the user can specify to have them
“rescued” by another group of occupants (emergency personnel with a defined
“rescue” action).
• Delays/pre-movement time – Yes, these can be input by specifying a mean and
standard deviation for occupant activity. For instance, if the action of “reacting” is
given a 60 second delay with a specific standard deviation, the occupants will “react”
for approximately 60 seconds, which results in the occupants remaining in place.
Once the “reacting” time delay is completed, they will follow their next user-defined
action, which is usually “escape.”
• Elevator use – No, however, this feature is currently being worked on.
• Toxicity of the occupants – Yes, if the model is NOT simulating in fire drill mode (in
the external evacuation model). When FED=1, the occupant is assumed to be dead.
• Route choice of the occupants/occupant distribution – Globally, the potential leads to
shortest route. This can be overridden by local information and events.
Limitations: Complex input files and all behavioral activities must be input by the user.
Limitations of the program involve up to 1000 rooms, up to 20 floors, and 15,000
occupants maximum. Also, the maximum grid network is 0.5 x 0.5 m grid.
_____________

136
Section 2.18 ASERI39,99,100,101,102:
Developer: V. Schneider, I.S.T. Integrierte Sicherheits-Technik GmbH, Germany
Purpose of the model: The purpose of the model is to simulate egress movement in
complex geometrical environments, such as railway and underground stations, airports,
theatres, sports arenas, trade fairs, etc.
Availability to the public for use: This model is available through I.S.T. Integrierte
Sicherheits-Technik GmbH. Company.
Modeling method: This is a behavioral model.
Structure of model: This is a fine network system. The floor plan defines rooms,
corridors, stairs, and refuge areas by the size and position of the doors and passageways.
The model defines the instantaneous positions of every person by the coordinates which
are related to a point on the floor plan or staircase. This a method allows for a 3-D
representation of the building and the local modeling of people movement throughout.
Perspective of model and occupant: The model views occupants as individuals by
characterizing them by a set of parameters (both fixed and conditional to the fire
environment). These parameters are age, sex, fitness, incapability, social
interdependencies, former experience, special knowledge about the building, response to

137
smoke and toxic products, and the amount of information available during the evacuation
(location of fire, availability of egress routes).
The occupant’s perspective of the building is also individual. Each person has a
goal/exit, which is either the nearest exit or is prescribed by the user. The route choice is
then influenced by the external impact from conditions of the building or the behavior of
the other evacuees around them. Because of this, occupants can alter their behavior away
from the original route (nearest or user-defined) in avoidance of smoke conditions or
occupant congestion.
Occupant behavior: Rule-based or conditional behavior. First actions and perceiving
cues can be modeled by either assigning individual alarm and reaction times or by
incorporating intermediate stop positions. These positions are areas of the building that
the occupant move to, wait, and then begin egress after a certain time interval. ASERI
uses a matrix of estimated delay times that depends on the initial activity shown in the
first column and on the corresponding action or behavior in the first row. Table 2.11 is
shown below.
Table 2.11: Matrix of ASERI delay times (99)
Awareness Response Time Prepare (Dress) Information Watching TV 0 – 30 s 4 – 8 s 5 - 120 s 0 – 30 s
Showering 60 – TS s 4 – 10 s 30 – 300 s 0 – 60 s Social activity 0 – TS s 4 – 10 s 5 – 240 s 0 – 60 s
Sleeping 10 – TS s 6 – 14 s 20 – 300 s 0 – 60 s Reading/Writing 0 – TS s 4 – 8 s 5 – 120 s 0 – 45 s
Smoking 0 – 300 s 4 – 8 s 10 – 120 s 0 – 45 s
The purpose of this matrix is to model the sequence of first actions. “TS” is the
time for the staff to check certain areas/rooms of the building, which depends on the

138
communication or information events. Each corresponding behaviour/action is explained
below:
• “Awareness” is the time interval beginning with the perception of the first cue to the
time that the person becomes aware of the evacuation situation
• “Response Time” is the average time interval to respond to the corresponding cue.
The model uses average times used by Levin which are 6 seconds for awake
individuals and 10 seconds for sleeping occupants.
• “Prepare” is the time interval allowing the occupant to dress and look for valuables.
This action depends on the weather and the geographical location.
• “Information” represents the time delay for occupants to seek for information and
“inform others” of the event.
Individual responses to hazards in the building (actual or suspected) depend on
individual specified parameters, external conditions, available information, and social
relations among the occupants. Most of these parameters vary with the changing
environment of the evacuation. ASERI uses Monte Carlo simulation techniques to
analyze the outcome of a building evacuation by stochastically altering individual
responses while leaving the initial and boundary conditions identical. By performing this
type of simulation, mean egress times as well as corresponding variances and confidence
limits can be obtained. Such stochastic variables include individual egress route choice
and movement, the initial distribution of occupants throughout the building, and
individual parameters (size, walking speed, and reaction times).

139
Occupant movement: The movement of the occupants is defined by an individual
walking speed and the orientation of the corresponding velocity vector, resulting from the
person’s current position and intended exit/goal. Also, obstacles and other occupants
affect movement. ASERI takes note of individual body size by incorporating shoulder
and chest width into the model. From this, minimum inter-person distance and boundary
layer from walls and obstacles are used to move people throughout the building.
Shoulder and chest width, certain behavioral conditions, and walking speeds are entered
as distributions or individual input, which affect the mobility of the occupants. Different
groups can be generated from these inputs, including those occupants who are disabled
(require lower walking speed or require a larger body size to account for a wheelchair).
ASERI allows the user to input persons with increased space requirement, such as
occupants carrying children, briefcases, or wheelchair mobile. Because of these
calculations, ASERI can model congestion, queuing, clustering, and merging of flows of
occupants.
Individual movement of the occupants is driven by their global (exit or refuge
area) and local (room exits, corners, etc.) goals. The local goals of the occupant change
dynamically with the environment and crowd conditions. There is no grid in the model
upon which the occupants move through. Instead the individual local goals of the
occupants trigger movement, depending upon the geometry of the building (interior
doors, obstacles, corners, etc.). The developer has explained the movement model as a
sequential one with appropriate priority rules for movement.
Toxic effects of the smoke components slow walking speed, alter behavioral
responses, and change designated route plans. Individual incapacitation of the occupants

140
is calculated by using the FED model by Purser. This includes monitoring the dose of
CO, HCN, CO2, low O2, and high temperature. Any obscuring effects of smoke are
described by the visibility of particular spaces in the building and affect walking speed
based on data from Jin28, and turn back behavior probability based on data from Bryan
and Wood2.
Output: The output involves evacuation times plus detailed information on the structure
and bottleneck/congestion situations that lead to egress delays. Because of the use of the
Monte Carlo technique in specifying behavioral responses of the occupants, mean egress
times along with their corresponding variances and confidence limits are obtained.
Use of fire data: ASERI is used
in conjunction with the field model
KOBRA-3D that simulates the fire
and smoke spread throughout the
space. Individual incapacitation
can be calculated based on the
FED model by Purser. ASERI
includes dose-effect relations for CO, HCN,
CO2, low O2 and heat. Also modeled are the effects of smoke movement on visibility,
speed, and exit route choice. Or, it seems like the user can enter time-dependent
temperatures and concentrations of smoke, CO, CO2, O2, and HCN for each unit in the
building. The smoke concentrations are expressed in terms of visibility.
Figure 2.14: ASERI visualization of a simulation (99, p. 45)

141
Import CAD drawings: A pre-processor will be available for licensees by the end of
the year that converts standard CAD formats into ASERI input.
Visualization capabilities: 2-D or
3-D visualization of the movement
of the evacuees, as shown in Figure
2.14 and 2.15.
Validation studies: The first
validation test of this discussion
involves an unannounced
evacuation from a theater in the
City of Tampere in 1995, as shown
in Figure 2.15. The theater
contained over 600 occupants. The data from this evacuation was used to assess
evacuation models as well as to understand the sensitivity of the basic input parameters of
the model. The simulation of the 3rd floor auditorium was restricted to half of the
building due to the symmetry of the space, as shown in the ASERI diagram shown in
Figure 2.15. The actual pre-movement time of the theater occupants was used in the
simulation as a random delay time. Also, a distribution of the individual mobility of the
occupants was incorporated to produce a range of walking speeds from 0.7 to 1.5 m/s and
Figure 2.15: ASERI visualization of the theater simulation (101, p. 7)

142
a body size range of 0.12 to 0.22 m2. It was known from the original evacuation that
persons with restricted mobility were present.
Figure 2.16 shows the results from the actual evacuation and the simulation from
ASERI.
Figure 2.16: Results from the ASERI validation studies of the theater (101, p. 6)
The first row shows the actual results from the evacuation drill of the theater building,
including the evacuation time from the auditorium only (2nd column). The second row
shows the results for the simulation of the drill as observed for the theater, and the third,
fourth, and fifth rows are changes to the model’s inputs as part of a sensitivity analysis of
the model itself. The second and third rows show the effect of inputting different egress
behavior (normal vs. danger). The second and fourth rows show the effects of inputting
different individual mobility (inhomogeneous group vs. homogeneous group with
unrestricted mobility – able occupants). And lastly the second and fifth rows show the
difference in inputting the number of occupants into the simulation (82% of the
occupancy which was present at the time of the drill vs. 100% occupancy). The
developer notes that the strongest effects on the egress time produced by the model were
due to a change in mobility of the occupants. Also, the first two rows which contained

143
the observed and simulated evacuation from the theater show very close results in all
three evacuation times.
Monitored evacuation drills were conducted for three high-rise and three school
buildings by the German Federal Office of Construction for the Forschungsstelle fur
Brandschutztechnik in cooperation with the local fire brigades. These evacuation drills
were used to validate ASERI as well as used to calibrate with the Predtechenskii and
Milinskii method31. After performing a range of simulations which involved changing of
mobility parameters and the presence of smoke barriers in the building and comparing
these to the observed evacuation drills, the developers stated that, “performing the
numerical simulation with an appropriate distribution of mobility parameters yields
realistic results, as already demonstrated by the investigation of other evacuation drills.”
For the tallest building, a 21-story office building with 1400 occupants, the calculated
total evacuation times ranged between 616 and 648 s, with a mean value of 627 s, while
the measured evacuation time for the structure was 629 s. More information on this
validation case study is provided in ASERI references.
The final case study to be discussed in this section involved the evacuation from a
hotel conducted by the Norwegian SINTEF organization. The input information
provided to the model for this case study involved the building layout, means of egress,
geometrical staircase information, location and the sequence of the fire incident, and the
communication events put in place by the evacuation plan. The evacuation case that
follows the evacuation plan is called the “schedule case” and actual observation of the
drill is referred to as the “actual case.” Also, information about the occupants was
available such as the gender, age, room number, and activity engaged in before

144
evacuation began. The staff was not included in the egress movement during the
simulation, but was modeled to perform actions during the alarming sequence. Also,
delay and response times associated with certain occupant actions were included in the
simulation. The occupant total was 104, and since the available egress routes were many,
the evacuation was not influenced by crowding. As mentioned earlier, runs were
performed in ASERI to resemble 1) immediate evacuation of all occupants at the start of
the fire alarm, 2) the scheduled case, and 3) the actual case. According to the developers,
the actual case was very much in agreement with the observation of the monitored hotel
drill. The only difference is that “the number of occupants not leaving the guest rooms or
returning into the room was much larger than predicted by the simulation.” The
developers relate this discrepancy to the fact that the information available was
ambiguous in the drill, resulting in guests ignoring the alarm.
Other validation studies can be found in the referenced ASERI publications.
Special features:
• Manual exit block/obstacles – Yes, if smoke is very heavy.
• Fire conditions affect behavior? Yes, the output of KOBRA-3D can be transferred to
ASERI through a cut and paste method.
• Defining groups – Yes, because of the ability to assign each individual certain
mobility parameters (body size, walking speed, and behavioral conditions) as well as
providing a distribution of these for a specified group.
• Disabilities/slow occupant groups – Yes, walking speed and increased body size can
be specified.

145
• Delays/pre-movement time – Delays are achieved either by assigning alarm and
reaction times or introducing intermediate stop positions.
• Toxicity of the occupants – Yes.
• Route choice of the occupants/occupant distribution – Route choice is either shortest
distance or user-defined. Routes then become altered due to the building
environment and the occupants’ behavior during the evacuation (conditional).
Limitations: The number of specified levels (floors), units, passages, and obstacles is
limited by computer memory.
_____________
Section 2.19 BFIRES-216,103:
Developer: F. Stahl, NBS, U.S.
Purpose of the model: The purpose of this model is to simulate an occupant moving
throughout a building as a result of decisions he makes during a period of time. The
computer program is described by the developer as “modular” in form. To explain, each
subroutine has a specific function as its purpose, and these functions fall into the
categories of perception, cognition, and action (all relative to the environment). The
subroutines are linked through the main program.
BFIRES simulates a building fire as a chain of “time frames” and for each time
frame, the model generates a behavioral response for every occupant in the building.
Availability to the public for use: Unknown.

146
Modeling method: This is a behavioral model.
Structure of model: This is a fine network system. The floor plan is overlaid with an
orthogonal grid. The spatial plan (walls, boundaries, etc) are laid out on the grid, and
occupants are only permitted to occupy grid points (the intersection of the two grid lines
is identified by an x,y point).
Perspective of model and occupant: This model recognizes individuals. The following
information is provided by the user for each individual:
• Interruption limit
• Bystander limit
• Familiarity with the exits in the building
• Initial mobility status
• Probability of opening a closed door
• Probability of closing a door
• Initial location within the floor plan.
The model also keeps track of the position (x,y coordinates) of the occupants throughout
the simulation.
The occupants also have an individual view of the building because the occupant
travels a particular route resulting from a “chain” of movement decisions made by the
occupant. Each decision is a result of the occupant interpreting gathered information
from the environment.
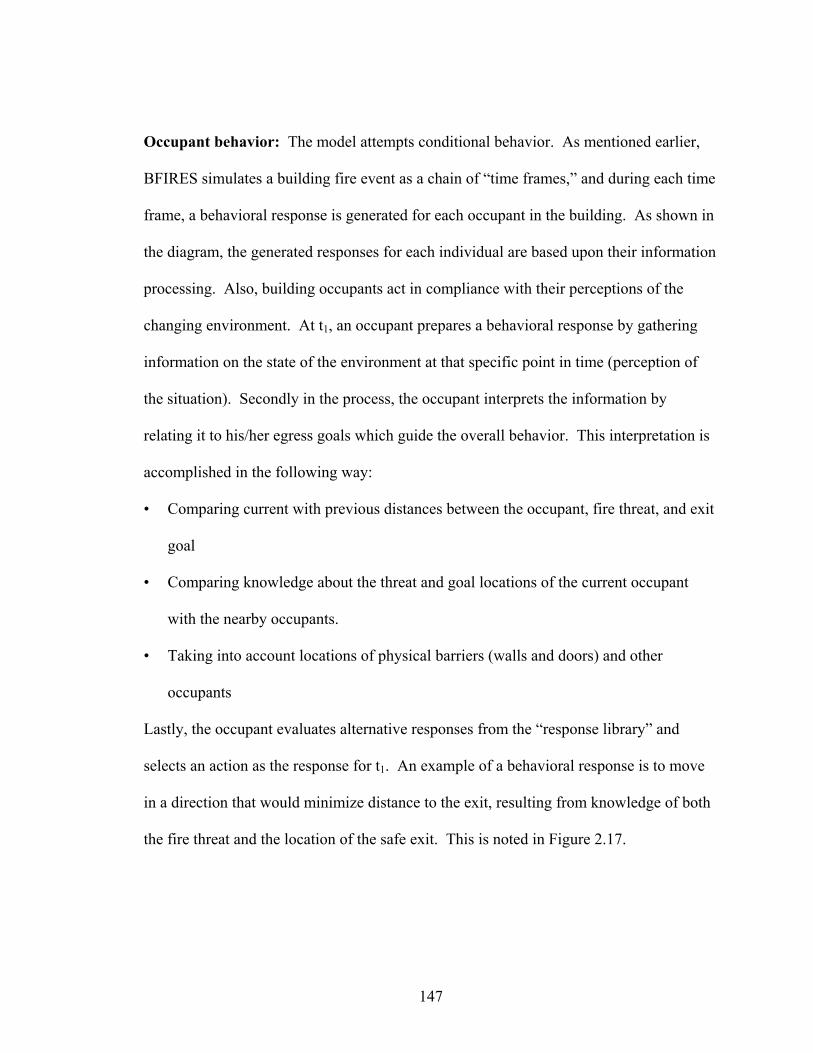
147
Occupant behavior: The model attempts conditional behavior. As mentioned earlier,
BFIRES simulates a building fire event as a chain of “time frames,” and during each time
frame, a behavioral response is generated for each occupant in the building. As shown in
the diagram, the generated responses for each individual are based upon their information
processing. Also, building occupants act in compliance with their perceptions of the
changing environment. At t1, an occupant prepares a behavioral response by gathering
information on the state of the environment at that specific point in time (perception of
the situation). Secondly in the process, the occupant interprets the information by
relating it to his/her egress goals which guide the overall behavior. This interpretation is
accomplished in the following way:
• Comparing current with previous distances between the occupant, fire threat, and exit
goal
• Comparing knowledge about the threat and goal locations of the current occupant
with the nearby occupants.
• Taking into account locations of physical barriers (walls and doors) and other
occupants
Lastly, the occupant evaluates alternative responses from the “response library” and
selects an action as the response for t1. An example of a behavioral response is to move
in a direction that would minimize distance to the exit, resulting from knowledge of both
the fire threat and the location of the safe exit. This is noted in Figure 2.17.
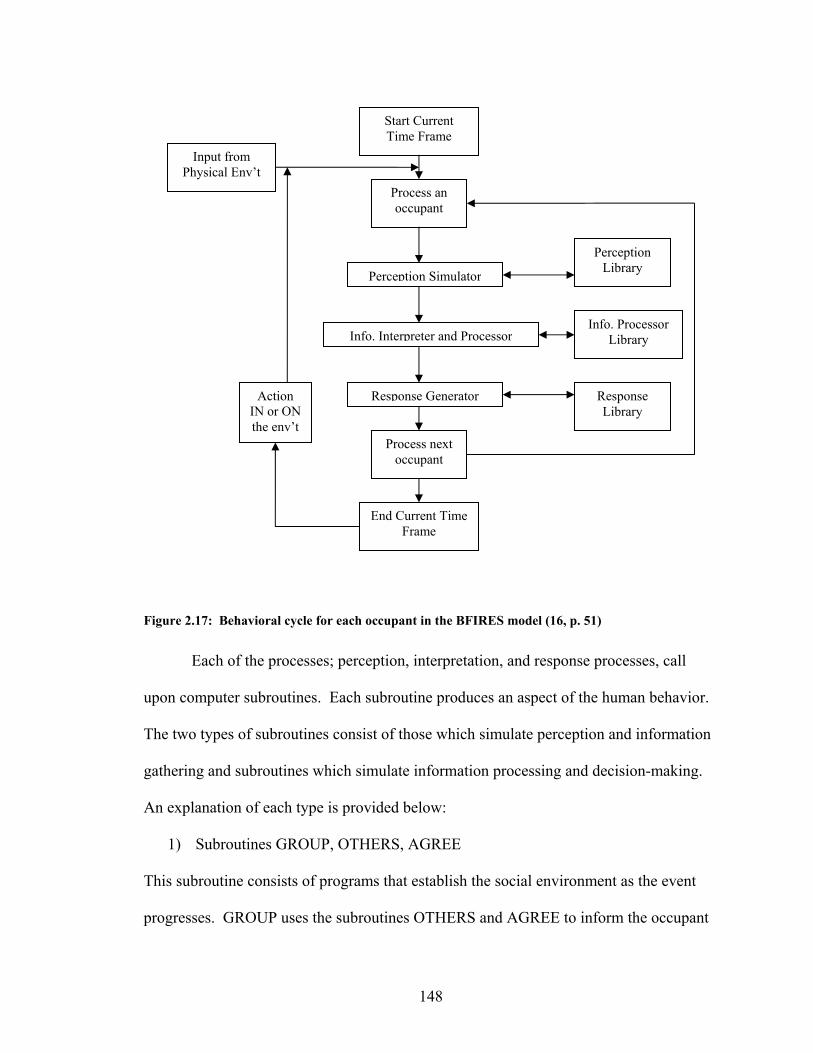
148
Figure 2.17: Behavioral cycle for each occupant in the BFIRES model (16, p. 51)
Each of the processes; perception, interpretation, and response processes, call
upon computer subroutines. Each subroutine produces an aspect of the human behavior.
The two types of subroutines consist of those which simulate perception and information
gathering and subroutines which simulate information processing and decision-making.
An explanation of each type is provided below:
1) Subroutines GROUP, OTHERS, AGREE
This subroutine consists of programs that establish the social environment as the event
progresses. GROUP uses the subroutines OTHERS and AGREE to inform the occupant
Start Current Time Frame
Process an occupant
Perception Simulator
Info. Interpreter and Processor
Response Generator
Input from Physical Env’t
Perception Library
Info. Processor Library
Response Library
Process next occupant
End Current Time Frame
Action IN or ON the env’t

149
whether any other occupants occupy the same space as the current occupant, whether any
others in the space have information unknown to the current occupant, whether others in
the space are injured, and whether all occupants can agree on an effective exit route.
Route choice depends upon an occupant’s perception of the situation, familiarity with the
building, lack of information about fire incident, etc.
2) Subroutine BYSTND
This subroutine will be called if an occupant is occupying a space with an injured or
disabled occupant. BYSTND determines probabilistically if the occupant ignores,
approaches, or stays to assist the disabled occupant.
3) Subroutine JAMMED
This subroutine enables the occupant to assess the degree of crowding of the
area/location he/she wishes to enter. If the occupant looks ahead to the next space, he/she
counts the number of occupants already there. If this number is larger than the pre-set
crowding tolerance, this route is rejected from the choices of movement.
4) Subroutine KPOSS
This subroutine allows the occupant to “see” or scan each potential move and determine
if it is physically possible to pass through. This allows the occupant to avoid paths
constrained by walls or other physical barriers.
5) Subroutine INTRPT
This subroutine probabilistically determines whether an occupant’s behavior will be
interrupted during a time frame, either by remaining in place or backtracking.
6) Subroutine BACKUP

150
This allows the occupant to retrace his/her steps back toward the initial starting position.
Once at this point, the occupant resumes the decision-making process.
7) Subroutines ASSIGN, DOORS1, and DOORS2
This model can assign a bias to the occupant’s decision-making behavior. This is meant
to assign probabilities to decisions made throughout the simulation, which may be more
likely than others. DOORS1 controls the probability of the occupant opening a closed
door during the evacuation. DOORS2 controls the behavior of whether or not the
occupant will close the door behind him/her once passing through.
8) Subroutine EQUALZ
This is used to satisfy the condition of “no bias” or equalizing the probability values of
available alternative moves.
9) Subroutine TBIAS
This routine establishes probabilities for moves which favor maximizing an occupant’s
distance from threat, such as fire or smoke.
10) Subroutine EBIAS
This subroutine uses probabilities that favor moves that minimize an occupant’s distance
from an exit.
11) Subroutine HBIAS
This subroutine biases an occupant’s moves toward helping disabled or injured
occupants.
12) Subroutine EVAL
This subroutine offers two alternative methods for an occupant to evacuate his/her current
safety status. Previously, an occupant achieves a positive evaluation of this situation if an

151
occupant perceives his/her safety status to improve. The two alternate methods involve
1) evaluation is constructed on the basis of the straight-line distance measured from the
occupant’s current location to threats, exits, or both, or 2) evaluation is constructed on the
basis of egress progress (measured in time spent in a threatening environment).
Occupant movement: Before running the program, the user inputs the number of
desired replications, the time length of each replication (in time frames), the total number
of occupants in the simulation, and a seed number for the random number generator. The
program also requires the maximum number of occupants permitted in a single spatial
location at any given time.
Although the model description does not expand upon the actual movement of the
occupants in the building, it seems that the occupant either remains at the grid coordinate
or moves to another grid coordinate in a time frame. The BFIRES manual states that
egress time is measured in the number of time frames it takes for the occupant to move
from the initial position to the exit. The developer explains that the “problem of
calibrating the program has not been dealt with in any detail, [but] preliminary simulation
experiments do suggest that a “time-frame” could be construed within the range of 5-10
seconds of real-time”103.
Also, as stated above, the user provides the maximum number of occupants
permitted in a single space in the building, which aids in deciding whether or not the
occupant moves into that space, remains where he/she is, or moves to another position
outside of the space. This could possibly reflect a maximum density of the space as
chosen by the user.

152
Output: The following output is provided by the model for each occupant at each time
frame:
• Location at beginning of frame
• Whether or not occupant experienced an interruption or bystander intervention
• Current exit/goal
• Selection of all probability values for move alternatives
• Final location
The TRACE output allows the user to track the movement of any occupant over a period
of time. Also, TOTALS output keeps track of individual events for each occupant.
Use of fire data: The user inputs the following conditions in order to simulate fire
effects: the x,y coordinates of the initial fire location, fire diffusion rate factor, and
occupant’s smoke tolerance factor.
Import CAD drawings: No, this is an older model. The input needed by the user is the
following:
• Location of walls, barriers, exits, and doors (in terms of x,y coordinates)
• Boundaries of room subdivisions
• Information about the doors, such as location, manual or automatic close, and initially
opened or closed
• Exit goal locations that are available for each spatial subdivision
• Initial location of the fire

153
• Number of exits available
• Number of spatial crowding subdivisions in the floor plan
• Number of doors in the floor plan
• Physical crowding threshold for each space in the building
Visualization capabilities: None.
Validation studies: None noted.
Special features:
• Manual exit block/obstacles – Yes, for each occupant. The occupant can have a
probability of 0 that he/she cannot open the door.
• Fire conditions affect behavior? Yes, fire conditions are input by the user.
• Disabilities/slow occupant groups – Yes, the user specifies each occupant’s initial
mobility or disability. This is suspected to mostly affect assistance and rescue
behavior of the mobile occupants.
• Delays/pre-movement time – Yes, the model accounts for behaviors occurring before
exiting the building.
• Toxicity of the occupants – Yes, per specified smoke tolerance factor.
• Route choice of the occupants/occupant distribution – Route choice is dependant
upon occupant characteristics and environmental conditions.

154
Limitations: A limitation of the model is very specific inputs for EACH occupant. It
probably gets difficult to model a large number of people. Also, it is not clear what the
limit is for modeling a certain number of occupants. This is a much older model.
_____________
Section 2.20 buildingEXODUS33,39,104,105,106,107:
Developer: E. Galea and FSEG Group, University of Greenwich, UK
Purpose of the model: The purpose of this model is to simulate the evacuation of a
large number of people from a variety of enclosures. The modeling suite consists of
airEXODUS, buildingEXODUS, maritimeEXODUS, railEXODUS, and vrEXODUS
(Virtual reality graphics program). buildingEXODUS attempts to consider “people-
people, people-fire, and people-structure interactions.” The model consists of six
submodels, as shown in Figure 2.18, that interact with one another to pass information
about the evacuation simulation, and these are Occupant, Movement, Behavior, Toxicity,
Hazard and Geometry submodels.
Figure 2.18: EXODUS submodel interaction (33, p. 46)

155
Availability to the public for use: As of August 2002, buildingEXODUS version 3.01
is available for use through the University of Greenwich (FSEG).
Modeling method: This is a behavioral model.
Structure of model: This is a fine network system. The model uses a 2-D spatial grid to
map out the geometry of the structure, locate exits, obstacles, etc. The grid is made up of
“nodes” and “arcs.” Each node represents a small amount of space on the floor plan and
the arcs connect the nodes together on the floor. Individuals use the arcs to travel from
node to node throughout the building. This information is stored in the Geometry
submodel. Also, throughout the simulation, each node has dynamic environmental
conditions associated with it, including levels of toxic gases, smoke concentration, and
temperature.
Perspective of model and occupant: The model views the occupants as individuals by
giving each occupant certain characteristics. The Occupant submodel’s purpose is to
describe the individual and contains such information as gender, age, maximum running
speed, maximum walking speed, response time, agility, patience, drive, etc. The
Occupant submodel also maintains such information as the distance traveled by the
occupant throughout the simulation, the person’s locations, and exposure to toxic gases.
Some of these attributes are static, and some of these change with the conditions in the
building.

156
The occupants’ view of the building is primarily individual, but includes a global
level as well. An occupant’s escape strategy or route, determined by the Behavioral
submodel, is a product of his/her interactions with the building, other occupants, and the
fire hazard in the situation. The behavioral submodel focuses on two distinct levels – a
local and global, as noted by the developers of the model. The local level (selection of a
detour route) determines the occupant’s response to the current or local situation and the
global (which is specified by the user but can be overridden by the local level) level
keeps track of the overall strategy of the occupant (such as to use the most familiar exit to
leave the building). After the Behavioral model has made a decision, it passes this
information onto the Movement submodel to move the occupant.
Occupant behavior: Rule-based or conditional behavior.
Occupant movement: The Movement submodel controls the physical movement of the
occupant from the current position to the next. Or, if a delay time was initiated by the
user, the model holds the occupant in position. The movement model can also
incorporate overtaking, side stepping, and other actions. The Movement submodel
determines the speed at which the occupant will move, and checks with the Occupant
submodel to make sure the occupant has the capability of performing specific maneuvers
during evacuation (i.e., jumping over obstacles). The user can set one of six levels of
walking speed for each individual occupant, randomly generated for the population, or
group-defined. Those six levels are:
• Fast walk – default speed of 1.5 m/s

157
• Walk – 90% of fast walk
• Leap – 80% of fast walk
• Crawl – 20% of fast walk
• Stairs-up (based on Fruin data30 and dependent upon age and gender)
• Stairs-down (“)
The occupant “slows” due to other occupants occupying the grid cells in front of
him/her. When moving to a grid cell that another occupant also wishes to occupy, the
conflict resolution input assigns a certain delay time to each occupant in “conflict.” Also,
the drive variable also affects which occupant will actually occupy the grid cell. If one of
the occupants is assigned a higher drive value than the other, that occupant will obtain the
next grid cell. However, if both occupants are assigned the same drive value, the
decision is random. In short, the evacuation time of movement from grid cell to grid cell
is made up of actual movement at unimpeded speed plus any conflict delays that occur
along the way.
At the global level of the occupants’ view of the building, the evacuation strategy
is defined by the user. The default route is determined by the potential map (marking 0
as the exit and all other nodes as higher number the further away the node is from the
exit), which leads people to the nearest available exit. If an exit is labeled as familiar or
more attractive, this default potential map and route changes. The occupants always
move onto a node with a lower potential than the one they are presently occupying. If an
exit is more attractive, the potential for that exit is lowered. As mentioned earlier, the
global level information is followed until an event occurs on the local level. At the local
level, two behavioral options are available to the user, normal and extreme behavior. In

158
normal behavior, the occupants’ movements are determined by the potential map, and
they strive to lower their potential. If the option to lower potential is not there, the
occupant will move onto a node with equivalent potential. If this option is not available,
the occupant will wait. In extreme conditions, occupants may act in a more extreme
manner by taking a more indirect route. In this case, the occupants do not mind accepting
a higher potential for a short time during the alternative route. These actions also tie in
with the patience option in the Occupant submodel.
On the stairwells, the occupants view all nodes on the stairs as equally attractive,
but if an occupant is within 5 nodes of the edge of the staircase, he/she will move to the
edge as an attempt to use the handrails. Occupant travel speeds on stairs are based on
work done by Fruin. Exiting is based on two factors, the exit width and flow rate per unit
width. These values determine the maximum amount of occupants allowed to exit at the
same time and the number of nodes assigned to the exit. The user specifies an upper and
lower limit of flow rate at each exit.
The user can manipulate all aspects of the Occupant submodel, for instance, the
mobility and agility attributes can be modified so that disabled or slow moving occupants
can be simulated.
The Toxicity submodel determines the effects of the toxic products on the
occupants in the building. The effects on the occupants are given to the Behavioral
submodel which transfers the information to the Movement submodel. To determine the
effects of the fire hazard, including the newly added radiative effects, on the occupant,
EXODUS uses the Fractional Effective Dose (FED) model developed by David Purser,
BRE26. The FED model assumes that the effects of certain fire hazards are related to a

159
dose over time. As the FED approaches 1, the occupant’s mobility, agility, and travel
speeds can be reduced. The FED model considers the effects of radiation, temperature,
HCN, CO, CO2, and low O2 to estimate the time to incapacitation. Also, other effects to
occupants are staggered and slowed movement, based on data from Jin28. Occupants may
choose to travel a different route when faced with a barrier of smoke, depending upon
their individual characteristics2.
Output: In order to interpret the results, data analysis tools have been developed to use
once the simulation have been completed. These tools allow for the output files to be
searched and for specific data to be extracted. The program is labeled as “askEXODUS.”
Use of fire data: Yes, the Hazard submodel determines the thermal and toxic
environment. buildingEXODUS can accept data from other fire models or experimental
data. A software link is established between buildingEXODUS and CFAST, a zone fire
model developed at NIST.
Import CAD drawings: Yes, CAD drawings can be imported into the model. In
addition, the user can also input the geometry of the building via the geometry library or
by interactively using the tools provided in buildingEXODUS. This information is stored
in the Geometry submodel.
Visualization capabilities: 2-D (low detail and person shape) and 3-D capabilities
(Virtual reality interface).

160
Validation studies: According to developer, the model has undergone several forms of
qualitative and quantitative validation. The model developer claims that this includes
direction comparison of model predictions with past experimental data, comparison of
“blind” model predictions with experimental data, and comparing the nature of human
behavior with expectations of the model. Although many of the validation studies are
performed on airEXODUS using experimental trials from the aviation industry, the
developers claim that both airEXODUS and buildingEXODUS are based on the same
principles.
For validation of the airEXODUS model, the model results were compared
against Cranfield Trident Three experiments (an example of past experiments). Here,
people evacuated from Trident Three aircraft cabin sections and the model correctly
predicted the trends in evacuation times, according to Gwynne et al. AirEXODUS results
are also compared against certification trials of aircrafts, specifically the B767-304ER.
These trials are performed only once and after running several runs of the model, it was
shown that the performance of the certification trial was near optimal by the passengers
and crew. Therefore, the optimal EXODUS predictions were compared to the trial and
were within 2% of the measured trial evacuation time.
Validations studies of buildingEXODUS108,109 using the following buildings:
seven pavilions of the Tukuba International Expo in 1985, the Stapelfeldt experiments
(evacuation of police cadets from a school gymnasium), and the Milburn House,
Newcastle-Upon-Tyne, UK. Reasonable agreement was found, when looking past

161
deficiencies in the data. The developer notes “excellent agreement between
buildingEXODUS predictions and observed evacuation times.”
Special features:
• Manual exit block/obstacles – Yes.
• Fire conditions affect behavior? Yes, from the Hazard submodel and CFAST.
• Defining groups – Yes.
• Disabilities/slow occupant groups – Yes.
• Delays/pre-movement time – Yes, these are user defined.
• Toxicity of the occupants – Yes.
• Impatience/drive variables – Yes.
• Route choice of the occupants/occupant distribution – Globally, the potential leads to
shortest route and can be overridden by local information and events.
Limitations: If users decide to purchase the level 1 option, the website notes that “Level
1 can handle multiple floors and unlimited population sizes, includes the movie player
facility and the data analysis tool askEXODUS. Limitations are dictated by the
capabilities of the host computer. This version does not include a toxicity sub-model and
posses a limited capability hazard sub-model.” The Level 2 option involves “As level 1
but includes a toxicity model that allows the inclusion of the fire hazards of smoke, heat
and toxic gases within the simulation. An ability to import history files from CFAST
V4.01 in order to define the fire atmosphere. This level includes the movie player, data
analysis tool askEXODUS and an ability to produce output capable of being read by the
162
post-processor virtual reality software vrEXODUS. Level 2 encompasses the full
capability of buildingEXODUS.”
_____________
Section 2.21 EGRESS39,110,111,112:
Developer: N. Ketchell, AEA Technology, UK
Purpose of the model: The purpose of this model is to determine the evacuation of
crowds in a variety of situations, such as theaters, office buildings, railway stations, and
ships.
Availability to the public for use: EGRESS is available only on a consultancy basis
and the software is not offered for sale.
Modeling method: This is a behavioral model
Structure of model: This is a fine network system. The floor plan of a building is
covered in cells that are equivalent in size to the minimum area occupied by an occupant.
Instead of being square, like most grid cells, the cell is hexagonal in shape, as shown in
Figure 2.19. The hexagon has a height equal to h and an area of √3h2/2. EGRESS holds a
default of 5 people per square meter, which equals a grid spacing of 0.5 m. This can be
modified if occupants are expected to be carrying large objects, etc.

163
Figure 2.19: Example of cells on an egress plan (112, p. 2)
Perspective of model and occupant: The model views the occupants as individuals.
The movements of each occupant are carefully monitored throughout the simulation.
Each individual also has certain goals and a specified time period to complete that goal.
The occupants’ perspective of the floor plan is also individual. EGRESS contains
a route finding algorithm that defines the shortest distance from each cell on the floor
plan to each specified region or exit. Then, the behavioral modeling aids in choosing
which objective the occupants moves toward.
Occupant behavior: The occupant behavior is conditional. As long as the objective is
still possible within the time frame allotted, the individual continues to pursue the goal.
The method of behavioral modelling has become simpler since the previous
method was found to cause major issues in the number of decisions made by each
occupant. EGRESS provides groups of occupants with itineraries throughout the
evacuation in order to alter objectives/goals, as shown in Figure 2.20. Each objective
(example is movement towards the fire for an emergency personnel worker) on the
itineraries is assigned a time period in which each individual of the group will attempt to

164
reach it. If during the time period, the preferred
objective is still possible, each person continues to
pursue it. If the objective is no longer possible, the
next objective down the list is attempted. The
itinerary includes the appropriate delay times for
responding and intermediate delays for decision
making to pursue other options. Other ways of
altering behaviour are assigning regions which are
accompanied by a delay time when crossing them,
regions which decrease walking speed when passing them, and regions which alter the
evacuation route assessment. EGRESS can also incorporate assessing the fractional toxic
doses received by the occupants in the evacuation, but the developers state that these are
infrequently used due to their degree of speculation in the process of modelling such
actions.
Occupant movement:
Route finding
People move from cell to cell based on the “throw of a weighted die.” The
weights/probabilities of the die are calibrated against the speed and flow, as a function of
the density, of the occupants to move them throughout the building. For certain cases,
the model can vary these probabilities for the cells to reflect changes in the evacuation
event, such as a region becoming blocked by smoke. EGRESS contains a route finding
algorithm that calculates the shortest distance from each cell to each exit. With the
Figure 2.20: Behavioral modeling in EGRESS (112, p. 9)
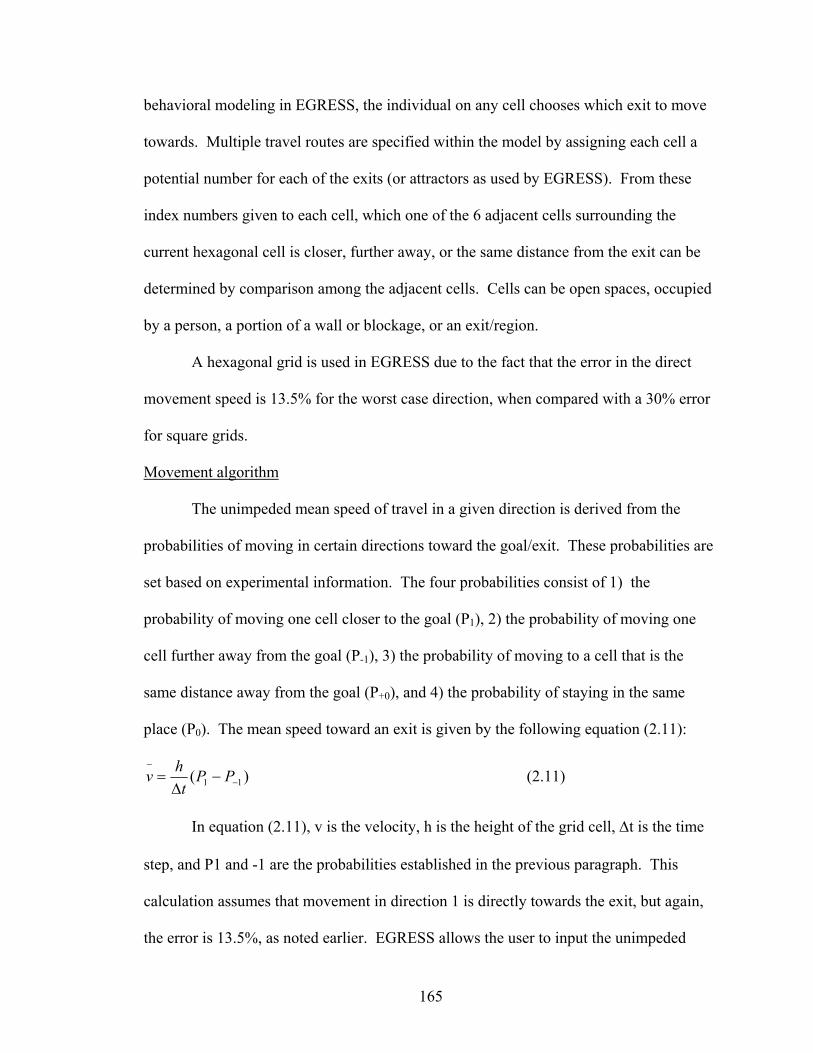
165
behavioral modeling in EGRESS, the individual on any cell chooses which exit to move
towards. Multiple travel routes are specified within the model by assigning each cell a
potential number for each of the exits (or attractors as used by EGRESS). From these
index numbers given to each cell, which one of the 6 adjacent cells surrounding the
current hexagonal cell is closer, further away, or the same distance from the exit can be
determined by comparison among the adjacent cells. Cells can be open spaces, occupied
by a person, a portion of a wall or blockage, or an exit/region.
A hexagonal grid is used in EGRESS due to the fact that the error in the direct
movement speed is 13.5% for the worst case direction, when compared with a 30% error
for square grids.
Movement algorithm
The unimpeded mean speed of travel in a given direction is derived from the
probabilities of moving in certain directions toward the goal/exit. These probabilities are
set based on experimental information. The four probabilities consist of 1) the
probability of moving one cell closer to the goal (P1), 2) the probability of moving one
cell further away from the goal (P-1), 3) the probability of moving to a cell that is the
same distance away from the goal (P+0), and 4) the probability of staying in the same
place (P0). The mean speed toward an exit is given by the following equation (2.11):
)( 11 −
−
−∆
= PPt
hv (2.11)
In equation (2.11), v is the velocity, h is the height of the grid cell, ∆t is the time
step, and P1 and -1 are the probabilities established in the previous paragraph. This
calculation assumes that movement in direction 1 is directly towards the exit, but again,
the error is 13.5%, as noted earlier. EGRESS allows the user to input the unimpeded

166
speed of a particular group as a percentage of the default movement speed, in order to
simulate injured or disabled occupants. The default movement speed in EGRESS is 0.9
m/s, along with various other parameters of standard deviations for the velocity and
times, based on work of Predtechenskii and Milinskii31.
Flow in crowds
EGRESS models crowd movement based on the collision rule. The simplest
method of applying this rule is to leave an occupant in their current cell if the proposed
move is blocked by another occupant. EGRESS uses this similar rule, except that a
random alternative adjacent cell is tried and if unoccupied, the person moves into that
cell. The first option calculates the speed as a function of density proportional to (1-D)
and the second alternative option calculates a speed as a function of density proportional
to (1-D/5). This EGRESS method of calculating flow as a function of density compares
well with Predtechenskii and Milinskii walkways, Pauls, and Fruin data. Also based on
work by Predtechenskii and Milinskii, EGRESS adds additional “haste factors” for speed
movement of 1.5 for emergency movement and 0.6 for unconcerned crowd movement.
Output: Visualization of congestion points, bottlenecks, merging flows, etc. The
visualization tracks the position of each individual throughout the simulation.
Use of fire data: EGRESS provides a way for the user to input fire scenario data. The
plans for the building, which are already drawn, can be edited at different times and the
results can be saved to the “scenario file.”

167
Import CAD drawings: The structure of the building to be modeled can be designed on
screen, as well as the position of the occupants.
Visualization capabilities: 2-D visualization is possible.
Validation studies: In the 2002 EGRESS publication, four specific validation examples
are featured. The four validation examples were the following:
• A series of competitive evacuation drills were performed using a Trident aircraft.
Competitiveness stemmed from the fact that the first 30 evacuees received a monetary
reward. The occupants either evacuated via the main exit (Type 2) with varying door
width or through the overwing exit (Type 3).
• A double-decker bus was evacuated, and the evacuees were aware that a trial was
being completed. Smoke capsules were used and the driver ordered the evacuees to
leave the bus.
• Two theaters were evacuated during the Tukuba Exp in 1985. These seated 424 and
500 people.

168
The results are shown in Table 2.12:
Table 2.12: Validation results for the EGRESS model
Evacuation Time (seconds) Validation Case Observed EGRESS
Variation
Trident (main) 24 33 +38% Using EGRESS default emergency speed 22 -8%
Trident (overwing) 53 25 -53% Bus 83 65 -22%
SU Pavilion 66 86 +30% SH Pavilion 160 133 -17%
The range of error is approximately ±20-30%, except where specific features were not
modeled, according to the developer. Also, crowding was well modeled. Lastly, the
Trident aircraft example provided a better result when EGRESS was equipped with the
emergency speed, since the experiment was competitive in nature.
One thing should be noted is the length of the evacuation times in each
comparison. They range from 0.5 to under 3 minutes. With short evacuation times, a
difference of 9 seconds, such as shown in the Trident (main) case, will give a 38%
variation. This is calculated by taking the different in the evacuation times and dividing
the difference by the observed evacuation speed. If that observed speed is a lower
number, even a small difference, such as 9 seconds, will show a significant percentage in
variation. The author added this paragraph to put the last column’s (Variation) values
into context.
Special features:
• Counterflow – Yes, the model can specify emergency personnel to move towards the
fire as a goal.

169
• Manual exit block/obstacles – Yes, the user can add obstructions to the building.
• Fire conditions affect behavior? Input by the user in a scenario file allows the user to
simulate fire conditions. The drawn building plans are edited at different times with
hazard information.
• Defining groups – Yes, the model only recognizes groups with different goals and
movement speeds.
• Disabilities/slow occupant groups – Yes, the user can input a percentage to be used
from the default unimpeded walking speed.
• Delays/pre-movement time – Yes, both response delays and decision making delays
are simulated.
• Toxicity of the occupants – Yes, but infrequently used.
• Route choice of the occupants/occupant distribution – Shortest route, which can be
altered due to behavioral aspects of the evacuation.
Limitations: The model developers state that there are few practical limits on the size of
the simulations because the model can handle several thousand occupants and plan areas
of many km2.
_____________
Section 2.22 EXITT113,114:
Developer: B.M. Levin, NBS, U.S.
Purpose of the model: The purpose of this model is to simulate occupant decisions and
actions in fire emergencies in small residential buildings. The decision rules used by the

170
model were designed to resemble decisions made by occupants during a fire emergency.
These decision rules are based on:
• Judgment by the author
• Case studies of residential fires
• A limited number of controlled experiments
Availability to the public for use: This model is available for public use through the
NFPA.
Modeling method: This is a behavioral model.
Structure of model: This is a coarse network system. The building is made up of nodes
used to represent rooms, exits, and secondary locations within a room, and the arcs are
the distances between the nodes.
Perspective of model and occupant: The model views occupants as individuals by
assigning each individual characteristics as well as tracking their movements throughout
the simulation. The occupant characteristics input into EXITT are age, sex, normal travel
speed, whether or not the occupant needs assistance during the evacuation, whether or not
the person is asleep, room location, and difficulty of waking up, if the person is sleeping.
The occupants also have an individual view of the building, due to their choice in
exit path. The occupants’ moves throughout the building are based on a shortest path
algorithm included in EXITT. During each action of the occupant, the route taken to the

171
destination is via the shortest path. This algorithm assigns penalties to certain paths due
to heavy smoke or having to leave via windows. In certain circumstances, the occupant
is left to choose the exit with the lowest number of penalties or demerits. Demerits work
in the following way: each meter traveled is assigned 1 demerit, leaving through a
window is assigned 100 demerits, and traveling through “bad” smoke is given 200
demerits. In some situations, all routes can become blocked, which will leave occupants
trapped in the residence.
Occupant behavior: Rule-based or conditional behavior. One way that occupants make
decisions is based on the optical density of the smoke in the upper layer using the
equation for psychological impact of smoke, S (equivalent to the equation used in
EXIT89). S = 2*OD*(D/H) where OD is the optical density of the upper layer, D is the
depth of the upper layer, and H is the height of the room. The following decision rules
are incorporated into the model:
• Occupants do not move to a node where S>0.5 (or into a room where S>0.4) unless
the (H-D) is at least 1.2 meters (the occupant can crawl)
• Occupants increase their travel speed by 30% after they encounter smoke of S>0.1
• Occupants stop investigating if they are in a room where S>0.05. They will stop
investigating before entering a room where S>0.1
• If the occupant is in a room where S>0.1, he/she will respond more quickly and
believe the fire is more serious.
• Penalties and demerits are assigned to a route where S>0.4

172
The occupants are assigned certain characteristics for a simulation and those are
age, sex, normal walking speed, whether or not the occupants have special needs,
whether or not the person is sleeping, room location, and difficulty of waking up.
There are two types of occupants within the model, those fully capable when
awake and those who are in need of assistance to evacuate the building. Decision rules
apply only to the first group, and the latter group only follows those decisions and
movements made by their rescuers.
Capable occupants become aware of the fire through cues, such as the sound of a
smoke detector, odor of smoke, visible smoke, and visible flame. The model follows a
basic equation for if and when an occupant will begin responding to a cue, and suggests
the work of Nober115 is the formulation of this equation. Equation 2.12 is the cue
equation, which assumes that the occupant’s response is a function of the sum of impacts
from sensory cues:
T = 70 – 4(C-20) and C = (A-N) + X1 + X2 + X3 + X4 (2.12)
Where T is the delay time before beginning the first action, C is the sum of
sensory impacts on the occupant, A is the sound intensity of the smoke detector as heard
by the occupant, N is the background noise, X1 is the impact of an occupant seeing flame,
X2 is the impact of the occupant smelling smoke, X3 is the impact of an occupant seeing
smoke, and X4=0 if occupant is sleeping and 15 if the occupant is awake. X1 and X3 = 0
if the occupant is asleep.
EXITT normally assigns investigation as the first action of the occupant.
Exceptions to this include if an occupant has completed investigation, if there is bad
smoke in the room, if the occupant has been alerted by another who has seen bad smoke,

173
or if the occupant is an adult female with an infant that needs help. The occupants have
other alternative actions in the case that the exceptions apply (in this specific order)
which are help an occupant in the same room, help an occupant in a different room,
investigate, and egress. Occupants over age 10 act in the same way as an adult would.
Any delay time, decision time, and time to perform actions depend on the
occupant characteristics, fire environment, and the impact of the fire cues onto the
occupants.
An addition to the model includes the option for users to override the decision
rules and study the effect of alternative decisions.
Occupant movement: As mentioned earlier, a normal walking speed is assigned to each
occupant by the user, and throughout the simulation, speeds are altered in the following
way:
• 30% faster than normal if the occupant considers the fire to be serious
• 50% of normal speed if the occupant assists another, and 30% faster than this
adjusted value if the occupant considers the situation to be serious.
• 60% of normal speed of the smoke is bad (S>0.4) and the (H-D) (depth of lower
layer) is less than 1.5 m
Output: The output includes the number of occupants out of the building, those trapped,
and the total evacuation time. The actions of individual occupants at all time periods
throughout the simulation are also included in the output.

174
Use of fire data: EXITT is designed to import output from FAST to simulate smoke
throughout the building. This assumes a 2-layer smoke distribution. EXITT also accepts
input of smoke density in the upper layer and the height of the two layers in each room at
each time period.
Import CAD drawings: No, CAD drawings of the building cannot be imported into
EXITT. The building is described by providing the number of rooms, nodes, and exits,
the height of each room, the room location of each node, whether the exit was a door,
window, etc., and the distances between the nodes. If a window cannot be used for
evacuation, it is not included into the model.
Visualization capabilities: The movement of the occupants can be displayed graphically
on the computer screen.
Validation studies: None noted.
Special features:
• Manual exit block/obstacles – Yes, if smoke is very heavy (which can be input by the
user)
• Fire conditions affect behavior? Yes, these can be imported from FAST or user-
defined (OD and smoke layer heights) per time period.
• Defining groups – Yes, capable and needs assistance.
• Disabilities/slow occupant groups – Yes.

175
• Delays/pre-movement time – Delays are associated with the activities during a
preparation and response time.
• Route choice of the occupants/occupant distribution – Route choice is dependent on a
list of information, many of it conditional to the environment, during the evacuation
as well as the familiarity with the building.
Limitations: This model is used only for residential buildings. Occupants respond to
smoke conditions only, not toxicity or heat. Also, many of decision rules are based on
author judgment.
_______
Section 2.23 VEgAS116,117,118: Developer: G.K. Still, Crowd Dynamics Ltd., UK
Purpose of the model: The purpose of this model is to simulate human behavioral
response under stress conditions and through the fire environment, monitoring toxicity
levels and physical containment. All occupants and components of the building operate
in “real-time” in a “virtual reality (VR) world.”
Availability to the public for use: Unknown. Myriad (described in Section 2.28), a
macroscopic evacuation model, has seemed to replace the use of the model by Crowd
Dynamics, Ltd.
Modeling method: This is a behavioral model

176
Structure of model: This is a fine network system.
Perspective of model and occupant: The model views the occupants as individuals.
Each occupant or “human character” is programmed to respond to the following:
• Proximity to fire/smoke/temperature
• Time from the initial alarm
• Proximity to the exit
• Behavior of their neighbors
Each occupant has intelligence and a number of choices during the evacuation.
According to Gwynne and Galea33, the user specifies a defined route to the exit,
instead of modeling wayfinding capability. The route is dynamically affected by the fire
environment, as shown in the VEGAS diagram.
Occupant behavior and movement: The occupant behavior is artificial intelligence,
which involves simulating the individual thought processes. The behavior/movement
processes are shown in Figure 2.21.

177
Fire Influence
Proximity Check
Smoke Influence
Flocking Influence
Health Check
Fire Proximity
Route Choice
Evacuate
Investigate DEAD!
OK
Limited
Above Trigger
Below Trigger
Below Trigger
Figure 2.21: The VEgAS model (116, p. 42)
The model can use such input as the products of combustion in the building
spaces (fixtures, finishes, and furnishings), the fire growth rate, the effect of opening and
closing doors, the effect of smoke, toxicity to the occupants, and smoke extraction
systems to simulate the evacuation. Each occupant is programmed to respond to the
proximity to the fire environment (fire, smoke, and temperature), the time from initial
alarm, proximity to the exit, and the behavior of his/her neighbors. VEGAS uses a series
of programmable events (by the user) to trigger the occupant respond/ignore cycle.
Fire Influence
Proximity Checks
Smoke Influence
Flocking Influence
Health Check

178
Within VEGAS, behavior is simulated as a chaotic process. The theory of “anti-
chaos” is used to outline the order in which chaotic systems can develop. The developer
uses the example of bird colonies to explain further. When part of a closer-packed group,
bird colonies display group characteristics of ordered societies, and yet have random
behaviors individually. The developer notes that “the ‘order of chaos’ theory explains the
behavior as the net effects of complex decision making processes having a finite
probabilistic outcome for the group as a whole.” According to Gwynne, the model
applies behavior rules dependent upon 1) an objective/goal, 2) a set of constraints (the
occupants attempt to maintain a minimum distance between themselves and others), and
3) a motivation (the occupants attempt to maintain unimpeded velocity).
VEGAS also uses “proximity logic” to modify behavior. Instead of calculating
movement speed based on density, the model simulates movement speed based on
“proximity logic,” which is the location of the occupant with respect to other objects in
the simulation. Also, when a group of occupants move toward an exit, the occupants who
have encountered that group will “flock” in the same direction, known as the flocking
algorithm. The model also includes an effective width model.
The exact method for applying both techniques was not expanded upon.
Output: Virtual reality simulation of the evacuation.
Use of fire data: VEGAS models fire effects, but it is unclear how the fire information
is input into the model (it seems that this information can be fed in from a CFD fire
model).

179
Import CAD drawings: The user can import DXF files (obtained from CAD) directly
into VEGAS/VR environment.
Visualization capabilities: 3-D visualization is possible.
Validation studies: None found.
Special features:
• Manual exit block/obstacles – Yes, the user can add obstructions to the building.
• Fire conditions affect behavior? Yes, fire conditions can be simulated but it is
unclear how the effects are input into the model.
• Defining groups – Yes, group behavior is modeled.
• Delays/pre-movement time – Yes, the assumption is that delays are incorporated in
the individual checks made (proximity check, health check) as well as the ability for
the occupant to investigate the situation before evacuating.
• Toxicity of the occupants – Yes.
• Route choice of the occupants/occupant distribution – User-defined.
Limitations: Some of the behavioral factors have not been calibrated with real life data.
_____

180
Section 2.24 E-SCAPE119:
Developer: E. Reisser-Weston, Weston Martin Bragg Ltd, UK
Purpose of the model: The purpose of this model is to view evacuation in real time,
identify bottlenecks in the building configuration, and to gain a probabilistic view of the
emergency scenario by running the model several times. This model has been complied
from studies carried out on emergency evacuation from over 30 years ago.
Availability to the public for use: The availability of the model is unknown at this
time.
Modeling method: This is a behavioral model.
Structure of model: This is a coarse network system. Each room or area in a room is
represented by a node, and the arcs connect these as well as represent the distances
between the nodes.
Perspective of model and occupant: This model seems to view the occupants with an
individual perspective. It is unclear whether or not the user inputs individual
characteristics of the occupants, but it seems that the model recognizes individual
responses to the evacuation environment, according to their Performing Shaping Factors
(PSFs).

181
The occupants have an individual view of the building, because their choice of
egress route is affected by the evacuation environment and PSFs. The occupants’ choice
of route to the exit is affected by the distance of the occupant to the exit, the frequency of
use of the exit during normal situations, and the signage of the route.
Occupant behavior: The model attempts conditional behavior. The model incorporates
the method of Hierarchical Task Analysis (HTA), which involves sorting evacuation into
individual tasks and then decomposing these tasks into sub-tasks until the appropriate
level of analysis has been reached. Factors of the environment determine the probability
of an individual carrying out certain tasks during the evacuation. E-SCAPE recognizes
the following four factors that shape an evacuation (these are known as Performing
Shaping Factors – PSF):
1. Structural PSF: The organization of the work environment, such as physical
characteristics, rules, hierarchies
2. Effective PSF: The emotional, cultural, and social factors that affect decision-making
during an evacuation
3. Informational PSF: The information available to occupants from direct collection or
its communication
4. Task and Resource Characteristics PSF: The tasks being carried out by the occupants
that may in turn affect their ability to react to certain cues/stimuli.
The developers claim that these factors were successful in describing the factors in an
evacuation after searching through case studies and experiments in egress. Possible tasks

182
during an evacuation are plotted in a hierarchical chart, and an example of this is
provided in Figure 2.22.
Figure 2.22: Examples of possible evacuation tasks for the E-Scape model (119, p. 3)
The decision on whether or not to evacuate depends on how serious the occupant
perceives the threat and the warning/fire cue. If the occupant believes the warning to be
genuine, this results in the immediate action of acting. On the other hand, if the cue is
considered to be unimportant, the occupant will wait.
To analyze the diagram further, once the decision has been made to act, the
decision to carry out the preparation activity depends on the PSFs in the environment.
For example, an occupant is more likely to “Deal with the danger” if 1) the location of
the stimulus is known (informational), 2) the individual is male (effective), 3) the
occupant has an organizational responsibility to the building (structural), and procedures
are provided for such instances (task and resource characteristic). E-SCAPE accounts for
Emergency Behavior
1) Act 2) Investigate 3) Wait
Prepare Egress Indirect Info.
Direct Info.
Deal with Danger
Assist Others
Inform Others
Dress/Gather valuables

183
the effect of performing these actions by varying the time it takes to initiate the
evacuation, not the actual action. This is done to reduce the processing power of the
simulation, but may take away from the accuracy of the egress times. Gwynne states that
“it is not obvious as to how the individual can then have any effect on the environment
within such a system, or whether the success or failure of actions is accounted for”33.
By defining the building type, a hospital for example, will prompt certain
structural, effective, informational, and task and resource characteristic PSFs, which then
affect the responses of the occupants and the routes chosen to evacuate the building.
The delay time of space within E-SCAPE is affected by the number of people in a
node, since the model assumes that group conformity occurs at certain limits. Also, delay
time is also affected by the movement of others, the building type, smoke, and training.
With the movement of others, the probability of evacuation increases as more people
leave the room. Depending upon the building type, organizational responsibility may
encourage occupants to tell others to leave, which in turn decreases the affect of group
conformity. The presence of smoke acts in decreasing delay time and will act as an
additional cue in the evacuation. Lastly, special training and fire drills have a different
effect on the occupants. If the occupants have experiences both special training and fire
drills, these two effects cancel each other out and the delay time remains unaffected. If
only special training is received, delay time is reduced, and if only fire drills are
experienced, delay time is increased.
Occupant movement: The occupant route choice is affected by the distance of the
occupant to the exit, the frequency of use for the exit during normal hours, and the

184
signage along the route. Depending upon the level of use of the exit, E-scape assigns a
weighting which effects evacuation from the building. The weightings of each exit are
then multiplied by the distance of the occupant to the exit, which determines the overall
weighting for the exit for each occupant.
These delay times and exit choice behaviors were combined with a dynamic
movement model120 to produce an evacuation model. Through the use of Pauls’ model,
people are moved throughout the building.
The user defines the dimensions of the building through nodes and arcs, the
position of the occupants in the structure, and describes the type of structure and exit
choice factors.
Output: The output includes the visualization of the evacuation, identification of
bottlenecks, and if the model is run a number of times, a probabilistic picture of the
evacuation scenario.
Use of fire data: Environmental conditions of the building are input by the user via the
environmental conditions window. The user can specify if there is smoke in the building
and if it spreads to the floor, entire building, or remains in the room of origin.
Import CAD drawings: No, nodes and arcs are input into E-scape.
Visualization capabilities: Yes, 2-D visualization is possible

185
Validation studies: None noted. The example of the offshore platform shows only that
E-scape can represent the geometry.
Special features:
• Fire conditions affect behavior? Yes, fire conditions are input by the user.
• Defining groups – Yes.
• Delays/pre-movement time – Yes, delays are incorporated by the model because it
varies the time it takes to initiate evacuation.
• Route choice of the occupants/occupant distribution – The route choice is dependent
upon distance to exit, frequency of use of exit, and signage.
Limitations: Still some questions left unanswered about model.
_____________
Section 2.25 BGRAF121,122,123,124:
Developer: F. Ozel, University of Michigan, U.S.
Purpose of the model: The purpose of the model is to simulate cognitive processes
during evacuation with the use of a graphical user interface. The developer recognizes
the model BFIRES-2, of which this model seems to be very similar.
Availability to the public for use: The model is not publicly available at this time. The
developer is working on putting together a CAD-based version of the model, and states
that when that is finished, the model might become available.

186
Modeling method: This is a behavioral model.
Structure of model: This is a fine network system. Each node, similar to BFIRES,
represents an x,y point on the floor plan. The preference levels are given to spaces/nodes
that affect the movement of the occupant throughout the situation. “Paths” are the
lines/distances that connect the nodes to one another.
Perspective of model and occupant: This model recognizes individuals. The model
also keeps track of the position (x,y coordinates) of the occupants throughout the
simulation. The properties of the occupants are both physical (walking speed, mobility,
alertness, smoke tolerance, and initial location) as well as psychological. Examples of
these psychological properties are the goals that the occupant sets for himself/herself and
the probability of these occurring, the threshold of stress, and the familiarity.
The occupants also have an individual view of the building because the occupant
travels a particular route resulting from a sequence of actions that depend on the
preference levels, environment, and the other occupants in the evacuation.
Occupant behavior: The model attempts conditional behavior. The model incorporates
an episodic structure which is similar to BFIRES. Each episode is identified by a specific
goal of each occupant. When the current goal changes, a new episode begins. The
decision process consists of choosing the next goal, which triggers a new set of actions
for the occupant to choose from. There are also such things as goal modifiers, which are
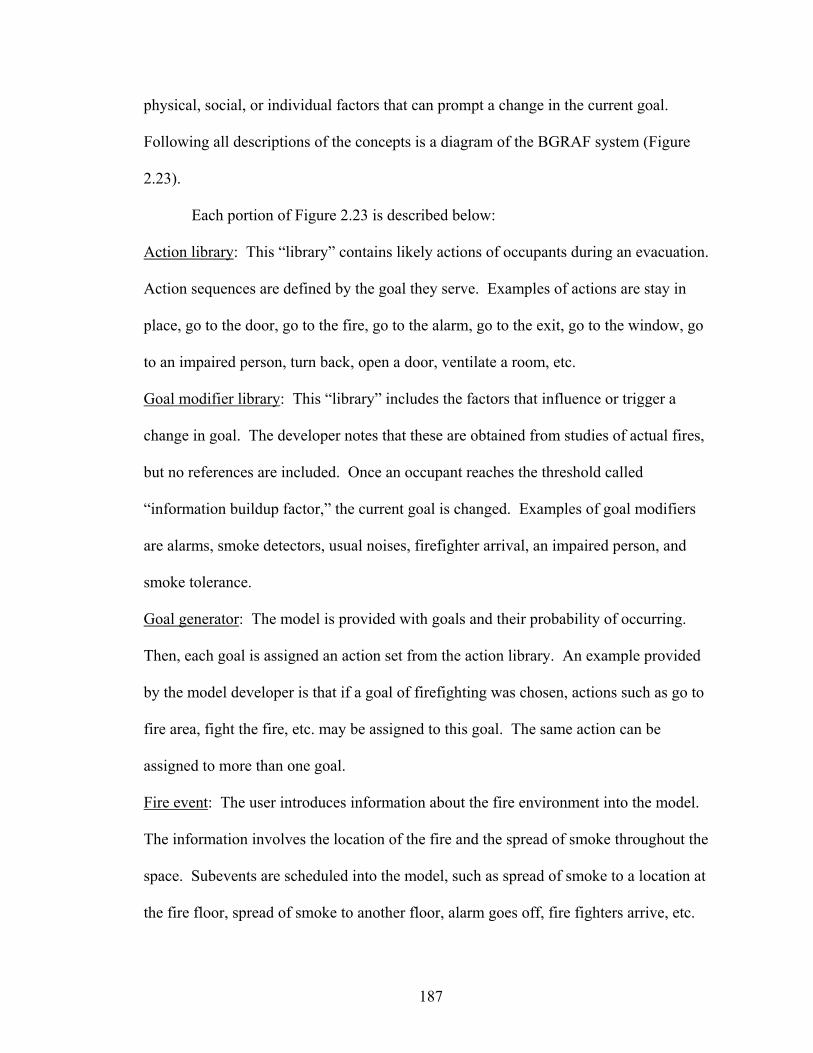
187
physical, social, or individual factors that can prompt a change in the current goal.
Following all descriptions of the concepts is a diagram of the BGRAF system (Figure
2.23).
Each portion of Figure 2.23 is described below:
Action library: This “library” contains likely actions of occupants during an evacuation.
Action sequences are defined by the goal they serve. Examples of actions are stay in
place, go to the door, go to the fire, go to the alarm, go to the exit, go to the window, go
to an impaired person, turn back, open a door, ventilate a room, etc.
Goal modifier library: This “library” includes the factors that influence or trigger a
change in goal. The developer notes that these are obtained from studies of actual fires,
but no references are included. Once an occupant reaches the threshold called
“information buildup factor,” the current goal is changed. Examples of goal modifiers
are alarms, smoke detectors, usual noises, firefighter arrival, an impaired person, and
smoke tolerance.
Goal generator: The model is provided with goals and their probability of occurring.
Then, each goal is assigned an action set from the action library. An example provided
by the model developer is that if a goal of firefighting was chosen, actions such as go to
fire area, fight the fire, etc. may be assigned to this goal. The same action can be
assigned to more than one goal.
Fire event: The user introduces information about the fire environment into the model.
The information involves the location of the fire and the spread of smoke throughout the
space. Subevents are scheduled into the model, such as spread of smoke to a location at
the fire floor, spread of smoke to another floor, alarm goes off, fire fighters arrive, etc.

188
While these events are scheduled, local spread rates are entered interactively during the
simulation. The developer describes the simulation as interactive, allowing the user to
point to areas on the screen and provide different values for the environment.
Physical environment: The user also enters into the model a description of the building
and the fire protection aspects, such as location of alarms, status of doors, etc. The
building configuration is also sketched interactively and the output is graphical.
Route modifier library: The model assigns preference levels to spaces along different
routes in the building. The criteria existing for these preference levels are the following:
high priority is given to spaces with “architectural and functional differentiation” because
of the belief that occupants have created stronger mental images of these areas; simple
paths (instead of complex) are associated with a high probability of making a rational
decision; higher preference is given to exits with perceptual access; and priority is
indifferent to the introduction of exit signs.
People characteristics: Cognitive properties, such as preference levels, are assigned to
each occupant group. Other characteristics include walking speed, asleep or awake at
time of fire, and smoke tolerance.
Goal Initiator: This is the central unit that checks the goal modifiers to see if a goal
change is needed for each individual at each time frame. If so, the next goal is chosen
stochastically. Then, the goal is passed to the action generator.
Action Generator: The individual person is moved by this generator according to the
action. The effect of the individual action on the fire event, building, and other individual
is transferred to the goal modifiers.
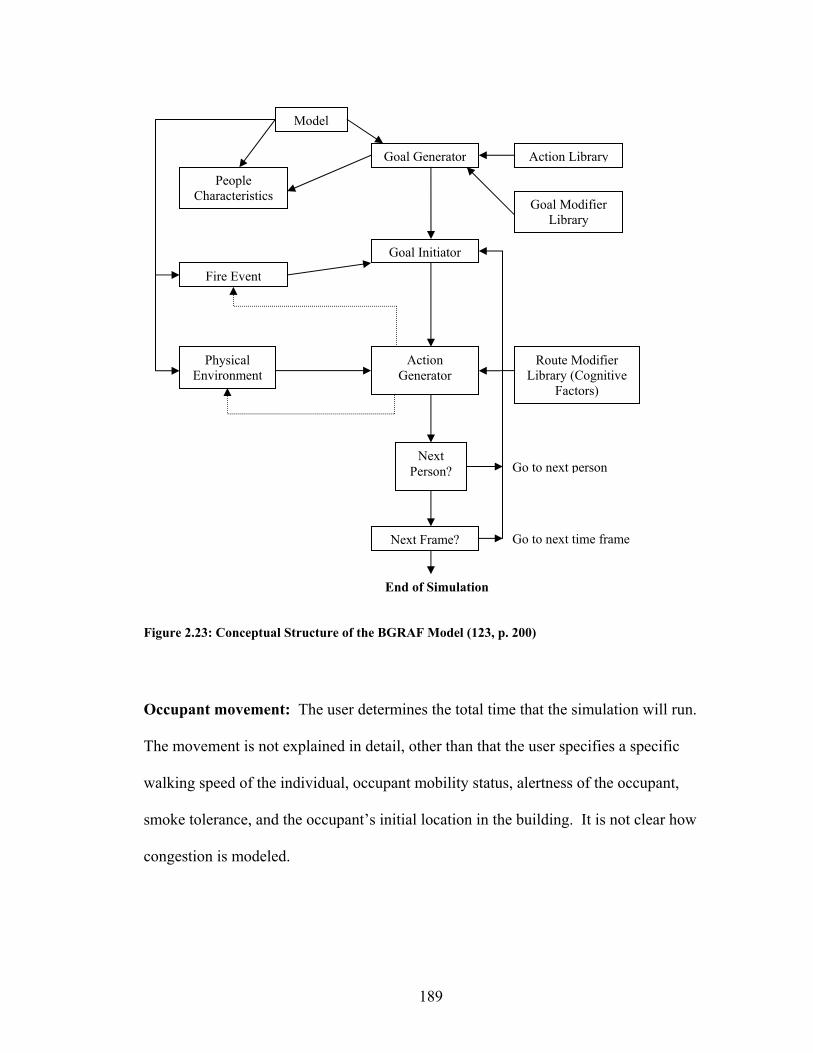
189
Figure 2.23: Conceptual Structure of the BGRAF Model (123, p. 200)
Occupant movement: The user determines the total time that the simulation will run.
The movement is not explained in detail, other than that the user specifies a specific
walking speed of the individual, occupant mobility status, alertness of the occupant,
smoke tolerance, and the occupant’s initial location in the building. It is not clear how
congestion is modeled.
Go to next time frame
Go to next person
Goal Generator
Goal Initiator
Action Generator
People Characteristics
Model
Fire Event
Physical Environment
Action Library
Goal Modifier Library
Route Modifier Library (Cognitive
Factors)
Next Person?
Next Frame?
End of Simulation

190
Output: The following output is provided by the model:
• Evacuation time
• Initial distance from exit
• Number of people that successfully escaped the fire
• Length of exposure to smoke
• Action statistics and order actions
Tabular output summarizes the goals pursued by the occupants and the actions that each
occupant has taken. Also output are the distances traveled, exits used, and current
locations of each occupant.
Use of fire data: The model can accept such user input as the start time of the fire, the
area of origin, and the fire spread rate. Or, data can be imported from FAST. The fire
spread is calculated and simulated for every time frame. Also, occupant decisions, such
as opening or closing a door, affect fire and smoke spread throughout the building.
Import CAD drawings: The CAD-based version of BGRAF is in development.
Currently, the user can sketch out the building geometry using the interactive interface of
the model.
Visualization capabilities: It seems like this is an option because of the mention of an
interactive simulation and high resolution output graphics.

191
Validation studies: A validation attempt was performed on BGRAF with the use of data
from a Nursing home fire. Although 91 occupants were on the fire floor, the developers
obtained only 22 occupants from which they gained information. These 22 occupants
also were not able to supply exit times, so the validation was focused on behavioral
activities and decisions. From the 10 runs performed on the nursing home, the model
identified the correct proportions of occupant activities 80% of the time with a 5% level
of significance.
Special features:
• Fire conditions affect behavior? Yes, fire conditions are input by the user or from
FAST
• Defining groups – Yes, the preference level can be assigned by occupant group.
• Disabilities/slow occupant groups – Yes, the walking speed depends on the physical
status of the occupant (ambulatory vs. disabled).
• Delays/pre-movement time – Yes, the model accounts for behaviors occurring before
exiting the building.
• Toxicity of the occupants – Yes, per specified smoke tolerance factor, similar to
BFIRES.
• Route choice of the occupants/occupant distribution – Route choice is dependant
upon occupant characteristics and environmental conditions.
Limitations: No mention of processing time or capacity of model.
_____________

192
Section 2.26 EvacSim125,126:
Developer: L. Poon, at the Victoria University of Technology, AU
Purpose of the model: The purpose of this model is to simulate a variety of complex
human behavioral activities, deterministically, probabilistically, or both. The model is
capable of modeling a large population, but at the same time considers human behavior at
the individual level. An occupant can be modeled to interact with the fire environment
and/or other occupants, depending upon the occupant’s specified level of severity.
Availability to the public for use: This model is not released publicly, but instead is
used internally at the present time.
Modeling method: This is a behavioral model.
Structure of model: This is a fine network system. Originally the grid structure was
based on zones of the building because it was designed to interface with a zone fire
model. However, the user has the ability to refine the grid structure to match the intended
resolution of the analysis. The developer stated that the user can “divvy up the zones [on
the floor plan] into smaller zones”126 and the only limit to this is the memory of the
computer running the simulation.

193
Perspective of model and occupant: The model views the occupants as individuals
because each is given an occupant profile which records the person’s physical attribute
and his/her building knowledge attribute. Typical occupant profiles are wardens,
residents, visitors, and disabled. Occupants are also individually tracked by the output of
the model.
The occupant’s view of the building is also an individual perspective. An
occupant’s exit choice is based on the following factors:
• The orthogonal distance between the occupants and exit (based on L-shape approach)
• Length of the cue at the exit
• Whether or not the exit is locked
• The familiarity of the occupant with the exit
• The familiarity of the occupant with the floor plan
• Whether or not the exit is a designated exit (equipped with EXIT signs)
• Whether or not the exit is blocked by the effects of fire
• Action of the occupants (evacuating or seeking fire source, seeking another occupant,
etc.)
Many of these factors are local considerations to route choice. Any additional
distances traveled by the occupant (during actions, for example) are calculated from the
exit points to the destination points to acquire minimum distances.
Occupant behavior: Rule-based or conditional behavior. Human behaviour is
simulated by EvacSim. The input data for modeling human behaviour is organized in the
following categories, shown in Figure 2.24:

194
• Severity scale – Each level; typically low, medium and high, correspond to a range of
occupant responses
• Physical scale – This scale is made up of a range of physical cues perceived by the
occupant, such as smoke obscuration level and temperature. Each scale is divided
into subranges and these ranges correspond to a particular severity level. For
instance, air temperatures between 80°F and 100°F are low severity, temperatures
between 100°F and 120°F are medium, and temperatures between 120°F and above
are high severity.
Occupant responses are
distributed probabilistically on
the basis of the occupant’s
severity level. Also, each
response contains a series of
activities that are
probabilistically assigned. Typical responses consist of Seek, Warn, and Protect, and
typical activities for the Seek response include Investigate fire source, Search for others,
Get fire extinguisher, etc. Physical attributes of the occupant consist of the horizontal
and stair maximum velocities, and the area occupied by the person. If more than one
response is assigned to an occupant profile, responses are weighted (to determine which
one is chosen on a probabilistic basis) and also assigned repeatability (they can occur
more than once). The activities can also be given these attributes as well as a preparation
time and response time. If no weightings are given, the occupant will follow the line of
activities as entered.
Figure 2.24: Individual occupant responses and actions (125, p. 684)

195
There is also an option of assigning familiarity of the building using either “exit
familiarity” or “floor layout familiarity.” In the first option, the occupant will only use a
familiar exit unless they are blocked, and in the second, all exits are assumed to be
familiar. Building knowledge can also be shared among the occupants in the space, as
well as fire knowledge.
At the exit points of the building, the model follows the flow rate information,
which is a function of density, specified in the SFPE chapter1 for doorways.
There is no real limit to the definition of a character’s/occupant’s profile and the
corresponding response profile. All responses and activities are input by the user.
Occupant movement: Occupants in the simulation are static until they receive the
appropriate cue to begin an activity (this activity does not have to cause movement). The
travel speed of the occupants throughout the building is affected by the occupant density.
EvacSim uses a variable bilinear travel speed model, similar to the invariable model
proposed by Nelson and Mowrer1, based on Fruin30, Pauls127, and Predtechenskii and
Milinskii31. Travel speed for disabled occupants also use the same speed model, but
incorporate a different horizontal and stair maximum velocities.
Occupant movement within the enclosure adopts the Takahashi’s L-shaped
approach44. This approach describes movement in an orthogonal path towards an exit
due to obstacles that may be present in the space.
Output: The output includes lines describing actions of the occupants at all times when
an action/movement occurs. A typical line of output lists the simulation time, floor level,

196
enclosure number, occupant number, occupant location in global coordinates, population
severity level, and a description of the event.
Use of fire data: Changes to the environment in EvacSim can be entered by the user as
input into the model. The user can specify the time, the room number, and the
environmental conditions. There is no limit to the amount of information that the user
can enter. The conditions to be entered are usual zone model outputs, such as
temperature and layer height.
Import CAD drawings: No, CAD drawings of the building cannot be imported into
EvacSim. Instead, the wall, floor, and ceiling boundaries are defined as well as the
openings in any of the boundaries (doors and windows).
Visualization capabilities: No visualization capabilities.
Validation studies: The validation of EvacSim is ongoing. One study was performed in
the mid 1980s, in an attempt to use real data from a 12-story, partially-occupied building.
Because of the sparse amount of occupants, the evaluation of validity was limited to
behavioral activity, not evacuation times. The developer explained that the validation of
EvacSim was a lengthy process and was being completed in stages.
Special features:
• Manual exit block/obstacles – Yes, doors can be simulated to be locked.

197
• Fire conditions affect behavior? Yes, and fire conditions are user-specified. The user
specifies the time, room number, and environmental conditions (layer height,
temperature, etc.) to be captured in the simulation. There is no limit to the length or
detail of the input.
• Defining groups – Yes.
• Disabilities/slow occupant groups – Yes.
• Delays/pre-movement time – Delays are associated with the activities, preparation
and response times.
• Elevator use – Yes, these may be used by occupants with disabilities. The following
actions are taken on by an elevator during a simulation:
o Call – request to use the elevator
o Ascend – elevator travels to request
o Load – occupants get into the elevator
o Wait – doors close
o Descend – elevator travels to discharge level
o Unload – occupants get out of the elevator
o Free – elevator is idle
• Use of emergency management modeling – The EvacSim model can take into
account either a warden system or emergency warning system. The actions of fire
wardens during an evacuation are determined by the user. Also, the wardens can be
assigned the unique action of a “room-to-room” search on their floor level. On the
fire floor, wardens relay the message to “leave immediately” to the occupants. On the
other levels, the wardens hold their occupants until receiving instructions from the

198
master warden to begin evacuation (this is the phased evacuation mode). The floors,
instead of wardens, can be equipped with an emergency warning system, and the
occupant’s decision to evacuate will depend on his/her defined cues (such as the
information broadcast over the system).
• Route choice of the occupants/occupant distribution – Route choice is dependent on a
list of information, many of it conditional to the environment, during the evacuation
as well as the familiarity with the building.
Limitations: EvacSim needs more development and a complete validation. According
to the developer, the model is not presently modeling some behavior related to
residences, and he would like to integrate a fire model.
_____________
Section 2.27 Legion128:
Developer: Legion International, Ltd., UK
Purpose of the model: The purpose of this model is to predict crowd behavior by
simulating how individual groups of people behave in public places. Aside from the
occupant input for each person, additional input can be provided to the model such as
local queuing systems, service rates (the time it takes to serve one person at a ticket
booth), obstructions (furniture, columns), typical distribution of people along train
platforms, train capacities, etc.

199
Availability to the public for use: This model is available through Legion International
Ltd.
Modeling method: This is a behavioral model.
Structure of model: Unknown.
Perspective of model and occupant: The model views the occupants as individuals.
Each individual in the model is considered to be a virtual person and is simulated
accordingly.
The occupant’s view of the building is also an individual perspective. This virtual
person moves in a realistic manner. This person also recognizes objects such as stairs,
escalators, signs, queues, etc. and adjusts their behavior accordingly.
Occupant behavior: Rule-based or conditional behavior. Legion includes various
social, physical, and behavioral characteristics for the virtual people. The social
characteristics include gender, age, and culture which Legion states shape typical
movement preferences. The physical characteristics addressed are body size. And, the
behavioral characteristics include memory, willingness to adapt, and preferences for
unimpeded walking speeds, personal space, and acceleration. These characteristics make
up a profile for each person and are based on observed distributions of actual pedestrians.

200
Occupant movement: Occupant movement is based on empirical research performed on
the study of crowd movement and behavior. Research teams have taken and studied
video footage crowd behavior. Legion128 claims to have overturned key assumptions on
behavior and movement in crowds. They state that “people's circulation through a space
is determined not only by their density but also by the specific features of the local
geometry”128. Movement is affected not only by input variables chosen for each
individual person, but also by factors such as knowledge of the environment and the
person’s state of readiness. These correspond to occupants’ interaction with signage and
information points throughout the building.
Output: Bitmap and video files and the ability to choose the data output that is of
interest; graphs or detailed metrics for individual and crowd experiences. Examples of
the output are the following:
• Usage maps that show areas of congestions and regions where counterflow impedes
movement
• Graphs of times to exit for certain groups, time spent by individuals in high-density
areas, graphs of levels of “frustration” experienced
• Dynamic simulations
Use of fire data: Unknown.
Import CAD drawings: Yes, CAD drawings are imported into the model. Also, the
user can easily change spatial configurations in the building by using the Legion

201
software. The user also inputs the following onto the CAD drawing in Legion; entrances,
exits and route options, facilities (gates, waiting areas), scheduled events (train
announcements, service times), and the arrival profile of the people and their desired
destinations.
Visualization capabilities: 2-D capabilities.
Validation studies: Not found.
Special features:
• Route choice of the occupants/occupant distribution – Route choice is based on user
input variables for each occupant such as signage and other path assumptions. Routes
are used by specifying an origin-destination matrix which simulates the variations in
demands over a period of time.
_____________
Section 2.28 Myriad117,118:
Developer: G.K. Still, Crowd Dynamics, Ltd, UK
Purpose of the model: The purpose of this model is to assess the spatial dynamics
required for a successful evacuation. Myriad is also used to ensure compliance to codes
and insurance assessment. This is a macroscopic model, and because of this, Still states
that the output does not depend on assumptions about the population incorporated in the
model. This collection of techniques supersedes the VEgAS and Legion systems.

202
Availability to the public for use: This model is used by Crowd Dynamics for the
client.
Ideas and Applications: Myriad117 is said to predict where congestion will occur in the
building and its severity (via Level of Service30 degrees), flow rates, queues, travel
distances, and times in order to “optimize” design. When questioning the developer
about the Myriad system, Still118 identified three basic steps used in the analysis process
using Myriad. First, Myriad measures the distance, width, ease of use, and directional
changes from all points within the building space to the exits. This is the analysis that
ensures compliance to the codes. Colors throughout the building’s egress routes are used
to show evacuation aspects of the building, for instance, travel distance of various
distances. The building can be assessed with and without furniture, which can ultimately
affect travel distances from certain areas of the space. The occupant can enter the
number of occupants within the building/space and Myriad will produce simulations,
each beginning occupants at different places, in order to test building travel distances.
Second, Myriad identifies the various flow paths, interaction paths, and
congestion areas. These are ultimately factored into the “delays” in the egress process.
The interactions and congestion paths within the model are also identified by certain
colors throughout the building in this analysis. Tables 2.13 – 2.16 below show the
corresponding colors for each Level of Service (taken from Fuin’s30 data) for each
building components (walkways, stairs, queues, and platforms). The visualization
software allows the client to view the density of the spaces in the building throughout the

203
simulation. As another example of the capabilities of Myriad, through the use of
hesitation maps, Myriad can highlight areas where occupants may hesitate, change routes,
or require more information to direct them to a destination.
Table 2.13: Fruin data and corresponding colors for density on walkways used by the Myriad model (www.crowddynamics.com)
Area (sq m) Flow rate
LoS A > 3.24 < 23 pmm
LoS B 3.24 to 2.32 33 pmm
LoS C 2.32 to 1.39 49 pmm
LoS D 1.39 to 0.93 66 pmm
LoS E 0.93 to 0.46 82 pmm
LoS E < 0.46 < 82 pmm
Table 2.14: Fruin data and corresponding colors for density on stairs (www.crowddynamics.com)
Area (sq m) Flow rate
LoS A > 1.85 < 17 pmm
LoS B 1.85 to 1.39 23 pmm
LoS C 1.39 to 0.93 33 pmm
LoS D 0.93 to 0.65 43 pmm
LoS E 0.65 to 0.37 56 pmm
LoS E < 0.37 < 56 pmm

204
Table 2.15: Fruin data and corresponding colors for density in queues (www.crowddynamics.com)
Area (Sq. Metres) LoS A > 1.21 Free circulation
LoS B 1.21 to 0.93 Restricted circulation
LoS C 0.93 to 0.65 Comfort zone
LoS D 0.65 to 0.28 No-touch zone
LoS E 0.28 to 0.19 The Body ellipse
Table 2.16: Fruin data and corresponding colors for density on platforms (www.crowddynamics.com)
Danger Level 3.59 people per m2 Jam Capacity 2.15 people per m2 Desirable Max 1.08 people per m2
Lastly, Myriad can be used in conjunction with Simulex to test egress rates. This
is shown in figures 2.25 and 2.26 and allows the user to visualize movement throughout
the building.
Figures 2.25 and 2.26: Simulex and Myriad visualization output for the same building (courtesy of www.crowddynamics.com)

205
In certain situations, Myriad can be used to identify the most used spaces as well
as identify potential wasted spaces. This model can be applied to the design and
management of many different occupancies, such as car parks, road networks, people and
traffic, offices, sports stadia, malls, rail stations, and other complex spaces. The key
elements of Myriad as identified by Still are the following117:
• The speed that operators can produce results
• Ability to test different scenarios
• Ability to evaluate compliance with relevant building codes for both normal and
emergency use.
Output: Myriad assesses escape routes, times, number of interactions (delays), and
determines the exit capacity based on the existing building geometry.
Import CAD drawings: Yes, CAD drawings are used significantly with this model in
producing the network, spatial and egress route analyses. Once the CAD drawing is
imported into the model, the user must identify the scale of the building (this is done by
clicking on two points and entering in the distance for that line).
Visualization capabilities: Yes, this is shown in Figures 2.25 and 2.26. Myriad is a set
of tools able to show overall congestion/density points as well as individual persons
moving through the building (with the use of tools such as Simulex and STEPs).

206
Validation studies: Validation was performed on the model through the development of
Still’s PhD Thesis. Also much work has been performed in third party modeling with the
use of EXODUS, Simulex, etc.
Summary
This comprehensive overview of evacuation models covers details on 28 separate
evacuation and crowd movement simulation tools. However, due to lack of information
in the designated categories of interest for certain models, three models are included in
the review but will not be included in the following conclusion tables (Tables 2.17
through 2.19). These models are FPETool, Legion, and Myriad.
FPETool is not included in the tables due to the fact that it is not primarily an
evacuation model, but more so a total package fire model with an egress calculation. It is
included in the review for completeness. However, since FPETool lacks many of the
features that other egress models contained, it was determined unnecessary to include its
features in Table 2.17 through 2.19.
Also, Legion focuses primarily on crowd movement and behavior. Legion is
added to the review for completeness, but there is a lack of data on the model in the areas
outlined as important in this categorization. Because of the lack of data, this model will
not be added to the conclusion tables 2.17 through 2.19.
Lastly, since Myriad is very different from the other evacuation models, focuses
on crowd movement, and lacks information on the important categories outlined in the
review, it is also not included in the conclusion tables. Because of the difference in
modeling method as well as lack of detailed data on the inner workings of the model,

207
only the categories for which data was obtained are included in the Myriad write-up
section.
Tables 2.17-2.19 are included to organize the detailed data presented in Chapter 2
in an easy to use format. Table 2.17 details the overall organization of the categorical
data for each model. The abbreviations for Table 2.17 are explained here corresponding
to each category.
Purpose:
(1) Models that can simulate any type of building
(2) Models that specialize in residences
(3) Models that specialize in public transport stations
(4) Models that are capable of simulating low-rise buildings (under 15 stories)
(5) Models that only simulate 1-route/exit of the building.
Availability to the Public:
(Y): The model is available to the public for free or a fee
(N1): The model has not yet been released
(N2): The model is no longer in use
(N3): The company uses the model for the client on a consultancy basis
(U): Unknown
Modeling Method:
(M): Movement model
208
(M-O): Movement/optimization models
(PB): Partial Behavioral model
(B): Behavioral model
(B-RA): Behavioral model with risk assessment capabilities
Grid/Structure:
(C): Coarse network
(F): Fine network
Perspective of the model/occupant:
(G): Global perspective
(I): Individual perspective
Each model is categorized by both the perspective of the model and of the occupant. If
only one entry is listed in this column, both the model and occupant have the same
perspective.
Behavior:
(N): None
(FA): Functional analogy
(I): Implicit
(R): Rule-based
(C): Conditional
(P): Probabilistic

209
(AI): Artificial intelligence
Movement:
(UC): User’s choice
(D): Density
(FA): Functional analogy
(Ac K): Acquired knowledge
(P): Potential
(E): Emptiness of next grid cell
(ID): Inter-person distance
(Un F): Unimpeded flow
(C): Conditional
(OML): Other model link
Fire Data:
(N): The model cannot incorporate fire data
(Y1): The model can import fire data from another model
(Y2): The model allows the user to input specific fire data at certain times throughout the
evacuation
(Y3): The model has its own simultaneous fire model
CAD:
(N): The model does not allow for importation of CAD drawings

210
(Y): The model does allow for importation of CAD drawings
(F): This feature is in development
Visual:
(N): The model does not have visualization capabilities
(2-D): 2-Dimension visualization available
(3-D): 3-Dimension visualization available
Validation:
(C): Validation against codes
(FD): Validation against fire drills
(PE): Validation against literature on past experiments (flow rates, etc.)
(OM): Validation against other models
(N): No validation work could be found on the model
Tables 2.18 through 2.19 also organize data from Chapter 2, but specifically focus on the
special features of each model.

211
Table 2.17: Easy reference chart of egress models included in Chapter 2.
Model Purpose Available to public
Modeling Method
Grid/ Structure
Perspective of M/O
Behavior Movement Fire data
CAD Visual Valid
EVACNET4 1 Y M-O C G N UC N N N FD Takahashi’s
Fluid 1 N2 M-O C G N/FA FA-D N N 2-D FD
PathFinder 1 N3 M F I/G N D N Y 2-D N TIMTEX 4 Y M C G/I N D N N N PE
WAYOUT 5 Y M C G N D N N 2-D FD Magnetic Model 1 U M F I FA/I FA N N 2-D N
EESCAPE 5 N3 M C G N D N N N FD EgressPro 5 N2 M C G N D Y2 N N N
ENTROPY 5 U M/PB C G/I N Ac K, FA N N N OM STEPs 1 Y M/PB F I FA P, E N Y 3-D C
PED/PAX 3 Y/N2 PB C G I D N Y 2,3-D N EXIT89 1* N1 PB C I I/C(smk) D Y1 N N FD Simulex 1 Y PB F I I ID N Y 2-D FD,PE
GridFlow 1 Y PB F I I D N Y 2,3-D FD, PE ALLSAFE 5 N3 PB C G I Un F Y1,2 N 2-D OM
CRISP 1 N3 B-RA F I R/C, P E,D Y3 Y 2,3-D FD ASERI 1 Y B-RA F I R/C, P ID Y1,2 N, F 2,3-D FD*-
BFIRES- 2 4 N2/U B-RA F I R/C, P UC** Y2 N N N BldEXO 1 Y B F I R/C, P P, E Y1,2 Y 2,3-D FD
EGRESS 2002 1 N3 B F I R/C, P P,D Y2 N 2-D FD EXITT 2 Y B C I R/C C Y1,2 N 2-D N VEgAS 1 N2/U B F I AI ID Y1? Y 3-D N
E-SCAPE 1 U B C I R/C, P OML Y2 N 2-D N BGRAF 1 N1 B F I R/C, P UC? Y1,2 N, F 2-D? FD EvacSim 1 N1 B F I R/C, P D Y2 N N N
*Especially for high-rise buildings; **User specifies # of time frames, an occupant moves to a grid point during each time frame; *- Fire drills and sensitivity analyses on the model ? indicates that a category is unclear or unknown

212
Movement models: Table 2.18.1: Movement models
Characteristics/Model Magnetic
Model EESCAPE EgressPro ENTROPY STEPs
Avail to public U N3 N2 U Y Method Movement Movement Movement Movement/
PB Movement/
PB Structure Fine Coarse Coarse Coarse Fine
Perspective of M/O Individual Global Global G/I Individual People Beh FA/I None None None FA
Import CAD drawings N N N N Y Visual Simulation Y N N N Y
Counterflow N N N N N Manual exit block N N N N, Y with
improvements Y
Fire Conditions N N Y N N Defining Groups Y N N N Y
Disabl/Slow Occ grps Y N N N, Y with improvements
Y
Delays/Pre-movement (how)
Y N Y N Y
Rte. Choice 3 choices 1 route 1 route 1 exit Score Elevator use N N N N Y
Toxicity to occ N N N N N Impatience/Drive N N N N Y Occ Distribution UC – 3
choices 1 choice only 1 choice only 1 choice Score/user
chooses target Table 2.18.2: Movement models continued
Characteristics/Model Evacnet4 Fluid PathFinder TIMTEX WAYOUT Avail to public Y N2 N3 Y Y
Method Movement-O Movement-O Movement Movement Movement Structure Coarse Coarse Fine Coarse Coarse
Perspective of M/O Global Global I/G G/I Global People Beh None N-FA None None None
Import CAD drawings N N Y N N Visual Simulation N Y Y N Y
Counterflow N N N N N Manual exit block N N N N N Fire Conditions N N N N N Defining Groups N N N N N
Disabl/Slow Occ grps N N N N N Delays/Pre-movement
(how) N Y N N Y
Rte. Choice Optimal Optimal 2 Choices Split choice 1 route, flows merge
Elevator use Y N N N N Toxicity to occ N N N N N
Impatience/Drive N N N N N Occ. Distribution Optimization Optimization
from rooms and to exits
UC – 2 choices
User chooses flow split
1 choice only

213
Behavioral models: Characteristics/Model PED/PAX EXIT89 Simulex GridFlow
Avail to public Y/N2 N1 Y Y Method Partial Behavior Partial Behavior Partial Behavior Partial Behavior
Structure Coarse Coarse Fine Fine Perspective of M/O Global Individual Individual Individual
People beh Implicit Implicit/C (smk) Implicit Implicit Import CAD drawings Y N Y Y
Visual simulation Y N Y Y Counterflow N Y N Y
Manual exit block N Y Y Y Fire conditions N Y, CFAST N not yet N, only FED
input Defining groups Y N Y Y
Disabl/Slow occ grps Y Y Y Y Delays/Pre-movement
(how) Y Y Y Y
Rte. choice Quickest route, optimize, or follow signs
Shortest distance or user-defined
Shortest distance or altered distance
map
Shortest distance, random, or
user-defined Elevator use N N N N
Toxicity to occ N N N Y Impatience/Drive N N N N Occ. distribution 3 choices? 2 choices 2 choices 3 choices
Table 2.19.1: Behavioral models Characteristics/Model ALLSAFE CRISP ASERI BFIRES-2
Avail to public N3 N3 Y N2/U Method Partial Behavior B-RA Behavioral-RA Behavioral-RA
Structure Coarse F F F Perspective of M/O Global I I I
People beh Implicit Conditional Conditional Conditional Import CAD drawings N Y N, F N
Visual simulation Y Y Y N Counterflow N Y N N
Manual exit block N Y Y Y Fire conditions Y Y – not in drill
mode Y Y
Defining groups Y Y Y N Disabl/Slow occ grps N Y Y Y Delays/Pre-movement
(how) Y Y Y Y
Rte. choice All to 1 exit Shortest, user defined door
difficulty
Shortest or user-defined, then conditional
Conditional
Elevator use N N N N Toxicity to occ N Y – not in drill Y Y-smk tolerance
Impatience/Drive N N N N Occ distribution 1 choice Conditional Various Various
Table 2.19.2: Behavioral models continued

214
Behavioral Models cont.: Characteristics/Model EXODUS EGRESS EXITT VEgAS
Avail to public Y N3 Y N2/U Method Behavioral Behavioral Behavior Behavioral
Structure F Fine Coarse Fine Perspective of M/O I Individual Individual Individual
People beh Conditional Conditional Conditional AI Import CAD drawings Y N N Y
Visual simulation Y Y Y Y Counterflow N Y N N
Manual exit block Y Y Y Y Fire conditions Y Y Y Y Defining groups Y Y Y Y
Disabl/Slow occ grps Y – mobility Y Y N Delays/Pre-movement
(how) Y Y Y Y
Rte. choice Shortest, altered by local level and
attractiveness
Conditional Conditional User-dfnd/Cond
Elevator use N N N N Toxicity to occ Y Y N Y
Impatience/Drive Y N N N Occ distribution Conditional Various Various Various
Table 2.19.3: Behavioral models continued Characteristics/Model E-SCAPE BGRAF EvacSim
Avail to public U N1 N1 Method Behavioral Behavioral Behavioral
Structure Coarse Fine Fine Perspective of M/O I Individual Individual
People beh Conditional Conditional Conditional Import CAD drawings N N, F N
Visual simulation Y Y N Counterflow N N N
Manual exit block N N Y-locked doors Fire conditions Y Y Y – user Defining groups Y Y Y
Disabl/Slow occ grps N Y Y Delays/Pre-movement
(how) Y Y Y
Rte. choice Conditional Conditional Conditional Elevator use N N Y
Toxicity to occ N Y N Impatience/Drive N N N Occ distribution Various Various Various
Table 2.19.4: Behavioral models continued

215
CHAPTER 3: FOUR FACTORS OF EGRESS MODELING
There are many factors and influences that play a role in the evacuation of
building occupants. Gwynne discusses these in his SFPE article entitled “A Review of
the Methodologies and Critical Appraisal of Computer Models Used in the Simulation of
Evacuation from the Built Environment”33. Gwynne organizes the factors that influence
evacuation into the following categories:
• The configuration of the building/enclosure
• The procedures within the enclosure
• The environmental factors inside the structure
• The behavior of the occupants.
The evacuation components of each category are explained in the following paragraphs,
although they all interact and overlap with each other in any type of evacuation. The four
factors are eventually related to a hotel fire evacuation in Chapter 4.
Configuration of the building/enclosure involves what is traditionally covered by
the codes and standards, such as building layouts, number of exits, exit widths, travel
distances, etc. Gwynne proposes that occupants can commit behavioral violations to this
factor in a number of ways, for instance exit misuse, because they may be unfamiliar with
the building and without staff guidance to aid the evacuation. Another main issue that is
frequently studied with building configuration is the way people move throughout the
different components of the building, horizontal and nonhorizontal movement. Fruin30,
Nelson and Mowrer1, Pauls34, and Proulx3, to name a few, have studied this topic to
understand movement through building components, such as corridors, doorways,
stairways, etc. The speed of the occupants throughout all components of the building

216
relies on the density of the occupants they are traveling with. Nelson and Mowrer1 name
two regions of interest in horizontal components which are less than 0.54 p/m2 (signifies
maintaining the speed of the occupant’s choice) and greater than 3.8 p/m2 (signifies no
movement possible). The speeds associated with densities between these two values are
specified by the graph provided by Nelson and Mowrer1. Also, Ando151, for instance, has
researched the possibility of different speeds depending upon the gender and age of the
occupant.
Stairway movement, another configuration aspect of the building, also affects
movement of the occupants. Occupant speed is affected by the number of steps, the
angle of the stairway, depth of the tread, height of the riser, and the presence and location
of handrails on each side33. Proulx3 states that she found stairway movement to involve a
complex set of behaviors, such as resting, investigation, and communication. Stairway
movement is also affected by the amount of personal space needed per occupant, whether
or not a person is carrying another individual (such as a child or personal items), and the
agility of the person traveling either up or down a flight of stairs. People sometimes
become obstacles in the evacuation process, due to exhaustion or injury in very vital
components of the building. These people may play a role in delaying others to evacuate
the building in a timely manner. The configuration items should be accounted for in an
evacuation model, since they are important factors that lead to a successful evacuation.
Procedures of the enclosure involve configuration knowledge of the occupants,
training and activities of the staff, familiarity of the occupants with exit availability, and
alerting the occupants that a fire is occurring in the building. This factor takes the
building configuration one step further toward the understanding that occupants’

217
knowledge about a building affects their movements and decisions during evacuation.
Also, some occupants enter into a fire situation with previous evacuation experience from
other events, which may alter their decisions. The evacuation process is much easier if
the building is equipped with accurate exit signs, an adequate and informative alarming
system, as well as informed staff that are able to guide occupants to safety. Proulx129,130
has studied the use of voice alarm systems in high-rise buildings, to inform occupants of
a serious situation and mitigate occupants that ignore a loud and frequently sounding fire
alarm. It is essential for occupants to believe that the alarm is not false and understand
the seriousness of the situation.
The third factor of evacuation is the environmental situation inside the structure.
This involves the effects of heat, toxic and irritant gases, and smoke on an occupant’s
ability to navigate and make decisions. This aspect is highly lacking in the evacuation
models currently on the market. The reason for this is the difficultly for researchers to
know how people actually react in a real fire. As of now, we simply rely on post-fire
reports and/or experimental work done by Jin28 in the early 80s. Jin, in his studies in
Japan, performed experiments to see how far people could move in irritant smoke
produced from wood, but studies like that can no longer be performed on human subjects.
Gwynne states that during evacuation, smoke can perform a number of functions, such as
alert the occupant, inhibit the use of exit routes, reduce speed due to lack of visibility and
irritation, and expose people to narcotic and irritant gases, as well as heat.
The fourth factor is the behavior of the occupant, which involves group and social
affiliation, adoption of specific roles, responses to the indication of an emergency,
emergency travel speeds, and the ability to carry out desired actions33. Bryan, in his
218
research of residential fires131, studied the roles of individuals in a fire emergency. Men,
when compared to women, were more likely to investigate the fire and carry on fire
fighting activities, where the women were more likely to alert and gather others together
for the evacuation procedure. Gwynne states that these behaviors appear dominant in a
more domestic setting, such as places where the person has a more personal attachment to
the property and people. Also, an important aspect of the behavioral factor is the
perception of danger. This involves the kind of cues that alert the person to a dangerous
situation and if they accept these cues as serious enough to evacuate. Many times, a loud
fire alarm without voice communication will not cause an individual to evacuate,
especially late at night. If occupants perceive the situation to be dangerous, they are
more likely to leave the building. Many different evacuation models do not take these
kinds of specific behaviors into account during the egress. The closest that these have
come to modeling behavior involves the use of a delay time and specific occupant speeds
for genders and other occupant types, such as commuters or office staff. As the model
review in the Chapter 2 shows, certain models do take interactive behavior into account,
although the data to support such behavior is sparse.
The interaction of these four evacuation factors encompasses almost any building
evacuation. Evacuation models incorporate all four of these factors in varying
complexity. As more data is obtained in the field of human behavior in fire, these factors
can be expanded upon and represented in their true form.

219
CHAPTER 4: FOUR FACTORS OF EGRESS RELATED TO A HOTEL EVACUATION
Chapter 3 describes the four factors of egress, namely building configuration,
procedures of the structure, environmental conditions, and behavioral conditions. This
chapter aims to relate these four factors specifically to a hotel evacuation.
There are many different building types that require special considerations when
planning for an evacuation. Some examples of different buildings types are apartment,
business, dwellings, hotels, and mercantile88. In addition to building types, special
requirements are given to a high-rise building, regardless of building occupancy. In this
chapter, those factors that are related to a high-rise hotel building will be identified for a
thorough evaluation of the case study presented in this report. It is hypothesized that
evacuation models may account for some of these hotel factors, but most likely not all.
Building Configuration
As mentioned in Chapter 3, the first of the four factors of egress33 is the building
configuration. In comparison with other occupancy structures, hotels have very unique
building configuration issues that relate to egress.
Overall in the United States, there are 44,787132 hotels with a varying range of
building height. As building height varies with different hotels, so does the number of
guestrooms per floor. There is a high potential for a large number of people to be
contained in a high-rise hotel building.
Some other building configuration factors that relate to hotels are long
corridors/hallways through which the occupants must pass to reach the stairs and long
exit paths leading to the outside, in the case of taller buildings. In order to maximize the

220
space in the hotel and assure that all guestrooms have a scenic view (especially for high-
rises), many hotels are equipped with longer hallways. This can potentially provide
problems for unfamiliar occupants. In the adverse case where smoke enters these longer
hallways133, occupants can become confused and/or disoriented before reaching the
stairwell.
In many of the larger hotels, it is common to find different occupancies in the
same building. Such spaces can consist of guestrooms, restaurants, assembly spaces for
conferences, office spaces, casinos, and/or dance clubs. These add a considerable amount
of risk to a structure of guestrooms. The other occupancies provide additional ignition
sources, different levels of occupant commitment to certain activities, different
mechanisms for occupant alertness, and different levels of familiarity to the structure.
As Proulx mentions3, certain spaces offer different levels of visual access to the
fire/emergency. This visual access affects the occupant’s response to the fire, ultimately
affecting their delay time for evacuation. In the case of hotels, particularly guestroom
floors, the visual access is lessened due to the division of the floor space into individual
rooms. In the case of open office spaces, for instance, it is more likely that an occupant
will see a fire developing on their floor and react faster than in a more closed off space.
Since occupants are closed off into individual rooms, delay time may be increased.
Along the same lines, if there is a focal point in the space, for instance a stage or screen
in a movie theater, occupants are more likely to react in a timely manner. Both visual
access and focal points seem irrelevant and certainly lessened in hotel buildings, due to
the arrangement of guestrooms. Although, if the hotel is equipped with conference
rooms or other assembly spaces, these factors may contribute to a shortened delay time.

221
Procedures
During evacuation from a hotel building, the procedures of the hotel can affect the
occupants’ awareness, decision to evacuation, and resultant movement to the exit.
Unique to a hotel building, there is usually (for larger hotels) at least a limited staff
available 24 hours a day in the front lobby. Also, during the day, the hotel is equipped
with a cleaning and maintenance staff who are frequently stationed throughout the
building. These personnel can be key in alerting unsuspecting occupants of an
emergency. They can also be helpful in guiding occupants out of the building, if
necessary. Their actions depend on their training and responsibilities as established
before an emergency occurs.
For any evacuation, including hotel buildings, any previous experience and/or
training provided to the occupants can affect the decisions made during the evacuation36.
Also, the type of warning system affects decision making and movement during
evacuation. If occupants are staying at the particular hotel for the first time, they may not
be familiar with the sound of the alarm system. This could cause the occupants to ignore
the signal, search for other information, remain sleeping, and a variety of other activities
that delay evacuation. In the case of voice communication, the hotel has the opportunity
to provide further information than simply an available sound, which could further
decrease delay time3. In certain types of communication systems, both staff and fire
service personnel are able to provide specific messages to assist the occupant’s behavior
and definition.

222
Also, if an occupant is a frequenter of hotels with numerous false alarms, they
may be more susceptible to ignore any future signals.
A potential problem with hotel buildings is the unfamiliarity of the occupants with
the exit system. It is likely that occupants will exit the building the way that they came
in, which in the case of high-rise hotel buildings, would be the elevators. Without
looking on the back of the guestroom door or observing exit signs, occupants may not be
aware of the location of exit doors.
Environmental Conditions
Various sources of fire ignition occur in hotel occupancies, and create a number
of possible fire scenarios for designers. Beyond fire, since September 11, 2001, more
building owners and occupants are faced with other threats, such as bombs and chemical
agent release. These conditions pose different risks to personnel and require different
evacuation procedures, which are beyond the scope of this project.
As noted in the NFPA U.S. Fire Problem Overview report134, leading causes of
fire scenarios in hotels include the following:
• Suspicious (Incendiary)
• Cooking equipment
• Appliance (air conditioning, dryer)
• Smoking materials
• Other equipment
• Electrical distribution
• Open flame
• Natural Causes

223
The leading causes of fires involving death and injuries to civilians were smoking
materials and incendiary fires. For example, an occupant in a smoking room may fall
asleep with a cigarette in bed. Also, some suite hotels have a kitchenette area for
occupants to cook in. A fire scenario could occur in the cooking area. Hotels have many
different fire scenarios to plan for in a performance-based design. Statistics, such as
those provided by NFPA, may help to narrow down the scenarios by choosing those
which are most frequent and/or pose the greatest threat.
Along with including the fire ignition, fire models should also account for smoke
travel, blocked exits, blocked stairwells, heavy smoke in corridors, heat, narcotic gases,
and other factors that affect occupants during evacuation movement.
Behavioral Factors
The behavioral factors that affect a hotel evacuation are explained in three
categories: hotel occupant characteristics, pre-evacuation behavior, and behavior during
the evacuation.
First, the characteristics of the hotel occupants play a role in the evacuation of the
building. For instance, occupants with disabilities travel at a different speed and may
require additional assistance to evacuate the building. In certain circumstances,
occupants with disabilities can also affect the evacuation of other occupants in the
building. Able-bodied occupants have been known to assist disabled occupants135 or
remain with them until rescued by emergency personnel.
When evacuating high-rise buildings, occupant exhaustion can interfere with
movement, especially on the stairs. Occupants that are overweight, pregnant, older,

224
and/or that have certain health problems can suffer from mobility impairment on multiple
flights of stairs. These occupant characteristics have been identified as a possible delay
during evacuation, but have been difficult to quantify and simulate in current evacuation
models.
Lastly, carrying or wearing certain items alter movement during evacuation. It is
possible that occupants will carry personal items with them during movement to safety,
such as luggage, purse, or computers. Carrying items will reduce occupants’ speed as
well as take up room in the stairwell. Also, occupants who need to assist or carry
children alter their movement accordingly. The speed of primary social and cultural
groups is governed by the mobility of the slowest member of the group even in fire
evacuations136. During winter months, occupants will usually put on a coat before
evacuating, which can alter body size and movement. Although work has not been
documented on this topic, footwear could also play a role in occupant movement,
especially on stairwells.
During the pre-evacuation period, occupants are known to engage in certain
activities before beginning the evacuation3. Behaviors/factors that are relevant to hotels
include social affiliation, responsibility, and alertness. Social affiliation is the need to
join or reunite with certain individuals before beginning to evacuate. This behavior
could be prevalent with families in hotels. For instance, members of a family could be
engaged in separate activities away from each other at the time of emergency awareness.
It is likely that members of a family will try to reunite and find each other before
beginning movement to the exits137,138. Also, if an occupant is alone, they may try to find

225
other occupants to obtain additional information about the situation and to verify their
definition and behavior plans.
In a hotel, it is possible that occupants may feel responsibility for their own guests
and other occupants. If this is the case, they may perform certain activities if their
guestroom is in danger, such as alerting others and the fire department2. Lastly, the
alertness of the occupant affects behavior during the pre-evacuation period. In hotels,
occupants have the opportunity to sleep. During certain stages of sleep, it is more
difficult to awaken to the sound of a fire alarm115, which could possibly delay evacuation.
Also, if occupants are impaired by drugs or alcohol, reacting to an alarm is also impaired.
During the evacuation period, occupants have been known to engage in certain
behaviors. These are not all unique to hotel evacuations, because they can occur in a
range of building types. It is a possibility that occupants act differently when they are
alone versus when they are with a group of occupants. For some occupants, they decide
to remain in their guestrooms and engage in “protect in place” activities instead of
evacuating133. If occupants do decide to leave, they may have to move through smoke,
which would ultimately affect their behavior2. As stated earlier, there is not a great deal
of research in this area, but it is identified as an important factor.
During evacuation, occupants may encounter rescue personnel in the stairwells.
This affects stairwell movement. Even though counterflow has not been extensively
researched, some current models have the capability of estimating this factor. Also, with
fire fighter assistance, some occupants can evacuate via the elevators, which would affect
the numbers of occupants in the stairwell.

226
After evacuation has been completed, occupants of homes sometimes feel it is
necessary to reenter the building2. Occupants may want to return to their guestrooms for
personal items, luggage, or other items of value. This certainly puts the occupant in
grave danger, but is not modeled by any current evacuation models. It is unclear whether
or not this is a factor with hotel buildings.
These four factors of egress have now been related to what could occur in a hotel
evacuation. Some current evacuation models can incorporate various aspects of these
factors, but not completely. There are many aspects of each factor that remain untouched
in evacuation modeling, such as staff participation, health and mobility variables of the
occupants, social affiliation, and information transfer. This is primarily due to the fact
that the data to verify such behavior is lacking. With an increase in data gathering, these
factors may be included in evacuation modeling in the future.

227
CHAPTER 5: DESCRIPTION OF EXIT89 AND SIMULEX AND KEY FEATURES RELATING TO A HOTEL EVACUATION
In order to answer the first set of questions posed in this thesis, two specific
models are chosen and described in great detail, outlining the key features that enable
these to simulate a hotel evacuation scenario. The purpose of Chapter 5 is to provide
descriptions of each model in detail, as well as outline the features of each model that
allow the user to simulation a hotel evacuation scenario.
EXIT89 and Simulex are chosen as example models that are capable of simulating
a high-rise building evacuation. Also, both models are considered to be partial-
behavioral models, which is important for any comparison of the evacuation results (in
Chapter 9). Partial-behavioral models have similar inputs and capabilities, which puts
EXIT89 and Simulex on the same “playing field.” However, Simulex is a fine network
model and EXIT89 is a coarse network model. This distinction is important and
significant to study when analyzing difference in evacuation results.
The next section describes each model’s capabilities in detail and identifies key
features that relate to a hotel evacuation.
EXIT8971,72,73,74,75,76
EXIT89 is an evacuation model that has the capability of modeling large
populations located in high-rise structures. The model requires the user to input nodes
and arcs, but contains a variety of features that are not available from other node/arc
models, such as:
• Shortest travel route or a user-defined route
• The use of CFAST77 smoke data, user defined blockages, or none

228
• Body size of the individuals being modeled (Austrian, Soviet, or American)
• Emergency or normal travel speed
• Random delay or none and the minimum and maximum times for the delay
• The use of contra flows or none
• The modeling of disabled occupants and their percentage of the travel speed
compared to the rest of the occupants
• Up or down stair travel
These features are shown in Table 5.1 below.
Table 5.1: Input features of EXIT89 for each egress factor
Input Type User choices/input Building
Configuration Node and arc
positions Area each node (usable space)
Distance from node to node (arc)
Procedures User-defined route for certain occupants to exit
Shortest route chosen for all occupants
Environment Yes or No (CFAST data)
If yes to CFAST data – exits become blocked by
dense smoke Behavior – Body size
All American = 0.0906 m2
All Soviet = 0.113 m2
All Austrian = 0.1458 m2
Behavior – Speed
Emergency (as shown in Table 5.2/5.3 below)
Normal (as shown in Table 5.2/5.3 below)
Randomly distributed
response time
Minimum delay time (s)
Maximum delay time (s)
% of population to delay
OR Constant response delay for each node
Amount of time specified for each node that occupants delay before beginning evacuation
Additional inputs –
Counterflow
Yes or No Time at which effect occurs
Fraction of node occupied by
opposite flow Occupants with
disabilities # of disabled occupants
for each node % of able-bodied speed each disabled occupant
will travel Stair Travel Up Down

229
In EXIT89, occupants can evacuate following the shortest route or other defined
routes. As such, routes can be identified that may be familiar to the occupants, yet
involve an increase in the distance traveled. Fahy71 states that choosing the shortest
evacuation route is more appropriate for a well-trained population or a population that is
assisted by well-trained staff. The shortest route calculation used in EXIT89 uses an
algorithm that identifies the origin of the network and then fans out from the origin.
EXIT89 calculates the shortest routes on each floor to the stairways or to an area of
safety. Fahy acknowledges that an advantage of this approach is that if a node becomes
blocked by smoke, the model recalculates only the routes on that floor, instead of the
routes throughout the entire building. If a stairway node is blocked, the routes on that
floor and the floor above are recalculated so that as occupants encounter the blockage,
they choose another route to travel down to an exit of the building.
EXIT89 allows more than one node to be blocked at a time. The user can also
input data from CFAST77, such as smoke densities and the depths of the smoke layer,
which must be recorded in time steps of 5 s. Entering smoke blockages without CFAST
output requires that the name of the blocked node and the time from the start of the
evacuation that the blockage occurs be identified.
If CFAST data is used in the evacuation model, EXIT89 calculates S, the
psychological impact of smoke by using equation (5.1):
HDODS ⋅⋅= 2 (5.1)
Where OD=optical density of the smoke in the upper layer (m-1)
D =depth of the upper layer (m)
H =height of the ceiling (m)

230
A value of S > 0.5 m-1 is used to block a node113. In order to interface CFAST
with EXIT89, each CFAST compartment needs to correspond with a node in EXIT89.
Data of the three body sizes included in EXIT89 are from Predtechenskii and
Milinskii31 for Soviet body sizes, Ezel Kendik139 for Austrian body sizes, and the
Occupational Safety and Health in Business and Industry (no reference could be found)
for American body sizes. These three references give body values in various conditions,
indicating differences between genders, age, and with various layers of clothing. Mean
values of each population are provided in EXIT89. Because Austrian values give the
largest body size, Fahy notes that simulations with Austrian values result in the longest
evacuation times under crowded conditions. Fahy71 suggests that simulations should be
conducted with all three body sizes to obtain a range of results for a given building.
EXIT89 uses formulas from Predtechenskii and Milinskii31 to determine walking
speeds as a function of the density of the occupants. Density is first obtained by
multiplying the number of people in the stream by the horizontal projection of the person
(related to body size) and dividing that value by the width multiplied by the length of the
stream (the area of the stream), resulting in a density in units of m2/m2.
EXIT89 uses the velocity correlations for horizontal paths, down stairs and
upstairs, depending upon the density calculated in each movement situation.
Horizontal Paths:
(m/min) (5.2)
for density: 92.00 ≤< D
Down Stairs (↓):
↓↓ =VmV (m/min) (5.3)
where )224.061.5sin(44.0775.0 39.0−⋅+= ↓
−
↓↓ Dem D
57217434 380 112 23 4 +−+ − = DD D D V

231
Up Stairs (↑):
↑↑ =VmV (m/min) (5.4)
where ↑↑ ⋅+= ↑ Dem D 7.15sin09.0785.0 45.3 for ;6.00 << ↑D
where )57.185.7sin(10.0785.0 +−= ↑↑ Dm for 92.06.0 ≤≤ ↑D
EXIT89 uses tables of velocities (based on occupant densities) for normal,
emergency, and comfortable movement along horizontal paths, openings, and stairways.
It should be stated that Predtechenskii and Milinskii’s data originated from observations
of people in different circumstances and perception of risk, which is the reason for
conditions such as emergency and normal speed data. Predtechenskii and Milinskii
omitted fire conditions of visual obscuration by smoke and physiological conditions of
heat exposure to occupants or structural damage to horizontal or vertical means of egress.
The condensed tables for emergency and normal speeds are shown in Tables 5.2 and 5.3
for all three building components.
Table 5.2: Speed vs. density relationship throughout horizontal components and doorways
Horizontal Components Through Doorways Density (m2/m2) Emergency
speed (m/s) Normal Speed
(m/s) Emergency speed (m/s)
Normal Speed (m/s)
0.01 1.36 0.9145 1.58 1.06 0.1 0.95 0.65 1.17 0.81 0.2 0.664 0.47 0.85 0.60 0.3 0.50 0.36 0.65 0.47 0.4 0.41 0.30 0.516 0.38 0.5 0.36 0.275 0.43 0.33 0.6 0.33 0.258 0.37 0.29 0.7 0.30 0.24 0.31 0.25 0.8 0.25 0.20 0.26 0.22 0.9 0.19 0.16 0.20 0.17 0.92 0.175 0.15 0.19 0.16
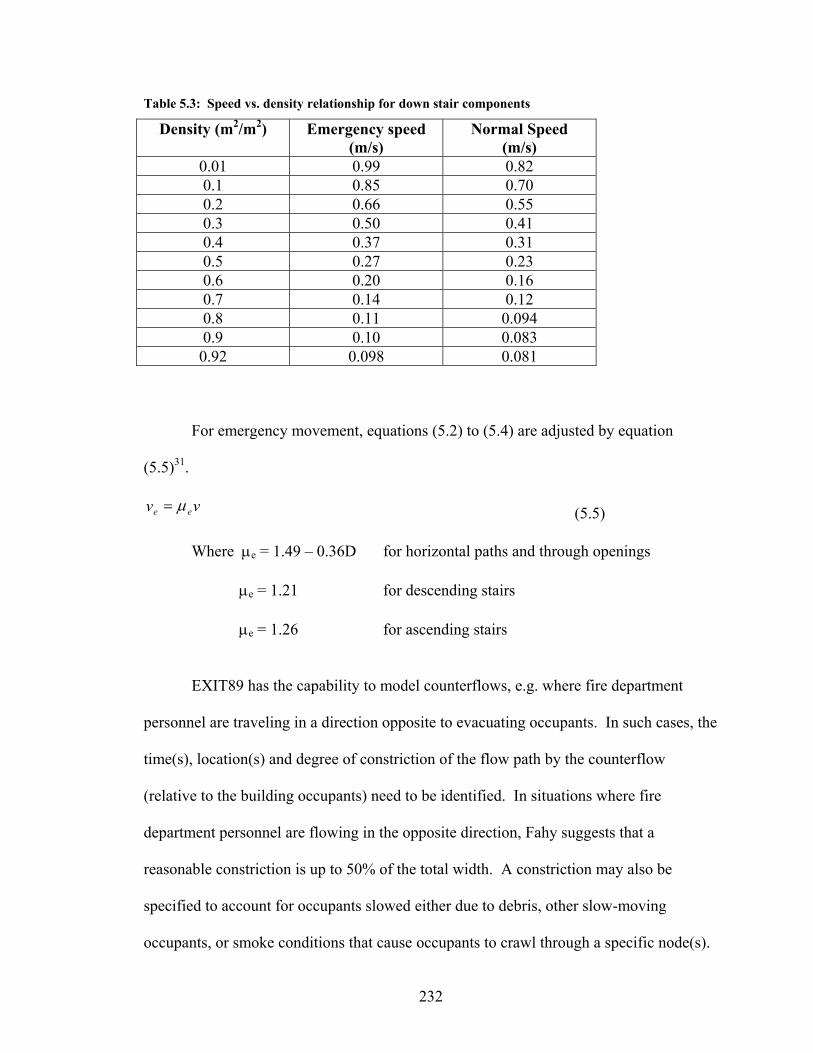
232
Table 5.3: Speed vs. density relationship for down stair components
Density (m2/m2) Emergency speed (m/s)
Normal Speed (m/s)
0.01 0.99 0.82 0.1 0.85 0.70 0.2 0.66 0.55 0.3 0.50 0.41 0.4 0.37 0.31 0.5 0.27 0.23 0.6 0.20 0.16 0.7 0.14 0.12 0.8 0.11 0.094 0.9 0.10 0.083 0.92 0.098 0.081
For emergency movement, equations (5.2) to (5.4) are adjusted by equation
(5.5)31.
(5.5) Where µe = 1.49 – 0.36D for horizontal paths and through openings
µe = 1.21 for descending stairs
µe = 1.26 for ascending stairs
EXIT89 has the capability to model counterflows, e.g. where fire department
personnel are traveling in a direction opposite to evacuating occupants. In such cases, the
time(s), location(s) and degree of constriction of the flow path by the counterflow
(relative to the building occupants) need to be identified. In situations where fire
department personnel are flowing in the opposite direction, Fahy suggests that a
reasonable constriction is up to 50% of the total width. A constriction may also be
specified to account for occupants slowed either due to debris, other slow-moving
occupants, or smoke conditions that cause occupants to crawl through a specific node(s).
v v e e µ =

233
The number of stairways in the building must be specified as well as the direction
occupants are expected to evacuate (up or down stairwells, with only one direction being
modeled in a single simulation). Upstairs movement may be of interest if evacuation
from a sub-grade level or movement to a roof for helicopter rescue is of interest.
The only behavioral aspect of EXIT89 relates to pre-evacuation time of
occupants, i.e. the time delay before occupants begin evacuation. Evacuation by
occupants can begin simultaneously or be delayed by a specified amount of time. Delays
can be set for a node and additional delays can be specified for particular occupants to
implicitly account for pre-evacuation activities such as investigating the fire, alerting or
assisting others, or gathering personal belongings. A compilation of limited data to
support the provision of a particular time delay for all or a portion of occupants is
provided by Proulx and Fahy140.
Information required to describe each node in EXIT89 includes usable floor area,
height of the ceiling, node capacity, initial contents, number of disabled occupants, the
delay time before occupants begin evacuation, and the node the occupants will move to
next if a user-defined route is selected. EXIT89 uses an individual perspective to track
individuals as they move throughout the building by recording occupants’ locations at set
intervals in time. Disabled occupants beginning at a node are identified by specifying a
velocity reduction factor. For each arc, users must include the distance from the center of
the node prior to the restriction, the width of the opening between the nodes, and the
distance from the restriction to the center of node after the restriction. EXIT89 expects
the user to include the diagonal distance of travel along stairways. In EXIT89, the arcs
are always bi-directional.

234
Features of EXIT89 that are Specific to a Hotel Evacuation
To represent the building configuration, EXIT89 uses node and arcs to layout the
space. Depending upon the type of space in the building (guest room vs. hallway), space
identification into nodes can be complicated. Certain hotels can have a large number of
guest rooms, which can be assigned one node for each room. On the other hand, hotels
can have uniquely long hallways with which the user has to choose the number of nodes
to place within that hall. The more nodes placed within a space, the more accurate the
building representation, and the more time involved in the set-up of the input file.
EXIT89 allows the user to define routes for certain individuals during the
evacuation to represent certain procedures of the simulation. This input option can be
used to simulate the possibility of hotel staff traveling to guestrooms to alert occupants.
This is certainly unlikely during the night, especially with a limited staff on hand. The
user-defined option can also be used for guests who are unfamiliar or who attempt to
perform alerting, searching, or notification behavior. Lastly, this option can be used for
family members that need to search for each other or friends in the hotel before
evacuating.
To represent the fire environment, EXIT89 allows the user to introduce CFAST
results or fire conditions over time to the simulation. This option will block certain exits
if they become overcome by smoke, which presents a more realistic evacuation scenario.
The user may choose to exercise this option in a complex hotel building with many exit
choices.

235
Lastly, EXIT89 allows the user to choose a body size and occupant speed
condition to implicitly represent behavior in the model. Most important to a hotel
situation, the user can also include occupants with disabilities and counterflow issues.
Counterflow of firefighters can affect an evacuation scenario of a hotel, especially with
high-rise hotel buildings. Firefighters usually take up a certain percentage of one of the
exit stairs for a certain period of time during the evacuation. EXIT89 allows the user to
incorporate such activities during the simulation.
Simulex78,79,80,81,82,83,84,85
Simulex is an evacuation model that has the ability to analyze the egress of a large
number of people from a large, geometrically complex building. Simulex generates a
two-dimensional building network from CAD drawings of each floor level. Unlike
EXIT89, Simulex does not require node connections, i.e. arcs, to be defined. Instead,
Simulex uses a “fine grid” to identify movement paths. The input required for the model
includes:
• Floor plans via CAD drawings
• Connection of floor levels via identification of stairways or ramps
• Location of occupants throughout building spaces.
• Population movement characteristics: occupant type (commuters, shoppers,
office staff, or school populations, identifying mixture of adults, children and
elderly); gender (occupant groups may be all male or all female), age (all
occupants may be children or elderly people), choosing a specific travel speed
for all occupants, or a mixture of characteristics defined by user.

236
• Mean delay time to be randomly, triangularly, or normally distributed
throughout the occupants of the building.
• Distance maps allowing all exits to be accessible or considering blocked exits.
These features are shown in Table 5.4 below.
Table 5.4: Input features of Simulex for each egress factor
Input Type User choices/Input Building
configuration Import CAD files Stair distance Stair width
Procedures Shortest route Blocking exits from certain occupants
Environment Blocking exits from certain occupants Behavior – body types
Male Female Children Elderly Median
Behavior – populations
All 1.0 m/s (speeds)
Office Staff Commuters Shoppers School Children
Response delay
Mean delay time (s) (+ or -) ___ seconds of time for delay
3 distributions: random, triangular, or
normal
The distance map consists of 0.2 by 0.2 m spatial blocks and represents a “low-
resolution” form of the total building space. These maps are used to direct occupants to
the closest available exit, where each person moves toward an exit by taking the direction
that is perpendicular to the constant-distance contours from the exit. Simulex allows the
user to calculate up to 10 different distance maps consisting of different exits and links
being open or blocked to different occupants throughout the building. A specific distance
map could be useful for simulating a certain group of occupants who are familiar with the
building and may travel to an exit that is farther away.
Assumptions included in Simulex that affect the results of the comparison involve
movement speed and overtaking. Each person is assigned a normal, unimpeded walking
speed until the speeds are reduced by the closeness of other occupants, obstacles, and/or

237
walls of the building. Simulex uses a relationship between walking velocity on level
pathways and inter-person distance80.
The occupants walking speed is a function of inter-person distance. An example
of the data used for this movement is shown in Figure 5.1.
Figure 5.1: Example graph of inter-person distance vs. velocity (79, page 3)
The walking speed of an occupant is dependent upon the proximity (or distance
away) from the people ahead. The inter-person distance is defined as the distance
between the center of the bodies of two individuals. The best-fit equation for the
example graph above is shown here as Equation 5.6:
v V sin 90d bt bu
d= × ×
−−
where b d td≤ ≤ (5.6)
v Vu= where d td>
Where: v is the impeded walking velocity (m/s), Vu is the unimpeded (normal)
walking velocity (m/s), d is the inter-person distance (m), td is the threshold
distance (1.6 m), and b is the body depth (torso radium).

238
Rb
Rt
Rs
The walking velocity down stairs is restricted to 0.6 times the normal unimpeded velocity
assigned to each body type.
The normal unimpeded walking velocity and body size for each body type is
assigned either by the program or the user, if the user prefers a different value79,84.
Examples of body types are shown in Table
5.5. The unimpeded walking velocity is
also assigned a +/- value among the members
of the group. For instance, the male body
type is assigned an unimpeded velocity of
1.35 m/s +/- 0.2 m/s as a variation in speed
among the members in the group.
A plan view of the body profile of
each person is represented as a mixture of
three circles as indicated in Figure 5.2. Each
body consists of a center torso circle and two
shoulder circles. Simulex contains a variety of different body types (of which 5 are
shown in Table 5.5), containing different dimensions of the body radius, torso radius, and
the shoulder radius. The five different body types highlighted here are median, male,
female, child, and elderly, and are used in the comparison runs performed for this thesis.
Inter-person distance is measured from the center of one body to the center of another.
Figure 5.2: Body Profile used in Simulex (79, p. 5)
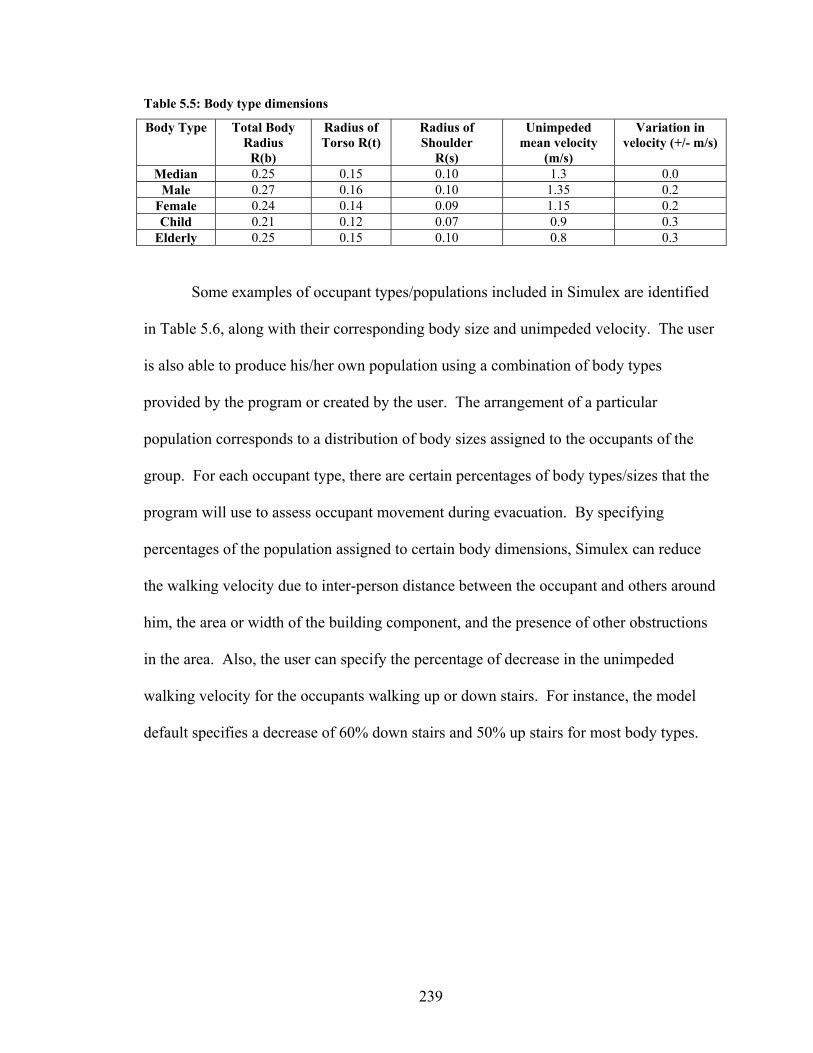
239
Table 5.5: Body type dimensions
Body Type Total Body Radius
R(b)
Radius of Torso R(t)
Radius of Shoulder
R(s)
Unimpeded mean velocity
(m/s)
Variation in velocity (+/- m/s)
Median 0.25 0.15 0.10 1.3 0.0 Male 0.27 0.16 0.10 1.35 0.2
Female 0.24 0.14 0.09 1.15 0.2 Child 0.21 0.12 0.07 0.9 0.3
Elderly 0.25 0.15 0.10 0.8 0.3
Some examples of occupant types/populations included in Simulex are identified
in Table 5.6, along with their corresponding body size and unimpeded velocity. The user
is also able to produce his/her own population using a combination of body types
provided by the program or created by the user. The arrangement of a particular
population corresponds to a distribution of body sizes assigned to the occupants of the
group. For each occupant type, there are certain percentages of body types/sizes that the
program will use to assess occupant movement during evacuation. By specifying
percentages of the population assigned to certain body dimensions, Simulex can reduce
the walking velocity due to inter-person distance between the occupant and others around
him, the area or width of the building component, and the presence of other obstructions
in the area. Also, the user can specify the percentage of decrease in the unimpeded
walking velocity for the occupants walking up or down stairs. For instance, the model
default specifies a decrease of 60% down stairs and 50% up stairs for most body types.

240
Table 5.6: Occupant types with corresponding body size and velocity
Occupant Type % Median
% Male
% Female
% Child
% Elderly
Body Size (m2)
**Initial Velocity m/s
All Elderly 0 0 0 0 100 0.113 0.8 (+/- 0.3) All Male 0 100 0 0 0 0.130 1.35 (+/- 0.2)
All Female 0 0 100 0 0 0.101 1.15 (+/- 0.2) All Children 0 0 0 100 0 0.070 0.9 ( +/- 0.3) All 1.0 m/s 100 0 0 0 0 0.118 1.0
All 1.2 m/s SFV 100 0 0 0 0 0.130 1.2 All 1.3 m/s 100 0 0 0 0 0.118 1.3 All 1.4 m/s 100 0 0 0 0 0.118 1.4 Office Staff 0 60 40 0 0 Multiple Range Commuters 0 50 40 10 0 Multiple Range Shoppers 0 35 40 15 10 Multiple Range
School Children 0 3 7 90 0 Multiple Range
Simulex accounts for rates of body twisting and overtaking during evacuation.
The value used by Simulex for the rate at which individual people can twist or turn for an
able-bodied person is 100 degrees/s141. Thompson and Marchant suggest that the rate of
body twist has a “significant effect on the overall rate of groups of people as they move
through exit openings”81. Overtaking occurs if the obstructing person is traveling in both
the similar and opposing direction of the assessing person. Simulex uses calculations for
overtaking that are based on the assumption that the passing person moves around the
obstructing person, avoiding contact by a minimum of 50 mm. Thompson, Marchant,
and Wu82 reference Bryan to state that 50 mm is the nominal value for body sway during
forward movement.
Features of Simulex that are Specific to a Hotel Evacuation
Unlike EXIT89, Simulex allows the user to import actual floor plans from a CAD
program to represent the building configuration. By using CAD drawings, Simulex can
“see” the building in its entirety, including all walls, obstructions, door openings, etc.

241
The program places a 0.2 m by 0.2 m grid over each floor plan which the occupants will
follow to evacuate the building. The use of CAD drawings and fine network models is
very convenient and more accurate for complex buildings, such as hotels. Hotels have
complex spaces, especially those hotels equipped with meeting spaces, kitchens, fitness
centers, guest rooms, etc. With this method, the floor plan is more accurately represented
in the model.
In order to simulate certain procedures during the evacuation, the user has the
capability of blocking certain exits from particular groups of individuals, which will
cause them to automatically go to the next closest, available exit. This is similar to the
method of a user-defined route for the occupants, and is performed by altering the
distance map of the particular group of occupants. Also, altering the distance map is
another way of simulating occupants that are unfamiliar with the building and may be
likely to travel to a farther, more familiar exit rather than the shortest distance route. This
is a valid choice for simulation of a hotel because many of the guests are unfamiliar with
their surroundings.
Simulex does not currently have the capability of simulating the fire environment.
The developer of the model is working to provide this capability.
Lastly, behavior is also implicitly simulated with Simulex. By choosing an
occupant characteristic/population, a corresponding body size and unimpeded velocity
are assigned to each individual. Speed is then decreased by interpersonal distance and
distance away from walls and obstacles throughout the building. There is no specific
behavioral simulation available in Simulex that would aid in the modeling of a hotel
building.

242
CHAPTER 6: USING EXIT89 AND SIMULEX IN A PERFORMANCE-BASED DESIGN
Performance-Based Design Process
Many times in a performance-based design, an engineer will compare the results
from an evacuation model with the results from a fire model to assess whether or not the
occupants can escape without succumbing to untenable conditions. It is usual that,
although there are many different types of evacuation models to choose from, only one
model is selected to run all of the evacuation simulations in this type of analysis.
Another alternative used by engineers, although rare, is to select an evacuation model that
is also equipped with fire model capabilities. In either method, the quantification of life
safety for the building is essentially a comparison of ASET vs. RSET. ASET is known as
the available safe egress time and defined as the “time when fire-induced conditions
within an occupied space or building become untenable”1. RSET, on the other hand,
stands for required safe egress time, and should be shorter than ASET to maintain life
safety from a fire. RSET is defined by Equation (6.1):
RSET = td + ta + to + ti + te (6.1) Where
td = the time from fire ignition to detection
ta = the time from detection to notification of the occupants
to = the time from notification until occupants decide to take an action
ti = the time from decision making to the start of evacuation
te = the time from the start of the evacuation until the end

243
The first two RSET times, td and ta involve initial detection and cues made
available to the occupants in a variety of ways. One method involves building hardware,
such as detection and alarm devices. Another could involve the method of human
detection, discovery, and/or response to the fire. Any other primary cue or indication of
fire is also included in these times, such as hearing the sirens of fire trucks, hearing,
seeing, and/or sensing fear from other occupants, receiving information from external
sources/family, etc.
The third and fourth RSET times, to and ti involve the processing of the initial and
subsequent cues before beginning evacuation. During this time period, occupants are
evaluating and responding to the cues presented to them due to the fire emergency.
Lastly, te involves the actual movement of the occupants to evacuate or remain in
their area of refuge, if fire conditions are untenable and impossible to traverse through. A
variety of calculation methods are available for this piece of RSET, such as hand
calculations1, evacuation models, and graphs19. While these calculation methods are
based on a variety of movement data, obtaining delay times for occupants in different
types of buildings has been difficult.
Another very similar way of labeling the RSET times is shown by Figure 6.1
taken from the SFPE Guide to Human Behavior in Fire142:
Figure 6.1: Timeline of the evacuation process (142, p. 1)
244
After fire development and/or cue initiation, the process referred to as cue
validation acts as a recurring cycle during the decision-making period. This cue
validation process is similar to the to and ti times from the RSET equation (6.1). During
this period, occupants are continually faced with cues that require that they recognize and
interpret the cue in order to make decisions and act. Occupants interpret different cues
with varying levels of severity, which in turn is reflected in the types of decisions that
they make during this period. For instance, if the occupant receives a fire alarm sound as
a cue, they will often recognize the sound to be a fire alarm. However, if they witness
many false alarms in their building, they may not interpret the alarm as an actual fire. In
this dangerous case, the occupant in question may decide to ignore the alarm and
continue to perform the action that they are already involved in. In another example, an
occupant may receive a cue in the form of smoke seeping through their bedroom door.
The occupant could recognize the cloud to be smoke and interpret the situation as
dangerous. In this case, the occupant will quite possibly decide to gather her family and
leave the house immediately. These are two very different situations, both following the
same cue validation process displayed in Figure 6.1.
As mentioned earlier, it is likely that the engineer working on a performance-
based design will run separate fire and evacuation models to compare ASET and RSET
for life safety evaluation of a building. An example of a need for design change is when
a fire model states that the smoke layer will descend to a dangerous level in
approximately 4 minutes (ASET), and the evacuation time for the building has resulted in
a range of 3-6 minutes (RSET). Since this paper focuses mainly on evacuation modeling,
only the RSET period is discussed. During the evaluation process, the engineer strives to

245
simulate a variety of fire/evacuation scenarios in order to bound the evacuation results.
This method attempts to anticipate a variety of feasible fire scenarios that could initiate
an evacuation over the lifetime of the building.
In the egress simulations, especially when a separate fire model is run to compare
results, the two main types of inputs are varied in the bounding analysis. These are
building characteristics and occupant characteristics. This leaves the egress simulations
to focus only on three of the four factors of egress; building configuration, procedures,
and behavior of the occupants. If some models contain the capability, it is possible for
the engineers to incorporate the environmental factor into the egress simulations. For
instance, if the fire model predicts heavy smoke and/or high levels of concentration in
certain areas of the building at specific time periods, some evacuation models allow the
user to block exits or stairways at a certain time during the simulation. Overall, it is
common that the building configuration remains constant, since by this time, the design
has been well-defined architecturally. And, since the occupant characteristics have a
greater uncertainty, they are modified to produce several different egress input scenarios
in order to bound evacuation results. Some evacuation models assign their occupant
characteristics and behaviors probabilistically, and with the Monte Carlo technique, can
automatically run a series of scenarios and produce a range of evacuation results.
Examples of occupant characteristics that can vary between simulations and affect
evacuation results include the following list:
• Age
• Gender
• Number of occupants in the building

246
• Walking speed
• Body size
• Route choice
• Initial location of occupants in the building
• Delay or Pre-evacuation time
An attempt is made to anticipate design scenarios for a hotel building. Also an input
matrix involving the characteristics listed above is created for each scenario using the two
featured evacuation models, EXIT89 and Simulex.
Overview of the Input Matrix for Each Model
There are similarities and differences in the input options between EXIT89 and
Simulex for each of the four factors of egress. For the building configuration, EXIT89 is
a coarse network model and Simulex is a fine network evacuation model. A coarse
network model requires the user to input the configuration of the building as a series of
nodes and arcs throughout the spaces. A node represents a room or section of a room.
Traveling between nodes is performed via arcs connecting these nodes. Simulex, on the
other hand, features a fire network which separates the entire floor plan into a series of
grid cells 0.2 m by 0.2 m in length. Occupants, using the fire network technique, move
from one grid cell to another, instead of one node to another. Simulex requires only that
the user import a CAD drawing of each floor, with which the model then overlays a grid.
The fine network technique allows the model to more accurately “see” the building
configuration through which the occupants will move.

247
For the procedures of the evacuation simulation, both models allow the user to
choose either the shortest route option or a user-defined route. The user-defined route is
input into each model differently, but the result is the same. This allows the user to move
occupants to a defined exit, even if the occupants pass by a closer exit. The user-defined
route method is helpful in situations where the user is interested in simulating occupants
who are familiar only with the main exits of a building.
For the environmental factor, only EXIT89 allows the user to input results from a
previously run fire model. In this case, the model used by EXIT89 is CFAST77.
Currently, this option is not available to users of Simulex. Also, neither of these models
incorporates manual blocking of an exit or stair by the user at specific time periods
during the simulation. This technique can be used to simulate untenable conditions
predicted by a separate fire model.
Lastly, there are multiple options available to users under the behavioral category.
Both EXIT89 and Simulex are considered to be implicit behavioral models33. An
“implicit” label represents those models that attempt to model behavior implicitly by
assigning certain response delays or occupant characteristics that affect movement
throughout the evacuation. Instead of occupants following specific behavioral rules, they
are primarily assigned a random delay time from a user-defined distribution. The
purpose of this input is to implicitly represent pre-evacuation decision-making and
activities. The user specifies a certain characteristic of the delay distribution for each
model, which results in the assignment of a delay time to each individual simulated by
the model. EXIT89 allows the user to specify an overall distribution to the population
and/or assign individual delay times to specific nodes. Simulex, on the other hand,

248
assigns delay times to the population via three distributions; random, triangular, and
normal.
Also under the behavioral factor, each model allows the user to specify certain
occupant characteristics that affect occupant movement and speed throughout the
evacuation. EXIT89 allows the user to choose between 3 different body sizes; American,
Soviet, or Austrian (listed from smallest to largest body). Also, the user chooses between
emergency or normal movement speeds. Although these seem to be a variety of choices
for the simulated population, these characteristics, once chosen, automatically apply to
the entire building population. On the other hand, occupant characteristics can be chosen
for groups within the building population when using Simulex. Each body type
corresponds to a particular body size and unimpeded walking speed. Users of Simulex
can choose characteristics provided by the model (speeds ranging from 0.5 m/s to 1.4
m/s) or create a population of their own. Simulex allows the user to place a variety of
body sizes and unimpeded walking speeds throughout the building in order to more
accurately represent a realistic situation.
Lastly, additional inputs provided by the models are simulating occupants with
disabilities and counterflow. Both models have the capability of simulating occupants
with disabilities, but in different ways. For the EXIT89 model, the user must specify the
number of occupants for each node and their respective percentage of able-bodied speed.
From data collected in Ulster143, it can be seen that the percentage of able-bodied speed
can differ depending upon the building component, such as horizontal, ramps, and stairs.
Because of this, the user can present an average percentage over multiple building
components. Simulex, on the other hand, allows the user to input the actual unimpeded

249
speed of the disabled population on horizontal components, the variation in this speed
(+/- m/s), the multiplication factor walking down stairs, and the multiplication factor
walking up stairs. Simulex allows the user to input more detailed data on the created
population. Finally, the counterflow option provides a limited method of simulating
opposing flow throughout the building. EXIT89 simulates counterflow by simulating a
percentage of the node blocked over a specific amount of time during the evacuation.
Fahy recommends no more than a 50% decrease due to firefighter counterflow76.
Simulex, on the other hand, can handle only horizontal opposing flow for the hotel
simulation. A simulation was attempted where a firefighter would begin on the ground
floor and move to the top floor for a rescue. The model was unable to handle vertical
counterflow, and after traversing 1 story, the firefighter became an obstacle stuck in the
stairwell.
Table 6.1 is used to represent the possible input variables available to users of
each model, EXIT89 and Simulex. These variables are used to represent best and worst
case hotel scenarios for a hotel building. The examples of fire scenarios are created in
order to show how an engineer would bound evacuation results for a particular building
using these two evacuation models. The best and worst cases are used here only as
examples for the engineer, not as a rule for all hotel buildings.

250
Table 6.1: Input choices for each model, EXIT89 and Simulex
Input Type User input – EXIT89 User input - Simulex Building
Configuration 1-? nodes in hallway; 1 node
per guestroom DXF files
Procedures User-defined routes or shortest distance
Blocking exits or shortest distance
Environment CFAST data (yes, no) N/A Behavior – Body size
American, Soviet, or Austrian Choice of 28 body types to create own population
Behavior – Speed
Emergency or Normal 0.5 m/s – 1.4 m/s; or another value chosen by user
Randomly distributed delay time
Minimum and maximum delay time (s); or ___ (s) for each
node
Mean delay time; +/- (s)
Additional inputs –
Counterflow
% of node blocked by counterflow (0-100%); Time
that effect occurs
N/A for vertical counterflow
Occupants with disabilities
# of disabled occupants for each node; % of able-bodied
speed traveled
# of disabled occupants for the building; 0.49 m/s – user
defined speed
Examples of Evacuation Scenarios for a Hotel Building
The following fire evacuation scenarios are used as examples of possible best and
worst case scenarios used to bound the evacuation results:
• Fire initiating in a guestroom on Floor 15 during the nighttime hours in the winter
season (cigarette ignition on a mattress)
• Fire initiating in the kitchen on the ground floor during the evening hours in the
winter season (cooking equipment)
• Fire initiating in the conference room area in the lower levels of the hotel during
daytime hours in the spring season (electrical fire)
• Fire initiating in the laundry area in the lower level of the hotel during the evening
hours of the winter season (mechanical cause or incendiary)
• Fire initiating in a guestroom on Floor 5 during the daytime hours in the summer
season (air conditioning unit failure)

251
• Fire initiating in electrical wiring on the ground floor away from occupants or staff
immediate discovery during the nighttime hours in the winter season
All fire causes were taken from NFPA’s “Selections from the U.S. Fire Problem
Overview Report Leading Causes and Other Patterns and Trends Hotels and Motel”134.
These scenarios range from nighttime to daytime, winter to summer, and different levels
throughout the hotel building.
The inputs that would essentially change from one scenario to another would be
body size, response time, occupant routes, initial position of occupants on the floor,
building population numbers, and speeds. Body size can change due to the season and
weather. Occupants with coats and heavier clothing can take up more room in hallways,
smaller rooms, and stairwells, possibly causing a slower evacuation time. Response
times in the simulations would change due to the time of day and activity being
performed by the occupants before notification. During the nighttime scenarios, time
would have to be added to the delay time for occupants to awaken and become alert
enough to recognize that an emergency is occurring. Occupant routes may change due to
the presence of hotel staff at different hours of the day. During nighttime situations, the
desk staff is limited and the hotel cleaning and maintenance staff are not there. Because
of this, occupants may be more likely to travel longer and more familiar routes to exit the
building. Also depending upon the time of day, the occupant positions and numbers will
change. During the day, the guestrooms are likely to be empty and the ballroom and
conference rooms filled. Occupants positioning and numbers will certainly change the
evacuation results. Lastly, occupant speeds throughout the building will change
depending upon the fire scenario. If the occupants are closer to the fire, they may sense
252
the urgency of the situation and be more likely to leave immediately and walk at a faster
rate than others further away from the fire. This occupant characteristic also ties in with
occupant positioning in its affect on the evacuation results.
The input variables that are not explicitly stated within each fire scenarios that are
taken into account for egress simulations are occupant gender, age and mobility
distributions. These will affect body sizes and speeds of the occupants in the hotel,
which ultimately affects occupant movement and evacuation times. These can be
obtained by consulting with the building owner for population statistics or acquiring
census information for the current year.
Input Matrices for Best and Worst Case Scenarios using EXIT89 and Simulex
From the six fire scenarios listed in this chapter, the best and worst case scenarios
are chosen. For each case and model, inputs are selected to reflect the specific scenario.
This is to be used as an example of how EXIT89 and Simulex can capture the four factors
of a hotel scenario. Once the input matrices have been established, the missing factors
are identified. Also, other models that may have the capability of accounting for the
missing factors are introduced.
The best and worst case scenarios are the following:
• BEST: Fire initiating in the conference room area in the lower levels of the hotel
during daytime hours in the spring season (electrical fire)
• WORST: Fire initiating in electrical wiring on the ground floor away from occupants
or immediate staff discovery during the nighttime hours in the winter season

253
The best case scenario is chosen as such because a fire that occurs during the day
when people are around is not likely to create untenable conditions and a need for total
evacuation of the building. But, if total evacuation is procedure for the hotel in this
scenario, people are awake and alert, a large number of hotel staff is on hand to direct
occupants out of the building, and a lower response delay is likely because of this. Also,
fewer occupants are likely to be in their guestrooms, during the day (especially during the
week days). Many of the occupants are likely to be in the conference areas of the hotel,
which is where the fire originates. Lastly, because of the season (spring), occupants are
unlikely to be wearing heavy coats. All of these scenario characteristics may lead to a
faster evacuation with a decrease in the delay time of the occupants.
In the worst case scenario, the fire occurs during the nighttime in an area that is
away from the sleeping rooms of the occupants. This scenario is labeled as the worst of
the six because the fire has a chance to grow behind the walls, possibly creating
untenable conditions. Since the occupants would be sleeping during this time, a large
delay time is possible, especially since none of the occupants would be near the fire’s
location of origin. Also, the staff is limited during the nighttime, which may allow
occupants to travel to further, more familiar exits. This scenario considers that all
occupants are sleeping in their guestrooms at full occupancy. Lastly, since the scenario
occurs in the winter months, occupants are likely to grab a jacket before exiting their
guestrooms, if they leave at all. All of these scenario characteristics lead to a slower
evacuation time with an increase in the delay time of the occupants.
For each model, the inputs for the best and worst case scenarios are displayed in
Tables 6.2 and 6.3 as an example of how to bound evacuation results.

254
Table 6.2: Best and worst case scenarios for EXIT89
EXIT89 Worst Case Scenario Best Case Scenario Building
Configuration Multiple nodes in hallway;
1 node per guestroom Multiple nodes in hallway;
1 node per guestroom Procedures User-defined routes to familiar
exits Shortest route
Environment CFAST data (yes, no) CFAST data (yes, no) Behavior – Body size
Austrian (largest) American (smallest)
Behavior – Speed
Normal speed Emergency speed
Randomly distributed delay time
5 min to 15 min for 100% of population
Immediate to 30 seconds
Occupants with disabilities
Occupy accessible rooms with slower moving occupants
None
Table 6.3: Best and worst case scenarios for Simulex
Simulex Worst Case Scenario Best Case Scenario Building
Configuration Import DXF files Import DXF files
Procedures Alter distance map to move to familiar exit
Shortest distance
Environment N/A N/A Behavior – Body size
Distribution of males, female, children, and elderly for a
hotel population with jackets
Distribution of males and females only
Behavior – Speed
Distribution of 0.5 – 1.5 m/s Distribution of 1.0 – 1.5 m/s
Randomly distributed delay time
10 min mean, +/- 5 min 15 second mean, +/- 15 seconds
Occupants with disabilities
Occupy accessible rooms with slower moving occupants
None
Missing Egress Factors from EXIT89 or Simulex
There are certain egress factors related to hotels that are not captured in
evacuation simulations with EXIT89 and Simulex. For the building configuration factor,
it is important to represent the building accurately. This can sometimes be a problem

255
with coarse network models, such as EXIT89. It is up to the user to specify the node and
arc connections for the floor plan, which will ultimately guide occupants throughout the
building and to the exits. If this is done carelessly or arbitrarily, occupants could follow
paths which are not realistic. Fine network models that allow the user to import a CAD
drawing are ideal because the model calculates occupant paths, and occupants move more
realistically to their goal. Fine network models also allow the user to input obstacles that
may hinder occupant movement.
Under the procedures factor, neither model allows the user to input the presence
of a staff member aiding in the evacuation. Such can be done implicitly by defining a
specific route, but the presence of a staff can aid beyond route finding. Staff can
determine the severity of the situation, alert occupants, provide instructions, provide
information to the firefighters for disabled rescue, calm or increase movement of the
occupants, etc. Although this would be difficult to model, it may be a part of a fire
situation in a hotel building. Also not simulated by either model is previous training and
experience of the occupants. Previous training and experience in fires36 has been shown
to affect the delay time of the occupant. This is also difficult to model as well as
determine the training status of the population to be modeled. However, this is another
factor in hotel buildings that ultimately affects the overall evacuation time.
There are some obvious limitations to running the fire model and evacuation
model separately for a performance-based design project. This method overlooks the
interaction between the fire conditions and the occupants. Even though Jin’s studies28
have their limits, they begin to show that heat and irritant smoke affect occupant
movement, senses, brain function, and anxiety level. EXIT89 has the ability to simulate

256
turn back behavior due to the optical density of the smoke, however, the model lacks all
other effects to the occupant. Although there is a lack of data on how asphyxiants and
heat affect the stress level and brain functions of the occupant, this is an obvious concern
of egress through any building. Simulex does not currently have this capability.
Lastly, similar to the environmental factor, EXIT89 and Simulex do not capture
all of the behavioral factors associated with a hotel evacuation. To begin with, for any
tall building, exhaustion on the stairs is not simulated. There is no decrease in speed due
to number of stories traversed in either of the two models. Also, social affiliation of
friends and families is overlooked. If families are in different locations when alerted of
an emergency, the models make no effort to reunite the family members or friends before
beginning the evacuation process. EXIT89 and Simulex account for delay times by
distributing a delay time across all occupants, instead of assigning individual activities to
occupants with corresponding activities delay times. In other words, there lacks specific
simulation of the following individual activities; firefighting, searching for occupants or
the fire itself, preparation activities (getting dressed, waking others), etc. Another
possibility of occupant egress that lacks simulation using the two models is elevator use.
Even though a majority of elevators are recalled to the lobby when the fire alarm sounds,
the issue of elevator evacuation is a current concern in human behavior. There is
currently a building in Australia where the use of elevators is a part of the evacuation
procedures144 and the modeling of such is becoming more useful as technology and mind
set changes.
Simulex allows the user to simulate occupants carrying items, such as babies and
book bags, as well as occupants that are wheelchair bound. The user can change the body

257
size of a particular population, which allows for such unique shaped occupants. EXIT89,
on the other hand, does not have this capability. Both models allow the user to simulate
an occupant sleeping or impaired by a response delay distribution only. Lastly, the
incorporation of environmental conditions is lacking in the case of Simulex and
simplified in the case of EXIT89, as stated earlier. However, both models do not
simulate occupants returning to their rooms and preparing an area of refuge, if the
conditions outside of their guestroom are untenable. The preparation of an area of refuge
can occurr2,133, but lacks simulation and the proper understanding of the interaction
between smoke and occupants.
Current Evacuation Models that can Account for Some of these Missing Factors
While EXIT89 and Simulex lack the incorporation of certain factors of an
evacuation from a hotel building, there exist other models that can incorporate some of
them. Table 6.4 lists some of the current capabilities of models today that can address
factors of a hotel evacuation. However, it should be mentioned that just because a model
can simulate such an activity, does not mean that there is sufficient data to support the
results. Where there is data to support the incorporation of a particular factor, it is noted
in this section. If a reference is not provided, the supportive data was not evident. Most
of these models are labeled as behavior models, with the exception of STEPs (given a
Movement model categorization).

258
Table 6.4: Features of models that contribute to a hotel evacuation
Model Contribution to a hotel evacuation EXODUS • Turn back behavior
• Movement affected by presence of smoke EvacSim • Fire wardens instruct occupants on each floor
• Knowledge sharing among occupants • Elevator use • Simulation of pre-evacuation activities
CRISP • Vertical counterflow • Simulation of pre-evacuation activities
STEPs • Social Affiliation – family members reunite • Elevator use
ASERI • Turn back behavior • Simulation of pre-evacuation activities
EXITT (residences only)
• Turn back behavior • Simulation of pre-evacuation activities • Simulation of occupants assisting others in the building
EGRESS • Simulation of response and decision-making delays • Simulation of fire fighters moving toward the fire
VEGAS • Simulation of occupants responding to behavior of others around them
E-SCAPE • Simulation of pre-evacuation activities • Simulation of group conformity • Delays affected by occupant special training and/or fire drills
BGRAF • Simulation of pre-evacuation activities • Simulation of environmental conditions affecting evacuation
BFIRES-II • Simulation of pre-evacuation activities
As indicated in Table 6.4, many current evacuation models have the capability of
simulating individual pre-evacuation activities. The method involves assigning a specific
time period to complete each activity (and probabilities are likely to be included), instead
of a response delay distribution for the entire group or population. The simulation of pre-
evacuation activities is used by EvacSim, CRISP, ASERI, EXITT, E-SCAPE, BGRAF,
and BFIRES-II.
EXODUS, ASERI, and EXITT simulate turn back behavior if the optical density
of the smoke warrants such behavior. There is data available by Bryan and Wood2 on
this subject, which is used by EXODUS and ASERI. EXODUS also uses Jin data28 to

259
simulate movement affected by smoke, which involves a decrease in movement to an
eventual crawl position. Overall, with the exception of STEPs, all models listed in Table
6.4 incorporate fire effects using certain methods specified in Chapter 2 of this report.
Another interesting feature involving fires is the capability of BGRAF to simulate
environmental conditions affecting the evacuation and to simulate the occupants affecting
environmental conditions. This is a realistic scenario, however it is not clear whether
there is data to support such a unique capability.
EvacSim is a unique model that fulfills many of the missing factors presented
earlier. The model, however, is still in the research stage and may never be released for
public use. The model has the unique capability of incorporating fire wardens that guide
and instruct occupants on their specific floor. These wardens can hold occupants on their
floor until further instruction, relay messages to leave the floor immediately, and perform
room to room searches of their floor. EvacSim also simulates elevator use by occupants
with disabilities and incorporates the familiarity factor to lead occupants to further exits.
Also, similar to fire input, all of these models incorporate the use of occupant familiarity
(as a variable or through user-defined routes) in the simulation.
After discussion and work with the CRISP developer at BRE, it was discovered
that the vertical counterflow capability was recently incorporated into the model. The
model allows the user to specify which occupants will act as firefighters and perform
search and rescue on different floors of the building. The model can simulate actual
movement of an occupant against the flow in the stairwell. The STEPS model contains
the unique capabilities of social affiliations of a family group. Before the identified
260
family group will begin evacuation, they are simulated to unite in a certain place and
evacuate together. STEPs can also simulate limited elevator use.
The final unique capabilities of models involve behaviors simulated by EGRESS,
E-SCAPE, and VEGAS. EGRESS has the capability of simulating both the action and
decision-making delays. This is unique in that the model recognizes the steps associated
with the pre-evacuation process. Lastly, VEgAS and E-SCAPE incorporate the
simulation of occupants who respond to the situation based on the behavior of the others
around them. For instance, if an occupant is near a “flock” or group of occupants acting
on a cue, that occupant will also act in a similar manner.
All of these behavioral capabilities begin to simulate a more realistic evacuation
from any type of building. As stated earlier, just because a model capability is listed and
discussed, does not mean that that capability is based in research data. This is still a
major necessity in the field of evacuation modeling. Because of this, it may be beneficial
in many cases to use a simpler model that lacks the “bells and whistles” of evacuation
modeling, if the user is more confident with the data supporting the input choices.

261
CHAPTER 7: DESIGN SCENARIO FOR GUEST BEDROOM HOTEL FIRE
Engineers commonly run all evacuation simulations (in order to bound the
evacuation results) for a performance-based design with one evacuation model. The
purpose of this section in the thesis is to challenge this idea. The question to be answered
is will two specific models give similar output for the same design scenario? Negative
results may then show the importance of choosing the egress model with the appropriate
features for the building, and I have provided a mechanism to do this in Chapter 2.
A fire scenario is created in which both models run in an attempt to simulate such
an evacuation. Each model is run “blindly” by the author to simulate the scenario using
the full range of capabilities that each evacuation model has to offer. The purpose of the
fire comparison run for each model is to simulate the fire scenario as close as possible to
an actual evacuation. Output from each model, such as evacuation times, population flow
split to the exits, and time spent in each exit, is compared and analyzed. Lastly, reasons
for any differences are identified and explained.
In this chapter, the fire scenario for the comparison run is discussed.
Characteristics of the fire scenario are the cause, location, and size of the fire, the time of
day and season of the fire ignition, the distribution of expected pre-evacuation times for
this type of fire, the expected occupant characteristics for a hotel building (age and
gender), and the actual building configuration used for the comparison run.
The Fire
The NFPA U.S. Fire Problem Overview134 states that, “Although fatal fires in
[hotels and motels] are less frequent than fatal fires in homes, the potential for large loss
of life is very real.” In the United States throughout the years of 1994 through 1998,
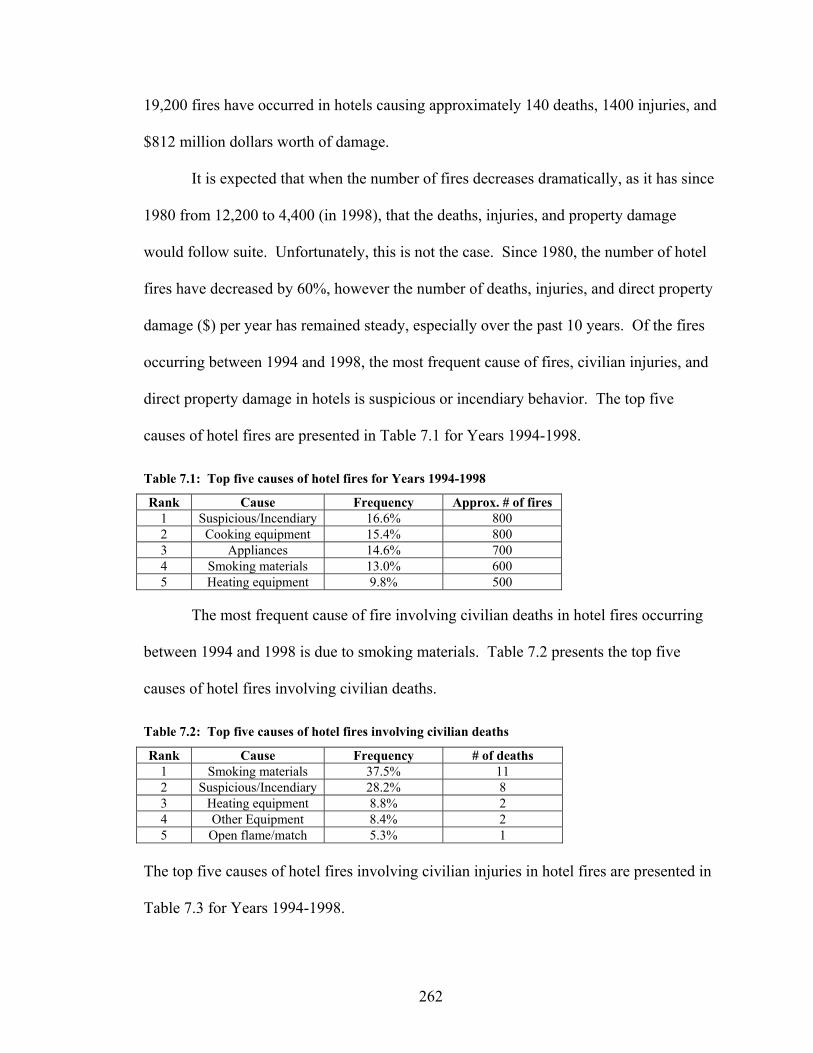
262
19,200 fires have occurred in hotels causing approximately 140 deaths, 1400 injuries, and
$812 million dollars worth of damage.
It is expected that when the number of fires decreases dramatically, as it has since
1980 from 12,200 to 4,400 (in 1998), that the deaths, injuries, and property damage
would follow suite. Unfortunately, this is not the case. Since 1980, the number of hotel
fires have decreased by 60%, however the number of deaths, injuries, and direct property
damage ($) per year has remained steady, especially over the past 10 years. Of the fires
occurring between 1994 and 1998, the most frequent cause of fires, civilian injuries, and
direct property damage in hotels is suspicious or incendiary behavior. The top five
causes of hotel fires are presented in Table 7.1 for Years 1994-1998.
Table 7.1: Top five causes of hotel fires for Years 1994-1998
Rank Cause Frequency Approx. # of fires 1 Suspicious/Incendiary 16.6% 800 2 Cooking equipment 15.4% 800 3 Appliances 14.6% 700 4 Smoking materials 13.0% 600 5 Heating equipment 9.8% 500
The most frequent cause of fire involving civilian deaths in hotel fires occurring
between 1994 and 1998 is due to smoking materials. Table 7.2 presents the top five
causes of hotel fires involving civilian deaths.
Table 7.2: Top five causes of hotel fires involving civilian deaths
Rank Cause Frequency # of deaths 1 Smoking materials 37.5% 11 2 Suspicious/Incendiary 28.2% 8 3 Heating equipment 8.8% 2 4 Other Equipment 8.4% 2 5 Open flame/match 5.3% 1
The top five causes of hotel fires involving civilian injuries in hotel fires are presented in
Table 7.3 for Years 1994-1998.

263
Table 7.3: Top five causes of hotel fires involving civilian injuries
Rank Cause Frequency # of injuries 1 Suspicious/Incendiary 24.4% 68 2 Smoking materials 21.2% 59 3 Appliance 11.7% 32 4 Cooking equipment 10.6% 30 5 Electrical distribution 7.2% 20
The top five causes of fires involving direct property damage ($) in hotel fires are
presented in Table 7.4 for Years 1994-1998.
Table 7.4: Top five causes of fires involving direct property damage
Rank Cause Frequency $ of damage (mil) 1 Suspicious/Incendiary 29.2% $20.4 2 Heating equipment 26.8% $18.7 3 Electrical distribution 11.3% $7.9 4 Other Equipment 7.0% $4.9 5 Smoking materials 6.6% $4.6
The NFPA U.S. Fire Problem Overview134 also documents the frequency of fires,
casualties, injuries, and property damage by area of origin within the hotel. The most
frequent area of origin for all four of these categories is the bedroom. The top five most
frequent areas of origin for fires to occur are included in Table 7.5.
Table 7.5: Top five most frequent areas of origin for fires
Rank Area of Origin Frequency Approx. # of fires 1 Bedroom 25.3% 1200 2 Kitchen 17.2% 800 3 Laundry room 12.2% 600 4 Lavatory 4.4% 200 5 Hallway/Corridor 4.4% 200
The most frequent areas of origin for civilian casualties to occur are included in
Table 7.6.

264
Table 7.6: Most frequent areas of origin for civilian casualties
Rank Area of Origin Frequency # of deaths 1 Bedroom 56.2% 16 2 Lounge/den 12.7% 4 3 Other area 10.5% 3 4 Kitchen 6.4% 2 5 Lavatory 4.3% 1
The most frequent areas of origin for civilian injuries to occur are included in
Table 7.7.
Table 7.7: Most frequent areas of origin for civilian injuries
Rank Area of Origin Frequency # of injuries 1 Bedroom 40.4% 113 2 Kitchen 11.0% 31 3 Laundry room 9.2% 26 4 Lounge/den 5.8% 16 5 Lavatory 4.7% 13
The most frequent areas of origin for property damage to occur are included in
Table 7.8.
Table 7.8: Most frequent areas of origin for property damage
Rank Area of Origin Frequency $ of damage (mil) 1 Bedroom 23.9% $16.7 2 Kitchen 6.8% $4.7 3 Other area 5.9% $4.2 4 Attic 5.8% $4.1 5 Laundry room 5.1% $3.6
The scenario chosen to be modeled by EXIT89 and Simulex is one that presents a
high risk to occupants residing in a hotel. From the U.S. hotel statistics presented by
NFPA, hotel fires most frequently begin in the bedroom, which results in frequent deaths
and injuries to civilian guests. And, from the fire cause data, possible causes of a fire in a
guest bedroom could be incendiary or smoking materials. Other conditions to consider in
the scenario are the floor of origin, time of day and the season/weather. The floor chosen
as the floor of origin is the 15th floor. By choosing the 15th floor, the fire presents a risk
to occupants high in the building who have the farthest distance to travel to evacuate the

265
building. Also, to present the greatest amount of risk to the occupants (or the worst case
scenario), a time of 3 a.m. and the season of winter is chosen for the scenario. A night-
time scenario considers that the occupants of the hotel are sleeping and may take
additional time to wake up and prepare to leave the guest room. Also, by choosing a
winter scenario, the occupants may take additional time to dress appropriately for time
spent outside of the hotel. A winter scenario also improves the mechanics for smoke
spread to the upper floors. The final scenario chosen for modeling of the 21-story hotel is
the following:
• A mattress fire begins in the guest room of the 15th floor of the hotel around 3 a.m.
during the winter season.
• The cause of the fire is due to a guest smoking in bed and falling asleep with cigarette
still lit.
• The fire burns slowly for a while and eventually engulfs the mattress to develop a fast
fire.
Delay Times
A large amount of research was performed to locate delay times for hotel
buildings during the night-time or sleeping hours3,76,140,145,146,147. Many researchers,
Proulx, Fahy, Purser, Gwynne, Boyce, Brennan, and others, were contacted to obtain
delay times for night-time hotel drills or fires. The article that contains the most
information on this topic was presented at the 2nd International Symposium on Human
Behavior in Fire by R. Fahy and G. Proulx140. The article focuses on creating a database
of delay times and walking speeds for evacuation modeling. The article contains a
collection of delay times for hotels, office buildings, department stores, and apartment

266
buildings. Only two entries of the database focus on high-rise hotel buildings. The two
hotel buildings that Bryan studied did not give an initial alarm notification of the fire
situation, resulting in extremely long time delays ranging from 5 minutes to 2 or 3 hours.
Since the high-rise hotel building for this scenario is equipped with a voice
communication system, such high delay times are not feasible. Another source of delay
times for hotel buildings is Proulx’s chapter of the SFPE handbook3. Proulx discusses
estimated delay times to start evacuation included in the 1997 British Standard, Part 1:
Guide to the Application of Fire Safety Engineering Principles, Draft for Development
DD240148. For hotels and boarding houses equipped with pre-recorded messages, as
found in the design scenario hotel used for this study, DD240 suggests a delay time of 4
minutes. The delay time value of 4 minutes seems small, and no reference material was
found to defend such a number. Another source of hotel delay times was found in
Mizuno et al.145 who reports delay times of evacuating hotel staff to be a mean of 7
minutes during a specific fire event. Although these sources give starting information on
hotel fires, the range of delay times are quite large and are taken from scenarios
dissimilar to this design scenario.
The next step was to research delay times for apartment buildings, since much
more information on delays could be found on this building type. The author
acknowledges the difference between hotels and apartments, but also recognizes that in
both buildings, occupants can be sleeping during the alarm. Arousal from sleep is a
major component to the delay time in this scenario, and the similarities of the building
types outweigh the differences.

267
For apartment building delay times, DD240 also suggests a time of 4 minutes for
a pre-recorded voice communication system. Also, Proulx140 has done a substantial
amount of work in apartment buildings by performing fire drills and documenting
movement during actual fires. She has stated that none of her observed fire drills were
performed at night. On the other hand, she has documented the Forest Laneway fire that
occurred during night-time hours. She stated that for those occupants who evacuated
during the first hour, their mean delay time was approximately 10 minutes.
Overall, the most substantial work on apartment delay times has been performed
by Brennan at VUT147. She has put together a database of information from apartment
fires and has established time ranges of delay times for the first 70 cases of fire incidents.
The time ranges for the apartment buildings are calculated from the time of the
cue that resulted in the initial action. The database distinguishes between those who
begin evacuation without investigating and those that do investigate first. The time range
to begin evacuation (the occupants are asleep) is 0.5 m – 17 minutes (mean of 5 minutes)
for those who do not investigate. For those who investigate, the time range is 2 – 21
minutes with a mean of 6 minutes. Brennan does not make distinctions in delay times
dependent upon the type of alarm system within the building, as DD240 does. When
combining Proulx data from the Forest Laneway fire, Brennan data from the apartment
database, and DD-240 guidance, while also taking into account that this design hotel is
equipped with a voice alarm system, the delay time for the guest bedroom fire scenario
will range from 0.5 minutes – 10 minutes, with a mean of 5 minutes. This range of delay
time stays close to the mean of data from Brennan, but contains a maximum of 10
minutes (instead of 17 or 21) due to the use of a voice communication system149. As

268
Proulx has shown in recent work129, the use of voice communication systems lessens the
amount of delay time taken by the occupants of high-rise buildings.
Occupant Distribution for Fire Scenario
Statistics on hotel guest occupant distributions in the U.S. was obtained from two
different sources, D.K. Shifflet’s DIRECTIONS Travel Information System and the
American Hotel and Lodging Association (www.ahla.com). The statistics from D.K.
Shifflet’s DIRECTIONS, provided from Marriott Inc., contain a wide variety of
information such as the percentages of male and female guests, a distribution of the ages
staying at hotels for all types of stays, and the additional percentage of children present
during leisure trips. These distributions are provided below in table 7.9.
Table 7.9: DIRECTIONS distributions of hotel stays in the U.S.
Gender Distribution Age Distribution Male 58% Ages 18-34 26%
Female 42% 35-49 37% 50-64 26%
89% adults
65+ 11% 11% over 65 During leisure travel: 12% children
There is a wide distribution of ages of hotel guests, which also depends on the
type of stay, business or leisure. Information on the distribution of type of stay was
found on the American Hotels and Lodging Association (AHLA) website,
www.ahla.com, and is included in Table 7.10.
Table 7.10: AHLA distributions of hotel stays in the U.S.
Type of Stay % Transient Business 29
Attending Conference 27 56%
business Vacation 24
Other reasons (personal, family, special event) 20 44%
leisure

269
This information aids in understanding what percentage of the time spent in hotels
is for business or for leisure. For business stays, it is unlikely that children are included
in the trip. Therefore, it is important to get an overall percentage of occupants, whether
for business or leisure, that includes children, adults, and older adults for this modeling
scenario. Some models take into account body sizes and corresponding walking speeds,
depending upon the gender and age of the occupant.
From the AHLA chart, 56% of the hotel stays are for business purposes and the
other 44% are considered leisure for the purposes of an overall calculation of the
occupant distribution at the time of the fire emergency. For business stays, children are
not considered as part of the occupant distribution. By combining the gender, age, and
type of stay distributions, it can be calculated that the occupant distribution for business
stay will contain 52% male adults, 37% female adults, and 11% older adults over 65
years. The calculation chart for this distribution is found in Table 7.11.
Table 7.11: Business stay distribution
56% Business stay Age dist. Gender dist. Calculation Business overall dist.
89% adults 58% male adult 0.58 * 89% 52% male adult 42% female adult 0.42 * 89% 37% female adult
11% 65+ 11% older adult 0% children 0% children
The same type of calculation is performed for leisure stays and is included in
Table 7.12. By combining gender, age, and type of stay, the occupant distribution
calculated for leisure stay is 45% male adults, 33% female adults, 10% older adults over
65, and 12% children.

270
Table 7.12: Leisure stay distribution
44% Leisure stay Leisure dist. Age dist. Gender dist. Calculation Leisure overall
dist. 88% over 18 58% male adult 88 * 0.89 * 0.58 45% male adult
89% adults
42% female adult 88 * 0.89 * 0.42 33% female adult 11% over 65 88 * 0.11 10% older adult
12% children 12% children
In order to calculate the overall occupant distribution which takes into account the
business and leisure stay distribution, the following calculations are made to combine the
two into one distribution. From these calculations, an overall distribution of occupants
present for the hotel bedroom fire is the calculated to be the following: 49% adult males,
35% adult females, 11% older adults over 65 years old, and 5% children. Table 7.13
contains the calculation performed to obtain this distribution.
Table 7.13: Overall distribution of the hotel occupants - business and leisure
Occupant Type Business % (56% of stays)
Leisure % (44% of stays)
Calculation Overall %
Adult Male 52% 45% 56 * 0.52 + 44 * 0.45 49% Adult Female 37% 33% 56 * 0.37 + 44 * 0.33 35% Older Adult 11% 10% 56 * .11 + 44 * 0.10 11%
Child 0% 12% 56 * 0 + 44 * 0.12 5%
This scenario assumes that 2 men or 2 women will share one room for business
stays in parts of the hotel, and that couples of men and women will share one room for
leisure stays in other parts of the hotel (along with their children in certain rooms). No
rooms will have single occupants because this scenario is anticipating a worst case
scenario, which is full capacity of the hotel.
The main purpose is to provide an average scenario comparison run for each
model. Then, the comparison run’s inputs are tweaked to bound the evacuation results by
higher and lower evacuation times.

271
Because of this purpose, it has been decided that occupants with disabilities will
not be simulated in the fire scenario for this model comparison run. Although data is
available on the movement of occupants with certain disabilities140,143, it is of interest to
study differences between two models, instead of including an infinite amount of input
variable differences. However, additional simulations used in the model comparison will
feature disabled occupants.
Also, the simulation of occupants with jackets or other items are included only in
the bounding analysis. There lacks a great deal of data on movement with heavy and
bulky clothing or other items, which is the main reason for such to be included in the
bounding analysis, instead of the main comparison run.
Building Configuration88,150
The building selected for the comparison is a 28-story high-rise hotel. The
building is located on the west coast of the United States and is used for both business
and leisure travelers. The height of the building is 81.2 m and the gross floor area is
39,320 m2. The gross area of each floor level ranges from 1,168 to 1,204 m2. The
building consists of 28 levels above ground and 2 levels below grade.
Because the purpose of this study is to compare the results from two models
rather than predict actual evacuation times, a simplified version of the sample building is
modeled. Levels 1-3 are used as public spaces (containing a ballroom, meeting rooms,
health club, mechanical spaces and other support spaces), with no guest rooms provided.
Level four consists of a hospitality suite, guestrooms, and a walk-on terrace, levels 5-24
contains guestrooms and suites, level 25 contains the concierge’s club, and levels 26-28
consists of mechanical space. In this study, only floors 4 through 24 are modeled to use

272
those levels that the guests would be occupying during the night-time fire scenario. Four
of the upper floors and three of the lower floors of the hotel are omitted from the analysis
because those areas (meetings rooms and mechanical spaces) are unlikely to be occupied
by a large number of occupants during the night-time hours. Also, the block of elevators
located on each floor of the hotel is also omitted from the scenario. This is due to the fact
that elevators are currently not allowed to be used during an emergency by the occupants
of a building, as specified in ASME A17.1150. An empty space is left on each floor plan
where the elevators resided, as shown on Figure 7.1.
For each model simulation, as soon as occupants in the stairway travel from floor
4 (see Figure 7.1) to the door of the stairwell lobby entering onto floor 3 (see Figure 7.2),
they are assumed to arrive at their destination of safety. Being that the first three floors
of the building are neglected in this analysis, the input of each model is simplified by
considering the fourth floor to be Floor 1 and the ground floor to be Floor 0.
Figure 7.1: An AutoCAD drawing of Floor 4 – changed to Floor 1
ELEVATORS
GUESTROOMS CONFERENCE ROOM
STAIR 1, LEFT STAIR STAIR 2,
RIGHT STAIR

273
Figure 7.2: An AutoCAD drawing of Floor 3 – adjusted to Floor 0
All guestrooms are occupied by either 2 or 4 guests (depending upon the size of
the room). There is a conference room on the first floor that can house 54 occupants,
however since the fire scenario occurs at 3 a.m., no occupants are initially located in the
conference room. The listed numbers of occupants in each room are presented in Figure
7.3 for Floor 1 as a typical floor. Considering all 21 floors, a total of 1044 occupants are
present in the building at the time of the evacuation. Both exits, consisting of two
stairways located on the right and left sides of the building, are available to occupants in
each simulation.
Figure 7.3: Occupant Load on Floor 4 (adjusted to Floor 1)
EXIT 1
EXIT 2
3
2
0 22
3
2 2
2 2 2 2 2 2 2 2 2 2
4
4

274
The width of each of the two stairs, measuring the wall to wall distance, is 1.13 m.
The width of the handrails from each side of the stairway will not be subtracted from the
width of the stairway by the user of the model because the models use movement
algorithms that account for space from walls and obstruction. Also, it has been suggested
that although occupants avoid brushing up against the side of a wall, they treat their
distance from the handrails differently23. The length along the diagonal connecting the
stair treads in both Stair 1 and 2 is 9.5 m.

275
CHAPTER 8: DESCRIPTION OF THE EVACUATION SIMULATIONS RUN WITH
EXIT89 AND SIMULEX
As mentioned in Chapter 7, the main question to be answered is whether or not
two specific models give similar output for the same design scenario. This chapter aims
to highlight the input parameters used in each model to simulate the fire comparison
scenario. Chapter 5 discusses the types of input available for each model, and Chapter 8
highlights the choices made to simulate the fire scenario and the reasons.
In addition, each model is used in an attempt to bound evacuation results from the
example hotel building. The building configuration will remain constant for all
evacuation runs. Chapter 7 provides a synopsis of how the actual hotel building is altered
for the purpose of this comparison run. Only the occupant characteristics will change in
order to anticipate other hotel occupant scenarios. The characteristics that are likely to
change with bounding scenarios are the following: ages and genders (which have an
impact on body size and walking speeds for EXIT89 and Simulex), occupant position
within the hotel, occupant routes, population numbers, delay time, and occupant mobility.
Since there is uncertainty in all of this information, it is important to understand the
sensitivity of changing these values and provide an appropriate bound on the evacuation
time.
However, for the purpose of this thesis, occupant position within the floor,
population numbers, and occupants routes will not change. The reason for this is due to
the fact that the hotel building is altered for comparison purposes. A performance-based
design would likely change occupant positions and population numbers in relation to the
time of day, for example, placing specific number occupants in conference rooms during

276
the day and guestrooms at night. However, because the building is altered for this thesis
to contain only guestroom floors for model comparison purposes, this is not a possibility
and lies outside the scope of this thesis. A performance-based design could also alter
occupant exit paths to use a more familiar main exit to the building. This is also out of
the scope of this thesis for the same reason.
Lastly, since only two exits are simulated for the altered hotel building, exits or
stairs will not be simulated as blocked for the entire scenario. If the models are equipped
with the capability to manually block stairs doors during certain time periods of the
simulation, this could be another technique to bound the evacuation results. This is not a
capability of EXIT89 or Simulex. Also, since no fire simulations are run for this thesis,
this is out of the scope of the project.
Due to the purpose of model comparison, only occupant characteristics such as
age, gender, and mobility are altered (which are ultimately labels that change the way that
occupants move throughout a building). Lastly, delay times are altered and compared.
Comparison Run for Simulex:
First, the inputs provided to Simulex for the fire scenario comparison (design
scenario) run are identified and the reasons for choosing such inputs are explained.

277
Figure 8.1: Simulex snapshot of separate stair building input
As mentioned earlier, the Simulex model allows the user to import CAD drawings
of each floor into the program. The user then has options of how to link the floor plans
together with stair sections. For the fire comparison, each floor plan is linked to a
separate, created stair section. The inputs provided by the user are the stair widths and
length for each stair section. The stair length provided to the model for each stair section
is 7.3 m, which is the length of 2 flights with 1 landing in between (the distance in
between 2 floors). The other landing (on the actual floor as shown in Figure 8.1) is not
included in the stair length because the occupants actually traverse that distance on the
floor plan. Figure 8.1 shows the Left stair of Floor 3 on the floor plan and the adjoining
stair sections from Floor 4 to 3 and from Floor 3 to 2. Occupants traveling on the stair
from floor 4 (Link 15), pass through Link 13, continue on the landing on Floor 3, pass
through Link 11, and travel to Floor 2 (Link 9) via the stair. This complicated link and
stair configuration is created in order to more accurately simulate occupant movement
From floor 4 to 3
Landing on floor
Stair sections
Left Stair on Floor 3
From floor 3 to 2
From floor 4 to 3From floor 3 to 2

278
through the building. Another option would have been to include one long continuous
staircase that all floor plans feed into for each stair. However, the continuous stair would
not allow for occupant body turning on the floor plan, which more accurately simulates
an evacuation via stairs.
Other information about the hotel building is significant in the simulation of the
fire comparison scenario. On the floor containing the conference room, the left landing is
slightly larger, causing occupants to move 0.6 m longer, however only on that specific
floor. The stair sections are 44 inches in width and the guestrooms range from 350 – 440
ft2, with guest suites of 800 ft2. When entering stair width, frame-to-frame stair
dimensions are used, instead of incorporating boundary layers. Frame-to-frame distance
is used because Simulex slows occupants down due to inter-person distance from other
occupants as well as obstacles and walls83. The incorporation of boundary layers seems
redundant. Also, handrails are not subtracted from stair widths due to the fact that people
can and will rub against the rail when walking down the stair.
For the choice of shortest route vs. a created distance map, the shortest route
option (default distance map) is chosen for this fire scenario. The reason for this is due to
the simplicity of the hotel’s floor plan. The floor plan is equipped with guestrooms
surrounding one main hallway with exits on the right and left sides.
In Simulex, the user is required to choose a certain occupant population consisting
of single or multiple body types for the building population. This occupant population
can be prescribed for the entire population or for a group within the hotel building. As
described earlier in the occupant distributions section of Chapter 7, 49% of the occupants
are male adults, 35% are female adults, 11% are older adults, and 5% are children. This

279
distribution combines statistics from both business and leisure travel stays. By
identifying this hotel population, a certain selection of unimpeded walking speeds and
body sizes are distributed throughout the hotel building. The user is also required to
visually place the occupants throughout the building, manually or using different methods
provided by the program. For this fire comparison run, occupants are manually placed at
the back of each guestroom, opposite of the doors, to simulate the location of beds. It is
assumed that because of the nighttime scenario, occupants would be located in bed.
For the comparison run, no smoke data is incorporated into the Simulex run,
because the program does not currently have this capability.
Finally, the mean delay time for the hotel scenario is 5 minutes, plus or minus 5
minutes, distributed with a random distribution throughout the building. A random
distribution is used due to the lack of data on hotels and its corresponding distribution for
the simulated population. The support for this response delay range is given in Chapter
7. Also added to the comparison for each model, a run without occupant delay is
simulated.
Simulex Input for 3 a.m. Cigarette Burn in a Guest Bedroom:
• Building configuration input through CAD files
• Shortest route chosen for all occupants
• No exits blocked for any occupants, i.e. Default distance map
• Occupant distribution for scenario: 49% (512) adult males, 35% (365) adult females,
11% (115) older adults over 65 years old, and 5% (52) children
• No delay or Mean delay time = 5 minutes; +/- 5 minutes; Random distribution

280
Comparison Run for EXIT89:
Similar to the Simulex section, the inputs provided to EXIT89 for the fire
comparison (design scenario) run are identified and the reasons for choosing such inputs
are explained.
As explained earlier, EXIT89 is a coarse network model. This requires the user to
specify a chosen amount of nodes and arcs for each floor plan and stair section of the
building. For larger spaces, such as the hallway, it is important to determine the
appropriate amount of nodes in the hallway of each floor that would accurately represent
the shape of the building.
Node input sensitivity analysis for the hallway
Work is performed on the sensitivity of EXIT89 to the choice of the number of
nodes for this hotel building configuration. Even though this floor plan provides a simple
configuration, the center hallway is long and connects to a large number of nodes
representing the guestrooms. Because of the shape of the hallway, the number of nodes
in the hallway is altered from 7 to 1 (shown in Figures 8.2-8.9) to see if the population
flow split to each exit and the evacuation times change dramatically. Results of this
exercise are displayed in Table 8.1.
It should be noted that all node change simulations contain the following inputs:
American body size, normal walking speed, shortest route calculation, 1044 total
occupants (empty conference room), no boundary layers on the doors, guestroom,
corridors, and stairs, and no delay time for occupant movement.
Figure 8.2 shows the placement of the nodes for the 7 node simulation. Nodes are
strategically placed so that, except for the node on the left, all are approximately 7.5 feet

281
away from any guestroom entrance. A dotted line in Figure 8.2 represents the midpoint
of the hallway for each simulation. Since the shortest-route calculation is used for each
simulation, as soon as the occupants walked out to their corresponding hallway nodes,
EXIT89 would then move occupants to the closest stairwell. By using this 7 node
configuration, any occupant to the left of the midpoint line would travel to the left
stairwell, and any occupant to the right of the midpoint would travel right. This results in
a 582/462 people flow split to the left and right stairwells, respectively.
One note should be made as to the configuration of Floor 1 found in Figures 8.2-
8.9. Not all floors look exactly like the one shown in Figures 8.2-8.9. This floor plan is
used only as an example of node placement. On most floors, the conference room area,
shown in Figure 8.2, is divided into 3 separate guestrooms. With this known, one can see
that more occupants reside on the left of the midpoint than on the right, which explains
the 582/462 population split (left and right respectively).
Figure 8.2: 7 nodes in hallway of 1st floor
Figure 8.3 shows the node configuration for 6 nodes in the hallway. The only
difference between Figure 8.2 and 8.3 is the removal of the node in the left vertical
hallway. As expected, by removing this node, the population flow split remained the
same, however, the evacuation time increased slightly. The reason for this is possibly
Midpoint of hallway Conference room

282
because the guestroom occupants on the left of the floor plan had to walk a bit further to
their hallway node and then into the left stairwell.
Figure 8.3: 6 nodes in hallway of 1st floor
Figure 8.4 displays a change of 5 nodes in the hallway. These nodes are still
spaced out evenly in the center portion of the hall, with one of the nodes directly at the
midpoint. The flow split is similar to the previous 2 simulations, but presents slightly
different numbers: 584/460 for the left and right exits respectively. This caused some
confusion, but after further analysis, the cause of this difference was found. Because the
two starred guestrooms in Figure 8.4 are connected to the center node on every floor of
the building, this node is exactly the same distance from either stair. The model
randomly chooses the right or left stair for the starred guestrooms on each floor. This is
the reason for the slight variation in population split. However, even with this difference,
the evacuation time of 467 seconds is very close to the previous simulations, 6 and 7
nodes.
Figure 8.4: 5 nodes in hallway of 1st floor

283
Figure 8.5 shows the node placement of 4 nodes in the main hallway. This
configuration gives an equivalent flow split as the previously discussed simulations.
Also, a similar evacuation time of 461 seconds is calculated. Different from 5 nodes in
the hallway, this 4 node configuration allows the guestrooms to the left and right of the
hallway midpoint to travel to their respective stairways.
The reason for this is because of the arcs (or connections) from node to node
established by the user. For instance, the starred guestroom in Figure 8.5 is connected to
the node displayed by the curved arrow. If the user had connected the starred guestroom
to the node displayed by the straight arrow, the occupant would have traveled to the left
stair. The reason for the change is the distance from the connected hallway node to the
staircase. Once the occupant from the starred guestroom has reached their corresponding
hallway node, they travel the shortest distance from that node to the stair. In other words,
the population flow split is more dependent upon the node connections from the
guestroom to the hallway and the positioning of that node in reference to the available
staircases, instead of the number of nodes in the hall.
Figure 8.5: 4 nodes in hallway of 1st floor
The population flow split for the 3 node configuration (as shown in Figure 8.6) is
also equivalent to the previous simulations. The decrease in evacuation time to 444
seconds is possibly because of the addition of the left most node in the vertical hallway.

284
The occupants on the left side of each floor plan do not have to walk as far to reach the
staircase.
Figure 8.6: 3 nodes in hallway of 1st floor
The 2 node configuration shown in Figure 8.7 also provided an equivalent
population split and similar evacuation time. None of the occupants are specifically
going out of their way to travel to the stairs. Again, it is dependent upon the user’s
choice of node connections, or arcs. All of the guestrooms to the right of the hallway
midpoint are connected to the right node. The same is true for the left node. Because of
the distance between nodes and the stairs, the occupants will travel to their respective
stairs.
Figure 8.7: 2 nodes in hallway of 1st floor – Configuration 1
As a twist to the configuration in Figure 8.7, Figure 8.8 presents a different
mechanism of noding the hallway. One node is placed in the vertical left hallway and
one node is placed in the center of the main hallway. This provides a dramatic change in
the population split and evacuation time, as shown in Table 8.1. The arcs designated by

285
the user are key to this simulation. Only 4 guestrooms to the left of the floor plan are
connected to the left-most node. All other guestrooms on the floor are connected to the
center node. As was previously mentioned and displayed in Figure 8.4, all guestrooms
connected to the center node are randomly distributed to either the right or left stairwell,
by floor, i.e. an entire floor will proceed to one stairwell or the other. The reason that the
left stair is so heavily used is because of that left-most node. On every floor, 10 people
are automatically designated to the left from the 4 left guestrooms.
Figure 8.8: 2 nodes in hallway of 1st floor - Configuration 2
Lastly, similar to the configuration in Figure 8.8, Figure 8.9 displays only one
node in the midpoint of the main hallway. The results reflect a random use of either
staircase by floor. This time, though, the right stair is more heavily used. It is not
necessarily clear as to why this is the case. Similar to the 2 nodes, Configuration 2 case,
the evacuation time is much larger than the previous cases.
Figure 8.9: 1 node in center of hallway of 1st floor

286
Table 8.1: Results of altering number of nodes in the hallway from 7 to 1
# of nodes in hall # using left exit # using right exit Evacuation time 7 582 462 439 6 582 462 459 5 584 460 467 4 582 462 461 3 582 462 444
2 – Configuration 1 582 462 441 2 – Configuration 2 764 280 606
1 350 694 593
Consequently, the population split to exits and evacuation time is governed by
node placement, distances, and choice of node connections (or arcs) by the user. At least
in this example, less weight is placed on the actual number of nodes in the hallway, and
more on their placement.
Ultimately, as Figure 8.2 shows, seven nodes are placed throughout the hallway to
simulate the fire scenario. Each node is less than 8 feet away from each doorway of the
guestrooms. From the previous discussion and the results found in Table 8.1, it was
decided that this layout would accurately describe the movement of the occupants from
the guestrooms to the stairway. Also, as explained in the Simulex section, Chapter 7
explains how the hotel building is altered for the purpose of model comparison.
Frame-to-frame dimensions are also used for all building components, including
doors, guestrooms, corridors, and stairwells. As with Simulex, it is questioned whether
or not to use boundary layers for these components. Fahy, the developer, says that she
enters the exact dimensions of the building components into her model76. It is understood
that Predtechenskii and Milinskii incorporate this boundary layer in their calculation
tables. There would certainly be differences if boundary layers are included in the model,

287
by an obvious decrease in widths of components, and ultimately evacuation times. Fahy
also states that the user should input the usable area for each space, which includes
subtracting out for large obstacles. This is not done for the guestrooms in the hotel
building, due to the fact that there are so few occupants residing in such a large space. It
is speculated that a hotel bed would not alter occupant movement in a substantial way.
Lastly, handrails are not incorporated for the same reasons described for the Simulex
model. As Fahy has stated, the choice is up to the user to decide whether or not to take
handrails into account. Fahy writes that the “use of the handrails can make footing more
secure, which should increase the flow (or at least not cause the slowing that will happen
when people feel unsure of their footing).” On the other hand, handrails could increase
the boundary layer. Either way, handrails are not considered to hinder movement in the
fire comparison run.
For the choice of shortest route vs. a user-defined route, the shortest route option
is chosen for this fire scenario. The reason for this is due to the simplicity of the hotel’s
floor plan.
EXIT89 requires the user to choose an overall body size in which all of the
occupants will represent during the simulation. The average or middle body size of
Soviet is chosen for the scenario as well as the emergency travel speed. The Soviet body
size is chosen to represent an average body size of men, women, children, and older
adult. The Soviet body size is 0.1130 m2, which is very close (within 0.003 m2) to the
anthropometric data for adults (97.5 percentile) provided in the Life Safety Code, NFPA
10188 (Figure A.7.3.4.1). The Soviet body size is also close to an average taken of men,
women, elderly, and children body sizes used by Simulex. Also, emergency travel speed

288
is selected since an actual fire would be the cause for this simulated evacuation. It may
seem more appropriate to choose the American body size for a hotel building in the
United States, however, the body size of 0.0906 m2 is quite small. Instead of viewing
these body size labels as representations of countries, they should be viewed as labels for
a small, medium, and large body size.
Whereas location of the occupants can be chosen in Simulex, EXIT89 does not
allow the user to place occupants at certain points (x,y) throughout the building. The user
only tells the model how many occupants are located within a node and the model
handles “placement” or more accurately, the calculation of the number of people and the
size of the space. This aids the model in understanding the density of the space or the
amount of space each occupant occupies throughout the simulation.
There is no input of CFAST data for the fire scenario. It is not included to be
consistent since Simulex does not have smoke considerations.
This fire scenario does not include the input of counterflow by the firefighters
responding to this type of an emergency. Although it is obvious that firefighter
movement upstairs in an emergency is an issue in any fire, there is not enough data
available on firefighter movement nor the interaction of flow streams moving in opposite
directions to support choices for this parameter.
Also, the comparison runs include one with a delay time and one without. The
minimum response delay time is 0.5 minutes and the maximum response delay time is 10
minutes, as stated in Chapter 7. These values apply to 100% of the population in the
hotel building.

289
EXIT89 Input for 3 a.m.Cigarette Burn in a Guest Bedroom
• Node/arc configuration of the building with 7 nodes in the hallway of every floor.
• Shortest route chosen for all occupants
• No input of CFAST data
• All occupants of Soviet body size
• All occupants travel at emergency speed
• Minimum response delay time = 0.5 minutes; Maximum response delay time = 10
minutes; 100% of population to delay
• No input of counterflow
• No occupants with disabilities
• Down stair travel only
Additional Bounding Analysis Runs for Simulex:
The purpose of this exercise is to alter the occupant characteristics of the
population, such as occupant speed, body size, mobility, and delay time, in an attempt to
bound the evacuation results from the hotel building. The purpose of the bounding
analysis for any design is to attempt to anticipate other emergency situations, such as a
change in fire location, fire type, time of day, season, change in hotel use, difference in
hotel guests, etc.
As mentioned earlier, other characteristics, such as occupant initial location,
route, and population numbers for the building are not altered, which does put a
limitation on the breadth of evacuation scenarios used to bound results. For the purpose
of this thesis, a majority of the focus is on the body size and speed of the occupants,
dependent on certain circumstances.

290
The simulations run with Simulex are run either with no delay time or with the
previous 5 minute +/- 5 minute delay time (as is used in the fire comparison run). The
runs using Simulex (with and without a delay time) are the following cases:
Speed variation (all median body size except jackets)
• All move at 1.0 m/s
• All move at 1.2 m/s
• All move at 1.4 m/s
• All 1.2 m/s + jackets
Occupant type variation (body size and speed) – smallest and slowest; largest and fastest
• All elderly population
• All males
• All median body size, move at 1.3 m/s
• All females
Hotel use variation
• Business Stay hotel
• Leisure Stay hotel
• Summer Camp hotel
Occupant mobility variation
• Hotel population (used in the fire comparison run) with a 3% disabled population
• All disabled
Speed variation The first attempt to bound the evacuation results from the hotel building is to do
so by variation in speed. The range of speeds used to do this is 1.0 m/s to 1.4 m/s (197-

291
276 ft/min). Each speed simulation uses the median body speed with no variation (+/-) in
the unimpeded speed. In other words, all occupants move at that specified speed. The
reason for using such a range is that 1.2 m/s represents the value provided in the SFPE
handbook as the maximum unimpeded exit flow speed for horizontal components1. 1.0
m/s, on the other hand, is provided by Boyce et al143 to represent average movement of
various disabled occupants on horizontal components. This is used as the lower bound.
Since the lower and midbounds differ by 0.2 m/s, the highest speed bound used is 1.4 m/s
and is representative of a very fit, urgent population.
Also, to simulate a fire scenario occurring in the very cold months of winter, a
simulation is run at the average speed of 1.2 m/s with the occupants wearing jackets.
This also uses a median body size.
Occupant type variation (body sizes and speed) In an attempt to vary the body sizes and corresponding unimpeded speeds,
simulations are run with all of the population designated as containing 1) a smaller body
and slowest speed and 2) a larger body size and fastest speed. By running these types of
simulations, the evacuation times can be bounded, as long as these populations are
feasible to expect in a hotel building. Also, to use the model’s capabilities to its fullest,
this section uses the established populations provided by Simulex. The model provides
body types that correspond to body sizes and unimpeded speeds (with variation +/-) from
field observations.
The smaller body and slowest speed population is an “all elderly” population.
This could occur in a hotel if a particular conference or event takes place for older adults
near by the hotel. The “elderly” body size is 0.113 m2, the population speed is 0.8 m/s

292
(+/- 0.3 m/s), and the multiplication factor for walking down stairs is 0.6. It is true that
Simulex specifies another body size that is smaller, which is the children body size. This
is not used to represent the entire smaller and slower population because the children’s
speed is faster than the “elderly,” and it is also not feasible to design for an entire hotel
filled with children, without adult supervision. The children occupant type is taken into
account in the hotel use variation simulations.
The larger body sizes and fastest speed populations are two different occupant
types. The first being an all male population, which corresponds to the following inputs:
0.131 m2 body size, 1.35 m/s (+/- 0.2 m/s), and a multiplication factor for walking down
stairs of 0.6. The second occupant type simulated is an all median population, consisting
of a body size of 0.118 m2, unimpeded speed of 1.3 (+/- 0 m/s), and a multiplication
factor for walking down stairs of 0.6. These two occupant types are also provided by
Simulex. Two occupant types are simulated for bounding because although the all male
population may have a larger body, the speeds are varied and can be slower than the
median occupant type. The median occupant type is used to represent an average of body
sizes with no variation in speed. Both occupant types are selected to produce faster
evacuation times for the hotel building.
An occupant type of all females is also simulated because of the fact that the
female body is a smaller size than the males and median bodies. On the other hand, the
female occupant type contains a slower speed. This simulation is run to check which
input, a smaller body size or faster speed, has a greater effect on the evacuation time.
The female occupant type contains the following inputs: 0.101 m2 body size, 1.15 m/s
(+/- 0.2 m/s) and 0.6 is the multiplication factor for downstairs movement.

293
Hotel use variation For the fire comparison run, the hotel occupant statistics are obtained from DK
Shifflet’s DIRECTIONS Travel Information System. The purpose of the comparison
run is to capture an average population of hotel guests, and this is done by combining
percentages of business and leisure stays into one simulation. For the bounding analysis,
separate scenarios are simulated to anticipate an emergency in a primarily business hotel
and a hotel primarily used for leisure stay. As mentioned earlier, the percentages of men,
women, children, and older adults for both a business and leisure trip are provided by
DIRECTIONS and are restated here: Business - 58% male, 42% female and Leisure -
45% male, 33% female, 10% older adult, and 12% children. The last simulation run
under hotel use variation is of a hotel being used to house summer camps. This
simulation involves a population containing 95% children and 5% adults.
Occupant mobility variation As mentioned before, Simulex allows the user to designate any population
distribution (made up of any type of body size and speed) for their specific building.
This is done for the Hotel use variance runs. This is also used for the Occupant mobility
simulations. A hotel population with 3% (acknowledging the number of rooms
designated to handicapped or disabled occupants) disabled population is created. Data
for the movement of the disabled occupants was acquired from data collected by Boyce et
al.143. This article captures the movement speed of disabled occupants (using crutches,
canes, rollators, wheelchairs, etc.) on horizontal and vertical building components.
The occupant types that are used to create this population involve the previous
hotel distribution (49% male adults, 35% female adults, 11% older adults, and 5%

294
children) used in the fire comparison run and a created disabled population. This
population is entitled “hotel with 3% disabled” and contains 97% of the hotel type and
3% of the disabled type. The percentage of 3% for the disabled occupant type is decided
upon by calling the actual hotel building used in this research to ask for the number of
guestrooms that are designated for handicapped or disabled occupants. Out of 506
guestrooms and 28 suites in this hotel, 7 have an accessible shower, 11 have an accessible
tub, and 28 have equipment for the hearing impaired. Since the hearing impaired would
not necessary have slower movement, they are not included here in the calculation for
disabled occupants. Therefore, 18 divided by 534 rooms provides an estimate of 3%
disabled occupants. This is strictly an estimate since it is likely that all accessible rooms
will not be occupied at one time, as well as not all disabled or slower moving occupants
require accessible rooms. Also, if a hotel is equipped with a greater number of accessible
rooms, for instance 5%, it is likely that not all disabled occupants will be able to traverse
the stairs on their own. Some will be in a wheelchair and will require occupants to carry
them down or to be rescued by firefighters via elevator (Phase II control). Therefore, 3%
is a reasonable estimate to use here in the simulation of disabled occupants in a hotel
scenario.
The disabled occupant type is assigned the “median” body size to represent adult
sizes. The speed of the disabled occupant type is decided upon by using data from Boyce
et. al143. This article provides data on disabled occupants traversing horizontal building
components, inclines, and up and down stairs. The data used for the disabled simulation
involved those occupants using crutches, walking sticks, and rollators as well as
occupants defined as having “locomotion disability” but did not require a walking aid.

295
Other occupants, such as wheelchair users, would not be included in those occupants
using the stairs. Although Boyce et al did not have a large number of participants in the
study, the article provides a good estimate. The range of horizontal movement for the
disabled population is a mean of 0.8 m/s with a variation of +/- 0.37 m/s. This data is
used for horizontal movement in Simulex. For movement downstairs, the range of speed
includes 0.11 – 0.7 m/s with a mean of 0.33 m/s. This results in a 0.4 multiplication
factor of movement down stairs, another input used in Simulex. Overall, the hotel with
disabled population involves a distribution of men (47%), women (34%), children (5%),
older adult (11%), and disabled (3%) occupant types.
Another occupant population that is created to bound the evacuation results is an
all disabled occupant population. This will present a very slow evacuation, although not
as practical of a fire scenario for a hotel.
Additional Bounding Analysis Runs for EXIT89
Similar to Simulex, the purpose of this exercise is to use EXIT89 to alter the
occupant characteristics of the population, such as occupant speed, body size, mobility,
and delay time, in an attempt to bound the evacuation results from the hotel building.
The purpose of the bounding analysis for any design is to attempt to anticipate other
emergency situations, such as a change in fire location, fire type, time of day, season,
change in hotel use, difference in hotel guests, etc.
As mentioned earlier, other characteristics, such as occupant initial location,
route, and population numbers for the building are not altered, which does put a
limitation on the breadth of evacuation scenarios use to bound results. For the purpose of

296
this thesis, a majority of the focus is on the body size and speed of the occupants,
dependent on certain circumstances.
Unlike Simulex, however, EXIT89 does not allow the user to specify groups of
occupants. In other words, any occupant characteristic specified applies to the entire
population of the building. Also, the model allows the user to choose only from three
different body sizes that apply to the entire population; American, Soviet, and Austrian,
and two different speeds; emergency and normal. This model does not give the user the
choices and range of occupant characteristics, as does Simulex. Therefore, less flexibility
is given to the user to bound the evacuation results.
The simulations run with EXIT89 are run either with no delay time or with a 30
second to 10 minute range distributed randomly over the entire population (the same
delay used for the fire comparison run). The runs using EXIT89 (with and without a
delay time) are the following:
Occupant body size and speed variation
• American emergency
• Austrian normal
• American normal
• Austrian emergency
• Soviet normal
Occupant mobility variation
• Soviet emergency with 3% disabled occupants
• All disabled occupants

297
Because of the limitations in input for occupant characteristics, only the body
size/speed variation and occupant mobility variation can be performed to bound the
evacuation results. This leaves out the opportunity to vary hotel use and simulate a
variety of speeds with which the occupants traverse the hotel building.
Occupant body size and speed variation For each EXIT89 simulation, the user must choose one of the three body sizes and
one of the two speed choices. The body sizes of the 3 choices are provided here: 0.1458
m2 for Austrian, 0.1130 m2 for Soviet, and 0.0906 m2 for American. Also, by consulting
the density/speed tables used by EXIT89, the emergency speed for horizontal
components is 1.36 m/s at a density of 0.01 m2/m2 and the normal speed is 0.915 m/s at a
density of 0.01 m2/m2.
With that said, the combination of body size and speed that should create the
fastest evacuation time is that of American emergency. On the other hand, the slowest
evacuation times should result from the Austrian normal combination. All other
combinations are run in order to check this speculation.
Occupant mobility variation Similar to Simulex, occupants with disabilities are added to the fire comparison
run (Soviet emergency). 31 occupants total, which is 3% of 1044 occupants, are added to
the simulation randomly by the user. EXIT89 requires that the user manually place the
disabled occupants in certain nodes throughout the building and specify the disabled
occupants’ percentage of the "normal" walking speed.
In order to arrive at this input, which is different from what Simulex requires, the
Boyce et al. reference143 was again consulted. The velocities provided by Boyce et. al are

298
then compared with the initial unimpeded speeds provided in the model31 for horizontal
and vertical building components. This comparison aids in the estimation of the
percentage of the “normal” walking speed input for EXIT89. The initial speed of
emergency movement for horizontal movement is 1.36 m/s and downstairs is 0.99 m/s.
As stated earlier, disabled occupants travel 0.8 m/s (mean) on horizontal components and
0.33 m/s (mean) downstairs. The percentage “able-bodied speed” for disabled occupants
on horizontal is 58% (1.36 m/s * 0.58 = 0.8 m/s) and on stairs is 33% (0.99 m/s * 0.33 =
0.33 m/s). Since these percentages differ and EXIT89 requires only one percentage of
“able-bodied speed”, an average percentage had to be calculated. This average is 45%
(average of 58% and 33%).
However, since 45% may not capture the range of different speeds and the
majority of the movement of occupants (especially those on higher floors) is on the stairs,
disabled occupants are randomly assigned percentages ranging from 0.33 to 0.58, with a
majority focused on 0.45. In total, 3% (or 31 occupants) are assigned a disabled speed
percentage. This covers 1 person on every floor with an additional person (total of 2) on
floors 2, 4, 6, 8, 10, 12, 14, 16, 18, and 20 to reach a total of 31 disabled occupants.
These occupants are manually placed on each floor in different places throughout the
floor plan ranging from rooms right next to the staircase to rooms in the middle of the
hallway (which would involve walking the furthest distance to get to the stairs).
Also, as is performed in Simulex, an all disabled population is input as a bounding
simulation. All 1044 occupants are given the average 0.45 percentage of “normal”
walking speed, so as to simplify manual input.

299
The fire comparison (design scenario) run results from each model is compared
and analyzed in the next chapter. Also, all evacuation simulations attempting to bound
the evacuation results are presented and discussed for each model. This provides an
evacuation result range for each model which will then be compared and analyzed
between EXIT89 and Simulex.

300
CHAPTER 9: RESULTS AND ANALYSIS OF DIFFERENCES IN MODELS
The purpose of this chapter is to present and compare the results from the fire
comparison run (design scenario) from Simulex and EXIT89. As stated in Chapter 7, the
fire comparison scenario, referred to as the “hotel” simulation, involves a fire ignited by a
cigarette on a mattress in a guest bedroom on the 15th floor of a 21 story hotel (fully
occupied with 1044 occupants). This fire occurs at approximately 3 a.m. in the morning
during the winter season. The models are used to their full capacity in order to simulate
this fire scenario as realistically as possible. All inputs chosen for each model are
presented in Chapter 8. Chapter 9 aims to compare the results from each model for the
fire comparison run (hotel) and discuss possible reasons for any differences. Two
additional scenarios, both including disabled occupants, are used in a limited fashion to
compare the models. Since both models have the capabilities of including disabled
occupants and a performance-based design is likely to include such a scenario, it is
important to assess these differences. Also, it is imperative to include more than one data
point in assessing differences in the models.
Once the fire comparison runs are compared and analyzed, results from the
bounding analysis from each model are presented and discussed. Since a performance-
based design aims to bound the evacuation results by running combinations of model
inputs, the evacuation time results from each model are presented as a range and
compared. The purpose of the bounding results comparison is to assess whether or not
the two models provide a similar range of evacuation times for the same building. If
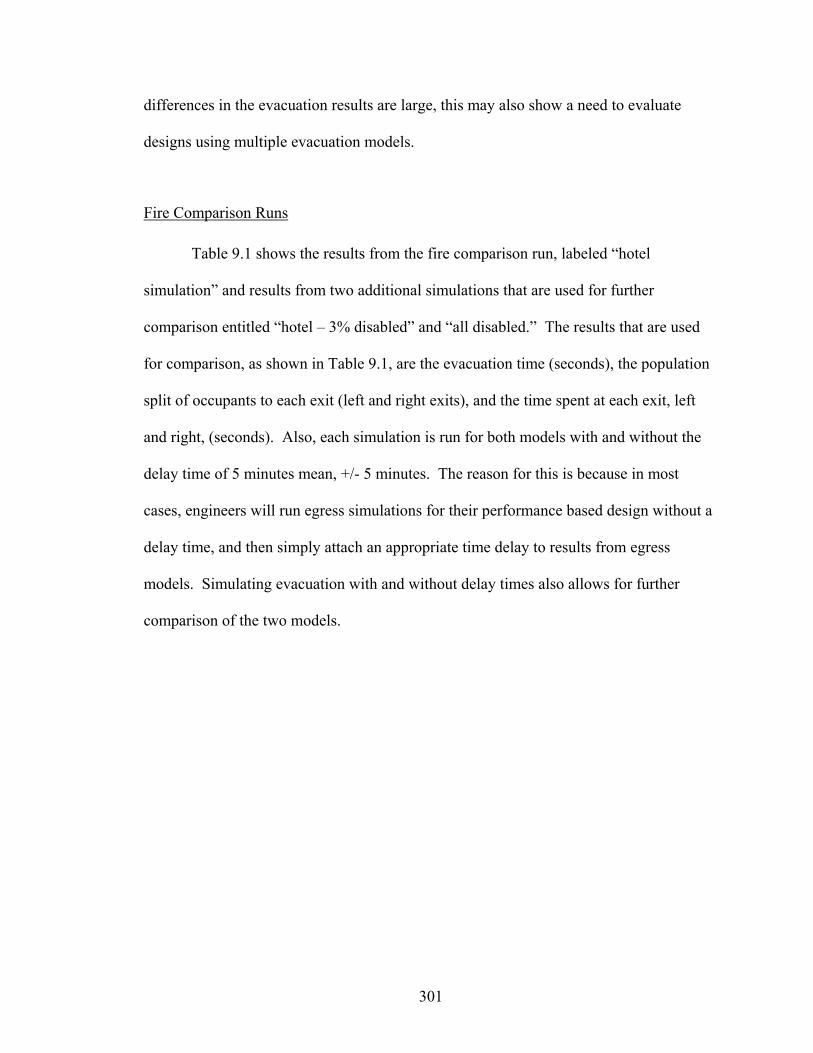
301
differences in the evacuation results are large, this may also show a need to evaluate
designs using multiple evacuation models.
Fire Comparison Runs
Table 9.1 shows the results from the fire comparison run, labeled “hotel
simulation” and results from two additional simulations that are used for further
comparison entitled “hotel – 3% disabled” and “all disabled.” The results that are used
for comparison, as shown in Table 9.1, are the evacuation time (seconds), the population
split of occupants to each exit (left and right exits), and the time spent at each exit, left
and right, (seconds). Also, each simulation is run for both models with and without the
delay time of 5 minutes mean, +/- 5 minutes. The reason for this is because in most
cases, engineers will run egress simulations for their performance based design without a
delay time, and then simply attach an appropriate time delay to results from egress
models. Simulating evacuation with and without delay times also allows for further
comparison of the two models.

302
Table 9.1: Results of fire comparison run and additional disabled simulations
NO DELAY Simulex EXIT89 Simulation Evacuation
Time (s) Flow Split
Time at Exit (s)
Evacuation Time (s)
Flow Split
Time at Exit (s)
Hotel simulation
735 L=582 R=462
L=735 R=635
445 L=582 R=462
L=445 R=386
Hotel – 3% disabled
1029 L=582 R=462
L=1029 R=815
633 L=582 R=462
L=496 R=633
All disabled 1319 L=582 R=462
L=1319 R=1020
990 L=582 R=462
L=990 R=859
DELAY –
0.5–10 MIN Simulex EXIT89
1140 L=1140 R=1005
Hotel simulation
1195
L=582 R=462
L=1140 R=1195
809 L=582 R=462
L=806 R=809
Hotel – 3% disabled
1378 L=582 R=462
L=1378 R=1190
969 L=582 R=462
L=934 R=969
All disabled 1592 L=582 R=462
L=1525 R=1592
1226 L=582 R=462
L=1226 R=1085
Table 9.1 indicates EXIT89 evacuation times are 40% lower in the two hotel
scenarios and a 25% lower in the “all disabled” scenario for the simulation with no delay
time. For the simulations including a delay time with a 5 minute mean (+/- 5 minutes),
EXIT89 provides an evacuation time that is 30% lower than Simulex for the two hotel
simulations and approximately 25% lower for the “all disabled” simulation. Overall,
Simulex provides a 25-40% higher evacuation time when compared to EXIT89 for these
three evacuation scenarios.
However, when comparing the number of occupants using each exit (flow split),
both Simulex and EXIT89 produce the following results; 582 occupants use the left exit
and 462 occupants use the right exit. A similar flow split from both models is expected
because the shortest distance route for the occupants is chosen for Simulex and EXIT89.
This shows that the models are both seeing occupant distances in the same way and that

303
occupants are moving along the same path in both models. If occupants are moving
along the same path in Simulex and EXIT89, differences in the results could possibly be
attributed to other inputs, such as body size and speeds.
Another set of results that is compared among Simulex and EXIT89 is the time
spent in each exit by the occupants. It is known that the same number of occupants is
using the exits, shown by the flow split results. However, Simulex is showing longer
times spent in the exits by the same number of occupants. This difference is researched
and analyzed in this chapter.
Possible Reasons for the Differences in the Results Given by Simulex and EXIT89:
• Actual stair configuration input
• Differences in body sizes
• Differences in unimpeded speed
• Differences in the number of occupants allowed in a stair section at one time
• Differences in the speed on horizontal components and stairs of the occupants
controlled by movement algorithms of each model
• Differences in the evacuation time recorded when 99% of the occupants have
evacuated the building
• Differences in the way the models handle slower moving occupants
• Differences in the way that the models handle response distributions
All of these possible reasons for differences are explored and reported upon.
These reasons may prompt additional simulations using either of the two models, and
these results are reported and analyzed. Finally, conclusions are made noting the

304
significant reasons for the differences in the evacuation results from Simulex and
EXIT89.
Stair configuration input
Continuous staircase One possible cause of the differences in results between
EXIT89 and Simulex could be the stair configuration and method
of input for the stairs into each model. The occupants of the
building spend most of their evacuation time on the staircase. As
stated in Chapter 8, the method of input for the staircases in
Simulex is to include separate staircases for each floor. On the
other hand, EXIT89 requires only that each staircase section be
represented by one node and the entire staircase is represented by
the connection of all stair nodes together. In other words, the
model recognizes the stair as one continuous section (without
turns on landings) that each floor plan flows into. Because of
the differences in stair input, Simulex input for the hotel
building is altered so that only one left and one right staircase is
created for the entire building. An example of the left continuous staircase is shown in
Figure 9.1. By using this technique, once the occupants enter the staircase from any
floor, they will continue to traverse the straight, continuous stairwell until reaching Floor
0 (containing their exits).
Although this may be a faster mechanism for inputting building configurations, it
seems to subtract from the accuracy of the simulation. Occupants evacuating an actual
Figure 9.1: Example of continuous left stair

305
building do not continue in a straight line throughout their entire trip. At each floor and
in between each floor, they are required to twist their bodies around a corner to continue
down the next flight of stairs. The continuous stairway, however, does give the user a
better view of the flow and movement in the stairwells. Also, when consulting the
developer of Simulex, Thompson speculates that simulating separated staircases may
cause pessimistic evacuation results84. He goes on to explain that “people are perhaps
inclined to obstruct the paths of other people more readily when changing direction
(ignoring the obstruction to movement that they cause, rather than the direct effect upon
themselves).” However, the separate stair simulation seems to simulate a more accurate
representation of high-rise building movement.
In order to test this theory using other types of occupant characteristics within
Simulex, several different simulations are run using the continual staircase for the left and
right stairs (all with no delay time). The Simulex simulations run with the continuous
stair include all simulations run for the bounding analysis for the Simulex model (low and
high evacuation times), as shown in Table 9.2. These continual stair simulations are then
compared to the previous, more realistic, separate stair simulations (which are used in the
actual fire comparison run and subsequent bounding simulations). The results are found
in Table 9.2.

306
Table 9.2: Simulex bounding simulations, no delay, used to compare the separated and continuous stair configurations
SIMULEX – No delay
Separated Stairs One continuous staircase
Overall
Simulation Evacuation Time (s)
Time at Exit (s)
Evacuation Time (s)
Time at Exit (s)
Difference in Evac. Time
All Hotel population
735 L=735 R=635
698 L=698 R=555
- 5%
Hotel population + disabled
1029 L=1029 R=815
1079 L=930 R=1079
+ 5%
All disabled 1319 L=1319 R=1020
1230 L=1230 R=1155
- 7%
All Male 590 L=590 R=490
552 L=552 R=435
- 6%
All Median 591 L=591 R=460
447 L=447 R=370
- 24%
All Female 620 L=620 R=540
460 L=460 R=390
- 26%
All Elderly 1073
L=1073 R=860
856 L=856 R=720
- 20%
Business Stay 603 L=603 R=515
510 L=510 R=405
- 15%
Leisure Stay 699 L=699 R=680
707 L=707 R=625
+ 1%
95% Children, 5% adult (camp)
738 L=738 R=650
596 L=575 R=596
- 20%
All 1.0 m/s 745 L=745 R=630
591 L=591 R=480
- 20%
All 1.2 m/s 602 L=602 R=515
489 L=489 R=400
- 19%
All 1.4 m/s 537 L=537 R=430
420 L=420 R=335
- 22%
1.2 m/s + jackets 803
L=803 R=615
595 L=595 R=450
- 26%
Overall Range:537-1319 Range:420-1230 - 24% to 0
Simulations using the continuous staircase provided faster evacuation times,
except in the simulations with slower and disabled occupants mixed with faster moving
occupants. This exception is shown in the following simulations: “hotel,” “hotel with
disabled,” and “leisure stay.” The reason for the increase in the evacuation time for the
“hotel population with disabled” and “leisure stay” simulations is due to the random

307
placement of the slow occupants by the model. If a slower occupant is placed in a certain
part of the building, especially on a higher level in the building, that speed dominates for
all other occupants (who are unable to pass the slow occupant) in the staircase. Because
of this, all occupants behind the slow-moving person take on the slow speed, thereby
negating their own speed. Also, their slow speed negates the change in stair
configuration if they are placed high enough in the building to affect the movement of a
large number of occupants.
For all other simulations that include mobile (faster) occupants, the decrease in
evacuation time with the continuous stair ranges from approximately 40 seconds (“all
males”) to 208 seconds (“1.2 m/s + jackets”), or a range of 6-26%. Also, for the “hotel”
run, approximately a 1-minute decrease in evacuation time is calculated by Simulex, even
though this simulation included slower moving occupants. This difference in evacuation
time seems logical because occupants in the continuous staircase no longer have to wrap
around the stairs at each floor. When analyzing movement of the occupants in the
separated staircase simulations, several occupants wrap around the landings one by one,
at times, and other times, travel 2 people across through the landing area. When
analyzing the continuous stair simulations, the model allows the occupants to move freely
(and at times, two-abreast) and continuously down a long, straight staircase.
As mentioned earlier, it is logical to see small decreases in evacuation time for the
simulations with a percentage of slower occupants, such as the “hotel population,” “hotel
with disabled,” and the “leisure stay” simulations. However, there is a question as to why
the “all males” simulation only produces a 6% decrease in evacuation time when other
simulations with larger bodies, such as the “all median” and the “jackets” simulations

308
have a much larger decrease in evacuation time. Due to this confusion, the “all males”
simulation is observed compared with the “all median” and “1.2 m/s + jackets”
simulations because all of the three simulations mentioned contain occupants with larger
body sizes and faster evacuation speeds. It did not seem logical that both the median and
jackets simulations included such a large decrease in evacuation time, while the males
simulation did not.
Observations are made of each simulation; “all males,” “all median,” and “1.2 m/s
+ jackets,” and are reported below. The “all males” simulation includes all occupants
traveling at a speed of 1.35 m/s (+/-) 0.2 m/s with an overall body size of 0.131 m2 (0.27
m for the radius of the body circle, 0.16 m for the radius of the torso circle, and 0.10 for
the radius of the shoulder circle). During the observation and as shown in Figure 9.2,
many of the men travel the stair single file in the center of the stairway. This is seen
frequently throughout the simulation, especially in the beginning of the simulation, when
people are still entering the stairwells from the floors. During any backup or slow down
in the stair, the occupants move down the stair in a single file line. And when the men
begin to move faster, all of the occupants either travel in a staggered pattern or in a single
file line (never 2-abreast movement).
The “all median” simulation includes all occupants traveling at a speed of 1.3 m/s
(+/-) 0.2 m/s with an overall body size of 0.118 m2 (0.25 m for the radius of the body
circle, 0.15 m for the radius of the main torso circle, and 0.10 m for the radius of the
shoulder circle). During the observation and as is shown in Figure 9.3, the occupants
freely move down the stairs 2-abreast throughout the entire simulation. The occupants
travel single file or even staggered for short portions of the stair between larger groups of

309
tightly packed occupants. In the “all median” simulation, occupants get closer in the stair
than the “all males” or “jackets” simulations. The “all median” occupants have a smaller
body size than males, which allows them to move closely throughout the stair. The “all
median” occupants also travel at a similar speed when compared with the “all males.”
Therefore, it makes sense for the “all median” occupants to have a faster evacuation time
in the continuous stair simulation, which results in a larger percentage decrease (when
compared to “all males”).
Lastly, the “1.2 m/s + jackets” (known as “jackets”) simulation includes all
occupants traveling at a constant speed of 1.2 m/s with an overall body size of 0.247 m2
(0.25 m for the radius of the body circle, 0.235 m for the radius of the torso circle, and
0.10 m for the radius of the shoulder circle). During the observations of the “jackets”
simulation, as shown in Figure 9.4, occupants travel throughout the stair in a close,
staggered pattern. At times throughout the evacuation, the occupants move at 2-abreast.
Even though these occupants have a larger torso radius and body size, their overall body
radius (0.25 m) is still smaller than the “all males” occupants (0.27 m). It is assumed that
the developer uses these body sizes for a jacketed population with the understanding that
occupants still get closer to each other even with the presence of jackets, shown by a 0.25
m body radius. It makes sense for the “jackets” simulation to have similar evacuation
results to the “all males” simulation because although the jackets simulation has a smaller
body size than the males, they also move at a slower speed than the males.
From these observations and Figures 9.2-9.4, the large percentage decrease of the
“jackets” continuous stair simulation seems to be consistent with decreases seen for the
“all males” and “all median” simulation. This comparison and the large percentage

310
decrease in evacuation time (between the stair input methods) shows that the “jackets”
separate stair simulation may have caused some unnecessary delays due to body sizes
throughout the stair.
Overall, the results of the stairway change in Simulex for the three main
simulations are included in Table 9.3 for comparison purposes. With the change in stair
configuration for Simulex, the results given by EXIT89 for no delay are still 36% lower
in the “hotel” simulation, 40% lower in the “hotel with disabled” simulation, and 20%
lower in the “all disabled” simulation. For the delay simulations, EXIT89 for all three
simulations is lower by a range of 25%. Even with the stair change, EXIT89 still differs,
using these three simulations, by a range of 20-40%.
Figure 9.2: "All Males" single file movement
Figure 9.3: "All Median" 2-abreast
Figure 9.4: "All 1.2 + jackets" closely staggered

311
Table 9.3: Results of fire comparison run and additional disabled simulations with addition of continuous stair simulations
NO DELAY Simulex EXIT89 Separated Stair Continuous Stair
Simulation Evac Time (s)
Time at Exit (s)
Evac Time (s)
Time at Exit (s)
Evac Time (s)
Time at Exit (s)
Hotel 735 L=735 R=635
698 L=698 R=555
445 L=445 R=386
Hotel with disabled
1029 L=1029 R=815
1079 L=903 R=1079
633 L=496 R=633
All disabled 1319 L=1319 R=1020
1230 L=1230 R=1155
990 L=990 R=859
DELAY Simulex EXIT89
1140 L=1140 R=1005
Hotel
1195 L=1140 R=1195
1091 L=1085 R=1091
809 L=806 R=809
Hotel with disabled
1378 L=1378 R=1190
1264 L=1220 R=1264
969 L=934 R=969
All disabled 1592 L=1525 R=1592
1647 L=1647 R=1610
1226 L=1226 R=1085
Difference in body sizes
Another possible cause for the differences in EXIT89 and Simulex output is the
body sizes used for the occupants in each model. In Simulex, the average body size is
calculated by adding together the percentages of each type of body size involved in the
individual simulation. As shown in Table 9.4, the average body sizes for each model
used in all three simulations are approximately equivalent. Any differences among the
average body sizes for each model and simulation are in the thousandths of a square
meter. It should be noted, however, that in EXIT89, all occupants move with the same
body size. In Simulex, for the “hotel” and “hotel – 3% disabled” simulations, almost half

312
of the population has a body size that is 0.02 m2 larger than any of those simulated by
EXIT89.
Table 9.4: Body size comparison for each simulation
Body sizes Simulex EXIT89 Simulation Body type Body size
m2 Average
body size m2Body name Body
size m2
49% Males 0.131 35% Females 0.101 5% Children 0.072
Hotel simulation
11% Elderly 0.113
0.115 100% Soviet 0.113
47% Males 0.131 34% Females 0.101 5% Children 0.072 11% Elderly 0.113
Hotel – 3% disabled
3% Disabled 0.118
0.115 100% Soviet 0.113
All disabled 100% Disabled 0.118 0.118 100% Soviet 0.113
Analysis of the three simulations is performed later in the chapter to evaluate the
number of occupants each model allows in a stair section as one time period. This will
aid in concluding whether or not body size plays a role in the larger evacuation times
created by Simulex. Similarly, each model’s movement algorithms, in which body size is
a factor, is analyzed and compared.
In order to check the feasibility of these average body sizes, the Life Safety Code
Handbook88 is consulted on anthropometric data for the 97.5 percentile of adults. The
body size given by the Handbook is calculated to be 0.11 m2, which is similar to the body
sizes in Table 9.4.
Difference in unimpeded speeds
Similar to the previous section, another reason for differences in the results for the
two models could be the unimpeded speeds used in each model’s simulation. Table 9.5

313
shows the unimpeded speeds in EXIT89 and Simulex given to each body type for all
three simulations. Similar to the body size input, if an emergency speed is input into
EXIT89, all occupants move at that unimpeded speed until density increases. Chapter 5
includes tables from Predtechenskii and Milinskii31, which are used in EXIT89 to show
the relationship between speed and density of the occupants.
In Simulex, each body type is also given a specific unimpeded speed, as shown in
the table. Since a variety of occupant types are used in each simulation, Table 9.5
provides the mean unimpeded speed of the simulation and the range of occupant speeds.
In addition, the multiplication factor of the occupants on the stair is included for each
model.
However, each model handles stair movement differently. A multiplication factor
for stair movement is included in the table for comparison purposes. The horizontal
speed of the occupant is multiplied by this multiplication factor to achieve speeds on
stairs. In the Simulex input file, the user can specify the actual multiplication factor for
both up and down stair movement. In all body types, except for disabled, a multiplication
factor of 0.6 is used. A factor of 0.4 is used for all disabled occupants. A 0.6
multiplication factor, for example, allows the model to move occupants at 60% of their
horizontal speed. In EXIT89, the model uses the Predtechenskii and Milinskii chart
specifically for movement downstairs, which begins at an unimpeded speed of 0.99 m/s
for able moving occupants moving at emergency movement. An initial multiplication
factor of 0.72, shown in Table 9.5, is solved for in EXIT89 by dividing 0.99 m/s (down
stairs) by 1.36 m/s (horizontal movement), for comparison purposes only. Stair

314
multiplication factors can be altered in Simulex, whereas in EXIT89, the density vs.
speed tables are already set.
Table 9.5: Average unimpeded speeds on horizontal and stair components for each model
Initial Speeds
Simulex EXIT89
Simulation Body type Initial speed (m/s)
Average speed (m/s)
Speed name Initial Speed (m/s)
49% Males 1.35 +/- 0.2 35% Females 1.15 +/- 0.2 5% Children 0.9 +/- 0.3
Hotel simulation
11% Elderly 0.8 +/- 0.3
1.19 mean; 0.5-1.55; (0.6 stairs
factor)
100% Emergency
1.36 horiz; (0.72 stairs
factor)
47% Males 1.35 +/- 0.2 34% Females 1.15 +/- 0.2 5% Children 0.9 +/- 0.3 11% Elderly 0.8 +/- 0.3
Hotel – 3% disabled
3% Disabled 0.8 +/- 0.37
1.18 mean; 0.43-1.55; (0.6/0.4
stairs factor)
97% Emergency; 3% disabled
1.36 horiz, .45-0.79 horiz
disabled; (0.72 stairs
factor)
All disabled 100% Disabled
0.8 +/- 0.37 0.8 mean; 0.43-1.17; (0.4 stairs
factor)
100% Disabled
0.61 horiz; (0.72 stairs
factor)
For the “hotel” simulation, Simulex occupants move at a mean unimpeded speed
of 1.19 m/s (with a range of 0.5-1.55 m/s) and EXIT89 occupants move at 1.36 m/s for
horizontal components. Even with a large distribution of male occupants possibly
moving faster (maximum of 1.55 m/s) in Simulex, all of the occupants in EXIT89 begin
with a fast speed of 1.36 m/s. This could certainly be a causal factor for EXIT89’s faster
evacuation times. Also, EXIT89 has a smaller initial decrease in speed down stairs,
which could also contribute to faster evacuation times.
For the “hotel with 3% disabled” simulation, the addition of 3% disabled
population lowers Simulex’s mean unimpeded speed to 1.18 m/s (0.43 – 1.55 m/s range).
On the other hand, EXIT89 contains a mean speed of 1.36 m/s with 3% of the population
ranging from 0.45 to 0.79 m/s. Again, the mean speed is higher for the majority of the

315
occupants in the simulation. Also, for all occupants, the initial stair factor in EXIT89 is
still 0.72. For Simulex, the disabled occupants move with a 0.4 stair multiplication
factor. This is a possible reason for the large difference in evacuation times.
Lastly, for the “disabled” simulation, even though the mean speed of occupants in
Simulex is larger than that of EXIT89, Simulex provides a randomly distributed range of
speed. This range of speeds is from 0.43 to 1.17 m/s. All of the disabled occupants in
EXIT89 move at a speed of 0.61 m/s. This could cause a smaller difference in evacuation
time between EXIT89 and Simulex, however, Simulex’s stair factor (0.4) is much lower
for all occupants than EXIT89’s initial multiplication factor (0.72).
Difference in the number of occupants in a staircase section at one time
Another possible reason for differences in input is the number of occupants that
each model allows in a stair section at one time. As mentioned in earlier chapters, when
occupants move closer together, each model has a different method of slowing occupants
due to density. The occupants’ stair speed and the overall movement algorithm control
the number of occupants in a stair section at any time in the simulation. This is relevant
because if one model allows the stair to become more crowded than the other with
occupants traveling at a higher speed, occupants are moving through the stairs at a faster
flow. The faster flow results in a faster evacuation time.
For this comparison, only simulations without a delay time are analyzed.
The reasons for this are twofold. One reason involves the fact that delay times are
frequently added onto evacuation simulation results, instead of included in the
simulation. Also, there is an interest in understanding maximum occupant numbers in

316
stair sections for each model, which can only be achieved by allowing all occupants to
travel to the stairs as soon as the simulation begins. The delay time simulations are
analyzed specifically in other sections throughout this chapter.
The output of EXIT89 poses a challenge to explicitly calculate the number of
occupants in a stair section during certain time periods throughout the simulation. The
output tracks the position of each occupant throughout the building for the entire length
of the simulation. Each line of output tracks the exact time, the occupant number, the
original start node of the occupant, the building node that the occupant is traveling from,
the building node that the occupant is traveling to, the number of occupants that have
exited the building, and the number of occupants trapped (if smoke is involved in the
simulation). The information and its organization provide some difficulty in arriving at
the number of occupants in the stairs at a certain time period.
However, a method for finding this information is developed using groups of
occupants entering a specific stair section (between floors 2 and 3) at the same point in
time. “Groups” of occupants from similar locations in the building enter a stair section at
the exact same time, seen in the output file. It is then noted, from the file, at which time
in the evacuation that this group would exit this stair section and enter the next. Then,
during this bracketed time period (that the “group” would travel inside the stair section),
it is noted the number of occupants that entered the stair section to join the original
“group” of occupants in the stair. This is representative of the number of occupants in
the stair section at the time just before the original “group” exits to the following stair.
For example, a group of 8 occupants enter stair section 398 (left stair on the 3rd floor) at
17.36 s and enter the following stair section at 35.98 s. Before 35.98 s, 20 more

317
occupants enter the stair 398 for a total of 28 occupants in the stair section at the time
period directly before the group of 8 enters the next stair section 298 (approximately
30.27 s is when the last occupant enters the stair before the group of 8 exits).
Table 9.6 shows the number of occupants inside the Left (398) and the Right
(399) stairs (one story of stairs only) at specific points in time throughout the “hotel”
simulation from EXIT89. It can be seen from the table that an average of 31 occupants
and 23 occupants can be found in the left and right stairs, respectively, at one time. Also,
Table 9.6 notes the range of occupants found in the stair at one time, including the
maximum number of 45 occupants for the Left stair.
Table 9.6: Numbers of occupants inside the Left and Right Stairs sections (measuring occupants on one story of stairs only) at specific points in time throughout the "hotel" simulation for EXIT89
Time (s) # of occupants in Stair 398
Time (s) # of occupants in Stair 399
30.27 28 30.12 22 50.11 28 45.49 22 69.16 28 60.64 22 86.98 28 76.56 22 105.21 29 90.62 20 119.29 22 105.67 22 137.53 28 111.03 16 157.72 34 125.63 22 176.37 27 139.8 22 197.6 36 154.4 22 214.92 20 187.38 28 234.43 36 200.8 8 240.37 8 220.83 32 269.29 45 238.65 6 313.47 43 262.29 36 357.07 44 296.5 36 400.16 42 352.65 40
Average 31 Average 23 Range 8-45 Range 6-40
Tables 9.7 and 9.8 capture the number of occupants in the left and right stair
sections (connecting floors 2 and 3) at specific points throughout the simulation using the

318
Simulex model. The method for recording this data is to playback the “hotel” simulation
and to pause the simulation at randomly chosen times to count the number of occupants
in each stair section. The recording of occupants included only those occupants
originating from the third floor and above.
Table 9.7: Numbers of occupants inside the Left and Right Stairs (in between floors 2 and 3) at specific points in time throughout the "hotel" simulation for Simulex – Separate Stair
Time (s) # of occupants in Left Stair Section
Time (s) # of occupants in Right Stair Section
29 12 23 12 47 21 45 14 108 20 57 11 118 18 111 21 141 18 133 18 163 21 152 21 198 19 174 20 236 22 200 20 275 23 246 21 321 28 280 20 344 27 312 20 354 27 328 20 375 26 353 22 425 22 367 20 449 24 392 21 495 21 433 5 524 21 463 19 558 24 521 25 598 11 532 22 613 3 559 1 661 1 Average 18
Average 19 Range 1-25 Range 1-28

319
Table 9.8: Numbers of occupants inside the Left and Right Stairs (in between floors 2 and 3) at specific points in time throughout the "hotel" simulation for Simulex – Continuous Stair
Time (s) # of occupants in Left Stair Section
Time (s) # of occupants in Right Stair Section
29 13 23 12 47 24 45 26 108 23 57 23 118 27 111 23 141 26 133 19 163 28 152 24 198 27 174 11 236 28 200 0 275 28 246 16 321 21 280 26 344 27 312 29 354 16 328 27 375 17 353 26 425 22 367 22 449 23 392 20 495 27 433 26 524 25 463 22 558 22 Average 21 598 24 Range 0-29 613 11
Average 23 Range 11-28
As shown in Tables 9.7 and 9.8, the continuous stair simulations allow a higher
average of occupants to be recorded in each stair. The reason for this may be due to the
fact that occupants on the floor landings are missed by analyzing the separated stair
simulations. Because of this, more confidence is placed in the data in Table 9.8.
As indicated in the three tables, even with the continuous stair simulated in
Simulex (Table 9.8), EXIT89 still allows a larger number of occupants in the stair section
at one time. The average number of occupants in the stairs is larger in EXIT89 when
compared to both simulations with Simulex. Also, the range of the number of occupants

320
in the stair at one time is also larger with EXIT89 ranging from 8-45 occupants
(compared to 0-29 occupants with continuous stair using Simulex).
The reasons for a lower number of occupants in the stairs in Simulex, when
compared with EXIT89, is based on the differences in unimpeded velocity, and more so
in the body sizes and the empirical relationships that slow occupants due to specific
densities of the space. From previous sections, it can be seen that Simulex contains a
lower (average) unimpeded velocity, a larger body size, and a different technique to slow
occupants due to density (which is explained in a later section). It could be seen from the
visualization of Simulex runs that occupants with larger body sizes would walk only 1-
abreast down the stairwell. Other times, occupants would walk 2-abreast, which shows
the manner in which Simulex handles differences in body sizes of the occupants in a
simulation. Also, when trying to input occupants into Stair 3 at a density of 0.222
m2/person (4.5 persons/m2), Simulex only allows a maximum of 28-30 occupants input
into Stair 3. This allows for a density of only 3 people/m2.
In EXIT89, however, instead of specifying the length and width of the stairwell,
the program is only aware of a total area of the space. Therefore, it can easily space a
specific number of occupants, of equivalent size, throughout each stairwell node, based
on the speed of the incoming occupants and the density of the space with time. The
differences in techniques of body size, velocity vs. density, and the input of the stairwell
alter the number of occupants in stair 3 throughout the simulation for each model.
EXIT89 allows a larger number of occupants in the stair at one time, when
compared to Simulex. The maximum numbers of occupants noted in Stair 3 are 45
occupants in EXIT89 and 29 occupants in Simulex. With the area of the stairwell being

321
9.93 m2, the density of the space for 45 occupants in EXIT89 is 4.5 persons/m2 (0.51
m2/m2) and for 29 occupants in Simulex is 2.9 person/m2. The EXIT89 value of 4.5
persons/m2 is off of the graphs created by Jake Pauls for speed vs. density and flow vs.
density1. However, when calculating the density used by Predtechenskii and Milinskii,
0.51 m2/m2 for 45 persons in the stair, the occupants are still able to move at this density.
This is an obvious difference in movement and density when using Predtechenskii and
Milinskii calculations compared to others, such as Pauls and Fruin. Fruin30 lists the
highest density in his level of service data for stairways (Level of Service F) as 0.37
m2/person (4 ft2/person) which is equal to 2.69 persons/m2. This is also less dense than
the allowance of Predtechenskii and Milinskii found in EXIT89 of 4.5 persons/m2.
Differences in speed on stairs discovered by comparing movement correlations
EXIT89 and Simulex use different methods for simulating speed of the occupants
throughout all building components and under various densities. EXIT89 uses a density
vs. speed relationship provided by the research of Predtechenskii and Milinskii for
horizontal components, through the doorway, and downstairs and upstairs movement.
Examples of these equations and data are presented in Chapter 5 of this thesis, as Tables
5.2 and 5.3 and Equations 5.2 through 5.5. For all building components, as density
increases, the speed of the occupant decreases. Much different from the data provided by
Pauls and Fruin, Predtechenskii and Milinskii data allows for a maximum density of 0.92
m2/m2 at a very slow speed of 0.1 m/s on stairs. With the Soviet body size of 0.113 m2,
this equates to an allowable density of approximately 8 persons/m2 in the hotel staircase.

322
Tables of velocities vs. densities for EXIT are also introduced in Chapter 5 as Tables 5.2
and 5.3.
Simulex, on the other hand, uses a different empirical relationship that slows
occupants due to their inter-person distance in a building space. This equation is also
included and explained in Chapter 5 as Equation 5.6. The walking velocity down stairs
in the Simulex model is restricted to 0.6 times the normal unimpeded velocity assigned to
each occupant characteristic/type, unless otherwise changed and stated by the author.
Since EXIT89 and Simulex use different
techniques to slow occupants in dense situations,
a method was devised by Thompson83, to equate
techniques for comparison purposes. The
method successfully equates density (m2/m2 or
persons/m2) and inter-person distance in the
following way. Thompson states that Fruin30
and Ando et al151 observed individual people
conforming to a circular spacing pattern while
moving in a crowd. Thompson also states that
Fruin defined “levels of service” for pedestrians based on a radius of personal space
surrounding the individual. This circular spatial zoning is used only as an approximation
for crowd movement. Thompson uses a circular spacing arrangement for analysis of
inter-person distance, which is shown in Figure 9.5 and is taken from Chapter 8 of
Thompson’s thesis83. Thompson uses this figure to show the reduction of the circular
formation into linear dimensions.
= − =1 0.5 0.87d2 2
Figure 9.5: Circular formation of occupants (83, p. 115)

323
“d” is used to describe inter-person distance or the forward spacing in between
individuals. Using the Pythagorean theorem, Thompson calculates the lateral or side
spacing to be 0.87d. From this situation, it can be derived that the quantity of total floor
space per person (in a crowded area) is equivalent to the forward distance d multiplied by
the side distance 0.87d. Thompson has derived the following equation (Equation 9.3) to
equate density and inter-person distance.
A=0.87d2 where A is area per person (m2) (9.1)
D=crowd density (persons per unit area) = 287.011
dA= (9.2)
d=inter-person distance (m) = D87.0
1 (9.3)
Equation (9.3) is used to convert density (m2/m2) used by Predtechenskii and
Milinskii into inter-person distance, so that the velocities used by both models can be
compared accurately. Since their density is in the form of m2/m2, it is first divided by the
body size of the simulated occupants, to convert the Predtechenskii and Milinskii density
into persons/m2. In the case of the hotel simulations, the Soviet body size used is 0.113
m2/person. In this case, all densities used by Predtechenskii and Milinskii have to be
divided by 0.113 m2/person to achieve a density of persons/m2. Once in that form,
equation (9.3) is used to convert all densities into inter-person distance, with each
corresponding emergency velocity (in m/s).
Next, calculations are made to calculate the speed of the occupants vs. inter-
person distance for the thesis simulations in Simulex. This is done by using Equation
(5.6) from Chapter 5 and inserting average values (found in Table 9.5 of this section)
from the hotel simulation run for unimpeded velocity and body depth. Two graphs,

324
Figures 9.6 and 9.7, are included showing the differences between EXIT89 and Simulex
occupant movement vs. inter-person distance on horizontal components and stairs. For
the stair graph, it must be noted that the average unimpeded speeds of the occupants in
Simulex is multiplied by 0.6, as is used in the model. Also, in both the horizontal
components and the stairs graphs, the maximum and minimum velocities (also found in
Table 9.5) are used to calculate the range of velocities modeled in the hotel simulation. It
should be restated that since a mixture of occupant types is used to simulate the hotel
scenario in Simulex, a range of velocities are input into the simulation. This is unlike
EXIT89, where all occupants moved at the same unimpeded speeds and contained the
same body sizes. The graphs for the horizontal components and stair movement for
Simulex and EXIT89 (using Predtechenskii and Milinskii equations (P&M)) are included
as Figure 9.6 and 9.7.
Figure 9.6: Graph showing velocity on horizontal components vs. Inter-person distance for both models
Velocity on horizontal components vs. Inter-person distance for thesis run
0.000
0.200
0.400
0.600
0.800
1.000
1.200
1.400
1.600
1.800
0.00 1.00 2.00 3.00 4.00
Inter-person distance (m)
Velo
city
(m/s
)
Velocity on horizontal (m/s) for P&Memergency movementVelocity on horizontal (m/s) Simulexaverage thesis runVelocity on horizontal (m/s) SimulexMax ValuesVelocity on horizontal (m/s) SimulexMin Values

325
Figure 9.7: Graph showing velocity on stairs vs. Inter-person distance for both models
Velocity on stairs vs. Inter-person distance for thesis run
0.000
0.200
0.400
0.600
0.800
1.000
1.200
0.00 0.50 1.00 1.50 2.00 2.50 3.00 3.50 4.00
Inter-person distance (m)
Velo
city
(m/s
)
Velocity on stairs (m/s) for P&Memergency movementVelocity on stairs (m/s) Simulexaverage thesis runVelocity on stairs (m/s) SimulexMax ValuesVelocity on stairs (m/s) Simulex MinValues
From these graphs, it can be seen that the average Simulex velocity and EXIT89
(P&M) velocity on horizontal components of the building are fairly similar. At inter-
person distances below approximately 1.2 m, the mean velocity of Simulex is slightly
higher than that of EXIT89 (a difference of about 0.1 to 0.2 m/s). Above the inter-person
distance of 1.2 m, EXIT89’s velocity is higher than the mean of Simulex. However,
since most of the time spent during this hotel evacuation is on the stairs, Figure 9.7 is
analyzed more closely. The mean velocity of the occupants in Simulex is much lower
that that of EXIT89 on stairs. Because of this, even the maximum values of velocity by a
fraction of the occupants in Simulex (males body type) are still lower than that of
EXIT89 by all occupants. Simulex produces greater velocities at low inter-person
distances of 0.5 m and below, but it is rare to see numbers this low in either model. An
inter-person distance of 0.5 m is equivalent to a density of 4.51 persons/m2 or 0.51
m2/m2. In the hotel staircase, this is represented by a value of 45 persons in the stairwell
at one time, as mentioned in numbers in the stair section of this chapter. This high

326
number of occupants is seen only by EXIT89 on a single occasion in the left stair section
(Stair 398). The averages of occupants in the left stair section, for instance, at one time
period are 31 for EXIT89 and 21 for Simulex (average of separate and continuous stair
simulations), which is equivalent to an inter-person distance of 0.61 m (0.43 m/s) and
0.74 m (0.381 m/s mean) respectively. After 0.5 m, EXIT89’s velocities significantly
increase above the velocities of the average Simulex velocity. Because of this data,
Figures 9.3 and 9.4 explain why EXIT89 produces a faster evacuation time in each of its
simulations.
Differences in evacuation time when 99% of occupants evacuate the building
During Simulex simulations, it is noticed that a majority of the occupants
evacuate the building in a significantly lower evacuation time than would result from the
entire population. This could be another possible cause of the differences in the results
from the two models. Therefore, it is of interest to understand the difference in
evacuation time between 99% population escape and 100% population escape for each
model. If there is a significant difference in escape times from 99% and 100% of the
population, reasons for such are analyzed and explained. 1% of the population includes
approximately 10 people.

327
Table 9.9: Evacuation time when 99% of the occupants have evacuated the building
NO DELAY Simulex EXIT89 Separated Stair Continuous Stair
Simulation 99% Evac
Time (s)
100% Evac Time
99% Evac
Time (s)
100% Evac
Time (s)
99% Evac
Time (s)
100% Evac
Time (s) Hotel 655 735 670 698 441 445
Hotel with disabled
725 1029 1050a 1079 457 633
All disabled 1270 1319 1210 1230 980 990
DELAY Simulex EXIT89 1005 1140 Hotel 990 1195
1080b 1091 782 808
Hotel with disabled
1075 1378 1255c 1264 804 969
All disabled 1440 1592 1630 1647 1215 1126 a96% evacuated by 930 s; b97% evacuated by 935 s; c92% evacuated by 1125 s
When there is an insignificant difference in evacuation times, such as all
continuous stair simulations in Simulex, another majority percentage (90% or higher) and
the accompanying evacuation time is presented (as shown by the notes labeled a, b, and
c). The appropriate majority percentage is chosen if the output file shows a gap in the use
of either exit. A gap is captured in the output file as a list of zeros (as time increases) for
the number of occupants using that exit at each time step, followed by a small number
using either exit at the end of the simulation. If a gap in occupants using either one of the
two exits is discovered in the output files for a simulation, the time for the appropriate
percentage of occupants to evacuate the building is logged in the table above. Where the
majority of occupants is less than 99% before a gap in the output file forms, an

328
alternative percentage of occupants (90% or higher) evacuating the building is listed with
Figure 9.8: A small portion of the population still left to evacuation in Simulex
the accompanying evacuation time.
For the simulations in Table 9.9, it is common for the
majority of the occupants in Simulex to leave after a certain
time, and for a small portion of the population to leave the
building a significant amount of time later. This is shown by
Figure 9.8, taken from the Simulex “Hotel with disabled”
simulation with no delay after 11 minutes. The figure shows
the left and right stairs between floors 2 and 4.
This simulation with “stragglers” also occurred in the “Hotel
with disabled” simulation with no delay for the continuous stair. This is shown below in
Figure 9.9: A small portion of the population still left to evacuate in Simulex

329
Figure 9.9. After 15 minutes and 30 seconds, only 4% of the population remains in the
building in the right stair and is obstructed from free flow by the slower occupant shown
here.
Also, this behavior seems to have occurred in the simulations with 3% (31)
disabled occupants in EXIT89 (delay and no delay), as shown in Table 9.9. However, in
the case of EXIT89’s 1%, these are only disabled occupants who move slower than the
other able occupants in the simulation.
In Simulex, these “stragglers” are either one of two possibilities. Figure 9.8
shows the first case of very slow individual occupants who originate on the higher floors,
namely floors 19, 20, and 21 (the three highest floors of the hotel building). Simulex
gives its occupants the capability to pass slower moving occupants in the stair, depending
upon their body size and positioning in the stair. For instance, a slow mover was spotted
originating in a guestroom in the middle of the floor plan on Floor 21(meaning that they
had to travel the longest distance to reach the stair). This occupant was moving much
slower than the rest of the population on the floor, entered the stairwell after all others
from the floor, and continued down the stairwell at an extremely slow rate. In this case,
the occupant was not blocking a larger population from getting by since he originated on
the top floor of the building and entered the stairwell last. Other “stragglers” initiating on
lower floor may allow other faster occupants to pass, instead of blocking their route.
This would also cause a small number of “stragglers” to increase the overall evacuation
time.
For larger occupants, a second case like what is shown in Figure 9.9 will occur.
Here, the slow moving occupant is blocking the stair for the occupants behind him to

330
pass. This will cause a larger number of occupants to leave the building much later than
the rest of the population.
Differences in the way each model handles slower moving occupants
It can be seen by viewing the Simulex simulations that slower moving occupants
can provide an obstacle in the stair, depending upon the stair width. In the design
comparison runs, it is common to see the slower moving occupants, labeled “elderly” or
“disabled,” causing a queue behind them. Many times, due to the width of the stairwell
in the hotel, the occupants behind the slow mover would adjust to the speed of the slow
occupant and travel behind throughout the rest of the simulation. This is seen in many of
the simulations using Simulex involving slower moving occupants. At times, the other
occupants in the stair can bypass the slower moving occupants if the slow occupant is
traveling close to the stair wall. As shown in simulations, the position and body size of
the occupant play a role in whether or not others can pass by. Even if the slow moving
occupants “hug” the stair wall, they provide a short-term obstacle for the others that wish
to pass. The occupants that wish to pass a slow mover many times slow down
themselves, then angle their bodies to get by the occupant near the wall. This affects the
fluid movement of the other occupants, and this is seen by a short queue forming behind
even the slow movers near the walls.
The figures below are taken from the “hotel with disabled” simulation without
delay using separate stairs. Figures 9.10 and 9.11 show how a slow occupant can affect
the movement of others in the stairwell using the Simulex model. In Figure 9.10, the
stair on the right (Right 34) is showing gaps between occupants where slower moving

331
occupants are causing others behind them also to slow. Also, in Figure 9.11, Right 23
shows that slower moving occupants are also passed by and left to travel in smaller
numbers at the lower stairs, which increases the evacuation time. This also accounts for
why a majority of the occupants escape in a smaller evacuation time, while the clock runs
higher for the few slower moving occupants to reach the exit.
Figure 9.10: Snapshots taken from "hotel with disabled" simulation showing how slow movers affect stair movement

332
Figure 9.11: Snapshots taken from "hotel with disabled" simulation showing how slow movers affect stair movement
Figures 9.12-9.14 are also taken from the “hotel with disabled” simulation
without delay, but this time showing the continuous stair simulation. They show the
evacuation via progressive paused screen shots in order to show the gaps in between the
occupants throughout the left and right continuous stairways. The continuous stair
simulation, as shown, provides an easier way to track individuals in the staircase and
monitor total stair movement.

333
Figures 9.12-9.14: Snapshots taken from “hotel with disabled” simulation
EXIT89’s output is also analyzed to note if the occupants in the stair surrounding
the disabled occupant are slowed down to the slower occupant’s speed, as is seen in
Simulex. From the analysis of the output, it is discovered that the increase in the
evacuation time in the model is due only to the individual disabled occupants traveling to
the exit without interfering with the able occupants in the stairs. This is concluded due to
the fact that all other occupants from a particular floor evacuate much quicker than the
disabled occupant from that same floor. There are definite differences recorded in
evacuation times of the disabled occupant on a particular floor when compared to the
evacuation time of the last person to leave the building from the same floor as the

334
disabled. This increase in overall evacuation times of the disabled occupant ranges from
12 s to 250 s, an average of 130 seconds.
Also analyzed is the time the disabled occupants took to enter and exit the stair
section on floor 3, compared with the time the able occupants, who are present in the stair
section with the disabled, take to enter and exit the same section. This is a check to make
sure that the theory discussed in the earlier paragraph is accurate and that the disabled
occupants did not interfere in any way with the evacuation of the able occupants. On
average, the disabled occupants take approximately 17 seconds longer than the others
around them in the same stair section during the same time period, with a range of 0-34
seconds. Lastly, Table 9.10 shows the difference, per stair, of the disable and able
occupants’ travel times for a flight of stairs. It is seen that disabled occupants
consistently have longer travel and evacuation times on stairs when compared with the
able occupants in the simulation.
Table 9.10: Average stair section travel times for disabled vs. able occupants in Stair 3, EXIT89
Average travel times Left stair section Right stair sectionDisabled travel time (s) 34 28
Able travel time (s) 19 18
The following reasons show that the disabled occupants did not interfere with the
able occupants traveling alongside in the stair.
• The disabled occupants take longer to exit the building when compared with all
others originating from the same floor
• The disabled occupants take longer to travel one flight of stairs when compared with
others traveling in the same stair
• Overall, disabled occupants have longer travel times for a flight of stairs when
compared with able occupants

335
Differences in the way each model handles response distributions
As mentioned in Chapter 5, Simulex allows the user to distribute delay times
randomly, triangularly, and normally. EXIT89 allows the user to assign delay times to
certain nodes and/or assign additional random delay times over a certain percentage of
the population. In order to simulate the fire scenario, random distributions are used in
both models. The only difference in input of this response delay is that EXIT89 requires
a minimum and maximum value of the delay and Simulex requires a mean value with a
(+/-) value for the delay. However, in either model, the maximum response delay of 10
minutes is specifically stated in the input. Because of the similarity in input, any
differences depend on the model’s random assignment of response delays over the height
of the building. This difference is expected anytime the user chooses random
distributions.
Bounding Results
As is done in performance-based designs, an attempt to bound the evacuation
results for this hotel building is made. Simulex separate stair no delay and Simulex
continuous stair no delay simulations (Table 9.11) are compared with the bounding
results from EXIT89’s no delay simulations (Table 9.12). Also EXIT89’s delay
simulations (Table 9.12) are compared with Simulex delay simulations (Table 9.11).

336
Table 9.11: Bounding results from the Simulex model
SIMULEX No Delay 5 min +/- 5 min Delay Separate Stair Continuous Stair
Simulation Evacuation Time (s)
Time at Exit (s)
Evacuation Time (s)
Time at Exit (s)
Evacuation Time (s)
Time at Exit (s)
1140 L=1140 R=1005
All Hotel population
735 L=735 R=635
698
L=698 R=555
1195
L=1140 R=1195
Hotel population +
disabled
1029 L=1029 R=815
1079 L=930 R=1079
1378 L=1378 R=1190
All disabled 1319 L=1319 R=1020
1230 L=1230 R=1155
1592 L=1520 R=1592
All 1.0 m/s 745 L=745 R=630
591 L=591 R=480
963 L=963 R=960
All 1.2 m/s 602 L=602 R=515
489 L=489 R=400
903 L=903 R=895
All 1.4 m/s 537 L=537 R=430
420 L=420 R=335
869 L=869 R=860
1.2 m/s + jackets
803
L=803 R=615
595 L=595 R=450
907 L=907 R=885
All Elderly 1073
L=1073 R=860
856 L=856 R=720
1269 L=1269 R=1150
All Male 590 L=590 R=490
552 L=552 R=435
923 L=923 R=880
All Median
591 L=591 R=460
447 L=447 R=370
899 L=899 R=880
All Female 620 L=620 R=540
460 L=460 R=390
968 L=945 R=968
Business Stay 603 L=603 R=515
510 L=510 R=405
962 L=962 R=955
Leisure Stay 699 L=699 R=680
707 L=707 R=625
1169 L=1169 R=1160
95% Children, 5% adult (camp)
738 L=738 R=650
596 L=575 R=596
1151 L=1085 R=1151
Overall Range: 537-1319 Range(w/o outliers):
590-1073
Range:420-1230 Range (w/o outliers):
447-1079
Range: 869-1592 Range(w/o outliers):
899-1378 Flow Split - L=582; R=462

337
Table 9.12: Bounding results from the EXIT89 model
EXIT89 No Delay 5 min +/- 5 min Delay Simulation Evacuation
Time (s) Time at Exit
(s) Evacuation
Time (s) Time at Exit (s)
Hotel (Soviet, emergency)
445 L=445 R=386
809 L=806 R=809
Hotel–3% disabled
633 L=496 R=633
969 L=934 R=969
All disabled 990 L=990 R=859
1226 L=1226 R=1085
American, emergency
384 L=384 R=332
809 L=806 R=809
Austrian, normal 679 L=679 R=544
862 L=862 R=857
American, normal 442 L=442 R=402
857 L=853 R=857
Soviet, normal 563 L=563 R=466
857 L=854 R=857
Austrian emergency
560 L=560 R=445
809 L=807 R=809
Overall Range: 384-990 Range (w/o outliers):
384-633
Range: 809-1226 Range(w/o outliers):
809-969 Flow split - L=582; R=462
For the simulations without delay, EXIT89’s bounding results range from 384-
990 seconds and Simulex’s results range from 537-1319 seconds (separate stair) and 420-
1230 seconds (continuous stair). Although these ranges quite possibly contain
simulations that are highly unlikely. For simulations that are too risky, the safety of the
occupants may be comprised, and for simulations that are too conservative, the building
owner may have to invest in unnecessary and costly safety additional to the building.
Because of this, the following simulations are deemed unlikely.
• Simulex – all 1.4 m/s
• Simulex – all disabled
• EXIT89 – all disabled

338
It is unlikely that the designer will design a hotel building safe enough for an entire
population of disabled or slow moving occupants. Also, speeds of 1.4 m/s from the entire
population are also unlikely and not even documented as a maximum speed by Pauls1.
The highest occupant speed has been documented to be approximately 1.2 m/s on
horizontal components.
Once the unlikely scenarios are removed from the bounding results, the ranges of
evacuation times from each model are compared. For the simulations without delay,
EXIT89’s bounding results range from 384-633 s, while Simulex’s range from 590-1073
s (separate stair) and 447-1079 s (continuous stair). For simulations including a random
delay distribution, EXIT89’s results range from 809-969 s and Simulex’s results range
from 899-1378 s (separate stair only). The separate stair is presumed to make the biggest
impact or problem if all occupants traveled into the stairwell at the same time. However,
since a delay time is distributed among all occupants, the separate stair remains as the
input file used for the delay simulations.
Simulex still contains results much larger than EXIT89’s maximum evacuation
time for the bounding simulations. This was due to the introduction of the slower
populations by Simulex, a known capability of the model. EXIT89’s American
emergency simulation produces a very low evacuation time (384 s or approximately 6.5
minutes). EXIT89 produces maximum results in the bounding simulations that are
approximately 40% lower than that of Simulex for no delay. In the case of simulated
delay times, EXIT89 produces maximum results that are approximately 30% lower than
Simulex. In both cases of delay and no delay, EXIT89 produces a faster minimum result,
but only by approximately 10%.

339
One thing that should be noted here is the results obtained from EXIT89 with the
30 to 600 second delay time distribution. Once the distribution is input, the evacuation
time for EXIT89 no longer depends on the body size. For all simulations with delay
times, other than those involving disabled occupants, an evacuation time is given for all
emergency simulations (independent of body size) and for all normal simulations
(independent of body size). The two evacuation times that EXIT89 would produce for
the hotel building with delay time is either 809 seconds (emergency speed) or
approximately 860 seconds (normal speed). The delay time seems to space occupants
throughout the building in such a way that they move close to their unimpeded speeds on
the stairs and the evacuation time is then dominated by the time in which they are able to
begin evacuating.
Another observation to note is the differences between the separate and
continuous stair simulations in Simulex. When analyzing the continuous stair
simulations, Simulex allows the occupants to walk 2 people, side-by-side, to the exit,
causing a faster simulation. This does not seem as realistic, especially given the size of
the stairwell (44 inches). Pauls mentions from his previous work that a 44 inch stair does
not permit two-abreast movement152, as is shown by the Simulex model.
Difficulties in Analyzing the Output of Each Model
Simulex: It is beneficial that the simulations are visualized, however the
occupants are not labeled or tracked in the actual output. It would be very difficult to
track the location of the occupant from one place to another in the separated stair
simulation or even the continuous stair simulation because the occupants become
grouped once they enter the stair window. Also, the model does not allow the user to

340
give occupants of interest different colors in order to track movements. This would be a
problem in very complicated buildings if the user is interested in following a certain
group of occupants from one position in the building to another.
EXIT89: The output from the model is very detailed, but in a complex way.
Each occupant in given a number and the author has found it useful to import the output
data into an excel spreadsheet and sort out by occupant number, building component, etc.
to evaluate the inner workings of the model. The model does not visualize the
evacuation, so the author must rely on analysis of the detailed data. It is very helpful,
however, to have the output tracking individual occupants’ positions at each time (s).
This aided in the analysis performed in the chapter.
Discussion of Results
Even with a simplified hotel building, significant differences are found among the
evacuation results given by EXIT89 and Simulex for the same fire scenario. Figures 9.15
and 9.16 are also used to show the differences in the evacuation times for each simulation
type, with and without delay times. And, Figure 9.17 is used to show differences in the
maximum and minimum evacuation times (without unlikely simulations or outliers) from
the bounding results from each model. This type of bar graph can show more easily,
rather than restating numbers and percentages, the differences between Simulex and
EXIT89 results.
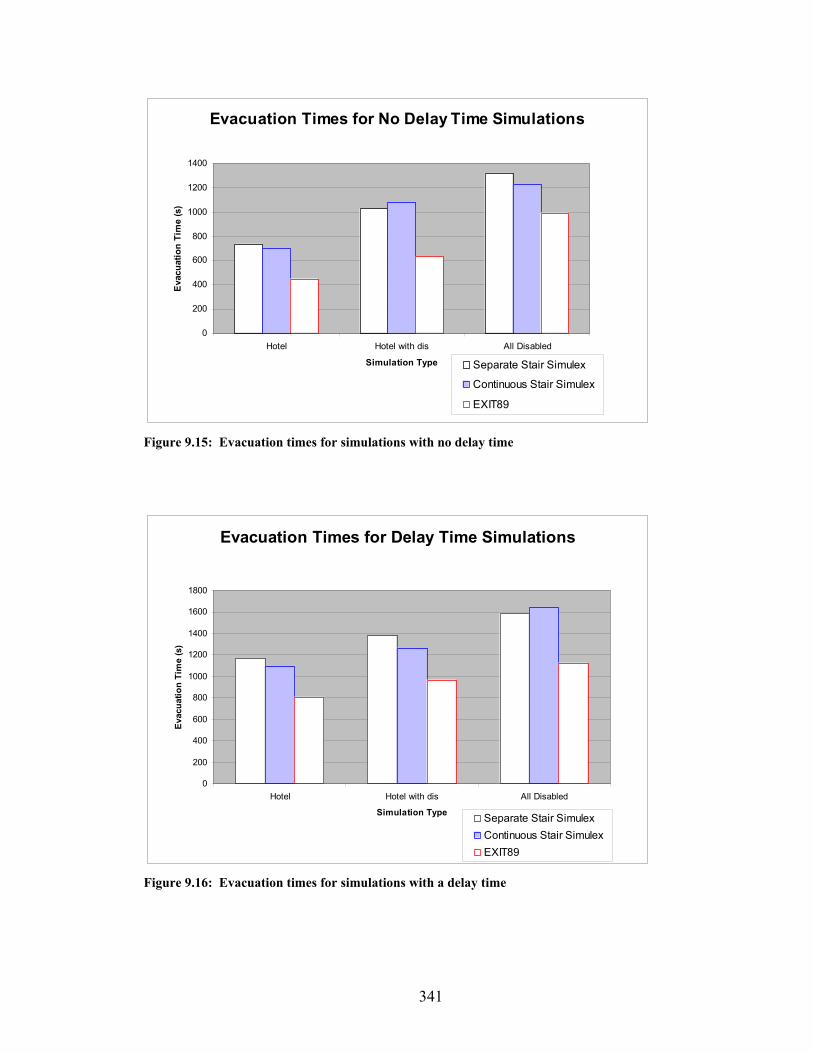
341
Evacuation Times for No Delay Time Simulations
0
200
400
600
800
1000
1200
1400
Hotel Hotel with dis All Disabled
Simulation Type
Evac
uatio
n Ti
me
(s)
Separate Stair Simulex
Continuous Stair Simulex
EXIT89
Figure 9.15: Evacuation times for simulations with no delay time
Evacuation Times for Delay Time Simulations
0
200
400
600
800
1000
1200
1400
1600
1800
Hotel Hotel with dis All Disabled
Simulation Type
Evac
uatio
n Ti
me
(s)
Separate Stair SimulexContinuous Stair SimulexEXIT89
Figure 9.16: Evacuation times for simulations with a delay time

342
Consistently, EXIT89 produced evacuation times that are 20-40% lower than
those in Simulex. The main reasons for these differences are found to be the following
(taken from the sections presented previously in this chapter):
1) The difference in movement algorithms used by each model
2) The capability of Simulex to simulate slower moving occupants that affected able
occupants’ movement
3) The difference in unimpeded velocity
4) The allowance of EXIT89 for a larger number of occupants in the stair at one time
Even though a greater number of occupants in the stair at times would cause a
lower inter-person distance and corresponding lower speed, Figure 9.7 is still able to
show EXIT89 captured a higher overall speed on stairs than Simulex. The movement
algorithm, which incorporated body size and unimpeded speed, is the dominating factor
in the difference in evacuation times between the two models.
Differences in bounding results from both delay and no delay simulations
0
200
400
600
800
1000
1200
1400
1600
Minimum, nodelay
Maximum, nodelay
Minimum, delay Maximum, delay
Evacuation range with associated simulation type
Evac
uatio
n tim
e (s
)
SimulexEXIT89
Figure 9.17: Evacuation times for the bounding results with and without delay times
343
Figure 9.17 shows the differences in the evacuation times of EXIT89 and
Simulex, where Simulex values are those recorded in the continuous stair simulations for
no delay time. It is clear to see the similarities in evacuation time for the minimum
bounds on both the delay and no delay simulations. The differences occur in the
maximum values, due to the ability of Simulex to move slower occupants throughout the
simulation. Also, EXIT89 handles disabled occupants in a different manner than
Simulex, as stated earlier in this chapter.

344
CHAPTER 10: CONCLUSIONS This thesis aims to answer two sets of questions. The first and second sets of
questions ask the following:
• How does an engineering egress design of a hotel using EXIT89 or Simulex
account for the four factors of egress? What is missing from these models to
capture major factors of a hotel evacuation?
• Will two specific models give similar output for the same design scenario? If not,
why?
To answer the first set of questions, a comprehensive model review is completed,
as well as an in-depth study of two specific evacuation models, EXIT89 and Simulex.
The focus of the set of questions is whether or not EXIT89 or Simulex can simulate all of
the factors associated with a hotel evacuation, namely the building configuration,
procedures of the evacuation, environmental conditions, and behaviors. If not, other
models are listed which have the capabilities of simulating a hotel evacuation.
EXIT89 and Simulex are able to simulate certain features of a hotel evacuation,
but could not capture all of the four factors of egress. The input choices for each model
corresponding to each of the four factors of egress are the following:
• Building Configuration – Nodes and arcs input for EXIT89 and CAD drawing input
for Simulex
• Procedures – User-defined routes or shortest distance for both models
• Environmental Conditions – CFAST data can be imported into EXIT89 and there is
no option for Simulex

345
• Behavior – Both include inputs of delay time, body size, and the simulation of
occupants with disabilities. Simulex also allows the user to choose unimpeded speeds
for each occupant group.
However, there are features of a hotel evacuation that these models are not able to
simulate. These include an accurate representation of the building when using a coarse
network, the simulation of the presence of hotel staff, the simulation of the effect of
previous experience or training on the occupant, the incorporation of both fire and smoke
conditions and the effects on the occupants’ decision making, exhaustion on the stairs,
social affiliation, the simulation of actual pre-evacuation behaviors, elevator use, the
condition of the occupant at the time of alarm (sleep, intoxicated, etc.), the simulation of
carrying items or a baby, and the option of preparing an area of refuge instead of full
evacuation.
From Chapter 2, it is apparent that other models have certain capabilities lacking
in EXIT89 and Simulex to simulate a hotel evacuation. This information is provided in
Table 10.1. As shown in Table 10.1, EvacSim contains many of the needed capabilities
lacking in the two compared models. However, it should be noted that data for some of
the more complicated simulation techniques may be lacking.
Also shown in Table 10.1, all of the models listed, with the exception of STEPS,
are the behavioral models. This shows that behavioral models aim to simulate more
complex situations and behaviors. Many of the models listed in Table 10.1 have the
capabilities of simulating individual pre-evacuation activities.
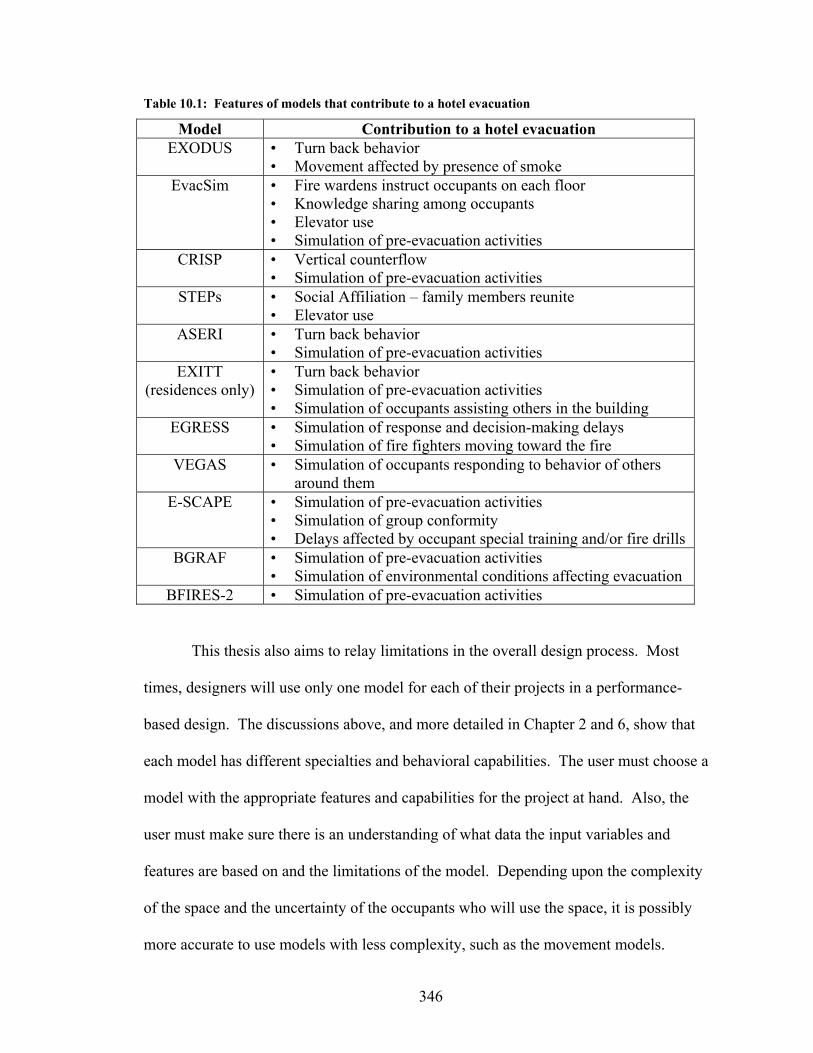
346
Table 10.1: Features of models that contribute to a hotel evacuation
Model Contribution to a hotel evacuation EXODUS • Turn back behavior
• Movement affected by presence of smoke EvacSim • Fire wardens instruct occupants on each floor
• Knowledge sharing among occupants • Elevator use • Simulation of pre-evacuation activities
CRISP • Vertical counterflow • Simulation of pre-evacuation activities
STEPs • Social Affiliation – family members reunite • Elevator use
ASERI • Turn back behavior • Simulation of pre-evacuation activities
EXITT (residences only)
• Turn back behavior • Simulation of pre-evacuation activities • Simulation of occupants assisting others in the building
EGRESS • Simulation of response and decision-making delays • Simulation of fire fighters moving toward the fire
VEGAS • Simulation of occupants responding to behavior of others around them
E-SCAPE • Simulation of pre-evacuation activities • Simulation of group conformity • Delays affected by occupant special training and/or fire drills
BGRAF • Simulation of pre-evacuation activities • Simulation of environmental conditions affecting evacuation
BFIRES-2 • Simulation of pre-evacuation activities
This thesis also aims to relay limitations in the overall design process. Most
times, designers will use only one model for each of their projects in a performance-
based design. The discussions above, and more detailed in Chapter 2 and 6, show that
each model has different specialties and behavioral capabilities. The user must choose a
model with the appropriate features and capabilities for the project at hand. Also, the
user must make sure there is an understanding of what data the input variables and
features are based on and the limitations of the model. Depending upon the complexity
of the space and the uncertainty of the occupants who will use the space, it is possibly
more accurate to use models with less complexity, such as the movement models.

347
The second set of questions discussed in this thesis is the following:
• Will two specific models give similar output for the same design scenario? If not,
why?
Since designers use only one model for a performance-based design, there is a
concern about the difference in output from two similar models given the same design
scenario. EXIT89 and Simulex, both partial behavior models, are used to model the same
fire and evacuation design scenario from a hotel building. In addition to the “hotel”
simulation, “hotel with 3% disabled” and “all disabled” simulations are used in the
comparison of EXIT89 and Simulex. Also, each simulation described above is run with
and without a time delay. Overall, EXIT89’s evacuation times for these simulations are
25-40% lower than the times produced by Simulex. However, the usage of exits (the
number of people using exits 1 and 2) are equivalent for both models.
The reasons for these differences in model results are due to the differences in
stair configuration input, the movement algorithm used by each model, differences in
unimpeded speeds of the occupants, the differences in density in the stairwell, and the
differences in the method that each model simulates disabled or slower moving
occupants.
The differences in stair configuration are due to the method of stair input into
EXIT89 and Simulex. By using the Simulex separate stair input method described in
Chapters 8 and 9, the occupants travel 180° around the landing at each floor plan.
EXIT89 considers the stairwell to be a set of connected nodes, without acknowledging
individual movement around a landing. Therefore, a new Simulex file is created in which
the stair forms a single continuous staircase into which all floors enter. By changing

348
Simulex’s stair configuration input to be more similar to EXIT89, the three simulations
run in EXIT89; “hotel,” “hotel with 3% disabled,” and “all disabled,” still produce results
that are 20-40% lower when compared with Simulex continuous stair simulations. This
stair configuration change results in more significant evacuation time differences in
Simulex (between separate and continuous stair runs) for the simulations without slower
or disabled occupants, as is seen in the bounding analyses in Chapter 9.
The difference in movement algorithms in EXIT89 and Simulex is the main
reason for the significant differences in evacuation times between the two models. The
three main simulations being compared are labeled as “hotel,” “hotel with 3% disabled,”
and “all disabled.” The movement algorithms for each model incorporate body sizes,
initial unimpeded speeds, and slowing due to distance from others/density of the space.
From analysis of the “hotel” simulation, it is found that both EXIT89 and Simulex
contain similar overall body sizes, however EXIT89 simulates occupants at a higher
unimpeded speed on horizontal components and stairs. Both models’ movement
algorithms are equated to inter-person distance vs. velocity in Chapter 9. When velocity
vs. inter-person distance is graphed for each model for the “hotel” simulation, Figure 9.7
shows that movement in the stair is much faster using the EXIT89 model. EXIT89’s
velocity is, at times, larger than the maximum speed of a group of occupants using the
Simulex model.
Also, by analyzing the “hotel” simulation using EXIT89 and Simulex, it is found
that EXIT89 allows a larger number of occupants in the stairwell at one time. By
observing the continuous stairwell visualization of the “hotel simulation,” the number of
occupants in a stairwell section (the stair section is between floors 2 and 3 equating to

349
9.93 m2) is counted at random times throughout the simulation in Simulex. EXIT89’s
detailed output file is analyzed, using steps outlined in Chapter 9, to count the number of
occupants in a stair section at various times throughout the simulation. Analysis shows
that EXIT89 allows 8-45 occupants in the stair section, while Simulex allows only 0-29
occupants in the stair section during the “hotel” simulation. With more occupants in the
stair moving at a faster pace, EXIT89 can produce much faster evacuation times.
A final reason for differences in evacuation results of the three simulations is the
way in which the two models simulate slower moving occupants. Simulex allows the
slower moving occupant to act as an “obstacle” in the stair that either causes a queue or a
slight delay for other occupants. EXIT89, on the other hand, does not simulate the slower
moving occupants to interfere with the able occupants in the simulations. For this reason,
EXIT89 still produces faster evacuation times than Simulex, even with the simulation of
disabled occupants.
The evacuation time for all three simulations; “hotel,” “hotel with 3% disabled,”
and “all disabled,” using EXIT89 and Simulex with separate and continuous stairs are
shown in Figures 10.1 and 10.2.

350
Figure 10.1: Differences in evacuation times between EXIT89 and Simulex for simulations without delay
Evacuation Times for No Delay Time Simulations
0
200
400
600
800
1000
1200
1400
Hotel Hotel with dis All Disabled
Simulation Type
Evac
uatio
n Ti
me
(s)
Separate Stair Simulex
Continuous Stair Simulex
EXIT89
Figure 10.2: Differences in evacuation times between EXIT89 and Simulex for simulations with a delay
Evacuation Times for Delay Time Simulations
0
200
400
600
800
1000
1200
1400
1600
1800
Hotel Hotel with dis All Disabled
Simulation Type
Evac
uatio
n Ti
me
(s)
Separate Stair SimulexContinuous Stair SimulexEXIT89

351
Also, both models are used in their full capacity to bound the evacuation results,
since this is frequently done in performance-based design. As mentioned in Chapter 5,
Simulex contains a wider range of occupant characteristic inputs, which is used in the
bounding simulations. The ranges of evacuation time from each model (with and without
delays) are also compared. In the Simulex model, the simulations are varied by occupant
speed, occupant type (speed and body size varied), hotel use, and occupant mobility. In
the EXIT89 model, the simulations are varied by occupant body size and speed and
occupant mobility. Results of the bounding simulations can be seen in Tables 9.11 and
9.12 in Chapter 9.
For the bounding results, the evacuation times of interest are the minimum and
maximum evacuation times for each model (with and without delay times). Simulex still
contains evacuation times larger than EXIT89’s times for each minimum and maximum
value, as shown in Figure 10.3. This is especially seen with Simulex’s maximum value
simulations with and without delay times. Larger evacuation times produced by Simulex
are mainly due to the introduction of the slower populations, a known capability of the
model. EXIT89 produces maximum results in the bounding simulations that are
approximately 40% lower than that of Simulex for no delay. In the case of simulated
delay times, EXIT89 produces maximum results that are approximately 30% lower than
Simulex. In both cases of delay and no delay, EXIT89 produces a faster minimum result,
but only by approximately 10%.

352
Figure 10.3: Differences in bounding results for EXIT89 and Simulex with and without delay times
Differences in bounding results from both delay and no delay simulations
0
200
400
600
800
1000
1200
1400
1600
Minimum, nodelay
Maximum, nodelay
Minimum, delay Maximum, delay
Evacuation range with associated simulation type
Evac
uatio
n tim
e (s
)
SimulexEXIT89
The question remains whether or not it is sufficient to use only one evacuation
model for a project in a performance-based design. This is a difficult question to answer
due to other factors, such as time and cost. In many cases, evacuation models may be
second to hand calculations. From the analysis done for this thesis, it is important to
make sure that the model has sufficient capabilities and features to capture the scenario(s)
for the specific building. It is recommended for the designer to fully understand the inner
workings of the models and to assess whether or not the movement algorithm and
methods are realistic. For example, in the case of EXIT89, it may not be a realistic
scenario to model occupants who do not interact with each other.
The models in this comparison produced different evacuation results mainly due
to the capabilities of the model to represent an actual hotel simulation. The simulation of
a variety of speed and body sizes by Simulex produced longer evacuation times.
However, a variety of occupant types are realistically seen in evacuation from buildings.
Therefore, instead of focusing on the number of models to use in a design, the
recommendation is to choose a model that is capable of simulating a multitude of

353
scenarios for that building type and is conscious of differences in the population’s
movement. And, by providing the information in Chapter 2, the user now has the
mechanism to choose the appropriate model for the specific project. If time is available
and costs are low, the designers may want to check results with another egress model of
similar capabilities and features.
Future Work
This work helped to identify two types of further research in egress modeling.
The first type involves the review and comparison of current egress models and the
second type involves the collection of data to further prediction of egress models.
The first type of further research focuses on an extension of the work presented in
this thesis. This type of comparison can be extended to other available egress models
being used to predict egress, such as STEPs, buildingEXODUS, and EVACNET4. Since
the models used in this analysis were dissimilar in the model structure (coarse and fine
network), it would be beneficial to compare egress models that have the same
characteristics and/or input features. If differences arise with additional models which
use different movement algorithms (but contain the same structure and features), the
questions arises as to which movement data is the most accurate for certain types of
evacuations. Also, an interesting project would involve the use of the entire hotel
building for future egress model comparison. If the entire hotel building is modeled,
other bounding variables could be simulated, such as occupant initial position, route
choice, and occupant population numbers. Lastly, a project that involves the
identification of the dominant variables of certain egress models would be beneficial to
the field of egress modeling. By identifying dominant input variables that significantly

354
affect the egress results, model users would understand which input variables would
require a higher level of research before running each simulation. This project would be
an extension of work being performed by Arup for the National Institute of Standard and
Technology under the grants program.
The second type of further research involves the collection of data necessary to
improve prediction capabilities in egress. Data is needed on pre-movement times and
activities of occupants in hotel buildings. Also, data on how hotel staff (or staff of other
buildings) affects the evacuation from hotels is critical in capturing all aspects of the
evacuation. Lastly, there is an overall need for more research detailing behaviors and
reasons for delay from actual fire events occurring in hotel buildings (or any building).
Many model developers rely on evacuation drills for model validation, which may result
in unrealistic evacuation times.
Recommendations for Model Developers
This research also helped to identify recommendations for model developers from
a users’ point of view. First, it would be beneficial for the user to obtain a more detailed
version of the output than is frequently provided. In performing the comparison of
models outlined in Chapter 9, the differences in output and the lack of data in certain
areas restricted the amount of analysis to be completed. For instance, it would have been
interesting to develop a graph of individual evacuation times over the length of the
evacuation period for each model for comparison purposes, however individual
evacuation times (without visualization) were not provided by each model as output.
This is just one example.

355
Also, providing the user with the egress model’s specific data sources to support
certain input variables is important in understanding the inner methods of the model.
There are highly sophisticated egress models that are available for users, however, these
may lack egress data to support many of the input variables. This should be stated so that
the user is aware of these input parameters. Also, providing the user with model
limitations would prepare the user for possible problems or confusion with the output
data. It can be said that all egress models are accompanied with certain limitations, and
providing them openly could avoid incorrect and/or inappropriate use of the model for
certain project.
Lastly, it would be beneficial to compare egress model output to actual fire data.
Although this is a difficult task with limited data, this comparison should be attempted at
some stage in model development. It is suggested that drill data is not sufficient to
compare with model results due to the nature of the perceived threat of the occupants.
With all of these considerations in mind, there are many steps to take to improve
the prediction tools in egress modeling. These are certainly not “quick fixes.” They are
meant to provide areas of improvement from a users’ point of view.
356
REFERENCES 1 Nelson, H.E., and Mowrer, F.W., “Emergency Movement,” SFPE Handbook of Fire Protection Engineering, 3rd Edition, P.J. DiNenno (Ed.), NFPA, Quincy, MA., 2002. 2 Bryan, J.L., “Section 3, Chapter 12 - Behavioral Response to Fire and Smoke,” SFPE Handbook of Fire Protection Engineering, Third Edition, Society of Fire Protection Engineers, Bethesda, MD, 2002. 3 Proulx, G., “Section 3, Chapter 13 – Movement of People: The Evacuation Timing,” SFPE Handbook of Fire Protection Engineering, Third Edition, Society of Fire Protection Engineers, Bethesda, MD, 2002. 4 Withey, S.B., in Man and Society in Disaster, Basic, New York (1962). 5 Breaux, J., Canter, D., and Sime, J., Psychological Aspects of Behavior of People in Fire Situations, University of Surrey, Guilford, UK (1976). 6 Bickman, L., Edelman, P., & McDaniels, M., NBS-GCR-78-120, National Bureau of Standards, Gaithersburg, MD (1977). 7 Proulx, G., “A Stress Model for People Facing a Fire,” Journal of Environmental Psychology, 13, pp. 137-147, (1993). 8 Canter, D., Breaux, Sime, J., “Domestic, Multiple-Occupancy, and Hospital Fires,” in Fires and Human Behaviour (David Canter, ed.), John Wiley & Sons, New York, NY, pp. 117-136 (1980). 9 Lord, Jamie, “Incorporating Egress Modeling into the Engineering Design Process,” Arup Group Ltd, ongoing grant on the study of uncertainty in egress models for NIST, 2003. 10 Caravaty, R.D. and Haviland, D.S., “Life Safety from Fire, A Guide for Housing the Elderly,” Architectural Standards Division, Federal Housing Administration, Washington, DC, 1967. 11 Fahy, R.F., Section 4, Chapter 2, “Calculation Methods for Egress Prediction,” Fire Protection Handbook 19th Edition, National Fire Protection Association, Quincy, Massachusetts, 2003. 12 Nelson, H.E., “Emergency Evacuation Flow Models,” National Bureau of Standards, Gaithersburg, MD; U.S./Japan Government Cooperative Program on Natural Resources, Fire Research and Safety, 6th Joint Panel Meeting of the UJNR Proceedings, May 10-14, 1982, Tokyo, Japan, Building Research Institute, Japan, 282-354 pp. 13 Watts, J.M., “Computer Models for Evacuation Analysis,” Fire Safety Journal, Volume 12, No. 3, 1987, pp. 237-245. 14 Stahl, F.I., “Simulating Human Behavior in High-Rise Building Fires: Modeling Occupant Movement Through a Fire-Floor from Initial Alert to Safe Egress.” Design Research Consultant, Woodside, NY; National Bureau of Standards, Gaithersburg, MD; Department of Health, Education and Welfare, Washington, DC, NBS GCR 77-92; 53 p. (1977). 15 Stahl, F.I., “Final Report on the ‘BFIRES/VERSION 1’ Computer Simulation of Emergency Egress Behavior During Fires: Calibration and Analysis,” National Bureau of Standards, Gaithersburg, MD; Department of Health, Education, and Welfare, Washington, DC; NBSIR 79-1713, 178 p. (1979). 16 Stahl, F.I., “BFIRES-II: A Behavior Based Computer Simulation of Emergency Egress During Fires,” Fire Technology, February, 1982.

357
17 Francis, R.L. and Saunders, P.B., “EVACNET: Prototype Network Optimization Models for Building Evacuation,” NBSIR 79-1593, National Bureau of Standards, Washington, DC (1979). 18 Alvord, D.M., “Escape and Rescue Model: A Simulation Model for the Emergency Evacuation of Board and Care Homes. Final Report. American Institute of Architects Foundation, Washington, DC, National Bureau of Standards, Gaithersburg, MD, NBS GRC 83-453; 151 p. (1983). 19 Pauls, J., “Effective-Width Model for Crowd Evacuation Flow on Stairs,” National Research Council of Canada, Ottawa, Ontario; Vereinigung zur Forderung des Deutschen Brandschutzes e.V. (VFDB). International Fire Protection Seminar, 6th Volume, September 21-24, 1982, Karlsruhe, West Germany, 295-306 pp. (1982). 20 Smith, J.M., “An Analytical Queuing Network Computer Program for the Optimal Egress Problem,” Fire Technology, Vol. 18, No. 1, 1982, pp. 18-33. 21 Berlin, G.N., “A Simulation Model for Assessing Building Fire Safety,” Fire Technology, Vol. 18, No. 1, 1982, pp. 66-75. 22 Beyler, C. & DiNenno, P.J., Section 3, Chapter 4 “Introduction to Fire Modeling,” Fire Protection Handbook 19th Edition, National Fire Protection Association, Quincy, Massachusetts, 2003. 23 Nelson, H.E., Personal Communication, September, 2003. 24 Still, G.K., http://www.crowddynamics.com 25 Klupfel, H. & Meyer-Konig, T, “Characteristics of the PedGo Software for Crowd Movement and Egress Simulation,” 2nd International Conference in Pedestrian and Evacuation Dynamics (PED), August, 2003, pp. 331-340. 26 Purser, D.A., “Chapter 6 – Toxicity Assessment of Combustion Products,” The SFPE Handbook of Fire Protection Engineering, Third Edition, Society of Fire Protection Engineers, Bethesda, MD, 2002. 27 Klote, J.H. & Milke, J.A., “Principles of Smoke Management,” American Society of Heating, Refrigerating, and Air-Conditioning Engineers, Inc., Atlanta, GA and the Society of Fire Protection Engineers, Bethesda, ME, 386 pp., 2002. 28 Jin, T., “Studies on Human Behavior and Tenability in Fire Smoke,” Fire Safety Science-Proceedings of the Fifth International Symposium, pp. 3-21, 1997. This is a summary of earlier studies.
29 Levin, B.M., “EXITT – A Simulation Model of Occupant Decisions and Actions in Residential Fires,” Fire Safety Science – Proceedings of the 2nd International Symposium, 1988, pp. 561-570. 30 Fruin, J.J., Pedestrian Planning and Design, Revised Edition, Strakosch, G.R., editor, Elevator World, Inc, Mobile, AL, 1987. 31 Predtechenskii, V.M. & Milinskii, A.I., Planning for Foot Traffic Flow in Buildings, Amerind Publishing, Co. Pvt. Ltd., New Delhi, 1978. 32 Harrington, S.S., “TIMTEX: A Hydraulic Flow Model for Emergency Egress,” M.S. Thesis, 1996, 100 pp. 33 Gwynne, S. & Galea, E.R., “A Review of Methodologies and Critical Appraisal of Computer Models Used in the Simulation of Evacuation from the Built Environment,” Research Report, Society of Fire Protection Engineers, (undated).

358
34 Pauls, J.L, “Movement of People,” SFPE Handbook of Fire Protection Engineering, Second Edition, Society of Fire Protection Engineers, Bethesda, MD, 1995. 35 Bryan, J.L., Personal communication, Summer 2003. 36 Mileti, D.S. & Sorensen, J.H., “Communication of Emergency Public Warnings, A Social Science Perspective and State-of-the-Art Assessment,” ORNL-6609, August 1990, 161 pp. 37 Latane, B., Darley, J.M., “Group Inhibition of Bystander Intervention in Emergencies,” Journal of Personality and Social Psychology, Vol. 10, No. 3, 1968, 215-221 pp. 38 Olenick, S.M., Carpenter, D.J., “Updated International Survey of Computer Models for Fire and Smoke,” Journal of Fire Protection Engineering, Vol. 13, No. 2, May 2003, 87-110 pp. 39 CSE fire model survey website: http://www.firemodelsurvey.com/EgressModels.html. 40 Friedman, R., “An International Survey of Computer Models for Fire and Smoke,” Journal of Fire Protection Engineering, 4 (3), 1992, pp. 81-92. 41 Deal, S., “Technical Reference Guide for FPETool Version 3.2,” NISTIR 5486-1, April 1995. 42 Kisko, T.M., Francis, R.L., & Nobel, C.R., “EVACNET4 User’s Guide,” Version 10/29/98, University of Florida, 1998, 67 pp. 43 Johnson, P., Beck, D. & Horasan, P., “Use of Egress Modeling In Performance Based Fire Engineering Design – A Fire Safety Study At The National Gallery of Victoria,” Fire Safety Science – Proceedings of the 4th International Symposium, Ed., Kashiwagi, T., pp. 669-680, 1994. 44 Takahashi, K., Tanaka, T., & Kose, S., “An Evacuation Model for Use in Fire Safety Designing of Buildings,” Fire Safety Science -- Proceedings of the 2nd International Symposium, pp. 551-560, 1988. 45 Tanaka, T., Email Communication, May 12, 2003. 46 Cappuccio, J., “Pathfinder: A Computer-Based Timed Egress Simulation,” Fire Protection Engineering, Fall 2000. 47 Caro, A.C. & Miller, J.A., “Computer-Based Exiting Design,” http://www.rjagroup.com/rja/ecorner/caro&miller_std_0702.htm. 48 Cappuccio, J., Email Communication, April 3, 2003. 49 Pauls, J.L., “Building Evacuation: Research Findings and Recommendations,” Fires and Human Behavior, John Wiley and Sons, Inc., New York, NY, 1980, pp. 251-274. 50 Shestopal, V.O. & Grubits, S.J., “Evacuation Model for Merging Traffic Flows in Multi-Room and Multi-Story Buildings,” Fire Safety Science – Proceedings of the 4th International Symposium, 1994, pp. 625-632. 51 Okazaki, S. & Matsushita, S., “A Study of Simulation Model for Pedestrian Movement with Evacuation and Queuing,” http://www.anc-d.fukui-u.ac.jp/~sat/ECS93.pdf. 52 Kendik, E., “Methods of Design for Means of Egress: Towards a Quantitative Comparison of National Code Requirements,” Fire Safety Science – 1st International Symposium, 1995, pp. 497-511.

359
53 Semenko, P., Email Communication, May 13, 2003. 54 Donegan, H.A., Pollock, A.J., & Taylor, I.R., “Egress Complexity of a Building, Fire Safety Science – Proceedings of the 4th International Symposium, date, 1994, pp. 601-612. 55 Donegan, H.A. & Taylor, I.R., “How Complex is the Egress Capability of your Design?” Human Behavior in Fire Proceedings of the First International Symposium, TJ Shields, ed., September 1998, pp. 601-608. 56 Mott MacDonald, “STEPS Simulation of Transient Evacuation and Pedestrian movements User Manual,” unpublished, available with egress model from Mott MacDonald. 57 Hoffman, N.A., Henson, D.A., & Pope, C.W., “Analysis of the Evacuation of a Crush Loaded Train in a Tunnel,” Mott MacDonald Limited, Presented at the 3rd International Conference on Safety in Road and Rail Tunnels, Nice, France, March 1998. 58 Wall, J.M. & Waterson, N.P., “Predicting Evacuation Times – A Comparison of the STEPS Simulation Approach with NFPA 130,” Mott MacDonald Limited, St Anne House, Wellesley Road, Croydon CR9 2UL, Submitted to Fire Command Studies. 59 Hoffman, N.A. & Henson, D.A., “Simulating Transient Evacuation and Pedestrian Movement in Stations,” Mott MacDonald Limited, Presented at the International Conference On Mass Transit Management, Kuala Lumpur, Malaysia, May 1997. 60 Hoffman, N.A. & Henson, D.A., “Simulating Emergency Evacuations in Stations,” Mott MacDonald Group, Presented at the APTA Rapid Transit Conference, Washington DC, USA, June 1997. 61 Mott MacDonald and Arup, Email Communication regarding the STEPS model, March 2003. 62 Pellissier, E., Email Communication, May, June, 2003. 63 National Fire Protection Association, NFPA 130, Standard for Fixed Guideway Transit and Passenger Rail Systems, 2000, Quincy, MA. 64 Arup, “Pedestrian Planning for the Olympic Park Railway Station, Sydney,” http://www.arup.com/insite/printfeature.cfm?featureid=38. 65 Transport Strategies Limited, “A Guide to Transport Demand Forecast Models: PEDROUTE & PAXPORT,” http://www.tsl.dircon.co.uk/dempedroute.htm. 66 Barton, J. & Leather, J., “Paxport – Passenger and Crowd Simulation,” Passenger Terminal ’95, pp. 71-77, 1995. 67 Buckmann, L.T. & Leather, J.A., “Modelling Station Congestion the PEDROUTE Way,” Traffic Engineering and Control, 35(6), June 1994, pp. 373-377. 68 Halcrow Group Limited, “PAXPORT” and “PEDROUTE” brochures, http://www.halcrow.com ? 69 Clifford, P. & du Sautoy, C., “Pedestrian and Passenger Activity Modelling,” Halcrow Fox, Vineyard House, 44 Brook Green, Hammersmith, London, undated. 70 du Sautoy, Email communication, May 16, 2003. 71 Fahy, R.F., User’s Manual, EXIT89 v 1.01, An Evacuation Model for High-Rise Buildings, National Fire Protection Association, Quincy, Mass., December, 1999.
360
72 Fahy, R.F., “Verifying the Predictive Capability of EXIT89,” 2nd International Symposium on Human Behaviour in Fire, Boston, MA, March 2001, pp. 53-63. 73 Fahy, R.F., “EXIT89 – An Evacuation Model for High-rise Buildings – Model Description and Example Applications,” Fire Safety Science – Proceedings of the 4th International Symposium, 1994, pp. 657-668. 74 Fahy, R.F., “EXIT89 – High-rise Evacuation Model – Recent Enhancements and Example Applications,” Interflam ’96, International Interflam Conference – 7th Proceedings, Cambridge, England, March 1996, pp. 1001-1005. 75 Fahy, R.F., "Development of an Evacuation Model for High-Rise Buildings," Volume 1 of 2, School of the Built Environment, Faculty of Engineering of the University of Ulster, in fulfillment of the requirements for the degree of DPhil by published works, December 1999. 76 Fahy, R.F., Email and Personal Communication, February, March, May, 2003. 77 Jones, W.W.; Forney, G.P.; Peacock, R.D.; Reneke, P.A., “Technical Reference for CFAST: An Engineering Tool for Estimating Fire and Smoke Transport,” National Institute of Standards and Technology, Gaithersburg, MD, NIST TN 1431; March, 2000. 78 IES, Simulex User Manual, Evacuation modeling software, Integrated Environmental Solutions, Inc., March, 2001. 79 IES, Simulex Technical Reference, Evacuation modeling software, Integrated Environmental Solutions, Inc., November 2000. 80 Thompson, P.A., Wu, J., and Marchant, E.W., “Modelling Evacuation in Multi-storey buildings with ‘Simulex,’” Fire Engineering Journal, 56, 185, November, 1996, 7-11. 81 Thompson, P.A. & Marchant, E.W., “A Computer Model for the Evacuation of Large Building Populations,” Fire Safety Journal 24, 1995, 131-148. 82 Thompson, P.A. & Marchant, E.W., “Simulex; Developing New Computer Modelling Techniques for Evaluation,” Fire Safety Science – Proceedings from the 4th International Symposium, 1994, pp. 613-624. 83 Thompson, P.A., "Developing New Techniques for Modelling Crowd Movement", PhD thesis, Dept. of Building and Environmental Engineering, University of Edinburgh, Scotland, January 1995. 84 Thompson, P.A., Email and Personal Communication, January, March, August, September, 2003. 85 Thompson, P.A. & Marchant, E.W., “Testing and Application of the Computer Model ‘SIMULEX’,” Fire Safety Journal, 24 (1995), pp. 149-166. 86 Simulex website, http://www.ies4d.com/VESystem/VE-Evacuation/simulex/simulex.htm. 87 Olsson, P.A. & Regan, M.A., “A Comparison Between Actual and Predicted Evacuation Times,” Human Behaviour in Fire – Proceedings of the 1st International Symposium, 1998, pp. 461-468. 88 National Fire Protection Association, NFPA 101 Life Safety Code Handbook, 2000. 89 Fire safety engineering in buildings (1997) Part 1. Guide to the application of fire safety engineering principles, Draft for development, BSI-DD240, ISBN 0-580-27952-9, UK.

361
90 Bensilum, M. & Purser, D., “GridFlow: an object-oriented building evacuation model combining pre-movement and movement behaviours for performance-based design,” 7th International Symposium on Fire Safety Science, Worcester Polytechnic Institute, Worcester, MA, June 16-21, 2002. 91 Purser, D., Email Communication, May 14, 2003. 92 Interconsult ASA, http://www.cibprogram.dbce.csiro.au/program/survey_view.cfm?S_ID=551. 93 Jensen, G., Email communication, May 2003. 94 Heskestad, A.W. & Meland, O.J., “Determination of Evacuation Times as a Function of Occupant and Building Characteristics and Performance of Evacuation Measures,” Human Behaviour in Fire – Proceedings of the 1st International Symposium, 1998, pp. 673-680. 95 Fraser-Mitchell, J., “Simulated Evacuations of an Airport Terminal Building, Using the CRISP model,” 2nd International Symposium in Human Behavior in Fire, Boston, MA, March 2001, pp. 89-100. 96 Fraser-Mitchell, J., “’CRISP’ Fire Risk Assessment by Simulation,” Presentation given at the University of Greenwich, April 2003. 97 Fraser-Mitchell, J., Email and Personal Communication, August 2003. 98 Boyce, K., Fraser-Mitchell, J., & Shields, J., “Survey Analysis and Modelling of Office Evacuation Using the CRISP Model,” Human Behavior in Fire Proceedings of the First International Symposium, TJ Shields, ed., September 1998, pp. 691-702. 99 Schneider, V., “Application of the Individual-Based Evacuation Model ASERI in Designing Safety Concepts, 2nd International Symposium on Human Behavior in Fire, Boston, March 2001, pp. 41-51. 100 ASERI brochure entitled “ASERI (Advance Simulation of Evacuation of Real Individuals) A model to simulate evacuation and egress movement based on individual behavioural response, http://www.ist-net.de. 101 Schneider, V. & Konnecke, R., “Simulating Evacuation Processes with ASERI,” Tagungsband International Conference on Pedestrian Evacuation Dynamics (PED), April 2001, Duisburg. 102 Schneider, V., Email and Personal Communication, May 19, 2003 and August, 2003. 103 Stahl, F.I., “BFIRES/Version 2: Documentations of Program Modifications,” NBSIR 80-1982, March 1980. 104 Fire Safety Engineering Group, http://fseg.gre.ac.uk/exodus. buildingEXODUS website. 105 Gwynne S., Galea, E., Lawrence, P., & Owen, M., “Simulating Occupant Interaction with Smoke Using buildingEXODUS,” 2nd International Symposium on Human Behaviour in Fire, Boston, MA, 2001, pp. 101-110. 106 Gwynne, S., Galea, E., Lawrence, P.J., & Filippidis, L., “Modelling Occupant Interaction with Fire Conditions Using the buildingEXODUS Evacuation Model,” University of Greenwich, London, England, Paper No. 00/IM/54; February 2000. 107 Gwynne, S., Email and Personal Communication, April, May, August 2003. 108 Gwynne, S., Galea, E.R., Owen, M. & Lawrence, P.J., “Validation of the BuildingEXODUS Evacuation Model,” University of Greenwich, London, England, Paper No. 98/IM/29, 1998.

362
109 Gwynne, S., Galea, E.R., Lawrence, P.J., Owen, M., & Filippidis, L., “Further Validation of the BuildingEXODUS Evacuation Model Using the Tsukuba Dataset,” University of Greenwich, London, England, Paper No. 98/IM/31, 1998. 110 Ketchell, N., Cole, S.S., & Webber, D.M., “The EGRESS Code for Human Movement and Behaviour in Emergency Evacuation,” Engineering for Crowd Safety, Eds: Smith, R.A. and Dickie, J.F., Elsevier, pp. 361-370, 1994. 111 Ketchell, N., Bamford, G.J., & Kandola, B., “Evacuation Modelling: A New Approach,” ASIAFLAM ’95, 1st Proceedings – International Conference on Fire Science and Engineering, March 1995, pp. 499-505. 112 AEA Technology, “A Technical Summary of the AEA EGRESS Code,” AEA Technology, Warrington, UK, May 2002. 113 Levin, B.M., “EXITT: A Simulation Model of Occupant Decisions and Actions in Residential Fires: Users Guide and Program Description,” National Bureau of Standards, Gaithersburg, MD, CIB W14/88/17; NBSIR 87-3591; July, 1987. 114 Levin, B.M., “EXITT – A Simulation Model of Occupant Decisions and Actions in Residential Fires,” Fire Safety Science – Proceedings of the 2nd International Symposium, 1988, pp. 561-570. 115 Nober, E.H. et al, “Waking Effectiveness of Household Smoke and Fire Detection Devices,” Fire Journal, Vol. 75, No. 4, 85 pp., 1981. 116 Still, G.K., “New Computer System Can Predict Human Behavioural Response to Building Fires,” Fire, January 1993, pp. 40, 42. 117 Still, G.K., “VEgAS (Virtual Egress and Analysis System), http://www.crowddynamics.com/. 118 Still, G.K., Email Communication, May 2003. 119 Reisser-Weston, E., “Simulating Human Behaviour in Emergency Situations,” RINA, International Conference of Escape, Fire, and Rescue, Nov, 1996. 120 Pauls, J.L., “Building Evacuation: research findings and recommendations in Fires and Human Behavior,” Ed. Canter, D., John Wiley & Sons, Chichester, p. 251-275. 121 Ozel, F., “A Stochastic Computer Simulation of the Behavior of People in Fires: An Environmental Cognitive Approach,” Proceedings of the International Conference on Building Use and Safety Technology, 1985. 122 Ozel, F., “Simulation of Processes in Buildings as a Factor in the Object Representation of Built Environments,” Proceedings of Building Simulation ’91, pp. 250-256, 1991. 123 Ozel, F., “Computer Simulation of Behavior in Spaces,” Environmental Simulation: Research and Policy Issues, edited by R.W. Marans & D. Stokols, Plenum Press, New York, pp. 191-204, 1993. 124 Ozel, F., Email Communication, May 2003. 125 Poon, L.S., “EvacSim: A Simulation Model of Occupants with Behavioural Attributes in Emergency Evacuation of High-Rise Building Fires,” Fire Safety Science – 4th International Symposium, 1994, pp. 681-692. 126 Poon, L.S., Email Communication, April 1, 2003.

363
127 Pauls, J.L., “Effective-Width Model for Evacuation Flow in Buildings,” Proceedings: Engineering Applications Workshop, Society of Fire Protection Engineers, Boston, MA, 1980. 128 Legion International Ltd., http://www.legion.biz/system/research.cfm. 129 Proulx, G., “The Impact of Voice Communication Messages During a Residential Highrise Fire,” Human Behavior in Fire – Proceedings of the 1st International Symposium, 1998, pp. 265-274. 130 Proulx, G. & Sime, J.D., “To Prevent ‘Panic’ in an Underground Emergency: Why Not Tell People the Truth?” Fire Safety Science – Proceedings of the 3rd International Symposium, Scotland, 1991, pp. 843-852. 131 Bryan, J.L., “Smoke as a Determinant of Human Behavior in Fire Situations (Project People). Final Report,” NBS GCR 77-94, June 30, 1977. 132 Schumacher, Christine, Brand Management, Marriott International, Personal communication, March 13, 2003. 133 Bryan, J.L., “MGM Grand Hotel Fire a Case Study of Human Reaction to Fire, 6th Joint Panel Meeting of the UJNR Proceedings, Tokyo, Japan, May 1982, pp. 218-250. 134 Ahrens, M., “Selections from the U.S. Fire Problem Overview Report Leading Causes and Other Patterns and Trends, Hotels and Motels,” National Fire Protection Association, Quincy, MA, June 2001. 135 Horovitz, B., “Some surprised to find themselves heroes Two men help a disabled woman escape inferno,” USA Today, September 12, 2002. 136 Feinberg, W.E. & Johnson, N.R., “Primary Group Size and Fatality Risk in a Fire Disaster,” 2nd International Symposium on Human Behaviour in Fire, Boston, MA, March 2001, pp. 11-22. 137 Sime, J., Breaux, J., & Canter, D., “Human Behavior Patterns in Domestic and Hospital Fires,” Fire Research Station, UK, BRE Occasional Paper 59, May 1994. 138 Sime, J.D., “Outcome of Escape Behavior in the Summerland Fire: Panic or Affiliation?” International Conference on Building Use and Safety Technology, March 1985, Los Angeles, CA, pp. 81-90. 139 Kendik, E., “Assessment of Escape Routes in Buildings and a Design Method for Calculating Pedestrian Movement,” SFPE Technology Report 85-4, Society of Fire Protection Engineers, Boston, MA, 1985. 140 Fahy, R.F. & Proulx, G., “Toward Creating a Database on Delay Times to Start Evacuation and Walking Speeds for Use in Evacuation Modeling,” 2nd International Symposium on Human Behavior in Fire, Boston, MA, March 2001, pp. 175-183. 141 Rickets, G. “An Investigation into the Density and Flow of People in Public Spaces by Image Analysis,” Hons. Dissertation, Dept. of Civil Engineering and Building Science, University of Edinburgh, 1994. 142 SFPE Engineering Guide to Human Behavior in Fire, Society of Fire Protection Engineers, Bethesda, MD, June 2003. 143 Boyce, K.E., Shields, T.J., & Silcock, G.W.H., “Toward the Characterization of Building Occupancies for Fire Safety Engineering: Capabilities of Disabled People Moving Horizontally and on an Incline,” Fire Technology, Vol. 35, No. 1, 1999.

364
144 Aloi, S. and Rogers, J. (2002), “Reach for the Sky,” Fire Prevention & Fire Engineers Journal, Vol. 62, No. 219, FPA London, April 2002. 145 Mizuno, M., Wakamatsu, T., Ohmiya, Y., & Sekizawa, A., “Investigation Report Regarding Behavioral Response of Employees in a Hotel Fire,” Asian-Oceania Symposium on Fire Science and Technology, 4th Proceedings, Tokyo, Japan, May 2000, pp. 205-216. 146 Nakano, M. & Hagiwara, I., “Experimental Study on Starting Time of Evacuation in Sleeping Condition,” Asia-Oceania Symposium on Fire Science and Technology, 4th Proceedings, Tokyo, Japan, May 2000, pp. 263-274. 147 Brennan, P., “Modelling Cue Recognition and Pre-Evacuation Response,” Proceedings – 6th International Symposium, International Association for Fire Safety Science, Boston, MA, July 1999, pp. 1029-1040. 148 British Standards Institute, “Fire Safety Engineering in Buildings, Part 1: Guide to the Application of Fire Safety Engineering Principles,” DD240, London, 1997. 149 Welsh, Stacey, Marriott Corporation, Email Communication, March, September, October, 2003. 150 American Society of Mechanical Engineers, ASME A17.1-2000, Safety Code for Elevators and Escalators, NY, 2000. 151 Ando, K., Ota, H., & Oki, T., “Forecasting the flow of people,” Railway Research Review, 45:8-14, 1988 (in Japanese). 152 Pauls, J.L., “Have we learned the evacuation lessons? A Commentary,” Fire Engineering, Vol. 155, No. 10, October 2002, 113-116, 118-122 pp.