Embed Size (px)
Citation preview

(_ Uirite_dtltuSm_trlte:' Evaluation of a_'_ Mechani edNorth CentralForeSt Experiment
:teatie__ch .. Tree- P/anti ngPaper NC-258
j _ peration"chael A. Thom
\
\
• I

|
°
.. CONTENTS
PageBackground .................................................................................................. 1Site Information .......................................................................................... 2
Site No. 2 ................................................................................................. 3Site No. 3 ................................................................................................. 3Site No. 4 ................................................................................................. 3Site No. 5 ................................................................................................. 3
Operational Efficiency ................................................................................ 3Land Utilization ...................................................................................... 3
Productivity Analysis ............................................................................. 4Cost Analysis ........................................................................................... 6Blade Evaluation ..................................................................................... 8
Discussion .................................................................................................... 8Literature Cited ........................................................................................... 8
Appendix ...................................................................................................... 9
North Central Forest Experiment StationForest Service--U.S. Department of Agriculture
1992 Folwell AvenueSt. Paul, Minnesota 55108
Manuscript approved for publication June 29, 1984December 1984

°
EVALUATION OF A MECHANIZEDTREE-PLANTING OPERATION
t Michael A. Thompson, Associate Engineer,Houghton, Michigan ,
f
Establishinga standofpreferredspeciesisoften plantingpath.The utilityofthisbladeisalsoeval-themostimportantgoalinforestlandmanagement, uated.The degreetowhich thisgoalisachievedwillde-terminethe future growth, yield, and economic re- BACKGROUNDturn from the stand. It will also determine therecreational, wildlife, and watershed value of the The planting operation was contracted by the Ot-developing forest. Conifer species may be estab- tawa National Forest _to a bulldozer owner with nolished by natural seeding (if suitable seed trees are previous mechanical tree planting experience. Thepresent), artificial seeding, or planting (either contractor supplied the prime mover and laborbarerootorcontainer- growntreeseedlings).Prob- whereasthe NationalForestsuppliedtheplanter,lemswithseedingmethodshavecausedwidespread V-blade,and seedlings.
interestinplantingtreeseedlings.Forestplanting The capitalcostofthe equipmentused in this.canbeexpensiveduetothecostsofsitepreparation,plantingstock,theplantingoperation,and thesub- operationwas $199,000using1983purchaseprices:
sequentcontrolofcompetingvegetation.However, 1983standdensityand compositioncan be controlledtoa much greaterextentthan withseedingmethods, purchaseThis may make plantingcheaperthan seedingin Equipment pricethelongrun ifseedingmethodsdelaystandestab- D5B CaterpillarDozer with V-lishment,resultin establishmentof undesirable blade $110,000species,orrequireprecommercialtreatmenttocon- WhitfieldForestlandTransplan- 8,000trolstanddensityand composition, terwithsinglecrankaxle 55,000
InternationalTranstarIITractor 15,000Seedlingscanbe plantedby hand orby machine. Heavy-duty,low-boytrailer 11,000
Eachmethod hasadvantagesand disadvantages.In• general;machines shouldbe used on large,fiat Heavy-dutyV2-tonpickuptruck $199,000
tracts having deep soils. Small tracts and steep The Whitfield Forestland Transplanter 2 is a con-slopes should be planted by hand (Benson 1982). tinuous-furrow bareroot stock mechanical treeThis general guideline is sensitive to local condi- planter (fig. 1). The operating principle of thetions, however. The land manager must try to attain planter is as follows (fig. 2): the packing wheels rollthe optimal combination of hand and machine along the ground and cause the planting chain toplanting based on site conditions, availability of lo- rotate; the operator places a seedling in the fingerscal labor, areas to be planted, and many other fac- of each planting arm as it rotates past; this armtors. To .make informed decisions, productivity, carries the seedling down into the furrow createdcost, and operational information for a variety ofoperating conditions must be available. 1The Ottawa National Forest is located in the west-
ern section of Michigan's Upper Peninsula.In this study I evaluated the productivity and cost
of a mechanized red pine (Pinus resinosa) planting "_The use of trade, firm, or corporation names inoperation, on four sites. In preparation for planting, this publication is for the information and conven-the slash on each site was treated differently. A large ience of the reader. It does not constitute an officialportion of the analysis will focus on differences in endorsement or approval of any product or service by
productivity due to these treatments. A specially the United States Department of Agriculture to thedesigned V-blade was used to clear debris from the exclusion of others which may be suitable.

CAB A88EMBLY ....
°
BEAT. 8AFETY BELT
AND PADDING
..
DRAWBAR ANDPLANTING ARM8 _I.!.. ._............._:_i
8PRiNG ASBEMBL*/
Figure 3.--Dozer with Voblade towing the Whitfieldplanter.
The transplanterwas towed by a D5B Caterpillar
_ou,.TE_B,.,,DE dozer with a V-blade mounted on the front (fig. 3).NuB The V-blade was designed to clear a path through
,ooTABBE,,B'._ PA*,,NGW,,EE,.B theslashand debrisatleastaswide asthebulldozer.
Figure 1.--WhitfieldForestlandTransplanter(as- A scalpingfooton the V-bladewas designedtoscalp
sembly view courtesy of Whitfield Manufacturing 4 inches of topsoil from an area at least as wide asCompany). the packing wheels of the planter (fig. 4). A float
pad was added to allow for adjustment of the scalp-' ing depth and to free the operator from having to
by the shoe; the packing wheels pack soil around continuously adjust the blade.
the roots, and the seedling is released. The coulter Four men were required for the operation - oneblade breaks the soil ahead of the foot, cuts through to operate the bulldozer, one to feed (load) theroots and small stumps, and allows the planter toroll up over impenetrable objects, such as rocks and planter, and two to follow the planter and replant-large stumps (fig. 1). poorly planted trees.
SITE INFORMATION-...._,
OPERATOR'8 PLANTING PLANTING Five sites in Ontonagon County, Michigan, were
-SEAT _:1 ARM j CHAIN plantedunder thiscontract.However, inan attemptto minimize the effectofoperatorinexperience,we\\ did not collectdata at sitenumber 1 and limited
PACKINGWHEEL
• .ii_::_::_i_i_i_!_::_]_::_]!i_.•....... ii i ._:.,!_._!_._. _<:_:_:_:_:::_::_]_:_:_]_]_::_]_::_::_:_::_:_:_:_[_::_[_::_::_:_]_:_]_:_:]::[]_]_]_]_
\\ - ' ......
Figure 2.--Operating principle o[ the Whitfield For-estland Transplanter. The packing wheels rollalong the ground causing the planting chain to ro-tate. The operator places a seedling in each plant-ing arm as it rotates past. The arm releases theseedling in the furrow created by the shoe, and thepacking wheels pack soil around the root collar.
" (courtesy of Whitfield Manufacturing Company). Figure 4.--Front view of specially modified V-blade.

the analysisto the remaining four sites.All sites Site No. 5have sandy loam soil and flat to gently rolling to-
pography. No slash treatment had been done on this site,
and therefore heavy slash was found throughout theSite No. 2 area. The 25-acre-(10.1-hectare) mixed jack/red
pine stand previously occupying the site was har-The logging slash had been partially burned in vested in 1981, leaving 12-to 24-inch-(30-to 61-cm)
place leaving a light layer of slash on the site. The tall, mainly 6- to 14-inch-(15-to 36-cm) diameter15-acre-(6.1-hectare) pure jack pine (Pinus bank- stumps, with some red pine stumps up to 24 inchessiana) stand previously occupying the site was hat- (61 cm) in diameter.vested in 1981 (2 years prior to planting), leaving
6-inch (15-cm) tall, 6- to 10-inch-(15- to 25-cm) di- OPERATIONAL EFFICIENCYameter stumps. Several large, decaying stumps from
an earlier stand were also scattered throughout the Land Utilizationarea. A portion (3.5 acres: 1.4 hectares) of the clear-
cut area supports dense aspen (Populus spp.) re- The proportion of forest land area in an unpro-generation and was not planted. A 20-foot-(6-m) ductive state is an important management consid-wide woods road through the site was also not eration. Large roads, landings, and brush pilesplanted, reduce the available land base, lowering the net pro-
ductivity of the forest. This area should be mini-Site No. 3 mized from an economic standpoint. Similarly,
stand density should be maintained between min-The slash had been l_iled and burned leaving the imum and maximum recommended stocking levels
site free from debris and standing timber. The piles to ensure favorable tree growth and quality and towere not completely burned, however, and occupied discourage the establishment of undesirable species.
• a significant portion of the planting area. The 20- The combination of these two factors--nonplanta-acre-(8.1-hectare) mixed jack/red pine stand pre- ble areas and stand density--determines the degreeviously occupying the site was harvested in 1981, of land utilization.leaving 6-inch-(15-cm) tall, mainly 6- to 10-inch-(15- to 25-cm) diameter stumps, with some red pine The area utilized on each site was estimated bystumps as large as 20 inches (51 cm) in diameter, multiplying the number of seedlings planted on thatA few large, decaying stumps were also Scattered site by the nominal area per seedling (assuming per-throughout the area. A portion (7.5 acres: 3.0 hec- fect 6-foot by 10-foot spacing). This nominaltares) of the clearcut area was on the side of a ridge planted area was computed for each site along with
so was planted by hand. the total area clearcut and the net area available forplanting (table 1). The total areas differed from the
Site No. 4 net areas for sites 2 and 3 because portions of thesesites were not intended to be machine planted, i
The slash on the site had been windrowed for The area planted (as calculated from the nominal tburning; however, a large amount of slash was left spacing) was less than the area available for plant-inplace. The 19-acre-(7.7-hectare) mixed jack/red ing on all four sites. There are several reasons forpine stand previously occupying the site was hat- this. First, machine planting was not possible invested in 1981, leaving 6-inch-(15 cm) tall, 6- to 12- certain localized areas due to the existing landform,inch-(15- to 30-cm) diameter stumps, such as large depressions, old railroad beds, woods
, Table 1.-'-Total area, net area, and planted area I by site
Site no. Total area Net area Seedlingsplanted Planted area'
Acres (ha) Acres (ha) No. Acres (ha)
2 15 (6.1) 11.5 (4.7) 8,250 11.36 (4.60)3 20(8.1) 12.5(5.1) 8,250 11.36 (4.60)4 19(7.7) 19.0(7.7) 11,250 15.50 (6.27)5 25 (10.1) 25.0 (10.1) 17,250 23.76 (9.62)
. _Basedon an assumed spacing of 6 feet by 10 feet (1.8 by 3.0 m)

roads, sloping ground, and wet areas. This was sig- Table 2.--Observed components of the schedulednificant on sites 3 and 5--on each site more than planting time for the operationan acre (0.4 hectare) was removed from the availableland base. Second, rows meandered around obstruc-tions such as high stumps, standing trees, and large Componenttimes ObservedtimeTotaltimeSlash piles causing inconsistent row spacing and Productivetime Hours Percentwasted land area. This was an important factor on Get seedlings 0.10 0.8site 4 where 3.5 acres (1.4 hectares) of the available Loadseedlings .67 5.4land was not planted. Third, tract shape and se- Travel .39 3.2verity of site conditions affects the ability of the Plant 6.15 49.8dozer operator to lay out well-spaced rows. And fi- Turnaround 2.00 16.2nally seedling spacing within each row depends on Total 9.31 75.4proper operation of the planter. Within-row spacing Mechanicaldelay timeincreases if the packing wheels lose contact with Adjustand inspect planter .11 .9the ground or if debris interferes with the planting Repairplanter .69 5.6mechanism. Random seedling counts on 15 rows in Total .80 6.5site 2 showed that the average within-row spacing Nonmechanicaldelaytime
was 6.2 feet (1.9 m)--close to the nominal spacing Cleardebris from planter 2.02 16.4of 6 feet (1.8 m). Maneuver .10 .8
. Backup .12 1.0Total 2.24 18.2
Productivity Analysis Totalobservedtime= 12.35hours
The productivity of this planting operation wasevaluated on each of the four sites through use of
continuous time-study techniques. A total of 19.6 Also, debris that did get underneath the planter didhours were observed out of the 94.9 hours spentplanting these sites, not get jammed between the coulter blade and foot
assembly as easily as it did on sites 2 and 3. ThisThe observed components of the scheduled plant- is because the Whitfield planter used on sites 4 and
ing time show 75 percent as productive (table 2). In 5 had a nub on the foot assembly (figure 1). Thisaddition to these times, some time will be spent nub was missing from the Whitfield planter useddaily on personal breaks. Also, time will be spent on sites 2 and 3. The positive effect of this nub onsetting up, taking down, and traveling between sites, sites 4 and 5 is supported by the lower average clearThe average amount of time spent on these activ- time per stop on these sites as compared to that ofities will depend on tract size, the distance between sites 2 and 3. [JtractS, and road conditions, among other things. In Two important conclusions can be drawn from
this study, 58 minutes were required to prepare for this portion of the analysis. First, based on the 1' planting and 36 minutes to prepare for leaving the planting efficiencies observed on these sites, site
site, On the. average, preparation in the form of slash treatment is notThe condition of the planting site is an important advantageous and may actually be detrimental to
determinant of planting productivity. Several of the the efficiency of the planting operation (this doeselements that interact to determine productivity are not pertain to lowering stump height or spreadingdirectly affected by site conditions. For example, the out large slash piles). This can be attributed to theincidence of site-related delays is greater on diffi- tendency for the slash to mat together and shedcult-to-plant sites. This greatly slows down pro- easier. Leaving the slash in place on the site alsoduction. Three delay times were identified as being may be preferable from a silvicultural standpoint.related to the site--ma.neuver, clear, and back up. The decomposing slash adds to the nutrient supplyThe magnitude of these delays per 1,000 planted feet of the site. It also holds moisture in the soil, pro-(305 m) ranged from about 1 to 3 minutes (table 3). vides partial shade for the seedlings in the heat ofThe major component of the site--related delay is the summer, and reduces competition by undesir-the l_ime it takes to clear debris caught beneath the able species. Another benefit of leaving the slash inplanter. Site 5 (the slashiest site)had the least prob- place is that less land area would be taken out oflem With this (table 3). This was because the heavy production by large, unburned slash piles. Finally,slash tended to mat together, which made it easier there would be no slash disposal costs, lowering thefor the V-blade to shed it from the planting path. total cost of stand conversion. One disadvantage to
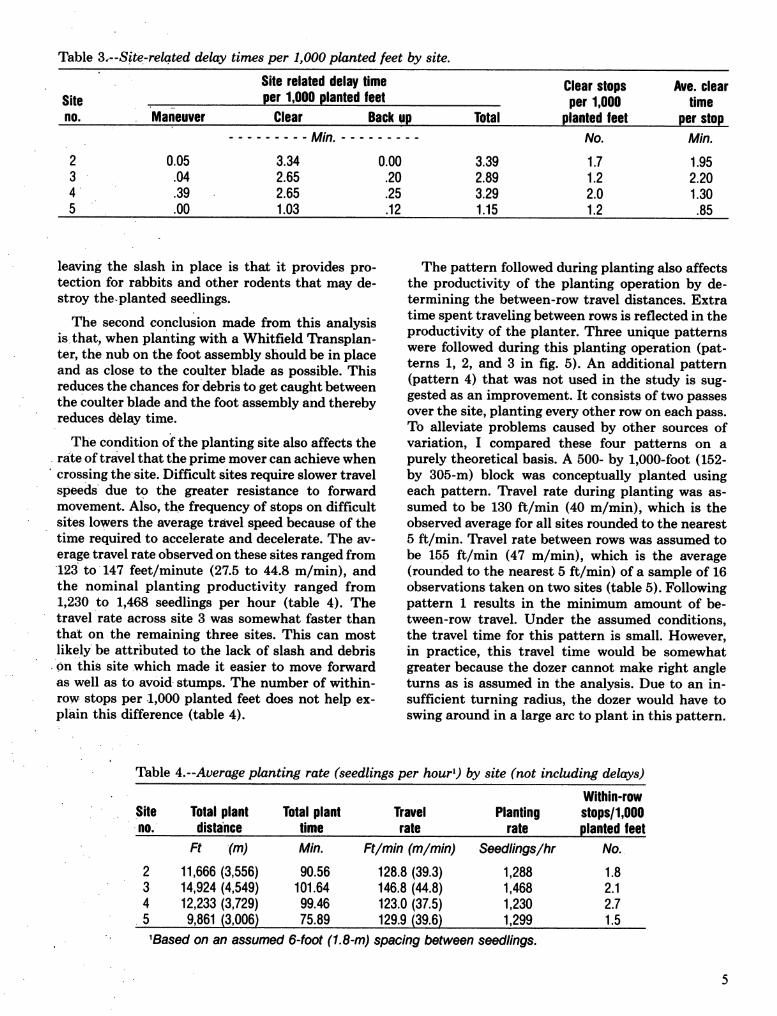
Table 3.--Site-related delay times per 1,000 planted feet by site.
Site relateddelaytime Clearstops Ave.clearSite per 1,000plantedfeet per 1,000 timeno. _Maneuver Clear Backup Total plantedfeet per stop
Min. No. Min.
2 0.05 3.34 0.00 3.39 1.7 1.953 .04 2.65 .20 2.89 1.2 2.20
-.
4 _ .39 2.65 .25 3.29 2.0 1.305 .00 1.03 .12 1.15 1.2 .85
leaving the slash in place is that it provides pro- The pattern followed during planting also affectstection for _rabbits and other rodents that may de- the productivity of the planting operation by de-stroy the.planted seedlings, termining the between-row travel distances. Extra
The second conclusion made from this analysis time spent traveling between rows is reflected in theis that, when planting with a Whitfield Transplan- productivity of the planter. Three unique patternster, the nub on the foot assembly should be in place were followed during this planting operation (pat-and as close to the coulter blade as possible. This terns 1, 2, and 3 in fig. 5). An additional patternreduces the chances fordebris to get caught between (pattern 4) that was not used in the study is sug-the Coulter blade and the foot assembly and thereby gested as an improvement. It consists of two passes
over the site, planting every other row on each pass.reduces delay time. To alleviate problems caused by other sources of
The condition of the planting site also affects the variation, I compared these four patterns on arate of travel that the prime mover can achieve when purely theoretical basis. A 500- by 1,000-foot (152-crossing thesite. Difficult sites require slower travel by 305-m) block was conceptually planted usingspeeds due to the greater resistance to forward each pattern. Travel rate during planting was as-movement. Also, the frequency of stops on difficult sumed to be 130 ft/min (40 m/rain), which is thesites lowers the average travel speed because of the observed average for all sites rounded to the nearesttime required to accelerate and decelerate. The av- 5 ft/min. Travel rate between rows was assumed toerage travel rate observed on these sites ranged from be 155 ft/min (47 m/rain), which is the average1-23 to147 feet/minute (27.5 to 44.8 m/rain), and (rounded to the nearest 5 ft/min) of a sample of 16the nominal planting productivity ranged from observations taken on two sites {table 5). Following1,230 to 1,468 seedlings per hour (table 4). The pattern 1 results in the minimum amount of be-travel rate across site 3 was somewhat faster than tween-row travel. Under the assumed conditions,that on the remaining three sites. This can most the travel time for this pattern is small. However,like!ybe attributed to the lack of slash and debris in practice, this travel time would be somewhat
•On this site which made it easier to move forward greater because the dozer cannot make right angle• .
as well as to avoid stumps. The number of within- turns as is assumed in the analysis. Due to an in-row stops per 1,000 planted feet does not help ex- sufficient turning radius, the dozer would have toplain this difference (table 4). swing around in a large arc to plant in this pattern.
Table 4.--Average planting rate (seedlings per hour 1) by site (not including delays)
Within-rowSite Totalplant Totalplant Travel Planting stops/I,000no. distance time rate rate plantedfeet
Ft (m) Min. Ft/min (m/min) Seedlings/hr No.
2 11,666(3,556) 90.56 128.8(39.3) 1,288 1.83 14,924(4,549) 101.64 146.8(44.8) 1,468 2.14 12,233(3,729) 99.46 123.0(37.5) 1,230 2.75 9,861(3,0061 75.89 129.9(39.6/ 1,299 1.5_Basedon an assumed 6-foot (1.8-m) spacing between seedlings.

_,r_R.°, P,_. 08 The overall productivity of this operation ranged
. ® ® ® ®®® from 99 to 139 seedlings per scheduled hour (table
I-I I't ii i 6). The productivity on sites 4 and 5 was somewhat
greater than On sites 2 and 3 for three main reasons.First, as the proficiency of the crew increased with
.... experience, less time was spent on avoidable delays,q) ® ® q)®® °.... k- such as preparation and planning. Second, the
greater amount of area planted on sites 4 and 5PAT.TERN-2 P,TT_RN°, resulted in proportionately less time being spent on
®®® ® ® ® preparation. Finally, having the nub in place on the
iIi 1 I i--I _-i-/]_i--j i ] [1''--]== f f_--== = foot assembly for the planter used on sites 4 and 5
i i i ! lowered the amount of delay time encountered on
I| -t_-] these sites. I expect that the overall productivity ofEL J__J-___.__ [_ this operation will improve further as experience is
®@@ (D _ 1 u,o,®__,,__t_,__® (_ gained for a variety of site conditions.
Figure 5.--Planting pattern--patterns 1, 2, and 3 Cost Analysiswere used in this study, and pattern 4 is suggestedas an improvement. The circled numbers indicate Tree planting is an annual investment in sus-the order in which the rows are planted, tained yield forest management from which returns
will not be realized for many years. To maximize
This is the problem the dozer operator encountered the return on this investment, the cost of the plant-ing operation must be minimized while ensuring
in this study when planting with this pattern, planting quality. The purpose of this analysis wasTherefore, because of the difficulty in backing upon these sites, he followed planting pattern 3. Un- to determine the costs that might be expected for
' a planting operation using this particular equip-fortunately, a large portion of time is spent travelingbetween rows with patterns 2 and 3 (table 5). The ment mix. It was not an attempt to estimate the
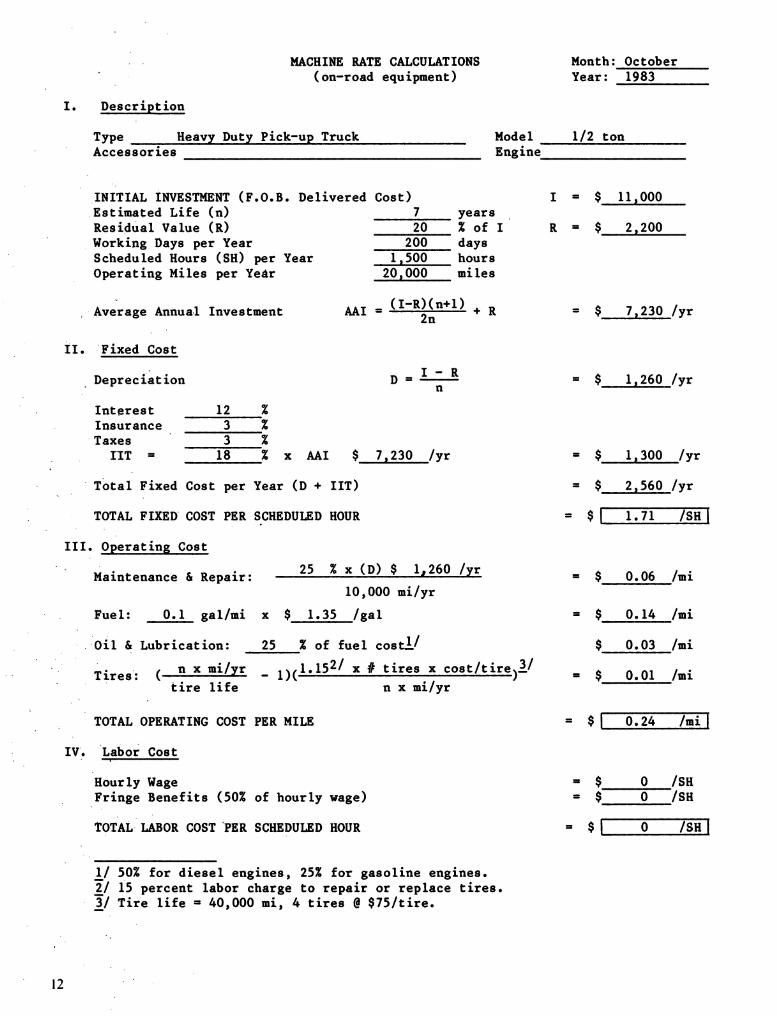
result is a decrease in productivity of equal pro- contractor's actual planting cost.portion (considering plant and between-row travel Purchase prices for 1983 were used to developtime only). This proportion will increase as the machine rates for each piece of equipment used inwidth of the site increases for patterns 2 and 3, the planting operation (table 7). Other assumptionsWhereas it"will remain constant for patterns 1 and made in deriving these machine rates can be de-4. To maximize productivity, this between-row duced from the calculation sheets presented in thetravel time must be minimized. Therefore, pattern Appendix. The costing procedure used is similar to4 is the best pattern to follow because it is fairly that described by Miyata (1980). This informationsimple, minimizes travel time, and provides an ad- was then used to develop overall costs (table 7). Theequate turning radius at the ends of rows. One dis- calculated cost of $239 per thousand seedlings
.. advantage to this pattern is that the chances of planted shows that machine planting can be expen-pushing slash over onto previously planted rows is sive. The cost of a given operation will depend heav-greatest, especially on sites where there has not ily on the equipment used, site conditions, localbeen any slash disposal, labor conditions, and crew efficiency.
Table 5.--Travel time by planting pattern
Pattern Total betweenrow Percentof Productivity3
no. Travel distance Traveltime' total time2
Ft. (m) Min Min Seedlings/hr1 470( 143) 3.03 0.8 1,289
• 2 10,580 (3,225) 68.26 15.6 1,0973 11,280(3,438) 72.77 16.5 1,0864 . 930( 283) 6.00 1.6 1,279
1Assuming a between-row travel rate of 155 ft/min.2Totalplant time is a constant by pattern at 369.23 min. assuming 130 ft/min travel rate while
planting and forty-eight 1,000-foot rows." 3Considers plant and between-row travel time only.

Table 6.--Overall planting productivity by site
Seedlings/Site no. .... Seedlings TotalSH' Seedlings/SH scheduledman-hour2
No.2 8,250 20.3 406 1023 8,250 20.8 397 994 11,250 22.8 493 1235 17,250 31.0 556 139
Total 45,000 94.9 475(ave.) 119(ave.)
_SH= Scheduled Houc time during which equipment is scheduled to do productive work (Miyata 1980). Timesstart at initial departure of equipment to site and end at time of departure from site.
2Average crew size = 4 persons; scheduled man-hour = scheduled hours divided by average crew size.
However, this cost can be reduced in several ways. creased to 75 percent and both follow-up handEquipment utilization can be increased through ex- planters were eliminated, the cost would be reducedperience. Secondhand equipment, having lower in- from $239 to $143 per thousand seedlings planted,vestment and depreciation costs, can be used. The or from $174 to $104 per acre at 6- by 10-foot (1.8-need- for follow-up hand planters can be alleviated by 3.0-m) spacing. This reduces the planting costby using a well-designed V-blade and the appropri- by 40 percent. Cameron (1976 and 1977) reportedate planting accessories for soil conditions. Turn- costs of $40 to $70 per acre ($99 to $173 per hectare)around time can be reduced by using less time-con- for one-pass machine planting. Projecting thesesuming planting patterns. Small sites can be costs to 1983 dollars at an inflation rate of 5 percent
avoided to decrease the proportion of time spent results in planting costs of $50 to $98 dollars permoving: As an example, if the utilization of the acre ($124 to $242 per hectare).equipment used in this planting operation was in-
I
Table 7.--Observed times, machine rates, labor costs, and overall costs for the planting operation
Observedtime Machinerate Cost
PH_ OperatingLabor Total Total Total Total PerMachine SH_ ormP Fixed ($/PH ($/SH) fixed operatinglabor thousand Percent
type ($/SH) ormi) seedings oftotalplanted cost
Caterpillar 94.9 45.04 $20.71 $25.92 $15.00 $i,965 $1,166 $1,424 $4,555 101 42.3. D5B dozer
w/V-bladeWhitfield 9419 45.0' 5.31 4.10 11.25 504 185 1,068 1,757 39 16.3
Forestland
planterLowboy.trailer 94.9 1,000mis 2.08 O.06/mi 0.00 197 60 0 257 6 2.4Pickuptruck 94.9 2,000mis 1.71 0.24/mi 0.00 162 480 0 642 14 6.0International 94.9 1,000mis 7.16 0.75/mi 0.00 679 750 0 1,429 32 13.3truck-tractor
Twofollow-up 94.9 NA6 NA NA 22.50 0 0 2,136 2,136 47 19.7handplanters
Totals: 3,507 2,641 4,628 10,776 239 100.0
_SH= scheduled hour.2PH = productive houri time during which equipment is actually operated (Miyata 1980).3Mi=mile.4Basedon an observed productive time of 9.31 hours out of a total observed time of 19.64 hours.SEstimatedamount of travel during planting period.
• 6NA = not applicable.

Blade Evaluation pending on many factors. However, under the con-" ditions encountered in this study, I feel that slash
A subjective evaluation of the V-blade used in this disposal was an unnecessary expense (from an op-planting operation uncovered one major design flaw erational point of view only) that could have been(fig. 4). Theblade would not float unattended along avoided. This hypothesis should be tested furtherthe ground surface. The forward slope of the blade under controlled conditions.
combined with the remote placement of the hinge Other hypotheses suggested by this study thatpoint relative to the blade caused it to dive into the warrant further investigation include:soil, regardless of the float pad adjustment. To al-leviate this problem, the forward slope of the blade • The design of the V-blade used in this study isshould be reduced (i.e., closer to the vertical)and inadequate. Alternative designs should bethe float pad enlarged or replaced with a rolling tested.
drum. It is important that the blade remain on the • Planting pattern 4 (fig. 5) seems to be the mostground surface; otherwise, debris will get jammed appropriate for this operation. This should bebeneath the planter and cause delays. This was im- documented in field trials.possible" for the operator to attain under his control,however, because of the topography, slash condi- • Machine planting can be an expensive propo-tions, and his other responsibilities, sition. Methods are needed to improve the prof-
itability of these operations (e.g., crew training,A few other deficiencies in the blade were uncov- tract size, equipment mix, etc.).
ered in this evaluation. The scalping foot on thefront of the V-blade removed too much soil from In addition to these hypotheses, the results of thisthe planting path as indicated by the poor packing study show the importance of having the nub onof soil around the seedlings. This could be corrected the foot assembly in place to minimize delays as-by cutting the wings off the foot to form a V-shaped sociated with debris becoming jammed between thePoint. Also, the float pad adjustment bolt was not foot and the coulter blade.
' protected from abrasion, making adjustment diffi-cultwhen the threads became worn.
Cameron (1978) discusses a unique V-blade de-sign that seems to have great potential. The concept LITERATURE CITEDis to have the blade float over the ground surfaceremoving only the debris in the planting path (i.e., Benson, Miles K. Hand or machine planting. In:the outside width of the packing wheels on the Artificial regeneration of conifers in the Upperplanter). Material outside this range is removed Great Lakes Region; 1982 October 26-28; Greenonly if its depth exceeds the clearance of the prime Bay, WI. Houghton, MI: Michigan Technologicalmover being used. This approach minimizes the University; 1982: 332-336.amount of material being moved and therefore low- Cameron, D. A. A guide to planting machine op-
• ers the power requirements of the prime mover, erations in the boreal forest of Ontario. Canadianmaking smaller, less expensive machines possible. Forest Service Rep. O-X-234. Sault Ste. Marie,In addition to this, significant fuel savings could be Ontario, Canada: Great Lakes Forest Researchrealized. Another advantage of this approach is that Centre; 1976. 23 p.there is less chance of pushing debris onto the pre- Cameron, D. A. Planting machines in the borealviously planted row, which can be a serious problem forest. In: Proceedings, Plantation establishmenton sites With heavy slash. The normal recourse is symposium; 1976 September 21-23; Kirklandto widen the row spacing, which affects the utili- Lake, Ontario, Canada. Proceedings O-P-5. Saultzation of the land and the future limbiness of the Ste. Marie, Ontario, Canada: Great Lakes Re-treesi search Centre; 1977: 76-79.
Cameron, D. A. The CFS V-blade. Canadian ForestService Rep. O-X-278. Sault Ste. Marie, Ontario,
DISCUSSION Canada: Great Lakes Forest Research Centre;1978. 10 p.
Theresults of this study pose an interesting ques- Miyata, Edwin S. Determining fixed and operatingtion; namely, "Is slash disposal prior to machine costs of logging equipment. Gen. Tech. Rep. NC-planting necessary, or can single-pass planting be 55. St. Paul, MN: U.S. Department of Agricul-equally efficient?" There is no simple answer to this ture, Forest Service, North Central Forest Ex-
. question. The answer will vary considerably de- periment Station; 1980. 16 p.
8

APPENDIX°
MACHINE RATE CALCULATIONS Month- October
(off-road equipment) Year: 1983
I. Description
Type Caterpillar Bulldozer Model DSB
Accessories Specially modified V-blade Engine 105 HP diesel
INITIAL INVESTMENT (F.O.B. Delivered Cost) I = $ 110,000
Estimated Life (n) 5 years..
Residual Value (R) 20 Z of I R = $ 22,000Working Days per Year 200 daysScheduled Hours (SH). per Year! / 1500 hoursUtilization (U) 65 Z
P.roductive Hours (PH) per Year 975 hoursJ
Average Annual Investment AAI = (.I-R)(n+l) + R = $ 74,800 /yr2n
II. Fixed Cost
Depreciation D ffiI- R = $ 17,600 /yr• 11
Interest 12 ZInsurance 3 Z
Taxes 3 Z
lit = 18 Z x AAI $ 74,800 /yr = $ 13,464 /yr
Total Fixed Cost per Year (D + IIT) ffi$ 31,064 /yr
TOTAL FIXED COST PER SCHEDULEDHOUR ffi $ [" 20.71 /SH I
III. Operating Cost
100 Z x (D) $ 17,,600 /yrMaintenance & Repair: 975 PH/yr ffi $_ 18.05 /PH
Fuel: 105 HP x 0.037 gal/HP-hr2/ x $ 1.35 /gal = $ 5.25 /PH
Oil & Lubrication: 50 Z of fuel cost_3/ $ 2.62 /PH
Tires- (....n x PH/yr - I)(1"154/ x # tires x cost/tire ) = $ NA /PHtire life n x PH/yr .....
TOTAL OPERATING COST PER PRODUCTIVE HOUR = $i' 25.92 /PHI
iV. Labor Cost
Hourly Wage = $ I0.00 /SHFringe Benefits (50Z of hourly wage) = $ 5.00 /SH
TOTAL LABOR COST PER SCHEDULED HOUR ffi $1 15.00 /S.H,]
I/ Not used strictly for planting.
, 2/ 0.037 for diesel engines, 0.050 for gasoline engines.
3/ 50Z for diesel engines, 25Z for gasoline engines.
'4/ 15 percent labor charge to repair or replace tires.

MACHINE RATE CALCULATIONS Month: October
(off-road equipment) Year: 1983
I. Description
Type Whit field Transplanter Model F0rest landAccessories _ w/single crank axle Engine NA
INITIAL INVESTMENT (F.O.B. Dellvered Cost) I = $ 8_000Estimated Life (n) 10 yearsResidual Value (R) 0 Z of I R = $ O
Working Days per Year 30 daysScheduled Hours (SH) per Year 300 hours
•Utilization (U) 65 Z
Productive Hours (PH)'per Year 195 hours
Average Annual Investment AAI = (I-R)(.n+!')+ R = $ 4,400 /yr, 2n ....
II. Fixed Cos t• , ,,
DepreCiation D = I. - ....R = $ 800 /yrn ' ' " •
Interest 12 Z• , ,
Insurance 3 ZTaxes ' 3 X
liT = 18 Z x AAI $. 4,400 /yr = $ 792 /yr
.Total Fixed Cost per Year (D + IIT) = $ I_592 /yr
TOTAL FIXED COST PER SCHEDULEDHOUR -- $[ s.3z ISH]
III. Operating Cost
100 Z x (D) $ 800 /yrMaintenance & Repair: 195 P'H/yr = $ 4.10 /PH
Fuel: - HP x - gal/HP-hr1/ x $ . - /gal = $ NA /PH
Oil & Lubricatlon: - Z of fuel cost_ 2/ $ NA /PH,,
' , Tires: ( n x PH/yr. _ 1)(1..153/ x # tires x cost/tire). = $ NA /PHtire life n x PH/yr ....
TOTAL OPERATING COST PER PRODUCTIVE HOUR = $[ 4.10 /PH[
IV. Labor Cost
Hourly Wage = $ 7.50 /SH
Fringe Benefits (50Z of hourly wage) = $ 3.75./SH
TOTAL LABOR COST PER SCHEDULED HOUR = $I 11.25 /SH]
• ,, ,
I_/ 0.037 for diesel engines, 0.050 for gasoline engines.
2/50Z for diesel engines, 257.for gasollne engines.
3/ 15 percent labor charge to repair or replace tires.
I0

MACHINE RATE CALCULATIONS Month: October
" (on-road equipment) Year: 1983
I. Description
Type .....Heavy Duty Low-boy Trailer Model -Access or ies _ , _" Engine NA
INITIAL INVESTMENT (F.O.B. Delivered Cost) I = $ 15,000
Estimated Life (11) I0 • yearsResidual Value (R) 0 Z of I R = $ 0
Working Days per Year 200 daysScheduled Hours (SH) per Year 1,500 hoursOperating Miles per Year I0_000 miles
,
Average Annual Investment AAI = .(.I-R)(11+1)211 + R = $ 9_000 /yr
II. Fixed Cost
Depreciation D = I- R = $ ITS00 /yr11
Interest 12 Z
Insurance 3 ZTaxes 3 Z
lIT - ' 18 Z x AAI $ 9,000 /yr = $. I_620 /yr
' Total Fixed Cost per Year (D + IIT) = $.. 3a120 /yr
TOTAL FIXED COST PER SCHEDULEDHOUR = $ l 2.08 /S. I
Ill. Operating Cost
Maintenance & Repair: .. 25 Z x (D) $ 1500 /yr = $ 0.04 /miI0,000 mi/yr
Fuel: - gal/mi x $ - /gal = $ - /mi
Oil & Lubrication: - g of fuel cosr_ I/ $ - /mi,
Tires: ( 11 x mi/yr _ i)(I.152/ x # tires X c°st/tire) 3/ = $ 0.02 /mitire life 11 x mi/yr
TOTAL OPERATING COST PER MILE = $[ 0.06 /mi I
IV. Labor Cost
_' 'Hourly Wage = $ 0 /SSFringe Benefits (50Z of hourly wage) = $' 0 /SH
+ TOTAL LABOR COST PER SCHEDULEDHOUR ffi $i 0 /SH[
I/ 5Og for diesel engines, 25Z for gasolille engines.2/ 15 percent labor charge to repair or replace tires.
•_/ Tire life = 40,000 mi, 8 tires @ $175/tire.
II
MACHINE RATE CALCULATIONS Month" October
" (on-road equipment) Year: 1983
I. Description
Type Heavy Duty Pick-up Truck , . Model .... 
MACHINE RATE CALCULATIONS Mouth" October
(on-road equipment) Year: 1983
I. Description
Type International Truck-Tractor Model Transtar II
Accessories .... Engine ..
INITIAL INVESTMENT (F.O.B. Delivered Cost) I = $ .... 55_000Estimated Life (n) I0 years
Residual Value (R) 20 % of I R = $ II_000Working Days per Year . 200 daysScheduled Hours (SH) per Year 1_500 hours•Operat ing Miles per Year I0_000 mi lea
Av.erage Annual Investment AAI = (I-R)(n+l) + R = $ 35_ 200 /yr2n
If. Fixed Cost
Depreciation D = I- R = $ 4,400 /yr• n
Interest 12 %
Insurance 3 %,
Taxes 3 %• ,,,
liT = .... 18 % x AAI $ 35_200 /yr = $ 6,336 /yr
Total Fixed Cost per Year (D + liT) = $ I0t736 /yr
TOTAL FIXED COST PER SCHEDULED HOUR = $ [ 7.16 /SH I
Ill. Operating Cost
Maintenance & Repair: 60 % x (D) $ 4_400 /yr• I0,000 mi/yr = $ 0.26 /mi
Fuel" 0.22 gal/mi x $ 1.35 /gal = $. 0.30 /mi
Oil & Lubrication: 50 % of fuel costII/ $ 0.15 /mi
Tires: ( n x mi/yr _ 1)(1.152/ x # tires x cost/tire)3/ = $ 0.04 /mi• ' tire life n x mi/yr
TOTAL OPERATING COST PER MILE = $_ 0.75 /rail
IV. Labor Cost, ,,
Hourly Wage = $ 0 /SH
Fringe Benefits (50% of hourly wage) = $ 0 /SH=,
TOTAL LABOR COST PER SCHEDULED SOUR = $1 0 /SH I
I/ 50% for diesel engines, 25% for gasoline engines.• m.-
2/ 15 percent labor charge to repair or replace tires._3/ Tire life = 40,000 miles, 10 tires @ $200/tire (I0.00- 20, 12 PR tubeless).
"_"U.S. GOVERNMENT PRINTING OFFICE: 1985--565-525110109
13

Thompson, Michael A." Evaluation of a mechanized tree-planting operation. Res. Pap. NC-258.
St. Paul, MN: U.S. Department of Agriculture, Forest Service, NorthCentral Forest Experiment Station; 1984. 13 p.
A continuous-furrow, bareroot-stock, mechanical planter was used toplant red pine tree seedlings on five sites in northern Michigan. Severalindicators of planting efficiency were analyzed including utilization ofthe available land area, productivity as related to site conditions and
• planting pattern, cost, and effectiveness of the V-blade.
KEY WORDS. Red pine, productivity, cost, reforestation, time study,. system analysis.
i,
1944 1984