Embed Size (px)
Citation preview
Vol. 11(1), pp. 37-56, January-June, 2020
DOI: 10.5897/JPGE2019.0309
Article Number: 01FE60463621
ISSN 2141-2677
Copyright © 2020
Author(s) retain the copyright of this article
http://www.academicjournals.org/JPGE
Journal of Petroleum and Gas
Engineering
Full Length Research Paper
Evaluation of a novel ionic demulsifier in the treatment of selected Niger Delta crude oil emulsions
E. B. Mepaiyeda1,2*, A. A. Ofoegbu1, S. O. Isehunwa2 and A. A. Akinola1
1Department of Chemical, Petroleum and Gas Engineering, University of Lagos, Lagos, Nigeria.
2Department of Petroleum Engineering, University of Ibadan, Oyo State, Nigeria.
Received 12 March, 2019; Accepted 28 February, 2020
Emulsion treatment is one of the major challenges in crude oil production, transportation and processing. It has great impact crude oil quality, refining costs and environment. The use of chemical demulsifiers is a widely accepted procedure in the industry. However, demulsifiers used in treatment of crude oil emulsions in Nigeria industries are imported. This study was designed to evaluate the effectiveness of a new ionic demulsifier used in the treatment of crude oil samples obtained from the Niger Delta. Six emulsion samples were formulated at 1000 and 3000 rpm and at 0, 71.4 and 143 g/L salinities. The temperature, interaction time and chemical concentrations were varied in their demulsification treatment. The new demulsifier was used to treat the emulsions under various conditions and its performance compared with that of a commercial demulsifier. Locally formulated demulsifier yielded 0.92, 0.22, 1.45, 0.73, 0.52, 0.9, 0.78 and 1.13 ml water separation for heavy crudes at eight varying treatment conditions. The commercial demulsifeier gave 0.47, 0.30, 0.93, 0.30, 0.33, 0.83, 0.25 and 0.6 ml water separation at the same treatment conditions. The mean yield of the new demulsifier at the temperature-additive treatment combination for saline and heavier crudes A2, A4 and A6 gave 1.5, 1.18 and 1.2 against commercial demulsifier which gave 1.4, 0.75 and 0.4. It was concluded that the use of only one variable like chemical concentration, is not enough in assessing the overall effectiveness of a demulsifier for the treatment of crude oil emulsion systems. Key words: Crude oil emulsions, chemical demulsifiers, Niger Delta, ionic compounds.
INTRODUCTION
The process of crude oil production is often accompanied inevitably with produced water containing chlorides, sulfates, nitrates and other inorganic compounds (Dimitrov et al., 2012; Abdurahman et al., 2012; Emuchay et al., 2013). The water is produced either in form of free water or emulsion which increases in percentage towards the end of the life of the well (Emuchay et al., 2013). The amount of water that emulsifies crude oil in most production systems varies with production process and crude oil type; hence there could be water-in-oil or oil-in-
water emulsion (Vernon and Kenneth 1987, Kokal and Wingrove 2000, Kokal 2005, Ashrafizadeh and Kamran 2010, Abdurahman and Rosli 2006, Abdurahman et al., 2012, Murtada et al., 2019). Other types as described by several authors include multiple or complex emulsions. Based on kinetic stability, emulsions are also classified as loose, medium tight emulsions separating free water within few minutes, tens of minutes, hours and days respectively (Auflem, 2002, Tambe and Sharma, 1993).
According to Schubert and Armbruster (1992), the three
*Corresponding author. E-mail: [email protected]. Author(s) agree that this article remain permanently open access under the terms of the Creative Commons Attribution
License 4.0 International License

38 J. Petroleum Gas Eng. main criteria necessary for crude oil emulsions formation are presence of immiscible liquids, presence of an emulsifying agent and sufficient agitation to disperse one liquid as droplets in another (Ahmed et al., 1999). The agitation is achieved during the flow of crude oil from the well to the surface lines, bottom hole pump, surface transfer pump, pressure drop through chokes, valves and other surface equipment (Vernon and Kenneth, 1987; Becker, 2005). Produced water have been identified to be affected by type and location of wells, type of reservoir, perforation and completion type and other procedures such as coning, channeling, cresting and fractures (Murtada et al., 2019).
Demulsification is the process of breaking emulsions by weakening the viscoelastic films techniques surrounding the dispersed water droplets, thus enhancing coalescence. The emulsifier at the interface is replaced with the demulsifier destroying the stable film surrounding the water droplets. The removal of impurities, salt and water is important in demulsification processes. Demulsifiers are surface active compounds which upon addition to emulsion, migrate to the oil-water interface and breaks the rigid film thus resulting in coalescence of water droplets (Alwadani, 2000). The chemical additives migrate to the oil-water interface to destabilize the emulsifying agents. They are generally classified into polymeric, anionic, amphoterics, nonionic, cationic, bio surfactant and surfactant mixtures (Zainab, 2015, Murtada et al 2019, Adewumi, 2019). The fraction and concentration of surfactants such as asphaltenes and resins have been observed to undergo interplay of diffusion at the oil water interface thus contributing immensely to the mechanism of interfacial adsorption, emulsion formation, and stability (Zainab, 2015). Asphaltenic substances however make the interfacial films stronger than resinous substances thereby contributing to wettability alteration which yields a more stable emulsion. The hydrophilic functional groups consisting of both asphaltene and resin, their concentration and ratio in different crudes are also other important factors responsible for emulsion stability (Murtada et al., 2019, Manar, 2012). Other works have also shown the use of biodegradable emulsifiers such as cocamide in the stabilization of both w/o and o/w emulsions (Rasha et al., 2014). The impact of the production and processing of crude oil emulsion on the environment cannot be over emphasized. The extraction of poisonous produced water impact the marine environment as a result of high molecular weight components such as benzene, toluene, ethylbenzene, and xylene (BTEX) which it contains. Emulsions also increase salinity, volume, viscosity and density of crude oil produced, thus resulting in increased cost of transportation, pumping of crude oil and pipeline corrosion (Sjoblom et al., 1990). Since the process of emulsification is quite inevitable in the production and field processing of crude oil, it is thus essential to carry
out demulsification at minimum cost.
Methods of demulsification are generally classified into three categories. These are physical, chemical and biological treatments (Saad et al., 2019). Physical demulsification includes gravitational settling, centrifugation, pH adjustment; thermal treatment which includes conventional heating, microwave irradiation, freeze/thaw, hydroclone, flotation, filtration by adsorption and coalescing filters; electrical demulsification by electro-coalescence; membrane separation, ion-exchange and biological demulsification by reverse-osmosis; ultrasonic by inertial, centrifuge and ortho-kinetic by shear flow (Arthur et al., 2005; Zhang et al., 2012; Saad et al., 2019). Physical treatments of emulsions have often been employed in conjunction with other separation methods to establish hybrid systems to improve the destabilization of emulsions up to satisfactory levels (Zhang et al., 2012). The biological treatment involves the use of bio-demulsifier as a form of biosurfactant with a characteristic feature to bio-remediate contaminated soils and destabilizes crude oil emulsion. Biodemulsifier have however been noted to be environmentally friendly, higher biodegradability and its usage does not result in secondary pollution (Makkar et al., 2011). Many works have been done in use of extracellular products, spores and cells of microorganisms which have been found to provide a strong hydrophobic property varying with different culture medium. Micro-organisms such as Pseudomonas aeruginosa, Bacillus subtilis, Rhodococcus erythropolis, Achromobacter sp. and Strenotrophomonas sp. have been isolated and cultured from bacterium and fungal spores from marine sediments polluted with petroleum hydrocarbons (Chen et al., 2007; Peng et al., 2007; Abdel-Mawgoud et al., 2008; Abdel-Mawgoud et al., 2009; Vallejo et al., 2017; Hoda and Hossein, 2018). Further works show that aromatic and aliphatic hydrocarbon compounds are used as the sole carbon sources for the production of biodemulsifiers. Chunyan et al. (2017) used Achromobacter sp with phenanthrene (PHE) naphthrene, fluoranthene, salicylic acid, catechol, benzene, pyrene, xylene and toluene as varying sole carbon sources in demulsifier formulation. They performed the optimal cultivation conditions using response surface methodology based on a Box–Behnken design to enhance demulsification efficiency. With the design, formulated demulsifier from phenanthrene (PHE) sole carbon source yielded 95.6% demulsification efficiency for water-in-oil model emulsions within 24 h and 92.3% degradation efficiency within five days, while carbon sources toluene, xylene and pyrene yielded almost no demulsification for the W/O model emulsion. They stated that the inability of Achromobacter sp LH-1 to use toluene, xylene or pyrene as the sole carbon source for growth may be responsible for their demulsifier ineffectiveness. Biodemulsifiers have been found to be a highly sought after group of chemicals due to their wide range potential applications, low toxicity and

environmental friendly nature. The complexity of their components, limited understanding of their interactions with cells with the abiotic environment and high cost of production limits their study (Bognolo, 1999; Chunyan et al., 2017). However, treatment method by addition of chemicals known as demulsifiers to crude oil emulsion is one of the commonest methods used in destabilization procedures in the oil industry.
The use of demulsifiers is one of the commonest crude oil destabilization procedures in the industry. However, literature shows no one demulsifier fits all and there are growing concerns in the oil and gas industry on the need to develop effective and efficient demulsifiers (Abdulkadir, 2006, Abdulrahman et al., 2012, Falode and Aduroja, 2015, Ali et al., 2016). Emuchay, (2013) formulated five different blends of demulsifiers from locally sourced materials using starch, camphor, calcium hydroxide, limonene, liquid soap and paraffin wax. The demulsifying effect of these demulsifiers on a Niger Delta crude oil emulsion sample at 40°C shows that they were all effective within the shortest possible separation time with a clean top oil of almost 100% and less than 1% sediment. The emulsions were resolved within 30 to 120 min. Falode and Aduroja (2015) worked on eight demulsifiers formulated from plants locally sourced from Nigeria. The full factorial design was used in order to minimize the number of experimental conditions investigated for the concentration of plant extract used. It was observed from their work that the optimized values gave a better yield. Biniaz et al., (2016) further used statistical and modeling optimization in demulsification of water in oil emulsion using three ionic liquids, namely Trioctylmethylammonium chloride,
Trioctylmethylammonium bromide and 1-Hexadecyltrimethylammonium bromide using bottle test method.
Sattar and Mohamad (2017) observed that demulsifier compounds replace the native surfactant at the water/oil interface by changing the rheological behavior of the existing film until the films are weakened leading to water drainage and coalescence after sufficient resident time. The effectiveness of this method was measured by the bottle test method. The chemical demulsifier acts on the emulsion to flocculate the oil droplets, coalesce the water droplets thus improving both the goodness of separated water, time, speed and efficiency at which separation occurs.
Murtada et al. (2019) used fractional factorial design to investigate the effectiveness and influence of factors such as demulsifier dosage, toluene concentration, settling time, pressure and temperature on water-in-oil emulsion using a novel non-ionic glycerol demulsifier. Their work showed that surfactant dosage and settling time were the most significant parameters affecting dehydration based non-ionic demulsifier. Bhardwaj and Hartland (1993) however reported that nonionic surfactants have a good effect on the demulsification of
Mepaiyeda et al. 39 crude oil because they do not leave any counter ion in the products.
An effective demulsifier (surfactant) can therefore enhance the coalescence of water droplets or oil droplets, depending on the type of demulsifier. This will also lead to improvement in process equipment design and demulsification operating conditions which include temperature, demulsifier dosage, settling time and rate of agitation. Most of these chemicals are however environmentally unfriendly when compared with green-based demulsifiers. An effective demulsfier will enhance the release of safe and clean separated water into the environment thus reducing potential poisoning concerns of the marine environment especially.
In this study, a non-toxic demulsifier was formulated from locally-sourced materials. The active ingredient of the demulsifier was sourced from a plant in Nigeria. MATERIALS AND METHODS
Demulsifier formulation
The demulsifier comprised an active ingredient extracted from a freshly cut locally available plant. The extract and coconut oil were the liphophillic components of the demusifier while starch was used as the hydrophilic component. Liquid soap served as the binder for the two ends. Cold mixing was employed in formulation of the demulsifer at 29°C room temperature. The mixture was stored in bottles at room temperature (30±2°C). Properties such as conductivity, pH and odour were measured and recorded.
Sampling and material
Six emulsion samples were formulated from crude oil sample collected from Prime field (Well 1) in the Niger Delta. Emulsification was carried out with known quantities of water at different salinities. Mixing was carried out using the high speed homogenizer at 1000 and 3000 rpm as shown in Table 1. Advanced Bench Jenway pH meter (Model 3510, United Kingdom), Bayite temperature controller heater (Model BTC 201, India), AWS (ZEO-5) Electronic weighing balance, USA and conductivity meter was used to determine properties of the pure crude oil and the emulsions. Control experiments were initially carried out without demulsifiers to examine the effect temperatures and settling time. Each of the process variables were then investigated at two levels based on the Emulsion Separation Index (ESI) initial experiments carried out at 30 and 90°C, varying additive concentration and residence time (0 to 4 h). A 2
3 full factorial separation experiment was designed to
investigate the variables using the Minitab software. The 800D Centrifuge Search-tech Instruments was used to separate the water and crude at 2000 rpm for 5 min. Results were analysed using the Minitab software tools.
Table 2 shows the eight set of experiments carried out on the emulsified samples A1-A6 to generate an empirical functional relationship between the true mean response and the set of process variables. Each of the experiments was performed independently using the bottle test method to minimize experimental errors. 5 ml of each emulsion sample was measured into centrifuge tubes, heated to specified treatment temperature for 5 min after which the demulsifier was dosed in drops specified at different treatment conditions. Each demulsifier was dosed. Each dosage was estimated to be 0.017 ml using the 1 ml pipette. Each sample was then centrifuged at 2000 rpm for 5 min to assist in

40 J. Petroleum Gas Eng.
Table 1. Formulation of the emulsion samples.
Sample Pure Crude (ml) Distilled water (ml) Salinity (g/L) Mixing speed (rpm)
A1 100 40 0.0 1000
A2 100 40 0.0 3000
A3 100 40 71.4 1000
A4 100 40 71.4 3000
A5 100 40 143.0 1000
A6 100 40 143.0 3000
Table 2. Demulsification design.
S/N Run Order Temperature (°C) Additive (ml) Time (h)
1 1 90 0.034 0
2 2 30 0.034 0
3 3 90 0.102 4
4 4 30 0.102 4
5 5 30 0.034 4
6 6 90 0.034 4
7 7 30 0.102 0
8 8 90 0.102 0
resolving the emulsion after which the specified settling time was observed before taking readings. Both the locally formulated and commercial demulsifiers were used in treating the emulsions. The process flow diagram is as shown in Figure 1.
RESULTS AND DISCUSSION
Characterization of samples Table 3 shows the properties of the pure and emulsified crude oil samples used. The pure crude sample is a light crude oil. The properties of the emulsified samples A1-A6 formulated from varying salinities were also highlighted. Figures 2 to 4 show the rheological properties of the emulsified crudes measured at room temperature 30±2°C. Emulsion samples A1-A6 decrease in API gravity with increase in salinity. This is in accordance to the work of Ashrafizadeh and Kamran, 2010. Samples A4 and A6 formulated at 3000 rpm formed heavy crudes 22.8 and 19.19 °API while emulsion Samples A1, A3 and A6 formulated at 1000 rpm formed lighter crudes 29.66, 28.39 and 24.51 °API. Higher mixing speeds and salinities thus produced heavy and stable emulsion. Figure 2 shows the effect of salinity on the formulated emulsions as observed from the changes in pH. The pure crude sample pH increased to 7.58 and 7.14 for fresh water emulsion samples A1 and A2 respectively while samples A3-A6 decreased in pH. Fresh water thus increases the pH of the emulsified crudes, while increase in salinity reduces it, therefore forming emulsion in the
acidic medium. Further observation also show that at constant mixing speed and increased salinity, light emulsion samples A1, A3 and A5 decreased in pH from 7.58 to 6.44 while samples A2, A4 and A6 reduced in pH from 7.14 to 6.23. This trend clearly shows a decrease in pH of crude oil emulsion with increased salinity at constant mixing speed. However, at constant salinity, pH decreases with increase in mixing speed. Viscosity decreased with API gravity for all the emulsion samples.
Table 4 shows the properties of both the locally formulated and commercial demulsifiers used. The locally formulated demulsifier was observed to have a high conductivity of 2440 µS/cm with slightly acidic pH of 4.43 while the commercial gave pH 11 with zero conductivity. The high conductivity is expected to give the locally formulated demulsifier a better electric penetration during the emulsion treatment, thus breaking all emulsion stability components present in the crude. Examples of components causing emulsion stability are the paraffins which have been found to possess no electrical conductivity, yet prevents breaking membranes of water drops (Ali et al., 2016). The odour of the commercial demulsifier was also found to be pungent and irritant while the locally formulated demulsifier was non-irritant. The Emulsion Separation Index (ESI) of these demulsifiers have been carried out on different crudes using the bottle test method in a previous work. On comparison of the locally formulated with commercial demulsifier, it was discovered that though the local demulsifier have a slightly lower separation by a difference of 4 and 3% respectively at lower dosages,

Mepaiyeda et al. 41
Figure 1. Flowchart diagram for the emulsification, demulsifier formulation and demulsifcation process.
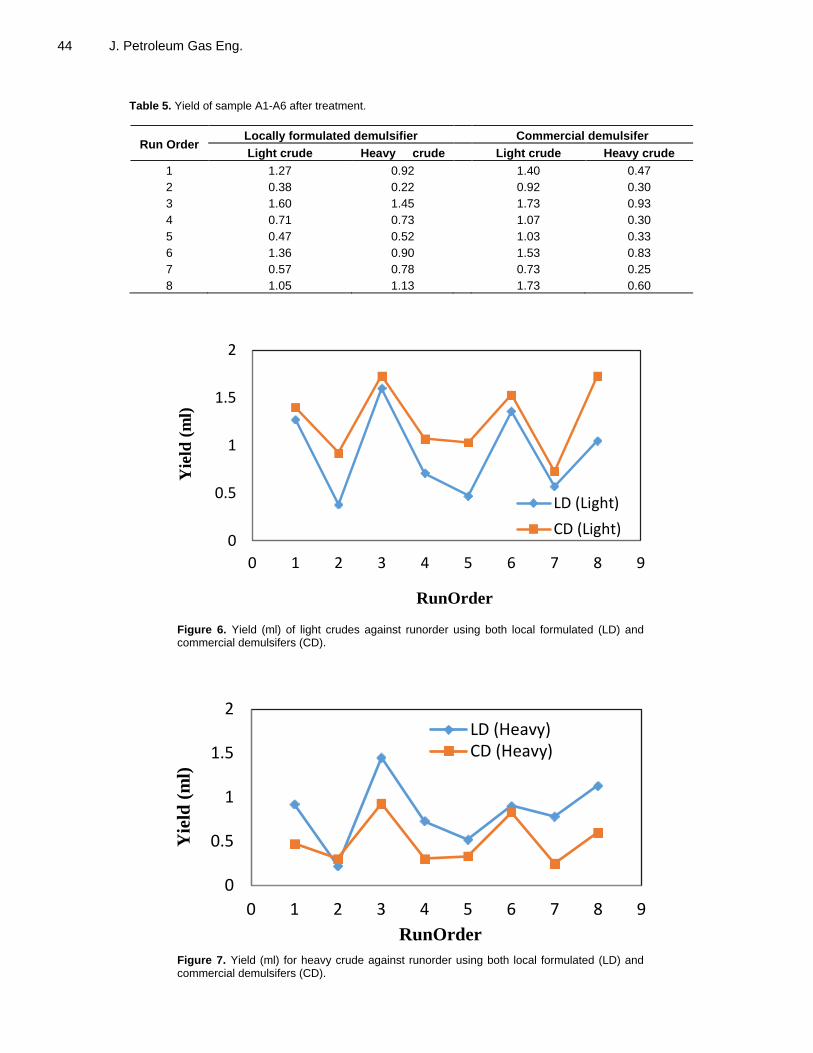
the local demulsifer performed better at higher dosages yielding about 86% separation index. The bottle test method is the most commonly used method in the screening and choice of effective additives. The contribution of other process conditions and their interactions in demulsification processes are however not properly accounted for in the screening of effective additives. Subsequently, we will be investigating which of the process variables considered in the demulsification process significantly contribute to the quantity of water separated. Demulsifier efficiency Figure 5 shows the yield of the varying formulations of the crude oil emulsion sample in the absence of both the local and commercial demulsifier. Samples A1 and A2 separated 1.75 and 1.6 ml while sample A5 separated 0.4 to 1.7 ml at the varying temperature and separation time conditions. It is observed that samples A3, A4 and A6 however remain unresolved, thus justifying the need for carrying out further treatment using demulsifiers. Table 5 shows the comparism of quantity of water separated at eight different levels of demulsification conditions using both locally formulated and commercial demulsifiers. Figures 6 and 7 show highest water separation
of 1.45 and 0.93 ml from heavy crudes at run 3 using the locally formulated and commercial demulsifier respectively. Further observation show that a higher water separation was observed at all runorder levels except for run 2. However, the highest water separation of 1.73 ml was observed at multiple runs 3 and 8 while from light crudes using commercial demulsifier the locally formulated demulsifer separated 1.60 ml was also at run 3. A close observation shows commercial demulsifier gave a higher yield at all the treatment levels.
This clearly shows that locally formulated demulsifier is far more efficient for breaking saline and viscous emulsions A2, A4 and A6 based on the oil and saline water conductivity differences. In addition, the locally formulated demulsifier possess a high conductivity characteristic, thus possessing ions of higher mobility at higher temperature with capability of migrating to the crude oil water interface of heavy emulsions to destroy steric barriers which prevents water droplets coalescing. The foreign demulsifier, however possess zero conductivity. Ionic demulsifiers are also effective for viscous crudes at lower temperatures when compared with the commercial demulsifier.
Factors contributing to water separation
Three process variables were investigated in this work to

42 J. Petroleum Gas Eng.
Table 3. Properties of pure crude and emulsion samples.
Sample pH API (°) Viscosity(cp) @ 30°C
Pure sample 6.99 33.30 5.20
Sample A1 7.58 29.66 7.06
Sample A2 7.14 28.93 8.27
Sample A3 6.87 28.39 9.33
Sample A4 6.72 22.81 40.02
Sample A5 6.44 24.51 24.54
Sample A6 6.23 19.19 201.4
Figure 2. Variation of pH of crude oil emulsion A1-A6 with salinity at varying mixing.
Figure 3. Variation of 0API of crude oil emulsion A1-A6 with salinity at varying mixing speed.
5
6
7
8
0 50 100 150
pH
Salinity (g/L)
1000RPM3000RPM
15
20
25
30
35
0 50 100 150
AP
I
Salinity (g/L)
1000RPM3000RPM

Mepaiyeda et al. 43
Figure 4. Variation of °API of crude oil emulsion A1-A6 with Viscosity (cp) at 30°C and varying mixing speed.
Table 4. Properties of demulsifiers.
Demulsifier pH Conductivity
(µS/cm) at 29.3°C Odour
ESI at 0.0166 ml (%)
ESI at 0.033 ml (%)
ESI at 0.050 ml (%)
ESI at 0.070 ml (%)
Locally formulated 4.73 2440 (ionic) Non Irritant 56 64% 86% 86%
Commercial 11.01 0 (non-ionic) Pungent and irritant 60% 67% 75% 80%
Figure 5. Control values of yield obtained for demulsification of samples A1-A6.
identify which of the variables or their combination is significant using least squares regression. All significant
factors were determined at 0.05𝛼 level. The Pareto charts of the effects allow to visually identify the important main and interaction effects to compare the relative magnitude of their standardized effects. It is quite interesting to observe that different variables and their interactions significantly contribute to yield using both demulsifiers. Figures 8 to 10 are samples of the Pareto chart of the standardised effect of temperature, additive, time
variable, their interactions and contribution to yield. Temperature was a significant factor common to samples A1-A6 for both local and commercial demulsifiers. Its contribution to yield was observed in samples A1 and A5 while time, additive, temperature-additive and temperature-time interaction significantly contribute to yield in sample A2, A4 and A6 using the local demulsifier. Conversely, the use of commercial demulsifier shows that none of the process variables significantly contributed to yield for samples A3, A4 and A6. Temperature and
15
20
25
30
0 50 100 150 200
AP
I
Viscosity (cp)
1000RPM3000RPM
0
0.5
1
1.5
2
0 1 2 3 4 5 6
Yie
ld (
ml)
Sample A1-A6
30 deg, 0hr
30 deg, 4hr
90 deg, 0hr
90 deg, 4hr
30°, 0 h
30°, 4 h
90°, 0 h
90°, 4 h
44 J. Petroleum Gas Eng.
Table 5. Yield of sample A1-A6 after treatment.
Run Order Locally formulated demulsifier Commercial demulsifer
Light crude Heavy crude Light crude Heavy crude
1 1.27 0.92 1.40 0.47
2 0.38 0.22 0.92 0.30
3 1.60 1.45 1.73 0.93
4 0.71 0.73 1.07 0.30
5 0.47 0.52 1.03 0.33
6 1.36 0.90 1.53 0.83
7 0.57 0.78 0.73 0.25
8 1.05 1.13 1.73 0.60
Figure 6. Yield (ml) of light crudes against runorder using both local formulated (LD) and commercial demulsifers (CD).
Figure 7. Yield (ml) for heavy crude against runorder using both local formulated (LD) and commercial demulsifers (CD).
0
0.5
1
1.5
2
0 1 2 3 4 5 6 7 8 9
Yie
ld (
ml)
RunOrder
LD (Light)
CD (Light)
0
0.5
1
1.5
2
0 1 2 3 4 5 6 7 8 9
Yie
ld (
ml)
RunOrder
LD (Heavy)CD (Heavy)

Mepaiyeda et al. 45
Figure 8. Interaction plot for yield using local demulsifier for sample A4.
Figure 9. Pareto chart for standardised effect using local demulsifier for sample A6.
Figure 10. Pareto chart for standardised effect using commercial demulsifier for sample A3.

46 J. Petroleum Gas Eng. additive significantly contributed to yield in sample A5. However, Figure 8 showed that none of the factors stated above were significantly contributory to yield for either demulsifiers in sample A3. This shows that it is possible that the tacit assumption that all important factors responsible for crude oil demulsification may not have been fully included in this experiment. It also proves the extent to which variability can occur in the treatment processes of crude oil emulsion produced from the same well under varying emulsion formation conditions. This is in agreement with an early work done in the century by Van Der Minne (1933) who stated that crude oil produced from same or varying wells yield different emulsions so far as water content and the state of dispersion of water are concerned. The subsequent sections examine the significant effect of these variables and their interaction to give yield which determines demulsifier effectiveness.
Standardized effect of temperature on separation
Temperature was identified as a recurrent significant factor common to samples A1, A2, A4, A5 and A6 using both demulsifiers. The Pareto plots show the main and interaction factors and their standardised effects. From Figures 8 to 10, samples A1, A2, A4, A5, A6 showed temperature to have a measurable effect on yield such that when it changes from 30 to 90°C, yield increases with certain measurable effects. The standardised effects of 24, 17, 110, 63 and 145 were observed for samples A1, A2, A4, A5, A6 respectively. Figures 8 and 9 above showed the standardised effect of temperature on yield for samples A4 and A6. This effect was observed to increase from 17 to 145 as salinity increased for viscous crudes samples A2, A4 and A6. However, the use of commercial demulsifier showed samples A1, A2, A5 have effect of 17, 19, 14 for temperature whereas it was insignificant for samples A3, A4, and A6. Thus, standardized effect of temperature using the commercial demulsifier was observed to be relatively lower when compared to the effects of the locally formulated demulsifiers. Temperature is therefore observed to be an important factor to be considered when using the locally formulated demulsifier. It also shows the effectiveness of temperature as a process variable in the treatment of crude oil emulsions. The large difference between the standardized effects of temperature using the both demulsifiers implies temperature effectiveness depends on the nature of crude oil treated and additive type. The demulsifier performance by reduction of emulsion viscosity and increase in diffusivity facilitating coalescence of water droplets from emulsions are also results of effects of temperature on the crude emulsion type.
Effect of additive (demulsifier) on separation
Figures 8 and 9 further show statistically significant
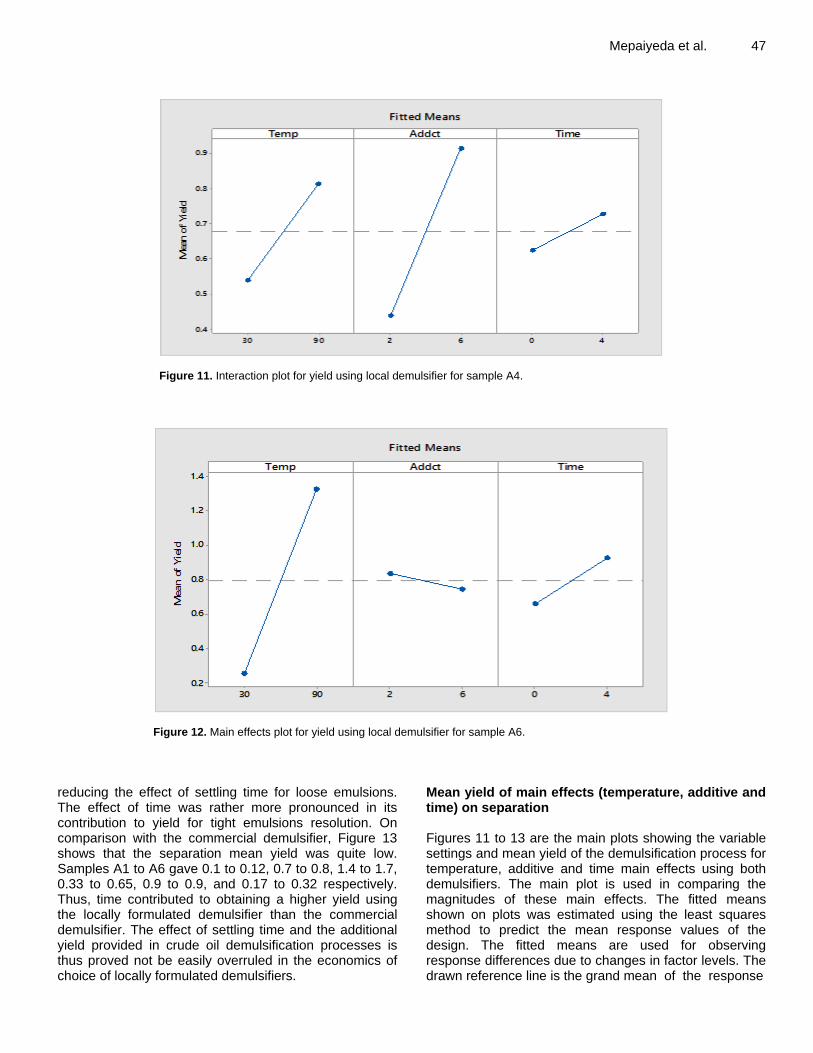
variable additive which contributed to yield in samples A4 and A6 when the locally formulated demulsifier was used. The magnitudes of the standardized effect were 190 and 12.7 respectively. Again, the demulsifier type contributed tremendously to the yield of saline, viscous and heavy emulsion samples A4 and A6. Sample A4 containing 71.4 g/L salinity is observed to be more stable crude than sample A6 containing 143 g/L salinity. In comparison with the commercial demulsifier, only sample A5 was observed to show additive significantly contributing to yield with magnitude effect of 14. The reason for this typical behaviour is not yet fully understood but we speculate an inconclusive behaviour of sample A5. This will be given more attention in further research. Moreover, the mean yield of each emulsion further substantiates the demulsifier effectiveness and its choice in treatment of crude oil emulsions. Figures 11 and 12 show the variable setting and mean values of both demulsifiers for samples A4 and A6. The mean yield of the locally formulated to commercial demulsifier at 2 drops for samples A1, A2, A4, A5, A6 was 1.0 to 0.09, 0.8 to 0.75, 0.42 to 0.53, 1.10 to 0.80 and 0.80 to 0.20 ml respectively. This clearly shows mean yield of the locally formulated demulsifier to be relatively higher than that of the commercial demulsifier especially for heavier and viscous crudes A2, A4 and A6. At the high setting of the additive (6 drops) however, the ratio of the mean yield was 1.25 to 0.13, 1.10 to 0.80, 0.95 to 0.45, 1.20 to 0.900 and 0.70 to 0.30 ml respectively. Again, it is observed that the locally formulated demulsifier gave a higher mean yield than the commercial demulsifier especially at higher treatment volume. This, once again justifies the choice of the locally formulated over the commercial demulsifier. Effect of time on separation
Further observation of Figures 8 and 9 showed time as a statistically significant process variable for the demulsification of samples A4 and A6 respectively. The measured standardized effect was 45 and 38 respectively. This shows a higher contributory effect of time to the mean yield separation of sample A4 than A6. Thus, stable crude requires more time for demulsifier contact, coalescence and settling to occur. The lower effect of time on sample A6 shows that higher salinity crudes have larger water droplets with greater downward velocity resulting in reduced effect of time on their mean yield. However, the mean yield of separation Time as shown in Figures 10 to 12 was observed the mean yield to be relatively equal for locally formulated demulsifier at low to high settings ratio of 1.0 to 1.1, 0.6 to 0.7 and 1.2 to 1.2 for samples A1, A3, A5 respectively while that of samples A2, A4 and A6 gave low to high setting ratio of 0.6 to 1.2, 0.6 to 0.75, 0.6 to 0.9. This clearly indicates the effectiveness of the locally formulated demulsifier to maximum separation yield at the initial time nullifying or
Mepaiyeda et al. 47
Figure 11. Interaction plot for yield using local demulsifier for sample A4.
Figure 12. Main effects plot for yield using local demulsifier for sample A6.
reducing the effect of settling time for loose emulsions. The effect of time was rather more pronounced in its contribution to yield for tight emulsions resolution. On comparison with the commercial demulsifier, Figure 13 shows that the separation mean yield was quite low. Samples A1 to A6 gave 0.1 to 0.12, 0.7 to 0.8, 1.4 to 1.7, 0.33 to 0.65, 0.9 to 0.9, and 0.17 to 0.32 respectively. Thus, time contributed to obtaining a higher yield using the locally formulated demulsifier than the commercial demulsifier. The effect of settling time and the additional yield provided in crude oil demulsification processes is thus proved not be easily overruled in the economics of choice of locally formulated demulsifiers.
Mean yield of main effects (temperature, additive and time) on separation Figures 11 to 13 are the main plots showing the variable settings and mean yield of the demulsification process for temperature, additive and time main effects using both demulsifiers. The main plot is used in comparing the magnitudes of these main effects. The fitted means shown on plots was estimated using the least squares method to predict the mean response values of the design. The fitted means are used for observing response differences due to changes in factor levels. The drawn reference line is the grand mean of the response

48 J. Petroleum Gas Eng.
Figure 13. Main effects plot for yield using commercial demulsifier for sample A2.
data. As discussed, temperature have a large effect on the mean response yield of all the samples while additive and time contribute either significantly or insignificantly to yield. The main effects plot for yield estimates the mean response value at the settings of each process design parameter and their mean yield obtained for the demulsifiers used. Also, temperature has a large effect on the mean response yield of all the samples while additive and time contribute either significantly or insignificantly to yield. Figures 10 and 11 showed the variable settings and mean yield for samples A4 and A6 using locally formulated demulsifier. A high setting of 90°C, (6 drops) and 4 h gave the highest yield of 1.36, 1.26, 0.87 for samples A1-A4; a high setting of 90°C, low setting of (2 drops) and 0 h gave 1.19 mean yield in sample A5 while a high setting of 90°C, (2 drops) and 4 h gave a 1.05 response yield in sample A6. Again, attention is drawn to sample A4 containing 71.4g/L salinity which required a high setting of demulsifier for its emulsion breakage while sample A6 of 143g/L salinity required a low setting of additive (2 drops) both at high setting of temperature and time. Figures 11 and 12 shows a grand mean yield of 68 and 80% was obtained for both samples respectively. This clearly shows the overall contributory effect of all factors to separation of sample A6 was higher than sample A4. Sample A4 is a tight and stable emulsion formulated at higher mixing speed resulting in formation of smaller emulsion droplets, higher interfacial area and viscosity, thus more difficult to break than sample A6. For heavier crudes, interfacial tension and viscosity decreases with increase in salinity, and temperature resulting in growth of large water droplets
and phase separation. This is in accordance with the work of Isehunwa and Olanisebe (2012), and Taha and Al-Shiwaish (2009). On comparison, the highest response yield observed for samples A1-A6 using the commercial demulsifier required a high setting of 90°C, additive (6 drops) and time (4 h) to give a response yield of 1.12, 0.98, 1.26, 0.56, 1.26 and 0.42. The response yield was found to be equal at run order 8 at zeroth time for samples A1, A2, A3 and A5 as shown in Table 5. Generally, the locally formulated demulsifier was observed to achieve a higher yield for samples A1, A2, A4, A5 and A6 showing it is more effective than commercial demuulsifiers. This shows an higher dosage commercial additive is needed for demulsification of saline and viscous crude oil emulsions A4 and A6. For the local demulsifier however, the higher the crude oil emulsion salinity, the lower the demulsifier dosage and vice versa for commercial demulsifier. Temperature, additive and time interaction effects on water separation The interaction between temperature, additive and time process variables were also a major concern to yield maximisation and choice of demulsifier. This is because interaction between factors is sometimes the root cause of either the challenges or accomplishments encountered in processes, rather than the individual effect of each factor on the response. This stands as a major disadvantage of the common One-Variable-At-a-Time (OVAT) method. The interaction plots show how the

Mepaiyeda et al. 49
Figure 14. Interaction plot for mean yield using local demulsifier for sample A4.
Figure 15. Interaction plot for mean yield using local demulsifier for sample A6.
effect of one process variable on response differs at different levels of another process variable. Thus, the performance characteristics of the demulsifiers compared in this work is also based on interaction between all process variable considered. Figures 14 to 17 illustrates the two-way interaction plots between ‘temperature and time’, ‘temperature and additive’ and ‘time and additive’
for samples A1-A6 using both demulsifiers. Parallel plots show there exist no strong interaction between process variables while less parallel lines show there are more likely to be a significant interaction between the variables. Most of the interaction plots in this work are however less parallel. The figures show the temperature-time interaction for samples A1-A6 to give the highest mean

50 J. Petroleum Gas Eng.
Figure 16. Interaction plot for mean yield using commercial demulsifier for sample A2.
Figure 17. Interaction plot for mean yield using commercial demulsifier for sample A5.
yield of 1.87, 1.73, 0.98, 0.88, 1.6 and 1.4 at high temperature, and high time setting respectively. Sample A5 achieved a high mean yield of 1.68 at high temperature and low time setting. It was observed that samples A1, A3 and A5 formulated at lower mixing speed separated high water quantity. Attention is again drawn to sample A4 which gave the lowest mean yield while the
behaviour of A3 is not fully understood yet. The temperature-time interaction treatment using the commercial demulsifier gave a mean yield of 1.4, 1.4, 1.75, 0.75, 1.6 and 0.5 for sample A1-A6 at high temperature-high time setting. The highest mean yield of sample A1 was 1.45 achieved at low time-high temperature setting. The locally formulated demulsifier

Mepaiyeda et al. 51
Figure 18. Pareto chart for standardised effect using local demulsifier for sample A4.
achieved a higher mean yield than the commercial demulsifier for heavier emulsion samples A2, A4 and A6 at high temperature-high time interaction process conditions. This showed the effectiveness of temperature and time process variables in demulsification processes. Temperature reduces oil viscosity thereby increasing the droplets molecular movement which aids coalescence through increased collision frequency of the dispersed phase droplets with time. An overall high temperature-high time demulsification condition was effective for emulsion separation. This however is dependent on the nature and type of demulsifier used.
The temperature-additive interaction using the locally formulated demulsifier showed that samples A1-A6 at high temperature and high additive setting gave the high mean yield of 1.93, 1.5, 1.23, 1.18, 1.63 and 1.2. These were the highest mean yield obtained except for sample A6 which gave the highest mean yield of 1.45 at low additive and high temperature condition. In comparison with the commercial demulsifier samples, A1-A6 achieved 1.45, 1.4, 1.8, 0.75, 1.8 and 0.4. The highest mean yield of 0.7 was observed for sample A4 at low additive-low temperature settings. It is observed that the high temperature high additive setting gave a higher yield for samples A2, A4 and A6 using the locally formulated demulsifier. The yield was also observed to decrease with increase in formulation mixing speed and viscosity. Figures 18 and 19 show that demulsifiers have temperature-additive factor statistically significant for samples A4 and A6 using the locally formulated demulsifier. This substantiates the effectiveness of the locally formulated demulsifier in heavy crude oil emulsion treatment. Figures 20 and 21 however show the effects of temperature and temperature-time interaction have lower
standardised effects and yield using the commercial demulsifier.
The time-additive interaction for samples A1-A6 gave a mean yield of 1.38, 1.4, 0.895, 0.975, 1.2, and 0.9 at high additive and high time setting using the locally made demulsifier. Sample A5 shows there exist no strong interaction between process variables. In comparison, a mean yield of 1.45, 0.85, 1.7, 0.6, 1 and 0.4 was observed using the commercial demulsifier for samples A1-A6 at high additive, high time setting. Samples A4 gave a higher mean yield of 0.7 at high additive and low time setting. It is observed that the mean yield of the locally formulated demulsifier for the time-additive interaction process variable is higher than that of the commercial demulsifier for all crude oil emulsion samples except for sample A3. Water separation from Sample A2, A4 and A6 with the time-additive interaction was also higher using the locally formulated demulsifier.
The result of this work has shown the best settings for process variables and their interaction in maximizing yield for demulsification processes. The temperature-additive-time three-way interactions were not considered because they do not occur in reality. Comparing the mean yields of the two-way interactions of the commercial and locally formulated demulsifier in Figures 22 and 23 shows that the locally formulated demulsifier performed better for emulsion samples A2, A4 and A6, while the commercial demulsifiers performed for samples A1, A3 and A5. Figure 23 shows that the sudden drop in the mean yield of the commercial demulsifier at points 2, 4 and 6 for the time-additive treatment shows that the demulsifier is less effective for saline and heavier crudes when compared to the locally formulated demulsifer. The ions of the commercial demulsifer thus have a slow rate of diffusion

52 J. Petroleum Gas Eng.
Figure 19. Pareto chart for standardised effect using local demulsifier for sample A6.
Figure 20. Pareto chart for standardised effect using commercial demulsifier for sample A2.
to the oil/water interface at reduced temperatures. The rate of the ionic movement to the interface is thus a function of temperature, viscosity of the fluid and the size (mass) of the particles. Generally, the locally formulated demulsifier was effective for all the emulsion samples except for samples A3 and A5. The performance of both demulsifiers was highly effective at the temperature-additive followed by the temperature-time variable interaction treatment condition. The least performance
was measured at the time-additive interaction. The mean yield obtained from the two-way variable interaction treatment condition was all higher than that obtained for the one variable at a time treatment condition. Overall effect of salinity Figures 22 and 23 further show how mean yield varies

Mepaiyeda et al. 53
Figure 21. Pareto chart for standardised effect using commercial demulsifier for sample A4.
Figure 22. Mean yield of samples A1-A6 using locally formulated demulsifier at varying two-way treatment conditions.
with fresh water and saline emulsions. The commercial demulsifier separated an equal mean yield of 1.8 at the temperature-additive treatment interaction for sample A3 and A5 formulated at 1000 rpm suggesting the insensitivity of the demulsifier to salinity at lower mixing speed. This was closely followed by temperature-time and time-additive interaction whose mean yield decreased with increase in salinity. The mean yield of samples A4 and A6 formulated at 3000 rpm generally decreased with increase in salinity for all the interaction
considered. The effect of salinity on mean yield using the locally formulated demulsifier was quite different, as samples A3 and A5 increased with increase in salinity for all the two-way interaction considered with highest mean yield at obtained at the temperature-additive interaction. Samples A4 and A6 formulated at 3000 rpm increased in mean yield with increase in salinity for all interactions with highest yields also obtained at the temperature-additive and temperature-time interaction respectively. It is observed that sample A6 became unstable and readily
0.8
1
1.2
1.4
1.6
1.8
2
1 2 3 4 5 6
Mea
n Y
ield
Samples A1-A6
Temp-Time
Temp-Additive
Time-Additive

54 J. Petroleum Gas Eng.
Figure 23. Mean yield of samples A1-A6 using commercial demulsifier at varying two-way treatment conditions.
separable at higher salinity such that the temperature-time interaction gave the highest mean yield. According to Binks (1993), O/W droplets increase in size upon increasing salt concentration, while W/O droplets decrease in size. This is also in accordance with the work of Abdurahman and Rosli. (2006) and the diffuse ion theory, which establish that as salt concentration increases for the same water content, the internal energy of the system increases. Increased internal energy results in the emulsion system becoming thermodynamically unstable thereby promoting coalescence faster in highly saline crude oil emulsions. Thus, it can be concluded that the non-ionic commercial demulsifier used in this work is neither compatible nor effective for highly saline and stable crude oil emulsions as observed in Figures 22 and 23. Regression equations Table 6 shows the regression equations for the predicting models for yield of all the demulsified samples A1-A6 formed using temperature, volume of additive and time as the input variables. This summary shows the fitness of the regression equation to the regression line. It comprises the R-squared value and the adjusted R-squared value. The R-square adjusted obtained for all the models of this work as shown in Table 7 were all above 98%. The percentage errors ranging between 0.01 and 0.87 as given in Table 8.
Conclusion
A new ionic demulsifier was formulated using an active ingredient obtained from a local plant. The performance of the demulsifier was evaluated using crude oil samples obtained from the Niger Delta and emulsified at varying salinities and temperatures. The results were compared with those obtained using a commercial demulsifier. The new demulsifier gave higher separation and mean yields and hence more effective than the commercial demulsifier in the treatment of the selected high saline and stable crude oil emulsions. It was also observed that the interaction in process variables was significant; hence only one variable at a time should not be used in the choice of an effective demulsifier.
NOMENCLATURE
BSW, Basic sediment and water; OVAT, one variable at a time; Temp, temperature; Addct, additive; RPM, rotation per minute; W/O, water in oil emulsion; O/W, oil in water emulsion; LD, localy formulated demulsifier; CD, Commercial demulsifier; A1, A2, A3, A4, A5, A6, crude oil emulsion samples. CONFLICT OF INTERESTS The authors have not declared any conflict of interests.
0.4
0.6
0.8
1
1.2
1.4
1.6
1.8
2
1 2 3 4 5 6
Mean
Yie
ld
Samples A1-A6
Temp-TimeTemp-AdditiveTime-Additive

Mepaiyeda et al. 55 Table 6. Regression equations for crude oil emulsion samples A1-A6.
Sample Locally formulated demulsifier Commercial demulsifier
Sample A1 Yield = -0.615 + 0.02525 Temp + 0.0788 Additive + 0.0456 Time - 0.000479 Temp × Additive - 0.000562 Temp × Time + 0.00531 Additive t × Time
Yield Log = -0.1338 + 0.002993 Temp + 0.02816 Additive + 0.03455 Time - 0.000242 Temp × Additive - 0.000367 Temp × Time - 0.001319 Additive × Time
Sample A2 Yield = -0.362 + 0.01375 Temp + 0.0687 Additive + 0.1250 Time - 0.000208 Temp × Additive + 0.000417 Temp × Time - 0.00000 Additive t × Time
Yield = -0.563 + 0.01917 Temp + 0.0250 Additive + 0.0531 Time + 0.000104 Temp × Additive - 0.000104 Temp × Time - 0.00469 Additive × Time
Sample A3 Yield = 0.067 - 0.00008 Temp + 0.0237 Additive + 0.0275 Time + 0.001792 Temp × Additive + 0.000542 Temp×Time - 0.00812 Additive × Time
YieldA3 = 1.900 - 0.0050 Temp - 0.225 Additive + 0.100 Time + 0.00292 Temp × Additive - 0.00125 Temp × Time + 0.0125 Additive × Time
Sample A4 Yield = 0.43000 - 0.004250 Temp - 0.01375 Additive + 0.00312 Time + 0.002104 Temp × Additive + 0.000188 Temp × Time + 0.002812 Additive × Time
Yield = 1.2750 - 0.01500 Temp - 0.1250 Additive - 0.0688 Time + 0.001875 Temp × Additive + 0.002708 Temp × Time - 0.00312 Additive × Time
Sample A5 Yield = -0.0075 + 0.019083 Temp + 0.03625 Additive + 0.0387 Time - 0.000500 Temp × Additive - 0.000708 Temp × Time + 0.00188 Additive × Time
YieldA5 = -0.3725 + 0.016000 Temp - 0.0350 Additive + 0.0156 Time + 0.001729 Temp × Additive + 0.000146 Temp × Time - 0.00406 Additive × Time
Sample A6 Yield = - 0.7075 + 0.025000 Temp + 0.04500 Additive + 0.10438 Time -0.001312 Temp × Additive - 0.000979 Temp × Time + 0.005312 Additive × Time
YieldA6 = 0.075 + 0.00083 Temp + 0.0125 Additive - 0.0625 Time - 0.000000 Temp × Additive + 0.001250 Temp × Time + 0.00625 Additive × Time
Table 7. Table of standard deviation and R squared values of models.
Sample A
Standard deviation (S) R-square (%) R-square (adjusted)%
Local demulsifier
Commercial demulsifier
Local demulsifier
Commercial demulsifier
Local demulsifier
Commercial demulsifier
Sample A1 0.0813173 0.03535 99.82 99.34 98.76 95.36
Sample A2 0.0707107 0.08838 99.77 99.72 98.40 98.01
Sample A3 0.0848528 0.35355 99.31 83.55 95.17 0.00
Sample A4 0.0035355 0.03535 100.0 99.78 99.99 98.46
Sample A5 0.0212132 0.02474 99.95 99.99 99.82 99.90
Sample A6 0.0106066 0.07071 100.0 97.50 99.97 82.50
Table 8. Percentage error estimates.
RunOrder Locally formulated demulsifier Commercial demulsifer
Light crude Heavy crude Light crude Heavy crude
1 0.11 0.36 0.16 0.3
2 0.73 0.85 0.57 0.87
3 -0.12 -0.01 -0.04 0.08
4 0.5 0.49 0.36 0.65
5 0.67 0.64 0.49 0.75
6 0.05 0.37 0.11 0.21
7 0.6 0.46 0.44 0.81
8 0.27 0.21 -0.04 0.16

56 J. Petroleum Gas Eng. ACKNOWLEDGEMENT This work was supported by the Shell Petroleum Development Company through the Shell Chair, Nigeria through the Shell Chair Office at the University of Ibadan. REFERENCES Abdel-Mawgoud A, Aboulwafa M, Hassouna N (2008). Optimization of
Surfactin Production by Bacillus Subtilis Isolate BS5. Application of Biochemistry and Biotechnology 150:305-325.
Abdel-Mawgoud A, Aboulwafa M, Hassouna N (2009). Characterization of Rhamnolipid Produced by Pseudomonas Aeruginosa Isolate Bs20. Application of Biochemistry and Biotechnology 157:329-345.
Abdulkadir M (2006). Comparative Analysis of the Effect of Demulsifiers in the Treatment of Crude Oil Emulsion. Asian Research Publishing Network Journal of Engineering and Applied Sciences 5(6):67-73.
Abdurahman NH, Rosli YM (2006). Stability Investigation of Water-in-Crude Oil Emulsion. Journal of Applied Sciences 6(14):2895-2900.
Abdurahman NH, Rosli YM, Azhari NH, Hayder BA (2012). Pipeline transportation of viscous crudes as concentrated oil-in-water emulsions. Journal of Petroleum Science and Engineering 10(1016):139-144.
Ali AH, Timur CH, Khidir, Abbas M, Ismael (2016). Experimental Study to find alternative Demulsifier to Treat Emulsion Crude Oil. Kirkuk University Journal/Scientific Studies 11(1):234-244.
Alwadani MS (2000). Characterization and Rheology of Water-in-Oil Emulsion from Deep Water Fields. MSc. Thesis, Rice University, Houston, Texas. pp. 1-214.
Ashrafizadeh SN, Kamran M (2010). Emulsification of Heavy Crude Oil in Water for Pipeline Transportation. Journal of Petroleum and Science Engineering 71(3-4):205-211.
Auflem IH (2002). Influence of Asphalting Aggregation and Pressure on Crude Oil Emulsion Stability. Ph.D. Thesis, Norwegian University of Science and Technology pp. 1-51.
Becker JR (2005). Crude Oil Waxes, Emulsions, and Asphaltenes. Penn Well Publishing Company, Oklahoma. pp. 126 -129.
Bhardwaj A, Hartland S (1993). Studies on Buildup of Interfacial Film at the Crude Oil/Water Interface. Journal of Dispersion Science Technology 19(4):465-473.
Biniaz P, Farsi M, Rahimpour MR (2016). Demulsification of water in oil emulsion using ionic liquids: statistical modeling and optimization. Statistical modeling and optimization. Fuel 184:325-333.
Binks BP (1993). Surfactant Monolayers at the Oil-Water Interface. Journal of Applied Sciences 14:537-541.
Bognolo F (1999). Biosurfactants as Emulsifying Agents for Hydrocarbons. Colloids and Surfaces A: Physiochemical and Engineering Aspects 152:41-52.
Chen H L, Chen Y-S, Juang R-S (2007). Recovery of Surfactin from Fermentation Broths by a Hybrid Salting-Out and Membrane Filtration Process. Separation Purification Technology 59:244-252.
Chunyan L, Tingting J, Meng F, Ning H, Huiming C, Qiaoruo W, Dapeng L (2017). Biodemulsifiers Produced by Achromobacter sp. and their Features in Improving the Biodegradation of Phenanthrene. Royal Society of Chemistry Advances 7:4339-4347.
Dimitrov AN, Yordanov DJ, Petkov (2012). Study on the Effect of Demulsifier on Crude Oil and Petroleum Products. International Journal of Environmental Research 6(2):435-442.
Emuchay D, Onyekonwu MO, Ogolo NA, Ubani C. SPE (2013).
Breaking Emulsions Using Locally Formulated Demulsifiers. Society of Petroleum Engineers SPE 167528:1-10.
Falode OA, Aduroja OC (2015). Development of Local Demulsifier For water-In-Oil Emulsion Treatment. International Journal of Sciences Basic and Applied Research. ISSN 2307-4531: 301-320.
Hoda S, Hossein M (2018). Eco-friendly Demulsification of Water-in-Oil Emulsions by an Efficient Biodemulsifier Producing Bacterium Isolated from Oil Contaminated Environment. Biotechnology Letters 40:201.
Kokal S, Wingrove M (2000). Emulsion Separation Index: From Laboratory to Field Case Studies. Presented at the SPE Annual Technical Conference and Exhibition, Dallas, Texas, 1-4 October 2000. SPE-63165-MS.
Kokal SL (2005). Crude Oil Emulsions: A State-of-the-Art Review. SPE Production Facilities 20:5-13.
Makkar RS, Cameotra SC, Banat IB (2011). Advances in Utilization of Renewable Substrates for Biosurfactant Production, Springer, Open Access. AMB Express 1(1):5.
Manar EA (2012). Factors Affecting the Stability of Crude Oil Emulsions. Petroleum Application: Department Egyptian Research Institute.
Murtada MA, Siti AH, Luqman CA (2019). Separation Emulsion via Non-Ionic Surfactant: An Optimization. Processes 7(6):382.
Peng F, Liu Z, Wang L, Shao Z (2007). An Oil-Degrading Bacterium: Rhodococcus erythropolis strain 3C-9 and its Biosurfactants. Journal of Application of Microbiology 102:1603-1611.
Rasha MA, Abdurhman HN, Ziad S (2014). Kinetic Stability and Rheology of Water-in-Crude Oil Emulsion Stabilised by Cocamide at Different Water Volume Fractions. Journal of Chemical Engineering and Applications 5(2):204-209.
Saad MA, Kamil M, Abdurahman NH, Yunus R.M, Awad OI (2019). An Overview of Recent Advances in State-of-the-Art Techniques in the Demulsification of Crude Oil Emulsions. Processes 7(7):470.
Schubert H, Armbruster H (1992). Principles of Formation and Stability of Emulsions. International Chemical Engineering 32:14-28.
Sjoblom J, Mingyuan L, Hoiland H, Johansen EJ (1990). Water-in-Crude Oil Emulsions from the Norwegian Continental Shelf Part III. A Comparative Destabilization of Model Systems. Colloids Surfaces 46:127-139.
Tambe DE, Sharma MM (1993). Factors Controlling the Stability of Colloid –Stabilized Emulsions: An Experimental Investigation. Journal of Colloid Interface Science 157:244-253.
Vallejo-Cardona AA, Martı´nez-Palou R, Cha´vez-Go´mez B, Garcı´a-Caloca G, GuerraCamacho J, Cero´n-Camacho R (2017). Demulsification of Crude Oil-in-Water Emulsions by Means of Fungal Spores. PLoS ONE 12(2):1-17.
Vernon S, Kenneth AE (1987). Crude Oil Emulsions, Petroleum Engineering Handbook. Richardson TX 75080-2040.
Zainab A (2015). Experimental Study of Crude Oil Emulsion Stability by Surfactants and Nanoparticles. Masters Theses. 7382.
Zhang H, Fang S, Wang M, Cheng H, Wen H, Meng X (2012). Treatment of Waste Filature Oil/Water Emulsion by Combined Demulsification and Reverse Osmosis. Separation Purification Technology 63:264-268.


![Green Demulsifier Development - Proserv...III Demulsifier Chemistry History Time period Dosage [ppm] Chemistry 1920 - 1935 500 - 1.000 Naphthenic acids, aromatic and aliphatic sulphonates](https://img.pdfslide.us/doc/110x75/5e98b35e13d8180128073d18/green-demulsifier-development-proserv-iii-demulsifier-chemistry-history-time.jpg)