Embed Size (px)
Citation preview
1521-009X/44/8/1399–1423$25.00 http://dx.doi.org/10.1124/dmd.115.069096DRUG METABOLISM AND DISPOSITION Drug Metab Dispos 44:1399–1423, August 2016Copyright ª 2016 by The American Society for Pharmacology and Experimental Therapeutics
Perspective
Evaluation of a New Molecular Entity as a Victim of MetabolicDrug-Drug Interactions—an Industry Perspective s
Tonika Bohnert, Aarti Patel, Ian Templeton, Yuan Chen, Chuang Lu, George Lai, Louis Leung,Susanna Tse, Heidi J Einolf, Ying-Hong Wang, Michael Sinz, Ralph Stearns, Robert Walsky,
Wanping Geng, Sirimas Sudsakorn, David Moore, Ling He, Jan Wahlstrom, Jim Keirns,Rangaraj Narayanan, Dieter Lang, and Xiaoqing Yang; International Consortium for Innovationand Quality in Pharmaceutical Development (IQ) Victim Drug-Drug Interactions Working Group
Biogen, Cambridge, Massachusetts (T.B.); GlaxoSmithKline R&D, Hertfordshire, United Kingdom (A.P.); Janssen R&D, SpringHouse, Pennsylvania (I.T.); Genentech, South San Francisco, California (Y.C.); Takeda, Cambridge, Massachusetts (C.L.); Eisai Inc.,
Andover, Massachusetts (G.L.); Pfizer Inc., Groton, Connecticut (L.L., S.T.); Novartis, East Hanover, New Jersey (H.J.E.);Merck & Co., Inc., Kenilworth, New Jersey (Y.-H.W.); Bristol Myers Squibb, Wallingford, Connecticut (M.S.); Vertex Pharmaceuticals
Inc., Boston, Massachusetts (R.S.); EMD Serono R&D Institute, Inc., Billerica, Massachusetts (R.W., W.G.); Sanofi, Waltham,Massachusetts (S.S.); Roche Innovation Center, New York, New York (D.M.); Daiichi Sankyo, Edison, New Jersey (L.H.); Amgen Inc.,
Thousand Oaks, California (J.W.); Astellas, Northbrook, Illinois (J.K.); Celgene Corporation, Summit, New Jersey (R.N.);Bayer Pharma AG, Wuppertal, Germany (D.L.); and Incyte Corporation, Wilmington, Delaware (X.Y.)
Received December 18, 2015; accepted March 31, 2016
ABSTRACT
Under the guidance of the International Consortium for Innovation andQuality in Pharmaceutical Development (IQ), scientists from 20 phar-maceutical companies formed a Victim Drug-Drug Interactions Work-ing Group. This working group has conducted a review of the literatureand the practices of each company on the approaches to clearancepathway identification (fCL), estimation of fractional contribution ofmetabolizing enzyme toward metabolism (fm), along with modelingand simulation-aided strategy in predicting the victim drug-drug in-teraction (DDI) liability due tomodulationof drugmetabolizingenzymes.Presented in this perspective are the recommendations from thisworking group on: 1) strategic and experimental approaches to iden-tify fCL and fm, 2) whether those assessments may be quantitative for
certain enzymes (e.g., cytochrome P450, P450, and limited uridinediphosphoglucuronosyltransferase, UGT enzymes) or qualitative (formost of other drug metabolism enzymes), and the impact due to thelack of quantitative information on the latter. Multiple decision trees arepresented with stepwise approaches to identify specific enzymes thatare involved in the metabolism of a given drug and to aid the predictionand risk assessment of drug as a victim inDDI.Modeling and simulationapproaches are also discussed to better predict DDI risk in humans.Variability and parameter sensitivity analysis were emphasized whenapplying modeling and simulation to capture the differences within thepopulation used and to characterize the parameters that have themostinfluence on the prediction outcome.
Introduction
Metabolism-based drug-drug interactions (DDI) remain a safetyconcern, as observed by the number of drugs that have been withdrawnfrom the market due to severe toxicities arising from metabolic DDIs
(http://www.fda.gov/Drugs/DrugSafety/DrugRecalls/default.htm). It istherefore extremely important to assess and avoid, if possible, the potentialof a drug to cause or be affected by such DDIs. Regulatory agencies suchas the US Food and Drug Administration (FDA) and EuropeanMedicinesAgency (EMA) require that potential drug interaction risks be investigatedbefore large scale clinical trials are conducted. During the assessment ofmetabolism-based DDIs, new molecular entities (NME) are classified asperpetrators, drugs (inhibitor/inducer) that alter themetabolic clearance of
dx.doi.org/10.1124/dmd.115.069096.s This article has supplemental material available at dmd.aspetjournals.org.
ABBREVIATIONS: ADME, absorption distribution metabolism excretion; AMS, accelerator mass spectrometry; AO, aldehyde oxidase; AUC, area undercurve; BDC, bile duct cannulated; CES, carboxylesterase; CL, clearance; CLint, intrinsic clearance; DDI, drug-drug interactions; DME, drug metabolizingenzyme; EMA, European Medicines Agency; fCL, fraction of clearance; FDA, US Food and Drug Administration; FG, fraction escaping gut metabolism; FIH,first in human; fm, fraction metabolized; FMO, flavin-containing monooxygenase; fu, fraction unbound; fu,gut, fraction unbound enterocytes; GSH,glutathione; HLM, human liver microsomes; IQ, International Consortium for Innovation and Quality in Pharmaceutical Development; ISEF, intersystemextrapolation factor; IVIVC, in vitro-in vivo correlation; Km, substrate concentration at which the reaction rate is half of maximal velocity; LC/MS, liquidchromatography–mass spectrometry; MAO, monoamine oxidase; MAD, multiple ascending dose; NADPH, nicotinamide adenine dinucleotide phosphatereduced; NAT, N-acetyl transferase; NME, new molecular entity; PBPK, physiologically based pharmacokinetic; P450, cytochrome P450; PK,pharmacokinetics; PM, poor metabolizer; RAF, relative activity factor; rh, recombinant CYP; SAD, single ascending dose; SULT, sulfotransferase; UGT,uridine diphosphoglucuronosyltransferase; UV, ultraviolet; Vdss¸ steady, state volume of distribution; Vmax, maximum reaction velocity; XO, xanthine oxidase.
1399
http://dmd.aspetjournals.org/content/suppl/2016/04/06/dmd.115.069096.DC1Supplemental material to this article can be found at:
at ASPE
T Journals on July 26, 2018
dmd.aspetjournals.org
Dow
nloaded from
another coadministered drug, and victims, coadministered drugs whosemetabolic clearance is affected.In 2003, the Pharmaceutical Research and Manufacturers of America
consortium published a comprehensive DDI manuscript, which pro-vided best practices for the conduct of in vitro and clinical DDI studiesrequired for registration dossiers of drugs in clinical development(Bjornsson et al., 2003). The manuscript described technical andstrategic aspects of experimental assays pertaining to both perpetratorand victim DDI assessment, with a focus on cytochrome P450 (P450)-mediated DDIs. The current working group comprised of pharmaceu-tical company members of the International Consortium for Innovationand Quality in Pharmaceutical Development (IQ) was formed with asimilar intent but with the focus to expand on the solid foundation of theearlier manuscript with regard to victim DDI risk assessment. EveryNME has the potential to be a victim of some DDI (drug-drug, geneticpolymorphism, food-drug, disease-drug interactions), because it has tobe cleared by a certain pathway. Unlike the liability of a perpetrator drugthat can potentially be dialed out before final clinical candidatenomination via structural modifications, victim drug liability can at bestbe managed by thorough assessment of a NME’s clearance pathway andidentifying those that will be most sensitive to modulation. Additionally,definitive clinical studies to confirm the victim DDI risk of a NME areusually not done until later stages (post proof of concept clinical studies)of development. However, early evaluation of victimDDI risk of a NMEis deemed crucial and is a routine practice among companies as part ofthe drug development paradigm. Therefore, a manuscript outliningholistic strategies dedicated to victim DDI risk assessment of NMEs,through various stages of preclinical to clinical development, wasmerited.Drugmetabolizing enzymes (DME) and transporters have both emerged
to play a prominent role in clearance of NMEs, and modulation of eitherof these can result in exposure change of a victim NME. Because of theexpansive scope of both DMEs and transporters in drug disposition andto avoid duplication of efforts by other transporter-focused workinggroups (Hillgren et al., 2013; Tweedie et al., 2013), the current workinggroup’s focus was on metabolism-based victim DDI assessment only.Researchers are also encouraged to read comprehensive recent publica-tions on victim DDIs resulting from modulation of transporters (Lai andHsiao, 2014; Nakanishi and Tamai, 2015). Other topics not within thescope of this manuscript but comprehensively covered in recentpublications include evaluation of NMEs as perpetrators of DDIs (Zhaoet al., 2014; Varma et al., 2015) and assessment of performance of staticand dynamic models commonly used for successful prediction ofclinical DDIs (Vieira et al., 2014).This manuscript will summarize the commonly adopted industry
practices, which include in vitro methods, in combination with in vivopreclinical and clinical studies, along with modeling and simulation, tobest estimate the potential of a NME to be a victim of P450 and non-P450-mediated metabolic DDIs in the clinic. The compilation ofnon-P450 enzymes discussed here is not an exhaustive list of reportednon-P450 enzymes, rather a list of non-P450 enzymes that arecommonly evaluated and have been encountered in recent years byworking group member companies during assessment of NME metab-olism. The intent of the manuscript is not to define the timing or stage ofdrug development when certain studies need to be conducted but torecommend what studies may provide the best estimate of theexperimentally determined parameters viewed as the key elements of avictim DDI liability. Challenges commonly encountered in the estima-tion of the key parameters, including limitations in evaluating non-P450mediated metabolic DDIs, will be discussed. Application of modelingand simulation via case studies to highlight the importance and theimpact of victim DDI input parameters on clinical DDI study design and
outcome as well as strategies for managing uncertainties in key param-eters will be presented.A substantial amount of detailed information on RAF/ISEF scaling
method for the P450 and IVIVC of overall clearance prediction via UGTand AO/XO enzymes that the working group compiled during theirreview has been intentionally placed in the Supplemental Material.Including such compiled up-to-date information in SupplementalMaterial is deemed advantageous to maintain optimum length of mainmanuscript, while providing such useful information to interestedreaders without having to do exhaustive literature search. Analysis ofoptimization of experimental assay conditions required for P450 andnon-P450 enzymatic reactions were also not the intent of thismanuscript, and key references have been provided for interestedreaders in appropriate sections of the main text. This working groupof pharmaceutical companies acknowledges the need for such acomprehensive manuscript that summarizes universal strategies andcurrently available tools that are routinely used to guide decision-makingthrough various stages of preclinical and clinical development, encom-passing both P450 and non-P450 mediated metabolic victim DDI riskpotential of NMEs.Metabolic victim DDIs discussed in this manuscript represent
pharmacokinetic DDIs, resulting in exposure change of the victim drug.Because of complex underlying mechanisms for pharmacodynamicdrug-drug interactions (e.g., synergistic, additive, or antagonistic effectof coadministered drugs on a target receptor), this manuscript does notattempt to address these types of interactions. It is worthwhile to notethat in cases where a drug forms pharmacologically active metabolites(e.g., acebutalol, alprenolol, diltiazem; carbamazepine, valproic acid,diazepam, fluoxetine), pharmacokinetic change in exposure of parentdrug may not reflect parallel change in overall pharmacodynamicresponse.A victim drug’s metabolic clearance and exposure may undergo
significant fluctuation due to modulation of the DME primarily respon-sible for its clearance. Modulation of a DME can result from eitherinhibition and/or induction of its enzyme activity in the presence of acoadministered drug in certain disease states (Cheng and Morgan,2001; Harvey and Morgan, 2014; Jiang et al., 2016) or due to inherentvariability associated with the abundance or polymorphic natureof the DMEs [e.g., CYP2D6, N-acetyltransferase1 (NAT1), UDP-glucuronosyltransferase (UGT)1A1]. Several representative examplesare presented in Supplemental Table 1S. For instance, a drugprimarily metabolized by a polymorphic DME is more susceptibleto substantial exposure change in poor metabolizers (PMs) in thepresence of inhibitors of a minor non-polymorphic pathway (Collinset al., 2006).To accurately assess the magnitude of exposure change of a victim
NME due to modulation of its metabolic clearance it is important tounderstand the role of metabolism toward the victim NME’s overallclearance and contribution of a DME(s) to its overall metabolicclearance. These parameters are represented by the terms fCL and fmthroughout this manuscript. The term fCL is defined as the fraction ofdrug cleared by a pathway representing its route of clearance, wherefCL,metabolism represents the fraction of drug cleared through metabolism,fCL,renal represents the fraction of drug cleared unchanged renally, andfCL,biliary refers to the fraction of drug cleared unchanged via biliaryexcretion. For any drug, systemic clearance is the sum of metabolism,renal excretion, and hepatic uptake by transporters followed bymetabolism and/or subsequent excretion into bile (and then feces):fCL,metabolism + fCL,renal + fCL,biliary = 1. Some drugs may also be clearedvia intestinal secretion but it is often not possible to distinguish this frombiliary clearance. The term fm is defined as the fraction of drugmetabolized by an enzyme. To illustrate, a drug that is metabolically
1400 Bohnert et al.
at ASPE
T Journals on July 26, 2018
dmd.aspetjournals.org
Dow
nloaded from
cleared primarily byCYP3A4, CYP2C9, andUGT2B7 can be illustratedas: fm,CYP3A4 + fm,CYP2C9 + fm,UGT2B7 = fCL, metabolism, where sum total offractional metabolism via each of these enzymes is equal to the totalfraction of a NME cleared by metabolism.The parameters fCL,metabolism and fm are considered key for a victim
DDI risk assessment, because the sensitivity/dependency of the AUCratio for a victim NME significantly depends on fCL,metabolism x fm(Zhang et al., 2007). It is widely recognized that when fCL,metabolismand/or fm attain higher values such that fCL,metabolism � fm $ 0.5, thevictim drug AUC ratio is predicted to be $2 and increases with fmexponentially. The predicted AUC ratio of a victim drug also increasessharply with increasing potency and concentration of the inhibitor (e.g.,[I]/Ki = 5, 10, 20, 50, 100), especially when fCL,metabolism� fm . 0.8. Inthe absence of well-defined clinical safety margins and for compoundswith narrow therapeutic indices, when the NME is cleared by a singlemetabolic pathway, impairment of that pathway can result in apotentially undesirable adverse outcome, especially when the value offCL,metabolism � fm of the NME$ 0.5. Most definitive human studies toquantitatively determine fCL,metabolism and fm are not conducted untillater stages of clinical development (e.g., post- proof of concept, mostlyPhase II or Phase III). It is therefore necessary to obtain best estimates offCL,metabolism and fm early on to allow investigators to ensure the safeconduct of Phase I and Phase II studies with consideration of certainclinical exclusion criteria. Clinical exclusion criteria to mitigate victimDDI risk in Phase I/first in human (FIH) studies are especially importantin cases where FIH studies are conducted in patients compared withhealthy volunteers (who are not on any medications) and in Phase II inpatients who are taking concomitant medications.Metabolism continues to be the predominant route of clearance of
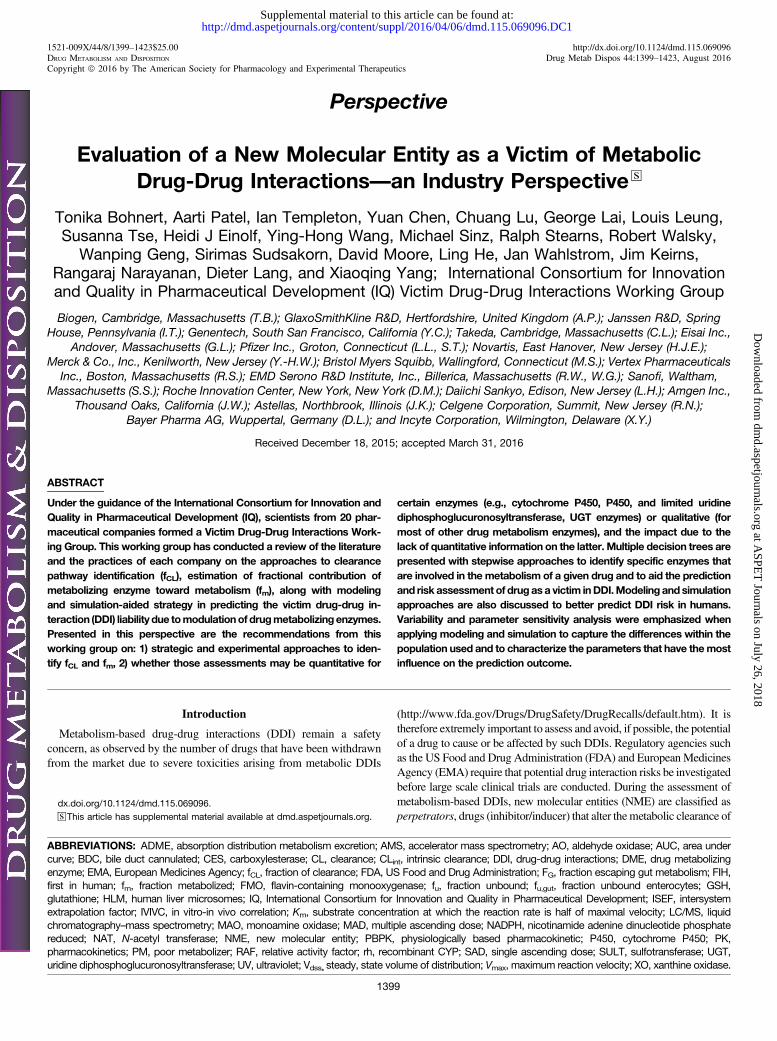
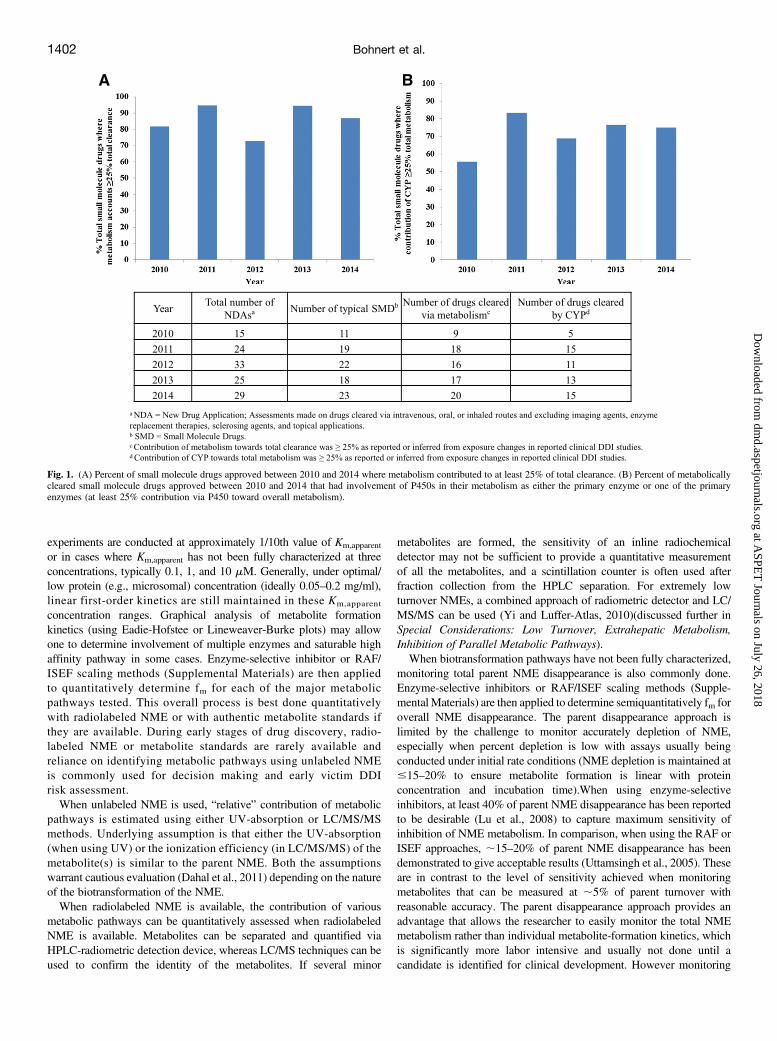
small molecule NMEs as experienced by pharmaceutical companies.This is also confirmed via assessment of clearance information ofNMEs approved over the years between 2010 and 2014, as availablefrom New Drug Applications, which reveal that metabolism accountedfor at least 25% of total clearance (Fig. 1) for.80% of the 95 approvedNMEs (assessment included NMEs administered via oral, intravenous,or inhalation route and excluded imaging agents, enzyme replacementtherapies, sclerosing agents, and topical applications). Of the drugs thatwere primarily cleared by metabolism, P450s were involved in themetabolism of approximately 75% of the NMEs approved during2010–2014 (Fig. 1), supporting the current view of a potentially higherrisk of P450-mediated victim DDI compared with other non-P450enzymes. Hence, it is routine practice among pharmaceutical compa-nies to start preliminary assessment of overall role of metabolism andunderstand DMEs involved in a NME’s clearance, starting in thepreclinical stages of drug development. This is commonly done viaevaluation of: 1) in vitro fm in human-derived matrices to understandwhether one or multiple P450 or non-P450 enzymes are involved in aNME’s metabolism and 2) in vivo fCL information in preclinical speciesand whether in vitro- in vivo correlation (IVIVC) holds in preclinicalspecies to gain qualitative understanding of whether metabolism orbiliary or renal excretion is predominant. The combined informationobtained is used as an early guide to evaluate victim DDI risk in theclinic using various predictive models (Vieira et al., 2014). Once thefCL,metabolism is available from human 14C-ADME study and fm,enzyme isquantitatively available from a clinical DDI study (or PK study ingenotyped population), the victim DDI predictions are further refined topredict additional and/or potentially complex DDIs before the NMEbeing administered in larger clinical trials (Lu et al., 2014). The nexttwo sections will focus on discussing how companies rely on cur-rently available in vitro assays and in vivo data to best estimate fm andfCL,metabolism along with some of the pitfalls encountered throughvarious stages of drug development.
In Vitro Determination of the Enzymes Involved in Metabolizing ofa NME and Their Relative Contribution Fm,Enzyme
Quantitative determination of fm in the clinic is obtained with studiesconducted either: 1) in a genotyped population where fm can beestimated from the change in exposure of a victim drug in extensivemetabolizers compared with poor metabolizers (Ito et al., 2005) or 2)with selective inhibitors of a metabolizing enzyme (responsible for theprimary metabolic pathway of victim drug) (Shou et al., 2008):
fm¼ 1-AUCno inhibitor or AUCextensive metabolizer
AUCwith inhibitor or AUCpoor metabolizerð1Þ
Before such definitive clinical studies are conducted, reliance on in vitromethods to estimate fm is common during early stages of development.“Enzyme mapping” is commonly the first step conducted to identifyDMEs involved in the major metabolic pathways of a NME. The secondstep often referred to as “reaction phenotyping” allows for thequantitative determination of the fraction metabolized (fm) by a specificenzyme or isoform in appropriate human liver matrices. After pre-liminary in vitro enzyme mapping, detailed reaction phenotypingexperiments are recommended when the contribution of a particularenzyme family is estimated to be$25% toward overall metabolism of aNME. In the absence of quantitative information on fCL,metabolism from14C-ADME studies, the worst-case scenario for victim DDI riskassessment is the assumption that metabolism is responsible for 100%of the NME clearance (consistent with the current observed trend ofmetabolism accounting for .80% clearance of NMEs registeredbetween 2010 and 2014). The conservative $25% cutoff from in vitrostudies is deemed to be a reasonable starting point to warrant furtherinvestigation of fm. Some of the reasons behind this approach include aconsideration for the experimental errors in in vitro determination of fmdue to unoptimized assay conditions, reduced enzyme activity in in vitrosystems, difficulty of extrapolation of in vitro fm to in vivo fm, especiallyin cases where extrahepatic metabolizing enzymes are involved.
General Guidelines for Enzyme Reaction Phenotyping
Comprehensive metabolite profiling in complete human liver systemssuch as hepatocytes to capture major metabolic pathways should beobtained before conducting detailed fm studies. Whether a NME iscleared via oxidation, reduction, hydrolysis, or direct conjugation guidesthe selection of metabolizing enzymes to be prioritized for phenotypingstudies. After major metabolic pathways have been identified, it isrecommended to determinemetabolite formation kinetics over a range ofNME concentrations to establish Km,apparent (apparent/observedMichaelis-Menten constant) value for the metabolic pathways of interest,particularly if using chemical inhibition method. Once Km,apparent
has been established, fm experiments are conducted maintaining NME/substrate concentration at approximately 1/10th value of Km,apparent tocapture accurate contribution of the physiologically relevant high-affinityenzymes toward the metabolic pathway of interest. Because most of theP450 substrates have Km,apparent values in 1–100 mM range, 0.1–10 mMis an appropriate concentration range to investigate metabolite formationkinetics while maintaining linear first-order kinetics. Investigators areencouraged to consider nonspecific binding of a NME to microsomes(and hepatocytes) in incubation mixture. For NMEs with high non-specific binding (as in cases of lipophilic basic drugs), although the Vmax
values are unaffected, the observed Km,apparent can be substantiallyhigher than Km,unbound(Km,apparent = funbound, incubation *Km,unbound),which represents the true unbound/pharmacologic drug concentrationat the enzyme active site and is key determinant of in vitro CLint.Challenges in assay sensitivity of metabolite monitoring at such lowKm,unbound concentration is a practical hurdle, and most in vitro
New Molecular Entities as Victims of Metabolic Drug-Drug Interactions 1401
at ASPE
T Journals on July 26, 2018
dmd.aspetjournals.org
Dow
nloaded from
experiments are conducted at approximately 1/10th value of Km,apparent
or in cases where Km,apparent has not been fully characterized at threeconcentrations, typically 0.1, 1, and 10 mM. Generally, under optimal/low protein (e.g., microsomal) concentration (ideally 0.05–0.2 mg/ml),linear first-order kinetics are still maintained in these Km,apparent
concentration ranges. Graphical analysis of metabolite formationkinetics (using Eadie-Hofstee or Lineweaver-Burke plots) may allowone to determine involvement of multiple enzymes and saturable highaffinity pathway in some cases. Enzyme-selective inhibitor or RAF/ISEF scaling methods (Supplemental Materials) are then appliedto quantitatively determine fm for each of the major metabolicpathways tested. This overall process is best done quantitativelywith radiolabeled NME or with authentic metabolite standards ifthey are available. During early stages of drug discovery, radio-labeled NME or metabolite standards are rarely available andreliance on identifying metabolic pathways using unlabeled NMEis commonly used for decision making and early victim DDIrisk assessment.When unlabeled NME is used, “relative” contribution of metabolic
pathways is estimated using either UV-absorption or LC/MS/MSmethods. Underlying assumption is that either the UV-absorption(when using UV) or the ionization efficiency (in LC/MS/MS) of themetabolite(s) is similar to the parent NME. Both the assumptionswarrant cautious evaluation (Dahal et al., 2011) depending on the natureof the biotransformation of the NME.When radiolabeled NME is available, the contribution of various
metabolic pathways can be quantitatively assessed when radiolabeledNME is available. Metabolites can be separated and quantified viaHPLC-radiometric detection device, whereas LC/MS techniques can beused to confirm the identity of the metabolites. If several minor
metabolites are formed, the sensitivity of an inline radiochemicaldetector may not be sufficient to provide a quantitative measurementof all the metabolites, and a scintillation counter is often used afterfraction collection from the HPLC separation. For extremely lowturnover NMEs, a combined approach of radiometric detector and LC/MS/MS can be used (Yi and Luffer-Atlas, 2010)(discussed further inSpecial Considerations: Low Turnover, Extrahepatic Metabolism,Inhibition of Parallel Metabolic Pathways).When biotransformation pathways have not been fully characterized,
monitoring total parent NME disappearance is also commonly done.Enzyme-selective inhibitors or RAF/ISEF scaling methods (Supple-mental Materials) are then applied to determine semiquantitatively fm foroverall NME disappearance. The parent disappearance approach islimited by the challenge to monitor accurately depletion of NME,especially when percent depletion is low with assays usually beingconducted under initial rate conditions (NME depletion is maintained at#15–20% to ensure metabolite formation is linear with proteinconcentration and incubation time).When using enzyme-selectiveinhibitors, at least 40% of parent NME disappearance has been reportedto be desirable (Lu et al., 2008) to capture maximum sensitivity ofinhibition of NME metabolism. In comparison, when using the RAF orISEF approaches, ;15–20% of parent NME disappearance has beendemonstrated to give acceptable results (Uttamsingh et al., 2005). Theseare in contrast to the level of sensitivity achieved when monitoringmetabolites that can be measured at ;5% of parent turnover withreasonable accuracy. The parent disappearance approach provides anadvantage that allows the researcher to easily monitor the total NMEmetabolism rather than individual metabolite-formation kinetics, whichis significantly more labor intensive and usually not done until acandidate is identified for clinical development. However monitoring
Fig. 1. (A) Percent of small molecule drugs approved between 2010 and 2014 where metabolism contributed to at least 25% of total clearance. (B) Percent of metabolicallycleared small molecule drugs approved between 2010 and 2014 that had involvement of P450s in their metabolism as either the primary enzyme or one of the primaryenzymes (at least 25% contribution via P450 toward overall metabolism).
1402 Bohnert et al.
at ASPE
T Journals on July 26, 2018
dmd.aspetjournals.org
Dow
nloaded from
NME disappearance does not yield a complete picture of metabolicpathways and enzymes involved in each of the pathways that could haveimportant implications in victim DDI risk predictions. This can bedemonstrated with an example of a NME metabolized predominantlythrough a major metabolic pathway, which has significant contributionfrom two distinct isoforms CYP3A4 and CYP2C9, each with differentkinetic behaviors (KmCYP2C9 = 5 mM, VmaxCYP2C9 = 18 pmol min21
mg21; KmCYP3A4 = 100 mM, VmaxCYP3A4 = 170 pmol min21 mg21).When overall NME disappearance is monitored, the apparent observedkinetic parameters obtained for the NMEwill be a result of hybrid of thekinetic parameters for both isoforms. At low NME concentration(usually therapeutically relevant concentrations), contribution of thehigh-affinity isoform CYP2C9 will be predominant toward NMEmetabolism. At high NME concentration due to higher Vmax ofCYP3A4-mediated pathway, contribution of CYP3A4 will be primary.Several drugs demonstrate such biphasic kinetics (bufuralol, dextro-methorphan, diazepam, omeprazole, lansoprazole, voriconazole) (Griffinand Houston, 2004; Pelkonen et al., 2008) where in vivo metabolismis dominated by the high-affinity/low-capacity enzymes (e.g., 2D6 or2C19) although in vitro, contribution of low-affinity/high-capacityenzyme (e.g., 3A4) may be predominant at high substrate concentra-tions. It is important to understand such mechanistic aspects in DDI riskassessment at clinically efficacious doses of a NME so as to notunderestimate or miss contribution of the physiologically relevant high-affinity enzyme under supratherapeutic in vitro assay conditions. In thenext few sections, summary of current tools and approaches for fmdetermination of P450 and non-P450 enzymes will be provided. Theapproaches can be evaluated by monitoring CLint of a NME via eithermajor metabolite formation or overall NME depletion, depending on thesensitivity of assays available to investigators that imparts data in-terpretation with high level of confidence. Technical details of typicalincubation conditions for P450- and non-P450-mediated in vitrometabolism assays are beyond the scope of this manuscript. Interestedreaders are referred to past reviews of this topic (Johnson andWaterman,1996, Venkatakrishnan et al., 2001; Kramer and Tracy, 2008, Ogilvieet al., 2008; Sensenhauser, 2014; Korzekwa, 2014) and citations madethroughout this document.
Early Enzyme Mapping: Identifying P450 and Non-P450 EnzymesInvolved in NME Metabolism
P450 and non-P450 enzymes such as flavin-containing monooxyge-nase (FMO), monoamine oxidase (MAO), and aldehyde oxidase (AO)/xanthine oxidase (XO), all catalyze oxidative metabolism of xenobioticswith differential preference based on the chemical nature of theirsubstrates. AO/XO preferentially oxidize electron-deficient carbons(Beedham, 1985; Pryde et al., 2010) compared with the P450s that preferelectron rich C-oxidations. Hence aldehyde, imine, or heteroaromaticfunctional groups are typical substrates of AO/XO. FMO is anotherNADPH-dependent oxidative enzyme like P450 enzymes but prefer-entially mediates N- and S- oxidations, typical peroxy acid reactions(e.g., Baeyer-Villiger oxidation) but not C-oxidation or heteroatom-dealkylations like P450 enzymes (Hines et al., 1994; Cashman, 1995;Ziegler, 2002; Harper and Brassil, 2008; Lang and Kalgutkar, 2003).MAO-mediatedmetabolism often occurs on compounds containing basicamine (Geha et al., 2001). Glucuronidation and sulfation commonlyoccurs on phenol and aliphatic alcohol groups forming O-glucuronidesand O-sulfates, respectively. Glucuronidation may also occur on aminesand carboxylic acids forming N-glucuronides and acyl glucuronides,respectively, whereas NAT has been observed to acetylate both aromaticand aliphatic amines. Carboxylesterase (CES) is usually involved in esterhydrolysis, although some amide and ketones with a-CF3 have beenreported to be substrates of CES (Wadkins et al., 2007).
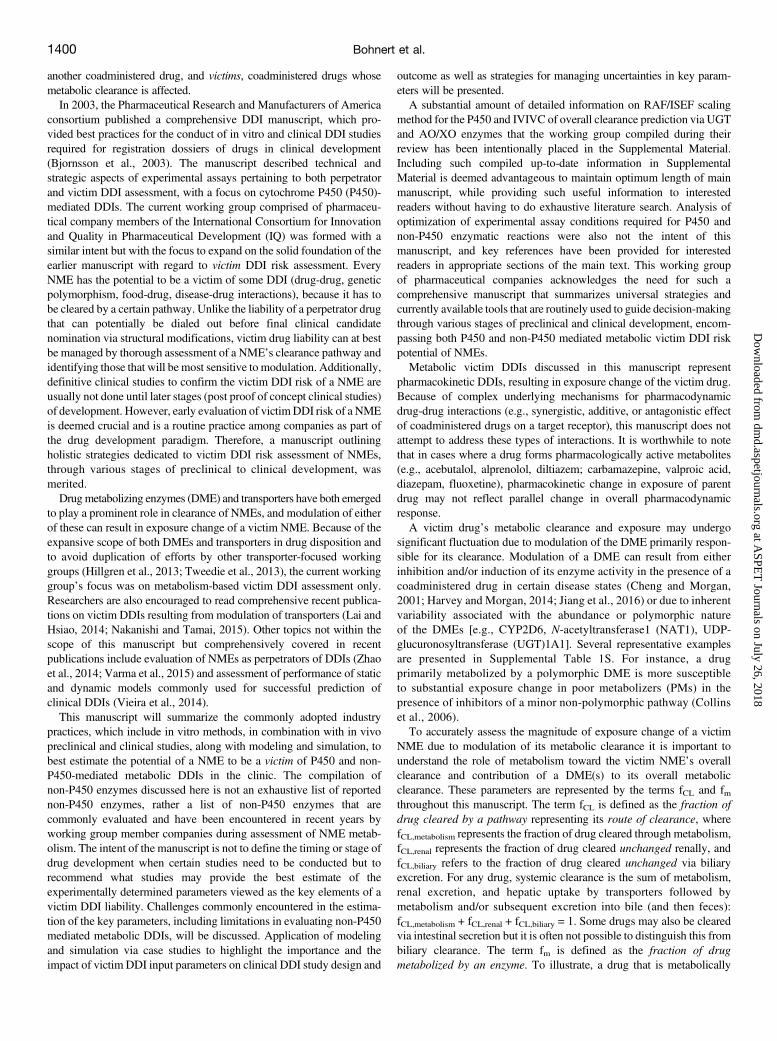
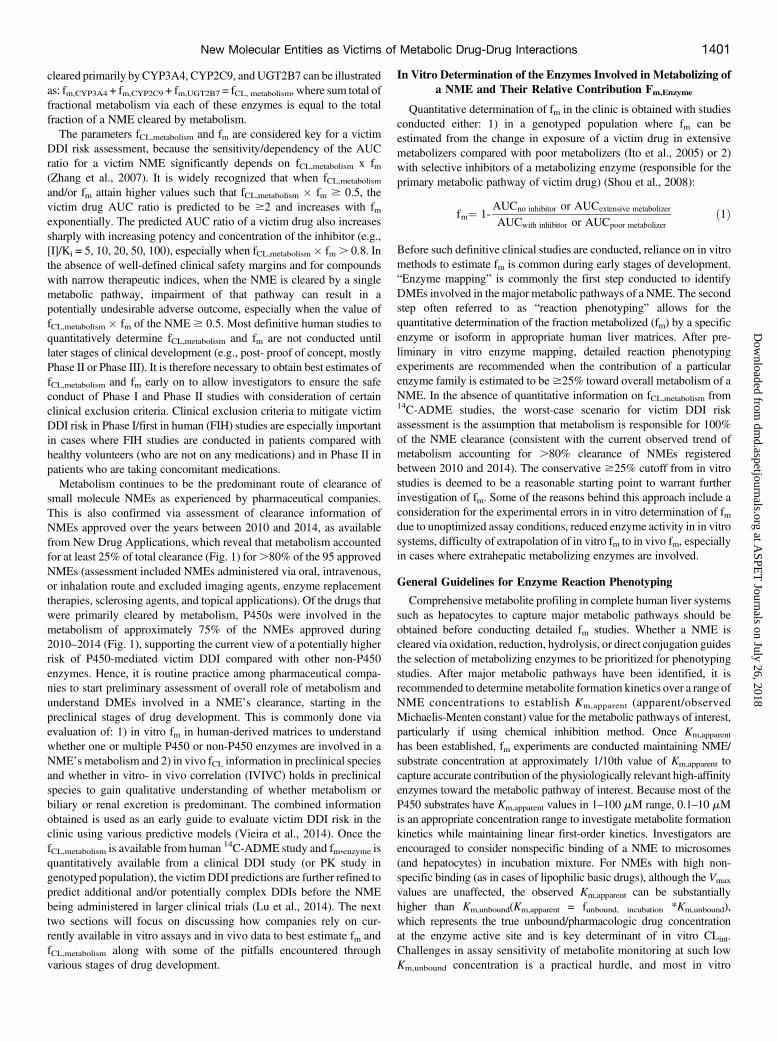
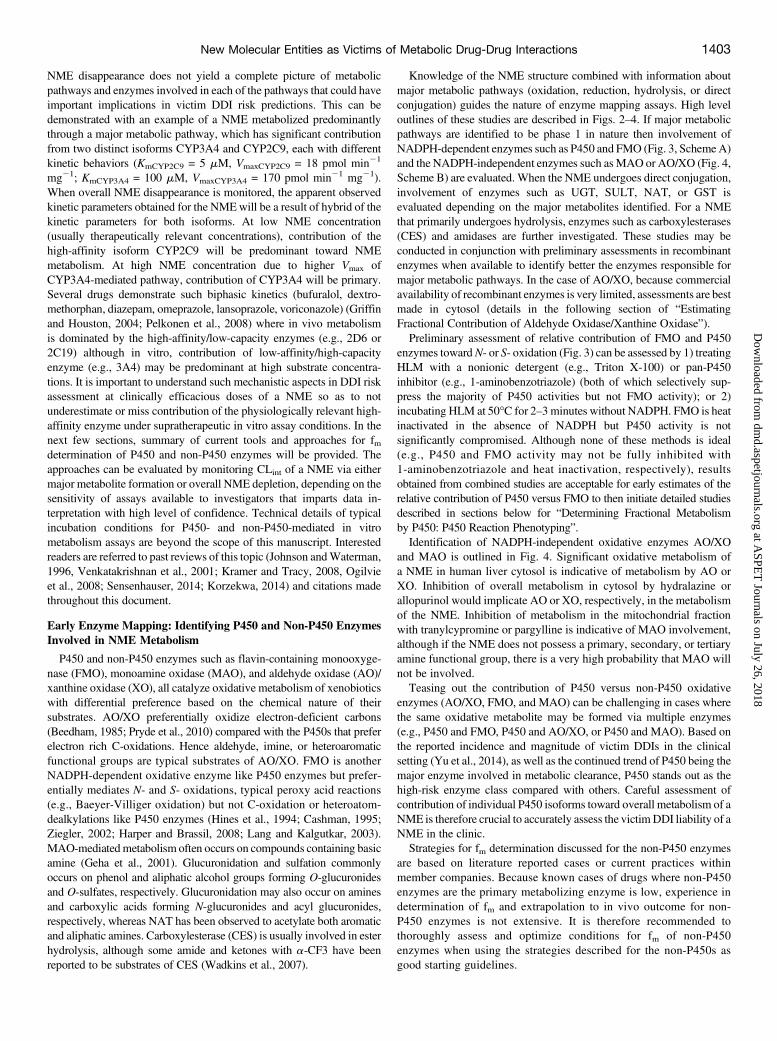
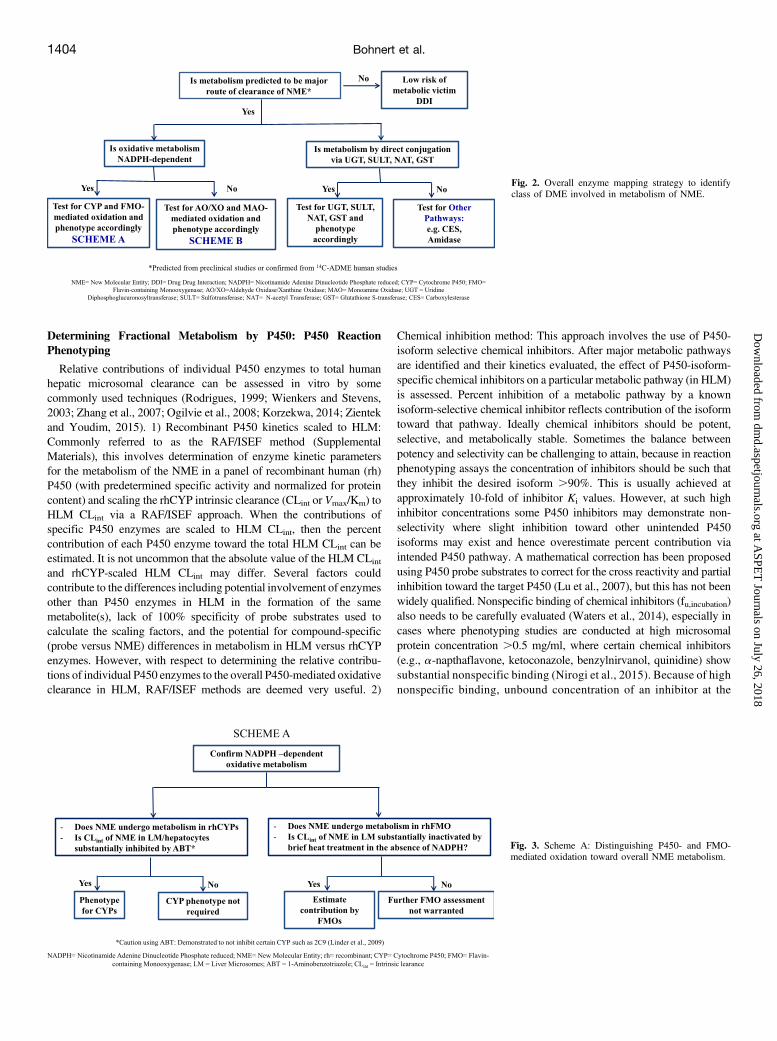
Knowledge of the NME structure combined with information aboutmajor metabolic pathways (oxidation, reduction, hydrolysis, or directconjugation) guides the nature of enzyme mapping assays. High leveloutlines of these studies are described in Figs. 2–4. If major metabolicpathways are identified to be phase 1 in nature then involvement ofNADPH-dependent enzymes such as P450 and FMO (Fig. 3, SchemeA)and the NADPH-independent enzymes such asMAO or AO/XO (Fig. 4,Scheme B) are evaluated. When the NME undergoes direct conjugation,involvement of enzymes such as UGT, SULT, NAT, or GST isevaluated depending on the major metabolites identified. For a NMEthat primarily undergoes hydrolysis, enzymes such as carboxylesterases(CES) and amidases are further investigated. These studies may beconducted in conjunction with preliminary assessments in recombinantenzymes when available to identify better the enzymes responsible formajor metabolic pathways. In the case of AO/XO, because commercialavailability of recombinant enzymes is very limited, assessments are bestmade in cytosol (details in the following section of “EstimatingFractional Contribution of Aldehyde Oxidase/Xanthine Oxidase”).Preliminary assessment of relative contribution of FMO and P450
enzymes towardN- or S- oxidation (Fig. 3) can be assessed by 1) treatingHLM with a nonionic detergent (e.g., Triton X-100) or pan-P450inhibitor (e.g., 1-aminobenzotriazole) (both of which selectively sup-press the majority of P450 activities but not FMO activity); or 2)incubating HLM at 50�C for 2–3minutes without NADPH. FMO is heatinactivated in the absence of NADPH but P450 activity is notsignificantly compromised. Although none of these methods is ideal(e.g., P450 and FMO activity may not be fully inhibited with1-aminobenzotriazole and heat inactivation, respectively), resultsobtained from combined studies are acceptable for early estimates of therelative contribution of P450 versus FMO to then initiate detailed studiesdescribed in sections below for “Determining Fractional Metabolismby P450: P450 Reaction Phenotyping”.Identification of NADPH-independent oxidative enzymes AO/XO
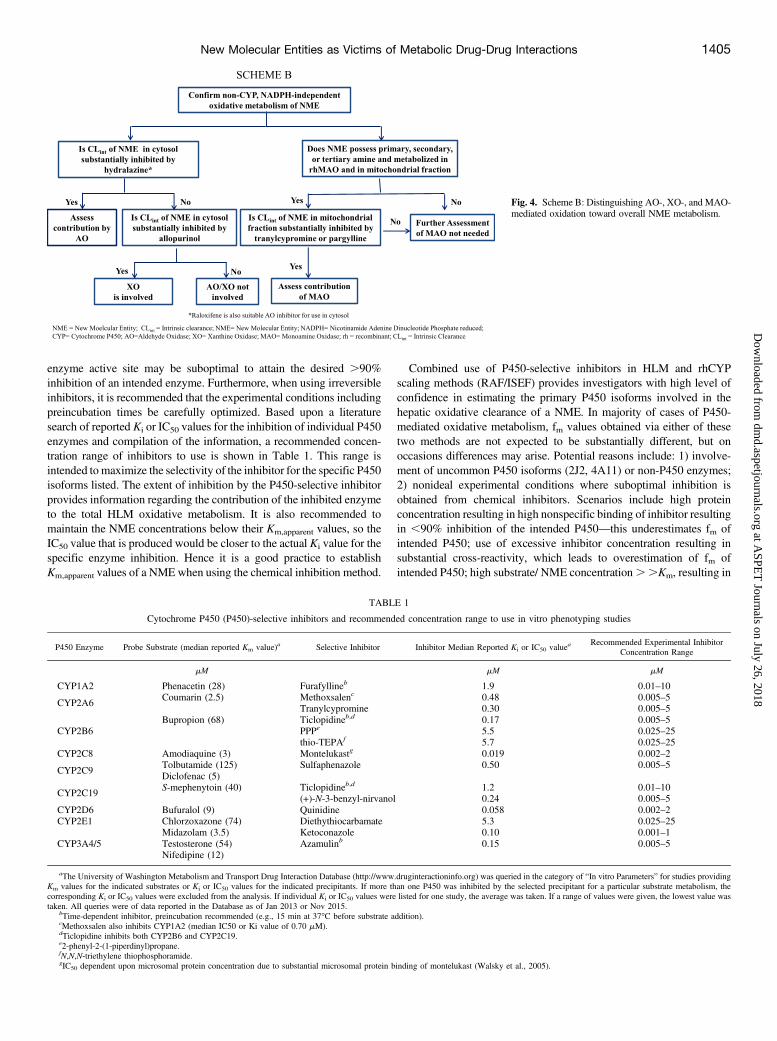
and MAO is outlined in Fig. 4. Significant oxidative metabolism ofa NME in human liver cytosol is indicative of metabolism by AO orXO. Inhibition of overall metabolism in cytosol by hydralazine orallopurinol would implicate AO or XO, respectively, in the metabolismof the NME. Inhibition of metabolism in the mitochondrial fractionwith tranylcypromine or pargylline is indicative of MAO involvement,although if the NME does not possess a primary, secondary, or tertiaryamine functional group, there is a very high probability that MAO willnot be involved.Teasing out the contribution of P450 versus non-P450 oxidative
enzymes (AO/XO, FMO, and MAO) can be challenging in cases wherethe same oxidative metabolite may be formed via multiple enzymes(e.g., P450 and FMO, P450 and AO/XO, or P450 and MAO). Based onthe reported incidence and magnitude of victim DDIs in the clinicalsetting (Yu et al., 2014), as well as the continued trend of P450 being themajor enzyme involved in metabolic clearance, P450 stands out as thehigh-risk enzyme class compared with others. Careful assessment ofcontribution of individual P450 isoforms toward overall metabolism of aNME is therefore crucial to accurately assess the victimDDI liability of aNME in the clinic.Strategies for fm determination discussed for the non-P450 enzymes
are based on literature reported cases or current practices withinmember companies. Because known cases of drugs where non-P450enzymes are the primary metabolizing enzyme is low, experience indetermination of fm and extrapolation to in vivo outcome for non-P450 enzymes is not extensive. It is therefore recommended tothoroughly assess and optimize conditions for fm of non-P450enzymes when using the strategies described for the non-P450s asgood starting guidelines.
New Molecular Entities as Victims of Metabolic Drug-Drug Interactions 1403
at ASPE
T Journals on July 26, 2018
dmd.aspetjournals.org
Dow
nloaded from
Determining Fractional Metabolism by P450: P450 ReactionPhenotyping
Relative contributions of individual P450 enzymes to total humanhepatic microsomal clearance can be assessed in vitro by somecommonly used techniques (Rodrigues, 1999; Wienkers and Stevens,2003; Zhang et al., 2007; Ogilvie et al., 2008; Korzekwa, 2014; Zientekand Youdim, 2015). 1) Recombinant P450 kinetics scaled to HLM:Commonly referred to as the RAF/ISEF method (SupplementalMaterials), this involves determination of enzyme kinetic parametersfor the metabolism of the NME in a panel of recombinant human (rh)P450 (with predetermined specific activity and normalized for proteincontent) and scaling the rhCYP intrinsic clearance (CLint or Vmax/Km) toHLM CLint via a RAF/ISEF approach. When the contributions ofspecific P450 enzymes are scaled to HLM CLint, then the percentcontribution of each P450 enzyme toward the total HLM CLint can beestimated. It is not uncommon that the absolute value of the HLM CLintand rhCYP-scaled HLM CLint may differ. Several factors couldcontribute to the differences including potential involvement of enzymesother than P450 enzymes in HLM in the formation of the samemetabolite(s), lack of 100% specificity of probe substrates used tocalculate the scaling factors, and the potential for compound-specific(probe versus NME) differences in metabolism in HLM versus rhCYPenzymes. However, with respect to determining the relative contribu-tions of individual P450 enzymes to the overall P450-mediated oxidativeclearance in HLM, RAF/ISEF methods are deemed very useful. 2)
Chemical inhibition method: This approach involves the use of P450-isoform selective chemical inhibitors. After major metabolic pathwaysare identified and their kinetics evaluated, the effect of P450-isoform-specific chemical inhibitors on a particular metabolic pathway (in HLM)is assessed. Percent inhibition of a metabolic pathway by a knownisoform-selective chemical inhibitor reflects contribution of the isoformtoward that pathway. Ideally chemical inhibitors should be potent,selective, and metabolically stable. Sometimes the balance betweenpotency and selectivity can be challenging to attain, because in reactionphenotyping assays the concentration of inhibitors should be such thatthey inhibit the desired isoform .90%. This is usually achieved atapproximately 10-fold of inhibitor Ki values. However, at such highinhibitor concentrations some P450 inhibitors may demonstrate non-selectivity where slight inhibition toward other unintended P450isoforms may exist and hence overestimate percent contribution viaintended P450 pathway. A mathematical correction has been proposedusing P450 probe substrates to correct for the cross reactivity and partialinhibition toward the target P450 (Lu et al., 2007), but this has not beenwidely qualified. Nonspecific binding of chemical inhibitors (fu,incubation)also needs to be carefully evaluated (Waters et al., 2014), especially incases where phenotyping studies are conducted at high microsomalprotein concentration .0.5 mg/ml, where certain chemical inhibitors(e.g., a-napthaflavone, ketoconazole, benzylnirvanol, quinidine) showsubstantial nonspecific binding (Nirogi et al., 2015). Because of highnonspecific binding, unbound concentration of an inhibitor at the
Fig. 2. Overall enzyme mapping strategy to identifyclass of DME involved in metabolism of NME.
Fig. 3. Scheme A: Distinguishing P450- and FMO-mediated oxidation toward overall NME metabolism.
1404 Bohnert et al.
at ASPE
T Journals on July 26, 2018
dmd.aspetjournals.org
Dow
nloaded from
enzyme active site may be suboptimal to attain the desired .90%inhibition of an intended enzyme. Furthermore, when using irreversibleinhibitors, it is recommended that the experimental conditions includingpreincubation times be carefully optimized. Based upon a literaturesearch of reported Ki or IC50 values for the inhibition of individual P450enzymes and compilation of the information, a recommended concen-tration range of inhibitors to use is shown in Table 1. This range isintended to maximize the selectivity of the inhibitor for the specific P450isoforms listed. The extent of inhibition by the P450-selective inhibitorprovides information regarding the contribution of the inhibited enzymeto the total HLM oxidative metabolism. It is also recommended tomaintain the NME concentrations below their Km,apparent values, so theIC50 value that is produced would be closer to the actual Ki value for thespecific enzyme inhibition. Hence it is a good practice to establishKm,apparent values of a NME when using the chemical inhibition method.
Combined use of P450-selective inhibitors in HLM and rhCYPscaling methods (RAF/ISEF) provides investigators with high level ofconfidence in estimating the primary P450 isoforms involved in thehepatic oxidative clearance of a NME. In majority of cases of P450-mediated oxidative metabolism, fm values obtained via either of thesetwo methods are not expected to be substantially different, but onoccasions differences may arise. Potential reasons include: 1) involve-ment of uncommon P450 isoforms (2J2, 4A11) or non-P450 enzymes;2) nonideal experimental conditions where suboptimal inhibition isobtained from chemical inhibitors. Scenarios include high proteinconcentration resulting in high nonspecific binding of inhibitor resultingin ,90% inhibition of the intended P450—this underestimates fm ofintended P450; use of excessive inhibitor concentration resulting insubstantial cross-reactivity, which leads to overestimation of fm ofintended P450; high substrate/ NME concentration..Km, resulting in
Fig. 4. Scheme B: Distinguishing AO-, XO-, and MAO-mediated oxidation toward overall NME metabolism.
TABLE 1
Cytochrome P450 (P450)-selective inhibitors and recommended concentration range to use in vitro phenotyping studies
P450 Enzyme Probe Substrate (median reported Km value)a Selective Inhibitor Inhibitor Median Reported Ki or IC50 valuea Recommended Experimental Inhibitor
Concentration Range
mM mM mM
CYP1A2 Phenacetin (28) Furafyllineb 1.9 0.01–10
CYP2A6Coumarin (2.5) Methoxsalenc 0.48 0.005–5
Tranylcypromine 0.30 0.005–5
CYP2B6Bupropion (68) Ticlopidineb,d 0.17 0.005–5
PPPe 5.5 0.025–25thio-TEPAf 5.7 0.025–25
CYP2C8 Amodiaquine (3) Montelukastg 0.019 0.002–2
CYP2C9Tolbutamide (125) Sulfaphenazole 0.50 0.005–5Diclofenac (5)
CYP2C19S-mephenytoin (40) Ticlopidineb,d 1.2 0.01–10
(+)-N-3-benzyl-nirvanol 0.24 0.005–5CYP2D6 Bufuralol (9) Quinidine 0.058 0.002–2CYP2E1 Chlorzoxazone (74) Diethythiocarbamate 5.3 0.025–25
CYP3A4/5Midazolam (3.5) Ketoconazole 0.10 0.001–1Testosterone (54) Azamulinb 0.15 0.005–5Nifedipine (12)
aThe University of Washington Metabolism and Transport Drug Interaction Database (http://www.druginteractioninfo.org) was queried in the category of “In vitro Parameters” for studies providingKm values for the indicated substrates or Ki or IC50 values for the indicated precipitants. If more than one P450 was inhibited by the selected precipitant for a particular substrate metabolism, thecorresponding Ki or IC50 values were excluded from the analysis. If individual Ki or IC50 values were listed for one study, the average was taken. If a range of values were given, the lowest value wastaken. All queries were of data reported in the Database as of Jan 2013 or Nov 2015.
bTime-dependent inhibitor, preincubation recommended (e.g., 15 min at 37�C before substrate addition).cMethoxsalen also inhibits CYP1A2 (median IC50 or Ki value of 0.70 mM).dTiclopidine inhibits both CYP2B6 and CYP2C19.e2-phenyl-2-(1-piperdinyl)propane.fN,N,N-triethylene thiophosphoramide.gIC50 dependent upon microsomal protein concentration due to substantial microsomal protein binding of montelukast (Walsky et al., 2005).
New Molecular Entities as Victims of Metabolic Drug-Drug Interactions 1405
at ASPE
T Journals on July 26, 2018
dmd.aspetjournals.org
Dow
nloaded from
overwhelming the inhibitory effect of reversible inhibitors and under-estimating fm of intended P450; 3) the lack of absolute specificity of theprobe substrate and/or inhibitor for P450; 4) potential difference in P450binding site for the probe substrate and the NME, where the NME mayinteract with the P450 at a binding site, different from that of the probesubstrate (Mathur et al., 2013). Large discrepancies in fm values obtainedfrom chemical inhibition and rhCYP scaling methods, often result inconsiderable differences in the magnitude of the predicted victim DDIliability for a NME and warrant a systematic look into factors discussedaboveCorrelation analysis is another method that has been assessed for the
P450 isoforms (and infrequent cases of UGT; Kamdem et al., 2010);however, review of current industry practices among the working groupmember companies did not advocate this to be a method of choice forphenotyping of drug candidates, especially when there is discrepancy inthe fm values from RAF/ISEF and chemical inhibitor methods. A reasonmay be that a prerequisite for correlation analysis is the maintenance of aconsistent collection of individual human liver microsomes, with a widerange of activity characterized for the metabolizing enzymes of interest.This is probably less practical/attractive for industry laboratories, whichroutinely use commercially available pooled human liver microsomesfrom 100–150 donors, for RAF/ISEF and chemical inhibitor studies.Correlation analysis is also substantially more labor intensive than RAF/ISEF and chemical inhibitor methods, and when multiple P450 isoformsare involved, data interpretation may not be straight forward and oftenyields only qualitative information on fm.Successful examples of predictions of exposure change of victim drug
in the clinic based on experimentally determined in vitro fm,CYP havebeen reported. These examples use the methods described in the P450phenotyping section as the standard approach (Youdim et al., 2008; Luet al., 2008) and in theory can also be applied to non-P450 enzymeswhen appropriate tools are available.
Identification of Flavin-Containing Monooxygenases FMO 1, 3, 5
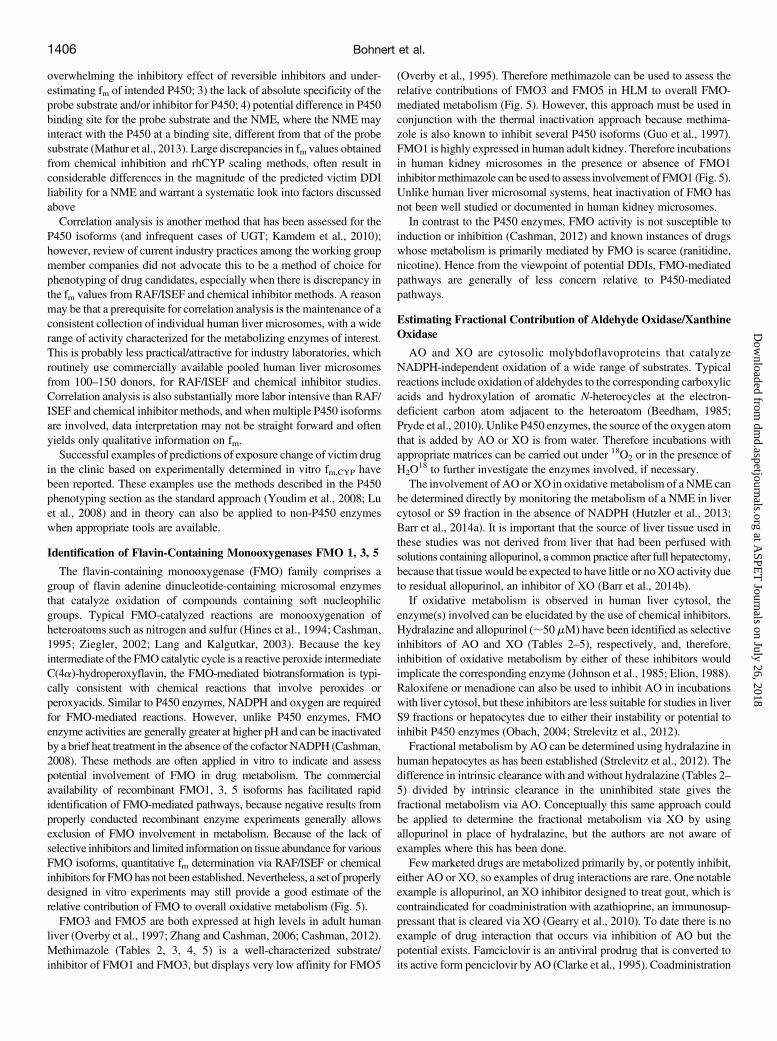
The flavin-containing monooxygenase (FMO) family comprises agroup of flavin adenine dinucleotide-containing microsomal enzymesthat catalyze oxidation of compounds containing soft nucleophilicgroups. Typical FMO-catalyzed reactions are monooxygenation ofheteroatoms such as nitrogen and sulfur (Hines et al., 1994; Cashman,1995; Ziegler, 2002; Lang and Kalgutkar, 2003). Because the keyintermediate of the FMO catalytic cycle is a reactive peroxide intermediateC(4a)-hydroperoxyflavin, the FMO-mediated biotransformation is typi-cally consistent with chemical reactions that involve peroxides orperoxyacids. Similar to P450 enzymes, NADPH and oxygen are requiredfor FMO-mediated reactions. However, unlike P450 enzymes, FMOenzyme activities are generally greater at higher pH and can be inactivatedby a brief heat treatment in the absence of the cofactor NADPH (Cashman,2008). These methods are often applied in vitro to indicate and assesspotential involvement of FMO in drug metabolism. The commercialavailability of recombinant FMO1, 3, 5 isoforms has facilitated rapididentification of FMO-mediated pathways, because negative results fromproperly conducted recombinant enzyme experiments generally allowsexclusion of FMO involvement in metabolism. Because of the lack ofselective inhibitors and limited information on tissue abundance for variousFMO isoforms, quantitative fm determination via RAF/ISEF or chemicalinhibitors for FMOhas not been established.Nevertheless, a set of properlydesigned in vitro experiments may still provide a good estimate of therelative contribution of FMO to overall oxidative metabolism (Fig. 5).FMO3 and FMO5 are both expressed at high levels in adult human
liver (Overby et al., 1997; Zhang and Cashman, 2006; Cashman, 2012).Methimazole (Tables 2, 3, 4, 5) is a well-characterized substrate/inhibitor of FMO1 and FMO3, but displays very low affinity for FMO5
(Overby et al., 1995). Therefore methimazole can be used to assess therelative contributions of FMO3 and FMO5 in HLM to overall FMO-mediated metabolism (Fig. 5). However, this approach must be used inconjunction with the thermal inactivation approach because methima-zole is also known to inhibit several P450 isoforms (Guo et al., 1997).FMO1 is highly expressed in human adult kidney. Therefore incubationsin human kidney microsomes in the presence or absence of FMO1inhibitormethimazole can be used to assess involvement of FMO1 (Fig. 5).Unlike human liver microsomal systems, heat inactivation of FMO hasnot been well studied or documented in human kidney microsomes.In contrast to the P450 enzymes, FMO activity is not susceptible to
induction or inhibition (Cashman, 2012) and known instances of drugswhose metabolism is primarily mediated by FMO is scarce (ranitidine,nicotine). Hence from the viewpoint of potential DDIs, FMO-mediatedpathways are generally of less concern relative to P450-mediatedpathways.
Estimating Fractional Contribution of Aldehyde Oxidase/XanthineOxidase
AO and XO are cytosolic molybdoflavoproteins that catalyzeNADPH-independent oxidation of a wide range of substrates. Typicalreactions include oxidation of aldehydes to the corresponding carboxylicacids and hydroxylation of aromatic N-heterocycles at the electron-deficient carbon atom adjacent to the heteroatom (Beedham, 1985;Pryde et al., 2010). Unlike P450 enzymes, the source of the oxygen atomthat is added by AO or XO is from water. Therefore incubations withappropriate matrices can be carried out under 18O2 or in the presence ofH2O
18 to further investigate the enzymes involved, if necessary.The involvement of AO or XO in oxidative metabolism of a NME can
be determined directly by monitoring the metabolism of a NME in livercytosol or S9 fraction in the absence of NADPH (Hutzler et al., 2013;Barr et al., 2014a). It is important that the source of liver tissue used inthese studies was not derived from liver that had been perfused withsolutions containing allopurinol, a common practice after full hepatectomy,because that tissue would be expected to have little or noXO activity dueto residual allopurinol, an inhibitor of XO (Barr et al., 2014b).If oxidative metabolism is observed in human liver cytosol, the
enzyme(s) involved can be elucidated by the use of chemical inhibitors.Hydralazine and allopurinol (;50 mM) have been identified as selectiveinhibitors of AO and XO (Tables 2–5), respectively, and, therefore,inhibition of oxidative metabolism by either of these inhibitors wouldimplicate the corresponding enzyme (Johnson et al., 1985; Elion, 1988).Raloxifene or menadione can also be used to inhibit AO in incubationswith liver cytosol, but these inhibitors are less suitable for studies in liverS9 fractions or hepatocytes due to either their instability or potential toinhibit P450 enzymes (Obach, 2004; Strelevitz et al., 2012).Fractional metabolism by AO can be determined using hydralazine in
human hepatocytes as has been established (Strelevitz et al., 2012). Thedifference in intrinsic clearance with and without hydralazine (Tables 2–5) divided by intrinsic clearance in the uninhibited state gives thefractional metabolism via AO. Conceptually this same approach couldbe applied to determine the fractional metabolism via XO by usingallopurinol in place of hydralazine, but the authors are not aware ofexamples where this has been done.Fewmarketed drugs are metabolized primarily by, or potently inhibit,
either AO or XO, so examples of drug interactions are rare. One notableexample is allopurinol, an XO inhibitor designed to treat gout, which iscontraindicated for coadministration with azathioprine, an immunosup-pressant that is cleared via XO (Gearry et al., 2010). To date there is noexample of drug interaction that occurs via inhibition of AO but thepotential exists. Famciclovir is an antiviral prodrug that is converted toits active form penciclovir by AO (Clarke et al., 1995). Coadministration
1406 Bohnert et al.
at ASPE
T Journals on July 26, 2018
dmd.aspetjournals.org
Dow
nloaded from
of famciclovir with a potent inhibitor of AO such as raloxifene couldpotentially lead to a reduction in antiviral efficacy (Obach, 2004), but studiesto determine the magnitude of this interaction have not been conducted. Itwas recently demonstrated that inhibition ofAOmaybe substrate dependentand occur by mixed modes of reversible and irreversible inhibition, so careshould be exercised in predicting drug interactions based on in vitro data(Barr and Jones, 2011, 2013a; Barr et al., 2014b).Because of species differences in AO isoforms and activities, good
preclinical models for human AO activity have yet to be identified(Choughule et al., 2013), so caution should be exercised in extrapolatingAO-mediated overall metabolic clearance from animals to humans. Invitro-in vivo correlation (IVIVC) assessed for set of 11 drugs (Zienteket al., 2010) (Supplemental Materials) predominantly metabolized bythis AO suggested that the IVIVC is typically poor and the AO-mediatedin vivo clearance is usually underestimated. Reasons for this poorcorrelation have been attributed to the extrahepatic contribution of AO to
total clearance and the potential lability of AO in liver preparations usedfor in vitro studies. Recently the protein content of AO has beenquantified in human liver cytosol (Barr and Jones, 2013; Barr et al.,2013; Fu et al., 2013). Use of these methods and their extension toextrahepatic tissues may help to define better our ability to predictcontribution of human metabolic clearance via AO in the future.
Identification of Monoamine Oxidases MAO-A and MAO-B
Monoamine oxidase (MAO) is a flavin-containing protein located onthe outer mitochondrial membrane of a wide range of mammalian cellsin various tissues (Saura et al., 1996). MAO catalyzes the oxidativedeamination of biogenic amines as well as basic amine-containingxenobiotics. MAO exists in two forms encoded by separate genes with70% sequence homology (Weyler et al., 1990). MAO-A is found in theliver, gastrointestinal tract, and placenta, whereas MAO-B is foundprimarily in blood platelets.
Fig. 5. Overall strategy to confirm role of FMO 1, 3,and 5 in NME metabolism.
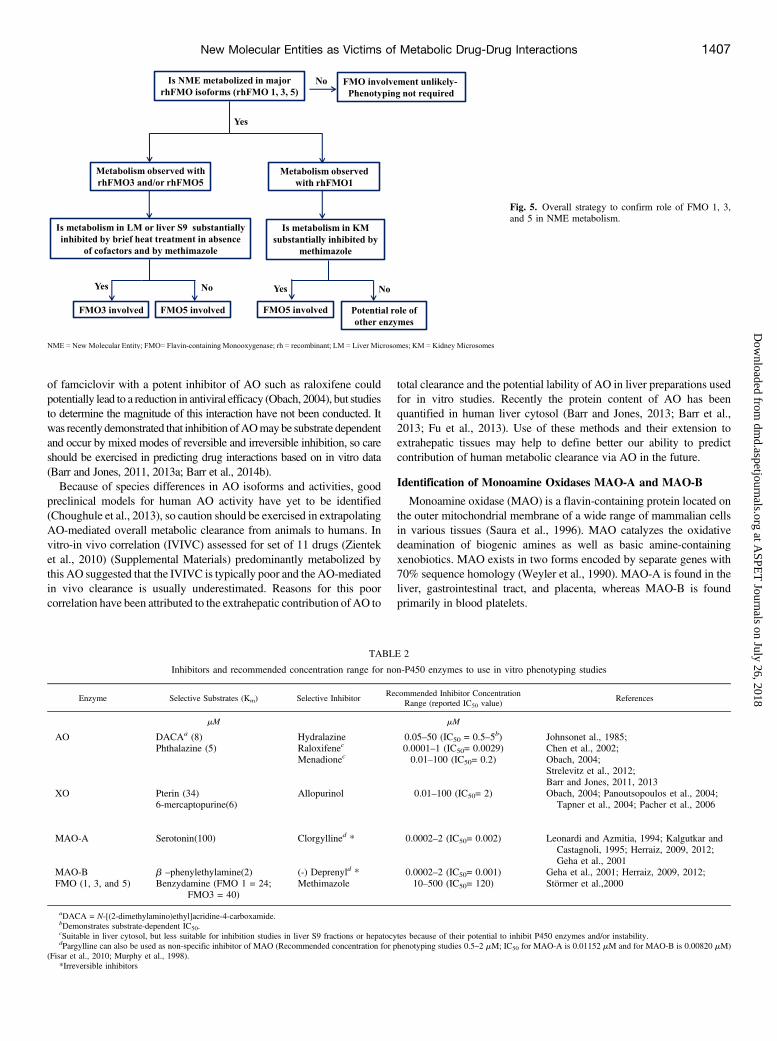
TABLE 2
Inhibitors and recommended concentration range for non-P450 enzymes to use in vitro phenotyping studies
Enzyme Selective Substrates (Km) Selective InhibitorRecommended Inhibitor Concentration
Range (reported IC50 value)References
mM mM
AO DACAa (8) Hydralazine 0.05–50 (IC50 = 0.5–5b) Johnsonet al., 1985;Phthalazine (5) Raloxifenec 0.0001–1 (IC50= 0.0029) Chen et al., 2002;
Menadionec 0.01–100 (IC50= 0.2) Obach, 2004;Strelevitz et al., 2012;Barr and Jones, 2011, 2013
XO Pterin (34) Allopurinol 0.01–100 (IC50= 2) Obach, 2004; Panoutsopoulos et al., 2004;Tapner et al., 2004; Pacher et al., 20066-mercaptopurine(6)
MAO-A Serotonin(100) Clorgyllined * 0.0002–2 (IC50= 0.002) Leonardi and Azmitia, 1994; Kalgutkar andCastagnoli, 1995; Herraiz, 2009, 2012;Geha et al., 2001
MAO-B b –phenylethylamine(2) (-) Deprenyld * 0.0002–2 (IC50= 0.001) Geha et al., 2001; Herraiz, 2009, 2012;FMO (1, 3, and 5) Benzydamine (FMO 1 = 24;
FMO3 = 40)Methimazole 10–500 (IC50= 120) Störmer et al.,2000
aDACA = N-[(2-dimethylamino)ethyl]acridine-4-carboxamide.bDemonstrates substrate-dependent IC50.cSuitable in liver cytosol, but less suitable for inhibition studies in liver S9 fractions or hepatocytes because of their potential to inhibit P450 enzymes and/or instability.dPargylline can also be used as non-specific inhibitor of MAO (Recommended concentration for phenotyping studies 0.5–2 mM; IC50 for MAO-A is 0.01152 mM and for MAO-B is 0.00820 mM)
(Fisar et al., 2010; Murphy et al., 1998).*Irreversible inhibitors
New Molecular Entities as Victims of Metabolic Drug-Drug Interactions 1407
at ASPE
T Journals on July 26, 2018
dmd.aspetjournals.org
Dow
nloaded from
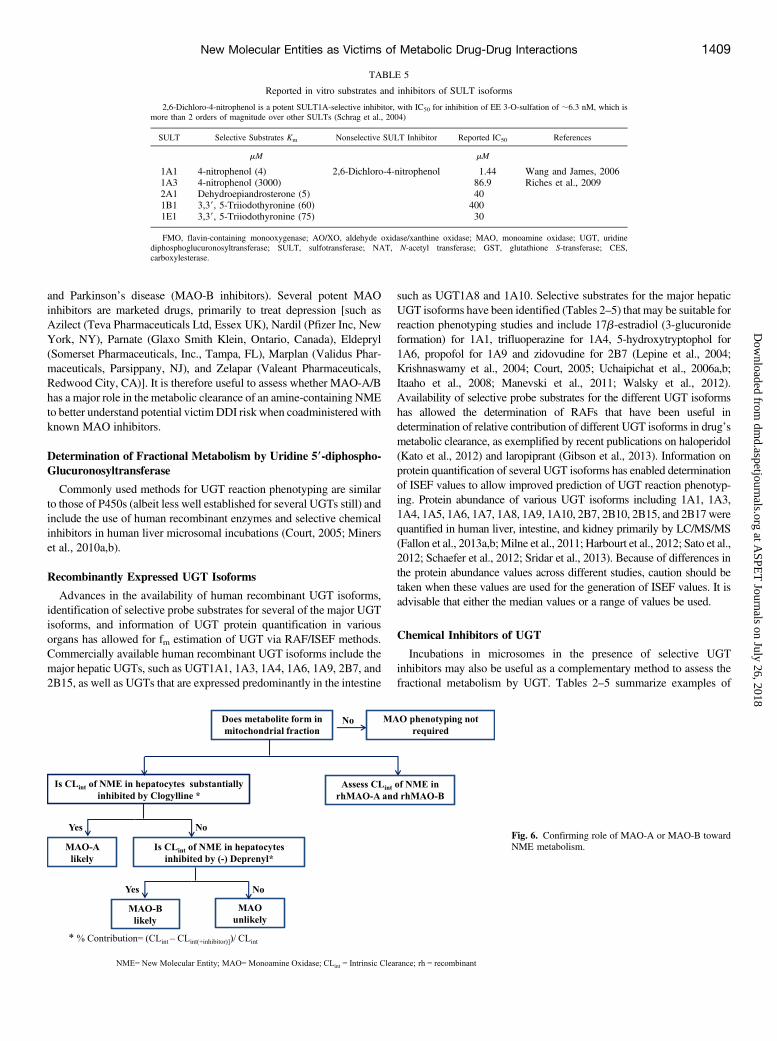
When a NME contains a primary, secondary, or tertiary amine,evaluation of the NME as a substrate ofMAO-A orMAO-B is importantfor victim DDI risk assessment, especially if the NME is intended to beused concomitantly with MAO inhibitors in the clinic. The livermitochondrial fraction where MAO activity is the highest may be usedas an appropriate system to evaluate the contribution of MAO-A orMAO-B. The overall strategy to identify MAO-A or MAO-B is outlinedin Fig. 6. When a basic amine-containing NME exhibits NADPH-independent metabolism in a mitochondrial fraction, it is warranted tofurther evaluate its metabolism in recombinant MAO-A and MAO-B(both are commercially available). If no metabolism is observed in eitherof the recombinantMAO isoforms, the probability ofMAO involvement islow and no further evaluation is warranted.MAO-A preferentially oxidizesserotonin and is inhibited by low concentrations of clorgyline (Tables 2–5),whereas MAO-B preferentially oxidizes b-phenylethylamine and isinhibited by low concentrations of (2)deprenyl (Kalgutkar and Castagnoli,1995; Geha et al., 2001; Youdim et al., 2006). Therefore the relative
contribution of MAO-A and MAO-B toward the overall oxidativemetabolism of a NME may theoretically be assessed in hepatocytes usingthese isoform-selective inhibitors. However, use of chemical inhibition toassess contribution of MAO-A and MAO-B is not routinely done amongcompanies, and literature cases of this approach are rare (Erickson et al.,2007). A RAF approach similar to that for P450s has been reported (Pybuset al., 2012) to evaluate the relative contribution of MAOs toward overallNMEmetabolism. But because the presence ofMAO inmicrosomes is dueto contamination during preparation, levels of MAO vary significantlybetween microsomal lots and microsomes are not recommended for MAOfm determination, thereby limiting the utility of this approach.MAO enzymes play a vital role in the inactivation of neurotransmit-
ters (serotonin, noradrenaline, epinephrine, norepinephrine, dopamine),and a number of psychiatric and neurologic disorders are attributed toMAO dysfunction. MAO inhibitors are one of the major classes of drugsprescribed for the treatment of depression and anxiety (MAO-Ainhibitors) and are used alone or in combination to treat Alzheimer’s
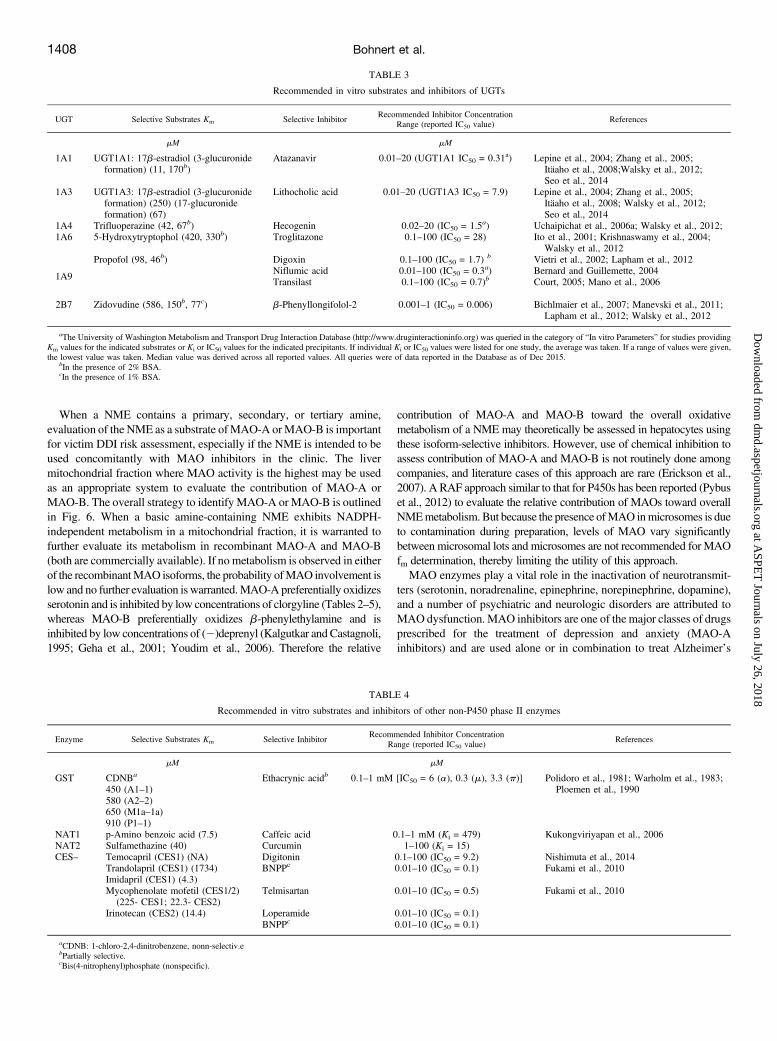
TABLE 3
Recommended in vitro substrates and inhibitors of UGTs
UGT Selective Substrates Km Selective InhibitorRecommended Inhibitor Concentration
Range (reported IC50 value)References
mM mM
1A1 UGT1A1: 17b-estradiol (3-glucuronideformation) (11, 170b)
Atazanavir 0.01–20 (UGT1A1 IC50 = 0.31a) Lepine et al., 2004; Zhang et al., 2005;Itäaho et al., 2008;Walsky et al., 2012;Seo et al., 2014
1A3 UGT1A3: 17b-estradiol (3-glucuronideformation) (250) (17-glucuronideformation) (67)
Lithocholic acid 0.01–20 (UGT1A3 IC50 = 7.9) Lepine et al., 2004; Zhang et al., 2005;Itäaho et al., 2008; Walsky et al., 2012;Seo et al., 2014
1A4 Trifluoperazine (42, 67b) Hecogenin 0.02–20 (IC50 = 1.5a) Uchaipichat et al., 2006a; Walsky et al., 2012;1A6 5-Hydroxytryptophol (420, 330b) Troglitazone 0.1–100 (IC50 = 28) Ito et al., 2001; Krishnaswamy et al., 2004;
Walsky et al., 2012
1A9
Propofol (98, 46b) Digoxin 0.1–100 (IC50 = 1.7) b Vietri et al., 2002; Lapham et al., 2012Niflumic acid 0.01–100 (IC50 = 0.3a) Bernard and Guillemette, 2004Transilast 0.1–100 (IC50 = 0.7)b Court, 2005; Mano et al., 2006
2B7 Zidovudine (586, 150b, 77c) b-Phenyllongifolol-2 0.001–1 (IC50 = 0.006) Bichlmaier et al., 2007; Manevski et al., 2011;Lapham et al., 2012; Walsky et al., 2012
aThe University of Washington Metabolism and Transport Drug Interaction Database (http://www.druginteractioninfo.org) was queried in the category of “In vitro Parameters” for studies providingKm values for the indicated substrates or Ki or IC50 values for the indicated precipitants. If individual Ki or IC50 values were listed for one study, the average was taken. If a range of values were given,the lowest value was taken. Median value was derived across all reported values. All queries were of data reported in the Database as of Dec 2015.
bIn the presence of 2% BSA.cIn the presence of 1% BSA.
TABLE 4
Recommended in vitro substrates and inhibitors of other non-P450 phase II enzymes
Enzyme Selective Substrates Km Selective InhibitorRecommended Inhibitor Concentration
Range (reported IC50 value)References
mM mM
GST CDNBa Ethacrynic acidb 0.1–1 mM [IC50 = 6 (a), 0.3 (m), 3.3 (p)] Polidoro et al., 1981; Warholm et al., 1983;Ploemen et al., 1990450 (A1–1)
580 (A2–2)650 (M1a–1a)910 (P1–1)
NAT1 p-Amino benzoic acid (7.5) Caffeic acid 0.1–1 mM (Ki = 479) Kukongviriyapan et al., 2006NAT2 Sulfamethazine (40) Curcumin 1–100 (Ki = 15)CES– Temocapril (CES1) (NA) Digitonin 0.1–100 (IC50 = 9.2) Nishimuta et al., 2014
Trandolapril (CES1) (1734) BNPPc 0.01–10 (IC50 = 0.1) Fukami et al., 2010Imidapril (CES1) (4.3)Mycophenolate mofetil (CES1/2)
(225- CES1; 22.3- CES2)Telmisartan 0.01–10 (IC50 = 0.5) Fukami et al., 2010
Irinotecan (CES2) (14.4) Loperamide 0.01–10 (IC50 = 0.1)BNPPc 0.01–10 (IC50 = 0.1)
aCDNB: 1-chloro-2,4-dinitrobenzene, nonn-selectiv.ebPartially selective.cBis(4-nitrophenyl)phosphate (nonspecific).
1408 Bohnert et al.
at ASPE
T Journals on July 26, 2018
dmd.aspetjournals.org
Dow
nloaded from
and Parkinson’s disease (MAO-B inhibitors). Several potent MAOinhibitors are marketed drugs, primarily to treat depression [such asAzilect (Teva Pharmaceuticals Ltd, Essex UK), Nardil (Pfizer Inc, NewYork, NY), Parnate (Glaxo Smith Klein, Ontario, Canada), Eldepryl(Somerset Pharmaceuticals, Inc., Tampa, FL), Marplan (Validus Phar-maceuticals, Parsippany, NJ), and Zelapar (Valeant Pharmaceuticals,Redwood City, CA)]. It is therefore useful to assess whether MAO-A/Bhas a major role in the metabolic clearance of an amine-containing NMEto better understand potential victim DDI risk when coadministered withknown MAO inhibitors.
Determination of Fractional Metabolism by Uridine 59-diphospho-Glucuronosyltransferase
Commonly used methods for UGT reaction phenotyping are similarto those of P450s (albeit less well established for several UGTs still) andinclude the use of human recombinant enzymes and selective chemicalinhibitors in human liver microsomal incubations (Court, 2005; Minerset al., 2010a,b).
Recombinantly Expressed UGT Isoforms
Advances in the availability of human recombinant UGT isoforms,identification of selective probe substrates for several of the major UGTisoforms, and information of UGT protein quantification in variousorgans has allowed for fm estimation of UGT via RAF/ISEF methods.Commercially available human recombinant UGT isoforms include themajor hepatic UGTs, such as UGT1A1, 1A3, 1A4, 1A6, 1A9, 2B7, and2B15, as well as UGTs that are expressed predominantly in the intestine
such as UGT1A8 and 1A10. Selective substrates for the major hepaticUGT isoforms have been identified (Tables 2–5) that may be suitable forreaction phenotyping studies and include 17b-estradiol (3-glucuronideformation) for 1A1, trifluoperazine for 1A4, 5-hydroxytryptophol for1A6, propofol for 1A9 and zidovudine for 2B7 (Lepine et al., 2004;Krishnaswamy et al., 2004; Court, 2005; Uchaipichat et al., 2006a,b;Itaaho et al., 2008; Manevski et al., 2011; Walsky et al., 2012).Availability of selective probe substrates for the different UGT isoformshas allowed the determination of RAFs that have been useful indetermination of relative contribution of different UGT isoforms in drug’smetabolic clearance, as exemplified by recent publications on haloperidol(Kato et al., 2012) and laropiprant (Gibson et al., 2013). Information onprotein quantification of several UGT isoforms has enabled determinationof ISEF values to allow improved prediction of UGT reaction phenotyp-ing. Protein abundance of various UGT isoforms including 1A1, 1A3,1A4, 1A5, 1A6, 1A7, 1A8, 1A9, 1A10, 2B7, 2B10, 2B15, and 2B17werequantified in human liver, intestine, and kidney primarily by LC/MS/MS(Fallon et al., 2013a,b; Milne et al., 2011; Harbourt et al., 2012; Sato et al.,2012; Schaefer et al., 2012; Sridar et al., 2013). Because of differences inthe protein abundance values across different studies, caution should betaken when these values are used for the generation of ISEF values. It isadvisable that either the median values or a range of values be used.
Chemical Inhibitors of UGT
Incubations in microsomes in the presence of selective UGTinhibitors may also be useful as a complementary method to assess thefractional metabolism by UGT. Tables 2–5 summarize examples of
TABLE 5
Reported in vitro substrates and inhibitors of SULT isoforms
2,6-Dichloro-4-nitrophenol is a potent SULT1A-selective inhibitor, with IC50 for inhibition of EE 3-O-sulfation of ;6.3 nM, which ismore than 2 orders of magnitude over other SULTs (Schrag et al., 2004)
SULT Selective Substrates Km Nonselective SULT Inhibitor Reported IC50 References
mM mM
1A1 4-nitrophenol (4) 2,6-Dichloro-4-nitrophenol 1.44 Wang and James, 20061A3 4-nitrophenol (3000) 86.9 Riches et al., 20092A1 Dehydroepiandrosterone (5) 401B1 3,39, 5-Triiodothyronine (60) 4001E1 3,39, 5-Triiodothyronine (75) 30
FMO, flavin-containing monooxygenase; AO/XO, aldehyde oxidase/xanthine oxidase; MAO, monoamine oxidase; UGT, uridinediphosphoglucuronosyltransferase; SULT, sulfotransferase; NAT, N-acetyl transferase; GST, glutathione S-transferase; CES,carboxylesterase.
Fig. 6. Confirming role of MAO-A or MAO-B towardNME metabolism.
New Molecular Entities as Victims of Metabolic Drug-Drug Interactions 1409
at ASPE
T Journals on July 26, 2018
dmd.aspetjournals.org
Dow
nloaded from
proposed selective substrates and inhibitors of five major hepatic UGTisoforms and recommended inhibitor concentrations relative to theirinhibition potency (IC50 values). Examples of selective inhibitors areatazanavir for UGT1A1/1A3 (Zhang et al., 2005); hecogenin for UGT1A4(Uchaipichat et al., 2006a,b;Walsky et al., 2012); troglitzone for UGT1A6(Ito et al., 2001), digoxin, transilast, and niflumic acid for UGT1A9 (Vietriet al., 2002; Lapham et al., 2012); and b-phenyllongifolol-2 for 2B7(Bichlmaier et al., 2007). Careful optimization of experimental conditions(Court, 2014; Zhou and Miners, 2014) (also more in SupplementalMaterials) should be done for the selection of suitable inhibitor concen-trations, e.g., when considering the presence of BSA, in particular forUGT1A9 and 2B7 reactions. These methods have not been wellestablished yet for several other UGT isoforms. As with any chemicalinhibitor (described in Determining Fractional Metabolism by P450: P450Reaction Phenotyping), chemical inhibitors of UGT are rarely absolutelyspecific at higher concentrations used for phenotyping studies. It istherefore warranted to carefully assess and account for cross-reactivitywhen using chemical inhibitors. Additional tools appropriate for in vitroreaction phenotyping for an extended number of UGT enzymesconsidered to be important in drug metabolism need to be developed.The use of selective inhibitors in liver microsomal incubations
together with commercially available recombinant human UGT iso-forms, selective probe substrates, and protein abundance information inintestine, liver, and kidney for some of the major UGT isoforms has ledto the emergence of a more semiquantitative approach toward de-termination of the contribution of these UGT isoforms to overall drugclearance. However, current tools only allow quantitative scaling forlimited UGT isoforms (UGT1A1, 1A6, 1A9, and 2B7), because this arearemains an area of active growth. For drugs metabolized by both P450and UGT, incubations in human liver, kidney, and intestinal microsomestogether with P450 and UGT cofactors in the presence of BSA toimprove fm,CYP and fm,UGT prediction have been proposed and is also anemerging area (Cubitt et al., 2011) (Supplemental Materials). IVIVCanalyses (Miners et al., 2006) (Supplemental Materials) of limiteddataset of UGT-mediated drugs suggest mixed success in the predictionof total UGT-mediated whole body clearance of drugs. Under-predictionswere observed in cases like zidovudine and morphine, whereas reason-able success was demonstrated for drugs like laropiprant (Gibson et al.,2013), where inclusion of BSAwas suggested to improve the predictions.Low incidence of UGT-mediated DDI in the clinic has also made itchallenging to extrapolate in vitro fm,UGT values to those in the clinic.Analysis of limited cases of UGT-mediated DDIs as in lamotrigine-valproic acid (Rowland et al., 2006), zidovudine-fluconazole (Uchaipichatet al., 2006b), zidovudine-vaproic acid interactions also suggest improve-ment in predictions of DDI magnitude with addition of BSA. Additionof BSA to improve predictions of UGT-mediated clearance and fordetermining fm,UGT has not been standardized across companies andcontinues to be an area of further research.
Relative Contribution of Glutathione-S-Transferases
Fractional metabolism by GSTmay be assessed by intrinsic clearancein hepatocytes or human liver S9 fractions fortified with reducedglutathione (GSH). GST-mediated metabolismmay also be qualitativelyassessed by determining intrinsic clearance in the presence of GSHversus intrinsic clearance in cytosol in the presence of other cofactorsthat may be needed for other known or suspected pathways ofmetabolism (e.g., NADPH for P450-mediated oxidation or uridinediphosphoglucuronic acid for UGT). Intrinsic nonenzymatic reactivityof NME with GSH in buffer needs to be determined and factored inwhile establishing GST-mediated metabolism. Inhibitors such as etha-crynic acid may be used to confirm the involvement of GST isoforms(Ahokas et al., 1985; Ploemen et al., 1990), although sufficiently
selective inhibitors for the different GST enzymes are needed to conducteffectively reaction phenotyping in subcellular or cellular systems.Human recombinant GST isoforms such as GSTA1, A2,M1, M2, P1,
and T1 are available commercially and may be used to assess thequalitative contribution of the different GST isoforms in GSHconjugation. However, tissue abundance of various GST isoforms(including different GST genotypes) and GST isoform-selectivesubstrates (Ginsberg et al., 2009) need to be further evaluated todevelop scaling factors for reaction phenotyping using human recombi-nant GST isoforms.Because of the expression of many GST isoforms in extrahepatic
tissues (e.g., GSTP1 in erythrocytes) (Awasthi et al., 1994; Whalen andBoyer, 1998), in vitro-in vivo extrapolation of human clearance needsto take into consideration the contribution from extrahepatic organs(including blood). In vitro-in vivo extrapolation of GST-mediatedmetabolic clearance remains to be established, and hence data from invitro experiments should be interpreted with caution when assessingoverall metabolic clearance by GST. There are no reported metabolism-based DDIs via GST of which this working group is aware.
Estimating Relative Contribution of Sulfotransferases
Sulfotransferases (SULTs) are cytosolic enzymes that transfer asulfonate group from 39-phosphoadenosine-59-phosphosulfate to a drugmolecule, thereby making it more polar and readily excreted mostly inurine (Parkinson and Ogilvie, 2007). In addition to biotransformation ofmany endogenous substrates such as cholesterol, dehydroepoandro-strerone, or estradiol and other estrogens, several hepatic SULTs areresponsible for biotransformation of xenobiotics. These SULTs includeSULT1A1, SULT1A2, and SULT2A1. Phenols and aliphatic alcoholsare the major sites of sulfation on drug molecules. Other sites suchas aromatic amines and primary amines can also undergo sulfation.However, unlike glucuronidation, sulfation usually does not occur oncarboxylic acids. SULT andUGT often share similar substrate properties,such as conjugation on phenol groups. However, SULT is an easilysaturable, high-affinity low-capacity enzyme class, whereas UGT is alow-affinity high-capacity enzyme class (Parkinson and Ogilvie 2007),due to which UGTs are often the predominant enzymes if phase 2conjugation is the major metabolic pathway. In vitro studies need to bedesigned carefully to elucidate the sulfation pathway, because sulfation iseasily saturated at low concentrations (Li et al., 1999; James, 2014).Relative contribution by SULT for a given compound can be done
using recombinant SULT isoforms to determine the intrinsic clear-ance value of a NME. The abundance of SULT isoforms in humanliver, kidney, intestine, and lung has been reported using Western blotquantification (Riches et al., 2009) (Table 5), although the currentliterature is limited. The intrinsic clearance values in theory can benormalized by the reported relative abundance of SULT in humantissues (e.g., ng SULT/g cytosol) to obtain the relative contributionsof each SULT toward the total clearance (assumption is that relativeabundance of various SULT isoforms determined by Western blot isreflective of relative activity). 2,6-Dichloro-4-nitrophenol has beenreported to inhibit various SULTs with varying potency (Wang andJames, 2006). By using a combination of rhSULT and inhibition by2,6-dichloro-4-nitrophenol (Tables 2–5) one can study the relativecontribution of SULT isoforms in liver S9, cytosol, or hepatocytes.Improved predictions of fm,SULT using hepatic and intestinal scalingfactors are also emerging (Gertz et al., 2011) and will be an area ofcontinued research to see whether additional incorporation of fm,SULT
will also refine predictions of fm,CYP and fm,UGT for NMEs thatare metabolized by all the three enzymes (e.g., troglitazone). Thisworking group is not aware of any reported cases of metabolic DDIsvia SULT.
1410 Bohnert et al.
at ASPE
T Journals on July 26, 2018
dmd.aspetjournals.org
Dow
nloaded from
Identifying Role of N-acetyltransferases NAT1 and NAT2
The N-acetyltransferases (NATs) are an important family of metab-olizing enzymes that catalyze direct conjugation of aryl and alkyl aminecompounds such as hydrazine with the acetyl group of acetyl-CoA (Simet al., 2008b). These cytosolic enzymes have been shown to be importantin arylamine-containing drug detoxification and carcinogen activationand are present in liver, esophagus, stomach, small intestine, colon,ureter, bladder, and lung (Windmill et al., 2000). In humans, there aretwo functional NAT genes encoding two isoenzymes, NAT1 andNAT2.A genetic polymorphism at the NAT2 gene locus encoding forpolymorphic NAT2 results in individuals with rapid, intermediate, orslow acetylator phenotypes (Sim et al., 2008a). NAT1, which alsometabolizes a variety of arylamines including p-amino benzoic acid butnot isoniazid, is also polymorphic, although the clinical effect of NAT1polymorphism is less well defined compared with NAT2 polymor-phisms. NAT polymorphism leads to different rates of inactivation ofdrugs, such as isoniazid, hydralazine, and sulfonamides, which undergoNAT-mediated metabolism.NAT1 and NAT2 have distinct substrate specificities (Wu et al.,
2007): NAT2 acetylates hydralazine, isoniazid, and sulfamethazine,whereas human NAT1 acetylates sulfamethoxazole, p-aminosalicylate,and p-aminobenzoylglutamate (folate catabolite). Human NAT2 ismainly in the liver and gut, whereas human NAT1 is expressed in manytissues (Windmill et al., 2000). Caffeic acid (Tables 2–5), ferulic acid,and gallic acid have been shown to selectively inhibit NAT1, whereasscopuletin and curcumin (Tables 2–5) have been shown to selectivelyinhibit NAT2 (Kukongviriyapan et al., 2006).Once involvement of NAT1 or NAT2 is confirmed using recombinant
NAT1 or NAT2, the relative contribution of NAT1 or NAT2 may beassessed in human hepatocytes, using selective chemical inhibitors, asoutlined in Fig. 7. A RAF-type approach, using NAT1 or NAT2 probesubstrates in commercially available NAT1 and NAT2 (fortified withcofactors acetyl-CoA and an acetyl-CoA regenerating system composedof acetyl-dl-carnitine and carnitine acetyltransferase) system can theo-retically be scaled to total metabolism in human hepatocytes. However,such scaling approaches are not well established and should beinterpreted with caution.Because only a few drugs have N-acetylation as the major metabolic
clearance pathway, documented incidences of NAT-mediated DDI arerare. However, potential inhibitions of NAT activity were reported bygypenosides, cisplatin, and nitrosoarene metabolites of carcinogenicarylamines (Chiu et al., 2004; Ragunathan et al., 2008; Liu et al., 2008).When NAT is identified to be the primary enzyme responsible for themetabolic clearance of a NME, it is advisable to assess the contributionsof the NAT and isoforms using currently available tools.
Determining Relative Role of Carboxylesterase CES1 and CES2
Carboxyesterase (CES) enzymes are serine esterases responsible forthe hydrolysis of esters, amides, thioesters, and carbamates (Laizure et al.,2013). In humans, the two major carboxyesterases known are humancarboxyesterase-1 and human carboxyesterase-2. CES1 is primarilyexpressed in the liver, where it plays an important role in the metabolismof many prescribed medications including clopidogrel (Kazui et al., 2010;Hagihara et al., 2009) and methylphenidate (Nemoda et al., 2009). CES2is present predominately in the intestine, where it has been shown tohydrolyze anticancer prodrugs gemcitabine (Pratt et al., 2013), capecita-bine (Ribelles et al., 2008), and irinotecan. (Humerickhouse et al., 2000).During in vitro assessment if NADPH-independent metabolism is
observed with a NME exhibiting an ester or amide linkage, metabolismusing rhCES1 and rhCES2 (commercially available) should be investigated.If no metabolism is observed in the recombinant CES, the probability of
CES involvement is low and no further evaluation is warranted. If NMEmetabolism is observed in the recombinant CES system, furtherassessment can be conducted using subcellular fractions, e.g., humanliver (CES1 enriched, low CES2 levels) and intestinal (CES2 only)microsomal and/or S9 systems, in combination with specific substratesand inhibitors listed in Tables 2–5, to evaluate the relative contributionof CES to overall clearance (Zhu et al., 2009; Ross et al., 2012;Nishimuta et al., 2014; Shimizu et al., 2014). There are no known CES-mediated metabolic DDIs reported, making this enzyme class as apotentially low risk for causing metabolic DDIs.
Special Considerations: Low Turnover, Extrahepatic Metabolism,Inhibition of Parallel Metabolic Pathways
Approaches for the Determination of Metabolic Pathways forLow Clearance Compounds. The determination of fractional metab-olized in subcellular systems or in recombinant enzymes by metaboliteformation kinetics or substrate depletion approaches may becomeproblematic for compounds that exhibit very low intrinsic clearance.An example is ertugluflozin (PF-04971729), a selective inhibitor of thesodium-dependent glucose cotransporter 2. Reaction phenotyping studiesindicated that both P450 (CYP3A4/3A5) and non-P450 pathways(UGT1A9 and UGT2B7) are involved in the metabolism of thiscompound (Kalgutkar et al., 2011). However, quantitative assignmentof each of these pathways was not feasible because of low in vitro turnoverin hepatic microsomes and hepatocytes. Subsequent to the in vitroevaluation, human 14C-ADME study using 14C-ertugliflozin showed thatUGT was the major metabolic pathway, whereas P450 metabolism wasminor (Miao et al., 2013). In general, upon understanding the total pictureof metabolism from the 14C-ADME study, quantitative in vitro delineationof the enzymes responsible for metabolic clearance can be done bymeasuring the rates of metabolite formation using HPLC-MS withauthentic metabolite standards. Recently, approaches including thehepatocyte relay method (Di et al., 2013) and coculture models, such asHepatoPac or Hurel (Chan et al., 2013), have been evaluated and haveshown promising results to better determine CLint via increasing theamount of substrate depletion or metabolite formation. Although thesesystems have gained considerable popularity in generating metabolitesand determining intrinsic clearance of very low clearance compounds, theuse of these models for phenotyping studies is under development (Yanget al., 2016).With radiolabeled NME, when metabolites generated during a
microsomal incubation under linear kinetics are too low in quantity tobe quantified accurately by a radioactivity detector, a more sensitive LC/MS/MS method may provide an alternative for quantification. In earlydevelopment when synthesized metabolite standards are usually notavailable, a radioactive calibration approach (Yu et al., 2007; Yi andLuffer-Atlas, 2010) can be applied. In this approach, bioreactors(concentrated pool of enzymes) can be used to generate a sufficientamount of metabolites. Metabolites generated via this method usuallyfollow nonlinear kinetics. Also, because in the majority of the casesmetabolites are formed under supraphysiologic NME concentrations,they may not reflect the high-affinity low-capacity pathway predominantin vivo. The samples can be injected in parallel into a radioactivitydetector / LC/MS/MS system to determine the ratio of radioactivedisintegrations per minute and LC/MS/MS peak area for each metabolite,and a calibration ratio can then be calculated for each metabolite, as:
MetabolitepðDPMÞ ¼ LC=MS=MS peak area from kinetic incubationpDPM=peak area ratio from the bio-reactor incubation
Further calculation can be applied to obtain the absolute concentration ofa metabolite of interest by using parent drug as an additional calibration
New Molecular Entities as Victims of Metabolic Drug-Drug Interactions 1411
at ASPE
T Journals on July 26, 2018
dmd.aspetjournals.org
Dow
nloaded from
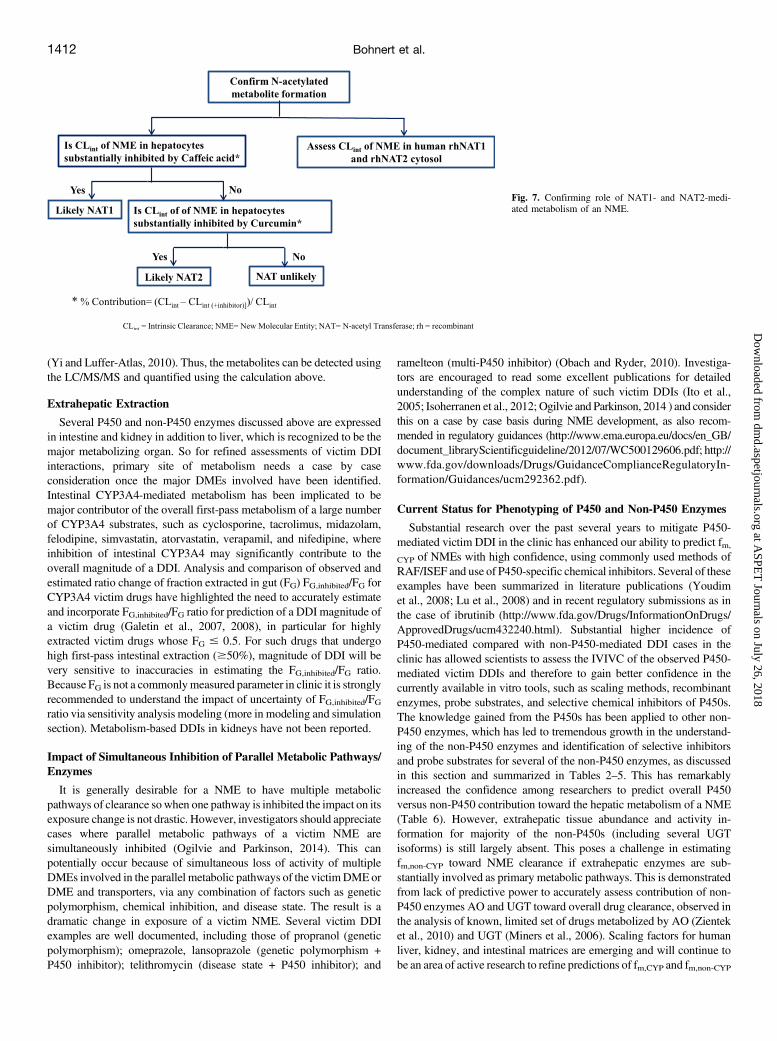
(Yi and Luffer-Atlas, 2010). Thus, the metabolites can be detected usingthe LC/MS/MS and quantified using the calculation above.
Extrahepatic Extraction
Several P450 and non-P450 enzymes discussed above are expressedin intestine and kidney in addition to liver, which is recognized to be themajor metabolizing organ. So for refined assessments of victim DDIinteractions, primary site of metabolism needs a case by caseconsideration once the major DMEs involved have been identified.Intestinal CYP3A4-mediated metabolism has been implicated to bemajor contributor of the overall first-pass metabolism of a large numberof CYP3A4 substrates, such as cyclosporine, tacrolimus, midazolam,felodipine, simvastatin, atorvastatin, verapamil, and nifedipine, whereinhibition of intestinal CYP3A4 may significantly contribute to theoverall magnitude of a DDI. Analysis and comparison of observed andestimated ratio change of fraction extracted in gut (FG) FG,inhibited/FG forCYP3A4 victim drugs have highlighted the need to accurately estimateand incorporate FG,inhibited/FG ratio for prediction of a DDI magnitude ofa victim drug (Galetin et al., 2007, 2008), in particular for highlyextracted victim drugs whose FG # 0.5. For such drugs that undergohigh first-pass intestinal extraction ($50%), magnitude of DDI will bevery sensitive to inaccuracies in estimating the FG,inhibited/FG ratio.Because FG is not a commonlymeasured parameter in clinic it is stronglyrecommended to understand the impact of uncertainty of FG,inhibited/FGratio via sensitivity analysis modeling (more in modeling and simulationsection). Metabolism-based DDIs in kidneys have not been reported.
Impact of Simultaneous Inhibition of Parallel Metabolic Pathways/Enzymes
It is generally desirable for a NME to have multiple metabolicpathways of clearance sowhen one pathway is inhibited the impact on itsexposure change is not drastic. However, investigators should appreciatecases where parallel metabolic pathways of a victim NME aresimultaneously inhibited (Ogilvie and Parkinson, 2014). This canpotentially occur because of simultaneous loss of activity of multipleDMEs involved in the parallel metabolic pathways of the victimDMEorDME and transporters, via any combination of factors such as geneticpolymorphism, chemical inhibition, and disease state. The result is adramatic change in exposure of a victim NME. Several victim DDIexamples are well documented, including those of propranol (geneticpolymorphism); omeprazole, lansoprazole (genetic polymorphism +P450 inhibitor); telithromycin (disease state + P450 inhibitor); and
ramelteon (multi-P450 inhibitor) (Obach and Ryder, 2010). Investiga-tors are encouraged to read some excellent publications for detailedunderstanding of the complex nature of such victim DDIs (Ito et al.,2005; Isoherranen et al., 2012; Ogilvie and Parkinson, 2014 ) and considerthis on a case by case basis during NME development, as also recom-mended in regulatory guidances (http://www.ema.europa.eu/docs/en_GB/document_libraryScientificguideline/2012/07/WC500129606.pdf; http://www.fda.gov/downloads/Drugs/GuidanceComplianceRegulatoryIn-formation/Guidances/ucm292362.pdf).
Current Status for Phenotyping of P450 and Non-P450 Enzymes
Substantial research over the past several years to mitigate P450-mediated victim DDI in the clinic has enhanced our ability to predict fm,
CYP of NMEs with high confidence, using commonly used methods ofRAF/ISEF and use of P450-specific chemical inhibitors. Several of theseexamples have been summarized in literature publications (Youdimet al., 2008; Lu et al., 2008) and in recent regulatory submissions as inthe case of ibrutinib (http://www.fda.gov/Drugs/InformationOnDrugs/ApprovedDrugs/ucm432240.html). Substantial higher incidence ofP450-mediated compared with non-P450-mediated DDI cases in theclinic has allowed scientists to assess the IVIVC of the observed P450-mediated victim DDIs and therefore to gain better confidence in thecurrently available in vitro tools, such as scaling methods, recombinantenzymes, probe substrates, and selective chemical inhibitors of P450s.The knowledge gained from the P450s has been applied to other non-P450 enzymes, which has led to tremendous growth in the understand-ing of the non-P450 enzymes and identification of selective inhibitorsand probe substrates for several of the non-P450 enzymes, as discussedin this section and summarized in Tables 2–5. This has remarkablyincreased the confidence among researchers to predict overall P450versus non-P450 contribution toward the hepatic metabolism of a NME(Table 6). However, extrahepatic tissue abundance and activity in-formation for majority of the non-P450s (including several UGTisoforms) is still largely absent. This poses a challenge in estimatingfm,non-CYP toward NME clearance if extrahepatic enzymes are sub-stantially involved as primary metabolic pathways. This is demonstratedfrom lack of predictive power to accurately assess contribution of non-P450 enzymes AO and UGT toward overall drug clearance, observed inthe analysis of known, limited set of drugs metabolized by AO (Zienteket al., 2010) and UGT (Miners et al., 2006). Scaling factors for humanliver, kidney, and intestinal matrices are emerging and will continue tobe an area of active research to refine predictions of fm,CYP and fm,non-CYP
Fig. 7. Confirming role of NAT1- and NAT2-medi-ated metabolism of an NME.
1412 Bohnert et al.
at ASPE
T Journals on July 26, 2018
dmd.aspetjournals.org
Dow
nloaded from
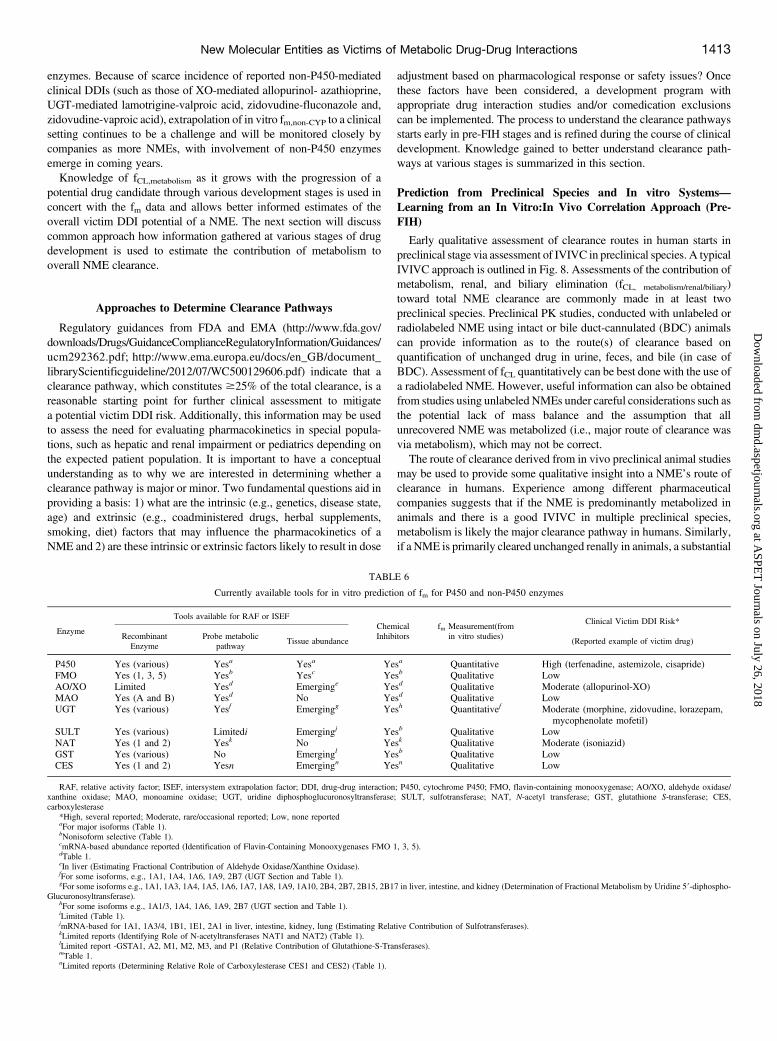
enzymes. Because of scarce incidence of reported non-P450-mediatedclinical DDIs (such as those of XO-mediated allopurinol- azathioprine,UGT-mediated lamotrigine-valproic acid, zidovudine-fluconazole and,zidovudine-vaproic acid), extrapolation of in vitro fm,non-CYP to a clinicalsetting continues to be a challenge and will be monitored closely bycompanies as more NMEs, with involvement of non-P450 enzymesemerge in coming years.Knowledge of fCL,metabolism as it grows with the progression of a
potential drug candidate through various development stages is used inconcert with the fm data and allows better informed estimates of theoverall victim DDI potential of a NME. The next section will discusscommon approach how information gathered at various stages of drugdevelopment is used to estimate the contribution of metabolism tooverall NME clearance.
Approaches to Determine Clearance Pathways
Regulatory guidances from FDA and EMA (http://www.fda.gov/downloads/Drugs/GuidanceComplianceRegulatoryInformation/Guidances/ucm292362.pdf; http://www.ema.europa.eu/docs/en_GB/document_libraryScientificguideline/2012/07/WC500129606.pdf) indicate that aclearance pathway, which constitutes $25% of the total clearance, is areasonable starting point for further clinical assessment to mitigatea potential victim DDI risk. Additionally, this information may be usedto assess the need for evaluating pharmacokinetics in special popula-tions, such as hepatic and renal impairment or pediatrics depending onthe expected patient population. It is important to have a conceptualunderstanding as to why we are interested in determining whether aclearance pathway is major or minor. Two fundamental questions aid inproviding a basis: 1) what are the intrinsic (e.g., genetics, disease state,age) and extrinsic (e.g., coadministered drugs, herbal supplements,smoking, diet) factors that may influence the pharmacokinetics of aNME and 2) are these intrinsic or extrinsic factors likely to result in dose
adjustment based on pharmacological response or safety issues? Oncethese factors have been considered, a development program withappropriate drug interaction studies and/or comedication exclusionscan be implemented. The process to understand the clearance pathwaysstarts early in pre-FIH stages and is refined during the course of clinicaldevelopment. Knowledge gained to better understand clearance path-ways at various stages is summarized in this section.
Prediction from Preclinical Species and In vitro Systems—Learning from an In Vitro:In Vivo Correlation Approach (Pre-FIH)
Early qualitative assessment of clearance routes in human starts inpreclinical stage via assessment of IVIVC in preclinical species. A typicalIVIVC approach is outlined in Fig. 8. Assessments of the contribution ofmetabolism, renal, and biliary elimination (fCL, metabolism/renal/biliary)toward total NME clearance are commonly made in at least twopreclinical species. Preclinical PK studies, conducted with unlabeled orradiolabeled NME using intact or bile duct-cannulated (BDC) animalscan provide information as to the route(s) of clearance based onquantification of unchanged drug in urine, feces, and bile (in case ofBDC). Assessment of fCL quantitatively can be best done with the use ofa radiolabeled NME. However, useful information can also be obtainedfrom studies using unlabeled NMEs under careful considerations such asthe potential lack of mass balance and the assumption that allunrecovered NME was metabolized (i.e., major route of clearance wasvia metabolism), which may not be correct.The route of clearance derived from in vivo preclinical animal studies
may be used to provide some qualitative insight into a NME’s route ofclearance in humans. Experience among different pharmaceuticalcompanies suggests that if the NME is predominantly metabolized inanimals and there is a good IVIVC in multiple preclinical species,metabolism is likely the major clearance pathway in humans. Similarly,if a NME is primarily cleared unchanged renally in animals, a substantial
TABLE 6
Currently available tools for in vitro prediction of fm for P450 and non-P450 enzymes
Enzyme
Tools available for RAF or ISEFChemicalInhibitors
fm Measurement(fromin vitro studies)
Clinical Victim DDI Risk*
RecombinantEnzyme
Probe metabolicpathway
Tissue abundance (Reported example of victim drug)
P450 Yes (various) Yesa Yesa Yesa Quantitative High (terfenadine, astemizole, cisapride)FMO Yes (1, 3, 5) Yesb Yesc Yesb Qualitative LowAO/XO Limited Yesd Emerginge Yesd Qualitative Moderate (allopurinol-XO)MAO Yes (A and B) Yesd No Yesd Qualitative LowUGT Yes (various) Yesf Emergingg Yesh Quantitativef Moderate (morphine, zidovudine, lorazepam,
mycophenolate mofetil)SULT Yes (various) Limitedi Emergingj Yesb Qualitative LowNAT Yes (1 and 2) Yesk No Yesk Qualitative Moderate (isoniazid)GST Yes (various) No Emergingl Yesb Qualitative LowCES Yes (1 and 2) Yesn Emergingn Yesn Qualitative Low
RAF, relative activity factor; ISEF, intersystem extrapolation factor; DDI, drug-drug interaction; P450, cytochrome P450; FMO, flavin-containing monooxygenase; AO/XO, aldehyde oxidase/xanthine oxidase; MAO, monoamine oxidase; UGT, uridine diphosphoglucuronosyltransferase; SULT, sulfotransferase; NAT, N-acetyl transferase; GST, glutathione S-transferase; CES,carboxylesterase
*High, several reported; Moderate, rare/occasional reported; Low, none reportedaFor major isoforms (Table 1).bNonisoform selective (Table 1).cmRNA-based abundance reported (Identification of Flavin-Containing Monooxygenases FMO 1, 3, 5).dTable 1.eIn liver (Estimating Fractional Contribution of Aldehyde Oxidase/Xanthine Oxidase).fFor some isoforms, e.g., 1A1, 1A4, 1A6, 1A9, 2B7 (UGT Section and Table 1).gFor some isoforms e.g., 1A1, 1A3, 1A4, 1A5, 1A6, 1A7, 1A8, 1A9, 1A10, 2B4, 2B7, 2B15, 2B17 in liver, intestine, and kidney (Determination of Fractional Metabolism by Uridine 59-diphospho-
Glucuronosyltransferase).hFor some isoforms e.g., 1A1/3, 1A4, 1A6, 1A9, 2B7 (UGT section and Table 1).iLimited (Table 1).jmRNA-based for 1A1, 1A3/4, 1B1, 1E1, 2A1 in liver, intestine, kidney, lung (Estimating Relative Contribution of Sulfotransferases).kLimited reports (Identifying Role of N-acetyltransferases NAT1 and NAT2) (Table 1).lLimited report -GSTA1, A2, M1, M2, M3, and P1 (Relative Contribution of Glutathione-S-Transferases).mTable 1.nLimited reports (Determining Relative Role of Carboxylesterase CES1 and CES2) (Table 1).
New Molecular Entities as Victims of Metabolic Drug-Drug Interactions 1413
at ASPE
T Journals on July 26, 2018
dmd.aspetjournals.org
Dow
nloaded from
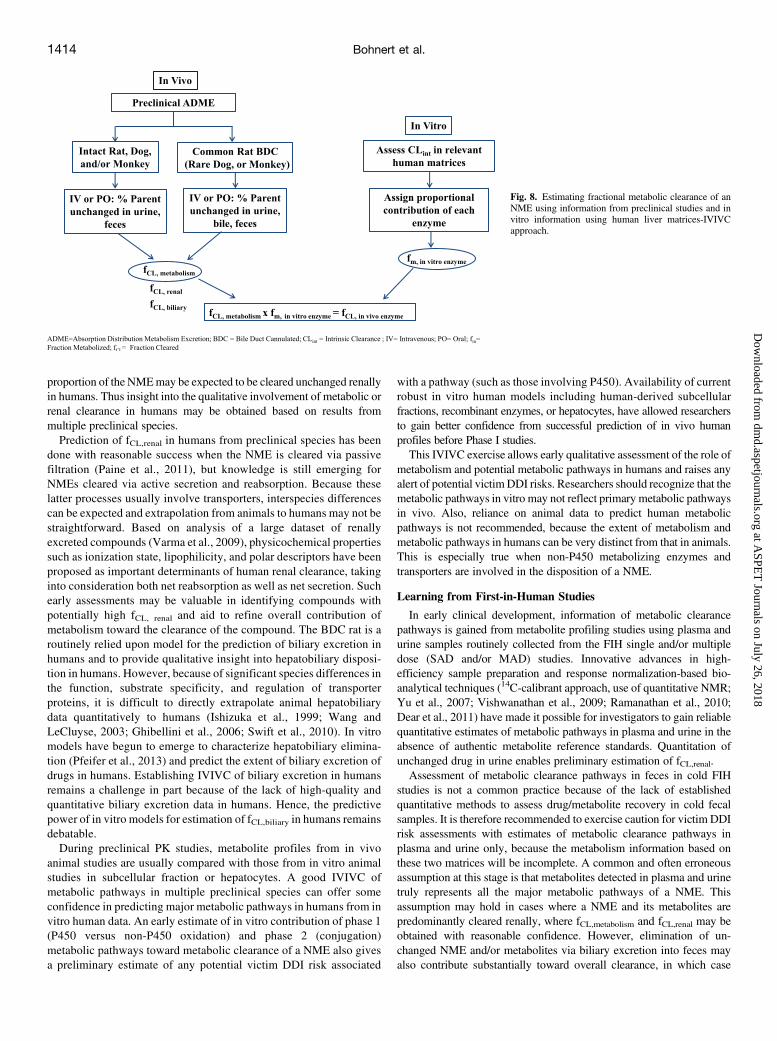
proportion of the NMEmay be expected to be cleared unchanged renallyin humans. Thus insight into the qualitative involvement of metabolic orrenal clearance in humans may be obtained based on results frommultiple preclinical species.Prediction of fCL,renal in humans from preclinical species has been
done with reasonable success when the NME is cleared via passivefiltration (Paine et al., 2011), but knowledge is still emerging forNMEs cleared via active secretion and reabsorption. Because theselatter processes usually involve transporters, interspecies differencescan be expected and extrapolation from animals to humans may not bestraightforward. Based on analysis of a large dataset of renallyexcreted compounds (Varma et al., 2009), physicochemical propertiessuch as ionization state, lipophilicity, and polar descriptors have beenproposed as important determinants of human renal clearance, takinginto consideration both net reabsorption as well as net secretion. Suchearly assessments may be valuable in identifying compounds withpotentially high fCL, renal and aid to refine overall contribution ofmetabolism toward the clearance of the compound. The BDC rat is aroutinely relied upon model for the prediction of biliary excretion inhumans and to provide qualitative insight into hepatobiliary disposi-tion in humans. However, because of significant species differences inthe function, substrate specificity, and regulation of transporterproteins, it is difficult to directly extrapolate animal hepatobiliarydata quantitatively to humans (Ishizuka et al., 1999; Wang andLeCluyse, 2003; Ghibellini et al., 2006; Swift et al., 2010). In vitromodels have begun to emerge to characterize hepatobiliary elimina-tion (Pfeifer et al., 2013) and predict the extent of biliary excretion ofdrugs in humans. Establishing IVIVC of biliary excretion in humansremains a challenge in part because of the lack of high-quality andquantitative biliary excretion data in humans. Hence, the predictivepower of in vitro models for estimation of fCL,biliary in humans remainsdebatable.During preclinical PK studies, metabolite profiles from in vivo
animal studies are usually compared with those from in vitro animalstudies in subcellular fraction or hepatocytes. A good IVIVC ofmetabolic pathways in multiple preclinical species can offer someconfidence in predicting major metabolic pathways in humans from invitro human data. An early estimate of in vitro contribution of phase 1(P450 versus non-P450 oxidation) and phase 2 (conjugation)metabolic pathways toward metabolic clearance of a NME also givesa preliminary estimate of any potential victim DDI risk associated
with a pathway (such as those involving P450). Availability of currentrobust in vitro human models including human-derived subcellularfractions, recombinant enzymes, or hepatocytes, have allowed researchersto gain better confidence from successful prediction of in vivo humanprofiles before Phase I studies.This IVIVC exercise allows early qualitative assessment of the role of
metabolism and potential metabolic pathways in humans and raises anyalert of potential victimDDI risks. Researchers should recognize that themetabolic pathways in vitro may not reflect primary metabolic pathwaysin vivo. Also, reliance on animal data to predict human metabolicpathways is not recommended, because the extent of metabolism andmetabolic pathways in humans can be very distinct from that in animals.This is especially true when non-P450 metabolizing enzymes andtransporters are involved in the disposition of a NME.
Learning from First-in-Human Studies
In early clinical development, information of metabolic clearancepathways is gained from metabolite profiling studies using plasma andurine samples routinely collected from the FIH single and/or multipledose (SAD and/or MAD) studies. Innovative advances in high-efficiency sample preparation and response normalization-based bio-analytical techniques (14C-calibrant approach, use of quantitative NMR;Yu et al., 2007; Vishwanathan et al., 2009; Ramanathan et al., 2010;Dear et al., 2011) have made it possible for investigators to gain reliablequantitative estimates of metabolic pathways in plasma and urine in theabsence of authentic metabolite reference standards. Quantitation ofunchanged drug in urine enables preliminary estimation of fCL,renal.Assessment of metabolic clearance pathways in feces in cold FIH
studies is not a common practice because of the lack of establishedquantitative methods to assess drug/metabolite recovery in cold fecalsamples. It is therefore recommended to exercise caution for victim DDIrisk assessments with estimates of metabolic clearance pathways inplasma and urine only, because the metabolism information based onthese two matrices will be incomplete. A common and often erroneousassumption at this stage is that metabolites detected in plasma and urinetruly represents all the major metabolic pathways of a NME. Thisassumption may hold in cases where a NME and its metabolites arepredominantly cleared renally, where fCL,metabolism and fCL,renal may beobtained with reasonable confidence. However, elimination of un-changed NME and/or metabolites via biliary excretion into feces mayalso contribute substantially toward overall clearance, in which case
Fig. 8. Estimating fractional metabolic clearance of anNME using information from preclinical studies and invitro information using human liver matrices-IVIVCapproach.
1414 Bohnert et al.
at ASPE
T Journals on July 26, 2018
dmd.aspetjournals.org
Dow
nloaded from
clearance pathway information derived from fecal samples will be animportant determinant of fCL and fm. Recent advances in clinical devicesas Entero-Test (Guiney et al., 2011; Bloomer et al., 2013) have enableddirect assessment of drugs and metabolites excreted into the bile ofhumans. This method can be applied in early clinical development toprovide qualitative information on the risk of interactions for drugsthat are metabolized and eliminated in bile. Increased conduct of14C-microtracer studies (trace 14C-NME administered as part of SADand MAD studies), coupled with accelerator mass spectrometry (AMS)detection (Lappin and Stevens, 2008) have also enabled investigators togain quantitative information of metabolic clearance pathways incirculation and in feces early in clinical development.Information gathered from early metabolite profiling in FIH studies is
valuable to get a first look into the major metabolic clearance pathwaysin plasma and urine and in certain cases bile (quantitative informationwhen 14C-microtracer studies have been incorporated into FIH studydesigns or qualitative when techniques such as Entero-Test have beenused). In addition, metabolite profiling in FIH studies can prove valuablein identifying primarymetabolic pathway in vivo that may not have beenpreviously identified in in vitro human models pre-FIH, although suchcases are of low incidence. With certain caveats as discussed above, theoverall learning from FIH study is helpful in refining victim DDI riskassessments made at pre-FIH stages.
Route of Clearance Determination in Human 14C-ADME Study
Human 14C-ADME study is deemed the gold standard in vivo studyto quantitatively determine routes of clearance and metabolicpathways of a NME (ensuring good mass balance is observed), whereunchanged drug and drug-derived metabolites are measured inplasma, urine, and feces. Data from the radiolabeled metaboliteprofiling in human are informative in the planning and design ofdefinitive in vitro reaction phenotyping and clinical DDI studiesrequired in support of a NME’s registration. When formation ofsecondary or tertiary metabolites is observed, it is assumed that theenzyme involved in the formation of the primary metabolite is of themost interest for DDIs (assuming a worst-case scenario).A caveat to consider in these studies is the difficulty sometimes in
interpretation of clearance pathways in feces based on metaboliteprofiles observed in fecal samples. Gut microflora can potentiallyconvert certain metabolites back to their parent (e.g., known forglucuronides and N-oxides). After an oral dose (dosing route formajority of drugs), unchanged NME detected in feces could be due to:1) either unabsorbed drug or hepatically formed metabolites excreted inbile and further metabolized to parent drug by gut microflora, or 2)absorbed drug excreted unchanged in bile via liver, or 3) intestinalsecretion of unchanged drug. Metabolites in feces, especially if observedat substantially higher levels in feces compared with lower/nonexistinglevels in circulation, may also indicate substantial metabolism viaintestinal enzymes. Potential contribution of intestinal and hepaticmetabolizing enzymes (and transporters) toward NME metabolismand excretion into feces versus unabsorbed drug component is importantto understand for victim DDI risk evaluation.Ideally the best estimate of fCL,biliary can be made after intravenous
dosing of a NME (radiolabeled or radiotracer) followed by determina-tion of unchanged NME in feces but intravenous 14C-ADME studies arenot routinely done (approximately 20% of 14C-ADME studies doneacross IQ companies were via intravenous route). Enhanced appreciationof information gathered from such studies has resulted in increasedconduct of microtracer intravenous 14C-ADME in recent years withprimary goals of providing better understanding absolute bioavailability/PK, mass balance, and routes of clearance. It should be noted thatintestinal secretion cannot be confidently determined even after an
intravenous dose because of the fact that quantitative, uninterrupted bilecollection from healthy humans is not possible.Investigators need to comprehensively understand the contribution of
metabolism toward the overall routes of clearance of a NME via carefulquantitative evaluation of metabolite profiles in plasma, urine, and feces.Understanding the site of formation of primary metabolites (e.g.,intestine, liver, or kidney) is crucial in evaluating metabolizing enzymesinvolved in the primary metabolic pathways and responsible forprecipitation of metabolic victim DDI.Incorporating robust in vitro fm data and fCL,metabolism information with
appropriate modeling and simulation may also provide better confidencein prediction of victim DDI liability in the clinic. Modeling andsimulation allows investigators to better assess dependence/sensitivity(i.e., the uncertainties in measurement of these parameters) of these keyvictim DDI parameters and their impact on clinical DDI timing and studydesign at different stages of drug development. The following sectionwillbriefly discuss various commonly used modeling approaches along withan explanation of their suitability in specific development phases basedon available data and specific questions of interest.
Application of Modeling and Simulation Tools in Victim NME DDIPredictions
Over the past 10 years, modeling and simulation approaches haveincreasingly been evaluated for their utility in predicting the magnitudeof DDIs, particularly those mediated by P450s, by pharmaceuticalcompanies and regulatory agencies. Results from these evaluations haveled to increased application of quantitative modeling and simulationapproaches, which has been attributed to an improved understanding ofthe factors that affect prediction accuracy and led to increasedconfidence in DDI prediction. Pharmaceutical companies have usedquantitative DDI predictions to impact decision making in drug devel-opment and support interactions with regulatory agencies. Regulatoryagencies recognize the value of DDI prediction using modeling andsimulation tools as highlighted by the recent FDA and EMA draftguidance documents (http://www.ema.europa.eu/docs/en_GB/docu-ment_libraryScientificguideline/2012/07/WC500129606.pdf; http://www.fda.gov/downloads/Drugs/GuidanceComplianceRegulatoryInfor-mation/Guidances/ucm292362.pdf).The most commonly used approaches for quantitative DDI prediction
include static concentration predictions and dynamic concentrationprediction by a more mechanistic physiologically based pharmacoki-netic (PBPK) modeling approaches. Numerous methodologies based onboth simplified and PBPK-based approaches have been well definedpreviously in the literature (Brown et al., 2006; Fahmi and Ripp, 2010;Peters et al., 2012). In all cases, model selection should be driven byspecific development questions and the extent of data available at thetime of model development. Briefly, available predictive models forvictim DDI prediction can be generally organized into three categories:simple static, mechanistic static, and mechanistic dynamic models(Supplemental Table 3S).
Simple Static Models
Static models are based on a single static perpetrator concentration. Inthe most simplified versions, fmCYP for victim drug is assumed to be 100%(worst case scenario). Numerous reference concentrations for perpetrator(total or unbound) have been proposed previously (Ito et al., 2004; Obachet al., 2007). Generally for the perpetrator, the total average concentrationat steady state, maximum concentration at steady state, or hepatic inletconcentration are recommended and used to predict victim drug interactionsin the liver using the static model (http://www.fda.gov/downloads/Drugs/GuidanceComplianceRegulatoryInformation/Guidances/ucm292362.pdf).
New Molecular Entities as Victims of Metabolic Drug-Drug Interactions 1415
at ASPE
T Journals on July 26, 2018
dmd.aspetjournals.org
Dow
nloaded from
Therefore, this approach often leads to overpredictions of victim DDIs(Ito et al., 2003). The static model can be a useful tool for early DDIrisk assessment when supporting data are limited (e.g., during earlydiscovery phase).
Mechanistic Static Models
Mechanistic static models incorporate more victim drug information,such as estimated fmCYP and impact of the DDI on both hepatic and gutmetabolism (Obach et al., 2006) or the integrated impact of competitiveor mechanism-based inhibition and induction (Fahmi et al., 2008). Themechanistic static model is often applied once in vivo victim drug dataare available, although this is not required (Table 7, example 6).
Mechanistic Dynamic Models
Mechanistic dynamic models including physiologically-based phar-macokinetic (PBPK) simulations incorporate the time-dependent changeof both perpetrator and victim drug concentrations over the time courseof the DDI. Therefore, this approach permits investigation of nonlinearkinetics and time-dependent phenomena, which include drug accumu-lation, additional impact due to the formation of inhibitory metabolite(s),and effect of dosing regimen. Commercial software packages areavailable that allow incorporation of literature data on human physiol-ogy, changes in special populations and disease states, and drug effectson physiologic rates [e.g., Simcyp (Certara), Phoenix (Certara),GastroPlus (Simulations Plus), PKSim (Bayer)]. PBPK modelingrequires the greatest degree of parameterization based on both in vitroand in vivo data. Key victim drug parameters required for PBPKmodel development include volume of distribution (Vdss) andclearance (CL) (Supplemental Table 4S). Although PBPK approachesmay be applied at the stage of discovery or development, it is mostpowerful in later stages when more data become available.
Model Application: “When and What”
Model selection must always be issue driven and based on particulardevelopment stage and available data. During early clinical development(i.e., clinical candidate selection), predictions are primarily used toimprove mechanistic understanding and support internal decisionmaking. At this stage the understanding of victim drug disposition ismainly based on preclinical and/or in vitro data, which are generallylimited. Applications of modeling at this stage include support ofprediction of clinical DDI risk, DDI study design, and victim drug doseselection (especially critical for a victim drug that has narrow safetywindow). In these situations a simplified model may be more suitable. Insituations where more definitive in vitro ADME data and Phase I clinicalPK data are available, PBPK simulation is applied. Retrospective modelsimulation of in vivo data can be used to estimate fm,CYP and the impactof alternative trial design on outcomes. In later stages of developmentwhen data from human mass-balance and DDI studies with a specificinhibitors (e.g., itraconazole for the inhibition of CYP3A4 for drugsmetabolized by this enzymatic pathway) become available, the model isfurther refined and used for simulation of victim DDIs with otherinhibitor(s) or inducer(s) of the same pathway, or inhibitors of a minormetabolic pathway, victim drug PK in special populations (e.g., hepaticor renal impaired), dose selection, influence labeling, or justifying ofwaivers for additional DDI studies.
Building Confidence in Model Predictions
Several approaches have been developed to build confidence in andensure mechanistic relevance of the simulation results, which will lead toincreased impact of modeling and simulation efforts. These approaches
include verification of assumptions, sensitivity analysis, and assessmentof variability. The level of model verification or validation will dependupon the stage of development and its impact on critical decision making.Verification of Assumptions. Although many model parameters
may be experimentally determined, assumptions must often be madeabout the translatability of in vitro data to in vivo DDI. Assumptionsmust always be evaluated, particularly in scenarios when complicateddisposition mechanisms are expected. Investigation of assumptions towhich the model is particularly sensitive may help explain disconnectsbetween in vitro data and in vivo DDI (e.g., complex DDI, poor IVIVE,lack of quantitative prediction of non-P450 and transporter pathways,nonlinear PK, inhibitory metabolites, altered PK in disease state).Sensitivity Analysis. Sensitivity analysis is often employed to assess
the mechanistic relevance of the model and to identify gaps in currentmechanistic understanding. In this approachmodel, parameters that havethe greatest impact on the simulation output are identified as requiringincreased scrutiny. Sensitivity analyses can lead to the design andexecution of additional supporting in vitro or in vivo studies. For victimdrug characterization, fm,CYPwill be especially important, and sensitivityanalysis on this parameter is strongly recommended. Consideration ofFG,inhibited/FG for NMEs that undergo substantial intestinal metabolism(e.g., CYP3A4- metabolized drugs such as midazolam, cyclosporine,tacrolimus, felodipine, simvastatin, atorvastatin, verapamil, and nifed-ipine) is important in DDI risk assessments. FG values are usually notdetermined but predicted via various available gut models incorporatedin commercial software such as Gastroplus and Simcyp. The Qgut model(Yang et al., 2007) is a simple and more commonly used model wherethe parameter fu,gut (fraction unbound in gut) is one of the keydeterminants of FG. Because fu,gut cannot be experimentally measuredin vitro or in vivo, sensitivity analysis of estimated fu,gut on exposurechange of a victim drug is often assessed and is strongly recommended.The sensitivity analysis may inform the impact of variability of theseparameters on predicted victim DDI with different perpetrators.Assessment of Variability. Variability in both observed and
simulated data are required to ensure the relevance of model outputs.An essential component of model verification is a comparison ofsimulated and observed variability around pharmacokinetic parametersof interest. Variability associated with fm,CYP of a victim drug couldresult in higher predicted PK and DDI variability between individuals,especially in the case of DDI prediction. Sources of variability includeintersubject differences in relative P450 abundance and, in the case ofsome isoforms, polymorphic gene expression.Case Examples. The utility of modeling and simulation in victim
DDI prediction is best illustrated through the presentation of caseexamples that highlight approaches used at various phases of drugdevelopment. Several case examples have been summarized (Table 7) toillustrate some of the questions typically addressed by modeling in thecourse of drug development. A typical case example has been describedin greater detail to demonstrate how to use and optimize predictivemodels. The data required to support model development, appropriateassumptions, and the manner in which these are combined to impactdevelopment programs are also discussed.Example 1: What is the DDI Risk for a Compound that is
Predominantly Metabolized by CYP3A4 in Vitro? An early devel-opment compound was found to be predominately metabolized byCYP3A4 in vitro. Based on preliminary preclinical metabolite identi-fication, a significant contribution of non-P450 (phase 2) metabolismwas suspected. This compound was highly cleared both in vitro and inpreclinical animal models. Before initiation of modeling, additional datawere requested, including in vitro phase 2 metabolism, in vitropermeability, human mass-balance information (fraction absorbed,elimination pathways), and in vitro phenotyping in human liver
1416 Bohnert et al.
at ASPE
T Journals on July 26, 2018
dmd.aspetjournals.org
Dow
nloaded from
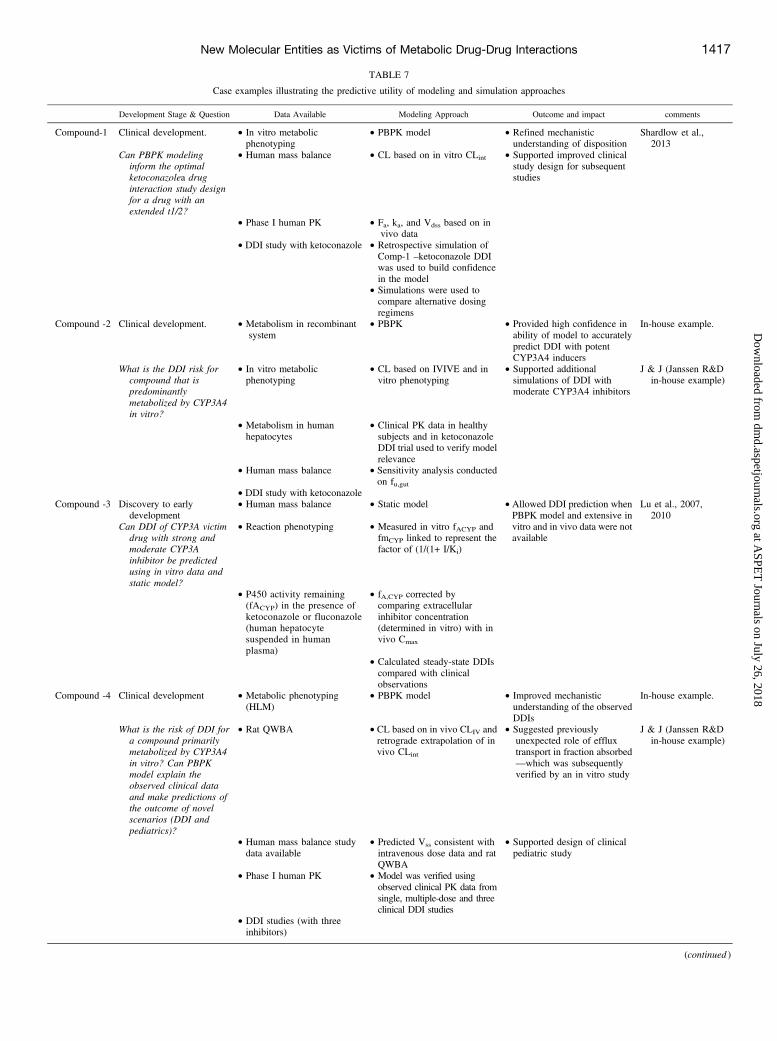
TABLE 7
Case examples illustrating the predictive utility of modeling and simulation approaches
Development Stage & Question Data Available Modeling Approach Outcome and impact comments
Compound-1 Clinical development. • In vitro metabolicphenotyping
• PBPK model • Refined mechanisticunderstanding of disposition
Shardlow et al.,2013
Can PBPK modelinginform the optimalketoconazolea druginteraction study designfor a drug with anextended t1/2?
• Human mass balance • CL based on in vitro CLint • Supported improved clinicalstudy design for subsequentstudies
• Phase I human PK • Fa, ka, and Vdss based on invivo data
• DDI study with ketoconazole • Retrospective simulation ofComp-1 –ketoconazole DDIwas used to build confidencein the model
• Simulations were used tocompare alternative dosingregimens
Compound -2 Clinical development. • Metabolism in recombinantsystem
• PBPK • Provided high confidence inability of model to accuratelypredict DDI with potentCYP3A4 inducers
In-house example.
What is the DDI risk forcompound that ispredominantlymetabolized by CYP3A4in vitro?
• In vitro metabolicphenotyping
• CL based on IVIVE and invitro phenotyping
• Supported additionalsimulations of DDI withmoderate CYP3A4 inhibitors
J & J (Janssen R&Din-house example)
• Metabolism in humanhepatocytes
• Clinical PK data in healthysubjects and in ketoconazoleDDI trial used to verify modelrelevance
• Human mass balance • Sensitivity analysis conductedon fu,gut
• DDI study with ketoconazoleCompound -3 Discovery to early
development• Human mass balance • Static model • Allowed DDI prediction when
PBPK model and extensive invitro and in vivo data were notavailable
Lu et al., 2007,2010
Can DDI of CYP3A victimdrug with strong andmoderate CYP3Ainhibitor be predictedusing in vitro data andstatic model?
• Reaction phenotyping • Measured in vitro fACYP andfmCYP linked to represent thefactor of (1/(1+ I/Ki)
• P450 activity remaining(fACYP) in the presence ofketoconazole or fluconazole(human hepatocytesuspended in humanplasma)
• fA,CYP corrected bycomparing extracellularinhibitor concentration(determined in vitro) with invivo Cmax
• Calculated steady-state DDIscompared with clinicalobservations
Compound -4 Clinical development • Metabolic phenotyping(HLM)
• PBPK model • Improved mechanisticunderstanding of the observedDDIs
In-house example.
What is the risk of DDI fora compound primarilymetabolized by CYP3A4in vitro? Can PBPKmodel explain theobserved clinical dataand make predictions ofthe outcome of novelscenarios (DDI andpediatrics)?
• Rat QWBA • CL based on in vivo CLIV andretrograde extrapolation of invivo CLint
• Suggested previouslyunexpected role of effluxtransport in fraction absorbed—which was subsequentlyverified by an in vitro study
J & J (Janssen R&Din-house example)
• Human mass balance studydata available
• Predicted Vss consistent withintravenous dose data and ratQWBA
• Supported design of clinicalpediatric study
• Phase I human PK • Model was verified usingobserved clinical PK data fromsingle, multiple-dose and threeclinical DDI studies
• DDI studies (with threeinhibitors)
(continued )
New Molecular Entities as Victims of Metabolic Drug-Drug Interactions 1417
at ASPE
T Journals on July 26, 2018
dmd.aspetjournals.org
Dow
nloaded from
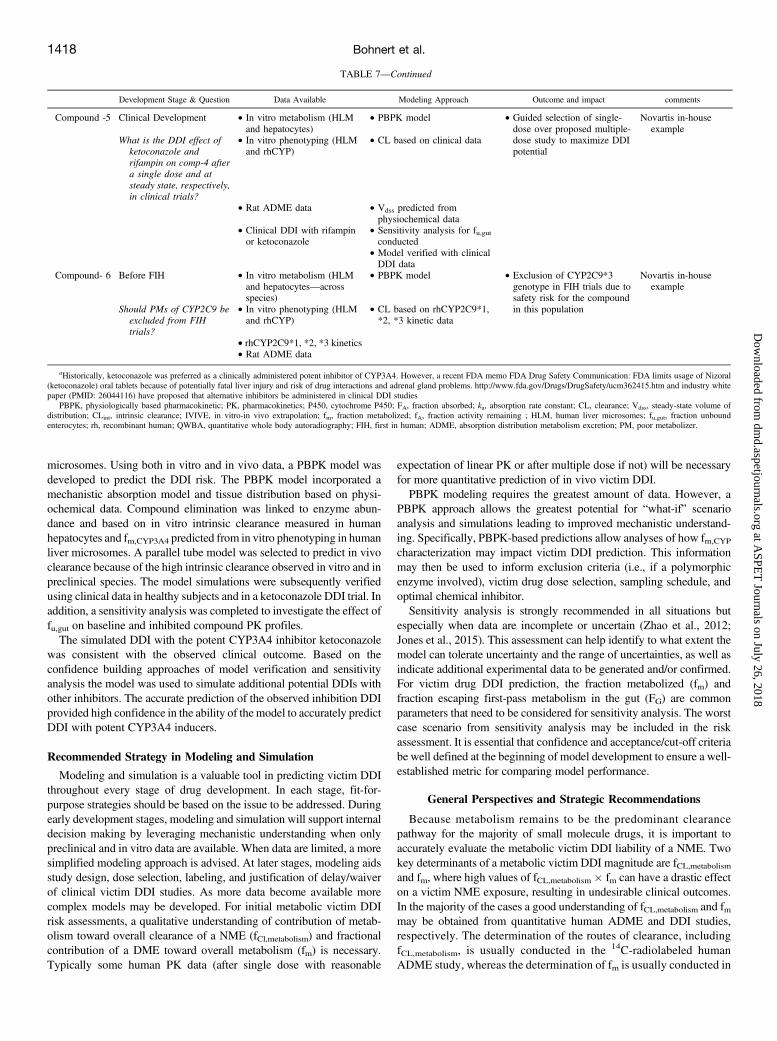
microsomes. Using both in vitro and in vivo data, a PBPK model wasdeveloped to predict the DDI risk. The PBPK model incorporated amechanistic absorption model and tissue distribution based on physi-ochemical data. Compound elimination was linked to enzyme abun-dance and based on in vitro intrinsic clearance measured in humanhepatocytes and fm,CYP3A4 predicted from in vitro phenotyping in humanliver microsomes. A parallel tube model was selected to predict in vivoclearance because of the high intrinsic clearance observed in vitro and inpreclinical species. The model simulations were subsequently verifiedusing clinical data in healthy subjects and in a ketoconazole DDI trial. Inaddition, a sensitivity analysis was completed to investigate the effect offu,gut on baseline and inhibited compound PK profiles.The simulated DDI with the potent CYP3A4 inhibitor ketoconazole
was consistent with the observed clinical outcome. Based on theconfidence building approaches of model verification and sensitivityanalysis the model was used to simulate additional potential DDIs withother inhibitors. The accurate prediction of the observed inhibition DDIprovided high confidence in the ability of themodel to accurately predictDDI with potent CYP3A4 inducers.
Recommended Strategy in Modeling and Simulation
Modeling and simulation is a valuable tool in predicting victim DDIthroughout every stage of drug development. In each stage, fit-for-purpose strategies should be based on the issue to be addressed. Duringearly development stages, modeling and simulation will support internaldecision making by leveraging mechanistic understanding when onlypreclinical and in vitro data are available. When data are limited, a moresimplified modeling approach is advised. At later stages, modeling aidsstudy design, dose selection, labeling, and justification of delay/waiverof clinical victim DDI studies. As more data become available morecomplex models may be developed. For initial metabolic victim DDIrisk assessments, a qualitative understanding of contribution of metab-olism toward overall clearance of a NME (fCl,metabolism) and fractionalcontribution of a DME toward overall metabolism (fm) is necessary.Typically some human PK data (after single dose with reasonable
expectation of linear PK or after multiple dose if not) will be necessaryfor more quantitative prediction of in vivo victim DDI.PBPK modeling requires the greatest amount of data. However, a
PBPK approach allows the greatest potential for “what-if” scenarioanalysis and simulations leading to improved mechanistic understand-ing. Specifically, PBPK-based predictions allow analyses of how fm,CYP
characterization may impact victim DDI prediction. This informationmay then be used to inform exclusion criteria (i.e., if a polymorphicenzyme involved), victim drug dose selection, sampling schedule, andoptimal chemical inhibitor.Sensitivity analysis is strongly recommended in all situations but
especially when data are incomplete or uncertain (Zhao et al., 2012;Jones et al., 2015). This assessment can help identify to what extent themodel can tolerate uncertainty and the range of uncertainties, as well asindicate additional experimental data to be generated and/or confirmed.For victim drug DDI prediction, the fraction metabolized (fm) andfraction escaping first-pass metabolism in the gut (FG) are commonparameters that need to be considered for sensitivity analysis. The worstcase scenario from sensitivity analysis may be included in the riskassessment. It is essential that confidence and acceptance/cut-off criteriabe well defined at the beginning of model development to ensure a well-established metric for comparing model performance.
General Perspectives and Strategic Recommendations
Because metabolism remains to be the predominant clearancepathway for the majority of small molecule drugs, it is important toaccurately evaluate the metabolic victim DDI liability of a NME. Twokey determinants of a metabolic victim DDI magnitude are fCL,metabolism
and fm, where high values of fCL,metabolism � fm can have a drastic effecton a victim NME exposure, resulting in undesirable clinical outcomes.In the majority of the cases a good understanding of fCL,metabolism and fmmay be obtained from quantitative human ADME and DDI studies,respectively. The determination of the routes of clearance, includingfCL,metabolism, is usually conducted in the 14C-radiolabeled humanADME study, whereas the determination of fm is usually conducted in
TABLE 7—Continued
Development Stage & Question Data Available Modeling Approach Outcome and impact comments
Compound -5 Clinical Development • In vitro metabolism (HLMand hepatocytes)
• PBPK model • Guided selection of single-dose over proposed multiple-dose study to maximize DDIpotential
Novartis in-houseexample
What is the DDI effect ofketoconazole andrifampin on comp-4 aftera single dose and atsteady state, respectively,in clinical trials?
• In vitro phenotyping (HLMand rhCYP)
• CL based on clinical data
• Rat ADME data • Vdss predicted fromphysiochemical data
• Clinical DDI with rifampinor ketoconazole
• Sensitivity analysis for fu,gutconducted
• Model verified with clinicalDDI data
Compound- 6 Before FIH • In vitro metabolism (HLMand hepatocytes—acrossspecies)
• PBPK model • Exclusion of CYP2C9*3genotype in FIH trials due tosafety risk for the compoundin this population
Novartis in-houseexample
Should PMs of CYP2C9 beexcluded from FIHtrials?
• In vitro phenotyping (HLMand rhCYP)
• CL based on rhCYP2C9*1,*2, *3 kinetic data
• rhCYP2C9*1, *2, *3 kinetics• Rat ADME data
aHistorically, ketoconazole was preferred as a clinically administered potent inhibitor of CYP3A4. However, a recent FDA memo FDA Drug Safety Communication: FDA limits usage of Nizoral(ketoconazole) oral tablets because of potentially fatal liver injury and risk of drug interactions and adrenal gland problems. http://www.fda.gov/Drugs/DrugSafety/ucm362415.htm and industry whitepaper (PMID: 26044116) have proposed that alternative inhibitors be administered in clinical DDI studies
PBPK, physiologically based pharmacokinetic; PK, pharmacokinetics; P450, cytochrome P450; FA, fraction absorbed; ka, absorption rate constant; CL, clearance; Vdss, steady-state volume ofdistribution; CLint, intrinsic clearance; IVIVE, in vitro-in vivo extrapolation; fm, fraction metabolized; fA, fraction activity remaining ; HLM, human liver microsomes; fu,gut, fraction unboundenterocytes; rh, recombinant human; QWBA, quantitative whole body autoradiography; FIH, first in human; ADME, absorption distribution metabolism excretion; PM, poor metabolizer.
1418 Bohnert et al.
at ASPE
T Journals on July 26, 2018
dmd.aspetjournals.org
Dow
nloaded from
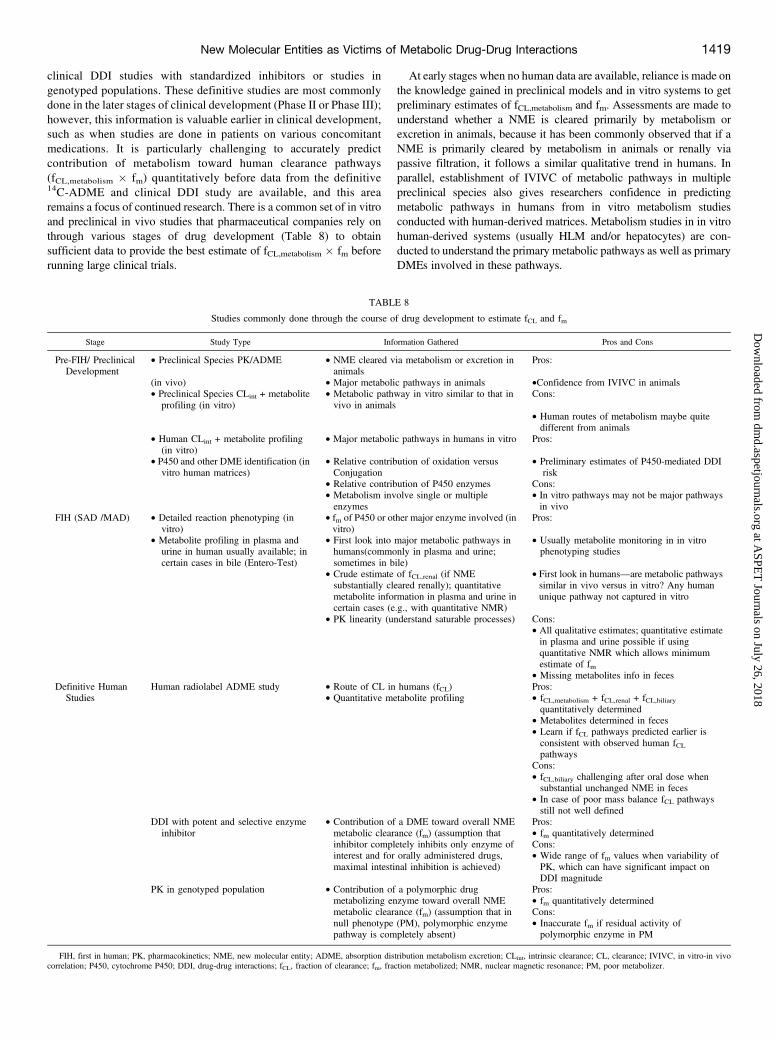
clinical DDI studies with standardized inhibitors or studies ingenotyped populations. These definitive studies are most commonlydone in the later stages of clinical development (Phase II or Phase III);however, this information is valuable earlier in clinical development,such as when studies are done in patients on various concomitantmedications. It is particularly challenging to accurately predictcontribution of metabolism toward human clearance pathways(fCL,metabolism � fm) quantitatively before data from the definitive14C-ADME and clinical DDI study are available, and this arearemains a focus of continued research. There is a common set of in vitroand preclinical in vivo studies that pharmaceutical companies rely onthrough various stages of drug development (Table 8) to obtainsufficient data to provide the best estimate of fCL,metabolism � fm beforerunning large clinical trials.
At early stages when no human data are available, reliance is made onthe knowledge gained in preclinical models and in vitro systems to getpreliminary estimates of fCL,metabolism and fm. Assessments are made tounderstand whether a NME is cleared primarily by metabolism orexcretion in animals, because it has been commonly observed that if aNME is primarily cleared by metabolism in animals or renally viapassive filtration, it follows a similar qualitative trend in humans. Inparallel, establishment of IVIVC of metabolic pathways in multiplepreclinical species also gives researchers confidence in predictingmetabolic pathways in humans from in vitro metabolism studiesconducted with human-derived matrices. Metabolism studies in in vitrohuman-derived systems (usually HLM and/or hepatocytes) are con-ducted to understand the primary metabolic pathways as well as primaryDMEs involved in these pathways.
TABLE 8
Studies commonly done through the course of drug development to estimate fCL and fm
Stage Study Type Information Gathered Pros and Cons
Pre-FIH/ PreclinicalDevelopment
• Preclinical Species PK/ADME • NME cleared via metabolism or excretion inanimals
Pros:
(in vivo) • Major metabolic pathways in animals •Confidence from IVIVC in animals• Preclinical Species CLint + metabolite
profiling (in vitro)• Metabolic pathway in vitro similar to that invivo in animals
Cons:
• Human routes of metabolism maybe quitedifferent from animals
• Human CLint + metabolite profiling(in vitro)
• Major metabolic pathways in humans in vitro Pros:
• P450 and other DME identification (invitro human matrices)
• Relative contribution of oxidation versusConjugation
• Preliminary estimates of P450-mediated DDIrisk
• Relative contribution of P450 enzymes Cons:• Metabolism involve single or multipleenzymes
• In vitro pathways may not be major pathwaysin vivo
FIH (SAD /MAD) • Detailed reaction phenotyping (invitro)
• fm of P450 or other major enzyme involved (invitro)
Pros:
• Metabolite profiling in plasma andurine in human usually available; incertain cases in bile (Entero-Test)
• First look into major metabolic pathways inhumans(commonly in plasma and urine;sometimes in bile)
• Usually metabolite monitoring in in vitrophenotyping studies
• Crude estimate of fCL,renal (if NMEsubstantially cleared renally); quantitativemetabolite information in plasma and urine incertain cases (e.g., with quantitative NMR)
• First look in humans—are metabolic pathwayssimilar in vivo versus in vitro? Any humanunique pathway not captured in vitro
• PK linearity (understand saturable processes) Cons:• All qualitative estimates; quantitative estimatein plasma and urine possible if usingquantitative NMR which allows minimumestimate of fm
• Missing metabolites info in fecesDefinitive Human
StudiesHuman radiolabel ADME study • Route of CL in humans (fCL) Pros:
• Quantitative metabolite profiling • fCL,metabolism + fCL,renal + fCL,biliaryquantitatively determined
• Metabolites determined in feces• Learn if fCL pathways predicted earlier isconsistent with observed human fCLpathways
Cons:• fCL,biliary challenging after oral dose whensubstantial unchanged NME in feces
• In case of poor mass balance fCL pathwaysstill not well defined
DDI with potent and selective enzymeinhibitor
• Contribution of a DME toward overall NMEmetabolic clearance (fm) (assumption thatinhibitor completely inhibits only enzyme ofinterest and for orally administered drugs,maximal intestinal inhibition is achieved)
Pros:• fm quantitatively determinedCons:• Wide range of fm values when variability ofPK, which can have significant impact onDDI magnitude
PK in genotyped population • Contribution of a polymorphic drugmetabolizing enzyme toward overall NMEmetabolic clearance (fm) (assumption that innull phenotype (PM), polymorphic enzymepathway is completely absent)
Pros:• fm quantitatively determinedCons:• Inaccurate fm if residual activity ofpolymorphic enzyme in PM
FIH, first in human; PK, pharmacokinetics; NME, new molecular entity; ADME, absorption distribution metabolism excretion; CLint, intrinsic clearance; CL, clearance; IVIVC, in vitro-in vivocorrelation; P450, cytochrome P450; DDI, drug-drug interactions; fCL, fraction of clearance; fm, fraction metabolized; NMR, nuclear magnetic resonance; PM, poor metabolizer.
New Molecular Entities as Victims of Metabolic Drug-Drug Interactions 1419
at ASPE
T Journals on July 26, 2018
dmd.aspetjournals.org
Dow
nloaded from
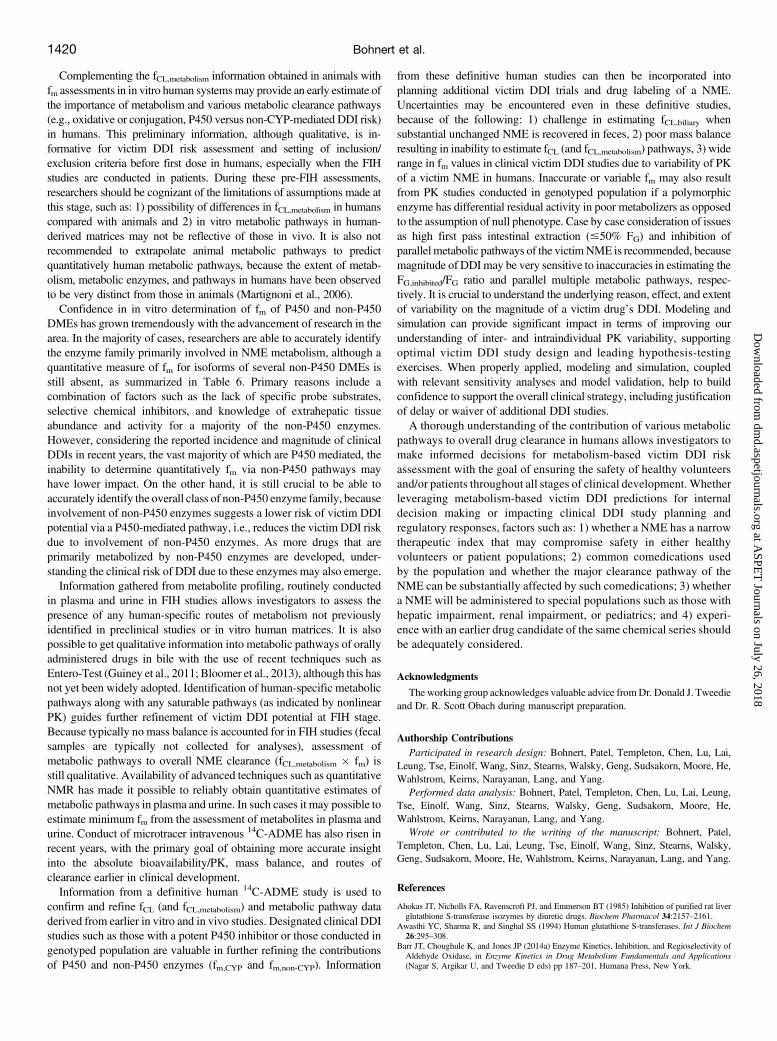
Complementing the fCL,metabolism information obtained in animals withfm assessments in in vitro human systemsmay provide an early estimate ofthe importance of metabolism and various metabolic clearance pathways(e.g., oxidative or conjugation, P450 versus non-CYP-mediated DDI risk)in humans. This preliminary information, although qualitative, is in-formative for victim DDI risk assessment and setting of inclusion/exclusion criteria before first dose in humans, especially when the FIHstudies are conducted in patients. During these pre-FIH assessments,researchers should be cognizant of the limitations of assumptions made atthis stage, such as: 1) possibility of differences in fCL,metabolism in humanscompared with animals and 2) in vitro metabolic pathways in human-derived matrices may not be reflective of those in vivo. It is also notrecommended to extrapolate animal metabolic pathways to predictquantitatively human metabolic pathways, because the extent of metab-olism, metabolic enzymes, and pathways in humans have been observedto be very distinct from those in animals (Martignoni et al., 2006).Confidence in in vitro determination of fm of P450 and non-P450
DMEs has grown tremendously with the advancement of research in thearea. In the majority of cases, researchers are able to accurately identifythe enzyme family primarily involved in NME metabolism, although aquantitative measure of fm for isoforms of several non-P450 DMEs isstill absent, as summarized in Table 6. Primary reasons include acombination of factors such as the lack of specific probe substrates,selective chemical inhibitors, and knowledge of extrahepatic tissueabundance and activity for a majority of the non-P450 enzymes.However, considering the reported incidence and magnitude of clinicalDDIs in recent years, the vast majority of which are P450 mediated, theinability to determine quantitatively fm via non-P450 pathways mayhave lower impact. On the other hand, it is still crucial to be able toaccurately identify the overall class of non-P450 enzyme family, becauseinvolvement of non-P450 enzymes suggests a lower risk of victim DDIpotential via a P450-mediated pathway, i.e., reduces the victim DDI riskdue to involvement of non-P450 enzymes. As more drugs that areprimarily metabolized by non-P450 enzymes are developed, under-standing the clinical risk of DDI due to these enzymes may also emerge.Information gathered from metabolite profiling, routinely conducted
in plasma and urine in FIH studies allows investigators to assess thepresence of any human-specific routes of metabolism not previouslyidentified in preclinical studies or in vitro human matrices. It is alsopossible to get qualitative information into metabolic pathways of orallyadministered drugs in bile with the use of recent techniques such asEntero-Test (Guiney et al., 2011; Bloomer et al., 2013), although this hasnot yet been widely adopted. Identification of human-specific metabolicpathways along with any saturable pathways (as indicated by nonlinearPK) guides further refinement of victim DDI potential at FIH stage.Because typically no mass balance is accounted for in FIH studies (fecalsamples are typically not collected for analyses), assessment ofmetabolic pathways to overall NME clearance (fCL,metabolism � fm) isstill qualitative. Availability of advanced techniques such as quantitativeNMR has made it possible to reliably obtain quantitative estimates ofmetabolic pathways in plasma and urine. In such cases it may possible toestimate minimum fm from the assessment of metabolites in plasma andurine. Conduct of microtracer intravenous 14C-ADME has also risen inrecent years, with the primary goal of obtaining more accurate insightinto the absolute bioavailability/PK, mass balance, and routes ofclearance earlier in clinical development.Information from a definitive human 14C-ADME study is used to
confirm and refine fCL (and fCL,metabolism) and metabolic pathway dataderived from earlier in vitro and in vivo studies. Designated clinical DDIstudies such as those with a potent P450 inhibitor or those conducted ingenotyped population are valuable in further refining the contributionsof P450 and non-P450 enzymes (fm,CYP and fm,non-CYP). Information
from these definitive human studies can then be incorporated intoplanning additional victim DDI trials and drug labeling of a NME.Uncertainties may be encountered even in these definitive studies,because of the following: 1) challenge in estimating fCL,biliary whensubstantial unchanged NME is recovered in feces, 2) poor mass balanceresulting in inability to estimate fCL (and fCL,metabolism) pathways, 3) widerange in fm values in clinical victim DDI studies due to variability of PKof a victim NME in humans. Inaccurate or variable fm may also resultfrom PK studies conducted in genotyped population if a polymorphicenzyme has differential residual activity in poor metabolizers as opposedto the assumption of null phenotype. Case by case consideration of issuesas high first pass intestinal extraction (#50% FG) and inhibition ofparallel metabolic pathways of the victimNME is recommended, becausemagnitude of DDI may be very sensitive to inaccuracies in estimating theFG,inhibited/FG ratio and parallel multiple metabolic pathways, respec-tively. It is crucial to understand the underlying reason, effect, and extentof variability on the magnitude of a victim drug’s DDI. Modeling andsimulation can provide significant impact in terms of improving ourunderstanding of inter- and intraindividual PK variability, supportingoptimal victim DDI study design and leading hypothesis-testingexercises. When properly applied, modeling and simulation, coupledwith relevant sensitivity analyses and model validation, help to buildconfidence to support the overall clinical strategy, including justificationof delay or waiver of additional DDI studies.A thorough understanding of the contribution of various metabolic
pathways to overall drug clearance in humans allows investigators tomake informed decisions for metabolism-based victim DDI riskassessment with the goal of ensuring the safety of healthy volunteersand/or patients throughout all stages of clinical development. Whetherleveraging metabolism-based victim DDI predictions for internaldecision making or impacting clinical DDI study planning andregulatory responses, factors such as: 1) whether a NME has a narrowtherapeutic index that may compromise safety in either healthyvolunteers or patient populations; 2) common comedications usedby the population and whether the major clearance pathway of theNME can be substantially affected by such comedications; 3) whethera NME will be administered to special populations such as those withhepatic impairment, renal impairment, or pediatrics; and 4) experi-ence with an earlier drug candidate of the same chemical series shouldbe adequately considered.
Acknowledgments
The working group acknowledges valuable advice fromDr. Donald J. Tweedieand Dr. R. Scott Obach during manuscript preparation.
Authorship ContributionsParticipated in research design: Bohnert, Patel, Templeton, Chen, Lu, Lai,
Leung, Tse, Einolf, Wang, Sinz, Stearns, Walsky, Geng, Sudsakorn, Moore, He,Wahlstrom, Keirns, Narayanan, Lang, and Yang.
Performed data analysis: Bohnert, Patel, Templeton, Chen, Lu, Lai, Leung,Tse, Einolf, Wang, Sinz, Stearns, Walsky, Geng, Sudsakorn, Moore, He,Wahlstrom, Keirns, Narayanan, Lang, and Yang.
Wrote or contributed to the writing of the manuscript: Bohnert, Patel,Templeton, Chen, Lu, Lai, Leung, Tse, Einolf, Wang, Sinz, Stearns, Walsky,Geng, Sudsakorn, Moore, He, Wahlstrom, Keirns, Narayanan, Lang, and Yang.
References
Ahokas JT, Nicholls FA, Ravenscroft PJ, and Emmerson BT (1985) Inhibition of purified rat liverglutathione S-transferase isozymes by diuretic drugs. Biochem Pharmacol 34:2157–2161.
Awasthi YC, Sharma R, and Singhal SS (1994) Human glutathione S-transferases. Int J Biochem26:295–308.
Barr JT, Choughule K, and Jones JP (2014a) Enzyme Kinetics, Inhibition, and Regioselectivity ofAldehyde Oxidase, in Enzyme Kinetics in Drug Metabolism Fundamentals and Applications(Nagar S, Argikar U, and Tweedie D eds) pp 187–201, Humana Press, New York.
1420 Bohnert et al.
at ASPE
T Journals on July 26, 2018
dmd.aspetjournals.org
Dow
nloaded from
Barr JT, Choughule KV, Nepal S, Wong T, Chaudhry AS, Joswig-Jones CA, Zientek M, StromSC, Schuetz EG, and Thummel KE, et al. (2014b) Why do most human liver cytosol prepara-tions lack xanthine oxidase activity? Drug Metab Dispos 42:695–699.
Barr JT and Jones JP (2011) Inhibition of human liver aldehyde oxidase: implications for potentialdrug-drug interactions. Drug Metab Dispos 39:2381–2386.
Barr JT and Jones JP (2013) Evidence for substrate-dependent inhibition profiles for human liveraldehyde oxidase. Drug Metab Dispos 41:24–29.
Barr JT, Jones JP, Joswig-Jones CA, and Rock DA (2013) Absolute quantification of aldehydeoxidase protein in human liver using liquid chromatography-tandem mass spectrometry. MolPharm 10:3842–3849.
Beedham C (1985) Molybdenum hydroxylases as drug-metabolizing enzymes. Drug Metab Rev16:119–156.
Bernard O and Guillemette C (2004) The main role of UGT1A9 in the hepatic metabolism ofmycophenolic acid and the effects of naturally occurring variants. Drug Metab Dispos 32:775–778.
Bichlmaier I, Kurkela M, Joshi T, Siiskonen A, Rüffer T, Lang H, Finel M, and Yli-Kauhaluoma J(2007) Potent inhibitors of the human UDP-glucuronosyltransferase 2B7 derived from the ses-quiterpenoid alcohol longifolol. ChemMedChem 2:881–889.
Bjornsson TD, Callaghan JT, Einolf HJ, Fischer V, Gan L, Grimm S, Kao J, King SP, Miwa G,and Ni L, et al.; Pharmaceutical Research and Manufacturers of America (PhRMA) DrugMetabolism/Clinical Pharmacology Technical Working Group; ; FDA Center for Drug Evalu-ation and Research (CDER) (2003) The conduct of in vitro and in vivo drug-drug interactionstudies: a Pharmaceutical Research and Manufacturers of America (PhRMA) perspective. DrugMetab Dispos 31:815–832.
Bloomer JC, Nash M, Webb A, Miller BE, Lazaar AL, Beaumont C, and Guiney WJ (2013)Assessment of potential drug interactions by characterization of human drug metabolism path-ways using non-invasive bile sampling. Br J Clin Pharmacol 75:488–496.
Brown HS, Galetin A, Hallifax D, and Houston JB (2006) Prediction of in vivo drug-drug inter-actions from in vitro data : factors affecting prototypic drug-drug interactions involvingCYP2C9, CYP2D6 and CYP3A4. Clin Pharmacokinet 45:1035–1050.
Cashman JR (1995) Structural and catalytic properties of the mammalian flavin-containing mono-oxygenase. Chem Res Toxicol 8:166–181.
Cashman JR (2008) Role of flavin-containing monooxygenase in drug development. Expert OpinDrug Metab Toxicol 4:1507–1521.
Cashman JR (2012) Flavin-containing Monooxygenases in Encyclopedia of Drug Metabolism andInteractions, (Lyubimov A, ed) Wiley, New York.
Chan TS, Yu H, Moore A, Khetani SR, and Tweedie D (2013) Meeting the challenge of predictinghepatic clearance of compounds slowly metabolized by cytochrome P450 using a novel hepa-tocyte model, HepatoPac. Drug Metab Dispos 41:2024–2032.
Chen Q, Ngui JS, Doss GA, Wang RW, Cai X, DiNinno FP, Blizzard TA, Hammond ML,Stearns RA, and Evans DC, et al. (2002) Cytochrome P450 3A4-mediated bioactivation ofraloxifene: irreversible enzyme inhibition and thiol adduct formation. Chem Res Toxicol 15:907–914.
Cheng PY and Morgan ET (2001) Hepatic cytochrome P450 regulation in disease states. CurrDrug Metab 2:165–183.
Chiu TH, Chen JC, Chen LD, Lee JH, and Chung JG (2004) Gypenosides inhibited N-acetylationof 2-aminofluorene, N-acetyltransferase gene expression and DNA adduct formation in humancervix epithelioid carcinoma cells (HeLa). Res Commun Mol Pathol Pharmacol 115-116:157–174.
Choughule KV, Barr JT, and Jones JP (2013) Evaluation of rhesus monkey and guinea pig hepaticcytosol fractions as models for human aldehyde oxidase. Drug Metab Dispos 41:1852–1858.
Clarke SE, Harrell AW, and Chenery RJ (1995) Role of aldehyde oxidase in the in vitro conversionof famciclovir to penciclovir in human liver. Drug Metab Dispos 23:251–254.
Collins C, Levy R, Ragueneau-Majlessi I, and Hachad H (2006) Prediction of maximum exposurein poor metabolizers following inhibition of nonpolymorphic pathways. Curr Drug Metab 7:295–299.
Court MH (2005) Isoform-selective probe substrates for in vitro studies of human UDP-glucuronosyltransferases. Methods Enzymol 400:104–116.
Court MH (2014) Phenotyping UDP-Glucuronosyltransferases (UGTs) involved in human drugmetabolism: An update, in Methods in Pharmacology and Toxicology: Optimization in DrugDiscovery: In Vitro Methods (Caldwell GW and Yan Y eds) pp 117–136, Humana Press, NewYork.
Cubitt HE, Houston JB, and Galetin A (2011) Prediction of human drug clearance by multiplemetabolic pathways: integration of hepatic and intestinal microsomal and cytosolic data. DrugMetab Dispos 39:864–873.
Dahal UP, Jones JP, Davis JA, and Rock DA (2011) Small molecule quantification by liquidchromatography-mass spectrometry for metabolites of drugs and drug candidates. Drug MetabDispos 39:2355–2360.
Dear GJ, Beaumont C, Roberts A, Squillaci B, Thomas S, Nash M, and Fraser D (2011) Approachesfor the rapid identification of drug metabolites in early clinical studies. Bioanalysis 3:197–213.
Di L, Atkinson K, Orozco CC, Funk C, Zhang H, McDonald TS, Tan B, Lin J, Chang C,and Obach RS (2013) In vitro-in vivo correlation for low-clearance compounds using hepatocyterelay method. Drug Metab Dispos 41:2018–2023.
Elion GB (1988) The Purine Path to Chemotherapy. Nobel Lecture, Burroughs Wellcome Co.,Research Triangle Park, NC.
Erickson DA, Hollfelder S, Tenge J, Gohdes M, Burkhardt JJ, and Krieter PA (2007) In vitrometabolism of the analgesic bicifadine in the mouse, rat, monkey, and human. Drug MetabDispos 35:2232–2241.
Fahmi OA, Maurer TS, Kish M, Cardenas E, Boldt S, and Nettleton D (2008) A combined modelfor predicting CYP3A4 clinical net drug-drug interaction based on CYP3A4 inhibition, in-activation, and induction determined in vitro. Drug Metab Dispos 36:1698–1708.
Fahmi OA and Ripp SL (2010) Evaluation of models for predicting drug-drug interactions due toinduction. Expert Opin Drug Metab Toxicol 6:1399–1416.
Fallon JK, Neubert H, Goosen TC, and Smith PC (2013a) Targeted precise quantification of 12human recombinant uridine-diphosphate glucuronosyl transferase 1A and 2B isoforms usingnano-ultra-high-performance liquid chromatography/tandem mass spectrometry with selectedreaction monitoring. Drug Metab Dispos 41:2076–2080.
Fallon JK, Neubert H, Hyland R, Goosen TC, and Smith PC (2013b) Targeted quantitative pro-teomics for the analysis of 14 UGT1As and -2Bs in human liver using NanoUPLC-MS/MS withselected reaction monitoring. J Proteome Res 12:4402–4413.
Fisar Z, Hroudová J, and Raboch J. (2010) Inhibition of monoamine oxidase activity by antide-pressants and mood stabilizers. Neuro Endocrinol Lett 31:645–656.
Fu C, Di L, Han X, Soderstrom C, Snyder M, Troutman MD, Obach RS, and Zhang H (2013)Aldehyde oxidase 1 (AOX1) in human liver cytosols: quantitative characterization of AOX1expression level and activity relationship. Drug Metab Dispos 41:1797–1804.
Fukami T, Takahashi S, Nakagawa N, Maruichi T, Nakajima M, and Yokoi T (2010) In vitroevaluation of inhibitory effects of antidiabetic and antihyperlipidemic drugs on human carboxy-lesterase activities. Drug Metab Dispos 38:2173–2178.
Galetin A, Gertz M, and Houston JB (2008) Potential role of intestinal first-pass metabolism in theprediction of drug-drug interactions. Expert Opin Drug Metab Toxicol 4:909–922.
Galetin A, Hinton LK, Burt H, Obach RS, and Houston JB (2007) Maximal inhibition of intestinalfirst-pass metabolism as a pragmatic indicator of intestinal contribution to the drug-drug inter-actions for CYP3A4 cleared drugs. Curr Drug Metab 8:685–693.
Gearry RB, Day AS, Barclay ML, Leong RWL, and Sparrow MP (2010) Azathioprine and allo-purinol: A two-edged interaction. J Gastroenterol Hepatol 25:653–655.
Geha RM, Rebrin I, Chen K, and Shih JC (2001) Substrate and inhibitor specificities for humanmonoamine oxidase A and B are influenced by a single amino acid. J Biol Chem 276:9877–9882.
Gertz M, Houston JB, and Galetin A (2011) Physiologically based pharmacokinetic modeling ofintestinal first-pass metabolism of CYP3A substrates with high intestinal extraction. Drug MetabDispos 39:1633–1642.
Ghibellini G, Leslie EM, and Brouwer KL (2006) Methods to evaluate biliary excretion of drugs inhumans: an updated review. Mol Pharm 3:198–211.
Gibson CR, Lu P, Maciolek C, Wudarski C, Barter Z, Rowland-Yeo K, Stroh M, Lai E, and Nicoll-Griffith DA (2013) Using human recombinant UDP-glucuronosyltransferase isoforms and arelative activity factor approach to model total body clearance of laropiprant (MK-0524) inhumans. Xenobiotica 43:1027–1036.
Ginsberg G, Smolenski S, Hattis D, Guyton KZ, Johns DO, and Sonawane B (2009) GeneticPolymorphism in Glutathione Transferases (GST): Population distribution of GSTM1, T1, andP1 conjugating activity. J Toxicol Environ Health B Crit Rev 12:389–439.
Griffin SJ and Houston JB (2004) Comparison of fresh and cryopreserved rat hepatocyte sus-pensions for the prediction of in vitro intrinsic clearance. Drug Metab Dispos 32:552–558.
Guiney WJ, Beaumont C, Thomas SR, Robertson DC, McHugh SM, Koch A, and Richards D(2011) Use of Entero-Test, a simple approach for non-invasive clinical evaluation of the biliarydisposition of drugs. Br J Clin Pharmacol 72:133–142.
Guo Z, Raeissi S, White RB, and Stevens JC (1997) Orphenadrine and methimazole inhibitmultiple cytochrome P450 enzymes in human liver microsomes. Drug Metab Dispos 25:390–393.
Hagihara K, Kazui M, Kurihara A, Yoshiike M, Honda K, Okazaki O, Farid NA, and Ikeda T(2009) A possible mechanism for the differences in efficiency and variability of active metaboliteformation from thienopyridine antiplatelet agents, prasugrel and clopidogrel. Drug Metab Dispos37:2145–2152.
Harbourt DE, Fallon JK, Ito S, Baba T, Ritter JK, Glish GL, and Smith PC (2012) Quantification ofhuman uridine-diphosphate glucuronosyl transferase 1A isoforms in liver, intestine, and kidneyusing nanobore liquid chromatography-tandem mass spectrometry. Anal Chem 84:98–105.
Harper TW and Brassil PJ (2008) Reaction phenotyping: current industry efforts to identify en-zymes responsible for metabolizing drug candidates. AAPS J 10:200–207.
Harvey RD and Morgan ET (2014) Cancer, inflammation, and therapy: effects on cytochromep450-mediated drug metabolism and implications for novel immunotherapeutic agents. ClinPharmacol Ther 96:449–457.
Herraiz T (2012) Evaluation of the oxidation of 1-methyl-4-phenyl-1,2,3,6-tetrahydropyridine(MPTP) to toxic pyridinium cations by monoamine oxidase (MAO) enzymes and its use tosearch for new MAO inhibitors and protective agents. J Enzyme Inhib Med Chem 27:810–817.
Herraiz T, Arán VJ, and Guillén H (2009) Nitroindazole compounds inhibit the oxidative activationof 1-methyl-4-phenyl-1,2,3,6-tetrahydropyridine (MPTP) neurotoxin to neurotoxic pyridiniumcations by human monoamine oxidase (MAO). Free Radic Res 43:975–984.
Hillgren KM, Keppler D, Zur AA, Giacomini KM, Stieger B, Cass CE, and Zhang L; InternationalTransporter Consortium (2013) Emerging transporters of clinical importance: an update from theInternational Transporter Consortium. Clin Pharmacol Ther 94:52–63.
Hines RN, Cashman JR, Philpot RM, Williams DE, and Ziegler DM (1994) The mammalianflavin-containing monooxygenases: molecular characterization and regulation of expression.Toxicol Appl Pharmacol 125:1–6.
Humerickhouse R, Lohrbach K, Li L, Bosron WF, and Dolan ME (2000) Characterization of CPT-11 hydrolysis by human liver carboxylesterase isoforms hCE-1 and hCE-2. Cancer Res 60:1189–1192.
Hutzler JM, Obach RS, Dalvie D, and Zientek MA (2013) Strategies for a comprehensive un-derstanding of metabolism by aldehyde oxidase. Expert Opin Drug Metab Toxicol 9:153–168.
Ishizuka H, Konno K, Shiina T, Naganuma H, Nishimura K, Ito K, Suzuki H, and Sugiyama Y(1999) Species differences in the transport activity for organic anions across the bile canalicularmembrane. J Pharmacol Exp Ther 290:1324–1330.
Isoherranen N, Lutz JD, Chung SP, Hachad H, Levy RH, and Ragueneau-Majlessi I (2012)Importance of multi-p450 inhibition in drug-drug interactions: evaluation of incidence, inhibitionmagnitude, and prediction from in vitro data. Chem Res Toxicol 25:2285–2300.
Itäaho K, Mackenzie PI, Ikushiro S, Miners JO, and Finel M (2008) The configuration of the 17-hydroxy group variably influences the glucuronidation of beta-estradiol and epiestradiol byhuman UDP-glucuronosyltransferases. Drug Metab Dispos 36:2307–2315.
Ito K, Brown HS, and Houston JB (2004) Database analyses for the prediction of in vivo drug-druginteractions from in vitro data. Br J Clin Pharmacol 57:473–486.
Ito K, Hallifax D, Obach RS, and Houston JB (2005) Impact of parallel pathways of drug elimi-nation and multiple cytochrome P450 involvement on drug-drug interactions: CYP2D6 para-digm. Drug Metab Dispos 33:837–844.
Ito K, Ogihara K, Kanamitsu S, and Itoh T (2003) Prediction of the in vivo interaction betweenmidazolam and macrolides based on in vitro studies using human liver microsomes. Drug MetabDispos 31:945–954.
Ito M, Yamamoto K, Sato H, Fujiyama Y, and Bamba T (2001) Inhibitory effect of troglitazone onglucuronidation catalyzed by human uridine diphosphate-glucuronosyltransferase 1A6. Eur JClin Pharmacol 56:893–895.
James MO (2014) Enzyme Kinetics of Conjugating Enzymes: PAPS Sulfotransferase, in EnzymeKinetics in Drug Metabolism Fundamentals and Applications (Nagar S, Argikar U, and TweedieD eds) pp 187–201, Humana Press, New York.
New Molecular Entities as Victims of Metabolic Drug-Drug Interactions 1421
at ASPE
T Journals on July 26, 2018
dmd.aspetjournals.org
Dow
nloaded from
Jiang M, Klein M, Zanger UM, Mohammad MK, Cave MC, Gaikwad NW, Dias NJ, SelcerKW, Guo Y, and He J, et al. (2016) Inflammatory regulation of steroid sulfatase: A novelmechanism to control estrogen homeostasis and inflammation in chronic liver disease. JHepatol 64:44–52.
Johnson C, Stubley-Beedham C, and Stell JG (1985) Hydralazine: a potent inhibitor of aldehydeoxidase activity in vitro and in vivo. Biochem Pharmacol 34:4251–4256.
Johnson EF and Waterman MR, editors (1996) Methods in Enzymology Volume 272 CytochromeP450 Part B, Academic Press, New York.
Jones HM, Chen Y, Gibson C, Heimbach T, Parrott N, Peters SA, Snoeys J, Upreti VV, Zheng M,and Hall SD (2015) Physiologically based pharmacokinetic modeling in drug discovery anddevelopment: a pharmaceutical industry perspective. Clin Pharmacol Ther 97:247–262.
Kamdem LK, Liu Y, Stearns V, Kadlubar SA, Ramirez J, Jeter S, Shahverdi K, Ward BA, OgburnE, and Ratain MJ, et al. (2010) In vitro and in vivo oxidative metabolism and glucuronidation ofanastrozole. Br J Clin Pharmacol 70:854–869.
Kalgutkar AS and Castagnoli N, Jr (1995) Selective inhibitors of monoamine oxidase (MAO-A andMAO-B) as probes of its catalytic site and mechanism. Med Res Rev 15:325–388.
Kalgutkar AS, Tugnait M, Zhu T, Kimoto E, Miao Z, Mascitti V, Yang X, Tan B, Walsky RL,and Chupka J, et al. (2011) Preclinical species and human disposition of PF-04971729, aselective inhibitor of the sodium-dependent glucose cotransporter 2 and clinical candidate for thetreatment of type 2 diabetes mellitus. Drug Metab Dispos 39:1609–1619.
Kazui M, Nishiya Y, Ishizuka T, Hagihara K, Farid NA, Okazaki O, Ikeda T, and Kurihara A(2010) Identification of the human cytochrome P450 enzymes involved in the two oxidativesteps in the bioactivation of clopidogrel to its pharmacologically active metabolite. Drug MetabDispos 38:92–99.
Kato Y, Nakajima M, Oda S, Fukami T, and Yokoi T (2012) Human UDP-glucuronosyltransferaseisoforms involved in haloperidol glucuronidation and quantitative estimation of their contribu-tion. Drug Metab Dispos 40:240–248.
Korzekwa K (2014) Enzyme Kinetics of Oxidative Metabolism:Cytochrome, in Enzyme Kinetics inDrug Metabolism Fundamentals and Applications (Nagar S, Argikar U, and Tweedie D eds) p450, Humana Press, New York.
Kramer MA and Tracy TS (2008) Studying cytochrome P450 kinetics in drug metabolism. ExpertOpin Drug Metab Toxicol 4:591–603.
Krishnaswamy S, Hao Q, Von Moltke LL, Greenblatt DJ, and Court MH (2004) Evaluation of5-hydroxytryptophol and other endogenous serotonin (5-hydroxytryptamine) analogs as sub-strates for UDP-glucuronosyltransferase 1A6. Drug Metab Dispos 32:862–869.
Kukongviriyapan V, Phromsopha N, Tassaneeyakul W, Kukongviriyapan U, Sripa B, HahnvajanawongV, and Bhudhisawasdi V (2006) Inhibitory effects of polyphenolic compounds on human arylamineN-acetyltransferase 1 and 2. Xenobiotica 36:15–28.
Lai Y and Hsiao P (2014) Beyond the ITCWhite Paper: emerging sciences in drug transporters andopportunities for drug development. Curr Pharm Des 20:1577–1594.
Laizure SC, Herring V, Hu Z, Witbrodt K, and Parker RB (2013) The role of human carboxy-lesterases in drug metabolism: have we overlooked their importance? Pharmacotherapy 33:210–222.
Lang D and Kalgutkar AS(2003) Non-P450 mediated oxidation metabolism of xenobiotics, in DrugMetabolizing Enzymes: Cytochrome P450 and Other Enzymes in Drug Discovery and Devel-opment (Lee JS, Obach RS, and Fisher MB eds) pp 483–498, FontisMedia S.A. and MarcelDekker Inc., New York.
Lapham K, Baumann JN, Walsky RL, Niosi M, Orozco CC, Bourcier K, Giddens G, Obach RS,and Hyland R (2012) Digoxin and tranilast identified as novel isoform-selective inhibitors ofhuman UDP-glucuronosyltransferase 1A9 (UGT1A9) activity (Poster P108). Drug Metab Rev 44(S1):82.
Lappin G and Stevens L (2008) Biomedical accelerator mass spectrometry: recent applications inmetabolism and pharmacokinetics. Expert Opin Drug Metab Toxicol 4:1021–1033.
Leonardi ET and Azmitia EC (1994) MDMA (ecstasy) inhibition of MAO type A and type B:comparisons with fenfluramine and fluoxetine (Prozac). Neuropsychopharmacology 10:231–238.
Lépine J, Bernard O, Plante M, Têtu B, Pelletier G, Labrie F, Bélanger A, and Guillemette C (2004)Specificity and regioselectivity of the conjugation of estradiol, estrone, and their catecholes-trogen and methoxyestrogen metabolites by human uridine diphospho-glucuronosyltransferasesexpressed in endometrium. J Clin Endocrinol Metab 89:5222–5232.
Li AP, Hartman NR, Lu C, Collins JM, and Strong JM (1999) Effects of cytochrome P450 inducerson 17alpha-ethinyloestradiol (EE2) conjugation by primary human hepatocytes. Br J ClinPharmacol 48:733–742.
Liu L, Wagner CR, and Hanna PE (2008) Human arylamine N-acetyltransferase 1: in vitro andintracellular inactivation by nitrosoarene metabolites of toxic and carcinogenic arylamines. ChemRes Toxicol 21:2005–2016.
Lu C, Balani SK, Qian MG, Prakash SR, Ducray PS, and von Moltke LL (2010) Quantitativeprediction and clinical observation of a CYP3A inhibitor-based drug – drug interactions withMLN3897, a potent CCR1 antagonist, J Pharmacol Exp Therap 332:562–568.
Lu C, Hatsis P, Berg C, Lee FW, and Balani SK (2008) Prediction of pharmacokinetic drug-drug interactions using human hepatocyte suspension in plasma and cytochrome P450phenotypic data. II. In vitro-in vivo correlation with ketoconazole. Drug Metab Dispos 36:1255–1260.
Lu C, Miwa GT, Prakash SR, Gan LS, and Balani SK (2007) A novel model for the prediction ofdrug-drug interactions in humans based on in vitro cytochrome p450 phenotypic data. DrugMetab Dispos 35:79–85.
Lu C, Suri A, Shyu WC, and Prakash S (2014) Assessment of cytochrome P450-mediated drug-drug interaction potential of orteronel and exposure changes in patients with renal impairmentusing physiologically based pharmacokinetic modeling and simulation. Biopharm Drug Dispos35:543–552.
Manevski N, Moreolo PS, Yli-Kauhaluoma J, and Finel M (2011) Bovine serum albumin decreasesKm values of human UDP-glucuronosyltransferases 1A9 and 2B7 and increases Vmax values ofUGT1A9. Drug Metab Dispos 39:2117–2129.
Mano Y, Usui T, Kamimura H, Mano Y, Usui T, and Kamimura H (2006) In vitro inhibitoryeffects of non-steroidal anti-inflammatory drugs on 4-methylumbelliferone glucuronidation inrecombinant human UDP-glucuronosyltransferanceglucuronosyltransferase 1A9—potent in-hibition by niflumic acid. Biopharm Drug DisposBiopharm Drug Dispos 27:1–6.
Martignoni M, Groothuis GMM, and de Kanter R (2006) Species differences between mouse, rat,dog, monkey and human CYP-mediated drug metabolism, inhibition and induction. Expert OpinDrug Metab Toxicol 2:875–894.
Mathur A, Tweedie DJ, Maw HH, and Li Y (2013) Unexpected interaction between CYP3A4 andBI 11634: is BI 11634 interacting with CYP3A4 similar to nifedipine? Drug Metabol DrugInteract 28:239–246.
Miao Z, Nucci G, Amin N, Sharma R, Mascitti V, Tugnait M, Vaz AD, Callegari E, and KalgutkarAS (2013) Pharmacokinetics, metabolism, and excretion of the antidiabetic agent ertugliflozin(PF-04971729) in healthy male subjects. Drug Metab Dispos 41:445–456.
Milne AM, Burchell B, and Coughtrie MW (2011) A novel method for the immunoquantificationof UDP-glucuronosyltransferases in human tissue. Drug Metab Dispos 39:2258–2263.
Miners JO, Knights KM, Houston JB, and Mackenzie PI (2006) In vitro-in vivo correlation fordrugs and other compounds eliminated by glucuronidation in humans: pitfalls and promises.Biochem Pharmacol 71:1531–1539.
Miners JO, Mackenzie PI, and Knights KM (2010a) The prediction of drug-glucuronidation pa-rameters in humans: UDP-glucuronosyltransferase enzyme-selective substrate and inhibitorprobes for reaction phenotyping and in vitro-in vivo extrapolation of drug clearance and drug-drug interaction potential. Drug Metab Rev 42:196–208.
Miners JO, Polasek TM, Mackenzie PI, and Knights KM (2010b) The in vitro characterization ofinhibitory drug-drug interactions involving UDP - glucuronosyltransferase, in Enzyme- andTransporter-Based Drug-Drug Interactions: Progress and Future Challenges pp 217–236,Springer, New York, NY.
Murphy DL, Karoum F, Pickar D, Cohen RM, Lipper S, Mellow AM, Tariot PN, and Sunderland T(1998) Differential trace amine alterations in individuals receiving acetylenic inhibitors of MAO-A(clorgyline) or MAO-B (selegiline and pargyline). J. Neural Transm Suppl 52:39–48.
Nakanishi T and Tamai I (2015) Interaction of Drug or Food with Drug Transporters in Intestineand Liver. Curr Drug Metab 16:753–764.
Nemoda Z, Angyal N, Tarnok Z, Gadoros J, and Sasvari-Szekely M (2009) Carboxylesterase 1gene polymorphism and methylphenidate response in ADHD. Neuropharmacology 57:731–733.
Nirogi R, Palacharla RC, Uthukam V, Manoharan A, Srikakolapu SR, Kalaikadhiban I, BoggavarapuRK, Ponnamaneni RK, Ajjala DR, and Bhyrapuneni G (2015) Chemical inhibitors of CYP450enzymes in liver microsomes: combining selectivity and unbound fractions to guide selection ofappropriate concentration in phenotyping assays. Xenobiotica 45:95–106.
Nishimuta H, Houston JB, and Galetin A (2014) Hepatic, intestinal, renal, and plasma hydrolysis ofprodrugs in human, cynomolgus monkey, dog, and rat: implications for in vitro-in vivo ex-trapolation of clearance of prodrugs. Drug Metab Dispos 42:1522–1531.
Obach RS (2004) Potent inhibition of human liver aldehyde oxidase by raloxifene. Drug MetabDispos 32:89–97.
Obach RS and Ryder TF (2010) Metabolism of ramelteon in human liver microsomes and cor-relation with the effect of fluvoxamine on ramelteon pharmacokinetics. Drug Metab Dispos 38:1381–1391.
Obach RS, Walsky RL, and Venkatakrishnan K (2007) Mechanism-based inactivation of humancytochrome p450 enzymes and the prediction of drug-drug interactions. Drug Metab Dispos 35:246–255.
Obach RS, Walsky RL, Venkatakrishnan K, Gaman EA, Houston JB, and Tremaine LM (2006)The utility of in vitro cytochrome P450 inhibition data in the prediction of drug-drug interactions.J Pharmacol Exp Ther 316:336–348.
Ogilvie BW and Parkinson A (2014) Drugs as victims and perpetrators and the pharmacokineticconcept of maximum exposure, in Handbook Metabolic Pathways of Xenobiotics (Lee P ed) pp103–146, Wiley, New York.
Ogilvie BW, Usuki E, Yerino P, and Parkinson A (2008) In Vitro Approaches for Studying theInhibition of Drug-Metabolizing Enzymes and Identifying the Drug-Metabolizing EnzymesResponsible for the Metabolism of Drugs (Reaction Phenotyping) with Emphasis on Cyto-chrome, in Drug-Drug Interactions (Rodrigues AD, ed) pp 450, Informa Healthcare, New York.
Overby LH, Buckpitt AR, Lawton MP, Atta-Asafo-Adjei E, Schulze J, and Philpot RM (1995)Characterization of flavin-containing monooxygenase 5 (FMO5) cloned from human and guineapig: evidence that the unique catalytic properties of FMO5 are not confined to the rabbitortholog. Arch Biochem Biophys 317:275–284.
Overby LH, Carver GC, and Philpot RM (1997) Quantitation and kinetic properties of hepaticmicrosomal and recombinant flavin-containing monooxygenases 3 and 5 from humans. ChemBiol Interact 106:29–45.
Pacher P, Nivorozhkin A, and Szabó C (2006) Therapeutic effects of xanthine oxidase inhibitors:renaissance half a century after the discovery of allopurinol. Pharmacol Rev 58:87–114.
Paine SW, Ménochet K, Denton R, McGinnity DF, and Riley RJ (2011) Prediction of human renalclearance from preclinical species for a diverse set of drugs that exhibit both active secretion andnet reabsorption. Drug Metab Dispos 39:1008–1013.
Panoutsopoulos GI, Kouretas D, Gounaris EG, and Beedham C (2004) Enzymatic oxidation of2-phenylethylamine to phenylacetic acid and 2-phenylethanol with special reference to themetabolism of its intermediate phenylacetaldehyde. Basic Clin Pharmacol Toxicol 95:273–279.
Parkinson A and Ogilvie BW (2007) Biotransformation of Xenobiotics, in Casarett and Doull’sToxicology, the basic science of poisons (Klaassen CD, ed, ed) pp 163–304, Mc Graw Hill, NewYork.
Pelkonen O, Turpeinen M, Hakkola J, Honkakoski P, Hukkanen J, and Raunio H (2008) Inhibitionand induction of human cytochrome P450 enzymes: current status. Arch Toxicol 82:667–715.
Peters SA, Schroeder PE, Giri N, and Dolgos H (2012) Evaluation of the use of static and dynamicmodels to predict drug-drug interaction and its associated variability: impact on drug discoveryand early development. Drug Metab Dispos 40:1495–1507.
Pfeifer ND, Yang K, and Brouwer KL (2013) Hepatic basolateral efflux contributes significantly torosuvastatin disposition I: characterization of basolateral versus biliary clearance using a novelprotocol in sandwich-cultured hepatocytes. J Pharmacol Exp Ther 347:727–736.
Phoemen JH, van Ommen B, and van Bladeren PJ (1990) Inhibition of rat and human glutathioneS-transferase isoenzymes by ethacrynic acid and its glutathione conjugate. Biochem Pharmacol40:1631–1635.
Polidoro G, Di Ilio C, Arduini A, and Federici G (1981) Molecular and catalytic properties ofpurified glutathione S-transferase from human placenta. Biochem Med 25:247–259.
Pratt SE, Durland-Busbice S, Shepard RL, Heinz-Taheny K, Iversen PW, and Dantzig AH (2013)Human carboxylesterase-2 hydrolyzes the prodrug of gemcitabine (LY2334737) and confersprodrug sensitivity to cancer cells. Clin Cancer Res 19:1159–1168.
Pryde DC, Dalvie D, Hu Q, Jones P, Obach RS, and Tran TD (2010) Aldehyde oxidase: an enzymeof emerging importance in drug discovery. J Med Chem 53:8441–8460.
Pybus BS, Sousa JC, Jin X, Ferguson JA, Christian RE, Barnhart R, Vuong C, Sciotti RJ, ReichardGA, and Kozar MP, et al. (2012) CYP450 phenotyping and accurate mass identification ofmetabolites of the 8-aminoquinoline, anti-malarial drug primaquine. Malar J 11:259–267.
1422 Bohnert et al.
at ASPE
T Journals on July 26, 2018
dmd.aspetjournals.org
Dow
nloaded from
Ragunathan N, Dairou J, Pluvinage B, Martins M, Petit E, Janel N, Dupret JM, and Rodrigues-Lima F (2008) Identification of the xenobiotic-metabolizing enzyme arylamineN-acetyltransferase 1 as a new target of cisplatin in breast cancer cells: molecular and cellularmechanisms of inhibition. Mol Pharmacol 73:1761–1768.
Ramanathan R, Josephs JL, Jemal M, Arnold M, and Humphreys WG (2010) Novel MS solutionsinspired by MIST. Bioanalysis 2:1291–1313.
Ribelles N, López-Siles J, Sánchez A, González E, Sánchez MJ, Carabantes F, Sánchez-Rovira P,Márquez A, Dueñas R, and Sevilla I, et al. (2008) A carboxylesterase 2 gene polymorphism aspredictor of capecitabine on response and time to progression. Curr Drug Metab 9:336–343.
Riches Z, Stanley EL, Bloomer JC, and Coughtrie MW (2009) Quantitative evaluation of theexpression and activity of five major sulfotransferases (SULTs) in human tissues: the SULT“pie”. Drug Metab Dispos 37:2255–2261.
Rodrigues AD (1999) Integrated cytochrome P450 reaction phenotyping: attempting to bridge thegap between cDNA-expressed cytochromes P450 and native human liver microsomes. BiochemPharmacol 57:465–480.
Ross MK, Borazjani A, Wang R, Crow JA, and Xie S (2012) Examination of the carboxylesterasephenotype in human liver. Arch Biochem Biophys 522:44–56.
Rowland A, Elliot DJ, Williams JA, Mackenzie PI, Dickinson RG, and Miners JO (2006) In vitrocharacterization of lamotrigine N2-glucuronidation and the lamotrigine-valproic acid interaction.Drug Metab Dispos 34:1055–1062.
Sato Y, Nagata M, Kawamura A, Miyashita A, and Usui T (2012) Protein quantification of UDP-glucuronosyltransferases 1A1 and 2B7 in human liver microsomes by LC-MS/MS and corre-lation with glucuronidation activities. Xenobiotica 42:823–829.
Saura J, Nadal E, van den Berg B, Vila M, Bombi JA, and Mahy N (1996) Localization ofmonoamine oxidases in human peripheral tissues. Life Sci 59:1341–1349.
Schaefer O, Ohtsuki S, Kawakami H, Inoue T, Liehner S, Saito A, Sakamoto A, Ishiguro N,Matsumaru T, and Terasaki T, et al. (2012) Absolute quantification and differential expression ofdrug transporters, cytochrome P450 enzymes, and UDP-glucuronosyltransferases in culturedprimary human hepatocytes. Drug Metab Dispos 40:93–103.
Schrag ML, Cui D, Rushmore TH, Shou M, Ma B, and Rodrigues AD (2004) Sulfotransferase 1E1is a low KM isoform mediating the 3-O-sulfation of ethinyl estradiol. Drug Metab Dispos 32:1299–1303.
Sensenhauser C (2014) In vitro CYP/FMO Reaction Phenotyping, in Methods in Pharmacologyand Toxicology: Optimization in Drug Discovery: Vitro Methods (Caldwell GW, Yan Z, eds) pp137–169, Humana Press, New York.
Seo KA, Kim HJ, Jeong ES, Abdalla N, Choi CS, Kim DH, and Shin JG (2014) In vitro assay ofsix UDP-glucuronosyltransferase isoforms in human liver microsomes, using cocktails of probesubstrates and liquid chromatography-tandem mass spectrometry. Drug Metab Dispos 42:1803–1810.
Shardlow CE, Generaux GT, Patel AH, Tai G, Tran T, and Bloomer JC (2013) Impact of physi-ologically based pharmacokinetic modeling and simulation in drug development. Drug MetabDispos 41:1994–2003.
Shimizu M, Fukami T, Nakajima M, and Yokoi T (2014) Screening of specific inhibitors forhuman carboxylesterases or arylacetamide deacetylase. Drug Metab Dispos 42:1103–1109.
Shou M, Hayashi M, Pan Y, Xu Y, Morrissey K, Xu L, and Skiles GL (2008) Modeling, pre-diction, and in vitro in vivo correlation of CYP3A4 induction. Drug Metab Dispos 36:2355–2370.
Sim E, Lack N, Wang CJ, Long H, Westwood I, Fullam E, and Kawamura A (2008a) Arylamine N-acetyltransferases: structural and functional implications of polymorphisms. Toxicology 254:170–183.
Sim E, Walters K, and Boukouvala S (2008b) Arylamine N-acetyltransferases: from structure tofunction. Drug Metab Rev 40:479–510.
Sridar C, Hanna I, and Hollenberg PF (2013) Quantitation of UGT1A1 in human liver microsomesusing stable isotope-labelled peptides and mass spectrometry based proteomic approaches.Xenobiotica 43:336–345.
Störmer E, Roots I, and Brockmoller J (2000) Benzydamine N-oxidation as an index reactionreflecting FMO activity in human liver microsomes and impact of FMO3 polymorphisms onenzyme activity. British J of Clin Pharmacol 50:553–561.
Strelevitz TJ, Orozco CC, and Obach RS (2012) Hydralazine as a selective probe inactivator ofaldehyde oxidase in human hepatocytes: estimation of the contribution of aldehyde oxidase tometabolic clearance. Drug Metab Dispos 40:1441–1448.
Swift B, Pfeifer ND, and Brouwer KL (2010) Sandwich-cultured hepatocytes: an in vitro model toevaluate hepatobiliary transporter-based drug interactions and hepatotoxicity. Drug Metab Rev42:446–471.
Tapner MJ, Jones BE, Wu WM, and Farrell GC (2004) Toxicity of low dose azathioprine and 6-mercaptopurine in rat hepatocytes. Roles of xanthine oxidase and mitochondrial injury. JHepatol 40:454–463.
Tweedie D, Polli JW, Berglund EG, Huang SM, Zhang L, Poirier A, Chu X, and Feng B;International Transporter Consortium (2013) Transporter studies in drug development: experi-ence to date and follow-up on decision trees from the International Transporter Consortium. ClinPharmacol Ther 94:113–125.
Uchaipichat V, Mackenzie PI, Elliot DJ, and Miners JO (2006a) Selectivity of substrate (trifluo-perazine) and inhibitor (amitriptyline, androsterone, canrenoic acid, hecogenin, phenylbutazone,quinidine, quinine, and sulfinpyrazone) “probes” for human udp-glucuronosyltransferases. DrugMetab Dispos 34:449–456.
Uchaipichat V, Winner LK, Mackenzie PI, Elliot DJ, Williams JA, and Miners JO (2006b)Quantitative prediction of in vivo inhibitory interactions involving glucuronidated drugsfrom in vitro data: the effect of fluconazole on zidovudine glucuronidation. Br J ClinPharmacol 61:427–439.
Uttamsingh V, Lu C, Miwa G, and Gan LS (2005) Relative contributions of the five major humancytochromes P450, 1A2, 2C9, 2C19, 2D6, and 3A4, to the hepatic metabolism of the proteasomeinhibitor bortezomib. Drug Metab Dispos 33:1723–1728.
Varma MV, Pang KS, Isoherranen N, and Zhao P (2015) Dealing with the complex drug-druginteractions: towards mechanistic models. Biopharm Drug Dispos 36:71–92.
Varma MV, Feng B, Obach RS, Troutman MD, Chupka J, Miller HR, and El-Kattan A (2009)Physicochemical determinants of human renal clearance. J Med Chem 52:4844–4852.
Venkatakrishnan K, Von Moltke LL, and Greenblatt DJ (2001) Human drug metabolism and thecytochromes P450: application and relevance of in vitro models. J Clin Pharmacol 41:1149–1179.
Vieira ML, Kirby B, Ragueneau-Majlessi I, Galetin A, Chien JY, Einolf HJ, Fahmi OA, Fischer V,Fretland A, and Grime K, et al. (2014) Evaluation of various static in vitro-in vivo extrapolation
models for risk assessment of the CYP3A inhibition potential of an investigational drug. ClinPharmacol Ther 95:189–198.
Vietri M, Pietrabissa A, Mosca F, and Pacifici GM (2002) Inhibition of mycophenolic acid glu-curonidation by niflumic acid in human liver microsomes. Eur J Clin Pharmacol 58:93–97.
Vishwanathan K, Babalola K, Wang J, Espina R, Yu L, Adedoyin A, Talaat R, Mutlib A,and Scatina J (2009) Obtaining exposures of metabolites in preclinical species through plasmapooling and quantitative NMR: addressing metabolites in safety testing (MIST) guidance withoutusing radiolabeled compounds and chemically synthesized metabolite standards. Chem ResToxicol 22:311–322.
Wadkins RM, Hyatt JL, Edwards CC, Tsurkan L, Redinbo MR, Wheelock CE, Jones PD,Hammock BD, and Potter PM (2007) Analysis of mammalian carboxylesterase inhibition bytrifluoromethylketone-containing compounds. Mol Pharmacol 71:713–723.
Walsky RL, Bauman JN, Bourcier K, Giddens G, Lapham K, Negahban A, Ryder TF, Obach RS,Hyland R, and Goosen TC (2012) Optimized assays for human UDP-glucuronosyltransferase(UGT) activities: altered alamethicin concentration and utility to screen for UGT inhibitors. DrugMetab Dispos 40:1051–1065.
Walsky RL, Obach RS, Gaman EA, Gleeson JP, and Proctor WR (2005). Selective inhibition ofhuman cytochrome P4502C8 by montelukast. Drug Metab Dispos 33: 413–418.
Wang H and LeCluyse EL (2003) Role of orphan nuclear receptors in the regulation of drug-metabolising enzymes. Clin Pharmacokinet 42:1331–1357.
Wang LQ and James MO (2006) Inhibition of sulfotransferases by xenobiotics. Curr Drug Metab7:83–104.
Warholm M, Guthenberg C, and Mannervik B (1983) Molecular and catalytic properties of glu-tathione transferase mu from human liver: an enzyme efficiently conjugating epoxides. Bio-chemistry 22:3610–3617.
Waters NL, Obach RS, and Di L (2014) Considerations of Unbound Drug Concentration inEnzyme Kinetics, in Enzyme Kinetics in Drug Metabolism Fundamentals and Applications(Nagar S, Argikar U, and Tweedie D eds) pp 119–145, Humana Press, New York.
Weyler W, Hsu YP, and Breakefield XO (1990) Biochemistry and genetics of monoamine oxidase.Pharmacol Ther 47:391–417.
Whalen R and Boyer TD (1998) Human glutathione S-transferases. Semin Liver Dis 18:345–358.Wienkers LC and Stevens JC (2003) Cytochrome P450 reaction phenotyping, in Drug Metab-olizing Enzymes: Cytochrome P450 and Other Enzymes in Drug Discovery and Development(Lee JS, Obach RS, Fisher MB eds) pp 255–300, FontisMedia S.A. & Marcel Dekker, Inc.,New York.
Windmill KF, Gaedigk A, Hall PM, Samaratunga H, Grant DM, and McManus ME (2000)Localization of N-acetyltransferases NAT1 and NAT2 in human tissues. Toxicol Sci 54:19–29.
Wu H, Dombrovsky L, Tempel W, Martin F, Loppnau P, Goodfellow GH, Grant DM,and Plotnikov AN (2007) Structural basis of substrate-binding specificity of human arylamine N-acetyltransferases. J Biol Chem 282:30189–30197.
Yang J, Jamei M, Yeo KR, Tucker GT, and Rostami-Hodjegan A (2007) Prediction of intestinalfirst-pass drug metabolism. Curr Drug Metab 8:676–684.
Yang X, Atkinson K, and Di L (2016) Novel cytochrome P450 reaction phenotyping for lowclearance compounds using hepatocyte relay method. Drug Metab Dispos 44:460–465.
Yi P and Luffer-Atlas D (2010) A radiocalibration method with pseudo internal standard to estimatecirculating metabolite concentrations. Bioanalysis 2:1195–1210.
Youdim MB, Bakhle YS, and Bakhle YS (2006) Monoamine oxidase: isoforms and inhibitors inParkinson’s disease and depressive illness. Br J Pharmacol 147 (Suppl 1):S287–S296.
Youdim KA, Zayed A, Dickins M, Phipps A, Griffiths M, Darekar A, Hyland R, Fahmi O, Hurst S,and Plowchalk DR, et al. (2008) Application of CYP3A4 in vitro data to predict clinical drug-drug interactions; predictions of compounds as objects of interaction. Br J Clin Pharmacol 65:680–692.
Yu C, Chen CL, Gorycki FL, and Neiss TG (2007) A rapid method for quantitatively estimatingmetabolites in human plasma in the absence of synthetic standards using a combination of liquidchromatography/mass spectrometry and radiometric detection. Rapid Commun Mass Spectrom21:497–502.
Yu J, Ritchie TK, Mulgaonkar A, and Ragueneau-Majlessi I (2014) Drug disposition and drug-druginteraction data in 2013 FDA new drug applications: a systematic review. Drug Metab Dispos42:1991–2001.
Zhang D, Chando TJ, Everett DW, Patten CJ, Dehal SS, and Humphreys WG (2005) In vitroinhibition of UDP glucuronosyltransferases by atazanavir and other HIV protease inhibitors andthe relationship of this property to in vivo bilirubin glucuronidation. Drug Metab Dispos 33:1729–1739.
Zhang H, Davis CD, Sinz MW, and Rodrigues AD (2007) Cytochrome P450 reaction-phenotyping:an industrial perspective. Expert Opin Drug Metab Toxicol 3:667–687.
Zhang J and Cashman JR (2006) Quantitative analysis of FMO gene mRNA levels in humantissues. Drug Metab Dispos 34:19–26.
Zhao P, Rowland M, and Huang SM (2012) Best practice in the use of physiologically basedpharmacokinetic modeling and simulation to address clinical pharmacology regulatory questions.Clin Pharmacol Ther 92:17–20.
Zhao YS, Chen F, and Li L (2014) Are circulating metabolites important in pharmacokinetic drug-drug interactions? A retroanalysis of clinical data. Curr Drug Metab 15:767–790.
Zhou J and Miners JO (2014) Enzyme kinetics of uridine diphosphate glucuronosyltransferase(UGTs), in Enzyme Kinetics in Drug Metabolism Fundamentals and Applications (Swati N,Upendra A, and Donald D eds) pp 203–228, Humana Press, New York.
Zhu HJ, Appel DI, Jiang Y, and Markowitz JS (2009) Age- and sex-related expression and activityof carboxylesterase 1 and 2 in mouse and human liver. Drug Metab Dispos 37:1819–1825.
Ziegler DM (2002) An overview of the mechanism, substrate specificities, and structure of FMOs.Drug Metab Rev 34:503–511.
Zientek M, Jiang Y, Youdim K, and Obach RS (2010) In vitro-in vivo correlation for intrinsicclearance for drugs metabolized by human aldehyde oxidase. Drug Metab Dispos 38:1322–1327.
Zientek MA and Youdim K (2015) Reaction phenotyping: advances in the experimental strategies usedto characterize the contribution of drug-metabolizing enzymes. Drug Metab Dispos 43:163–181.
Address correspondence to: T. Bohnert, Preclinical Drug Metabolism andPharmacokinetics, Biogen, 255 Binney St, Cambridge, MA 02142. E-mail: [email protected]
New Molecular Entities as Victims of Metabolic Drug-Drug Interactions 1423
at ASPE
T Journals on July 26, 2018
dmd.aspetjournals.org
Dow
nloaded from