Embed Size (px)
Citation preview
The author(s) shown below used Federal funds provided by the U.S.Department of Justice and prepared the following final report:
Document Title: Evaluation of a Comprehensive InterventionStrategy in Public Housing
Author(s): Denise E. Stevens Ph.D.
Document No.: 193424
Date Received: March 27, 2002
Award Number: 98-IJ-CX-0053
This report has not been published by the U.S. Department of Justice.To provide better customer service, NCJRS has made this Federally-funded grant final report available electronically in addition totraditional paper copies.
Opinions or points of view expressed are thoseof the author(s) and do not necessarily reflect
the official position or policies of the U.S.Department of Justice.
PROPERTY OF National Criminal Justice Reference Service (NCJRS) Box 6000 Gockville. MD 20849-6000
Evaluation of a Comprehensive Intervention Strategy in Public
Housing I
i
a
Denise E. Stevens, Ph.D. Associate Research Scientist,
Yale University School of Medicine, Department of Epidemiology & Public Health
0 May 200 1
FINAL REP:=
Approved By: National Supported Institute Under Award of Justice, #9tC Office /r-CV of Just~ce Programs, e f1d-3 U S Department fromthe of Justice Points of view in this document are those of the authors and do not necessarily represent the oficlal position ofthe U S Department of Juhce
a Date: d ! / O A .
and do not necessarily reflect the official position or policies of the U.S. Department of Justice. been published by the Department. Opinions or points of view expressed are those of the author(s) This document is a research report submitted to the U.S. Department of Justice. This report has not
Acknowledgements
This grant was supported under Award 98-IJ-CX-0053 from the National Institute of Justice, Office of Justice Programs, U.S. Department of Justice. Points of view in this document are those of the author and do not necessarily represent the official position of the U.S. Department of Justice.
The author would like to thank the following individuals and organizations for their contribution to this project.
The Robert Wood Johnson Foundation through its Join Together Fighting Back community initiative to reduce the supply and demand of alcohol and drugs has in part funded the Families F.1.R.S.T initiative.
The Housing Authority of the City of New Haven under the leadership of Robert Solomon and Robin Golden have supported this program fiscally and conceptually and have recently been instrumental in moving these on-site services to scale in other local housing developments.
The Director of New Haven Fighting Back, Marzella Tyson and Sergio Rodriguez, Substance Abuse Coordinator for the City of New Haven, who provided me with the opportunity to work with the team of outreach workers and managers responsible for the implementation of the Families FIRST program.
The success of this program is particularly a function of the dedicated outreach workers who continue to provide services to individuals at Families F.I.R.S.T. This project would not have moved forward without their hard work, perseverance and dedication to serving the needs of residents at Quinnipiac Terrace.
I would like to thank the City of New Haven, Department of Police Services (Chief Wearing and his staff) for participating as team members in the Families F.1.R.S.T initiative, having a visible presence on-site and for providing the crime data that were used in this report.
Finally, and perhaps most importantly, I wish to acknowledge the residents at Quinnipiac Terrace who demonstrated the courage and commitment to change - both personally and within their community.
11
and do not necessarily reflect the official position or policies of the U.S. Department of Justice. been published by the Department. Opinions or points of view expressed are those of the author(s) This document is a research report submitted to the U.S. Department of Justice. This report has not
EXECUTIVE SUMMARY
Overview
Substance abuse and its related sequelae (including crime, poverty, violence, HIV, AIDS,
psychiatric disorders and medical comorbidity), constitutes one of the leading public
health problems facing society today. Substance problems occur across all strata of the
population. However, particularly vulnerable groups face increased risk, such as
minorities, indigent women and their children and the homeless. Public housing is one
such environment that contains a critical mass of high-risk women and their children.
The increased pressures of living life in the face of adversity and the strong presence of
alcohol and/or drugs in the public housing community has contributed to more women
using and abusing both prescription and non-prescription substances. In recognition that
drug elimination in public housing requires a multi-faceted approach, the Housing
Authority designed an innovative partnership program to reduce drug activity and foster
family self-sufficiency in target developments. The program combines enhanced law
enforcement, and on-site substance abuse and family support services as a unified
approach to the problem of drug activity and substance abuse in public housing. The
program included collaboration with the City of New Haven and the Robert Wood
Johnson Foundation Fighting Back Initiative
Goals and Objectives
This report presents the evaluation findings of an intervention strategy directed towards
reducing substance use/abuse and its related sequelae in a sample of at-risk families
1
and do not necessarily reflect the official position or policies of the U.S. Department of Justice. been published by the Department. Opinions or points of view expressed are those of the author(s) This document is a research report submitted to the U.S. Department of Justice. This report has not
living in a housing project in the City of New Haven. The key elements of this
intervention are an innovative on-site comprehensive services model that includes both
clinical (substance abuse treatment and family support services) and non-clinical
components (e.g. extensive outreach and community organizing as well as job training
and placement and GED certification) as well as high profile police involvement. The
principal objectives included demonstrating:
1) A significant increase in the proportion of residents entering and completing
intervention services; and
2) A reduction in substance related activities and crime post-intervention.
This intervention is novel for the following reasons:
The intervention is multidimensional capturing the complexiiy of substance abuse
issues including sewesteem and employment issues.
The program has removed significant barriers to treatment including
transportation and childcare issues by having these services made available on-
site.
The program depenh on a high level of community organization (e.g. tenant
committee approval and participation) and extensive outreach (e.g. male
involvement and family support).
In order to maximize the opportunity for a reduction in drug-related crime and
drug activity, the police will maintain a high proJle by actively engaging in
11
and do not necessarily reflect the official position or policies of the U.S. Department of Justice. been published by the Department. Opinions or points of view expressed are those of the author(s) This document is a research report submitted to the U.S. Department of Justice. This report has not
resident activities and by having a 24-hour physical presence within the housing
complex.
Methods
At baseline, a needs assessment survey was completed that was compromised of
questions that address factors relevant to the outcomes of interest. Process evaluation
early in program implementation allowed for feed-back and program restructuring. In
addition to follow-up surveys on residents at 12 and 18 months post-intervention, detailed
information was obtained on crime statistics and utilization of intervention services. The
general analytic strategy involved drawing comparisons between the intervention and
control site at baseline, and following implementation of the intervention at 12 and 18
months. The primary outcomes of interest, including entry into substance abuse
treatment, crime reduction, and employment are compared to a non-intervention control
site that is matched to the intervention site in terms of race, family based housing and
predominantly female head of household status.
Summary of Findings
Families F.I.R.S.T. is a model on-site human services program that demonstrates the
impact that effective community partnerships can have on a major public health problem.
The evaluation findings confirm that the principal objectives of this project were
accomplished as evidenced by the (positive) changes that had occurred in the community
at the 18-month assessment:
... 111
and do not necessarily reflect the official position or policies of the U.S. Department of Justice. been published by the Department. Opinions or points of view expressed are those of the author(s) This document is a research report submitted to the U.S. Department of Justice. This report has not
1. Service Utilization
Over 90 clients had been served by the Families F.I.R.S.Tprogram during
the evaluation period (60 with substance abuse problems were referred to
a variety of treatmentprograms; 51 to job training andplacement
programs; and 92 to GED certijkation) and a substantialproportion of
residents are currently engaged in services.
2. Substance Related Activities
Significant improvements over time were observed in the intervention site
for drug and alcohol abuse, drug selling, and violence as reported by
residents.
A signiJicant decrease in drug selling had occurred in the intervention site
compared to the control site, although drug selling remained a major
problem.
Despite the signijicant reductions in substance-related activities, major
problems such as substance usdabuse, drug-selling, and violence stili
remain in the community based on resident reports.
3. Crime
Residents reported a signifcant decrease in crime and improved safeq
over time at the intervention site.
iv
and do not necessarily reflect the official position or policies of the U.S. Department of Justice. been published by the Department. Opinions or points of view expressed are those of the author(s) This document is a research report submitted to the U.S. Department of Justice. This report has not
e Residents attributed improved crime and safety to increasedpolice
presence in the community.
Trends over time revealed by calls for service data indicate fewer UCR I
and Ncrimes since the inception of the Families F.I.R.S.Tprogram,
although a similar reduction occurred at the control site.
Factors contributing to programmatic success included: a) continuous process evaluation
that revealed that physical presence of services was not sufficient in and of itself to
engage residents; b) extensive outreach and creative strategies are necessary to gain a
presence beyond the ‘physical’; c) involvement of the resident council and tenants across
all aspects of program implementation is critical to gain trust, credibility and buy-in as
necessary first steps; and d) ‘word of mouth’ marketing by trusted residents and satisfied
clients.
Recommendations
Extend the Families F.1.R.S.T model that includes the availability of on-site
services to other public housing developments.
Implement continuous improvement/process evaluation at each public housing
development in which the program is implemented.
Use aggregate analyses to define larger programmatic and systems level changes
Conduct systematic long-term follow-up on individuals that use the services to
determine treatment efficacy, employment, and ultimately exodus from public
housing.
i
V
and do not necessarily reflect the official position or policies of the U.S. Department of Justice. been published by the Department. Opinions or points of view expressed are those of the author(s) This document is a research report submitted to the U.S. Department of Justice. This report has not
0 Conduct cost-effectiveness studies as next steps to validate the efficiency of
providing services on-site compared to other possible models.
Contribution to Criminal Justice System Policy and Practice
Families F.I.R.S.T. is a model on-site human services program that is tailored to meet the
needs of individuals living in high-crime public housing. The major contribution of this
intervention program to criminal justice system policy and practice is the development of
a partnership program between a Public Housing Authority, treatment providers and a
police department whereby at-risk individuals can seek the treatment they need and
maintain sobriety living in an environment where drug activity continues but at reduced
rates. The program represented an opportunity for the Department of Police Services,
Housing Authority officials and residents, and the City to evaluate the effectiveness of
combining community policing and human resource and support programs in public
housing authorities. This program will be expanded across public housing developments
in the City of New Haven and has the potential to be adopted statewide andor nationally.
The policy and practice change within the criminal justice system will include the
incorporation of police sub-stations within housing projects, active participation of the
officers in resident activities, and a round-the-clock presence to inhibit the purchase and
sales of drugs.
vi
and do not necessarily reflect the official position or policies of the U.S. Department of Justice. been published by the Department. Opinions or points of view expressed are those of the author(s) This document is a research report submitted to the U.S. Department of Justice. This report has not
TABLE OF CONTENTS
Acknowledgements .........................................................................................
EXECUTIVE SUMMARY ........................................................................... i Statement of the Problem ....................................................................... i Goals and Objectives ........................................................................... i Summary of Findings ........................................................................ iii Recommendations ................................................................................ v Contribution to Criminal Justice System Policy and Practice .............................. vi
TABLE OF CONTENTS ................................................................................
LIST OF FIGURES AND TABLES ..................................................................
CHAPTER 1 Background and Significance ...................................................... 1 City of New Haven .............................................................................. 1 Crime in New Haven ............................................................................ 2 Public Housing in New Haven ................................................................. 4 New Haven Partnership ........................................................................ 4 Strategies to Address Social Mayhem in Public Housing ................................. 6 Miracle Village ................................................................................... 8
CHAPTER 2 Research Design and Methodology ............................................. 10 Overview ......................................................................................... 10 Families F.I.R.S.T. .............................................................................. 10 Characteristics of the Intervention Site ....................................................... 14 Characteristics of the Control Site ........................................................... 14 Data Collection Strategy ....................................................................... 15 Procedures of Analysis ........................................................................ 17
CHAPTER 3 Results: Baseline ..................................................................... 19 Overview .......................................................................................... 19 Demographic Characteristics .................................................................. 20 Service Needs .................................................................................... 21 Problems in the Community ................................................................... 23 Baseline Crime Statistics ....................................................................... 25 Environmental Assessments ................................................................... 27
CHAPTER 4 Results: Process Evaluation ....................................................... 30 Needs Assessment Survey Design and Implementation ................................... 30 Validation of the Need for the Clinical and Non-Clinical Interventions ................. 32 Factors that Led to Delay in Implementing All A r m s of the Intervention ............ 33
CHAPTER 5 Results: Across Multiple Time Points ........................................... 40 Overview .......................................................................................... 40 Demographic Characteristics ................................................................... 41 Access to Services ............................................................................... 42 Knowledge and Reported Use of Families F.I.R.S.T. Services ........................... 42
vii
and do not necessarily reflect the official position or policies of the U.S. Department of Justice. been published by the Department. Opinions or points of view expressed are those of the author(s) This document is a research report submitted to the U.S. Department of Justice. This report has not
Families F.I.R.S.T. Service Utilization Data ................................................... 43 Resident Perception of Crime and Safety ...................................................... 45 Substance Abuse in the Community ............................................................ 48 Knowledge. Use and Attribution of Change to Families F.I.R.S.T. ........................ 49
CHAPTER 6 Final Results: Comparisons Between Intervention and Control Site ......... 51 Demographic Characteristics ...................................................................... 51 Access to Services ................................................................................. 52 Resident Perception of Community Crime and Personal Safety .............................. 53 Crime Data .......................................................................................... 55
Summary and Discussion ............................................................. 58 Summary of Findings .............................................................................. 58 Discussion ........................................................................................... 59 LessonsLearned .................................................................................... 63 Strengths, Limitations & Ongoing Challenges., ................................................ 64 Policy Implications .............................................................................. 68
I CHAPTER 7
REFERENCES ............................................................................................ 70
APPENDICES ..............................................................................................
... Vlll
and do not necessarily reflect the official position or policies of the U.S. Department of Justice. been published by the Department. Opinions or points of view expressed are those of the author(s) This document is a research report submitted to the U.S. Department of Justice. This report has not
LIST OF EXHIBITS
Exhibit 1 :
Exhibit 2:
Exhibit 3:
Exhibit 4:
Exhibit 5:
Exhibit 6:
Exhibit 7:
Exhibit 8:
Exhibit 9:
Map of Connecticut .................................................................. 1
Selected Indicators of Child-Well Being (New Haven vs State Rates) ....... 2
UCR I Crimes Reported New Haven (1 980-2000) .............................. 4
Components of Families F.I.R.S.T. ............................................... 12
Baseline Demographic Characteristics ........................................... 20
Baseline Community Services Needed ........................................... 22
Intervention Site Access to Services .............................................. 23
Baseline Major Problems in the Community .................................... 24
Baseline Crime Reports By Site ................................................... 26
Exhibit 10: Demographic Characteristics Across Time ...................................... 41
Exhibit 11: Access to Services .................................................................. 42
Exhibit 12: Safety in the Neighborhood Over Time .......................................... 46
Exhibit 13: Major Drug Related Community Problems ..................................... 47
Exhibit 14: Major Community Problems ...................................................... 47
Exhibit 15: Community Substance Abuse .................................................... 48
Exhibit 16: Attribution of Community Change to Families F.I.R.S.T. ................... 50
Exhibit 17: Demographic Characteristics Final Survey .................................... 51
Exhibit 18: Access to Services Final Survey ................................................ 53
Exhibit 19: Community Safety Final Survey ................................................ 54
Exhibit 20: Comparisons Between Intervention and Control Site Major Community Problems ..................................................... 55
Exhibit 21: UCR I Calls For Service (18-months) ....................................... - 3 6
Exhibit 22: UCR I1 Calls For Service (1 8-months) ......................................... 56
ix
and do not necessarily reflect the official position or policies of the U.S. Department of Justice. been published by the Department. Opinions or points of view expressed are those of the author(s) This document is a research report submitted to the U.S. Department of Justice. This report has not
CHAPTER 1 Background and Significance
City of New Haven
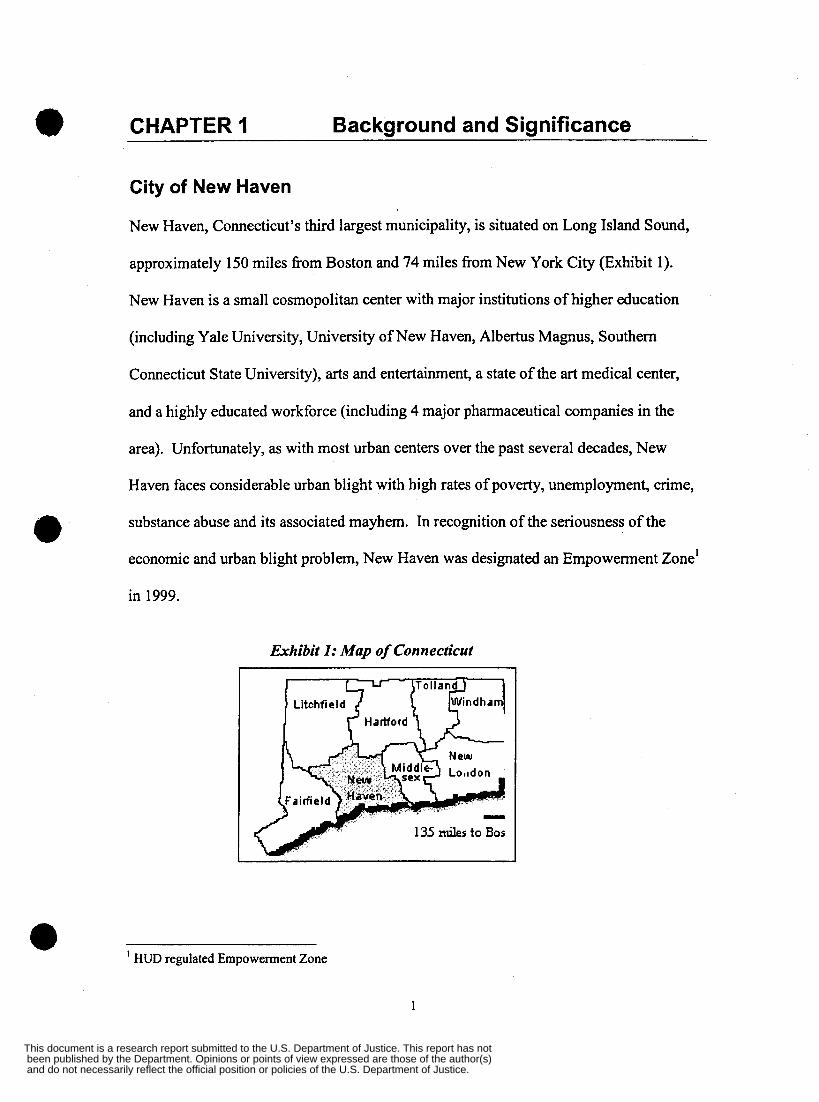
New Haven, Connecticut's third largest municipality, is situated on Long Island Sound,
approximately 150 miles fiom Boston and 74 miles fiom New York City (Exhibit 1).
New Haven is a small cosmopolitan center with major institutions of higher education
(including Yale University, University of New Haven, Albertus Magnus, Southern
Connecticut State University), arts and entertainment, a state of the art medical center,
and a highly educated workforce (including 4 major pharmaceutical companies in the
area). Unfortunately, as with most urban centers over the past several decades, New
Haven faces considerable urban blight with high rates of poverty, unemployment, crime,
substance abuse and its associated mayhem. In recognition of the seriousness of the
economic and urban blight problem, New Haven was designated an Empowerment Zone'
in 1999.
Exhibit 1: Map of Connecticut
Litchfie Id
135 miles to Bos
HUD regulated Empowerment Zone I
1
and do not necessarily reflect the official position or policies of the U.S. Department of Justice. been published by the Department. Opinions or points of view expressed are those of the author(s) This document is a research report submitted to the U.S. Department of Justice. This report has not
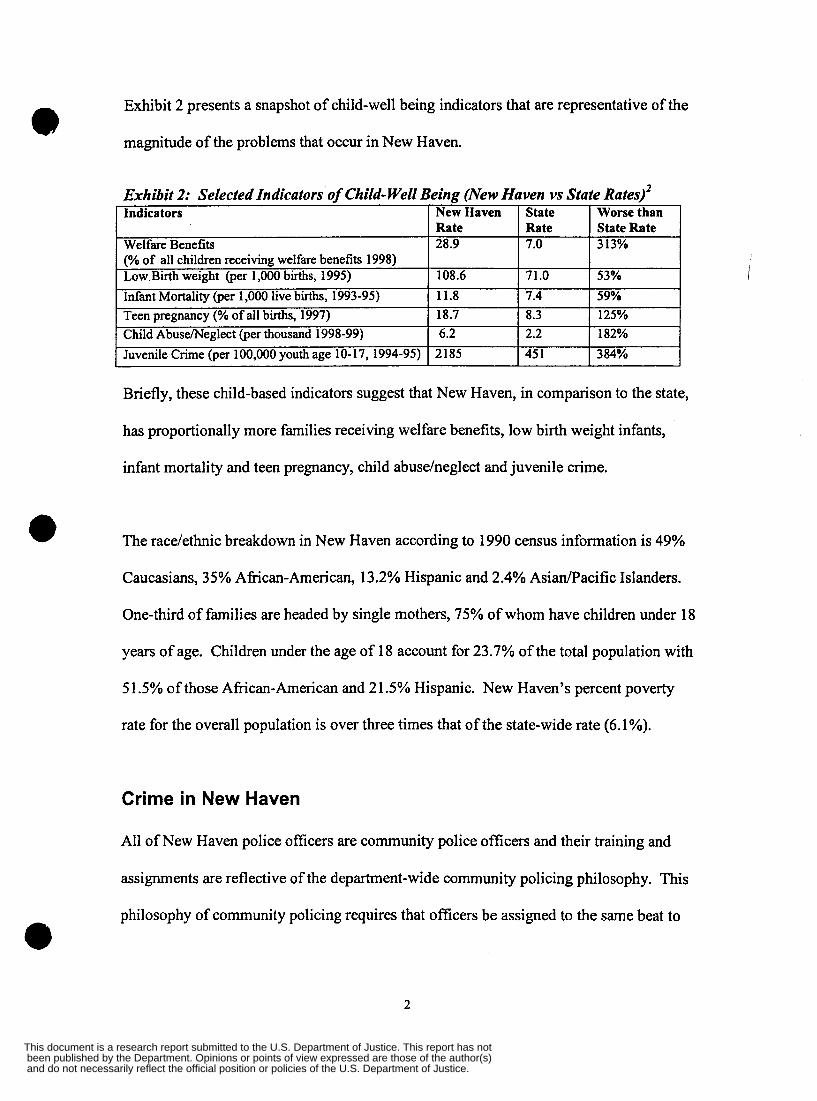
Exhibit 2 presents a snapshot of child-well being indicators that are representative of the
Indica tors
Welfare Benefits (% of all children receiving welfare benefits 1998) Low Birth weight (per 1,000 births, 1995) Infant Mortality (per 1,000 live births, 1993-95) Teen pregnancy (% of all births, 1997) Child Abuserneglect (per thousand 1998-99) Juvenile Crime (per 100,000 youth age 10- 17, 1994-95)
magnitude of the problems that occur in New Haven.
New Haven State Worse than Rate Rate State Rate 28.9 7.0 3 13%
108.6 71.0 53% 11.8 7.4 59% 18.7 8.3 125% 6.2 2.2 182%
2 185 45 1 384%
Briefly, these child-based indicators suggest that New Haven, in comparison to the state,
has proportionally more families receiving welfare benefits, low birth weight infants,
infant mortality and teen pregnancy, child abuseheglect and juvenile crime.
The race/ethnic breakdown in New Haven according to 1990 census information is 49%
Caucasians, 35% African-American, 13.2% Hispanic and 2.4% AsiadPacific Islanders.
One-third of families are headed by single mothers, 75% of whom have children under 18
years of age. Children under the age of 18 account for 23.7% of the total population with
5 1.5% of those African-American and 2 1.5% Hispanic. New Haven’s percent poverty
rate for the overall population is over three times that of the state-wide rate (6.1 %).
Crime in New Haven
All of New Haven police officers are community police officers and their training and
assignments are reflective of the department-wide community policing philosophy. This
philosophy of community policing requires that officers be assigned to the same beat to
2
and do not necessarily reflect the official position or policies of the U.S. Department of Justice. been published by the Department. Opinions or points of view expressed are those of the author(s) This document is a research report submitted to the U.S. Department of Justice. This report has not
build a relationship with the community and become familiar with its problems.
Community policing is a method of providing law enforcement services that stresses a
partnership among residents, police, schools, churches, government services, the private
sector, and others to prevent crime by addressing the conditions and problems that lead to
crime and the fear of crime. The City of New Haven Department of Police Services is
cited by experts as a model city with respect to the implementation of community-based
policing. The Department of Police Services works collaboratively with the Housing
Authority regarding the elimination of drug-related crime and other criminal activities
associated with drug-related problems to improve safety and security for residents. In
several housing developments, Police officers “walk the beat” as part of their assigned
responsibilities as both a deterrent to drug-related criminal behavior as well as to enforce
the law. In some instances, the presence of police officers is more visible because of the
community policing substation is located nearby or within a housing development. e
As reflected currently by most urban centers in the nation, there has been a consistent
downward trend in the overall patterns of crime in New Haven during the past decade.
(Exhibit 3). UCR I crimes in particular, are the lowest that they have been in 20 years
and down 33% since 1990. Closer examination of violent crimes indicates that they are
down by approximately 57% compared to the overall statewide drop that is reported to be
38% in 1999.
i
* Connecticut Association for Human Services 2000 Data Book
3
and do not necessarily reflect the official position or policies of the U.S. Department of Justice. been published by the Department. Opinions or points of view expressed are those of the author(s) This document is a research report submitted to the U.S. Department of Justice. This report has not
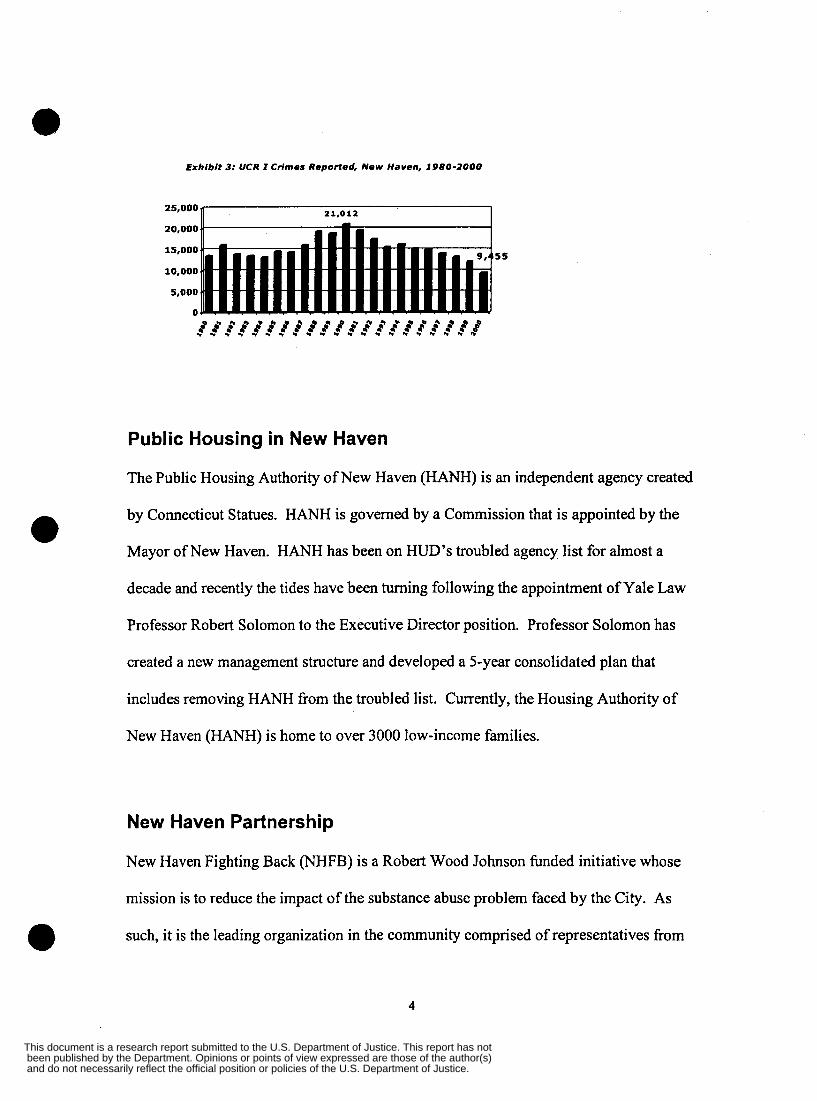
Exhibit 3: UCR I Crimes Reported, New Haven, 1980-2000
21,012 25,000 1 20,000
5 5 15,000
10,000
5,000
0
Public Housing in New Haven
The Public Housing Authority of New Haven (HANH) is an independent agency created
by Connecticut Statues. HANH is governed by a Commission that is appointed by the
Mayor of New Haven. HANH has been on HUD's troubled agency list for almost a
decade and recently the tides have been turning following the appointment of Yale Law
Professor Robert Solomon to the Executive Director position. Professor Solomon has
created a new management structure and developed a 5-year consolidated plan that
includes removing HANH from the troubled list. Currently, the Housing Authority of
New Haven (HANH) is home to over 3000 low-income families.
New Haven Partnership
New Haven Fighting Back ("FB) is a Robert Wood Johnson funded initiative whose
mission is to reduce the impact of the substance abuse problem faced by the City. As
such, it is the leading organization in the community comprised of representatives from
4
and do not necessarily reflect the official position or policies of the U.S. Department of Justice. been published by the Department. Opinions or points of view expressed are those of the author(s) This document is a research report submitted to the U.S. Department of Justice. This report has not
every major organizatiodentity addressing substance use/abuse issues including
treatment providers, policy makers, criminal justice, housing, and emgloyment. Over the
past few years NHFB has built relationships across all levels of the Authority, from its
Board of Commissioners to resident groups and tenant councils. Recently, two important
changes at the Authority have caused the City and the Authority to request assistance
fiom NHFB. First, a change in the executive-level leadership has resulted in a rethinking
of how human services are delivered on site at the Authority. Second, faced with the
implementation of the US HUD “one-strike” eviction policy, the Authority has turned to
NHFB for assistance in developing a means to intervene with families before eviction is
necessary. The City endorses NHFB’s involvement because the “one-strike” evictions
may result in heavier use of public safety and homeless systems. In response to these
needs, and in partnership with Authority residents, NHFB designed and implemented
Families F.I.R.S.T. (Families In Recovery Stay Together). The overall purpose of
Families F.I.R.S.T. is to provide intervention, support, and community organizing
services to at-risk Authority families. Ultimately, these families will be drug-free and
gainfully employed.
i
While recent Public Housing Authority initiatives and community-policing efforts have
begun to turn the tide against high drug-related crime and activity in family
developments, crime rates and estimated rates of family substance abuse are exceedingly
high as compared to prevalence data from national surveys (Kessler et al., 1996). A
recent local estimate obtained through an Authority consulting firm suggests that
approximately 40% of households may be evicted when the Authority implements its
5
and do not necessarily reflect the official position or policies of the U.S. Department of Justice. been published by the Department. Opinions or points of view expressed are those of the author(s) This document is a research report submitted to the U.S. Department of Justice. This report has not
new “one-strike” eviction policy (tied to its drug-free leasing addendum). Furthermore,
Authority data reveal that over 95% of the 420 households in two (of six) family
developments are headed by single women and over 50% of these families are supported
principally by welfare, or Temporary Assistance to Needy Families (TANF). Most
families live below the poverty level (the average household income is $8,249) and are at
risk of moving on and off welfare as personal situations and the local economy fluctuate.
Only 10% of all households have an employed adult. Connecticut welfare regulations,
among the most stringent in the country, provide 21 months of assistance to families.
The need for training, reliable and affordable daycare and job placement are critical.
These high rates of poverty, crime, and substance abuse in the New Haven Housing
Authority combine with additional evidence that call for a coordinated strategy to
establish clear pathways to treatment @ employment for Authority families: By
strategically removing diug users who create social mayhem from the environment and
strengthening the viability of low-income families affected by substance abuse, the
project partners will have a significant impact on its most serious substance abuse
problems. Finally, in order to do an effective job, the project partners must increase its
use of data and take a more visible, data-driven approach to inform policy changes and
stimulate community participation.
Strategies to Address Social Mayhem in Public Housing
There is considerable evidence to suggest that a comprehensive intervention strategy
using a community-based approach may be successful in the reduction of substance use,
abuse and its related sequelae (including crime, poverty, and medical and psychiatric
6
and do not necessarily reflect the official position or policies of the U.S. Department of Justice. been published by the Department. Opinions or points of view expressed are those of the author(s) This document is a research report submitted to the U.S. Department of Justice. This report has not
comorbidity). In a review of substance abuse prevention intervention research, Cazares
(1 994) emphasized that the necessary strategies for a comprehensive prevention-
intervention research program should involve factors that address the needs of
individuals, families, peer groups and communities. He further highlighted the
importance of gender issues, cultural needs and community relevance in the development
of such programs. In addition, De La Rosa et a1 (1 993) have recommend that
community-based approaches based on qualitative and quantitative methods that
incorporate members of the community are central features of a well-developed
intervention.
In 1993 the staff of the Prevention Research Branch, National Institute on Drug Abuse
(N.1.D.A) developed a series of five research objectives for those conducting scientific
investigations in the preventiodintervention field. Several of these objectives and
proposed strategies involve the development of programs that focus on high-risk,
culturally diverse strategies encompassing multiple program elements with the inclusion
of control populations (Prevention Research Branch, 1993). The intervention program
highlighted herein is a timely response to these emerging research strategies. This
program incorporates the implicit theory underlying the development of Fighting Back (a
national program) where the basic premise is that community-based partnerships
incorporating multiple strategies are most likely to succeed in the struggle against the
complex issues involved in substance use supply and demand (Jellinek and H e m , 1991).
This philosophy is also similar to that proposed by the federal government's Community
Partnership Programs (CSAP, 1996).
7
and do not necessarily reflect the official position or policies of the U.S. Department of Justice. been published by the Department. Opinions or points of view expressed are those of the author(s) This document is a research report submitted to the U.S. Department of Justice. This report has not
Miracle Village I
The intervention program proposed in this project is an extension of "Miracle Village", a
Cleveland based recovery community for women and their children living in public
housing (Graham et al, 1997). Miracle Village is a comprehensive substance-abuse
treatment program that uses gender specific family-focused therapeutic approaches
towards the development and maintenance of drug-free lifestyles. Briefly, the program
components include substance abuse treatment, day care, parenting programs, vocational
training and job placement, spirituality, and wellness training. There are three phases to
this two-year program. Phase I consists a pre-treatment phase where there are two
weekly groups and a formal assessment is conducted. Phase I1 consists of a 3-month
intensive treatment program in Miracle Village which is a 30-unit apartment building.
The focus of this phase is intensive group-based therapy as well as individual therapy.
The third phase consists of the women and their children being transferred to Recovery
Village, a public housing project where they continue to receive comprehensive treatment
for 21 months.
Although in the early stages of evaluation, after 4 years of program implementation
Graham et a1 (1997) report that 63% of the 148 women who entered Miracle Village and
completed the initial treatment remain sober. The success of Miracle Village is due in
large part to the creative efforts of a primary health facility with expertise in chemical
dependence and a motivated housing authority. As such, this project serves as a role
i
and do not necessarily reflect the official position or policies of the U.S. Department of Justice. been published by the Department. Opinions or points of view expressed are those of the author(s) This document is a research report submitted to the U.S. Department of Justice. This report has not
model for the positive effects of community based partnerships. The only limitation of
this work is that it has yet to pass scientific scrutiny.
The intervention program proposed herein builds on the strengths of Miracle Village. In
addition to the use of a comprehensive service package, it expands upon their program by
adding in other community partners, and by building in extensive police involvement in
order to create a safe environment as well as one that promotes drug-fiee lifestyles. What
sets apart the present investigation is that it is designed as a controlled study to evaluate
the efficacy of the intervention program using both process and outcome evaluation.
9
and do not necessarily reflect the official position or policies of the U.S. Department of Justice. been published by the Department. Opinions or points of view expressed are those of the author(s) This document is a research report submitted to the U.S. Department of Justice. This report has not
CHAPTER 2 Research Design and Methodology
Overview
The conceptual framework for this study involves a multifaceted approach towards the
reduction of substance use/abuse and its related sequelae (e.g. poverty, unemployment,
crime, victimization, poor mental and physical health, loss of children). The
methodology employed involves a quasi-experimental design with an experimental (Le.
intervention) group and a control group (Le. non-invention). The evaluation design is
both process and outcome oriented incorporating a longitudinal element and involves the
collection of both qualitative and quantitative data. The principal element of the
intervention program is the availability of a comprehensive human service program,
enhanced community policing and supportive community organizing. The
comprehensive human service program encompasses multiple strategies that address the
unique characteristics of the housing complex including cultural sensitivity and
community structure and participation.
Families F.1.R.S.T
Families Involved and Revived Stay Together (F.1.R.S.T) is a family support and
empowerment program designed to help families become self-sufficient and reduce drug
activity within the public housing community. The program is designed to help
individuals and their families that are at risk due to drug involvement, near the end of
their 2 1 months of Temporary Family Assistance, un-employed or significantly
underemployed and affected by the environmental hazards of alcohol and substance
abuse. The services provided by Families F.1.R.S.T are highlighted in the figure below
10
and do not necessarily reflect the official position or policies of the U.S. Department of Justice. been published by the Department. Opinions or points of view expressed are those of the author(s) This document is a research report submitted to the U.S. Department of Justice. This report has not
and include case management and case coordination (with other service providers),
G.E.D. classes, child care, substance abuse and mental health referral? and treatment, job
training and employment services, police involvement and male-fatherhood involvement.
This intervention is novel for the following reasons:
0 The intervention is multidimensional capturing the complexity of substance abuse
issues including self-esteem and employment issues.
The program has removed significant barriers to treatment including
transportation and childcare issues by having these services made available on-
site.
The program depends on a high level of community organization (e.g. tenant
committee approval and participation) and extensive outreach (e.g. male
involvement and family support).
0
In order to maximize the opportunity for a reduction in drug-related crime and
drug activity, the police will maintain a high profile by actively engaging in
resident activities and by having a 24-hour physicalpresence within the housing
complex.
I
11
and do not necessarily reflect the official position or policies of the U.S. Department of Justice. been published by the Department. Opinions or points of view expressed are those of the author(s) This document is a research report submitted to the U.S. Department of Justice. This report has not
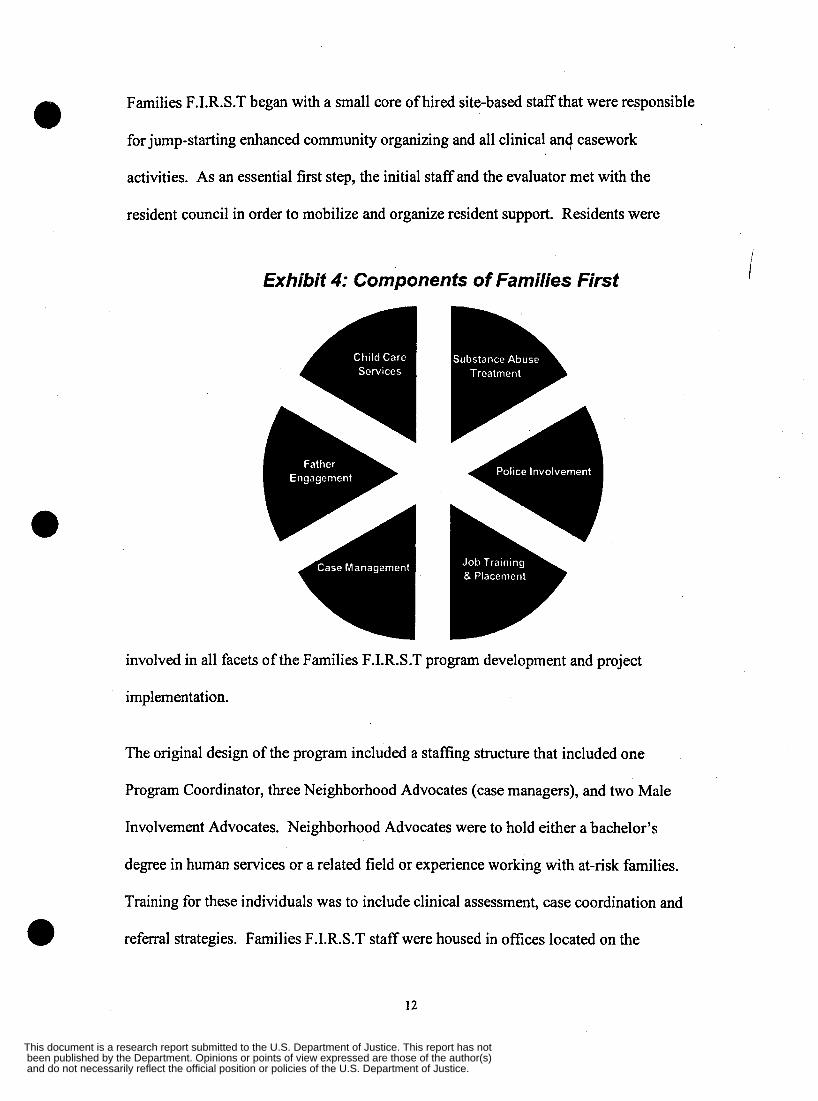
Families F.1.R.S.T began with a small core of hired site-based staff that were responsible
for jump-starting enhanced community organizing and all clinical anq casework
activities. As an essential first step, the initial staff and the evaluator met with the
resident council in order to mobilize and organize resident support. Residents were
Exhibit 4: Components of Families First
involved in all facets of the Families F.1.R.S.T program development and project
implementation.
The original design of the program included a staffing structure that included one
Program Coordinator, three Neighborhood Advocates (case managers), and two Male
Involvement Advocates. Neighborhood Advocates were to hold either a bachelor’s
degree in human services or a related field or experience working with at-risk families.
Training for these individuals was to include clinical assessment, case coordination and
referral strategies. Families F.1.R.S.T staff were housed in ofices located on the
I
12
and do not necessarily reflect the official position or policies of the U.S. Department of Justice. been published by the Department. Opinions or points of view expressed are those of the author(s) This document is a research report submitted to the U.S. Department of Justice. This report has not
intervention site. The initial target goals of the staff were to use community organizing
strategies, to engage the resident council, and conduct the base line needs assessment in
the residents homes as a way of gathering needed information and introducing the
Families F.1.R.S.T concept on an individual basis. Families that were identified in need
during the time of the needs assessment became part of the case management docket of
the staff. The case management and outreach focus were built upon the models of
Brandis and Theidon (1 997) that is specific to the needs of substance abusing women and
their families.
Characteristics of the Intervention Site
Quinnipiac Terrace (QT) is a housing authority complex that at baseline was comprised
of approximately 250 female-head-of-households and their approximate 500 additional
family members. The housing complex is located several miles from the heart of the City
of New Haven and is in a semi-isolated location on the banks of the Quinnipiac river, in
the district of town known as Fair Haven. Although exact estimates of the magnitude of
the alcohol and drug problem within this complex have never been determined, the
Housing Authority has estimated that the prevalence of substance use and misuse is
approximately 15% in housing projects within the City of New Haven. A meeting among
members of the tenant council for Quinnipiac Terrace revealed that this statistic was a
gross underestimate of the magnitude of the problem given that they believed that most
tenants have problems with alcohol use and that a substantial proportion of women were
using drugs on a regular basis. Included in the Appendix are police calls for service GIS
maps that highlight the district of Fair Haven (the encircled hot spots at the far right) that
demonstrate that this area is a high crime area.
13
and do not necessarily reflect the official position or policies of the U.S. Department of Justice. been published by the Department. Opinions or points of view expressed are those of the author(s) This document is a research report submitted to the U.S. Department of Justice. This report has not
Characteristics of the Control Site
McConnaughy Terrace is a public housing complex located in the City of New Haven's
far western comer on the opposite side of town from the intervention site. It is comprised
of approximately 180 female head-of-household tenants and their 350 family members,
the majority of whom are young children. It is directly comparable to the intervention
site in terms of race, family composition, crime statistics and the number of women that
are welfare recipients. There are currently few social service activities underway within
this housing complex and no additional police have been added to this neighborhood.
The sampling frame includes all households in McConnaughy Terrace.
Data Collection Strategy
Baseline Data
A 'Needs Assessment Survey' was designed to gather preliminary data on a broad range
of problems that occurred within the housing complex. A primary goal of the baseline
assessment was to determine if the program as designed would be sufficient to meet the
needs of the residents. The survey incorporated questions from all aspects of the
intervention program including those regarding: 1) demographics; 2) general health; 3)
family composition; 4) day care needs; 5 ) employment status and current earned income
level; 6) welfare status (e.g. length of time on welfare and status within the Connecticut
2 1 -month TANF time limit); 7) neighborhood violence; 8) police presence and safety
issues; 9) knowledge of substance related problems in their community; and 10)
accessibility to treatment. Several of the questions in the survey were drawn from the
14
and do not necessarily reflect the official position or policies of the U.S. Department of Justice. been published by the Department. Opinions or points of view expressed are those of the author(s) This document is a research report submitted to the U.S. Department of Justice. This report has not
National Household Survey of Drug Abuse (Substance Abuse and Mental Health
Services Administration, 1994), the National Comorbidity Survey (Kessler et al, 1996)
and the Monitoring the Future Study (Johnston et al, 1993). The inclusion of such
questions allow for comparisons to be made beyond the local level. Moreover, the
advantages of including questions that have been used at the national level include
previously established reliability and validity data and in some instances cultural
appropriateness.
After the survey was developed a focus group was held with residents fiom the tenant
council at Quinnipiac Terrace. Following the inclusion of the council’s recommendations
on the next draft, the data were piloted on a small sample of residents.
The baseline surveys were administered by the staff of Families F.1.R.S.T in the homes of
residents. The staff conducting the survey’s was a way in which they could begin
extending outreach activities to the community and use the survey as a means of
introducing themselves to individual residents. The sequence of events for training staff
on survey administration included: 1 ) orientation to the survey by describing the goals
and objectives and why this needs assessment information would be useful to the staff; 2)
review of the survey and its components by section; 3) review of coding issues; 4) tips on
good interviewing skills (including how to work with individuals who refbse to answer
questions andor participate); 5) personal safety and confidentiality; 6 ) mock interviews;
and 7) partnered interviewing and review.
15
and do not necessarily reflect the official position or policies of the U.S. Department of Justice. been published by the Department. Opinions or points of view expressed are those of the author(s) This document is a research report submitted to the U.S. Department of Justice. This report has not
The baseline survey that was used at the control site was a shortened version of the needs
assessment survey. A key resident was identified to assist with survey administration and
she was trained in the same manner as the Families F.I.R.S.T. staff. This resident was
identified among her peers as being an elder leader in the community who was very much
respected among the residents.
Follow Up Data (I2 and 18 months)
Two follow up time points occurred after the initial baseline assessment. These follow
up surveys were in the same general format as the baseline survey (e.g. in terms of
question content) with the goal of drawing comparisons across time. In addition to the
survey, other indicators of program success were evaluated including the number of
residents entering treatment, crime statistics, as well as a number of other indicators (see
Table 1 below). The survey’s were conducted by the Families F.1.R.S.T case
management staff as well as Male Engagement Advocates that were eventually hired.
Emphasis occurred on fostering habits for full documentation and appropriate
management of all information related to the Project, both on an individual client and
community aggregate level. In order to ensure standardization and appropriate client
interaction, the investigator trained and observed all staff associated with this project and
project clinical staff supervised Neighborhood Advocates around client assessment and
service delivery protocols throughout the life of the project.
I I
Crime Data
Crime statistics were obtained from the New Haven police department and include the
total number of crimes that occurred within the boundaries of the intervention and control
16
and do not necessarily reflect the official position or policies of the U.S. Department of Justice. been published by the Department. Opinions or points of view expressed are those of the author(s) This document is a research report submitted to the U.S. Department of Justice. This report has not
sites. The total numbers of crimes are broken down by category according to whether
they are substance-related events andor whether they include acts of vandalism, violence
or victimization.
Procedures of Analysis
Aside from the descriptive statistics that will be generated during process evaluation, the
general analytic strategy involves comparisons between and within the intervention and
control sites at both baseline and follow-up intervals.
The key objectives of this study were to demonstrate:
1. A significant increase in the proportion of residents entering and completing
intervention services; and
2. A reduction in substance related activities and crime post-intervention.
These objectives will be accomplished by observing:
A sign9cant increase in the number of residents entering and completing services
at the intervention site comparing baseline information to follow-up at 6, 12 and
I 8 months.
0 A signijicant reduction in substance-related activities and crime within the
intervention site when comparing baseline factors to follow-up at 6, 12 and 18
months.
A significant difference between the intervention and control sites with respect to
the numbers of substance-related activities and crimes post-intewention.
17
and do not necessarily reflect the official position or policies of the U.S. Department of Justice. been published by the Department. Opinions or points of view expressed are those of the author(s) This document is a research report submitted to the U.S. Department of Justice. This report has not
Process Evaluation
The data generated during process evaluation is specific to the intervention site and
consists of descriptive analyses of log book entries, self-report checklists, frequency,
duration and quality of contacts made with individuals, and degree of involvement. For
most of these analyses the simple comparison group will be factors that distinguish
between those who enter treatment vs those who do not (in terms of the factors
mentioned above), so simple frequencies and means will be generated. The primary
purpose of these analyses is to generate constructive qualitative or quantitative feedback
at the programmatic level or to individual staff members so that changes can be made to
the elements of the intervention program andor that staff may receive hrther training
and advise.
I
Outcome Evaluation
The general analytic strategy for the outcome evaluation is highlighted below according
to the evaluation issues that will be addressed. These questions or directional hypotheses
have been sectioned according to whether the comparisons are being drawn between or
within the intervention and control sites and whether longitudinal comparisons are drawn.
Most of the analyses will take the form of simple univariate and bivariate statistics using
the SPSS statistical package.
i
18
and do not necessarily reflect the official position or policies of the U.S. Department of Justice. been published by the Department. Opinions or points of view expressed are those of the author(s) This document is a research report submitted to the U.S. Department of Justice. This report has not
CHAPTER 3 Results: Baseline
Overview
Phase I of this proposal involved conducting a Needs Assessment Survey comprised of
questions regarding: i) demographics; ii) general health; iii) family composition; iv) day
care needs and interest in father engagement; v) employment status and current earned
income level; vi) welfare status (e.g. length of time on welfare and status within the
Connecticut 2 1-month TANF time limit); vii) neighborhood violence; viii) police
presence and safety issues; ix) knowledge of substance related problems in their
community; and x) accessibility to treatment. Some of these questions were drawn from
National Surveys in order to enhance reliability and validity as well as compare local data
to national statistics.
Of the total of 250 units at Quinnipiac Terrace (QT) 175 households were identified and
represented by this survey. The target population were head-of-households with the
results demonstrating that the majority of individuals interviewed were heads-of-
households (>80%). It was noted by the Families FIRST staff that there were 28 vacant
and 6 offline units during the time that they were conducting the surveys. A total of 29
individuals refiised to participate and 12 households were not represented due to inability
of the Families FIRST staff to successfilly reach them.
The control site, McConnaughy Terrace (MT), was chosen for its similarity in
characteristics to Quinnipiac Terrace in that the majority of residents were single, female-
19
and do not necessarily reflect the official position or policies of the U.S. Department of Justice. been published by the Department. Opinions or points of view expressed are those of the author(s) This document is a research report submitted to the U.S. Department of Justice. This report has not
heads-of households with many children under the age of 10 years of age. Of the total of
approximately 18 1 units at McConnaughy Terrace, 80 households were identified and
represented by this survey. All of those interviewed were adult heads-of-households.
The results of the baseline survey as summarized below demonstrate the critical need of
intervention services and strategies within these impoverished housing development and
validate the original design of the intervention program.
Demographic Character isti cs
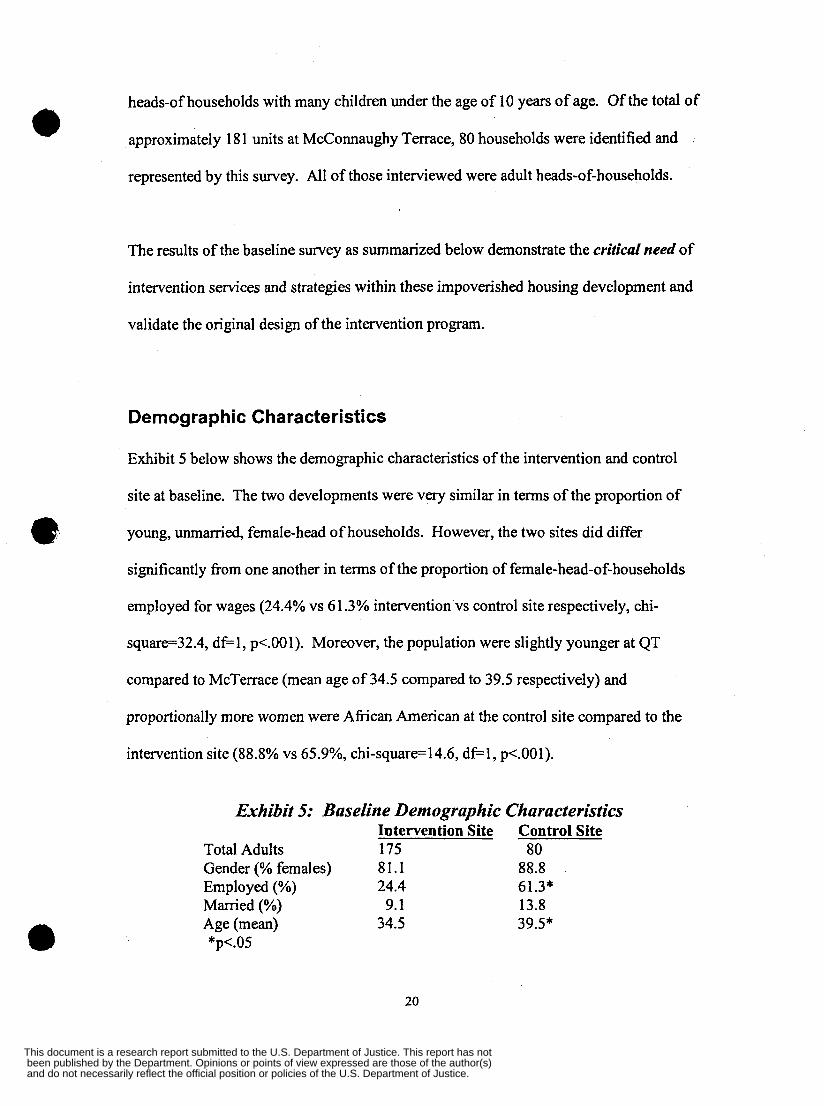
Exhibit 5 below shows the demographic characteristics of the intervention and control
site at baseline. The two developments were very similar in terms of the proportion of
young, unmarried, female-head of households. However, the two sites did differ
significantly from one another in terms of the proportion of female-head-of-households
employed for wages (24.4% vs 61.3% intervention vs control site respectively, chi-
square=32.4, d e l , p<.OOl). Moreover, the population were slightly younger at QT
compared to McTerrace (mean age of 34.5 compared to 39.5 respectively) and
proportionally more women were Afiican American at the control site compared to the
intervention site (88.8% vs 65.9%, chi-square=14.6, d e l , p<.OOl).
Exhibit 5: BaseIine Demographic Characteristics Intervention Site Control Site
Total Adults 175 80 Gender (% females) 81.1 88.8 Employed (%) 24.4 61.3* Married (%) 9.1 13.8
*p<.05 Age (mean) 34.5 39.5*
20
and do not necessarily reflect the official position or policies of the U.S. Department of Justice. been published by the Department. Opinions or points of view expressed are those of the author(s) This document is a research report submitted to the U.S. Department of Justice. This report has not
Residents were asked a question about their general health. Approximately 52% of the
residents reported very good to excellent health, 44% reported fair to good health and
only 4% reported poor health. Approximately 8 1 % of the residents were receiving health
care coverage.
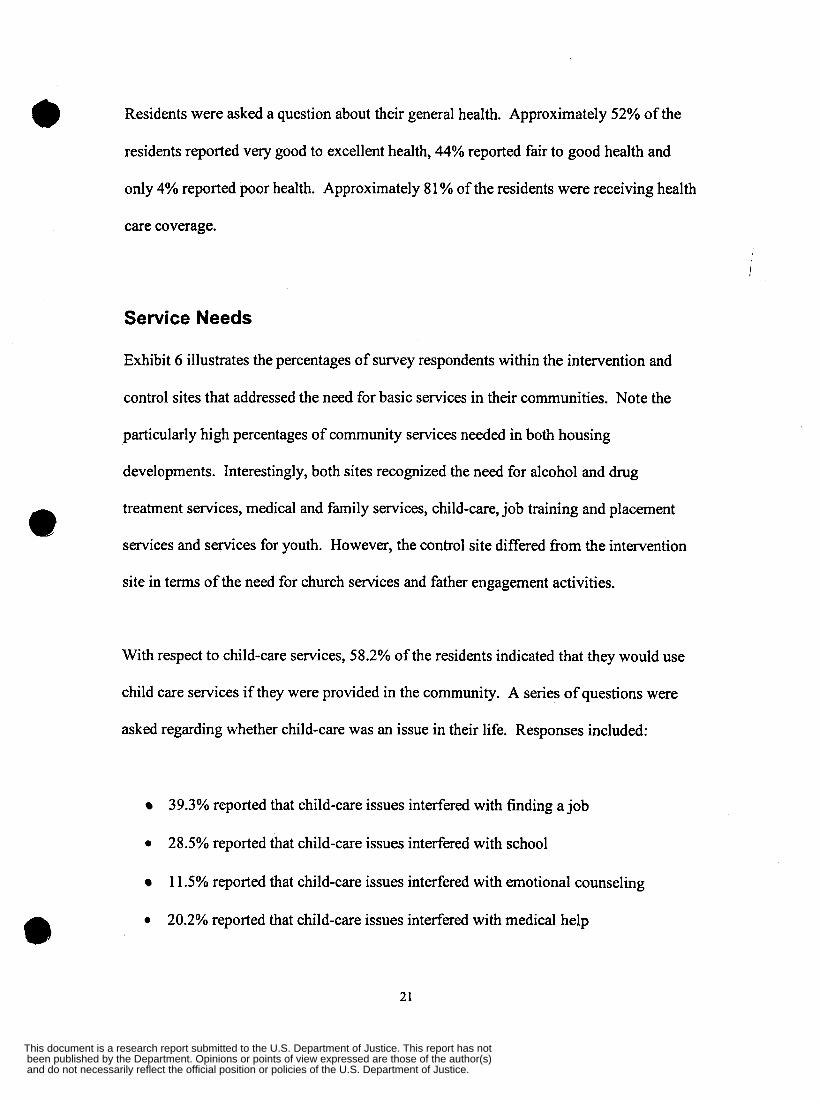
Service Needs
Exhibit 6 illustrates the percentages of survey respondents within the intervention and
control sites that addressed the need for basic services in their communities. Note the
particularly high percentages of community services needed in both housing
developments. Interestingly, both sites recognized the need for alcohol and drug
treatment services, medical and family services, child-care, job training and placement
services and services for youth. However, the control site differed fkom the intervention
site in terms of the need for church services and father engagement activities.
c
With respect to child-care services, 58.2% of the residents indicated that they would use
child care services if they were provided in the community. A series of questions were
asked regarding whether child-care was an issue in their life. Responses included:
39.3% reported that child-care issues interfered with finding a job
0 28.5% reported that child-care issues interfered with school
1 1.5% reported that child-care issues interfered with emotional counseling
0 20.2% reported that child-care issues interfered with medical help
21
and do not necessarily reflect the official position or policies of the U.S. Department of Justice. been published by the Department. Opinions or points of view expressed are those of the author(s) This document is a research report submitted to the U.S. Department of Justice. This report has not
0 10% reported that child-care issues interfered with drug/alcohol treatment
Exhibit 6: Community Sewices Needed
I V V
90 80 70 60 50 40 30 20 10 0
H Intervention
I3 Control
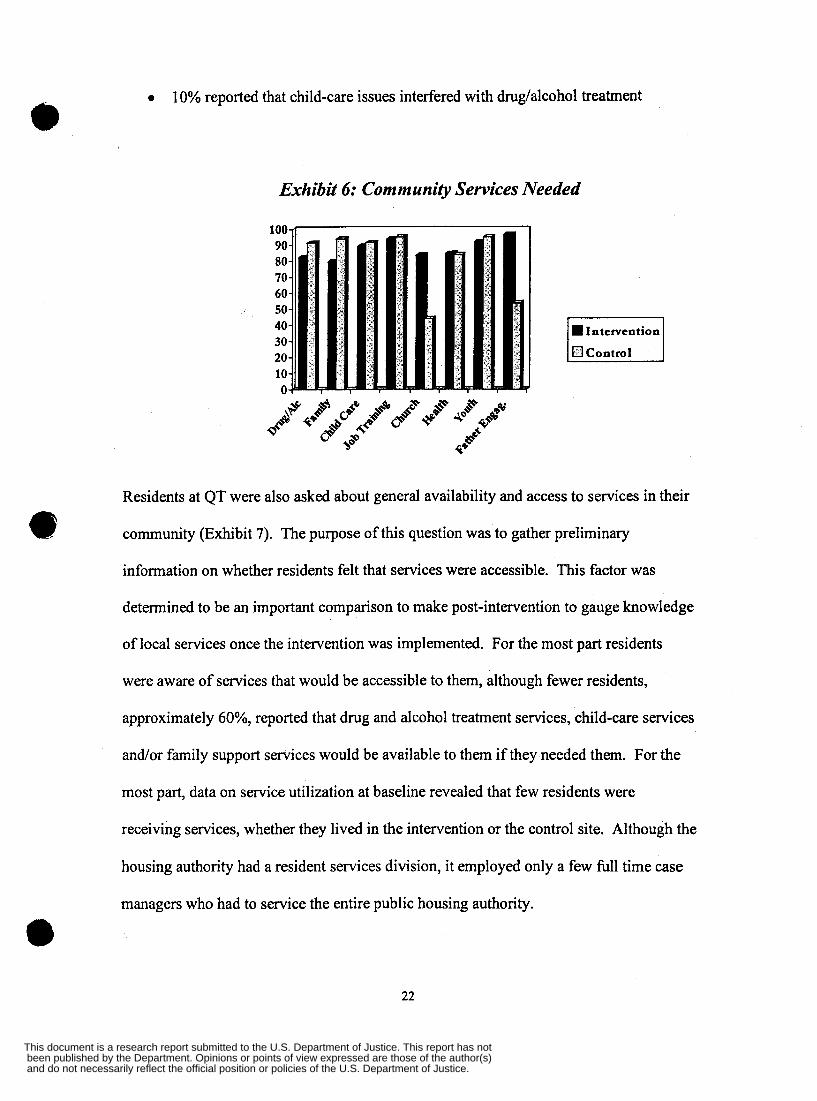
Residents at QT were also asked about general availability and access to services in their
community (Exhibit 7). The purpose of this question was to gather preliminary
information on whether residents felt that services were accessible. This factor was
determined to be an important comparison to make post-intervention to gauge knowledge
of local services once the intervention was implemented. For the most part residents
were aware of services that would be accessible to them, although fewer residents,
approximately 60%, reported that drug and alcohol treatment services, child-care services
and/or family support services would be available to them if they needed them. For the
most part, data on service utilization at baseline revealed that few residents were
receiving services, whether they lived in the intervention or the control site. Although the
housing authority had a resident services division, it employed only a few full time case
managers who had to service the entire public housing authority.
22
and do not necessarily reflect the official position or policies of the U.S. Department of Justice. been published by the Department. Opinions or points of view expressed are those of the author(s) This document is a research report submitted to the U.S. Department of Justice. This report has not
Exhibit 7: Baseline Intervention Site Access to Services
63 59 57
10 - 64 60 - 50 - 40 - 30 - 20 - 10 - 0 7
Problems in the Community
When residents at MT were asked about whether or not they lived in a safe environment,
interestingly 84.6% reported that they felt safe in contrast to QT residents where only
27.4% reporting feeling safe in their environment (chi-squar~7 1 1.4, de2 , p<.OOOl).
Paradoxically, when MT residents were asked if they needed more police involvement in
their community, significantly more residents reported the need for more police
compared to QT (95.0% vs 75.6% respectively, chi-square=l4.8, df-2, p<.Ol). Of
interest at the control site is that in the past year several major drug arrests including
major gang clean up had occurred, which may have accounted for the increased feeling of
safety.
Exhibit 8 illustrates the magnitude of the problem behaviors that residents at QT report.
Residents at baseline noted the particularly high proportions of drug abuse, drug selling,
alcohol abuse and violence in their community. In addition, 68.4% of residents reported
that they often observed drunk and/or high individuals in their community. The lack of a 23
and do not necessarily reflect the official position or policies of the U.S. Department of Justice. been published by the Department. Opinions or points of view expressed are those of the author(s) This document is a research report submitted to the U.S. Department of Justice. This report has not
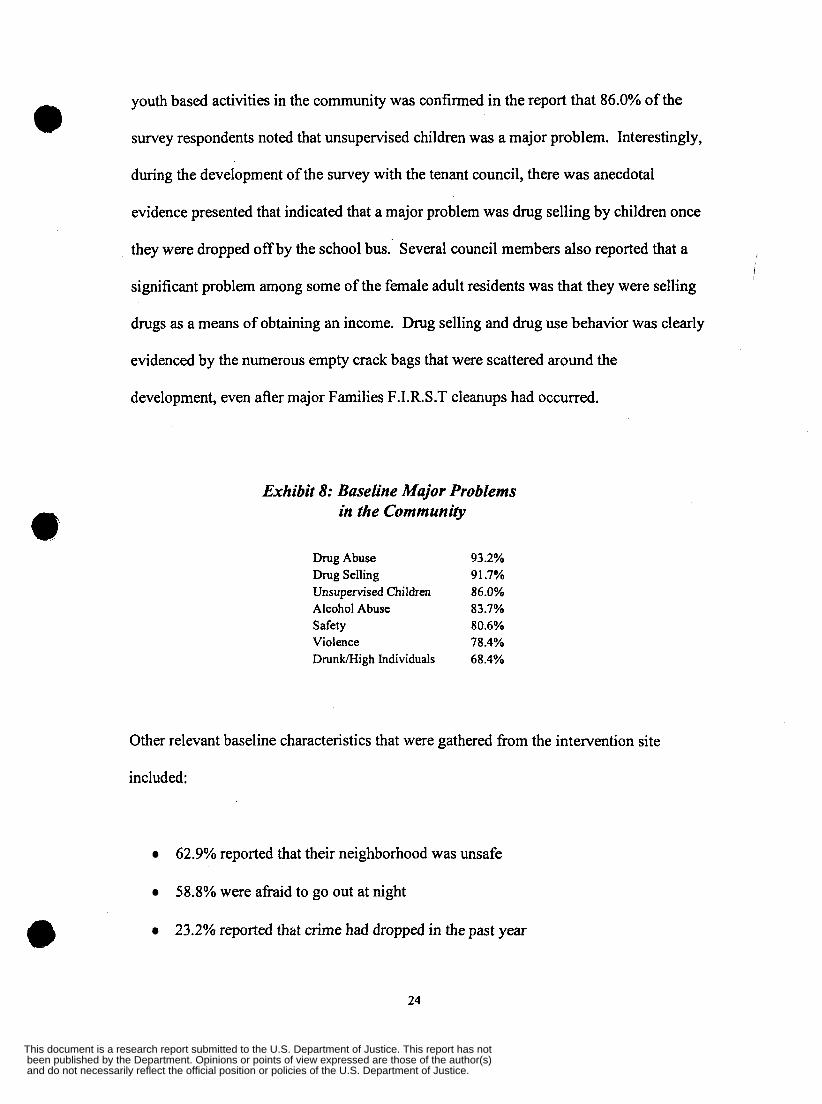
youth based activities in the community was confirmed in the report that 86.0% of the
survey respondents noted that unsupervised children was a major problem. Interestingly,
during the development of the survey with the tenant council, there was anecdotal
evidence presented that indicated that a major problem was drug selling by children once
they were dropped off by the school bus. Several council members also reported that a
significant problem among some of the female adult residents was that they were selling
drugs as a means of obtaining an income. Drug selling and drug use behavior was clearly
evidenced by the numerous empty crack bags that were scattered around the
development, even after major Families F.1.R.S.T cleanups had occurred.
I
Exhibit 8: Baseline Major Problems in the Community
Drug Abuse 93.2% Drug Selling 91.7% Unsupervised Children 86.0% Alcohol Abuse 83.7% Safety 80.6% Violence 78.4% Drunmigh Individuals 68.4%
Other relevant baseline characteristics that were gathered fi-om the intervention site
included:
62.9% reported that their neigh,orhood was unsafe
58.8% were afiaid to go out at night
23.2% reported that crime had dropped in the past year
24
and do not necessarily reflect the official position or policies of the U.S. Department of Justice. been published by the Department. Opinions or points of view expressed are those of the author(s) This document is a research report submitted to the U.S. Department of Justice. This report has not
0 46.3% often heard a fight where a weapon was used
0 51.1% reported that it was very easy to get marijuana 1
0 57.6% reported that it was very easy to get cocaine
0 26.1 % reported that it was very easy to get heroin
0 65.7% believed that it was people from the community buyinglselling drugs (not
themselves)
37.7% felt that police had a high enough profile in their community 0
Interestingly, the reporting of personal alcohol and/or drug use as well as responses to
questions regarding problematic use were minimal. This was not too surprising given
that residents were self-reporting alcohol and drug use to an interviewer whom they had
not met previously coupled with the fact that drug use on housing authority property
would be grounds for eviction. This led the Families F.1.R.S.T staff to request a waiver
from the housing authority whereby residents that reported use and/or abuse would not be
reported to housing authority staff if identified through Families F.1.R.S.T if the resident
agreed to engage in treatment services. Similarly, residents that were identified through
the housing authority as ‘one-strike’ offender’s, would be given the option of entering
services.
Baseline Crime Stat is t ics
Close to the time that the intervention
coverage at QT, partly in response to the Families FIRST intervention. In addition to the
tenant council having regular meetings with the local Sergeant, officers also regularly
the police department had stepped up
I
25
and do not necessarily reflect the official position or policies of the U.S. Department of Justice. been published by the Department. Opinions or points of view expressed are those of the author(s) This document is a research report submitted to the U.S. Department of Justice. This report has not
participated in Families FIRST meetings. Around the time that the intervention began
QT had 24-hour coverage that consisted of two police officers covering a beat from 7 pm
to 3 am. A patrol car then provided coverage during the remaining hours. Interestingly,
this new coverage took effect in late October, just before the intervention began, yet the
residents reported in the survey’s that they would like to see more coverage.
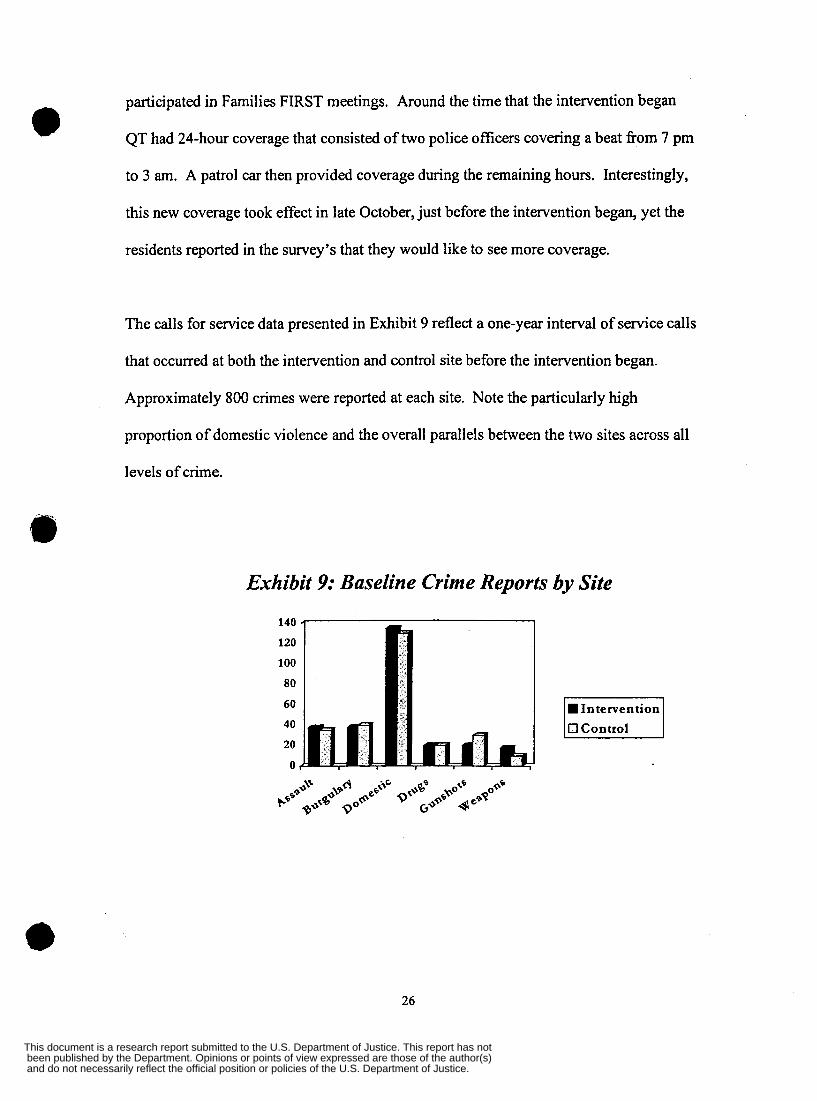
The calls for service data presented in Exhibit 9 reflect a one-year interval of service calls
that occurred at both the intervention and control site before the intervention began.
Approximately 800 crimes were reported at each site. Note the particularly high
proportion of domestic violence and the overall parallels between the two sites across all
levels of crime.
Exhibit 9: Baseline Crime Reports by Site
140
120
100
80
60
40
20
0
Intervention 0 Control
26
and do not necessarily reflect the official position or policies of the U.S. Department of Justice. been published by the Department. Opinions or points of view expressed are those of the author(s) This document is a research report submitted to the U.S. Department of Justice. This report has not
Environmental Assessments
Intervention Site
Quinnipiac Terrace is an isolated housing development, located alongside the Quinnipiac
River approximately 3 miles fiom downtown New Haven. Quinnipiac Terrace built in
the early 1950’s, is located within the Fair Haven district of New Haven, which is well
known for its Latino population. Within a one-mile walking distance are the closest
convenience and shopping stores, laundry services and health clinic. A major complaint
for residents is the inaccessibility that they have to local transportation services,
especially during the evening hours. The housing units themselves were built in the
1950’s and are in desperate need of renovation. Housing units that are not currently
occupied are boarded up which enhances the unpleasantness of the environment. All of
the housing units were low-rise units, a maximum of two stories high. There were
approximately 25 unit blocks of multiple units that were spaced apart. The central focus
of the development was a two-story community center that had a large community room
and kitchen used for social fimctions and several second story offices that had been
habitually used by the tenant council and the occasional community services programs
(e.g. truancy program). In terms of the stability of the residents, interestingly, over 25%
of the survey respondents reported that they had lived in public housing for over 10 years.
Using an environmental assessment that parallels that used by Greene et a1 (1 998) in the
Philadelphia 1 1 th Comdor community policing intervention project, the following
i
physical characteristics of QT were noted (hll description is provided in the Appendix):
27
and do not necessarily reflect the official position or policies of the U.S. Department of Justice. been published by the Department. Opinions or points of view expressed are those of the author(s) This document is a research report submitted to the U.S. Department of Justice. This report has not
a
There was litter all around the community center including papers, wrappers,
broken and unbroken bottles as well as empty crack bags scattered around.
There is a dumpster located behind the community center with garbage lying
around it. The smell coming from the dumpster was extremely strong.
There is litter including a lot of broken glass throughout the parking area.
Lighting around the development was poor and intermittent with no specific lights
for the walkways.
On some buildings, there are spotlights on one end of the buildings and they were
mostly shattered.
In between each set of buildings, there are two sets of three clotheslines for the
residents.
Some apartments have boards on the windows and some had broken windows.
There is graffiti on some of the buildings but not all of them.
I
I
I
Control Site
McConnaughy Terrace is physically less isolated from the downtown core than QT in
that it is located approximately 1.5 miles on a major bus route. Although convenience
stores, laundry services and other basic services are not directly adjacent to the
development they are easily accessible by walking. Similar to QT, MT is also low rise
arranged in sparse looking, barren unit blocks with a central community center that is
also two stories. Interestingly, a major outpatient drug and alcohol treatment program is
located adjacent to the development, but there is no specific outreach conducted by the
center. Many of the housing units at MT had been tom down over the last several years
28
and do not necessarily reflect the official position or policies of the U.S. Department of Justice. been published by the Department. Opinions or points of view expressed are those of the author(s) This document is a research report submitted to the U.S. Department of Justice. This report has not
in response to the need to make the developments smaller overall and more manageable.
The random scattering of barren dry, garbage infected fields that were left behind
following demolition added to the unpleasantness of this development. Similar to QT
there were few if any youth recreational activities available aside from a small basketball
court that was littered with trash and broken glass. Other characteristics of the
development that were noted on the environmental assessment included:
0 Litter and trash were scattered around the development except for around the
community center whose upkeep was the part of a single senior citizen and
children that she worked with in keeping the area clean
0 Although there were lights around, they were sparsely located
0 Graffiti and trash were scattered in various places around the development
29
and do not necessarily reflect the official position or policies of the U.S. Department of Justice. been published by the Department. Opinions or points of view expressed are those of the author(s) This document is a research report submitted to the U.S. Department of Justice. This report has not
CHAPTER 4 Results: Process Evaluation
Needs Assessment Survey Design and Implementation
Although the project was awarded in July of 1998, the notice of award and hnding for
this project did not begin at Yale until October ls'and charging instructions were made
available to the Principal Investigator at the beginning of November. In late September
and early October the Needs Assessment was drafted and pilot tested among staff of
Fighting Back, executive staff within the Housing Authority, and members of the tenant
council at the housing project where the intervention would be conducted, Quinnipiac
Terrace. It was around this time that the name of the intervention strategy changed fiom
Families F.1.R.S.T (Preparing and Organizing Women for Employment and Recovery) to
Families FIRST (Families in Recovery to Sustainability) in order to reflect the fact that
men play a significant role in women's lives and that the road to self-sufficiency for
impoverished families must include the entire family. The staff members of the Families
FIRST intervention program were hired in late October (a Project Coordinator, 2 full-
time and 2 part-time outreach workers and 2 full-time male engagement advocates).
After several weeks of orientation and preparatory work, including training on the survey,
the staff of Families FIRST began to conduct the survey's. Progress was briefly
interrupted during December when the staff moved into new space in the housing project.
In December, the Principal Investigator attended an NIJ meeting where preliminary
results of the survey were presented.
30
and do not necessarily reflect the official position or policies of the U.S. Department of Justice. been published by the Department. Opinions or points of view expressed are those of the author(s) This document is a research report submitted to the U.S. Department of Justice. This report has not
0 In early January, after the Families FIRST staff had conducted approximately 20 more
survey’s (of a total of 80) it became apparent that staff productivity was slowing and that
there were a number of survey’s being returned without the alcohol and drug section
having been completed. A meeting was called to address these issues and the staff raised
concerns regarding these questions as well as those involving the reporting of criminal
activities. They believed that the way in which some of the questions were worded
compromised their safety and that many of the residents refused to answer the alcohol
and drug questions because it was none of the staffs business. In addition, they felt that
some of the questions were redundant and that several questions could be dropped. In
response to their concerns the survey was revised.
It was also noted during discussions with the staff that they were spending considerable
time on case management issues rather than gathering surveys. In response to this
concern, all staff were informed that all efforts be devoted to gathering survey
information so that informed programmatic decisions could be made. By the end of
February, all of the surveys were completed. It is important to note that when residents
were identified with needs that required immediate attention, the Families FIRST staff
were instructed to attend to these needs. For example, several residents reported that they
would like to receive substance abuse treatment, and priority was placed on finding
available treatment.
i
The mechanism in place for identifying and referring clients was through the Project
Coordinator who reviewed each survey. Case management protocols were developed
31
and do not necessarily reflect the official position or policies of the U.S. Department of Justice. been published by the Department. Opinions or points of view expressed are those of the author(s) This document is a research report submitted to the U.S. Department of Justice. This report has not
based on the surveys as well as through more extensive follow-up interviews with the
residents by the case managers whenever a problem area was identified.
Validation of the Need for the Clinical and Non-Clinical I n t ewe n t i ons
The results of baseline survey supported the original design of the intervention services
and strategies at Quinnipiac Terrace. Although the intervention was designed in advance
of the Needs Assessment Survey, it was important to all stakeholders to demonstrate that
all of the components originally identified were in fact needed. For example, there were
some concerns that assumptions were made about the need for child- care services when
there were no numbers available on who would use such services. Similarly, there was
no information available on those who might want GED certification or job training and
placement services. Within a few weeks following completion of the baseline surveys,
the data were entered, error checked and preliminary analyses were conducted. Baseline
results indicated that all of the original components of the intervention were needed at a
rate much higher than anticipated, with the exception of an intensive intervention
involving health care services because the general health of the population surveyed was
fair to excellent. Of particular concern at baseline was the high percentage reporting
domestic violence reported. The staff were aware of domestic violence as an important
issue, and this was routinely addressed with clients.
32
and do not necessarily reflect the official position or policies of the U.S. Department of Justice. been published by the Department. Opinions or points of view expressed are those of the author(s) This document is a research report submitted to the U.S. Department of Justice. This report has not
Factors that Lead to Delay in Implementing All Arms of the In te wen t ion
Child Care
Full implementation of Families F.I.R.S.T. within Quinnipiac Terrace was not without its
shortcomings and delays. Although case management services were made available early
in the intervention, it took considerable time and energy to implement on-site child-care
and substance abuse treatment services. Not only were contracts slow moving through
the City’s bureaucratic process, but considerable challenges were faced in identifylng and
then having space approved for child-care services within the housing project. Several
key spaces that were identified were later eliminated as viable space due to zoning issues
and inaccessibility to wheelchair access. The original plans called for full child-care
services with licensing and certification, however at the end of the first year of program
implementation a creative alternative strategy developed to address child care needs. All-
Our-Kin was a new innovative non-profit organization developed by a recent Yale law
* school graduate and several others to address child-care issues among low-income
families. The goal of the program was to train several mothers to become child-care
providers that would then be able to provide services within their own homes. In early
2000 the Program was made available to women living in QT and as of the summer of
2000 several women were trained to provide child-care services in the development. All-
Our-Kin has an on-site location to make it easily accessible to the women and families
that are trained. Although this program will take a few years to train enough women and
then provide services to the large number of families requiring child-care assistance in
the development, it proved to be an innovative strategy that employed women.
33
and do not necessarily reflect the official position or policies of the U.S. Department of Justice. been published by the Department. Opinions or points of view expressed are those of the author(s) This document is a research report submitted to the U.S. Department of Justice. This report has not
On-site Substance Abuse Services
The implementation of on-site substance abuse treatment services was particularly
problematic due to licensing issues and adequate funds to hire a clinical social worker.
The sixteen clients that were identified by case management staff during the first several
months of program implementation had to be referred to off-site inpatient and outpatient
substance abuse clinical services. It became apparent that in order to have treatment
services on site, the substance abuse treatment contractor would have to apply for on-site
licensure. This process would be a lengthy process that had to be addressed at the state
level. Therefore, in order to meet the needs of residents, it was decided to change the
model of service delivery to be one where a paraprofessional would work on-site with
residents and when need be the person would be referred to an outside treatment facility.
The on-site person developed a known presence within the housing development by
conducting workshops on stress management and by extensive outreach to individuals
with substance usdabuse issues. Eventually, she gained the trust of residents and was
able to identifL individuals within the development who would benefit fiom these
services. Interestingly, this proved to be a cost-effective way in which to address the
substance use/abuse problem. This staff person had office space at Families F.I.R.S.T,
participated in regular meetings with case management staff, and was supervised by a
clinician that was located at a central substance abuse treatment unit.
Father Engagement Activities
Although residents reported an interest in father engagement activities in the baseline
survey, it took considerable time to determine exactly what the activities would need to
be in order to meet the needs of men in the community. Demographically speaking, the
34
and do not necessarily reflect the official position or policies of the U.S. Department of Justice. been published by the Department. Opinions or points of view expressed are those of the author(s) This document is a research report submitted to the U.S. Department of Justice. This report has not
development included lease holders that were predominantly fernale, single-heads-of
households. Men were however always present in the development. The premise was
that many of the men observed were either related to the women, fathers of their children,
ex-spouses or significant others.
The concept of engaging fathers in the lives of their children was interesting, but the
Evaluator did not detect that a firm plan was in place at the beginning of the intervention.
For example, there was some discussion early on at Families F.1.R.S.T meetings that
male outreach workers would identify fathers of children that were in prison and assist
them in visitation. However, tactics for identifying these fathers was not clear and didn’t
materialize over the course of the evaluation period. Other discussions occurred around
organizing community activities for fathers. Indeed, over the course of the evaluation
period at least two high profile events occurred at the intervention site that provided
opportunities for fathers to engage and/or re-engage in the lives of their children: 1) a
faith based rally occurred with the goal of promoting family and faith with over 100
participants; and 2) local political leaders mobilized a large group of fathers and
discussed how important they were in the lives of their children (approximately 100
individuals). In addition to these activities the father engagement specialist attempted
support groups, father-child pizza events, basketball, among other activities.
General Health
The results of the baseline survey revealed that for the most part, residents were in good
health (95% reported fair to excellent health) and that the majority had health care
35
and do not necessarily reflect the official position or policies of the U.S. Department of Justice. been published by the Department. Opinions or points of view expressed are those of the author(s) This document is a research report submitted to the U.S. Department of Justice. This report has not
coverage (8 1 %). These were unexpected findings but may be a function of the young age
of the population and related to the fact that many women were receiving Temporary
Assistance For Needy Families (TANF) and thus were Medicaid eligible. The decision
to withhold comprehensive health based activities was withheld partly as a result of these
findings. However, QT did participate in an annual health fair, relationships were built
with Fair Haven Health Clinic (a local community health center), and the Yale University
School of Medicine in the fall of 2000 started visiting the development on a routine basis
with a mobile community health van to provide basic health screening and testing
services (e.g. blood pressure, diabetes, cholesterol) as well as dispense free medicines.
Staffing and Contractual Issues
The initial date of the entry of Families F.I.R.S.T. into the community was postponed by
several months while staffing was hired and space addressed with HANH. Within the
first year of project implementation the Project Coordinator gave two weeks notice and
moved away for family reasons and it took several months to find a replacement. Only
two of the original four case managers remained on staff at the 18-month evaluation.
The case managedoutreach workers were well matched to the population that they were
serving in terms of racelethnicity (one case worker was a bilingual Hispanic), previous
exposure (living and/or working) to public housing, and/or a previous problem with
alcohol and/or drug addiction. The requisite for employment as a case-worker was a
B.A. preferred and/or relevant work experience. The salaries for the case-workers was
approximately $25,OOO/yr and the positions were unionized with benefits.
e 36
and do not necessarily reflect the official position or policies of the U.S. Department of Justice. been published by the Department. Opinions or points of view expressed are those of the author(s) This document is a research report submitted to the U.S. Department of Justice. This report has not
The Project Coordinator position was a Master's level position. The first Coordinator,
had a Master's in Education and experience working with the indigent poor as part of the
Yale Child Study Center's family based home visit program. While savvy in case
management tactics, this person had limited management experience and was weak in
computer skills and data management and data tracking. In order to compensate for this
weakness, the Evaluator had to provide technical assistance to the staff through the
development of computerized data management and data tracking tools and then had to
train the Project Coordinator and staff. For the most part, the first year of data collection
and analysis was completed in paper-pencil format and it continued to be challenging to
have staff provide total counts to determine how well the program was doing in terms of
referrals and enrollment3. The replacement Project Coordinator had a composite skill set,
with a background in substance abuse that was ideal for working in this challenging
environment. However, there were issues raised about the supervisory skills of this
individual.
There were numerous challenges and obstacles that the staff of Families F.1.R.S.T and
Fighting Back had to face in setting up this program, notwithstanding the following:
Thepersonal beliefs of the initial Executive Director of HA" hired at the time
of the implementation of Families F.I.R.S.T. who did not believe that human
In order to calculate the fmal numbers at 18-months the Evaluator and staff had to review carefidly each of the monthly reports submitted by the staff over the entire intervention period. In the final analysis the most conservative estimates were chosen. The staff did not provide sufficient detail on the type of
37
and do not necessarily reflect the official position or policies of the U.S. Department of Justice. been published by the Department. Opinions or points of view expressed are those of the author(s) This document is a research report submitted to the U.S. Department of Justice. This report has not
services provided on-site would impact the quality of life of residents and that
Families F.1.R.S.T had to focus on employment and job training for residents
rather than substance abuse treatment. This particular Executive Director was
replaced by Professor Robert Solomon from the Yale Law School within the
first year. Professor Solomon and his staff from the outset have been extremely
supportive of the Families F.1.R.S.T program.
Contractual issues including the delay in time to organize and execute contracts
at City Hall. These delays led to a slow start in implementing job training and
employment opportunities on-site and the staff had to find creative ways of
identifying referral sources.
Ineffective communication between the Fighting Back office and Families
F.1.R.S.T office that wasn’t identified and partially rectified until late within the
first year of program implementation. Communication issues continued to occur
over the course of the Evaluation period with the Fighting Back ofice that led to
consistent delays in receiving funds to provide services.
0 Site-based issues including a significant delay in receiving telephone lines,
computers, printers, a fax machine and cell phones to ensure personal safety.
0
0
0 Contractor issues including concerns for personal safety associated with
providing some services on-site (e.g. Adult Education did not want to provide
evening GED classes and requested GED occur off-site).
0 Space was a major issue, particularly renovating space once identified for
programmatic activities.
substance abuse referrals that were made therefore specific counts of inpatient, outpatient and self-help group referrals are not available.
38
and do not necessarily reflect the official position or policies of the U.S. Department of Justice. been published by the Department. Opinions or points of view expressed are those of the author(s) This document is a research report submitted to the U.S. Department of Justice. This report has not
0 Engaging residents in crime watching activities proved to be problematic. The
local Sergeant had tried to engage the resident council in organizing community
block watches, but was unsuccessful. However, for a short time, the Sergeant
was able to organize the reopening of the police substation on-site with the use
of resident volunteers. Over time it became increasingly difficult to staff the
substation, although the idea was an excellent one.
Issues with the resident tenant council that included the identification of
substance use/abuse problems among council representatives. Interestingly, one
0
of the council members who completed substance abuse treatment later became
part of the Families F.1.R.S.T team as a volunteer initially and then later as a
paid employee using HANH drug elimination funds. Moreover, one of the
original case workers who left within the first year had been the President of the
Tenant Council and had worked with the Families F.1.R.S.T staff for a brief time
before she was hired into a higher paying position elsewhere, that allowed her to
move out of the development.
39
and do not necessarily reflect the official position or policies of the U.S. Department of Justice. been published by the Department. Opinions or points of view expressed are those of the author(s) This document is a research report submitted to the U.S. Department of Justice. This report has not
CHAPTER 5 Results: Across Multiple Time Points
Overview
The Families F.1.R.S.T intervention program was formally initiated at QT in late 1998.
The first set of follow-up surveys occurred in October 1999 and the final surveys were
conducted in the fall of 2000. Although QT started to downsize in 1999 with more units
coming omine, interestingly, 80% of the survey respondents at the 12 month follow-up
reported that they had lived at QT during the time of the baseline survey. Of these
individuals, 30.6% recalled having completed the survey before. At the time that the
final survey was conducted, 77.1 % reported having lived in the development previously,
with 50% having completed the survey before4.
This chapter is organized in the following way: 1) Selective summaries of the key survey
constructs are provided across the multiple time points at QT; 2) Service utilization data
as of year end 2000 are summarized for the Families F.1.R.S.T program; 3) Comparative
analyses are presented for the intervention and control site (e.g. 1998 and 2000 survey
data) and 4) Crime statistics across time.
It would have been of interest to analyze the data overtime using the same respondents (dependent sampling) however in order to ensure confidentiality, the investigators were not able to track this information. The fact that 50% of the sample recalled having completed the survey is surprising given the general fluid nature of housing authority residents. However, it does make it easier to attribute change to the intervention program.
40
and do not necessarily reflect the official position or policies of the U.S. Department of Justice. been published by the Department. Opinions or points of view expressed are those of the author(s) This document is a research report submitted to the U.S. Department of Justice. This report has not
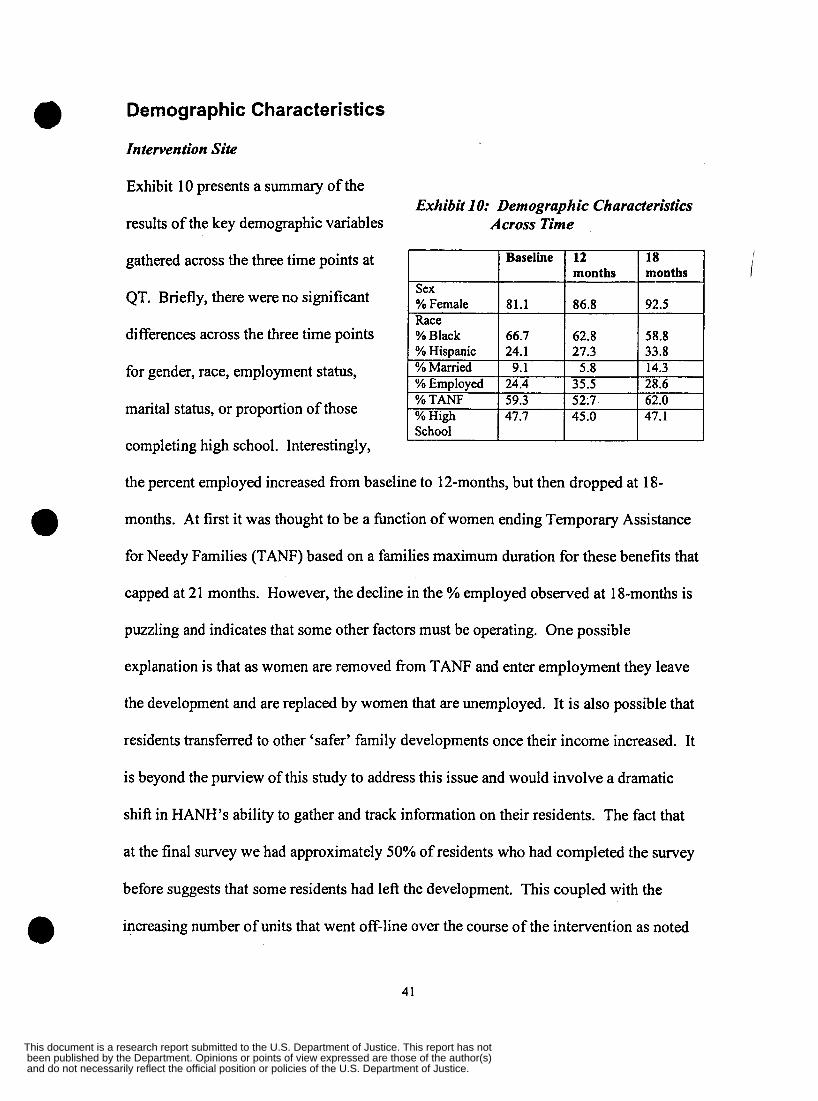
Demographic Characteristics
Intervention Site
Exhibit 10 presents a summary of the
results of the key demographic variables
gathered across the three time points at
QT. Briefly, there were no significant
differences across the three time points
for gender, race, employment status,
marital status, or proportion of those
completing high school. Interestingly,
Sex % Female Race % Black % Hispanic % Married
Exhibit 10: Demographic Characteristics Across Time
Baseline 12 18 months months
81.1 86.8 92.5
66.7 62.8 58.8 24.1 27.3 33.8 9.1 5.8 14.3
% Employed % TANF
24.4 35.5 28.6 59.3 5217 62.0
% High School
the percent employed increased from baseline to 12-months, but then dropped at 18-
months. At first it was thought to be a fbnction of women ending Temporary Assistance
for Needy Families (TANF) based on a families maximum duration for these benefits that
capped at 2 1 months. However, the decline in the % employed observed at 18-months is
puzzling and indicates that some other factors must be operating. One possible
explanation is that as women are removed from TANF and enter employment they leave
the development and are replaced by women that are unemployed. It is also possible that
residents transferred to other ‘safer’ family developments once their income increased. It
is beyond the purview of this study to address this issue and would involve a dramatic
shift in HANH’s ability to gather and track information on their residents. The fact that
47.7 45.0 47.1
I I
at the final survey we had approximately 50% of residents who had completed the survey
before suggests that some residents had left the development. This coupled with the
increasing number of units that went off-line over the course of the intervention as noted
41
and do not necessarily reflect the official position or policies of the U.S. Department of Justice. been published by the Department. Opinions or points of view expressed are those of the author(s) This document is a research report submitted to the U.S. Department of Justice. This report has not
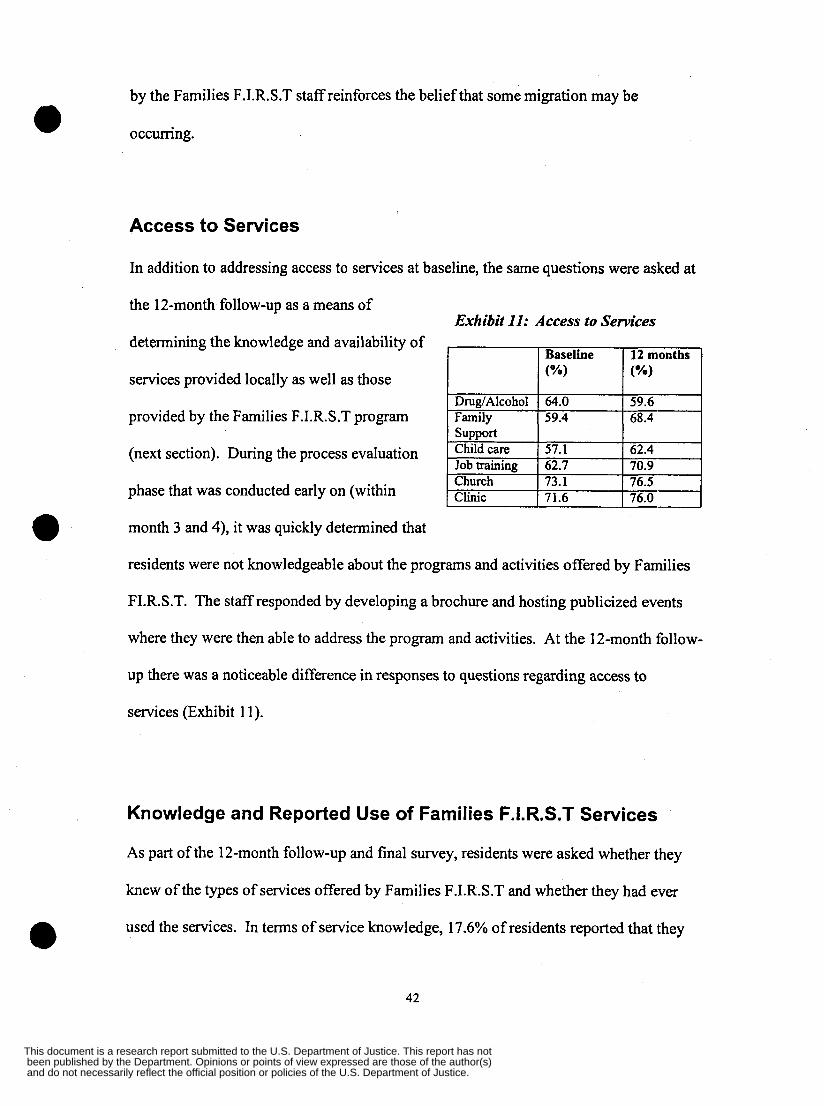
by the Families F.1.R.S.T staff reinforces the belief that some migration may be
e occurring.
Baseline (%I
Access to Services
In addition to addressing access to services at baseline, the same questions were asked at
12 months
the 12-month follow-up as a means of
determining the knowledge and availability of
services provided locally as well as those
provided by the Families F.1.R.S.T program
(next section). During the process evaluation
phase that was conducted early on (within
Job training Church Clinic
Exhibit 1 I : Access to Services
62.7 70.9 73.1 76.5 71.6 76.0
Family
Child care support
month 3 and 4), it was quickly determined that
residents were not knowledgeable about the programs and activities offered by Families
F1.R.S.T. The staff responded by developing a brochure and hosting publicized events
0
where they were then able to address the program and activities. At the 12-month follow-
up there was a noticeable difference in responses to questions regarding access to
services (Exhibit 11).
Knowledge and Reported Use of Families F.1.R.S.T Services
As part of the 12-month follow-up and final survey, residents were asked whether they
knew of the types of services offered by Families F.1.R.S.T and whether they had ever
used the services. In terms of service knowledge, 17.6% of residents reported that they a 42
and do not necessarily reflect the official position or policies of the U.S. Department of Justice. been published by the Department. Opinions or points of view expressed are those of the author(s) This document is a research report submitted to the U.S. Department of Justice. This report has not
knew that Families F.1.R.S.T was a program that could be used for drug and alcohol
support services and at 18-months this jumped dramatically to 45.7%. Similarly, over
time residents became aware of the program as a place where job training and placement
services were being offered (41.6% at 12-months vs 50% at 18-months) although only a
small proportion of residents took advantage of these services (1 5.7%) at 1 8-months.
I
Families F.1 R.S. T Service Utilization Data’
Baseline data revealed that very few residents were involved in social services programs
aside from the few that were involved on an as-needed basis with resident services.
Families F.1.R.S.T service utilization data was examined at 1 year post-intervention and
the following are highlights taken from these data:
1. The program at one-year was a highly utilized program in that four case managers
were serving 84 clients out of a possible pool of 150 adult head-of-households
and their respective adult family members.
2. Of the 84 clients that were examined at that point in time, 44 were identified as
‘high’ need clients. The typical profile of a client categorized as ‘high’ need was
a person who was engaged in substance abuse treatment services and/or
individual counseling, involved with DCF or probatiodparole, and was preparing
to enter a job training program or in need of GED certification.
The original service data tracking and monitoring system was problematic and included sporadic paper and pencil versions of client counts. It was not anticipated that the evaluator would have to work closely with the management staff to redesign the forms and train the core team to gather these data. It is possible that these total service counts are an underestimate of the number of clients seen over the course of the evaluation period.
43
and do not necessarily reflect the official position or policies of the U.S. Department of Justice. been published by the Department. Opinions or points of view expressed are those of the author(s) This document is a research report submitted to the U.S. Department of Justice. This report has not
3. Of the 84 clients, 40 were characterized as ‘moderate/low’ need. A typical profile
of this person might include the need for job training, individual counseling
and/or child care services.
Although the program was not able to provide on-site clinical substance abuse and mental
health services due to contracting and licensure issues, a full-time certified substance
abuse case management specialist had been hired approximately 9 months into the
program to conduct extensive outreach to clients in the community6. Within the first 6
months of operation, Families F.1.R.S.T had made 16 referrals to local substance abuse
facilities. Through the use of creative strategies, the counselor was able to identify and
refer clients to individual and group counseling either onsite or off-site as necessary,
including referrals to inpatient or outpatient treatment. The counselor was overseen by a
licensed clinician who was available on call, provided supervision hours and reviewed all
cases on a regular basis. The counselor provided psycho-educational programs as well as
stress management workshops to residents living in the development. Often it was
through these group settings, that clients would self-disclose problematic substance use.
Highlights of the service utilization data at 18 months include:
1. Skty clients had been referred to substance abuse treatment.
2. Ninety-two clients had been referred to GED certification programs.
3. Fifty-one clients had been referred to job training and placement programs.
44
and do not necessarily reflect the official position or policies of the U.S. Department of Justice. been published by the Department. Opinions or points of view expressed are those of the author(s) This document is a research report submitted to the U.S. Department of Justice. This report has not
In addition to these referrals the case management staff addressed other issues including,
but not limited to addressing basic needs such as housing and emergency financial
assistance, child care, domestic violence, truancy, and legal issues, among others.
What these data do not provide is an indication of the number of clients that completed
substance abuse treatment, GED certification andor job training and employment at 6
and 12 months. As a pilot study, and with limited funds, there was no way of integrating
a tracking and monitoring system that would allow for the evaluation of these longer term
programmatic successes. Also at the end of the first year of program implementation,
staff were already being pulled to work at a second housing development and asked to
split their time between the two developments. The decision to expand the Families
F.1.R.S.T program to an additional site was negatively reviewed by the evaluator who
recognized the high demand for service need at the original site. There was no way that
the staff could monitor long-term programmatic successes if they were increasing their
existing caseloads. Therefore, more long-term follow-up is critical for fbture studies of
the efficacy of this intervention program.
Resident Perception of Crime and Safety
At each time point residents were asked questions on the survey about their neighborhood
including perception of crime and safety. Exhibit 12 represents responses to these
questions over the three time points.
~~ ~ ~~~~
Not unexpected, the results of the baseline survey did not include many residents who self-disclosed problematic substance use (e.g. only 8 reported heavy use of alcohol andor drugs). All of these clients were referred to off-site treatment agencies.
45
and do not necessarily reflect the official position or policies of the U.S. Department of Justice. been published by the Department. Opinions or points of view expressed are those of the author(s) This document is a research report submitted to the U.S. Department of Justice. This report has not
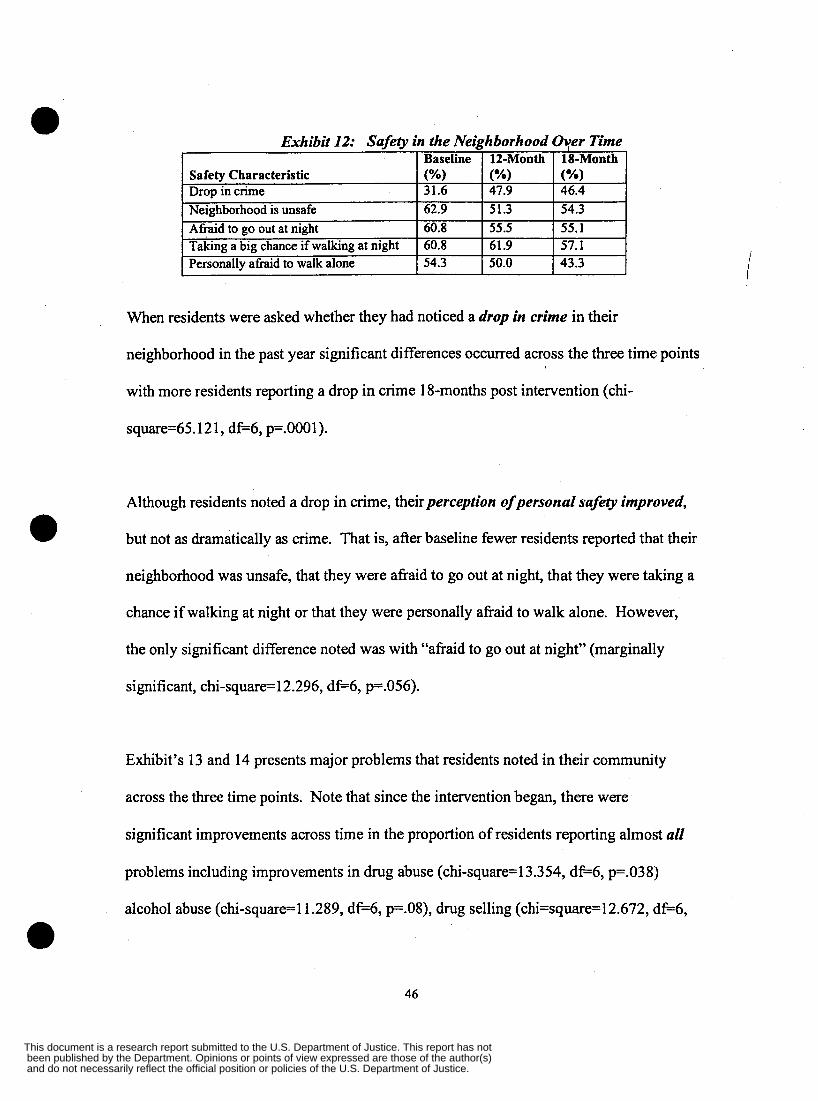
Safety Characteristic
Neighborhood is unsafe Drop in crime
Afraid to go out at night Taking a big chance if walking at night Personally afraid to walk alone
When residents were asked whether they had noticed a drop in crime in their
Baseline 12-Month 18-Month (”/.I (%I (%I 31.6 47.9 46.4 62.9 51.3 54.3 60.8 55.5 55.1 60.8 61.9 57.1 54.3 50.0 43.3
neighborhood in the past year significant differences occurred across the three time points
with more residents reporting a drop in crime 18-months post intervention (chi-
square=65.121, d e 6 , p=.OOOl).
Although residents noted a drop in crime, their perception of personal safety improved,
but not as dramatically as crime. That is, after baseline fewer residents reported that their
neighborhood was unsafe, that they were afraid to go out at night, that they were taking a
chance if walking at night or that they were personally afraid to walk alone. However,
the only significant difference noted was with “afraid to go out at night” (marginally
significant, chi-square1 2.296, d66 , p=.056).
Exhibit’s 13 and 14 presents major problems that residents noted in their community
across the three time points. Note that since the intervention began, there were
significant improvements across time in the proportion of residents reporting almost all
problems including improvements in drug abuse (chi-square=l3.354, d+6, p=.038)
i
alcohol abuse (chi-square=l 1.289, d e 6 , p=.08), drug selling (chi=square=l2.672, d+6,
46
and do not necessarily reflect the official position or policies of the U.S. Department of Justice. been published by the Department. Opinions or points of view expressed are those of the author(s) This document is a research report submitted to the U.S. Department of Justice. This report has not
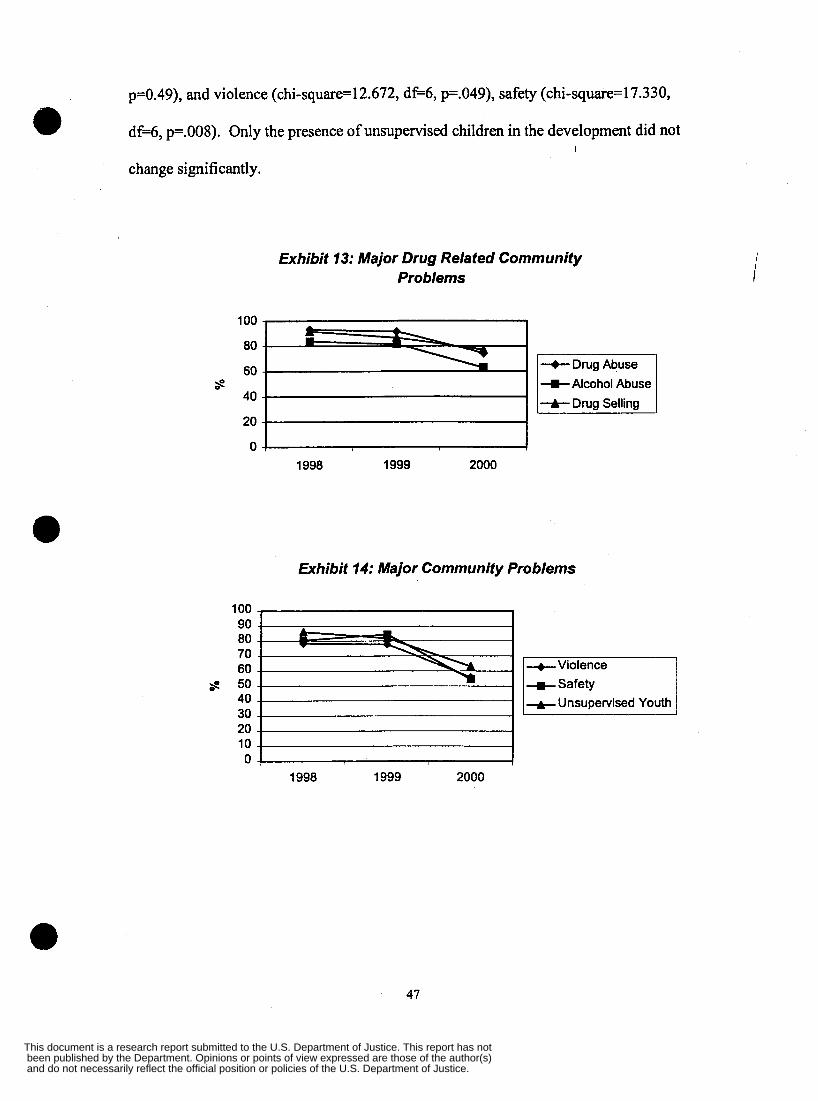
p=0.49), and violence (chi-square=l2.672, d e 6 , p=.049), safety (chi-square=l7.330,
dfi6, p=.008). Only the presence of unsupervised children in the development did not
change significantly.
Exhibit 13: Major Drug Related Community Problems
100 . I
--t Drug Abuse 60 +Alcohol Abuse --t Drug Selling
20
s
1998 1999 2000
Exhibit 14: Major Community Problems
90 80 70 60
$ 50 40 30 20 10 0 I
1998 1999 2000
+Violence +Safety -+- Unsupewised Youth
I
47
and do not necessarily reflect the official position or policies of the U.S. Department of Justice. been published by the Department. Opinions or points of view expressed are those of the author(s) This document is a research report submitted to the U.S. Department of Justice. This report has not
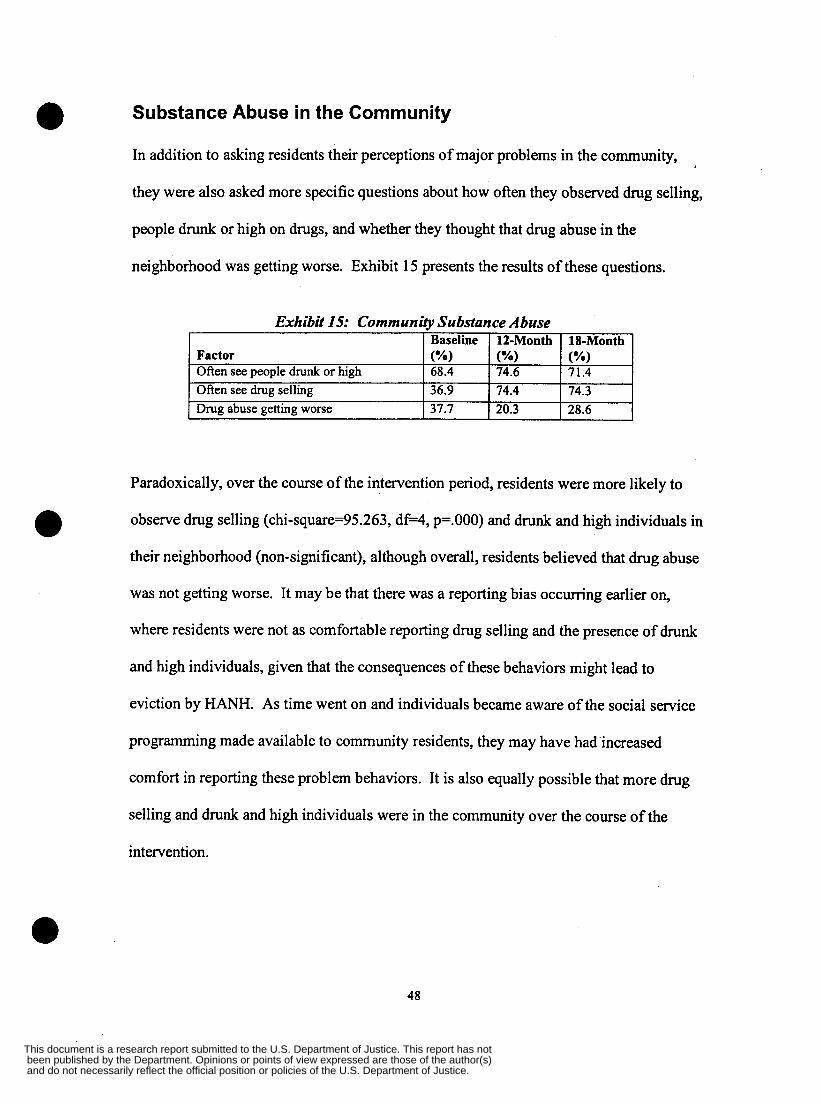
Substance Abuse in the Community
In addition to asking residents their perceptions of major problems in the community,
they were also asked more specific questions about how often they observed drug selling,
people drunk or high on drugs, and whether they thought that drug abuse in the
neighborhood was getting worse. Exhibit 15 presents the results of these questions.
Exhibit 15: Community Substance Abuse Baseline 12-Month 18-Month
Factor (%I (%I (%I Often see people drunk or high Often see drug selling
37.7 28.6
Paradoxically, over the course of the intervention period, residents were more likely to
observe drug selling (chi-square=95.263, d H , p=.OOO) and drunk and high individuals in
their neighborhood (non-significant), although overall, residents believed that drug abuse
was not getting worse. It may be that there was a reporting bias occurring earlier on,
where residents were not as comfortable reporting drug selling and the presence of drunk
and high individuals, given that the consequences of these behaviors might lead to
eviction by HA". As time went on and individuals became aware of the social service
programming made available to community residents, they may have had 'increased
comfort in reporting these problem behaviors. It is also equally possible that more drug
selling and drunk and high individuals were in the community over the course of the
intervention.
48
and do not necessarily reflect the official position or policies of the U.S. Department of Justice. been published by the Department. Opinions or points of view expressed are those of the author(s) This document is a research report submitted to the U.S. Department of Justice. This report has not
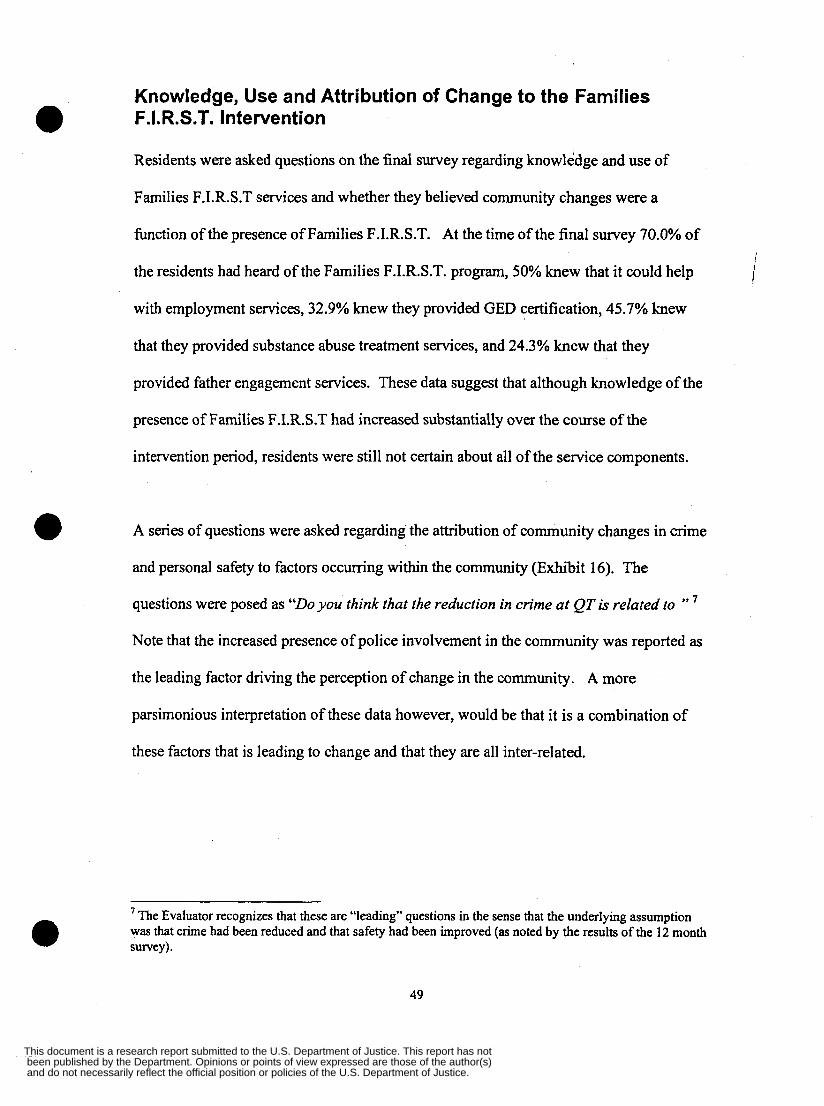
Knowledge, Use and Attribution of Change to the Families F. I. R. S .T. In te wen t ion
Residents were asked questions on the final survey regarding knowledge and use of
Families F.1.R.S.T services and whether they believed community changes were a
hnction of the presence of Families F.I.R.S.T. At the time of the final survey 70.0% of
the residents had heard of the Families F.I.R.S.T. program, 50% knew that it could help
with employment services, 32.9% knew they provided GED certification, 45.7% knew
that they provided substance abuse treatment services, and 24.3% knew that they
provided father engagement services. These data suggest that although knowledge of the
presence of Families F.1.R.S.T had increased substantially over the course of the
intervention period, residents were still not certain about all of the service components.
A series of questions were asked regarding the attribution of community changes in crime
and personal safety to factors occurring within the community (Exhibit 16). The
questions were posed as “Do you think that the reduction in crime at QT is related to ’’I
Note that the increased presence of police involvement in the community was reported as
the leading factor driving the perception of change in the community. A more
parsimonious interpretation of these data however, would be that it is a combination of
these factors that is leading to change and that they are all inter-related.
The Evaluator recognizes that these are “leading” questions in the sense that the underlying assumption was that crime had been reduced and that safety had been improved (as noted by the results of the 12 month survey).
7
49
and do not necessarily reflect the official position or policies of the U.S. Department of Justice. been published by the Department. Opinions or points of view expressed are those of the author(s) This document is a research report submitted to the U.S. Department of Justice. This report has not
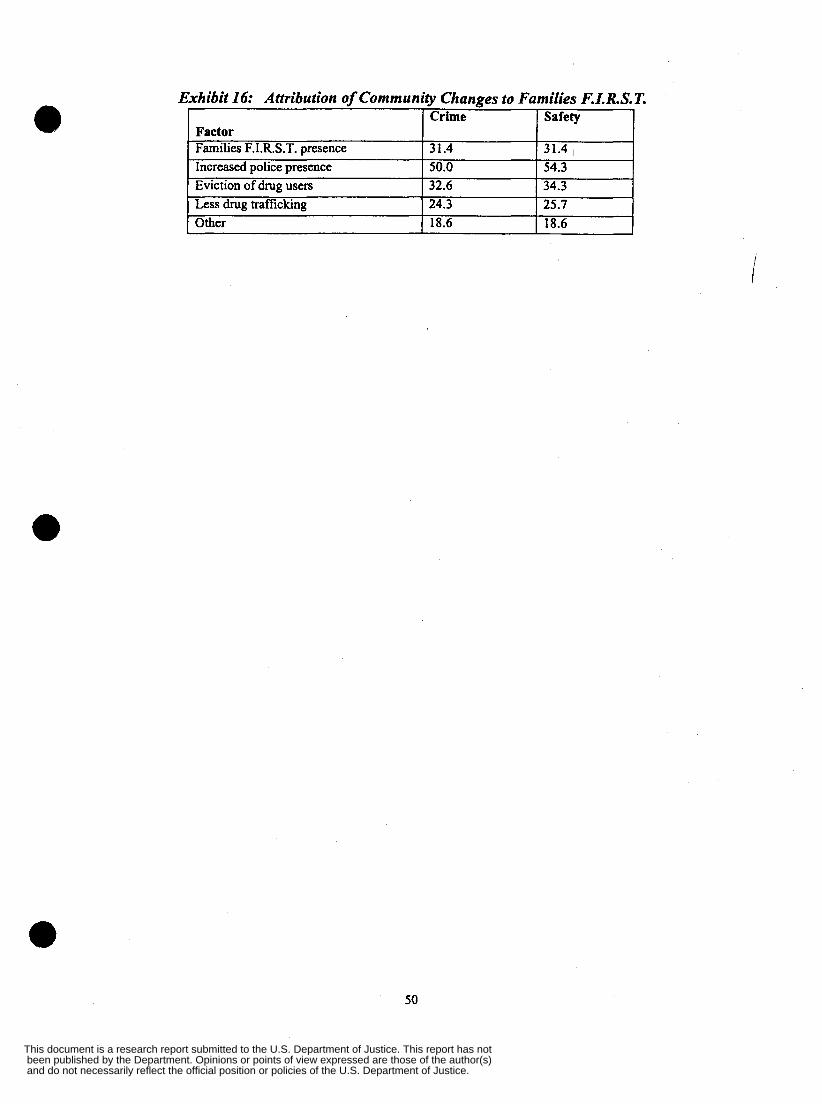
Factor Families F.I.R.S.T. presence 31.4 31.4 1 Increased police presence Eviction of drug usen Less drug trafficking Other
i
50.0 54.3 32.6 34.3 24.3 25.1 18.6 18.6
50
and do not necessarily reflect the official position or policies of the U.S. Department of Justice. been published by the Department. Opinions or points of view expressed are those of the author(s) This document is a research report submitted to the U.S. Department of Justice. This report has not
CHAPTER 6 Final Results: Comparisons Between Intervention and Control Site
Intervention Sex % Female 88.6
Demographics
The final survey, completed in the late fall
2000, was administered to 70 residents at
Quinnipiac Terrace and 50 residents at Control
89.6
McConnaughy Terrace. The decline in the Age (mean, s.d.) Race
of
44.4 (2 1.2) 36.9 (17.8)
number of surveys completed across both sites is
partly a reflection of the reduced population at
% Black 58.8 85.4 * % Hispanic 33.8 6.3 % Married 14.5 10.4 % Employed 31.7 53.2 *
both sites (e.g. more units off-line than previously) as well as a hnction of the limited
time that Families F.1.R.S.T staff were able to allocate to assisting in survey
administration. In order to compensate for the inability of the staff to complete the
surveys, the Project Coordinator was able to identify a team of 4 male-engagement
advocates that were trained and paid by the Evaluator to assist with survey
administration. The sample size at both developments however, is sufficient to detect
statistical differences.
Briefly, similar to baseline data, the age and gender distribution between the intervention
and control site were similar to one another, as was the percent of individuals married.
That is, there was no major change in demographics over the course of the evaluation of
the intervention program. The developments continued to be comprised of
* Families F.I.R.S.T. as part of the Robert Wood Johnson Fighting Back Initiative were required to expand their services into an additional development (Farnam Courts) in mid-year 2000. The impact on QT was
51
and do not necessarily reflect the official position or policies of the U.S. Department of Justice. been published by the Department. Opinions or points of view expressed are those of the author(s) This document is a research report submitted to the U.S. Department of Justice. This report has not
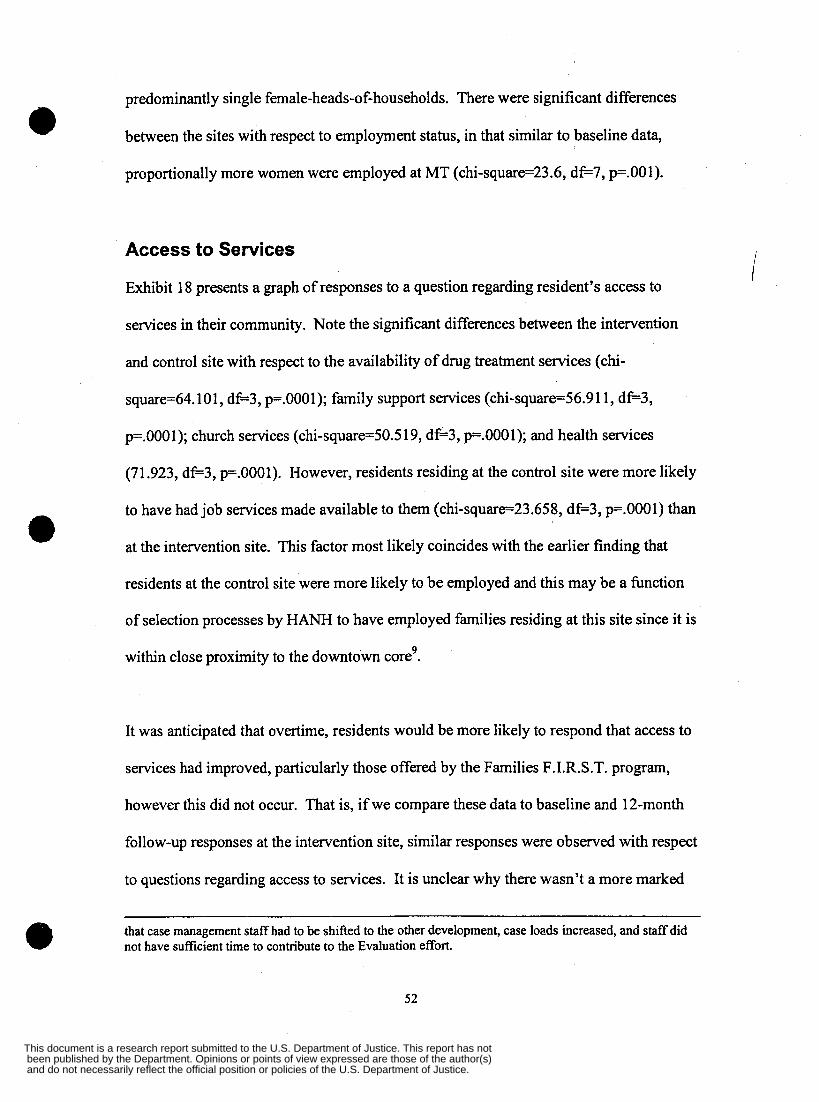
predominantly single female-heads-of-households. There were significant differences
between the sites with respect to employment status, in that similar to baseline data,
proportionally more women were employed at MT (chi-square=23.6, df-7, p=.OOl). I
Access to Services
Exhibit 18 presents a graph of responses to a question regarding resident’s access to
services in their community. Note the significant differences between the intervention
and control site with respect to the availability of drug treatment services (chi-
square=64.101, df-3, p=.OOOl); family support services (chi-square=56.911, df-3,
p=.OOOl); church services (chi-square=50.5 19, df-3, p=.OOOl); and health services
(71.923, df-3, p=.OOOl). However, residents residing at the control site were more likely
to have had job services made available to them (chi-square=23.658, df-3, p=.OOOl) than
at the intervention site. This factor most likely coincides with the earlier finding that
residents at the control site were more likely to be employed and this may be a hnction
of selection processes by HANH to have employed families residing at this site since it is
within close proximity to the downtown core’.
It was anticipated that overtime, residents would be more likely to respond that access to
services had improved, particularly those offered by the Families F.I.R.S.T. program,
however this did not occur. That is, if we compare these data to baseline and 12-month
follow-up responses at the intervention site, similar responses were observed with respect
to questions regarding access to services. It is unclear why there wasn’t a more marked
that case management staff had to be shifted to the other development, case loeds increased, and staff did not have sufficient time to contribute to the Evaluation effort.
52
and do not necessarily reflect the official position or policies of the U.S. Department of Justice. been published by the Department. Opinions or points of view expressed are those of the author(s) This document is a research report submitted to the U.S. Department of Justice. This report has not

improvement in resident's perception of access to services, however it may be a function
of lack of clarity of the types of services being offered by the program.
Exhibit 18: Access to Services Final Survey
90 80 70 60 50 40 30 20 10 0
IJ Control
Drug Tx Family Child Job Church Health Support care clinic
Resident Perception of Community Crime and Personal Safety
Exhibit 19 presents the results of questions regarding crime and personal safety in the
community. Residents at the intervention site, were significantly more likely to report a
drop in crime in their community in the past year (chi-square=7.916, d e 2 , p=.O19) when
compared with responses fiom the control site. However, residents at the control site
were significantly more likely to report that they lived in a safer community (chi-
square=l3.6; dg2, p=.OOl), were less likely to be afraid to go out at night (chi-
square=33.031, d e 2 , p=.OOOl), less likely to be taking a chance at night (chi-
square=44.449, df-3, p=.OOOl), and less afraid to walk alone at night (chi-square=23.243,
d+3, p=.OOOl). It is clear fiom these findings that residents at the control site were
The Evaluator was not able to get a clear response from HAW regarding any selection processes.
53
and do not necessarily reflect the official position or policies of the U.S. Department of Justice. been published by the Department. Opinions or points of view expressed are those of the author(s) This document is a research report submitted to the U.S. Department of Justice. This report has not
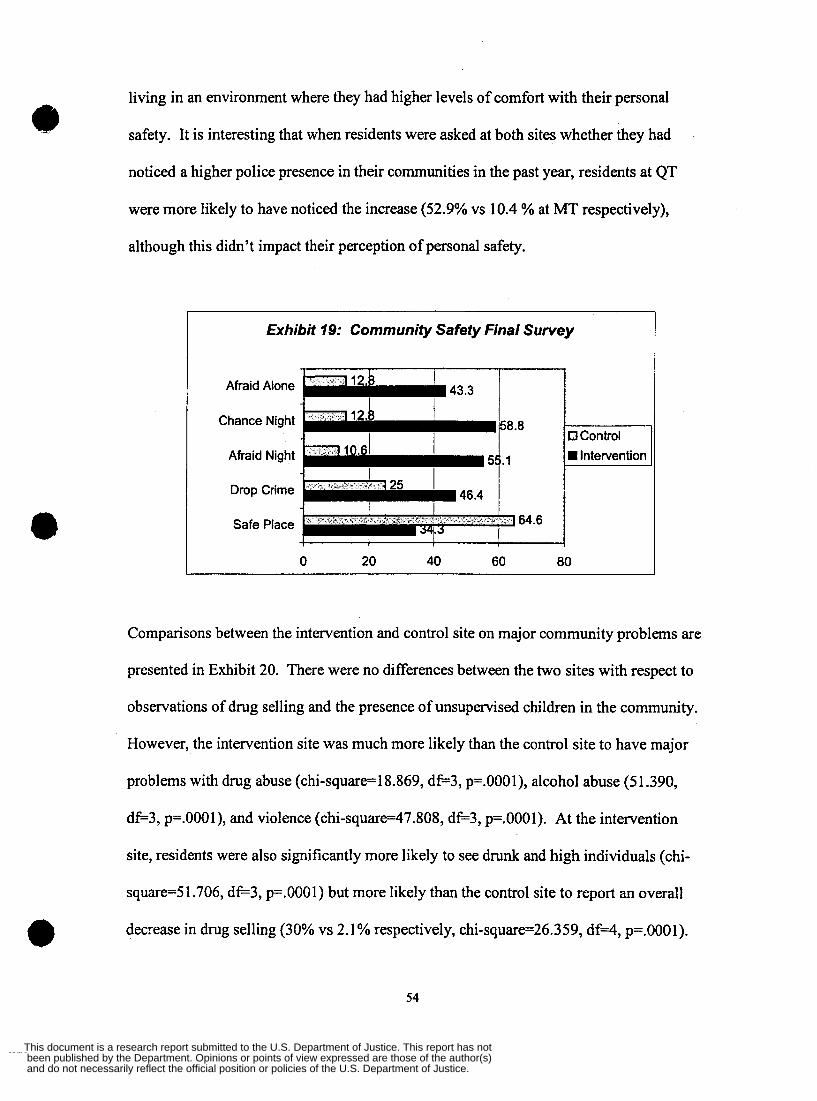
living in an environment where they had higher levels of comfort with their personal
safety. It is interesting that when residents were asked at both sites whether they had
noticed a higher police presence in their communities in the past year, residents at QT
were more likely to have noticed the increase (52.9% vs 10.4 % at MT respectively),
although this didn’t impact their perception of personal safety.
Exhibit 79: Community Safety Final Survey
Afraid Alone
Chance Night
Afraid Night
Drop Crime
Safe Place
0 20 40 60 80
Comparisons between the intervention and control site on major community problems are
presented in Exhibit 20. There were no differences between the two sites with respect to
observations of drug selling and the presence of unsupervised children in the community.
However, the intervention site was much more likely than the control site to have major
problems with drug abuse (chi-square=l8.869, d+3, p=.OOOl), alcohol abuse (5 1.390,
dfL3, p=.OOOl), and violence (chi-square=47.808, dfi3, p=.OOOl). At the intervention
site, residents were also significantly more likely to see drunk and high individuals (chi-
square=51.706, d e 3 , p=.OOOl) but more likely than the control site to report an overall
decrease in drug selling (30% vs 2.1 % respectively, chi-square=26.359, d H , p=.OOOl). e 54
and do not necessarily reflect the official position or policies of the U.S. Department of Justice. been published by the Department. Opinions or points of view expressed are those of the author(s) This document is a research report submitted to the U.S. Department of Justice. This report has not
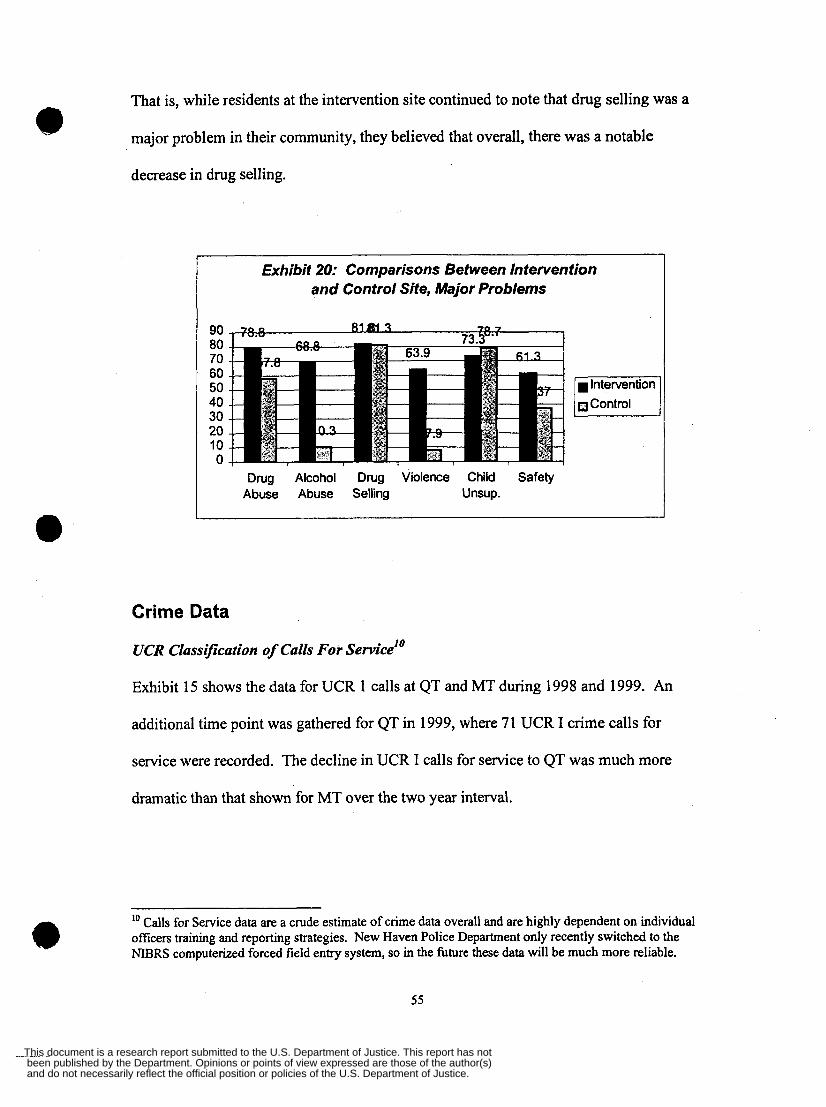
That is, while residents at the intervention site continued to note that drug selling was a
major problem in their community, they believed that overall, there was a notable
decrease in drug selling.
Exhibit 20: Comparisons Between Intervention and Control Site, Major Problems
90 80 70 60 50 40 30 20 10 0
0 81dM R 70 7 Y 1
Intervention' 0 Control
J
Drug Alcohol Drug Violence Child Safety Abuse Abuse Selling Unsup.
I
Crime Data
UCR Classification of Calls For Service"
Exhibit 15 shows the data for UCR 1 calls at QT and MT during 1998 and 1999. An
additional time point was gathered for QT in 1999, where 71 UCR I crime calls for
service were recorded. The decline in UCR I calls for service to QT was much more
dramatic than that shown for MT over the two year interval.
lo Calls for Service data are a crude estimate of crime data overall and are highly dependent on individual oflicers training and reporting strategies. New Haven Police Department only recently switched to the NIBRS Computerized forced field entry system, so in the future these data will be much more reliable.
55
and do not necessarily reflect the official position or policies of the U.S. Department of Justice. been published by the Department. Opinions or points of view expressed are those of the author(s) This document is a research report submitted to the U.S. Department of Justice. This report has not
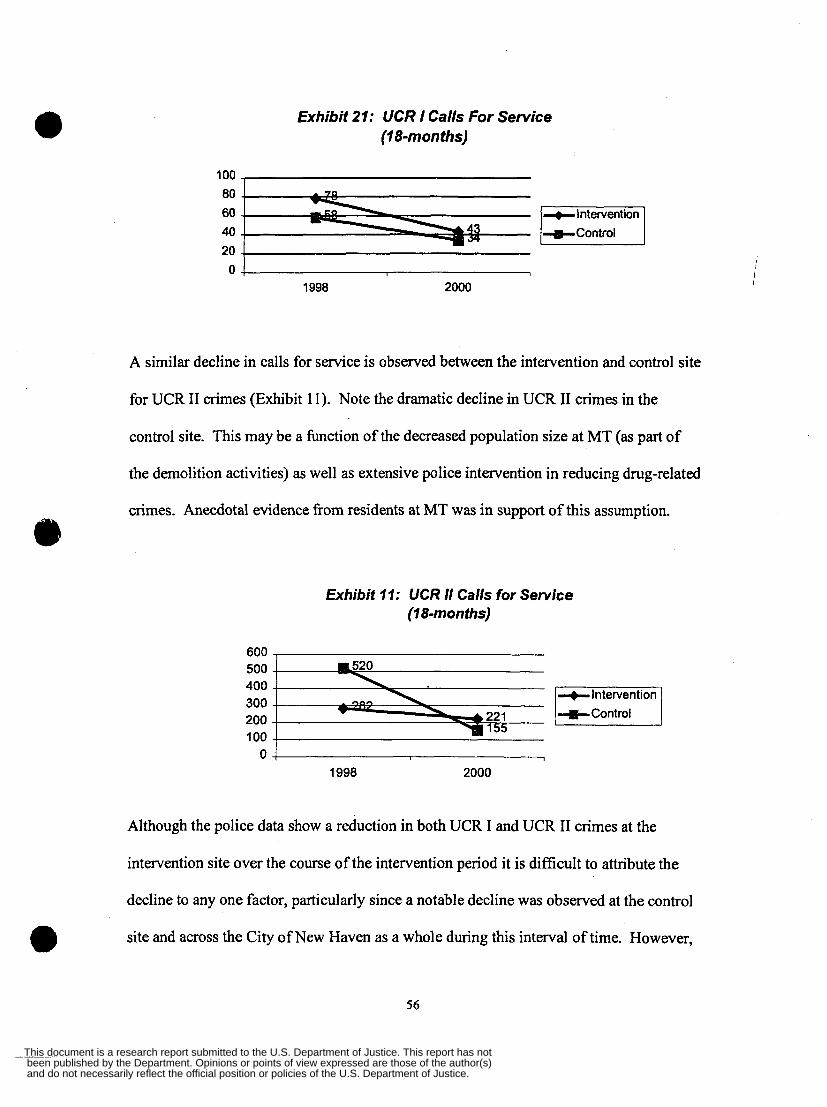
Exhibit 21: UCR I Calls For Service (lbmonths)
300 200 100 -
100 80 60 40 20 0
-Control
1998 2000
22 1 55
A similar decline in calls for service is observed between the intervention and control site
for UCR I1 crimes (Exhibit 11). Note the dramatic decline in UCR I1 crimes in the
control site. This may be a function of the decreased population size at MT (as part of
the demolition activities) as well as extensive police intervention in reducing drug-related
crimes. Anecdotal evidence from residents at MT was in support of this assumption.
Exhibit 77: UCR I1 Calls for Service (7 8-months)
600 500 400 -
+Intervention +Control
04 I
1998 2000
Although the police data show a reduction in both UCR I and UCR I1 crimes at the
intervention site over the course of the intervention period it is difficult to attribute the
decline to any one factor, particularly since a notable decline was observed at the control
site and across the City of New Haven as a whole during this interval of time. However,
56
and do not necessarily reflect the official position or policies of the U.S. Department of Justice. been published by the Department. Opinions or points of view expressed are those of the author(s) This document is a research report submitted to the U.S. Department of Justice. This report has not
it is compelling to link the drop in UCR I crimes at QT to the increased presence of
police in this previously isolated community.
Further assessment of the nature of the calls for service indicated that in 2000, 10 were
drug related events at the control site, and 24 were drug related at the intervention site.
When compared to the baseline data, it appears that only the control site showed a
reduction in this type of call for service, whereas QT remained about the same (e.g. from
20 in 1998 to 10 in 2000).
57
and do not necessarily reflect the official position or policies of the U.S. Department of Justice. been published by the Department. Opinions or points of view expressed are those of the author(s) This document is a research report submitted to the U.S. Department of Justice. This report has not
CHAPTER 7 Summary and Discussion
Summary of Findings
The principal objectives of this evaluation project were to demonstrate the efficacy of the
Families F.1.R.S.T pilot intervention program in providing services to at-risk residents by
examining the proportion of residents entering and completing services and impacting
substance related activities and crime post-intervention. These primary objectives were
accomplished as evidenced by the following positive changes that had occurred in the
community at the 18-month assessment:
2. Service Utilization
Over 90 clients had been served by the Families F.I.R.S.Tprogram during
the evaluation period (60 with substance abuse problems were referred to
a variety of treatmentprograms; 51 to job training andplacement
programs; and 92 to GED certiJication) and a substantial proportion of
residents are currently engaged in services.
4. Substance Related Activities
Significant improvements over time were observed in the intervention site
for drug and alcohol abuse, drug selling, and violence as reported by
residents.
A signijicant decrease in drug selling had occurred in the intervention site
compared to the control site, although drug selling remained a major
problem.
58
and do not necessarily reflect the official position or policies of the U.S. Department of Justice. been published by the Department. Opinions or points of view expressed are those of the author(s) This document is a research report submitted to the U.S. Department of Justice. This report has not
e Despite the signiJcant reductions in these types of activities, major
problems still remain in the community based on resident reports.
5. Crime
e Residents reported a signijkant decrease in crime and improved safety
over time at the intervention site.
Residents attributed improved crime and safety to increased police
presence in the community.
Trends over time revealed by calls for service data indicate fewer UCR I
and 11 crimes since the inception of the Families F.I.R.S. Tprogram,
e
although a similar reduction occurred at the control site.
Discussion
Quinnipiac Terrace, like many other public housing developments built around the
country in the last century, is physically and socially isolated from the broader
community. As highlighted in the summary above, this pilot intervention program aimed
at reducing the impact of substance use, abuse and crime in the community by providing
on-site services, was effective in impacting the level of crime in the community as well as
serving the unmet social service needs of residents.
Historically, traditional services (social or otherwise) have been found to be lacking in
public housing (Rouse and Rubenstein, 1978), partly due to safety issues as well as high
costs associated with providing such services (Weisel, 1990; Vitella, 1992). Generally e 59
and do not necessarily reflect the official position or policies of the U.S. Department of Justice. been published by the Department. Opinions or points of view expressed are those of the author(s) This document is a research report submitted to the U.S. Department of Justice. This report has not
speaking, safety issues have precluded social service providers from providing direct
services to public housing residents. Green et al(1998) note that public housing residents
tend to fall through the cracks of coordinated services delivery.
More recently, Public Housing Drug Elimination Program (PHDEP) fbnds have been
used to support anti-crime activities for youth but have not targeted the broader needs of
families. For example, in some parts of the country programs have emerged such as
Combating Alcohol and Drugs through Rehabilitation and Education (CADRE) a
program that provides direct services to youth. It has been a highly utilized program that
typically involves a drug prevention and drug treatment agency with the goal of
increasing self-confidence and self-worth among youth. A few other model youth
programs have also emerged, however, at this point in time it is unclear whether any of
these youth based programs have been evaluated.
In general, Holzman (1 996) noted that research in public housing has been sparse, ill-
conceived and ill-applied. Greene and colleagues (1 998) in presenting the results of the
Philadelphia 1 l* corrider study of public housing and crime in Philadelphia highlight the
diMiculty and challenges in doing effective research in this area. Aside from the
comprehensive social service based programming provided in Miracle Village, and the
limited evaluation work that had been initiated, the present author was not able to find
any other relevant evaluation literature based in public housing.
60
and do not necessarily reflect the official position or policies of the U.S. Department of Justice. been published by the Department. Opinions or points of view expressed are those of the author(s) This document is a research report submitted to the U.S. Department of Justice. This report has not
Contrary to what one might believe, and aside from public myth, few studies have
examined the prevalence of crime in public housing. Of the few studies that have been
conducted, the results are mixed and/or controversial (Fagan et al, 1998; Piquero et al.
1991). That is, as many studies have shown a positive association (Brill and Associates,
1977; Weisburd and Green, 1995; Dunsworth and Sarger; 1994) as those that do not
(Roncek et al, 1981; Farley, 1982; Hare11 & Grouvis, 1994).
Several surveys have been conducted on public housing residents across the country. The
America Housing Survey, indicated that 25% of residents report crime as a problem
(DeFrancis & Smith (1 998). The National Crime Victim Survey (1 998) indicated that
crime victimization was the same in public housing as it was outside of public housing
(23.8% vs 23.4% respectively). Holman et a1 (1996) using data from the 1996 Survey of
Public Housing residents found: a) that the size of the development (500 or more units)
was related to crime; b) fear of crime vanes across developments; c) family high rises
may not have increased rates of crime. Other studies have shown that concentrated
community poverty increases the likelihood of crime and disorder (Wilson, 1987; Massey
& Kanaiaupuni, 1993; Sampson, 1995), and that family disruption is associated with
poverty, crime and disorder (Greene, 1997; Sampson, 1995). Moreover, physical signs of
the environment (including vacant, abandoned, run-down housing, graffiti, trash, etc) are
significant signs of disorderly behavior (Taylor and Gottfiedson, 1986; Skogan 1990).
61
and do not necessarily reflect the official position or policies of the U.S. Department of Justice. been published by the Department. Opinions or points of view expressed are those of the author(s) This document is a research report submitted to the U.S. Department of Justice. This report has not
The finding in the present study that crime had dropped over the course of the evaluation
period was interesting and is worth further discussion. Although residents attributed the
change in crime and increase in safety to an increased presence of police in the
development, the actual facts were that the police did not dramatically alter their
presence. Indeed, at any given time there were only two police officers in the
neighborhood and they were not necessarily walking a beat in the development. It is true
that the tenant council and others were very familiar with the local Sergeant who would
attend meetings and had a great physical presence. However, at night only a patrol car
was in the neighborhood. To conclude that the drop in crime is only a function of
increased police presence in the community is far too simplistic. It is equally plausible,
and more parsimonious to link the change in crime in the community and the increased
perception of personal safety to a composite of factors, including but not limited to the
presence of Families F.I.R.S.T, increased police presence, positive changes in the
physical environment, the new administration at HA", among other factors. After all,
Families F.1.R.S.T came with a host of other positive community activities including
children and family events, clean-up days, newsletters and other forms of
communication. Perhaps this previously disenfranchised setting began to feel more like a
community.
There is some literature to support the premise that perception andor fear of crime is
associated with actual crimes, physical disorder and social disorder (Skogen, 1992).
Covington and Taylor (1 991) in a review of incivilities argue that the environment that
individuals live in has implications on their perception of safety in that those who live in
62
and do not necessarily reflect the official position or policies of the U.S. Department of Justice. been published by the Department. Opinions or points of view expressed are those of the author(s) This document is a research report submitted to the U.S. Department of Justice. This report has not
poor environments are more vulnerable and more fearful of crime and victimization. The
positive changes that occurred at Quinnipiac Terrace since the inception of the Families
F.I.R.S.T. program may have contributed to the changes in perception that have occurred
in the community by virtue of its on-site high profile physical presence.
Nonetheless, having a positive police presence in the community is a powerful force for
impacting change. Cooper (1 994) in an analysis of public housing drug elimination
programs across 4 public housing authorities (Chicago, Cleveland, Philadelphia and
Smithfield, North Carolina) concluded that a substantial reduction in violent crimes is
important in contributing to residents perception of safety and that high visibility by
police is an effective method in developing and improving quality of life in
developments.
Lessons Learned
The results of continuous process evaluation and monitoring have led to the following
conclusions:
Resident buy-in is a multi-stage process that requires persistence and continuity.
Resident word-of-mouth and motivated staff are the most efficient methods of
attracting residents into services.
Staff matched to the race/ethnicity and potential backgrounds (e.g. history of
living in public housing and/or substance uselabuse) of residents is central to
engaging and motivating clients.
The Evaluator and the evaluation process must be seen as an integral part of the
intervention process.
63
and do not necessarily reflect the official position or policies of the U.S. Department of Justice. been published by the Department. Opinions or points of view expressed are those of the author(s) This document is a research report submitted to the U.S. Department of Justice. This report has not
5. Continuous process evaluation is a critical factor in program implementation and
ultimate program efficacy.
6. The parameters of community change are complex and are difficult to attribute to
any single factor.
Strengths, Limitations and Ongoing Challenges
This pilot program includes an innovative on-site comprehensive services model that
includes both clinical (substance abuse treatment and family support services) and non-
clinical components (e.g. extensive outreach and community organizing as well as job
training and placement and GED certification) as well as high profile police involvement
It has demonstrated its effectiveness in impacting the social service needs of residents as
well as reducing crime and increasing the perception of personal safety making the
community a more viable place to live in then it had been previously. The acceptance of
this program as a model program for the HANH is further testimony of its value to
residents living in local public housing.
e
In large part, the successes of this program are based on the strong collaborative
partnership between the HANH, Department of Police Services, New Haven Fighting
Back as well as the collaborating social service agencies including representation from
health clinics, substance abuse treatment providers, the faith community, welfare-to-
work, and youth organizations, among others. The strength of this partnership was
exemplified by the regular attendance of these partners at monthly meetings.
64
and do not necessarily reflect the official position or policies of the U.S. Department of Justice. been published by the Department. Opinions or points of view expressed are those of the author(s) This document is a research report submitted to the U.S. Department of Justice. This report has not
However, the program and the evaluation process was not without its shortcomings as
summarized below:
1.
2.
3.
4.
The bureaucratic process for initiating and finalizing service contracts was
cumbersome, inefficient and took several months before agencies had the funds to
provide necessary services on-site. For example, the hiring of the on-site
substance abuse counselor took almost 9 months due to contractual issues, and in
the subsequent year, similar issues held up the same person.
The staffturnover and subsequent low staff moral during the first year delayed the
onset of many of the programs that should have occurred on-site (e.g. job training
and placement programs). In the first year most of the referrals were to off-site
entities/organizations.
Engaging the trust of residents and establishing a presence in the community was
an unexpected lengthy and ongoing process and was ultimately based on the
persistence and creativity of staff members who had to balance a caseload and run
community activities (e.g. a highly publicized, well-orchestrated Christmas party
drew approximately 100 residents and their children in 1999).
Initial expectations regarding the role of the tenant council in helping drive the
acceptance of the program in the community was problematic given that in the
initial stages of the program the tenant council was dysfunctional. More recently,
the tenant council has taken a more noticeable and active role in the community.
If the tenant council had been functioning properly and appropriate resources had
65
and do not necessarily reflect the official position or policies of the U.S. Department of Justice. been published by the Department. Opinions or points of view expressed are those of the author(s) This document is a research report submitted to the U.S. Department of Justice. This report has not
been provided to them for leadership development and training, the Families
F.I.R.S.T. program would have benefited.
5 . Expectations ofthe Evaluator regarding the case monitoring, case tracking, data
management and computer skills of the staff were not on target in that the
evaluator had to provide these critical resources to the project.
6. Expansion of the Families F.I.R.S.T. program to two other developments was
premature and based in part on the management staff attempting to fulfill an
obligation to one of the funding streams without negotiating and thinking through
7.
the impact that this would have on the existing programming. The decision to
expand divided the resources, complicated the staffing structure and imposed
unrealistic expectations on staff. The impact on the residents at the intervention
site was difficult to gauge.
The selection of the control site was problematic in the sense that it didn’t
maximize the opportunity to detect significant differences post-intervention.
Originally it had been chosen because it was a family based development matched
for race/ethnicity and high crime rate. Factors that were unexpected at both
baseline and follow up included the larger number of Hispanics at the intervention
site, and the dramatic shift in crime that was based on the changing population at
the control site due to demolition and a step up on drug raids and police activity.
The ongoing challenges that Families F.I.R.S.T. must address include, but are not limited
to the following:
66
and do not necessarily reflect the official position or policies of the U.S. Department of Justice. been published by the Department. Opinions or points of view expressed are those of the author(s) This document is a research report submitted to the U.S. Department of Justice. This report has not
1. Program eflcacy can only be determined through adequate follow-up. Necessary
next steps in determining the value of this program include ongoing evaluation
studies that investigate the numbers of residents that successfully complete the
different arms of the intervention.
2. Ongoing strategies are needed to engage, motivate, and retain residents in
I
I
I services. Early on outreach workedcase managers identified motivation as a key
issue among the clients that they were serving. Staff found themselves in almost
daily dialogue with clients assisting them with the most basic and fundamental
aspects of life including instructing them to set an alarm clock, planning meals,
reviewing transportation options, among others. Additional fbnding that included
motivational enhancements is one option to engage, retain and motivate clients.
3 . Community investment in change is a key factor that requires continuous feeding
and care. Community organizing and mobilization activities are a continuous
process that will need to occur because the population is dynamic and turnover is
high. Outreach and education of Families F.I.R.S.T. programming activities will
become an integral part of the program.
4. Political forces need to recognize the value in their investment in order to ensure
program continuation. Local and federal government are notorious for creating
‘rules of engagement’ and policy for the indigent poor without recognizing the
complexities involved. For example, when the HUD “one-strike” eviction policy
was implemented, there was little attention paid to the impact that these evictions
would have on public safety and the homeless systems. Moreover, the major
change in the welfare system with respect to the 2 1 -month rule for women
67
and do not necessarily reflect the official position or policies of the U.S. Department of Justice. been published by the Department. Opinions or points of view expressed are those of the author(s) This document is a research report submitted to the U.S. Department of Justice. This report has not
receiving TANF, continues to be problematic for women living in public housing
who have not been given the opportunities needed to be employable (e.g. child-
care, convenient access to GED certification and job training opportunities).
Political forces need to recognize that poverty is attached to a number of complex
issues including apathy, depression, substance usdabuse, crime, and poor health.
For the most part just getting a job isn’t in and of itself going to help someone
move out of public housing and into the community. Programs that are multi-
faceted and directed towards the specific needs of the poor are needed. The
Families F.I.R.S.T. program is a model program that serves the complex needs of
individuals living in public housing.
Policy Implications
The major contribution of this intervention program to criminal justice system policy and
practice is the development of a partnership program between a Public Housing
Authority, treatment providers and a police department whereby at-risk individuals can
seek the treatment they need and maintain sobriety living in an environment where drug
activity is reduced. The program represents an opportunity for the Department of Police
Services, Housing Authority officials and residents, and the City to evaluate the
effectiveness of combining community policing and human resource and support
programs in public housing authorities. Thus, Families F.I.R.S.T. is a model on-site
human services program that is tailored to meet the needs of individuals living in high-
crime public housing. This program is currently being expanded across public housing
68
and do not necessarily reflect the official position or policies of the U.S. Department of Justice. been published by the Department. Opinions or points of view expressed are those of the author(s) This document is a research report submitted to the U.S. Department of Justice. This report has not
developments in the City of New Haven and has the potential to be adopted statewide
and/or nationally. The policy and practice change within the criminal justice system will
include the incorporation of police sub-stations within housing projects, active
participation of the officers in resident activities, and a round-the-clock presence to
inhibit the purchase and sales of drugs.
I
69
and do not necessarily reflect the official position or policies of the U.S. Department of Justice. been published by the Department. Opinions or points of view expressed are those of the author(s) This document is a research report submitted to the U.S. Department of Justice. This report has not
REFERENCES
Brill and Associates, 1977. Victimizatioin, Fear of Crime, and Altered Behavior. A Profile of the Crime Problem in four Housing Projects in Murphy Homes, Baltimore, Maryland. Washington, D.C. U.S. Department of Housing and Urban Development.
Brindis, C.D., Theidon, K.S. (1997). The role of case management in substance abuse treatment services for women and their children. Journal ofPsychoactiue Drugs, 29( 1):79-88.
Cazares, A. (1 994). Prevention Intervention Research: Focus and Perspective. National Institute of Drug Abuse Research Monograph Series: Scientific Methods for Prevention Intervention Research.
Center for Substance Abuse Prevention. (1 996). Fourth annual report of the National Evaluation of the Community Partnership Demonstration Grant Program. Rockville, M.D., Center for Substance Abuse Prevention, Department of Health and Human Services.
Center for Substance Abuse Treatment Women's and Children's Branch (1 994). Practical approaches in the treatment of women who abuse alcohol and other drugs. Rockville, M.D., U.S. Department of Health and Human Services.
Collins, P., Greene, J.R., Kane, R., Stokes, R., Piquero, A. 1998. Implementing community policing in public housing: Philadelphia's 1 l* street corridor program. National Institute of Justice, U.S. Department of Justice.
Cooper, C. An analysis of the Public Housing Drug Elimination Program: A guide for Policymakers for Reducing Violent Crime in Public Housing, 1994.
Covington, J., Taylor, R. 1991. Fear of crime in urban residential neighborhoods: Implications of between-and within-neighborhood sources for current models. Sociological Quarter&, 32:' 23 1-249.
DeFrances, C.J., Smith, S.K. 1998. Perceptions of Neighborhood Crime 1995. Washington DC: Bureau of Justice Statistics, U.S. Department of Justice.
De La Rosa, M.R., Recio-Adrados, J.L., Kennedy, N.J., Milburn, N. (1993) Current gaps and new directions for studying drug use and abuse behavior in minority youth. In: De La Roa, M.R. and Recio-Adrados, J.L, eds. Drug Abuse Among Minority Youth: Advances in Research and Methodology. National Institute of Drug Abuse Research Monograph 130.
Dunsworth, T., Saiger, A. 1994. Drugs and Crime in Public Housing A Three City Analysis. National Institute of Justice, Washiington, D.C.
70
and do not necessarily reflect the official position or policies of the U.S. Department of Justice. been published by the Department. Opinions or points of view expressed are those of the author(s) This document is a research report submitted to the U.S. Department of Justice. This report has not
Fagan, J. Dumanovsky, T., Thompson, J.P., Davies, G. 1998. Crime in public housing: clarifying research issues. National Institute of Justice Journal. Washington, D.C., National Institute of Justice.
a Farley, J. 1982. Has public housing gotten a bum rap? The incidence of crime in St. Louis public housing developments. Environment and Behavior, 14(4): 443-477.
Graham, A.V., Graham, N.R., Sowell, A., Ziegler, H. (1 997) Miracle Village: A recovery community for addicted women and their children in public housing. Journal of Substance Abuse Treatment. 14(3):275-284.
Hanell, A., Gouvis, C. 1994. Predicting Neighborhood Risk of Crime. Washington, D.C. The Urban Institute.
Hawkins, J.D., Catalano, R.F., Miller, J.Y. (1 992) Risk and protective factors for alcohol and other drug problems in adolescence and early adulthood: Implications for substance abuse prevention. Psychological Bulletin, 1 12 (1):64-105.
Holzman, H. 1996. Criminological research on public housing: Toward a better understanding of people, place, and spaces. Crime and Delinquency, 42361 -378.
Holman, H. Kudrick, T., Voytek, K. 1996. Revisiting the relationship between crime and architectural design: An analysis of HUD's 1994 survey of public housing residents. Cityscape: A Journal of Policy Development and Research 2( 1): 107-126. 0 Jellinek, P.S., Hearn, R.P. (1991). Fighting drug abuse at the local level: Can communities consolidate their resources into a single system of prevention, treatment and aftercare? Issues in Science and Technology, 78-84.
Johnston, L., O'Malley, P. & Bachman, J. (1986). Drug Use Among American High School Students, College Students, and Other Young Adults. Ann Arbor, MI: University of Michigan, Institute for Social Research.
Kessler, R. C., Nelson, M. B., McGonagle, K. A. & Edlund, M. J. (1996). The epidemiology of co-occuring mental disorders and substance use disorders in the National Comorbidity Study: implications fro prevention and service utilization. American Journal of Orthopsychiatry 66, 17-3 1.
Massey, D. Kanaiaupuni, S.M. 1993. Public housing and the concentration of poverty. Social Science Quarterly. 74( 1): 109-122.
National Center on Addiction and Substance Abuse (1 996). Substance abuse and the American Women: New York, Columbia University.
71
and do not necessarily reflect the official position or policies of the U.S. Department of Justice. been published by the Department. Opinions or points of view expressed are those of the author(s) This document is a research report submitted to the U.S. Department of Justice. This report has not
Prevention Research Branch. Five-year Strategic Plan for Drug Abuse Prevention Research. Rockville, M.D: National Institute on Drug Abuse. Roncek, D., Bell, R, Francik, J.M.A. 198 1. Housing projects and crime. Social Problems 29(2): 1 5 1 - 1 66.
Rouse, W.V., Rubenstein, H. 1978. Crime in Public Housing: A Review of Major Issues and Selected Crime Reduction Strategies. V1 and 2. Washington, D.C: U.S. Department of Housing and Urban Development.
Sampson, R. 1995. The community. In James Q. Wilson and Joan Petersillia (eds.) Crime. ICs Press. San Francisco.
Sampson, R. Groves, W. 1989. Community structure and crime: Testing social disorganization theory. American Journal of Sociology, 94:774-802.
Skogan, W. 1990. Disorder and Decline. The Free Press. New York.
Skogan, W., Sampson, A. 1994. Drugs and public housing: toward an effective police response. In Doris MacKenzie and Craig Uchida (eds). Drugs and Crime: Evaluating Public Policy Initiatives. Sage. Newbury Park, CA.
Substance Abuse and Mental Health Services Administration (1 994). . . ..
Taylor, r., Gottfredson, S. 1986. Environmental design, crime, and prevention: An examination of community dynamics. In Albert Reiss, Jr. and Michael Tonry (eds.). Communities and Crime. Crime and Justice A Review of Research, Volume 8. University of Chicago Press. Chicago.
0
The National Center on Addiction and Substance Abuse (1 995). Substance Abuse and the American Woman,. New York, N.Y.
Vitella, J.P. 1992. Security, Crime and Drugs in Public Housing. A Review of Programs and Expenditures. Working paper prepared for the CLPHA/NAHRO/PHADA public housing research project.
Weisburd, D., Green, L. 1995. Policing drug hot spots: The Jersey City DMA experiment. Justice Quarterly 12(4): 7 1 1 -736.
Weisel, D. 1990. Tackling Drug Problems in Public Housing Washington, D.C.: Police Executive Research Forum.
Wilson, W.J. 1987. The Truly Disadvantaged. Chicago: University of Chicago Press.
72
and do not necessarily reflect the official position or policies of the U.S. Department of Justice. been published by the Department. Opinions or points of view expressed are those of the author(s) This document is a research report submitted to the U.S. Department of Justice. This report has not
APPENDICES I
1. New Haven Calls For Service GIS Maps
2. Baseline and Follow-Up Survey’s
3. Process Evaluation Forms & Summaries
4. Environmental Assessment
5. Summary of Electronic Datasets
e
I
73
and do not necessarily reflect the official position or policies of the U.S. Department of Justice. been published by the Department. Opinions or points of view expressed are those of the author(s) This document is a research report submitted to the U.S. Department of Justice. This report has not
APPENDIX I a
New Haven Calls For Service GIS Maps
e
and do not necessarily reflect the official position or policies of the U.S. Department of Justice. been published by the Department. Opinions or points of view expressed are those of the author(s) This document is a research report submitted to the U.S. Department of Justice. This report has not
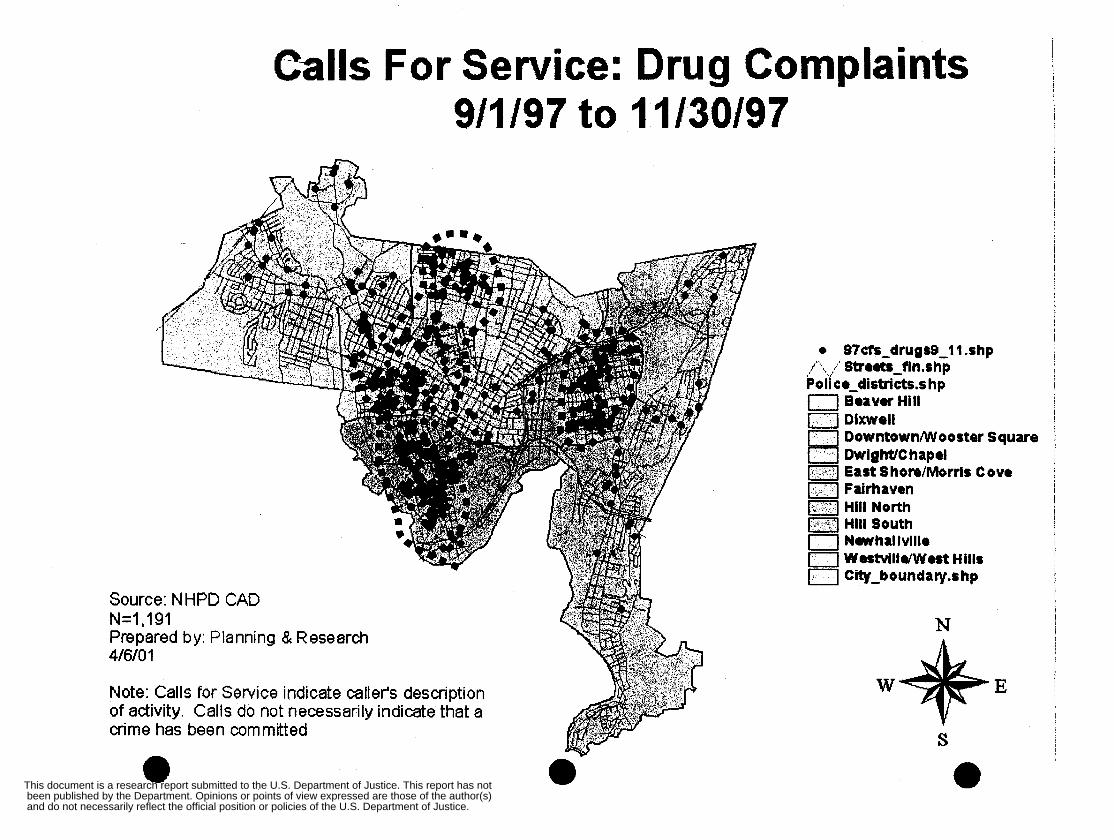
Calls For Service: Drug Complaints 9/1/97 to 11130197
Source: NHPD CAD N=1,191 Prepared by: Planning & Research 4/6/0 1
Note: Calls for Service indicate caller's description of activity. Calls do not necessarily indicate that a crime has been committed
8 7 c f r ~ d r u ~ s 9 ~ 1 1 .rhp J',.. ,.e' Streutt-fin.shp Pofi ce districts.s hp 0 f e a v u Hill
Dixwell Downtownmoorter Square Dw I g htlC hapd East S hore/Morrls Cove Fai rh aven Hill North Hill South n Newhal lville WestuillWest Hills City-b o unda y .s h p
N
w+E S
and do not necessarily reflect the official position or policies of the U.S. Department of Justice. been published by the Department. Opinions or points of view expressed are those of the author(s) This document is a research report submitted to the U.S. Department of Justice. This report has not
APPENDIX 2
Baseline & Follow-Up Surveys
and do not necessarily reflect the official position or policies of the U.S. Department of Justice. been published by the Department. Opinions or points of view expressed are those of the author(s) This document is a research report submitted to the U.S. Department of Justice. This report has not
*****
FAMILIES FIRST i
BASELINE NEEDS ASSESSMENT SURVEY March 1999
1
and do not necessarily reflect the official position or policies of the U.S. Department of Justice. been published by the Department. Opinions or points of view expressed are those of the author(s) This document is a research report submitted to the U.S. Department of Justice. This report has not
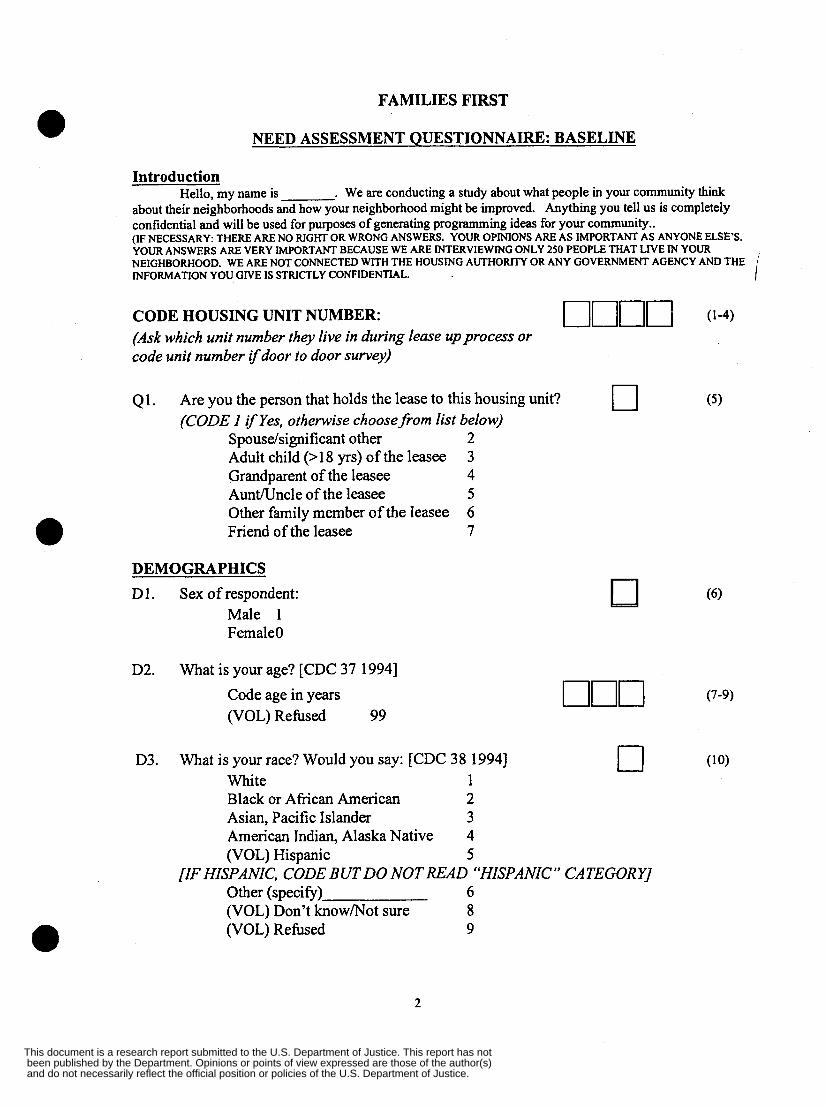
FAMILIES FIRST
NEED ASSESSMENT QUESTIONNAIRE: BASELINE
Introduction Hello, my name is . We are conducting a study about what people in your community think
about their neighborhoods and how your neighborhood might be improved. Anything you tell us is completely confidential and will be used for purposes of generating programming ideas for your community.. (IF NECESSARY: THERE ARE NO RIGHT OR WRONG ANSWERS. YOUR OPINIONS ARE AS IMPORTANT AS ANYONE ELSE’S. YOUR ANSWERS ARE VERY IMPORTANT BECAUSE WE ARE INTERVIEWING ONLY 250 PEOPLE THAT LIVE IN YOUR NEIGHBORHOOD. WE ARE NOT CONNECTED WITH THE HOUSMG AUTHORITY OR ANY GOVERNMENT AGENCY AND THE INFORMATION YOU GIVE IS STRICTLY CONFIDENTIAL. i CODE HOUSING UNIT NUMBER: UUUrJ (Ask which unit number they live in during lease up process or code unit number ifdoor to door survey)
Q1. Are you the person that holds the lease to this housing unit? 0 ( 5 ) (CODE 1 ifyes, otherwise choose from list below)
Adult child (>18 yrs) of the leasee 3
AunWncle of the leasee 5 Other family member of the leasee 6 Friend of the leasee 7
Spouse/significant other 2
Grandparent of the leasee 4
DEMOGRAPHICS D1. Sex of respondent:
Male 1 Female0
D2. What is your age? [CDC 37 19941 Code age in years (VOL) Refused 99
OUU (7-9)
D3. What is your race? Would you say: [CDC 38 19941 El (10) White 1 Black or African American 2 Asian, Pacific Islander 3 American Indian, Alaska Native 4 (VOL) Hispanic 5
(VOL) Don’t know/Not sure 8 (VOL) Refused 9
[IF HISPANIC, CODE BUT DO NOT READ “HISPANIC” CATEGORY] Other (specify) 6
2
and do not necessarily reflect the official position or policies of the U.S. Department of Justice. been published by the Department. Opinions or points of view expressed are those of the author(s) This document is a research report submitted to the U.S. Department of Justice. This report has not
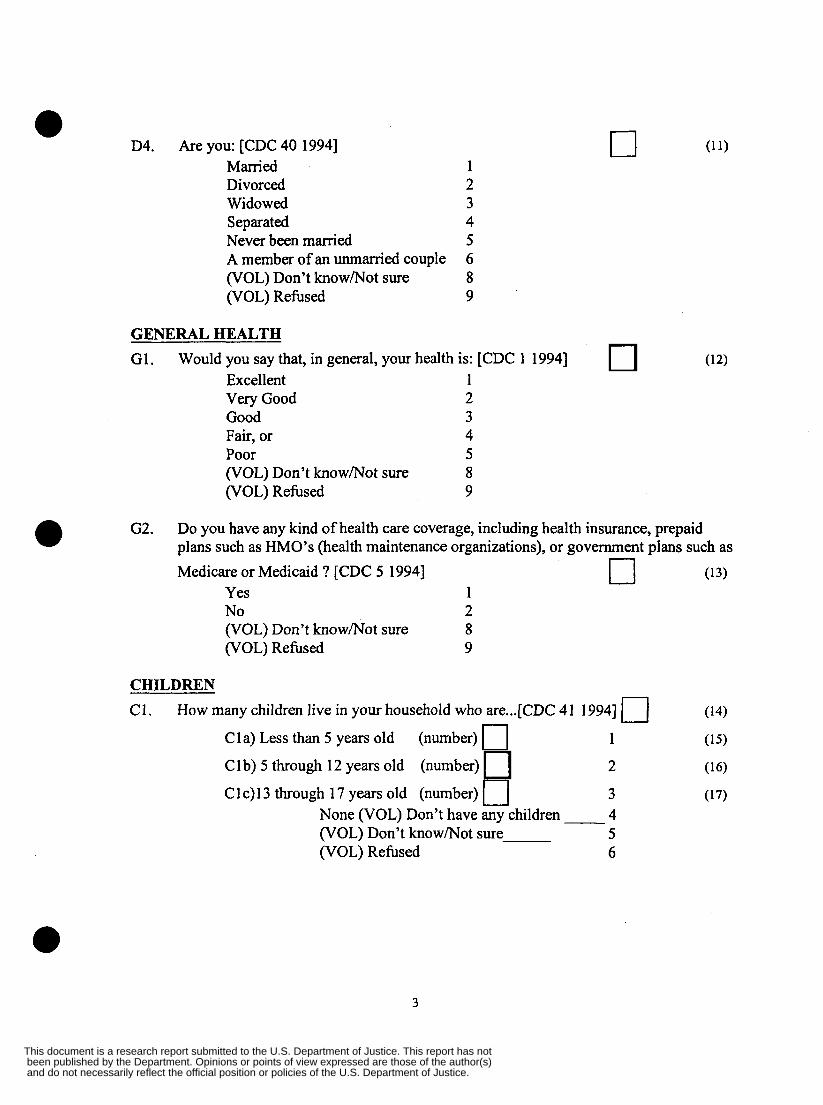
D4. Are you: [CDC 40 19941 a
Married Divorced Widowed Separated Never been married A member of an unmarried couple (VOL) Don’t know/Not sure (VOL) Refused
0
GENERALHEALTH
G1. Would you say that, in general, your health is: [CDC 1 19941 (12) Excellent 1 Very Good 2 Good 3 Fair, or 4 Poor 5 (VOL) Don’t know/Not sure 8 (VOL) Rehsed 9
G2. Do you have any kind of health care coverage, including health insurance, prepaid plans such as HMO’s (health maintenance organizations), or government plans such as a Medicare or Medicaid ? [CDC 5 19941 0 (13)
Yes 1 No 2 (VOL) Don’t know/Not sure 8 (VOL) Refused 9
CHILDREN C1. How many children live in your household who are...[CDC 41 19941 c] (14) .
C 1 a) Less than 5 years old (number) u 1 (15)
C 1 b) 5 through 12 years old (number)
C 1 c) 13 through 17 years old (number) 0 2 (16)
3 (17) None (VOL) Don’t have any children 4 (VOL) Don’t know/Not sure 5 (VOL) Refused 6
3
and do not necessarily reflect the official position or policies of the U.S. Department of Justice. been published by the Department. Opinions or points of view expressed are those of the author(s) This document is a research report submitted to the U.S. Department of Justice. This report has not
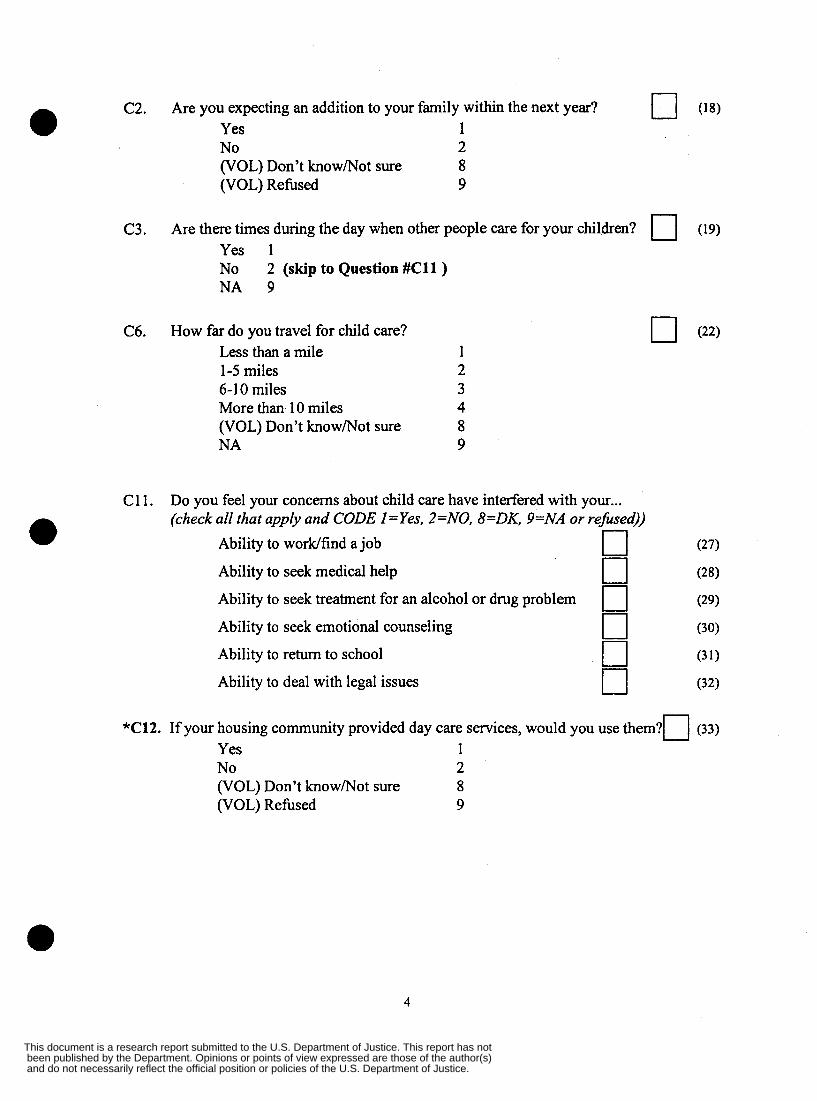
. C2. Are you expecting an addition to your family within the next year? u (18)
Yes 1 No 2 (VOL) Don’t knowmot sure 8 (VOL) Rehsed 9
C3. Are there times during the day when other people care for your children? [7 (19) Yes 1 No NA 9
2 (skip to Question #C11)
C6. How far do you travel for child care? Less than a mile 1 1-5 miles 2 6- 10 miles 3 More than 10 miles 4 (VOL) Don’t know/Not sure 8 NA 9
c11. Do you feel your concerns about child care have interfered with yo ur... (check all that apply and CODE 1 =Yes, 2=NO, 8=DK, 9=NA or refused))
Ability to worwfind a job
Ability to seek medical help
Ability to seek treatment for an alcohol or drug problem
Ability to seek emotional counseling
Ability to return to school
Ability to deal with legal issues
u 0 0 0
*C12. If your housing community provided day care services, would you use t h e m ? n (33) Yes 1 No 2 (VOL) Don’t know/Not sure 8 (VOL) Refused 9
4
and do not necessarily reflect the official position or policies of the U.S. Department of Justice. been published by the Department. Opinions or points of view expressed are those of the author(s) This document is a research report submitted to the U.S. Department of Justice. This report has not
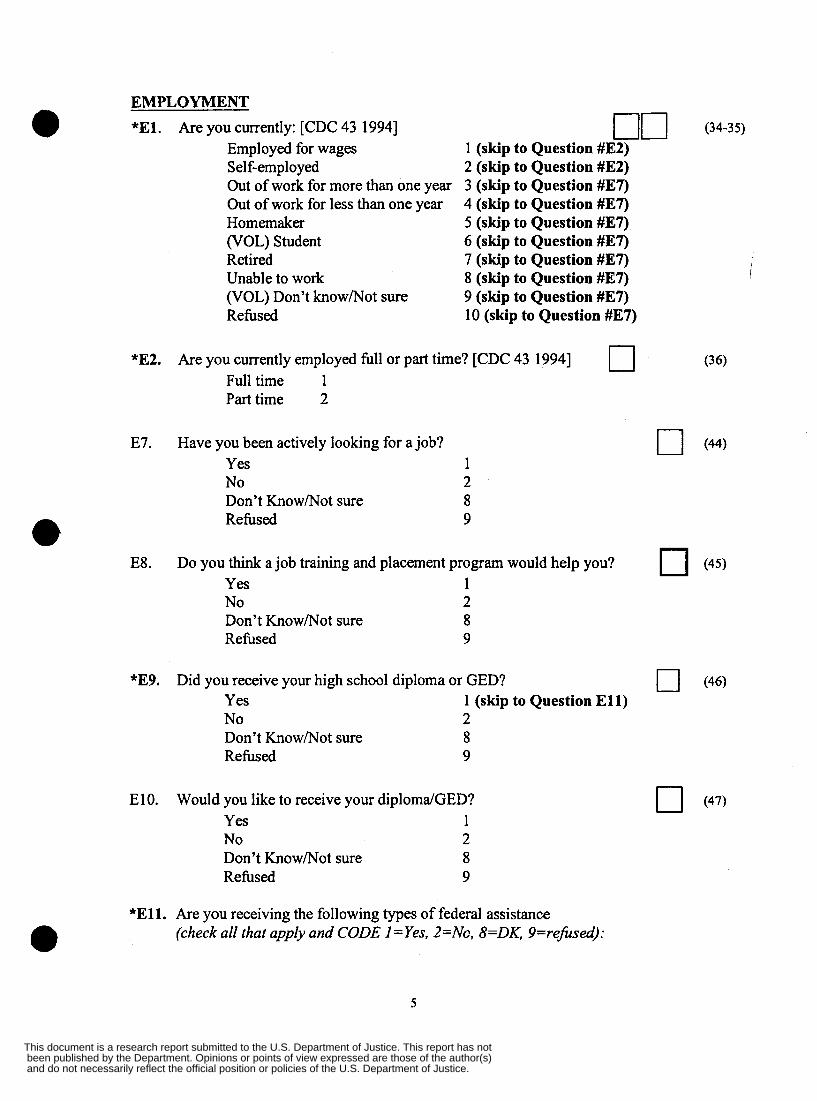
EMPLOYMENT
*El. Are you currently: [CDC 43 19941 Employed for wages Self-employed Out of work for more than one year Out of work for less than one year Homemaker (VOL) Student Retired Unable to work (VOL) Don’t knowmot sure Refused
1 (skip to Question #E2) 2 (skip to Question #E2) 3 (skip to Question #E7) 4 (skip to Question #E7) 5 (skip to Question #E7) 6 (skip to Question #E7) 7 (skip to Question #E7) 8 (skip to Question #E7) 9 (skip to Question #E7) 10 (skip to Question #E7)
I
I
*E2. Are you currently employed full or part time? [CDC 43 19941 u (36) Full time 1 Part time 2
E7. Have you been actively looking for a job? Yes 1 No 2 Don’t KnowhJot sure 8 Refused 9
E8. Do you think a job training and placement program would help you? (45) YeS 1 No 2 Don’t Know/Not sure 8 Refused 9
*E9. Did you receive your high school diploma or GED? 0 (46) Yes No 2 Don’t KnowhJot sure 8 Refused 9
1 (skip to Question E l l )
E 10. Would you like to receive your diplomdGED? YeS 1 No 2 Don’t Knowmot sure 8 Refused 9
*El l . Are you receiving the following types of federal assistance (check all that apply and CODE I =Yes, 2=Nc, 8=DK, 9=refused):
5
and do not necessarily reflect the official position or policies of the U.S. Department of Justice. been published by the Department. Opinions or points of view expressed are those of the author(s) This document is a research report submitted to the U.S. Department of Justice. This report has not
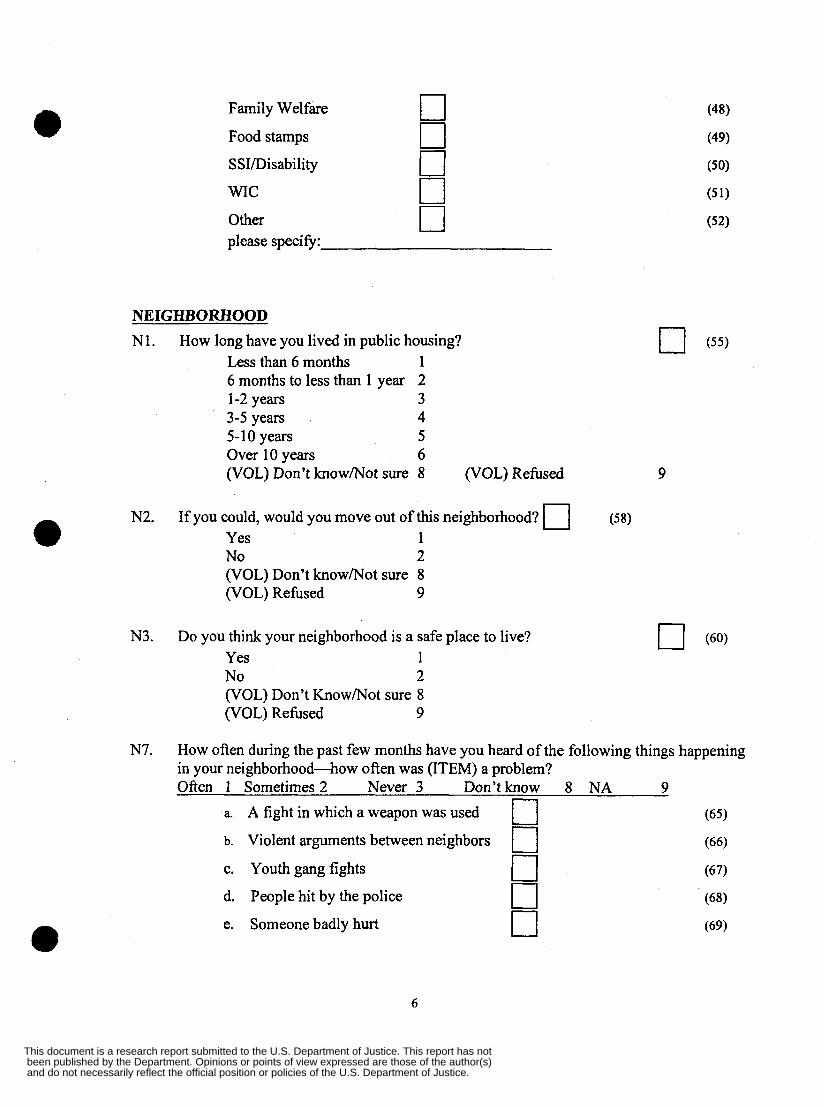
Family Welfare 0 Food stamps 0 S SIDisability 0 WIC 0 Other ‘0 please specify:
NEIGHBORHOOD N1.
N2.
N3.
N7.
If you could, would you move out of this neighborhood? c] (58 ) Yes 1 No 2 (VOL) Don’t know/Not sure 8 (VOL) Refused 9
Do you think your neighborhood is a safe place to live? Yes 1 No 2 (VOL) Don’t Know/Not sure 8 (VOL) Refused 9
How long have you lived in public housing? Less than 6 months 1 6 months to less than 1 year 2 1-2 years 3 3-5 years . 4 5-1 0 years 5
(VOL) Don’t know/Not sure 8 (VOL) Refused 9 Over 10 years 6
How often during the past few months have you heard of the following things happening in your neighborhood-how often was (ITEM) a problem? Often 1 Sometimes2 Never 3 Don’tknow 8 NA 9
a. A fight in which a weapon was used 0 0
(65)
b. Violent arguments between neighbors 0 (66)
(67)
(68)
c. Youth gang fights
d. People hit by the police
e. Someone badly hurt
6
U (69)
and do not necessarily reflect the official position or policies of the U.S. Department of Justice. been published by the Department. Opinions or points of view expressed are those of the author(s) This document is a research report submitted to the U.S. Department of Justice. This report has not
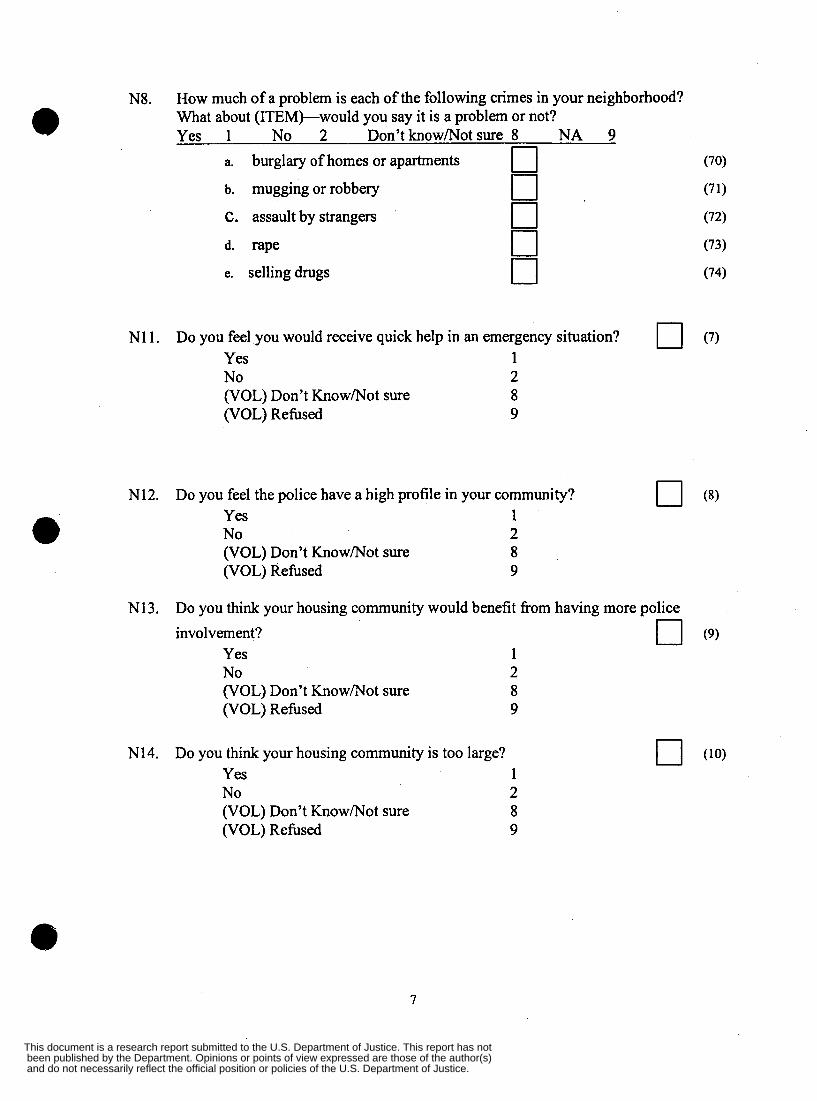
N8. How much of a problem is each of the following crimes in your neighborhood? What about (ITEM)--would you say it is a problem or not? Yes 1 No 2 Don’t know/Not sure 8 NA 9
a. burglary of homes or apartments 0 b. mugging or robbery o C. assault by strangers 0 d. rape 0 e. selling drugs 0
N1 1 . Do you feel you would receive quick help in an emergency situation? [7 YeS 1 No 2 (VOL) Don’t Know/Not sure 8 (VOL) Refused 9
0 N12. Do you feel the police have a high profile in your community? Yes 1 No 2 (VOL) Don’t Know/Not sure 8 (VOL) Refused 9
N13. Do you think your housing community would benefit fi-om having more police . U involvement?
Yes 1 No 2 (VOL) Don’t Know/Not sure 8 (VOL) Refused 9
N14. Do you think your housing community is too large? Yes 1 No 2 (VOL) Don’t Know/Not sure 8 (VOL) Refused 9
(7)
(9)
7
and do not necessarily reflect the official position or policies of the U.S. Department of Justice. been published by the Department. Opinions or points of view expressed are those of the author(s) This document is a research report submitted to the U.S. Department of Justice. This report has not
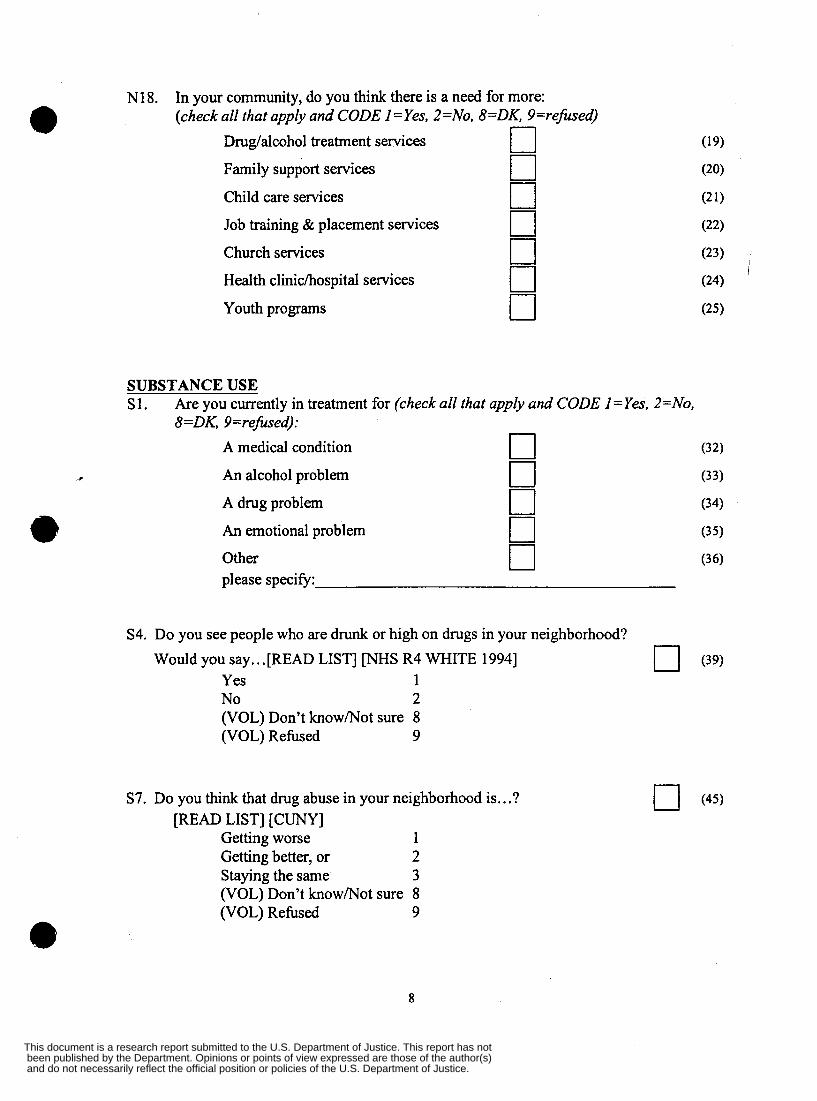
N18. In your community, do you think there is a need for more: (check all that apply and CODE I =Yes, 2=No, 8=DK, P=refused)
Drug/alcohol treatment services e
Family support services
Child care services
Job training & placement services 0 Church services 0 Health clinichospital services 0 Youth programs 0
SUBSTANCE USE S 1. Are you currently in treatment for (check all that apply and CODE I =Yes, 2=No,
8=DK, 9 =refused):
(32)
(33)
(34)
(35)
(3 6)
A medical condition 0 An alcohol problem 0 A drug problem 0
0 Other 0 An emotional problem
please specify:
S4. Do you see people who are drunk or high on drugs in your neighborhood? Would you say.. .[READ LIST] ["S R4 WHITE 19941 0 (39)
Yes 1 No 2 (VOL) Don't knowMot sure 8 (VOL) Refused 9
S7. Do you think that drug abuse in your neighborhood is.. .? [READ LIST] [CUNY]
Getting worse 1 Getting better, or 2 Staying the same 3
(VOL) Refused 9 (VOL) Don't knowMot sure 8
8
and do not necessarily reflect the official position or policies of the U.S. Department of Justice. been published by the Department. Opinions or points of view expressed are those of the author(s) This document is a research report submitted to the U.S. Department of Justice. This report has not
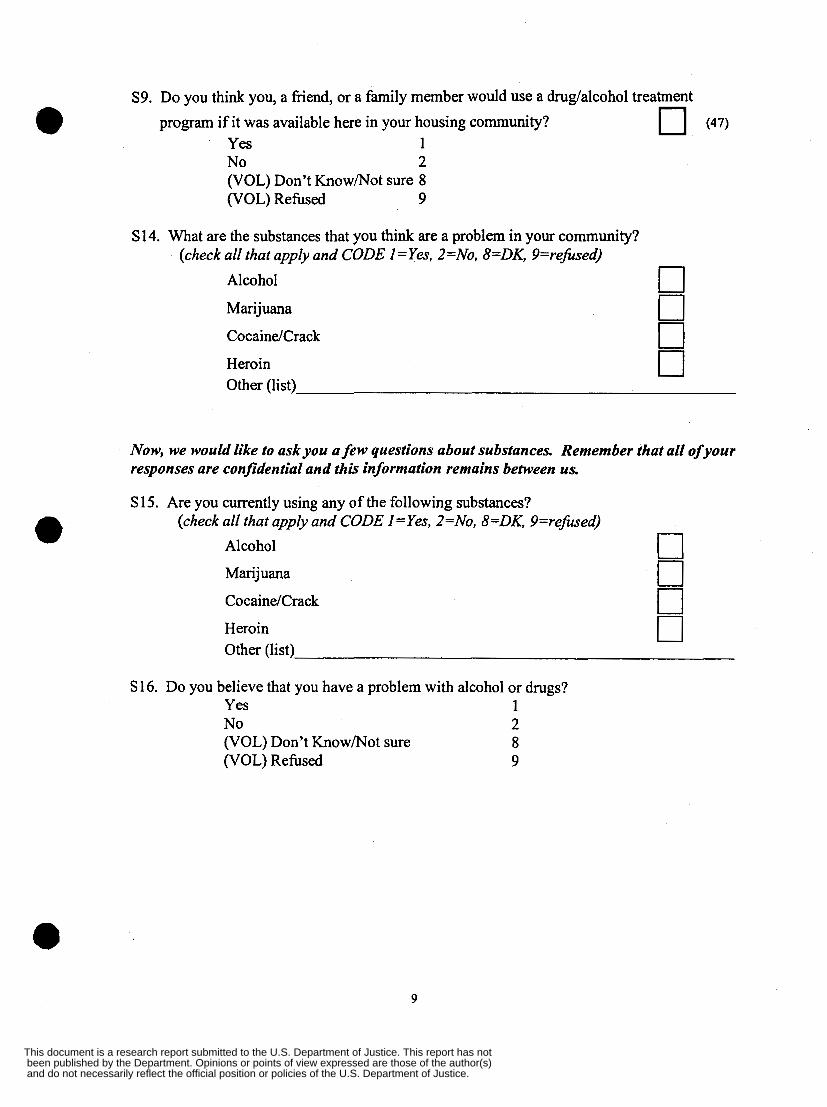
S9. Do you think you, a friend, or a family member would use a drug/alcohol treatment program if it was available here in your housing community? (47)
Yes 1 No 2 (VOL) Don’t Know/Not sure 8
e (VOL) Refused 9
S 14. What are the substances that you think are a problem in your community? (check all that apply and CODE 1 =Yes, 2=No, 8=DK, 9=refued)
Alcohol 0 Marijuana 0 CocaineKrack 0 Heroin 0 Other (list)
Now, we would like to ask you a few questions about substances. Remember that all of your responses are confidential and this information remains between us.
S 15. Are you currently using any of the following substances? (check all that apply and CODE I =Yes, 2=No, 8=DK, 9=refised)
Alcohol 0 Marijuana 0 Cocaine/Crack 0 Heroin 0 Other (list)
S 16. Do you believe that you have a problem with alcohol or drugs? Yes 1 No 2 (VOL) Don’t Know/Not sure 8 (VOL) Refused 9
9
and do not necessarily reflect the official position or policies of the U.S. Department of Justice. been published by the Department. Opinions or points of view expressed are those of the author(s) This document is a research report submitted to the U.S. Department of Justice. This report has not
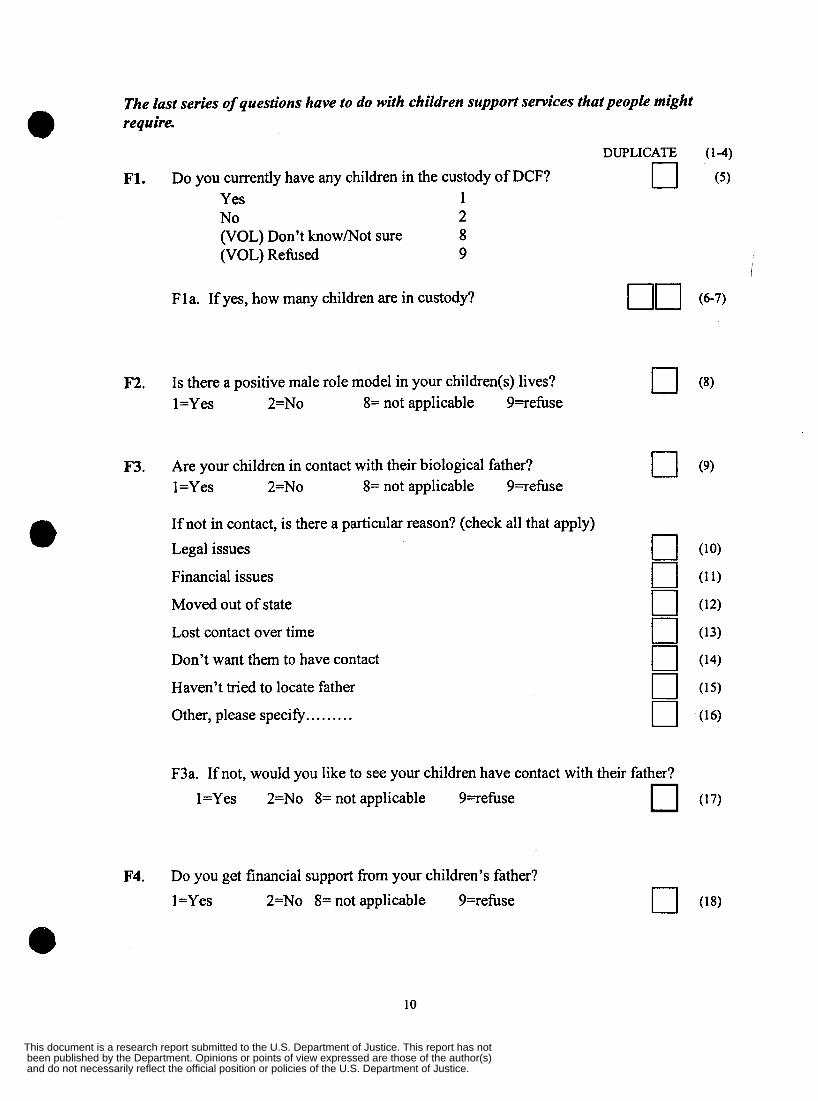
The last series of questions have to do with children support services that people might require.
DUPLICATE (14)
F1. Do you currently have any children in the custody of DCF? 0 ( 5 ) Yes 1 No 2 (VOL) Don’t know/Not sure 8 (VOL) Refused 9
F 1 a. If yes, how many children are in custody?
F2. Is there a positive male role model in your children(s) lives? l=Yes 2=No 8= not applicable 9=refuse
F3. Are your children in contact with their biological father? l=Yes 2=No 8= not applicable 9=refuse
If not in contact, is there a particular reason? (check all that apply) Legal issues
Financial issues
Moved out of state
Lost contact over time
Don’t want them to have contact
Haven’t tried to locate father
Other, please specify .... . ... .
c] (9 )
F3a. If not, would you like to see your children have contact with their father?
l=Yes 2=No 8= not applicable 9=refuse (17)
F4. Do you get financial support fiom your children’s father? 1 =Yes 2=No 8= not applicable 9-7efuse
10
and do not necessarily reflect the official position or policies of the U.S. Department of Justice. been published by the Department. Opinions or points of view expressed are those of the author(s) This document is a research report submitted to the U.S. Department of Justice. This report has not
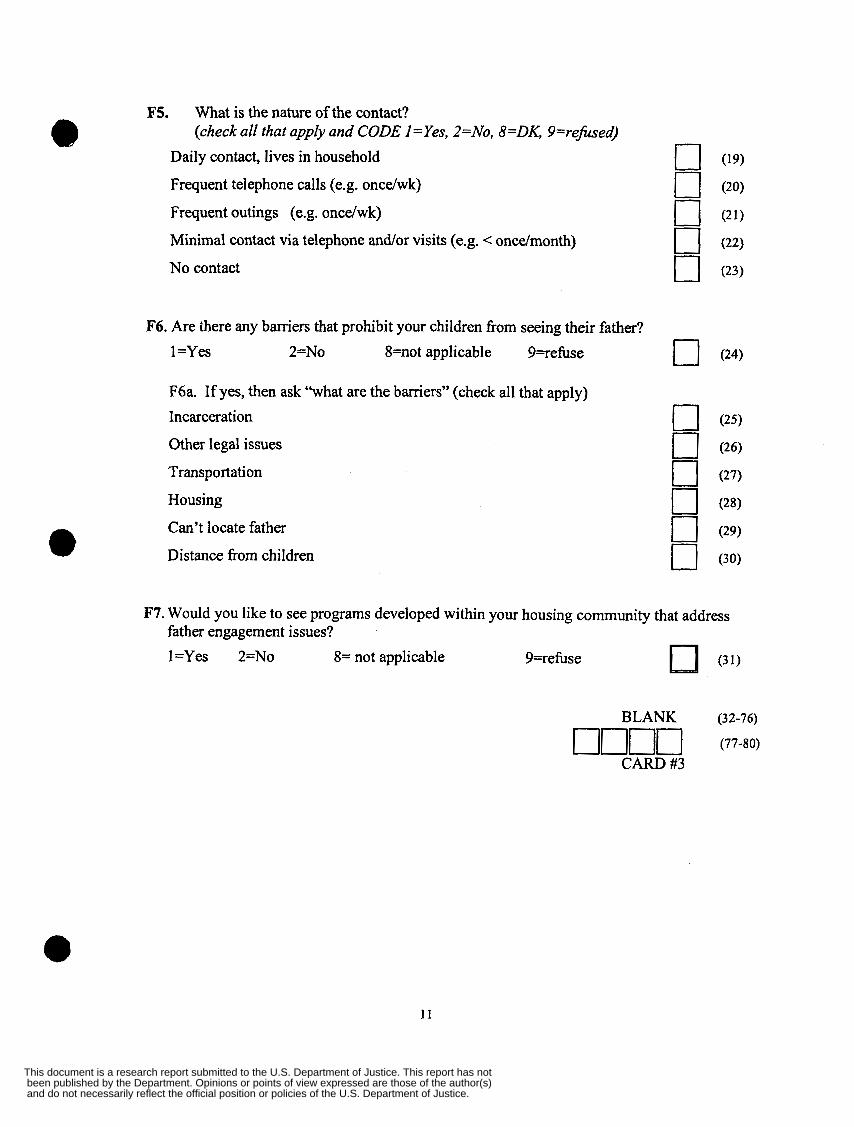
F5. What is the nature of the contact? (check all that apply and CODE I =Yes, 2=No, 8=DK, 9=reJ;sed)
Daily contact, lives in household
Frequent telephone calls (e.g. oncelwk)
Frequent outings (e.g. once/wk)
Minimal contact via telephone and/or visits (e.g. < oncdmonth)
No contact
F6. Are there any barriers that prohibit your children from seeing their father? 1 =Yes 2=No 8=not applicable 9-rehse
F6a. If yes, then ask “what are the barriers” (check all that apply) Incarceration
Other legal issues
Transportation
Housing
Can’t locate father
Distance from children
F7. Would you like to see programs developed within your housing community that address father engagement issues? l=Yes 2=No 8= not applicable 9=refuse (31)
BLANK (32-76) nr1r1r-j (77-80) CARD #3
and do not necessarily reflect the official position or policies of the U.S. Department of Justice. been published by the Department. Opinions or points of view expressed are those of the author(s) This document is a research report submitted to the U.S. Department of Justice. This report has not
*****
FAMILIES FIRST
Short-Form 3/99
1
i
and do not necessarily reflect the official position or policies of the U.S. Department of Justice. been published by the Department. Opinions or points of view expressed are those of the author(s) This document is a research report submitted to the U.S. Department of Justice. This report has not
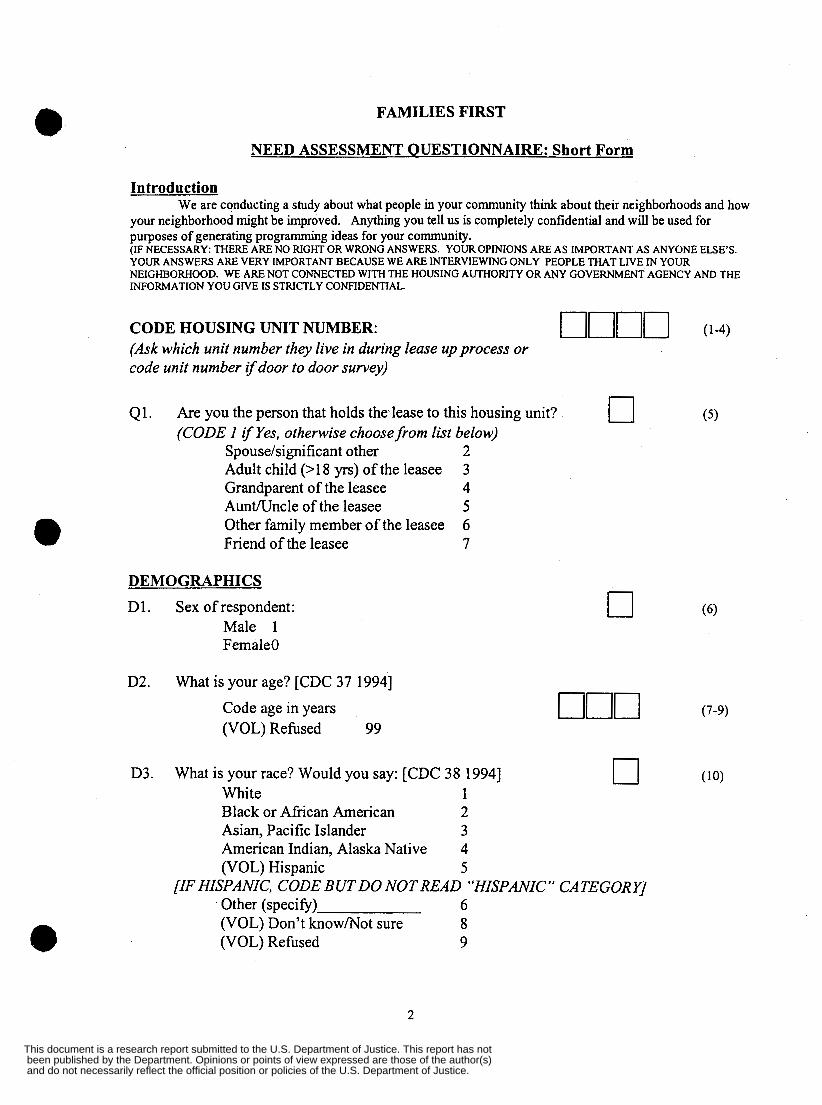
FAMILIES FIRST
NEED ASSESSMENT QUESTIONNAIRE: Short Form
Introduction We are conducting a study about what pepple in your community think about their neighborhoods and how
your neighborhood might be improved. Anything you tell us is completely confidential and will be used for purposes of generating programming ideas for your community. (IF NECESSARY: THERE ARE NO RIGHT OR WRONG ANSWERS. YOUROPINIONS ARE AS IMPORTANT AS ANYONE ELSE’S. YOUR ANSWERS ARE VERY IMPORTANT BECAUSE WE ARE INTERVIEWING ONLY PEOPLE THAT LIVE IN YOUR NEIGHBORHOOD. WE ARE NOT CONNECTED WITH THE HOUSING AUTHORITY OR ANY GOVERNMENT AGENCY AND THE INFORMATION YOU GIVE IS STRICTLY CONFIDENTIAL.
CODE HOUSING UNIT NUMBER: nunu (1-4) (Ask which unit number they live in during lease up process or code unit number ifdoor to door survey)
Q1. Are you the person that holds the lease to this housing unit? 0 ( 5 ) (CODE I if Yes, otherwise choose from list below)
Spouse/significant other 2 Adult child (>18 yrs) of the leasee 3 Grandparent of the leasee 4 Aunt/Uncle of the leasee 5 Other family member of the leasee 6 Friend of the leasee 7
DEMOGRAPHICS
D1.
D2.
D3.
Sex of respondent: Male 1 Female0
What is your age? [CDC 37 19941
Code age in years (VOL) Rehsed 99
0
0 What is your race? Would you say: [CDC 38 19941 White 1 Black or African American 2 Asian, Pacific Islander 3 American Indian, Alaska Native 4 (VOL) Hispanic 5
(VOL) Don’t knowmot sure 8
[IF HISPANIC, CODE BUTDO NOT READ “HISPANIC” CATEGORY] Other (specib) 6
(VOL) Refused 9
2
and do not necessarily reflect the official position or policies of the U.S. Department of Justice. been published by the Department. Opinions or points of view expressed are those of the author(s) This document is a research report submitted to the U.S. Department of Justice. This report has not
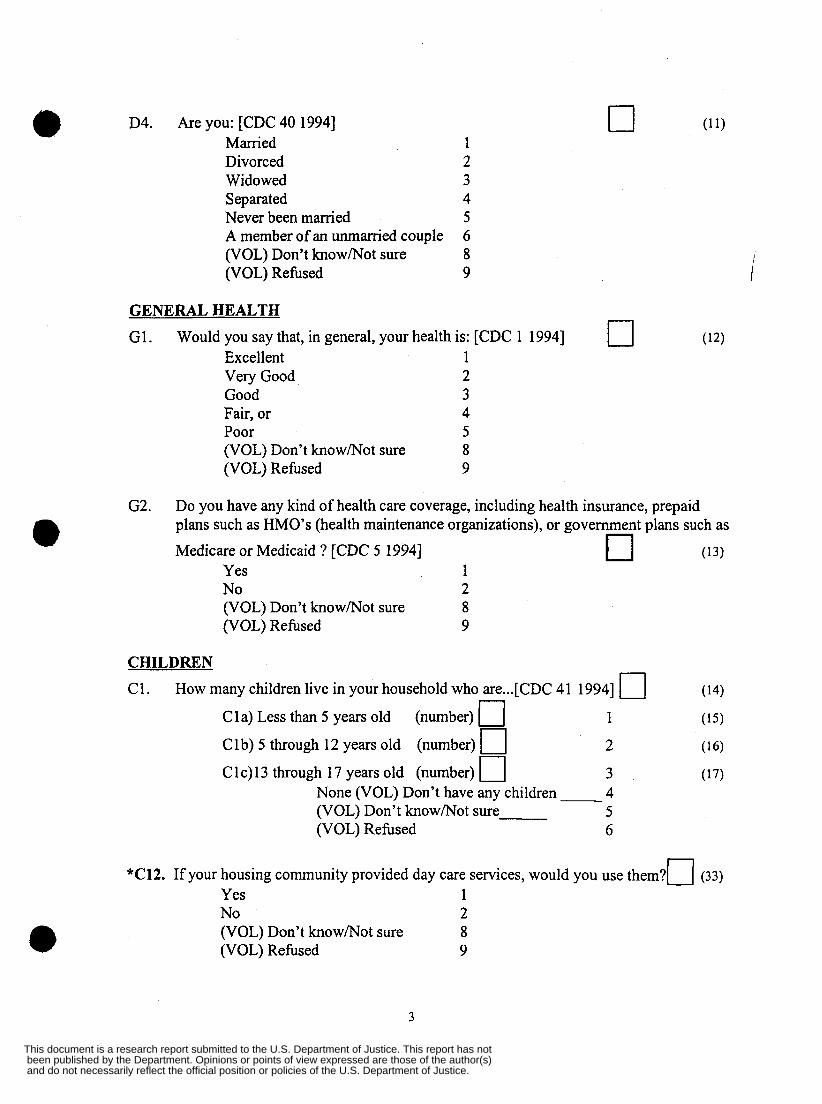
D4. Are you: [CDC 40 19941 Married Divorced 2 Widowed 3 Separated 4 Never been married 5 A member of an unmarried couple 6 (VOL) Don’t know/Not sure 8 (VOL) Refused 9
GENERALHEALTH
G1. Would you say that, in general, your health is: [CDC 1 19941 0 (12) Excellent 1 Very Good 2 Good 3 Fair, or 4 Poor 5 (VOL) Don’t know/Not sure 8 (VOL) Refused 9
G2. Do you have any kind of health care coverage, including health insurance, prepaid plans such as HMO’s (health maintenance organizations), or government plans such as
Medicare or Medicaid ? [CDC 5 19941 (13) e
Yes 1 No 2 (VOL) Don’t know/Not sure 8 (VOL) Refbed 9
CHILDREN C1. How many children live in your household who are ...[ CDC 41 19941 n (14)
Cla) Less than 5 years old (number) 0 1 (15)
Clb) 5 through 12 years old (number) 0 2 (16)
C 1 c) 13 through 17 years old (number) 0 3 (17) None (VOL) Don’t have any children 4 (VOL) Don’t know/Not sure 5 (VOL) Refixed 6
*C12. If your housing community provided day care services, would you use t h e r n ? u (33) Yes 1 No 2 (VOL) Don’t know/Not sure 8 e (VOL) Refixed 9
3
and do not necessarily reflect the official position or policies of the U.S. Department of Justice. been published by the Department. Opinions or points of view expressed are those of the author(s) This document is a research report submitted to the U.S. Department of Justice. This report has not
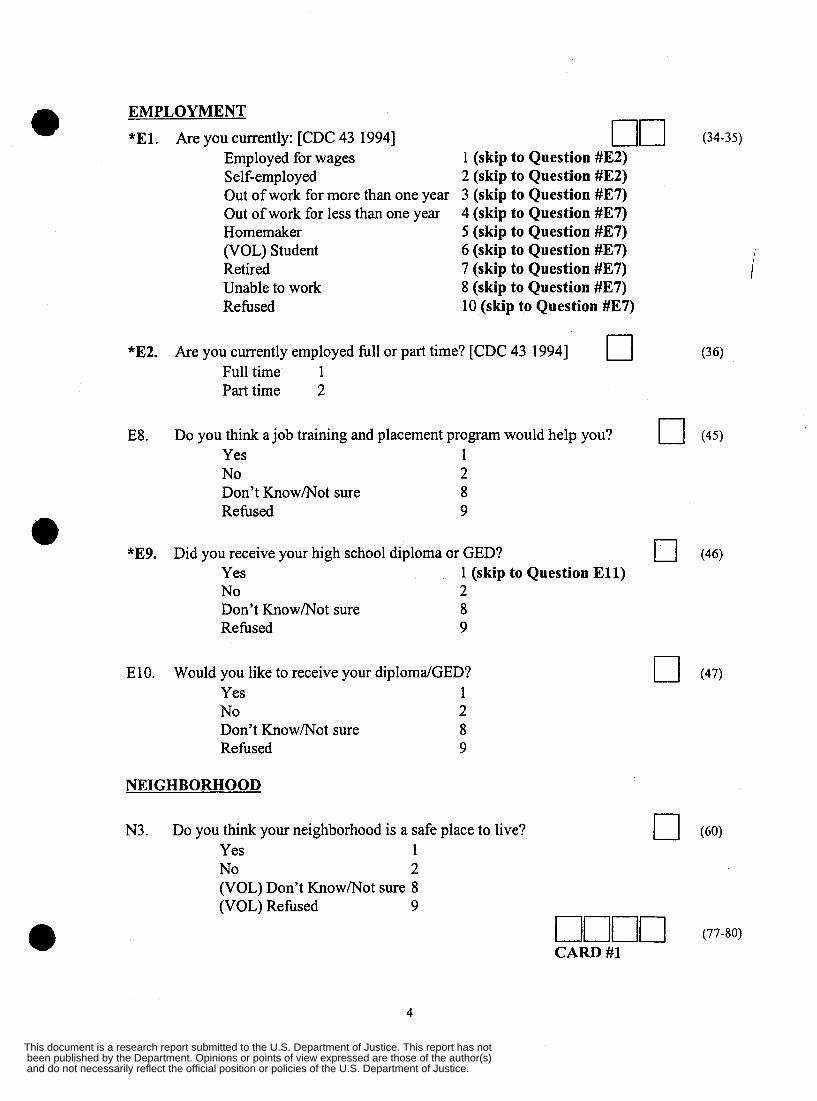
EMPLOYMENT
*El. Are you currently: [CDC 43 19941 Employed for wages Self-employed Out of work for more than one year Out of work for less than one year Homemaker (VOL) Student Retired Unable to work Refused
nn (34-35) 1 (skip to Question #E2) 2 (skip to Question #E2) 3 (skip to Question #E7) 4 (skip to Question #E7) 5 (skip to Question #E7) 6 (skip to Question #E7) 7 (skip to Question #E7) 8 (skip to Question #E7) 10 (skip to Question #E7)
i
*E2. Are you currently employed full or part time? [CDC 43 19941 0 (36) Full time 1 Part time 2
E8. Do you think a job training and placement program would help you? 0 (45) Yes 1 No 2 Don’t Know/Not sure 8 Refused 9
- *E9. Did you receive your high school diploma or GED?
Yes No 2 Don’t Know/Not sure 8 Refused 9
1 (skip to Question E l l )
E10. Would you like to receive your diplomdGED? Yes 1 No 2 Don’t Know/Not sure 8 Refused 9
NEIGHBORHOOD
N3. Do you think your neighborhood is a safe place to live? Yes 1 No 2 (VOL) Don’t Know/Not sure 8 (VOL) Refused 9 nnnn (77-80)
CARD #1
4
and do not necessarily reflect the official position or policies of the U.S. Department of Justice. been published by the Department. Opinions or points of view expressed are those of the author(s) This document is a research report submitted to the U.S. Department of Justice. This report has not
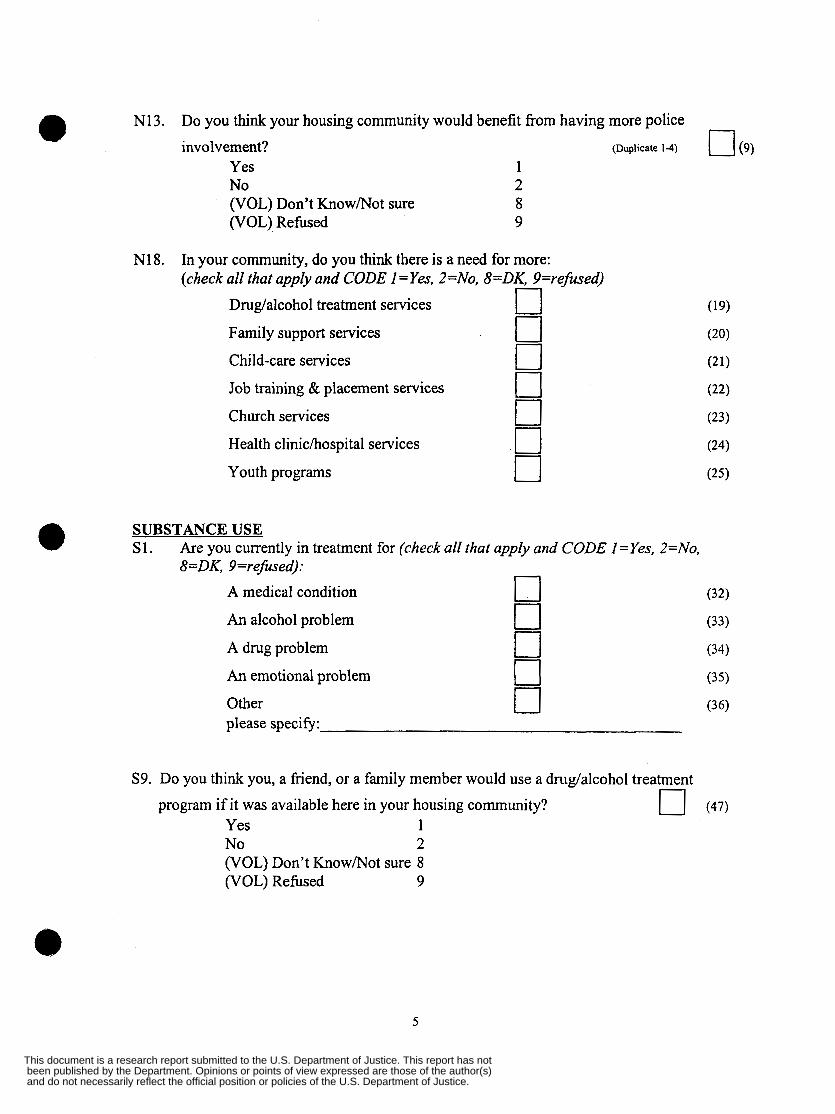
N13. Do you think your housing community would benefit from having more police involvement? (Duplicate 1-4) El (9)
1 Yes No 2 (VOL) Don’t Know/Not sure 8 (VOL) Refused 9
0
N18. In your community, do you think there is a need for more: (check all that apply and CODE 1 =Yes, 2=No, 8=DK, 9=refused)
(19)
(20)
(21)
(22)
(23)
(24)
(25)
Druglalcohol treatment services cl Family support services 0 Child-care services 0
0 Church services 0 Health clinichospital services 0 Youth programs 0
Job training & placement services
SUBSTANCE USE S1. Are you currently in treatment for (check all that appZy and CODE I =Yes, 2=No,
8=DK, 9=refused):
(32)
(33)
(34)
(35)
(36)
A medical condition 0 An alcohol problem 0 A drug problem 0 An emotional problem 0 Other 0 please specify:
S9. Do you think you, a friend, or a family member would use a drug/alcohol treatment program if it was available here in your housing community? 0 (47)
Yes 1 No 2 (VOL) Don’t Know/Not sure 8 (VOL) Refused 9
5
and do not necessarily reflect the official position or policies of the U.S. Department of Justice. been published by the Department. Opinions or points of view expressed are those of the author(s) This document is a research report submitted to the U.S. Department of Justice. This report has not
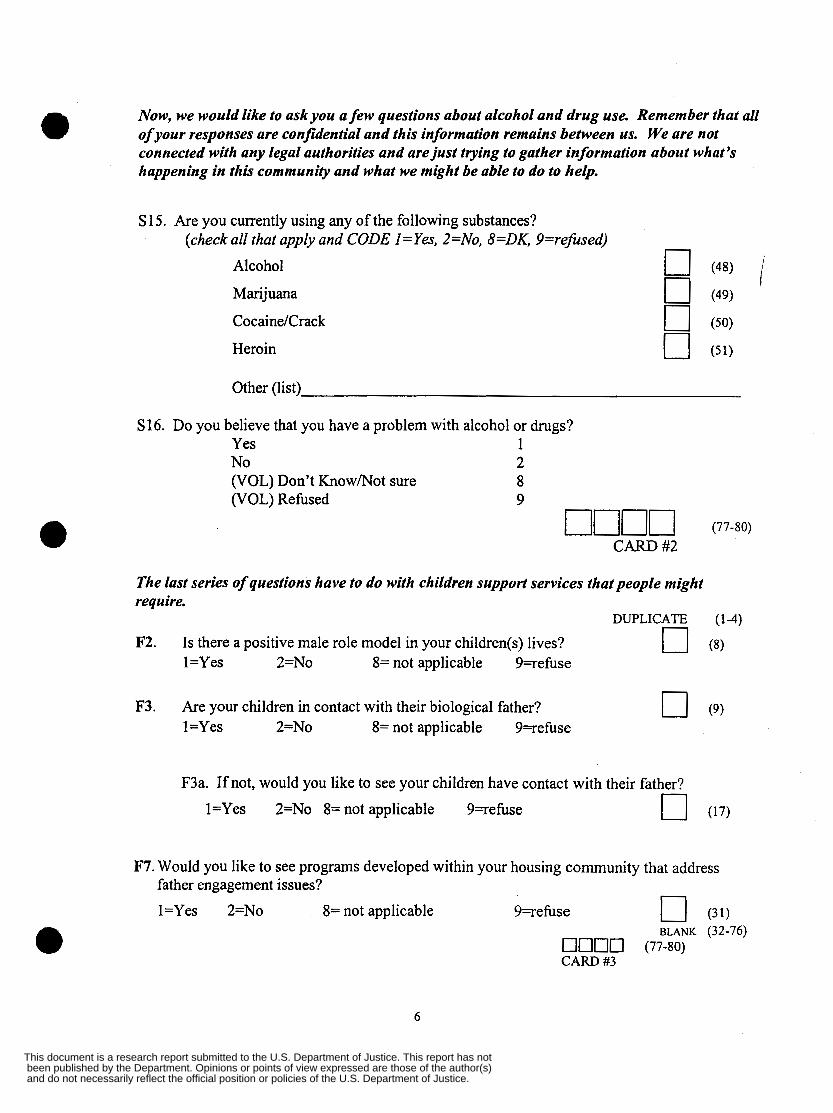
Now, we would like to ask you a few questions about alcohol and drug use. Remember that all of your responses are confidential and this information remains between us. We are not connected with any legal authorities and are just trying to gather information about what’s happening in this communiil, and what we might be able to do to help.
S 15. Are you currently using any of the following substances? (check all that apply and CODE I =Yes, 2=No, 8=DK, 9=refused)
Alcohol 0 (48) / Marijuana 0 (49)
CocaineKrack 0 (50)
Heroin 0 (51)
S16. Do you believe that you have a problem with alcohol or drugs? Yes 1 No 2 (VOL) Don’t Know/Not sure 8 (VOL) Refused 9 ninn (77-80)
CARD #2
The last series of questions have to do with children support services that people might require.
DUPLICATE n (1 -4)
F2. Is there a positive male role model in your children(s) lives? u (8) l=Yes 2=No 8= not applicable 9=refbse
F3. Are your children in contact with their biological father? 0 (9) l=Yes 2=No 8= not applicable 9=refuse
F3a. If not, would you like to see your children have contact with their father?
l=Yes 2=No 8= not applicable 9=refbse 0 (17)
F7. Would you like to see programs developed within your housing community that address father engagement issues? l=Yes 2=No 8= not applicable 9=refise 17 (31)
BLANK (32-76) ~ 0 0 0 (77-80) CARD #3
6
and do not necessarily reflect the official position or policies of the U.S. Department of Justice. been published by the Department. Opinions or points of view expressed are those of the author(s) This document is a research report submitted to the U.S. Department of Justice. This report has not

FAMILIES FIRST i
FINAL SURVEY McCounaghy Terrace
September 2000
1
and do not necessarily reflect the official position or policies of the U.S. Department of Justice. been published by the Department. Opinions or points of view expressed are those of the author(s) This document is a research report submitted to the U.S. Department of Justice. This report has not
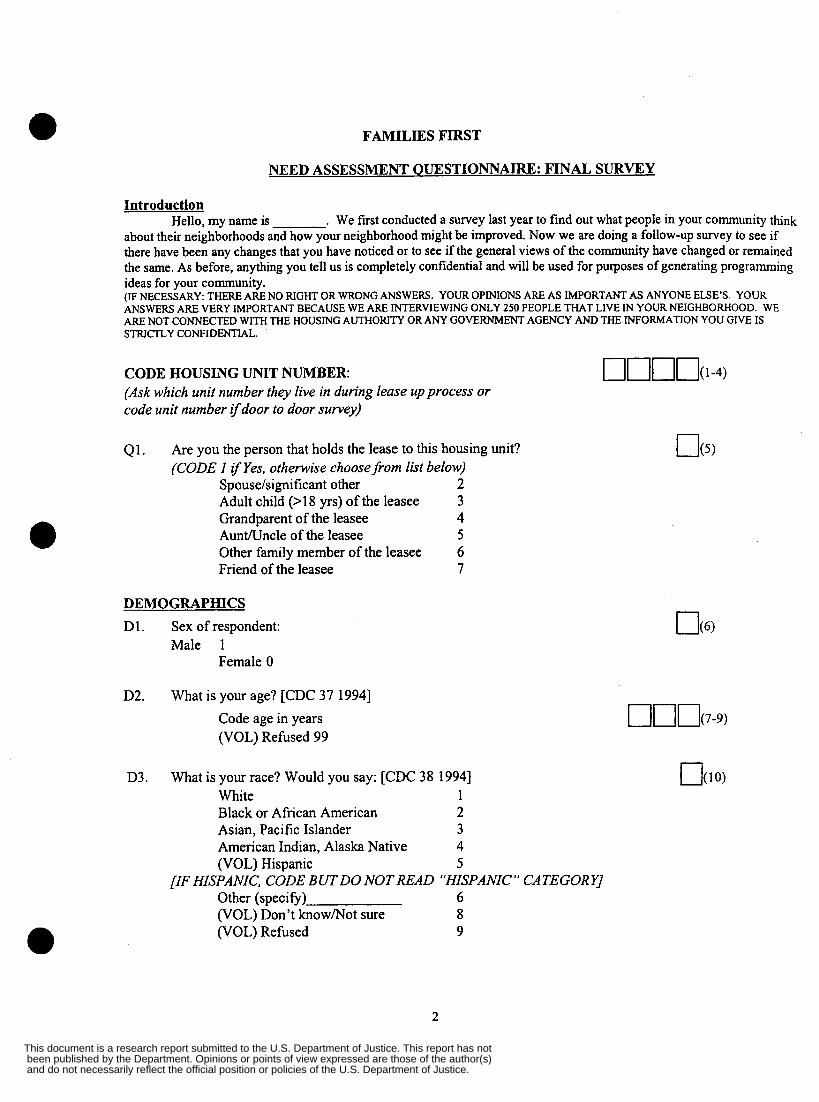
FAMILIES FIRST
NEED ASSESSMENT QUESTIONNAIRE: FINAL SURVEY
Introduction . We first conducted a survey last year to find out what people in your community think
about their neighborhoods and how your neighborhood might be improved. Now we are doing a follow-up survey to see if there have been any changes that you have noticed or to see if the general views of the community have changed or remained the same. As before, anything you tell us is completely confidential and will be used for purposes of generating programming ideas for your community. (IF NECESSARY: THERE ARE NO RIGHT OR WRONG ANSWERS. YOUR OPINIONS ARE AS IMPORTANT AS ANYONE ELSE’S. YOUR ANSWERS ARE VERY IMPORTANT BECAUSE WE ARE INTERVIEWING ONLY 250 PEOPLE THAT LIVE IN YOUR NEIGHBORHOOD. WE ARE NOT CONNECTED WITH THE HOUSING AUTHORITY OR ANY GOVERNMENT AGENCY AND THE INFORMATION YOU GIVE IS STRICTLY CONFIDENTIAL.
Hello, my name is
CODE HOUSING UNIT NUMBER: (Ask which unit number they live in during lease upprocess or code unit number ifdoor to door survey)
Q1. Are you the person that holds the lease to this housing unit? (CODE 1 i f Yes, otherwise choosefrom list below)
3
AuntAJncle of the leasee 5 Other family member of the leasee 6 Friend of the leasee 7
Spouse/significant other 2 Adult child (>18 yrs) of the leasee Grandparent of the leasee 4
DEMOGRAPHICS D1.
D2.
D3.
Sex of respondent: Male 1
Female 0
What is your age? [CDC 37 19941 Code age in years (VOL) Refused 99
What is your race? Would you say: [CDC 38 19941 White 1 Black or African American 2 Asian, Pacific Islander 3 American Indian, Alaska Native 4 (VOL) Hispanic 5
[IF HISPANIC, CODE BUT DO NOT READ “HISPANIC” CATEGORY] Other (specify) 6 (VOL) Don’t knowMot sure 8 (VOL) Refused 9
2
and do not necessarily reflect the official position or policies of the U.S. Department of Justice. been published by the Department. Opinions or points of view expressed are those of the author(s) This document is a research report submitted to the U.S. Department of Justice. This report has not
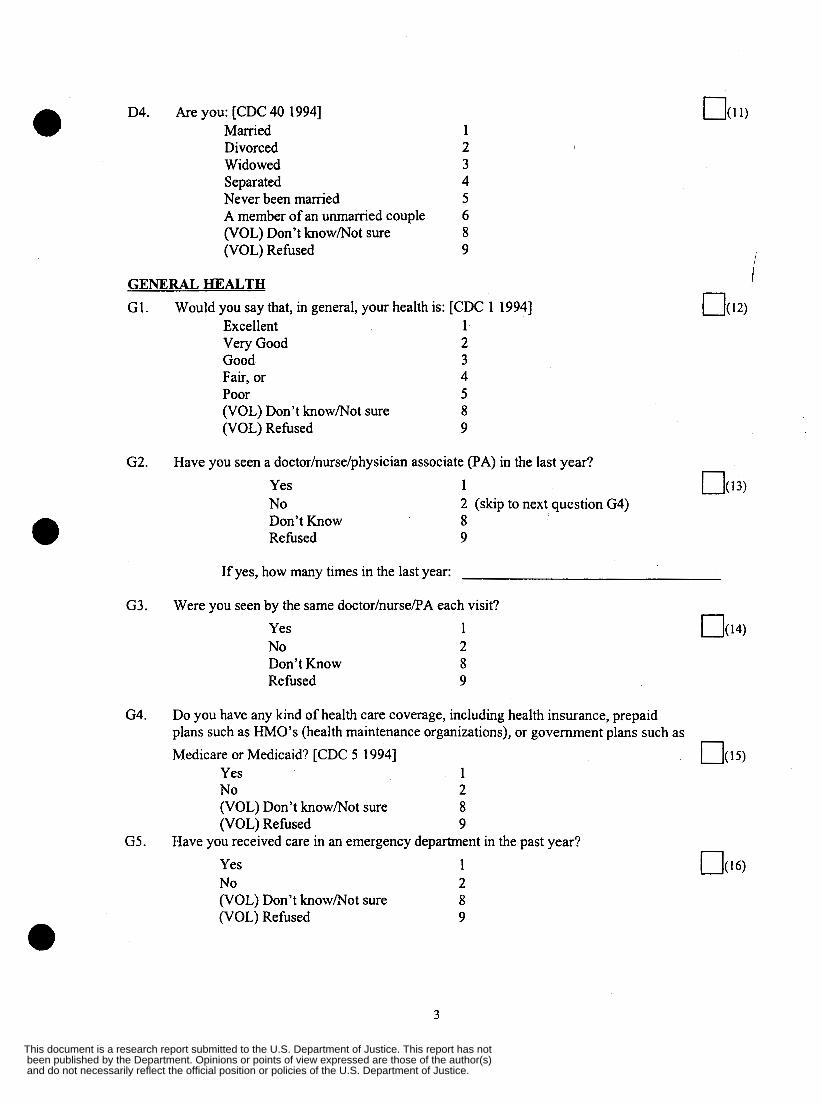
D4. Are you: [CDC 40 19941 Married Divorced Widowed Separated Never been married A member of an unmarried couple (VOL) Don’t knowmot sure (VOL) Refused
GENERAL HEALTH G1.
G2.
G3.
G4.
G5.
Would you say that, in general, your health is: [CDC 1 19941 Excellent 1 Very Good 2 Good 3 Fair, or 4 Poor 5 (VOL) Don’t know/Not sure 8 (VOL) Refused 9
Have you seen a doctor/nurse/physician associate (PA) in the last year? Yes 1 No Don’t Know 8 Refused 9
2 (skip to next question G4)
/
If yes, how many times in the last year:
Were you seen by the same doctor/nurse/PA each visit? Yes 1 No 2 Don’t Know 8 Refused 9
Do you have any kind of health care coverage, including health insurance, prepaid plans such as HMO’s (health maintenance organizations), or government plans such as Medicare or Medicaid? [CDC 5 19941 O( 15)
Yes 1 No 2 (VOL) Don’t knowmot sure 8 (VOL) Refused 9
Have you received care in an emergency department in the past year? Yes 1 No 2 (VOL) Don’t know/Not sure 8 P O L ) Refused 9
3
and do not necessarily reflect the official position or policies of the U.S. Department of Justice. been published by the Department. Opinions or points of view expressed are those of the author(s) This document is a research report submitted to the U.S. Department of Justice. This report has not
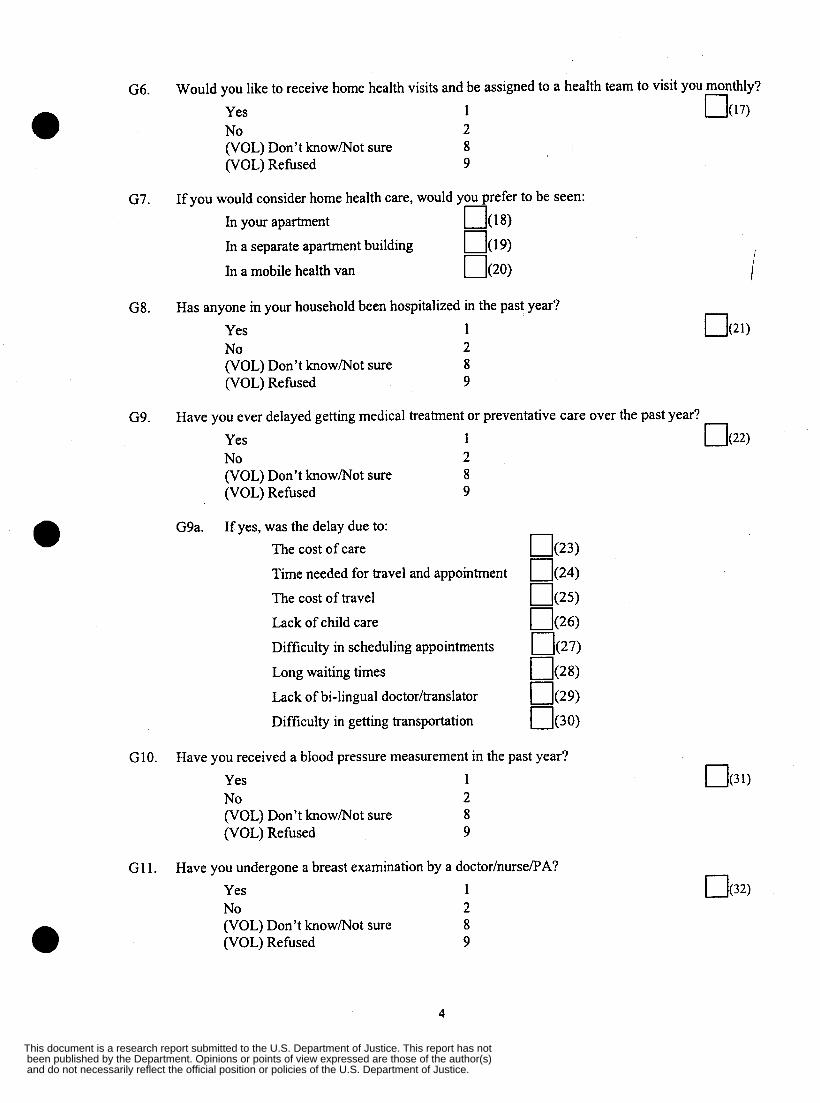
G6.
G7.
G8.
G9.
G10.
G11.
Would you like to receive home health visits and be assigned to a health team to visit you monthly? Yes 1 OU7) No 2 (VOL) Don’t knowmot sure 8 I
(VOL) Refhed 9
If you would consider home health care, would you prefer to be seen:
In your apartment O(W 0 0 9 ) om In a separate apartment building
In a mobile health van
Has anyone in your household been hospitalized in the past year? Yes 1 No 2 (VOL) Don’t know/Not sure 8 (VOL) Refused 9
Have you ever delayed getting medical treatment or preventative care over the past year? Yes 1 ow No 2 (VOL) Don’t know/Not sure 8 (VOL) Refused 9
G9a. If yes, was the delay due to: The cost of care
Time needed for travel and appointment
The cost of travel
Lack of child care
Difficulty in scheduling appointments
Long waiting times
Lack of bi-lingual doctor/translator
Difficulty in getting transportation
Have you received a blood pressure measurement in the past year? Yes 1 No 2 (VOL) Don’t know/Not sure 8 (VOL) Refused 9
Have you undergone a breast examination by a doctorhursePA? Yes 1 No 2 (VOL) Don’t knowblot sure 8 (VOL) Refused 9
4
and do not necessarily reflect the official position or policies of the U.S. Department of Justice. been published by the Department. Opinions or points of view expressed are those of the author(s) This document is a research report submitted to the U.S. Department of Justice. This report has not
G12. Have you undergone a breast examination by a doctor/nurse/PA? Yes 1 No 2 (VOL) Don’t knowMot sure 8 (VOL) Refused 9
G 12a. Do you know how to do a self-breast exam? Yes 1 No 2 (VOL) Don’t knowMot sure 8 (VOL) Refused 9
G13. Have you seen a dentist in the past year? Yes 1 No 2 (VOL) Don’t knowMot sure 8 (VOL) Refused 9
G14. Would you be interested in a smoking cessation program? Yes 1 No 2 (VOL) Don’t knowMot sure 8 (VOL) Refused 9
G15. Do you feel that you have a strong personal resource network? (i.e. if you were ever in need, that you can count on family, friends, church)
Yes 1
Don’t Know 8 Refused 9
No 2 O ( 3 7 )
c1.
c2.
CHILDREN How many children live in your household who are ...[ CDC 41 19941 O ( 3 8 )
Cla) Less than 5 years old (number) 0 (39) (number) 0
C 1 c) 13 through 17 years old (number) 0 C 1 b) 5 through 12 years old (40)
(41) None (VOL) Don’t have any children 7
(Please refer to next section) (VOL) Don’t know/Not sure 8 (VOL) Refused 9
Have your school-aged children ever had any problems with truancy? Yes 1 No 2 Don’t Know 8 Refused 9
5
and do not necessarily reflect the official position or policies of the U.S. Department of Justice. been published by the Department. Opinions or points of view expressed are those of the author(s) This document is a research report submitted to the U.S. Department of Justice. This report has not
c3 .
c4 .
Do you currently have any children in the custody of DCF? Yes 1 No 2
(VOL) Refused 9 8 (VOL) Don’t knowMot sure
C3a. If yes, how many children are in custody?
I f there are children in the house, are your children up to date on hisher vaccines such as measles, polio, tetanus/DPT, hepatitis B?
Yes 1 No 2
(VOL) Refused 9 (VOL) Don’t knowMot sure 8
D 4 3 )
EMPLOYMENT *El. Are you currently: [CDC 43 19941
Employed for wages Self-employed Out of work for more than one year Out of work for less than one year Homemaker (VOL) Student Retired Unable to work (VOL) Don’t knowNot sure Refused
1 (skip to Question #E2) 2 (skip to Question #E2) 3 (skip to Question #E3) 4 (skip to Question #E3) 5 (skip to Question #E3) 6 (skip to Question #E3) 7 (skip to Question #E3) 8 (skip to Question #E3) 9 (skip to Question #E3) 10 (skip to Question #E3)
*E2. Are you currently employed full or part time? [CDC 43 19941 O(49) Full time 1 Part time 2
*E3. Did you receive your high school diploma or GED? Yes 1 No 2 Don’t KnowMot sure 8 Refused 9
E4. Are you receiving the following types of federal assistance (check all that apply and CODE ]=Yes, 2=No, 8=DK, 9=refused):
Family Welfare 0 ( 5 1 )
Food stamps ow SSI/Disability O(53)
WIC O(54)
Other O(55) please specify:
6
and do not necessarily reflect the official position or policies of the U.S. Department of Justice. been published by the Department. Opinions or points of view expressed are those of the author(s) This document is a research report submitted to the U.S. Department of Justice. This report has not
If on Family Welfare for how many months have you been on assistance? (leave blank if not relevant)?
E5. Are you currently involved with any social service agencies in the New Haven county area (e.g. social services, department of children and families)?
Yes 1 U ( 5 8 )
i No 2 Don’t Know/Not sure 8 Refused 9
E5a. If yes, can you please list those agencies:
NEIGHBORHOOD N1. How long have you lived in public housing? O(59)
Less than 6 months 1 6 months to less than 1 year 2 1-2 years 3 3-5 years 4 5 - 10 years 5
(VOL) Rehsed 9
Over 10 years 6 (VOL) Don’t know/Not sure 8
N2. Have you ever been threatened with eviction from public housing (e.g. asked to leave)?
Yes 1 UP) No 2 Don’t Know 8 Refixed 9
N3. D Y L think your neighborhood is a safe place to live? Yes 1 No 2 (VOL) Don’t Know/Not sure 8 (VOL) Refused 9
N4. Have you noticed a drop in crime in the neighborhood in the past year? Yes 1 No 2 (VOL) Don’t Know/Not sure 8 (VOL) Refused 9
7
and do not necessarily reflect the official position or policies of the U.S. Department of Justice. been published by the Department. Opinions or points of view expressed are those of the author(s) This document is a research report submitted to the U.S. Department of Justice. This report has not
N5. would say it is true or not true in your neighborhood.
Now I am going to read several statements about neighborhoods. As I read each one, tell me whether you
True 1 Not true 2 Don’t know/Not sure 8 NA 9
a. Many people in this neighborhood are afraid to go out at night O ( 6 3 ) b. You are taking a big chance if you walk in this neighborhood
n alone after dark
c. I am afraid to walk alone in this neighborhood
N6. In the past year, have you noticed a higher police presence in the community?
Yes 1 O ( 6 6 ) No 2 (VOL) Don’t Know/Not sure 8 (VOL) Refused 9
N7. In the past year, would you say that the amount of crime in your neighborhood has.. .[READ LIST]
[EAGLETON 26 19931 O ( 6 7 ) Gone up 1 Gone down 2 Remained the same 3 (VOL) Don’t know/Not sure 8 (VOL) Refused 9
N8. Have you or anyone you’ve known in this community ever been a victim of domestic violence?
Yes 1 O ( 6 8 ) No 2 Don’t Know 8 Refused 9
COMMUNITY ISSUES 11. If necessary, do you think that you, a friend, or a family member would be able to get (check all that apply
and CODE I =Yes, 2=No, 8=DK, 9=refused): Drug/alcohol treatment services 0 (69)
Family support services 0 Child-care services 0
0 Church services 0 Health clinichospital services 0
(70)
(71)
(72)
(73)
(74)
Job training & placement services
8
12. Which of the following would you say are major problems within your community (check all that appb and CODE I =Yes, 2=No, 8=DK, 9=refused)
(75)
(76)
(77)
(78)
(79)
(80)
Drug abuse 0 Alcohol abuse 0 Drug selling 0 Violence 0 Unsupervised children 0 Safety 0
and do not necessarily reflect the official position or policies of the U.S. Department of Justice. been published by the Department. Opinions or points of view expressed are those of the author(s) This document is a research report submitted to the U.S. Department of Justice. This report has not
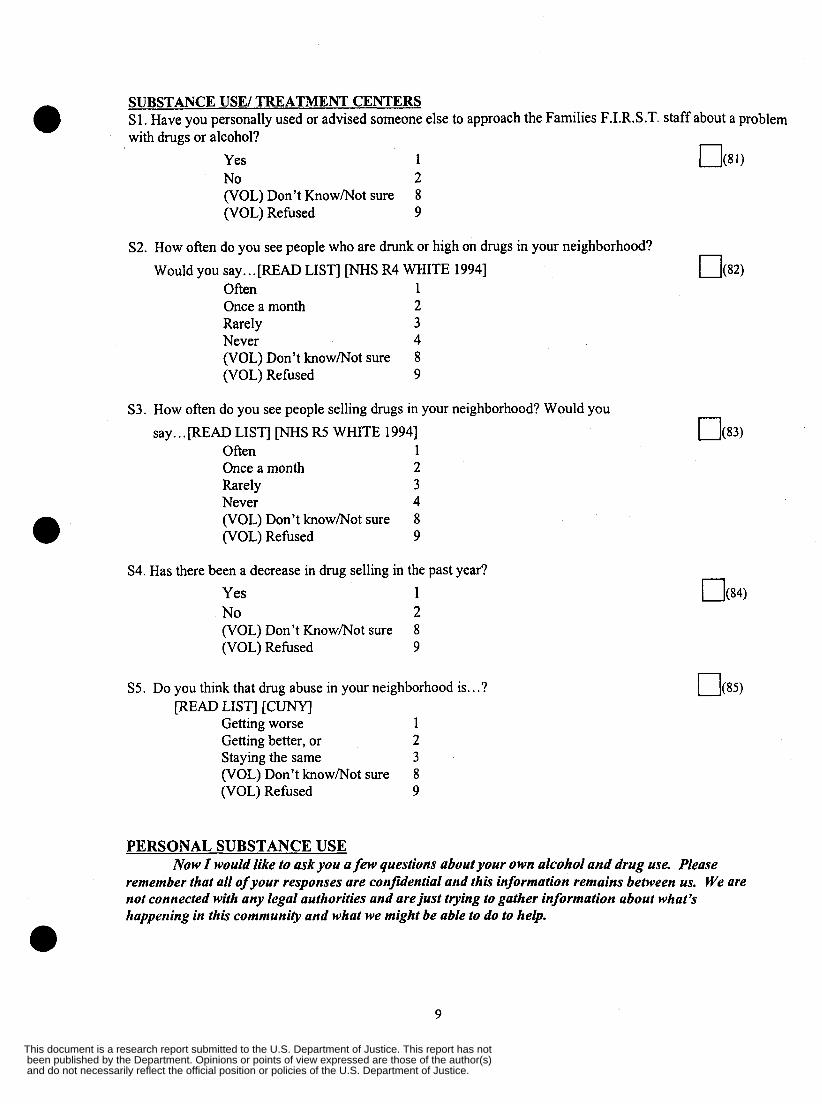
SUBSTANCE USE/ TREATMENT CENTERS S1. Have you personally used or advised someone else to approach the Families F.I.R.S.T. staff about a problem with drugs or alcohol?
Yes 1 OW No 2 (VOL) Don't Know/Not sure 8 (VOL) Refused ' 9
S2. How often do you see people who are drunk or high on drugs in your neighborhood? Would you say.. .[READ LIST] ["S R4 WHITE 19941
Often 1 Once a month 2 Rarely 3 Never 4 (VOL) Don't know/Not sure 8 (VOL) Refused 9
S3. How often do you see people selling drugs in your neighborhood? Would you say.. .NAD LIST] ["S R5 WHITE 19941
Often 1 Once a month 2 Rarely 3 Never 4 (VOL) Don't know/Not sure 8 (VOL) Refused 9
S4. Has there been a decrease in drug selling in the past year? Yes 1 No 2 (VOL) Don't Know/Not sure 8 (VOL) Refused 9
S5. Do you think that drug abuse in your neighborhood is.. .? [READ LIST] [CUNY]
Getting worse 1 Getting better, or 2 Staying the same 3
(VOL) Refused 9 (VOL) Don't know/Not sure 8
PERSONAL SUBSTANCE USE
remember that all ofyour responses are confidential and this information remains between us. We are not connected with any legal authorities and arejust trying to gather information about what's happening in this community and what we might be able to do to help.
Now I would like to ask you a few questions about your own alcohol and drug use. Please
9
and do not necessarily reflect the official position or policies of the U.S. Department of Justice. been published by the Department. Opinions or points of view expressed are those of the author(s) This document is a research report submitted to the U.S. Department of Justice. This report has not
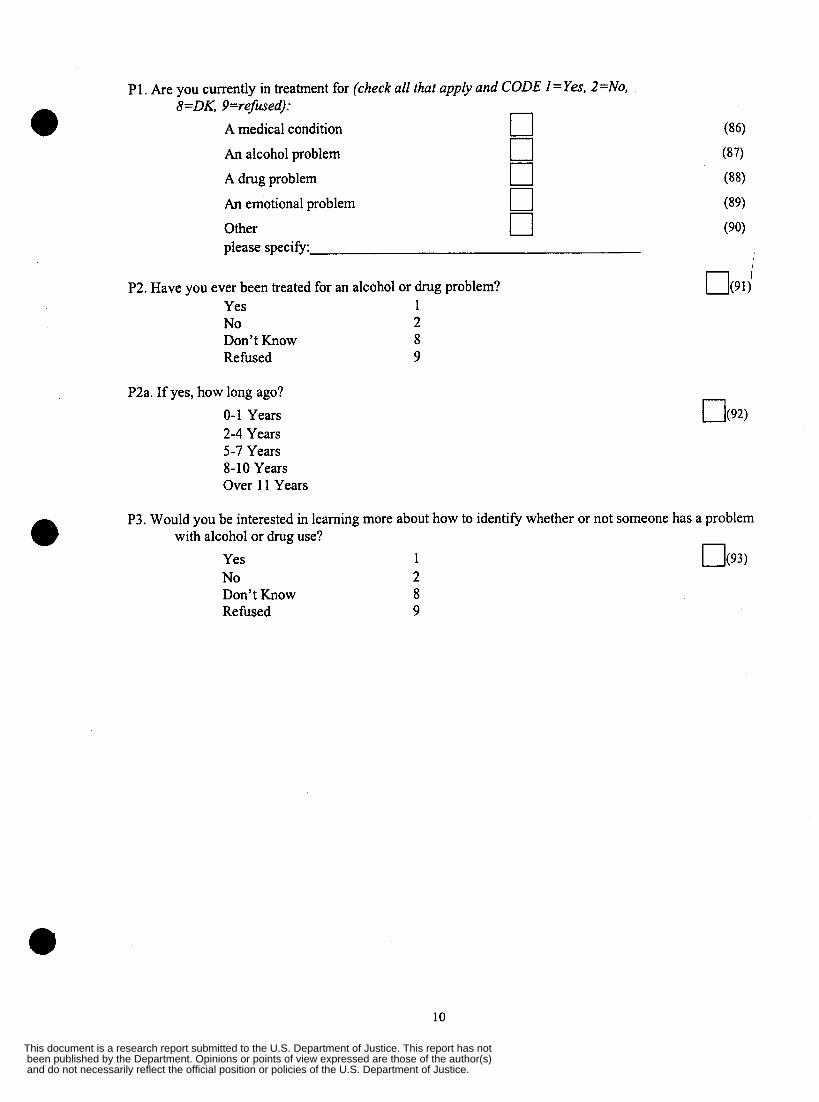
P 1. Are you currently in treatment for (check all that apply and CODE I = Yes, 2=No, 8=DK, 9=refused):
A medical condition 0 An alcohol problem 0 A drug problem 0 An emotional problem 0 Other 0 please specify:
P2. Have you ever been treated for an alcohol or drug problem? Yes 1 No 2 Don’t Know 8 Rehsed 9
P2a. If yes, how long ago? 0-1 Years 2-4 Years 5-7 Years 8-10 Years Over 11 Years
P3. Would you be interested in learning more about how to identify whether or not someone has a problem with alcohol or drug use?
Yes 1 O(93) No 2 Don’t Know 8 Rehsed 9
10
and do not necessarily reflect the official position or policies of the U.S. Department of Justice. been published by the Department. Opinions or points of view expressed are those of the author(s) This document is a research report submitted to the U.S. Department of Justice. This report has not
FAMILIES FIRST
a n
FINAL SURVEY September 2000
1
and do not necessarily reflect the official position or policies of the U.S. Department of Justice. been published by the Department. Opinions or points of view expressed are those of the author(s) This document is a research report submitted to the U.S. Department of Justice. This report has not
FAMILIES FIRST
NEED ASSESSMENT OUESTIONNAIRE: FINAL SURVEY
Introduction
about their neighborhoods and how your neighborhood might be improved. Now we are doing a follow-up survey to see if there have been any changes that you have noticed or to see if the general views of the community have changed or remained the same. As before, anything you tell us is completely confidential and will be used for purposes of generating programming ideas for your community.
Hello, my name is . We first conducted a survey last year to find out what people in your community think
(IF NECESSARY: THERE ARE NO RIGHT OR WRONG ANSWERS. YOUR OPINIONS ARE AS IMPORTANT AS ANYONE ELSE’S. YOUR ANSWERS ARE VERY IMPORTANT BECAUSE WE ARE INTERVIEWING ONLY 250 PEOPLE THAT LIVE IN YOUR NEIGHBORHOOD. WE ARE NOT CONNECTED WITH THE HOUSING AUTHORITY OR ANY GOVERNMENT AGENCY AND THE INFORMATION YOU GIVE IS STRICTLY CONFIDENTIAL.
CODE HOUSING UNIT NUMBER: (Ask which unit number they live in during lease up process or code unit number ifdoor to door s u w q )
- Q1. Are you the person that holds the lease to this housing unit? (CODE 1 i f Yes, otherwise choosefrom list below)
Spouselsignificant other 2 Adult child (>18 yrs) of the leasee 3 Grandparent of the leasee 4 Aunt/Uncle of the leasee 5 Other family member of the leasee 6 Friend of the leasee 7
DEMOGRAPHICS D1.
D2.
D3.
Sex of respondent: Male 1
Female 0
What is your age? [CDC 37 19941 Code age in years (VOL) Refused 99
What is your race? Would you say: [CDC 38 19941 White 1 Black or African American 2 Asian, Pacific Islander 3 American Indian, Alaska Native 4 (VOL) Hispanic 5
[IF HISPANIC, CODE BUT DO NOT READ “HISPANIC” CATEGORY] Other (specify) 6 (VOL) Don’t knowMot sure 8 (VOL) Refused 9
2
and do not necessarily reflect the official position or policies of the U.S. Department of Justice. been published by the Department. Opinions or points of view expressed are those of the author(s) This document is a research report submitted to the U.S. Department of Justice. This report has not
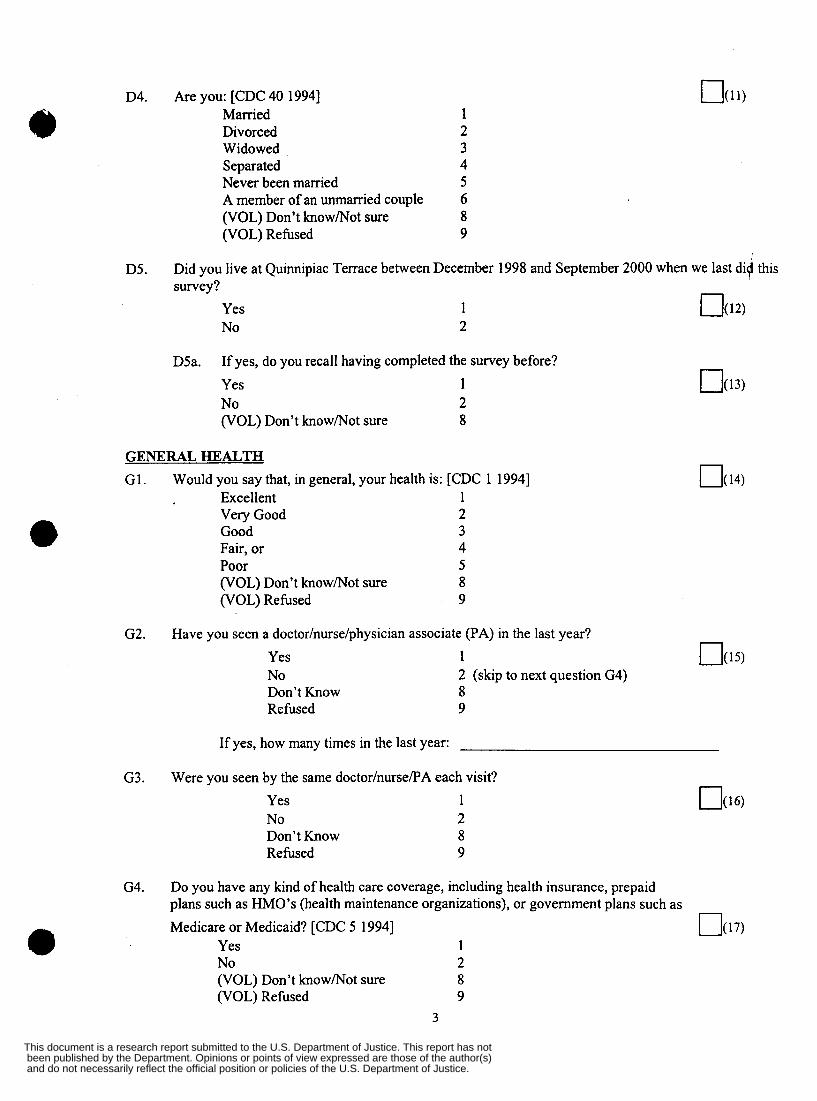
D4.
D5.
Are you: [CDC 40 19941 Married 1 Divorced 2 Widowed 3 Separated 4 Never been mamed 5 A member of an unmarried couple 6 (VOL) Don’t know/Not sure 8 (VOL) Refused 9
Did you live at Quinnipiac Terrace between December 1998 and September 2000 when we last di i this survey?
Yes 1 ow No 2
D5a. If yes, do you recall having completed the survey before? Yes 1 No 2 (VOL) Don’t know/Not sure 8
GENERAL HEALTH G1.
G2.
G3.
G4.
Would you say that, in general, your health is: [CDC 1 19941 Excellent 1 Very Good 2 Good 3 Fair, or 4 Poor 5 (VOL) Don’t know/Not sure 8 (VOL) Refused 9
Have you seen a doctor/nurse/physician associate (PA) in the last year? Yes No Don’t Know Refused
1 2 (skip to next question G4) 8 9
If yes, how many times in the last year:
Were you seen by the same doctor/nurse/PA each visit? Yes 1 No 2 Don’t Know 8 Rehsed 9
Do you have any kind of health care coverage, including health insurance, prepaid plans such as HMO’s (health maintenance organizations), or government plans such as Medicare or Medicaid? [CDC 5 19941 nu71
Yes 1 No 2 (VOL) Don’t knowmot sure 8 (VOL) Refused 9
3
and do not necessarily reflect the official position or policies of the U.S. Department of Justice. been published by the Department. Opinions or points of view expressed are those of the author(s) This document is a research report submitted to the U.S. Department of Justice. This report has not
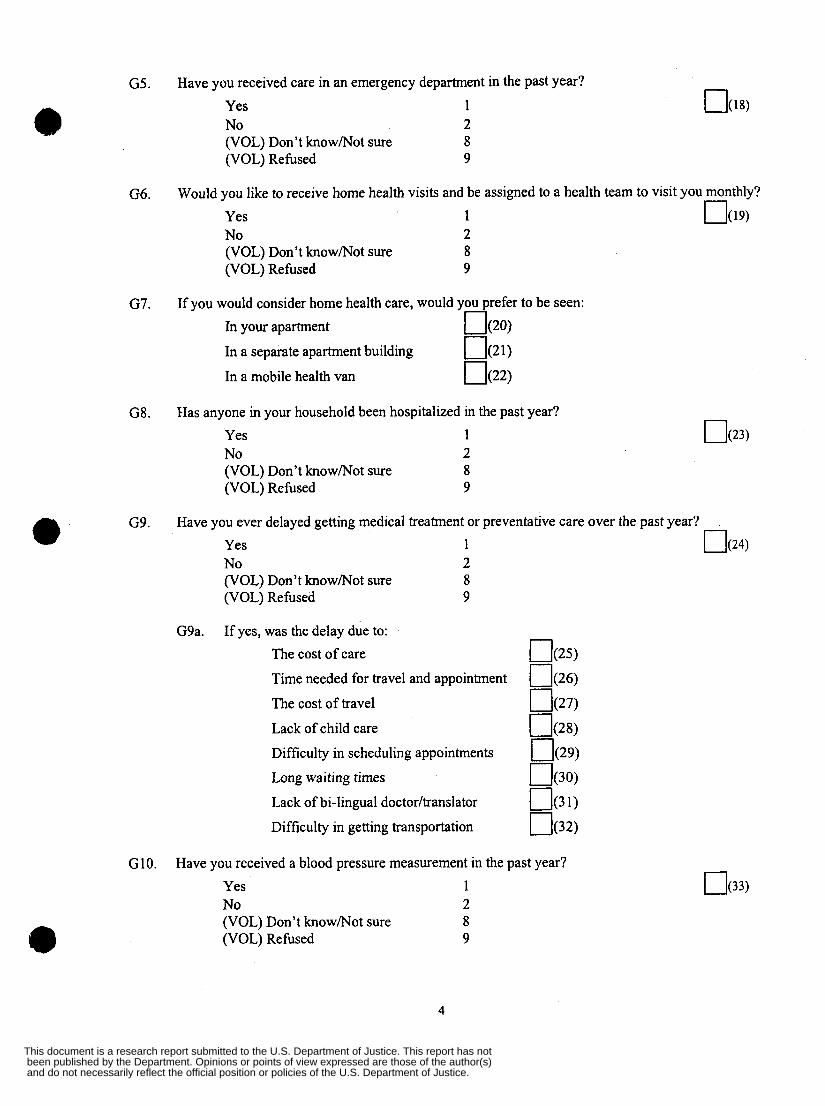
G5.
G6.
G7.
G8.
G9.
G10.
Have you received care in an emergency department in the past year? Yes 1 No 2 (VOL) Don’t knowMot sure 8 (VOL) Refused 9
Would you like to receive home health visits and be assigned to a health team to visit you monthly? Yes 1 OU9) No 2 (VOL) Don’t knowMot sure 8 (VOL) Refused 9
If you would consider home health care, would you prefer to be seen:
In your apartment I7P) ow ow In a separate apartment building
In a mobile health van
Has anyone in your household been hospitalized in the past year? Yes 1 No 2 (VOL) Don’t knowMot sure 8 (VOL) Refused 9
Have you ever delayed getting medical treatment or preventative care over the past year?
Yes 1 I 3 2 4 1 No 2 (VOL) Don’t know/Not sure 8 (VOL) Refused 9
G9a. If yes, was the delay due to: The cost of care
Time needed for travel and appointment
The cost of travel
Lack of child care
Difficulty in scheduling appointments
Long waiting times
Lack of bi-lingual doctorhranslator
Difficulty in getting transportation
Have you received a blood pressure measurement in the past year? Yes 1 No 2 (VOL) Don’t knowhiot sure 8 (VOL) Refused 9
4
and do not necessarily reflect the official position or policies of the U.S. Department of Justice. been published by the Department. Opinions or points of view expressed are those of the author(s) This document is a research report submitted to the U.S. Department of Justice. This report has not
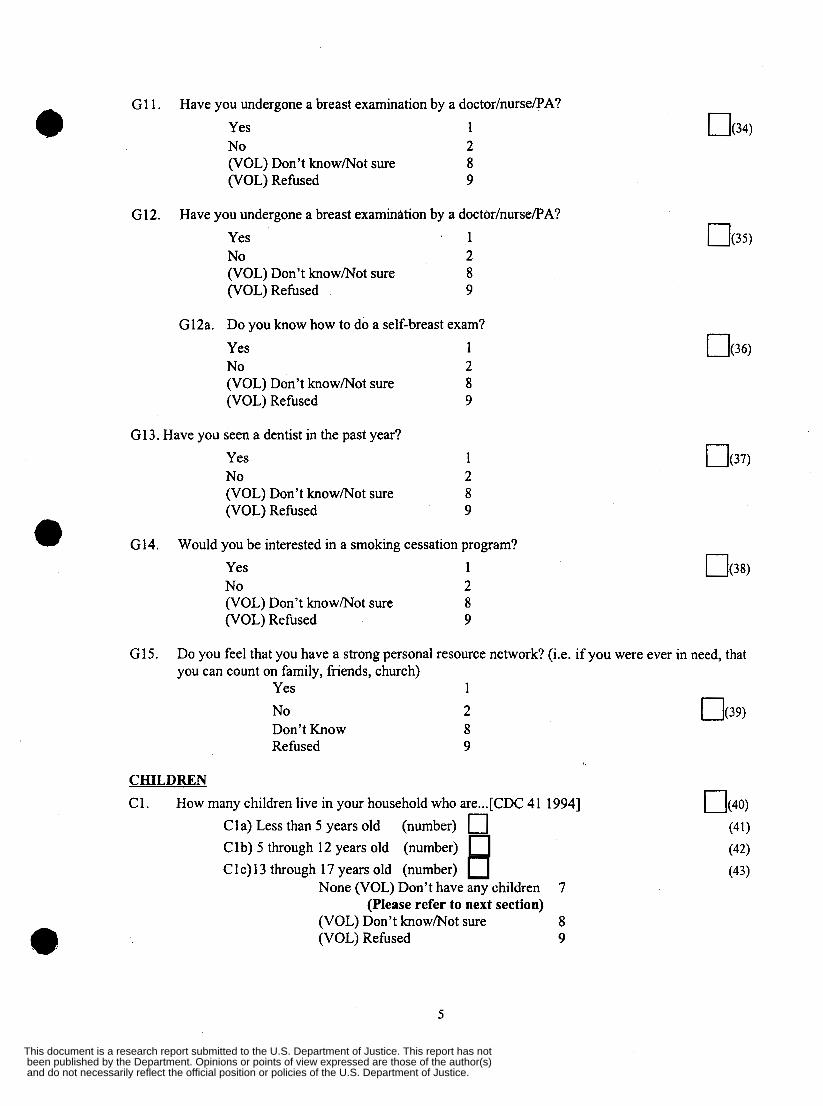
G1 1 . Have you undergone a breast examination by a doctorInursePA? Yes 1 No 2
8 (VOL) Don’t know/Not sure (VOL) Refused 9
e G12. Have you undergone a breast examination by a doctorInurseRA?
Yes ‘ 1 No 2 (VOL) Don’t know/Not sure 8 (VOL) Refused 9
G12a. Do you know how to do a self-breast exam? Yes 1 No 2 (VOL) Don’t know/Not sure 8 (VOL) Rehsed 9
G13. Have you seen a dentist in the past year? Yes 1 No 2 (VOL) Don’t know/Not sure 8 (VOL) Refused 9
G14. Would you be interested in a smoking cessation program? Yes 1 No 2 (VOL) Don’t know/Not sure 8 (VOL) Refused 9
G15. Do you feel that you have a strong personal resource network? (i.e. if you were ever in need, that you can count on family, friends, church)
Yes 1
Don’t Know 8 Refused 9
No 2 0 0 9 )
CHILDREN C1. How many children live in your household who are ...[ CDC 41 19941 O ( 4 0 )
Cla) Less than 5 years old (number) 0 (41) Clb) 5 through 12 years old (number) C 1 c) 13 through 17 years old (number)
(42)
(43) None (VOL) Don’t have any children
(Please refer to next section) 7
(VOL) Don’t know/Not sure 8 (VOL) Refused 9
5
and do not necessarily reflect the official position or policies of the U.S. Department of Justice. been published by the Department. Opinions or points of view expressed are those of the author(s) This document is a research report submitted to the U.S. Department of Justice. This report has not
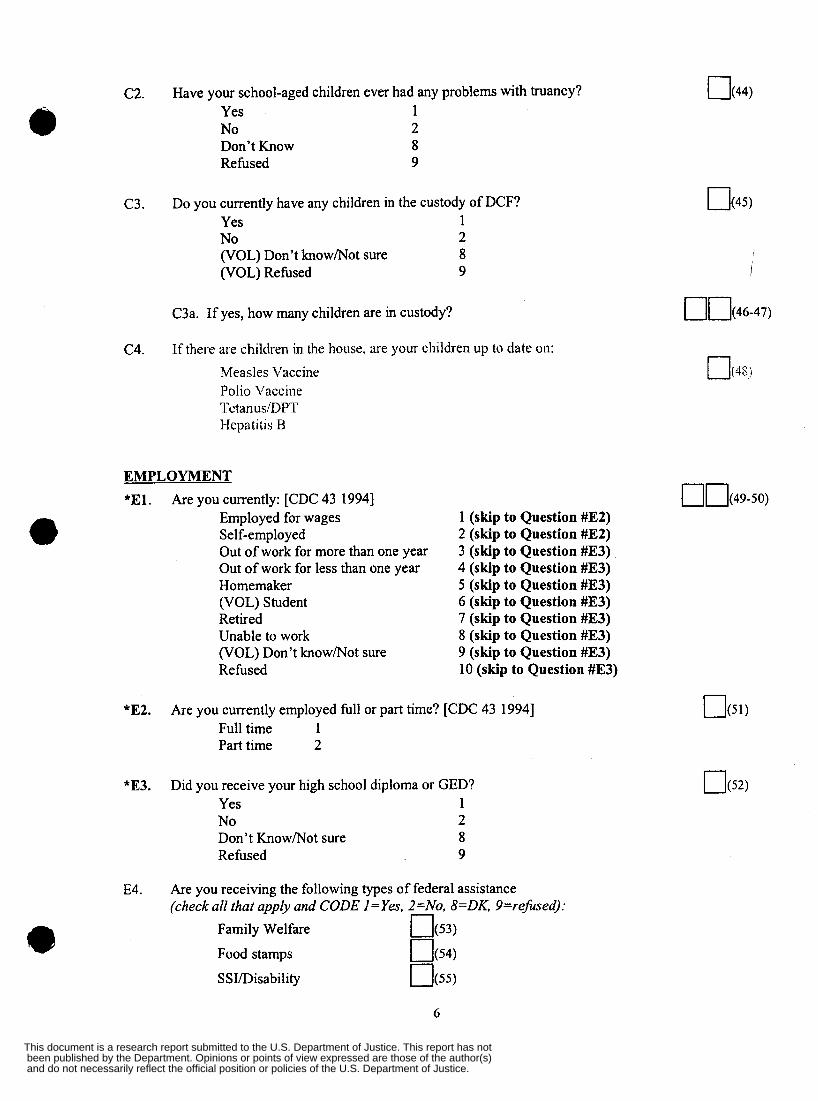
c 2 .
c 3 .
c4 .
Have your school-aged children ever had any problems with truancy? Yes 1 No 2 Don't Know 8 Refused 9
Do you currently have any children in the custody of DCF? Yes 1 No 2 (VOL) Don't know/Not sure 8 (VOL) Refused 9
C3a. If yes, how many children are in custody?
If there are chilclren in the house, we your children up to date on:
Measles Vaccine Polio I'accine 'Tct anus IDPT lfepatitis B
EMPLOYMENT *El. Are you currently: [CDC 43 19941
Employed for wages Self-employed Out of work for more than one year Out of work for less than one year Homemaker (VOL) Student Retired Unable to work (VOL) Don't knowmot sure Refused
1 (skip to Question #E2) 2 (skip to Question #E2) 3 (skip to Question #E3) 4 (skip to Question #E3) 5 (skip to Question #E3) 6 (skip to Question #E3) 7 (skip to Question #E3) 8 (skip to Question #E3) 9 (skip to Question #E3) 10 (skip to Question #E3)
*E2. Are you currently employed full or part time? [CDC 43 19941 Full time 1 Part time 2
"E3. Did you receive your high school diploma or GED? Yes 1 No 2 Don't Know/Not sure 8 Refused 9
E4. Are you receiving the following types of federal assistance (check all that appb and CODE 1 =Yes, 2=No, 8=DK, 9=refirsed):
Family Welfare 0 3 )
Food stamps E 5 4 1
S SI/Disability O(55)
6
and do not necessarily reflect the official position or policies of the U.S. Department of Justice. been published by the Department. Opinions or points of view expressed are those of the author(s) This document is a research report submitted to the U.S. Department of Justice. This report has not
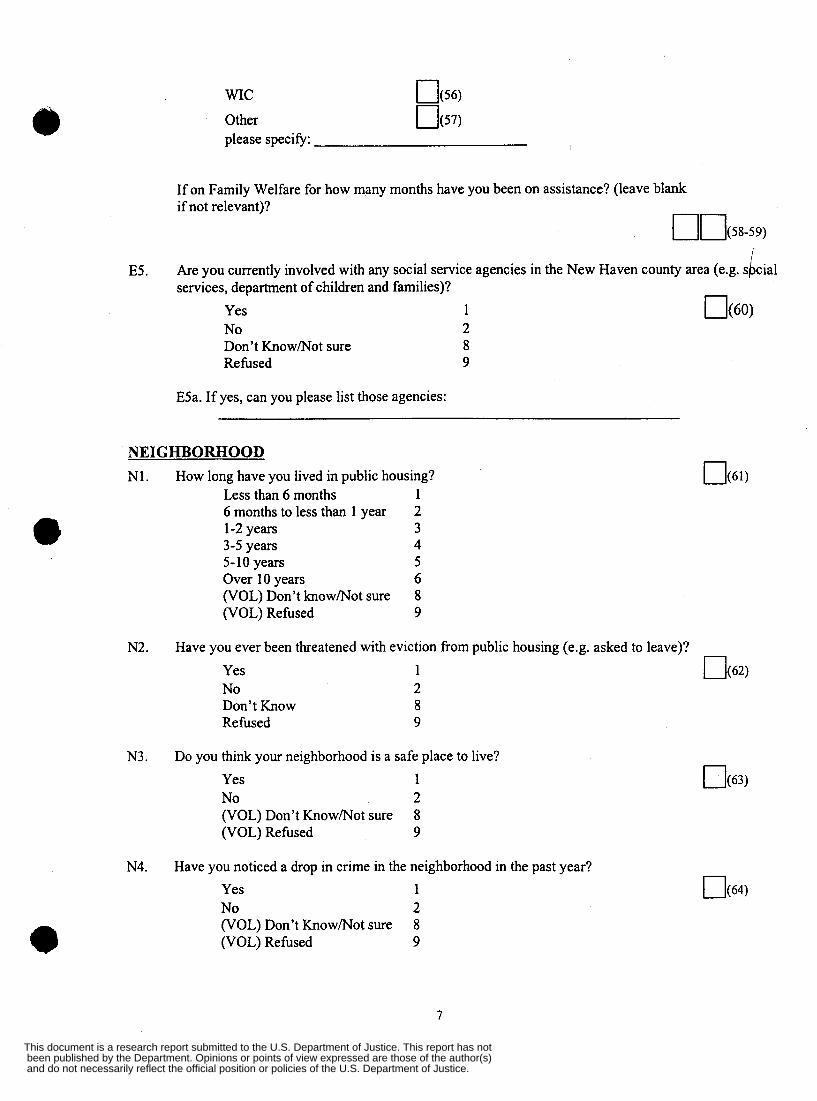
WIC O(56)
Other nu71 please specify:
If on Family Welfare for how many months have you been on assistance? (leave blank if not relevant)?
E5. Are you currently involved with any social service agencies in the New Haven county area (e.g. s i: cia1 services, department of children and families)?
Yes 1 ow No 2 Don’t Know/Not sure 8 Refused 9
E5a. If yes, can you please list those agencies:
N1.
N2.
N3.
N4.
NEIGHBORHOOD How long have you lived in public housing?
Less than 6 months 6 months to less than 1 year 1-2 years 3-5 years 5- 10 years Over 10 years (VOL) Don’t knowmot sure (VOL) Refused
Have you ever been threatened with eviction from public housing (e.g. asked to leave)?
Yes 1 c 1 ( 6 2 ) No 2 Don’t Know 8 Refused 9
Do you think your neighborhood is a safe place to live?
Yes 1 O(63) No 2 (VOL) Don’t Know/Not sure 8 (VOL) Refused 9
Have you noticed a drop in crime in the neighborhood in the past year? Yes 1 No 2 (VOL) Don’t KnowNot sure 8 (VOL) Refused 9
7
and do not necessarily reflect the official position or policies of the U.S. Department of Justice. been published by the Department. Opinions or points of view expressed are those of the author(s) This document is a research report submitted to the U.S. Department of Justice. This report has not
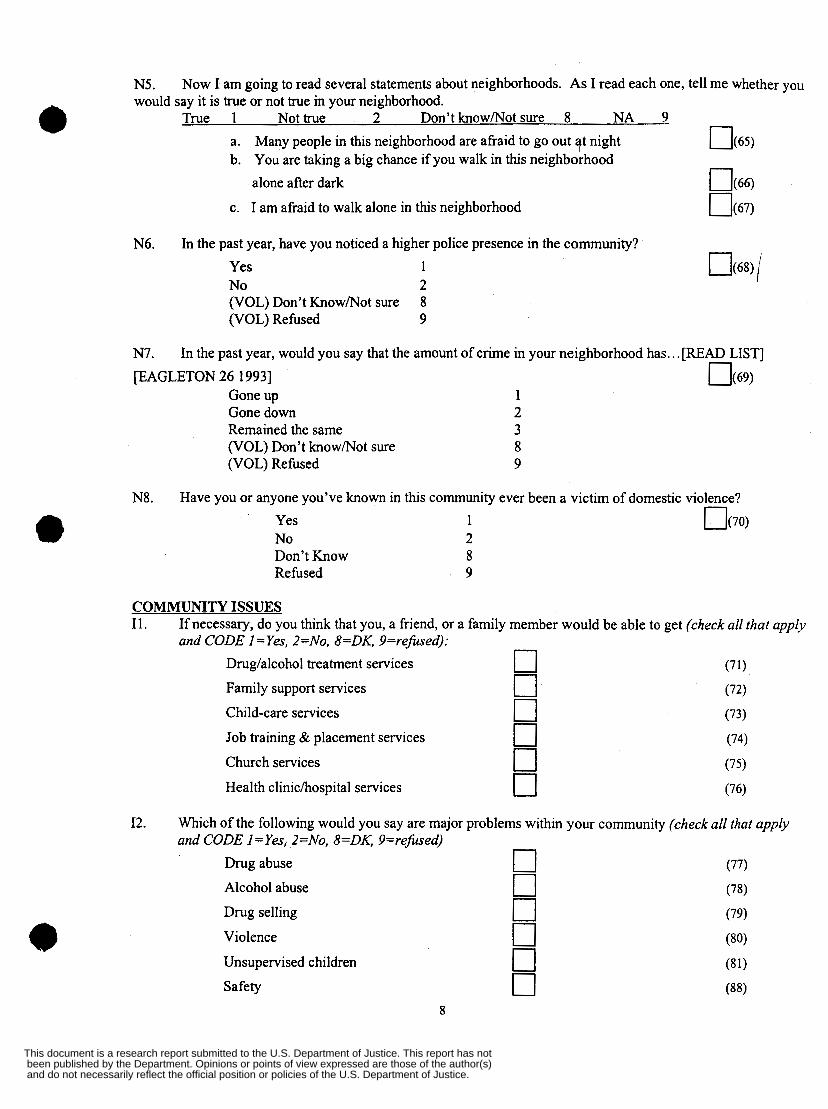
N5. would say it is true or not true in your neighborhood.
Now I am going to read several statements about neighborhoods. As I read each one, tell me whether you
True 1 Not true 2 Don’t know/Not sure 8 NA 9
a. Many people in this neighborhood are afraid to go out at night OW) alone after dark O ( 6 6 )
0 @ 7 )
b. You are taking a big chance if you walk in this neighborhood
c. I am afraid to walk alone in this neighborhood
N6. In the past year, have you noticed a higher police presence in the community? Yes 1 No 2 (VOL) Don’t KnowMot sure 8 (VOL) Refused 9
N7. In the past year, would you say that the amount of crime in your neighborhood has.. .[READ LIST] [EAGLETON 26 19931 O ( 6 9 )
Gone up 1 Gone down 2 Remained the same 3 (VOL) Don’t know/Not sure 8 (VOL) Refused 9
N8. Have you or anyone you’ve known in this community ever been a victim of domestic violence? Yes 1 O ( 7 0 ) No 2 Don’t Know 8 Refused 9
COMMUNITY ISSUES 11. If necessary, do you think that you, a friend, or a family member would be able to get (check all that apply
and CODE I =Yes, 2=No, 8=DK, 9=refused):
Drug/alcohol treatment services 0 Family support services 0 Child-care services 0
0 Church services 0 Health clinichospital services 0 Job training & placement services
12. Which of the following would you say are major problems within your community (check all that appb and CODE I =Yes, 2=No, 8=DK, 9=refused)
(77)
(78)
(79)
(80)
(81)
(88)
Drug abuse 0 Alcohol abuse 0 Drug selling 0 Violence 0 Unsupervised children 0 Safety 0
8
and do not necessarily reflect the official position or policies of the U.S. Department of Justice. been published by the Department. Opinions or points of view expressed are those of the author(s) This document is a research report submitted to the U.S. Department of Justice. This report has not
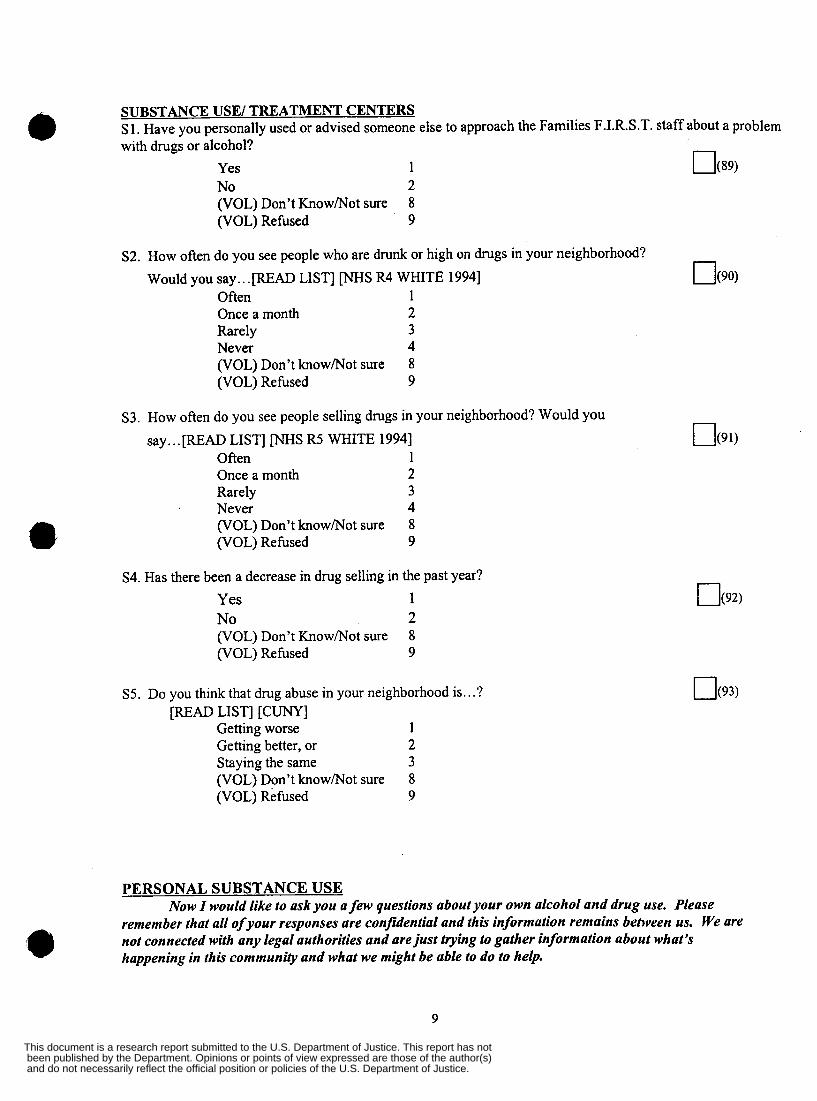
SUBSTANCE USE/ TREATMENT CENTERS S 1. Have you personally used or advised someone else to approach the Families F.I.R.S.T. staff about a problem with drugs or alcohol?
Yes 1 0 @ 9 ) No 2 (VOL) Don't KnowMot sure 8 (VOL) Refused ' 9
S2. How often do you see people who are drunk or high on drugs in your neighborhood? Would you say.. .[READ LIST] ["S R4 WHITE 19941
Often 1 Once a month 2 Rarely 3 Never 4 (VOL) Don't knowMot sure 8 (VOL) Refused 9
O(90)
S3. How often do you see people selling drugs in your neighborhood? Would you say.. .[READ LIST] ["S R5 WHITE 19941
Often 1 Once a month 2 Rarely 3 Never 4 (VOL) Don't knowMot sure 8 (VOL) Refused 9
S4. Has there been a decrease in drug selling in the past year? Yes 1 No 2 (VOL) Don't Know/Not sure 8 (VOL) Refused 9
S5. Do you think that drug abuse in your neighborhood is.. .? [READ LIST] [CUNY]
Getting worse 1 Getting better, or 2 Staying the same 3
(VOL) Refused 9 (VOL) Don't knowMot sure 8
PERSONAL SUBSTANCE USE
remember that all of your responses are confidential and this information remains between us. We are not connected with any legal authorities and arejust tying to gather information about what's happening in this community and what we might be able to do to help.
Now I would like to ask you a few questions about your own alcohol and drug use. Please
9
and do not necessarily reflect the official position or policies of the U.S. Department of Justice. been published by the Department. Opinions or points of view expressed are those of the author(s) This document is a research report submitted to the U.S. Department of Justice. This report has not
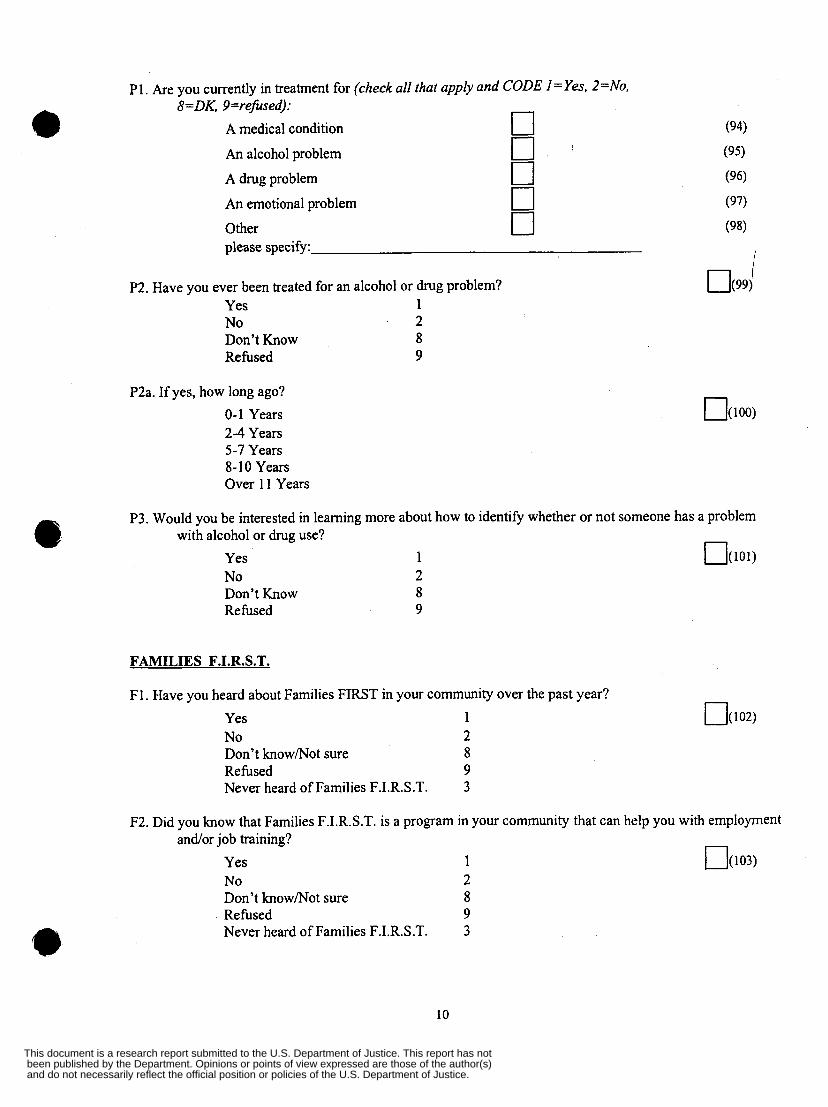
P1. Are you currently in treatment for (check all that apply and CODE ]=Yes, 2=No, 8=DK, 9=refused):
A medical condition 0 An alcohol problem 0 A drug problem 0 An emotional problem 0 Other 0 please specify:
P2. Have you ever been treated for an alcohol or drug problem? Yes 1 No 2 Don’t Know 8 Refused 9
P2a. If yes, how long ago? 0-1 Years 2-4 Years 5-7 Years 8-10 Years Over 11 Years
I
t l ( 9 9 i
P3. Would you be interested in learning more about how to identify whether or not someone has a problem with alcohol or drug use?
Yes 1 O(W e No 2 Don’t Know 8 Refused 9
FAMILIES F.I.R.S.T.
F1. Have you heard about Families FIRST in your community over the past year? Yes 1 No 2 Don’t know/Not sure 8 Refused 9 Never heard of Families F.I.R.S.T. 3
F2. Did you know that Families F.I.R.S.T. is a program in your community that can help you with employment andor job training?
Yes 1 ow31 No 2 Don’t know/Not sure 8 Refused 9 Never heard of Families F.I.R.S.T. 3
10
and do not necessarily reflect the official position or policies of the U.S. Department of Justice. been published by the Department. Opinions or points of view expressed are those of the author(s) This document is a research report submitted to the U.S. Department of Justice. This report has not
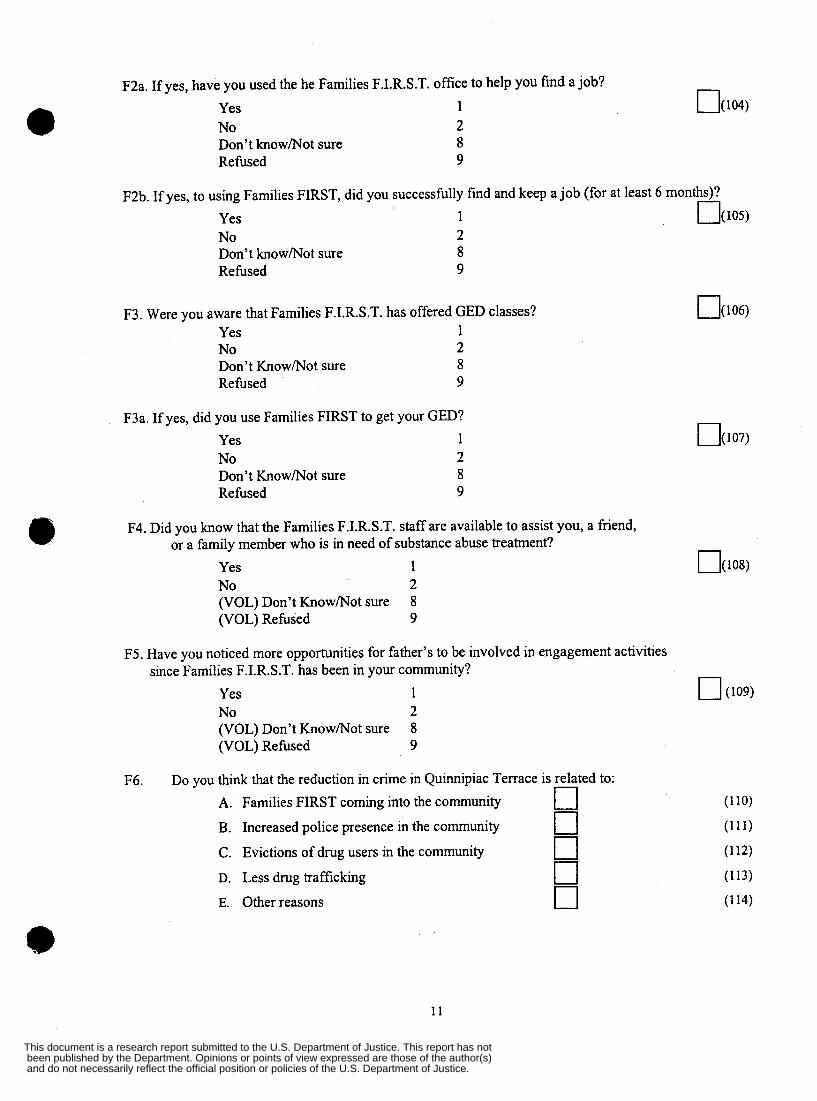
F2a. If yes, have you used the he Families F.I.R.S.T. office to help you find a job? Yes No Don’t knowmot sure Refused
F2b. If yes, to using Families FIRST, did you successfully find and keep a job (for at least 6 months)? Yes 1 O(l05) No 2 Don’t knowmot sure 8 Refused 9
F3. Were you aware that Families F.I.R.S.T. has offered GED classes? Yes 1 No 2 Don’t Know/Not sure 8 Refused 9
F3a. If yes, did you use Families FIRST to get your GED? Yes 1 No 2 Don’t Knowmot sure 8 Refused 9
F4. Did you know that the Families F.I.R.S.T. staff are available to assist you, a friend, or a family member who is in need of substance abuse treatment?
Yes 1 No 2 (VOL) Don’t Knowmot sure 8 (VOL) Refused 9
F5. Have you noticed more opportunities for father’s to be involved in engagement activities since Families F.I.R.S.T. has been in your community?
Yes 1 0 (109) No 2 (VOL) Don’t Know/Not sure 8 (VOL) Refused 9
F6. Do you think that the reduction in crime in Quinnipiac Terrace is related to: A.
B. C.
Families FIRST coming into the community
Increased police presence in the community
Evictions of drug users in the community
cl 0 0
D. Less drug trafficking 0 E. Other reasons 0
11
and do not necessarily reflect the official position or policies of the U.S. Department of Justice. been published by the Department. Opinions or points of view expressed are those of the author(s) This document is a research report submitted to the U.S. Department of Justice. This report has not
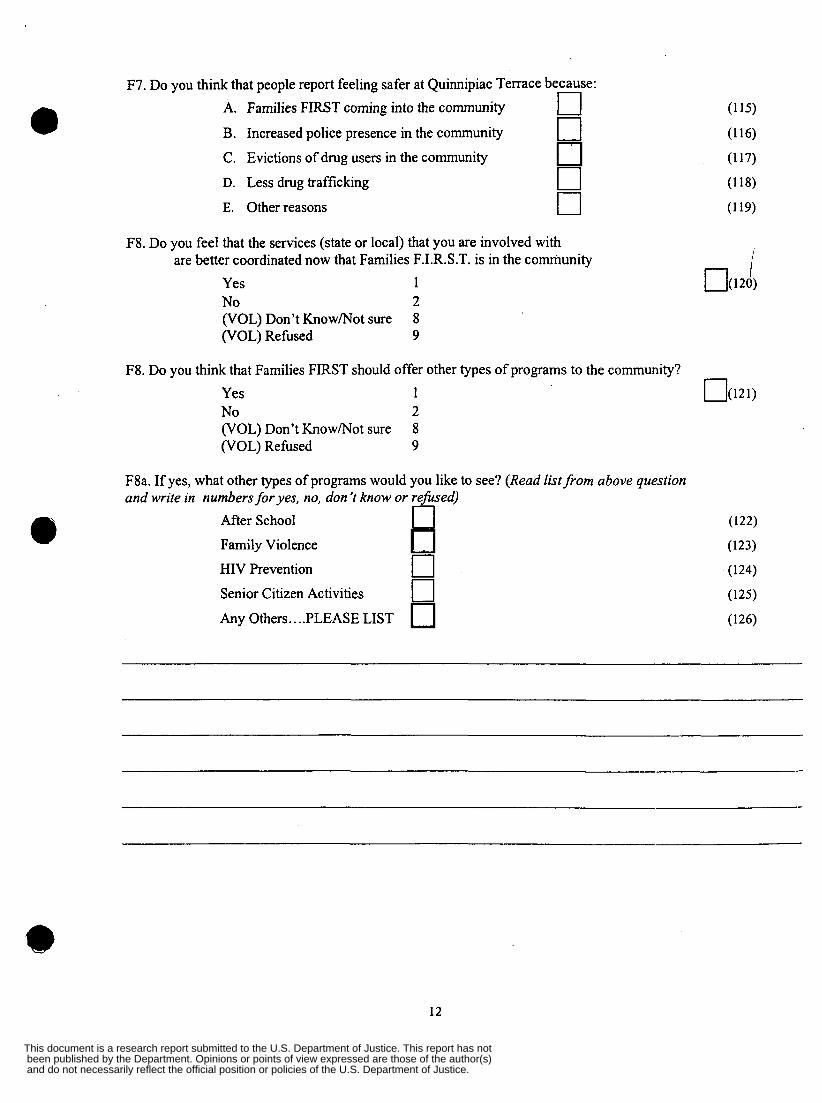
F7. Do you think that people report feeling safer at Quinnipiac Terrace because: A. Families FIRST coming into the community
Increased police presence in the community
Evictions of drug users in the community
cl 0
D. Less drug trafficking 0 E. Other reasons 0
B. C.
F8. Do you feel that the services (state or local) that you are involved with are better coordinated now that Families F.I.R.S.T. is in the community
Yes 1 No 2 (VOL) Don’t KnowMot sure 8 (VOL) Refused 9
F8. Do you think that Families FIRST should offer other types of programs to the community? Yes 1 No 2 (VOL) Don’t Know/Not sure 8 (VOL) Refused 9
F8a. If yes, what other types of programs would you like to see? (Read list from above question and write in numbers for yes, no, don ’t know or refused)
After School 0 Family Violence
HIV Prevention El Senior Citizen Activities 0 Any Others.. ..PLEASE LIST
12
and do not necessarily reflect the official position or policies of the U.S. Department of Justice. been published by the Department. Opinions or points of view expressed are those of the author(s) This document is a research report submitted to the U.S. Department of Justice. This report has not
APPENDIX 3 I
Process Evaluation Forms & Summaries
and do not necessarily reflect the official position or policies of the U.S. Department of Justice. been published by the Department. Opinions or points of view expressed are those of the author(s) This document is a research report submitted to the U.S. Department of Justice. This report has not
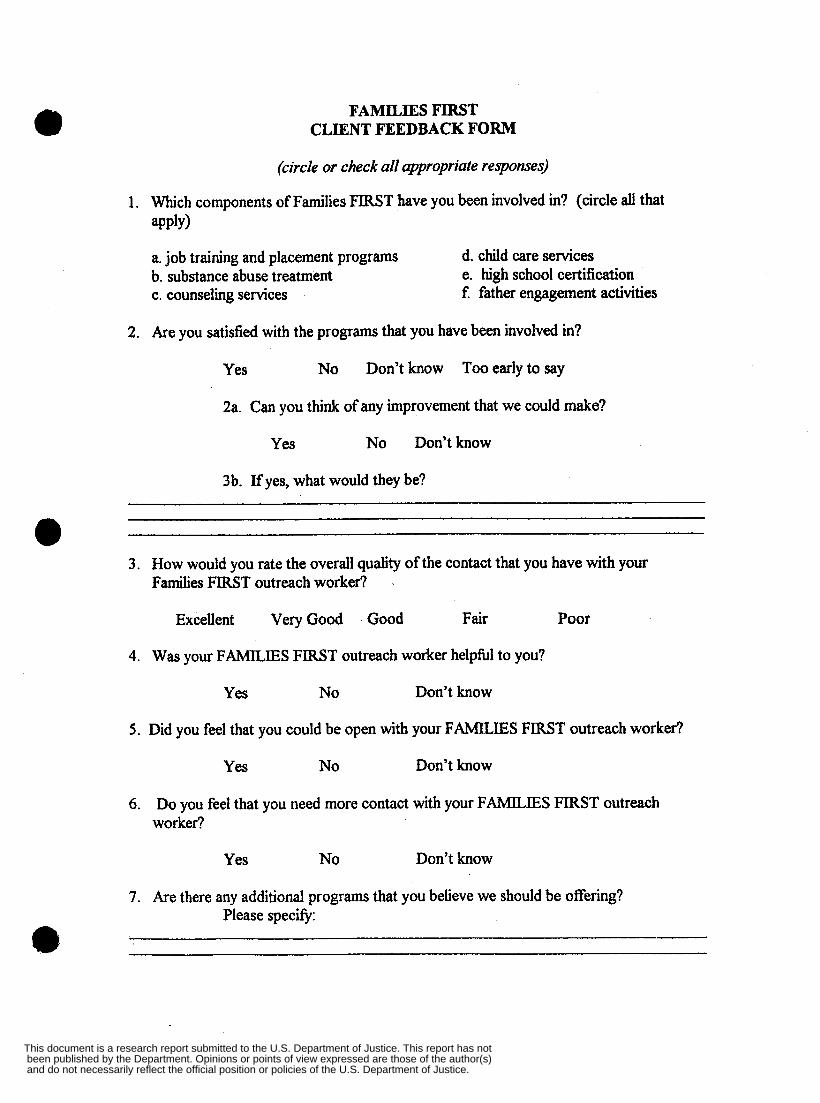
FAMILES FIRST CLIENT FEEDBACK FORM
(circle or check all appropriate responses)
1. Which components of Families FIRST have you been involved in? (circle all that apply)
a. job training and placement programs b. substance abuse treatment c. counseling services
d. child care services e. high school certification f father engagement activities
2. Are you satisfied with the programs that you have been involved in?
Yes No Don’t know Too early to say
2a. Can you think of any improvement that we could make?
Yes No Don’tknow
3b. Ifyes, what would they be?
3. How would you rate the overall quality of the contact that you have with your Families FIRST outreach worker?
Excellent Very Good Good Fair Poor
4. Was your FAMILIES FIRST outreach worker helpfbl to you?
Yes No Don’t know
5 . Did you feel that you could be open with your FAMILIES FIRST outreach worker?
Yes No Don’t know
6. Do you feel that you need more contact with your FAMILIES FlRST outreach worker?
Yes No Don’t know
7. Are there any additional programs that you believe we should be offering? Please specify: e
and do not necessarily reflect the official position or policies of the U.S. Department of Justice. been published by the Department. Opinions or points of view expressed are those of the author(s) This document is a research report submitted to the U.S. Department of Justice. This report has not
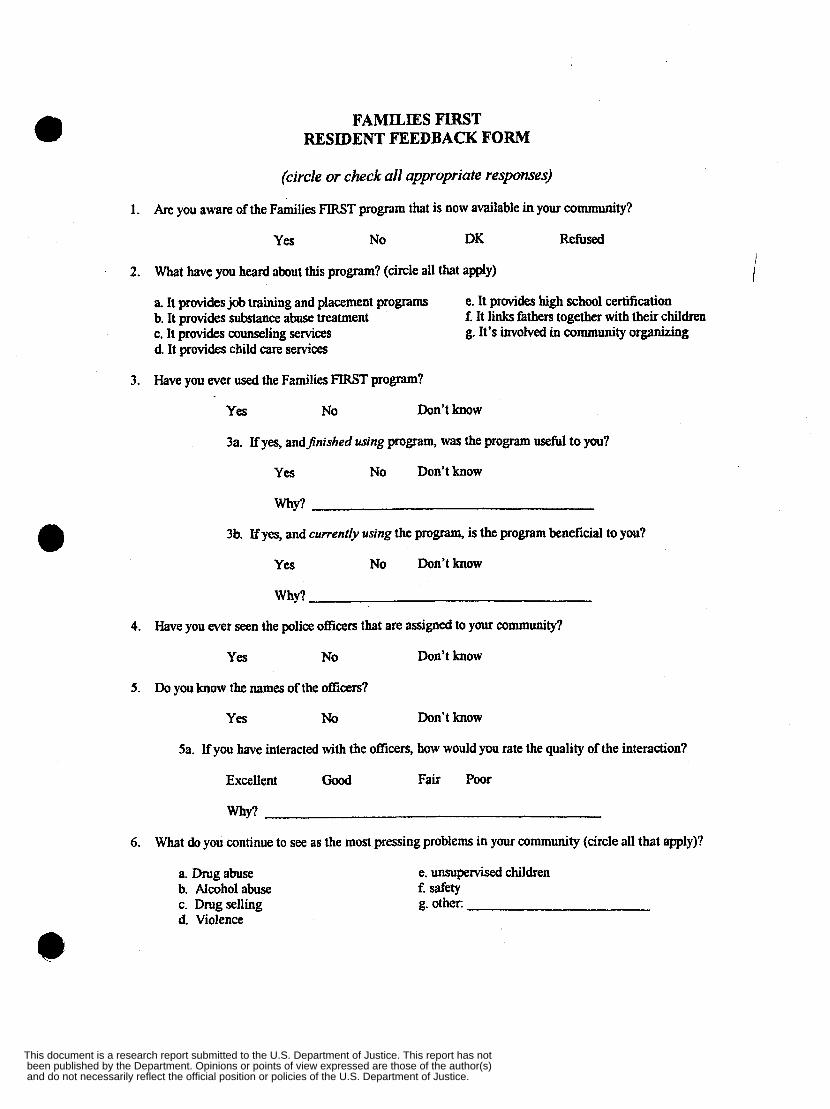
FAMILIES FLRST RESIDENT FEEDBACK FORM
(circle or check all appropriate responses)
1. Are you aware of the Families FIRST program that is now available in your community?
Yes No DK Refused
2. What have you heard about this program? (circle all that apply)
a. It provides job training and placement programs b. It provides substance abuse treatment
d It provides child care services
e. It provides high school certification f. It links fathers together with their children
c. It provides counseling services g. 1t7s involved in community organizing
3. Have you ever used the Families FIRST program?
Yes No Don’t know
3a. If yes, andfinished using program, was the program useful to you?
Yes No Don’tknow
MY?
3b. If yes, and currently using the program, is the program beneficial to you?
YeS No Don’tknow
Why?
4. Have you ever seen the police officers that are assigned to your Community’?
Yes No Don’t know
5. Do you know the names of the officers?
Yes No Don’t know
Sa. If you have interacted with the officers, bow would you rate the quality of the interaction?
Excellent Good Fair Poor
why?
6. What do you continue to see as the most pressing problems in your community (circle all that apply)?
a. Drug abuse b. Alcoholabuse c. Drug selling d. Violence
e. unsupervised children f safety g. other:
i
and do not necessarily reflect the official position or policies of the U.S. Department of Justice. been published by the Department. Opinions or points of view expressed are those of the author(s) This document is a research report submitted to the U.S. Department of Justice. This report has not
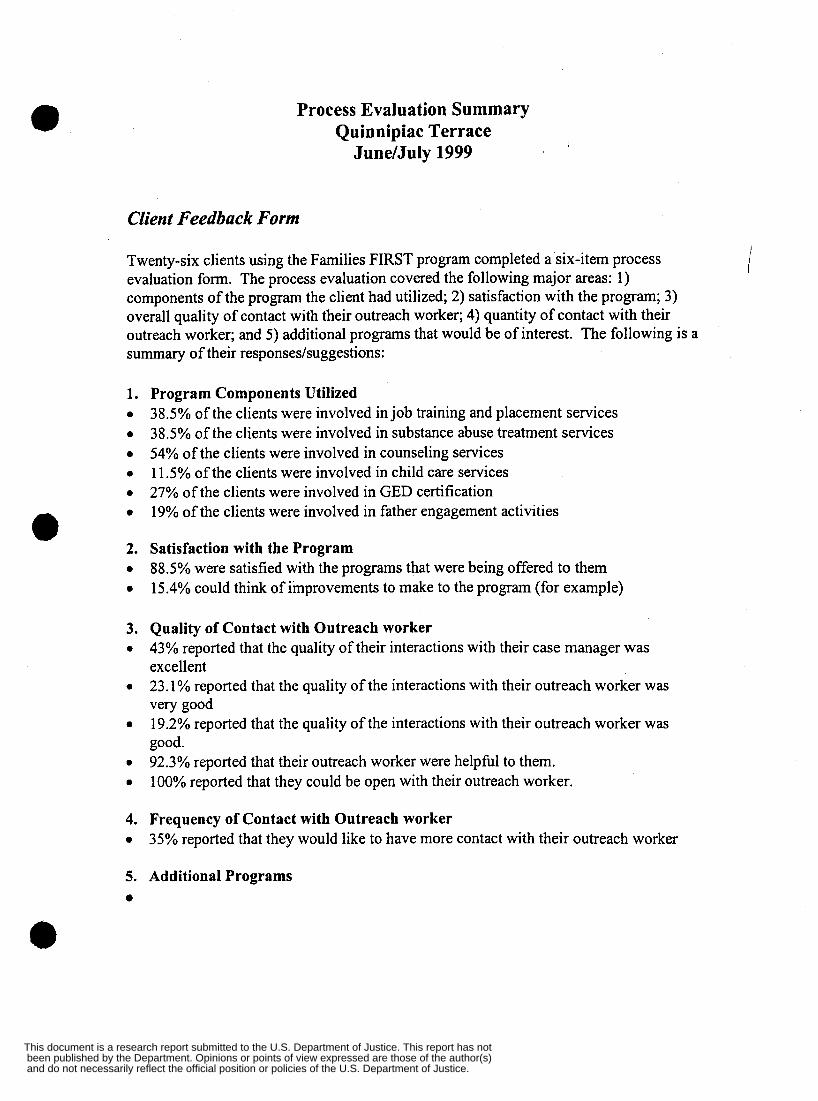
a Process Evaluation Summary Quinnipiac Terrace
June/July 1999
Client Feedback Form
Twenty-six clients using the Families FIRST program completed a six-item process evaluation form. The process evaluation covered the following major areas: 1) components of the program the client had utilized; 2) satisfaction with the program; 3) overall quality of contact with their outreach worker; 4) quantity of contact with their outreach worker; and 5) additional programs that would be of interest. The following is a summary of their responseshggestions:
1. 0
0
0
0
0
0
2. 0
0
3. 0
0
0
0
0
4. 0
5. 0
Program Components Utilized 38.5% of the clients were involved in job training and placement services 38.5% of the clients were involved in substance abuse treatment services 54% of the clients were involved in counseling services 11.5% of the clients were involved in child care services 27% of the clients were involved in GED certification 19% of the clients were involved in father engagement activities
Satisfaction with the Program 88.5% were satisfied with the programs that were being offered to them 15.4% could think of improvements to make to the program (for example)
Quality of Contact with Outreach worker 43% reported that the quality of their interactions with their case manager was excellent 23.1% reported that the quality of the interactions with their outreach worker was very good 19.2% reported that the quality of the interactions with their outreach worker was good. 92.3% reported that their outreach worker were helpful to them. 100% reported that they could be open with their outreach worker.
Frequency of Contact with Outreach worker 35% reported that they would like to have more contact with their outreach worker
Additional Programs
i
and do not necessarily reflect the official position or policies of the U.S. Department of Justice. been published by the Department. Opinions or points of view expressed are those of the author(s) This document is a research report submitted to the U.S. Department of Justice. This report has not
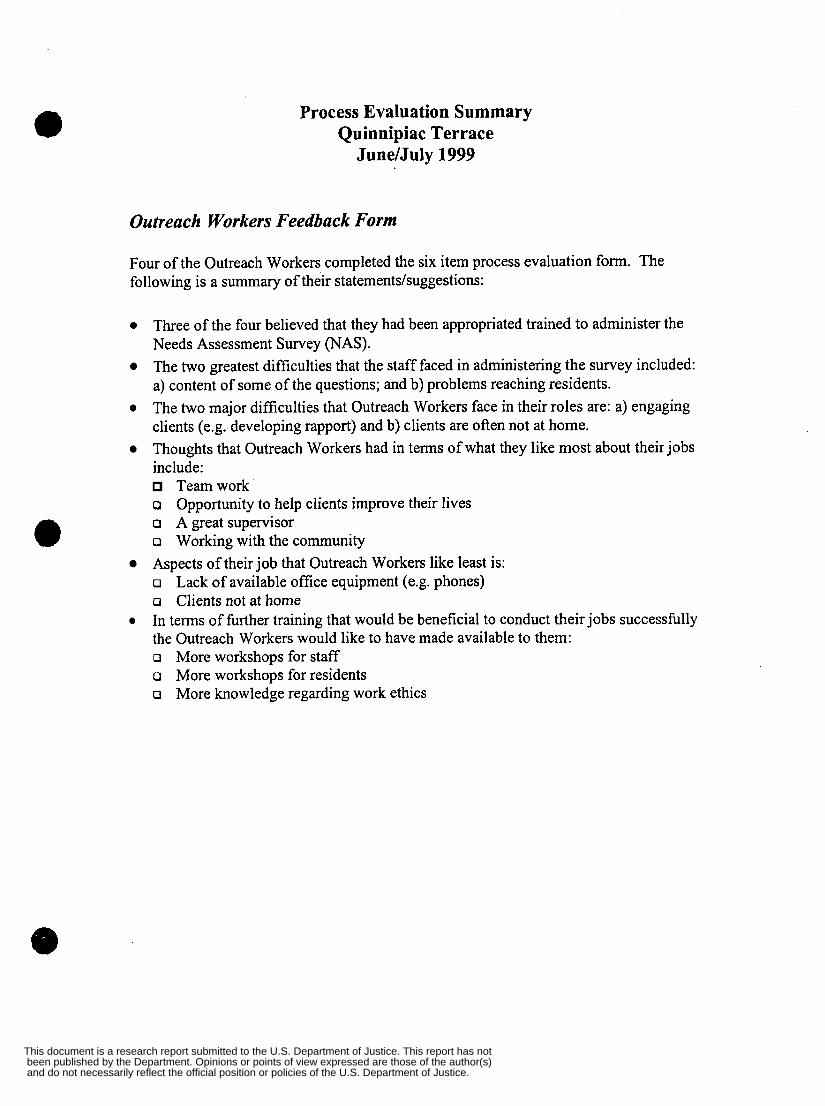
Process Evaluation Summary Quinnipiac Terrace
June/July 1999
Outreach Workers Feedback Form
Four of the Outreach Workers completed the six item process evaluation form. The following is a summary of their statements/suggestions:
0 Three of the four believed that they had been appropriated trained to administer the Needs Assessment Survey (NAS). The two greatest difficulties that the staff faced in administering the survey included: a) content of some of the questions; and b) problems reaching residents. The two major difficulties that Outreach Workers face in their roles are: a) engaging clients (e.g. developing rapport) and b) clients are often not at home. Thoughts that Outreach Workers had in terms of what they like most about their jobs include:
Teamwork o Opportunity to help clients improve their lives o A great supervisor Q Working with the community Aspects of their job that Outreach Workers like least is: o Lack of available office equipment (e.g. phones) o Clients not at home In terms of further training that would be beneficial to conduct their jobs successfully the Outreach Workers would like to have made available to them: o More workshops for staff o More workshops for residents o More knowledge regarding work ethics
0
and do not necessarily reflect the official position or policies of the U.S. Department of Justice. been published by the Department. Opinions or points of view expressed are those of the author(s) This document is a research report submitted to the U.S. Department of Justice. This report has not
APPENDIX 4
Environmental Assessments
and do not necessarily reflect the official position or policies of the U.S. Department of Justice. been published by the Department. Opinions or points of view expressed are those of the author(s) This document is a research report submitted to the U.S. Department of Justice. This report has not
b 1 L L 1 J J J
ENVIRONMENTAL SURVEY
1. Communitv center
graf6t.i (none, little, moderate, extensive) I trashcans , overflow trash cans dumpsters overflow dumpsters litter (none, little, moderate, extensive) I
glass (none, little, moderate, extensive) type of litter (paper, eanshottles, household items, drug paraphernalia) (yes,no) shxubs (none, neatly trimmed, partially trimmed, not trimmed) abandondwreeked cars illegally parked cars payphones inoperable phones lighting (well-lit, poorly lit, dark, none) numberoflights I
inoperable lights broken windows (none, little, moderate, extensive) boarded windows (none, little, moderate, extensive) benches ' I
broken benches congregation of p p l e #I (size, *no congregation) congregation of people # 1 (type==> children, teens, adults, seniors, mixed) congregation of people #1 (location) congregation of people #2 (size, *no congregation) congregation of people #2 (type==> children, teens, adults, seniors, mixed) congregation of people #2 (location)
4
2. Hipbrise
@ti (none, little, moderate, extensive) :
trashcans overflow trash cans dumpsters 1
overflow dumpsters - - litter (none, little, moderate, extensive) , glass (none, little, moderate, extensive) type of litter (paper, cans/boetles, household items, drug paraphernalia) Qes,no) shrubs (none, neatly trimmed, partially trimmed, not trimmed) abandonediwreckedcars- - illegally parked cars payphones inoperable phones lighting (well-lit, poorly lit, dark, none) number of lights inoperable lights broken windows (none, little, moderate, extensive) boarded windows (none, little, moderate, extensive) benches
1
II II a II * broken benches
and do not necessarily reflect the official position or policies of the U.S. Department of Justice. been published by the Department. Opinions or points of view expressed are those of the author(s) This document is a research report submitted to the U.S. Department of Justice. This report has not
I I 1 I I 0 I
congregation of people #1 (size, O=no congregation) congregation of people #1 (type==> children, teens, adults, seniors, mixed) congregation of people #1 (location) congregation of people #2 (size, +no congregation) congregation of people #2 (type==> children, teens, adults, seniors, mixed) congregation of people #2 (location)
3. ODen Space
graffiti (none, little, moderate, extensive) trash cans overflow trash cans dumpsters overflow dumpsters litter (none, little, moderate, extensive) glass (none, little, moderate, extensive) type of litter (paper, caus/bottles, household items, drug paraphernalia) (yes,no) shrubs (none, neatly trimmed, partially trimmed, not trimmed) abandondwrecked cars illegally parked cars payphones inoperable phones lighting (well-lit, poorly lit, dark, none) number of lights inoperable lights broken windows (none, little, moderate, extensive) boarded windows (none, little, moderate, extensive) benches broken benches congregation of people #1 (size, O=no congregation) congregation of people #1 (type==> children, teens, adults, seniors, mixed) congregation of people # 1 (location) congregation of people #2 (size, +no congregation) congregation of people #2 (type==> children, teens, adults, seniors, mixed) congregation of people #2 (location)
4.Parkin~Lot '
graffiti (none, little, moderate, extensive) trashcans overflow trash cans dumpsters overflow dumpsters litter (none, little, moderate, extensive) glass (none, little, moderate, extensive) type of litter (paper, cans/bottles, household items, drug paraphernalia) (yes,no) shrubs (none, neatly trimmed, partially trimmed, not trimmed) abandondwrecked cars illegally parked cars payphones inoperable phones lighting (well-lit, poorly lit, dark, none) number of lights
and do not necessarily reflect the official position or policies of the U.S. Department of Justice. been published by the Department. Opinions or points of view expressed are those of the author(s) This document is a research report submitted to the U.S. Department of Justice. This report has not
inoperable lights broken windows (none, little, moderate, extensive) boarded windows (none, little, moderate, extensive) benches broken benches congregation of people #1 (size, O=no congregation) congregation of people #I (type==> children, teens, adults, seniors, mixed) congregation of people #I (location) congregation of people #2 (size, +no congregation) congregation of people #2 (type=> children, teens, adults, seniors, mixed) congregation of people #2 (location)
5. Perimeter
graf6ti (none, little, moderate, extensive) trash cans ovexilow trash cans dumpsters overflow dumpsters litter (none, little, moderate, extensive) glass (none, little moderate, extensive) type of litter (paper, cans/bottles, household items, drug paraphernalia) &es,no) shrubs (none, neatly trimmed, partially trimmed, not trimmed) abandondwrecked cars illegally parked cars payPho= inoperable phones lighting (well-lit, poorly lit, dark, none) number of lights inoperable lights broken windows (none, little, moderate, extensive) boarded windows (none, little, moderate, extensive) benches broken benches congregation of people #1 (size, +no Congregation) congregation of people #1 (type==> children, teens, adults, seniors, mixed) congregation of people #1 (location) congregation of people #2 (size, +no congregation) congregation of people #2 (type==> children, teens, adults, seniors, mixed) congregation of people #2 (location) businesses (check cashing, conveniencelgrocery, restaurant, other) @=,no)
6. Plavmound
gratsti (none, little, moderate, extensive) trashcans ovexilow trash cans dumpsters ovexilow dumpsters litter (none, little, moderate, extensive) glass (none, little, moderate, extensive) type of litter (paper, cans/bottles, household items, drug paraphernalia) 6es,no) shrubs (none, neatly trimmed, partially trimmed, not trimmed)
and do not necessarily reflect the official position or policies of the U.S. Department of Justice. been published by the Department. Opinions or points of view expressed are those of the author(s) This document is a research report submitted to the U.S. Department of Justice. This report has not
abandonedkecked cars illegaIIy parked cars payphones inoperable phones lighting (well-lit, poorly lit, dark, none) number of lights inoperable lights broken Windows (none, little, moderate, extensive) boarded windows (none, little, moderate, extensive) benches broken benches equipment condition (good, moderate damage, extensive damage) congregation of people #1 (size, O=no congregation) congregation of people #1 (type==> children, teens, adults, seniors, mixed) congregation of people #1 (location) congregation of people #2 (size, O=no congregation) congregation of people #2 (type==> children, teens, adults, seniors, mixed) congregation of people #2 (location)
7. Rest Area
@ti (none, little, moderate, extensive) trash cans overflow trash cans dumpsters overflow dumpsters litter (none, little, moderate, extensive) glass (none, little, moderate, extensive) type of litter (paper, cans/bottles, household items, drug paraphernalia) (yesno) shrubs (none, neatly trimmed, partially trimmed, not trimmed) abandonedlwrecked cars illegallyparked cars PaYPho= inoperable phones lighting (well-lit, poorly lit, dark, none) number of lights inoperable lights broken Windows (none, little, moderate, extensive) boarded windows (none, little, moderate, extensive) benches broken benches congregation of people #1 (size, O=no congregation) congregation of people #1 (type==> children, teens, adults, seniors, mixed) congregation of people #1 (location) congregation of people #2 (size, O=no congregation) congregation of people #2 (type=> children, teens, adults, seniors, mixed) congregation ofpeople #2 (location)
8. Rowbouse
@ti (none, little, moderate, extensive) trash cans overflow trash cans
and do not necessarily reflect the official position or policies of the U.S. Department of Justice. been published by the Department. Opinions or points of view expressed are those of the author(s) This document is a research report submitted to the U.S. Department of Justice. This report has not
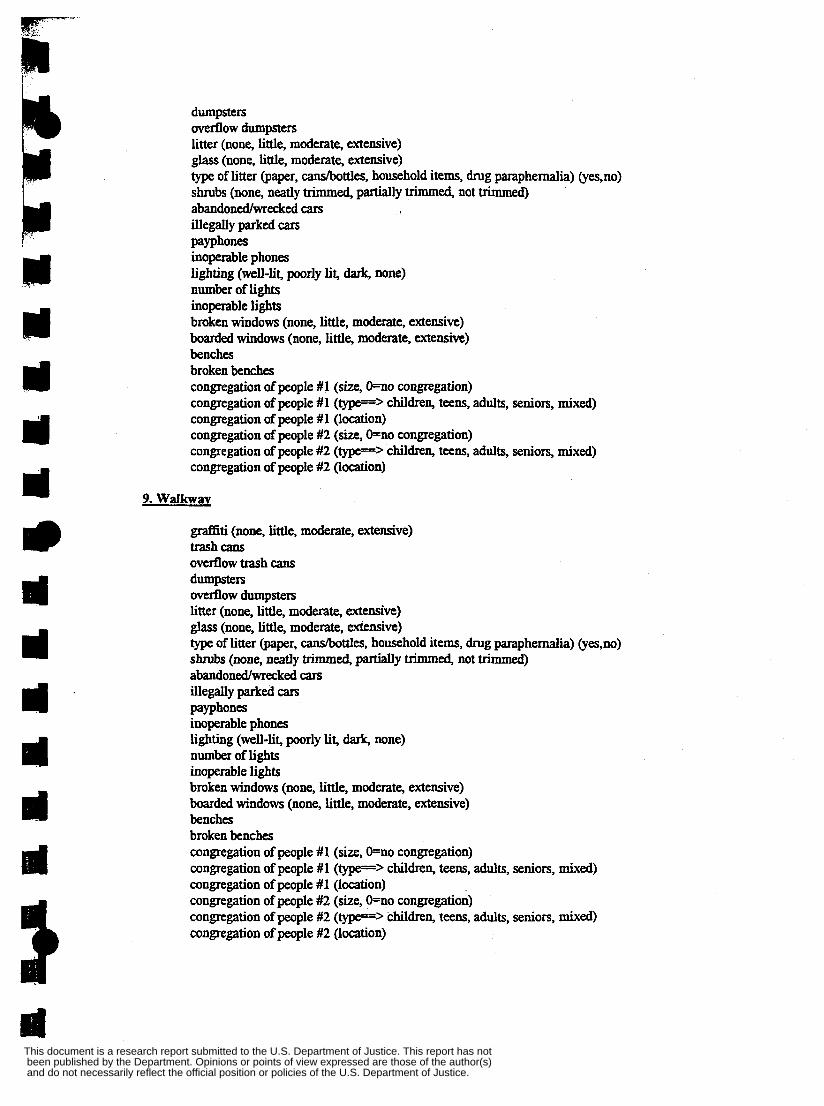
llJ 3 J a I@
d II II d d
dumpsters overflow dumpsters litter (none, little, moderate, extensive) glass (none, little, moderate, extensive) type of litter (paper, caus/bottles, household items, drug paraphernalia) @=,no) shrubs (none, neatly trimmed, partially trimmed, not trimmed) abandondwrecked cars illegally parked cars payphones inoperable phones lighting (well-lit, poorly lit, dark, none) number of lights inoperable lights broken windows (none, little, moderate, extensive) boarded windows (none, little, moderate, extensive) benches broken benches congregation of people #1 (size, &no congregation) congregation of people #1 (type==> children, teens, a d t s , seniors, mixed) congregation of people # 1 (location) congregation of people #2 (size, @no congregation) congregation of people #2 (type==> children, teens, adults, seniors, mixed) congregation of people #2 (location)
9. Walkway
graffiti (none, little, moderate, extensive) trashcam overflow trash cans dumpsters overflow dumpsters litter (none, little, moderate, extensive) glass (none, little, moderate, extensive) type of litter (paper, cansbottles, household items, drug paraphernalia) @es,no) shrubs (none, neatly trimmed, padally trimmed, not trimmed) abandondwrecked cars illegally parked cars payphones inoperable phones lighting (well-lit, poorly lit, dark, none) number of lights inoperable lights broken windows (none, little, moderate, extensive) boarded windows (none, little, moderate, extensive) benches broken benches congregation of people #1 (size, +no congregation) congregation of people #1 (type==> children, teens, adults, seniors, mixed) congregation of people #1 (location) congregation of people #2 (size, O=no congregation) congregation of people #2 (type==> children, teens, adults, seniors, mixed) congregation of people #2 (location)
and do not necessarily reflect the official position or policies of the U.S. Department of Justice. been published by the Department. Opinions or points of view expressed are those of the author(s) This document is a research report submitted to the U.S. Department of Justice. This report has not
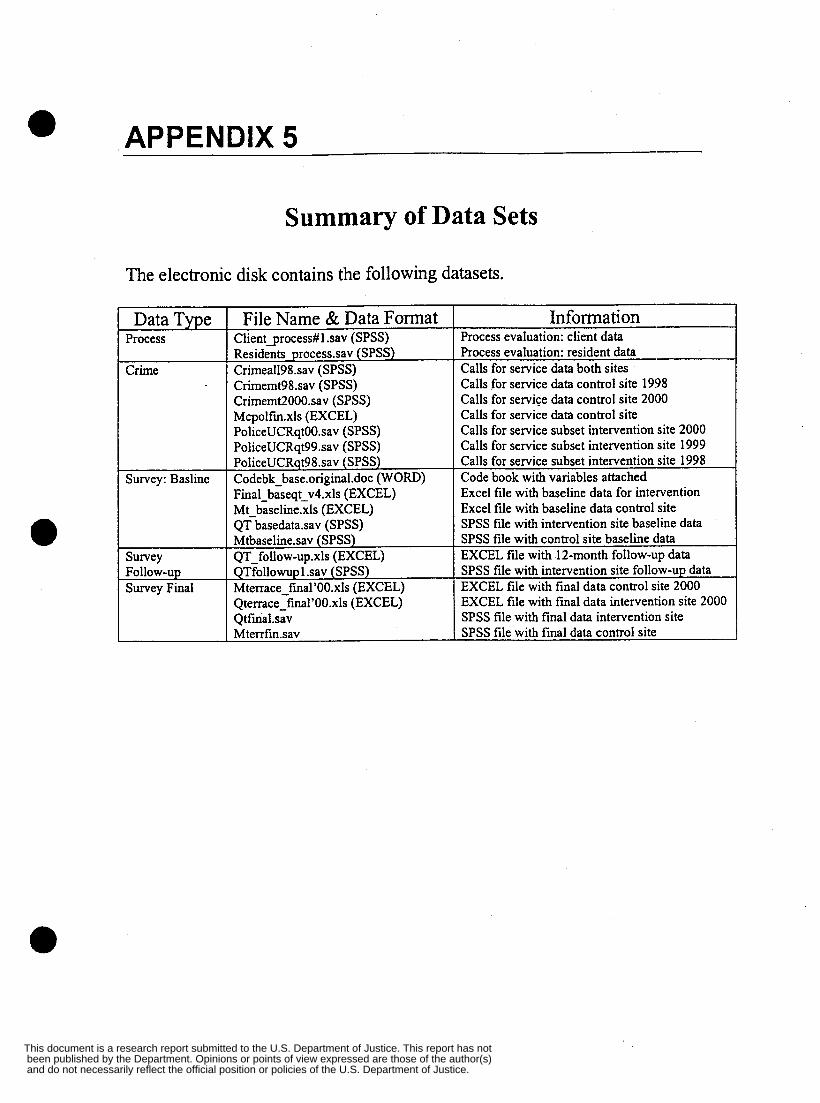
APPENDIX 5
File Name & Data Format Clientqrocess#l .sav (SPSS) Residents process.sav (SPSS) Crimeall98.sav (SPSS) Crimemt98.sav (SPSS) Crimemt2000.sav (SPSS) Mcpolfm.xls (EXCEL) PoliceUCRqt00.sav (SPSS) PoliceUCRat99.sav (SPSS)
Summary of Data Sets
The electronic disk contains the following datasets.
Info m a ti on Process evaluation: client data Process evaluation: resident data Calls for service data both sites Calls for service data control site 1998 Calls for service data control site 2000 Calls for service data control site Calls for service subset intervention site 2000 Calls for service subset intervention site 1999
Data Type Process
PoliceUCR&8.sav (SPSS) Codebk base.original.doc (WORD)
~
Crime
Calls for service subset intervention site 1998 Code book with variables attached Survey: Basline
Mtbaselinesav (SPSS) QT-follow-up.xls (EXCEL) QTfollowuplsav (SPSS) Mterrace-fma1’00,xls (EXCEL) Qterrace-fma1’00.xls (EXCEL) Qtfinalsav Mterrfin.sav
Survey
Survey Final Follow-up
SPSS file with control site baseline data EXCEL file with 12-month follow-up data SPSS file with intervention site follow-up data EXCEL file with final data control site 2000 EXCEL file with final data intervention site 2000 SPSS file with final data intervention site SPSS file with final data control site
Final-b&eqt-v4.& (EXCEL) Mt-baseline.xls (EXCEL) OT basedatasay (SPSS)
Excel file with baseline data for intervention Excel file with baseline data control site SPSS file with intervention site baseline data
and do not necessarily reflect the official position or policies of the U.S. Department of Justice. been published by the Department. Opinions or points of view expressed are those of the author(s) This document is a research report submitted to the U.S. Department of Justice. This report has not
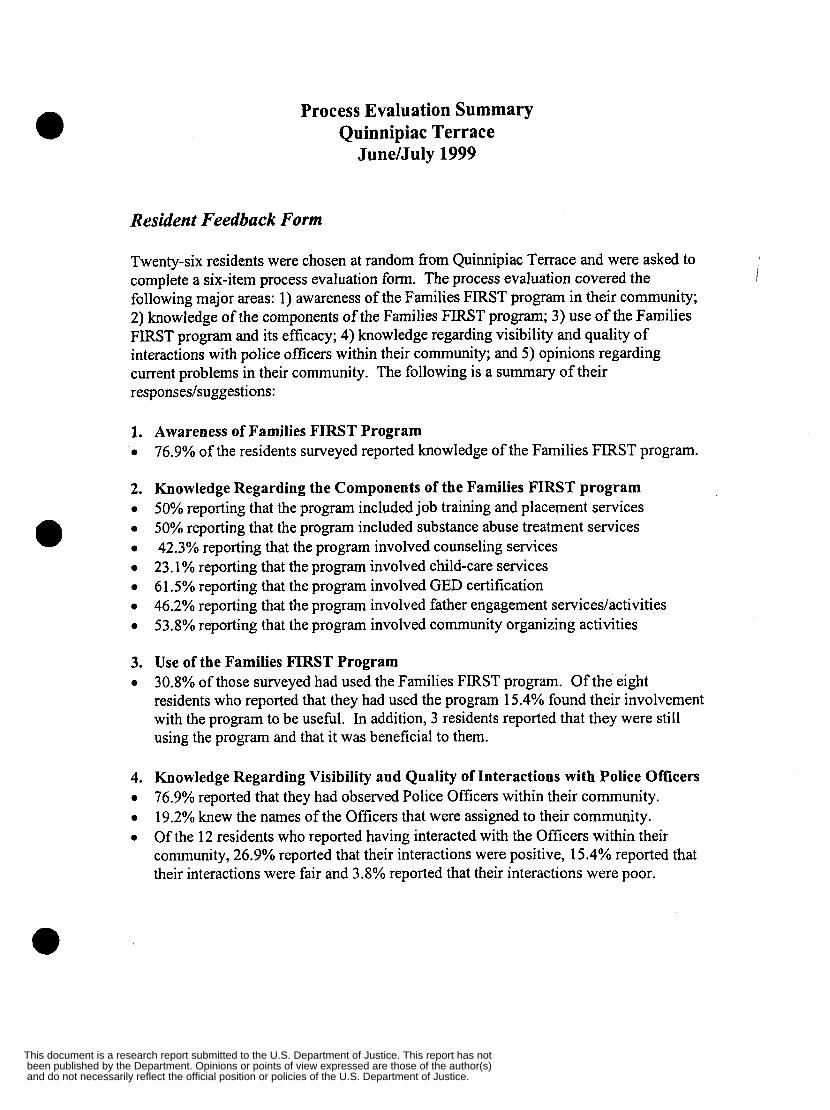
Process Evaluation Summary Quinnipiac Terrace
June/July 1999
Resident Feedback Form
Twenty-six residents were chosen at random from Quinnipiac Terrace and were asked to complete a six-item process evaluation form. The process evaluation covered the following major areas: 1) awareness of the Families FIRST program in their community; 2) knowledge of the components of the Families FIRST program; 3) use of the Families FIRST program and its efficacy; 4) knowledge regarding visibility and quality of interactions with police officers within their community; and 5) opinions regarding current problems in their community. The following is a summary of their responseshuggestions:
1. e
2. e
a
e
e
a
e
a
3. e
4. a
a
e
Awareness of Families FIRST Program 76.9% of the residents surveyed reported knowledge of the Families FIRST program.
Knowledge Regarding the Components of the Families FIRST program 50% reporting that the program included job training and placement services 50% reporting that the program included substance abuse treatment services 42.3% reporting that the program involved counseling services 23.1 % reporting that the program involved child-care services 61.5% reporting that the program involved GED certification 46.2% reporting that the program involved father engagement services/activities 53.8% reporting that the program involved community organizing activities
Use of the Families FIRST Program 30.8% of those surveyed had used the Families FIRST program. Of the eight residents who reported that they had used the program 15.4% found their involvement with the program to be useful. In addition, 3 residents reported that they were still using the program and that it was beneficial to them.
Knowledge Regarding Visibility and Quality of Interactions with Police Officers 76.9% reported that they had observed Police Officers within their community. 19.2% knew the names of the Officers that were assigned to their community. Of the 12 residents who reported having interacted with the Officers within their community, 26.9% reported that their interactions were positive, 15.4% reported that their interactions were fair and 3.8% reported that their interactions were poor.
and do not necessarily reflect the official position or policies of the U.S. Department of Justice. been published by the Department. Opinions or points of view expressed are those of the author(s) This document is a research report submitted to the U.S. Department of Justice. This report has not
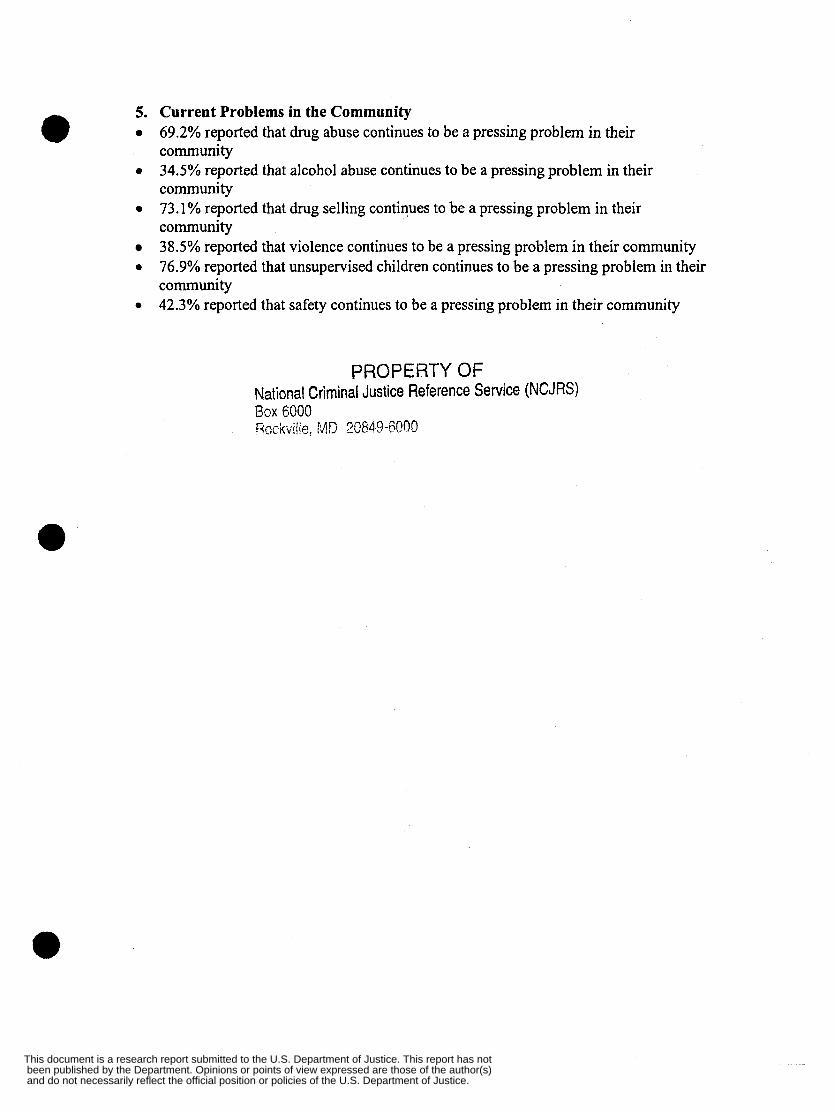
5. Current Problems in the Community 0 69.2% reported that drug abuse continues to be a pressing problem in their
community 0 34.5% reported that alcohol abuse continues to be a pressing problem in their
community 0 73.1 % reported that drug selling continues to be a pressing problem in their
community 38.5% reported that violence continues to be a pressing problem in their community
0 76.9% reported that unsupervised children continues to be a pressing problem in their community
0 42.3% reported that safety continues to be a pressing problem in their community
PROPERTY OF National Criminal Justice Reference Service (NCJRS) Box 6000 Rockyilie, MD 20849-~000
and do not necessarily reflect the official position or policies of the U.S. Department of Justice. been published by the Department. Opinions or points of view expressed are those of the author(s) This document is a research report submitted to the U.S. Department of Justice. This report has not