Embed Size (px)
Citation preview
EVALUATION OF A COLD THERMAL ENERGY STORAGE SYSTEM USING
ALTERNATIVE REFRIGERANTS
by
Salah Ali Alshaibani
A Thesis Presented to the Faculty of the
American University of Sharjah
College of Engineering
in Partial Fulfillment
of the Requirements
for the Degree of
Master of Science in
Mechanical Engineering
Sharjah, United Arab Emirates
May 2016

© 2016 Salah Alshaibani. All rights reserved
Approval Signatures
We, the undersigned, approve the Master’s Thesis of Salah Ali Alshaibani.
Thesis Title: Evaluation of a Cold Thermal Energy Storage System Using Alternative
Refrigerants
Signature Date of Signature
(dd/mm/yyyy)
___________________________ _______________
Dr. Saad A. Ahmed
Professor, Department of Mechanical Engineering
Thesis Advisor
___________________________ _______________
Dr. Mohamed A. Gadalla,
Professor, Department of Mechanical Engineering
Thesis Co-Advisor
___________________________ _______________
Dr. Essam M. Wahba,
Associate Professor, Department of Mechanical Engineering
Thesis Committee Member
___________________________ _______________
Dr. Zarook Shareefdeen,
Associate Professor, Department of Chemical Engineering
Thesis Committee Member
___________________________ _______________
Dr. Mamoun Abdel-Hafez
Department Head, Department of Mechanical Engineering
___________________________ _______________
Dr. Mohamed El-Tarhuni,
Associate Dean, College of Engineering
___________________________ _______________
Dr. Leland Blank
Dean, College of Engineering
___________________________ _______________
Dr. Khaled Assaleh,
Interim Vice Provost for Research and Graduate Studies
Acknowledgements
All praises and thanks goes to Allah for giving me the strength and ability to
finish this thesis. I take this opportunity to thank my parents for their endless support and
encouragement to strive to pursue my dreams. My sincere appreciation and respect also
goes to my wife Maryam, for her support in all aspects of my life
I would like to express my profound gratitude to Dr. Saad Ahmed and Dr.
Mohamed Gadalla, for their time and effort to support my work throughout my Master’s
program. I thank them for giving me the opportunity to pursue my interest in
experimental research. Special thanks goes to the thesis committee: Dr. Essam Wahba,
and Dr. Zarook Shareefdeen, for their time and effort devoted in reviewing this thesis.

Dedication
In the name of Almighty Allah, the source and origin of all knowledge of present and
otherwise, I dedicate this effort of mine to
My father and mother, whose kindness, is a constant source of strength
6
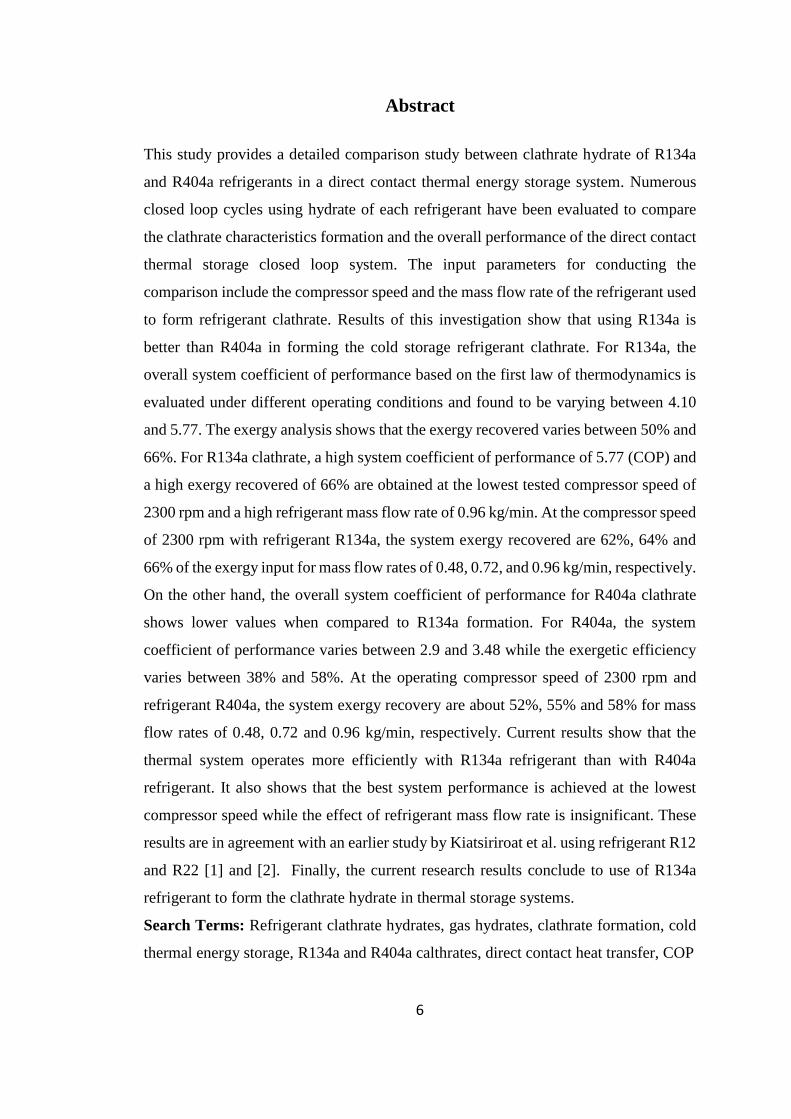
Abstract
This study provides a detailed comparison study between clathrate hydrate of R134a
and R404a refrigerants in a direct contact thermal energy storage system. Numerous
closed loop cycles using hydrate of each refrigerant have been evaluated to compare
the clathrate characteristics formation and the overall performance of the direct contact
thermal storage closed loop system. The input parameters for conducting the
comparison include the compressor speed and the mass flow rate of the refrigerant used
to form refrigerant clathrate. Results of this investigation show that using R134a is
better than R404a in forming the cold storage refrigerant clathrate. For R134a, the
overall system coefficient of performance based on the first law of thermodynamics is
evaluated under different operating conditions and found to be varying between 4.10
and 5.77. The exergy analysis shows that the exergy recovered varies between 50% and
66%. For R134a clathrate, a high system coefficient of performance of 5.77 (COP) and
a high exergy recovered of 66% are obtained at the lowest tested compressor speed of
2300 rpm and a high refrigerant mass flow rate of 0.96 kg/min. At the compressor speed
of 2300 rpm with refrigerant R134a, the system exergy recovered are 62%, 64% and
66% of the exergy input for mass flow rates of 0.48, 0.72, and 0.96 kg/min, respectively.
On the other hand, the overall system coefficient of performance for R404a clathrate
shows lower values when compared to R134a formation. For R404a, the system
coefficient of performance varies between 2.9 and 3.48 while the exergetic efficiency
varies between 38% and 58%. At the operating compressor speed of 2300 rpm and
refrigerant R404a, the system exergy recovery are about 52%, 55% and 58% for mass
flow rates of 0.48, 0.72 and 0.96 kg/min, respectively. Current results show that the
thermal system operates more efficiently with R134a refrigerant than with R404a
refrigerant. It also shows that the best system performance is achieved at the lowest
compressor speed while the effect of refrigerant mass flow rate is insignificant. These
results are in agreement with an earlier study by Kiatsiriroat et al. using refrigerant R12
and R22 [1] and [2]. Finally, the current research results conclude to use of R134a
refrigerant to form the clathrate hydrate in thermal storage systems.
Search Terms: Refrigerant clathrate hydrates, gas hydrates, clathrate formation, cold
thermal energy storage, R134a and R404a calthrates, direct contact heat transfer, COP
7
Table of Contents
Abstract .......................................................................................................................... 6
List of Figures .............................................................................................................. 10
List of Tables ............................................................................................................... 14
Nomenclature ............................................................................................................... 15
Chapter 1: Introduction ............................................................................................... 17
1.1 Thermal Energy Storage .................................................................................... 17
1.2 Significance of the Research .............................................................................. 19
1.3 Literature Review............................................................................................... 21
1.4 Research Methodology ...................................................................................... 28
1.5 Objective and Scope .......................................................................................... 28
1.6 Problem Statement ............................................................................................. 30
1.7 Thesis Organization ........................................................................................... 30
Chapter 2: Thesis Background ..................................................................................... 32
2.1 Classification of TES ......................................................................................... 32
2.1.1 Sensible heat TES ........................................................................................ 32
2.1.2 Latent heat TES ........................................................................................... 32
2.2 Phase Change Materials for TES Application ................................................... 34
2.3 Direct Contact TES Systems .............................................................................. 36
2.4 Indirect Contact TES Systems ........................................................................... 38
Chapter 3: System Modeling and Analysis .................................................................. 40
3.1 Introduction ........................................................................................................ 40
3.2 System Modeling and Assumptions................................................................... 40
3.3 Direct Storage Tank Modeling........................................................................... 44
3.4 Compressor Modeling ........................................................................................ 45
3.5 System Performance .......................................................................................... 47
Chapter 4: Experimental Test Facilities ....................................................................... 51
4.1 Introduction ........................................................................................................ 51
4.2 Experimental Test Facility ................................................................................. 52
4.2.1 Single stage operating mode with single direct storage system .................. 53
4.2.2 Multi stage operating mode with single direct storage system .................... 55
4.3 Single Stage Experimental Apparatus and Procedure ....................................... 55
8
4.3.1 Experimental apparatus ............................................................................... 55
4.3.2 Experimental procedure ............................................................................... 57
4.4 Experimental Components ................................................................................. 59
4.4.1 Direct storage tank ....................................................................................... 59
4.4.2 Compressor .................................................................................................. 60
4.4.3 Water-cooled condenser .............................................................................. 60
4.4.5 Cooling tower .............................................................................................. 61
4.4.6 Expansion valve ........................................................................................... 61
4.5 Subsystem components ...................................................................................... 61
4.5.1 Pressure safe switches ................................................................................. 61
4.5.2 Condenser pressure regulator ...................................................................... 62
4.5.3 Evaporator relief valve ................................................................................ 62
4.5.4 Sight glass .................................................................................................... 62
4.5.5 Charging connection .................................................................................... 63
4.5.6 Oil separator ................................................................................................ 63
4.6 Measurement Devises ........................................................................................ 63
4.6.1 Pressure gauges and transducers .................................................................. 63
4.6.2 Thermocouples ............................................................................................ 63
Chapter 5: Experimental Results and Discussion ........................................................ 64
5.1 Introduction ........................................................................................................ 64
5.2 Setup Process ..................................................................................................... 65
5.3 Direct Storage Tank Behavior ........................................................................... 68
5.3.1 Direct storage tank temperature variation ................................................... 68
5.3.2 Direct storage tank pressure variation ......................................................... 74
5.3.3 Uncertainty analysis .................................................................................... 77
5.4 Compressor Behavior......................................................................................... 77
5.4.1 Compressor power ....................................................................................... 77
5.4.2 Compressor ratio.......................................................................................... 79
5.5 System Performance Evaluation ........................................................................ 81
5.6 Comparative analysis between R134a and R404a clathrate .............................. 90
5.7 Discussion of Results ......................................................................................... 94
Chapter 6: Conclusion and Recommendations ............................................................ 96
9
References .................................................................................................................... 99
Appendices ................................................................................................................. 105
Appendix: A (Temperature Readings) ................................................................... 105
Appendix: B (Specification of Components) ......................................................... 118
I. MEASUREMENTS COMPONENTS ............................................................ 118
II. MAIN COMPONENTS .............................................................................. 120
III. MULTI-STAGE COMPONENTS .............................................................. 122
Appendix: C (EES CODES) .................................................................................. 124
I. R134A EES CODE ..................................................................................... 124
II. R404A EES CODE ..................................................................................... 125
III. MODELING CODE R134A REFRIGERANT ....................................... 126
IV. MODELING CODE R404A REFRIGERANT ....................................... 128
Vita ............................................................................................................................. 129
10
List of Figures
Figure 1: Fundamental areas for studies of thermal energy storage systems and
properties. [5,6] ............................................................................................................ 18
Figure 2: Types of thermal energy storage based on heat classification [6] ................ 19
Figure 3: Types of hydrate structure and their cage arrangement [58] ........................ 38
Figure 4: Temperature-Entropy diagram of single stage refrigeration system ............ 42
Figure 5: Flow chart for modeling the thermal energy storage system ...................... 43
Figure 6: Effect of R134a refrigerant mass flow rates on compressor power at different
compressor speeds ....................................................................................................... 46
Figure 7: Effect of R404a refrigerant mass flow rates on compressor power at different
compressor speeds ....................................................................................................... 47
Figure 8: Effect of R134a refrigerant mass flow rate on system energetic efficiency at
different compressor speeds ......................................................................................... 48
Figure 9: Effect of R404a refrigerant mass flow rates on system energetic efficiency at
different compressor speeds ......................................................................................... 48
Figure 10: Effect of R134a refrigerant mass flow rate on system exergetic efficiency at
different compressor speeds ......................................................................................... 50
Figure 11: Effect of R404a refrigerant mass flow rate on system exergetic efficiency at
different compressor speeds ......................................................................................... 50
Figure 12: Picture view of the experimental direct thermal energy storage test rig .... 51
Figure 13: Detailed experimental schematic apparatus used for thermal storage ....... 52
Figure 14: Rig components for direct thermal energy storage system ........................ 54
Figure 15: Experimental apparatus for direct thermal energy storage system............. 56
Figure 16: Refrigerant distributer inside the direct storage tank ................................. 56
Figure 17: Vapor compression cycle during charging process of direct storage tank . 58
Figure 18: Picture view of thermal energy storage tank .............................................. 59
Figure 19: Formation of R134a clathrate hydrate during charging process ................ 67
Figure 20: Location of the temperature sensors around the storage tank .................... 69
Figure 21: Variation of average R134a clathrate temperature inside the storage tank
during charging process at N= 2300 rpm ..................................................................... 72
Figure 22: Variation of average R134a clathrate temperature inside the storage tank
during charging process at N= 2500 rpm ..................................................................... 72
11
Figure 23: Variation of average R134a clathrate temperature inside the storage tank
during charging process at N= 2700 rpm ..................................................................... 73
Figure 24: Variation of average R404a clathrate temperature inside the storage tank
during charging process at N= 2300 rpm ..................................................................... 73
Figure 25: Variation of average R404a clathrate temperature inside the storage tank
during charging process at N= 2500 rpm ..................................................................... 73
Figure 26: Variation of average R404a clathrate temperature inside the storage tank
during charging process at N= 2700 rpm ..................................................................... 74
Figure 27: Pressure variation of storage tank during charging process at N=2700 rpm
and ṁ= 0.96 (kg/min) .................................................................................................. 75
Figure 28: Pressure variation of storage tank during charging process at N= 2500 rpm
and ṁ= 0.96 (kg/min) .................................................................................................. 76
Figure 29: Pressure variation of storage tank during charging process at N= 2300 rpm
and ṁ= 0.96 (kg/min) .................................................................................................. 76
Figure 30: Effect of refrigerant R134a mass flow rate on input compressor power during
charging process........................................................................................................... 79
Figure 31: Effect of refrigerant R404a mass flow rate on input compressor power during
charging process........................................................................................................... 79
Figure 32: Effect of R134a mass flow rate on compressor ratio at different compressor
speed during charging process ..................................................................................... 80
Figure 33: Effect of R404a mass flow rate of refrigerant R404a refrigerant on the system
at different compressor speeds ..................................................................................... 81
Figure 34: Effect of R134a mass flow rate on COP during charging process based on
first law analysis .......................................................................................................... 87
Figure 35: Effect of R404a mass flow rate on COP during charging process based on
first law analysis .......................................................................................................... 87
Figure 36: Effect of R134a mass flow rate on COP during charging process based on
second law analysis ...................................................................................................... 88
Figure 37: Effect of R404a mass flow rate on COP during charging process based on
second law analysis ...................................................................................................... 88
Figure 38: System performance based on first law analysis during clathrate formation
of R134a and ṁ=0.96 kg/min ...................................................................................... 89
12
Figure 39: System performance based on second law analysis during clathrate
formation of R134a and ṁ=0.96 kg/min ..................................................................... 89
Figure 40: Variation of temperature inside the storage tank during clathrate formation
of refrigerant R134a with mass flow rate 0.48 kg/min and N=2300 rpm .................. 105
Figure 41: Variation of temperature inside the storage tank during clathrate formation
of refrigerant R134a with mass flow rate of 0.72 kg/min and N=2300 rpm ............. 105
Figure 42: Variation of temperature inside the storage tank during clathrate formation
of refrigerant R134a with mass flow rate of 0.96 (kg/min) and N= 2300 rpm .......... 106
Figure 43: Variation of temperature inside the storage tank during clathrate formation
of refrigerant R134a with mass flow rate of 0.48(kg/min) and N=2500 rpm ............ 106
Figure 44: Variation of temperature inside the storage tank during clathrate formation
of refrigerant R134a with mass flow rate of 0.72(kg/min) and N= 2500 rpm ........... 107
Figure 45: Variation of temperature inside the storage tank during clathrate formation
of refrigerant R134a with mass flow rate of 0.96 (kg/min) and N= 2500 rpm .......... 107
Figure 46: Variation of temperature inside the storage tank during clathrate formation
of refrigerant R134a with mass flow rate of 0.48(kg/min) and N= 2700 rpm ........... 108
Figure 47: Variation of temperature inside the storage tank during clathrate formation
of refrigerant R134a with mass flow rate of 0.72(kg/min) and N= 2700 rpm ........... 108
Figure 48: Variation of temperature inside the storage tank during clathrate formation
of refrigerant R134a with mass flow rate of 0.96(kg/min) and N= 2700 rpm ........... 109
Figure 49: Variation of temperature inside the storage tank during clathrate formation
of refrigerant R404a with mass flow rate 0.48 kg/min and N=2300 rpm .................. 109
Figure 50: Variation of temperature inside the storage tank during clathrate formation
of refrigerant R404a with mass flow rate of 0.72 kg/min and N=2300 rpm ............. 110
Figure 51: Variation of temperature inside the storage tank during clathrate formation
of refrigerant R404a with mass flow rate of 0.96 (kg/min) and N= 2300 rpm .......... 110
Figure 52: Variation of temperature inside the storage tank during clathrate formation
of refrigerant R404a with mass flow rate of 0.48(kg/min) and N=2500 rpm ............ 111
Figure 53: Variation of temperature inside the storage tank during clathrate formation
of refrigerant R404a with mass flow rate of 0.72(kg/min) and N= 2500 rpm ........... 111
Figure 54: Variation of temperature inside the storage tank during clathrate formation
of refrigerant R404a with mass flow rate of 0.96 (kg/min) and N= 2500 rpm .......... 112
13
Figure 55: Variation of temperature inside the storage tank during clathrate formation
of refrigerant R404a with mass flow rate of 0.48(kg/min) and N= 2700 rpm ........... 112
Figure 56: Variation of temperature inside the storage tank during clathrate formation
of refrigerant R404a with mass flow rate of 0.72(kg/min) and N= 2700 rpm ........... 113
Figure 57: Variation of temperature inside the storage tank during clathrate formation
of refrigerant R404a with mass flow rate of 0.96(kg/min) and N= 2700 rpm ........... 113
Figure 58: Variation of average R134a clathrate temperature inside the storage tank
with change in time at ṁ= 0.48 (kg/min) ................................................................... 114
Figure 59: Variation of average R134a clathrate temperature inside the storage tank
with change in time at ṁ= 0.72 (kg/min) ................................................................... 114
Figure 60: Variation of average R134a clathrate temperature inside the storage tank
with change in time at ṁ= 0.96 (kg/min) ................................................................... 115
Figure 61: Variation of average R404a clathrate temperature inside the storage tank
with change in time at ṁ= 0.48 (kg/min) ................................................................... 115
Figure 62: Variation of average R404a clathrate temperature inside the storage tank
with change in time at ṁ= 0.72 (kg/min) ................................................................... 116
Figure 63: Variation of average R404a clathrate temperature inside the storage tank
with change in time at ṁ= 0.96 (kg/min) ................................................................... 116
Figure 64: Experimental data measurements system including 12 channels for
temperature reading, 8 channels for pressure reading ............................................... 119
Figure 65: PLATON refrigerant flow meter .............................................................. 120
Figure 66: Multi-stage rig components for direct thermal energy storage system .... 122
14
List of Tables
Table 1: Absolute average deviations of the hydrate dissociation pressure using van der
Waals-Platteeuw soild solution theory......................................................................... 23
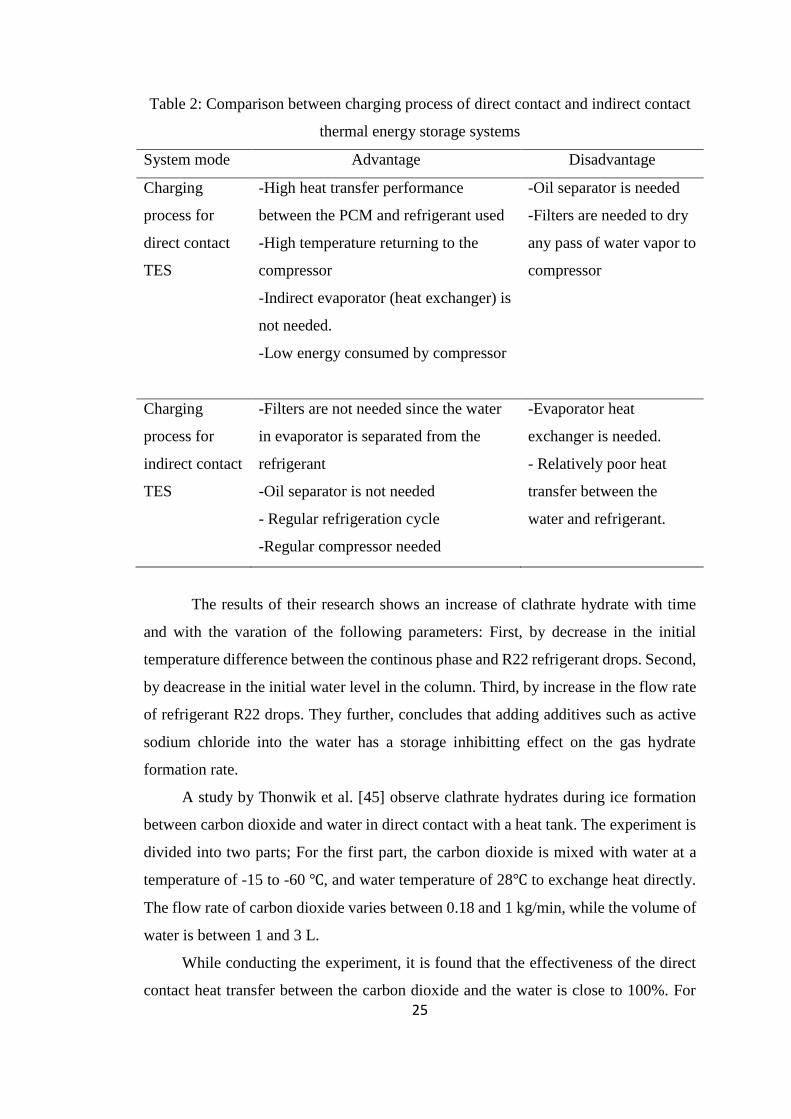
Table 2: Comparison between charging process of direct contact and indirect contact
thermal energy storage systems ................................................................................... 25
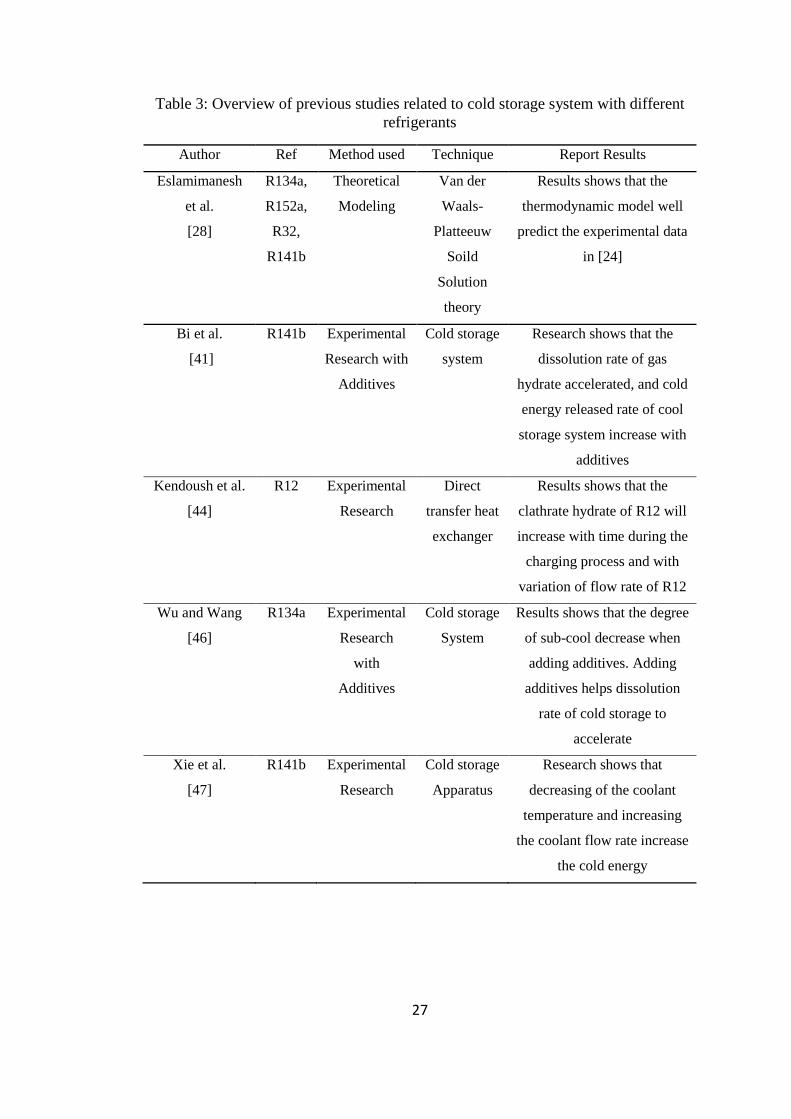
Table 3: Overview of previous studies related to cold storage system with different
refrigerants ................................................................................................................... 27
Table 4: List of selected solid-liquid materials for sensible heat storage [48] ............ 33
Table 5: Characteristic of phase change material used for thermal storage ................ 35
Table 6: Thermal properties of guest material for refrigerants hydrates [57] .............. 37
Table 7: Rig components used for single-stage direct TES system ............................. 55
Table 8: Experimental operating conditions for clathrate R134a and R404a .............. 64
Table 9: Ratio of water to refrigerant based on mass fraction .................................... 66
Table 10: Experimental operating conditions for refrigerant R134a ........................... 70
Table 11: Experimental operating conditions for refrigerant R404a ........................... 71
Table 12: Variation of the pressure readings during R134a clathrate formation ......... 75
Table 13: Comparison of storage time between model and experiment data for different
operation conditions for R134a .................................................................................... 83
Table 14: System performance with refrigerant R134a clathrate hydrate at different
flow rates and different compressor speed ................................................................... 84
Table 15: Comparison of storage time between model and experiment data for different
operation condition for R404a ..................................................................................... 85
Table 16: System performance with refrigerant R404a clathrate hydrate system at
different flow rates and different compressor speed .................................................... 86
Table 17: Comparative analysis between R134a and R404a clathrate hydrates ......... 93
Table 18: Relation between pressure ratio and mass flow rate at different compressor
speed during refrigerant R134a hydration ................................................................. 117
Table 19: Relation between pressure ratio and mass flow rate at different compressor
speed during refrigerant R404a hydration ................................................................. 117
Table 20: Specification of the compressor used for thermal storage system. ........... 120
Table 21: Specification of filter drier used for thermal storage experiment .............. 121
Table 22: Rig components used for direct multi-stage TES system .......................... 123
15
Nomenclature
𝐶𝑝 Specific heat (kJ/kg)
𝐸�̇�𝑟𝑒𝑐 Rate of exergy recovered during the charging period (kW)
𝐸�̇�𝑖𝑛 Rate of exergy flow-in during the charging period (kW)
∆ℎ Enthalpy change during the charging process (kJ/kg)
∆ℎ𝑙 Latent heat of refrigerant hydrate (kJ/kg)
𝑚𝑟𝑒𝑓 Mass of refrigerant inside the direct storage tank (kg)
𝑚𝑤𝑎𝑡𝑒𝑟 Mass of water inside the direct storage tank (kg)
𝑚𝑐𝑙 Mass of refrigerant clathrate hydrate inside the storage tank.
(kg)
�̇� Mass flow rate of refrigerant during the charging process.
(kg/s)
𝑁 Revolution per minute
𝑄𝑒𝑣𝑎𝑝 Total load inside the direct thermal energy storage. (kJ)
�̇�𝑒𝑣𝑎𝑝 Rate of heat removal inside the storage tank. (kW)
𝑄𝑡𝑜𝑡𝑎𝑙−𝑒𝑥𝑝 Total energy stored (Experimental) .(kJ)
𝑄𝑡𝑜𝑡𝑎𝑙−𝑚𝑜𝑑 Total energy stored (Model) .(kJ)
∆𝑡 Time change (s)
𝑇𝑎𝑣𝑔 Average charging Temperature (℃)
𝑇𝑖𝑛−𝑒𝑣𝑎𝑝 Refrigerant temperature into evaporator. ( ℃)
𝑇0 Ambient temperature. (℃ )
�̇�𝑐𝑜𝑚𝑝 Rate of work of the compressor. (kW)
Greek Symbols
𝜂𝑣 Volumetric efficiency of the compressor -
Subscript
𝑎𝑣𝑔 Average
𝑐𝑙 Clathrate hydrate
𝑐𝑙,tank Clathrate hydrate inside storage tank
16
𝑐𝑜𝑚𝑝 Compressor
𝑐𝑦𝑐𝑙𝑒 Actual cycle
𝑒𝑣𝑎𝑝 Evaporator
𝑒𝑥e Exergy
𝑒𝑥𝑝 Experimental
ℎ Enthalpy values
𝑖 Specific time
𝐼𝑑𝑒𝑎𝑙 Reversible (ideal) cycle
𝑙 Latent heat
𝑝ℎ𝑐 Phase change
𝑟𝑒𝑓 Refrigerant
𝑟𝑒𝑓, 𝑡𝑎𝑛𝑘 Quantity of refrigerant inside the tank
𝑠 Sensible heat
𝑠𝑖𝑚 Simulation
𝑡𝑜𝑡𝑎𝑙 Total charging time
Abbreviations
COP Coefficient of performance
CTES Cold thermal energy storage
HTF Heat transfer fluid
HVAC Heating ventilating and air conditioning
LHES Latent heat energy storage
PCM Phase change materials
TES Thermal energy storage
VSD Variable speed drive
17
Chapter 1: Introduction
1.1 Thermal Energy Storage
Thermal energy storage (TES) systems have been the main topic of research in
the field of energy management for the last few decades due to their potential for storing
thermal energy. They are considered to be the most promising and competitive solution
for storing efficient thermal energy. Thermal energy storage systems are defined as
temporary systems that hold thermal energy for later use [3,4]. This thermal energy can
be in the form of cold thermal energy or hot thermal energy. The importance of TES
systems lies in their capability to save cold thermal energy for later use which leads to
savings in electrical power. One of the main advantages of TES is its capability of
managing the mismatch of electricity between supply and demand. Furthermore, TES
plays an important role in converting accessible electrical power to thermal energy and
saving it for later use. This conversion of power can be employed to reduce energy
consumption or transfer the energy load from peak periods to un-peak periods.
Implementing thermal energy systems in buildings can help power producer (power
stations) to manage the load and at the same time help power consumption (residents
and factories) to improve the performance of conventional air-cooling systems. For
example, storage of thermal energy would improve the performance of a power
generation plant by load leveling, lead to higher efficiency and lower generation costs.
Simultaneously, TES systems would help in shaving the peak electrical load consumed
by commercial buildings and shifting it from daytime to nighttime. Usually, the electric
load consumed during the day time is more than consumed at night time; Therefore,
TES systems help in managing the electric load and balancing any mismatch between
demand and supply of the electric load.
In general, TES systems are an important element of energy saving management
for a variety of sectors such as the residential, commercial, industrial, and transportation
sectors. The primary objective of TES systems is to alter energy patterns to promote a
cleaner environment and financial savings. A cleaner environment and financial savings
can occur by achieving the following points; Firstly, the use of surplus energy where
the consumption of purchased energy can be reduced by storing surplus thermal energy
such as heat collected from solar panels instead of water heater.
18
Secondly, shave of peak demand by production of thermal energy during of off
peak hours and utilize it during high demand period. Thirdly, defer of conventional
equipment by replacing or integrating new saving technologies with conventional
equipment. Mainly, TES systems are integrated with conventional HVAC systems for
cooling/heating applications. The influence of TES with HVAC systems has inspired
many researchers to study such systems more deeply. Integrating TES with HVAC
systems has helped greatly in reducing electric bills for buildings.
Thermal energy storage is mainly used to store thermal energy during periods of
low electric tariffs. Then, during periods of high electric tariffs, the stored energy is
used to cool a space, based on the stored temperature. One prospective technique of
storing thermal energy is by using phase change materials (PCMs). Thermal energy
systems use PCMs as the storage materials or media for storage purposes. It is reported
by Zalba [5] that over 150 materials are used in research as PCMs for TES systems,
while only 45 materials are commercially utilized.
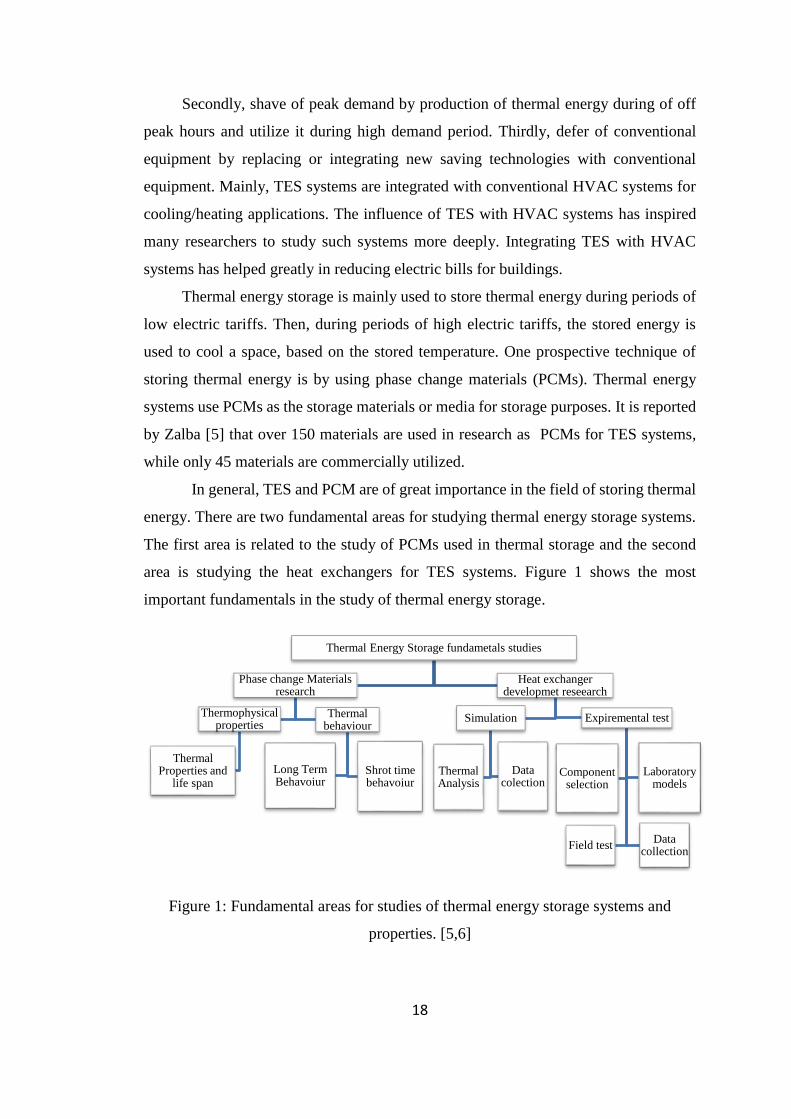
In general, TES and PCM are of great importance in the field of storing thermal
energy. There are two fundamental areas for studying thermal energy storage systems.
The first area is related to the study of PCMs used in thermal storage and the second
area is studying the heat exchangers for TES systems. Figure 1 shows the most
important fundamentals in the study of thermal energy storage.
Figure 1: Fundamental areas for studies of thermal energy storage systems and
properties. [5,6]
Thermal Energy Storage fundametals studies
Phase change Materials research
Thermophysical properties
Thermal Properties and
life span
Thermal behaviour
Long Term Behavoiur
Shrot time behavoiur
Heat exchanger developmet reseearch
Simulation
Thermal Analysis
Data colection
Expiremental test
Component selection
Laboratory models
Field testData
collection
19
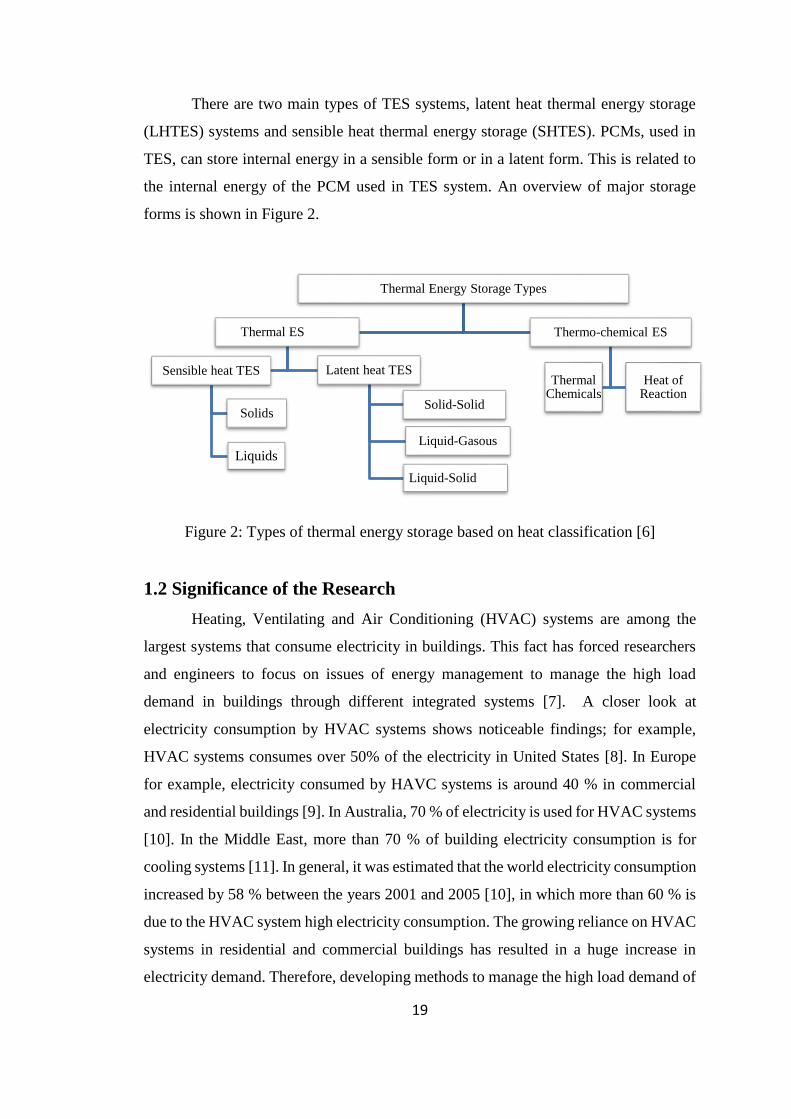
There are two main types of TES systems, latent heat thermal energy storage
(LHTES) systems and sensible heat thermal energy storage (SHTES). PCMs, used in
TES, can store internal energy in a sensible form or in a latent form. This is related to
the internal energy of the PCM used in TES system. An overview of major storage
forms is shown in Figure 2.
Figure 2: Types of thermal energy storage based on heat classification [6]
1.2 Significance of the Research
Heating, Ventilating and Air Conditioning (HVAC) systems are among the
largest systems that consume electricity in buildings. This fact has forced researchers
and engineers to focus on issues of energy management to manage the high load
demand in buildings through different integrated systems [7]. A closer look at
electricity consumption by HVAC systems shows noticeable findings; for example,
HVAC systems consumes over 50% of the electricity in United States [8]. In Europe
for example, electricity consumed by HAVC systems is around 40 % in commercial
and residential buildings [9]. In Australia, 70 % of electricity is used for HVAC systems
[10]. In the Middle East, more than 70 % of building electricity consumption is for
cooling systems [11]. In general, it was estimated that the world electricity consumption
increased by 58 % between the years 2001 and 2005 [10], in which more than 60 % is
due to the HVAC system high electricity consumption. The growing reliance on HVAC
systems in residential and commercial buildings has resulted in a huge increase in
electricity demand. Therefore, developing methods to manage the high load demand of
Thermal Energy Storage Types
Thermal ES
Sensible heat TES
Solids
Liquids
Latent heat TES
Liquid-Gasous
Liquid-Solid
Solid-Solid
Thermo-chemical ES
Thermal Chemicals
Heat of Reaction
20
HVAC systems will result in huge savings in electrical power consumed by HVAC
systems.
Some methods are implemented to reduce the high load demand of HVAC
system in buildings. One of these methods is to use thermal energy storage systems [12-
14]. Thermal energy storage systems are capable of managing the high load demanded
by HVAC systems by shifting the load demand of HVAC systems from on-peak to off-
peak periods to level the cooling load in buildings.
Thermal energy storage systems are widely used in different building
applications that are occupied during the day working hours, such as office buildings
[15], hospitals and schools , churches and mosques [16,17] . In cold thermal energy
storage systems, the energy is stored at low temperatures, usually below 10℃.
Therefore, thermal energy can be classified according to the thermal medium stored
[18]. For example, thermal storage can occur by sensible or latent storage. For sensible
thermal storage, the chilled water technique is the most used technique in thermal
storage in buildings. For the latent thermal storage, ice, ice slurry, and phase change
materials are among the most used thermal storage techniques. Clathrates hydrates of
refrigerants are considered among the phase change materials which are capable of
storing thermal energy. In this research, clathrate hydrates of refrigerants are
investigated as a storage medium for thermal storage systems. Thermal energy storage
systems with refrigerant clathrate hydrates as a storage medium plays an important role
in load management when integrated with buildings HVAC systems to manage the
cooling load.
The cooling load can be managed by using a full load thermal storage or a partial
load thermal storage. In the full load thermal storage, the compressors in the HVAC
chillers are stopped to operate in on-peak hours and the building cooling demand is
supplied from the thermal storage system. In the partial thermal storage, the load is
shared between the chillers and the thermal storage system. Compared to conventional
HVAC systems, HVAC using the thermal storage technique offers various advantages
such as electricity managements, cost savings, system operation improvements, system
capacity extension and equipment size reduction. Therefore, this study focuses on
developing a thermal system that is capable of storing energy using clathrate hydrates
of refrigerants. The system is built and designed to investigate the effect of different
tested parameters with alternative refrigerants.
21
1.3 Literature Review
Direct cold thermal energy storage with refrigerant clathrate hydrates as a storage
medium is the main topic of this thesis. Cold thermal storage systems are of great
importance in the field of cooling and air conditioning. One of the main objectives of
this thesis is to study different refrigerants clathrate hydrate which can be used in cold
thermal energy storage systems. The importance of studying refrigerants for clathrate
hydrate lies in their ability to save thermal energy. For example, most commercial
buildings in tropical parts of the word use a tremendous amount of energy for HVAC
systems. As a result, the electricity demand increases during the day time.
Implementing direct cold thermal energy storage system with conventional air
conditioning systems helps in shifting the electricity load from day time, peak time, to
night time. This shifting is done by storing cold energy during the night and then
utilizing it when needed or during the daytime.
Clathrate hydrates are group of non-stoichiometric, ice-like crystalline
compounds formed through a combination of water molecule and CFCs molecules. It
has been proven by many researchers that many chlorofluorocarbons (CFCs),
hydroflourocarbon (HFCs) and hydro-chlorofluorocarbons (HCFCs) can combine with
water molecules to form clathrate hydrate [19-25]. During clathrate hydrate formation,
water molecules behave like a host substance while CFCs or HCFCs behave as a guest
molecule.
The common gas hydrate crystalline structures are classified into three structures:
structure s-I, structure s-II, and structure s-H, where each structure is composed of a
certain number of cavities formed by water molecules. Refrigerant clathrate hydrate
can form due to the interaction between refrigerants (i.e R134a, R22, R11, R404a,
R407c…etc) and water under a hydrate formable temperature condition (5–12 °C).
Refrigerants such as R12, R11, R21, R31, R141b, R22, R142b, R134a, R152a, and
R125 can be utilized to form refrigerant clathrate hydrate, serving as guest molecules
when contacting with water in a proper thermodynamic state.
Refrigerant clathrate hydrates are used in many applications in engineering
science. The most particular use of refrigerant clathrate hydrate is in application of
refrigeration, and air conditioning [26,27] . However, applications with CFCs are
restricted due to environmental issues.
22
The advantage of using clathrate hydrates in application such as air conditioning
and refrigeration is their ability to freeze at a temperature higher than water freezing
temperature. Furthermore, refrigerant clathrate hydrates are used in the water
desalination and treatment application. These applications use clathrate hydrate because
only water can form clathrate hydrate at ambient temperature and atmospheric pressure
[28]. Cold thermal energy storage system with refrigerant clathrate hydrates is
integrated with buildings air conditioning systems (or what is known as buildings’
chiller) to use the night surplus electric power to store thermal energy for daytime use
[29].
Thermal storage systems using ice as a storage medium are integrated with
HVAC systems which show a remarkable progress in load management due to their
latent heat of fusion [30-33]. However, the ice manufacturing process for thermal
storage requires a unique unit to achieve temperature below the freezing of ice.
Therefore, storing thermal energy with temperature higher than the ice freezing point
is a promising technology for managing the on-peak and off-peak cooling load demand
of HVAC systems. Clathrate hydrates with thermal energy storage system have been
demonstrated to be the most promising candidates for managing cooling load in HVAC
systems [34,35]. Clathrate hydrate, or refrigerant hydrate, with a latent heat of fusion
similar to that of ice, could be used as a storage medium for thermal energy systems.
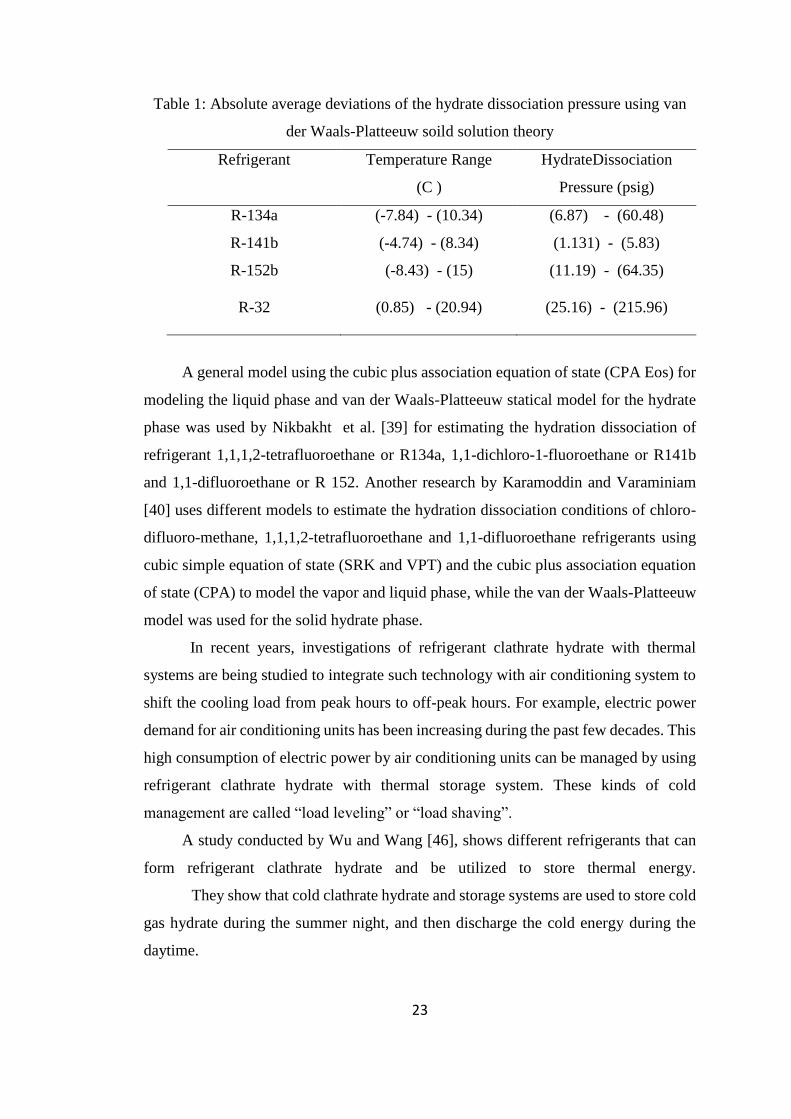
Studying the behavior of refrigerant clathrate hydrates of HFCs and HCFCs is
important to predict models and to generate comprehensive experimental data for these
clathrate hydrates. Some research [24,36-38] are used to propose different model to
predict the formation conditions of refrigerant clathrate hydrate. A thermodynamics
model using the van der Waals and Platteeuw soild solution theory was used by
Eslamimanesh et al. [28] to model the phase equilibrium of clathrate hydrates of
refrigerant. They use a thermodynamic model (van der Waals-Platteeuw soild solution
theory) for modeling phase equilibrium conditions of refrigerants R134a, R152a, R32,
and R141b. The results of their model are compared to experimental data. By using the
proposed method of dissociation pressure and temperature, they obtained to the results
summarized in Table 1.
23
Table 1: Absolute average deviations of the hydrate dissociation pressure using van
der Waals-Platteeuw soild solution theory
Refrigerant Temperature Range
(C )
HydrateDissociation
Pressure (psig)
R-134a (-7.84) - (10.34) (6.87) - (60.48)
R-141b (-4.74) - (8.34) (1.131) - (5.83)
R-152b (-8.43) - (15) (11.19) - (64.35)
R-32 (0.85) - (20.94) (25.16) - (215.96)
A general model using the cubic plus association equation of state (CPA Eos) for
modeling the liquid phase and van der Waals-Platteeuw statical model for the hydrate
phase was used by Nikbakht et al. [39] for estimating the hydration dissociation of
refrigerant 1,1,1,2-tetrafluoroethane or R134a, 1,1-dichloro-1-fluoroethane or R141b
and 1,1-difluoroethane or R 152. Another research by Karamoddin and Varaminiam
[40] uses different models to estimate the hydration dissociation conditions of chloro-
difluoro-methane, 1,1,1,2-tetrafluoroethane and 1,1-difluoroethane refrigerants using
cubic simple equation of state (SRK and VPT) and the cubic plus association equation
of state (CPA) to model the vapor and liquid phase, while the van der Waals-Platteeuw
model was used for the solid hydrate phase.
In recent years, investigations of refrigerant clathrate hydrate with thermal
systems are being studied to integrate such technology with air conditioning system to
shift the cooling load from peak hours to off-peak hours. For example, electric power
demand for air conditioning units has been increasing during the past few decades. This
high consumption of electric power by air conditioning units can be managed by using
refrigerant clathrate hydrate with thermal storage system. These kinds of cold
management are called “load leveling” or “load shaving”.
A study conducted by Wu and Wang [46], shows different refrigerants that can
form refrigerant clathrate hydrate and be utilized to store thermal energy.
They show that cold clathrate hydrate and storage systems are used to store cold
gas hydrate during the summer night, and then discharge the cold energy during the
daytime.
24
They further investigate cold clathrate hydrate of refrigerant R134a with some
additives. They concludes that the magnitude of the heat formation of refrigerants
R134a and R141b clathrate hydrate are estimated to have a little difference from the
heat formation of refrigerant R12 and R11 clathrate hydrate. They show that the degree
of sub-cooling decreases when adding additives. They further show that the formation
rate of clathrate hydrate is greatly accelerated by adding reasonable proportions of the
additives. The results summarized by Jianghong et al. show that adding additives with
the storage medium helps the dissolution rate of clathrate hydrate to accelerate, causing
an increased release rate of the cold energy stored. The influence of different additives
such as calcium hypochlorite or benzenesulfonic acid on the dissolution process of
clathrate hydrate is studied more by Bi et al. [41].
Another study was conducted by Mori and Mori [42] to reveal the physical
process of clathrate hydrate formation in the storage tank built-in vapor compression
refrigeration cycle. Mori et al use refrigerant R12 as a working fluid that flows into a
storage tank (heat exchanger) where refrigerant R12 and water are filled in a liquid
state. Their experiment results in a cooling of the stored fluids (R12 and water) in the
heat exchanger and then formation of R12 refrigerant clathrate hydrate as a cooled
storage medium. They conclude their experiments by observing that clathrate hydrate
appears in two different forms, making separate layers in the heat exchanger. The two
separate layers are: one in the form of slurry particles appears at the bottom of the heat
exchanger, and one as floating foam on the free surface of the water phase inside the
heat exchanger.
Studies such as Bi et al. [41] and McCormack [43] conducted detailed
comparison direct contact thermal energy storage and indirect contact thermal energy
storage. The results of their research are summarized in Table 2. Another study by
Abdullah A. K. et al. [44] studies the growth rate of gas hydrate for refrigerant R22.
Their test is made in a direct contact heat transfer crystallizer. They aim to investigate
the three phases (vapor, liquid, and soild) of hydrate R22 in the direct heat transfer
crystiliser. Abdullah’s et al paper shows a numerical and experimental formation rate
of gas hydrate in the crystallizer. The experimental parameters used are different initial
temperature,different initial column height,different initial R22 drop diameter, and
different R12 flow rates.
25
Table 2: Comparison between charging process of direct contact and indirect contact
thermal energy storage systems
System mode Advantage Disadvantage
Charging
process for
direct contact
TES
-High heat transfer performance
between the PCM and refrigerant used
-High temperature returning to the
compressor
-Indirect evaporator (heat exchanger) is
not needed.
-Low energy consumed by compressor
-Oil separator is needed
-Filters are needed to dry
any pass of water vapor to
compressor
Charging
process for
indirect contact
TES
-Filters are not needed since the water
in evaporator is separated from the
refrigerant
-Oil separator is not needed
- Regular refrigeration cycle
-Regular compressor needed
-Evaporator heat
exchanger is needed.
- Relatively poor heat
transfer between the
water and refrigerant.
The results of their research shows an increase of clathrate hydrate with time
and with the varation of the following parameters: First, by decrease in the initial
temperature difference between the continous phase and R22 refrigerant drops. Second,
by deacrease in the initial water level in the column. Third, by increase in the flow rate
of refrigerant R22 drops. They further, concludes that adding additives such as active
sodium chloride into the water has a storage inhibitting effect on the gas hydrate
formation rate.
A study by Thonwik et al. [45] observe clathrate hydrates during ice formation
between carbon dioxide and water in direct contact with a heat tank. The experiment is
divided into two parts; For the first part, the carbon dioxide is mixed with water at a
temperature of -15 to -60 ℃, and water temperature of 28℃ to exchange heat directly.
The flow rate of carbon dioxide varies between 0.18 and 1 kg/min, while the volume of
water is between 1 and 3 L.
While conducting the experiment, it is found that the effectiveness of the direct
contact heat transfer between the carbon dioxide and the water is close to 100%. For
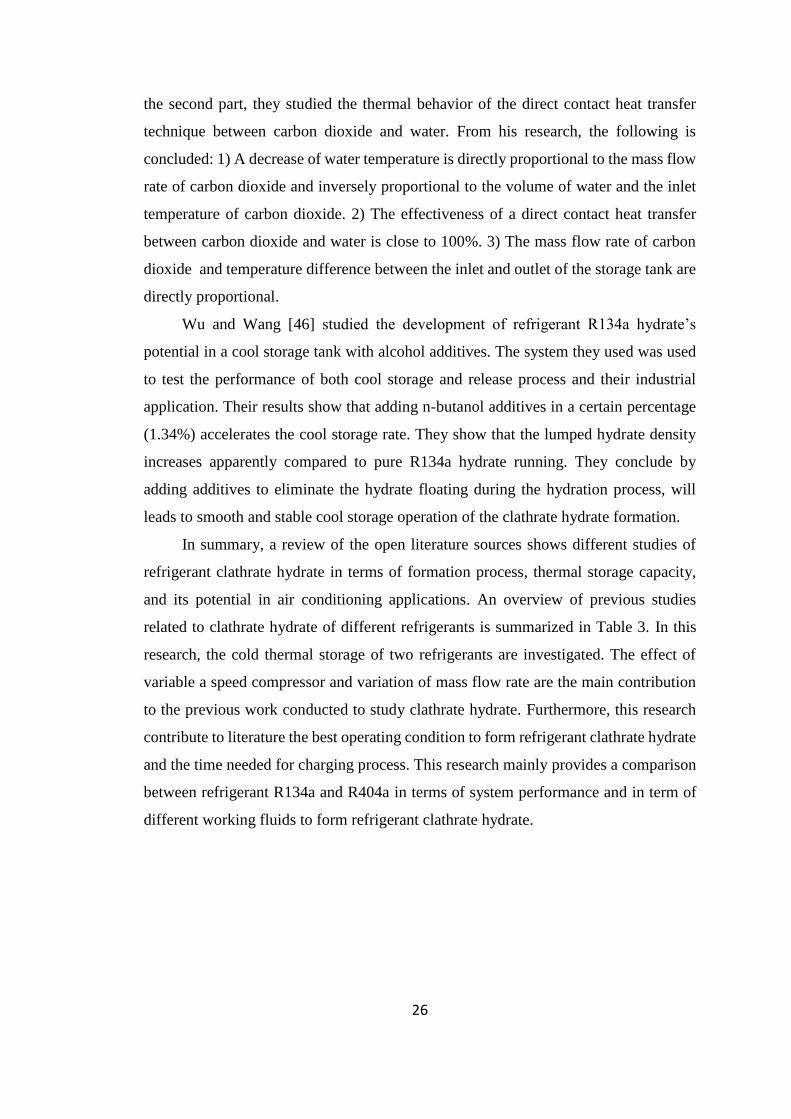
26
the second part, they studied the thermal behavior of the direct contact heat transfer
technique between carbon dioxide and water. From his research, the following is
concluded: 1) A decrease of water temperature is directly proportional to the mass flow
rate of carbon dioxide and inversely proportional to the volume of water and the inlet
temperature of carbon dioxide. 2) The effectiveness of a direct contact heat transfer
between carbon dioxide and water is close to 100%. 3) The mass flow rate of carbon
dioxide and temperature difference between the inlet and outlet of the storage tank are
directly proportional.
Wu and Wang [46] studied the development of refrigerant R134a hydrate’s
potential in a cool storage tank with alcohol additives. The system they used was used
to test the performance of both cool storage and release process and their industrial
application. Their results show that adding n-butanol additives in a certain percentage
(1.34%) accelerates the cool storage rate. They show that the lumped hydrate density
increases apparently compared to pure R134a hydrate running. They conclude by
adding additives to eliminate the hydrate floating during the hydration process, will
leads to smooth and stable cool storage operation of the clathrate hydrate formation.
In summary, a review of the open literature sources shows different studies of
refrigerant clathrate hydrate in terms of formation process, thermal storage capacity,
and its potential in air conditioning applications. An overview of previous studies
related to clathrate hydrate of different refrigerants is summarized in Table 3. In this
research, the cold thermal storage of two refrigerants are investigated. The effect of
variable a speed compressor and variation of mass flow rate are the main contribution
to the previous work conducted to study clathrate hydrate. Furthermore, this research
contribute to literature the best operating condition to form refrigerant clathrate hydrate
and the time needed for charging process. This research mainly provides a comparison
between refrigerant R134a and R404a in terms of system performance and in term of
different working fluids to form refrigerant clathrate hydrate.
27
Table 3: Overview of previous studies related to cold storage system with different
refrigerants
Author Ref Method used Technique Report Results
Eslamimanesh
et al.
[28]
R134a,
R152a,
R32,
R141b
Theoretical
Modeling
Van der
Waals-
Platteeuw
Soild
Solution
theory
Results shows that the
thermodynamic model well
predict the experimental data
in [24]
Bi et al.
[41]
R141b Experimental
Research with
Additives
Cold storage
system
Research shows that the
dissolution rate of gas
hydrate accelerated, and cold
energy released rate of cool
storage system increase with
additives
Kendoush et al.
[44]
R12 Experimental
Research
Direct
transfer heat
exchanger
Results shows that the
clathrate hydrate of R12 will
increase with time during the
charging process and with
variation of flow rate of R12
Wu and Wang
[46]
R134a Experimental
Research
with
Additives
Cold storage
System
Results shows that the degree
of sub-cool decrease when
adding additives. Adding
additives helps dissolution
rate of cold storage to
accelerate
Xie et al.
[47]
R141b Experimental
Research
Cold storage
Apparatus
Research shows that
decreasing of the coolant
temperature and increasing
the coolant flow rate increase
the cold energy
28
1.4 Research Methodology
Different types of refrigerants used to form clathrate hydrate for cold thermal
energy storage systems are discussed within this investigation. Experimental and
theoretical studies are conducted to evaluate the performance of the direct storage
system with different refrigerants at different parameters. A literature survey on direct
thermal energy storage system is first collected. Different available resources related to
clathrate hydrate are studied to understand the energy stored in direct thermal energy
storage system with alternative refrigerants. The energy stored with different
refrigerants is then modeled thermodynamically. The theoretical analysis mainly
focuses on the first and second law of thermodynamics. Once the theoretical analysis is
conducted, experimental tests are conducted to verify the theoretical results obtained
using refrigerant properties. The main tools to evaluate the thermal energy system with
different refrigerants hydrate are the energy and the exergy analysis. Both energy and
exergy analyses are used to study the effect of different parameters on the overall
performance of the system. Variable parameters such as compressor speed and
refrigerant mass flow rate are used to study the effect of each on the overall performance
of the storage process.
1.5 Objective and Scope
Recent research shows that phase change materials (PCMs) are considered to be a
good candidate for storing thermal energy. Water in particular is considered to be the
most effective thermal carrier due to its high latent heat of fusion. Therefore, this thesis
mainly studies a comparison between refrigerant R134a and R404a in direct cold
thermal energy storage (CTES) to form refrigerant clathrate hydrate as a storage
medium. Within the research, a thermal energy storage apparatus is designed and built
to investigate different clathrate hydrates of refrigerants for direct thermal storage.
Thermodynamic assessments are conducted to study different refrigerants with storage
systems. The apparatus used for direct cold storage was designed to work under
different speeds by using a variable speed drive. It was also designed to work with
different refrigerants. Furthermore, the apparatus is capable of operating in single stage
and multi stage direct storage. It consists of a direct contact storage tank, variable speed
compressor, manual expansion valve, and water-cooled condenser.
29
This research mainly focuses on using a single stage direct storage system with
different refrigerants. Furthermore, this research compares between clathrate formation
of refrigerant R134a and refrigerant R404a.
Thermodynamics assessment for different refrigerants are studied and analyzed
in order to find the best control/operating strategy in terms of heat transfer fluid inlet
temperature, refrigerant mass flow rate, and energy / exergy efficiencies to achieve high
storage performance.
Various experimental and theoretical parametric studies are carried out for
different refrigerants and the results are discussed. The goals of these experiments are
1) to verify the mathematical equations used to model the thermal storage system
experientially, 2) to determine the conditions under which clathrate hydrate formed for
the tested refrigerants, 3) to study the characteristics of the system while forming
different clathrate hydrates, and 4) to study the time at which clathrate formed.
Parametric studies are carried out for the storage system to investigate the effect
of the selected parameters on the behavior of the storage system. The studied parameters
used are the mass of water, mass flow rate of refrigerant, compressor speed and type of
refrigerant. The working principles of the charging process of the thermal energy
storage system are also studied under different operating parameters.
The outcome of this investigation includes a detailed analysis of the amount of
cold energy stored, the mass of clathrate hydrate forms of different refrigerants, the
overall temperature distribution inside the storage tanks during the cold storage process,
the effect of compressor speed on the performance of the system, the characteristics of
refrigerant R134a as a working fluid and refrigerant R404a as a working fluid.
The scope of this research involves studying different refrigerants at different
operating conditions. The first and second laws of thermodynamics analysis are used
as a tool to investigate the performance of each refrigerant within the thermal storage
system. Different parametric studies are conducted and the best operating condition is
chosen for high performance and low exergy destruction.
30
1.6 Problem Statement
Managing the electricity consumption of a building’s HVAC systems is
becoming increasingly important due to the increase in demand of heating and cooling
and due to the environmental impacts caused by conventional fuels. Therefore, finding
novel systems to manage cooling load in buildings without affecting indoor air quality
is an ongoing research topic. One way of achieving load management in HVAC systems
is to design thermal energy storage systems that can be integrated with an existing
HVAC system. Every thermal storage system has specific design requirements and each
presents opportunities for load management. Load management in HVAC systems can
be achieved by designing thermal storage systems that are capable of integrating with
HVAC systems to make more use of load leveling. Recent research has demonstrated
that a combination of thermal storage technologies can offer effective solutions for load
management and thermal comfort. Therefore, the topic of this research aims to develop
a design of a cold thermal energy storage system using clathrate hydrates of refrigerants
as a storage medium. Developing a thermal system with clathrate hydrates of
refrigerants as a cooling medium for thermal energy storage systems is the main topic
of this research. The design of the direct system discussed within this research can help
in reducing the high consumption of HVAC systems and level the load at on-peak
hours.
1.7 Thesis Organization
This thesis is divided into six chapters through which they evaluate the
performance of the thermal energy storage system used to conduct the tests for different
refrigerant hydrates. The first chapter provides a general background about thermal
storage systems and the importance of such technologies. Survey of previous work
related to thermal storage system and clathrate hydrates of refrigerants are discussed in
first chapter. Furthermore, the objective and methodology of the research is presented
in this chapter. Chapter 2 provides a classification of thermal energy storage systems.
Some sections in Chapter 2 discuss indirect contact thermal storage system (Ice TES
systems) and compare them to direct contact thermal energy storage system (Clathrate
hydrate TES system). More related information such as phase change materials
descriptions and applications are discussed in this chapter.
31
Chapter 3 shows the mathematical model of the direct thermal energy storage
system built to conduct the experiments. The modeling of the components mainly
focuses on the direct storage tank and the compressor of the thermal system. Chapter 4
provides a brief discussion of the experimental test components used in conducting the
experimental results. All the components used in the testing lab to conduct the
experiments are described in details in this chapter. The main results and analysis for
thermal energy storage system with clathrate hydrate are summarized in chapter 5. All
the obtained results for the system with the tested parameters of R134a and R 404a are
represented and compared in Chapter 5. The last chapter in this thesis, Chapter 6,
presents the conclusion and the recommendations of the research.
32
Chapter 2: Thesis Background
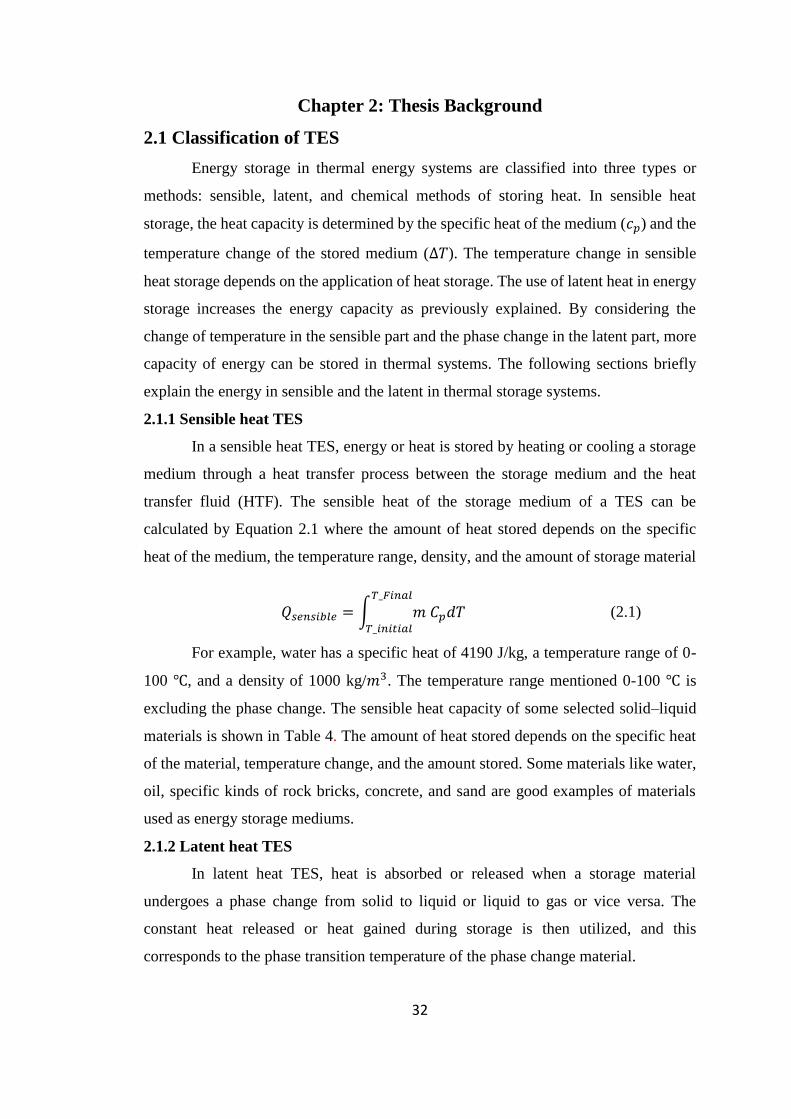
2.1 Classification of TES
Energy storage in thermal energy systems are classified into three types or
methods: sensible, latent, and chemical methods of storing heat. In sensible heat
storage, the heat capacity is determined by the specific heat of the medium (𝑐𝑝) and the
temperature change of the stored medium (∆𝑇). The temperature change in sensible
heat storage depends on the application of heat storage. The use of latent heat in energy
storage increases the energy capacity as previously explained. By considering the
change of temperature in the sensible part and the phase change in the latent part, more
capacity of energy can be stored in thermal systems. The following sections briefly
explain the energy in sensible and the latent in thermal storage systems.
2.1.1 Sensible heat TES
In a sensible heat TES, energy or heat is stored by heating or cooling a storage
medium through a heat transfer process between the storage medium and the heat
transfer fluid (HTF). The sensible heat of the storage medium of a TES can be
calculated by Equation 2.1 where the amount of heat stored depends on the specific
heat of the medium, the temperature range, density, and the amount of storage material
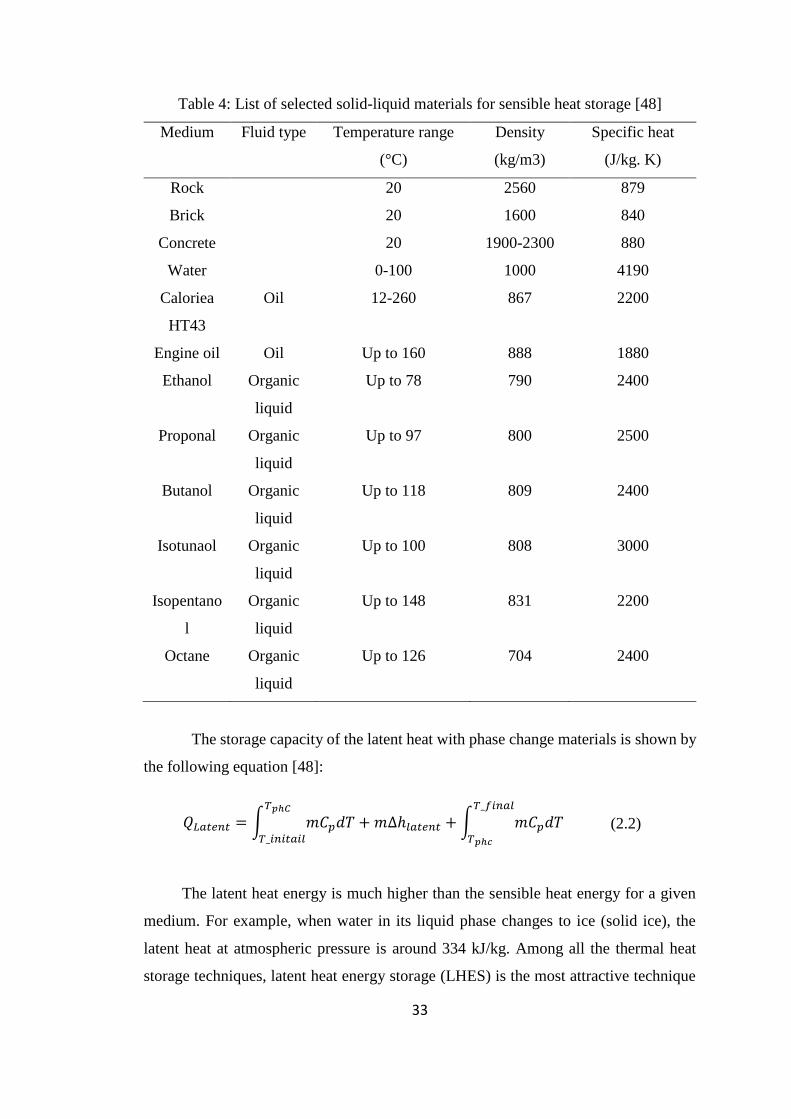
For example, water has a specific heat of 4190 J/kg, a temperature range of 0-
100 ℃, and a density of 1000 kg/𝑚3. The temperature range mentioned 0-100 ℃ is
excluding the phase change. The sensible heat capacity of some selected solid–liquid
materials is shown in Table 4. The amount of heat stored depends on the specific heat
of the material, temperature change, and the amount stored. Some materials like water,
oil, specific kinds of rock bricks, concrete, and sand are good examples of materials
used as energy storage mediums.
2.1.2 Latent heat TES
In latent heat TES, heat is absorbed or released when a storage material
undergoes a phase change from solid to liquid or liquid to gas or vice versa. The
constant heat released or heat gained during storage is then utilized, and this
corresponds to the phase transition temperature of the phase change material.
𝑄𝑠𝑒𝑛𝑠𝑖𝑏𝑙𝑒 = ∫ 𝑚 𝐶𝑝𝑑𝑇𝑇_𝐹𝑖𝑛𝑎𝑙
𝑇_𝑖𝑛𝑖𝑡𝑖𝑎𝑙
(2.1)
33
Table 4: List of selected solid-liquid materials for sensible heat storage [48]
Medium Fluid type Temperature range
(°C)
Density
(kg/m3)
Specific heat
(J/kg. K)
Rock 20 2560 879
Brick 20 1600 840
Concrete 20 1900-2300 880
Water 0-100 1000 4190
Caloriea
HT43
Oil 12-260 867 2200
Engine oil Oil Up to 160 888 1880
Ethanol Organic
liquid
Up to 78 790 2400
Proponal Organic
liquid
Up to 97 800 2500
Butanol Organic
liquid
Up to 118 809 2400
Isotunaol Organic
liquid
Up to 100 808 3000
Isopentano
l
Organic
liquid
Up to 148 831 2200
Octane Organic
liquid
Up to 126 704 2400
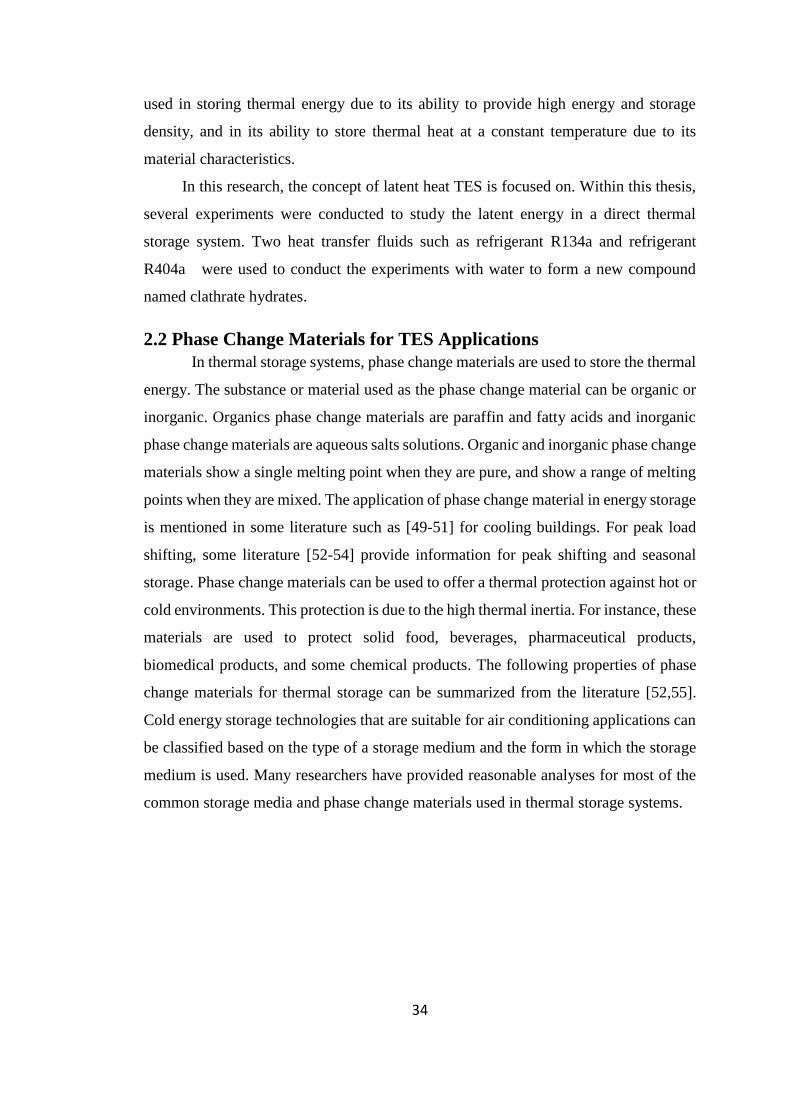
The storage capacity of the latent heat with phase change materials is shown by
the following equation [48]:
The latent heat energy is much higher than the sensible heat energy for a given
medium. For example, when water in its liquid phase changes to ice (solid ice), the
latent heat at atmospheric pressure is around 334 kJ/kg. Among all the thermal heat
storage techniques, latent heat energy storage (LHES) is the most attractive technique
𝑄𝐿𝑎𝑡𝑒𝑛𝑡 = ∫ 𝑚𝐶𝑝𝑑𝑇𝑇𝑝ℎ𝐶
𝑇_𝑖𝑛𝑖𝑡𝑎𝑖𝑙
+𝑚∆ℎ𝑙𝑎𝑡𝑒𝑛𝑡 +∫ 𝑚𝐶𝑝𝑑𝑇𝑇_𝑓𝑖𝑛𝑎𝑙
𝑇𝑝ℎ𝑐
(2.2)
34
used in storing thermal energy due to its ability to provide high energy and storage
density, and in its ability to store thermal heat at a constant temperature due to its
material characteristics.
In this research, the concept of latent heat TES is focused on. Within this thesis,
several experiments were conducted to study the latent energy in a direct thermal
storage system. Two heat transfer fluids such as refrigerant R134a and refrigerant
R404a were used to conduct the experiments with water to form a new compound
named clathrate hydrates.
2.2 Phase Change Materials for TES Applications
In thermal storage systems, phase change materials are used to store the thermal
energy. The substance or material used as the phase change material can be organic or
inorganic. Organics phase change materials are paraffin and fatty acids and inorganic
phase change materials are aqueous salts solutions. Organic and inorganic phase change
materials show a single melting point when they are pure, and show a range of melting
points when they are mixed. The application of phase change material in energy storage
is mentioned in some literature such as [49-51] for cooling buildings. For peak load
shifting, some literature [52-54] provide information for peak shifting and seasonal
storage. Phase change materials can be used to offer a thermal protection against hot or
cold environments. This protection is due to the high thermal inertia. For instance, these
materials are used to protect solid food, beverages, pharmaceutical products,
biomedical products, and some chemical products. The following properties of phase
change materials for thermal storage can be summarized from the literature [52,55].
Cold energy storage technologies that are suitable for air conditioning applications can
be classified based on the type of a storage medium and the form in which the storage
medium is used. Many researchers have provided reasonable analyses for most of the
common storage media and phase change materials used in thermal storage systems.
35
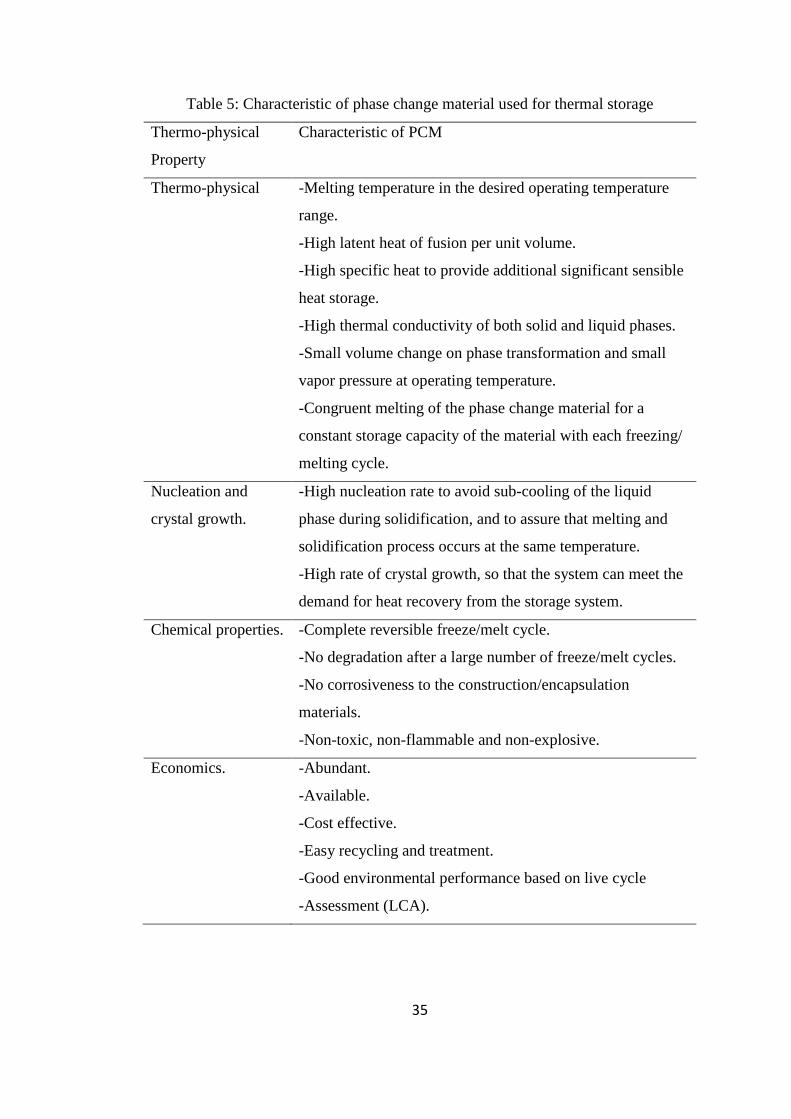
Table 5: Characteristic of phase change material used for thermal storage
Thermo-physical
Property
Characteristic of PCM
Thermo-physical -Melting temperature in the desired operating temperature
range.
-High latent heat of fusion per unit volume.
-High specific heat to provide additional significant sensible
heat storage.
-High thermal conductivity of both solid and liquid phases.
-Small volume change on phase transformation and small
vapor pressure at operating temperature.
-Congruent melting of the phase change material for a
constant storage capacity of the material with each freezing/
melting cycle.
Nucleation and
crystal growth.
-High nucleation rate to avoid sub-cooling of the liquid
phase during solidification, and to assure that melting and
solidification process occurs at the same temperature.
-High rate of crystal growth, so that the system can meet the
demand for heat recovery from the storage system.
Chemical properties.
-Complete reversible freeze/melt cycle.
-No degradation after a large number of freeze/melt cycles.
-No corrosiveness to the construction/encapsulation
materials.
-Non-toxic, non-flammable and non-explosive.
Economics.
-Abundant.
-Available.
-Cost effective.
-Easy recycling and treatment.
-Good environmental performance based on live cycle
-Assessment (LCA).
36
2.3 Direct Contact TES Systems
Storing thermal energy using clathrate hydrates as a storage medium has shown
great promise in cooling efficient facilities. Clathrate hydrate (or refrigerant gas
hydrate) are ice-like crystalline compounds in which small molecules are entrapped in
a cage of water molecules under high pressure and low temperature [39]. Latent heat
thermal storage with clathrate hydrates has proven the efficiency and effectiveness of
storing cold energy in direct energy storage systems. Clathrate hydrates of refrigerants
are also known as inclusion compounds formed by the inclusion of molecules of one
kind of guest substance in the cavities of the crystal lattice of another host substance
[56]. Clathrate hydrates are characterized to have a high heat of formation which makes
them ideal materials for cold storage. The density of clathrate hydrates is extremely
high; therefore it is possible for thermal systems using clathrate hydrates as a storage
medium to provide a high cooling capacity equivalent, or one that is much larger than
the conventional storage such as water/ice or chilled water storage. High density can be
considered as one of the advantages of clathrate hydrates. For clathrate hydrates of
refrigerants to be capable of thermally stored, they must be formed at an atmospheric
pressure and temperature range between 5℃ to 13℃. Clathrate hydrates are formed by
directly mixing water and refrigerants at a certain pressure and temperature. One
disadvantage of this energy technology is that the quantity of refrigerant used as a
working fluid for the refrigeration unit might decrease with the formation process of
clathrate hydrate.
The system used in this research consists of a direct thermal energy storage
system and a fan coil unit (FCU). The purpose of the FCU connected with the direct
thermal storage system is to utilize the cold energy stored. The FCU is used as a heat
exchanger with internal coils connected inside the storage tank. The internal coils are
used to discharge or melt the clathrate hydrate, cold stored material, formed. Therefore,
when the cold energy is needed, warm fluid is directed through internal discharge coils
which melt the clathrate hydrate that previously formed. As the cold storage material
melts, a boundary layer of water forms between the discharge coils and the remaining
clathrate hydrate. This separation layer causes the heat transfer between the cold
medium and the discharge coils to be through natural convection rather than
conduction.
37
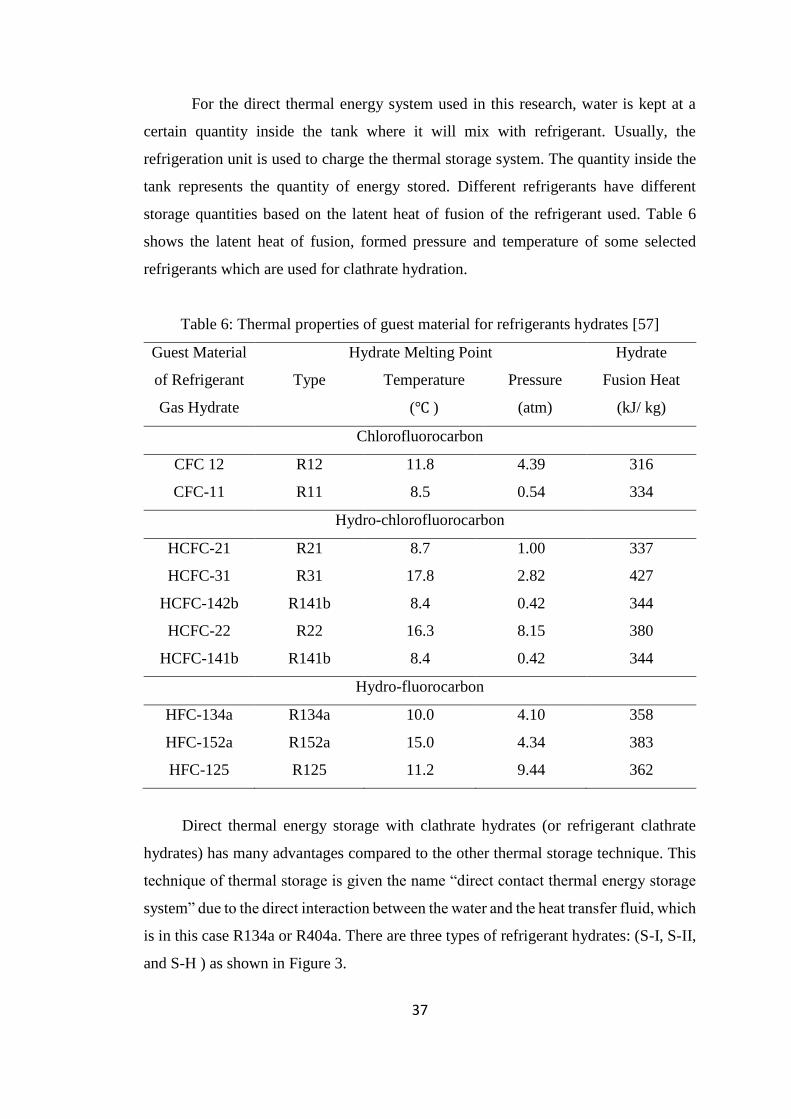
For the direct thermal energy system used in this research, water is kept at a
certain quantity inside the tank where it will mix with refrigerant. Usually, the
refrigeration unit is used to charge the thermal storage system. The quantity inside the
tank represents the quantity of energy stored. Different refrigerants have different
storage quantities based on the latent heat of fusion of the refrigerant used. Table 6
shows the latent heat of fusion, formed pressure and temperature of some selected
refrigerants which are used for clathrate hydration.
Table 6: Thermal properties of guest material for refrigerants hydrates [57]
Guest Material
of Refrigerant
Gas Hydrate
Hydrate Melting Point Hydrate
Fusion Heat
(kJ/ kg)
Type Temperature
(℃ )
Pressure
(atm)
Chlorofluorocarbon
CFC 12 R12 11.8 4.39 316
CFC-11 R11 8.5 0.54 334
Hydro-chlorofluorocarbon
HCFC-21 R21 8.7 1.00 337
HCFC-31 R31 17.8 2.82 427
HCFC-142b R141b 8.4 0.42 344
HCFC-22 R22 16.3 8.15 380
HCFC-141b R141b 8.4 0.42 344
Hydro-fluorocarbon
HFC-134a R134a 10.0 4.10 358
HFC-152a R152a 15.0 4.34 383
HFC-125 R125 11.2 9.44 362
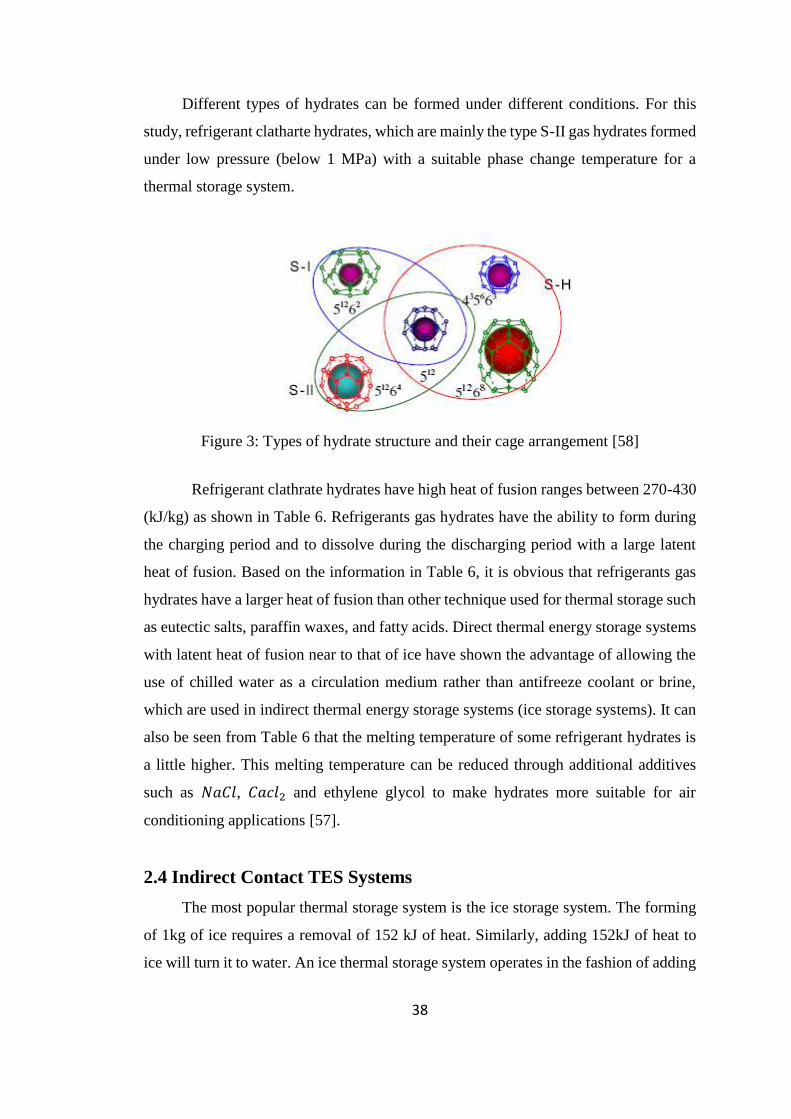
Direct thermal energy storage with clathrate hydrates (or refrigerant clathrate
hydrates) has many advantages compared to the other thermal storage technique. This
technique of thermal storage is given the name “direct contact thermal energy storage
system” due to the direct interaction between the water and the heat transfer fluid, which
is in this case R134a or R404a. There are three types of refrigerant hydrates: (S-I, S-II,
and S-H ) as shown in Figure 3.
38
Different types of hydrates can be formed under different conditions. For this
study, refrigerant clatharte hydrates, which are mainly the type S-II gas hydrates formed
under low pressure (below 1 MPa) with a suitable phase change temperature for a
thermal storage system.
Figure 3: Types of hydrate structure and their cage arrangement [58]
Refrigerant clathrate hydrates have high heat of fusion ranges between 270-430
(kJ/kg) as shown in Table 6. Refrigerants gas hydrates have the ability to form during
the charging period and to dissolve during the discharging period with a large latent
heat of fusion. Based on the information in Table 6, it is obvious that refrigerants gas
hydrates have a larger heat of fusion than other technique used for thermal storage such
as eutectic salts, paraffin waxes, and fatty acids. Direct thermal energy storage systems
with latent heat of fusion near to that of ice have shown the advantage of allowing the
use of chilled water as a circulation medium rather than antifreeze coolant or brine,
which are used in indirect thermal energy storage systems (ice storage systems). It can
also be seen from Table 6 that the melting temperature of some refrigerant hydrates is
a little higher. This melting temperature can be reduced through additional additives
such as 𝑁𝑎𝐶𝑙, 𝐶𝑎𝑐𝑙2 and ethylene glycol to make hydrates more suitable for air
conditioning applications [57].
2.4 Indirect Contact TES Systems
The most popular thermal storage system is the ice storage system. The forming
of 1kg of ice requires a removal of 152 kJ of heat. Similarly, adding 152kJ of heat to
ice will turn it to water. An ice thermal storage system operates in the fashion of adding
39
or removing heat from water. The processes of thermal energy storage will be explained
below and ice thermal storage will be studied as an example of a thermal storage system.
In the past 20 years, much efforts has been spent researching topics of thermal
energy storage and particularly latent heat thermal energy storage. Water as a storage
medium is the most commonly used phase change material for cold storage latent heat.
According to Dincer and Rosen [3], latent heat thermal energy storage has attracted an
increasing interest due to its high volumetric capacity and low heat transfer losses.
Today, there are more than 150 PCM suitable for latent energy storage, some of which
some are commercialized, while the rest are in the literature. Despite some of the
disadvantage of ice storage systems such as low melting temperature, ice storage is the
most extended period phase change material and is used for long term cold storage. Ice
storage has a; high latent heat capacity (335 kJ/kg), high specific heat, and high density.
Ice thermal storage system is usually integrated with HVAC systems for cooling
applications. During the early hours of the day, buildings require a minor cooling
capacity. During this time, the chiller of the building is used to charge the ice storage
system or in other words to form ice in the storage ice tank. Producing ice during off-
peak periods is economically an effective measure for shifting on-peak period power
demand to the off-peak nighttime hours [58]. Since the electricity price during off-peak
hours is lower than that of on-peak hours, implementing an ice storage system in the air
conditioning system is a cost-effective measure, and its application is increasing [59-
63].
Note that ice forms at a temperature of 0℃, thus a specific cooling unit are used
to achieve this low temperature. This process of forming ice is called the charging
process of the thermal system. After ice is formed, it stays for a certain period in the
storing tanks. This process is called the storing process. At noon time, when chillers
are usually run at full load, the role of the ice storage system begins. Now in buildings
where the ice storage system is integrated with HVAC systems, the full load of the
chiller is reduced and the cooling needed by the building is covered by both the HVAC
and the ice storage system systems. The process of utilizing coolness from ice storage
systems is called discharge process.
40
Chapter 3: System Modeling and Analysis
3.1 Introduction
In this section, the mathematical modeling of the main components of direct
thermal storage system is presented. The direct thermal storage system host two main
processes: charging and discharging. The charging process occur during the production
of cold energy, while the discharging process is the utilization of the stored cold energy.
To formulate the mathematical model of the system, the mass flow rate of refrigerant
is varied between 0.48 kg/min and 0.96 kg/min. The compressor is regulated by a
variable speed control varying from 2000 rpm to 3000 rpm. The mass of water in the
tank is fixed at 11kg for all experiments. The refrigerants used within this experiment
are R134a refrigerant and R404a refrigerant. The system starts by evacuating all the air
inside then inject water and liquid refrigerant to the direct storage tank. The refrigerant
is directly mixed with water to extract the heat. The pressures and temperatures are
recorded after and before all components. The temperature of the tank is measured
during the charging process with six thermocouples located at different locations
around the storage tank. After the clathrate formation inside the storage tank, the
compressor is shutdown. The cold energy is stored for some time and then utilized. A
discharging unit is used where water passes through the tank through direct copper coils
to melt the clathrate and extract the energy. The following sections discuss the modeling
of the system’s main components.
3.2 System Modeling and Assumptions
The direct thermal energy storage system is modeled using the components of
refrigeration units such as a compressor, condenser, evaporator and expansion valve.
The thermal storage system behaves like the evaporator of the refrigeration unit but it
is modeled to have a direct contact heat transfer between the refrigerant and stored load.
The following assumptions are made to model the components using the
thermodynamic properties of refrigerants:
(1) Steady state operation of the system is assumed.
(2) Efficiency of the compressor is assumed to be 80%.
(3) Heat transfer to the surrounding is assumed to be negligible.
(4) Pressure drops in connections and copper coils are assumed to be negligible.
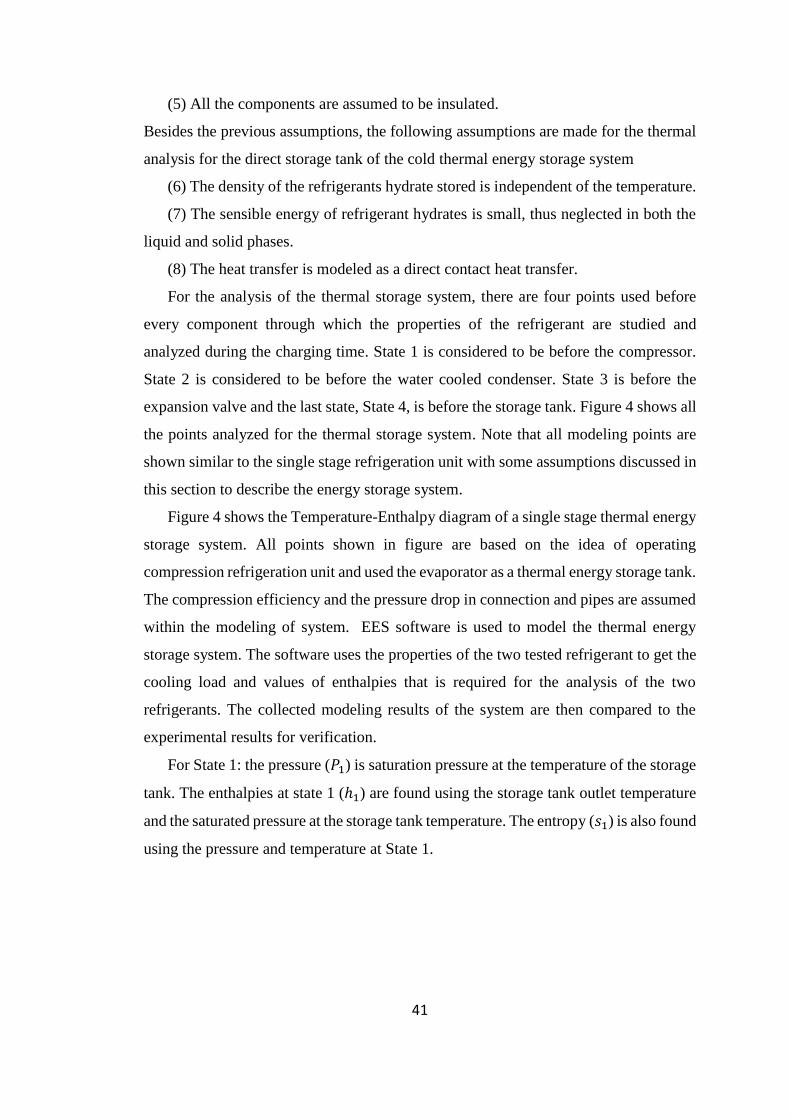
41
(5) All the components are assumed to be insulated.
Besides the previous assumptions, the following assumptions are made for the thermal
analysis for the direct storage tank of the cold thermal energy storage system
(6) The density of the refrigerants hydrate stored is independent of the temperature.
(7) The sensible energy of refrigerant hydrates is small, thus neglected in both the
liquid and solid phases.
(8) The heat transfer is modeled as a direct contact heat transfer.
For the analysis of the thermal storage system, there are four points used before
every component through which the properties of the refrigerant are studied and
analyzed during the charging time. State 1 is considered to be before the compressor.
State 2 is considered to be before the water cooled condenser. State 3 is before the
expansion valve and the last state, State 4, is before the storage tank. Figure 4 shows all
the points analyzed for the thermal storage system. Note that all modeling points are
shown similar to the single stage refrigeration unit with some assumptions discussed in
this section to describe the energy storage system.
Figure 4 shows the Temperature-Enthalpy diagram of a single stage thermal energy
storage system. All points shown in figure are based on the idea of operating
compression refrigeration unit and used the evaporator as a thermal energy storage tank.
The compression efficiency and the pressure drop in connection and pipes are assumed
within the modeling of system. EES software is used to model the thermal energy
storage system. The software uses the properties of the two tested refrigerant to get the
cooling load and values of enthalpies that is required for the analysis of the two
refrigerants. The collected modeling results of the system are then compared to the
experimental results for verification.
For State 1: the pressure (𝑃1) is saturation pressure at the temperature of the storage
tank. The enthalpies at state 1 (ℎ1) are found using the storage tank outlet temperature
and the saturated pressure at the storage tank temperature. The entropy (𝑠1) is also found
using the pressure and temperature at State 1.
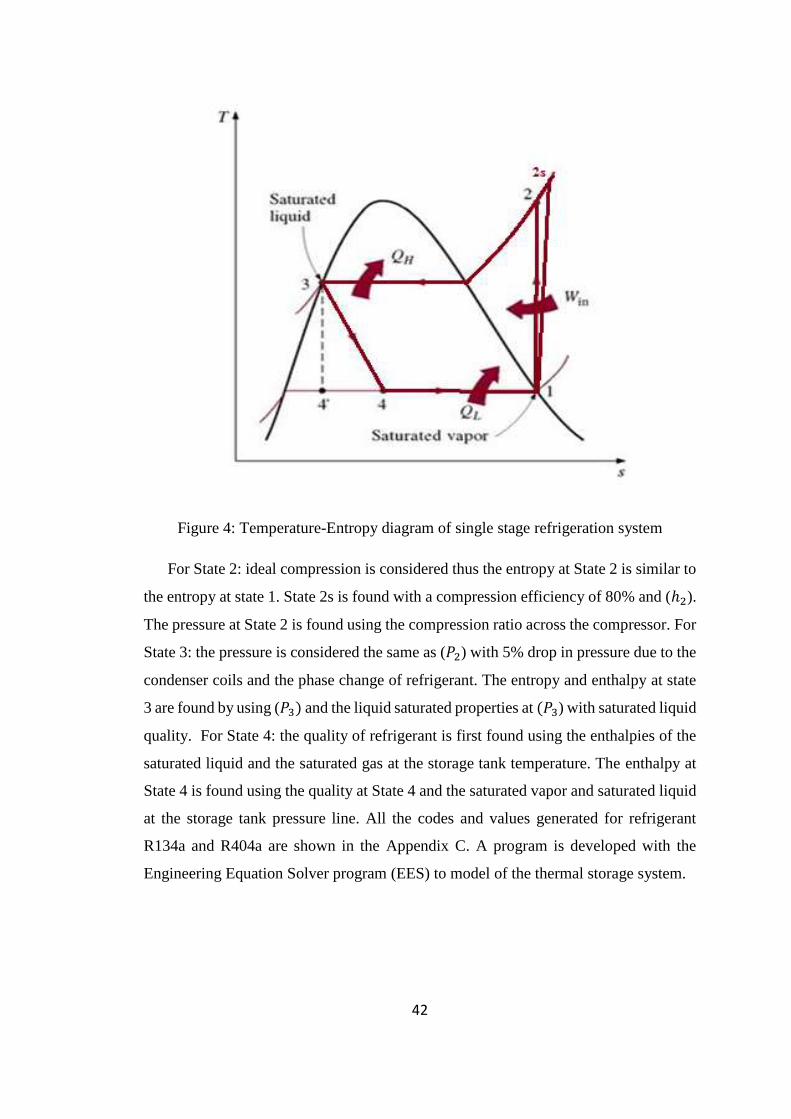
42
Figure 4: Temperature-Entropy diagram of single stage refrigeration system
For State 2: ideal compression is considered thus the entropy at State 2 is similar to
the entropy at state 1. State 2s is found with a compression efficiency of 80% and (ℎ2).
The pressure at State 2 is found using the compression ratio across the compressor. For
State 3: the pressure is considered the same as (𝑃2) with 5% drop in pressure due to the
condenser coils and the phase change of refrigerant. The entropy and enthalpy at state
3 are found by using (𝑃3) and the liquid saturated properties at (𝑃3) with saturated liquid
quality. For State 4: the quality of refrigerant is first found using the enthalpies of the
saturated liquid and the saturated gas at the storage tank temperature. The enthalpy at
State 4 is found using the quality at State 4 and the saturated vapor and saturated liquid
at the storage tank pressure line. All the codes and values generated for refrigerant
R134a and R404a are shown in the Appendix C. A program is developed with the
Engineering Equation Solver program (EES) to model of the thermal storage system.
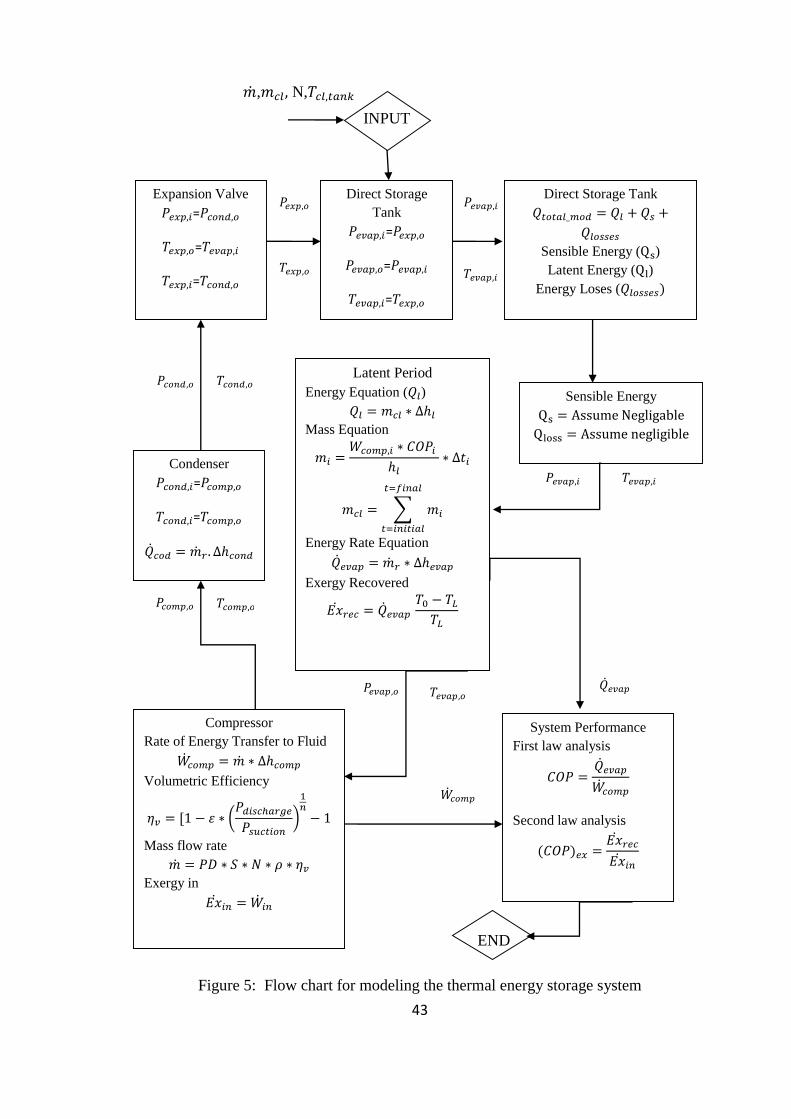
43
Figure 5: Flow chart for modeling the thermal energy storage system
�̇�,𝑚𝑐𝑙, N,𝑇𝑐𝑙,𝑡𝑎𝑛𝑘
INPUT
Sensible Energy
Qs = Assume Negligable
Qloss = Assume negligible
𝑃𝑒𝑣𝑎𝑝,𝑖
Direct Storage Tank
𝑄𝑡𝑜𝑡𝑎𝑙_𝑚𝑜𝑑 = 𝑄𝑙 + 𝑄𝑠 +
𝑄𝑙𝑜𝑠𝑠𝑒𝑠
Sensible Energy (Qs)
Latent Energy (Ql)
Energy Loses (𝑄𝑙𝑜𝑠𝑠𝑒𝑠)
𝑇𝑒𝑣𝑎𝑝,𝑖
Expansion Valve
𝑃𝑒𝑥𝑝,𝑖=𝑃𝑐𝑜𝑛𝑑,𝑜
𝑇𝑒𝑥𝑝,𝑜=𝑇𝑒𝑣𝑎𝑝,𝑖
𝑇𝑒𝑥𝑝,𝑖=𝑇𝑐𝑜𝑛𝑑,𝑜
𝑇𝑒𝑥𝑝,𝑜
𝑃𝑒𝑥𝑝,𝑜
END
System Performance
First law analysis
𝐶𝑂𝑃 =�̇�𝑒𝑣𝑎𝑝
�̇�𝑐𝑜𝑚𝑝
Second law analysis
(𝐶𝑂𝑃)𝑒𝑥 =𝐸�̇�𝑟𝑒𝑐
𝐸�̇�𝑖𝑛
Latent Period
Energy Equation (𝑄𝑙)
𝑄𝑙 = 𝑚𝑐𝑙 ∗ ∆ℎ𝑙
Mass Equation
𝑚𝑖 =𝑊𝑐𝑜𝑚𝑝,𝑖 ∗ 𝐶𝑂𝑃𝑖
ℎ𝑙∗ ∆𝑡𝑖
𝑚𝑐𝑙 = 𝑚𝑖
𝑡=𝑓𝑖𝑛𝑎𝑙
𝑡=𝑖𝑛𝑖𝑡𝑖𝑎𝑙
Energy Rate Equation
�̇�𝑒𝑣𝑎𝑝 = �̇�𝑟 ∗ ∆ℎ𝑒𝑣𝑎𝑝
Exergy Recovered
𝐸�̇�𝑟𝑒𝑐 = �̇�𝑒𝑣𝑎𝑝 𝑇0 − 𝑇𝐿𝑇𝐿
�̇�𝑒𝑣𝑎𝑝 𝑃𝑒𝑣𝑎𝑝,𝑜 𝑇𝑒𝑣𝑎𝑝,𝑜
Compressor
Rate of Energy Transfer to Fluid
�̇�𝑐𝑜𝑚𝑝 = �̇� ∗ ∆ℎ𝑐𝑜𝑚𝑝
Volumetric Efficiency
𝜂𝑣 = [1 − 𝜀 ∗ 𝑃𝑑𝑖𝑠𝑐ℎ𝑎𝑟𝑔𝑒
𝑃𝑠𝑢𝑐𝑡𝑖𝑜𝑛
1𝑛− 1
Mass flow rate
�̇� = 𝑃𝐷 ∗ 𝑆 ∗ 𝑁 ∗ 𝜌 ∗ 𝜂𝑣
Exergy in
𝐸�̇�𝑖𝑛 = �̇�𝑖𝑛
𝑃𝑐𝑜𝑚𝑝,𝑜 𝑇𝑐𝑜𝑚𝑝,𝑜
Condenser
𝑃𝑐𝑜𝑛𝑑,𝑖=𝑃𝑐𝑜𝑚𝑝,𝑜
𝑇𝑐𝑜𝑛𝑑,𝑖=𝑇𝑐𝑜𝑚𝑝,𝑜
�̇�𝑐𝑜𝑑 = �̇�𝑟 . ∆ℎ𝑐𝑜𝑛𝑑
𝑇𝑐𝑜𝑛𝑑,𝑜 𝑃𝑐𝑜𝑛𝑑,𝑜
Direct Storage
Tank
𝑃𝑒𝑣𝑎𝑝,𝑖=𝑃𝑒𝑥𝑝,𝑜
𝑃𝑒𝑣𝑎𝑝,𝑜=𝑃𝑒𝑣𝑎𝑝,𝑖
𝑇𝑒𝑣𝑎𝑝,𝑖=𝑇𝑒𝑥𝑝,𝑜
𝑇𝑒𝑣𝑎𝑝,𝑖
𝑃𝑒𝑣𝑎𝑝,𝑖
�̇�𝑐𝑜𝑚𝑝
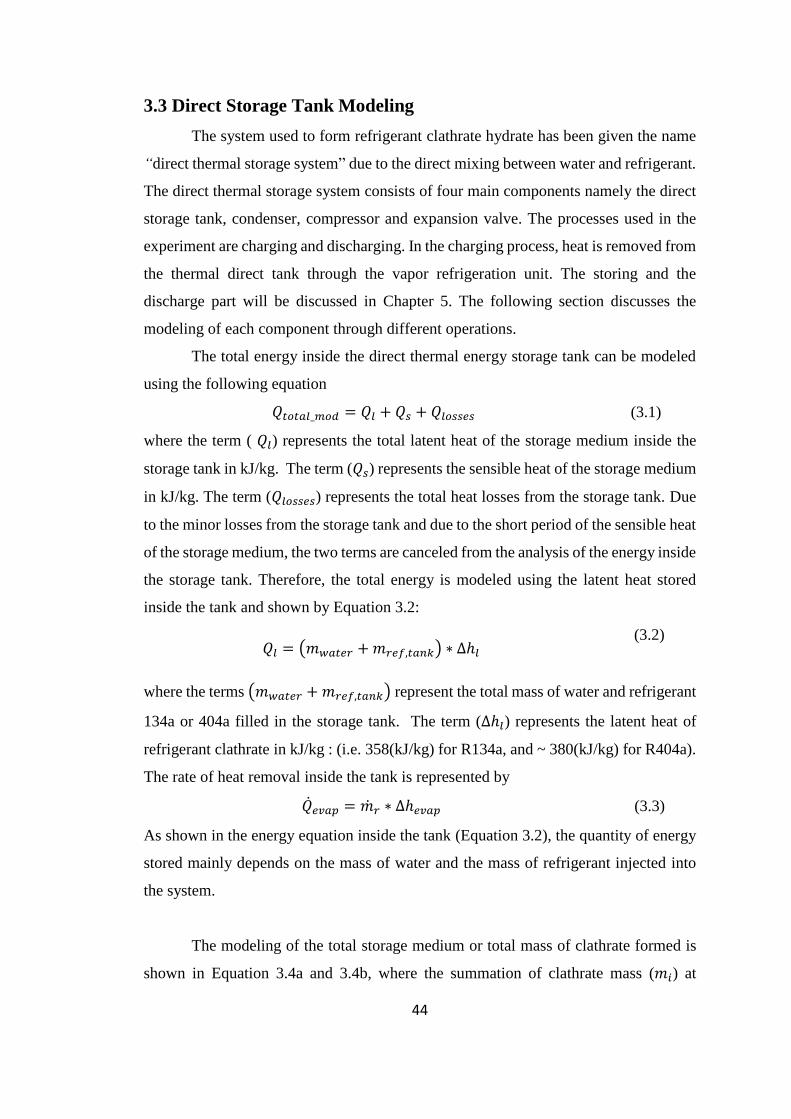
44
3.3 Direct Storage Tank Modeling
The system used to form refrigerant clathrate hydrate has been given the name
“direct thermal storage system” due to the direct mixing between water and refrigerant.
The direct thermal storage system consists of four main components namely the direct
storage tank, condenser, compressor and expansion valve. The processes used in the
experiment are charging and discharging. In the charging process, heat is removed from
the thermal direct tank through the vapor refrigeration unit. The storing and the
discharge part will be discussed in Chapter 5. The following section discusses the
modeling of each component through different operations.
The total energy inside the direct thermal energy storage tank can be modeled
using the following equation
𝑄𝑡𝑜𝑡𝑎𝑙_𝑚𝑜𝑑 = 𝑄𝑙 + 𝑄𝑠 + 𝑄𝑙𝑜𝑠𝑠𝑒𝑠 (3.1)
where the term ( 𝑄𝑙) represents the total latent heat of the storage medium inside the
storage tank in kJ/kg. The term (𝑄𝑠) represents the sensible heat of the storage medium
in kJ/kg. The term (𝑄𝑙𝑜𝑠𝑠𝑒𝑠) represents the total heat losses from the storage tank. Due
to the minor losses from the storage tank and due to the short period of the sensible heat
of the storage medium, the two terms are canceled from the analysis of the energy inside
the storage tank. Therefore, the total energy is modeled using the latent heat stored
inside the tank and shown by Equation 3.2:
𝑄𝑙 = (𝑚𝑤𝑎𝑡𝑒𝑟 +𝑚𝑟𝑒𝑓,𝑡𝑎𝑛𝑘) ∗ ∆ℎ𝑙 (3.2)
where the terms (𝑚𝑤𝑎𝑡𝑒𝑟 +𝑚𝑟𝑒𝑓,𝑡𝑎𝑛𝑘) represent the total mass of water and refrigerant
134a or 404a filled in the storage tank. The term (∆ℎ𝑙) represents the latent heat of
refrigerant clathrate in kJ/kg : (i.e. 358(kJ/kg) for R134a, and ~ 380(kJ/kg) for R404a).
The rate of heat removal inside the tank is represented by
�̇�𝑒𝑣𝑎𝑝 = �̇�𝑟 ∗ ∆ℎ𝑒𝑣𝑎𝑝 (3.3)
As shown in the energy equation inside the tank (Equation 3.2), the quantity of energy
stored mainly depends on the mass of water and the mass of refrigerant injected into
the system.
The modeling of the total storage medium or total mass of clathrate formed is
shown in Equation 3.4a and 3.4b, where the summation of clathrate mass (𝑚𝑖) at
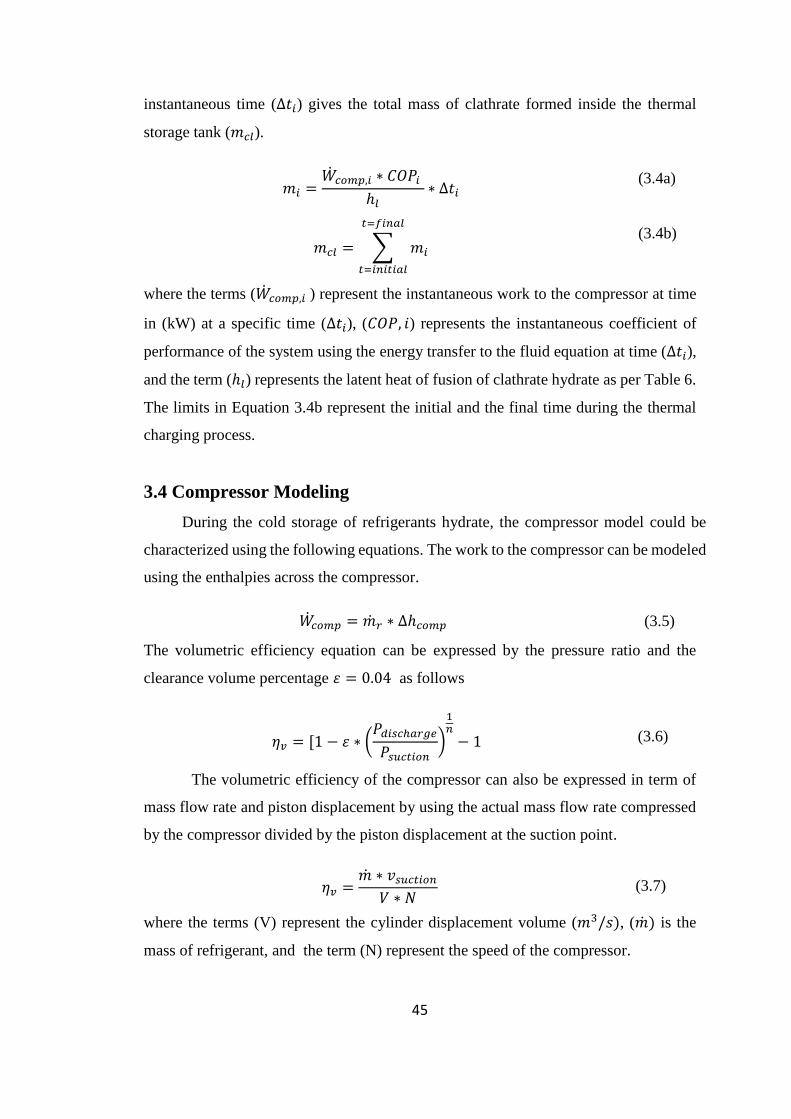
45
instantaneous time (∆𝑡𝑖) gives the total mass of clathrate formed inside the thermal
storage tank (𝑚𝑐𝑙).
where the terms (�̇�𝑐𝑜𝑚𝑝,𝑖 ) represent the instantaneous work to the compressor at time
in (kW) at a specific time (∆𝑡𝑖), (𝐶𝑂𝑃, 𝑖) represents the instantaneous coefficient of
performance of the system using the energy transfer to the fluid equation at time (∆𝑡𝑖),
and the term (ℎ𝑙) represents the latent heat of fusion of clathrate hydrate as per Table 6.
The limits in Equation 3.4b represent the initial and the final time during the thermal
charging process.
3.4 Compressor Modeling
During the cold storage of refrigerants hydrate, the compressor model could be
characterized using the following equations. The work to the compressor can be modeled
using the enthalpies across the compressor.
The volumetric efficiency equation can be expressed by the pressure ratio and the
clearance volume percentage 𝜀 = 0.04 as follows
The volumetric efficiency of the compressor can also be expressed in term of
mass flow rate and piston displacement by using the actual mass flow rate compressed
by the compressor divided by the piston displacement at the suction point.
where the terms (V) represent the cylinder displacement volume (𝑚3/𝑠), (�̇�) is the
mass of refrigerant, and the term (N) represent the speed of the compressor.
𝑚𝑖 =�̇�𝑐𝑜𝑚𝑝,𝑖 ∗ 𝐶𝑂𝑃𝑖
ℎ𝑙∗ ∆𝑡𝑖
𝑚𝑐𝑙 = 𝑚𝑖
𝑡=𝑓𝑖𝑛𝑎𝑙
𝑡=𝑖𝑛𝑖𝑡𝑖𝑎𝑙
(3.4a)
(3.4b)
�̇�𝑐𝑜𝑚𝑝 = �̇�𝑟 ∗ ∆ℎ𝑐𝑜𝑚𝑝 (3.5)
𝜂𝑣 = [1 − 𝜀 ∗ 𝑃𝑑𝑖𝑠𝑐ℎ𝑎𝑟𝑔𝑒
𝑃𝑠𝑢𝑐𝑡𝑖𝑜𝑛
1𝑛− 1 (3.6)
𝜂𝑣 =�̇� ∗ 𝑣𝑠𝑢𝑐𝑡𝑖𝑜𝑛𝑉 ∗ 𝑁
(3.7)
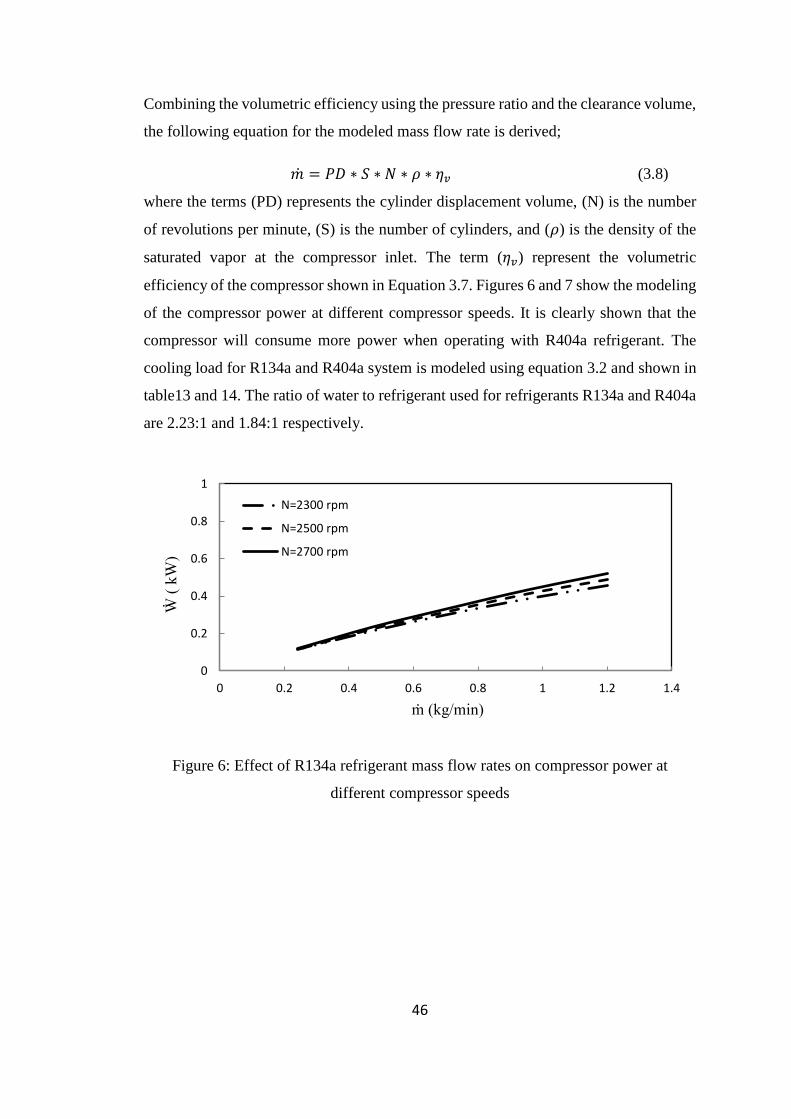
46
Combining the volumetric efficiency using the pressure ratio and the clearance volume,
the following equation for the modeled mass flow rate is derived;
where the terms (PD) represents the cylinder displacement volume, (N) is the number
of revolutions per minute, (S) is the number of cylinders, and (𝜌) is the density of the
saturated vapor at the compressor inlet. The term (𝜂𝑣) represent the volumetric
efficiency of the compressor shown in Equation 3.7. Figures 6 and 7 show the modeling
of the compressor power at different compressor speeds. It is clearly shown that the
compressor will consume more power when operating with R404a refrigerant. The
cooling load for R134a and R404a system is modeled using equation 3.2 and shown in
table13 and 14. The ratio of water to refrigerant used for refrigerants R134a and R404a
are 2.23:1 and 1.84:1 respectively.
Figure 6: Effect of R134a refrigerant mass flow rates on compressor power at
different compressor speeds
0
0.2
0.4
0.6
0.8
1
0 0.2 0.4 0.6 0.8 1 1.2 1.4
Ẇ (
kW
)
ṁ (kg/min)
N=2300 rpm
N=2500 rpm
N=2700 rpm
�̇� = 𝑃𝐷 ∗ 𝑆 ∗ 𝑁 ∗ 𝜌 ∗ 𝜂𝑣 (3.8)
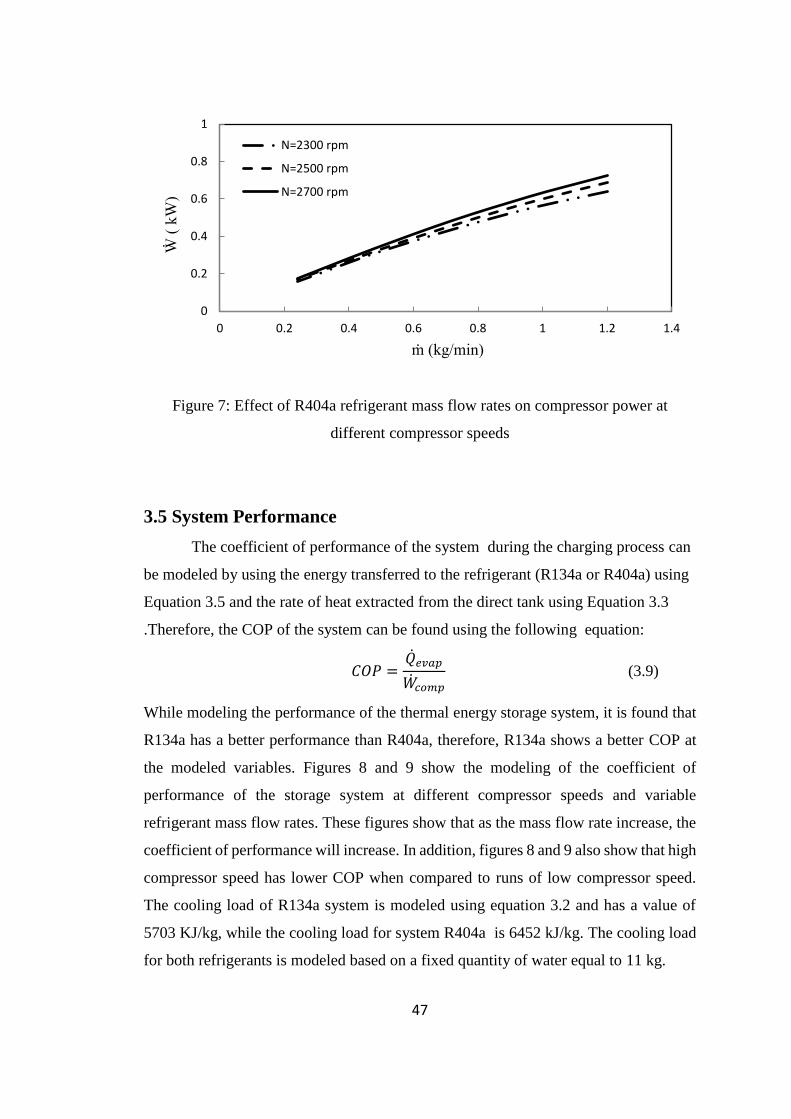
47
Figure 7: Effect of R404a refrigerant mass flow rates on compressor power at
different compressor speeds
3.5 System Performance
The coefficient of performance of the system during the charging process can
be modeled by using the energy transferred to the refrigerant (R134a or R404a) using
Equation 3.5 and the rate of heat extracted from the direct tank using Equation 3.3
.Therefore, the COP of the system can be found using the following equation:
𝐶𝑂𝑃 =�̇�𝑒𝑣𝑎𝑝
�̇�𝑐𝑜𝑚𝑝 (3.9)
While modeling the performance of the thermal energy storage system, it is found that
R134a has a better performance than R404a, therefore, R134a shows a better COP at
the modeled variables. Figures 8 and 9 show the modeling of the coefficient of
performance of the storage system at different compressor speeds and variable
refrigerant mass flow rates. These figures show that as the mass flow rate increase, the
coefficient of performance will increase. In addition, figures 8 and 9 also show that high
compressor speed has lower COP when compared to runs of low compressor speed.
The cooling load of R134a system is modeled using equation 3.2 and has a value of
5703 KJ/kg, while the cooling load for system R404a is 6452 kJ/kg. The cooling load
for both refrigerants is modeled based on a fixed quantity of water equal to 11 kg.
0
0.2
0.4
0.6
0.8
1
0 0.2 0.4 0.6 0.8 1 1.2 1.4
Ẇ (
kW
)
ṁ (kg/min)
N=2300 rpm
N=2500 rpm
N=2700 rpm
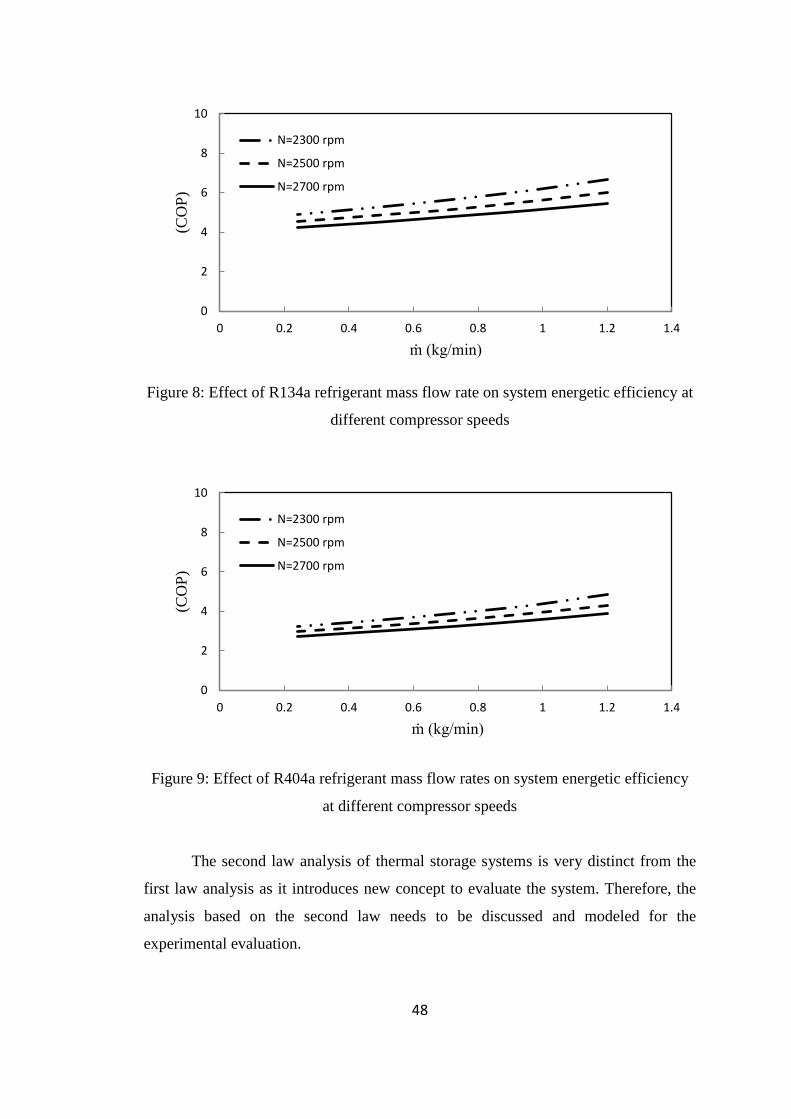
48
Figure 8: Effect of R134a refrigerant mass flow rate on system energetic efficiency at
different compressor speeds
Figure 9: Effect of R404a refrigerant mass flow rates on system energetic efficiency
at different compressor speeds
The second law analysis of thermal storage systems is very distinct from the
first law analysis as it introduces new concept to evaluate the system. Therefore, the
analysis based on the second law needs to be discussed and modeled for the
experimental evaluation.
0
2
4
6
8
10
0 0.2 0.4 0.6 0.8 1 1.2 1.4
(CO
P)
ṁ (kg/min)
N=2300 rpm
N=2500 rpm
N=2700 rpm
0
2
4
6
8
10
0 0.2 0.4 0.6 0.8 1 1.2 1.4
(CO
P)
ṁ (kg/min)
N=2300 rpm
N=2500 rpm
N=2700 rpm
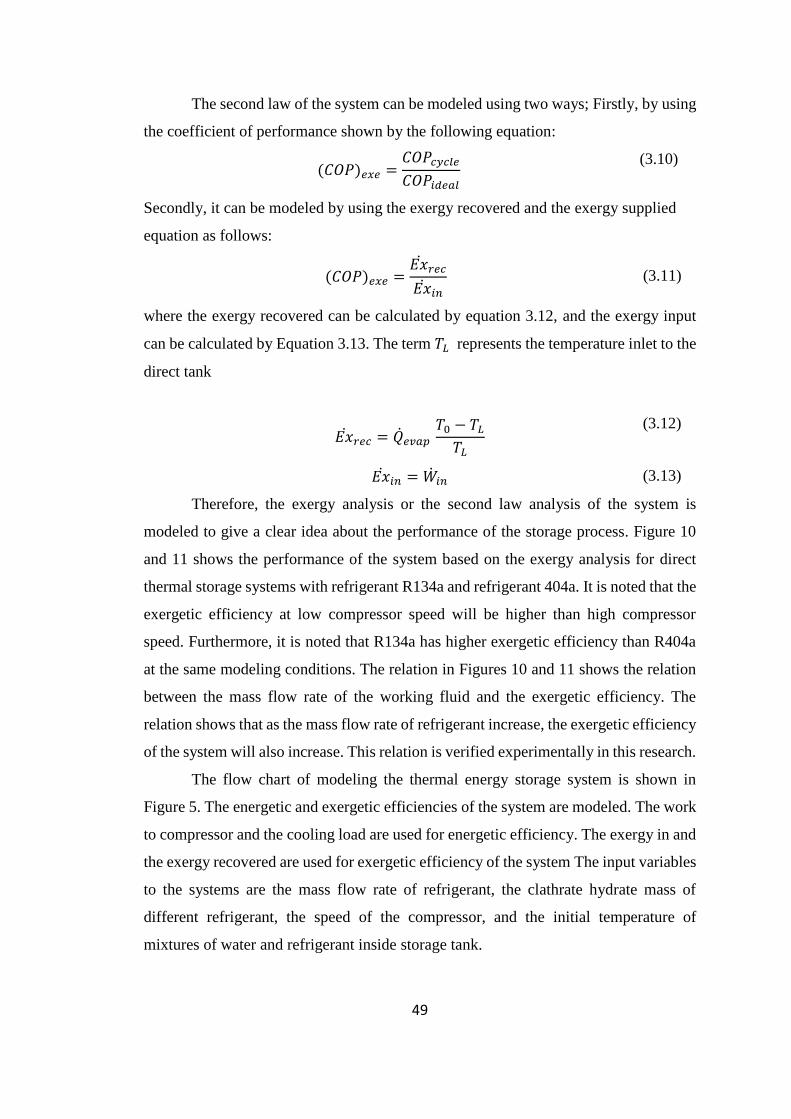
49
The second law of the system can be modeled using two ways; Firstly, by using
the coefficient of performance shown by the following equation:
(𝐶𝑂𝑃)𝑒𝑥𝑒 =𝐶𝑂𝑃𝑐𝑦𝑐𝑙𝑒
𝐶𝑂𝑃𝑖𝑑𝑒𝑎𝑙
(3.10)
Secondly, it can be modeled by using the exergy recovered and the exergy supplied
equation as follows:
(𝐶𝑂𝑃)𝑒𝑥𝑒 =𝐸�̇�𝑟𝑒𝑐
𝐸�̇�𝑖𝑛 (3.11)
where the exergy recovered can be calculated by equation 3.12, and the exergy input
can be calculated by Equation 3.13. The term 𝑇𝐿 represents the temperature inlet to the
direct tank
𝐸�̇�𝑟𝑒𝑐 = �̇�𝑒𝑣𝑎𝑝 𝑇0 − 𝑇𝐿𝑇𝐿
(3.12)
𝐸�̇�𝑖𝑛 = �̇�𝑖𝑛 (3.13)
Therefore, the exergy analysis or the second law analysis of the system is
modeled to give a clear idea about the performance of the storage process. Figure 10
and 11 shows the performance of the system based on the exergy analysis for direct
thermal storage systems with refrigerant R134a and refrigerant 404a. It is noted that the
exergetic efficiency at low compressor speed will be higher than high compressor
speed. Furthermore, it is noted that R134a has higher exergetic efficiency than R404a
at the same modeling conditions. The relation in Figures 10 and 11 shows the relation
between the mass flow rate of the working fluid and the exergetic efficiency. The
relation shows that as the mass flow rate of refrigerant increase, the exergetic efficiency
of the system will also increase. This relation is verified experimentally in this research.
The flow chart of modeling the thermal energy storage system is shown in
Figure 5. The energetic and exergetic efficiencies of the system are modeled. The work
to compressor and the cooling load are used for energetic efficiency. The exergy in and
the exergy recovered are used for exergetic efficiency of the system The input variables
to the systems are the mass flow rate of refrigerant, the clathrate hydrate mass of
different refrigerant, the speed of the compressor, and the initial temperature of
mixtures of water and refrigerant inside storage tank.
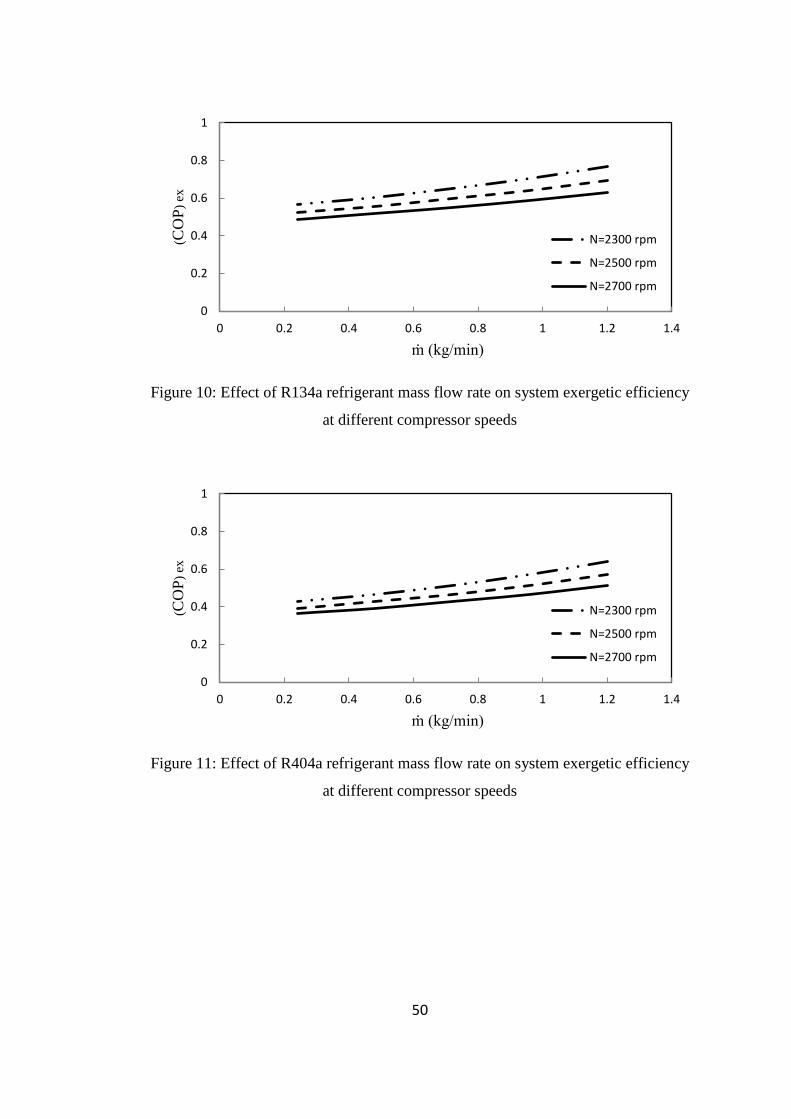
50
Figure 10: Effect of R134a refrigerant mass flow rate on system exergetic efficiency
at different compressor speeds
Figure 11: Effect of R404a refrigerant mass flow rate on system exergetic efficiency
at different compressor speeds
0
0.2
0.4
0.6
0.8
1
0 0.2 0.4 0.6 0.8 1 1.2 1.4
(CO
P)
ex
ṁ (kg/min)
N=2300 rpm
N=2500 rpm
N=2700 rpm
0
0.2
0.4
0.6
0.8
1
0 0.2 0.4 0.6 0.8 1 1.2 1.4
(CO
P)
ex
ṁ (kg/min)
N=2300 rpm
N=2500 rpm
N=2700 rpm
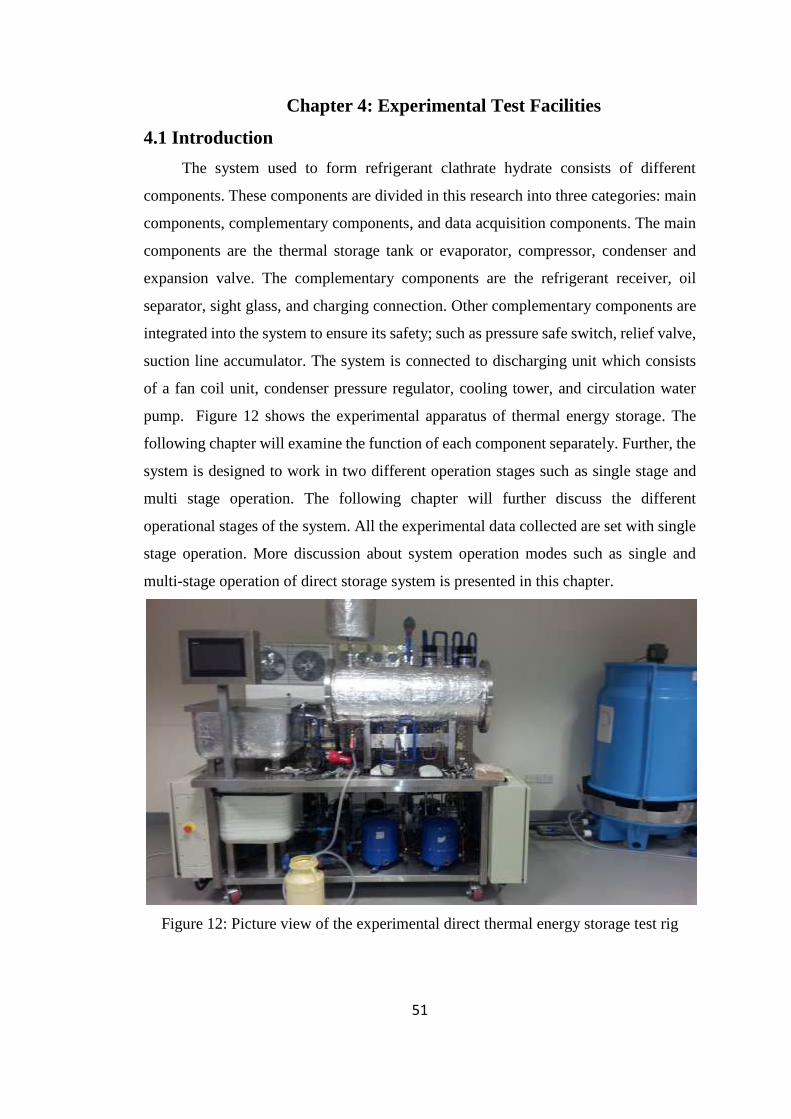
51
Chapter 4: Experimental Test Facilities
4.1 Introduction
The system used to form refrigerant clathrate hydrate consists of different
components. These components are divided in this research into three categories: main
components, complementary components, and data acquisition components. The main
components are the thermal storage tank or evaporator, compressor, condenser and
expansion valve. The complementary components are the refrigerant receiver, oil
separator, sight glass, and charging connection. Other complementary components are
integrated into the system to ensure its safety; such as pressure safe switch, relief valve,
suction line accumulator. The system is connected to discharging unit which consists
of a fan coil unit, condenser pressure regulator, cooling tower, and circulation water
pump. Figure 12 shows the experimental apparatus of thermal energy storage. The
following chapter will examine the function of each component separately. Further, the
system is designed to work in two different operation stages such as single stage and
multi stage operation. The following chapter will further discuss the different
operational stages of the system. All the experimental data collected are set with single
stage operation. More discussion about system operation modes such as single and
multi-stage operation of direct storage system is presented in this chapter.
Figure 12: Picture view of the experimental direct thermal energy storage test rig
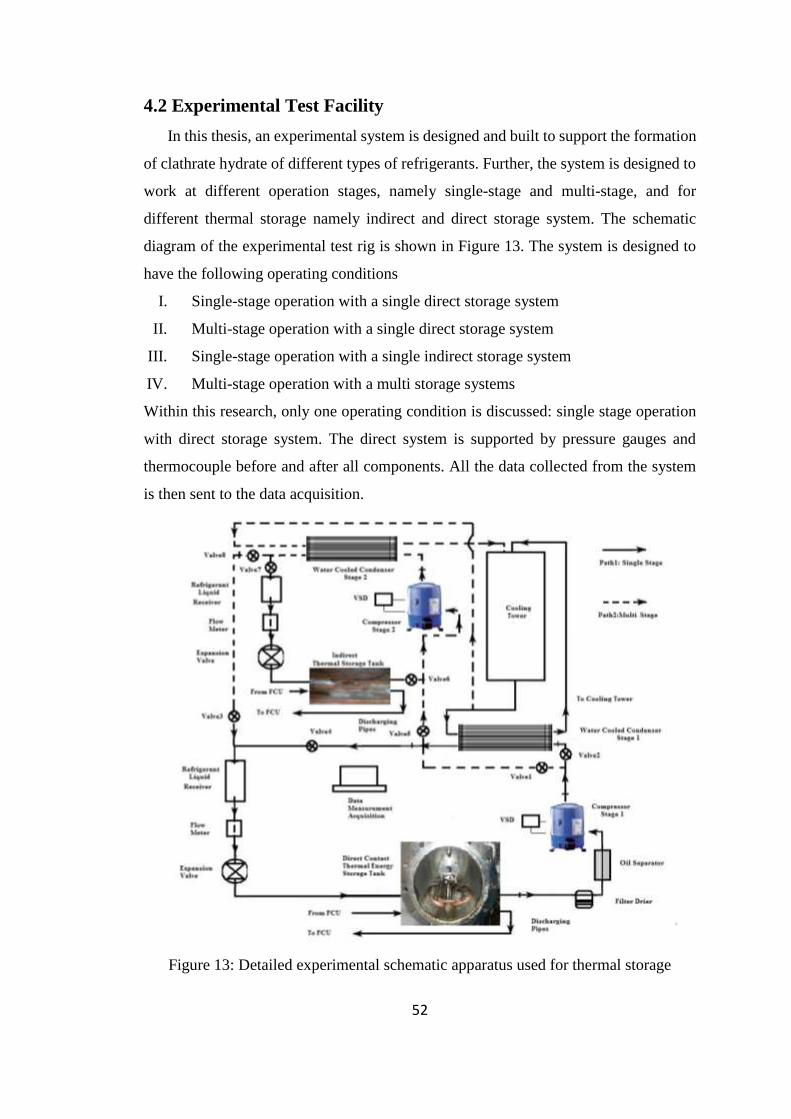
52
4.2 Experimental Test Facility
In this thesis, an experimental system is designed and built to support the formation
of clathrate hydrate of different types of refrigerants. Further, the system is designed to
work at different operation stages, namely single-stage and multi-stage, and for
different thermal storage namely indirect and direct storage system. The schematic
diagram of the experimental test rig is shown in Figure 13. The system is designed to
have the following operating conditions
I. Single-stage operation with a single direct storage system
II. Multi-stage operation with a single direct storage system
III. Single-stage operation with a single indirect storage system
IV. Multi-stage operation with a multi storage systems
Within this research, only one operating condition is discussed: single stage operation
with direct storage system. The direct system is supported by pressure gauges and
thermocouple before and after all components. All the data collected from the system
is then sent to the data acquisition.
Figure 13: Detailed experimental schematic apparatus used for thermal storage
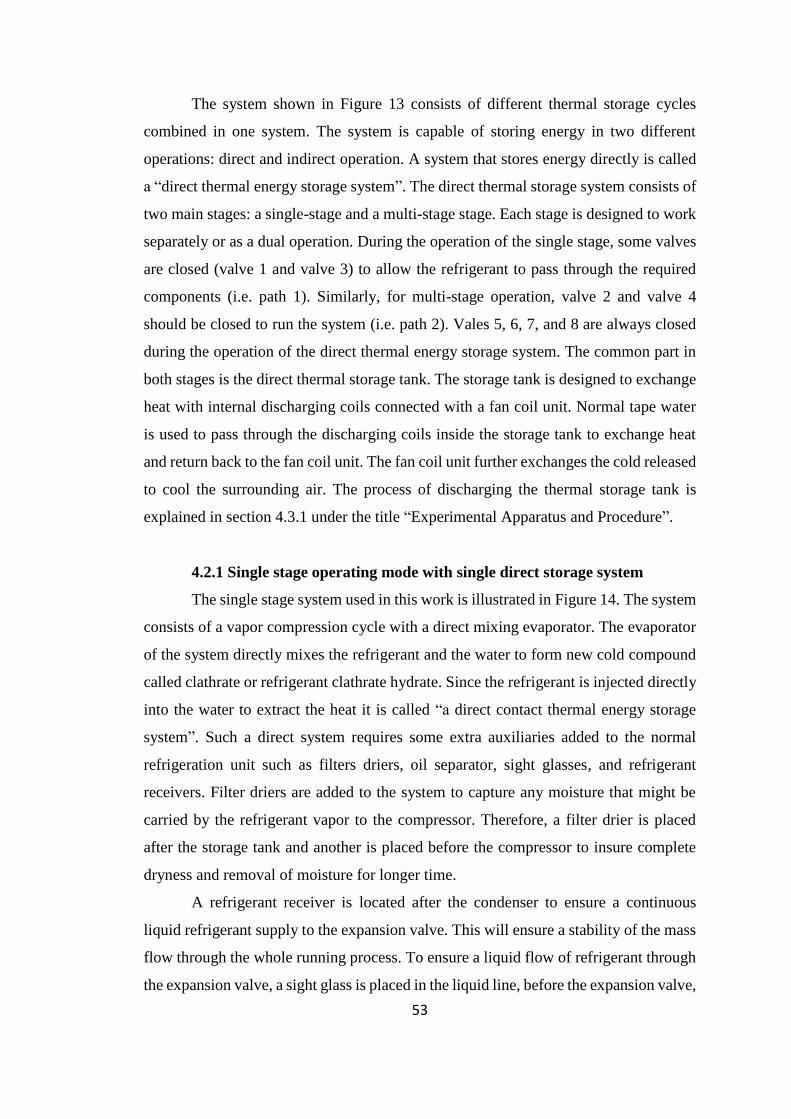
53
The system shown in Figure 13 consists of different thermal storage cycles
combined in one system. The system is capable of storing energy in two different
operations: direct and indirect operation. A system that stores energy directly is called
a “direct thermal energy storage system”. The direct thermal storage system consists of
two main stages: a single-stage and a multi-stage stage. Each stage is designed to work
separately or as a dual operation. During the operation of the single stage, some valves
are closed (valve 1 and valve 3) to allow the refrigerant to pass through the required
components (i.e. path 1). Similarly, for multi-stage operation, valve 2 and valve 4
should be closed to run the system (i.e. path 2). Vales 5, 6, 7, and 8 are always closed
during the operation of the direct thermal energy storage system. The common part in
both stages is the direct thermal storage tank. The storage tank is designed to exchange
heat with internal discharging coils connected with a fan coil unit. Normal tape water
is used to pass through the discharging coils inside the storage tank to exchange heat
and return back to the fan coil unit. The fan coil unit further exchanges the cold released
to cool the surrounding air. The process of discharging the thermal storage tank is
explained in section 4.3.1 under the title “Experimental Apparatus and Procedure”.
4.2.1 Single stage operating mode with single direct storage system
The single stage system used in this work is illustrated in Figure 14. The system
consists of a vapor compression cycle with a direct mixing evaporator. The evaporator
of the system directly mixes the refrigerant and the water to form new cold compound
called clathrate or refrigerant clathrate hydrate. Since the refrigerant is injected directly
into the water to extract the heat it is called “a direct contact thermal energy storage
system”. Such a direct system requires some extra auxiliaries added to the normal
refrigeration unit such as filters driers, oil separator, sight glasses, and refrigerant
receivers. Filter driers are added to the system to capture any moisture that might be
carried by the refrigerant vapor to the compressor. Therefore, a filter drier is placed
after the storage tank and another is placed before the compressor to insure complete
dryness and removal of moisture for longer time.
A refrigerant receiver is located after the condenser to ensure a continuous
liquid refrigerant supply to the expansion valve. This will ensure a stability of the mass
flow through the whole running process. To ensure a liquid flow of refrigerant through
the expansion valve, a sight glass is placed in the liquid line, before the expansion valve,
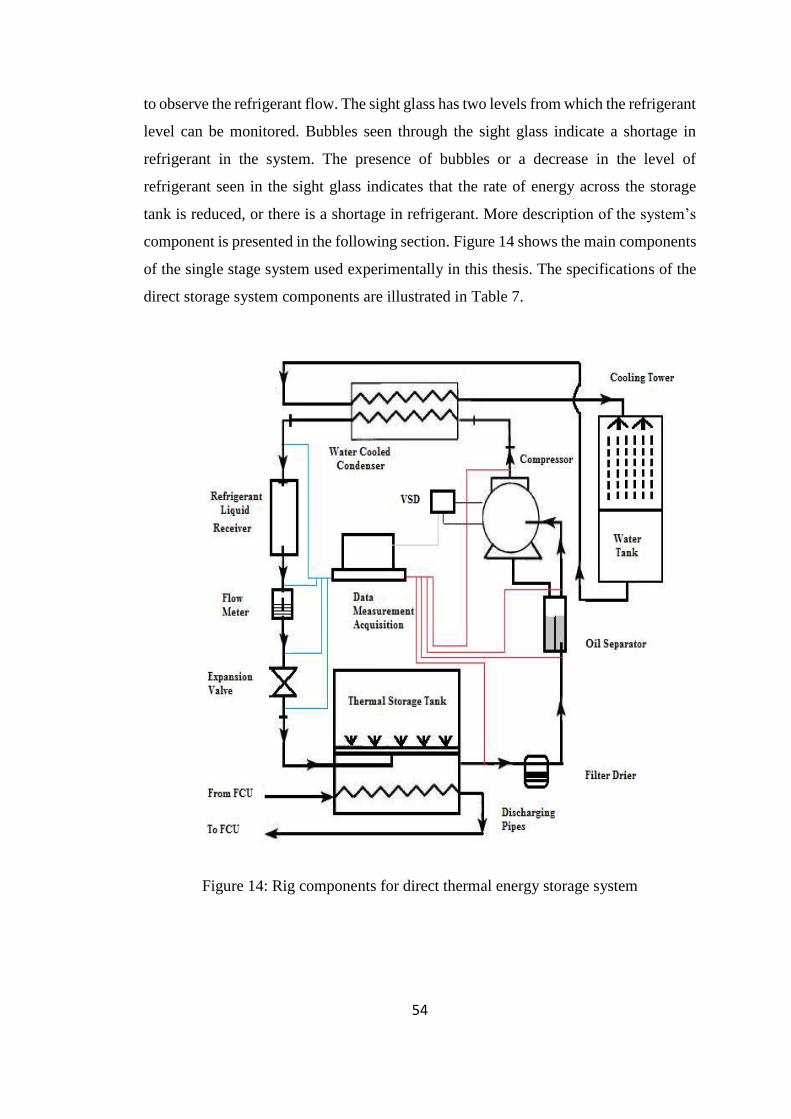
54
to observe the refrigerant flow. The sight glass has two levels from which the refrigerant
level can be monitored. Bubbles seen through the sight glass indicate a shortage in
refrigerant in the system. The presence of bubbles or a decrease in the level of
refrigerant seen in the sight glass indicates that the rate of energy across the storage
tank is reduced, or there is a shortage in refrigerant. More description of the system’s
component is presented in the following section. Figure 14 shows the main components
of the single stage system used experimentally in this thesis. The specifications of the
direct storage system components are illustrated in Table 7.
Figure 14: Rig components for direct thermal energy storage system
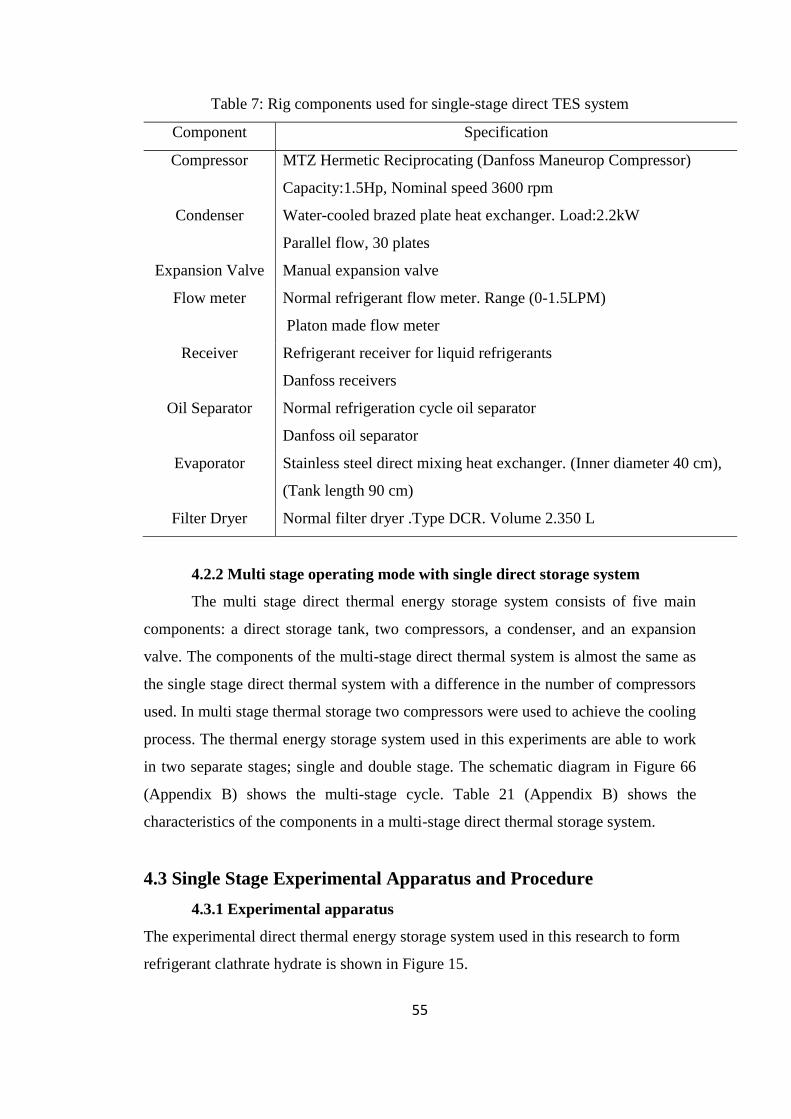
55
Table 7: Rig components used for single-stage direct TES system
Component Specification
Compressor MTZ Hermetic Reciprocating (Danfoss Maneurop Compressor)
Capacity:1.5Hp, Nominal speed 3600 rpm
Condenser Water-cooled brazed plate heat exchanger. Load:2.2kW
Parallel flow, 30 plates
Expansion Valve Manual expansion valve
Flow meter Normal refrigerant flow meter. Range (0-1.5LPM)
Platon made flow meter
Receiver Refrigerant receiver for liquid refrigerants
Danfoss receivers
Oil Separator Normal refrigeration cycle oil separator
Danfoss oil separator
Evaporator Stainless steel direct mixing heat exchanger. (Inner diameter 40 cm),
(Tank length 90 cm)
Filter Dryer Normal filter dryer .Type DCR. Volume 2.350 L
4.2.2 Multi stage operating mode with single direct storage system
The multi stage direct thermal energy storage system consists of five main
components: a direct storage tank, two compressors, a condenser, and an expansion
valve. The components of the multi-stage direct thermal system is almost the same as
the single stage direct thermal system with a difference in the number of compressors
used. In multi stage thermal storage two compressors were used to achieve the cooling
process. The thermal energy storage system used in this experiments are able to work
in two separate stages; single and double stage. The schematic diagram in Figure 66
(Appendix B) shows the multi-stage cycle. Table 21 (Appendix B) shows the
characteristics of the components in a multi-stage direct thermal storage system.
4.3 Single Stage Experimental Apparatus and Procedure
4.3.1 Experimental apparatus
The experimental direct thermal energy storage system used in this research to form
refrigerant clathrate hydrate is shown in Figure 15.
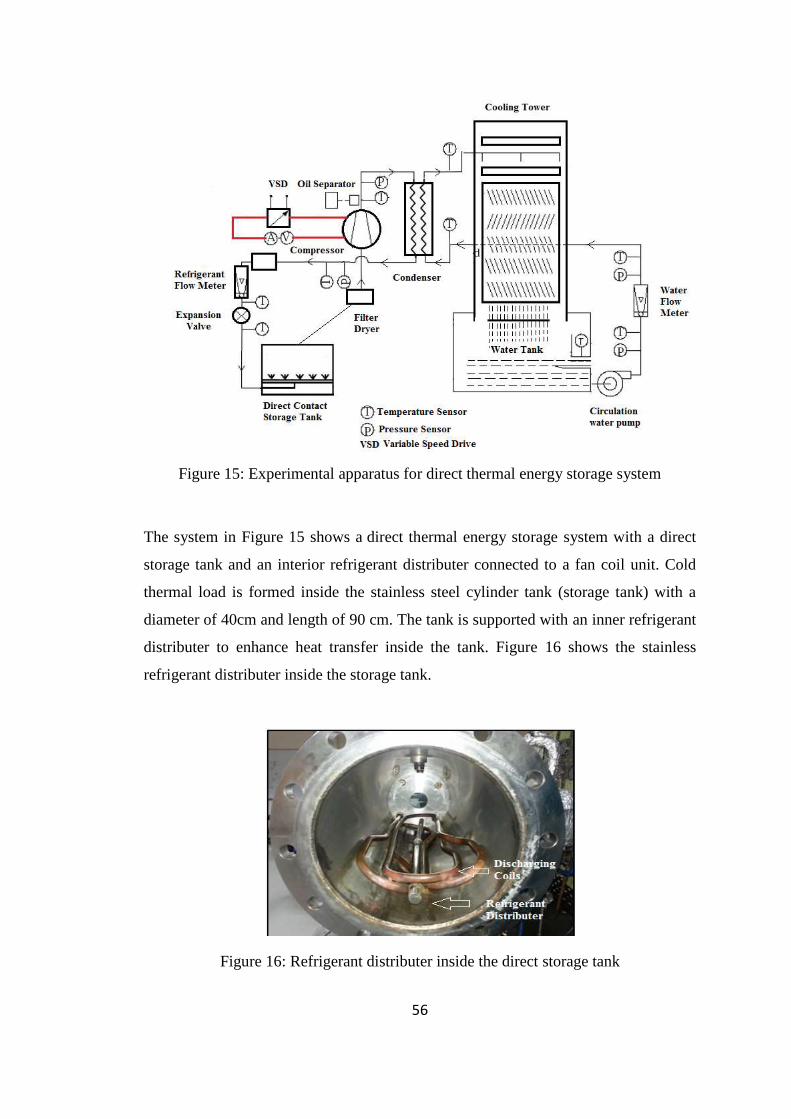
56
Figure 15: Experimental apparatus for direct thermal energy storage system
The system in Figure 15 shows a direct thermal energy storage system with a direct
storage tank and an interior refrigerant distributer connected to a fan coil unit. Cold
thermal load is formed inside the stainless steel cylinder tank (storage tank) with a
diameter of 40cm and length of 90 cm. The tank is supported with an inner refrigerant
distributer to enhance heat transfer inside the tank. Figure 16 shows the stainless
refrigerant distributer inside the storage tank.
Figure 16: Refrigerant distributer inside the direct storage tank
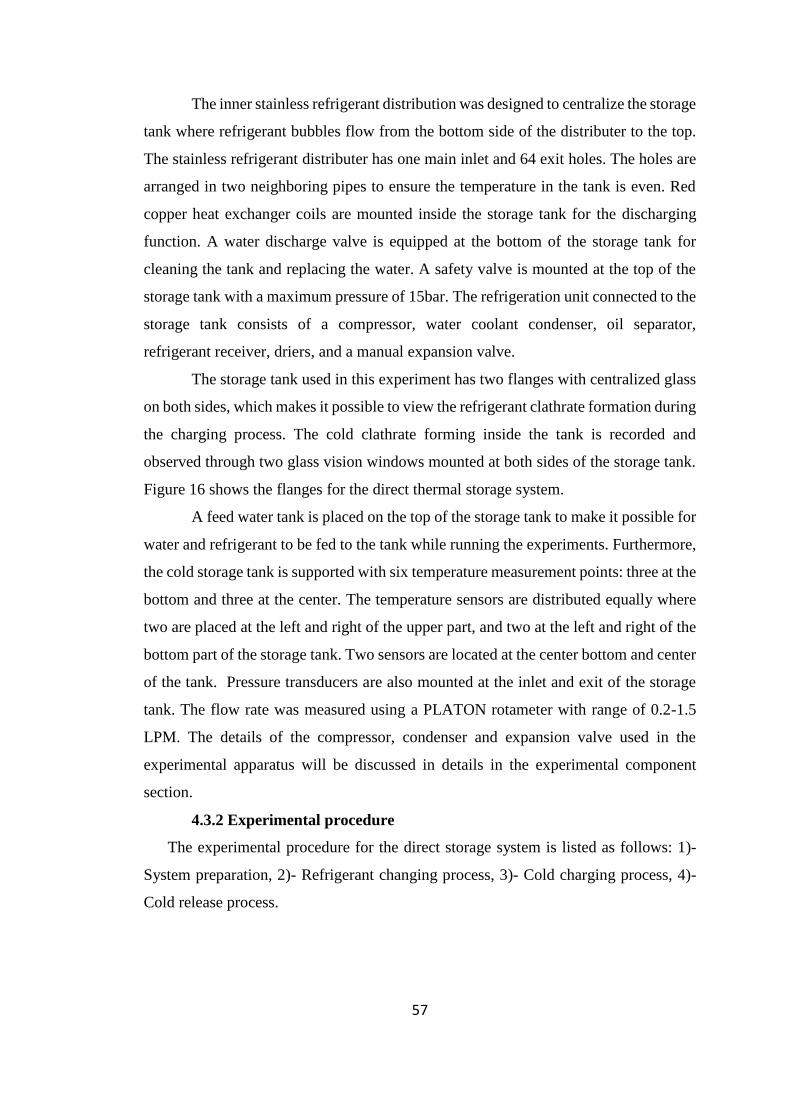
57
The inner stainless refrigerant distribution was designed to centralize the storage
tank where refrigerant bubbles flow from the bottom side of the distributer to the top.
The stainless refrigerant distributer has one main inlet and 64 exit holes. The holes are
arranged in two neighboring pipes to ensure the temperature in the tank is even. Red
copper heat exchanger coils are mounted inside the storage tank for the discharging
function. A water discharge valve is equipped at the bottom of the storage tank for
cleaning the tank and replacing the water. A safety valve is mounted at the top of the
storage tank with a maximum pressure of 15bar. The refrigeration unit connected to the
storage tank consists of a compressor, water coolant condenser, oil separator,
refrigerant receiver, driers, and a manual expansion valve.
The storage tank used in this experiment has two flanges with centralized glass
on both sides, which makes it possible to view the refrigerant clathrate formation during
the charging process. The cold clathrate forming inside the tank is recorded and
observed through two glass vision windows mounted at both sides of the storage tank.
Figure 16 shows the flanges for the direct thermal storage system.
A feed water tank is placed on the top of the storage tank to make it possible for
water and refrigerant to be fed to the tank while running the experiments. Furthermore,
the cold storage tank is supported with six temperature measurement points: three at the
bottom and three at the center. The temperature sensors are distributed equally where
two are placed at the left and right of the upper part, and two at the left and right of the
bottom part of the storage tank. Two sensors are located at the center bottom and center
of the tank. Pressure transducers are also mounted at the inlet and exit of the storage
tank. The flow rate was measured using a PLATON rotameter with range of 0.2-1.5
LPM. The details of the compressor, condenser and expansion valve used in the
experimental apparatus will be discussed in details in the experimental component
section.
4.3.2 Experimental procedure
The experimental procedure for the direct storage system is listed as follows: 1)-
System preparation, 2)- Refrigerant changing process, 3)- Cold charging process, 4)-
Cold release process.
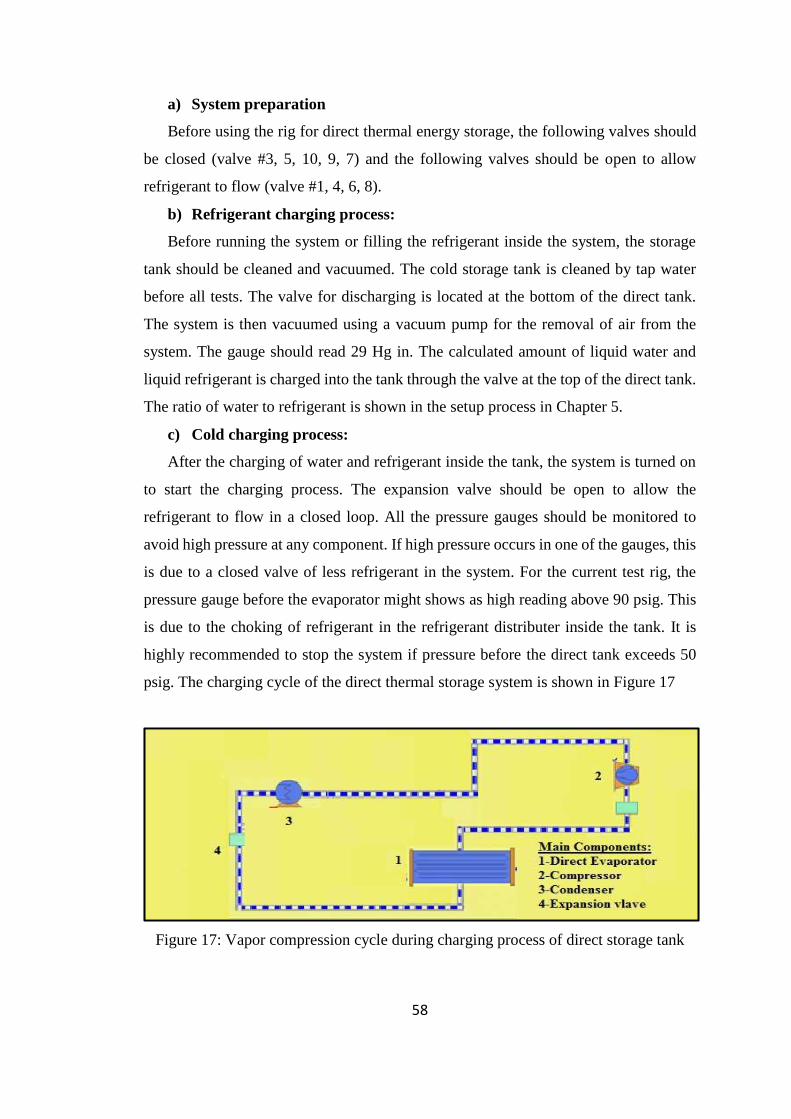
58
a) System preparation
Before using the rig for direct thermal energy storage, the following valves should
be closed (valve #3, 5, 10, 9, 7) and the following valves should be open to allow
refrigerant to flow (valve #1, 4, 6, 8).
b) Refrigerant charging process:
Before running the system or filling the refrigerant inside the system, the storage
tank should be cleaned and vacuumed. The cold storage tank is cleaned by tap water
before all tests. The valve for discharging is located at the bottom of the direct tank.
The system is then vacuumed using a vacuum pump for the removal of air from the
system. The gauge should read 29 Hg in. The calculated amount of liquid water and
liquid refrigerant is charged into the tank through the valve at the top of the direct tank.
The ratio of water to refrigerant is shown in the setup process in Chapter 5.
c) Cold charging process:
After the charging of water and refrigerant inside the tank, the system is turned on
to start the charging process. The expansion valve should be open to allow the
refrigerant to flow in a closed loop. All the pressure gauges should be monitored to
avoid high pressure at any component. If high pressure occurs in one of the gauges, this
is due to a closed valve of less refrigerant in the system. For the current test rig, the
pressure gauge before the evaporator might shows as high reading above 90 psig. This
is due to the choking of refrigerant in the refrigerant distributer inside the tank. It is
highly recommended to stop the system if pressure before the direct tank exceeds 50
psig. The charging cycle of the direct thermal storage system is shown in Figure 17
Figure 17: Vapor compression cycle during charging process of direct storage tank
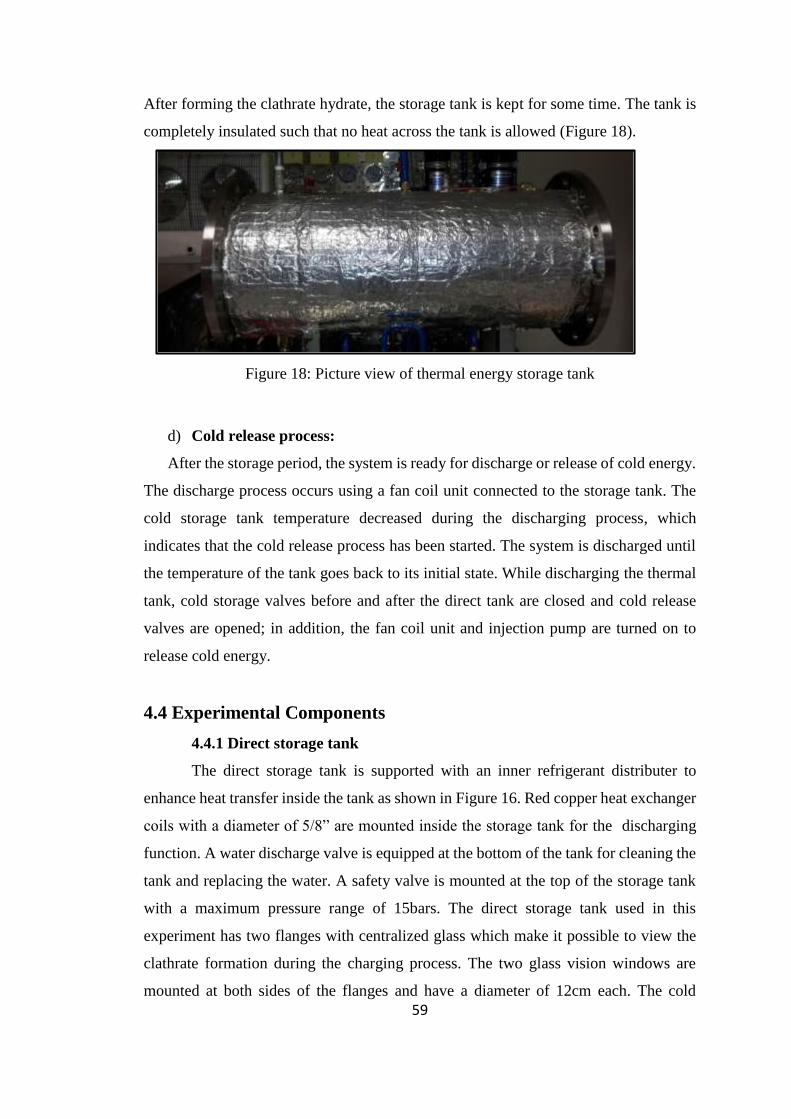
59
After forming the clathrate hydrate, the storage tank is kept for some time. The tank is
completely insulated such that no heat across the tank is allowed (Figure 18).
Figure 18: Picture view of thermal energy storage tank
d) Cold release process:
After the storage period, the system is ready for discharge or release of cold energy.
The discharge process occurs using a fan coil unit connected to the storage tank. The
cold storage tank temperature decreased during the discharging process, which
indicates that the cold release process has been started. The system is discharged until
the temperature of the tank goes back to its initial state. While discharging the thermal
tank, cold storage valves before and after the direct tank are closed and cold release
valves are opened; in addition, the fan coil unit and injection pump are turned on to
release cold energy.
4.4 Experimental Components
4.4.1 Direct storage tank
The direct storage tank is supported with an inner refrigerant distributer to
enhance heat transfer inside the tank as shown in Figure 16. Red copper heat exchanger
coils with a diameter of 5/8” are mounted inside the storage tank for the discharging
function. A water discharge valve is equipped at the bottom of the tank for cleaning the
tank and replacing the water. A safety valve is mounted at the top of the storage tank
with a maximum pressure range of 15bars. The direct storage tank used in this
experiment has two flanges with centralized glass which make it possible to view the
clathrate formation during the charging process. The two glass vision windows are
mounted at both sides of the flanges and have a diameter of 12cm each. The cold
60
refrigerant clathrate forming inside the tank is recorded and observed through these two
glass vision windows mounted on the side of the tank. Further, the cold storage tank is
supported with six temperature measurement points: three at the bottom and three at the
center.
4.4.2 Compressor
The compressor used in the direct thermal storage system is considered as a
hermetic reciprocating compressor. As named by manufacturer, the compressor is
positive displacement Maneurop MTZ compressors. The purpose of the compressor in
this system is to raise the low pressure of refrigerant coming from the storage tank to a
high pressure that of the condenser. Usually such compressors capacity ranges from
1/12 HP to 30 BG in household refrigeration [64]. The hermetic compressor used within
the experiment is a 1.5 hp reciprocating compressor with a separate variable speed
control. The nominal speed at 50Hz is given by the manufacturer as 2900 rpm while at
60Hz, it reaches to 3600 rpm. All the experimental process carried in this research uses
a range of 2300 to 3000 rpm. The maximum pressure from the low pressure side is
given by manufacturer as 25 bars, while the maximum from the high pressure side is
30 bars. The compressor used has a charging limit of 3 kg of refrigerant. The charging
limit of oil is around 1 liter. For the energy efficiency of this experiment, the data from
the compressor is collected and analyzed. The compressor characteristics are shown in
Appendix B. The compressor ratio during the experiments varies with mass flow rate
and type of refrigerant used. It is important to know the compressor ratio during the
experiment because the compressors are rated in terms of how much flow they produce
at a given ratio. The compressor ratio is defined as discharging pressure divided by
suction pressure in absolute pressure. From the experiments, it is noted that the
compressor performance is influenced by compressor ratio, suction, and discharge
temperature and compressor speed. The type of refrigerant used also has an effect on
the compressor performance.
4.4.3 Water-cooled condenser
There are many condensers to be considered when making a selection for a
direct thermal storage system. The famous condensers types are air cooled and water
cooled. The condenser used in this experiment is water-cooled condenser with cooling
capacity of 2.2 kW. The purpose of the condenser is to cool the hot refrigerant coming
from the compressor at high pressure. The heat of the refrigerant is exchanged with
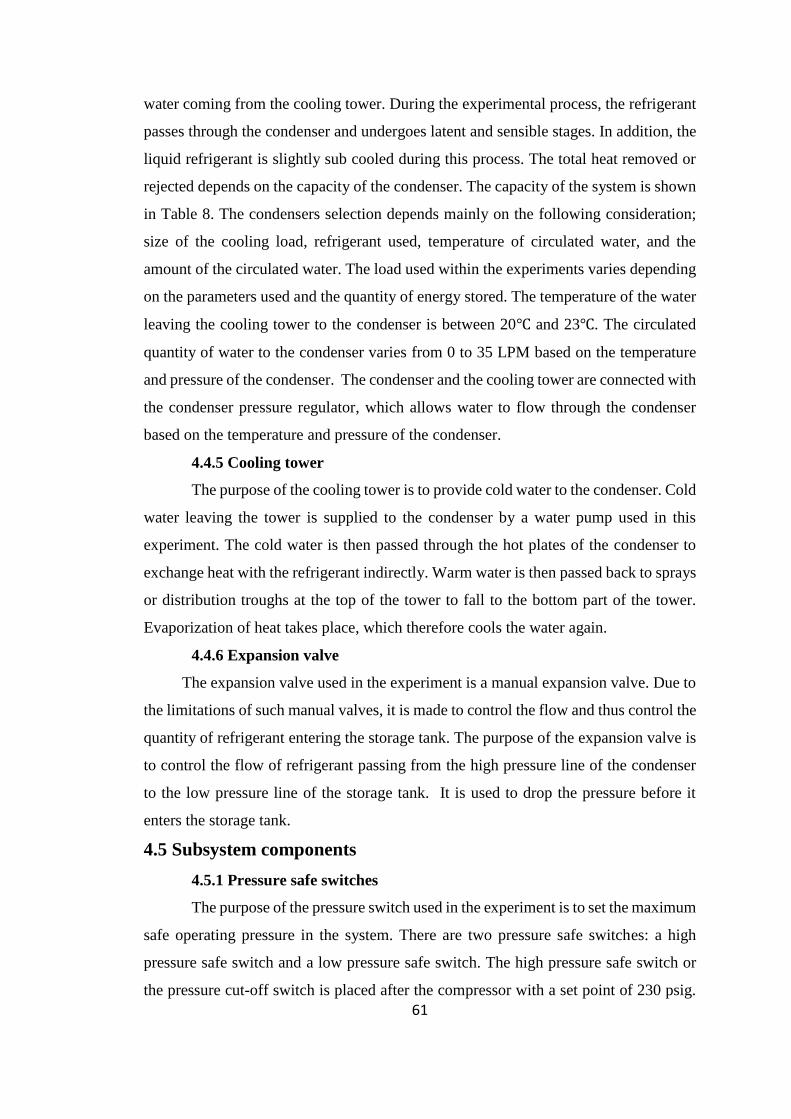
61
water coming from the cooling tower. During the experimental process, the refrigerant
passes through the condenser and undergoes latent and sensible stages. In addition, the
liquid refrigerant is slightly sub cooled during this process. The total heat removed or
rejected depends on the capacity of the condenser. The capacity of the system is shown
in Table 8. The condensers selection depends mainly on the following consideration;
size of the cooling load, refrigerant used, temperature of circulated water, and the
amount of the circulated water. The load used within the experiments varies depending
on the parameters used and the quantity of energy stored. The temperature of the water
leaving the cooling tower to the condenser is between 20℃ and 23℃. The circulated
quantity of water to the condenser varies from 0 to 35 LPM based on the temperature
and pressure of the condenser. The condenser and the cooling tower are connected with
the condenser pressure regulator, which allows water to flow through the condenser
based on the temperature and pressure of the condenser.
4.4.5 Cooling tower
The purpose of the cooling tower is to provide cold water to the condenser. Cold
water leaving the tower is supplied to the condenser by a water pump used in this
experiment. The cold water is then passed through the hot plates of the condenser to
exchange heat with the refrigerant indirectly. Warm water is then passed back to sprays
or distribution troughs at the top of the tower to fall to the bottom part of the tower.
Evaporization of heat takes place, which therefore cools the water again.
4.4.6 Expansion valve
The expansion valve used in the experiment is a manual expansion valve. Due to
the limitations of such manual valves, it is made to control the flow and thus control the
quantity of refrigerant entering the storage tank. The purpose of the expansion valve is
to control the flow of refrigerant passing from the high pressure line of the condenser
to the low pressure line of the storage tank. It is used to drop the pressure before it
enters the storage tank.
4.5 Subsystem components
4.5.1 Pressure safe switches
The purpose of the pressure switch used in the experiment is to set the maximum
safe operating pressure in the system. There are two pressure safe switches: a high
pressure safe switch and a low pressure safe switch. The high pressure safe switch or
the pressure cut-off switch is placed after the compressor with a set point of 230 psig.
62
The mechanism of the safe switch works to stop the compressor if the adjustable spring
exceeds the set range. The cut-off point is usually set to be higher than the expected
operating pressure, which in this case ranges between 100-200 psig for both tested
refrigerants. The mechanism of the low pressure safety valve is almost the same. A
spring is adjusted to match the required pressure. It is placed at the suction part of the
compressor. During the experiments the high safe pressure cut-off point is set to 230
psig, while the low cut-off switch is set to around 20 inches of mercury (Hg in vac).
4.5.2 Condenser pressure regulator
The system is designed to work satisfactorily during maximum operating
conditions. The condenser was sized to operate under maximum conditions of pressure
and temperature. But when the load is reduced, the temperature and pressure of the
condenser drops, resulting in a lower pressure difference across the high and low
pressure which may lead to a malfunction of the system. Therefore, the purpose of
condenser pressure regulator is to control the water-regulating valve that is operated by
the condenser pressure. In other words, if the pressure of the condenser drops, the valve
will gradually close to regulate the amount of water entering the condenser. The
condenser pressure regulator can be fitted with a directly controlled water regulator
valve controlled by the condenser pressure.
4.5.3 Evaporator relief valve
To prevent over pressure within the storage tank, a relief valve is placed in the
evaporator to stop the system in case the pressure exceeds the limited pressure. The
pressure is set to be 70 psig. The difference between the pressure safe switch and the
evaporator relief valve is that the pressure safe switch cut-off or stops the system in
case the pressure exceeds the limited pressure. However, in the relief valve, it only
opens to release some of the pressure for safety while the system is operating.
4.5.4 Sight glass
The purpose of the sight glass is to show that the refrigerant is present in the
pipe which should be in liquid phase. The main application of the sight glass in the
thermal storage system is in the liquid line from the receiver to the expansion valve.
Normal sight glass is used during the experiments. Furthermore, the sight glass is used
to identify the quantity of refrigerant in the thermal storage system.
In case of a shortage, the refrigerant level monitored from the sight glass will be in a
mixture phase (gas and liquid phase).
63
4.5.5 Charging connection
The purpose of a charging connection is to add refrigerant to the system when
needed. The safest place to charge refrigerant is before the expansion valve, in the liquid
receiver.
4.5.6 Oil separator
Since circulated refrigerant will be carrying oil, and this oil must be returned to
the compressor, an oil separator is placed in the system. An oil separator is also called
as suction line accumulator
4.6 Measurement Devices
In addition to the main components, several instruments are connected to the
system. These instruments are connected to either improve performance plus monitor
the system, or to ensure the safety of the system’s operation.
4.6.1 Pressure gauges and transducers
The system is equipped with different pressure gauges and pressure transducers
to measure the pressure. All pressure gauges and transducers are placed at the inlet and
outlet of each component. The main use of the pressure gauges and transducers is to
monitor the system’s behavior and ensure the safety of operation. Pressure gauges show
the measured value of the pressure on a scale, while the pressure transducer detects the
pressure variation and sends it to data acquisition to digitalize it and send it to a
computer in order to view it, store it, and analyze it. Omega pressure transducer
PX240A series are mounted in the storage system. The data sheet for the pressure
transducer used is shown in Appendix B.
4.6.2 Thermocouples
All the components of a direct storage system are linked to data acquisition
system. Temperature thermocouples are used during the experiment to measure the
temperature before and after each component. They are also placed around the storage
tank to measure the temperature distribution inside the storage tank. Thermocouples are
connected to the data acquisition system so it can be viewed on a computer. K type
thermocouples were chosen to be installed in the system.
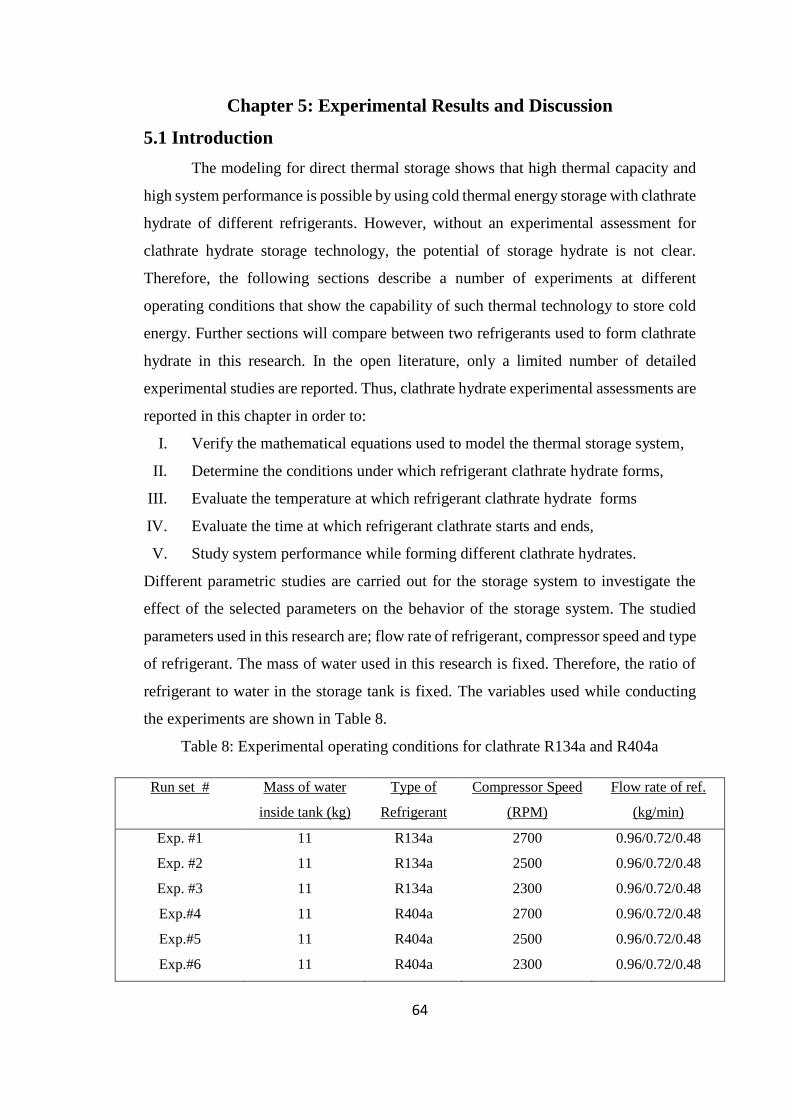
64
Chapter 5: Experimental Results and Discussion
5.1 Introduction
The modeling for direct thermal storage shows that high thermal capacity and
high system performance is possible by using cold thermal energy storage with clathrate
hydrate of different refrigerants. However, without an experimental assessment for
clathrate hydrate storage technology, the potential of storage hydrate is not clear.
Therefore, the following sections describe a number of experiments at different
operating conditions that show the capability of such thermal technology to store cold
energy. Further sections will compare between two refrigerants used to form clathrate
hydrate in this research. In the open literature, only a limited number of detailed
experimental studies are reported. Thus, clathrate hydrate experimental assessments are
reported in this chapter in order to:
I. Verify the mathematical equations used to model the thermal storage system,
II. Determine the conditions under which refrigerant clathrate hydrate forms,
III. Evaluate the temperature at which refrigerant clathrate hydrate forms
IV. Evaluate the time at which refrigerant clathrate starts and ends,
V. Study system performance while forming different clathrate hydrates.
Different parametric studies are carried out for the storage system to investigate the
effect of the selected parameters on the behavior of the storage system. The studied
parameters used in this research are; flow rate of refrigerant, compressor speed and type
of refrigerant. The mass of water used in this research is fixed. Therefore, the ratio of
refrigerant to water in the storage tank is fixed. The variables used while conducting
the experiments are shown in Table 8.
Table 8: Experimental operating conditions for clathrate R134a and R404a
Run set # Mass of water
inside tank (kg)
Type of
Refrigerant
Compressor Speed
(RPM)
Flow rate of ref.
(kg/min)
Exp. #1 11 R134a 2700 0.96/0.72/0.48
Exp. #2 11 R134a 2500 0.96/0.72/0.48
Exp. #3 11 R134a 2300 0.96/0.72/0.48
Exp.#4 11 R404a 2700 0.96/0.72/0.48
Exp.#5 11 R404a 2500 0.96/0.72/0.48
Exp.#6 11 R404a 2300 0.96/0.72/0.48
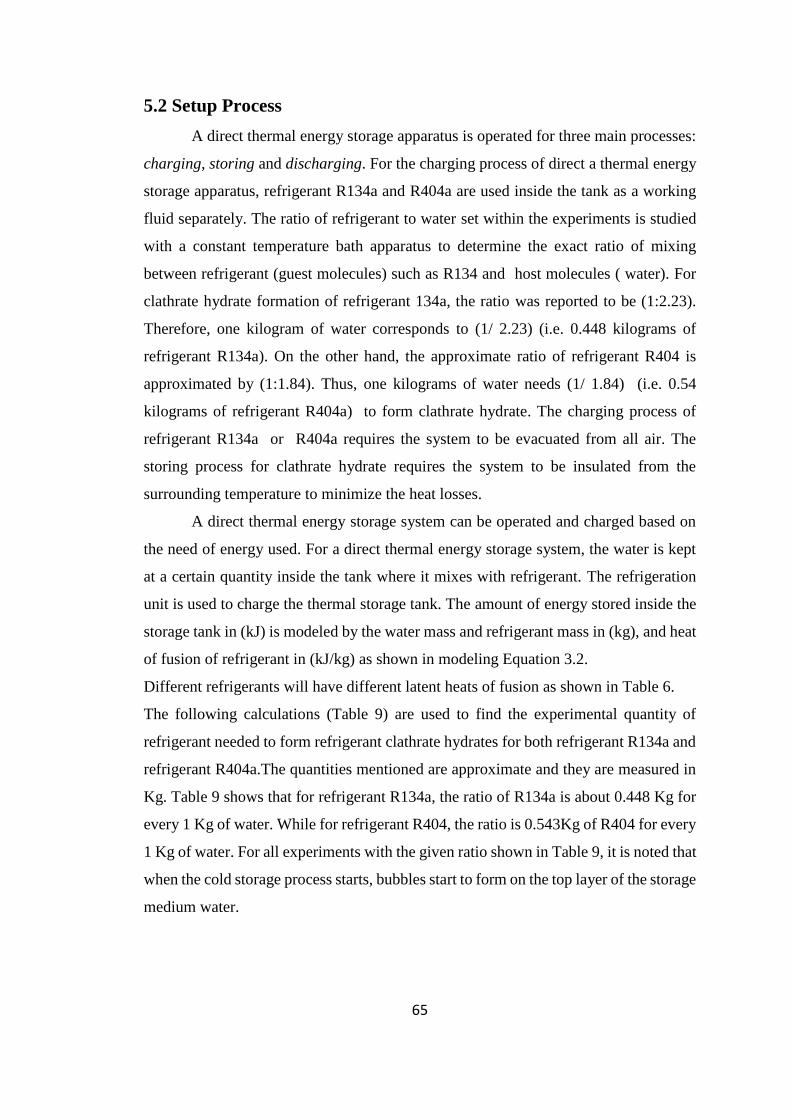
65
5.2 Setup Process
A direct thermal energy storage apparatus is operated for three main processes:
charging, storing and discharging. For the charging process of direct a thermal energy
storage apparatus, refrigerant R134a and R404a are used inside the tank as a working
fluid separately. The ratio of refrigerant to water set within the experiments is studied
with a constant temperature bath apparatus to determine the exact ratio of mixing
between refrigerant (guest molecules) such as R134 and host molecules ( water). For
clathrate hydrate formation of refrigerant 134a, the ratio was reported to be (1:2.23).
Therefore, one kilogram of water corresponds to (1/ 2.23) (i.e. 0.448 kilograms of
refrigerant R134a). On the other hand, the approximate ratio of refrigerant R404 is
approximated by (1:1.84). Thus, one kilograms of water needs (1/ 1.84) (i.e. 0.54
kilograms of refrigerant R404a) to form clathrate hydrate. The charging process of
refrigerant R134a or R404a requires the system to be evacuated from all air. The
storing process for clathrate hydrate requires the system to be insulated from the
surrounding temperature to minimize the heat losses.
A direct thermal energy storage system can be operated and charged based on
the need of energy used. For a direct thermal energy storage system, the water is kept
at a certain quantity inside the tank where it mixes with refrigerant. The refrigeration
unit is used to charge the thermal storage tank. The amount of energy stored inside the
storage tank in (kJ) is modeled by the water mass and refrigerant mass in (kg), and heat
of fusion of refrigerant in (kJ/kg) as shown in modeling Equation 3.2.
Different refrigerants will have different latent heats of fusion as shown in Table 6.
The following calculations (Table 9) are used to find the experimental quantity of
refrigerant needed to form refrigerant clathrate hydrates for both refrigerant R134a and
refrigerant R404a.The quantities mentioned are approximate and they are measured in
Kg. Table 9 shows that for refrigerant R134a, the ratio of R134a is about 0.448 Kg for
every 1 Kg of water. While for refrigerant R404, the ratio is 0.543Kg of R404 for every
1 Kg of water. For all experiments with the given ratio shown in Table 9, it is noted that
when the cold storage process starts, bubbles start to form on the top layer of the storage
medium water.
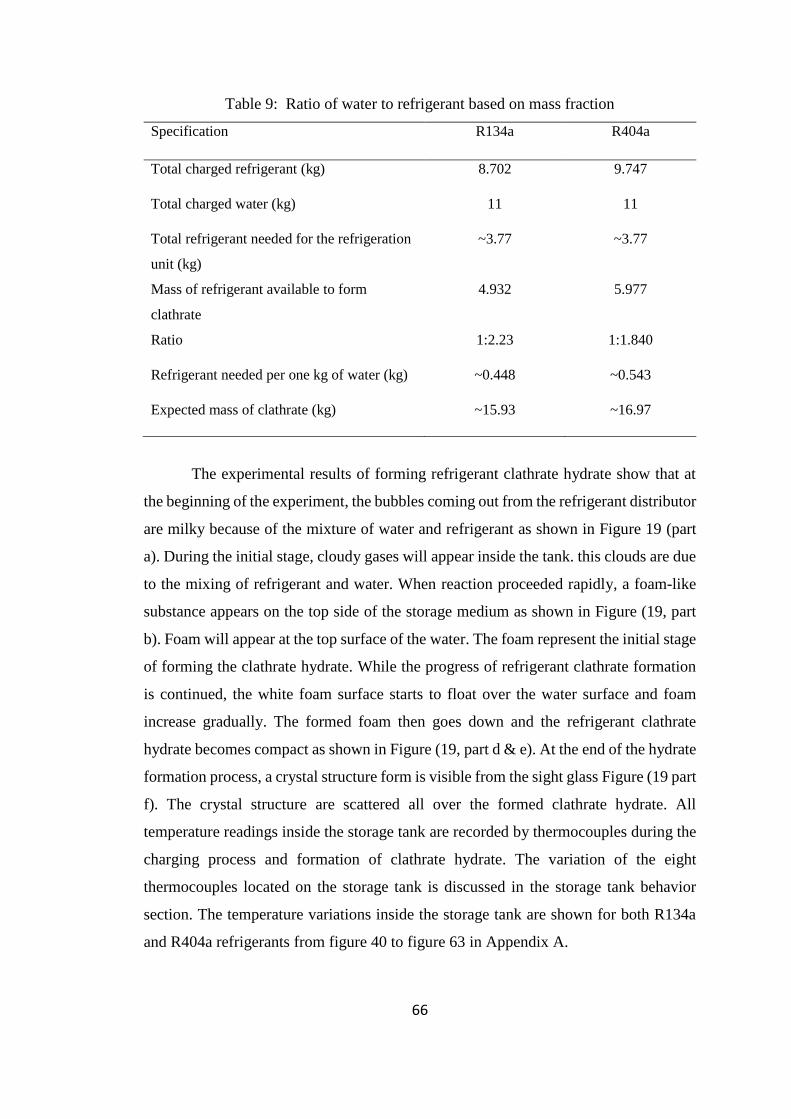
66
Table 9: Ratio of water to refrigerant based on mass fraction
Specification R134a R404a
Total charged refrigerant (kg) 8.702 9.747
Total charged water (kg) 11 11
Total refrigerant needed for the refrigeration
unit (kg)
~3.77 ~3.77
Mass of refrigerant available to form
clathrate
4.932 5.977
Ratio 1:2.23 1:1.840
Refrigerant needed per one kg of water (kg) ~0.448 ~0.543
Expected mass of clathrate (kg) ~15.93 ~16.97
The experimental results of forming refrigerant clathrate hydrate show that at
the beginning of the experiment, the bubbles coming out from the refrigerant distributor
are milky because of the mixture of water and refrigerant as shown in Figure 19 (part
a). During the initial stage, cloudy gases will appear inside the tank. this clouds are due
to the mixing of refrigerant and water. When reaction proceeded rapidly, a foam-like
substance appears on the top side of the storage medium as shown in Figure (19, part
b). Foam will appear at the top surface of the water. The foam represent the initial stage
of forming the clathrate hydrate. While the progress of refrigerant clathrate formation
is continued, the white foam surface starts to float over the water surface and foam
increase gradually. The formed foam then goes down and the refrigerant clathrate
hydrate becomes compact as shown in Figure (19, part d & e). At the end of the hydrate
formation process, a crystal structure form is visible from the sight glass Figure (19 part
f). The crystal structure are scattered all over the formed clathrate hydrate. All
temperature readings inside the storage tank are recorded by thermocouples during the
charging process and formation of clathrate hydrate. The variation of the eight
thermocouples located on the storage tank is discussed in the storage tank behavior
section. The temperature variations inside the storage tank are shown for both R134a
and R404a refrigerants from figure 40 to figure 63 in Appendix A.
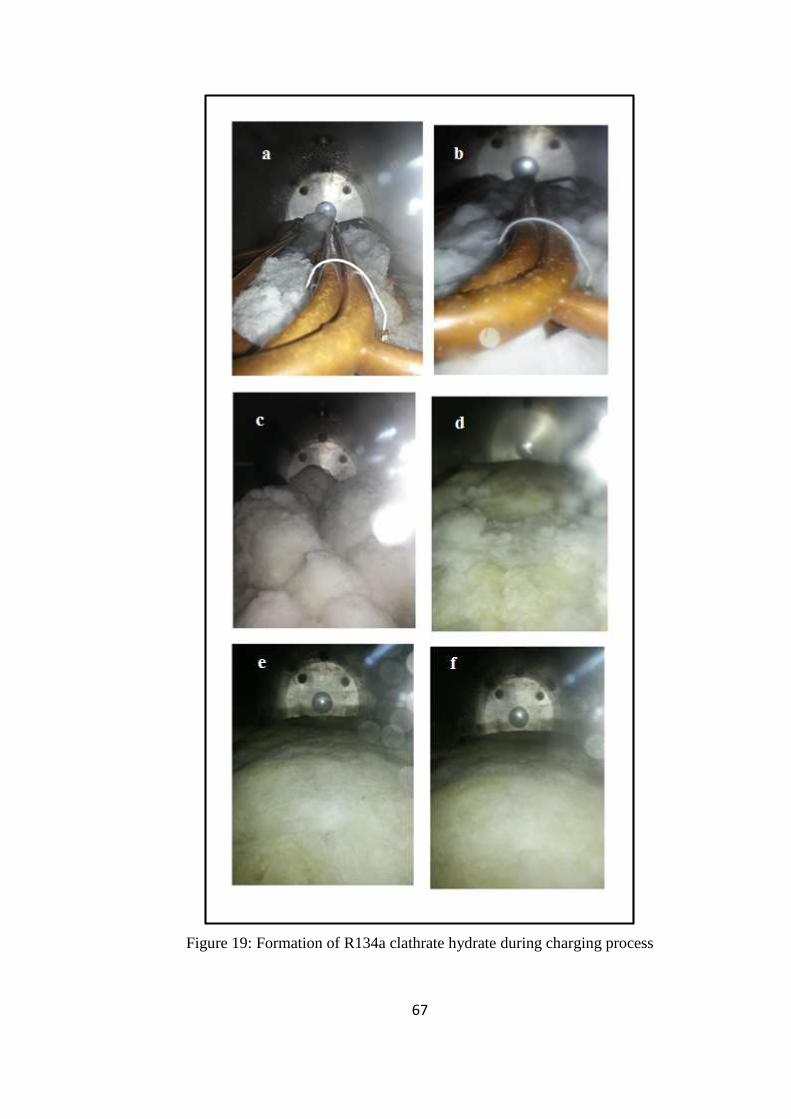
67
Figure 19: Formation of R134a clathrate hydrate during charging process
68
5.3 Direct Storage Tank Behavior
The behavior of the direct thermal energy storage tank includes; the variation of
the temperature inside the tank, the pressure variation of the refrigerant inlet and the
outlet from the storage tank, the quantity of refrigerant clathrate hydrate formed and the
operational processes of charging and discharging. The behavior of the system is
conducted by measuring the temperature and pressure of the refrigerant used and the
temperature of the storage medium. Many experimental tests are studied for both
refrigerants, the results are summarized in this chapter. This section will discuss the
behavior of the storage tank and the compressor used. Further results related to the
clathrate formed are disused in the discussion of results section.
5.3.1 Direct storage tank temperature variation
For clathrate hydrate to be used in thermal storage, it should be formed at
storage temperature ranges between 5℃ and 12℃. It is experimentally noted that for
different refrigerants, there is a certain time needed before clathrate hydrate starts to
form. This period is the sensible period for the storage material. Figures 21 to 23 show
the variation of the average temperature inside the direct storage tank for refrigerant
R134a clathrate hydrate. It is experimentally noted that in almost all experimental runs,
the temperature of the tank with R134a will converge in the range of 4℃ and 6℃ as
shown in Figures 21 to 23. For the case of R404a clathrate hydrate, the temperature
inside the direct storage tank will converge to a higher temperature than that of R134a
which is between 10℃ and 7℃ as shown in figures 24 to 26.
At the beginning of the charging process, the temperature of the storage medium
inside the storage tank ranges between 17 ℃ and 20 ℃. The temperature and pressure
of the mixed water and refrigerant will decrease gradually with time while charging the
direct storage tank. It is noticed that the inlet temperature varies based on the pressure
of the storage tank and the mass flow rate of the refrigerant. The inlet temperature of
the storage tank varies between -8 ℃ and -2 ℃ for refrigerant R134a. The experimental
results show that the inlet temperature of refrigerant R404a is lower than that of R134a.
Thus clathrate hydrate with R404a forms at a higher temperature than R134a clathrate
hydrate.
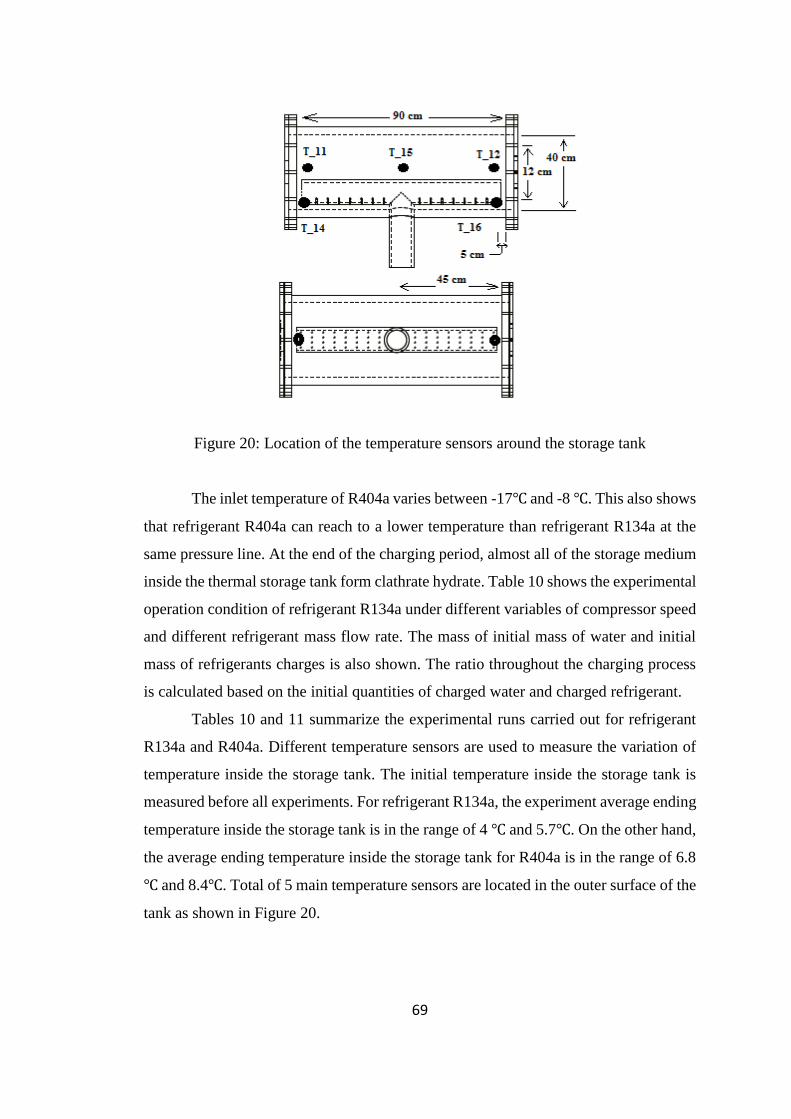
69
Figure 20: Location of the temperature sensors around the storage tank
The inlet temperature of R404a varies between -17℃ and -8 ℃. This also shows
that refrigerant R404a can reach to a lower temperature than refrigerant R134a at the
same pressure line. At the end of the charging period, almost all of the storage medium
inside the thermal storage tank form clathrate hydrate. Table 10 shows the experimental
operation condition of refrigerant R134a under different variables of compressor speed
and different refrigerant mass flow rate. The mass of initial mass of water and initial
mass of refrigerants charges is also shown. The ratio throughout the charging process
is calculated based on the initial quantities of charged water and charged refrigerant.
Tables 10 and 11 summarize the experimental runs carried out for refrigerant
R134a and R404a. Different temperature sensors are used to measure the variation of
temperature inside the storage tank. The initial temperature inside the storage tank is
measured before all experiments. For refrigerant R134a, the experiment average ending
temperature inside the storage tank is in the range of 4 ℃ and 5.7℃. On the other hand,
the average ending temperature inside the storage tank for R404a is in the range of 6.8
℃ and 8.4℃. Total of 5 main temperature sensors are located in the outer surface of the
tank as shown in Figure 20.
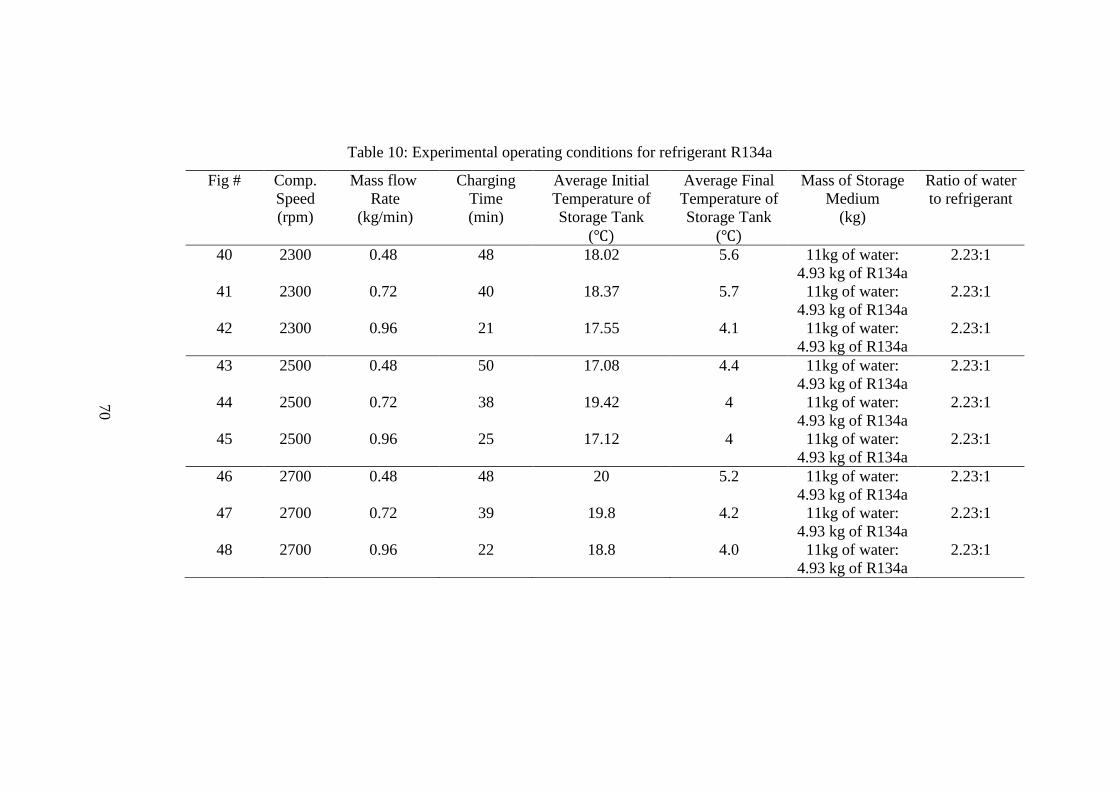
70
Table 10: Experimental operating conditions for refrigerant R134a
Fig # Comp.
Speed
(rpm)
Mass flow
Rate
(kg/min)
Charging
Time
(min)
Average Initial
Temperature of
Storage Tank
(℃)
Average Final
Temperature of
Storage Tank
(℃)
Mass of Storage
Medium
(kg)
Ratio of water
to refrigerant
40
2300 0.48 48 18.02 5.6 11kg of water:
4.93 kg of R134a
2.23:1
41
2300 0.72 40 18.37 5.7 11kg of water:
4.93 kg of R134a
2.23:1
42
2300 0.96 21 17.55 4.1 11kg of water:
4.93 kg of R134a
2.23:1
43
2500 0.48 50 17.08 4.4 11kg of water:
4.93 kg of R134a
2.23:1
44
2500 0.72 38 19.42 4 11kg of water:
4.93 kg of R134a
2.23:1
45
2500 0.96 25 17.12 4 11kg of water:
4.93 kg of R134a
2.23:1
46
2700 0.48 48 20 5.2 11kg of water:
4.93 kg of R134a
2.23:1
47
2700 0.72 39 19.8 4.2 11kg of water:
4.93 kg of R134a
2.23:1
48
2700 0.96 22 18.8 4.0 11kg of water:
4.93 kg of R134a
2.23:1
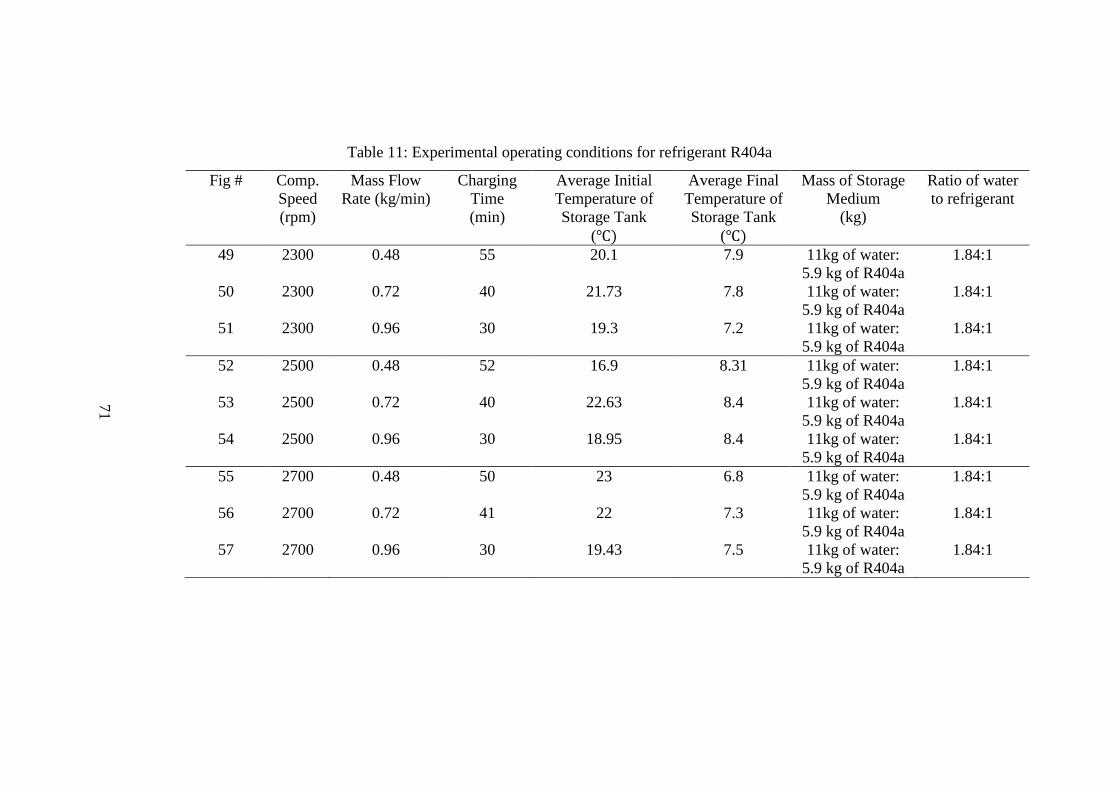
71
Table 11: Experimental operating conditions for refrigerant R404a
Fig # Comp.
Speed
(rpm)
Mass Flow
Rate (kg/min)
Charging
Time
(min)
Average Initial
Temperature of
Storage Tank
(℃)
Average Final
Temperature of
Storage Tank
(℃)
Mass of Storage
Medium
(kg)
Ratio of water
to refrigerant
49
2300 0.48 55 20.1 7.9 11kg of water:
5.9 kg of R404a
1.84:1
50
2300 0.72 40 21.73 7.8 11kg of water:
5.9 kg of R404a
1.84:1
51
2300 0.96 30 19.3 7.2 11kg of water:
5.9 kg of R404a
1.84:1
52
2500 0.48 52 16.9 8.31 11kg of water:
5.9 kg of R404a
1.84:1
53
2500 0.72 40 22.63 8.4 11kg of water:
5.9 kg of R404a
1.84:1
54
2500 0.96 30 18.95 8.4 11kg of water:
5.9 kg of R404a
1.84:1
55
2700 0.48 50 23 6.8 11kg of water:
5.9 kg of R404a
1.84:1
56
2700 0.72 41 22 7.3 11kg of water:
5.9 kg of R404a
1.84:1
57
2700 0.96 30 19.43 7.5 11kg of water:
5.9 kg of R404a
1.84:1
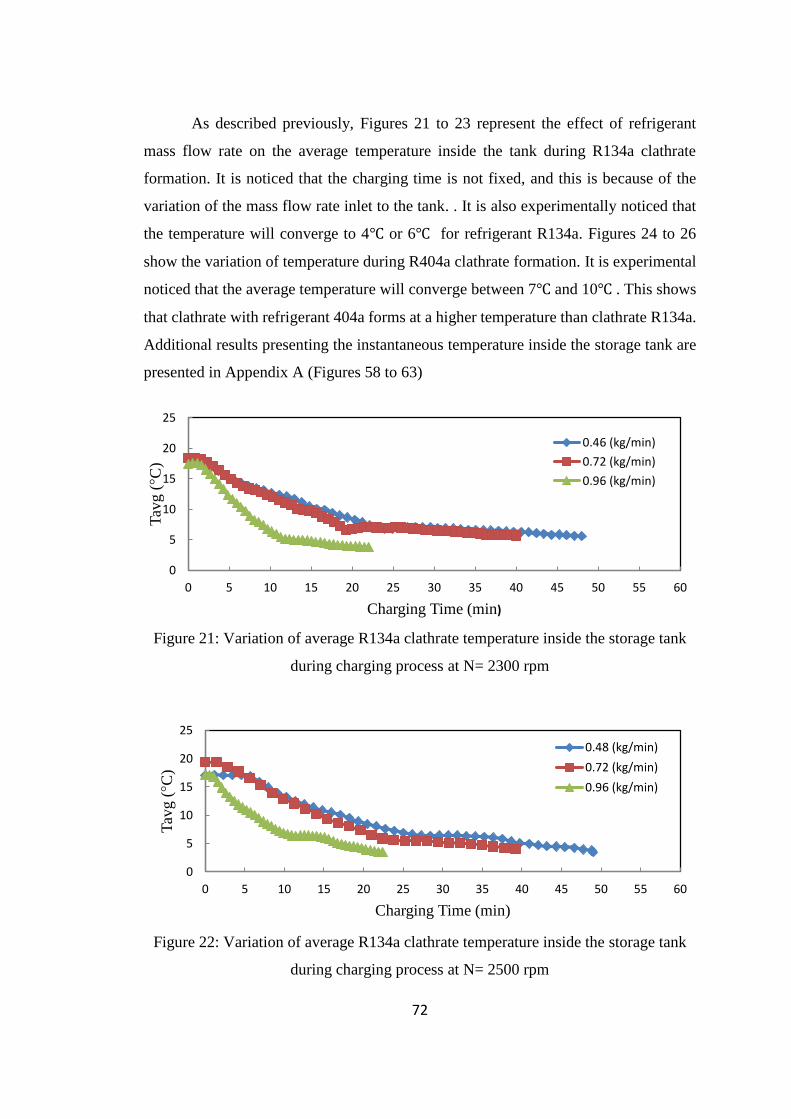
72
As described previously, Figures 21 to 23 represent the effect of refrigerant
mass flow rate on the average temperature inside the tank during R134a clathrate
formation. It is noticed that the charging time is not fixed, and this is because of the
variation of the mass flow rate inlet to the tank. . It is also experimentally noticed that
the temperature will converge to 4℃ or 6℃ for refrigerant R134a. Figures 24 to 26
show the variation of temperature during R404a clathrate formation. It is experimental
noticed that the average temperature will converge between 7℃ and 10℃ . This shows
that clathrate with refrigerant 404a forms at a higher temperature than clathrate R134a.
Additional results presenting the instantaneous temperature inside the storage tank are
presented in Appendix A (Figures 58 to 63)
Figure 21: Variation of average R134a clathrate temperature inside the storage tank
during charging process at N= 2300 rpm
Figure 22: Variation of average R134a clathrate temperature inside the storage tank
during charging process at N= 2500 rpm
0
5
10
15
20
25
0 5 10 15 20 25 30 35 40 45 50 55 60
Tav
g (
°C)
Charging Time (min)
0.46 (kg/min)
0.72 (kg/min)
0.96 (kg/min)
0
5
10
15
20
25
0 5 10 15 20 25 30 35 40 45 50 55 60
Tav
g (
°C)
Charging Time (min)
0.48 (kg/min)
0.72 (kg/min)
0.96 (kg/min)
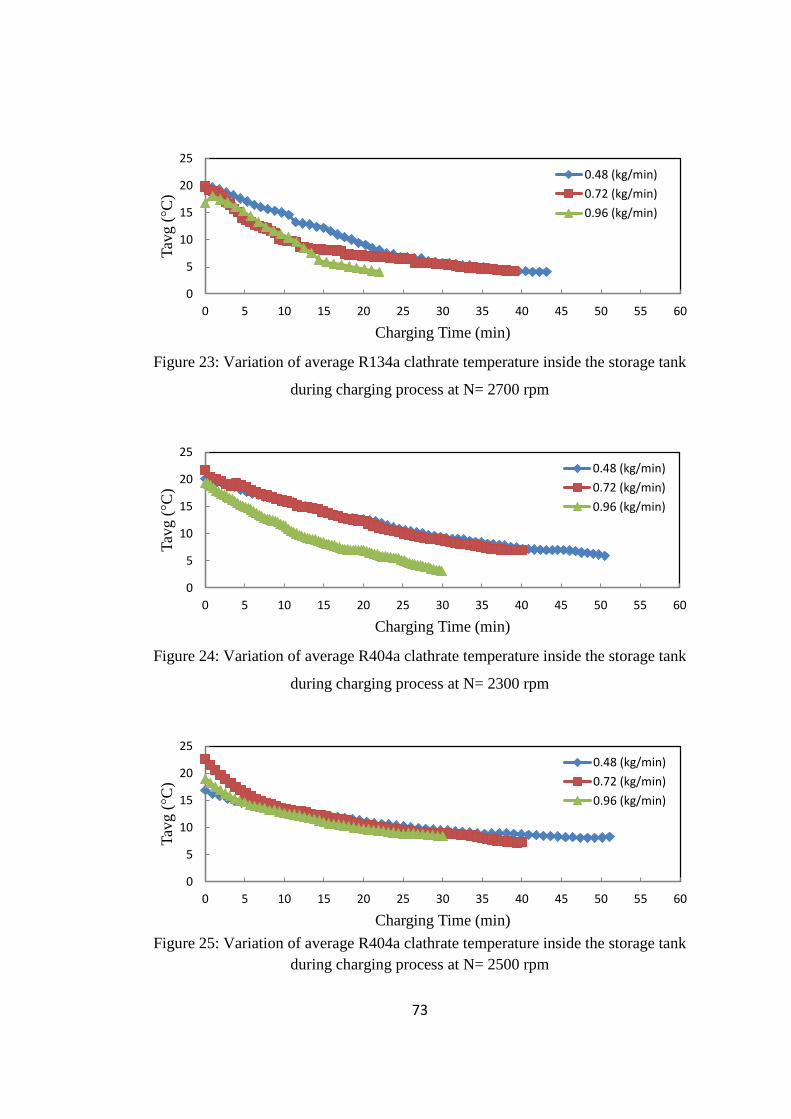
73
Figure 23: Variation of average R134a clathrate temperature inside the storage tank
during charging process at N= 2700 rpm
Figure 24: Variation of average R404a clathrate temperature inside the storage tank
during charging process at N= 2300 rpm
Figure 25: Variation of average R404a clathrate temperature inside the storage tank
during charging process at N= 2500 rpm
0
5
10
15
20
25
0 5 10 15 20 25 30 35 40 45 50 55 60
Tav
g (
°C)
Charging Time (min)
0.48 (kg/min)
0.72 (kg/min)
0.96 (kg/min)
0
5
10
15
20
25
0 5 10 15 20 25 30 35 40 45 50 55 60
Tav
g (
°C)
Charging Time (min)
0.48 (kg/min)
0.72 (kg/min)
0.96 (kg/min)
0
5
10
15
20
25
0 5 10 15 20 25 30 35 40 45 50 55 60
Tav
g (
°C)
Charging Time (min)
0.48 (kg/min)
0.72 (kg/min)
0.96 (kg/min)
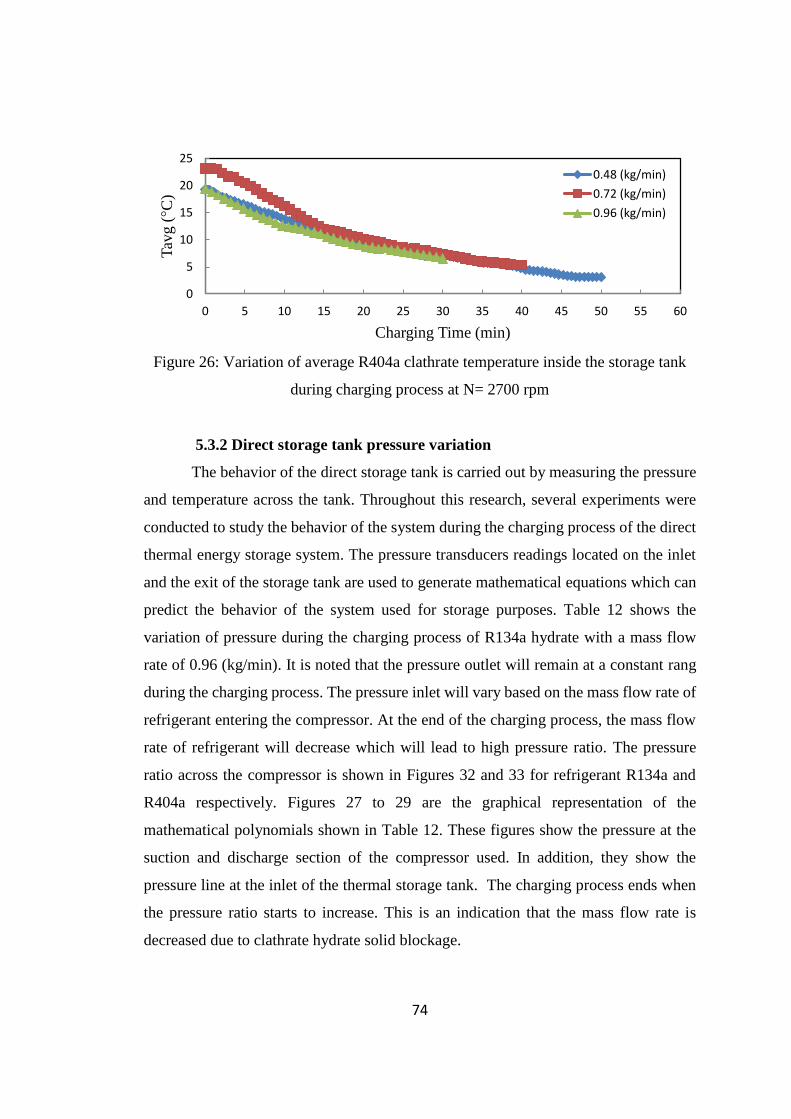
74
Figure 26: Variation of average R404a clathrate temperature inside the storage tank
during charging process at N= 2700 rpm
5.3.2 Direct storage tank pressure variation
The behavior of the direct storage tank is carried out by measuring the pressure
and temperature across the tank. Throughout this research, several experiments were
conducted to study the behavior of the system during the charging process of the direct
thermal energy storage system. The pressure transducers readings located on the inlet
and the exit of the storage tank are used to generate mathematical equations which can
predict the behavior of the system used for storage purposes. Table 12 shows the
variation of pressure during the charging process of R134a hydrate with a mass flow
rate of 0.96 (kg/min). It is noted that the pressure outlet will remain at a constant rang
during the charging process. The pressure inlet will vary based on the mass flow rate of
refrigerant entering the compressor. At the end of the charging process, the mass flow
rate of refrigerant will decrease which will lead to high pressure ratio. The pressure
ratio across the compressor is shown in Figures 32 and 33 for refrigerant R134a and
R404a respectively. Figures 27 to 29 are the graphical representation of the
mathematical polynomials shown in Table 12. These figures show the pressure at the
suction and discharge section of the compressor used. In addition, they show the
pressure line at the inlet of the thermal storage tank. The charging process ends when
the pressure ratio starts to increase. This is an indication that the mass flow rate is
decreased due to clathrate hydrate solid blockage.
0
5
10
15
20
25
0 5 10 15 20 25 30 35 40 45 50 55 60
Tav
g (
°C)
Charging Time (min)
0.48 (kg/min)
0.72 (kg/min)
0.96 (kg/min)
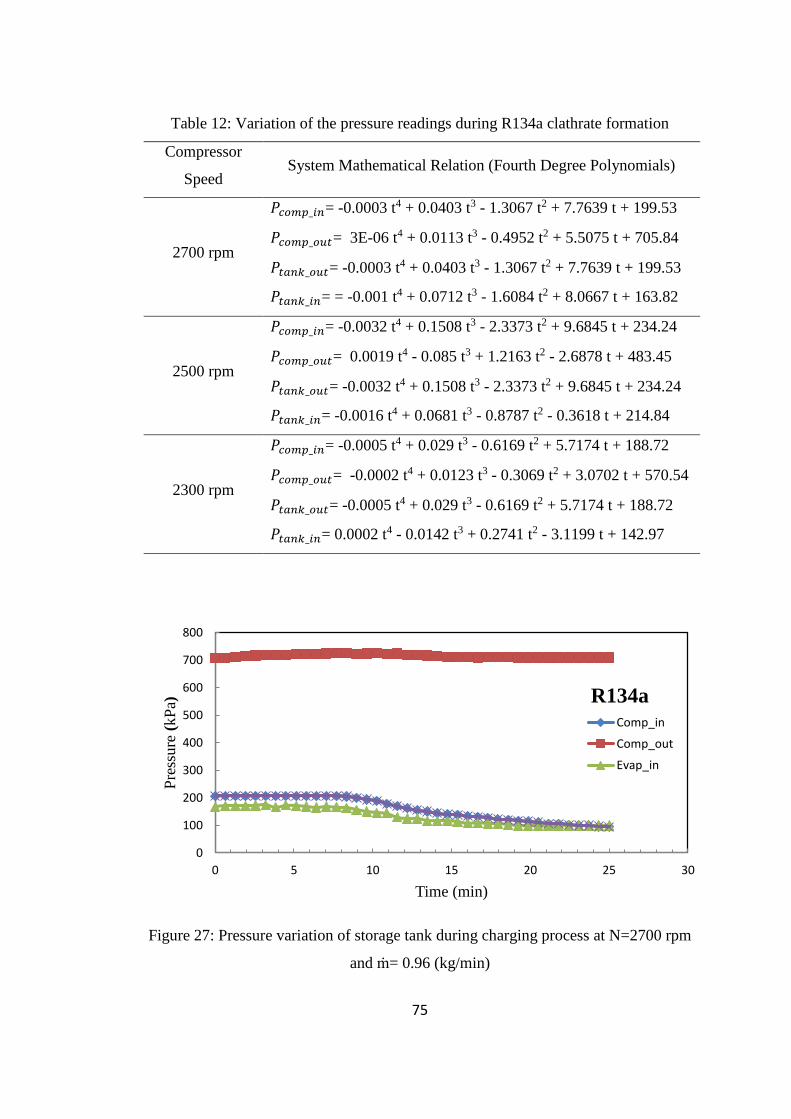
75
Table 12: Variation of the pressure readings during R134a clathrate formation
Compressor
Speed System Mathematical Relation (Fourth Degree Polynomials)
2700 rpm
𝑃𝑐𝑜𝑚𝑝_𝑖𝑛= -0.0003 t4 + 0.0403 t3 - 1.3067 t2 + 7.7639 t + 199.53
𝑃𝑐𝑜𝑚𝑝_𝑜𝑢𝑡= 3E-06 t4 + 0.0113 t3 - 0.4952 t2 + 5.5075 t + 705.84
𝑃𝑡𝑎𝑛𝑘_𝑜𝑢𝑡= -0.0003 t4 + 0.0403 t3 - 1.3067 t2 + 7.7639 t + 199.53
𝑃𝑡𝑎𝑛𝑘_𝑖𝑛= = -0.001 t4 + 0.0712 t3 - 1.6084 t2 + 8.0667 t + 163.82
2500 rpm
𝑃𝑐𝑜𝑚𝑝_𝑖𝑛= -0.0032 t4 + 0.1508 t3 - 2.3373 t2 + 9.6845 t + 234.24
𝑃𝑐𝑜𝑚𝑝_𝑜𝑢𝑡= 0.0019 t4 - 0.085 t3 + 1.2163 t2 - 2.6878 t + 483.45
𝑃𝑡𝑎𝑛𝑘_𝑜𝑢𝑡= -0.0032 t4 + 0.1508 t3 - 2.3373 t2 + 9.6845 t + 234.24
𝑃𝑡𝑎𝑛𝑘_𝑖𝑛= -0.0016 t4 + 0.0681 t3 - 0.8787 t2 - 0.3618 t + 214.84
2300 rpm
𝑃𝑐𝑜𝑚𝑝_𝑖𝑛= -0.0005 t4 + 0.029 t3 - 0.6169 t2 + 5.7174 t + 188.72
𝑃𝑐𝑜𝑚𝑝_𝑜𝑢𝑡= -0.0002 t4 + 0.0123 t3 - 0.3069 t2 + 3.0702 t + 570.54
𝑃𝑡𝑎𝑛𝑘_𝑜𝑢𝑡= -0.0005 t4 + 0.029 t3 - 0.6169 t2 + 5.7174 t + 188.72
𝑃𝑡𝑎𝑛𝑘_𝑖𝑛= 0.0002 t4 - 0.0142 t3 + 0.2741 t2 - 3.1199 t + 142.97
Figure 27: Pressure variation of storage tank during charging process at N=2700 rpm
and ṁ= 0.96 (kg/min)
0
100
200
300
400
500
600
700
800
0 5 10 15 20 25 30
Pre
ssure
(kP
a)
Time (min)
R134a
Comp_in
Comp_out
Evap_in
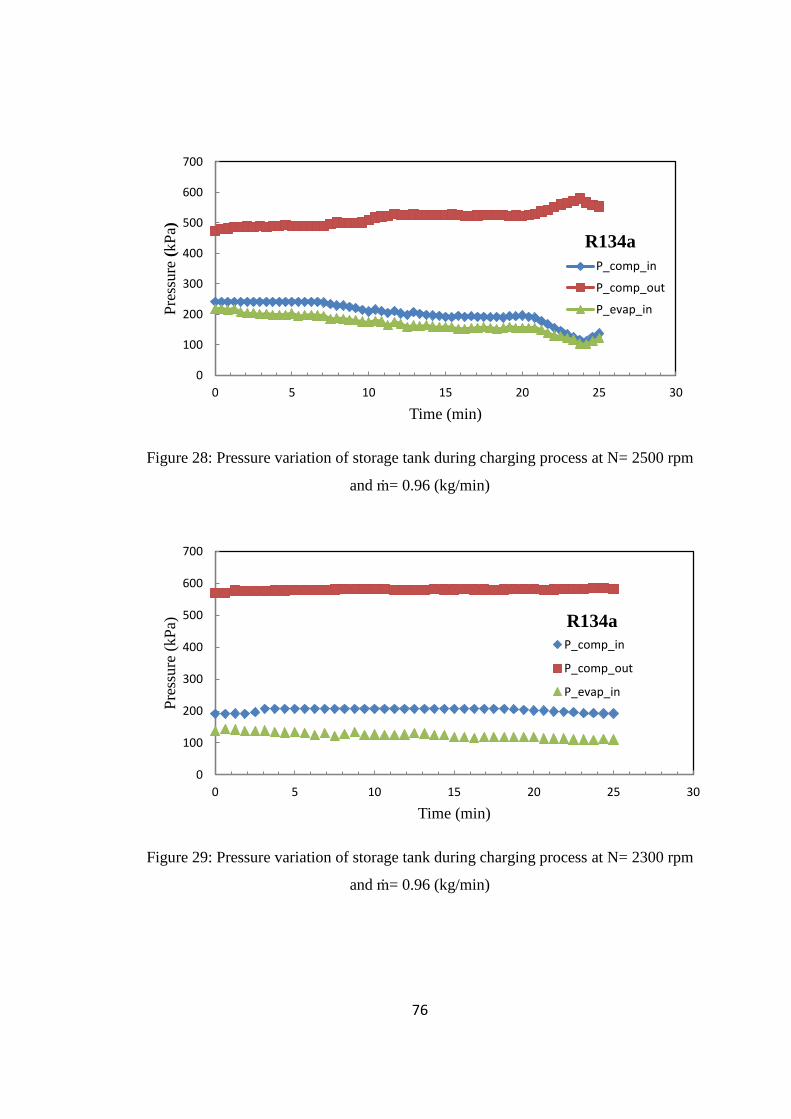
76
Figure 28: Pressure variation of storage tank during charging process at N= 2500 rpm
and ṁ= 0.96 (kg/min)
Figure 29: Pressure variation of storage tank during charging process at N= 2300 rpm
and ṁ= 0.96 (kg/min)
0
100
200
300
400
500
600
700
0 5 10 15 20 25 30
Pre
ssure
(kP
a)
Time (min)
R134a
P_comp_in
P_comp_out
P_evap_in
0
100
200
300
400
500
600
700
0 5 10 15 20 25 30
Pre
ssure
(kP
a)
Time (min)
R134a
P_comp_in
P_comp_out
P_evap_in
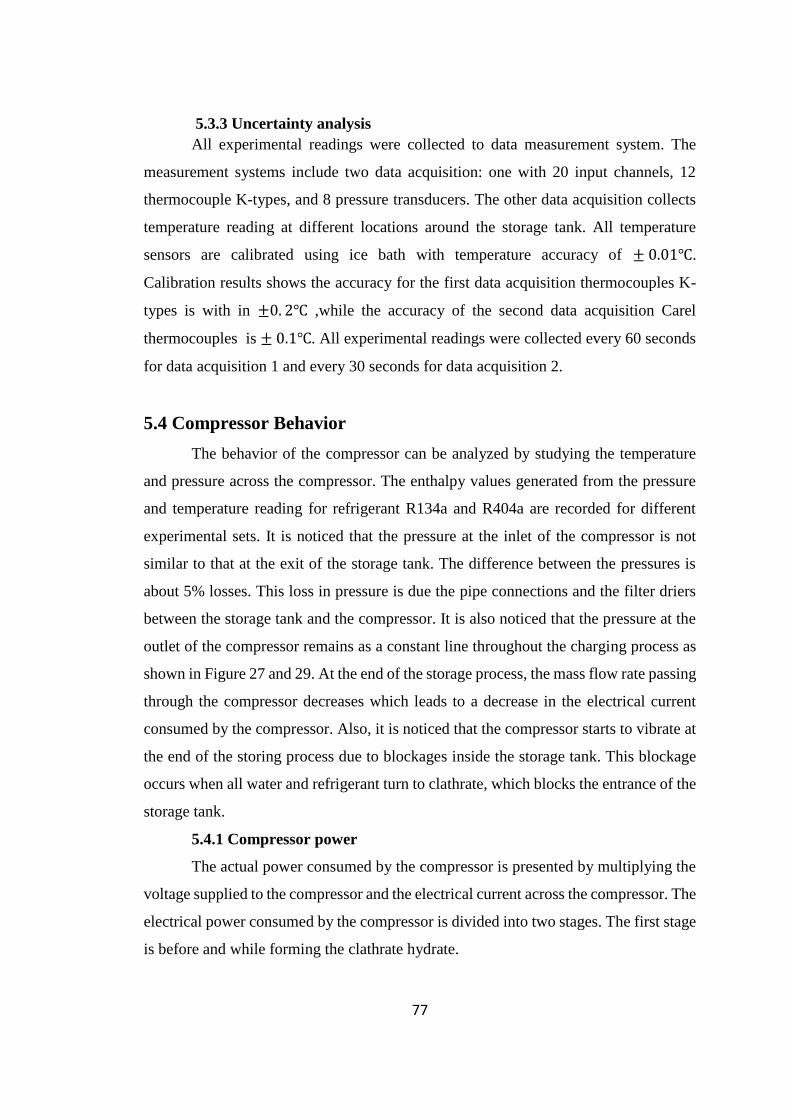
77
5.3.3 Uncertainty analysis
All experimental readings were collected to data measurement system. The
measurement systems include two data acquisition: one with 20 input channels, 12
thermocouple K-types, and 8 pressure transducers. The other data acquisition collects
temperature reading at different locations around the storage tank. All temperature
sensors are calibrated using ice bath with temperature accuracy of ± 0.01℃.
Calibration results shows the accuracy for the first data acquisition thermocouples K-
types is with in ±0. 2℃ ,while the accuracy of the second data acquisition Carel
thermocouples is ± 0.1℃. All experimental readings were collected every 60 seconds
for data acquisition 1 and every 30 seconds for data acquisition 2.
5.4 Compressor Behavior
The behavior of the compressor can be analyzed by studying the temperature
and pressure across the compressor. The enthalpy values generated from the pressure
and temperature reading for refrigerant R134a and R404a are recorded for different
experimental sets. It is noticed that the pressure at the inlet of the compressor is not
similar to that at the exit of the storage tank. The difference between the pressures is
about 5% losses. This loss in pressure is due the pipe connections and the filter driers
between the storage tank and the compressor. It is also noticed that the pressure at the
outlet of the compressor remains as a constant line throughout the charging process as
shown in Figure 27 and 29. At the end of the storage process, the mass flow rate passing
through the compressor decreases which leads to a decrease in the electrical current
consumed by the compressor. Also, it is noticed that the compressor starts to vibrate at
the end of the storing process due to blockages inside the storage tank. This blockage
occurs when all water and refrigerant turn to clathrate, which blocks the entrance of the
storage tank.
5.4.1 Compressor power
The actual power consumed by the compressor is presented by multiplying the
voltage supplied to the compressor and the electrical current across the compressor. The
electrical power consumed by the compressor is divided into two stages. The first stage
is before and while forming the clathrate hydrate.
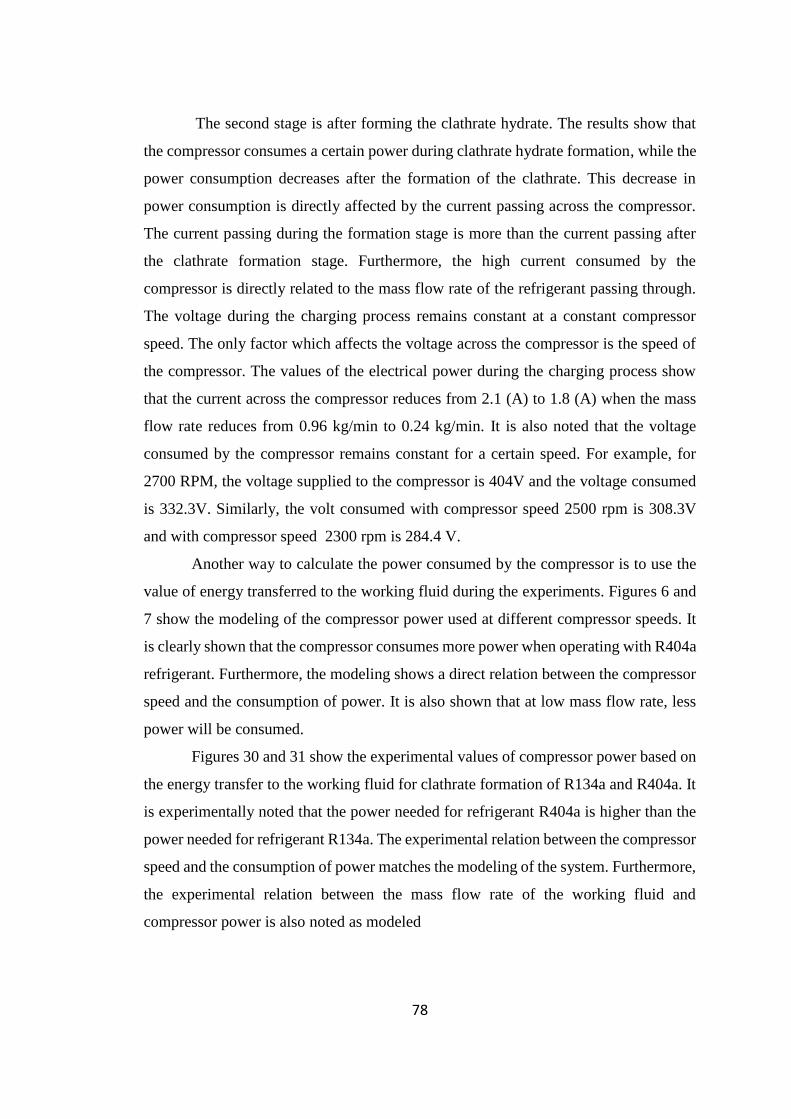
78
The second stage is after forming the clathrate hydrate. The results show that
the compressor consumes a certain power during clathrate hydrate formation, while the
power consumption decreases after the formation of the clathrate. This decrease in
power consumption is directly affected by the current passing across the compressor.
The current passing during the formation stage is more than the current passing after
the clathrate formation stage. Furthermore, the high current consumed by the
compressor is directly related to the mass flow rate of the refrigerant passing through.
The voltage during the charging process remains constant at a constant compressor
speed. The only factor which affects the voltage across the compressor is the speed of
the compressor. The values of the electrical power during the charging process show
that the current across the compressor reduces from 2.1 (A) to 1.8 (A) when the mass
flow rate reduces from 0.96 kg/min to 0.24 kg/min. It is also noted that the voltage
consumed by the compressor remains constant for a certain speed. For example, for
2700 RPM, the voltage supplied to the compressor is 404V and the voltage consumed
is 332.3V. Similarly, the volt consumed with compressor speed 2500 rpm is 308.3V
and with compressor speed 2300 rpm is 284.4 V.
Another way to calculate the power consumed by the compressor is to use the
value of energy transferred to the working fluid during the experiments. Figures 6 and
7 show the modeling of the compressor power used at different compressor speeds. It
is clearly shown that the compressor consumes more power when operating with R404a
refrigerant. Furthermore, the modeling shows a direct relation between the compressor
speed and the consumption of power. It is also shown that at low mass flow rate, less
power will be consumed.
Figures 30 and 31 show the experimental values of compressor power based on
the energy transfer to the working fluid for clathrate formation of R134a and R404a. It
is experimentally noted that the power needed for refrigerant R404a is higher than the
power needed for refrigerant R134a. The experimental relation between the compressor
speed and the consumption of power matches the modeling of the system. Furthermore,
the experimental relation between the mass flow rate of the working fluid and
compressor power is also noted as modeled
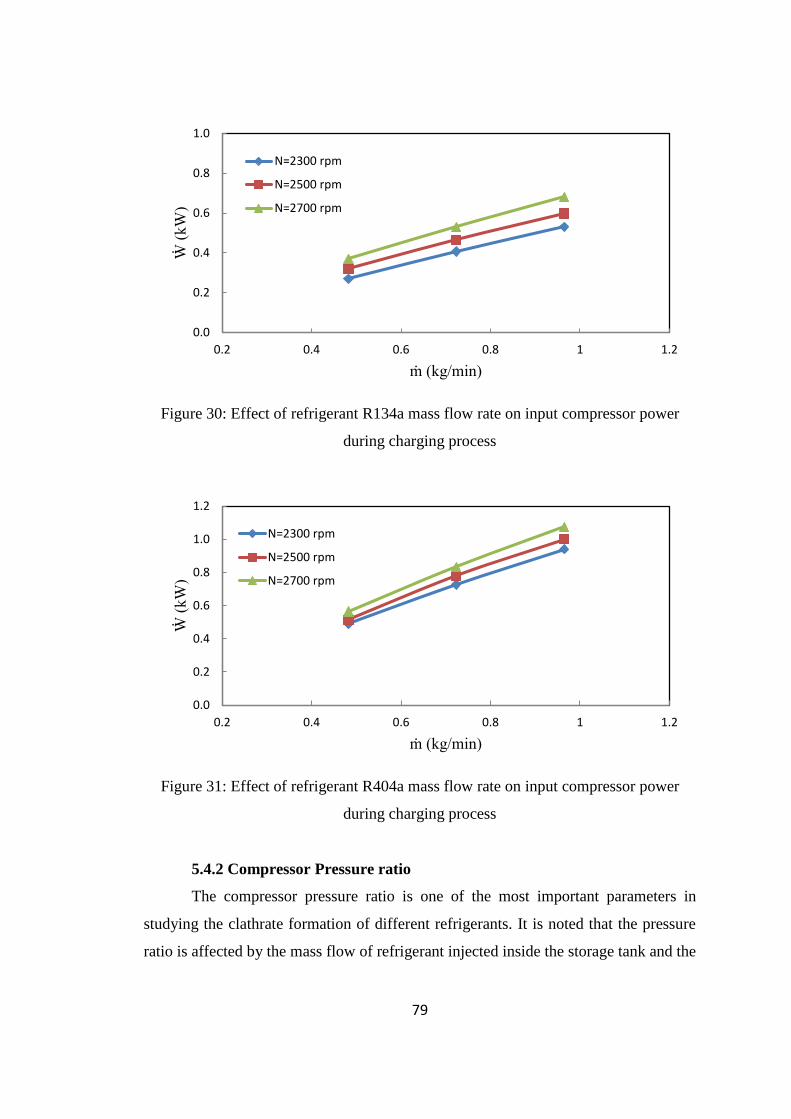
79
Figure 30: Effect of refrigerant R134a mass flow rate on input compressor power
during charging process
Figure 31: Effect of refrigerant R404a mass flow rate on input compressor power
during charging process
5.4.2 Compressor Pressure ratio
The compressor pressure ratio is one of the most important parameters in
studying the clathrate formation of different refrigerants. It is noted that the pressure
ratio is affected by the mass flow of refrigerant injected inside the storage tank and the
0.0
0.2
0.4
0.6
0.8
1.0
0.2 0.4 0.6 0.8 1 1.2
Ẇ (
kW
)
ṁ (kg/min)
N=2300 rpm
N=2500 rpm
N=2700 rpm
0.0
0.2
0.4
0.6
0.8
1.0
1.2
0.2 0.4 0.6 0.8 1 1.2
Ẇ (
kW
)
ṁ (kg/min)
N=2300 rpm
N=2500 rpm
N=2700 rpm
80
compressor speed. The compressor pressure ratio varies with different speeds according
to the following equation for R134a.
(𝑃𝑜/𝑃𝑖)𝑖 =(-0.0472 �̇�𝑟2 -3.3568 �̇�𝑟 + 6.3591)*[1 +
(𝑁𝑖 − 2700)] - (1.5663�̇�𝑟2 – 0.6217�̇�𝑟 + 4.9727)*
[1 + (𝑁𝑖 − 2500)] + (5.1258�̇�𝑟2 – 10.084�̇�𝑟 + 7.8748*[1 +
(𝑁𝑖 − 2300)]
(5.1)
The variation of the compressor pressure ratio for refrigerant R134a is shown
in Figure 32. The results show that the highest compression ratio occurs at high
compressor speeds and lower refrigerant mass flow rate. On the other hand, all pressure
ratios at high mass flow rates converge to lower compression values at all compressor
speeds.
Figure 32: Effect of R134a mass flow rate on compressor ratio at different compressor
speed during charging process
On the other hand, the compressor pressure ratio for refrigerant R404a varies with
different speeds according to the following equation;
(𝑃𝑜/𝑃𝑖)𝑖 =(4.6173 �̇�𝑟2 – 10.208 �̇�𝑟 + 10.593)* [1 +
(𝑁𝑖 − 2700)] -(0.1891 �̇�𝑟2 + 2.4933 �̇�𝑟 + 7.3695)*[1 +
(𝑁𝑖 − 2500) + (1.4404 �̇�𝑟2 – 3.5249 �̇�𝑟 + 6.9719)* [1 +
(𝑁𝑖 − 2300)]
( 5.2)
0
2
4
6
8
10
0 0.2 0.4 0.6 0.8 1 1.2 1.4
CR
ṁ (kg/min)
N=2300 rpm
N=2500 rpm
N=2700 rpm
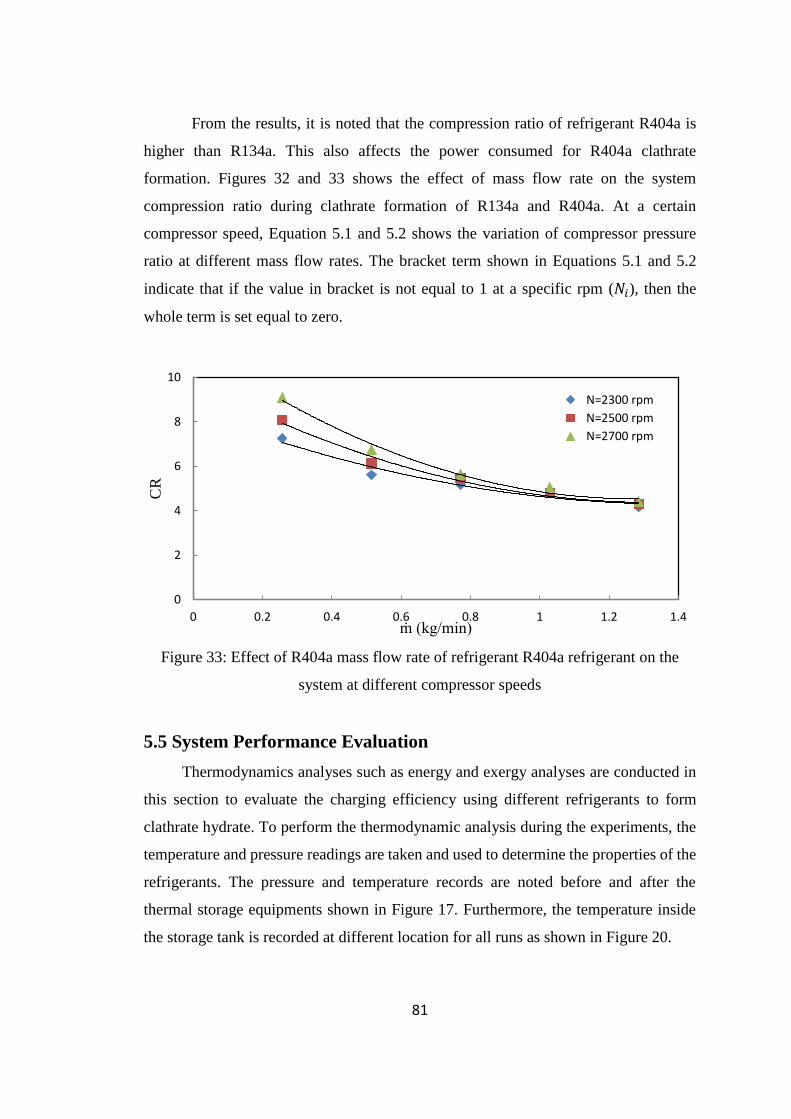
81
From the results, it is noted that the compression ratio of refrigerant R404a is
higher than R134a. This also affects the power consumed for R404a clathrate
formation. Figures 32 and 33 shows the effect of mass flow rate on the system
compression ratio during clathrate formation of R134a and R404a. At a certain
compressor speed, Equation 5.1 and 5.2 shows the variation of compressor pressure
ratio at different mass flow rates. The bracket term shown in Equations 5.1 and 5.2
indicate that if the value in bracket is not equal to 1 at a specific rpm (𝑁𝑖), then the
whole term is set equal to zero.
Figure 33: Effect of R404a mass flow rate of refrigerant R404a refrigerant on the
system at different compressor speeds
5.5 System Performance Evaluation
Thermodynamics analyses such as energy and exergy analyses are conducted in
this section to evaluate the charging efficiency using different refrigerants to form
clathrate hydrate. To perform the thermodynamic analysis during the experiments, the
temperature and pressure readings are taken and used to determine the properties of the
refrigerants. The pressure and temperature records are noted before and after the
thermal storage equipments shown in Figure 17. Furthermore, the temperature inside
the storage tank is recorded at different location for all runs as shown in Figure 20.
0
2
4
6
8
10
0 0.2 0.4 0.6 0.8 1 1.2 1.4
CR
ṁ (kg/min)
N=2300 rpm
N=2500 rpm
N=2700 rpm
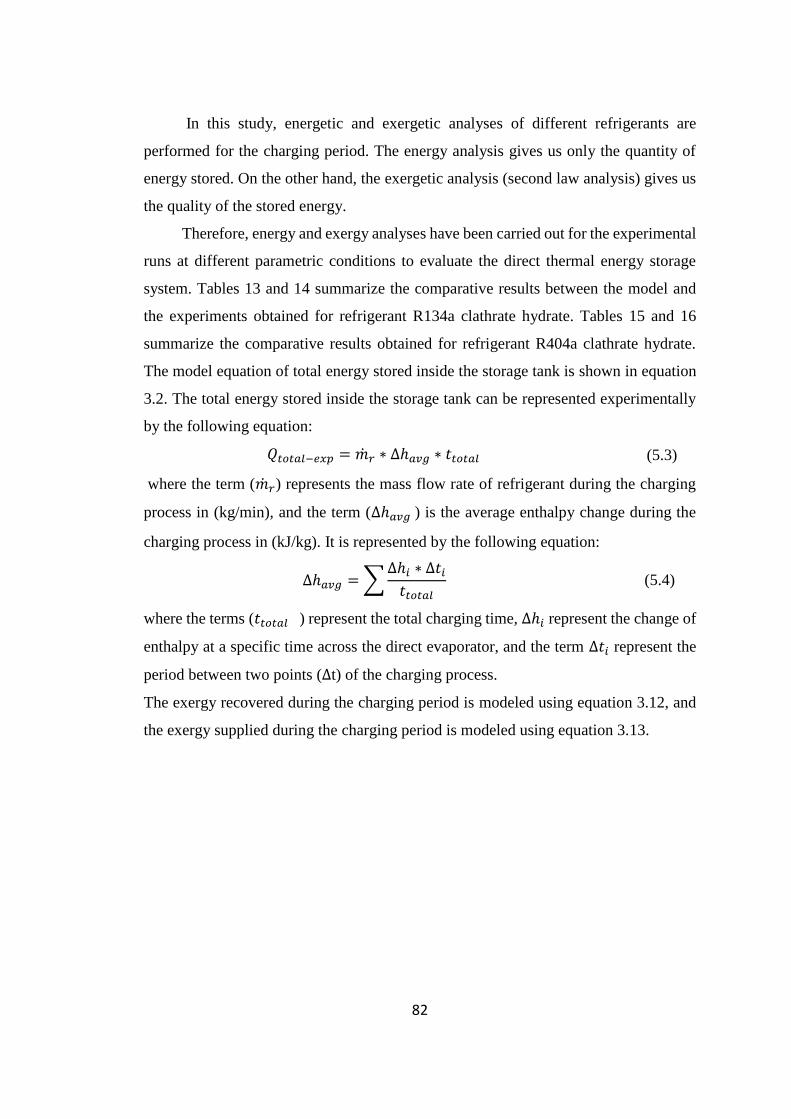
82
In this study, energetic and exergetic analyses of different refrigerants are
performed for the charging period. The energy analysis gives us only the quantity of
energy stored. On the other hand, the exergetic analysis (second law analysis) gives us
the quality of the stored energy.
Therefore, energy and exergy analyses have been carried out for the experimental
runs at different parametric conditions to evaluate the direct thermal energy storage
system. Tables 13 and 14 summarize the comparative results between the model and
the experiments obtained for refrigerant R134a clathrate hydrate. Tables 15 and 16
summarize the comparative results obtained for refrigerant R404a clathrate hydrate.
The model equation of total energy stored inside the storage tank is shown in equation
3.2. The total energy stored inside the storage tank can be represented experimentally
by the following equation:
𝑄𝑡𝑜𝑡𝑎𝑙−𝑒𝑥𝑝 = �̇�𝑟 ∗ ∆ℎ𝑎𝑣𝑔 ∗ 𝑡𝑡𝑜𝑡𝑎𝑙 (5.3)
where the term (�̇�𝑟) represents the mass flow rate of refrigerant during the charging
process in (kg/min), and the term (∆ℎ𝑎𝑣𝑔 ) is the average enthalpy change during the
charging process in (kJ/kg). It is represented by the following equation:
∆ℎ𝑎𝑣𝑔 = ∆ℎ𝑖 ∗ ∆𝑡𝑖𝑡𝑡𝑜𝑡𝑎𝑙
(5.4)
where the terms (𝑡𝑡𝑜𝑡𝑎𝑙 ) represent the total charging time, ∆ℎ𝑖 represent the change of
enthalpy at a specific time across the direct evaporator, and the term ∆𝑡𝑖 represent the
period between two points (∆t) of the charging process.
The exergy recovered during the charging period is modeled using equation 3.12, and
the exergy supplied during the charging period is modeled using equation 3.13.
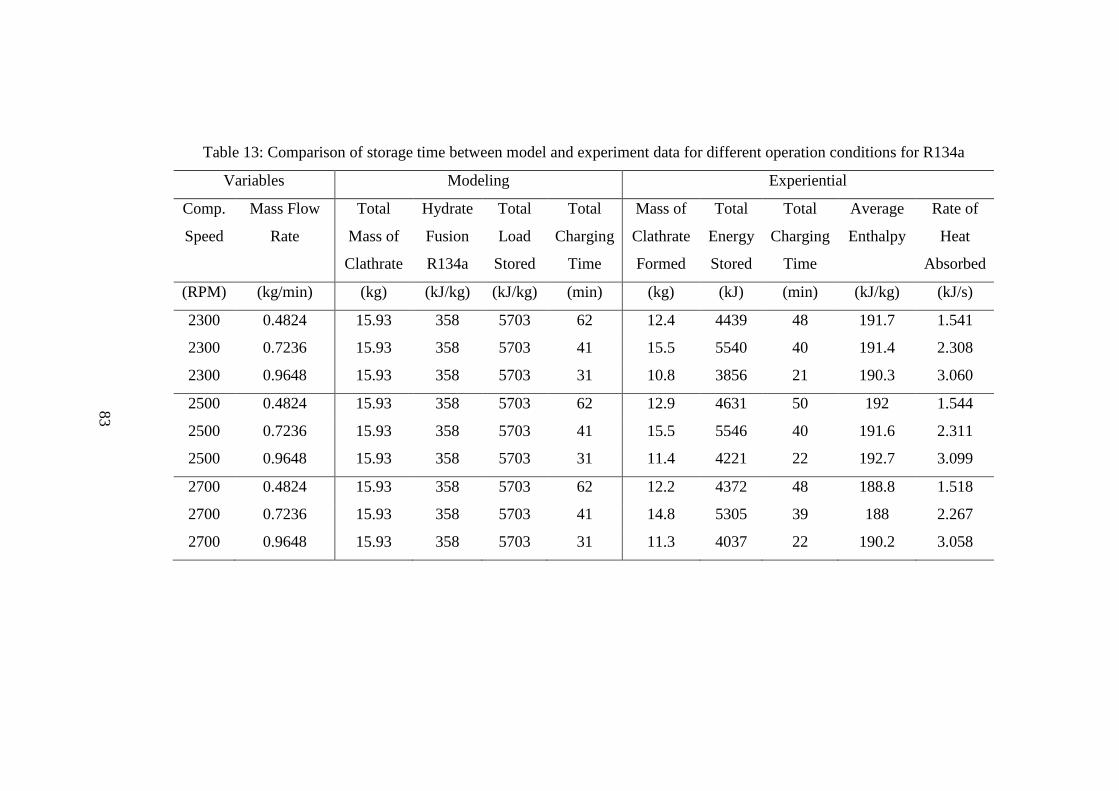
83
Table 13: Comparison of storage time between model and experiment data for different operation conditions for R134a
Variables Modeling Experiential
Comp.
Speed
Mass Flow
Rate
Total
Mass of
Clathrate
Hydrate
Fusion
R134a
Total
Load
Stored
Total
Charging
Time
Mass of
Clathrate
Formed
Total
Energy
Stored
Total
Charging
Time
Average
Enthalpy
Rate of
Heat
Absorbed
(RPM) (kg/min) (kg) (kJ/kg) (kJ/kg) (min) (kg) (kJ) (min) (kJ/kg) (kJ/s)
2300 0.4824 15.93 358 5703 62 12.4 4439 48 191.7 1.541
2300 0.7236 15.93 358 5703 41 15.5 5540 40 191.4 2.308
2300 0.9648 15.93 358 5703 31 10.8 3856 21 190.3 3.060
2500 0.4824 15.93 358 5703 62 12.9 4631 50 192 1.544
2500 0.7236 15.93 358 5703 41 15.5 5546 40 191.6 2.311
2500 0.9648 15.93 358 5703 31 11.4 4221 22 192.7 3.099
2700 0.4824 15.93 358 5703 62 12.2 4372 48 188.8 1.518
2700 0.7236 15.93 358 5703 41 14.8 5305 39 188 2.267
2700 0.9648 15.93 358 5703 31 11.3 4037 22 190.2 3.058
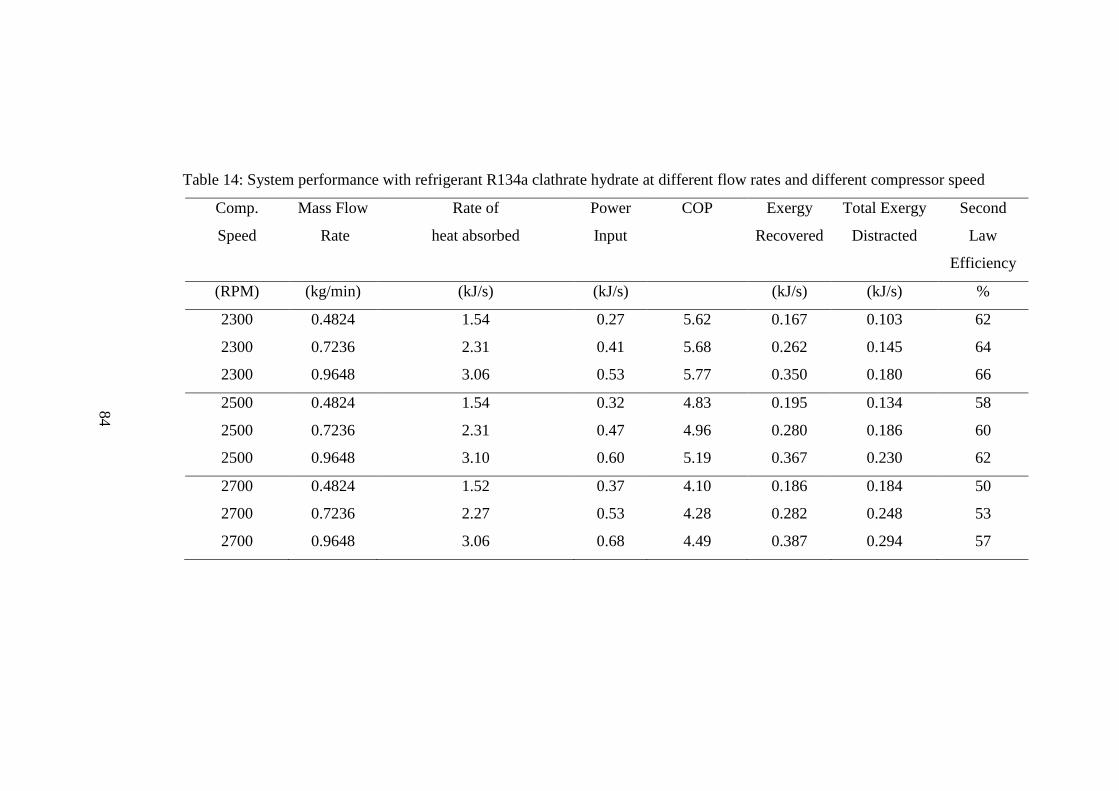
84
Table 14: System performance with refrigerant R134a clathrate hydrate at different flow rates and different compressor speed
Comp.
Speed
Mass Flow
Rate
Rate of
heat absorbed
Power
Input
COP
Exergy
Recovered
Total Exergy
Distracted
Second
Law
Efficiency
(RPM) (kg/min) (kJ/s) (kJ/s) (kJ/s) (kJ/s) %
2300 0.4824 1.54 0.27 5.62 0.167 0.103 62
2300 0.7236 2.31 0.41 5.68 0.262 0.145 64
2300 0.9648 3.06 0.53 5.77 0.350 0.180 66
2500 0.4824 1.54 0.32 4.83 0.195 0.134 58
2500 0.7236 2.31 0.47 4.96 0.280 0.186 60
2500 0.9648 3.10 0.60 5.19 0.367 0.230 62
2700 0.4824 1.52 0.37 4.10 0.186 0.184 50
2700 0.7236 2.27 0.53 4.28 0.282 0.248 53
2700 0.9648 3.06 0.68 4.49 0.387 0.294 57
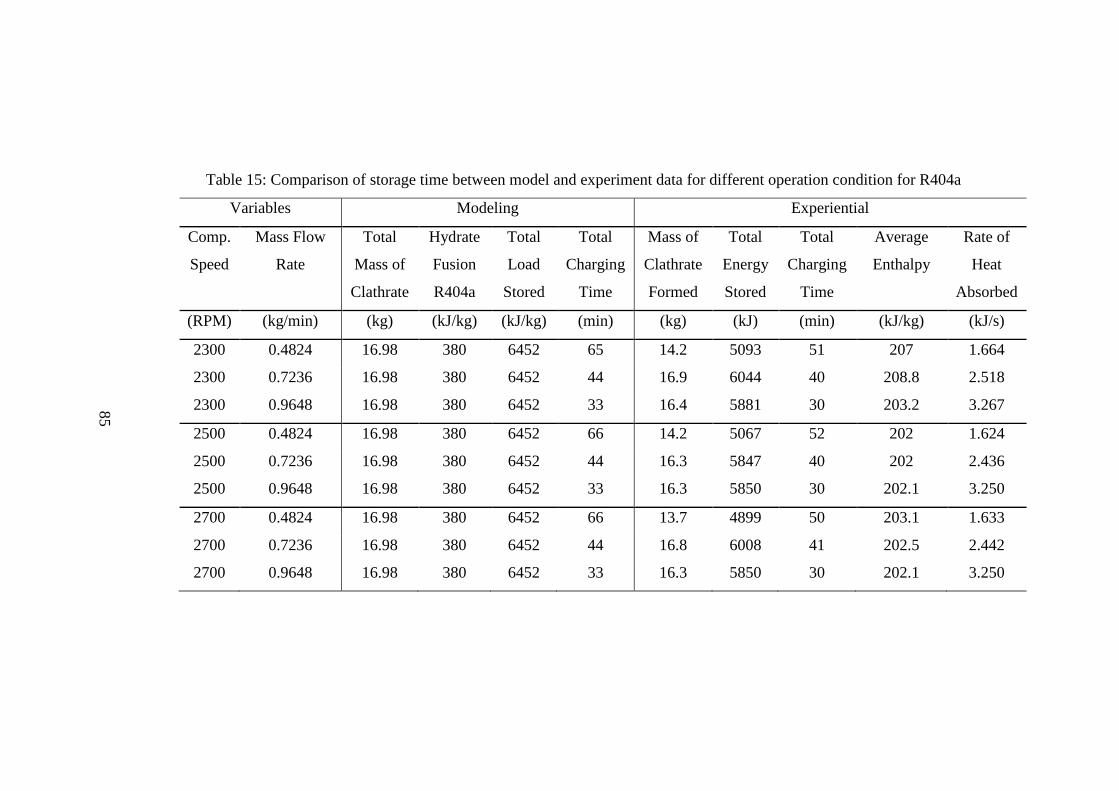
85
Table 15: Comparison of storage time between model and experiment data for different operation condition for R404a
Variables Modeling Experiential
Comp.
Speed
Mass Flow
Rate
Total
Mass of
Clathrate
Hydrate
Fusion
R404a
Total
Load
Stored
Total
Charging
Time
Mass of
Clathrate
Formed
Total
Energy
Stored
Total
Charging
Time
Average
Enthalpy
Rate of
Heat
Absorbed
(RPM) (kg/min) (kg) (kJ/kg) (kJ/kg) (min) (kg) (kJ) (min) (kJ/kg) (kJ/s)
2300 0.4824 16.98 380 6452 65 14.2 5093 51 207 1.664
2300 0.7236 16.98 380 6452 44 16.9 6044 40 208.8 2.518
2300 0.9648 16.98 380 6452 33 16.4 5881 30 203.2 3.267
2500 0.4824 16.98 380 6452 66 14.2 5067 52 202 1.624
2500 0.7236 16.98 380 6452 44 16.3 5847 40 202 2.436
2500 0.9648 16.98 380 6452 33 16.3 5850 30 202.1 3.250
2700 0.4824 16.98 380 6452 66 13.7 4899 50 203.1 1.633
2700 0.7236 16.98 380 6452 44 16.8 6008 41 202.5 2.442
2700 0.9648 16.98 380 6452 33 16.3 5850 30 202.1 3.250
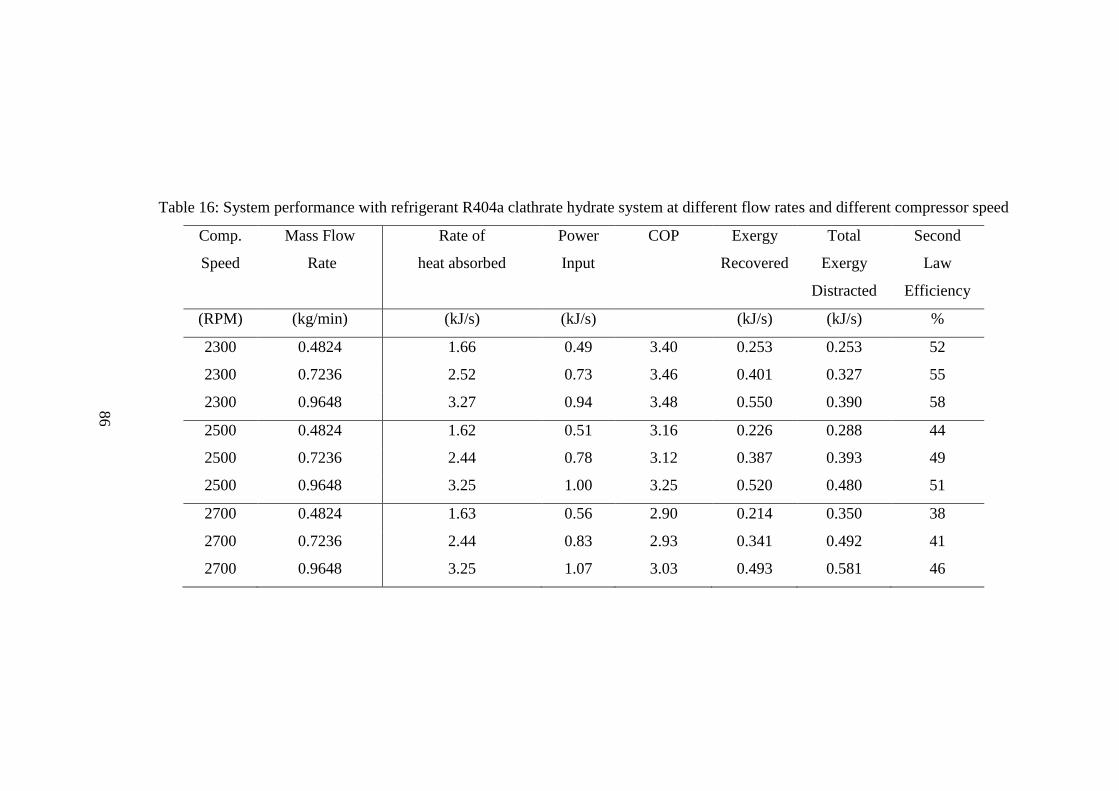
86
Table 16: System performance with refrigerant R404a clathrate hydrate system at different flow rates and different compressor speed
Comp.
Speed
Mass Flow
Rate
Rate of
heat absorbed
Power
Input
COP Exergy
Recovered
Total
Exergy
Distracted
Second
Law
Efficiency
(RPM) (kg/min) (kJ/s) (kJ/s) (kJ/s) (kJ/s) %
2300 0.4824 1.66 0.49 3.40 0.253 0.253 52
2300 0.7236 2.52 0.73 3.46 0.401 0.327 55
2300 0.9648 3.27 0.94 3.48 0.550 0.390 58
2500 0.4824 1.62 0.51 3.16 0.226 0.288 44
2500 0.7236 2.44 0.78 3.12 0.387 0.393 49
2500 0.9648 3.25 1.00 3.25 0.520 0.480 51
2700 0.4824 1.63 0.56 2.90 0.214 0.350 38
2700 0.7236 2.44 0.83 2.93 0.341 0.492 41
2700 0.9648 3.25 1.07 3.03 0.493 0.581 46
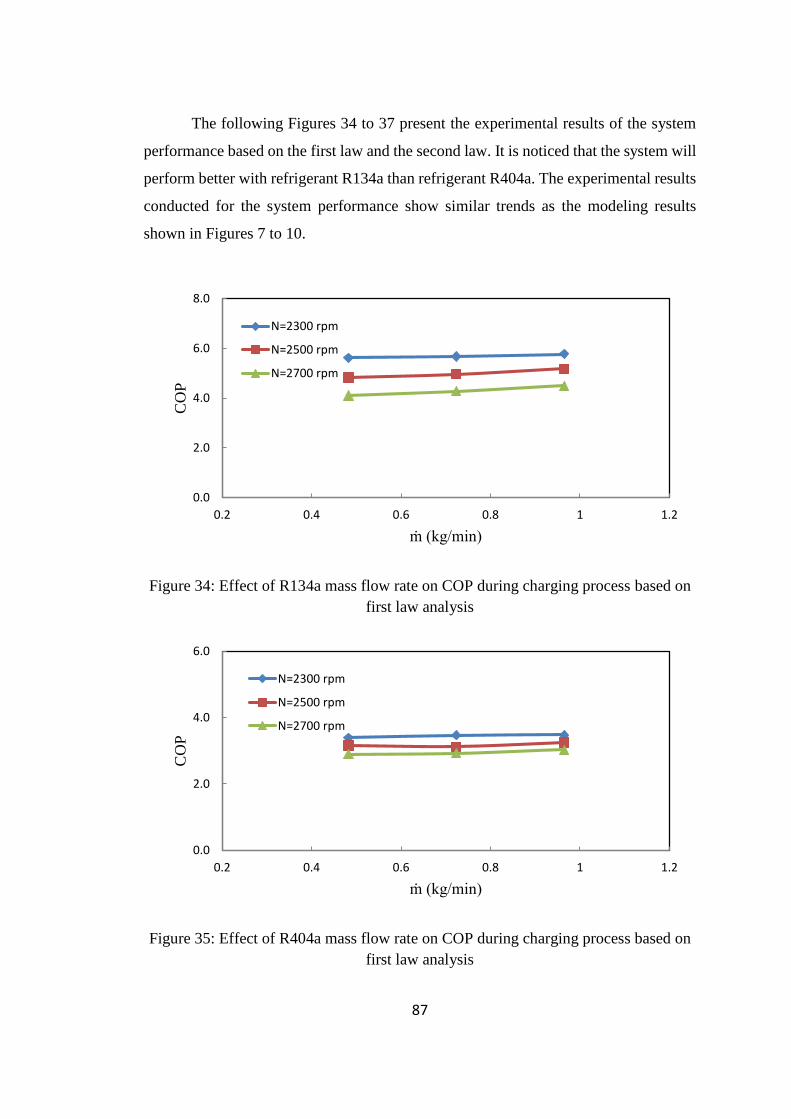
87
The following Figures 34 to 37 present the experimental results of the system
performance based on the first law and the second law. It is noticed that the system will
perform better with refrigerant R134a than refrigerant R404a. The experimental results
conducted for the system performance show similar trends as the modeling results
shown in Figures 7 to 10.
Figure 34: Effect of R134a mass flow rate on COP during charging process based on
first law analysis
Figure 35: Effect of R404a mass flow rate on COP during charging process based on
first law analysis
0.0
2.0
4.0
6.0
8.0
0.2 0.4 0.6 0.8 1 1.2
CO
P
ṁ (kg/min)
N=2300 rpm
N=2500 rpm
N=2700 rpm
0.0
2.0
4.0
6.0
0.2 0.4 0.6 0.8 1 1.2
CO
P
ṁ (kg/min)
N=2300 rpm
N=2500 rpm
N=2700 rpm
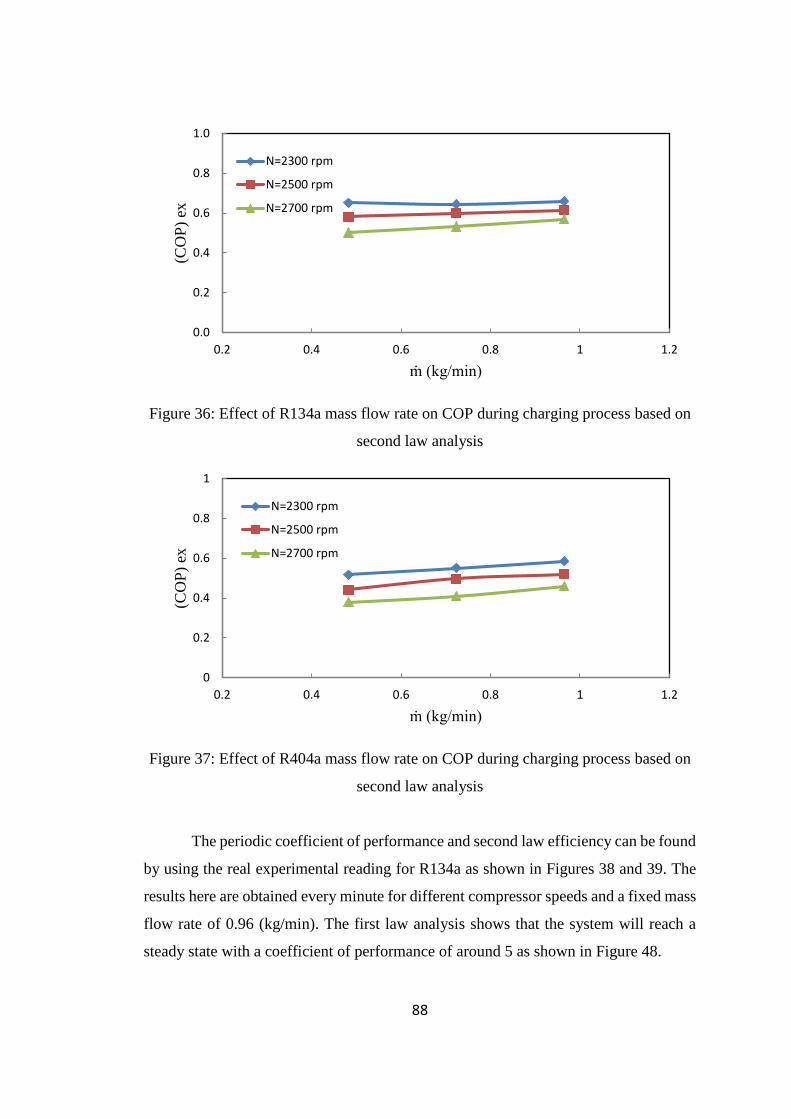
88
Figure 36: Effect of R134a mass flow rate on COP during charging process based on
second law analysis
Figure 37: Effect of R404a mass flow rate on COP during charging process based on
second law analysis
The periodic coefficient of performance and second law efficiency can be found
by using the real experimental reading for R134a as shown in Figures 38 and 39. The
results here are obtained every minute for different compressor speeds and a fixed mass
flow rate of 0.96 (kg/min). The first law analysis shows that the system will reach a
steady state with a coefficient of performance of around 5 as shown in Figure 48.
0.0
0.2
0.4
0.6
0.8
1.0
0.2 0.4 0.6 0.8 1 1.2
(CO
P)
ex
ṁ (kg/min)
N=2300 rpm
N=2500 rpm
N=2700 rpm
0
0.2
0.4
0.6
0.8
1
0.2 0.4 0.6 0.8 1 1.2
(CO
P)
ex
ṁ (kg/min)
N=2300 rpm
N=2500 rpm
N=2700 rpm
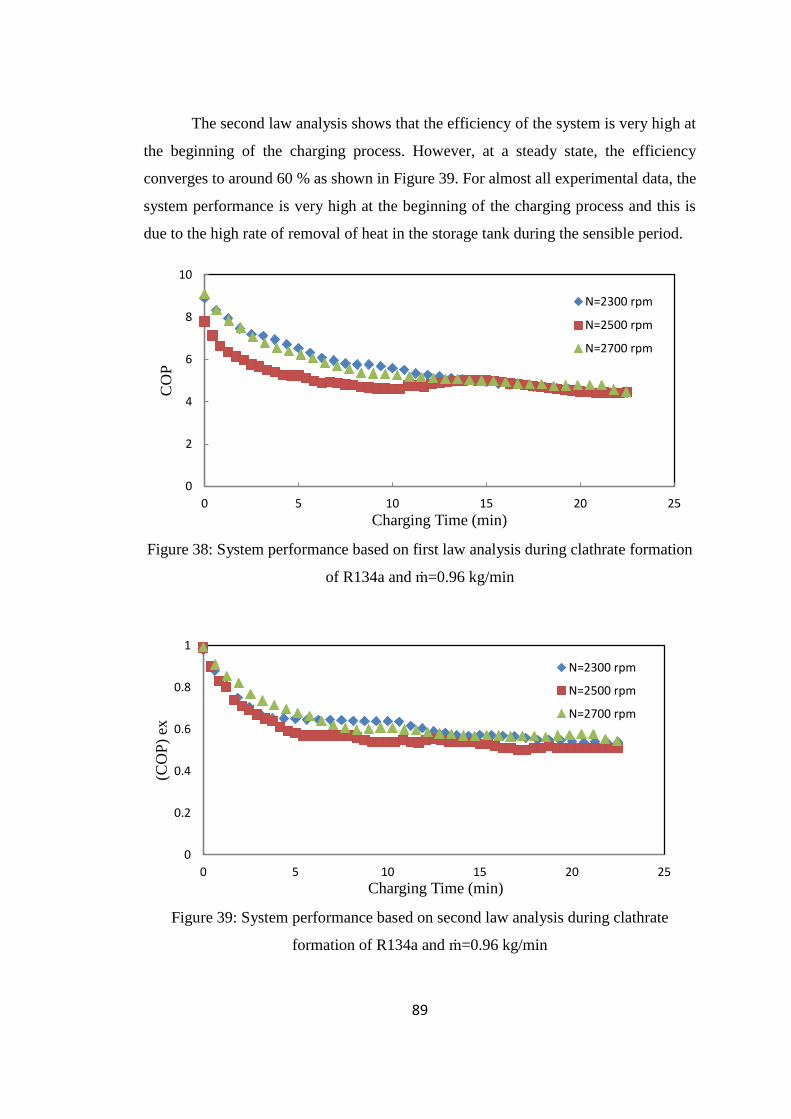
89
The second law analysis shows that the efficiency of the system is very high at
the beginning of the charging process. However, at a steady state, the efficiency
converges to around 60 % as shown in Figure 39. For almost all experimental data, the
system performance is very high at the beginning of the charging process and this is
due to the high rate of removal of heat in the storage tank during the sensible period.
Figure 38: System performance based on first law analysis during clathrate formation
of R134a and ṁ=0.96 kg/min
Figure 39: System performance based on second law analysis during clathrate
formation of R134a and ṁ=0.96 kg/min
0
2
4
6
8
10
0 5 10 15 20 25
CO
P
Charging Time (min)
N=2300 rpm
N=2500 rpm
N=2700 rpm
0
0.2
0.4
0.6
0.8
1
0 5 10 15 20 25
(CO
P)
ex
Charging Time (min)
N=2300 rpm
N=2500 rpm
N=2700 rpm
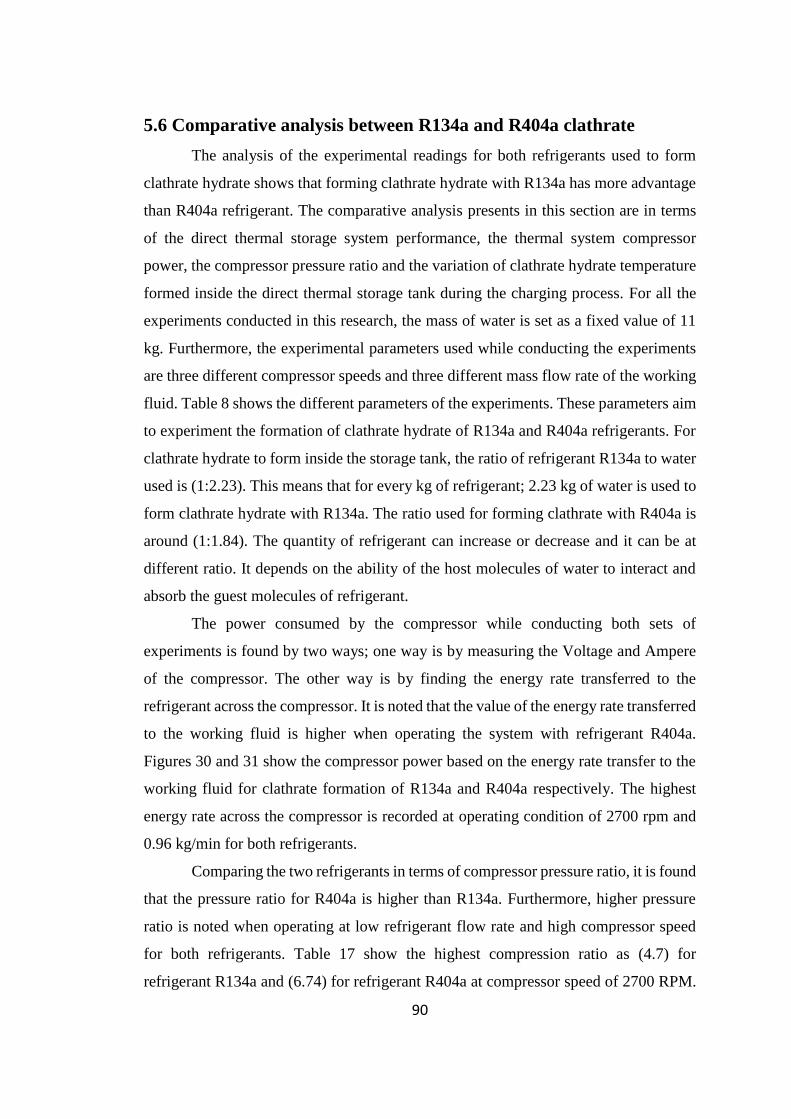
90
5.6 Comparative analysis between R134a and R404a clathrate
The analysis of the experimental readings for both refrigerants used to form
clathrate hydrate shows that forming clathrate hydrate with R134a has more advantage
than R404a refrigerant. The comparative analysis presents in this section are in terms
of the direct thermal storage system performance, the thermal system compressor
power, the compressor pressure ratio and the variation of clathrate hydrate temperature
formed inside the direct thermal storage tank during the charging process. For all the
experiments conducted in this research, the mass of water is set as a fixed value of 11
kg. Furthermore, the experimental parameters used while conducting the experiments
are three different compressor speeds and three different mass flow rate of the working
fluid. Table 8 shows the different parameters of the experiments. These parameters aim
to experiment the formation of clathrate hydrate of R134a and R404a refrigerants. For
clathrate hydrate to form inside the storage tank, the ratio of refrigerant R134a to water
used is (1:2.23). This means that for every kg of refrigerant; 2.23 kg of water is used to
form clathrate hydrate with R134a. The ratio used for forming clathrate with R404a is
around (1:1.84). The quantity of refrigerant can increase or decrease and it can be at
different ratio. It depends on the ability of the host molecules of water to interact and
absorb the guest molecules of refrigerant.
The power consumed by the compressor while conducting both sets of
experiments is found by two ways; one way is by measuring the Voltage and Ampere
of the compressor. The other way is by finding the energy rate transferred to the
refrigerant across the compressor. It is noted that the value of the energy rate transferred
to the working fluid is higher when operating the system with refrigerant R404a.
Figures 30 and 31 show the compressor power based on the energy rate transfer to the
working fluid for clathrate formation of R134a and R404a respectively. The highest
energy rate across the compressor is recorded at operating condition of 2700 rpm and
0.96 kg/min for both refrigerants.
Comparing the two refrigerants in terms of compressor pressure ratio, it is found
that the pressure ratio for R404a is higher than R134a. Furthermore, higher pressure
ratio is noted when operating at low refrigerant flow rate and high compressor speed
for both refrigerants. Table 17 show the highest compression ratio as (4.7) for
refrigerant R134a and (6.74) for refrigerant R404a at compressor speed of 2700 RPM.
91
Similarly, the lowest compression value is recorded while operating at 2300 RPM and
high mass flow rate. The effect of R134a and R404a mass flow rate on compressor
pressure ratio is shown in Figure 32 and 33 respectively
The performance of the thermal storage system is found by recording the
temperature and the pressure reading. Using the reading of temperature and pressure in
EES software, the instantaneous enthalpies for the refrigerant used in then noted. The
enthalpies readings across the compressor and the storage tank are then used to find the
coefficient of performance of the system. Comparing both refrigerants in terms of
system performance, it is noticed that the system has higher COP when R134a is used
as a working fluid. The COP of the system while forming R134a clathrate hydrate varies
between (4.1) and (5.77). The highest record for COP is during operating condition of
low compressor speed and high mass flow rate. Table 14 shows the range of operation
of different compressor speed and different refrigerant flow rate and the corresponded
coefficient of performance. Figure 34 shows the experimental COP results while
operating the system with R134a refrigerant. The COP of the system while forming
R404a clathrate hydrate varies between (2.9) and (3.48). Figure 35 shows the
experimental results recorded for the COP while forming R404a clathrate hydrate. For
R134a clathrate hydrate, the best operating condition shows COP of 5.62, 5.68 and 5.77
for compressor speed of 2300 rpm and mass flow rate of 0.48, 0.72 and 0.96 kg/min
respectively. For R404a clathrate hydrate, the best operating condition shows COP of
3.40, 3.46 and 3.48 for compressor speed of 2300 rpm and mass flow rate of 0.48, 0.72
and 0.96 kg/min respectively. Comparing the COP of both systems, it is clear that the
forming clathrate hydrate with R134a has higher COP than R404a.
The cooling capacity for both refrigerant clathrate hydrate varies based on the
operating condition. Tables 13 and 15 show the variation of the cooling capacity at
different operating condition. The cooling capacity is directly proportional to the latent
heat of fusion of the refrigerant used and the mass of refrigerant and water inside the
storage tank. The cooling load for R134a clathrate hydrate is 5703 kJ/kg, while the
cooling load for R404a is 6452 kJ/kg.
The temperature inside the storage while forming clathrate hydrate also varies
based on the operating conditions. Appendix A shows the temperature variation inside
the storage tank for all experimental runs. It is noticed that for refrigerant R134a, less
92
time is need to form clathrate hydrate when compared to refrigerant R404a. Operating
the system with high mass flow rate will require less time to form clathrate hydrate.
This concludes that the compressor speed has less effect than mass flow rate
when studying the time needed to form clathrate hydrate. As shown in Table 17, the
range of time needed to form clathrate hydrate with refrigerant R134a is around (21)
and (50) minutes at different operation of compressor speed and different mass flow
rate. Therefore, the formation time for clathrate hydrate will mainly depend on the mass
flow rate of the working fluid used. Comparing the results of the two refrigerants, it is
noted that R404a takes more time to form clathrate hydrate than R134a at the same
operating conditions.
The variation of temperature inside the storage tank during the charging process
of R134a clathrate hydrate is shown in Figures 40 to 48 in Appendix A. It is noted that
the temperature readings inside the storage tank will start decreasing gradually with
time to a certain temperature point, then all the temperature reading will have a constant
reading. Figure 40 for example, shows different temperature reading during operating
the system at compressor speed of 2300 rpm and mass flow rate of 0.48 kg/min with
R134a as a working fluid. Decreasing in temperature inside the storage tank is noted
from time (0) to (25) minutes. Later, the temperature readings remain at a certain value
as shown from time (25) to (45) minutes. Afterward, the temperature readings curves
will further decrease more as shown from time (45) to (50) minutes. The second period,
between 25-40 min, represents the latent heat of fusion for R134a clathrate formation.
While the third period shows that the clathrate is sub-cooled. Similarly, the variation of
temperature inside the storage tank during the charging process of R404a clathrate
hydrate is shown in Figures 49 to 57. The formation of R404a clathrate hydration at
operating condition of 2300 rpm and 0.48 kg/min is shown in Figure 49. It is noted that
more time is needed to form clathrate with R404a at the same operating conditions.
Figure 49 shows the variation of temperature reading inside the storage tank for R404
clathrate formation. It is also noted that the latent period for R404a is more than R134a.
This is also due to the thermal properties of the guest material of refrigerant hydrate as
shown in [65]. All temperature figures in Appendix A are arranged based on the
experimental sets shown in Table 10 for R134a clathrate hydrate and Table 11 for
R404a clathrate hydrate.
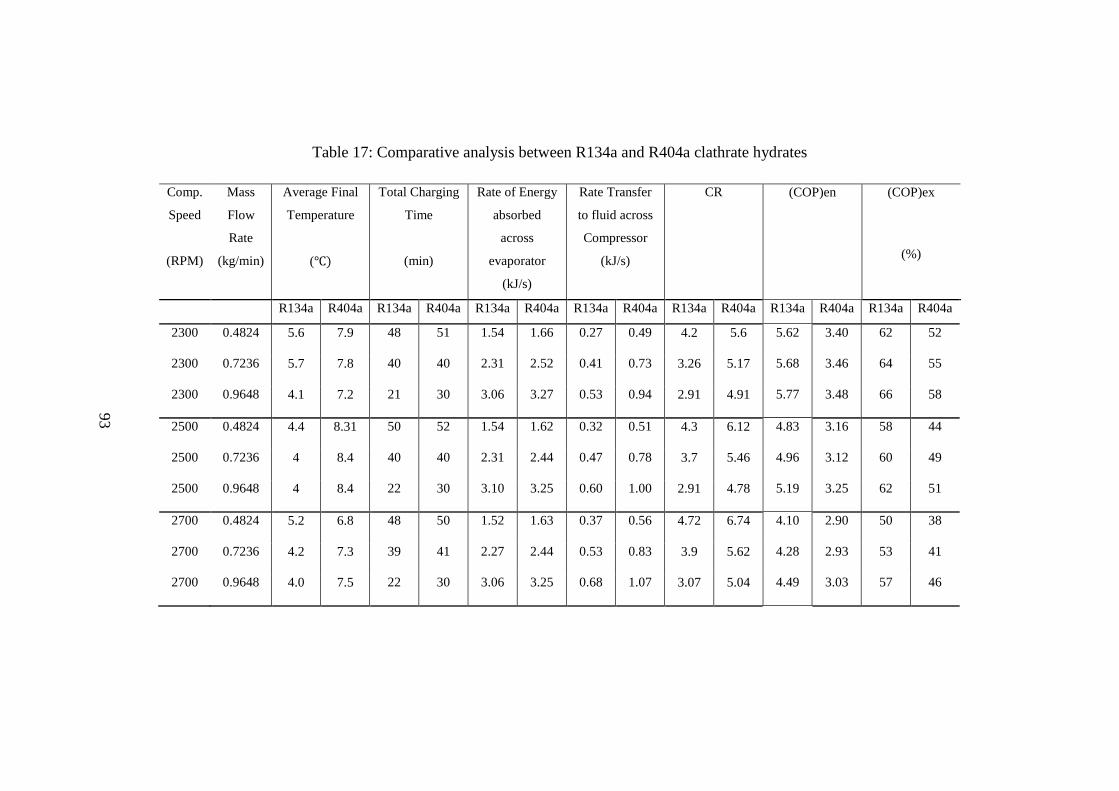
93
Table 17: Comparative analysis between R134a and R404a clathrate hydrates
Comp.
Speed
(RPM)
Mass
Flow
Rate
(kg/min)
Average Final
Temperature
(℃)
Total Charging
Time
(min)
Rate of Energy
absorbed
across
evaporator
(kJ/s)
Rate Transfer
to fluid across
Compressor
(kJ/s)
CR (COP)en (COP)ex
(%)
R134a R404a R134a R404a R134a R404a R134a R404a R134a R404a R134a R404a R134a R404a
2300 0.4824 5.6 7.9 48 51 1.54 1.66 0.27 0.49 4.2 5.6 5.62 3.40 62 52
2300 0.7236 5.7 7.8 40 40 2.31 2.52 0.41 0.73 3.26 5.17 5.68 3.46 64 55
2300 0.9648 4.1 7.2 21 30 3.06 3.27 0.53 0.94 2.91 4.91 5.77 3.48 66 58
2500 0.4824 4.4 8.31 50 52 1.54 1.62 0.32 0.51 4.3 6.12 4.83 3.16 58 44
2500 0.7236 4 8.4 40 40 2.31 2.44 0.47 0.78 3.7 5.46 4.96 3.12 60 49
2500 0.9648 4 8.4 22 30 3.10 3.25 0.60 1.00 2.91 4.78 5.19 3.25 62 51
2700 0.4824 5.2 6.8 48 50 1.52 1.63 0.37 0.56 4.72 6.74 4.10 2.90 50 38
2700 0.7236 4.2 7.3 39 41 2.27 2.44 0.53 0.83 3.9 5.62 4.28 2.93 53 41
2700 0.9648 4.0 7.5 22 30 3.06 3.25 0.68 1.07 3.07 5.04 4.49 3.03 57 46
94
5.7 Discussion of Results
The aim of this experimental research is to evaluate the cold thermal energy
storage system while forming clathrate with alternative refrigerants. The experiments
are conducted to determine the conditions under which clathrate hydrate forms for the
tested refrigerants and to study the performance of the thermal storage system. This
section discusses the results obtained from the experimental runs during formation of
clathrate hydrate with refrigerant R134a and R404a. The results present in this section
discuss the cooling load for both refrigerant and the performance of the cold thermal
storage system in terms of energy and exergy analysis. The best operation condition is
then discussed based on analyzing the experimental data.
The instantaneous enthalpies for both refrigerants are found by measuring the
temperatures and pressures readings across the compressor and the storage tank. The
rate of heat absorbed inside the storage tank shows different reading based on the
operating conditions. For clathrate hydrate with R134a, the rate of heat absorbed shows
high rate while operating the system with high mass flow rate. For example, the
recorded values for R134a are 1.541 kJ/s, 2.308 kJ/s and 3.060 kJ/s for mass flow rate
of 0.48 kg/min, 0.72 kg/min and 0.96 kg/min respectively. Similarly for clathrate
hydrate with R404a, the rate of heat absorbed across the storage tank are 1.664 kJ/s,
2.518 kJ/s, and 3.267 kJ/s for mass flow rate of 0.48 kg/min, 0.72 kg/min and 0.96
kg/min respectively. Table 17 presents the comparative analysis between R134a and
R404a clathrate hydrate at different running parameters.
Studying the cooling load of both clathrates, results show that clathrate hydrate
with R404a has greater cooling load than R134a clathrate. This is due to the fact that
refrigerant R134a has less latent heat of fusion of 358 (kJ/kg) when compared to latent
heat of fusion of R404a refrigerant. The calculated values of the cooling load stored are
noted in Table 13 and 15.
For clathrate hydrate with refrigerant R134a, the system performance varies
between (4.10) to (5.77) based on first law analysis. The second law analysis shows the
variation between (50%) to (66%) at different operating conditions. This means that the
total recovered work by the system is between (50%) to (66%) of the total work
supplied.
95
For refrigerant R134a, it is noted that a high coefficient of performance (5.77)
and high system exergetic efficiency (66%) occur at lower compressor speed (2300
rpm) and high mass flow rate of refrigerant (0.948 kg/min). This concludes that running
the system with high compressor speed generates more exergetic loss in the system
leading to low efficiency. The recorded exergy recovered of R134a system is higher for
2300 rpm than 2700 rpm. For example, for mass flow rate of 0.96 (kg/min) and 2300
rpm, the exergy recovered is 66% of the exergy input. Studying the other mass flow
rates 0.72 (kg/min) and 0.48 (kg/min), the exergy recovery is 64% and 62%
respectively. This shows that the exergy recovered is high with high flow rate and low
compressor speed.
For clathrate hydrate with refrigerant R404a, the system performance shows
lower values when compared to R134a clathrate formation. For example, for clathrate
hydrate with refrigerant R404a, the coefficient of performance varies between (2.9) to
(3.48) based on the first law analysis of thermodynamics at different operating
conditions. High system COP of (3.48) occurs while running the system with 2300 rpm
and 0.94 (kg/min) mass flow rate. The second law analysis shows variation in exergetic
efficiency between (38%) to (58%). The exergetic efficiency of the system is highest
when running at low compressor speed and high mass flow rate. For example, running
the experiments at compressor speed of 2300 rpm, the exergetic efficiencies are 52%,
55% and 58% for 0.48 (kg/min), 0.72 (kg/min), and 0.96(kg/min) respectively. On the
other hand, for high compressor speed of 2700rpm, the exergetic efficiencies are 38%,
41%, 46% for 0.48 (kg/min), 0.72 (kg/min), and 0.96(kg/min) respectively. This shows
that the best operating condition found in this research is at compressor speed of 2300
rpm and mass flow rate of 0.96 kg/min.
The tables shown in Section 5.5 are the summary of all experimental results
obtained while conducting the experiments to form the clathrate hydrates. These tables
summarize the effect of the experimental parameters (compressor speed and mass flow
rate) on the thermal system to form clathrate hydrate of two main refrigerants: R134a
and R404a. This research shows that the best operating conditions for cold thermal
energy storage system are at low compressor speed and at high mass flow rate of the
tested operating parameters.
96
Chapter 6: Conclusion and Recommendations
This research mainly focused on studying clathrate hydrates with different
refrigerants. Refrigerant R134a and R404a are used to study the performance of a direct
thermal energy storage system with refrigerant clathrate hydrate as a storage medium.
The results in this research present the cold charging process of refrigerant clathrate
hydrates with both refrigerants R134a and R404a. During operation of the direct
thermal energy system with refrigerant R134a, it is noted that the clathrate formed
temperature readings converge to a temperature range between 4℃ and 6 ℃ inside the
storage tank. This indicates that the complete formation of refrigerant R134a clathrate
hydrates occurs at these temperature ranges. For refrigerant R134a clathrate formation,
it is noted that less time is needed to form the clathrate unlike the case for refrigerant
R404a under the same operating conditions of flow rate and compressor speed.
Furthermore, it is noted that refrigerant R134a clathrate formation takes more time to
dissolve and discharge. This can be explained by the fact that the water molecules forms
a stronger cage-like structure around the refrigerant R134a guest molecules which make
it takes more time to discharge the refrigerant clathrate structure to start another
charging process.
A detailed comparison between R134a and R404a clathrate in terms of mass of
clathrate, the energy stored during the charging process, and the coefficient of
performance of the system are provided with in this research in Tables 14 to 17. The
first and second laws of thermodynamics are used as a tool to evaluate the performance
of each refrigerant clathrate formation. The experimental results for system
performance are shown in Figures 34 to 39. The experimental study and the
mathematical model show that forming clathrate hydrate with refrigerant R134a is more
efficient than refrigerant R404a. The coefficient of performance of the thermal energy
storage system varies from 4.1 and 5.77 while forming refrigerant clathrate hydrate of
R134a. On the other hand, the performance varies from 2.9 and 3.48 while forming
clathrate hydrate of R404a at similar experimental conditions. It is noted that a high
coefficient of performance occurs at the low compressor speed and high working fluid
mass flow rate. The second law efficiency of the R134a system varies between 50%
and 66%, while for R404a, the second law efficiency varies between 37% and 58%.
Further, the exergy destruction in the R404a thermal storage system is higher than the
97
exergy destruction in the R134a thermal storage system. Therefore, this thesis proposes
the use of R134a refrigerant to form clathrate hydrate for thermal energy storage.
The recommendations for this study can be summarized as follows: according
to this research work, refrigerant R134a has more advantage in forming refrigerant
clathrate hydrate as a storage medium than refrigerant R404 for a direct thermal energy
storage system. Refrigerant R134a shows a better system performance and reasonable
stored load compared to R404a clathrate. This work recommends the study of other
refrigerants as an alternative for R134a clathrate for thermal storage systems. Also,
more research is needed to improve the understanding of the scientific and engineering
characteristics of refrigerant clathrate hydrate with thermal energy storage systems. It
is also recommended to develop various theoretical and practical aspects related to the
performance and implementation of thermal storage system with real HVAC systems.
In order to select a thermal energy storage system for real HVAC applications, it is
recommended to consider several factors such as; size, operating strategies,
environment, economics, and the reliability of such integration.
In this study, the experimental investigation proves that such a system can be reliable
in storing thermal energy for short and long periods if used for HVAC systems. A
further recommendation is to model thermal system numerically or with ANSYS
software to check the reliability of the storage system. In order to improve the designing
aspects related to the system performance and real system implementation of the
existing direct thermal energy storage system, some recommended developments are
presented as follows:
The size of the storage tank (direct storage tank) is a critical component of such
a system; thus, implementing such system in real HVAC systems will require a
bigger storage tank.
The discharging unit is one of the important sub-systems for direct thermal
energy storage; thus, improving the efficiency of a fan coil unit (FCU) is
strongly recommended.
The formation of clathrate hydrate inside the tank is almost solid which blocks
the discharging coils in most cases; thus, adding a heater inside the tank beside
the discharging coils will be of great importance to the system.
98
Conducting more experimental test with new refrigerants to form new clathrate
hydrates that are suitable for longer thermal storage periods is recommended
Developing and applying standardized methods to find new refrigerants for
better system performance, long lifetime, and safety of the storage system.
Develop numerical models to understand and optimize the clathrate behavior
and the overall storage system before running the system can show a better
understanding of the clathrate formation process.
In conclusion, the evaluation of a cold direct thermal energy storage system using
alternative refrigerants is the main research topic of this thesis. The evaluation of the
multi-stage operation of the existing direct thermal energy storage system needs to be
further investigated with current refrigerants and current tested parameters. It would,
however, be appropriate to further execute this study using a variety of tested
parameters such as lower compressor speeds varying from 700 rpm to 2000 rpm and
higher mass flow rate of refrigerant varying between 0.96 kg/min to 3.98 kg/min to
conduct the experimental tests. The mass of stored water is also an important parameter
and it would be appropriate to conduct experiments using higher mass of water: 22 kg
and 33 kg. While the aim in this study is to evaluate thermal energy storage systems, a
comparison between direct and indirect thermal energy storage might be a special topic
of interest in this field. Hence, further studies with detailed thermal energy storage
system behavior can follow with more detail and a wider range of parameters. The
development of better cold thermal energy systems will result in a promising
contribution to the thermal energy design.
99
References
[1] T. Kiatsiriroat, P. Siriplubpla, and A. Nuntaphan, “Performance Analysis of a
refrigeration cycle using a direct contact evaporator,” Int. J. Energy Res., vol.
22, no. 13, pp. 1179–1190, 1998.
[2] T. Kiatsiriroat, S. Vithayasai, N. Vorayos, and a Nuntaphan, “Heat transfer
prediction for a direct contact ice thermal energy storage,” Energy Convers.
Manag., vol. 44, no. 4, pp. 497–508, Mar. 2003.
[3] I. Dincer and M. A. Rosen, Thermal Energy Storage Systems and Application,
2nd ed. UK: John Wiley & Sons, 2010, p. 620.
[4] I. Dincer, “On thermal energy storage systems and applications in buildings,”
Energy Build., vol. 34, no. 2001, pp. 377–388, 2002.
[5] B. Zalba, J. M. Marı́n, L. F. Cabeza, and H. Mehling, “Review on thermal
energy storage with phase change: materials, heat transfer analysis and
applications,” Appl. Therm. Eng., vol. 23, no. 3, pp. 251–283, Feb. 2003.
[6] A. Sharma, V. V. Tyagi, C. R. Chen, and D. Buddhi, “Review on thermal
energy storage with phase change materials and applications,” Renew. Sustain.
Energy Rev., vol. 13, no. 2, pp. 318–345, Feb. 2009.
[7] M. O. Abdullah, L. P. Yii, E. Junaidi, G. Tambi, and M. A. Mustapha,
“Electricity cost saving comparison due to tariff change and ice thermal storage
(ITS) usage based on a hybrid centrifugal-ITS system for buildings: A
university district cooling perspective,” Energy Build., vol. 67, pp. 70–78, Dec.
2013.
[8] L. Perez-lombard and C. Pout, “A review on buildings energy consumption
information,” Energy Build., vol. 40, pp. 384–348, 2008.
[9] C. Balaras, G. Grossman, C. Ferreira, E. Podesser, L. Wang, and E. Wiemken,
“Solar air conditioning in Europe—an overview,” Renew. Sustain. Energy Rev.,
vol. 11, no. 2, pp. 299–314, Feb. 2007.
[10] V. Vakiloroaya, B. Samali, A. Fakhar, and K. Pishghadam, “A review of
different strategies for HVAC energy saving,” Energy Convers. Manag., vol.
77, pp. 738–754, Jan. 2014.
[11] H. Eldessouky, “Performance analysis of two-stage evaporative coolers,”
Chem. Eng. J., vol. 102, no. 3, pp. 255–266, Sep. 2004.
[12] M. Salvador and S. Grieu, “Methodology for the design of energy production
and storage systems in buildings: Minimization of the energy impact on the
electricity grid,” Energy Build., vol. 47, pp. 659–673, Apr. 2012.
100
[13] R. Parameshwaran and S. Kalaiselvam, “Energy conservative air conditioning
system using silver nano-based PCM thermal storage for modern buildings,”
Energy Build., vol. 69, pp. 202–212, Feb. 2014.
[14] N. Soares, J. J. Costa, a. R. Gaspar, and P. Santos, “Review of passive PCM
latent heat thermal energy storage systems towards buildings’ energy
efficiency,” Energy Build., vol. 59, pp. 82–103, Apr. 2013.
[15] C. Chaichana, W. W. . Charters, and L. Aye, “An ice thermal storage computer
model,” Appl. Therm. Eng., vol. 21, no. 17, pp. 1769–1778, Dec. 2001.
[16] B. a. Habeebullah, “Economic feasibility of thermal energy storage systems,”
Energy Build., vol. 39, no. 3, pp. 355–363, Mar. 2007.
[17] O. M. Al-Rabghi and M. M. Akyurt, “A survey of energy efficient strategies
for effective air conditioning,” Energy Convers. Manag., vol. 45, no. 11–12,
pp. 1643–1654, Jul. 2004.
[18] H. Caliskan, I. Dincer, and A. Hepbasli, “Energy and exergy analyses of
combined thermochemical and sensible thermal energy storage systems for
building heating applications,” Energy Build., vol. 48, pp. 103–111, May 2012.
[19] A. H. Mohammadi, “Pressure-Temerature Phase Diagrams of Clathrate
Hydrates of HFC-134a, HFC-152a and HFC-32,” AIChE Annual Meeting,
2010.
[20] Y. Seo, H. Tajima, A. Yamasaki, S. Takeya, T. Ebinuma, and F. Kiyono, “A
new method for separating HFC-134a from gas mixtures using clathrate
hydrate formation.,” Environ. Sci. Technol., vol. 38, no. 17, pp. 4635–9, Sep.
2004.
[21] D. Liang, R. Wang, K. Guo, and S. Fan, “Prediction of refrigerant gas hydrates
formation conditions,” J. Therm. Scince, vol. 10, no. 1, pp. 64–68, 2001.
[22] K. Maeda, Y. Katsura, Y. Asakuma, and K. Fukui, “Concentration of sodium
chloride in aqueous solution by chlorodifluoromethane gas hydrate,” Chem.
Eng. Process. Process Intensif., vol. 47, no. 12, pp. 2281–2286, Nov. 2008.
[23] J. Javanmardi and M. Moshfeghian, “Energy consumption and economic
evaluation of water desalination by hydrate phenomenon,” Appl. Therm. Eng.,
vol. 23, no. 7, pp. 845–857, May 2003.
[24] D. Liang, K. Guo, R. Wang, and S. Fan, “Hydrate equilibrium data of 1,1,1,2-
tetrafluoroethane (HFC-134a), 1,1-dichloro-1-fluoroethane (HCFC-141b) and
1,1-difluoroethane (HFC-152a),” Fluid Phase Equilib., vol. 188, pp. 61–70,
2001.
101
[25] M. Nakaiwa and H. Fukuura, “Formation of CFC alternative R134a gas
hydrate,” Energy Convers. Eng. Conf., vol. 4, pp. 269–274, 1990.
[26] Y. Seo, H. Tajima, A. Yamasaki, S. Takeya, T. Ebinuma, and F. Kiyono, “A
new method for separating HFC-134a from gas mixtures using clathrate
hydrate formation,” Environ. Sci. Technol., vol. 38, pp. pp.4635–4639, 2004.
[27] Z. Li, G. Kaihua, Z. Yongli, S. Bifen, and Z. Jiawei, “Phase equilibrium
calculation for refrigerant simple gas hydrates,” J. Eng. Thermophys., vol. 21,
no. 1, pp. 31–16, 2000.
[28] A. Eslamimanesh, A. H. Mohammadi, and D. Richon, “Thermodynamic model
for predicting phase equilibria of simple clathrate hydrates of refrigerants,”
Chem. Eng. Sci., vol. 66, no. 21, pp. 5439–5445, Nov. 2011.
[29] V. Vakiloroaya, B. Samali, A. Fakhar, and K. Pishghadam, “A review of
different strategies for HVAC energy saving,” Energy Convers. Manag., vol.
77, pp. 738–754, Jan. 2014.
[30] B. Rismanchi, R. Saidur, H. H. Masjuki, and T. M. I. Mahlia, “Energetic,
economic and environmental benefits of utilizing the ice thermal storage
systems for office building applications,” Energy Build., vol. 50, pp. 347–354,
Jul. 2012.
[31] B. Rismanchi, R. Saidur, H. H. Masjuki, and T. M. I. Mahlia, “Thermodynamic
evaluation of utilizing different ice thermal energy storage systems for cooling
application in office buildings in Malaysia,” Energy Build., vol. 53, pp. 117–
126, Oct. 2012.
[32] Y. Sun, S. Wang, F. Xiao, and D. Gao, “Peak load shifting control using
different cold thermal energy storage facilities in commercial buildings,”
Energy Convers. Manag., vol. 71, pp. 101–114, Jul. 2013.
[33] M. J. Sebzali and P. a. Rubini, “Analysis of ice cool thermal storage for a clinic
building in Kuwait,” Energy Convers. Manag., vol. 47, no. 18–19, pp. 3417–
3434, Nov. 2006.
[34] A. Eslamimanesh, A. H. Mohammadi, and D. Richon, “Thermodynamic model
for predicting phase equilibria of simple clathrate hydrates of refrigerants,”
Chem. Eng. Sci., vol. 66, no. 21, pp. 5439–5445, Nov. 2011.
[35] K. H. Guo, B. F. Shu, and Y. Zhang, “Transient behavior of energy charge-
discharge and solid-liquid phase change in mixed gas-hydrate formation,” in
Guangzhou Inst of Energy Conversion, of the Chinese Acad of Sciences, 1996.
[36] D. Liang, R. Wang, K. Guo, and S. Fan, “Prediction of refrigerant gas hydrates
formation conditions,” J. Therm. Sci., vol. 10, no. 1, pp. 64–68, 2001.
102
[37] Z. Li, G. Kaihua, Z. Yongli, S. Bifen, and Z. Jiawei, “Phase Equilibrium
Calculation for Refrigerant Simple Gas Hydrates,” J. Eng. Thermophys., vol.
21, no. 1, pp. 13–16, 2000.
[38] Z. Li, G. Kaihua, Y. ZHAO, and S. Bifen, “Phase Equilibrium Calculation for
Binary Refrigerant Gas Hydrates,” J. Eng. Thermophys., vol. 21, no. 2, pp.
269–272, 2000.
[39] F. Nikbakht, A. a. Izadpanah, F. Varaminian, and A. H. Mohammadi,
“Thermodynamic modeling of hydrate dissociation conditions for refrigerants
R-134a, R-141b and R-152a,” Int. J. Refrig., vol. 35, no. 7, pp. 1914–1920,
Nov. 2012.
[40] M. Karamoddin and F. Varaminian, “Experimental measurement of phase
equilibrium for gas hydrates of refrigerants, and thermodynamic modeling by
SRK, VPT and CPA EOSs,” J. Chem. Thermodyn., vol. 65, pp. 213–219, Oct.
2013.
[41] Y. Bi, T. Guo, L. Zhang, H. Zhang, and L. Chen, “Experimental study on cool
release process of gas-hydrate with additives,” Energy Build., vol. 41, no. 1, pp.
120–124, Jan. 2009.
[42] T. Mori and Y. Mori, “Characterization of gas hydrate formation in direct-
contact cool storage process,” Int. J. Refrig., vol. 12, no. 5, pp. 259–265, 1989.
[43] R. McCormack, “Use of clathrates for ‘off-peak’ thermal energy storage,” in
Energy Conversion Engineering Conference, 1900, pp. 300–305.
[44] A. A. Kendoush, K. Joudi, and N. Abid Jassim, “The growth rate of gas
hydrate from refrigerant R12,” Exp. Therm. Fluid Sci., vol. 30, pp. 643–651,
2006.
[45] S. Thongwik, N. Vorayos, T. Kiatsiriroat, and A. Nuntaphan, “Thermal
analysis of slurry ice production system using direct contact heat transfer of
carbon dioxide and water mixture,” Int. Commun. Heat Mass Transf., vol. 35,
pp. 756–761, 2008.
[46] J. Wu and S. Wang, “Research on cool storage and release characteristics of
R134a gas hydrate with additive,” Energy Build., vol. 45, pp. 99–105, Feb.
2012.
[47] Y. Xie, G. Li, D. Liu, N. Liu, Y. Qi, D. Liang, K. Guo, and S. Fan,
“Experimental study on a small scale of gas hydrate cold storage apparatus,”
vol. 87, pp. 3340–3346, 2010.
[48] A. Sharma, V. V. Tyagi, C. R. Chen, and D. Buddhi, “Review on thermal
energy storage with phase change materials and applications,” Renew. Sustain.
Energy Rev., vol. 13, no. 2, pp. 318–345, Feb. 2009.
103
[49] S. Álvarez, L. F. Cabeza, A. Ruiz-Pardo, A. Castell, and J. A. Tenorio,
“Building integration of PCM for natural cooling of buildings,” Appl. Energy,
vol. 109, pp. 514–522, Sep. 2013.
[50] A. Waqas and Z. Ud Din, “Phase change material (PCM) storage for free
cooling of buildings—A review,” Renew. Sustain. Energy Rev., vol. 18, pp.
607–625, Feb. 2013.
[51] E. Osterman, V. . Tyagi, V. Butala, N. . Rahim, and U. Stritih, “Review of
PCM based cooling technologies for buildings,” Energy Build., vol. 49, pp. 37–
49, Jun. 2012.
[52] W. a. Qureshi, N.-K. C. Nair, and M. M. Farid, “Impact of energy storage in
buildings on electricity demand side management,” Energy Convers. Manag.,
vol. 52, no. 5, pp. 2110–2120, May 2011.
[53] S. M. Hasnain and N. M. Alabbadi, “Need for thermal-storage air-conditioning
in Saudi Arabia,” Appl. Energy, vol. 65, no. 1–4, pp. 153–164, Apr. 2000.
[54] M. Ban, G. Krajačić, M. Grozdek, T. Ćurko, and N. Duić, “The role of cool
thermal energy storage (CTES) in the integration of renewable energy sources
(RES) and peak load reduction,” Energy, vol. 48, no. 1, pp. 108–117, Dec.
2012.
[55] E. Oró, A. de Gracia, A. Castell, M. M. Farid, and L. F. Cabeza, “Review on
phase change materials (PCMs) for cold thermal energy storage applications,”
Appl. Energy, vol. 99, no. 0, pp. 513–533, Nov. 2012.
[56] S. Hunt, “Gas Hydrate Thermal Energy Storage Systems.” U.S. Patent
5140824A, Aug. 25, 1992.
[57] G. Li, Y. Hwang, and R. Radermacher, “Review of cold storage materials for
air conditioning application,” Int. J. Refrig., vol. 35, no. 8, pp. 2053–2077, Dec.
2012.
[58] K. Liu, H. Guven, A. Beyene, and P. Lowrey, “A comparison of the field
performance of thermal energy storage (TES) and conventional chiller
systems,” Energy, vol. 19, pp. 889–900, 1994.
[59] S. M. Hasnain, “Review on sustainable thermal energy storage technologies,
Part II: cool thermal storage,” Energy Convers. Manag., vol. 39, no. 11, pp.
1139–1153, Aug. 1998.
[60] C.-D. Ho, J.-W. Tu, T.-L. Hsien, H. Chang, and T.-C. Chen, “Heat transfer
enhancement in cool-thermal discharge systems from ice melting with time–
velocity variations,” Int. Commun. Heat Mass Transf., vol. 37, no. 7, pp. 815–
821, Aug. 2010.
104
[61] Y. F. Liu and R. Z. Wang, “Method to design optimal scheme for cold storage
air conditioning system,” Energy Convers. Manag., vol. 43, no. 17, pp. 2357–
2367, Nov. 2002.
[62] H.-J. Chen, D. W. P. Wang, and S.-L. Chen, “Optimization of an ice-storage air
conditioning system using dynamic programming method,” Appl. Therm. Eng.,
vol. 25, no. 2–3, pp. 461–472, Feb. 2005.
[63] S. Ashok and R. Banerjee, “Optimal cool storage capacity for load
management,” Energy, vol. 28, no. 2, pp. 115–126, Feb. 2003.
[64] I. Dincer and M. Kanoglu, Refrigeration Systems and Application, 2nd ed. UK:
John Wiley & Sons, 2010, p. 484.
[65] G. Li, Y. Hwang, and R. Radermacher, “Review of cold storage materials for
air conditioning application,” Int. J. Refrig., vol. 35, no. 8, pp. 2053–2077, Dec.
2012.
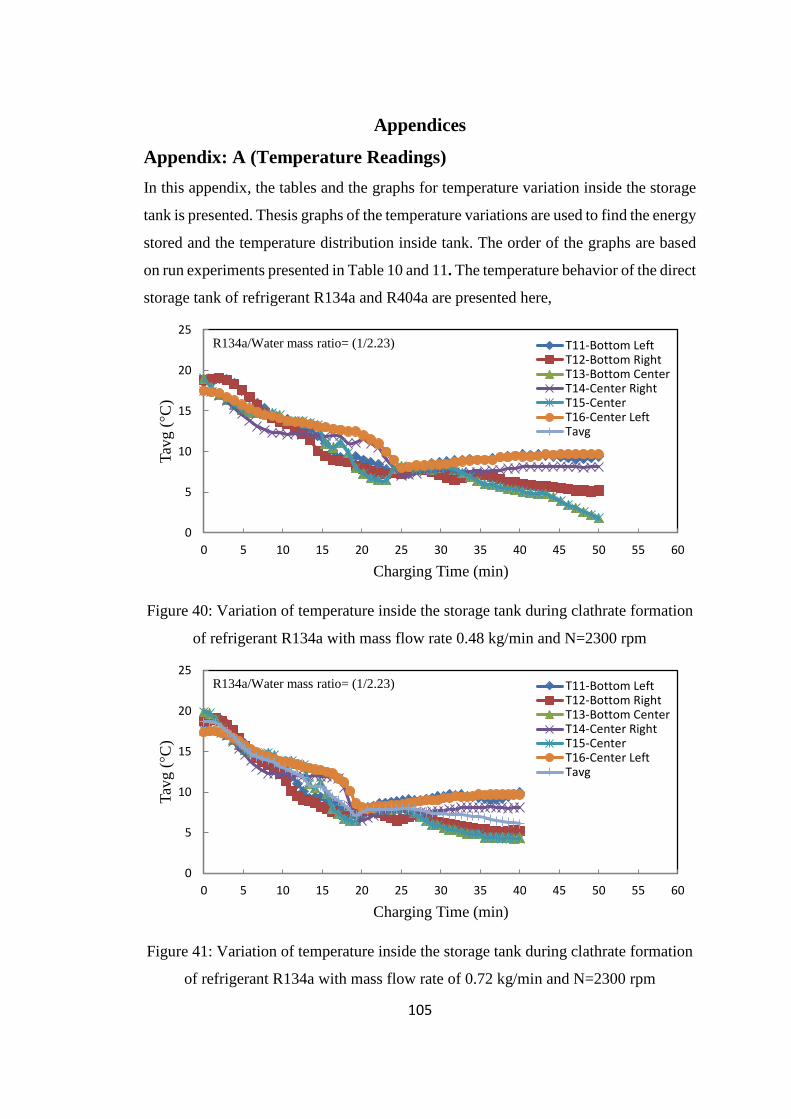
105
Appendices
Appendix: A (Temperature Readings)
In this appendix, the tables and the graphs for temperature variation inside the storage
tank is presented. Thesis graphs of the temperature variations are used to find the energy
stored and the temperature distribution inside tank. The order of the graphs are based
on run experiments presented in Table 10 and 11. The temperature behavior of the direct
storage tank of refrigerant R134a and R404a are presented here,
Figure 40: Variation of temperature inside the storage tank during clathrate formation
of refrigerant R134a with mass flow rate 0.48 kg/min and N=2300 rpm
Figure 41: Variation of temperature inside the storage tank during clathrate formation
of refrigerant R134a with mass flow rate of 0.72 kg/min and N=2300 rpm
0
5
10
15
20
25
0 5 10 15 20 25 30 35 40 45 50 55 60
Tav
g (
°C)
Charging Time (min)
T11-Bottom LeftT12-Bottom RightT13-Bottom CenterT14-Center RightT15-CenterT16-Center LeftTavg
R134a/Water mass ratio= (1/2.23)
0
5
10
15
20
25
0 5 10 15 20 25 30 35 40 45 50 55 60
Tav
g (
°C)
Charging Time (min)
T11-Bottom LeftT12-Bottom RightT13-Bottom CenterT14-Center RightT15-CenterT16-Center LeftTavg
R134a/Water mass ratio= (1/2.23)
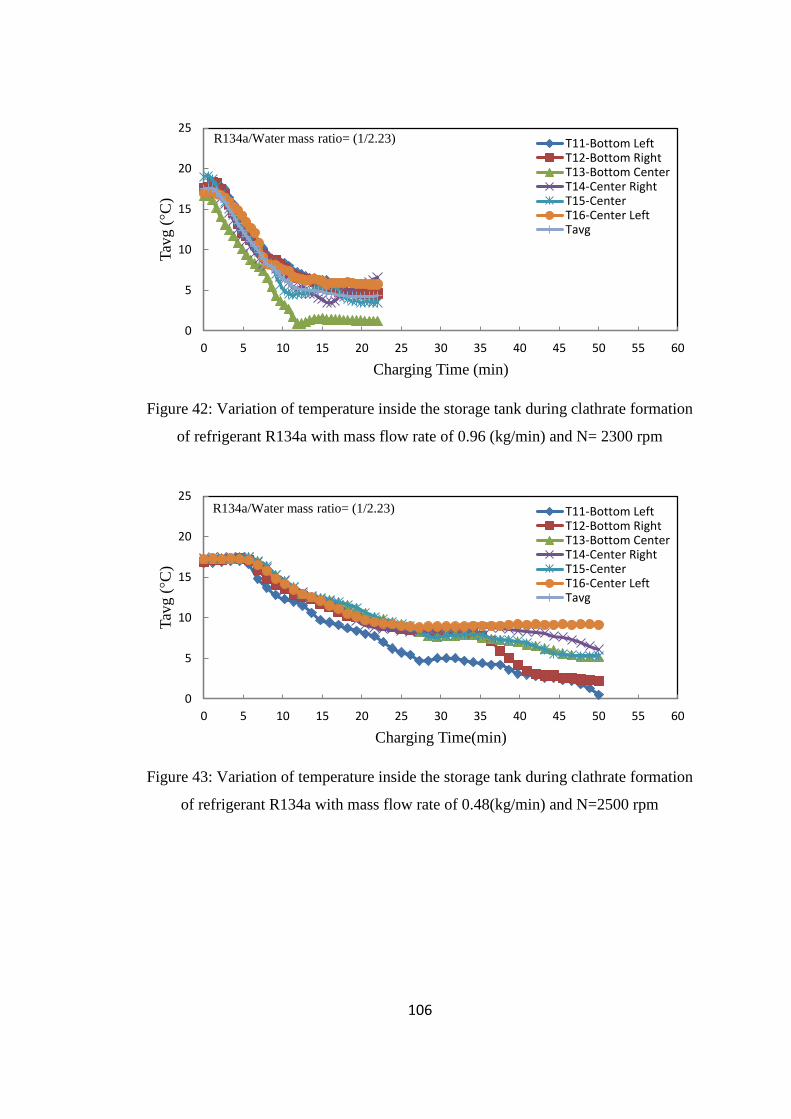
106
Figure 42: Variation of temperature inside the storage tank during clathrate formation
of refrigerant R134a with mass flow rate of 0.96 (kg/min) and N= 2300 rpm
Figure 43: Variation of temperature inside the storage tank during clathrate formation
of refrigerant R134a with mass flow rate of 0.48(kg/min) and N=2500 rpm
0
5
10
15
20
25
0 5 10 15 20 25 30 35 40 45 50 55 60
Tav
g (
°C)
Charging Time (min)
T11-Bottom LeftT12-Bottom RightT13-Bottom CenterT14-Center RightT15-CenterT16-Center LeftTavg
R134a/Water mass ratio= (1/2.23)
0
5
10
15
20
25
0 5 10 15 20 25 30 35 40 45 50 55 60
Tav
g (
°C)
Charging Time(min)
T11-Bottom LeftT12-Bottom RightT13-Bottom CenterT14-Center RightT15-CenterT16-Center LeftTavg
R134a/Water mass ratio= (1/2.23)
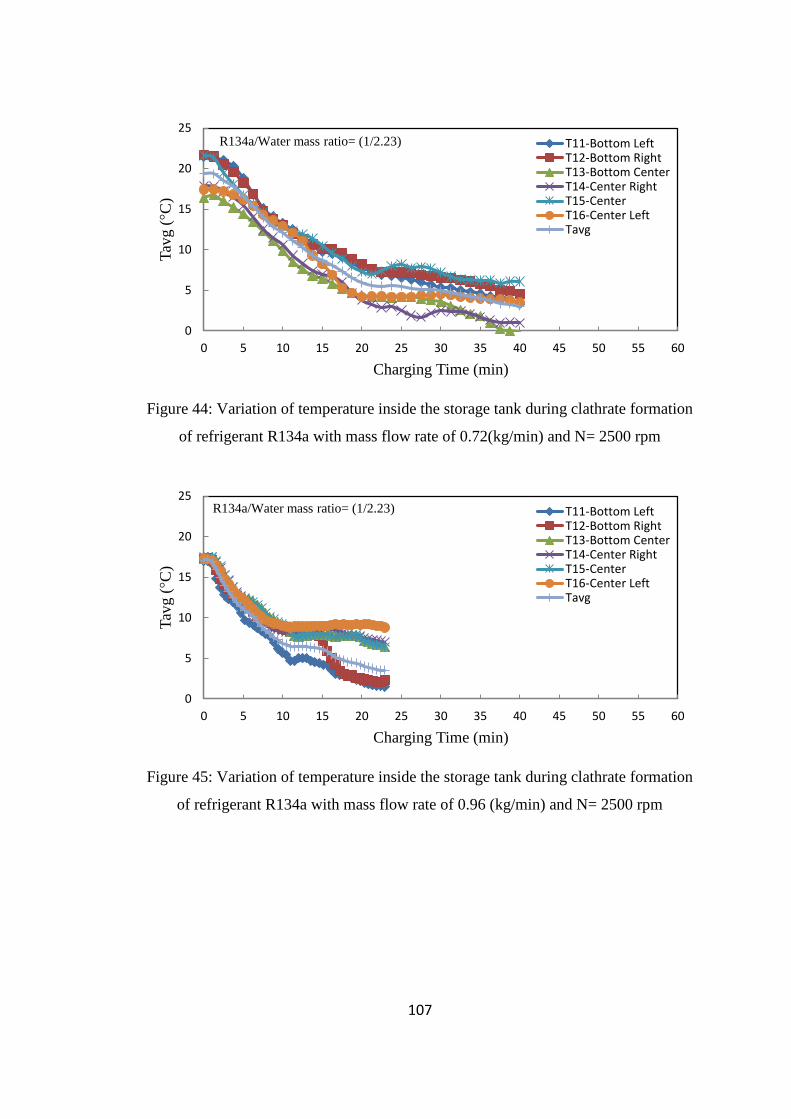
107
Figure 44: Variation of temperature inside the storage tank during clathrate formation
of refrigerant R134a with mass flow rate of 0.72(kg/min) and N= 2500 rpm
Figure 45: Variation of temperature inside the storage tank during clathrate formation
of refrigerant R134a with mass flow rate of 0.96 (kg/min) and N= 2500 rpm
0
5
10
15
20
25
0 5 10 15 20 25 30 35 40 45 50 55 60
Tav
g (
°C)
Charging Time (min)
T11-Bottom LeftT12-Bottom RightT13-Bottom CenterT14-Center RightT15-CenterT16-Center LeftTavg
R134a/Water mass ratio= (1/2.23)
0
5
10
15
20
25
0 5 10 15 20 25 30 35 40 45 50 55 60
Tav
g (
°C)
Charging Time (min)
T11-Bottom LeftT12-Bottom RightT13-Bottom CenterT14-Center RightT15-CenterT16-Center LeftTavg
R134a/Water mass ratio= (1/2.23)
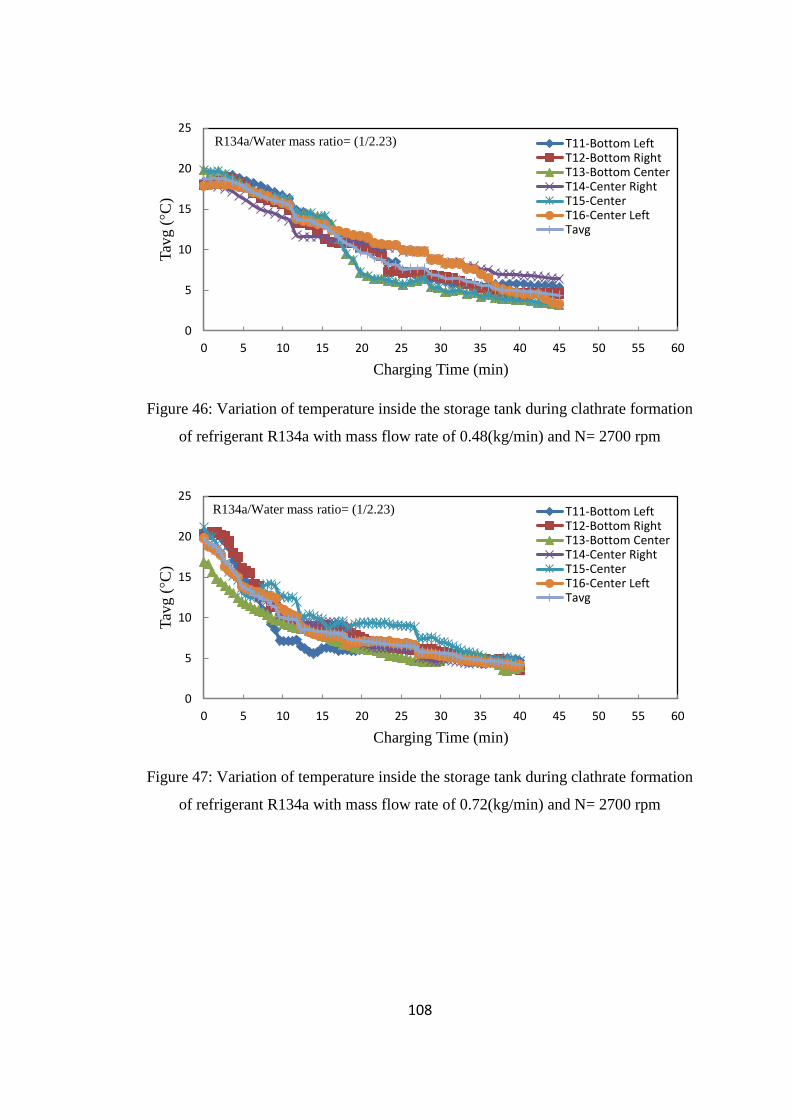
108
Figure 46: Variation of temperature inside the storage tank during clathrate formation
of refrigerant R134a with mass flow rate of 0.48(kg/min) and N= 2700 rpm
Figure 47: Variation of temperature inside the storage tank during clathrate formation
of refrigerant R134a with mass flow rate of 0.72(kg/min) and N= 2700 rpm
0
5
10
15
20
25
0 5 10 15 20 25 30 35 40 45 50 55 60
Tav
g (
°C)
Charging Time (min)
T11-Bottom LeftT12-Bottom RightT13-Bottom CenterT14-Center RightT15-CenterT16-Center LeftTavg
R134a/Water mass ratio= (1/2.23)
0
5
10
15
20
25
0 5 10 15 20 25 30 35 40 45 50 55 60
Tav
g (
°C)
Charging Time (min)
T11-Bottom LeftT12-Bottom RightT13-Bottom CenterT14-Center RightT15-CenterT16-Center LeftTavg
R134a/Water mass ratio= (1/2.23)
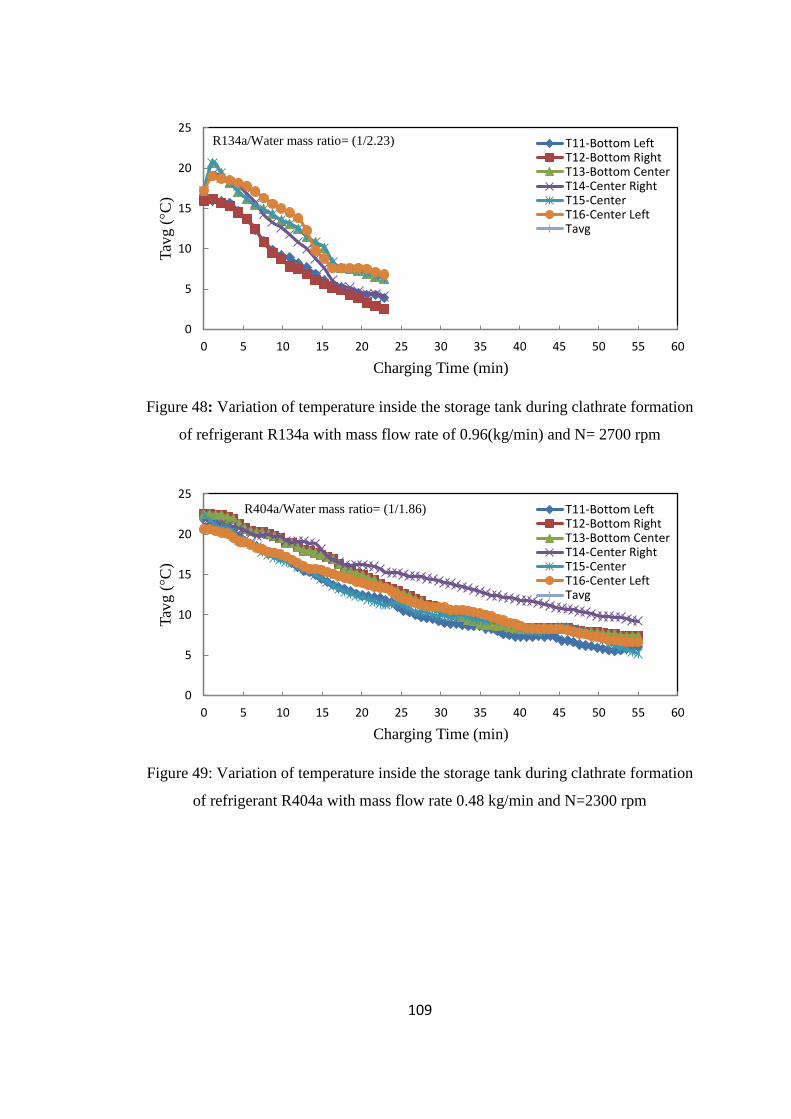
109
Figure 48: Variation of temperature inside the storage tank during clathrate formation
of refrigerant R134a with mass flow rate of 0.96(kg/min) and N= 2700 rpm
Figure 49: Variation of temperature inside the storage tank during clathrate formation
of refrigerant R404a with mass flow rate 0.48 kg/min and N=2300 rpm
0
5
10
15
20
25
0 5 10 15 20 25 30 35 40 45 50 55 60
Tav
g (
°C)
Charging Time (min)
T11-Bottom LeftT12-Bottom RightT13-Bottom CenterT14-Center RightT15-CenterT16-Center LeftTavg
R134a/Water mass ratio= (1/2.23)
0
5
10
15
20
25
0 5 10 15 20 25 30 35 40 45 50 55 60
Tav
g (
°C)
Charging Time (min)
T11-Bottom LeftT12-Bottom RightT13-Bottom CenterT14-Center RightT15-CenterT16-Center LeftTavg
R404a/Water mass ratio= (1/1.86)
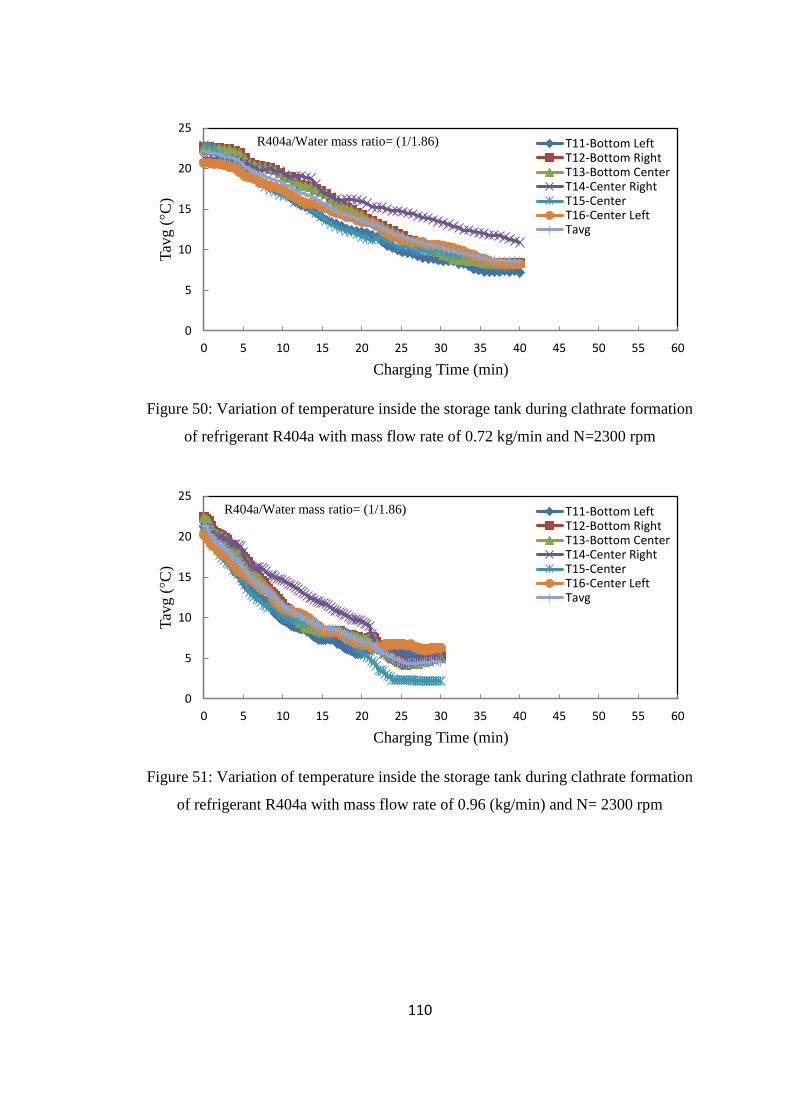
110
Figure 50: Variation of temperature inside the storage tank during clathrate formation
of refrigerant R404a with mass flow rate of 0.72 kg/min and N=2300 rpm
Figure 51: Variation of temperature inside the storage tank during clathrate formation
of refrigerant R404a with mass flow rate of 0.96 (kg/min) and N= 2300 rpm
0
5
10
15
20
25
0 5 10 15 20 25 30 35 40 45 50 55 60
Tav
g (
°C)
Charging Time (min)
T11-Bottom LeftT12-Bottom RightT13-Bottom CenterT14-Center RightT15-CenterT16-Center LeftTavg
R404a/Water mass ratio= (1/1.86)
0
5
10
15
20
25
0 5 10 15 20 25 30 35 40 45 50 55 60
Tav
g (
°C)
Charging Time (min)
T11-Bottom LeftT12-Bottom RightT13-Bottom CenterT14-Center RightT15-CenterT16-Center LeftTavg
R404a/Water mass ratio= (1/1.86)

111
Figure 52: Variation of temperature inside the storage tank during clathrate formation
of refrigerant R404a with mass flow rate of 0.48(kg/min) and N=2500 rpm
Figure 53: Variation of temperature inside the storage tank during clathrate formation
of refrigerant R404a with mass flow rate of 0.72(kg/min) and N= 2500 rpm
0
5
10
15
20
25
0 5 10 15 20 25 30 35 40 45 50 55
Tav
g (
°C)
Charging Time (min)
T11-Bottom LeftT12-Bottom RightT13-Bottom CenterT14-Center RightT15-CenterT16-Center LeftTavg
R404a/Water mass ratio= (1/1.86)
0
5
10
15
20
25
0 5 10 15 20 25 30 35 40 45 50 55 60
Tav
g (
°C)
Charging Time (min)
T11-Bottom LeftT12-Bottom RightT13-Bottom CenterT14-Center RightT15-CenterT16-Center LeftTavg
R404a/Water mass ratio= (1/1.86)
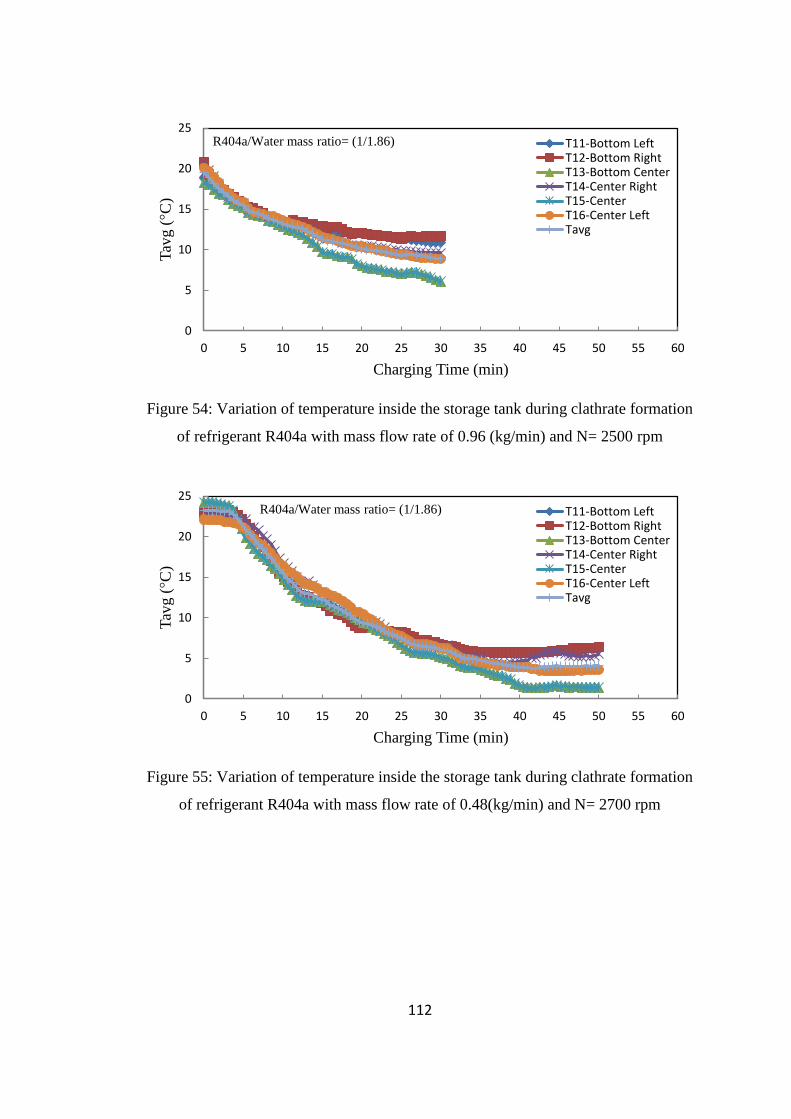
112
Figure 54: Variation of temperature inside the storage tank during clathrate formation
of refrigerant R404a with mass flow rate of 0.96 (kg/min) and N= 2500 rpm
Figure 55: Variation of temperature inside the storage tank during clathrate formation
of refrigerant R404a with mass flow rate of 0.48(kg/min) and N= 2700 rpm
0
5
10
15
20
25
0 5 10 15 20 25 30 35 40 45 50 55 60
Tav
g (
°C)
Charging Time (min)
T11-Bottom LeftT12-Bottom RightT13-Bottom CenterT14-Center RightT15-CenterT16-Center LeftTavg
R404a/Water mass ratio= (1/1.86)
0
5
10
15
20
25
0 5 10 15 20 25 30 35 40 45 50 55 60
Tav
g (
°C)
Charging Time (min)
T11-Bottom LeftT12-Bottom RightT13-Bottom CenterT14-Center RightT15-CenterT16-Center LeftTavg
R404a/Water mass ratio= (1/1.86)
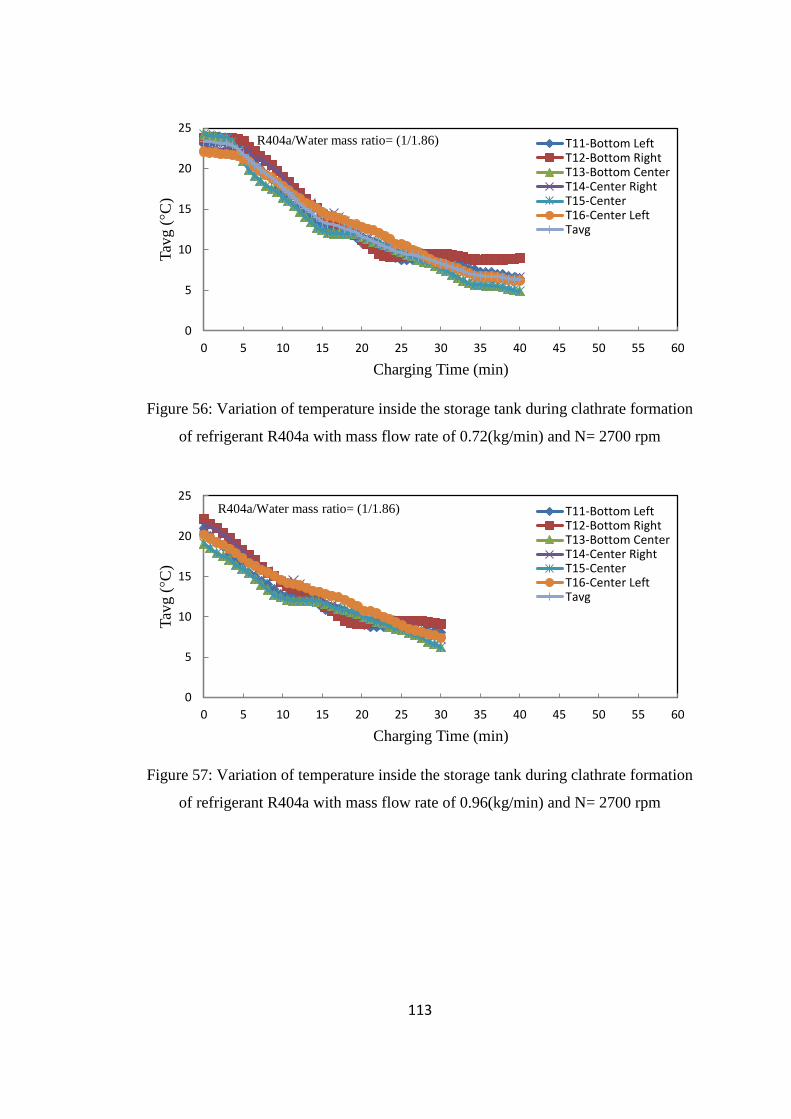
113
Figure 56: Variation of temperature inside the storage tank during clathrate formation
of refrigerant R404a with mass flow rate of 0.72(kg/min) and N= 2700 rpm
Figure 57: Variation of temperature inside the storage tank during clathrate formation
of refrigerant R404a with mass flow rate of 0.96(kg/min) and N= 2700 rpm
0
5
10
15
20
25
0 5 10 15 20 25 30 35 40 45 50 55 60
Tav
g (
°C)
Charging Time (min)
T11-Bottom LeftT12-Bottom RightT13-Bottom CenterT14-Center RightT15-CenterT16-Center LeftTavg
R404a/Water mass ratio= (1/1.86)
0
5
10
15
20
25
0 5 10 15 20 25 30 35 40 45 50 55 60
Tav
g (
°C)
Charging Time (min)
T11-Bottom LeftT12-Bottom RightT13-Bottom CenterT14-Center RightT15-CenterT16-Center LeftTavg
R404a/Water mass ratio= (1/1.86)
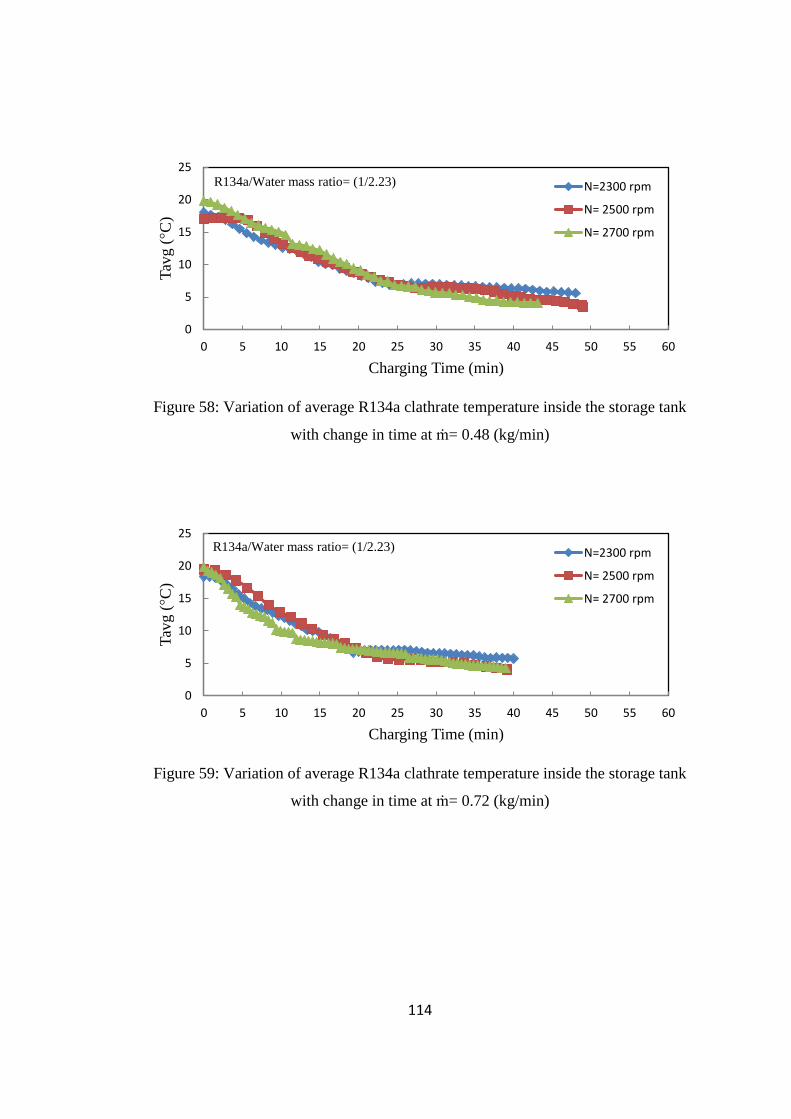
114
Figure 58: Variation of average R134a clathrate temperature inside the storage tank
with change in time at ṁ= 0.48 (kg/min)
Figure 59: Variation of average R134a clathrate temperature inside the storage tank
with change in time at ṁ= 0.72 (kg/min)
0
5
10
15
20
25
0 5 10 15 20 25 30 35 40 45 50 55 60
Tav
g (
°C)
Charging Time (min)
N=2300 rpm
N= 2500 rpm
N= 2700 rpm
R134a/Water mass ratio= (1/2.23)
0
5
10
15
20
25
0 5 10 15 20 25 30 35 40 45 50 55 60
Tav
g (
°C)
Charging Time (min)
N=2300 rpm
N= 2500 rpm
N= 2700 rpm
R134a/Water mass ratio= (1/2.23)
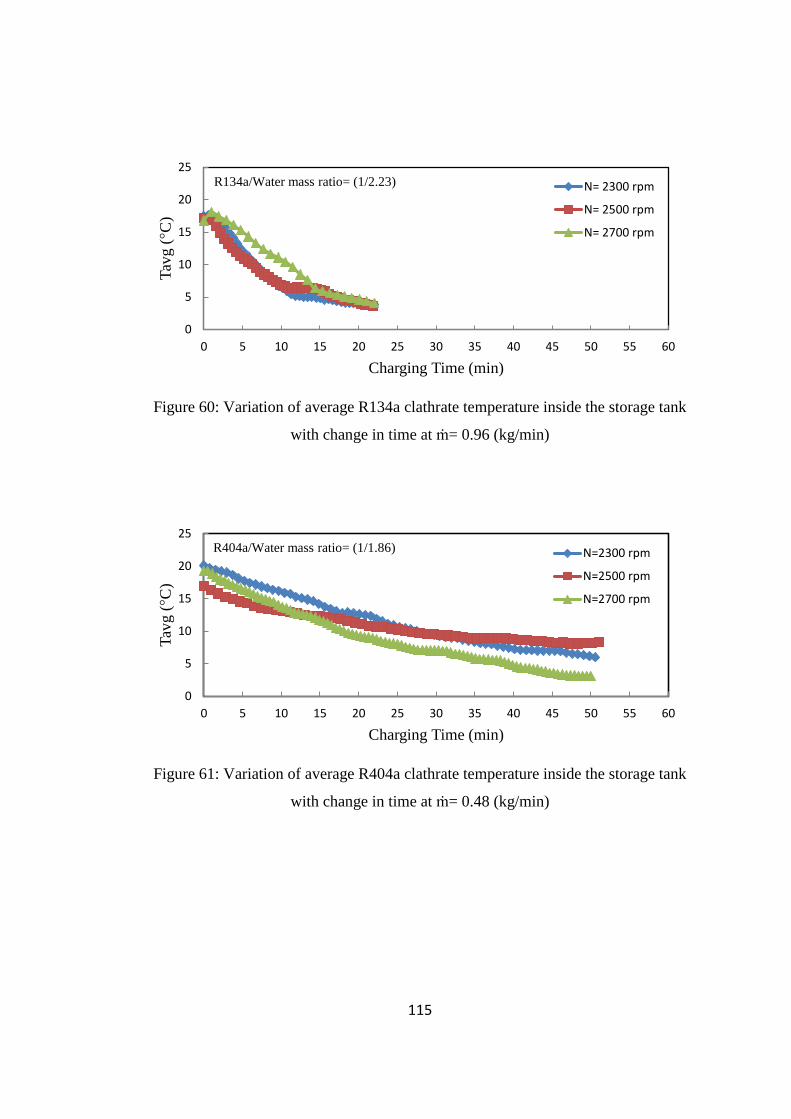
115
Figure 60: Variation of average R134a clathrate temperature inside the storage tank
with change in time at ṁ= 0.96 (kg/min)
Figure 61: Variation of average R404a clathrate temperature inside the storage tank
with change in time at ṁ= 0.48 (kg/min)
0
5
10
15
20
25
0 5 10 15 20 25 30 35 40 45 50 55 60
Tav
g (
°C)
Charging Time (min)
N= 2300 rpm
N= 2500 rpm
N= 2700 rpm
R134a/Water mass ratio= (1/2.23)
0
5
10
15
20
25
0 5 10 15 20 25 30 35 40 45 50 55 60
Tav
g (
°C)
Charging Time (min)
N=2300 rpm
N=2500 rpm
N=2700 rpm
R404a/Water mass ratio= (1/1.86)
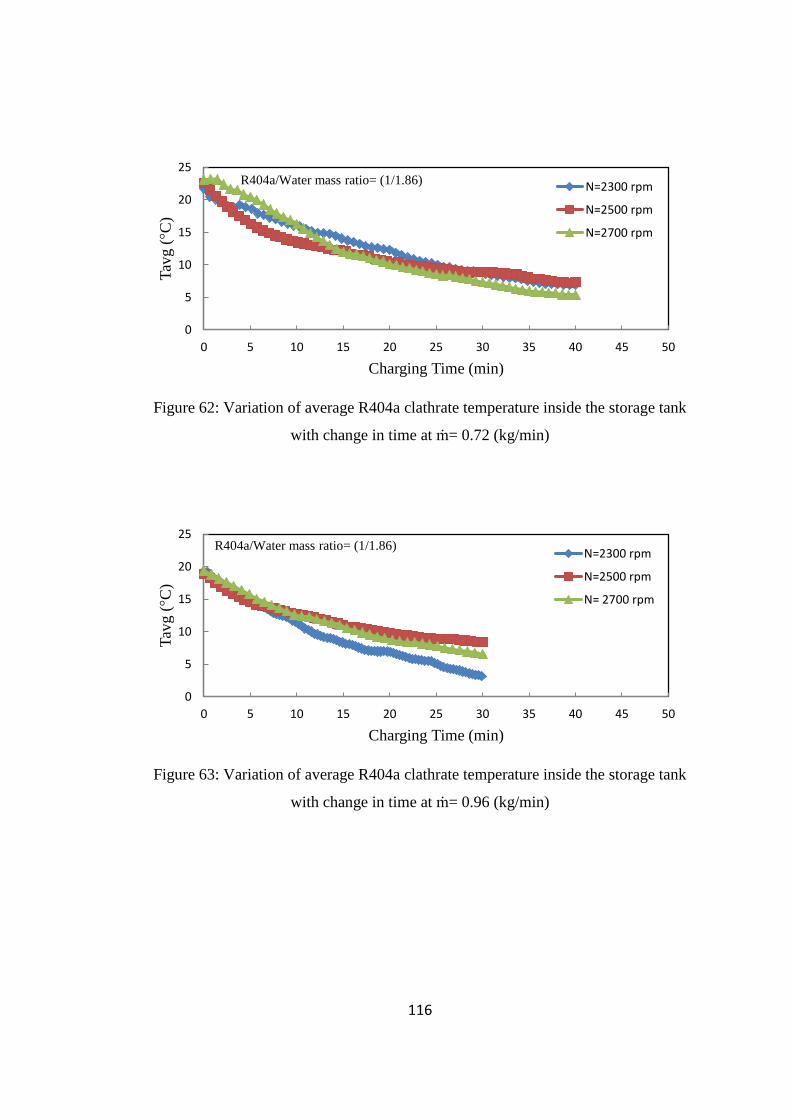
116
Figure 62: Variation of average R404a clathrate temperature inside the storage tank
with change in time at ṁ= 0.72 (kg/min)
Figure 63: Variation of average R404a clathrate temperature inside the storage tank
with change in time at ṁ= 0.96 (kg/min)
0
5
10
15
20
25
0 5 10 15 20 25 30 35 40 45 50
Tav
g (
°C)
Charging Time (min)
N=2300 rpm
N=2500 rpm
N=2700 rpm
R404a/Water mass ratio= (1/1.86)
0
5
10
15
20
25
0 5 10 15 20 25 30 35 40 45 50
Tav
g (
°C)
Charging Time (min)
N=2300 rpm
N=2500 rpm
N= 2700 rpm
R404a/Water mass ratio= (1/1.86)
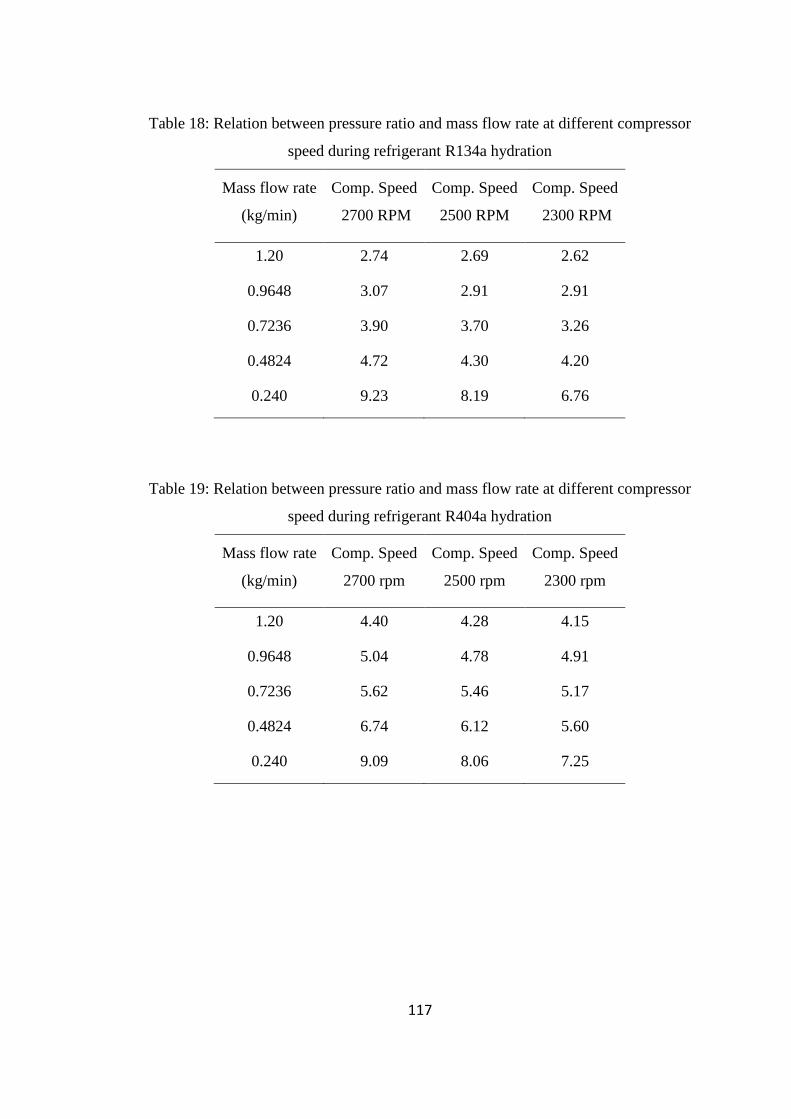
117
Table 18: Relation between pressure ratio and mass flow rate at different compressor
speed during refrigerant R134a hydration
Mass flow rate
(kg/min)
Comp. Speed
2700 RPM
Comp. Speed
2500 RPM
Comp. Speed
2300 RPM
1.20 2.74 2.69 2.62
0.9648 3.07 2.91 2.91
0.7236 3.90 3.70 3.26
0.4824 4.72 4.30 4.20
0.240 9.23 8.19 6.76
Table 19: Relation between pressure ratio and mass flow rate at different compressor
speed during refrigerant R404a hydration
Mass flow rate
(kg/min)
Comp. Speed
2700 rpm
Comp. Speed
2500 rpm
Comp. Speed
2300 rpm
1.20 4.40 4.28 4.15
0.9648 5.04 4.78 4.91
0.7236 5.62 5.46 5.17
0.4824 6.74 6.12 5.60
0.240 9.09 8.06 7.25
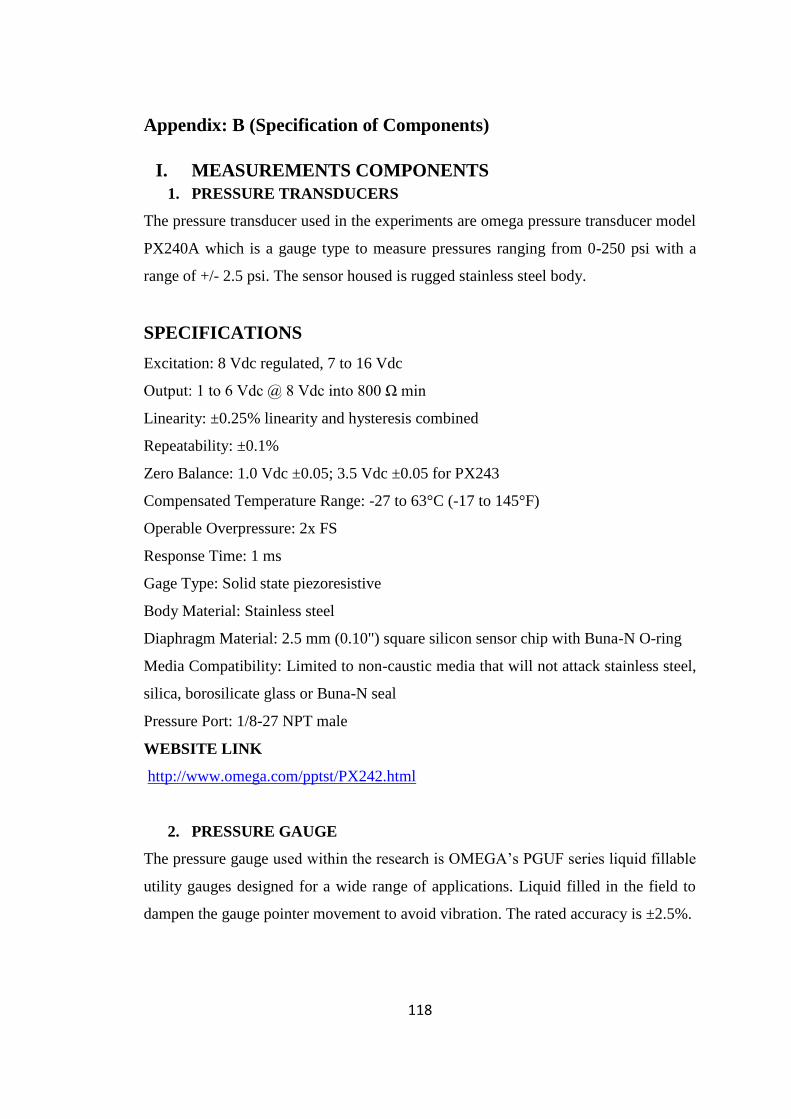
118
Appendix: B (Specification of Components)
I. MEASUREMENTS COMPONENTS
1. PRESSURE TRANSDUCERS
The pressure transducer used in the experiments are omega pressure transducer model
PX240A which is a gauge type to measure pressures ranging from 0-250 psi with a
range of +/- 2.5 psi. The sensor housed is rugged stainless steel body.
SPECIFICATIONS
Excitation: 8 Vdc regulated, 7 to 16 Vdc
Output: 1 to 6 Vdc @ 8 Vdc into 800 Ω min
Linearity: ±0.25% linearity and hysteresis combined
Repeatability: ±0.1%
Zero Balance: 1.0 Vdc ±0.05; 3.5 Vdc ±0.05 for PX243
Compensated Temperature Range: -27 to 63°C (-17 to 145°F)
Operable Overpressure: 2x FS
Response Time: 1 ms
Gage Type: Solid state piezoresistive
Body Material: Stainless steel
Diaphragm Material: 2.5 mm (0.10") square silicon sensor chip with Buna-N O-ring
Media Compatibility: Limited to non-caustic media that will not attack stainless steel,
silica, borosilicate glass or Buna-N seal
Pressure Port: 1/8-27 NPT male
WEBSITE LINK
http://www.omega.com/pptst/PX242.html
2. PRESSURE GAUGE
The pressure gauge used within the research is OMEGA’s PGUF series liquid fillable
utility gauges designed for a wide range of applications. Liquid filled in the field to
dampen the gauge pointer movement to avoid vibration. The rated accuracy is ±2.5%.
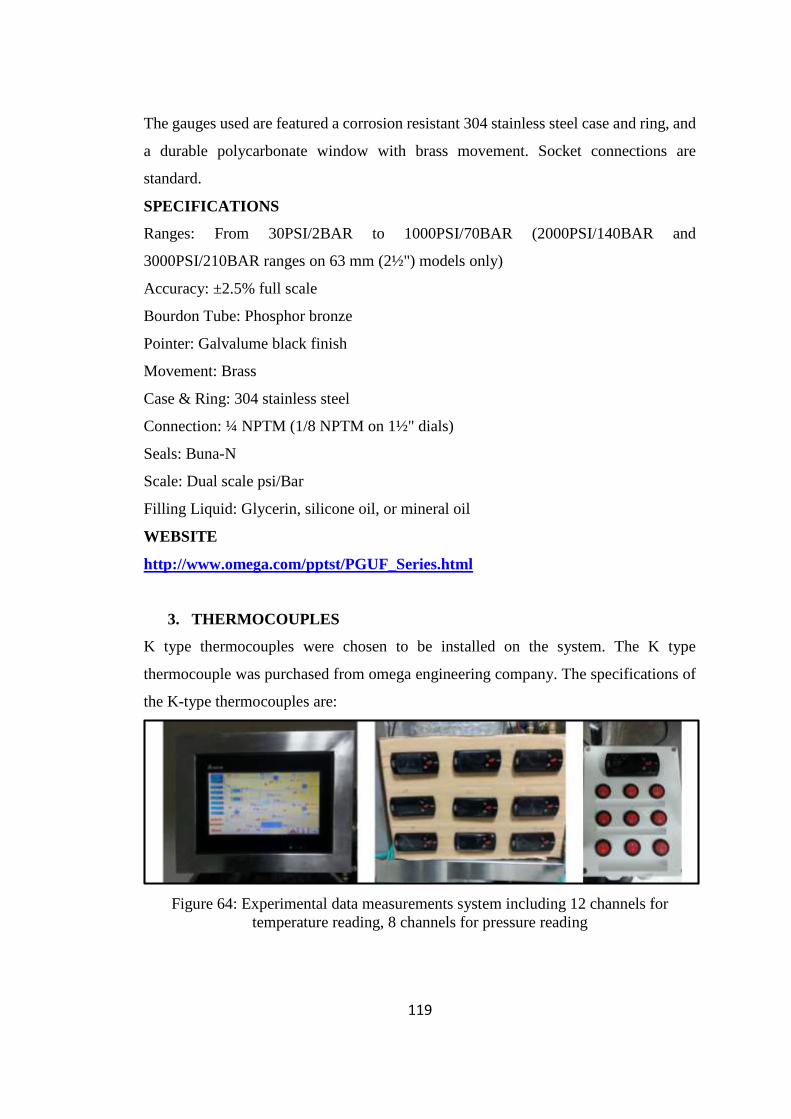
119
The gauges used are featured a corrosion resistant 304 stainless steel case and ring, and
a durable polycarbonate window with brass movement. Socket connections are
standard.
SPECIFICATIONS
Ranges: From 30PSI/2BAR to 1000PSI/70BAR (2000PSI/140BAR and
3000PSI/210BAR ranges on 63 mm (2½") models only)
Accuracy: ±2.5% full scale
Bourdon Tube: Phosphor bronze
Pointer: Galvalume black finish
Movement: Brass
Case & Ring: 304 stainless steel
Connection: ¼ NPTM (1/8 NPTM on 1½" dials)
Seals: Buna-N
Scale: Dual scale psi/Bar
Filling Liquid: Glycerin, silicone oil, or mineral oil
WEBSITE
http://www.omega.com/pptst/PGUF_Series.html
3. THERMOCOUPLES
K type thermocouples were chosen to be installed on the system. The K type
thermocouple was purchased from omega engineering company. The specifications of
the K-type thermocouples are:
Figure 64: Experimental data measurements system including 12 channels for
temperature reading, 8 channels for pressure reading
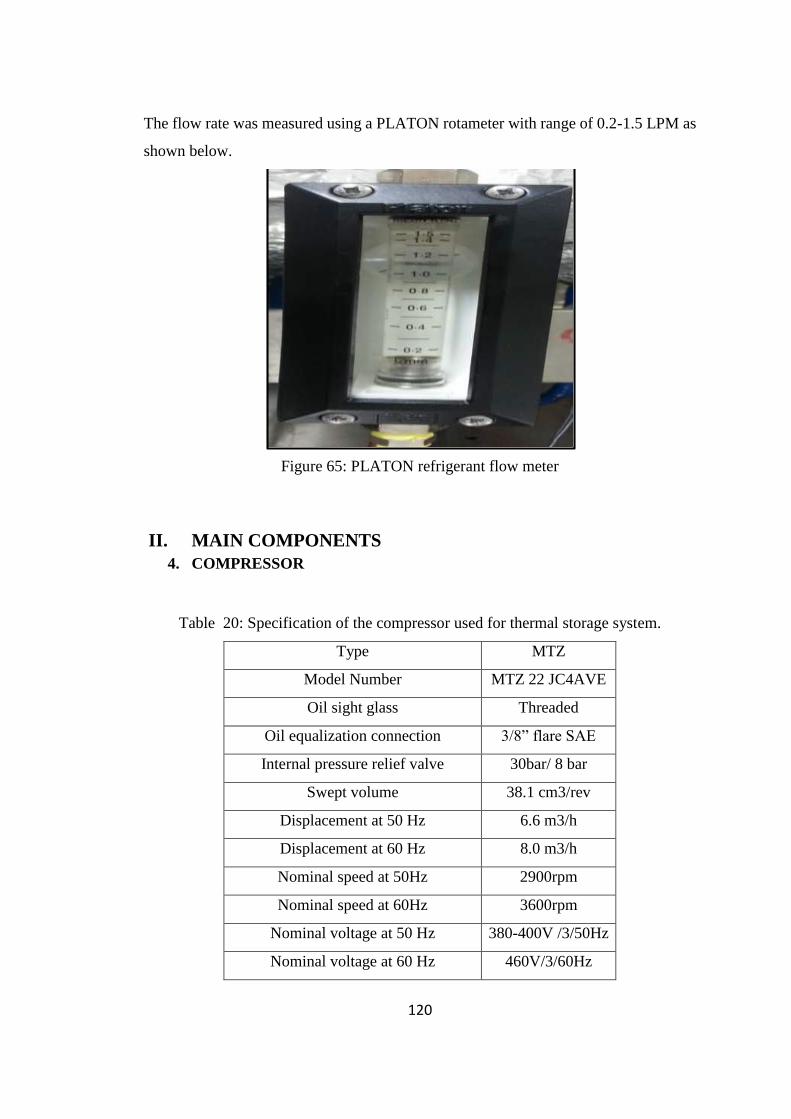
120
The flow rate was measured using a PLATON rotameter with range of 0.2-1.5 LPM as
shown below.
Figure 65: PLATON refrigerant flow meter
II. MAIN COMPONENTS
4. COMPRESSOR
Table 20: Specification of the compressor used for thermal storage system.
Type MTZ
Model Number MTZ 22 JC4AVE
Oil sight glass Threaded
Oil equalization connection 3/8” flare SAE
Internal pressure relief valve 30bar/ 8 bar
Swept volume 38.1 cm3/rev
Displacement at 50 Hz 6.6 m3/h
Displacement at 60 Hz 8.0 m3/h
Nominal speed at 50Hz 2900rpm
Nominal speed at 60Hz 3600rpm
Nominal voltage at 50 Hz 380-400V /3/50Hz
Nominal voltage at 60 Hz 460V/3/60Hz
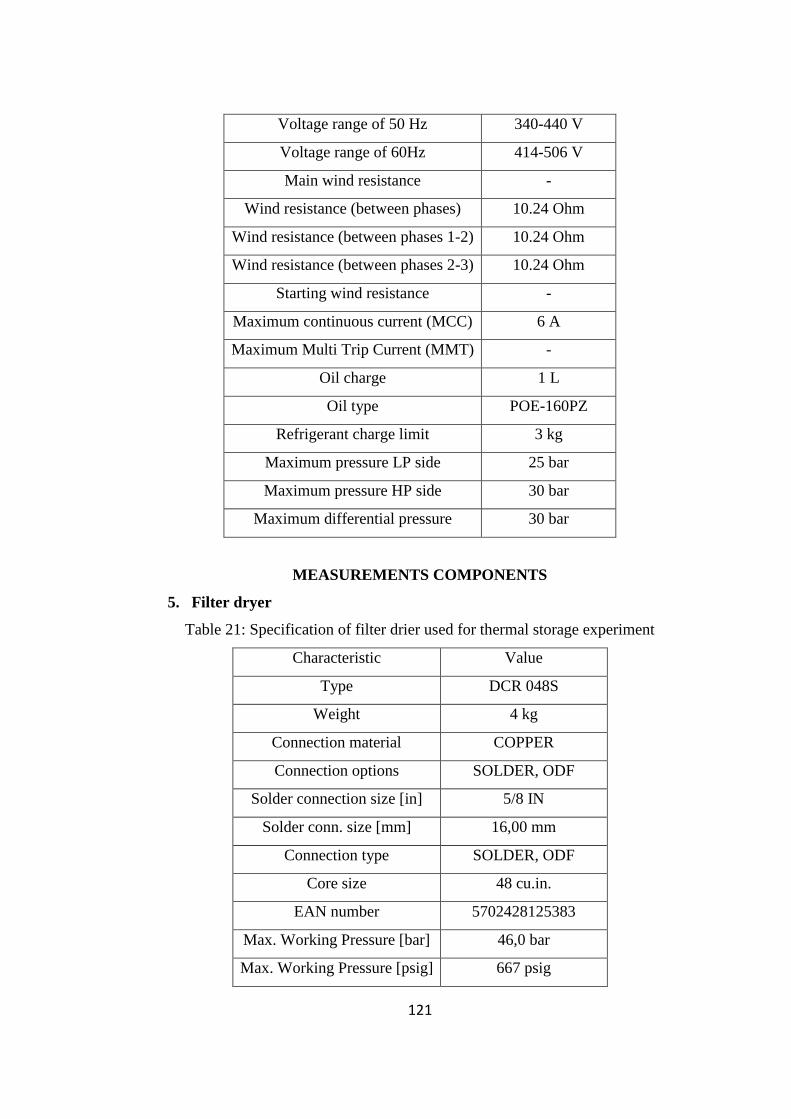
121
Voltage range of 50 Hz 340-440 V
Voltage range of 60Hz 414-506 V
Main wind resistance -
Wind resistance (between phases) 10.24 Ohm
Wind resistance (between phases 1-2) 10.24 Ohm
Wind resistance (between phases 2-3) 10.24 Ohm
Starting wind resistance -
Maximum continuous current (MCC) 6 A
Maximum Multi Trip Current (MMT) -
Oil charge 1 L
Oil type POE-160PZ
Refrigerant charge limit 3 kg
Maximum pressure LP side 25 bar
Maximum pressure HP side 30 bar
Maximum differential pressure 30 bar
MEASUREMENTS COMPONENTS
5. Filter dryer
Table 21: Specification of filter drier used for thermal storage experiment
Characteristic Value
Type DCR 048S
Weight 4 kg
Connection material COPPER
Connection options SOLDER, ODF
Solder connection size [in] 5/8 IN
Solder conn. size [mm] 16,00 mm
Connection type SOLDER, ODF
Core size 48 cu.in.
EAN number 5702428125383
Max. Working Pressure [bar] 46,0 bar
Max. Working Pressure [psig] 667 psig
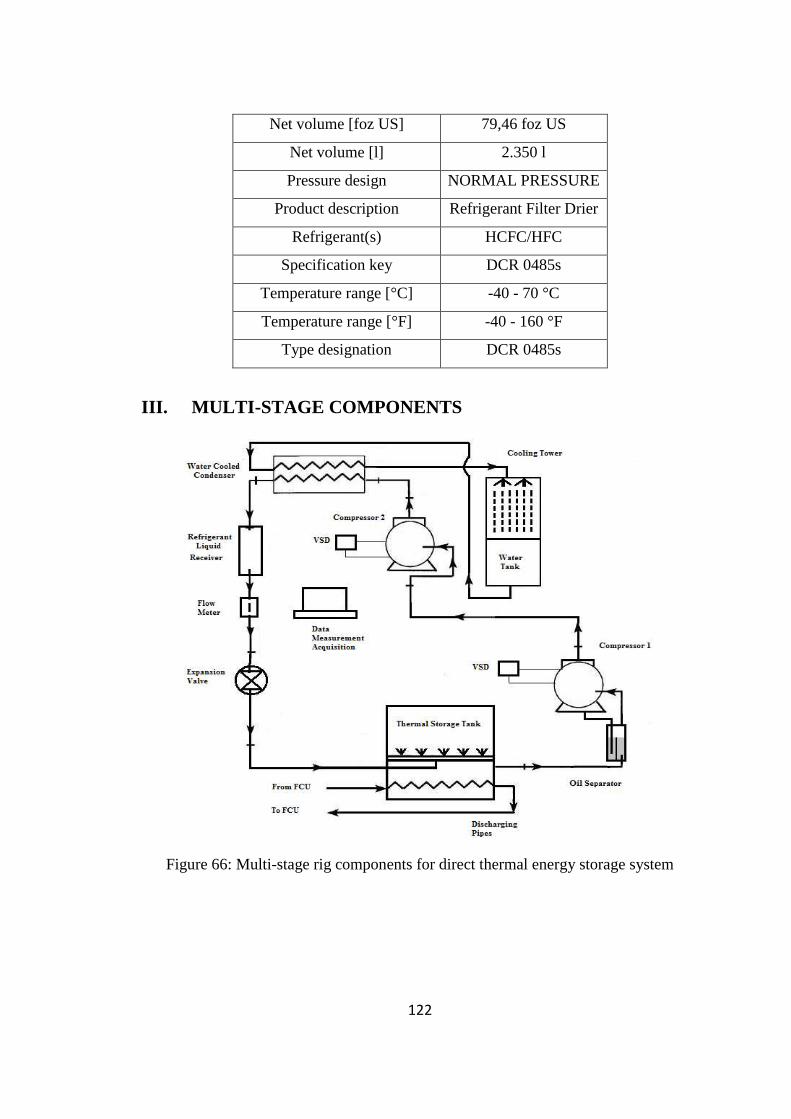
122
Net volume [foz US] 79,46 foz US
Net volume [l] 2.350 l
Pressure design NORMAL PRESSURE
Product description Refrigerant Filter Drier
Refrigerant(s) HCFC/HFC
Specification key DCR 0485s
Temperature range [°C] -40 - 70 °C
Temperature range [°F] -40 - 160 °F
Type designation DCR 0485s
III. MULTI-STAGE COMPONENTS
Figure 66: Multi-stage rig components for direct thermal energy storage system
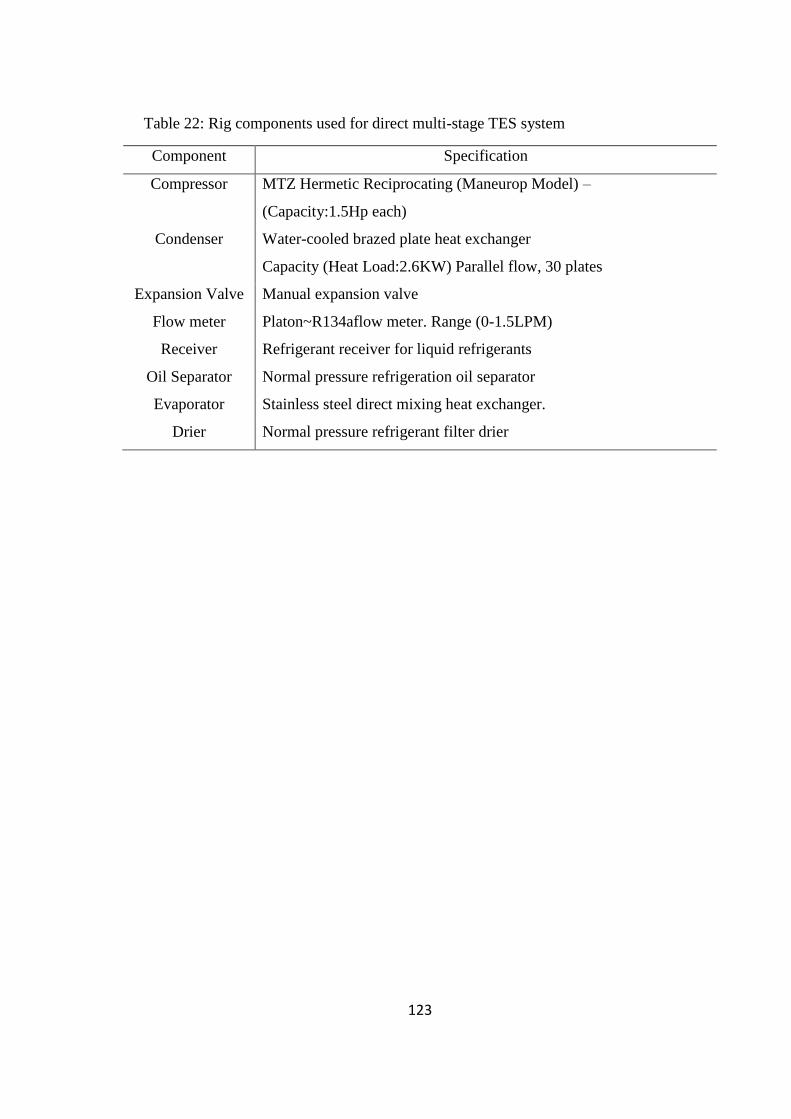
123
Table 22: Rig components used for direct multi-stage TES system
Component Specification
Compressor MTZ Hermetic Reciprocating (Maneurop Model) –
(Capacity:1.5Hp each)
Condenser Water-cooled brazed plate heat exchanger
Capacity (Heat Load:2.6KW) Parallel flow, 30 plates
Expansion Valve Manual expansion valve
Flow meter Platon~R134aflow meter. Range (0-1.5LPM)
Receiver Refrigerant receiver for liquid refrigerants
Oil Separator Normal pressure refrigeration oil separator
Evaporator Stainless steel direct mixing heat exchanger.
Drier Normal pressure refrigerant filter drier
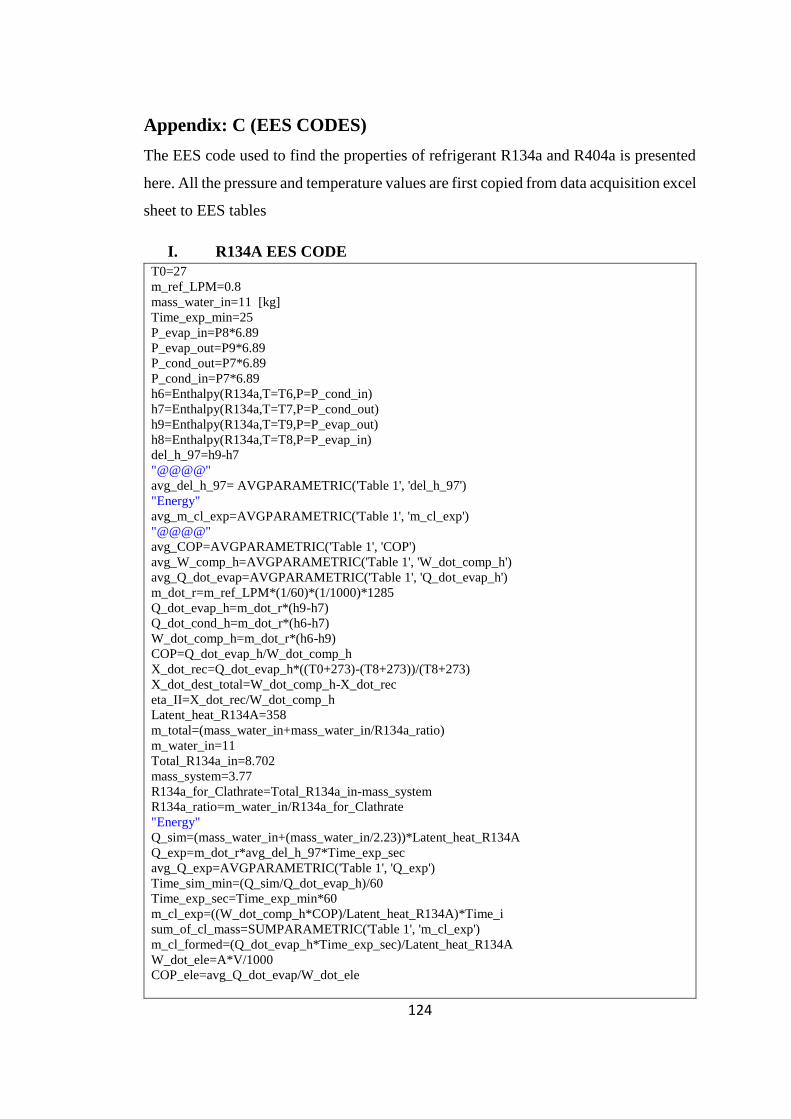
124
Appendix: C (EES CODES)
The EES code used to find the properties of refrigerant R134a and R404a is presented
here. All the pressure and temperature values are first copied from data acquisition excel
sheet to EES tables
I. R134A EES CODE
T0=27
m_ref_LPM=0.8
mass_water_in=11 [kg]
Time_exp_min=25
P_evap_in=P8*6.89
P_evap_out=P9*6.89
P_cond_out=P7*6.89
P_cond_in=P7*6.89
h6=Enthalpy(R134a,T=T6,P=P_cond_in)
h7=Enthalpy(R134a,T=T7,P=P_cond_out)
h9=Enthalpy(R134a,T=T9,P=P_evap_out)
h8=Enthalpy(R134a,T=T8,P=P_evap_in)
del_h_97=h9-h7
"@@@@"
avg_del_h_97= AVGPARAMETRIC('Table 1', 'del_h_97')
"Energy"
avg_m_cl_exp=AVGPARAMETRIC('Table 1', 'm_cl_exp')
"@@@@"
avg_COP=AVGPARAMETRIC('Table 1', 'COP')
avg_W_comp_h=AVGPARAMETRIC('Table 1', 'W_dot_comp_h')
avg_Q_dot_evap=AVGPARAMETRIC('Table 1', 'Q_dot_evap_h')
m_dot_r=m_ref_LPM*(1/60)*(1/1000)*1285
Q_dot_evap_h=m_dot_r*(h9-h7)
Q_dot_cond_h=m_dot_r*(h6-h7)
W_dot_comp_h=m_dot_r*(h6-h9)
COP=Q_dot_evap_h/W_dot_comp_h
X_dot_rec=Q_dot_evap_h*((T0+273)-(T8+273))/(T8+273)
X_dot_dest_total=W_dot_comp_h-X_dot_rec
eta_II=X_dot_rec/W_dot_comp_h
Latent_heat_R134A=358
m_total=(mass_water_in+mass_water_in/R134a_ratio)
m_water_in=11
Total_R134a_in=8.702
mass_system=3.77
R134a_for_Clathrate=Total_R134a_in-mass_system
R134a_ratio=m_water_in/R134a_for_Clathrate
"Energy"
Q_sim=(mass_water_in+(mass_water_in/2.23))*Latent_heat_R134A
Q_exp=m_dot_r*avg_del_h_97*Time_exp_sec
avg_Q_exp=AVGPARAMETRIC('Table 1', 'Q_exp')
Time_sim_min=(Q_sim/Q_dot_evap_h)/60
Time_exp_sec=Time_exp_min*60
m_cl_exp=((W_dot_comp_h*COP)/Latent_heat_R134A)*Time_i
sum_of_cl_mass=SUMPARAMETRIC('Table 1', 'm_cl_exp')
m_cl_formed=(Q_dot_evap_h*Time_exp_sec)/Latent_heat_R134A
W_dot_ele=A*V/1000
COP_ele=avg_Q_dot_evap/W_dot_ele
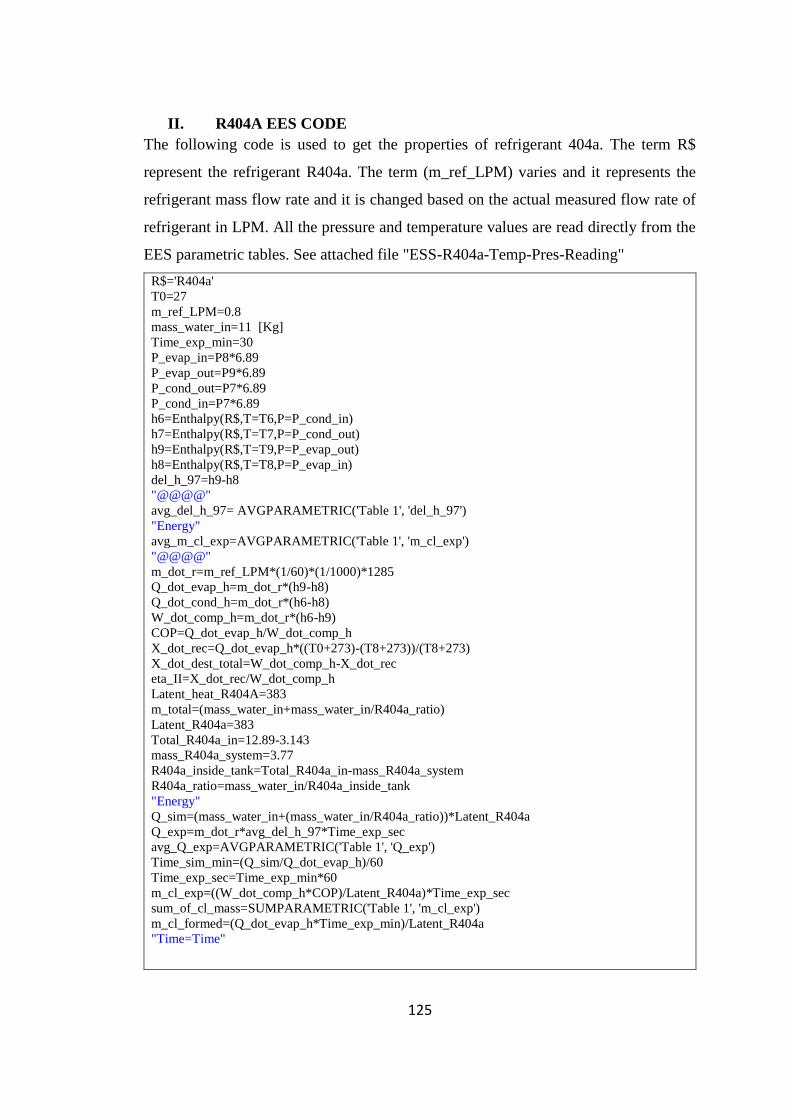
125
II. R404A EES CODE
The following code is used to get the properties of refrigerant 404a. The term R$
represent the refrigerant R404a. The term (m_ref_LPM) varies and it represents the
refrigerant mass flow rate and it is changed based on the actual measured flow rate of
refrigerant in LPM. All the pressure and temperature values are read directly from the
EES parametric tables. See attached file "ESS-R404a-Temp-Pres-Reading"
R$='R404a'
T0=27
m_ref_LPM=0.8
mass_water_in=11 [Kg]
Time_exp_min=30
P_evap_in=P8*6.89
P_evap_out=P9*6.89
P_cond_out=P7*6.89
P_cond_in=P7*6.89
h6=Enthalpy(R$,T=T6,P=P_cond_in)
h7=Enthalpy(R$,T=T7,P=P_cond_out)
h9=Enthalpy(R$,T=T9,P=P_evap_out)
h8=Enthalpy(R$,T=T8,P=P_evap_in)
del_h_97=h9-h8
"@@@@"
avg_del_h_97= AVGPARAMETRIC('Table 1', 'del_h_97')
"Energy"
avg_m_cl_exp=AVGPARAMETRIC('Table 1', 'm_cl_exp')
"@@@@"
m_dot_r=m_ref_LPM*(1/60)*(1/1000)*1285
Q_dot_evap_h=m_dot_r*(h9-h8)
Q_dot_cond_h=m_dot_r*(h6-h8)
W_dot_comp_h=m_dot_r*(h6-h9)
COP=Q_dot_evap_h/W_dot_comp_h
X_dot_rec=Q_dot_evap_h*((T0+273)-(T8+273))/(T8+273)
X_dot_dest_total=W_dot_comp_h-X_dot_rec
eta_II=X_dot_rec/W_dot_comp_h
Latent_heat_R404A=383
m_total=(mass_water_in+mass_water_in/R404a_ratio)
Latent_R404a=383
Total_R404a_in=12.89-3.143
mass_R404a_system=3.77
R404a_inside_tank=Total_R404a_in-mass_R404a_system
R404a_ratio=mass_water_in/R404a_inside_tank
"Energy"
Q_sim=(mass_water_in+(mass_water_in/R404a_ratio))*Latent_R404a
Q_exp=m_dot_r*avg_del_h_97*Time_exp_sec
avg_Q_exp=AVGPARAMETRIC('Table 1', 'Q_exp')
Time_sim_min=(Q_sim/Q_dot_evap_h)/60
Time_exp_sec=Time_exp_min*60
m_cl_exp=((W_dot_comp_h*COP)/Latent_R404a)*Time_exp_sec
sum_of_cl_mass=SUMPARAMETRIC('Table 1', 'm_cl_exp')
m_cl_formed=(Q_dot_evap_h*Time_exp_min)/Latent_R404a
"Time=Time"
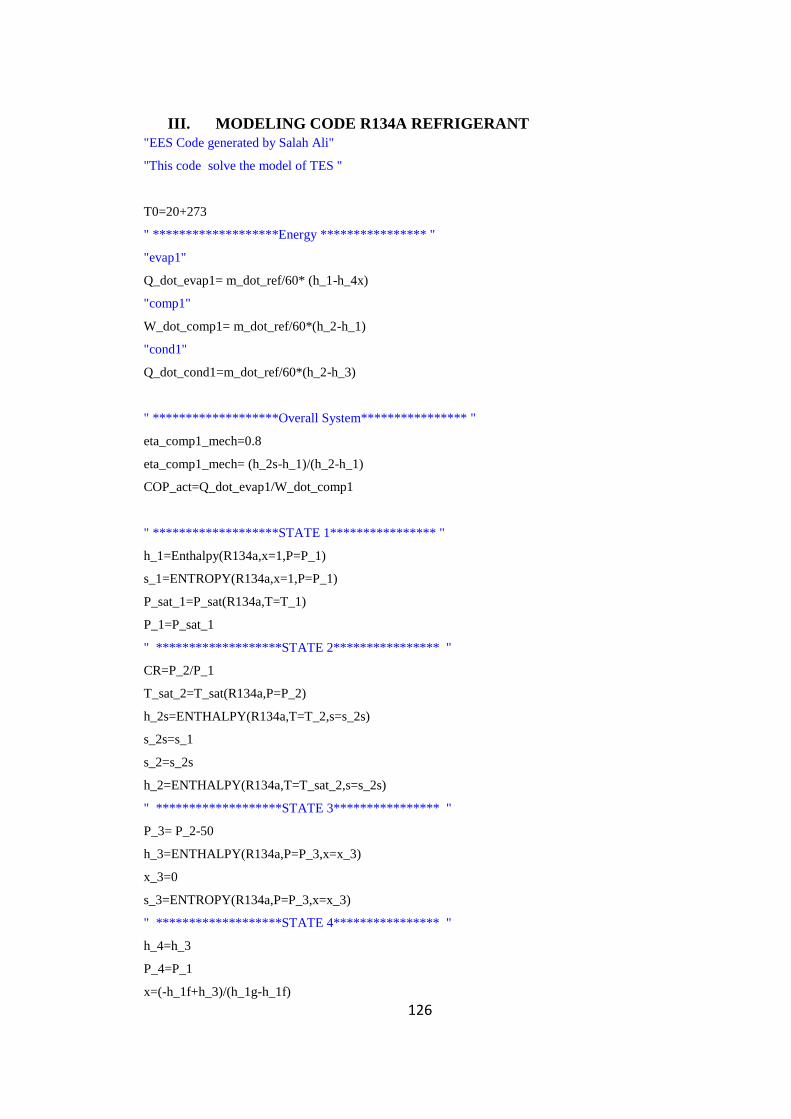
126
III. MODELING CODE R134A REFRIGERANT
"EES Code generated by Salah Ali"
"This code solve the model of TES "
T0=20+273
" *******************Energy **************** "
"evap1"
Q_dot_evap1= m_dot_ref/60* (h_1-h_4x)
"comp1"
W_dot_comp1= m_dot_ref/60*(h_2-h_1)
"cond1"
Q_dot_cond1=m_dot_ref/60*(h_2-h_3)
" *******************Overall System**************** "
eta_comp1_mech=0.8
eta_comp1_mech= (h_2s-h_1)/(h_2-h_1)
COP_act=Q_dot_evap1/W_dot_comp1
" *******************STATE 1**************** "
h_1=Enthalpy(R134a,x=1,P=P_1)
s_1=ENTROPY(R134a,x=1,P=P_1)
P_sat_1=P_sat(R134a,T=T_1)
P_1=P_sat_1
" *******************STATE 2**************** "
CR=P_2/P_1
T_sat_2=T_sat(R134a,P=P_2)
h_2s=ENTHALPY(R134a,T=T_2,s=s_2s)
s_2s=s_1
s_2=s_2s
h_2=ENTHALPY(R134a,T=T_sat_2,s=s_2s)
" *******************STATE 3**************** "
P_3= P_2-50
h_3=ENTHALPY(R134a,P=P_3,x=x_3)
x_3=0
s_3=ENTROPY(R134a,P=P_3,x=x_3)
" *******************STATE 4**************** "
h_4=h_3
P_4=P_1
x=(-h_1f+h_3)/(h_1g-h_1f)
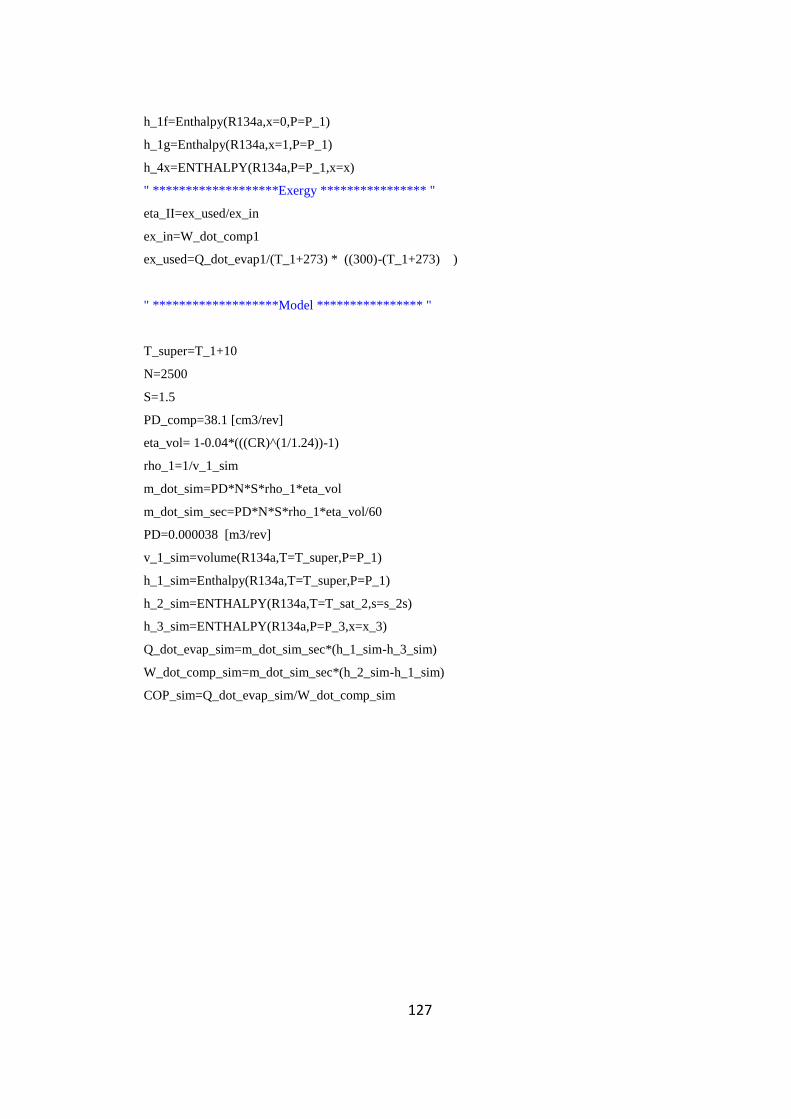
127
h_1f=Enthalpy(R134a,x=0,P=P_1)
h_1g=Enthalpy(R134a,x=1,P=P_1)
h_4x=ENTHALPY(R134a,P=P_1,x=x)
" *******************Exergy **************** "
eta_II=ex_used/ex_in
ex_in=W_dot_comp1
ex_used=Q_dot_evap1/(T_1+273) * ((300)-(T_1+273) )
" *******************Model **************** "
T_super=T_1+10
N=2500
S=1.5
PD_comp=38.1 [cm3/rev]
eta_vol= 1-0.04*(((CR)^(1/1.24))-1)
rho_1=1/v_1_sim
m_dot_sim=PD*N*S*rho_1*eta_vol
m_dot_sim_sec=PD*N*S*rho_1*eta_vol/60
PD=0.000038 [m3/rev]
v_1_sim=volume(R134a,T=T_super,P=P_1)
h_1_sim=Enthalpy(R134a,T=T_super,P=P_1)
h_2_sim=ENTHALPY(R134a,T=T_sat_2,s=s_2s)
h_3_sim=ENTHALPY(R134a,P=P_3,x=x_3)
Q_dot_evap_sim=m_dot_sim_sec*(h_1_sim-h_3_sim)
W_dot_comp_sim=m_dot_sim_sec*(h_2_sim-h_1_sim)
COP_sim=Q_dot_evap_sim/W_dot_comp_sim
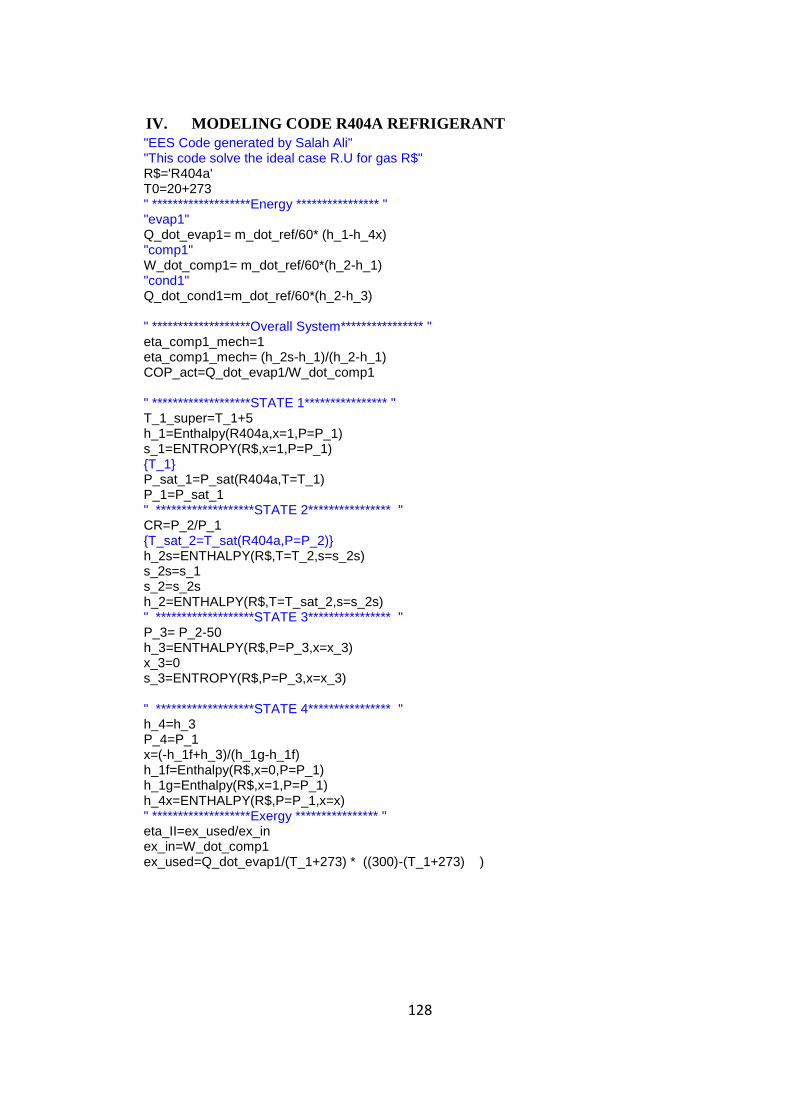
128
IV. MODELING CODE R404A REFRIGERANT
"EES Code generated by Salah Ali" "This code solve the ideal case R.U for gas R$" R$='R404a' T0=20+273 " *******************Energy **************** " "evap1" Q_dot_evap1= m_dot_ref/60* (h_1-h_4x) "comp1" W_dot_comp1= m_dot_ref/60*(h_2-h_1) "cond1" Q_dot_cond1=m_dot_ref/60*(h_2-h_3) " *******************Overall System**************** " eta_comp1_mech=1 eta_comp1_mech= (h_2s-h_1)/(h_2-h_1) COP_act=Q_dot_evap1/W_dot_comp1 " *******************STATE 1**************** " T_1_super=T_1+5 h_1=Enthalpy(R404a,x=1,P=P_1) s_1=ENTROPY(R$,x=1,P=P_1) {T_1} P_sat_1=P_sat(R404a,T=T_1) P_1=P_sat_1 " *******************STATE 2**************** " CR=P_2/P_1 {T_sat_2=T_sat(R404a,P=P_2)} h_2s=ENTHALPY(R$,T=T_2,s=s_2s) s_2s=s_1 s_2=s_2s h_2=ENTHALPY(R$,T=T_sat_2,s=s_2s) " *******************STATE 3**************** " P_3= P_2-50 h_3=ENTHALPY(R$,P=P_3,x=x_3) x_3=0 s_3=ENTROPY(R$,P=P_3,x=x_3) " *******************STATE 4**************** " h_4=h_3 P_4=P_1 x=(-h_1f+h_3)/(h_1g-h_1f) h_1f=Enthalpy(R$,x=0,P=P_1) h_1g=Enthalpy(R$,x=1,P=P_1) h_4x=ENTHALPY(R$,P=P_1,x=x) " *******************Exergy **************** " eta_II=ex_used/ex_in ex_in=W_dot_comp1 ex_used=Q_dot_evap1/(T_1+273) * ((300)-(T_1+273) )
129
Vita
Salah Ali Alshaibani was born on June 6, 1986 in Yemen. He received a
comprehensive education in Mohammed Ali Othman National School in Yemen. He
completed his GCE A levels before joining the American University of Sharjah in 2005
for his undergraduate studies in Mechanical Engineering. He graduated from AUS in
2010 with a minor in Engineering Management.
Salah then attended the master program at the same university. He worked at
the mechanical department as a teaching assistant for two years wherein he was working
as graduate teaching assistant in thermofluids laboratory. During his educational career,
he attended various energy summits, local conferences and business forums. He then
joined Hayel Saeed Anam Group as an Energy Audit Engineer.