Embed Size (px)
Citation preview
UMTRI-2007-51 DECEMBER 2007
EVALUATION OF 2006 IDAHO CRASH DATA REPORTED TO MCMIS CRASH FILE
PAUL E. GREEN ANNE MATTESON

UMTRI-2007-51
Evaluation of 2006 Idaho Crash Data Reported to the MCMIS Crash File
Paul E. Green Anne Matteson
The University of Michigan Transportation Research Institute
Ann Arbor, MI 48109-2150 U.S.A.
December 2007

ii
iii
Technical Report Documentation Page 1. Report No.
UMTRI-2007-51 2. Government Accession No.
3. Recipient’s Catalog No.
5. Report Date
December 2007
4. Title and Subtitle
Evaluation of 2006 Idaho Crash Data Reported to the MCMIS Crash File 6. Performing Organization Code
7. Author(s) Green, Paul E. and Matteson, Anne
8. Performing Organization Report No.
UMTRI-2007-51
10. Work Unit no. (TRAIS)
052702 9. Performing Organization Name and Address
The University of Michigan Transportation Research Institute 2901 Baxter Road Ann Arbor, Michigan 48109-2150 U.S.A.
11. Contract or Grant No.
DTMC75-06-H-00003
13. Type of Report and Period Covered
Special report 12. Sponsoring Agency Name and Address U.S. Department of Transportation Federal Motor Carrier Safety Administration 400 Seventh Street, SW Washington, D.C. 20590
14. Sponsoring Agency Code
15. Supplementary Notes
16. Abstract
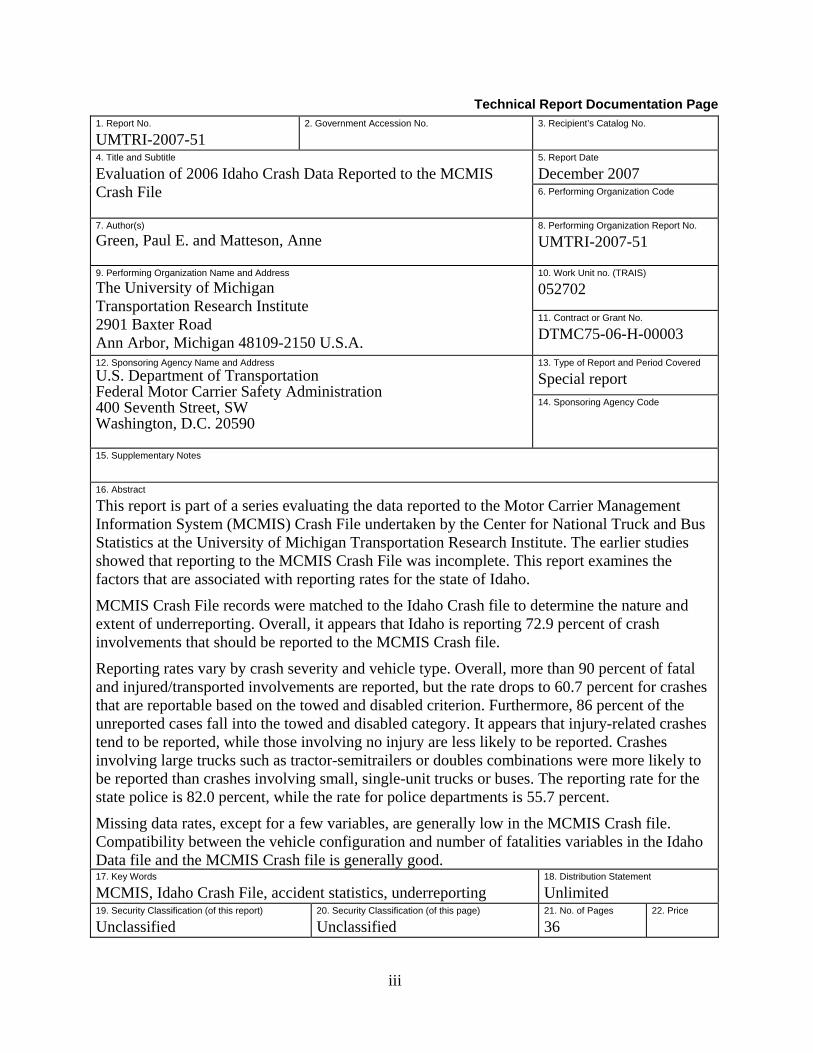
This report is part of a series evaluating the data reported to the Motor Carrier Management Information System (MCMIS) Crash File undertaken by the Center for National Truck and Bus Statistics at the University of Michigan Transportation Research Institute. The earlier studies showed that reporting to the MCMIS Crash File was incomplete. This report examines the factors that are associated with reporting rates for the state of Idaho.
MCMIS Crash File records were matched to the Idaho Crash file to determine the nature and extent of underreporting. Overall, it appears that Idaho is reporting 72.9 percent of crash involvements that should be reported to the MCMIS Crash file.
Reporting rates vary by crash severity and vehicle type. Overall, more than 90 percent of fatal and injured/transported involvements are reported, but the rate drops to 60.7 percent for crashes that are reportable based on the towed and disabled criterion. Furthermore, 86 percent of the unreported cases fall into the towed and disabled category. It appears that injury-related crashes tend to be reported, while those involving no injury are less likely to be reported. Crashes involving large trucks such as tractor-semitrailers or doubles combinations were more likely to be reported than crashes involving small, single-unit trucks or buses. The reporting rate for the state police is 82.0 percent, while the rate for police departments is 55.7 percent.
Missing data rates, except for a few variables, are generally low in the MCMIS Crash file. Compatibility between the vehicle configuration and number of fatalities variables in the Idaho Data file and the MCMIS Crash file is generally good. 17. Key Words
MCMIS, Idaho Crash File, accident statistics, underreporting 18. Distribution Statement
Unlimited 19. Security Classification (of this report)
Unclassified 20. Security Classification (of this page)
Unclassified 21. No. of Pages
36 22. Price
iv
SI* (MODERN METRIC) CONVERSION FACTORS APPROXIMATE CONVERSIONS TO SI UNITS
Symbol When You Know Multiply By To Find Symbol LENGTH
in inches 25.4 millimeters mm ft feet 0.305 meters m yd yards 0.914 meters m mi miles 1.61 kilometers km
AREA in2 square inches 645.2 square millimeters mm2
ft2 square feet 0.093 square meters m2
yd2 square yard 0.836 square meters m2
ac acres 0.405 hectares ha mi2 square miles 2.59 square kilometers km2
VOLUME fl oz fluid ounces 29.57 milliliters mL gal gallons 3.785 liters L ft3 cubic feet 0.028 cubic meters m3
yd3 cubic yards 0.765 cubic meters m3
NOTE: volumes greater than 1000 L shall be shown in m3
MASS oz ounces 28.35 grams glb pounds 0.454 kilograms kgT short tons (2000 lb) 0.907 megagrams (or "metric ton") Mg (or "t")
TEMPERATURE (exact degrees) oF Fahrenheit 5 (F-32)/9 Celsius oC
or (F-32)/1.8 ILLUMINATION
fc foot-candles 10.76 lux lx fl foot-Lamberts 3.426 candela/m2 cd/m2
FORCE and PRESSURE or STRESS lbf poundforce 4.45 newtons N lbf/in2 poundforce per square inch 6.89 kilopascals kPa
APPROXIMATE CONVERSIONS FROM SI UNITS Symbol When You Know Multiply By To Find Symbol
LENGTHmm millimeters 0.039 inches in m meters 3.28 feet ft m meters 1.09 yards yd km kilometers 0.621 miles mi
AREA mm2 square millimeters 0.0016 square inches in2
m2 square meters 10.764 square feet ft2
m2 square meters 1.195 square yards yd2
ha hectares 2.47 acres ac km2 square kilometers 0.386 square miles mi2
VOLUME mL milliliters 0.034 fluid ounces fl oz L liters 0.264 gallons gal m3 cubic meters 35.314 cubic feet ft3
m3 cubic meters 1.307 cubic yards yd3
MASS g grams 0.035 ounces ozkg kilograms 2.202 pounds lbMg (or "t") megagrams (or "metric ton") 1.103 short tons (2000 lb) T
TEMPERATURE (exact degrees) oC Celsius 1.8C+32 Fahrenheit oF
ILLUMINATION lx lux 0.0929 foot-candles fc cd/m2 candela/m2 0.2919 foot-Lamberts fl
FORCE and PRESSURE or STRESS N newtons 0.225 poundforce lbf kPa kilopascals 0.145 poundforce per square inch lbf/in2
*SI is the symbol for th International System of Units. Appropriate rounding should be made to comply with Section 4 of ASTM E380. e(Revised March 2003)
v
Table of Contents
1. Introduction............................................................................................................................. 1
2. Data Preparation...................................................................................................................... 2
2.1 MCMIS Crash Data File ................................................................................................. 2
2.2 Idaho Police Accident Report File.................................................................................. 2
3. Matching Process .................................................................................................................... 3
4. Identifying Reportable Cases.................................................................................................. 5
5. Factors Associated with Reporting ......................................................................................... 8
5.1 Overreporting.................................................................................................................. 8
5.2 Case Processing .............................................................................................................. 9
5.3 Reporting Criteria ......................................................................................................... 11
5.4 Reporting Agency and Area.......................................................................................... 13
5.5 Truck/Bus Fire or Explosion......................................................................................... 14
6. Data Quality of Reported Cases............................................................................................ 15
7. Summary and Discussion...................................................................................................... 17
8. References............................................................................................................................. 21
Appendix A Selection Algorithm to Identify Reportable Records............................................... 24
Appendix B Idaho Traffic Accident Reports ................................................................................ 26
vi
List of Tables
Table 1 Steps in MCMIS/Idaho PAR File Match, 2006................................................................. 4
Table 2 Vehicle and Crash Severity Threshold for MCMIS Crash File......................................... 5
Table 3 Relevant Vehicle Body Style Codes on Idaho Accident Report ....................................... 6
Table 4 Vehicles Meeting MCMIS Vehicle Criteria, Idaho PAR File, 2006 ................................. 6
Table 5 Reportable Records in Idaho Crash File, 2006 .................................................................. 8
Table 6 Distribution of Non-reportable Vehicles in MCMIS Crash File, Idaho 2006 ................... 9
Table 7 Reporting Rate by Accident Month, Idaho 2006............................................................... 9
Table 8 Reporting Rate by Vehicle Type, Idaho 2006 ................................................................. 11
Table 9 Reporting Rate by Detailed Vehicle Body Style, Idaho 2006 ......................................... 12
Table 10 Reporting Rate by Crash Severity, Idaho 2006 ............................................................. 12
Table 11 Reporting Rate by Detailed Injury Severity, Idaho 2006 .............................................. 13
Table 12 Reporting Rate by County, Idaho 2006 ......................................................................... 14
Table 13 Reporting Rate by Reporting Agency, Idaho 2006........................................................ 14
Table 14 Reporting Rate by Fire/explosion, Idaho 2006.............................................................. 15
Table 15 Missing Data Rates for Selected MCMIS Crash File Variables, Idaho, 2006............... 15
Table 16 Vehicle Configuration in Idaho and MCMIS Crash Files, 2006 ................................... 17
Table 17 Comparison of Fatals in Crash in MCMIS and Idaho Crash Files, 2006 ...................... 17
List of Figures
Figure 1 Case Flow in MCMIS/Idaho Crash File Match................................................................ 4
Figure 2 Median Latency (in Days, Minus 90) in Reporting to the MCMIS Crash File, Idaho Reported Cases, 2006............................................................................................................ 10
Evaluation of 2006 Idaho Crash Data Reported to the MCMIS Crash File
1. Introduction
The Motor Carrier Management Information System (MCMIS) Crash file has been developed by the Federal Motor Carrier Safety Administration (FMCSA) to serve as a census file of trucks and buses involved in traffic crashes meeting a specified selection criteria and crash severity threshold. FMCSA maintains the MCMIS file to support its mission to reduce crashes, injuries, and fatalities involving large trucks and buses. It is essential to assess the magnitude and characteristics of motor carrier crashes to design effective safety measures to prevent such crashes. The usefulness of the MCMIS Crash file depends upon individual states transmitting a standard set of data items on all trucks and buses involved in traffic crashes that meet a specific severity threshold.
The present report is part of a series evaluating the completeness and accuracy of the data in the MCMIS Crash file. Previous reports on a number of states showed underreporting due in large part to problems in interpreting and applying the reporting criteria. The problems were more severe in large jurisdictions and police departments. Each state also had problems specific to the nature of its system. Some states also had overreporting of cases, often due to technical problems with duplicate records. [See references 1 to 25.] The states are responsible for identifying and reporting qualifying crash involvements. Accordingly, improved completeness and accuracy must ultimately reside with the individual states.
In this report, we focus on MCMIS Crash file reporting by Idaho. In recent years, Idaho has reported from 704 to 925 involvements annually to the MCMIS Crash file. According to the 2002 Vehicle Inventory and Use Survey (the last available), in 2002, Idaho had over 85,000 trucks registered, ranking 25th among the states and accounting for 1.6 percent of all truck registrations [26]. Idaho is the 39th largest state by population [27] and generally ranks 38th in terms of the number of annual truck and bus fatal involvements [28, 29].
The method employed in this study is similar to previous studies.
1. The complete police accident report file (PAR file hereafter) from Idaho was obtained for the most recent year available, 2006. This file was processed to identify all cases that qualified for reporting to the MCMIS Crash file.
2. All cases in the Idaho PAR file—those that qualified for reporting to the Crash file as well as those that did not—were matched to the cases actually reported to the MCMIS Crash file from Idaho.
3. Cases that should have been reported, but were not, were compared with those that were reported to identify the sources of underreporting.
4. Cases that did not qualify but which were reported were examined to identify the extent and nature of overreporting.
Idaho Reporting to the MCMIS Crash file Page 2
Police accident report (PAR) data recorded in Idaho’s statewide files as of October 19, 2007 were used in this analysis. The 2006 PAR file contains the computerized records of 42,339 units (vehicles and pedestrians) involved in 24,279 crashes that occurred in Idaho.
2. Data Preparation
The Idaho PAR file and MCMIS Crash file each required some preparation before the Idaho records in the MCMIS Crash file could be matched to the Idaho PAR file. In the case of the MCMIS Crash file, the only processing necessary was to extract records reported from Idaho and to eliminate duplicate records. The Idaho PAR file required more extensive work to create a comprehensive vehicle-level file from accident, vehicle, and occupant data. The following sections describe the methods used to prepare each file and some of the problems uncovered.
2.1 MCMIS Crash Data File
The 2006 MCMIS Crash file as of June 4, 2007 was used to identify records submitted from Idaho. For calendar year 2006 there were 834 cases. An analysis file was constructed using all variables in the file. The file was then examined for duplicate records (those involvements where more than one record was submitted for the same vehicle in the same crash; i.e., the report number and sequence number were identical). No such instances were found.
In addition, records were examined for identical values on accident number, accident date/time, county, city, officer badge number, vehicle license number, and driver license number, even though their vehicle sequence numbers were perhaps different. One would not expect two records for the same vehicle and driver within a given accident. Four such duplicates were found, representing two unique occurrences of the examined variables. Only a few variables differed among the two records of each pair, including vehicle sequence number. One record may have been intended as an update, mistakenly resulting in the addition of a second vehicle record for that accident. The record with the latest “Upload date” was kept, and the earlier one deleted. After deleting two records, the resulting MCMIS file contains 832 records.
2.2 Idaho Police Accident Report File
The Idaho PAR data for 2006 (as of October 19, 2007) was obtained from the state of Idaho. The data were stored as a SAS file, representing records at the person level. From this large dataset, a vehicle-level file was created for the present study. The file contains records for 24,279 crashes involving 42,339 units (primarily vehicles and pedestrians). Data for the PAR file are coded from the Idaho Vehicle Collision Report (form ITD-90) completed by police officers.
The PAR file was first examined for duplicate records. A search for records with identical case numbers and vehicle numbers found no such instances. In addition, inspection of case numbers verified that they were recorded in a consistent format, so there was no reason to suspect duplicate records based on similar, but not identical, case numbers (such as 06C126063 and 06C126-63, for example). However, cases were also examined to determine if there were any records that contained identical case number, time, place and vehicle/driver variables, even though their vehicle numbers were perhaps different. Two cases would not be expected to be identical on all variables. To investigate this possibility, records were examined for duplicate
Idaho Reporting to the MCMIS Crash file Page 3
occurrences based on the variables case number, accident date/time, crash county, road, investigating officer number, vehicle identification number (VIN), and driver date of birth.
Based on the above algorithm, two duplicate instances were found, representing one unique occurrence of the examined variables. Further examination of the pair revealed that many of the vehicle-specific variables, including vehicle body, model year, license plate state, and cost of damage, had different values, even though VIN and driver birth date were identical. Because it could not be positively determined that these were in fact duplicate cases, both were left in the file.
3. Matching Process
The next step involved matching records from the Idaho PAR file to corresponding records from the MCMIS file. After removing the duplicate cases, there were 832 Idaho records from the MCMIS file available for matching, and 42,339 records from the Idaho PAR file. All records from the Idaho PAR data file were used in the match, even those that were not reportable to the MCMIS Crash file. This allowed the identification of cases in the MCMIS Crash file that did not meet the MCMIS Crash file reporting criteria.
Matching records in the two files requires finding combinations of variables common to the two files that have a high probability of uniquely identifying accidents and specific vehicles within the accidents. Serial number, which is the identifier used to uniquely identify a crash in the Idaho PAR data, and report number in the MCMIS Crash file, are obvious first choices. Indeed, there is a correspondence between the two numbers, and case number was never unrecorded in either file. Serial number in the Idaho PAR file is a nine-digit alphanumeric value, while in the MCMIS Crash file report number is stored as a 12-character alphanumeric value, a combination of alphabetic characters and numbers. It appears that the report number in the MCMIS Crash file is constructed as follows: The first two columns contain the state abbreviation (ID, in this case), followed by ten numeric digits. Since nine of these digits were consistent with the PAR serial number, the corresponding nine digits of the MCMIS report number were extracted, and used in the match.
Other variables typically available for matching at the crash level include crash date, crash time (stored in military time as hour/minute), crash county, crash city, crash street and reporting officer’s identification number. Since crash street was not coded identically in both the PAR and MCMIS files, this variable was not used in the match.
Variables in the MCMIS file that distinguish one vehicle from another within the same crash include vehicle license plate number, driver license number, vehicle identification number (VIN), driver date of birth, and driver last name. Only VIN, driver date of birth, and driver age were available in the PAR file. VIN was unrecorded <0.1% of the time in the PAR data and was unknown in 1.8% of MCMIS cases. In the PAR file, driver date of birth and driver age were each unrecorded in 4.8% of cases, compared to 1.9% of MCMIS cases.
Four separate matches were performed using the available variables. At each step, records in either file with duplicate values on all the match variables were excluded, along with records that were missing values on the match variables. The first match included the variables case number, crash date (month, day), crash time (hour, minute), county, city, officer ID, VIN, and driver date
Idaho Reporting to the MCMIS Crash file Page 4
of birth. The second match step dropped driver date of birth and officer ID. The third match step matched on crash date, crash hour, county, and driver date of birth, dropping case number, minute, city, officer ID, and VIN. After some experimentation, the fourth match included variables case number, date, hour, county, and VIN. This process resulted in matching 97.2% of the MCMIS records to the PAR file.
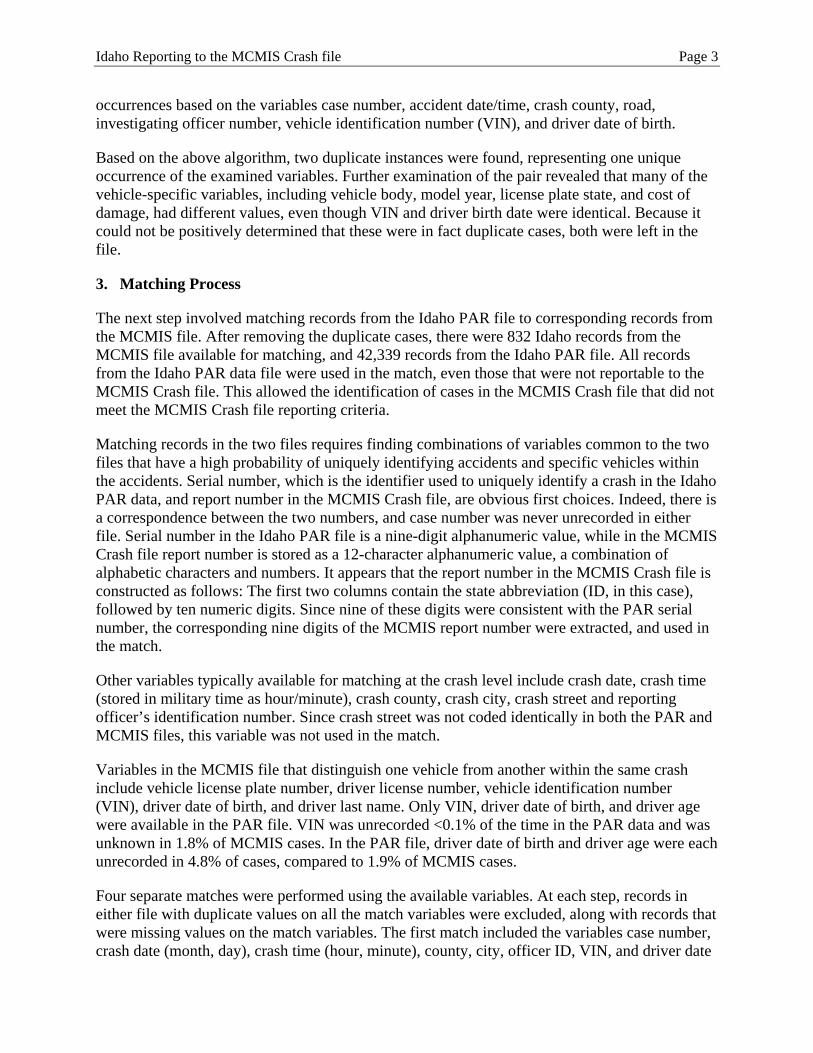
Table 1 shows the variables used in each match step along with the number of records matched at each step. Matched records were verified using other variables common to the MCMIS and PAR file as a final check to ensure the match was valid. The above procedure resulted in 809 matches, representing 97.2% of the 832 non-duplicate records reported to MCMIS.
Table 1 Steps in MCMIS/Idaho PAR File Match, 2006
Step Matching variables Cases
matched
Match 1 Case number, crash date, crash time, county, city, officer ID, VIN, and driver date of birth 673
Match 2 Case number, crash date, crash time, county, city, and VIN 75
Match 3 Crash date, crash hour, county, and driver date of birth 59
Match 4 Case number, crash date, crash hour, county, and VIN 2
Total cases matched 809
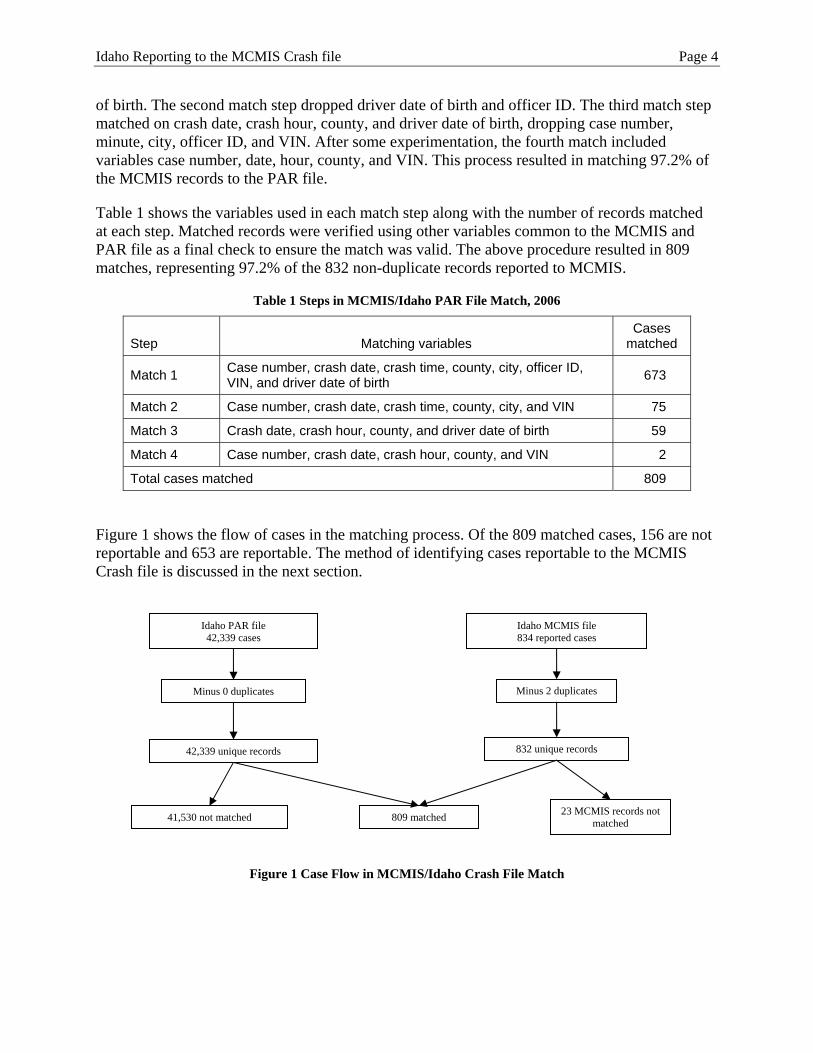
Figure 1 shows the flow of cases in the matching process. Of the 809 matched cases, 156 are not reportable and 653 are reportable. The method of identifying cases reportable to the MCMIS Crash file is discussed in the next section.
Idaho PAR file 42,339 cases
Idaho MCMIS file 834 reported cases
809 matched 23 MCMIS records not matched 41,530 not matched
Minus 2 duplicates
832 unique records
Minus 0 duplicates
42,339 unique records
Figure 1 Case Flow in MCMIS/Idaho Crash File Match
Idaho Reporting to the MCMIS Crash file Page 5
4. Identifying Reportable Cases
The next step in data preparation is to identify records in the Idaho data that qualified for reporting to the MCMIS Crash file. Records are identified using the information available in the computerized crash files that were sent by Idaho. The goal of the selection process is to approximate as closely as possible the reporting threshold of the MCMIS file. The MCMIS criteria for a reportable crash involving a qualifying vehicle are shown in Table 2.
Table 2 Vehicle and Crash Severity Threshold for MCMIS Crash File
Vehicle
Truck with GVWR over 10,000 or GCWR over 10,000, or Bus with seating for at least nine, including the driver, or Vehicle displaying a hazardous materials placard.
Accident
Fatality, or Injury transported to a medical facility for immediate medical attention, or Vehicle towed due to disabling damage.
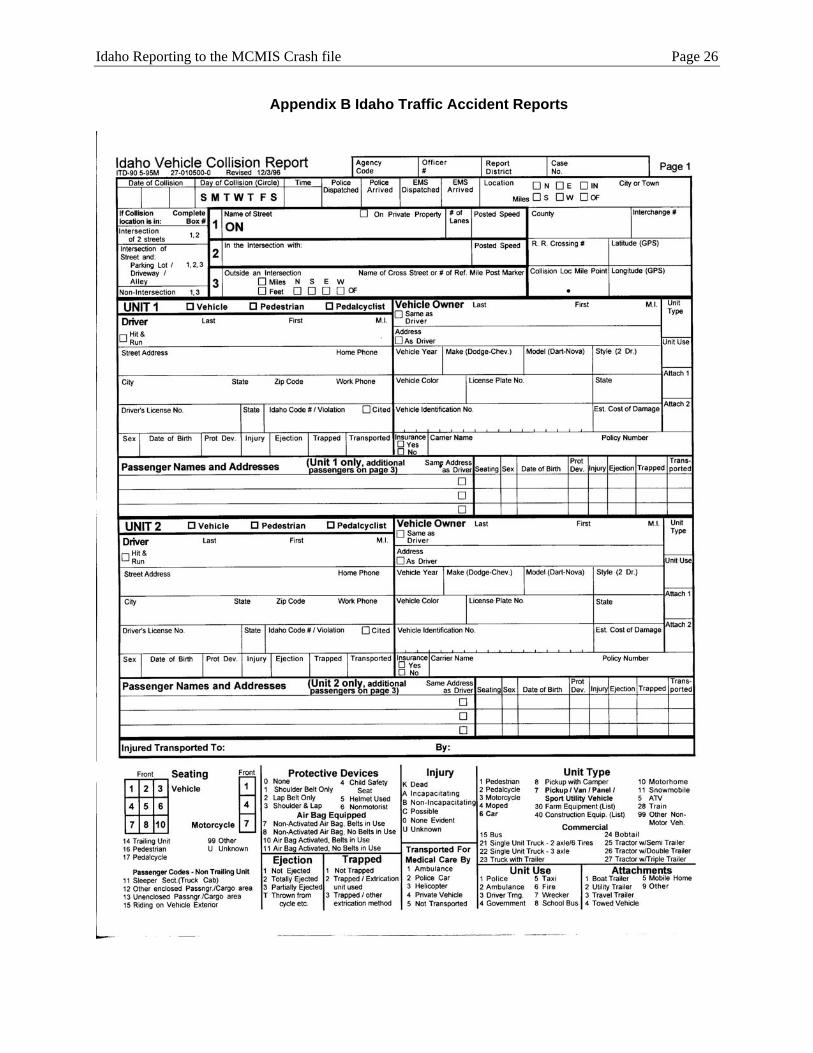
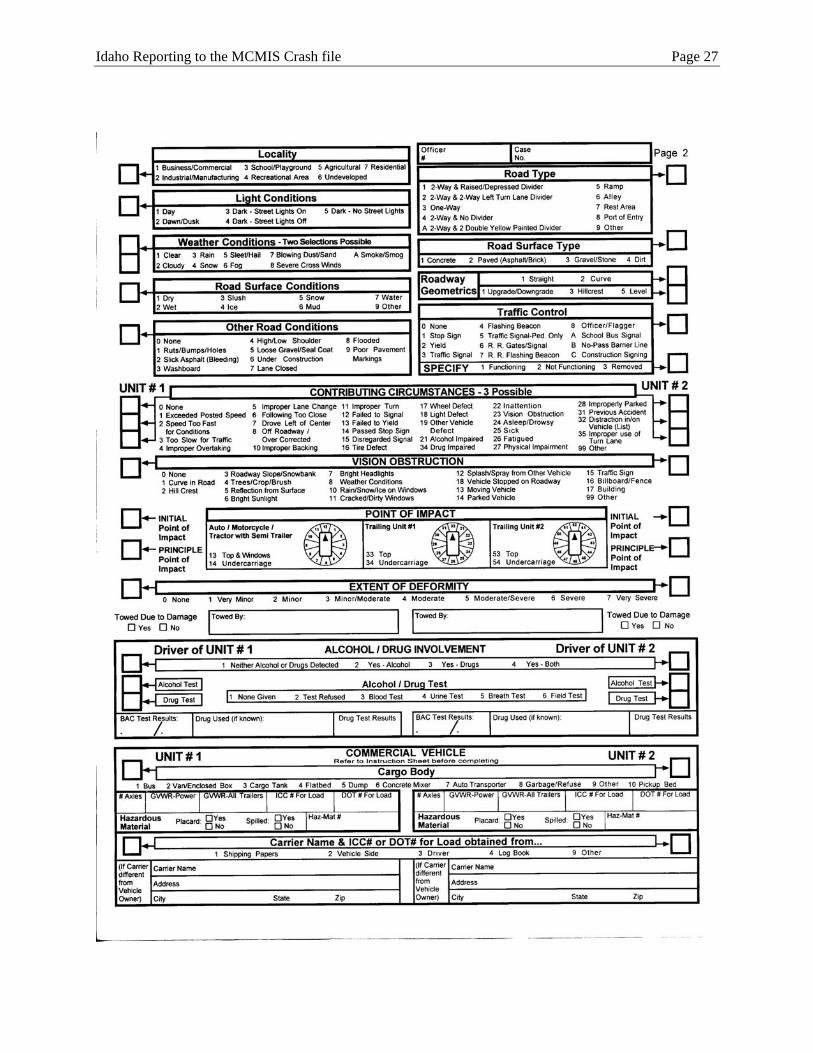
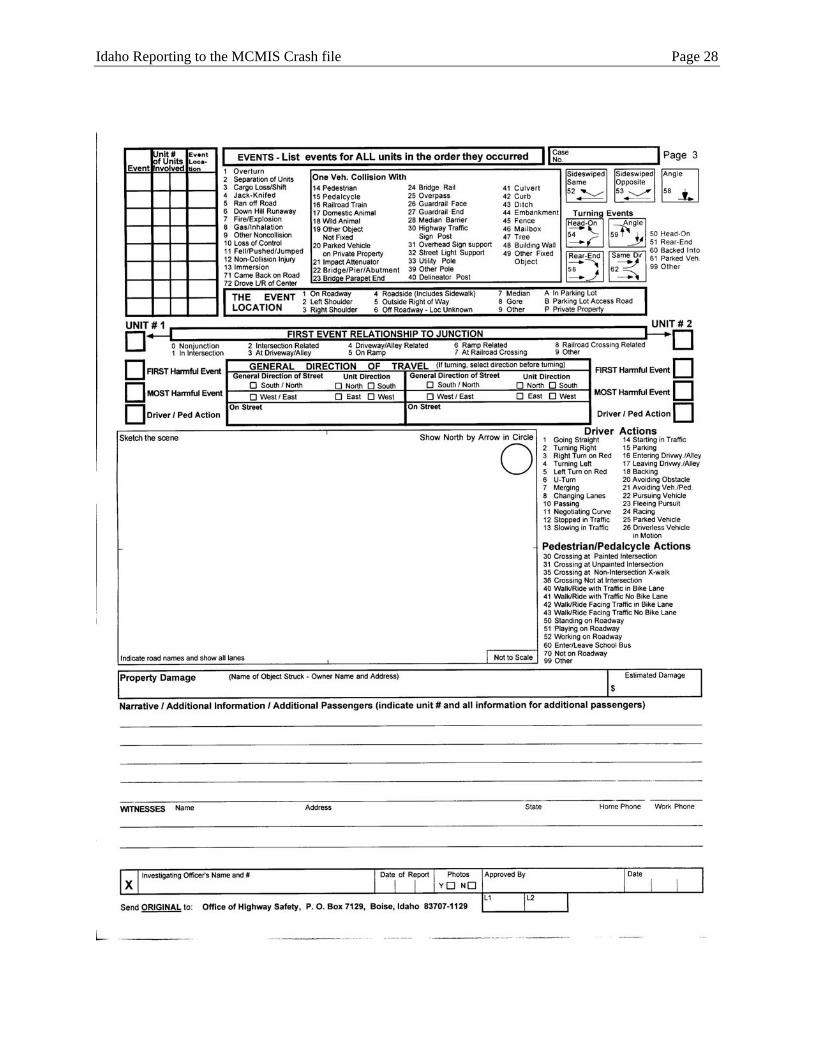
The process of identifying reportable records, as set out in Table 2 above, is fairly straightforward in the Idaho PAR file, because Idaho crash data includes most of the variables and levels needed to identify reportable cases. Some states utilize a truck/bus supplemental form with instructions to police officers to fill out that form if any of the involved vehicles meet the criteria for a MCMIS reportable crash. In some other states, there is a commercial vehicle section included as part of the main PAR form. In Idaho, the collision report form (Appendix B) has a section for recording information about commercial vehicles. According to instructions in the Idaho Vehicle Collision Report Form Manual [30], it appears that this section is completed for all commercial vehicles, not just those meeting a certain crash severity threshold. The manual provides a definition of a commercial motor vehicle:
Commercial Vehicle Definition – For collision reporting purposes only, a commercial vehicle is any vehicle equipped to carry property which has six or more tires on the ground (including pickups with dual rear tires), any vehicle displaying a hazardous materials placard, and buses designed to carry 16 or more persons, including the driver.
The definition does not include any information about GVWR, however the commercial vehicle section contains spaces for recording the GVWR for the power unit and all trailers (Appendix B). In addition, there is a commercial vehicle indicator (yes/no) variable in the Idaho PAR file.
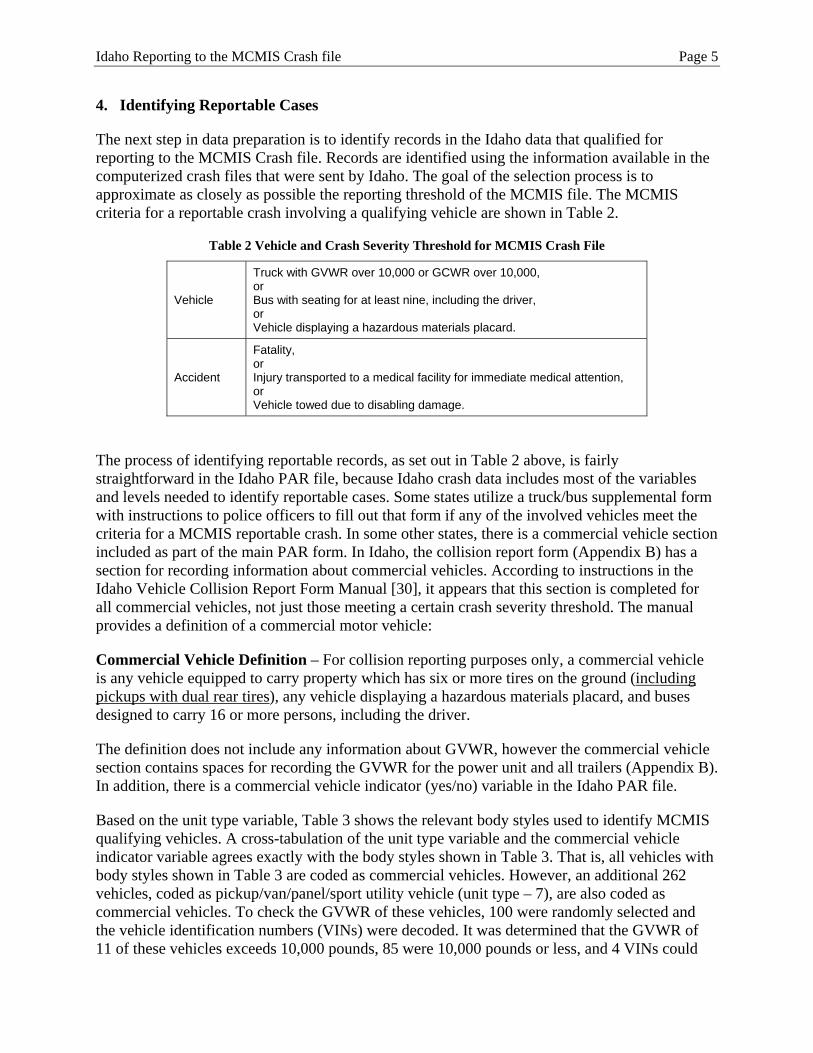
Based on the unit type variable, Table 3 shows the relevant body styles used to identify MCMIS qualifying vehicles. A cross-tabulation of the unit type variable and the commercial vehicle indicator variable agrees exactly with the body styles shown in Table 3. That is, all vehicles with body styles shown in Table 3 are coded as commercial vehicles. However, an additional 262 vehicles, coded as pickup/van/panel/sport utility vehicle (unit type – 7), are also coded as commercial vehicles. To check the GVWR of these vehicles, 100 were randomly selected and the vehicle identification numbers (VINs) were decoded. It was determined that the GVWR of 11 of these vehicles exceeds 10,000 pounds, 85 were 10,000 pounds or less, and 4 VINs could
Idaho Reporting to the MCMIS Crash file Page 6
Table 3 Relevant Vehicle Body Style Codes on Idaho Accident Report
15 - Bus
21 – Single unit truck (2 axle/6 tires)
22 – Single unit truck (3 axle)
23 – Truck with trailer
24 – Bobtail
25 – Tractor w/semi trailer
26 – Tractor w/double trailer
27 – Tractor w/triple trailer
not be decoded. Therefore, it is estimated that approximately 11 percent of vehicles coded as unit type=7 in the Idaho PAR file are qualifying vehicles. Based on the relatively low percent, these vehicles are not included in this study as satisfying the 10,000 pound GVWR criterion.
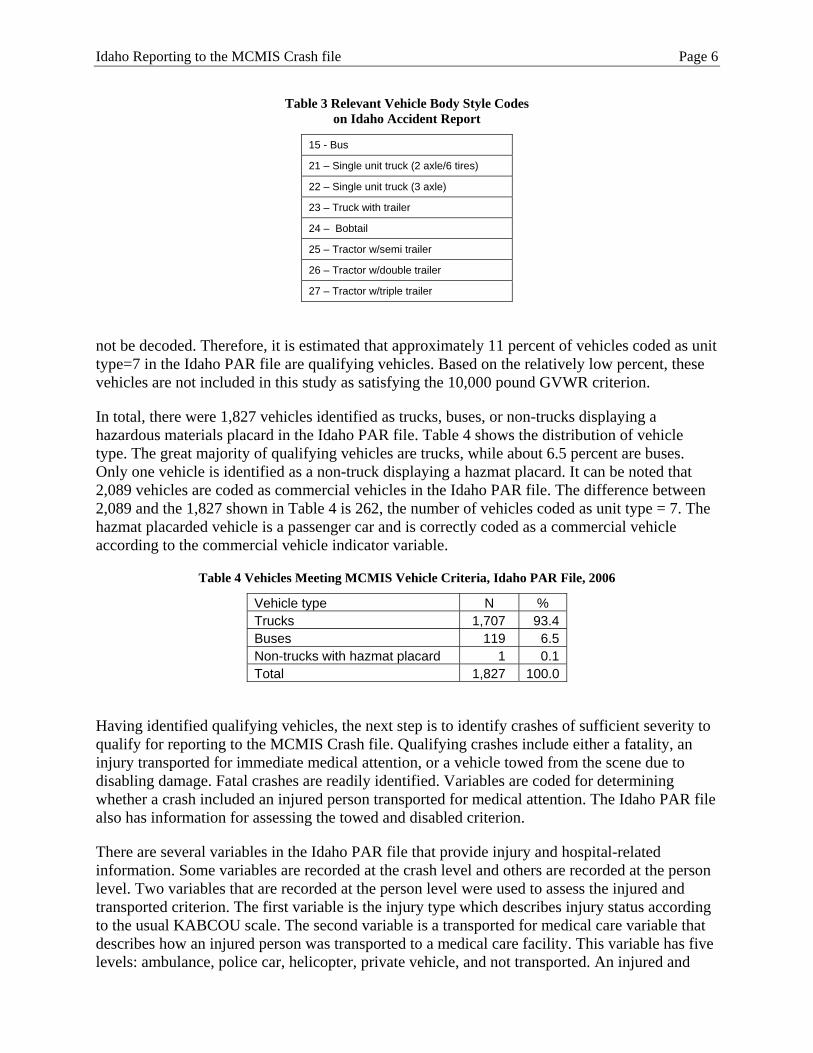
In total, there were 1,827 vehicles identified as trucks, buses, or non-trucks displaying a hazardous materials placard in the Idaho PAR file. Table 4 shows the distribution of vehicle type. The great majority of qualifying vehicles are trucks, while about 6.5 percent are buses. Only one vehicle is identified as a non-truck displaying a hazmat placard. It can be noted that 2,089 vehicles are coded as commercial vehicles in the Idaho PAR file. The difference between 2,089 and the 1,827 shown in Table 4 is 262, the number of vehicles coded as unit type = 7. The hazmat placarded vehicle is a passenger car and is correctly coded as a commercial vehicle according to the commercial vehicle indicator variable.
Table 4 Vehicles Meeting MCMIS Vehicle Criteria, Idaho PAR File, 2006
Vehicle type N % Trucks 1,707 93.4Buses 119 6.5Non-trucks with hazmat placard 1 0.1Total 1,827 100.0
Having identified qualifying vehicles, the next step is to identify crashes of sufficient severity to qualify for reporting to the MCMIS Crash file. Qualifying crashes include either a fatality, an injury transported for immediate medical attention, or a vehicle towed from the scene due to disabling damage. Fatal crashes are readily identified. Variables are coded for determining whether a crash included an injured person transported for medical attention. The Idaho PAR file also has information for assessing the towed and disabled criterion.
There are several variables in the Idaho PAR file that provide injury and hospital-related information. Some variables are recorded at the crash level and others are recorded at the person level. Two variables that are recorded at the person level were used to assess the injured and transported criterion. The first variable is the injury type which describes injury status according to the usual KABCOU scale. The second variable is a transported for medical care variable that describes how an injured person was transported to a medical care facility. This variable has five levels: ambulance, police car, helicopter, private vehicle, and not transported. An injured and
Idaho Reporting to the MCMIS Crash file Page 7
transported variable was created from the injury type and the transported for medical care variables. This variable was merged into a vehicle-level file to create a crash-level injured and transported variable. Therefore, any crash involving an A, B, or C-injury, and a transported person satisfies the criterion.
As a note, a maximum injury severity variable was also created at the crash level from the injury type variable. At the crash level, the Idaho PAR file has number of fatalities and number of injuries variables. The created maximum injury severity variable agrees exactly with both of these variables.
With respect to the towed/disabled criterion, the Idaho PAR data includes two sources of information to identify crashes in which a vehicle was towed due to disabling damage. The towed variable is a yes/no variable indicating whether a vehicle was towed or not. The extent of deformity variable is an ordered variable with increasing levels of damage: none, very minor, minor, minor/moderate, moderate, moderate/severe, severe, and very severe.
According to the Idaho Vehicle Collision Report Form Manual [30], the towed variable is defined to be a towed due to damage variable. Based on the definition it would appear that this variable would be sufficient to identify crashes in which at least one vehicle was towed due to disabling damage. In fact, there is a yes/no check box on the Idaho collision report form (Appendix B) that is specifically designated for vehicles towed due to damage. Instructions to officers state to check yes or no to indicate if the vehicle was towed from the collision scene because of damage sustained to the vehicle as a result of the collision. Furthermore, officers are instructed to check no if the unit was towed due to mechanical problems not associated with the collision, or if the unit was towed as a result of driver incapacity.
However, a cross-tabulation between the towed and the extent of deformity variables shows that approximately 12 percent of vehicles with minor damage are coded as towed due to disabling damage. The percentage increases to about 30 percent for vehicles with minor/moderate damage. In addition, of the 42,339 records at the vehicle level, approximately 40 percent are coded as towed due to damage. Analysis of the towed variable in the 2006 General Estimates System (GES) database [31] shows that approximately 27 percent of vehicles are towed due to damage. Other MCMIS evaluations tend to support this estimate [20, 22]. Based on these considerations, a vehicle is considered towed and disabled if the towed variable indicates the vehicle was towed, and the extent of deformity variable is moderate or greater. This results in an estimated 31.3 percent of vehicles towed due to damage in the Idaho PAR file, which is slightly more than the national estimate of 27 percent, but is consistent with the experience in several other states. A towed and disabled flag variable was created at the crash level to be used for estimating the number of qualifying vehicles satisfying this criterion.
Table 5 shows the numbers of qualifying vehicles that meet the threshold for a MCMIS reportable crash according to the MCMIS criteria. In total, it is estimated that 896 vehicles were reportable to the MCMIS Crash file. Of these, 26 were involved in fatal crashes and 338, or about 37.7 percent, were involved in crashes where at least one person was transported for medical treatment. Based on the towed and disabled variable described above, it is estimated that 532 or about 59.4 percent of reportable vehicles were involved in crashes where at least one vehicle was towed due to disabling damage.
Idaho Reporting to the MCMIS Crash file Page 8
Table 5 Reportable Records in Idaho Crash File, 2006
Crash type Total %
Fatal 26 2.9
Injury transported for treatment 338 37.7
Vehicle towed due to damage 532 59.4
Total 896 100.0
5. Factors Associated with Reporting
The procedure described in the previous section identified 896 vehicles involved in crashes as reportable to the MCMIS Crash file. The match process described in Section 3 determined that 832 unique cases were reported to the MCMIS Crash file, of which 809 could be matched to the Idaho PAR data. Of the 809 cases that could be matched, 653 were determined to meet the MCMIS Crash file reporting criteria. Therefore, of the 896 reportable crashes in 2006, Idaho reported 653, for an overall reporting rate of 72.9 percent. In this section, some of the factors that affect the chance that a qualifying crash would be submitted through the SafetyNet system and appear in the MCMIS Crash file are identified. The results are presented in five subsections: overreporting, case processing, reporting criteria, reporting agency and area, and truck/bus fire and explosion occurrence. Analysis of overreporting attempts to identify why cases were submitted that do not meet the MCMIS reporting criteria as defined by Table 2. Case processing deals with timing issues in reporting such as crash month and time lag between crash date and uploading date to the MCMIS Crash file. Reporting criteria includes factors such as vehicle type and crash severity. Reporting agency is associated with differences in reporting rates due to the agency, such as state police or local police, while area investigates reporting by location, such as the county where the crash occurred. Truck/bus fire occurrence examines reportable cases of crashes involving fire or explosion.
5.1 Overreporting
MCMIS evaluations tend to focus on underreporting because sources of underreporting tend to be more prevalent than overreporting. However, almost all states overreport cases to some degree. Overreporting results when cases are submitted to the MCMIS Crash file that do not meet the criteria for a reportable crash. Since 809 MCMIS cases could be matched to the Idaho PAR data, and 653 were determined to meet the reporting criteria, the difference, or 156 cases, were not reportable, and should not have been reported.
Table 6 shows a two-way classification of vehicle type and crash severity, and provides some explanation as to why these vehicles should not have been reported to the MCMIS Crash file. Note that all 156 vehicles do not meet the crash severity threshold for a MCMIS reportable crash as defined in this study. In addition, 31 vehicles do not meet the vehicle criteria since they are not trucks, buses, or hazmat placarded vehicles as defined in Table 3 or according to the hazmat placard variable. Classification of these 31 vehicles by vehicle type shows that 29 are coded as pickup/van/panel/suv. Based on the random sample of 100 of these vehicles that are coded as commercial vehicles, it was shown in Section 3 that about 11 percent have GVWR exceeding 10,000 pounds, so it is possible that some of these are qualifying vehicles. However, none meet
Idaho Reporting to the MCMIS Crash file Page 9
the crash severity threshold for reporting. The 121 trucks and 4 buses are qualifying vehicles, but they were involved in crashes in which there were no fatalities, no persons were injured and transported for medical attention, and no vehicles were towed due to disabling damage as described in this study.
Table 6 Distribution of Non-reportable Vehicles in MCMIS Crash File, Idaho 2006
Crash severity
Vehicle type Fatal Transported
injury Towed/disabled Other crash
severity Total Truck 0 0 0 121 121 Bus 0 0 0 4 4 Other vehicle (not transporting hazmat) 0 0 0 31 31
Total 0 0 0 156 156
5.2 Case Processing
Delays in transmitting cases may partially account for the incompleteness of the MCMIS Crash file. The time lag in extracting and submitting reports to the MCMIS Crash file might explain some portion of the unreported cases. All reportable crash involvements for a calendar year are required to be transmitted to the MCMIS Crash file within 90 days of the date of the crash. The MCMIS file used in this evaluation was dated June 4, 2007, so all 2006 cases should have been reported by that date.
Table 7 shows reporting rates according to month of the crash. Except for the month of June, in which the reporting rate is 88.4 percent, the rates do not fluctuate markedly from the overall rate of 72.9 percent. Some rates are slightly higher than the overall rate and some rates are slightly lower than the overall rate and there does not appear to be much of a seasonal pattern. On the
Table 7 Reporting Rate by Accident Month, Idaho 2006
Crash month
Reportable cases
Reporting rate
Unreported cases
% of total unreported
cases January 99 68.7 31 12.8 February 58 75.9 14 5.8 March 69 68.1 22 9.1 April 55 72.7 15 6.2 May 60 71.7 17 7.0 June 69 88.4 8 3.3 July 68 69.1 21 8.6 August 87 77.0 20 8.2 September 79 73.4 21 8.6 October 88 67.0 29 11.9 November 79 74.7 20 8.2 December 85 70.6 25 10.3 Total 896 72.9 243 100.0
Idaho Reporting to the MCMIS Crash file Page 10
other hand, there tend to be more reportable cases in January, and between August and December. January, October, and December are months in which the total percent of unreported cases is greater than 10 percent.
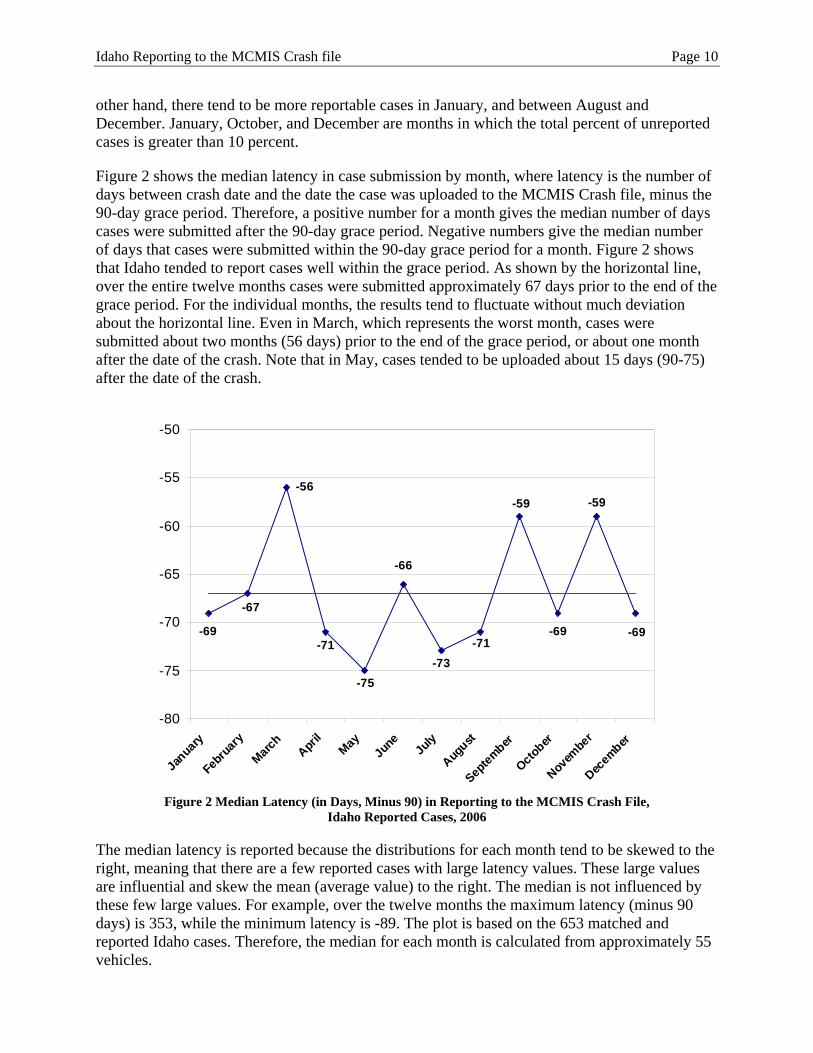
Figure 2 shows the median latency in case submission by month, where latency is the number of days between crash date and the date the case was uploaded to the MCMIS Crash file, minus the 90-day grace period. Therefore, a positive number for a month gives the median number of days cases were submitted after the 90-day grace period. Negative numbers give the median number of days that cases were submitted within the 90-day grace period for a month. Figure 2 shows that Idaho tended to report cases well within the grace period. As shown by the horizontal line, over the entire twelve months cases were submitted approximately 67 days prior to the end of the grace period. For the individual months, the results tend to fluctuate without much deviation about the horizontal line. Even in March, which represents the worst month, cases were submitted about two months (56 days) prior to the end of the grace period, or about one month after the date of the crash. Note that in May, cases tended to be uploaded about 15 days (90-75) after the date of the crash.
-56-59
-69-69-71
-59
-73
-66
-75
-71
-67
-69
-80
-75
-70
-65
-60
-55
-50
Janua
ry
Febr
uary
March
April
MayJu
ne July
August
Septem
ber
October
Novem
ber
Decem
ber
Figure 2 Median Latency (in Days, Minus 90) in Reporting to the MCMIS Crash File,
Idaho Reported Cases, 2006
The median latency is reported because the distributions for each month tend to be skewed to the right, meaning that there are a few reported cases with large latency values. These large values are influential and skew the mean (average value) to the right. The median is not influenced by these few large values. For example, over the twelve months the maximum latency (minus 90 days) is 353, while the minimum latency is -89. The plot is based on the 653 matched and reported Idaho cases. Therefore, the median for each month is calculated from approximately 55 vehicles.
Idaho Reporting to the MCMIS Crash file Page 11
5.3 Reporting Criteria
In this section, reporting is investigated according to variables in the Idaho PAR file related to the reporting criteria for a MCMIS-reportable crash, as outlined in Table 2. Previous studies have consistently shown that trucks are more likely to be reported than buses and that fatal crashes are more likely to be reported than injury involvements. Since the criteria revolve around attributes associated with the vehicle type and crash severity, calculating reporting rates for these two variables is a logical starting point for assessing where improvements can be gained.
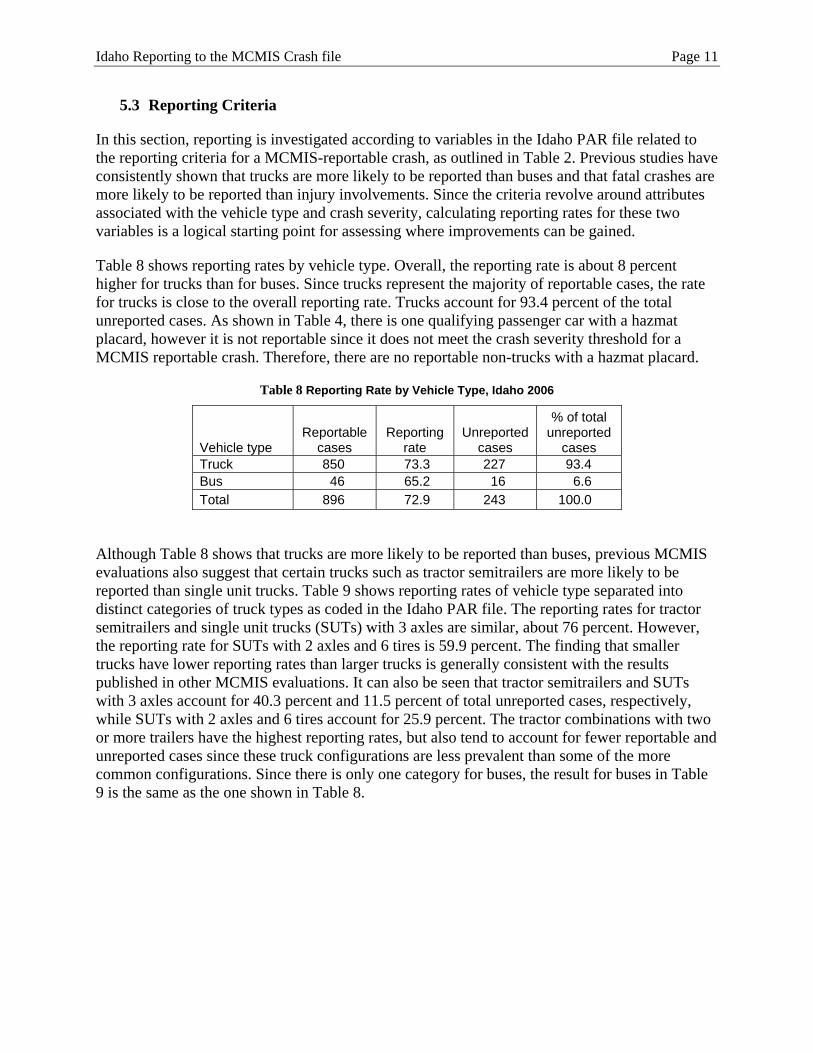
Table 8 shows reporting rates by vehicle type. Overall, the reporting rate is about 8 percent higher for trucks than for buses. Since trucks represent the majority of reportable cases, the rate for trucks is close to the overall reporting rate. Trucks account for 93.4 percent of the total unreported cases. As shown in Table 4, there is one qualifying passenger car with a hazmat placard, however it is not reportable since it does not meet the crash severity threshold for a MCMIS reportable crash. Therefore, there are no reportable non-trucks with a hazmat placard.
Table 8 Reporting Rate by Vehicle Type, Idaho 2006
Vehicle type Reportable
cases Reporting
rate Unreported
cases
% of total unreported
cases Truck 850 73.3 227 93.4 Bus 46 65.2 16 6.6 Total 896 72.9 243 100.0
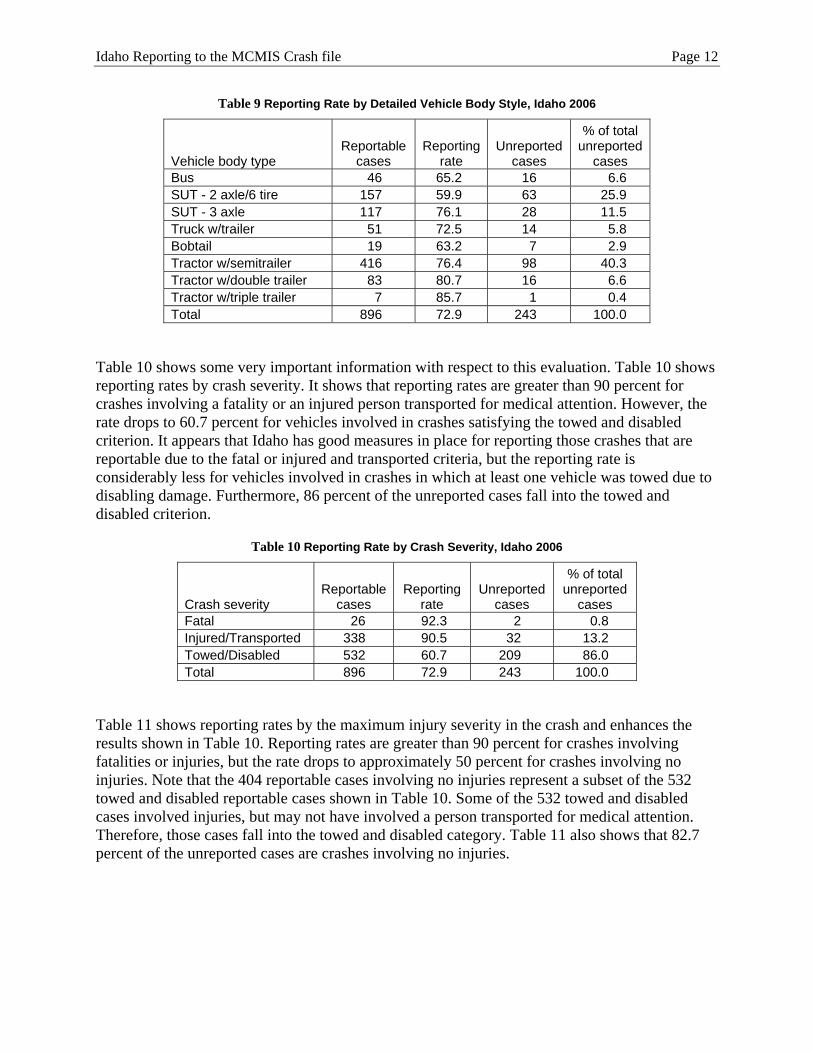
Although Table 8 shows that trucks are more likely to be reported than buses, previous MCMIS evaluations also suggest that certain trucks such as tractor semitrailers are more likely to be reported than single unit trucks. Table 9 shows reporting rates of vehicle type separated into distinct categories of truck types as coded in the Idaho PAR file. The reporting rates for tractor semitrailers and single unit trucks (SUTs) with 3 axles are similar, about 76 percent. However, the reporting rate for SUTs with 2 axles and 6 tires is 59.9 percent. The finding that smaller trucks have lower reporting rates than larger trucks is generally consistent with the results published in other MCMIS evaluations. It can also be seen that tractor semitrailers and SUTs with 3 axles account for 40.3 percent and 11.5 percent of total unreported cases, respectively, while SUTs with 2 axles and 6 tires account for 25.9 percent. The tractor combinations with two or more trailers have the highest reporting rates, but also tend to account for fewer reportable and unreported cases since these truck configurations are less prevalent than some of the more common configurations. Since there is only one category for buses, the result for buses in Table 9 is the same as the one shown in Table 8.
Idaho Reporting to the MCMIS Crash file Page 12
Table 9 Reporting Rate by Detailed Vehicle Body Style, Idaho 2006
Vehicle body type Reportable
cases Reporting
rate Unreported
cases
% of total unreported
cases Bus 46 65.2 16 6.6 SUT - 2 axle/6 tire 157 59.9 63 25.9 SUT - 3 axle 117 76.1 28 11.5 Truck w/trailer 51 72.5 14 5.8 Bobtail 19 63.2 7 2.9 Tractor w/semitrailer 416 76.4 98 40.3 Tractor w/double trailer 83 80.7 16 6.6 Tractor w/triple trailer 7 85.7 1 0.4 Total 896 72.9 243 100.0
Table 10 shows some very important information with respect to this evaluation. Table 10 shows reporting rates by crash severity. It shows that reporting rates are greater than 90 percent for crashes involving a fatality or an injured person transported for medical attention. However, the rate drops to 60.7 percent for vehicles involved in crashes satisfying the towed and disabled criterion. It appears that Idaho has good measures in place for reporting those crashes that are reportable due to the fatal or injured and transported criteria, but the reporting rate is considerably less for vehicles involved in crashes in which at least one vehicle was towed due to disabling damage. Furthermore, 86 percent of the unreported cases fall into the towed and disabled criterion.
Table 10 Reporting Rate by Crash Severity, Idaho 2006
Crash severity Reportable
cases Reporting
rate Unreported
cases
% of total unreported
cases Fatal 26 92.3 2 0.8 Injured/Transported 338 90.5 32 13.2 Towed/Disabled 532 60.7 209 86.0 Total 896 72.9 243 100.0
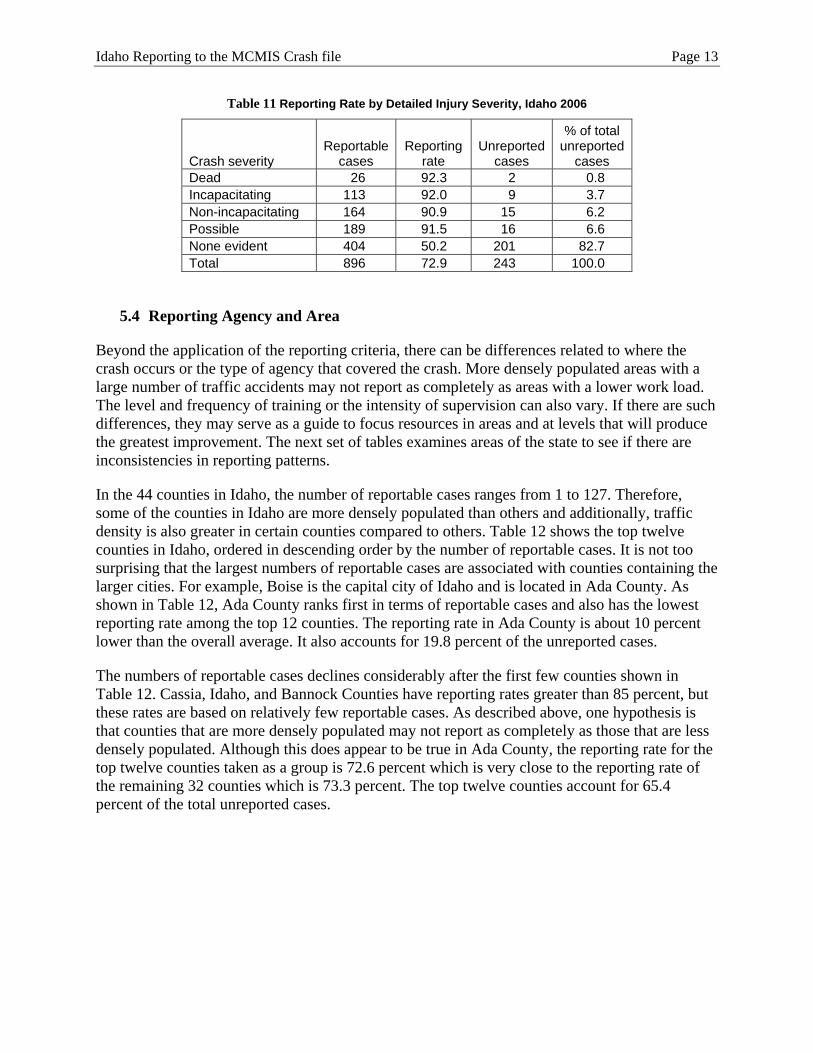
Table 11 shows reporting rates by the maximum injury severity in the crash and enhances the results shown in Table 10. Reporting rates are greater than 90 percent for crashes involving fatalities or injuries, but the rate drops to approximately 50 percent for crashes involving no injuries. Note that the 404 reportable cases involving no injuries represent a subset of the 532 towed and disabled reportable cases shown in Table 10. Some of the 532 towed and disabled cases involved injuries, but may not have involved a person transported for medical attention. Therefore, those cases fall into the towed and disabled category. Table 11 also shows that 82.7 percent of the unreported cases are crashes involving no injuries.
Idaho Reporting to the MCMIS Crash file Page 13
Table 11 Reporting Rate by Detailed Injury Severity, Idaho 2006
Crash severity Reportable
cases Reporting
rate Unreported
cases
% of total unreported
cases Dead 26 92.3 2 0.8 Incapacitating 113 92.0 9 3.7 Non-incapacitating 164 90.9 15 6.2 Possible 189 91.5 16 6.6 None evident 404 50.2 201 82.7 Total 896 72.9 243 100.0
5.4 Reporting Agency and Area
Beyond the application of the reporting criteria, there can be differences related to where the crash occurs or the type of agency that covered the crash. More densely populated areas with a large number of traffic accidents may not report as completely as areas with a lower work load. The level and frequency of training or the intensity of supervision can also vary. If there are such differences, they may serve as a guide to focus resources in areas and at levels that will produce the greatest improvement. The next set of tables examines areas of the state to see if there are inconsistencies in reporting patterns.
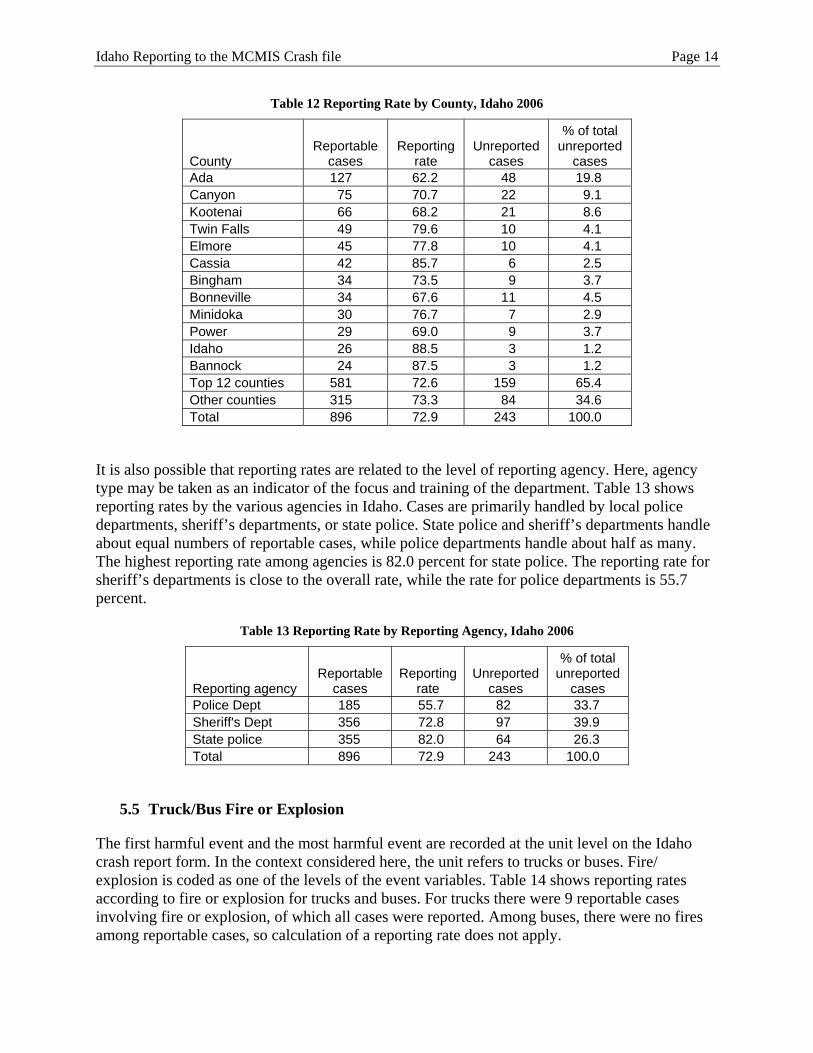
In the 44 counties in Idaho, the number of reportable cases ranges from 1 to 127. Therefore, some of the counties in Idaho are more densely populated than others and additionally, traffic density is also greater in certain counties compared to others. Table 12 shows the top twelve counties in Idaho, ordered in descending order by the number of reportable cases. It is not too surprising that the largest numbers of reportable cases are associated with counties containing the larger cities. For example, Boise is the capital city of Idaho and is located in Ada County. As shown in Table 12, Ada County ranks first in terms of reportable cases and also has the lowest reporting rate among the top 12 counties. The reporting rate in Ada County is about 10 percent lower than the overall average. It also accounts for 19.8 percent of the unreported cases.
The numbers of reportable cases declines considerably after the first few counties shown in Table 12. Cassia, Idaho, and Bannock Counties have reporting rates greater than 85 percent, but these rates are based on relatively few reportable cases. As described above, one hypothesis is that counties that are more densely populated may not report as completely as those that are less densely populated. Although this does appear to be true in Ada County, the reporting rate for the top twelve counties taken as a group is 72.6 percent which is very close to the reporting rate of the remaining 32 counties which is 73.3 percent. The top twelve counties account for 65.4 percent of the total unreported cases.
Idaho Reporting to the MCMIS Crash file Page 14
Table 12 Reporting Rate by County, Idaho 2006
County Reportable
cases Reporting
rate Unreported
cases
% of total unreported
cases Ada 127 62.2 48 19.8 Canyon 75 70.7 22 9.1 Kootenai 66 68.2 21 8.6 Twin Falls 49 79.6 10 4.1 Elmore 45 77.8 10 4.1 Cassia 42 85.7 6 2.5 Bingham 34 73.5 9 3.7 Bonneville 34 67.6 11 4.5 Minidoka 30 76.7 7 2.9 Power 29 69.0 9 3.7 Idaho 26 88.5 3 1.2 Bannock 24 87.5 3 1.2 Top 12 counties 581 72.6 159 65.4 Other counties 315 73.3 84 34.6 Total 896 72.9 243 100.0
It is also possible that reporting rates are related to the level of reporting agency. Here, agency type may be taken as an indicator of the focus and training of the department. Table 13 shows reporting rates by the various agencies in Idaho. Cases are primarily handled by local police departments, sheriff’s departments, or state police. State police and sheriff’s departments handle about equal numbers of reportable cases, while police departments handle about half as many. The highest reporting rate among agencies is 82.0 percent for state police. The reporting rate for sheriff’s departments is close to the overall rate, while the rate for police departments is 55.7 percent.
Table 13 Reporting Rate by Reporting Agency, Idaho 2006
Reporting agency Reportable
cases Reporting
rate Unreported
cases
% of total unreported
cases Police Dept 185 55.7 82 33.7 Sheriff's Dept 356 72.8 97 39.9 State police 355 82.0 64 26.3 Total 896 72.9 243 100.0
5.5 Truck/Bus Fire or Explosion
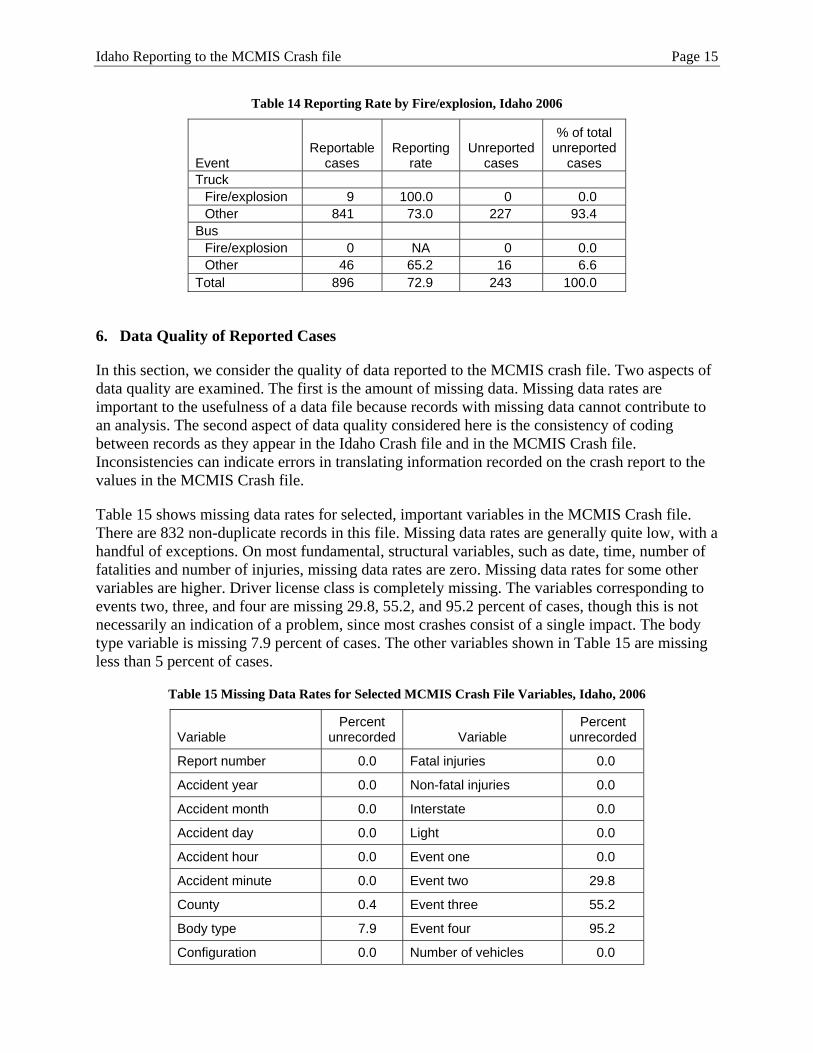
The first harmful event and the most harmful event are recorded at the unit level on the Idaho crash report form. In the context considered here, the unit refers to trucks or buses. Fire/ explosion is coded as one of the levels of the event variables. Table 14 shows reporting rates according to fire or explosion for trucks and buses. For trucks there were 9 reportable cases involving fire or explosion, of which all cases were reported. Among buses, there were no fires among reportable cases, so calculation of a reporting rate does not apply.
Idaho Reporting to the MCMIS Crash file Page 15
Table 14 Reporting Rate by Fire/explosion, Idaho 2006
Event Reportable
cases Reporting
rate Unreported
cases
% of total unreported
cases Truck
Fire/explosion 9 100.0 0 0.0 Other 841 73.0 227 93.4
Bus Fire/explosion 0 NA 0 0.0 Other 46 65.2 16 6.6
Total 896 72.9 243 100.0
6. Data Quality of Reported Cases
In this section, we consider the quality of data reported to the MCMIS crash file. Two aspects of data quality are examined. The first is the amount of missing data. Missing data rates are important to the usefulness of a data file because records with missing data cannot contribute to an analysis. The second aspect of data quality considered here is the consistency of coding between records as they appear in the Idaho Crash file and in the MCMIS Crash file. Inconsistencies can indicate errors in translating information recorded on the crash report to the values in the MCMIS Crash file.
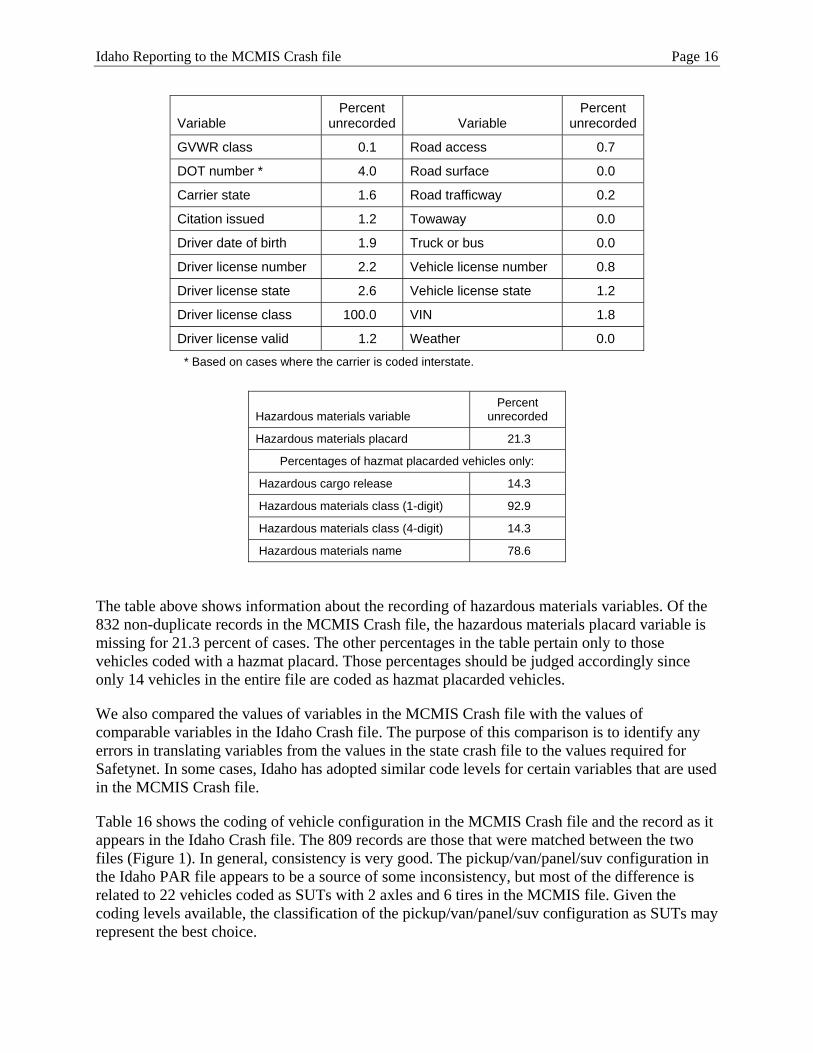
Table 15 shows missing data rates for selected, important variables in the MCMIS Crash file. There are 832 non-duplicate records in this file. Missing data rates are generally quite low, with a handful of exceptions. On most fundamental, structural variables, such as date, time, number of fatalities and number of injuries, missing data rates are zero. Missing data rates for some other variables are higher. Driver license class is completely missing. The variables corresponding to events two, three, and four are missing 29.8, 55.2, and 95.2 percent of cases, though this is not necessarily an indication of a problem, since most crashes consist of a single impact. The body type variable is missing 7.9 percent of cases. The other variables shown in Table 15 are missing less than 5 percent of cases.
Table 15 Missing Data Rates for Selected MCMIS Crash File Variables, Idaho, 2006
Variable Percent
unrecorded Variable Percent
unrecorded
Report number 0.0 Fatal injuries 0.0
Accident year 0.0 Non-fatal injuries 0.0
Accident month 0.0 Interstate 0.0
Accident day 0.0 Light 0.0
Accident hour 0.0 Event one 0.0
Accident minute 0.0 Event two 29.8
County 0.4 Event three 55.2
Body type 7.9 Event four 95.2
Configuration 0.0 Number of vehicles 0.0
Idaho Reporting to the MCMIS Crash file Page 16
Variable Percent
unrecorded Variable Percent
unrecorded
GVWR class 0.1 Road access 0.7
DOT number * 4.0 Road surface 0.0
Carrier state 1.6 Road trafficway 0.2
Citation issued 1.2 Towaway 0.0
Driver date of birth 1.9 Truck or bus 0.0
Driver license number 2.2 Vehicle license number 0.8
Driver license state 2.6 Vehicle license state 1.2
Driver license class 100.0 VIN 1.8
Driver license valid 1.2 Weather 0.0
* Based on cases where the carrier is coded interstate.
Hazardous materials variable Percent
unrecorded
Hazardous materials placard 21.3
Percentages of hazmat placarded vehicles only:
Hazardous cargo release 14.3
Hazardous materials class (1-digit) 92.9
Hazardous materials class (4-digit) 14.3
Hazardous materials name 78.6
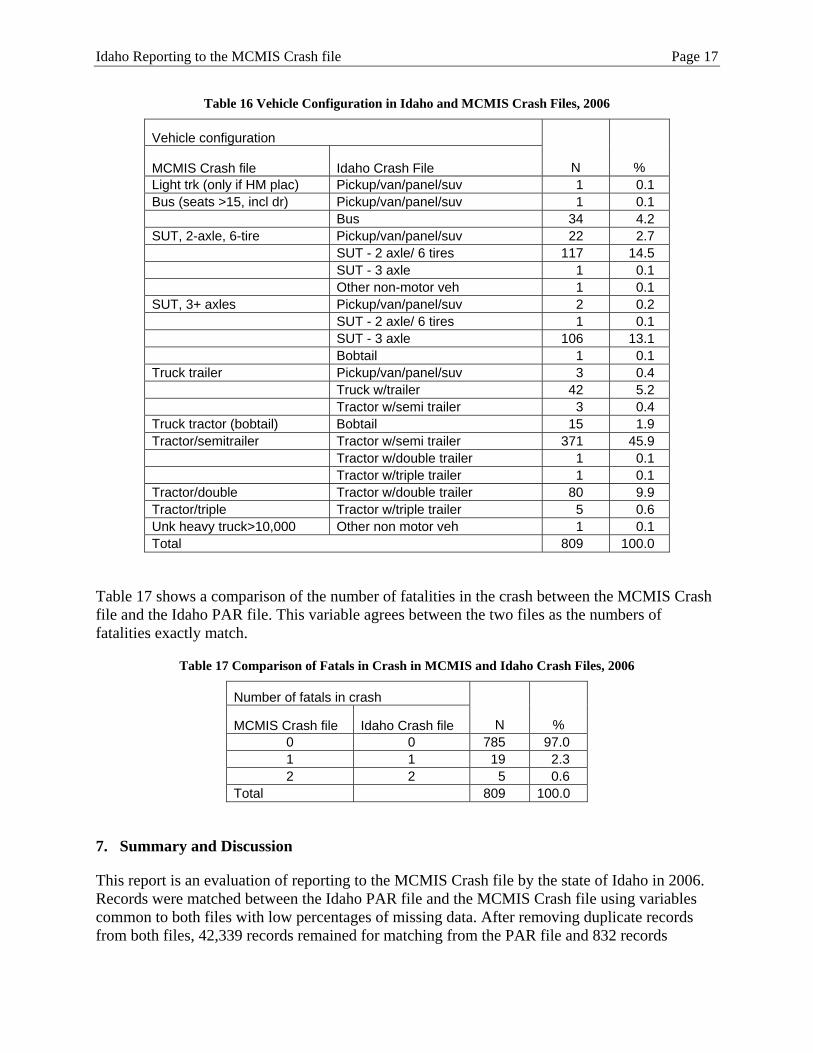
The table above shows information about the recording of hazardous materials variables. Of the 832 non-duplicate records in the MCMIS Crash file, the hazardous materials placard variable is missing for 21.3 percent of cases. The other percentages in the table pertain only to those vehicles coded with a hazmat placard. Those percentages should be judged accordingly since only 14 vehicles in the entire file are coded as hazmat placarded vehicles.
We also compared the values of variables in the MCMIS Crash file with the values of comparable variables in the Idaho Crash file. The purpose of this comparison is to identify any errors in translating variables from the values in the state crash file to the values required for Safetynet. In some cases, Idaho has adopted similar code levels for certain variables that are used in the MCMIS Crash file.
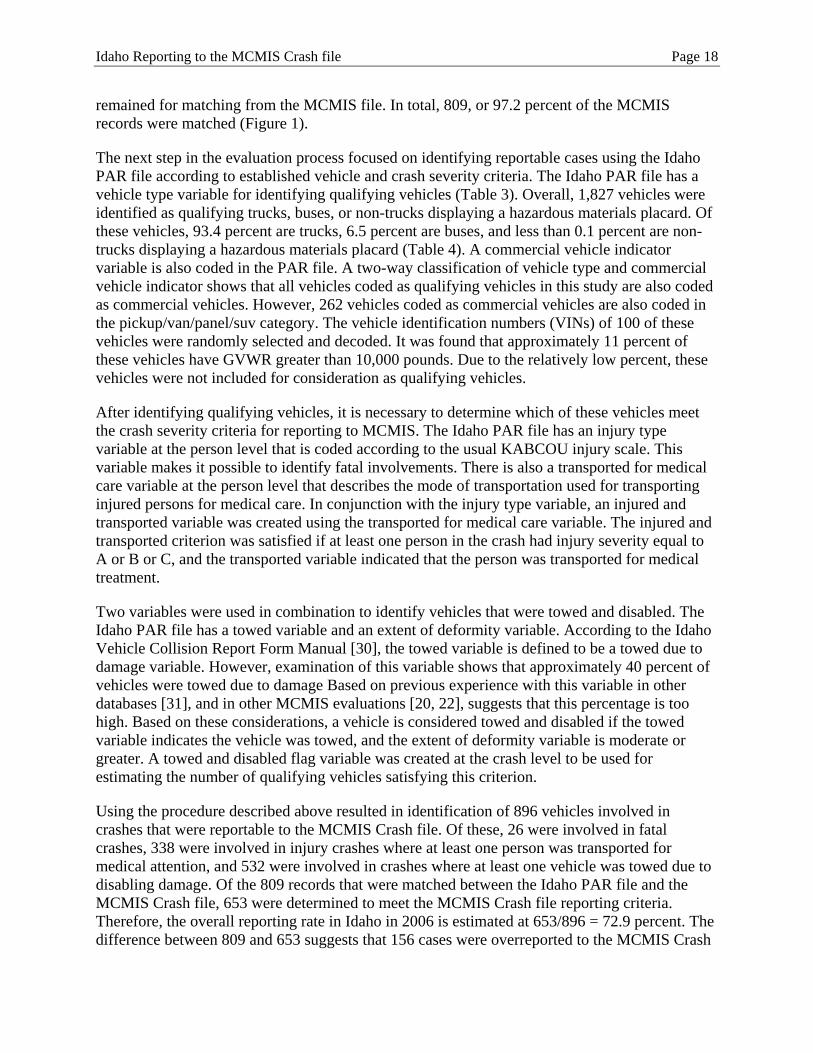
Table 16 shows the coding of vehicle configuration in the MCMIS Crash file and the record as it appears in the Idaho Crash file. The 809 records are those that were matched between the two files (Figure 1). In general, consistency is very good. The pickup/van/panel/suv configuration in the Idaho PAR file appears to be a source of some inconsistency, but most of the difference is related to 22 vehicles coded as SUTs with 2 axles and 6 tires in the MCMIS file. Given the coding levels available, the classification of the pickup/van/panel/suv configuration as SUTs may represent the best choice.
Idaho Reporting to the MCMIS Crash file Page 17
Table 16 Vehicle Configuration in Idaho and MCMIS Crash Files, 2006
Vehicle configuration
MCMIS Crash file Idaho Crash File N % Light trk (only if HM plac) Pickup/van/panel/suv 1 0.1 Bus (seats >15, incl dr) Pickup/van/panel/suv 1 0.1 Bus 34 4.2 SUT, 2-axle, 6-tire Pickup/van/panel/suv 22 2.7 SUT - 2 axle/ 6 tires 117 14.5 SUT - 3 axle 1 0.1 Other non-motor veh 1 0.1 SUT, 3+ axles Pickup/van/panel/suv 2 0.2 SUT - 2 axle/ 6 tires 1 0.1 SUT - 3 axle 106 13.1 Bobtail 1 0.1 Truck trailer Pickup/van/panel/suv 3 0.4 Truck w/trailer 42 5.2 Tractor w/semi trailer 3 0.4 Truck tractor (bobtail) Bobtail 15 1.9 Tractor/semitrailer Tractor w/semi trailer 371 45.9 Tractor w/double trailer 1 0.1 Tractor w/triple trailer 1 0.1 Tractor/double Tractor w/double trailer 80 9.9 Tractor/triple Tractor w/triple trailer 5 0.6 Unk heavy truck>10,000 Other non motor veh 1 0.1 Total 809 100.0
Table 17 shows a comparison of the number of fatalities in the crash between the MCMIS Crash file and the Idaho PAR file. This variable agrees between the two files as the numbers of fatalities exactly match.
Table 17 Comparison of Fatals in Crash in MCMIS and Idaho Crash Files, 2006
Number of fatals in crash
MCMIS Crash file Idaho Crash file N % 0 0 785 97.0 1 1 19 2.3 2 2 5 0.6
Total 809 100.0
7. Summary and Discussion
This report is an evaluation of reporting to the MCMIS Crash file by the state of Idaho in 2006. Records were matched between the Idaho PAR file and the MCMIS Crash file using variables common to both files with low percentages of missing data. After removing duplicate records from both files, 42,339 records remained for matching from the PAR file and 832 records
Idaho Reporting to the MCMIS Crash file Page 18
remained for matching from the MCMIS file. In total, 809, or 97.2 percent of the MCMIS records were matched (Figure 1).
The next step in the evaluation process focused on identifying reportable cases using the Idaho PAR file according to established vehicle and crash severity criteria. The Idaho PAR file has a vehicle type variable for identifying qualifying vehicles (Table 3). Overall, 1,827 vehicles were identified as qualifying trucks, buses, or non-trucks displaying a hazardous materials placard. Of these vehicles, 93.4 percent are trucks, 6.5 percent are buses, and less than 0.1 percent are non-trucks displaying a hazardous materials placard (Table 4). A commercial vehicle indicator variable is also coded in the PAR file. A two-way classification of vehicle type and commercial vehicle indicator shows that all vehicles coded as qualifying vehicles in this study are also coded as commercial vehicles. However, 262 vehicles coded as commercial vehicles are also coded in the pickup/van/panel/suv category. The vehicle identification numbers (VINs) of 100 of these vehicles were randomly selected and decoded. It was found that approximately 11 percent of these vehicles have GVWR greater than 10,000 pounds. Due to the relatively low percent, these vehicles were not included for consideration as qualifying vehicles.
After identifying qualifying vehicles, it is necessary to determine which of these vehicles meet the crash severity criteria for reporting to MCMIS. The Idaho PAR file has an injury type variable at the person level that is coded according to the usual KABCOU injury scale. This variable makes it possible to identify fatal involvements. There is also a transported for medical care variable at the person level that describes the mode of transportation used for transporting injured persons for medical care. In conjunction with the injury type variable, an injured and transported variable was created using the transported for medical care variable. The injured and transported criterion was satisfied if at least one person in the crash had injury severity equal to A or B or C, and the transported variable indicated that the person was transported for medical treatment.
Two variables were used in combination to identify vehicles that were towed and disabled. The Idaho PAR file has a towed variable and an extent of deformity variable. According to the Idaho Vehicle Collision Report Form Manual [30], the towed variable is defined to be a towed due to damage variable. However, examination of this variable shows that approximately 40 percent of vehicles were towed due to damage Based on previous experience with this variable in other databases [31], and in other MCMIS evaluations [20, 22], suggests that this percentage is too high. Based on these considerations, a vehicle is considered towed and disabled if the towed variable indicates the vehicle was towed, and the extent of deformity variable is moderate or greater. A towed and disabled flag variable was created at the crash level to be used for estimating the number of qualifying vehicles satisfying this criterion.
Using the procedure described above resulted in identification of 896 vehicles involved in crashes that were reportable to the MCMIS Crash file. Of these, 26 were involved in fatal crashes, 338 were involved in injury crashes where at least one person was transported for medical attention, and 532 were involved in crashes where at least one vehicle was towed due to disabling damage. Of the 809 records that were matched between the Idaho PAR file and the MCMIS Crash file, 653 were determined to meet the MCMIS Crash file reporting criteria. Therefore, the overall reporting rate in Idaho in 2006 is estimated at 653/896 = 72.9 percent. The difference between 809 and 653 suggests that 156 cases were overreported to the MCMIS Crash
Idaho Reporting to the MCMIS Crash file Page 19
file. According to this analysis, all 156 cases did not meet the crash severity threshold for reporting to MCMIS.
Since the overall reporting rate is estimated at 72.9 percent, specific variables were examined to identify sources of underreporting. Reporting rates were calculated and presented in four groups. The four groups are case processing, reporting criteria, reporting agency and area, and fire/ explosion. Case processing considers timing issues, reporting criteria deals with vehicle and crash severity issues, agency and area are related to the reporting agency and the county of the crash, and fire/explosion considers fires or explosions in reportable vehicles.
According to crash month, reporting rates did not appear to follow any kind of seasonal pattern or vary in any kind of systematic way. They tended to fluctuate randomly about the overall reporting rate. The minimum reporting rate is 67.0 percent in October and the maximum rate is 88.4 percent in June. In January, October, and December, the percentages of unreported cases are greater than 10 percent. Idaho tended to report cases well within the 90-day grace period between the date of the crash and the date the case was uploaded to the MCMIS Crash file. Overall, cases were uploaded about 67 days prior to the end of the grace period, or in other words, about 23 days (90-67) after the crash date (Figure 2).
Based on vehicle type, the reporting rate for trucks is 73.3 percent, while the rate for buses is 65.2 percent. Larger trucks, such as tractor semitrailers, tractor doubles, tractor triples, and SUTs with 3 axles have the highest reporting rates. Smaller configuration SUTs with 2 axles and 6 tires have the smallest rate at 59.9 percent and account for 25.9 percent of unreported cases.
A significant finding of this study appears to be that reporting rates are greater than 90 percent for crashes involving fatalities or injuries (Tables 10, 11). Idaho seems to have good procedures for reporting crashes that are MCMIS-reportable when injuries are involved. However, the reporting rate drops to 60.7 percent for vehicles involved in crashes in which there are no injuries, but are reportable based on the towed and disabled criterion. In addition, these cases account for 86.0 percent of the total unreported cases. Note that this study uses the strict definition of a MCMIS-reportable crash for identifying reportable cases. That is, based on variables available in the Idaho PAR file, a crash must satisfy the inured and transported criterion, the towed and disabled criterion, or both.
The location of the crash and the reporting agency handling the crash were also investigated. There are 44 counties in the state of Idaho. Ada County ranks first in terms of reportable cases and also has the lowest reporting rate among the top 12 counties. The reporting rate in Ada County is about 10 percent lower than the overall average and it also accounts for 19.8 percent of the unreported cases. With respect to reporting agency, the state police have the highest reporting rate of 82.0 percent. The reporting rate for sheriff’s departments is 72.8 percent and for police departments it is 55.7 percent.
There were 9 fire/explosions in reportable cases for trucks, all of which were reported. Among reportable buses, there were no fire/explosions recorded, so calculation of a reporting rate does not apply.
Missing data rates in the MCMIS Crash file were also examined. Except for a few variables such as driver license class, the event variables after the first event, and body type, missing data rates
Idaho Reporting to the MCMIS Crash file Page 20
are generally less than 5 percent. It is common for event variables after the first event to have missing data. Certain variables in the Idaho PAR file and the MCMIS Crash file were also compared for the 809 records that were matched between the two files. There is general agreement between the vehicle configuration variables. The pickup/van/panel/suv category for the vehicle type variable in the Idaho PAR file seems to be a source of coding differences between the two files, but in general the other coding levels agree well. The number of fatalities in the crash variable agrees exactly between the two files.
Idaho Reporting to the MCMIS Crash file Page 21
8. References
1 Blower, D., and Matteson, A., Evaluation of the Motor Carrier Management Information System Crash File, Phase One. University of Michigan Transportation Research Institute, Ann Arbor, Michigan. March 2003. Sponsor: Federal Motor Carrier Safety Administration, U.S. D.O.T.
2 Blower, D., and Matteson, A., Patterns of MCMIS Crash File Underreporting in Ohio. University of Michigan Transportation Research Institute, Ann Arbor, Michigan. August 2003. Sponsor: Federal Motor Carrier Safety Administration, U.S. D.O.T.
3 Blower, D., and Matteson, A., Evaluation of Missouri Crash Data Reported to MCMIS Crash File. University of Michigan Transportation Research Institute, Ann Arbor, Michigan. January 2004. Sponsor: Federal Motor Carrier Safety Administration, U.S. D.O.T.
4 Blower, D., and Matteson, A., Evaluation of Michigan Crash Data Reported to MCMIS Crash File. University of Michigan Transportation Research Institute, Ann Arbor, Michigan. September 2004. Sponsor: Federal Motor Carrier Safety Administration, U.S. D.O.T.
5 Blower, D., and Matteson, A., Evaluation of Florida Crash Data Reported to MCMIS Crash File. University of Michigan Transportation Research Institute, Ann Arbor, Michigan. December 2004. Sponsor: Federal Motor Carrier Safety Administration, U.S. D.O.T.
6 Matteson, A., and Blower, D., Evaluation of California Crash Data Reported to MCMIS Crash File. University of Michigan Transportation Research Institute, Ann Arbor, Michigan. February 2005. Sponsor: Federal Motor Carrier Safety Administration, U.S. D.O.T.
7 Green, P.E., and Blower, D., Evaluation of New Jersey Crash Data Reported to MCMIS Crash File. University of Michigan Transportation Research Institute, Ann Arbor, Michigan. February 2005. Sponsor: Federal Motor Carrier Safety Administration, U.S. D.O.T.
8 Green, P.E., and Blower, D., Evaluation of New Mexico Crash Data Reported to MCMIS Crash File. University of Michigan Transportation Research Institute, Ann Arbor, Michigan. July 2005. Sponsor: Federal Motor Carrier Safety Administration, U.S. D.O.T.
9 Matteson, A., and Blower, D., Evaluation of North Carolina Crash Data Reported to MCMIS Crash File. University of Michigan Transportation Research Institute, Ann Arbor, Michigan. May 2005. Sponsor: Federal Motor Carrier Safety Administration, U.S. D.O.T.
10 Matteson, A., and Blower, D., Evaluation of Illinois Crash Data Reported to MCMIS Crash File. University of Michigan Transportation Research Institute, Ann Arbor, Michigan. July 2005. Sponsor: Federal Motor Carrier Safety Administration, U.S. D.O.T.
Idaho Reporting to the MCMIS Crash file Page 22
11 Blower, D., and Matteson, A., Evaluation of Washington Crash Data Reported to MCMIS Crash File. University of Michigan Transportation Research Institute, Ann Arbor, Michigan. June 2006. Sponsor: Federal Motor Carrier Safety Administration, U.S. D.O.T.
12 Blower, D., and Matteson, A., Evaluation of Iowa Crash Data Reported to MCMIS Crash File. University of Michigan Transportation Research Institute, Ann Arbor, Michigan. August 2006. Sponsor: Federal Motor Carrier Safety Administration, U.S. D.O.T.
13 Blower, D., and Matteson, A., Evaluation of 2005 Missouri Crash Data Reported to MCMIS Crash File. University of Michigan Transportation Research Institute, Ann Arbor, Michigan. September 2006. Sponsor: Federal Motor Carrier Safety Administration, U.S. D.O.T.
14 Green, P.E., and Matteson, A., Evaluation of Maryland Crash Data Reported to MCMIS Crash File. University of Michigan Transportation Research Institute, Ann Arbor, Michigan. July 2006. Sponsor: Federal Motor Carrier Safety Administration, U.S. D.O.T.
15 Green, P.E., and Matteson, A., Evaluation of 2005 Ohio Crash Data Reported to MCMIS Crash File. University of Michigan Transportation Research Institute, Ann Arbor, Michigan. December 2006. Sponsor: Federal Motor Carrier Safety Administration, U.S. D.O.T.
16 Blower, D., and Matteson, A., Evaluation of 2005 Louisiana Crash Data Reported to MCMIS Crash File. University of Michigan Transportation Research Institute, Ann Arbor, Michigan. December 2006. Sponsor: Federal Motor Carrier Safety Administration, U.S. D.O.T.
17 Blower, D., and Matteson, A., Evaluation of 2005 Nebraska Crash Data Reported to MCMIS Crash File. University of Michigan Transportation Research Institute, Ann Arbor, Michigan. February 2007. Sponsor: Federal Motor Carrier Safety Administration, U.S. D.O.T.
18 Blower, D., and Matteson, A., Evaluation of 2005 South Dakota Crash Data Reported to MCMIS Crash File. University of Michigan Transportation Research Institute, Ann Arbor, Michigan. March 2007. Sponsor: Federal Motor Carrier Safety Administration, U.S. D.O.T.
19 Blower, D., and Matteson, A., Evaluation of 2004 Tennessee Crash Data Reported to MCMIS Crash File. University of Michigan Transportation Research Institute, Ann Arbor, Michigan. May 2007. Sponsor: Federal Motor Carrier Safety Administration, U.S. D.O.T.
20 Green, P.E., and Matteson, A., Evaluation of 2005 Arizona Crash Data Reported to MCMIS Crash File. University of Michigan Transportation Research Institute, Ann Arbor, Michigan. June 2007. Sponsor: Federal Motor Carrier Safety Administration, U.S. D.O.T.
Idaho Reporting to the MCMIS Crash file Page 23
21 Blower, D., and Matteson, A., Evaluation of 2005 Pennsylvania Crash Data Reported to MCMIS Crash File. University of Michigan Transportation Research Institute, Ann Arbor, Michigan. September 2007. Sponsor: Federal Motor Carrier Safety Administration, U.S. D.O.T.
22 Green, P.E., and Matteson, A., Evaluation of 2005 Indiana Crash Data Reported to MCMIS Crash File. University of Michigan Transportation Research Institute, Ann Arbor, Michigan. September 2007. Sponsor: Federal Motor Carrier Safety Administration, U.S. D.O.T.
23 Blower, D., and Matteson, A., Evaluation of 2005 Connecticut Crash Data Reported to MCMIS Crash File. University of Michigan Transportation Research Institute, Ann Arbor, Michigan. October 2007. Sponsor: Federal Motor Carrier Safety Administration, U.S. D.O.T.
24 Green, P.E., and Matteson, A., Evaluation of 2005 Alabama Crash Data Reported to MCMIS Crash File. University of Michigan Transportation Research Institute, Ann Arbor, Michigan. October 2007. Sponsor: Federal Motor Carrier Safety Administration, U.S. D.O.T.
25 Green, P.E., and Matteson, A., Evaluation of 2006 Georgia Crash Data Reported to MCMIS Crash File. University of Michigan Transportation Research Institute, Ann Arbor, Michigan. November 2007. Sponsor: Federal Motor Carrier Safety Administration, U.S. D.O.T.
26 U.S. Bureau of Census, 2002 Economic Census, Vehicle Inventory and Use Survey.
27 United States Census Bureau, Population Division, Estimates 2000-2005.
28 Trucks Involved in Fatal Accidents (TIFA) 1999-2003, Center for National Truck and Bus Statistics, The University of Michigan Transportation Research Institute.
29 Buses Involved in Fatal Accidents (BIFA) 1999-2003, Center for National Truck and Bus Statistics, The University of Michigan Transportation Research Institute.
30 Idaho Vehicle Collision Report Form Manual, Idaho Transportation Department, Office of Highway Safety.
31 National Automotive Sampling System (NASS) General Estimates System (GES) 2006, National Center for Statistics and Analysis, NHTSA.
Idaho Reporting to the MCMIS Crash file Page 24
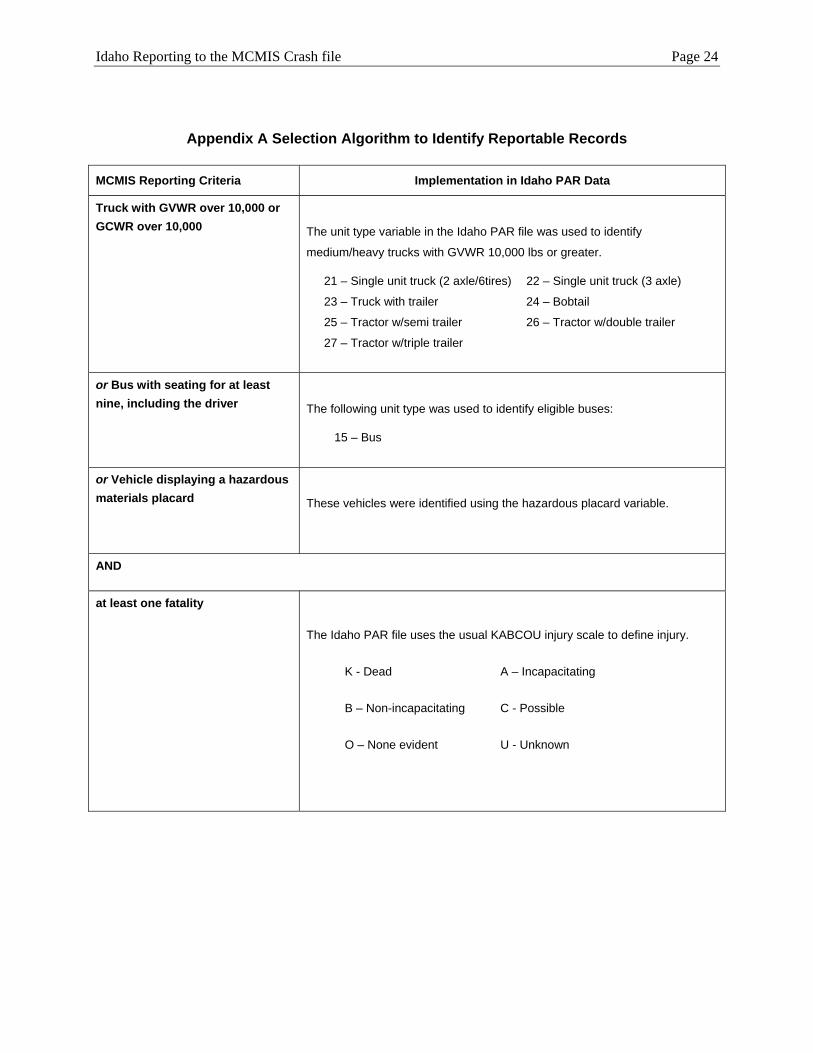
Appendix A Selection Algorithm to Identify Reportable Records MCMIS Reporting Criteria Implementation in Idaho PAR Data
Truck with GVWR over 10,000 or GCWR over 10,000
The unit type variable in the Idaho PAR file was used to identify
medium/heavy trucks with GVWR 10,000 lbs or greater.
21 – Single unit truck (2 axle/6tires) 22 – Single unit truck (3 axle)
23 – Truck with trailer 24 – Bobtail
25 – Tractor w/semi trailer 26 – Tractor w/double trailer
27 – Tractor w/triple trailer
or Bus with seating for at least nine, including the driver
The following unit type was used to identify eligible buses:
15 – Bus
or Vehicle displaying a hazardous materials placard
These vehicles were identified using the hazardous placard variable.
AND
at least one fatality
The Idaho PAR file uses the usual KABCOU injury scale to define injury.
K - Dead A – Incapacitating
B – Non-incapacitating C - Possible
O – None evident U - Unknown
Idaho Reporting to the MCMIS Crash file Page 25
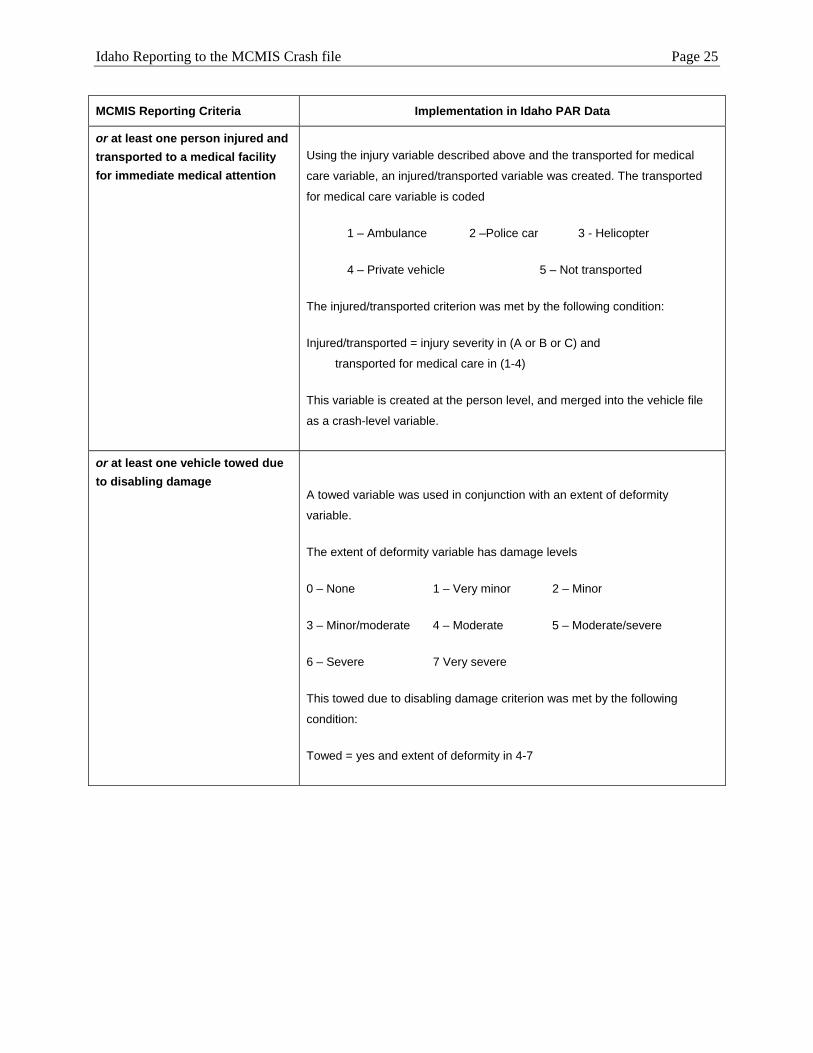
MCMIS Reporting Criteria Implementation in Idaho PAR Data
or at least one person injured and transported to a medical facility for immediate medical attention
Using the injury variable described above and the transported for medical
care variable, an injured/transported variable was created. The transported
for medical care variable is coded
1 – Ambulance 2 –Police car 3 - Helicopter
4 – Private vehicle 5 – Not transported
The injured/transported criterion was met by the following condition:
Injured/transported = injury severity in (A or B or C) and
transported for medical care in (1-4)
This variable is created at the person level, and merged into the vehicle file
as a crash-level variable.
or at least one vehicle towed due to disabling damage
A towed variable was used in conjunction with an extent of deformity
variable.
The extent of deformity variable has damage levels
0 – None 1 – Very minor 2 – Minor
3 – Minor/moderate 4 – Moderate 5 – Moderate/severe
6 – Severe 7 Very severe
This towed due to disabling damage criterion was met by the following
condition:
Towed = yes and extent of deformity in 4-7
Idaho Reporting to the MCMIS Crash file Page 26
Appendix B Idaho Traffic Accident Reports
Idaho Reporting to the MCMIS Crash file Page 27
Idaho Reporting to the MCMIS Crash file Page 28