Embed Size (px)
Citation preview
NBSIR 77-1214
Evaluation of Metal VolumetricStandards Used in theMeasurement of Liquid
Hydrocarbons: A Report of a
U. S. National Bureau of
Standards and AmericanPetroleum Institute ResearchAssociate Project.
D. J. Hine
Research Associate
Institute for Applied Technology
National Bureau of Standards
Washington, D C. 20234
April 1977
Final
Issued June 1 977
Prepared for
Office of Weights and MeasuresInstitute for Applied TechnologyWashington, D.C. 20234

NBSIR 77-1214
EVALUATION OF METAL VOLUMETRICSTANDARDS USED IN THEMEASUREMENT OF LIQUID
HYDROCARBONS: A REPORT OF AU. S. NATIONAL BUREAU OFSTANDARDS AND AMERICANPETROLEUM INSTITUTE RESEARCHASSOCIATE PROJECT.
D. J. Hine
Research Associate
Institute for Applied Technology
National Bureau of Standards
Washington, D.C. 20234
April 1977
Final
Issued June 1 977
Prepared for
Office of Weights and MeasuresInstitute for Applied Technology
Washington, D.C. 20234
U S. DEPARTMENT OF COMMERCE. Juanita M. Kreps, Secretary
Dr. Sidney Harman, Under Secretary
Jordan J. Baruch, Assistant Secretary for Science and Technology
NATIONAL BUREAU OF STANDARDS. Ernest Ambler. Acting Director
I
FOREWORD
No position is taken as to whether any method, apparatus, or productmentioned herein is covered by an existing patent, nor as to thevalidity of any patent alleged to cover any such method. Further-more, the information contained in this report does not grant theright, by implication or otherwise, for manufacture, sale, or usein connection with any method, apparatus, or product covered by
letters patent; nor does it insure anyone against liability forinfringement of letters patent.
This report does not endorse or advocate the preferential use of anytype of equipment. Its purpose, rather, is to describe and illustratemethods, practices, and equipment which are considered acceptable in
certain measurement circumstances. The report is not intended torestrict in any way the future development of equipment and methods,nor to affect in any way equipment of any type already installedand i n operat i on
.
The material contained in this report may be used by anyone desiringto do so, but neither the American Petroleum Institute nor the NationaBureau of Standards shall be held responsible or liable in any wayeither for loss or damage resulting therefrom or for the violationof any federal, state, or municipal regulations with which it mayconf I i ct
.
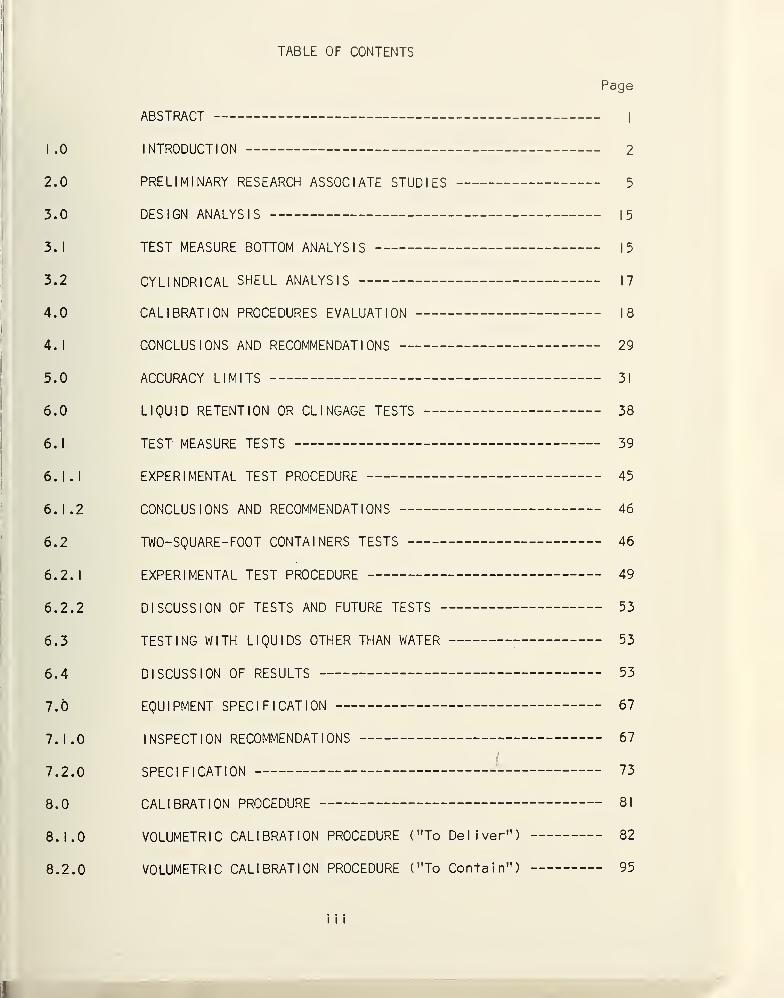
TABLE OF CONTENTS
Page
ABSTRACT |
1.0 INTRODUCTION 2
2.0 PRELIMINARY RESEARCH ASSOCIATE STUDIES 5
3.0 DESIGN ANALYSIS 15
3.1 TEST MEASURE BOTTOM ANALYSIS 15
3.2 CYLINDRICAL SHELL ANALYSIS 17
4.0 CALIBRATION PROCEDURES EVALUATION 18
4.1 CONCLUSIONS AND RECOMMENDATIONS 29
5.0 ACCURACY LIMITS 31
6.0 LIQUID RETENTION OR CLINGAGE TESTS 38
6. I TEST MEASURE TESTS 39
6.1.1 EXPERIMENTAL TEST PROCEDURE 45
6.1.2 CONCLUSIONS AND RECOMMENDATIONS 46
6.2 TWO-SQUARE-FOOT CONTAINERS TESTS 46
6.2.1 EXPERIMENTAL TEST PROCEDURE 49
6.2.2 DISCUSSION OF TESTS AND FUTURE TESTS 53
6.3 TESTING WITH LIQUIDS OTHER THAN WATER 53
6.4 DISCUSSION OF RESULTS 53
7.0 EQUIPMENT SPECIFICATION 67
7.1.0 INSPECTION RECOMMENDATIONS 67
7.2.0 SPECIFICATION 73
8.0 CALIBRATION PROCEDURE 81
8.1.0 VOLUMETRIC CALIBRATION PROCEDURE ("To Deliver") 82
8.2.0 VOLUMETRIC CALIBRATION PROCEDURE ("To Contain") 95
i i i
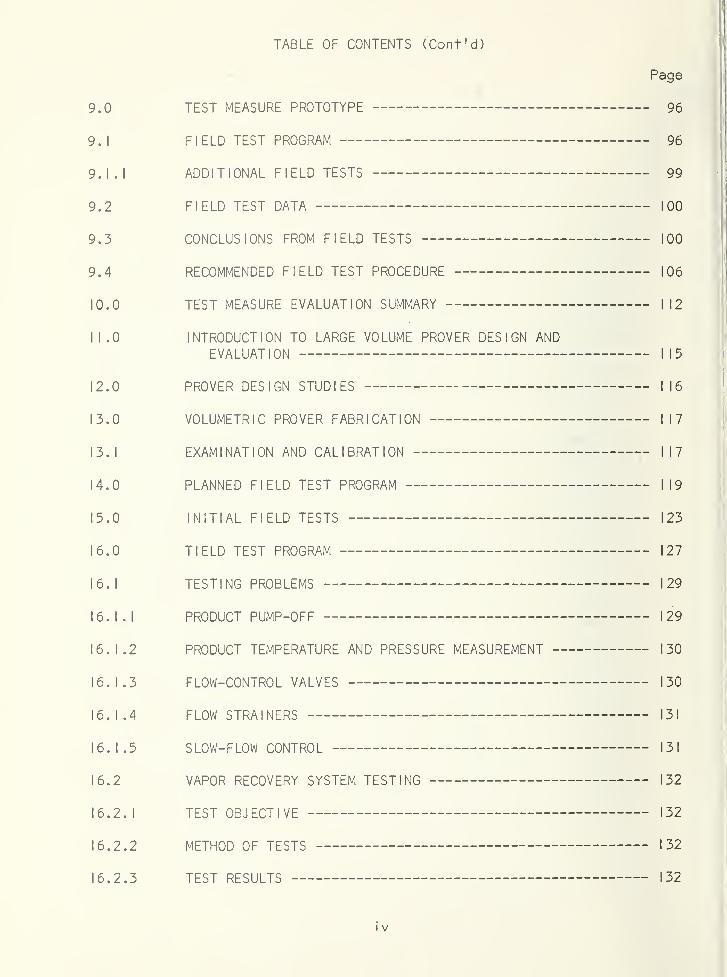
TABLE OF CONTENTS (Cont'd)
Page
9.0 TEST MEASURE PROTOTYPE 96
9.1 FIELD TEST PROGRAM — 96
9.1.1 ADDITIONAL FIELD TESTS 99
9.2 FIELD TEST DATA 100
9.3 CONCLUSIONS FROM FIELD TESTS 100
9.4 RECOMMENDED FIELD TEST PROCEDURE 106
10.0 TEST MEASURE EVALUATION SUMMARY 112
I 1.0 INTRODUCTION TO LARGE VOLUME PROVER DESIGN ANDEVALUATION i 15
12.0 PROVER DESIGN STUDIES 116
13.0 VOLUMETRIC PROVER FABRICATION 117
13.1 EXAMINATION AND CALIBRATION 117
14.0 PLANNED FIELD TEST PROGRAM 119
15.0 INITIAL FIELD TESTS 123
16.0 TIELD TEST PROGRAM 127
16.1 TESTING PROBLEMS 129
16.1.
1
PRODUCT PUMP-OFF 129
16.1.2 PRODUCT TEMPERATURE AND PRESSURE MEASUREMENT 130
16.1.3 FLOW-CONTROL VALVES 130
16.1.4 FLOW STRAINERS 131
16.1.5 SLOW-FLOW CONTROL 131
16.2 VAPOR RECOVERY SYSTEM TESTING 132
16.2.1 TEST OBJECTIVE 132
16.2.2 METHOD OF TESTS 132
16.2.3 TEST RESULTS 132
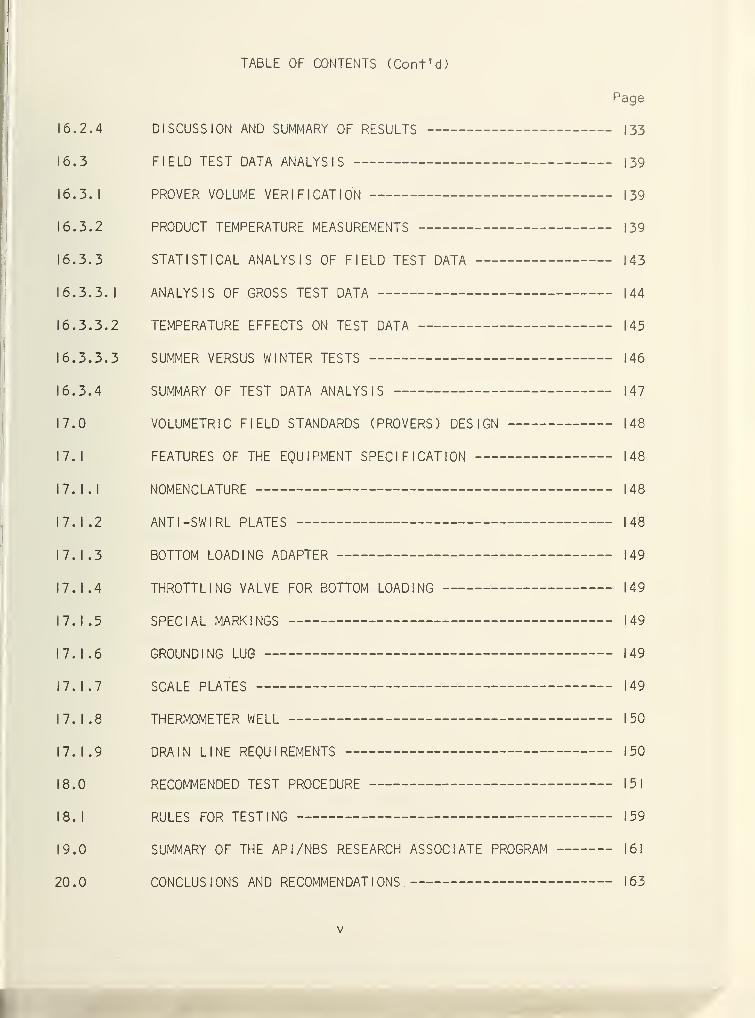
TABLE OF CONTENTS (Cont'd)
Page
16.2.4 DISCUSSION AND SUMMARY OF RESULTS 133
16.3 FIELD TEST DATA ANALYSIS 139
16.3.1 PROVER VOLUME VERIFICATION 139
16.3.2 PRODUCT TEMPERATURE MEASUREMENTS 139
16.3.3 STATISTICAL ANALYSIS OF FIELD TEST DATA 143
16.3.3.1 ANALYSIS OF GROSS TEST DATA 144
16.3.3.2 TEMPERATURE EFFECTS ON TEST DATA 145
16.3.3.3 SUMMER VERSUS WINTER TESTS 146
16.3.4 SUMMARY OF TEST DATA ANALYSIS 147
17.0 VOLUMETRIC FIELD STANDARDS (PROVERS) DESIGN 148
17.1 FEATURES OF THE EQUIPMENT SPECIFICATION 148
17. 1 .
1
NOMENCLATURE 148
17. 1 .2 ANTI-SWIRL PLATES 148
17.1.3 BOTTOM LOADING ADAPTER 149
17.1.4 THROTTLING VALVE FOR BOTTOM LOADING 149
17. 1 .5 SPECIAL MARKINGS 149
17.1.6 GROUNDING LUG 149
17.1.7 SCALE PLATES 149
17.1.8 THERMOMETER WELL 150
17.1.9 DRAIN LINE REQUIREMENTS —— 150
18.0 RECOMMENDED TEST PROCEDURE 151
18. I RULES FOR TESTING 159
! 9.0 SUMMARY OF THE API/NBS RESEARCH ASSOCIATE PROGRAM 161
20.0 CONCLUSIONS AND RECOMMENDATIONS 163
v

TABLE OF CONTENTS (Con+’d)
Page
ACKNOWLEDGEMENT 167
LIST OF REFERENCES 168
BIBLIOGRAPHY 170
A-
1
APPENDIX
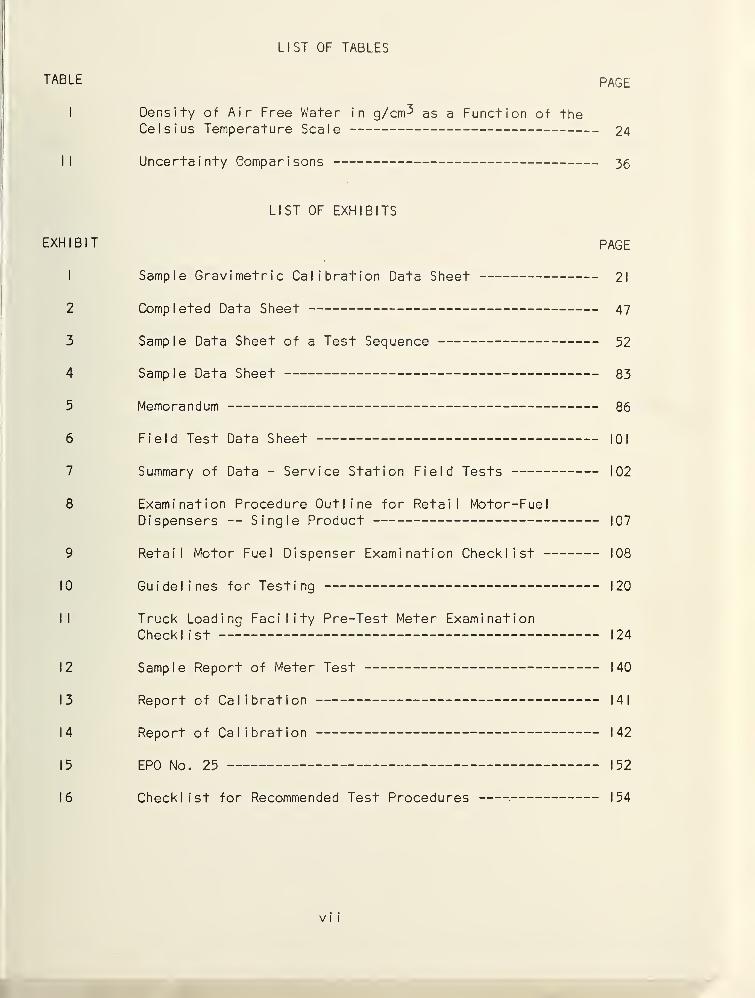
LIST OF TABLES
TABLE PAGE
I Density of Air Free Water in g/cm 5 as a Function of theCelsius Temperature Scale 24
II Uncertainty Comparisons 36
LIST OF EXHIBITS
EXHIBIT PAGE
1 Sample Gravimetric Calibration Data Sheet 21
2 Completed Data Sheet 47
3 Sample Data Sheet of a Test Sequence 52
4 Sample Data Sheet 83
5 Memorandum 86
6 Field Test Data Sheet 101
7 Summary of Data - Service Station Field Tests 102
8 Examination Procedure Outline for Retail Motor-FuelDispensers — Single Product 107
9 Retail Motor Fuel Dispenser Examination Checklist 108
10 Guidelines for Testing 120
11 Truck Loading Facility Pre-Test Meter ExaminationCheck I i st 1 24
12 Sample Report of Meter Test 140
13 Report of Calibration 141
14 Report of Calibration 142
15 EPO No. 25 152
16 Checklist for Recommended Test Procedures . 154
vi i
LIST OF FIGURES
FIGURE PAGE
1 Volume Standards Used for Tests - Group I 40
2 Volume Standards Used for Tests - Group 2 41
3 Volume Standards Used for Tests - Group 3 42
4 Configuration for Weighing on the Russell Balance 43
5 Configuration for Weighing a 1-Gallon Measure 44
6 Two-Square-Foot Containers for Fluid Retention Tests 48
7 Configuration for Weighing Two-Square-Foot Containers 50
8 Test Set-Up for Two-Square-Foot Containers 51
9 Two-Square-Foot Surface Area Device - 20° Top Angle, 40°
Bottom Angle 54
10 Two-Square-Foot Surface Area Device - 40° Top Angle, 20°
Bottom Angle 55
11 Two-Square-Foot Surface Area Device - 35° Top Angle, 10°
Bottom Angle 56
12 Two-Square-Foot Surface Area Device - 10° Top Angle, 35°
Bottom Angle 57
13 Two-Square-Foot Surface Area Device - 25°. Top Angle, 15°
Bottom Angle 58
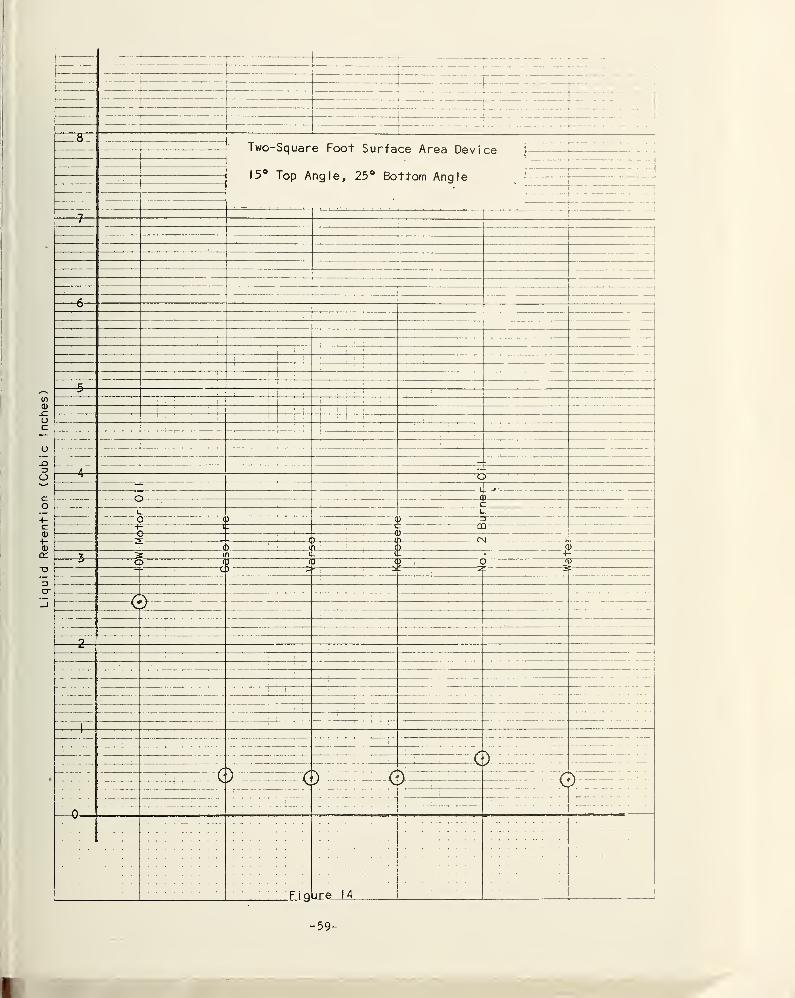
14 Two-Square-Foot Surface Area Device - 15° Top Angle, 25°
Bottom Angle 59
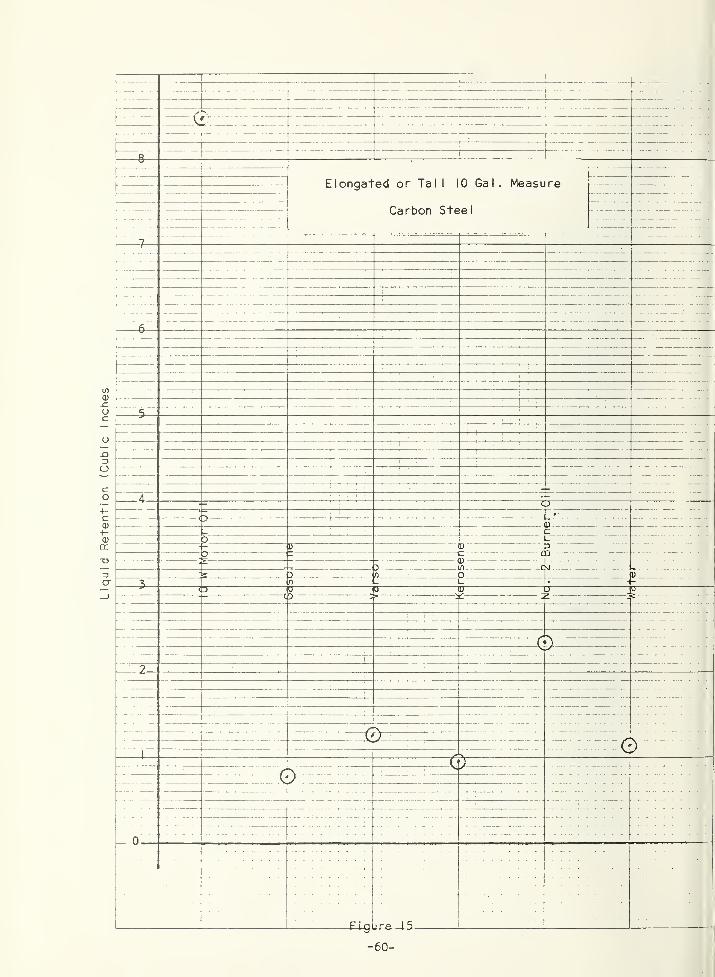
15 Elongated or Tall 10 Gallon Measure - Carbon Steel 60
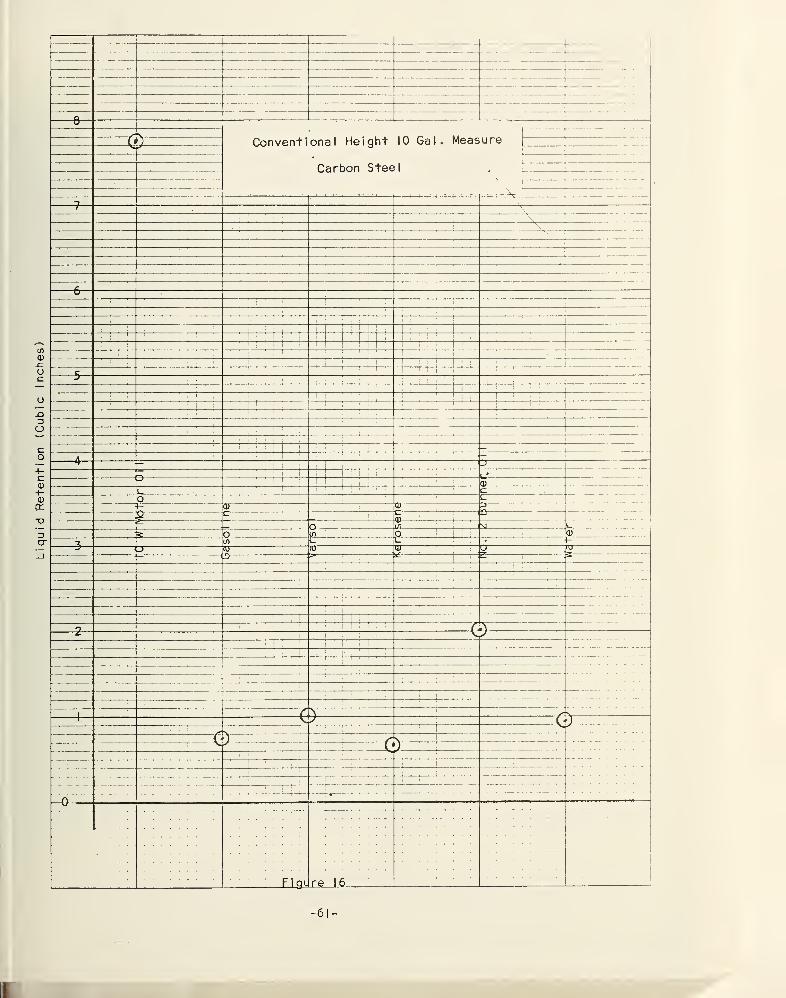
16 Conventional Height 10 Gallon Measure - Carbon Steel 61
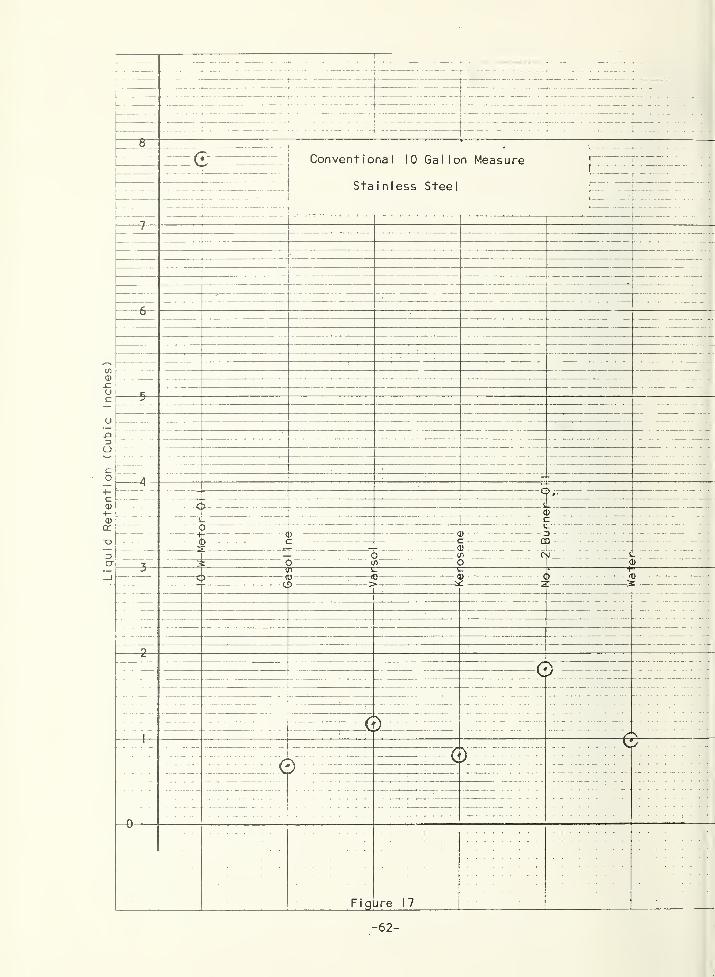
17 Conventional 10 Gallon Measure - Stainless Steel 62
18 Conventional 5 Gallon Measure - Stainless Steel 63
19 Conventional 5 Gallon Measure - Carbon Steel 64
20 Prototype 5-Gallon Measure - Stainless Steel 65
21 Bottom Drain 5-Gallon Field Test Measure 74
vi i i
LIST OF FIGURES (Cont'd)
FIGURE PAGE
22 Recommended Equipment Set-Up for Volume Calibration 84
23 Proper Draining Procedure for 5-Gallon Measure 88
24 Photograph of Prototype Test Measure
25 Meter Test Results 134
26 Meter Number Versus Meter Error Per 1000 Gallons 135
27 Meter Number Versus Difference in Meter Error 136

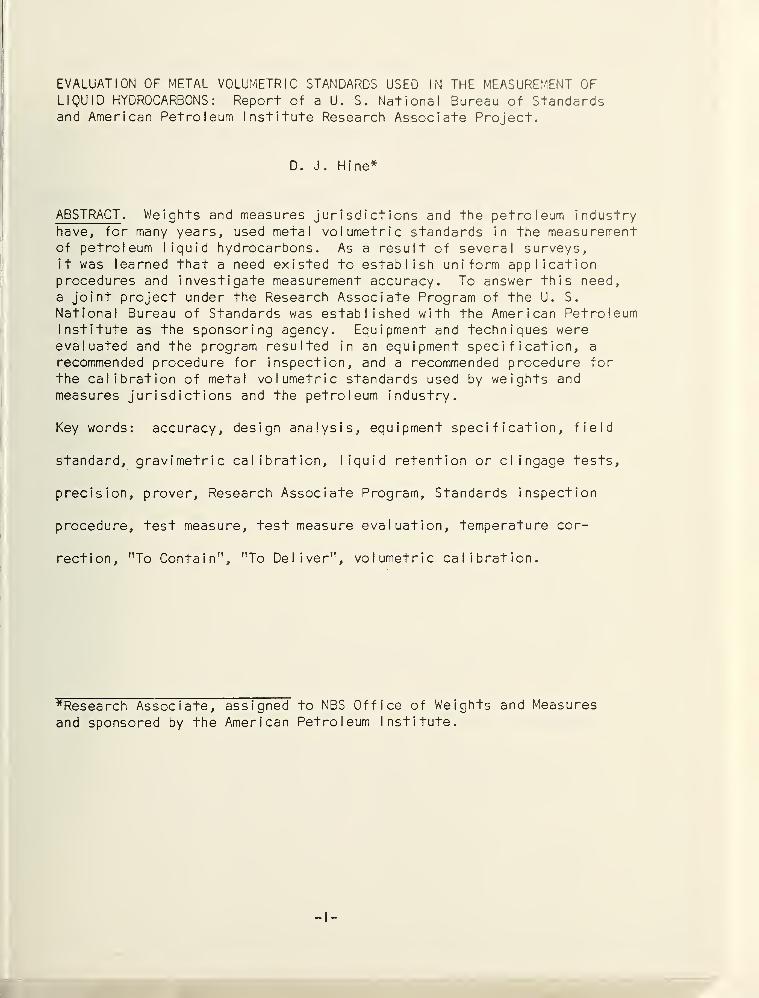
EVALUATION OF METAL VOLUMETRIC STANDARDS USED IN THE MEASUREMENT OFLIQUID HYDROCARBONS: Report of a U. S. National Bureau of Standardsand American Petroleum Institute Research Associate Project.
D. J. Hine*
ABSTRACT . Weights and measures jurisdictions and the petroleum industry
have, for many years, used metal volumetric standards in the measurementof petroleum liquid hydrocarbons. As a result of several surveys,it was learned that a need existed to establish uniform applicationprocedures and investigate measurement accuracy. To answer this need,
a joint project under the Research Associate Program of the U. S.
National Bureau of Standards was established with the American PetroleumInstitute as the sponsoring agency. Equipment and techniques wereevaluated and the program resulted in an equipment specification, a
recommended procedure for inspection, and a recommended procedure for
the calibration of metal volumetric standards used by weights and
measures jurisdictions and the petroleum industry.
Key words: accuracy, design analysis, equipment specification, field
standard, gravimetric calibration, liquid retention or cl ingage tests,
precision, prover. Research Associate Program, Standards inspection
procedure, test measure, test measure evaluation, temperature cor-
rection, "To Contain", "To Deliver", volumetric calibration.
^Research Associate, assigned to NBS Office of Weights and Measures
and sponsored by the American Petroleum Institute.
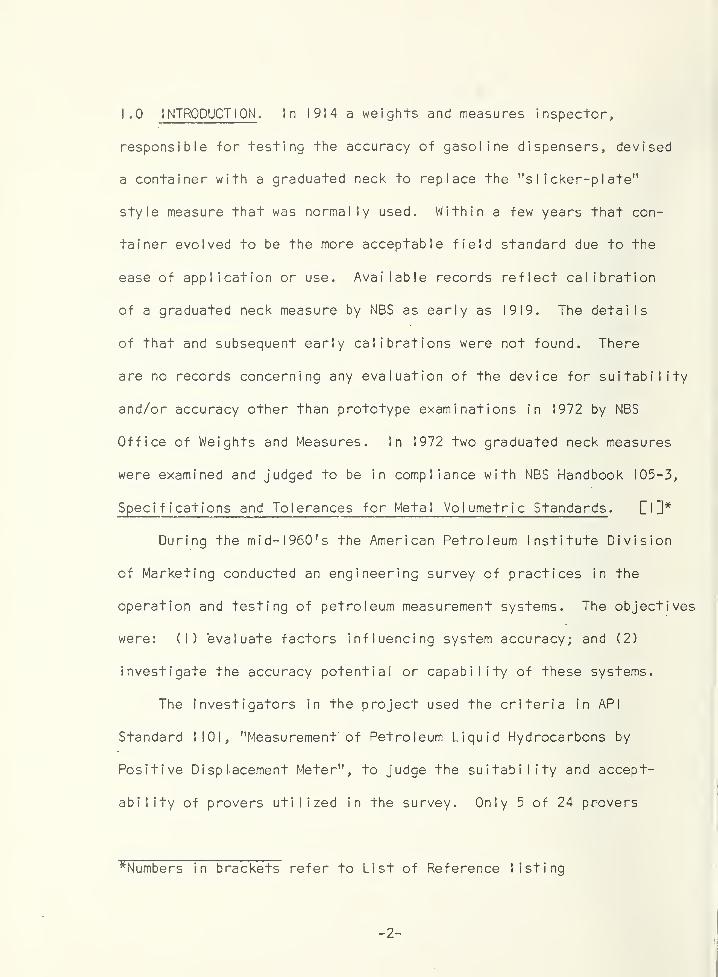
1.0 I NTRODUCTION. In 1914 a weights and measures inspector.
responsible for testing the accuracy of gasoline dispensers, devised
a container with a graduated neck to replace the "slicker-plate"
style measure that was normally used. Within a few years that con-
tainer evolved to be the more acceptable field standard due to the
ease of application or use. Available records reflect calibration
of a graduated neck measure by NBS as early as 1919. The details
of that and subsequent early calibrations were not found. There
are no records concerning any evaluation of the device for suitability
and/or accuracy other than prototype examinations in 1972 by NBS
Office of Weights and Measures. In 1972 two graduated neck measures
were examined and judged to be in compliance with NBS Handbook 105-3,
Specifications and Tolerances for Metal Volumetric Standards . [I
H*
During the mid-1960's the American Petroleum Institute Division
of Marketing conducted an engineering survey of practices in the
operation and testing of petroleum measurement systems. The objectives
were: (I) evaluate factors influencing system accuracy; and (2)
investigate the accuracy potential or capability of these systems.
The investigators in the project used the criteria in API
Standard 1101, "Measurement’ of Petroleum Liquid Hydrocarbons by
Positive Displacement Meter", to judge the suitability and accept-
ability of provers utilized in the survey. Only 5 of 24 provers
^Numbers in brackets refer to List of Reference listing
- 2 -
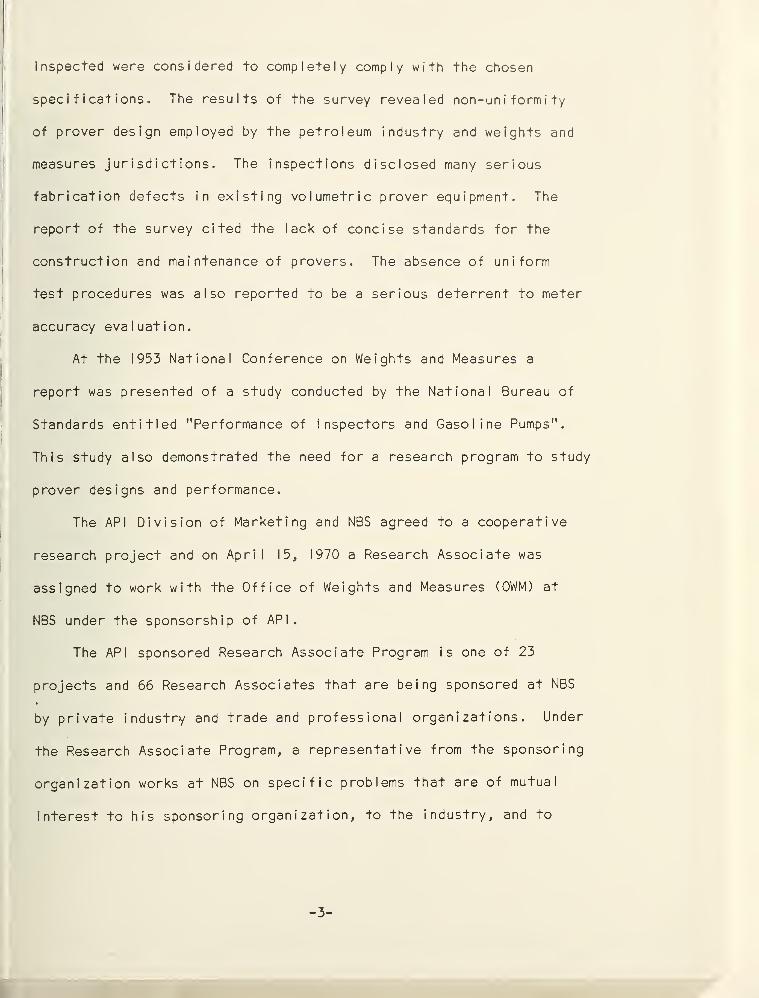
inspected were considered to completely comply with the chosen
specifications. The results of the survey revealed non-uniformity
of prover design employed by the petroleum industry and weights and
measures jurisdictions. The inspections disclosed many serious
fabrication defects in existing volumetric prover equipment. The
report of the survey cited the lack of concise standards for the
construction and maintenance of provers. The absence of uniform
test procedures was also reported to be a serious deterrent to meter
accuracy evaluation.
At the 1953 National Conference on Weights and Measures a
report was presented of a study conducted by the National Bureau of
Standards entitled "Performance of Inspectors and Gasoline Pumps".
This study also demonstrated the need for a research program to study
prover designs and performance.
The API Division of Marketing and NBS agreed to a cooperative
research project and on April 15, 1970 a Research Associate was
assigned to work with the Office of Weights and Measures (OWM) at
NBS under the sponsorship of API.
The API sponsored Research Associate Program is one of 23
projects and 66 Research Associates that are being sponsored at NBS
by private industry and trade and professional organizations. Under
the Research Associate Program, a representat i ve from the sponsoring
organization works at NBS on specific problems that are of mutual
interest to his sponsoring organization, to the industry, and to
- 3-
the Bureau. The Research Associate Programs, initiated by NBS in
1965, provide a valuable information exchange mechanism and promote
technology development.
- 4 -
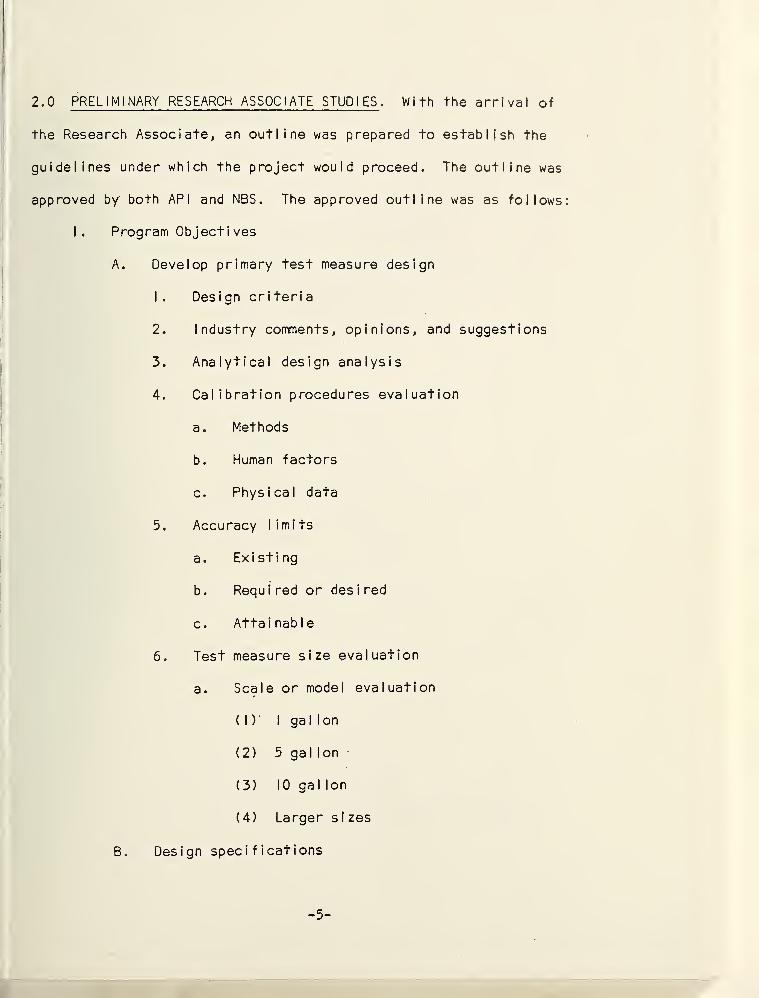
2.0 PRELIMINARY RESEARCH ASSOCIATE STUDIES. Wi+h the arrival of
the Research Associate, an outline was prepared to establish the
guidelines under which the project would proceed. The outline was
approved by both API and NBS. The approved outline was as follows
I. Program Objectives
A. Develop primary test measure design
1 . Design criteria
2. Industry comments, opinions, and suggestions
3. Analytical design analysis
4. Calibration procedures evaluation
a. Methods
b. Human factors
c. Physical data
5. Accuracy limits
a. Existing
Requ i red or des i red
Attai nab le
6. Test measure size evaluation
a. Scale or model evaluation
( 1 ) I gallon
(2) 5 ga I Ion •
(3) 10 gal Ion
(4) Larger s i zes
B. Design specifications
b.
c.
- 5 -
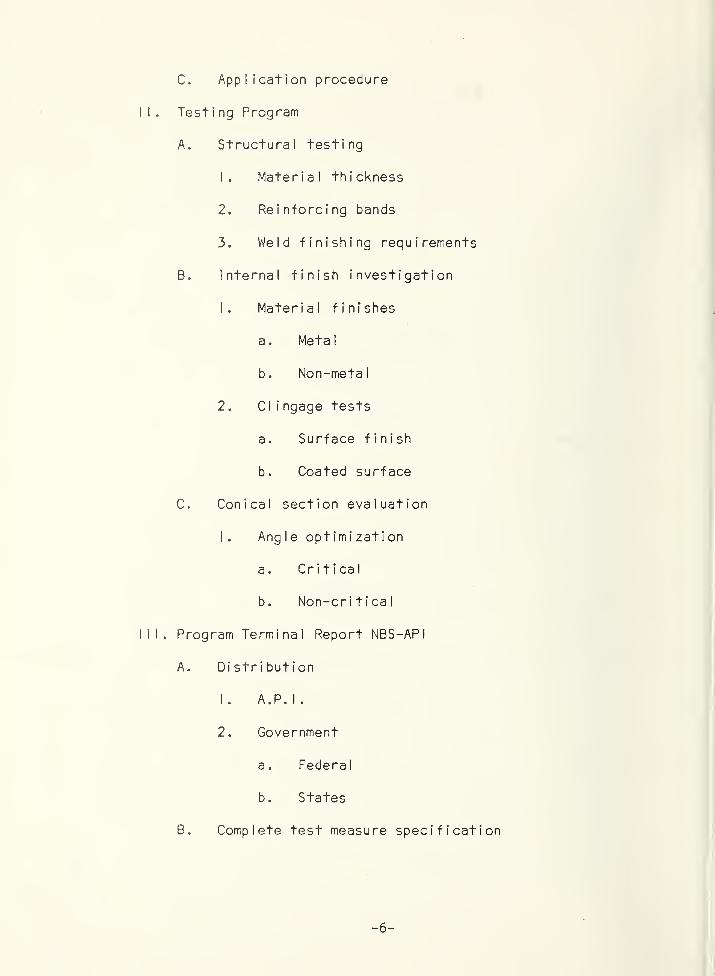
C. Application procedure
Testing Program
A. Structural testing
1 . Mater i a I th i ckness
2. Reinforcing bands
3. Weld finishing requirements
B. Internal finish investigation
1 . Mater i a I f i ni shes
a. Metal
b. Non-metal
2 . C I i ngage tests
a. Surface finish
b. Coated surface
C. Conical section evaluation
1 . Angle optimi zation
a. Critical
b. Non-critical
. Program Terminal Report NBS-API
A. Distribution
I . A . P . I .
2. Government
a. Federal
b. States
B. Complete test measure specification
-6 -
Materi a I
2. Geometric
3. Fabrication
4. Auxiliary permanent hardware
5. Finish
a. Internal
b. External
6. Inspection recommendations
C. Application procedure
I . Laboratory
To launch into a program of this type it was necessary to first
determine what information was available that might be applicable to
the project. Various reports and sTandards were studied with the
result being that a complete specification was non-existent and pro-
cedural write-ups were too general to establish uniform practices.
In an attempt to obtain needed material and information, a meeting
was held September 14, 1970 at NBS . Following are the minutes of that
meeti ng.
- 7 -
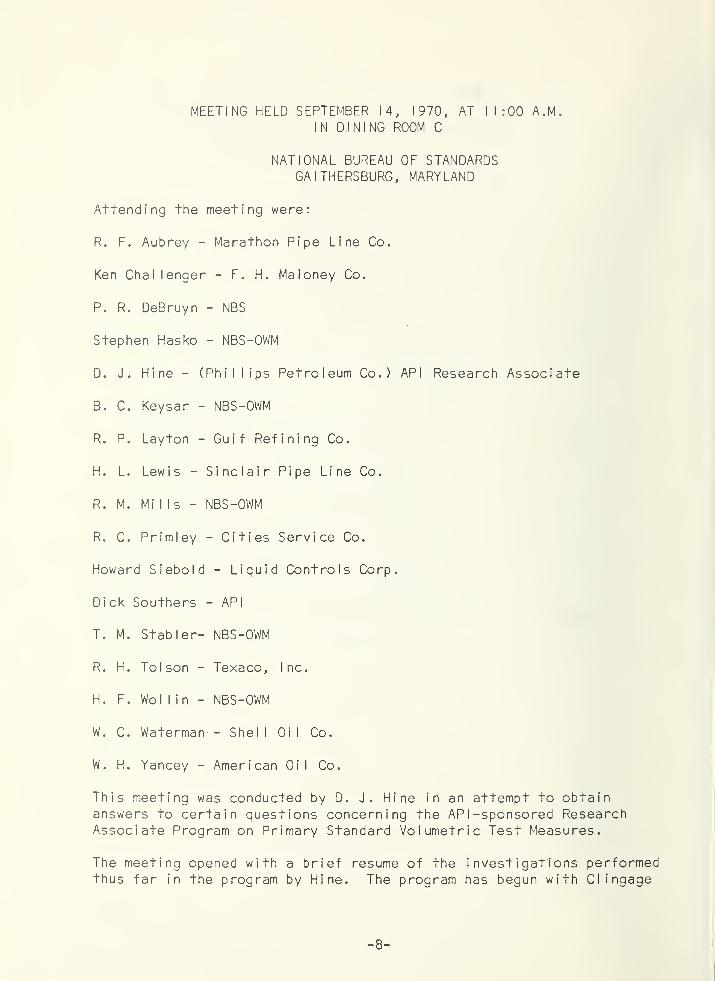
MEETING HELD SEPTEMBER 14, 1970, AT 11:00 A.M.
IN DJNING ROOM C
NATIONAL BUREAU OF STANDARDSGAITHERSBURG, MARYLAND
Attending the meeting were:
R. F. Aubrey - Marathon Pipe Line Co.
Ken Challenger - F. H. Maloney Co.
P. R. DeBruyn - NBS
Stephen Hasko - NBS-OWM
D. J. Hine - (Phillips Petroleum Co.) API Research Associate
B. C. Keysar - NBS-OWM
R. P. Layton - Gu i f Refining Co.
H. L. Lewis - Sinclair Pipe Line Co.
R. M. Mills- NBS-OWM
R. C. Primley - Cities Service Co.
Howard Siebold - Liquid Controls Corp.
Dick Southers - API
T. M. Stabler- NBS-OWM
R. H. Tolson - Texaco, Inc.
H. F. Wo II in - NBS-OWM
W. C. Waterman - Shel I Oi I Co.
W. H. Yancey - American Oil Co.
This meeting was conducted by D. J. Hine in an attempt to obtainanswers to certain questions concerning the AP I -sponsored ResearchAssociate Program on Primary Standard Volumetric Test Measures.
The meeting opened with a brief resume of the investigations performedthus far in the program by Hine. The program has begun with Cl ingage
-8-
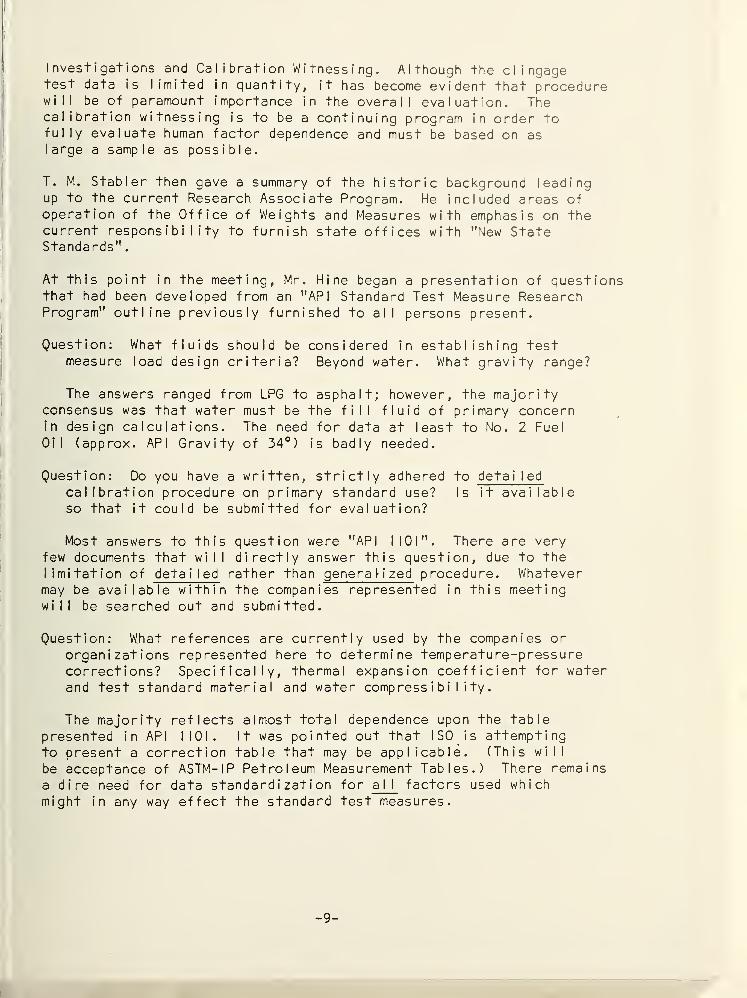
Investigations and Calibration Witnessing. Although the cl ingagetest data is limited in quantity, it has become evident that procedurewill be of paramount importance in the overall evaluation. Thecalibration witnessing is to be a continuing program in order tofully evaluate human factor dependence and must be based on aslarge a sample as possible.
T. M. Stabler then gave a summary of the historic background leadingup to the current Research Associate Program. He included areas ofoperation of the Office of Weights and Measures with emphasis on thecurrent responsibility to furnish state offices with "New StateStandards"
.
At this point in the meeting, Mr. Hine began a presentation of questionsthat had been developed from an "API Standard Test Measure ResearchProgram" outline previously furnished to all persons present.
Question: What fluids should be considered in establishing testmeasure load design criteria? Beyond water. What gravity range?
The answers ranged from LPG to asphalt; however, the majorityconsensus was that water must be the fill fluid of primary concernin design calculations. The need for data at least to No. 2 Fuel
Oil (approx. API Gravity of 34°) is badly needed.
Question: Do you have a written, strictly adhered to deta i I ed
calibration procedure on primary standard use? Is it availableso that it could be submitted for evaluation?
Most answers to this question were "API 1101". There are very
few documents that will directly answer this question, due to thelimitation of deta i I ed rather than genera I- i zed procedure. Whatevermay be available within the companies represented in this meetingwill be searched out and submitted.
Question: What references are currently used by the companies or
organizations represented here to determine temperature-pressurecorrections? Specifically, thermal expansion coefficient for waterand test standard material and water compressibility.
The majority reflects almost total dependence upon the tablepresented in API 1101. It was pointed out that ISO is attemptingto present a correction table that may be applicable. (This will
be acceptance of ASTM-IP Petroleum Measurement Tables.) There remains
a dire need for data standardization for a I I factors used which
might in any way effect the standard test measures.
-9-
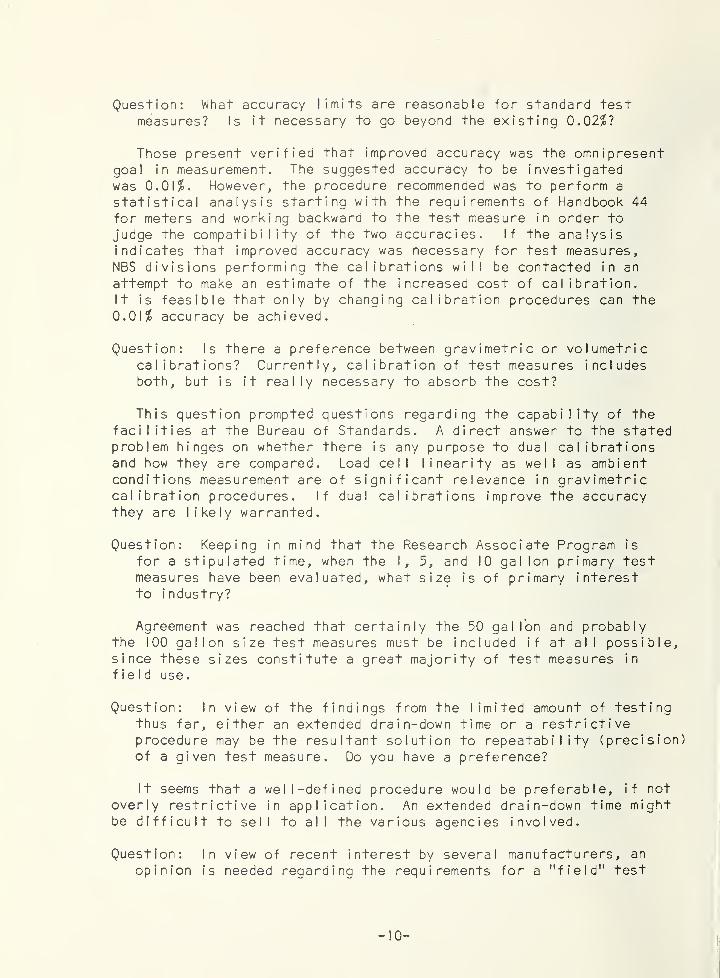
Question: What accuracy limits are reasonable for standard test
measures? Is it necessary to go beyond the existing 0.02$?
Those present verified that improved accuracy was the omnipresentgoal in measurement. The suggested accuracy to be investigatedwas 0.01%. However, the procedure recommended was to perform a
statistical analysis starting with the requirements of Handbook 44
for meters and working backward to the test measure in order to
judge the compatibility of the two accuracies. If the analysisindicates that improved accuracy was necessary for test measures,NBS divisions performing the calibrations will be contacted in an
attempt to make an estimate of the increased cost of calibration.It is feasible that only by changing calibration procedures can the
0.01$ accuracy be achieved.
Question: Is there a preference between gravimetric or volumetriccalibrations? Currently, calibration of test measures includesboth, but is it really necessary to absorb the cost?
This question prompted questions regarding the capability of the
facilities at the Bureau of Standards. A direct answer to the statedproblem hinges on whether there is any purpose to dual calibrationsand how they are compared. Load cell linearity as well as ambientconditions measurement are of significant relevance in gravimetriccalibration procedures. If dual calibrations improve the accuracythey are likely warranted.
Question: Keeping in mind that the Research Associate Program is
for a stipulated time, when the I, 5, and 10 gallon primary testmeasures have been evaluated, what size is of primary interestto industry?
Agreement was reached that certainly the 50 gallon and probablythe 100 gallon size test measures must be included if at all possible,since these sizes constitute a great majority of test measures in
field use.
Question: In view of the findings from the limited amount of testingthus far, either an extended drain-down time or a restrictiveprocedure may be the resultant solution to repeatability (precision)of a given test measure. Do you have a preference?
It seems that a well-defined procedure would be preferable, if not
overly restrictive in application. An extended drain-down time mightbe difficult to sell to all the various agencies involved.
Question: In view of recent interest by several manufacturers, an
opinion is needed regarding the requirements for a "field" test
- 10 -
measure that would not be calibration quality. It would be1
another generation removed from standard.
Wollin indicated that some states are contemplating droppingroutine checking, and in so doing will transfer the liability foraccuracy to the service station operator or owner and perform onlyinvestigative sampling. This would certainly encourage the operatoror owner to purchase a test measure which would make the availabilityof a low-cost measure desirable.
It was generally agreed that the availability might be warrantedbut the market was not a receptive one. The market will exist onlyif and when the inspecting jurisdictions make it necessary.
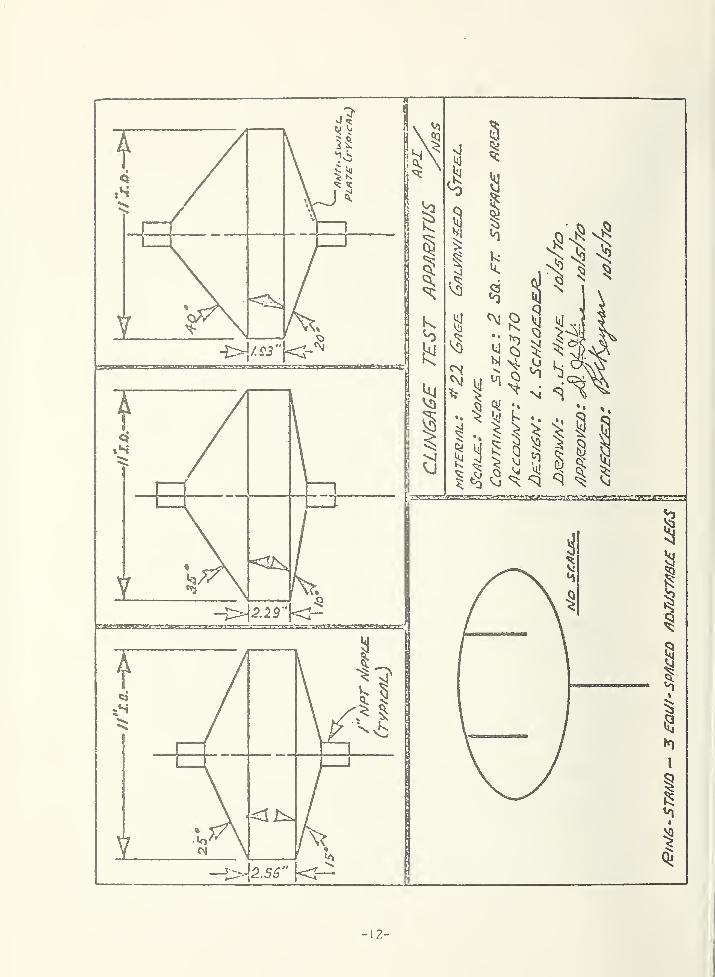
SERAPH IN TEST MEASURE CL INGAGE HARDWARE PROPOSAL
(See Drawing)
Question: Are top and bottom angles sufficiently representative?
It was agreed that possibly an angle less than 15° should be
included. The top and bottom designs could be made identical by
eliminating the 4" top neck and installing a coupling instead.This minor change would allow the angles to serve as either top orbottom depending on how installed.
Question: Does testing with this type of device have any merit?
Since it would facilitate possibly optimizing prover and testmeasure design, it has definite potential significance.
Question: What liquids should be used for the tests?
It would be desirable to include Kerosene and/or No. 2 Fuel Oil.
Question: Where, if testing with other than water?
Mr.' DeBruyn pointed out that the Hazards Laboratory here at the
Bureau might be made available. This possibility will be investigated.
Additional items brought up during the meeting were as follows:
1. Need for a Measurement Terminology Standard.
2. Interpolation procedure is needed for extending a "WaterCalibrated" test measure to other fluids. No. 2 Fuel Oil
is of particular interest.
The need for standardization of recalibration intervals
-I I-
3.
- 12 -
for test measures and prover tanks.
4. Larger capacity ( non- i nverted ) measures are calibrated withnipple-elbow-pipe combination attached to the drain valve,whereas in application, field calibrations are rarely per-formed with a similar flow restriction. The effect of therestrictions on cl ingage should be investigated.
5. Incremental scale maximum allowance may be too lax at 5 cubicinches. In the interest of improved accuracy, the maximumallowable division might be reduced to 2 cubic inches.
The answers to at least some of these questions could feasibly be
a residual benefit of the Research Associate Program as it is now
outlined. Attention will be given to these and additional questionsas the program progresses.
Meeting adjourned - 3:00 P.M.
- 13-
The answers and discussions of questions did not yield direct
solutions to the defined problem areas presented but did provide
information concerning the areas of interest where additional re-
search is required. The meeting provided additional indication
that standard test procedures and equipment specifications are
virtually non-existent and the concensus of those in attendance was
that they are badly needed.
- 14 -
3.0 DES I GN ANALYS I
S
. An analysis was performed to theoretically
predict the performance of two specific areas of a test measure.
The areas of interest were the lateral or cylindrical sides and the
bottom of a measure. The dimensions required for the calculations
were assumed to equal the minimum values appearing in NBS Handbook
105-3, Specifications and Tolerances for Metal Volumetric Field
Standards . [I
H
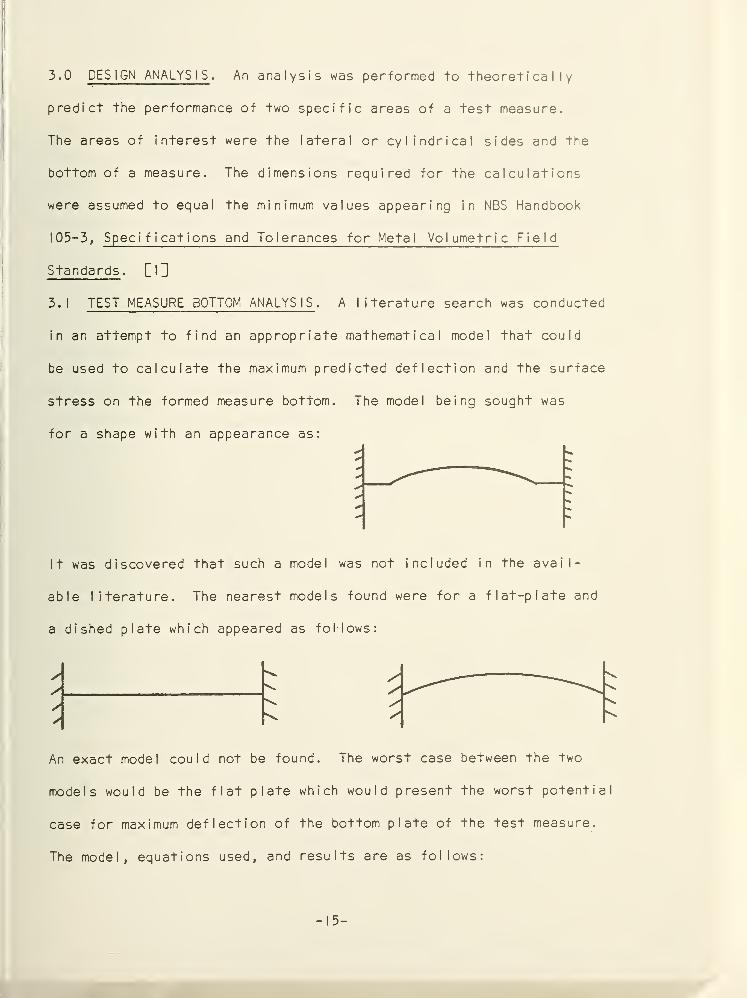
3.1 TEST MEASURE BOTTOM ANALYSIS . A literature search was conducted
in an attempt to find an appropriate mathematical model that could
be used to calculate the maximum predicted deflection and the surface
stress on the formed measure bottom. The model being sought was
for a shape with an appearance as:
It was discovered that such a model was not included in the avail-
able literature. The nearest models found were for a flat-plate and
a dished plate which appeared as follows:
An exact model could not be found. The worst case between the two
models would be the flat plate which would present the worst potential
case for maximum deflection of the bottom plate of the test measure.
The model, equations used, and results are as follows:
- 15 -
7777
PROBLEM:
GIVEN:
ASSUMPTIONS:
SOLUTION:
CONCLUSIONS:
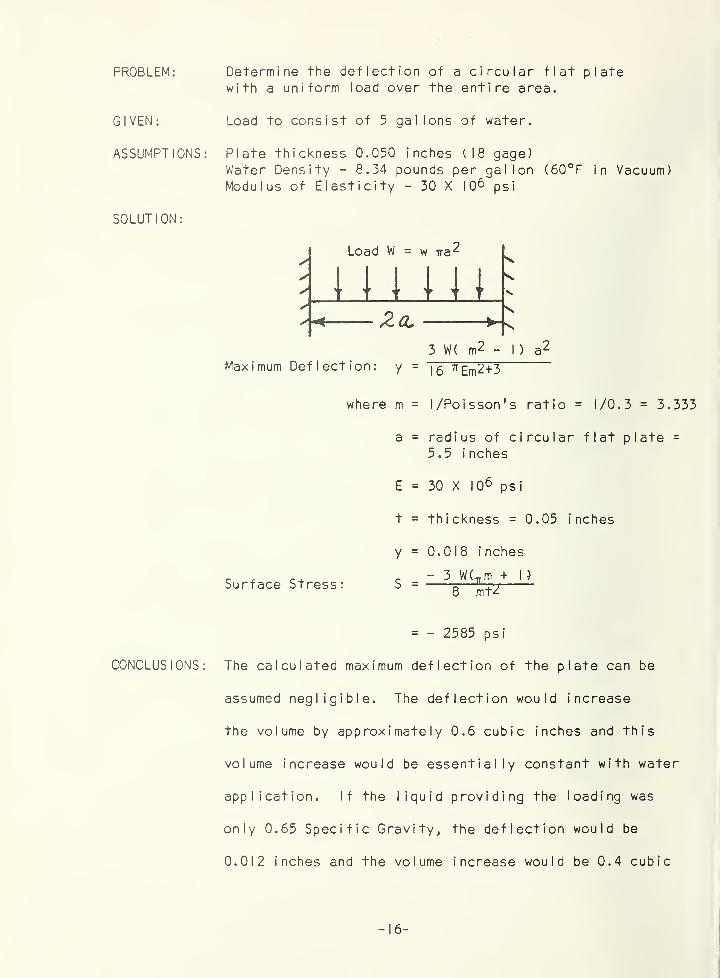
Determine the deflection of a circular flat platewith a uniform load over the entire area.
Load to consist of 5 gal Ions of water.
Plate thickness 0.050 inches (18 gage)
Water Density - 8.34 pounds per gallon (60°F in Vacuum)Modulus of Elasticity - 30 X 1 0& p s
i
Maximum Deflection: y
where m
a
E
t
y
Surface Stress: S
16 TT Em2+3
= l/Poisson fs ratio = 1/0.3 = 3.333
= radius of circular flat plate =
5.5 inches
= 30 X I0 6 psi
= thickness = 0.05 inches
= 0.018 inches
- 3 WC^m + I )
8 mT2
= - 2585 psi
The calculated maximum deflection of the plate can be
assumed negligible. The deflection would increase
the volume by approximately 0.6 cubic inches and this
volume increase would be essentially constant with water
application. If the liquid providing the loading was
only 0.65 Specific Gravity, the deflection would be
0.012 inches and the volume increase would be 0.4 cubic
- 16 -
inches. The net change for the example comparing a
water-calibrated device when used to measure a 0.65
gravity liquid is 0.2 cubic inches. For a gasoline
application, (assuming 0.7 specific gravity) the
volume change would be approximately 0.2 cubic inches.
With a 7.0 cubic inch tolerance the volume change of
0.2 cubic inches would represent approximately 3
percent of the total tolerance.
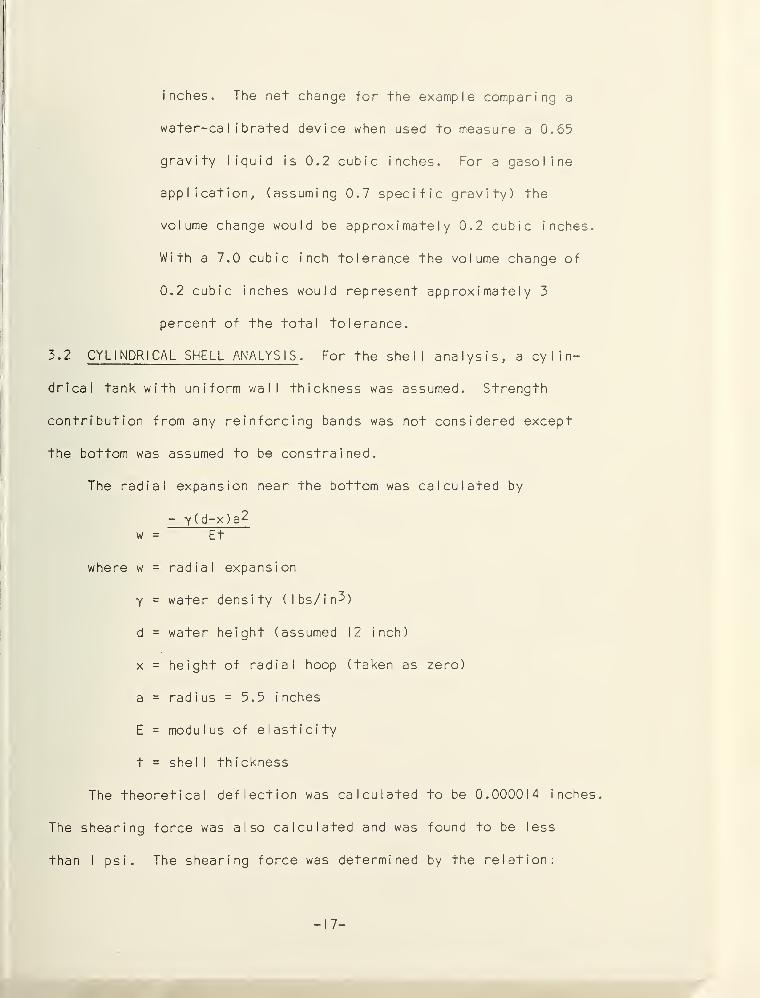
3.2 CYLINDRICAL SHELL ANALYSIS . For the shell analysis, a cylin-
drical tank with uniform wall thickness was assumed. Strength
contribution from any reinforcing bands was not considered except
the bottom was assumed to be constrained.
The radial expansion near the bottom was calculated by
- y(d-x)a2w = Et
where w = radial expansion
y = water density (Ibs/in^)
d = water height (assumed 12 inch)
x = height of radial hoop (taken as
a = radius = 5.5 inches
E = modulus of elasticity
t = she I I th i ckness
The theoretical deflection was calculated
The shearing force was also calculated and was
than I psi. The shearing force was determined
zero)
to be 0.000014 inches,
found to be less
by the relation:
- 17-
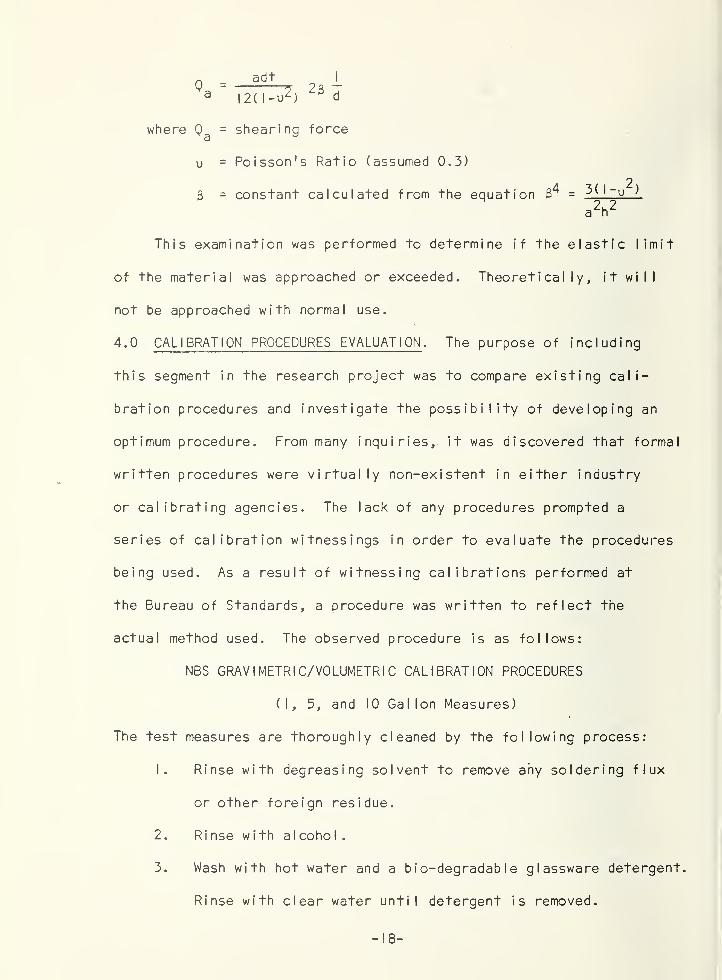
where Q = shearing force
u
6
Poisson's Ratio (assumed 0.3)
constant calculated from the equation B^ =
This examination was performed to determine if the elastic limit
of the material was approached or exceeded. Theoretically, it will
not be approached with normal use.
4.0 CALIBRATION PROCEDURES EVALUATION . The purpose of including
this segment in the research project was to compare existing cali-
bration procedures and investigate the possibility of developing an
optimum procedure. From many inquiries, it was discovered that formal
written procedures were virtually non-existent in either industry
or calibrating agencies. The lack of any procedures prompted a
series of calibration witnessings in order to evaluate the procedures
being used. As a result of witnessing calibrations performed at
the Bureau of Standards, a procedure was written to reflect the
actual method used. The observed procedure is as follows:
NBS GRAVIMETRIC/VOLUMETRIC CALIBRATION PROCEDURES
(I, 5, and 10 Gallon Measures)
The test measures are thoroughly cleaned by the following process:
1. Rinse with degreasing solvent to remove any soldering flux
or other foreign residue.
2. Rinse with alcohol.
3. Wash with hot water and a bio-degradable glassware detergent.
Rinse with clear water until detergent is removed.
- 18-
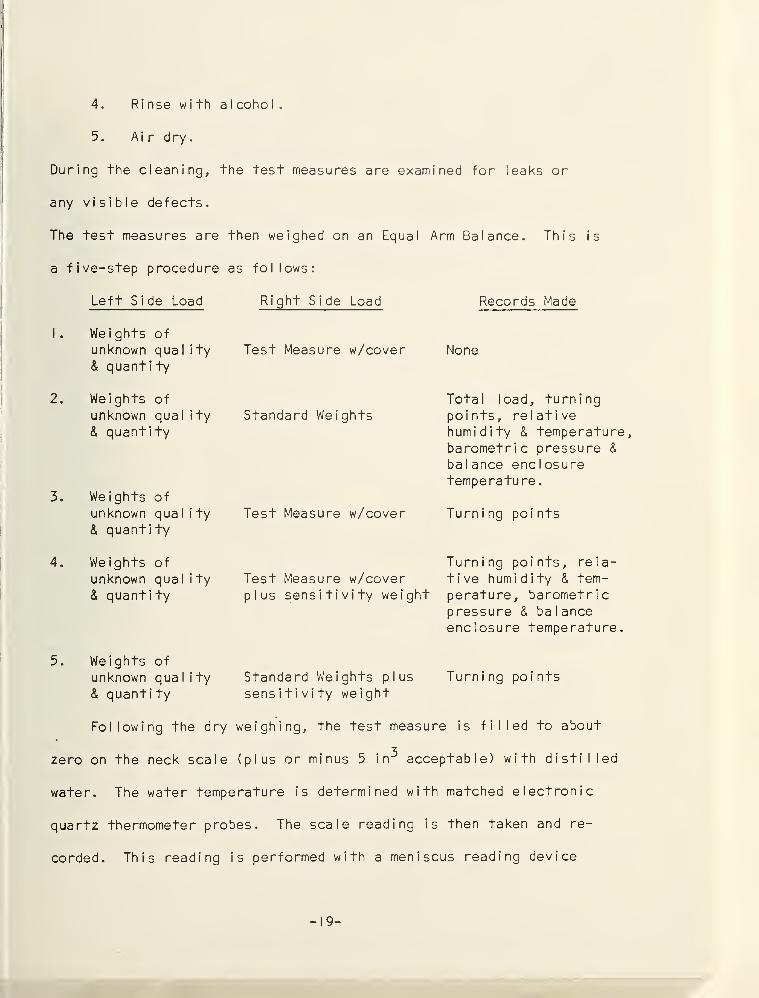
4. Ri nse with a I coho I
.
5. Air dry
.
During the cleaning, the test measures are examined for leaks or
any visible defects.
The test measures are then weighed on an Equal Arm Balance. This is
a five-step procedure as follows:
Left Side Load Right Side Load Records Made
I . Weights of
unknown qual
& quantityity Test Measure w/cover None
2. Weights of Total load, turningunknown qual ity Standard Weights points, relative
& quantity humidity & temperaturebarometric pressure &
balance enclosuretemperature.
3. Weights of
unknown qual
& quantityity Test Measure w/cover Turning points
4. Weights of Turning points, rela-
unknown qual ity Test Measure w/cover tive humidity & tem-
& quantity plus sensitivity weight perature, barometricpressure & balanceenclosure temperature.
5. Weights of
unknown qual ity Standard Weights plus Turning points
& quantity sensitivity weight
Following the dry weighing, the test measure is filled to about
zero on the neck scale (plus or minus 5 in^ acceptable) with distilled
water. The water temperature is determined with matched electronic
quartz thermometer probes. The scale reading is then taken and re-
corded. This reading is performed with a meniscus reading device
- 19-
that has a pair of crosshairs which aid in maintaining the eye
level with meniscus if properly used. This also magnifies the
scale, thereby enhancing estimation of the nearest one-tenth scale
division.
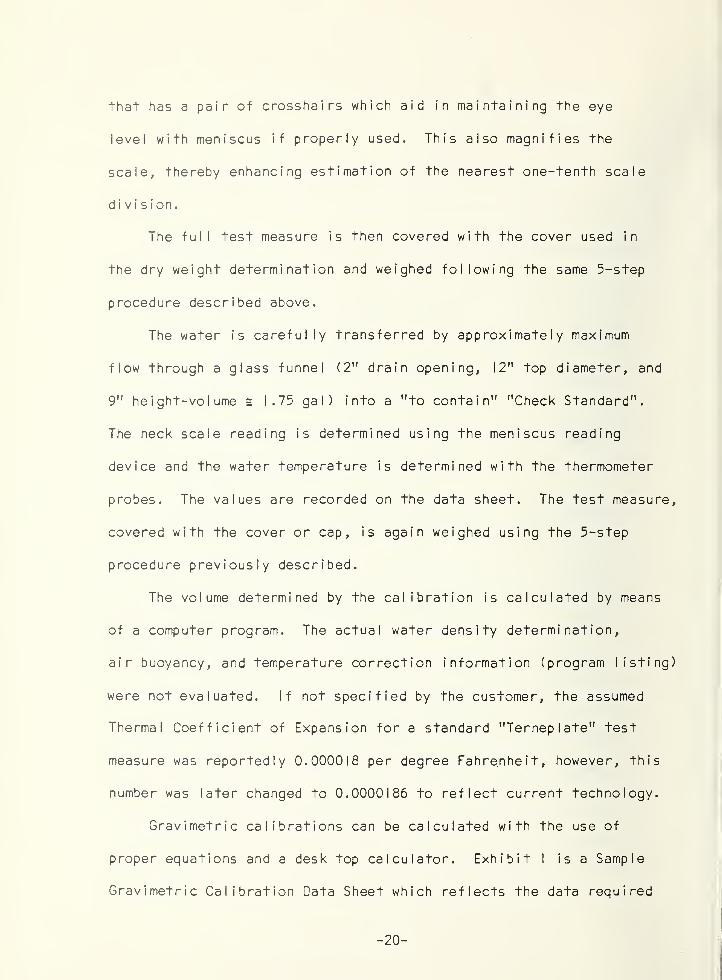
The full test measure is then covered with the cover used in
the dry weight determination and weighed following the same 5-step
procedure described above.
The water is carefully transferred by approximately maximum
flow through a glass funnel (2" drain opening, 12” top diameter, and
9" height-volume = 1.75 gal) into a "to contain" "Check Standard".
The neck scale reading is determined using the meniscus reading
device and the water temperature is determined with the thermometer
probes. The values are recorded on the data sheet. The test measure,
covered with the cover or cap, is again weighed using the 5-step
procedure previously described.
The volume determined by the calibration is calculated by means
of a computer program. The actual water density determination,
air buoyancy, and temperature correction information (program listing)
were not evaluated. If not specified by the customer, the assumed
Thermal Coefficient of Expansion for a standard "Terneplate" test
measure was reportedly 0.000018 per degree Fahrenheit, however, this
number was later changed to 0.0000186 to reflect current tecnnology.
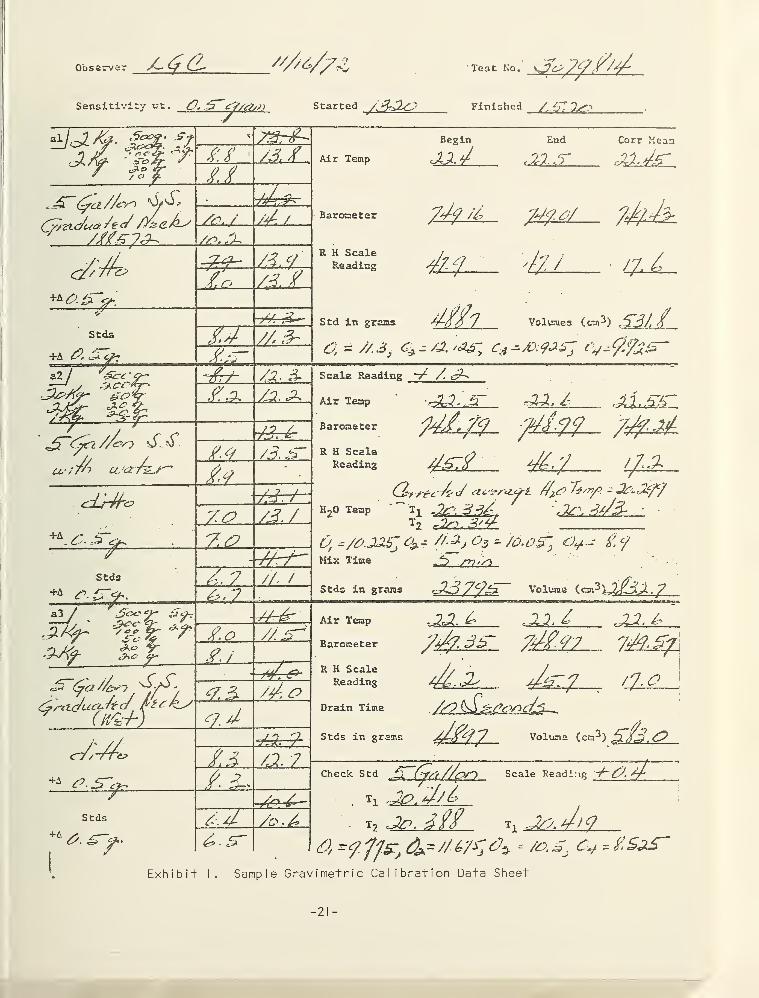
Gravimetric calibrations can be calculated with the use of
proper equations and a desk top calculator. Exhibit I is a Sample
Gravimetric Calibration Data Sheet which reflects the data required
-20 -
Observe Teat No.’
Sensitivity vt. £j//cZ/n Started X Finished /
- 21 -
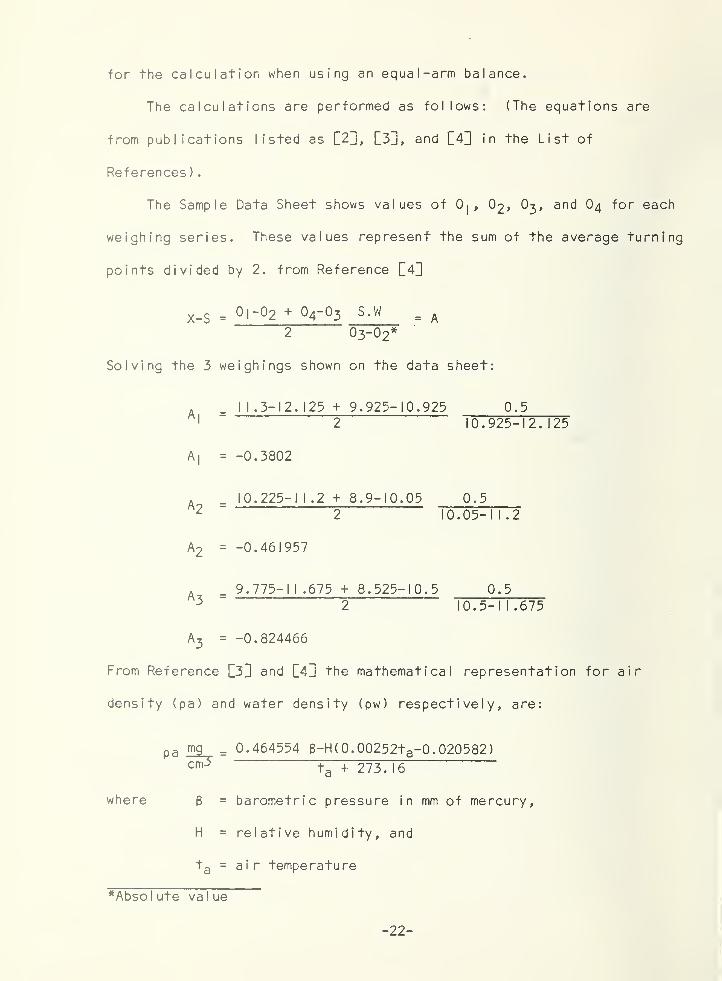
for the calculation when using an equal -arm balance.
The calculations are performed as follows: (The equations are
from publications listed as Q2]], L3H , and in the List of
References )
.
The Sample Data Sheet shows values of 0| , O 2 , O3 , and O 4 for each
weighing series. These values represent the sum of the average turning
points divided by 2. from Reference
X-S = <-) l“^2 + S.W _ ^2 O3-O2
*
Solving the 3 weighings shown on the data sheet:
. _ I I .3-12. 125 + 9.925-10.925 0.51 2 10.925-12.125
A|
= -0.3802
A _ _ 10.225-1 I .2 + 8.9-10.05 0.52 2 10. 05-11.
2
A 2 = -0.461957
A 9.775-11 .675 + 8.525-10.5 0.53 2 10. 5-11. 675
A3
= -0.824466
From Reference [3'H and C4 U the mathematical representation for air
density (pa) and water density (pw) respectively, are:
pa mg^ = 0.464554 g-H(0.00252ta-0. 020582)c™5 ta + 273.16
where 8 = barometric pressure i n mm of mercury,
H = relative humidity, and
t a = air temperature
*Abso I ute va I ue
-22 -
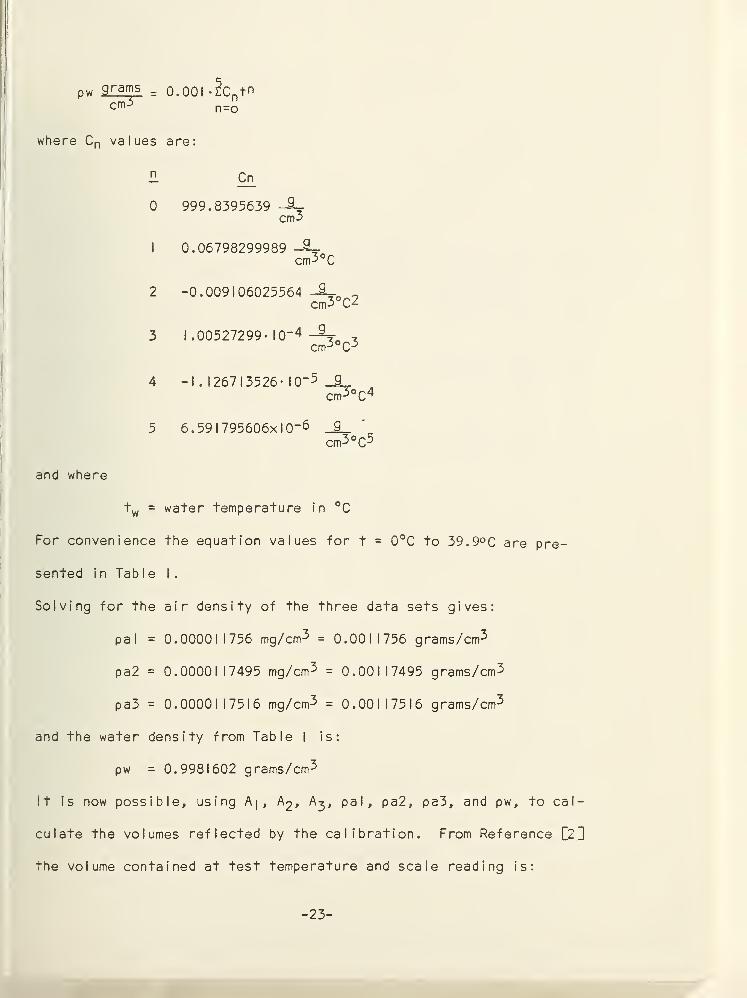
pw 9 ran;
s = 0.001 *ZCn +
n
cm3 n=o
where C n values are:
H Cn
0 999.8395639cm3
1 0.06798299989 -S_cm 3 °C
2 -0.009106025564 -2_ 0cm3°c2
3 I .00527299- I0“ 4 -Kn ,cm3o C 3
4 -I . 126713526- I0~ 5 9,^°C4
5 6. 59 1 795606x10~6 _2_
cm3 °C3
and where
tw = water temperature in °C
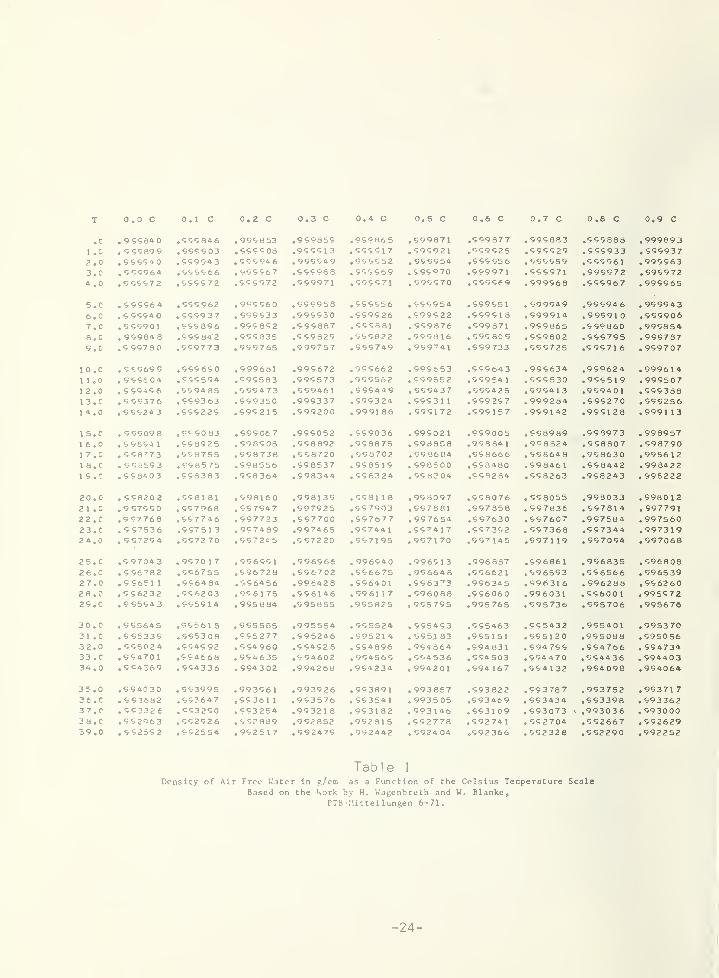
For convenience the equation values for t = 0°C to 39.9°C are pre-
sented in Table I
.
Solving for the air density of the three data sets gives:
pal = 0.000011756 mg/cm 3 = 0.0011756 grams/cm3
pa2 = 0.0000117495 mg/cm 3 = 0.00117495 grams/cm 3
pa3 = 0.00001 17516 mg/cm3 = 0.001 17516 grams/cm3
and the water density from Table I is:
pw = 0.9981602 grams/cm3
It is now possible, using A|, A 2 , A^, pal, pa2, pa3, and pw, to cal-
culate the volumes reflected by the calibration. From Reference [21
the volume contained at test temperature and scale reading is:
-23-
T 0.0 c 0.1 C 0.2 C 0.3 C 0. 4 C 0.5 C 0.6 C 0.7 C 0.8 C 0.9 C
.e .95534 0 .559846 . 995853 .999859 .959865 .599871 .559877 .595883 .555888 .9998931 .c . 95589 9 .555503 .559508 .95551
3
.555517 .599921 .999525 .595529 .555933 . 5959372.0 .55554 0 .559943 . 50505.6 .995549 .995552 . 595954 .555556 .555559 .555961 . 9999633.0 .59596 4 .555566 .995567 .995968 . 955569 . 595970 .599971 .595971 .995972 . 5959724 .0 .55557 2 .555972 .599972 .559971 .599971 . 595570 .559569 .999968 .555967 . 999965
s.c .55556 4 .555962 .955560 .599958 .555556 . 955554 .599551 . 599949 .995946 . 9599436. C .55594 O .555937 . 555533 .995530 .559526 .599922 .559518 .999914 .995910 .5559067.C .55590 1 .955896 . 955852 .595887 .595881 .599876 .599871 .959865 .599860 . 999854e.c .95984 8 .555842 .595335 .559829 .955822 .999816 .595 805 .959802 .955795 .9997875.C .5 9978 0 .599773 .999765 .999757 .955749 . 959741 .599733 .999725 .995716 . 959707
10.C .59969 5 .595690 .599681 .995672 .995662 . 599653 .555643 .995634 .959624 .9996 14
11.0 .55560 4 .955594 .999583 .595573 .995562 .999552 .55954
1
.595530 .955519 . 9995071 2 .0 .55545 6 .559485 .955473 .559461 .599449 , 555437 .595425 .59541
3
.959401 .5553881 3.C .55537 6 .559363 .559350 .999337 .595324 .55531
1
.559257 . 999284 .595270 .59525614.0 .55524 3 .555225 .595215 .999200 .9991 86 . 5951 72 .595157 .999142 .995128 .9991 13
1 5.C . 55509 8 .995083 .595067 .995052 . 959036 . 995021 .999005 .998989 .598973 . 99895716.0 .59854 1 .958925 . 598908 .958892 .958875 . 598858 .99884
1
.998824 .558807 .59879017.C .558 7 7 3 .558755 .958738 .558720 .558702 .998684 .558666 .556648 .958630 .9986121 8.C . 5 5655 3 .558575 .598556 .598537 .958515 . 998500 .558480 .99846
1
.558442 .99842219.C .55860 3 .558383 .998364 .998344 .596324 . 5583 04 .959284 .558263 .958243 . 998222
2 0.0 . 55820 2 .5981 81 .598160 .998139 .5581 1
8
.958097 .558076 . 558055 .993033 .5980122 1 .0 .95755 O .557968 .597947 .597925 .557003 . 557681 .997358 .997836 .557814 . 9977912 2 .0 .59776 8 .557746 . 597723 .557700 .557677 . 997654 .997630 .597607 .957584 . 99756023.
C
. 5 5753 6 .55751
3
. 997489 .997465 .957441 .597417 .557392 .557368 .557344 . 99731924.0 . 55729 4 .5572 70 .5572*5 .597220 .557195 . 997 1 70 .557145 .5971 19 .957094 . 597068
25.
C
.5 9704 3 .957017 .956551 .996566 . 996540 .996513 .996887 .596861 .956835 .59680826.0 .55678 2 .556755 .596728 .556702 .556675 .996648 .556621 .596593 .556566 .99653927.0 .55651 1 .556484 .556456 .996428 . 556401 .556373 .996345 .596316 .596288 .55626028.0 .55623 2 .9962 03 . 9561 75 .5561 46 .9961 1
7
.596088 .596060 .996031 .956001 , 99557225.0 .55594 3 .955914 .995884 .595855 .995825 . 955795 .995765 .995736 .595706 .995676
30.0 .55564 5 .99561
5
.955585 .995554 . 995524 . 595453 .555463 .955432 .955401 .99537031 .0 .55533 5 .59S308 .955277 .595246 . 995214 . 595.1 83 .995151 .555120 .955088 .59505632.0 .55502 4 .954592 .554960 .554523 . 554896 . 954864 .994831 . 594755 .954766 . 59473433 .0 .59470 1 .554668 .994635 .994602 .994565 .594536 .594 503 .994470 .554436 . 59440334.0 .56436 9 . 954336 .594302 .994268 . 954234 » 994201 .594 167 .554132 .954098 .994064
35.0 .59403 O . 553995 .993561 .993926 . 953891 . 993857 .593822 .993787 .953752 .99371736.
C
.553682 .553647 .55361
1
.953576 . 953541 . 993505 .593469 . 593434 .553398 . 59336237.0 .59332 6 .653250 .993254 .99321
8
.953182 .993146 .553109 .593073 .993036 . 99300038.
C
.55296 3 .552926 .992839 .952852 .952315 .552778 .592741 . 552704 .992667 .99262939.0 .95255 2 .952554 . 95251
7
. 992479 . 992442 . 5924 04 .592 366 . 552328 .552290 .992252
Table 1
Density of Air Free Water in
Based on the
g/em as a Function of the Celsius TemperatureWork by H. Wagenbreth and W. Blanke„
FTB-Mitteilungen 6-71,
Scale
24
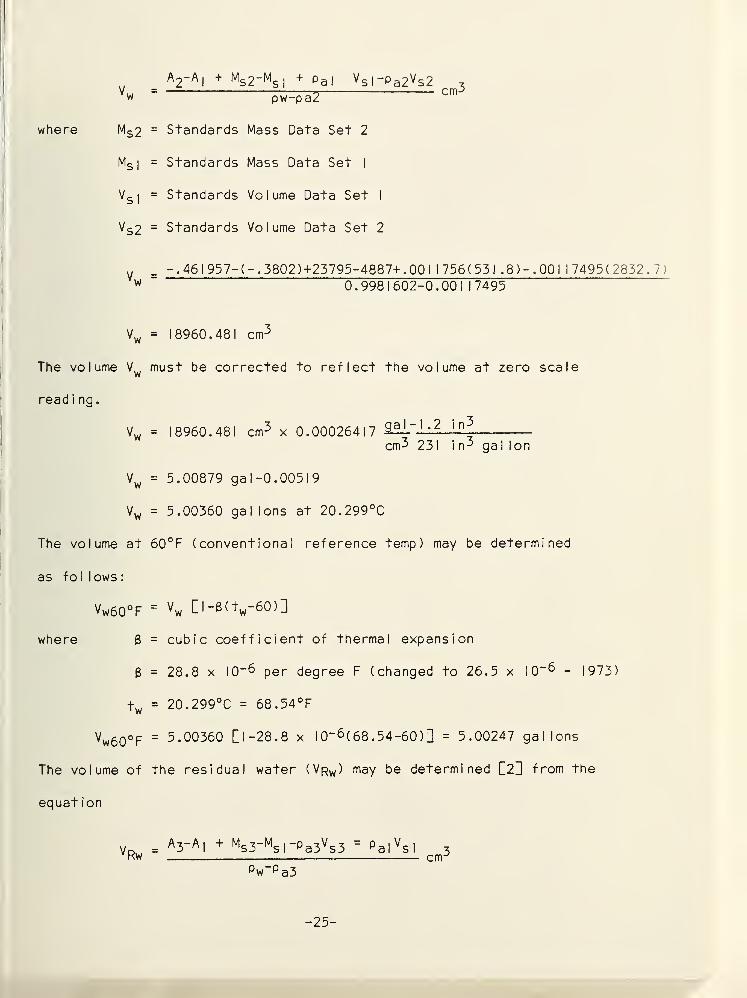
V w:
A2-A| + M s 2-Ms ,
+ p a |
V s |-p a2 V s2= cm3
where M s 2:= Standards Mass Data Set 2
Ms 1
:= Standards Mass Data Set 1
vsl
:= Standards Volume Data Set 1
V S 2== Standards Volume Data Set 2
vw:
-.46 1 957- (- .3802) +2 37 95-4 887+. 00 1 1756(531 .8)-. 001 17495(2832.7)0.9981602-0.001 17495
vw= 18960.481 cm3
The volume V.. must be corrected to reflect the volume at zero scaleW
read i ng.
vw:= 18960.481 cm3 x 0.00026417 S£L-1 - 2 in
^cm5 231 i
n
3 ga lion
Vw== 5.00879 gal-0.00519
VW:= 5.00360 gallons at 20.299°C
The volume at 60°F (conventional reference temp) may be determined
as fo 1 lows
:
Vw60°F:= Vw [l-3(tw-60)]
where 6 := cubic coefficient of thermal expansion
6 := 28.8 x I0”6 per degree F (changed to 26.5 x I0~5 - 1973)
+w = 20 . 299°C = 68 . 54°F
vw60°F= 5.00360 [1-28.8 x I
0“ 6( 68 . 54-60)] = 5.00247 gallons
The volume of the residual water (Vrw ) may be determined [2] from the
equation
V D =A 3-A I
+ Ms3"Msl" p a3v s3 = p alVsl 3’Kw _—_ crrr
pw“ p a3
- 25 -
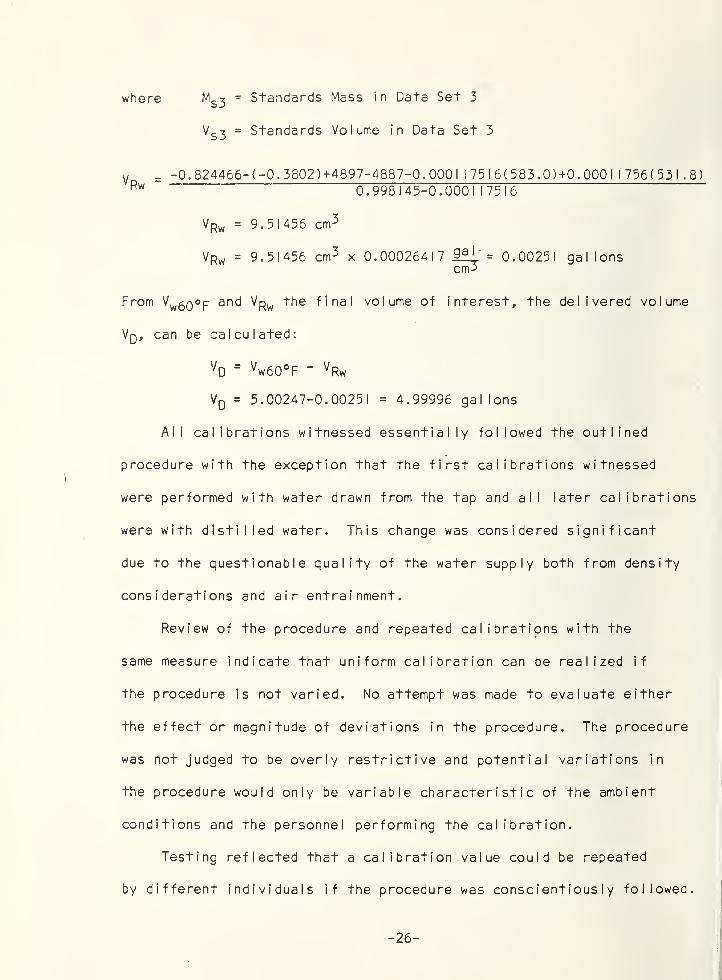
where Ms ^
= Standards Mass in Data Set 3
VS 3 = Standards Volume in Data Set 3
v _ -0.824466- (-0.3802) +4897-4887-0. 000 I I 75 I 6( 583.0)+0.000 II 756( 53 I .8)Rw 0.998145-0.0001 17516
VRw = 9.51456 cm 3
VRw = 9.51456 cm 3 x 0.00026417 9£i‘' = 0.00251 gal Ionscm3
From VwgQOp and V Rw the final volume of interest, the delivered volume
Vq, can be calculated:
VD
= Vw60°F " v Rw
VD = 5.00247-0.00251 = 4.99996 gallons
All calibrations witnessed essentially followed the outlined
procedure with the exception that the first calibrations witnessed
were performed with water drawn from the tap and all later calibrations
were with distilled water. This change was considered significant
due to the questionable quality of the water supply both from density
considerations and air entrainment.
Review of the procedure and repeated calibrations with the
same measure indicate that uniform calibration can be realized if
the procedure is not varied. No attempt was made to evaluate either
the effect or magnitude of deviations in the procedure. The procedure
was not judged to be overly restrictive and potential variations in
the procedure would only be variable characteristic of the ambient
conditions and the personnel performing the calibration.
Testing reflected that a calibration value could be repeated
by different individuals if the procedure was conscientiously followed.
- 26 -
Calibration of volumetric test measures is necessarily a manual
operation and is somewhat dependent on the mental attitude of the
individual performing the calibration. Mental attitude could affect
the calibration but the effect cannot be measured or estimated. Care
in cleaning, drying, reading, and recording balance readings and scale
readings are some of the features that could fluctuate with mental
attitude. It is considered, however, that an experienced technician
will strive for optimum accuracy.
Since the calculations to establish the NBS calibration values
are performed using a computer program, complete examination of the
physical data was not attempted beyond the manual calculation which
yielded good agreement with computer values. The computer program
includes corrections for ambient temperature, humidity, and barometric
pressure in the weighing process and is considered highly acceptable.
One value used in the computer program that was judged questionable was
the cubical thermal expansion coef f i ci ent- for low-carbon steel measures.
Report of tests indicated a value of 0.000018 per °-F was assumed.
This value reportedly came from the 1945 edition of Metals Handbook
and NBS Monograph 62 (issued April I, 1963). (The computer value
was changed to 0.0000186 in 1972.) The National Bureau of Standards,
at the request of the American Society for Testing Materials,
developed a set of equations to represent the thermal expansion of
mild steel from -40 to +400°F. The equations were published in Volume
45, No. 4, April 1961 Technical News Bulletin C5j as well as ASTM
DI750-62, API Standard: 2541, Tables for Positive Displacement Meter
- 27 -
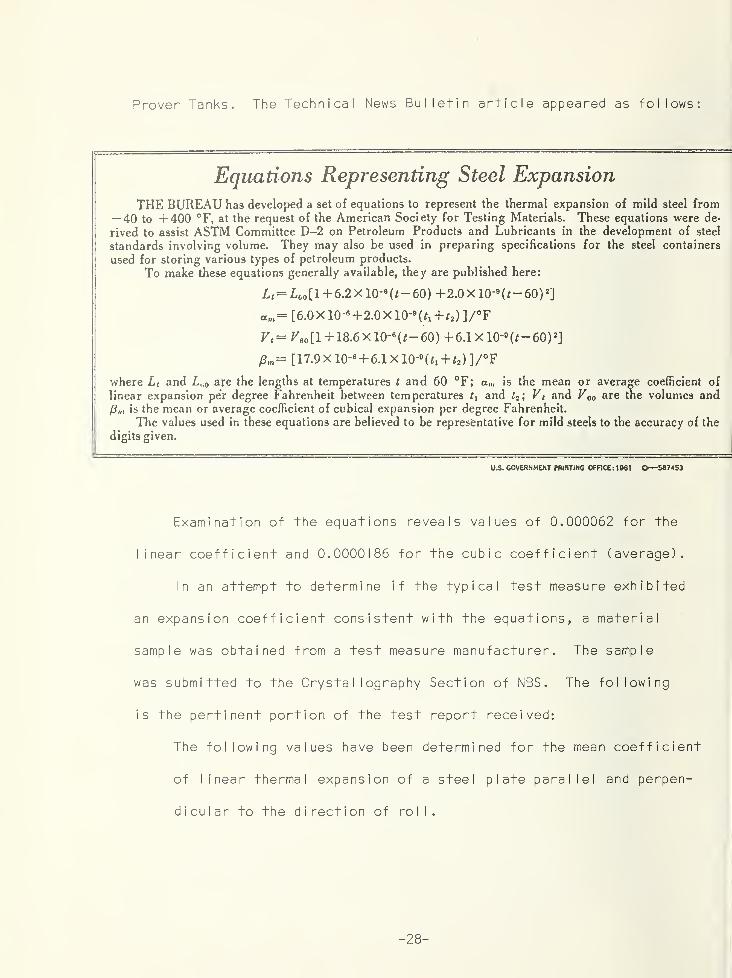
Prover Tanks. The Technical News Bulletin article appeared as follows:
Equations Representing Steel Expansion
THE BUREAU has developed a set of equations to represent the thermal expansion of mild steel from— 40 to +400 °F, at the request of the American Society for Testing Materials. These equations were de-
rived to assist ASTM Committee D-2 on Petroleum Products and Lubricants in the development of steel
standards involving volume. They may also be used in preparing specifications for the steel containers
used for storing various types of petroleum products.
To make these equations generally available, they are published here:
L t= Lco [l +6.2 X 10‘ 6 (/— 60) +2.0X 10'9 (/-60) 2
]
am— [6.0X 10- 6 + 2.0X lO-^ + fj) ]/°F
V t— F60 [l +18.6X 10‘ 6
(f — 60) +6.1 X 10~° — 60) 2]
J3,n=
[17.9 X 10' 6 + 6.1 X 10-°^ +t2 ) ]/°F
where Lt and L„0 are the lengths at temperatures t and 60 °F; a,„ is the mean or average coefficient of
linear expansion per degree Fahrenheit between temperatures f, and t 2 ; Vt and V00 are the volumes and
/?„, is the mean or average coefficient of cubical expansion per degree Fahrenheit.
The values used in these equations are believed to be representative for mild steels to the accuracy of the
digits given.
______________________U.S. GOVERNMENT PRINTING OffICE: 1961 O—567453
Examination of the equations reveals values of 0.000062 for the
linear coefficient and 0.0000186 for the cubic coefficient (average).
In an attempt to determine if the typical test measure exhibited
an expansion coefficient consistent with the equations, a material
sample was obtained from a test measure manufacturer. The sample
was submitted to the Crystallography Section of NBS. The following
is the pertinent portion of the test report received:
The following values have been determined for the mean coefficient
of linear thermal expansion of a steel plate parallel and perpen-
dicular to the direction of roll.
- 28-
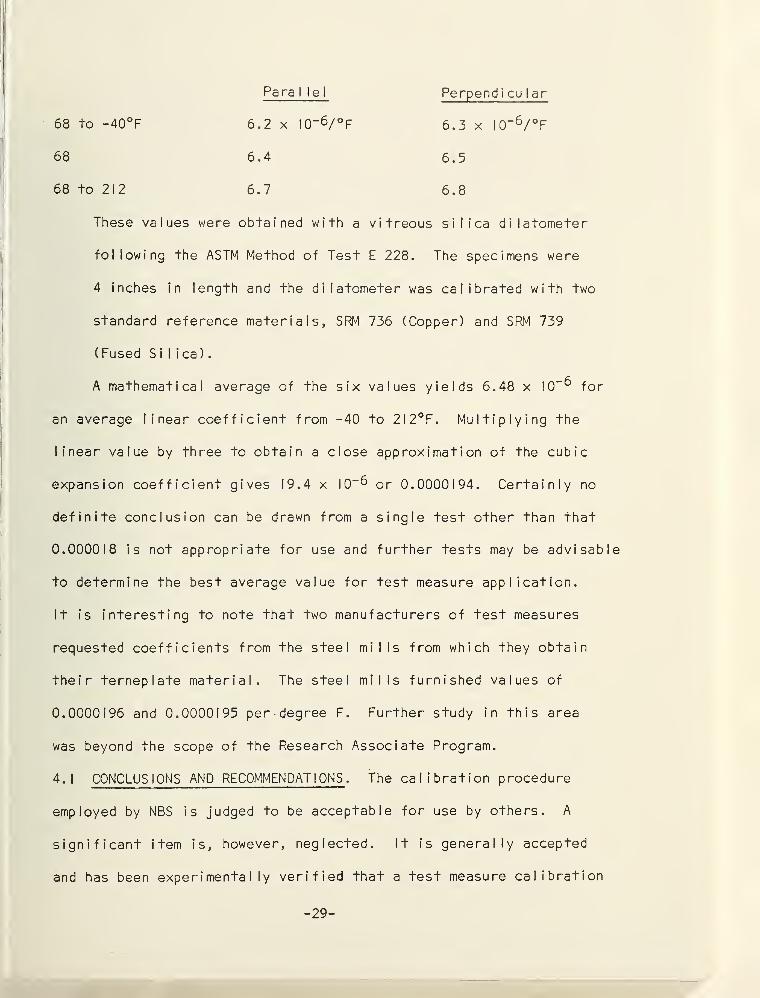
Para 1 lei Perpend i cu 1 ar
68 to -40°F 6.2 x I0~ 6/°F 6.3 x I0~6/°F
68 6.4 6.5
68 to 212 6.7 6.8
These values were obtained with a vitreous silica dilatometer
following the ASTM Method of Test E 228. The specimens were
4 inches in length and the dilatometer was calibrated with two
standard reference materials, SRM 736 (Copper) and SRM 739
( Fused Silica).
A mathematical average of the six values yields 6.48 x ICT^ for
an average linear coefficient from -40 to 2I2°F. Multiplying the
linear value by three to obtain a close approximation of the cubic
expansion coefficient gives 19.4 x I0~6 or 0.0000194. Certainly no
definite conclusion can be drawn from a single test other than that
0.000018 is not appropriate for use and further tests may be advisable
to determine the best average value for test measure application.
It is interesting to note that two manufacturers of test measures
requested coefficients from the steel mills from which they obtain
thei r ternep I ate material. The steel mills furnished values of
0.0000196 and 0.0000195 per degree F. Further study in this area
was beyond the scope of the Research Associate Program.
4.1 CONCLUSIONS AND RECOMMENDATIONS . The calibration procedure
employed by NBS is judged to be acceptable for use by others. A
significant item is, however, neglected. It is generally accepted
and has been experimentally verified that a test measure calibration
-29-
is dependent on the emptying time as well as the a Noted drain time
following cessation of flow. Historically, only the drain time
following cessation of flow is noted, recorded, and reported.
This condition should be corrected. For invertable style measures
the emptying time would reflect the NBS Calibration Procedure.
For bottom-drain measures the device owner would have the responsi-
bility of requesting a specific emptying time when submitting the
measure to NBS for calibration. Only the owner knows in what piping
configuration the equipment will be used and consequently he should
include this time requirement in his request. The actual emptying
time during calibration would then become part of the permanent docu-
mentation. Devices submitted without an accompanying drain time
request would be calibrated with a minimum of hardware attached and
the resulting drain time would be reported.
In considering the differences of values for the thermal expansion
coefficient it must be pointed out that the differences in total
calculated volumes would be slight (I cubic inch in'500 gallons with a
I5°F temperature differential). It does reflect non-uniformity but
is considered insignificant if all parties will use consistent co-
efficients. Until additional research is conducted, the values of
18.6 X I0“6 per °F for low-carbon steel and 26.5 X ICT^ per °F for
18-8 or Type 304 stainless steel should be used by all individuals.
- 30-
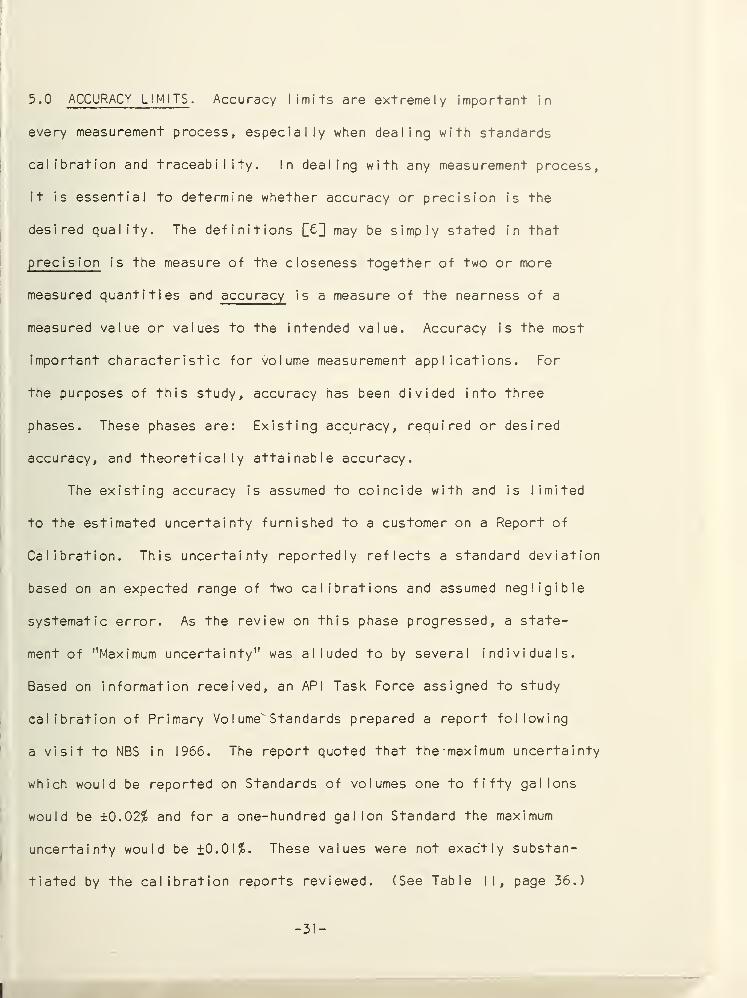
5.0 ACCURACY LIMITS . Accuracy limits are extremely important in
every measurement process, especially when dealing with standards
calibration and traceability. In dealing with any measurement process,
it is essential to determine whether accuracy or precision is the
desired quality. The definitions may be simply stated in that
precision is the measure of the closeness together of two or more
measured quantities and accuracy is a measure of the nearness of a'
measured value or values to the intended value. Accuracy is the most
important character istic for volume measurement applications. For
the purposes of this study, accuracy has been divided into three
phases. These phases are: Existing accuracy, required or desired
accuracy, and theoretically attainable accuracy.
The existing accuracy is assumed to coincide with and is limited
to the estimated uncertainty furnished to a customer on a Report of
Calibration. This uncertainty reportedly reflects a standard deviation
based on an expected range of two calibrations and assumed negligible
systematic error. As the review on this phase progressed, a state-
ment of "Maximum uncertainty" was alluded to by several individuals.
Based on information received, an API Task Force assigned to study
calibration of Primary Vo I ume" Standards prepared a report following
a visit to NBS in 1966. The report quoted that the-maximum uncertainty
which would be reported on Standards of volumes one to fifty gallons
would be ±0.02$ and for a one-hundred gallon Standard the maximum
uncertainty would be ±0.01$. These values were not exactly substan-
tiated by the calibration reports reviewed. (See Table II, page 36.)
- 31 -
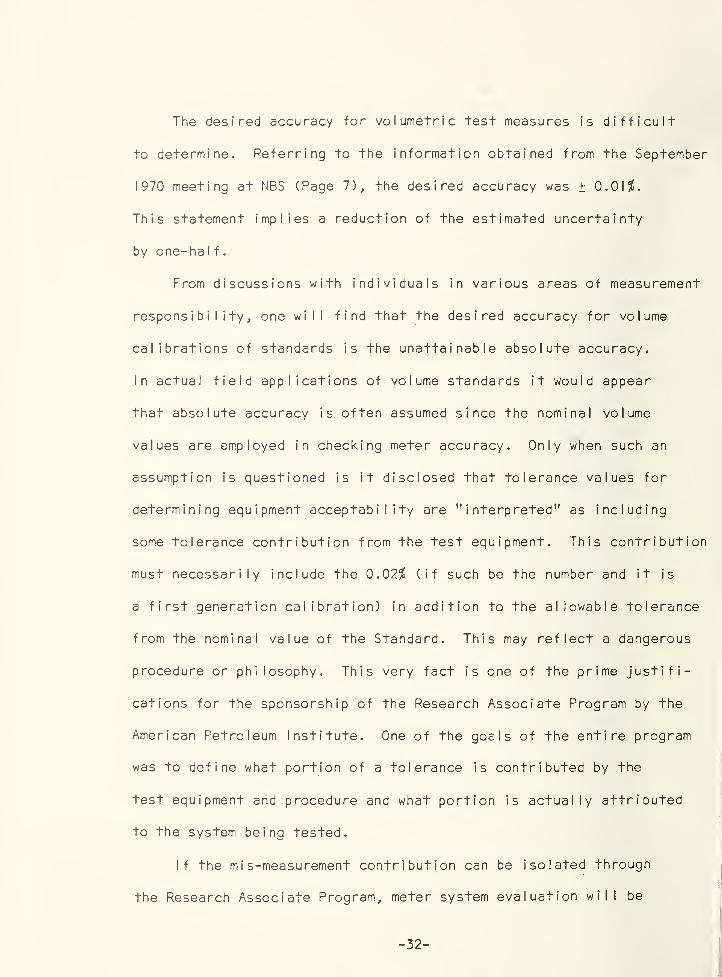
The desired accuracy for volumetric test measures is difficult
to determine. Referring to the information obtained from the September
1970 meeting at NBS (Page 7), the desired accuracy was ± 0.01%.
This statement implies a reduction of the estimated uncertainty
by one-ha I f
.
From discussions with individuals in various areas of measurement
responsibility, one will find that the desired accuracy for volume
calibrations of standards is the unattainable absolute accuracy.
In actual field applications of volume standards it would appear
that absolute accuracy is often assumed since the nominal volume
values are employed in checking meter accuracy. Only when such an
assumption is questioned is it disclosed that tolerance values for
determining equipment acceptability are "interpreted" as including
some tolerance contribution from the test equipment. This contribution
must necessarily include the 0.02$ (if such be the number and it is
a first generation calibration) in addition to the allowable tolerance
from the nominal value of the Standard. This may reflect a dangerous
procedure or philosophy. This very fact is one of the prime justifi-
cations for the sponsorship of the Research Associate Program by the
American Petroleum Institute. One of the goals of the entire program
was to define what portion of a tolerance is contributed by the
test equipment and procedure and what portion is actually attributed
to the system being tested.
If the mi s-measurement contribution can be isolated through
the Research Associate Program, meter system evaluation will be
- 32 -
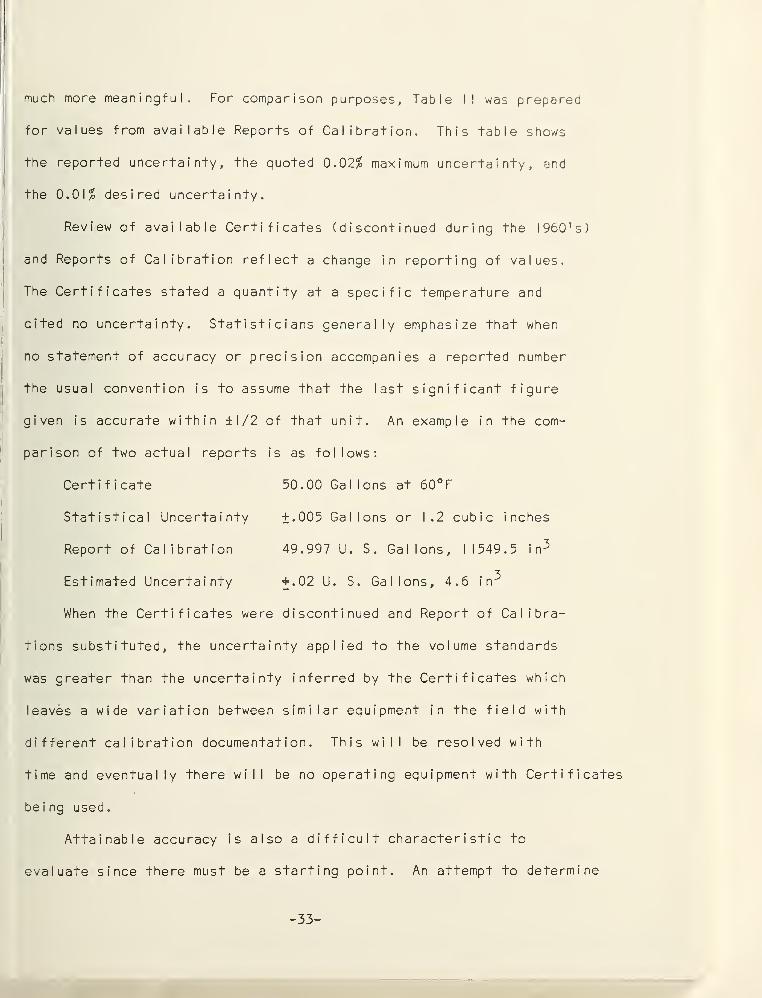
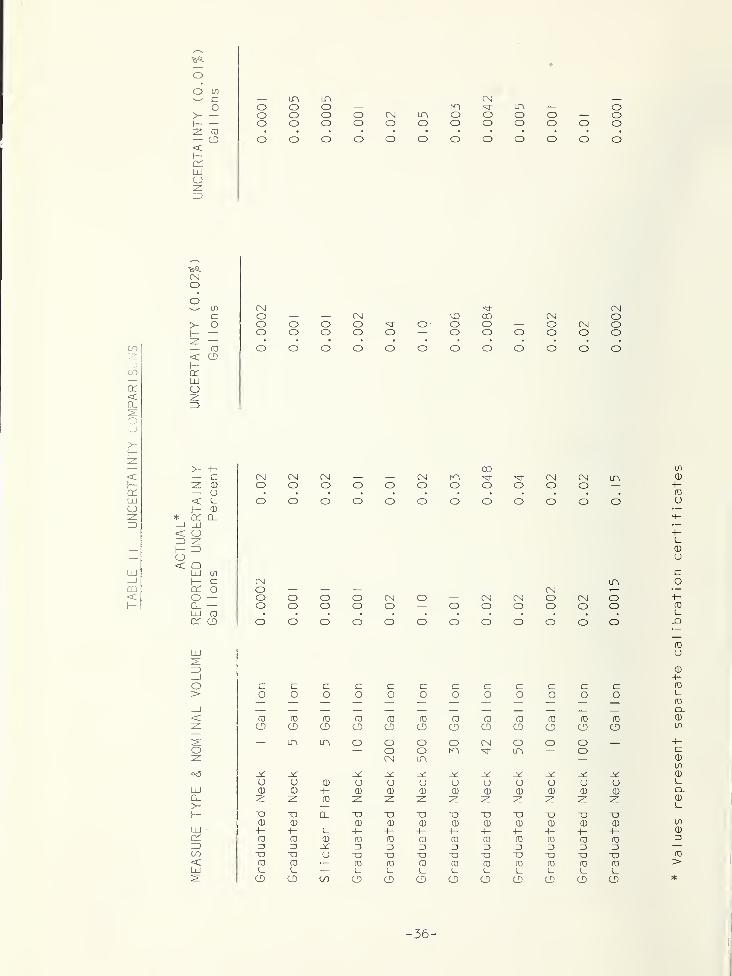
much more meaningful. For comparison purposes. Table I! was prepared
for values from available Reports of Calibration. This table shows
the reported uncertainty, the quoted 0.02 % maximum uncertainty, and
the 0.01% desired uncertainty.
Review of available Certificates (discontinued during the 1960’s)
and Reports of Calibration reflect a change in reporting of values.
The Certificates stated a quantity at a specific temperature and
cited no uncertainty. Statisticians generally emphasize that when
no statement of accuracy or precision accompanies a reported number
the usual convention is to assume that the last significant figure
given is accurate within ±1/2 of that unit. An example in the com-
parison of two actual reports is as follows:
Certificate 50.00 Gallons at 60°F
Statistical Uncertainty +.005 Gallons or 1.2 cubic inches
Report of Calibration 49.997 U. S. Gallons, 11549.5 i
n^
Estimated Uncertainty +.02 U. S. Gallons, 4.6 in'*
When the Certificates were discontinued and Report of Calibra-
tions substituted, the uncertainty applied to the volume standards
was greater than the uncertainty inferred by the Certificates which
leaves a wide variation between similar equipment in the field with
different calibration documentation. This will be resolved with
time and eventually there will be no operating equipment with Certificates
being used.
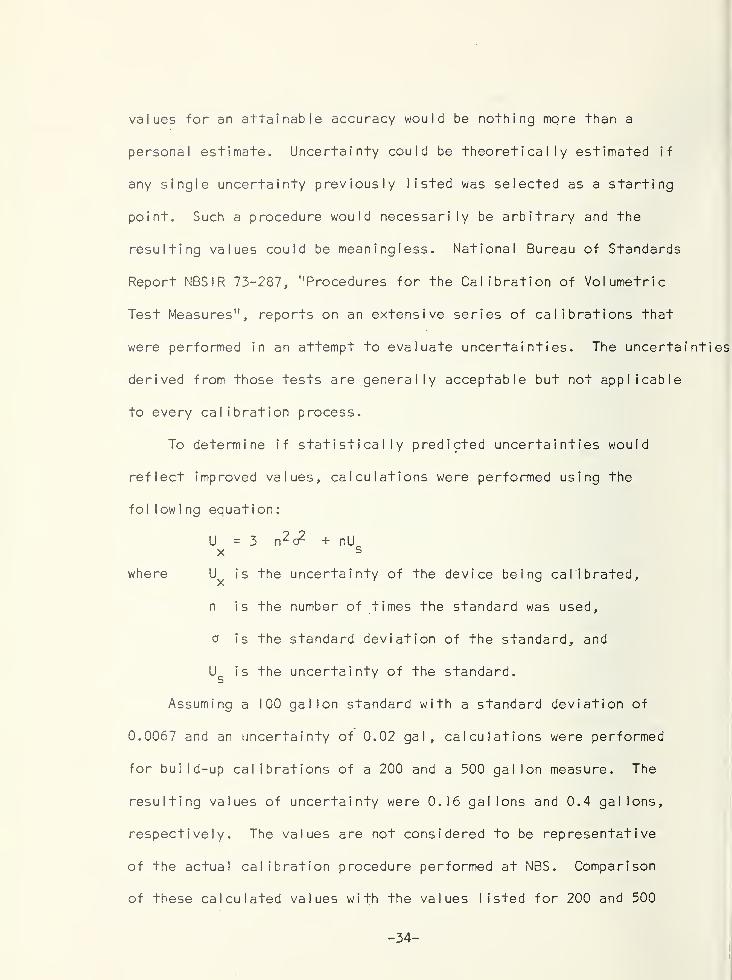
Attainable accuracy is also a difficult character i st i c to
evaluate since there must be a starting point. An attempt to determine
values for an attainable accuracy would be nothing more than a
personal estimate. Uncertainty could be theoretically estimated if
any single uncertainty previously listed was selected as a starting
point. Such a procedure would necessarily be arbitrary and the
resulting values could be meaningless. National Bureau of Standards
Report NBS I R 73-287, "Procedures for the Calibration of Volumetric
Test Measures", reports on an extensive series of calibrations that
were performed in an attempt to evaluate uncertainties. The uncertainties
derived from those tests are generally acceptable but not applicable
to every calibration process.
To determine if statistically predicted uncertainties would
reflect improved values, calculations were performed using the
fol lowi ng equation:
U =3 n2 a2 + nU
x s
where is the uncertainty of the device being calibrated,
n is the number of times the standard was used,
o is the standard deviation of the standard, and
is the uncertainty of the standard.
Assuming a 100 gallon standard with a standard deviation of
0.0067 and an uncertainty of 0.02 gal, calculations were performed
for build-up calibrations of a 200 and a 500 gallon measure. The
resulting values of uncertainty were 0.16 gallons and 0.4 gallons,
respectively. The values are not considered to be representative
of the actual calibration procedure performed at NBS. Comparison
of these calculated values with the values listed for 200 and 500
-34 -
gallon measures in Table II shows that the calculated values are
significantly greater than the reported values.
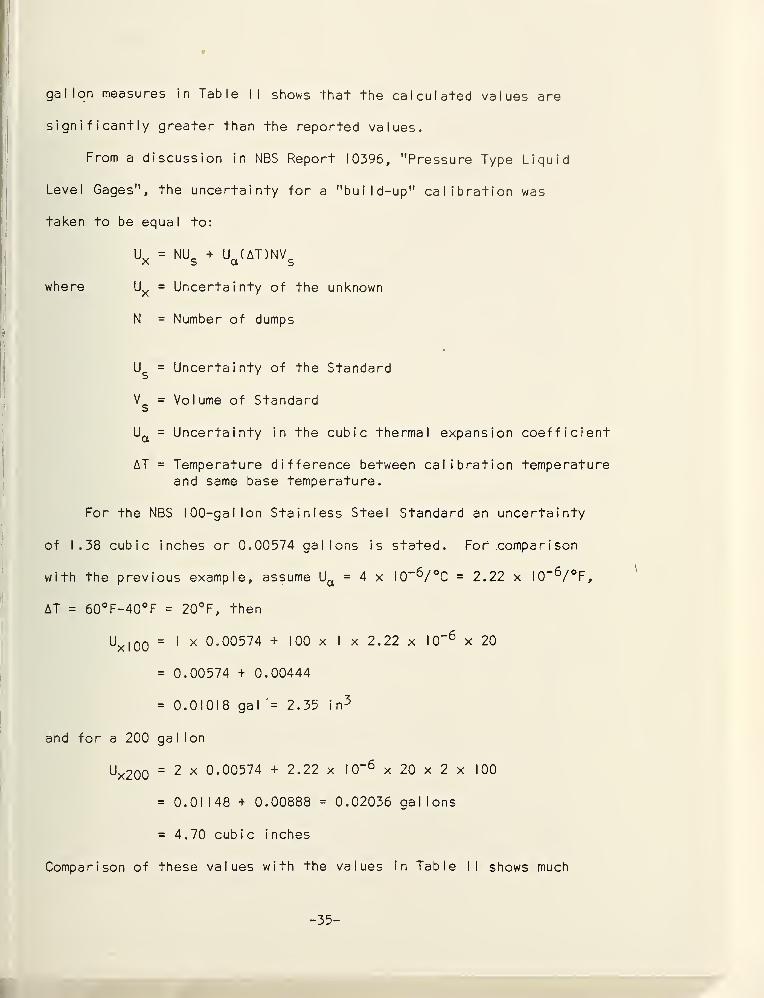
From a discussion in NBS Report 10396, "Pressure Type Liquid
Level Gages", the uncertainty for a "build-up" calibration was
taken to be equal to:
Uv = NLL + U (AT)NVA b 01 5
where Ux = Uncertainty of the unknown
N = Number of dumps
Us
= Uncertainty of the Standard
Vs
= Volume of Standard
Ua = Uncertainty in the cubic thermal expansion coefficient
AT = Temperature difference between calibration temperatureand same base temperature.
For the NBS 100-gallon Stainless Steel Standard an uncertainty
of 1.38 cubic inches or 0.00574 gallons is stated. For compar i son
with the previous example, assume Ua = 4 x IO -fV°C = 2.22 x I0“^/°F,
AT = 60°F-40°F = 20°F, then
Ux | oo=
1 x 0.00574 + 100 x I x 2.22 x I0~ 6 x 20
= 0.00574 + 0.00444
= 0.01018 gal '= 2.35 in 3
and for a 200 gal Ion
ux200 = 2 x 0.00574 + 2.22 x I0-6
x 20 x 2 x 100
= 0.01148 + 0.00888 = 0.02036 gallons
= 4.70 cubic inches
Comparison of these values with the values in Table II shows much
-35-
TABLE
||
UNCERTAINTY
COMPARISONS
va.
oo in^ c — LH in CM —
o o o o — m LH — o>
—
o o o o CM in o o o o — o1
— —Z CU
o o o o o o o o o o o o— cd o o o o o o o o o o o o<I
—
cm.
LUo
&«.CMOO
0)
cCMo Csl so
N-co CN
CNo
>- o o o o o o o o — o CM oI— — o o o o o — o o o o o oz — • • • • • • • • • • • •
<03
CDo o o o o o o o o o o o
I
—
cmLUoz3
>- 4-h- c CM CM CM — — CMz CD o o O o o O— (J • • • • . •
< L_ o o o o o oh- 0
* cr q_—J LU< o
03N" N" CM CM LH
10
CD
o O O O O — 4-• • • • • (0
o o O o o O (J
4-
h- 3O< Q0O
lu in1— ccm oo —
CMOO o o o CM o CM CMCMO CM
in
o
Co4—
a. — o o o o o — o o O O O O (U
LU (0 • • • • • • • • L_
cm cd o o o o o o o o o o O O _Q
co
LU uZ3 0_J 4-O C C C c e c c C e c c C CO
> o o o o o o o o o o o o L.
fD
1 CL< CO (0 CO (0 (0 CO co co CO CO CO CO 0z CD CD CD CD CD CD CD CD CD CD CD CD cn
s — m in o O o O CM o o o 4-
o — O o m •m3" in — o cz CM in — 0
in
z z z JL z z z Z z z 0o o CD o o u o u u o o o L.
LU 0) CD 4- CD 0 0 0 0 0 0 0 0 CLCL z Z CO z z z z z z z z z 0>- — l_
h- ~o T3 Cl T3 X) T3 "O T3 TD 13 “O 13CD CD o 0 0 0 0 0 0 0 0 in
UJ 4- 4- L_ +- +- 4- +- -i- +- +- 4- 4- 0QC (0 CO CD CO co CO (0 CO CO CO (0 co 33 13 ZJ Z5 3 3 3 3 3 3 3 3 —03 "O "O o T
3
~o ~o TD TD TD “O TD 13 (0
< co CO .
—
co CO CO CO (0 CO CO co CO >LU L. L_ — L. L_ L_ L_ L_ L_ L_ L_ L_
z CD CD CO CD CD CD CD CD CD CD CD CD 4
- 36 -
better agreement. If the relationship used in this example is valid,
then by using an accurate, wel l-known cubic thermal coefficient of
expansion that uncertainty contribution would approach zero. That
would represent an uncertainty reduction of 40 percent or more.
The ultimate goal for uncertainties associated with volumetric
measures, in the eyes of most people involved in measurement, would
be for the values to be decreased. It is impossible for any individual
to predict that such a reduction could be realized. The actual ability
to decrease the estimated uncertainty has been studied with the re-
sulting conclusion that the unknown variance of the cubic thermal
coefficient of expansion and the predicted readability of the
graduated neck may prevent a reduction of estimated uncertainty.
The calibration data of the "check standard", described in the
calibration procedure of Section 4.0, has been collected for I,
5, and 10-gallon calibrations with good agreement between predicted
uncertainty and uncertainty based on a large test population.
Similar data for the larger volume is not taken due to the absence
of "Check Standards" in the procedure. The resolution of this problem
will only come about when an exhaustive study is conducted by persons
knowledgeable in statistical’ evaluation and volumetric calibrations.
Such an evaluation is far beyond the scope of the Research Associate
Project.
The research project included calibrations to evaluate design
and operating character i st i cs of test measures and included repetitive
calibrations of prover standards.
- 37 -
6.0 LIQUID RETENTION OR CL INGAGE TESTS. In order to evaluate test
measure character i st i cs that affect liquid retention, it was necessary
to devise a test series that would provide the required information.
Preliminary tests were conducted in an attempt to determine which
characteristics of a given procedure would measureably affect the
amount of liquid remaining in a measure following emptying. It was
learned that three variables dominated or controlled this liquid
residue. They were:
1. The angle between the vertical axis of the test measure
and true vertical during drainage,
2. The time from the beginning of, the emptying of a measure
to the cessation of flow, and
3. The time from the cessation of flow until the measure is
returned to an upright position Op the drain valve closed.
The preliminary tests provided an indication that the basic
characteristics of test measures could be studied while performing
the retention of liquid tests. The most significant feature of test
measures concerns the reproduc i b i I i ty of performance and a large
contributing factor would be the liquid retention. It was found
that this factor could be significantly changed by slight variations
of the three variables previously mentioned. Admittedly, there can
be other factors that could influence the accuracy of a test measure
such as dirt film, corrosion, denting damage, etc. These factors
were not considered to be true variables since their effects would
be unstable and completely uncontrollable. The tests were limited
- 38-
to clean, reasonable quality volume standards suitable for a com-
mercial measurement process. A test series was planned using carbon
steel test measures, both bare and epoxy-coated, stainless steel
test measures, and specially designed containers of two square feet
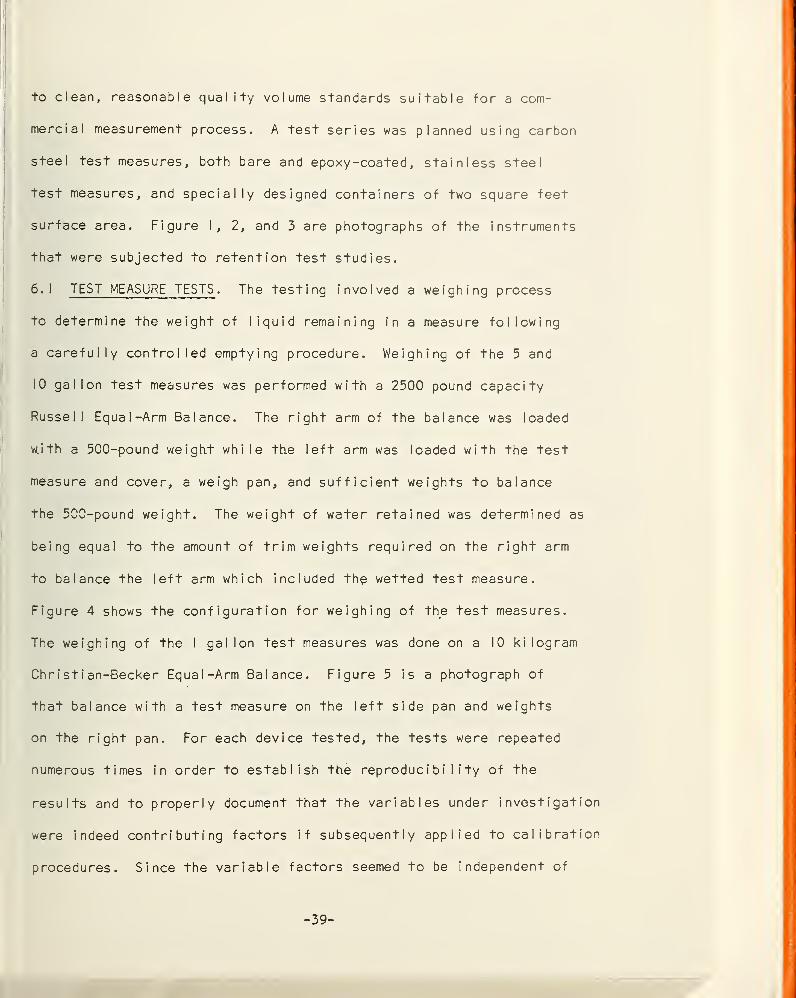
surface area. Figure I, 2, and 3 are photographs of the instruments
that were subjected to retention test studies.
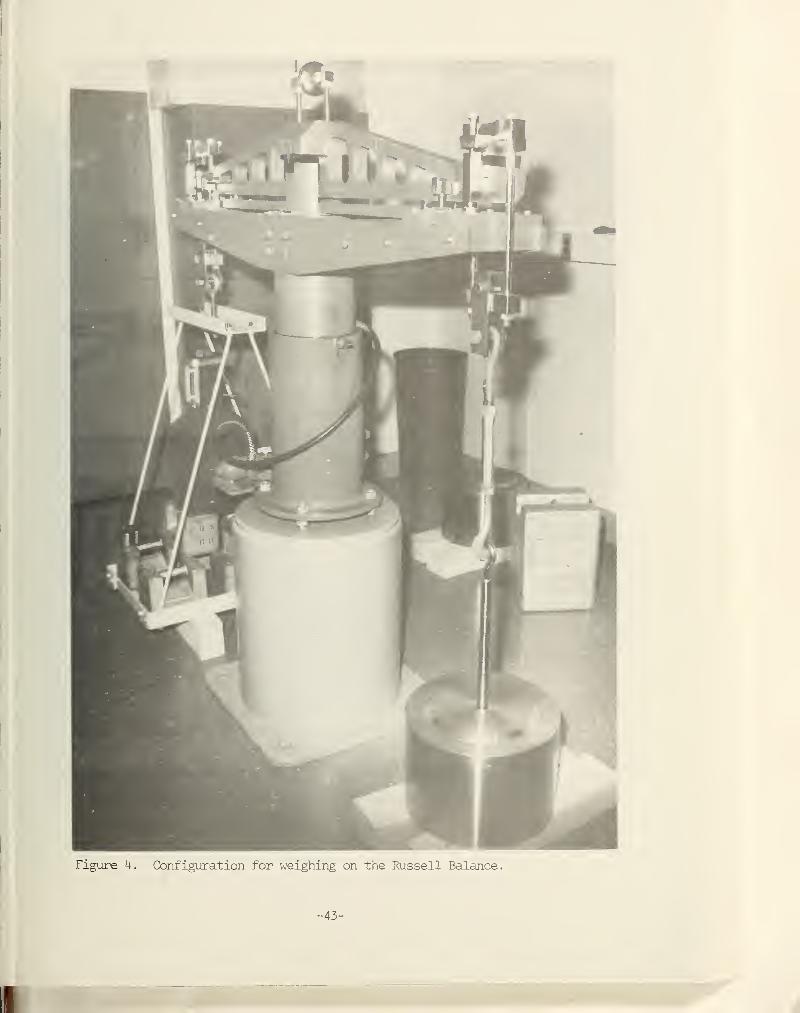
6.1 TEST MEASURE TESTS . The testing involved a weighing process
to determine the weight of liquid remaining in a measure following
a carefully controlled emptying procedure. Weighing of the 5 and
10 gallon test measures was performed with a 2500 pound capacity
Russell Equal-Arm Balance. The right arm of the balance was loaded
w.ith a 500-pound weight while the left arm was loaded with the test
measure and cover, a weigh pan, and sufficient weights to balance
the 500-pound weight. The weight of water retained was determined as
being equal to the amount of trim weights required on the right arm
to balance the left arm which included the wetted test measure.
Figure 4 shows the configuration for weighing of the test measures.
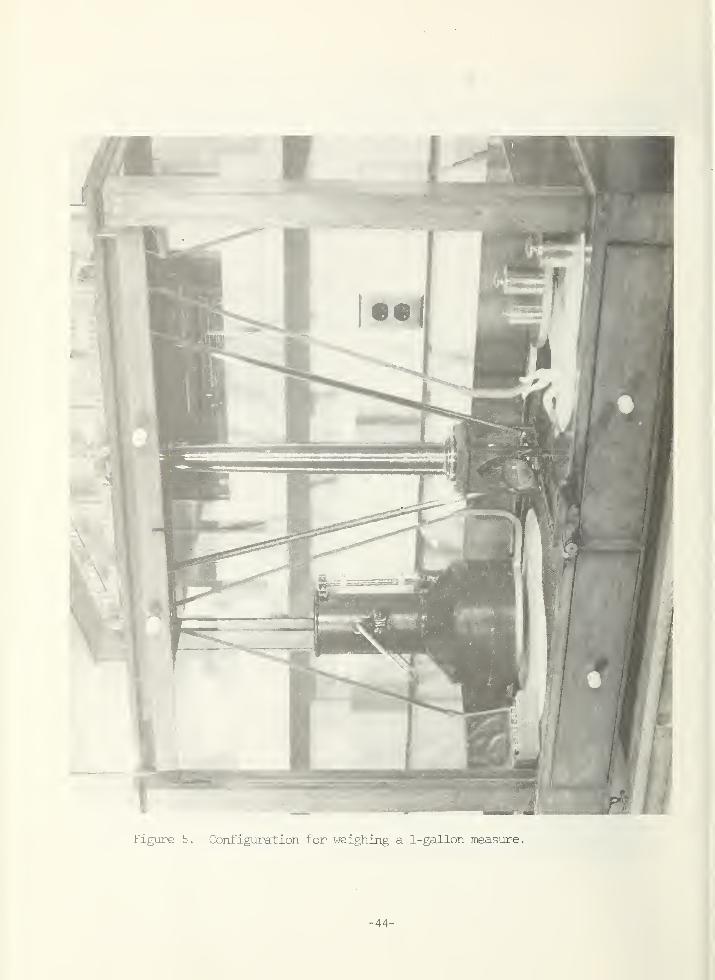
The weighing of the I gallon test measures was done on a 10 kilogram
Chr i st i an-Becker Equal-Arm Balance. Figure 5 is a photograph of
that balance with a test measure on the left side pan and weights
on the right pan. For each device tested, the tests were repeated
numerous times in order to establish the reproducibility of the
results and to properly document that the variables under investigation
were indeed contributing factors if subsequently applied to calibration
procedures. Since the variable factors seemed to be independent of
- 39-
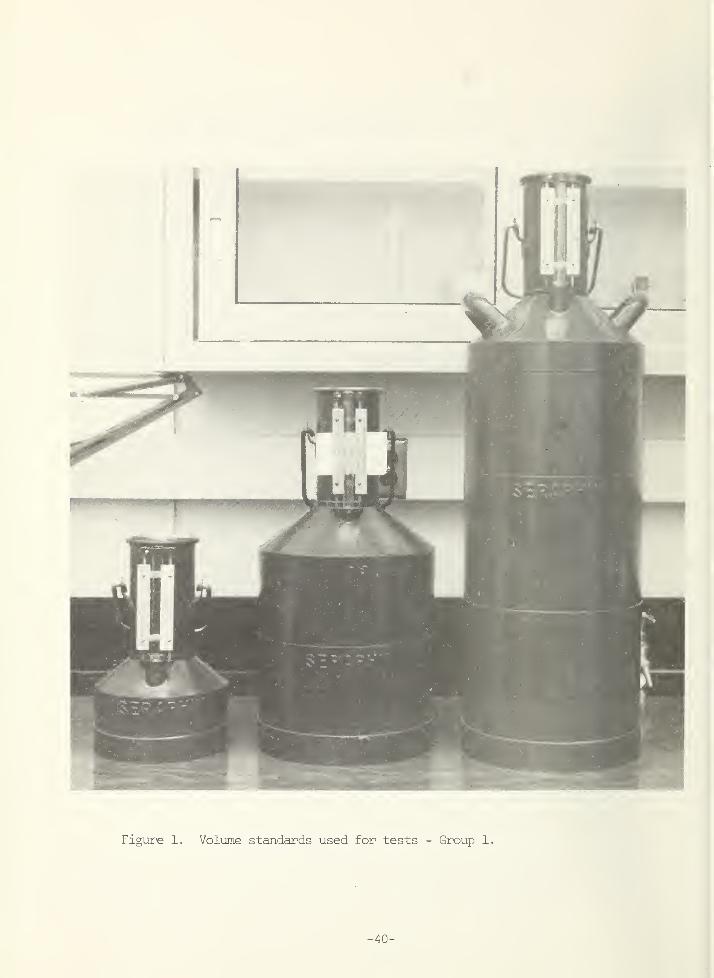
Figure 1. Volume standards used for tests - Group 1.
40 -
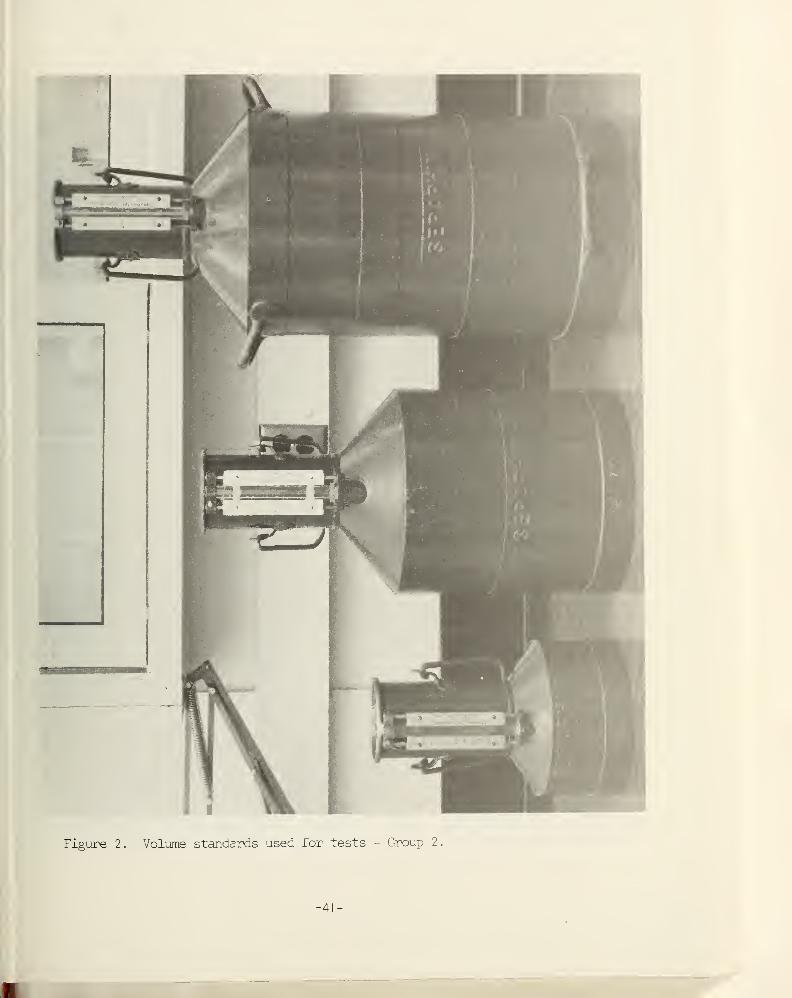
Figure 2. Volume standards used for tests - Group 2.
41
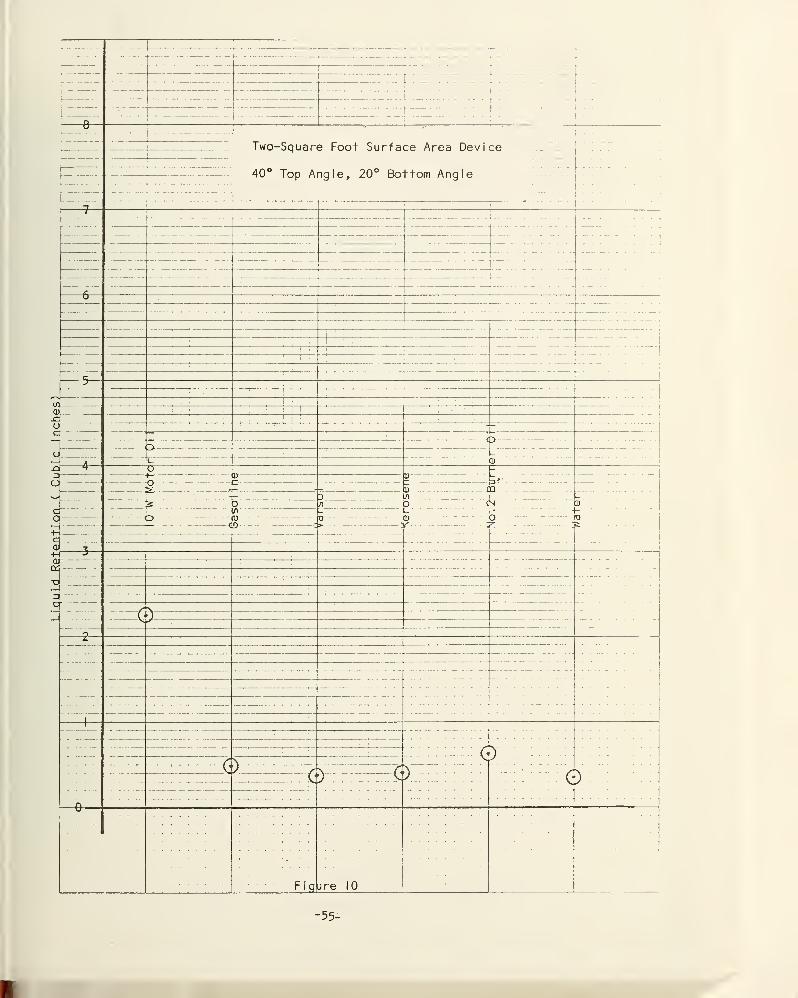
one another it was necessary to vary only one factor at a time in
order to establish what would be considered to be the optimum times
and angle. From these tests it was possible to determine at what
upper and lower limits the resulting data would exhibit a non-
reproducible scatter. The ultimate goal of the test series was to
establish the limits within which the variables should be controlled
in order to achieve a repeatable calibration and at the same time
not be overly restrictive.
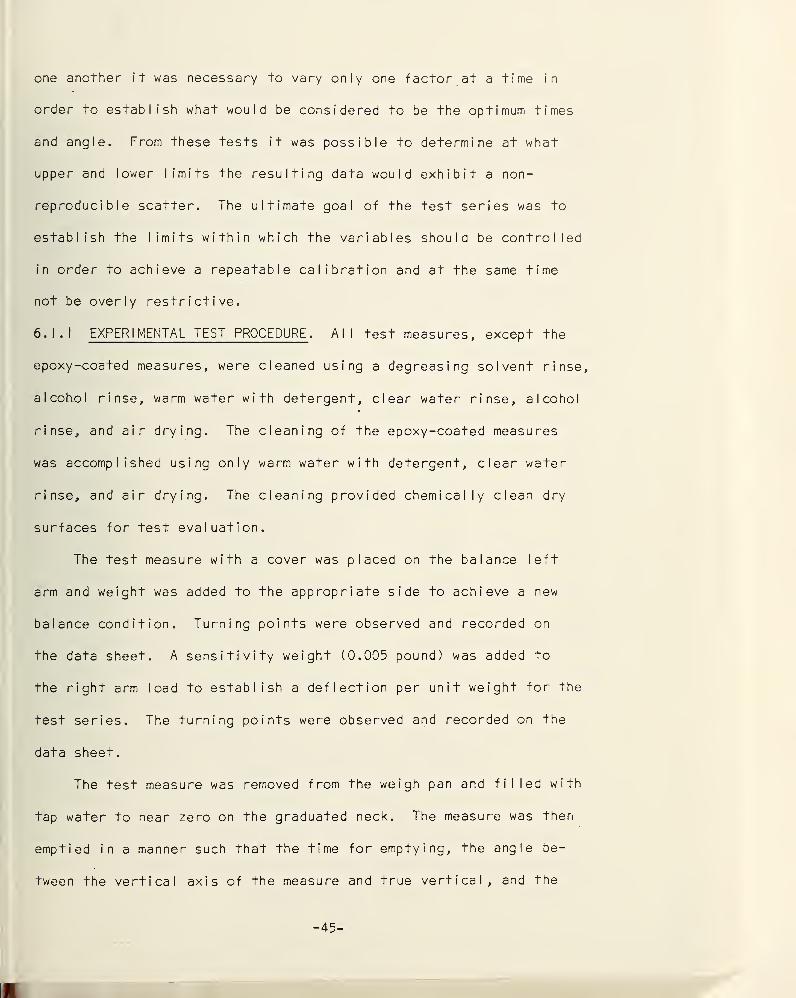
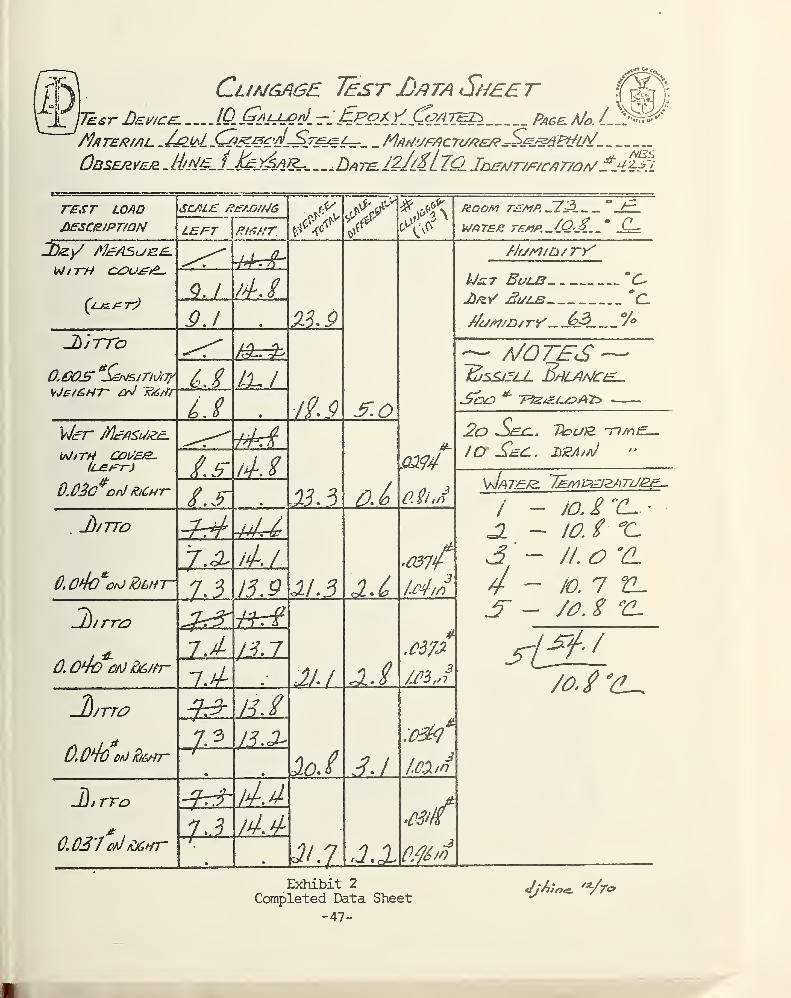
6.1.1 EXPERIMENTAL TEST PROCEDURE . All test measures, except the
epoxy-coated measures, were cleaned using a degreasing solvent rinse,
alcohol rinse, warm water with detergent, clear water rinse, alcohol
rinse, and air drying. The cleaning of the epoxy-coated measures
was accomplished using only warm water with detergent, clear water
rinse, and air drying. The cleaning provided chemically clean dry
surfaces for test evaluation.
The test measure with a cover was placed on the balance left
arm and weight was added to the appropriate side to achieve a new
balance condition. Turning points were observed and recorded on
the data sheet. A sensitivity weight (0.005 pound) was added to
the right arm load to establish a deflection per unit weight for the
test series. The turning points were observed and recorded on the
data sheet.
The test measure was removed from the weigh pan and filled with
tap water to near zero on the graduated neck. The measure was then
emptied in a manner such that the time for emptying, the angle be-
tween the vertical axis of the measure and true vertical, and the
drain time following cessation of flow could be repeated. Following
the completion of the drain, the cover plate was placed on the measure
and the wetted container was replaced on the balance. Trim weights
were added to the right side of the balance until a near balance
condition was achieved. The turning points were observed and re-
corded on the data sheet.
For each measure the angle of the vertical axis from vertical,
the time for emptying, and the drain time following cessation of
flow were varied one at a time for the test series.
Exhibit 2 is a completed Data Sheet for one of the series of tests.
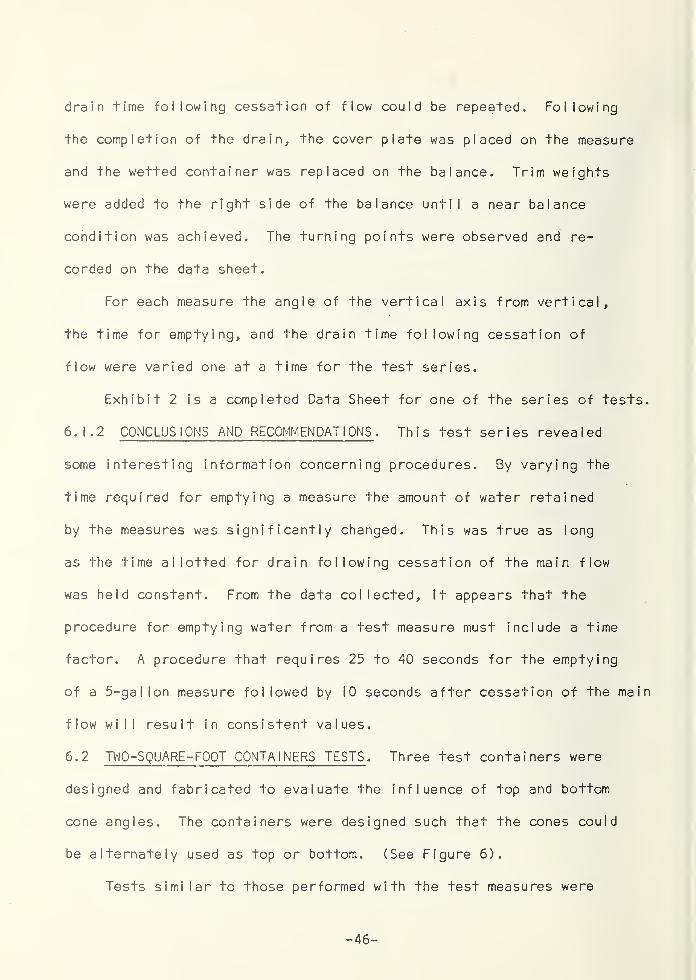
6.1.2 CONCLUSIONS AND RECOMMENDATIONS . This test series revealed
some interesting information concerning procedures. By varying the
time required for emptying a measure the amount of water retained
by the measures was significantly changed. This was true as long
as the time allotted for drain following cessation of the main flow
was held constant. From the data collected, it appears that the
procedure for emptying water from a test measure must include a time
factor. A procedure that requires 25 to 40 seconds for the emptying
of a 5-gallon measure followed by 10 seconds after cessation of the main
flow will result in consistent values.
6.2 TWO-SQUARE-FOOT CONTAINERS TESTS . Three test containers were
designed and fabricated to evaluate the influence of top and bottom
cone angles. The containers were designed such that the cones could
be alternately used as top or bottom. (See Figure 6).
Tests similar to those performed with the test measures were
-46-
CliMGAGE Test Jjeta Sheer (m):°}fjjksr Lev/cel !Q..Ql^E^~EePAE CpiiVEE Page /Jo. /
Material. _ Manufacturer^S sdBt/LE
Observer 12-1/$ll£i Ieea/t'/f/cat/o/VEji1EL
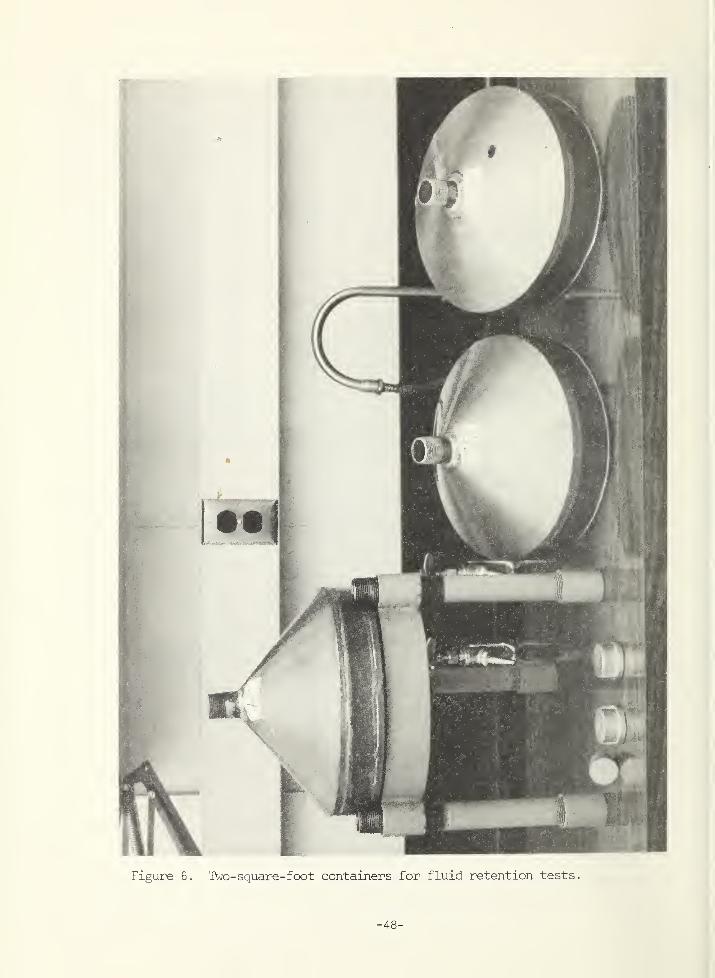
Figure 6. Two-square-foot containers for fluid retention tests.
48
conducted on the conical test pieces. Weighings were made on a
Chr i st i an-Becker 10 Kilogram Equal-Arm Balance. The left weigh pan
was replaced with a bracket to hold the test section in an upright
position while weighings were made. Figure 7 is a photograph of
the weighing set-up. The initial weighing was made balancing a bottle
with lead shot against the holding fixture and the dry test pieces.
In the ensuing tests the weight of water retained by the container
was determined as the amount of trim weights necessary to achieve
a balance condition.
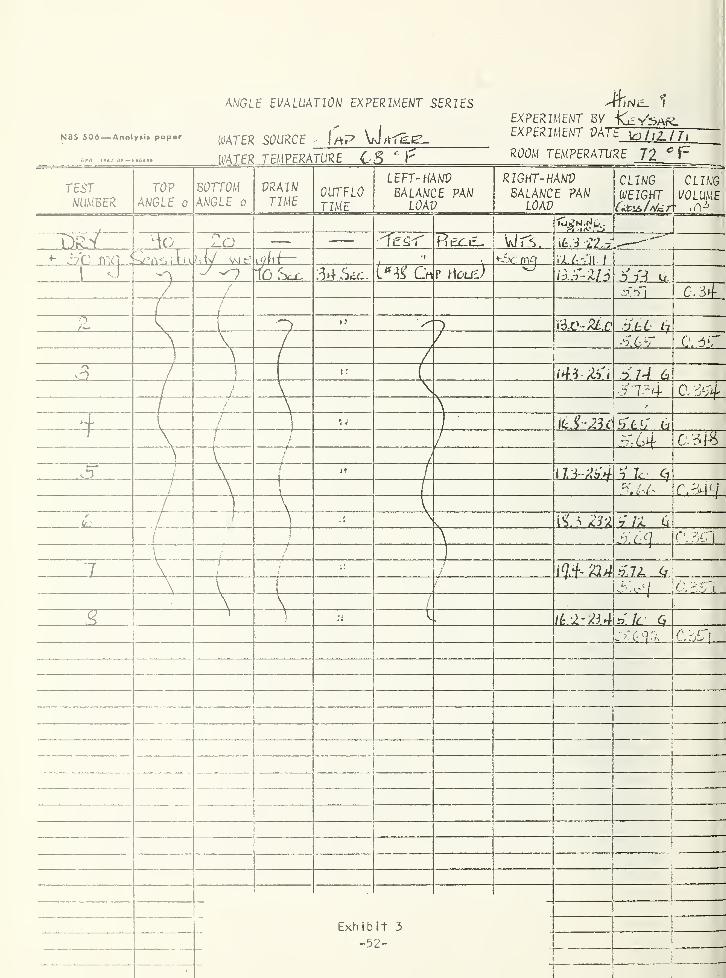
6.2. I EXPERIMENTAL TEST PROCEDURE . The test pieces were al I cleaned
in accordance with the procedure discussed in 6.1.1. The cleaned
equipment was weighed on the balance with a pipe cap on one opening
and a rubber stopper on the other. Due to weight variation of the
cap and stoppers the same cap and stopper were used in all weighings.
The weighed dry container was placed in the ring stand (See
Figure 8) and the container was filled with tap water. A cap with
a small diameter hole was placed on the container and then the rubber
stopper was removed allowing the water to drain. The time for the
draining was varied by exchanging caps with different hole diameters.
Following cessation of flow, the container was allowed to drain
for 10 additional seconds after which the dried stopper was replaced,
the closed cap was substituted for the flow cap and the container
was removed to the balance where the weight of water remaining in
the container was determined.
Exhibit 3 is a sample data sheet of one test sequence.
- 49 -
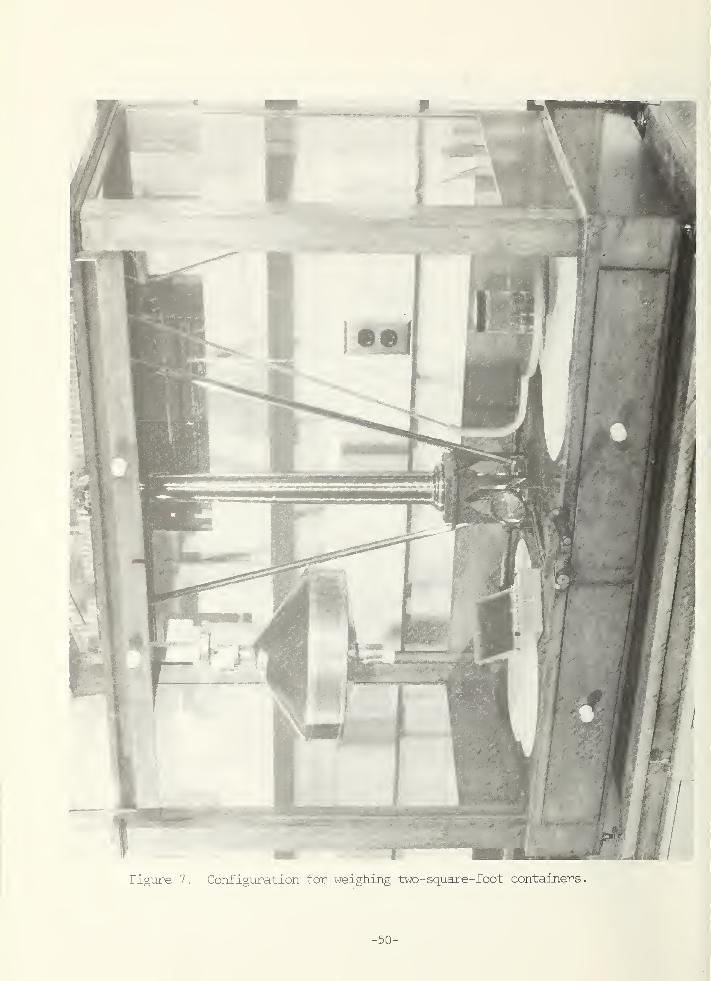
Figure 7. Configuration for weighing two-square-foot containers.
50
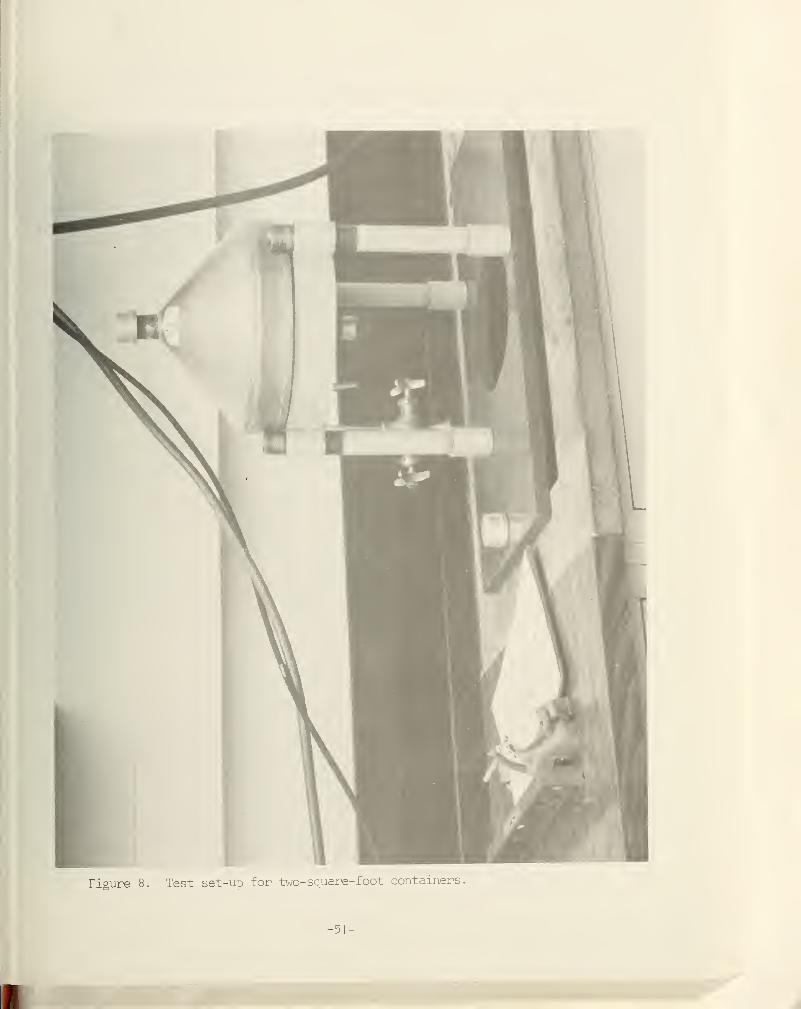
Test set-up for two-square-foot containers.
- 51 -
ANGLE EVALUATION EXPERIMENT SERIESEXPERIMENT BY -for/SAr
^
NBS 506— Anoly.i. pap.r WATER SOURCE ( HtP \jJ /ffg-g-EXPERIMENT VAlt \oh2_lT ,
™ WATER TEMPERATURE 6^ rl
; ROOM TEMPERATURE l'lc
C.PO 194 2 or —
TESTNUMBER
404*4
TOPANGLE o
WAI CK
BOTTOMANGLE o
i ci^rL/\n
PRAIA/
TIME
IUM
OUTFLOTIME
LEFT-HANVBALANCE PAN
LOAV
RIGHT- HANVBALANCE PAN
LOAV
CLINGWEIGHTCiX>i&//Yi±r
CLINGVOLUME
ifl*
r>i?V 7o _ — — 4if Re/Ci£- WIT'S . t£3 22.0
* 30 mq '
’i vs/ W fc
5iVlri— • 1
t-Jx: m3 1IT "7 10 SkLC. .74 J4:
.
(.*« Crt P H<5LM)vj
ib.b - ZI
6
4 T7 u
/ / .'To i C,S-
1
7/
J
O v _i O ....
>: 7 T&C-ZL.C 5Li h\ \ /
/ •7 LT 0 . 37] \ / /o3 / i I
t
:
/43 /£i>7 5.74 6/ /
/ Vv
\ V 77"4 Cl 0,4/ /
/ \ \ >
4 \ /
)
?
7
7E7 6/ \ /
1
/
/-44 C>4
\ V<
/ // \
/J
j?
/ iUSib'4 T 7c c7
/1 \
I
\ 5.^ C.34 Li
/ ] V l
im !1 \ iO V.11 4
J \ c.yr\
\
/.
1
7 \j1
/
/
44- &4 772. 6
\ <
r
!
1
/ 3’ 0-7 OSS' i
\ \4
.
4 ] V /C.2-44 1c (j
734 C4| _
.
‘
1
i
j
1
i
;
i
Exhibit 3
-52-
!
‘
1
1
:
*
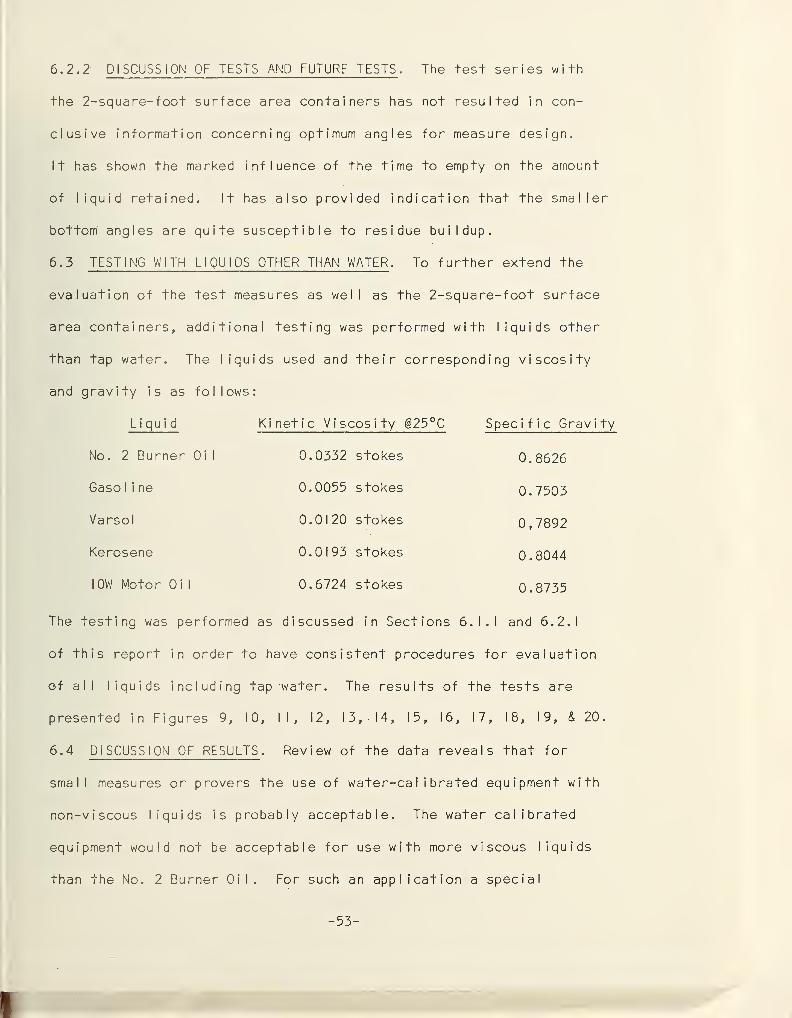
6.2.2 DISCUSSION OF TESTS AND FUTURF TESTS. The test series with
the 2-square-foot surface area containers has not resulted in con-
clusive information concerning optimum angles for measure design.
It has shown the marked influence of the time to empty on the amount
of liquid retained. It has also provided indication that the smaller
bottom angles are quite susceptible to residue buildup.
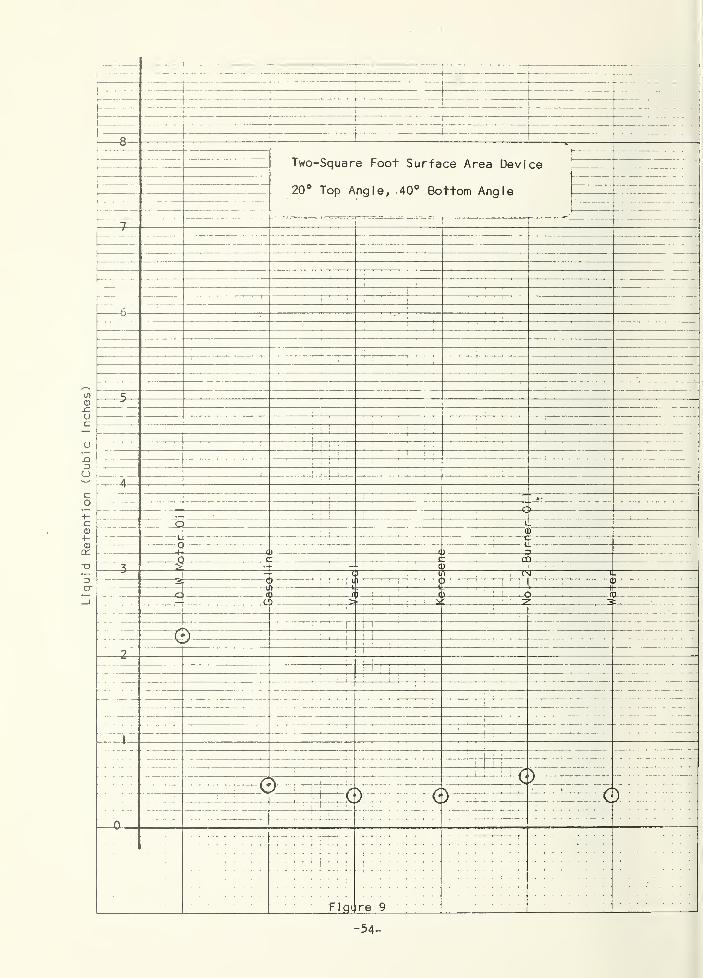
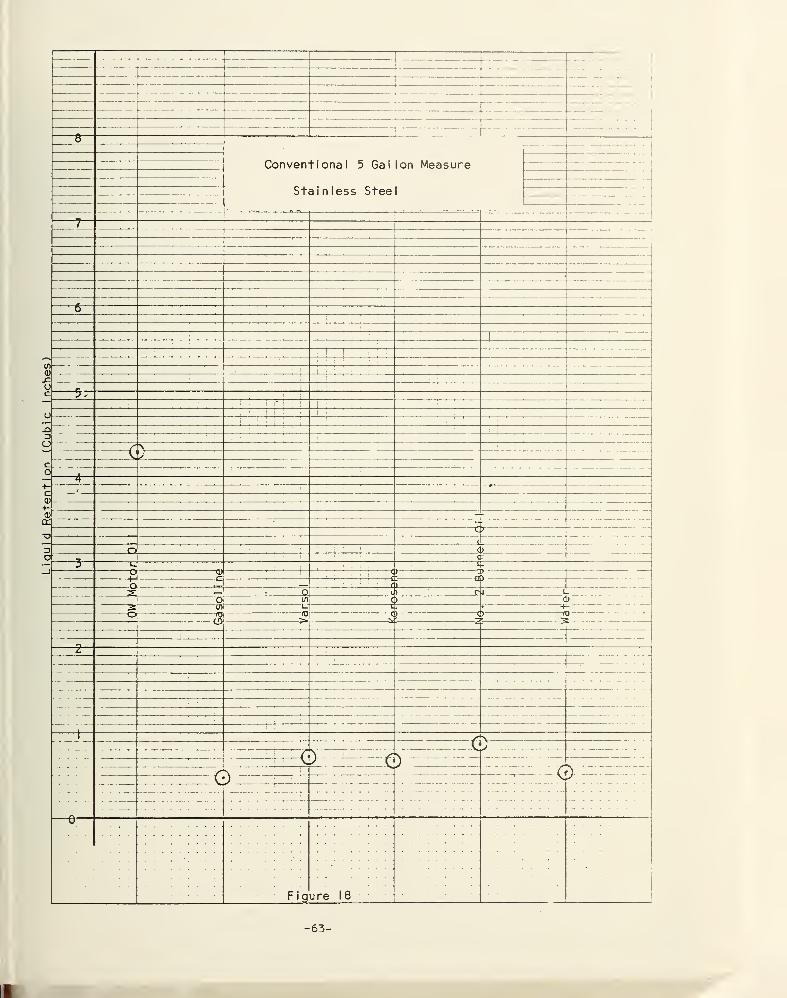
6.3 TESTING WITH LIQUIDS OTHER THAN WATER . To further extend the
evaluation of the test measures as well as the 2-square-foot surface
area containers, additional testing was performed with liquids other
than tap water. The liquids used and their corresponding viscosity
and gravity is as follows:
Liquid Kinetic Viscosity @25°C Spec i f i c Grav i ty
No. 2 Burner Oi 1 0.0332 stokes 0.8626
Gasoline 0.0055 stokes 0.7503
Varsol 0.0120 stokes 0,7892
Kerosene 0.0193 stokes 0.8044
I0W Motor Oil 0.6724 stokes 0.8735
The testing was performed as discussed in Sections 6. 1 . 1 and 6.2.
1
of this report in order to have consistent procedures for eva 1 uat ion
of all liquids including tap water. The results of the tests are
presented in Figures 9, 10, II, 12, 13, 14, 15, 16, 17, 18, 19, & 20.
6.4 DISCUSSION OF RESULTS . Review of the data reveals that for
small measures or provers the use of water-ca I i brated equipment with
non-viscous liquids is probably acceptable. The water calibrated
equipment would not be acceptable for use with more viscous liquids
than the No. 2 Burner Oil. For such an application a special
- 53 -
Liquid
Retention
(Cubic
Inches)
—... .
T
fto
Two-Square Foot Surface Area Device
h20° Top Angle, 40° Bottom Angle
. .
7
1 - .
'
1
!
5
'
j
!!
i
r
•i
!
i !
•
A
i 9 •
c
.... _cd )
c
< > qr C c: _ __ a 1
s < D
cl ) u ) c 1 ^
3 ''
C
11
L1
:1 t
Ji
'
)
o _ . . . a J . .... . fl 1 : < 1)'
i ( ) (1 >
t > 3 '! ! 2 : i
i
:
';
! Mi 1
•
9 ii
:
. —ill;
!
.
:
: 1 ;- I I , —
• • •— !
• * *
i:
' '
:
1 -
|
, |
- - -1— 1 c.\
/;n )AJ) s
) .... (
n
i
: i
Flqi re 9
- 54 -
tr
- )—-H
Two-Square Foot Surface Area Device
40° Top Angle, 20° Bottom Angle
7 mi
'
l m/—
*— * "
— —
0
i
! •
! i
' "
— — !
1 — -1
!
cJ
i : i
i!
I
i
,;::!!'
j
I, !
... . . -. . —. -
55. -
A i_4 D
f- 1) T_ . _ 3**
_ -
3) ... CQ .
a __ ________ f)
0. .ft o cs
313
q“
ru-
CD
o
a)—
v
o
o©
0
Figure 10
- 55-
Liquid
Retention
(
Cubic
Inches)
U.
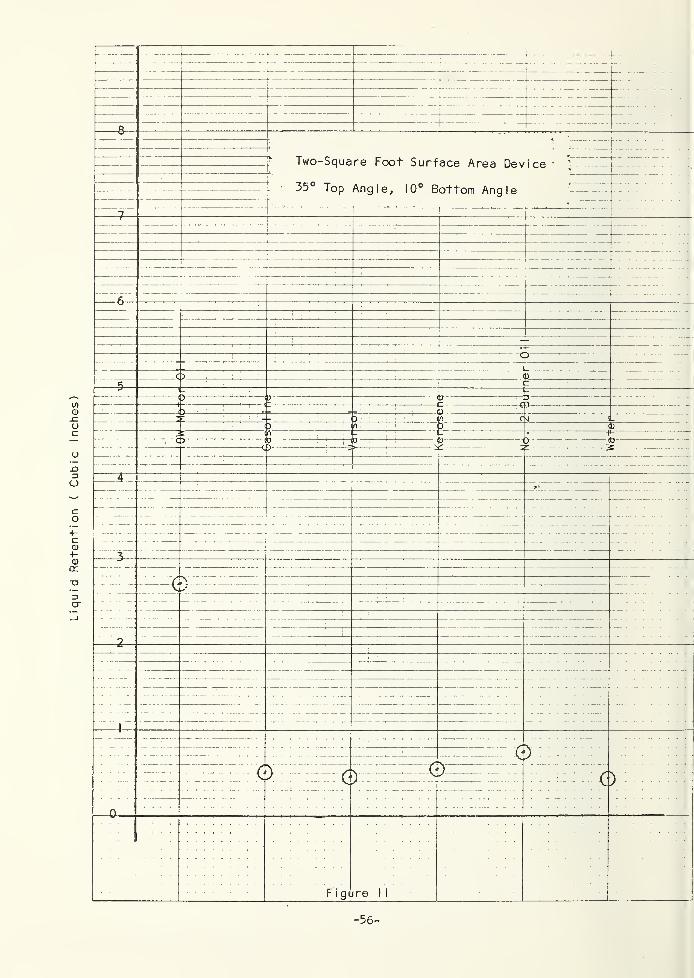
Two-Square Foot Surface Area Device
35° Top Angle, 10° Bottom Angle
T
6
~c 5
c 1• D
5 C- 1 -
) b 1) P
- - - -y
;; .
:
:
‘
1) _'
D iI
j
: 0 c j
5 n 5 i)
E \ ;
- • +K"~ "
c o 1
. D * • ‘ ~t>
— -
49 '
—
—<j
bs"_ '
2
' ' '
• - - '
j
—: 0V ;
<D 0 0 : G
Figure
-56 -
:E-
"1
—
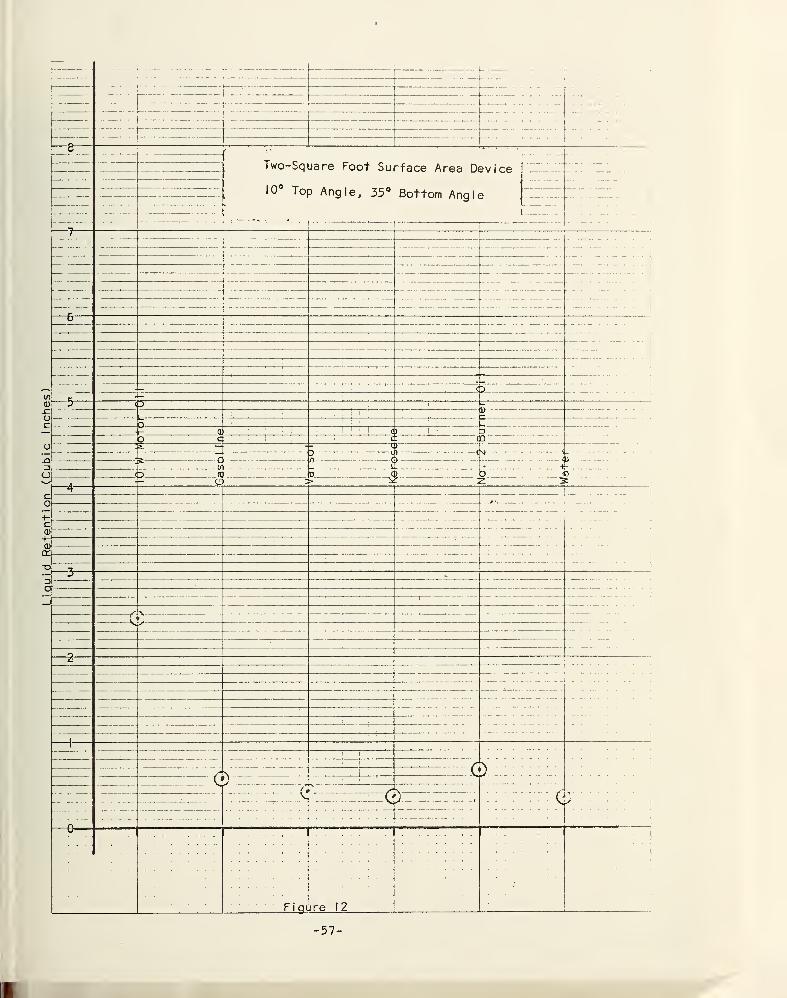
Two-Square Foot Surface Area Device
10 Top Angle, 35° Bottom Angle
jbic
Inches)
f—•
—
—
-
• - •
0
—'
i
1
, c 3•—
p (“
:1
. .
o i: M '
!
: U ....... ....
iF a '1
1
i . . fl ) 1
o c cE aD'
> - Qi)
D * • * o. . ... 5 .> VJ
If] . _ . . .... ."... .. c • -t
o ( ft . to fl > 3 0> isr :
2' 3£4
a .
+•c<D - —rr
“O
=>
o
-
-... . . .
'
—Zi
,
—
i
- •
1 1'
: i il * y
00'
(.— Gf\
.. G ). .......... >——Figure 12
bic
Inches)
1f
-
l
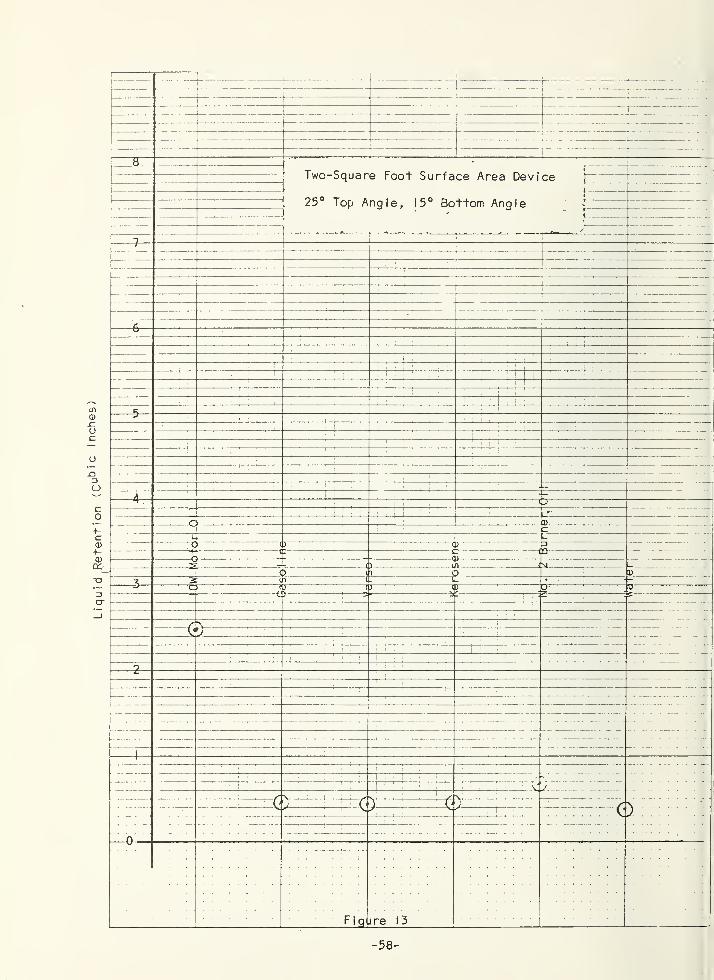
8' Two-Square Foot Surface Area Devi ce
„ lop Angie, 15 bottom Angle V
4
fkk /
71
- - -—£—
o
•i . ! !
j
t
1
e;
1
.
:
,
•. .
!
1
j !1
1
:
’
1
- - - -
A- —j
Mil] M{
I
'
J”— d Pcri L
"
-q c <p-
+ H-T
5 -. _xD m . . ( M -
d3 . _ *> 0 b3 n l • - ~
(- l j < J ( p y> . ^
z'K . - . .
’)
- -i
5
1 « ii
O
— - • ——1 — - - -
; !
•1
: 1 ! :1 i 1
’!
/
——rr1
i M '
. :,
v;
, J
1 y' “ * •
c; : C) £7" '
'
.
•
• - A• •• - • —
^: T •
— •
C~
- - • • •
o
Hq jre 13
- 58-
Liquid
Retention
(Cubic
Inches)
— ,|
— - ~;
* - H - ? - -
•
1.
...
- .....
^ - ...ra
_ _ t Two- ce }- —~ - v- , W . w i 1 » 1 1 vQ LJKZ V 1
• '
1 15° Top Angle, 25° Bottom Angle
7
f,o
,•
i i
’: '
:
Ky1
:
i
|
!M 1
11
-
c >
r\h .. .. ....... m— c:
L..... -
L_'
< p>~
c J"
Q) -3
-f - X
i ‘ < } . xih . . . o 4 l
C. ( ) d 1 c j
.
L> .
X : uD LL c • 4-
> <10 0 3 4 3 J3 ZPc. 0 *\ - ^
\ZJ
9
——|
. . ...
r\
. . 0)-— c j — .
r >\. . . .
' cy Vy Vy V.— ...
• •
i —
— __£igure 1 4
- 59 -
I
Liquid
Retention
(Cubic
Inches
l- '
- . >r
K
V-_
• '
ft
Elongated or Tal 1 10 Gal . Measure
Carbon Steel
— -— -
v —I
~ 6
———1
—
—
s
1
j
i !
—4
CP»•
5 -
o L
» .........
D ,
- D 13)“
DDo V- L
- 3 . a rki. .
-
p ... n 0in L L •
b iu [U JJ
'
L> u— C 0 t- 2t- " J
~ -1 i—
ro —1>
i
2— — — .
s
)- ... - . ..GJ .
z'q|
V: 6).— K
—
n- —
jre—15— E-i-gJ
- 60 -
Liquid
Retention
(Cubic
Inches)
61
Liquid
Retention
(Cubic
Inches)
62
n:
Conventional 5 Gallon Measure
Stainless Steel
01
—
<DJZO
! r i'
i
-r-ni I i-
-l_L_Q3o
_G:
c — ' -
O-
0cc ~
-o
3O
-O
-<w
-d -
2L
3io ~0>ItJ
3<0
G-O b 0
Figure 18
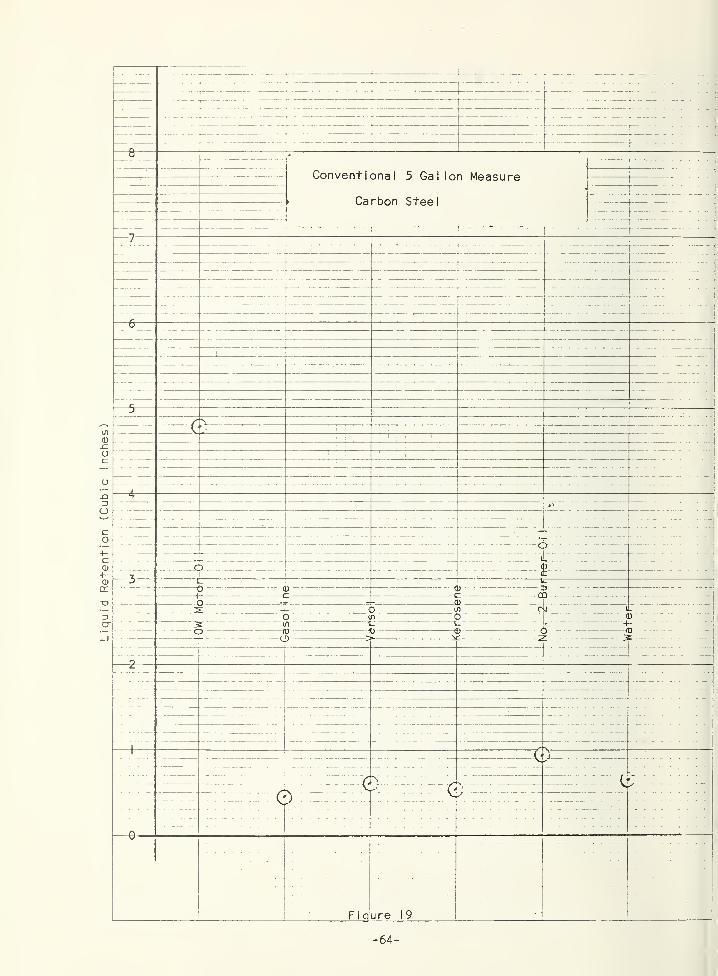
Liquid
Retention
(Cubic
Inches)
Figure 19
- 64 -
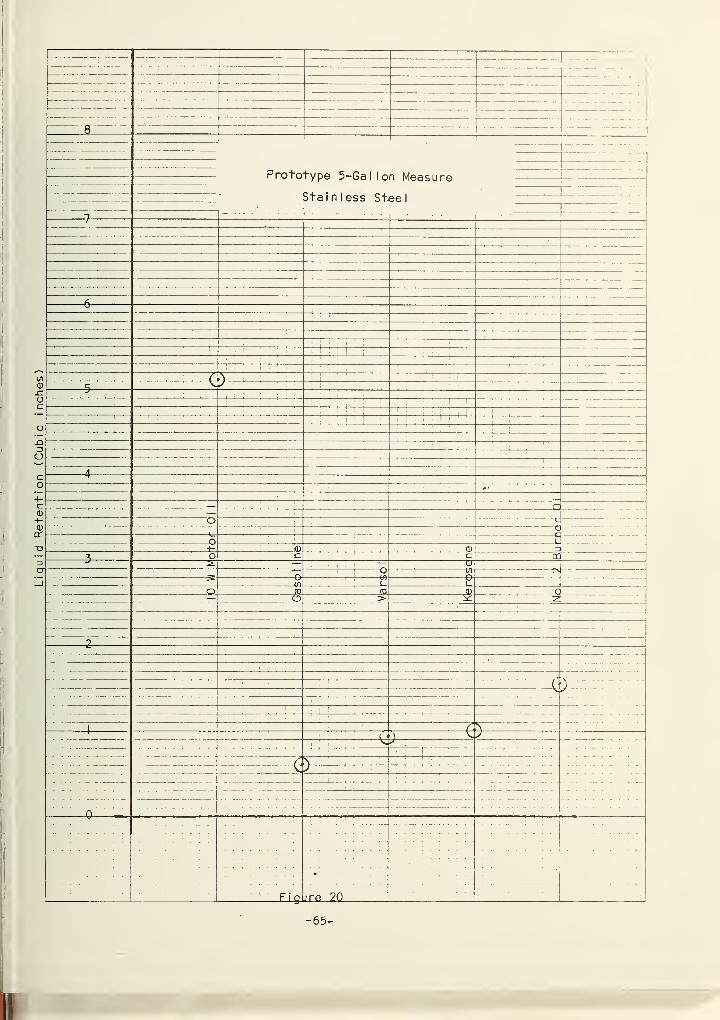
Liquid
Retention
(Cubic
inches)
-I
Prototype 5-Gal Ion Measure
Stainless Steel
TTi
,c._
10
__ZJ
03
O
-kl
0
Figure 20
-65-
calibration and test method would be required if a "To Contain"
measure were not employed.
An attempt was made to correlate surface area with liquid
retention. It appeared that for devices of similar geometric
configuration an estimate of retention could be made within 10-15
percent. It might be possible to predict the liquid retention of
large provers in this manner if a small scale model was tested
beforehand with the desired liquid. The need for such a procedure
is questionable for most liquids. If the amount of water retained
in a 1000 gallon prover was found to be 30 in^, it is unlikely
that the prover would retain ±25 percent different than that amount
of gasoline, varsol, or kerosene. Although this 7.5 cubic inches
per 1000 gallons is not totally insignificant, it represents less
than 2 percent of the current meter system tolerance for a 1000
gallon test draft and would normally be considered beyond the scale
readability for a prover of this volume.
The amount of liquid retained by a prover is influenced by
the liquid, prover geometry, surface area, surface condition, and
the drain procedure. The benefit from an extens i ve i nvestigat i on
of these factors does not warrant further testing at this time.
- 66 -
7.0 EQUIPMENT SPECIFICATION . One of the primary goals of the
research associate program was to collect information that could be
used to develop a specification, that if submitted to any fabricator,
the result would be an acceptable metal test measure.
As the test measure evaluation program proceeded, it was de-
cided that prior to developing a complete specification it would
be necessary to establish the methods and conditions under which
equipment would be inspected to judge compliance with a specification.
7.1.0 INSPECTION RECOMMENDATIONS . While conducting the tests
associated with the research program and witnessing calibrations
by several individuals, it was noted that no consistent examination
or inspection procedure was followed. This was considered to be
undesirable since it would indicate that the quality of equipment
was left entirely up to the judgement of the individual and that
acceptance/rejection criteria were non-uniform.
In an attempt to promote uniform practices, an inspection guide
was written. After numerous revisions, the draft was sent to over
50 individuals involved in various phases of volume measurement.
The individuals who were requested to review the draft represented
large segments of the petrol-eum industry; state, federal, and foreign
governments, and equipment manuf acturers . The nearly 40 returns of
the review request recommended very few changes. Only one negative
review was received. That reviewer questioned the usefulness of
such a listing until meaningful quantitative limits could be established
for the acceptance or rejection of a particular prover. On the other
-67 -
hand, another reviewer requested a copy of the final revised draft
in order to implement the inspection process in the company measure-
ment manual. Since the procedure dealt primarily with quality,
cleanliness, and potentially ever-changing corrosion and the over-
whelming concensus favored publication of the document, a final
draft was prepared which incorporated the pertinent recommendations
of the reviewers. The following is the text as submitted to the
American Petroleum Institute for publication consideration:
-68-
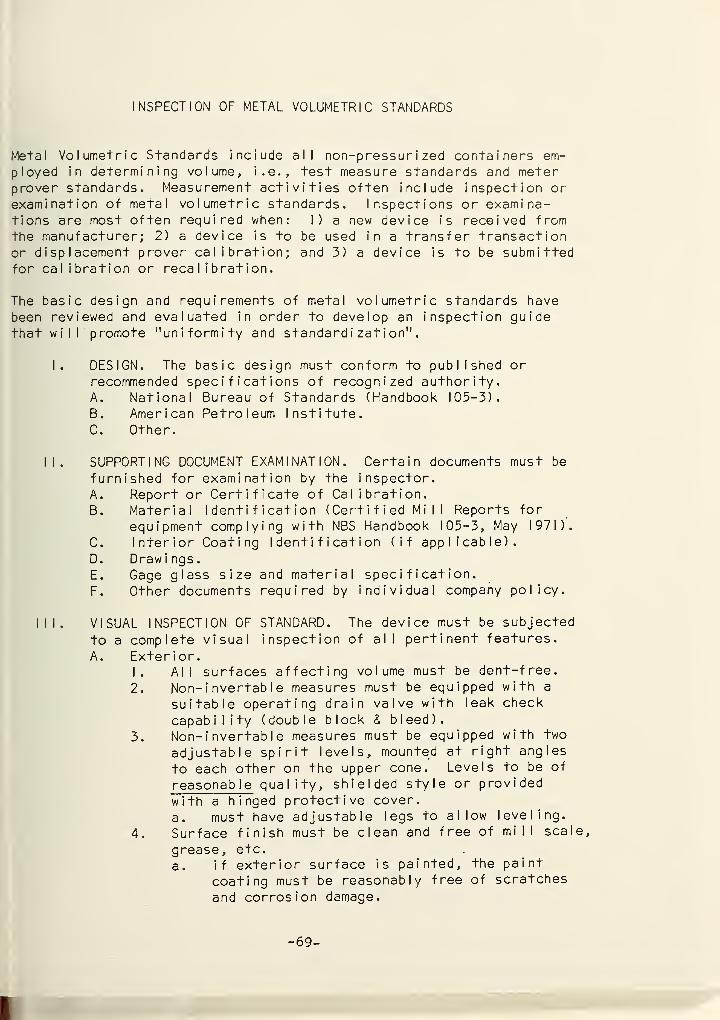
INSPECTION OF METAL VOLUMETRIC STANDARDS
Me+a I Volumetric Standards include all non-pressur i zed containers em-
ployed in determining volume, i.e., test measure standards and meterprover standards. Measurement activities often include inspection or
examination of metal volumetric standards. Inspections or examina-tions are most often required when: I) a new device is received fromthe manufacturer; 2) a device is to be used in a transfer transactionor displacement prover calibration; and 3) a device is to be submittedfor calibration or recalibration.
The basic design and requirements of metal volumetric standards have
been reviewed and evaluated in order to develop an inspection guidethat will promote "uniformity and standardization".
I. DESIGN. The basic design must conform to published orrecommended specifications of recognized authority.A. National Bureau of Standards (Handbook 105-3).
B. American Petroleum Institute.
C. Other.
II. SUPPORTING DOCUMENT EXAMINATION. Certain documents must be
furnished for examination by the inspector.
A. Report or Certificate of Calibration.B. Material Identification (Certified Mill Reports for
equipment complying with NBS Handbook 105-3, May 1971).
C. Interior Coating Identification (if applicable).
D. Drawings.E. Gage glass size and material specification.F. Other documents required by individual company policy.
III. VISUAL INSPECTION OF STANDARD. The device must be subjected
to a complete visual inspection of all pertinent features.
A. Exterior.1. All surfaces affecting volume must be dent-free.
2. Non- i nvertab I e measures must be equipped with a
suitable operating drain valve with leak check
capability (double block & bleed).
3. Non- i nvertab I e measures must be equipped with two
adjustable spirit levels, mounted at right angles
to each other on the upper cone. Levels to be of
reasonable quality, shielded style or provided
with a hinged protective cover.
a. must have adjustable legs to allow leveling.
4. Surface finish must be clean and free of mill scale,
grease, etc.
a. if exterior surface is painted, the paint
coating must be reasonably free of scratches
and corrosion damage.
-69 -
I
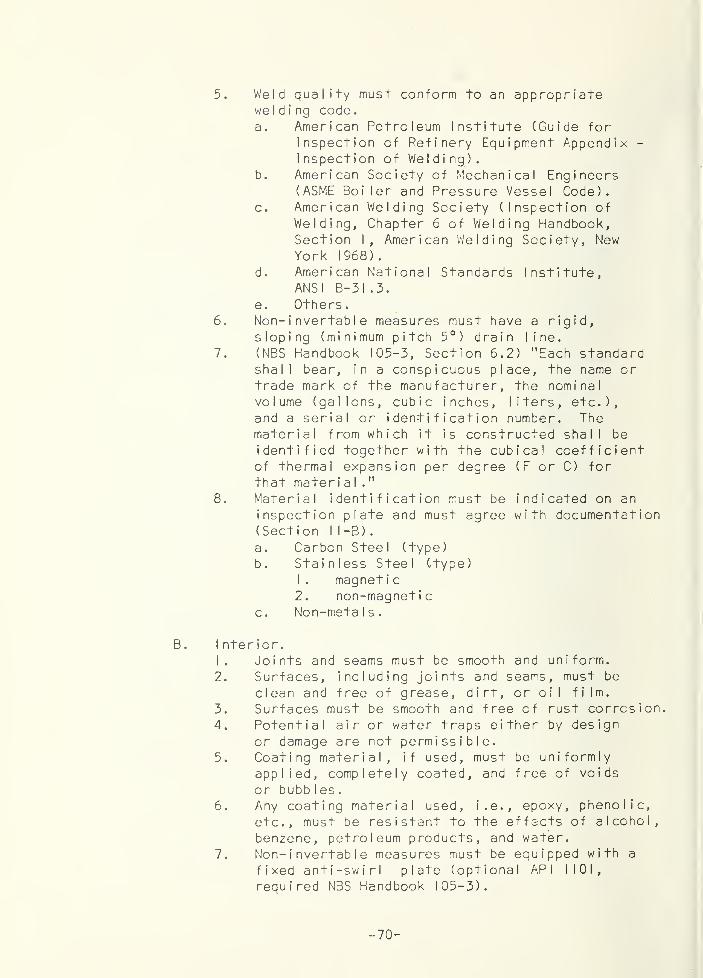
5. Weld quality must conform to an appropriatewelding code
.
a. American Petroleum Institute (Guide forInspection of Refinery Equipment Appendix -
Inspection of Welding).b. American Society of Mechanical Engineers
(ASME Boiler and Pressure Vessel Code).c. American Welding Society (Inspection of
Welding, Chapter 6 of Welding Handbook,Section I, American We I d i ng Society, NewYork 1968).
d. American National Standards Institute,ANSI B-3 I .3.
e. Others.6. Non- i nvertab I e measures must have a rigid,
sloping (minimum pitch 5°) drain line.
7. (NBS Handbook 105-3, Section 6.2) "Each standardshall bear, in a conspicuous place, the name ortrade mark of the manuf acturer , the nominalvolume (gallons, cubic inches, liters, etc.),and a serial or identification number. Thematerial from which it is constructed shall be
identified together with the cubical coefficientof thermal expansion per degree (F or C) forthat mater i a I
.
"
8. Material identification must be indicated on an
inspection plate and must agree with documentation( Sect ion II -B)
.
a. Carbon Steel (type)
b. Stainless Steel (-type)
1 . magnet i
c
2. non-magneticc. Non-metals.
B. Interior.
1. Joints and seams must be smooth and uniform.
2. Surfaces, including joints and seams, must be
clean and free of grease, dirt, or oil film.
3. Surfaces must be smooth and free of rust corrosion.
4. Potential air or water traps either by design
or damage are not permissible.5. Coating material, if used, must be uniformly
applied, completely coated, and free of voids
or bubbles.6. Any coating material used, i.e., epoxy, phenolic,
etc., must be resistant to the effects of alcohol,
benzene, petroleum products, and water.
7. Non- i nvertab I e measures must be equipped with a
fixed anti-swirl plate (optional API 1101,
required NBS Handbook 105-3).
- 70 -
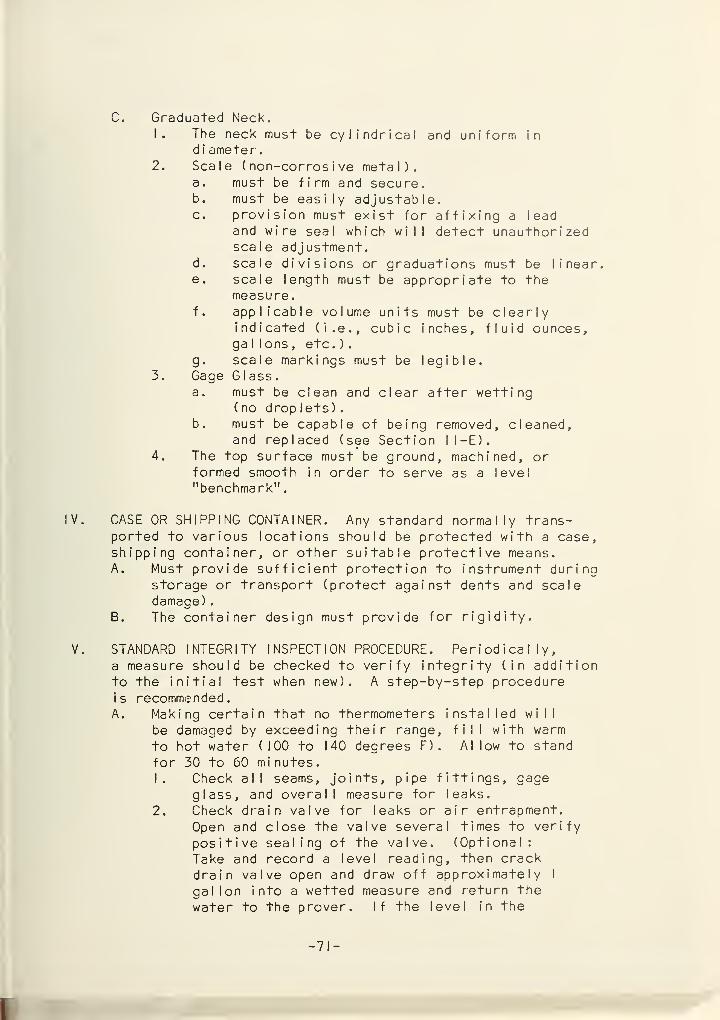
C. Graduated Neck.
1. The neck must be cylindrical and uniform in
d i ameter
.
2. Scale ( non-corros i ve metal).a. must be firm and secure.b. must be easily adjustable.c. provision must exist for affixing a lead
and wire seal which will detect unauthorizedscale adjustment.
d. scale divisions or graduations must be linear.e. scale length must be appropriate to the
measure.f. applicable volume units must be clearly
indicated ( i . e.
,
cubic inches, fluid ounces,ga I I ons , etc . )
.
g. scale markings must be legible.3. Gage Glass.
a. must be clean and clear after wetting( no drop I ets )
.
b. must be capable of being removed, cleaned,and replaced (see Section I I
— E )
.
4. The top surface must be ground, machined, orformed smooth in order to serve as a level
"benchmark"
.
V. CASE OR SHIPPING CONTAINER. Any standard normally trans-ported to various locations should be protected with a case,shipping container, or other suitable protective means.A. Must provide sufficient protection to instrument during
storage or transport (protect against dents and scaledamage)
.
B. The container design must provide for rigidity.
V. STANDARD INTEGRITY INSPECTION PROCEDURE. Periodically,a measure should be checked to verify integrity (in additionto the initial test when new). A step-by-step procedureis recommended.A. Making certain that no thermometers installed will
be damaged by exceeding their range, fill with warm
to hot water (100 to 140 degrees F). A I low to stand
for 30 to 60 minutes.1. Check all seams, joints, pipe fittings, gage
glass, and overall measure for leaks.
2. Check drain valve for leaks or air entrapment.
Open and close the valve several times to verify
positive sealing of the valve. (Optional:
Take and record a level reading, then crackdrain valve open and draw off approximately I
gallon into a wetted measure and return the
water to the prover. If the level in the
- 71 -
prover standard is lower, either there was airin the piping ahead of the valve, or some partof the valve body cavity previously filled withair is now filled with water.)
B. Drain the standard.
I. Observe the effectiveness of the anti-swirlplate while the fluid is draining.
C. Fill the standard with the calibrating medium.I. Repeat the checks listed in Sections V-A- I and
V-A-2
.
D. The thermometers to be used with the standard shouldroutinely be subjected to a calibration or a com-parison with a standard thermometer.
- 72 -
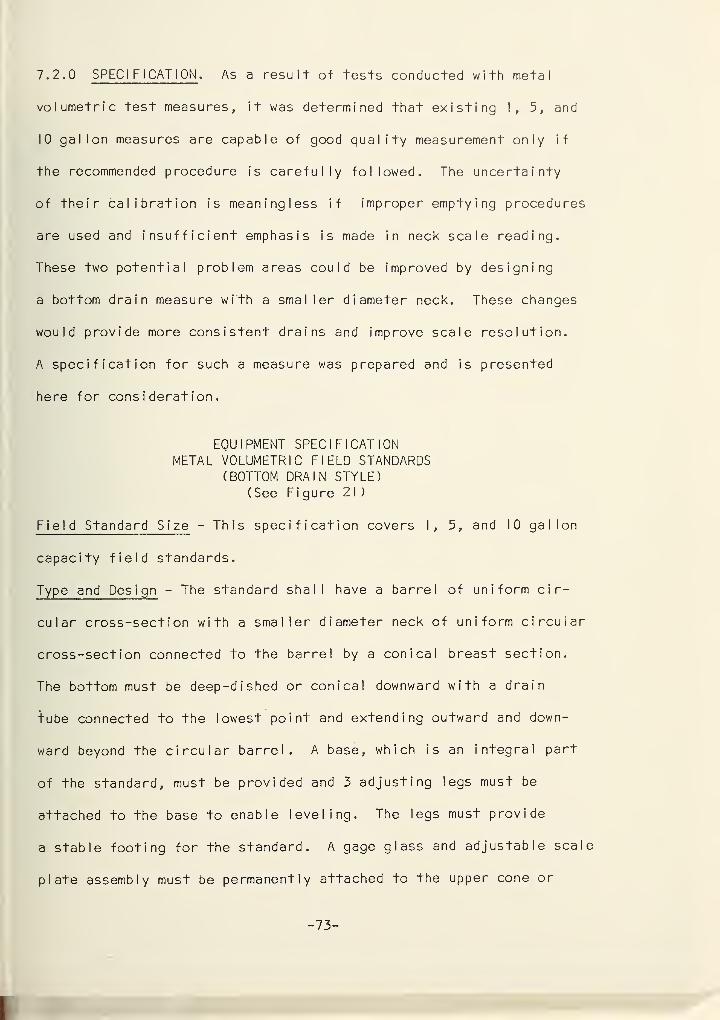
7.2.0 SPECIFICATION. As a result of tests conducted with metal
volumetric test measures, it was determined that existing 1, 5, and
10 gallon measures are capable of good quality measurement only if
the recommended procedure is carefully followed. The uncertainty
of their calibration is meaningless if improper emptying procedures
are used and insufficient emphasis is made in neck scale reading.
These two potential problem areas could be improved by designing
a bottom drain measure with a smaller diameter neck. These changes
would provide more consistent drains and improve scale resolution.
A specification for such a measure was prepared and is presented
here for consideration.
EQUIPMENT SPECIFICATIONMETAL VOLUMETRIC FIELD STANDARDS
(BOTTOM DRAIN STYLE)
( See Figure 21)
Field Standard Size - This specification covers I, 5, and 10 gallon
capacity field standards.
Type and Design - The standard shall have a barrel of uniform cir-
cular cross-section with a smaller diameter neck of uniform circular
cross-section connected to the barrel by a conical breast section.
The bottom must be deep-dished or conical downward with a drain
tube connected to the lowest point and extending outward and down-
ward beyond the circular barrel. A base, which is an integral part
of the standard, must be provided and 3 adjusting legs must be
attached to the base to enable leveling. The legs must provide
a stable footing for the standard. A gage glass and adjustable scale
plate assembly must be permanently attached to the upper cone or
- 73 -
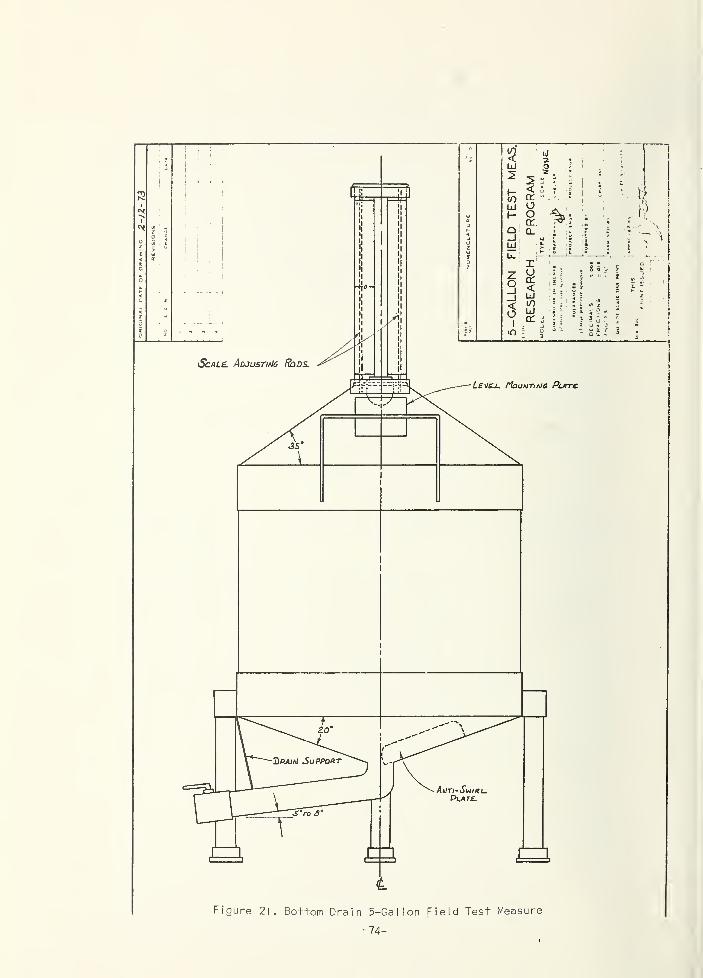
Z-/Z-73
-74-
breast section and the neck. Potential air or contamination entrap-
ments must be avoided.
Mater i a I- The mini mum low carbon steel or stainless steel material
required is 18 gauge ( 0 . 0478" nominal), except 16 gauge ( 0 . 0598 "
nominal) material for bottom cone and base. Aluminum, fibre-glass,
high impact plastics, or other materials must be of sufficient
thickness to equal or exceed the strength characteristics of low
carbon steel of specified thickness. Physical properties of any
material used must be certified.
The material must be impervious to any hydrocarbon liquid or
organic solvents. Dissimilar materials in a measure (i.e., 300 &
400 Series Stainless Steel) are not acceptable.
Fabrication - Field standards must be assembled to withstand reason-
able field and transit application.
Joints - All joints must provide strength equal to unjointed
material. Joints may be welded, brazed, or soldered. (Order of
preference as listed). Joints must be smooth, fully filleted
connections. Sharp protrusions or voids are unacceptable. If
metal is overheated during fabrication the device must be annealed
(heat-treated). NOTE: Soft solder is not permissible for achieving
the bottom joint. It can be used to fillet interior seams.
Forming or Shaping - All formed sections (top and bottom cone) must
be smooth continuous surfaces. Pockets, dents, or crevices that
may entrap air, liquid, or contami nents shall be judged unacceptable.
SPECIAL FABRICATION REQUIREMENTS
Handles - A pair of smooth handles shal I be attached to a top
- 75 -
reinforcing band. These handles should be located to facilitate
lifting the standard.
Reinforcing Bands - External reinforcing bands shall be attached to
the cylindrical barrel as judged necessary by the manufacturer
for strength and potential damage protection. Minimum 16 gauge
(0.0598" nomi na I )
.
Surface Preparation - If the standard interior and/or exterior is
to be coated or plated, the surface must be peened, sandblasted,
pickled, etc., in accordance with the recommendations of the coating
or plating manuf acturer . Standards that are not coated must be
completely free of foreign matter and chemically clean.
Coating, interior - The interior surface must be corrosion resistant
and impervious to hydrocarbons and organic solvents. Surface may
be coated with galvanized, terne-coated (lead-zinc), baked phenolic,
or epoxy resin. Epoxy or phenolic coatings must be 0.005 to 0.007
inches thick. Chemical resistance properties of coatings must be
documented to owner.
Coating, exterior - The exterior surface must be corrosive resistant
and impervious to hydrocarbons, organic solvents, and normal exposure
to atmosphere. Rust resistant materials do not require auxiliary
coatings unless specified. Painted measures must be primed with a
metal primer (zinc-chromate or equal) prior to painting.
SPECIAL REQUIREMENTS
I. The top surface of the standard must be a rolled edge or fitted
with a reinforcing ring. The top surface must represent a
level plane when the standard is placed on a level surface.
- 76 -
2. The gage glass must be borosilica+e or other material certified
to be impervious to extended service in hydrocarbons or organic
solvents. The minimum diameter shall be 0.50 inches.
3. The gage assembly must be rigid and shall include a gage glass
open at the top for cleaning and positively sealed at the bottom
without cement, a scale plate of appropriate divisions above
and below zero level, adjusting rods to provide 1/4 scale
division adjustments, and have provisions for attaching a
"lead and wire" seal such that adjustment or scale removal will
destroy the seal. The value of the scale divisions must be
clearly indicated on the scale, i.e., cubic inches, cubic
centimeters, etc.
4. Each standard shall bear a permanent conspicuous plate upon
which the following information appears:
a. Address, name or trademark of manufacturer.
b. Material identification (type and thickness).
c. Cubical coefficient of thermal expansion per degree
Fahrenheit or Celsius. (Reference shall be documented).
d. Manufacturers model number (optional).
e. Non-repet i ti ve serial or identification number.
f. Statement of nominal volume and reference temperature.
5. Device must comply with the requirements of Inspection Guide,
Section 7. I .0.
6. A positive sealing, fast acting valve shall be attached to the
drain line. The valve must be stamped with the same identifi-
cation number as the standard or provided with means to affix a
- 77 -
lead and wire seal between the valve and drain line. If a
ball valve is used it must have both upstream and downstream
seals. A short length of metal braided hose or a similar
conductor shall be installed on the downstream side of the
valve. The end of this hose shall not be threaded.
Anti-Swi rl Plate - A baffle or anti-swirl plate must be attached
to the bottom to reduce swirl during emptying.
Level Mounting Plate - A two- i nch-square flat surface must be provided
directly below the scale assembly. This surface may be soldered
to the gage assembly bottom nipple and the top cone. A "Bulls-eye"
level no greater than I” diameter is to be mounted on the plate to
indicate level when the measure is so adjusted.
Scale Assembly - The scale assembly shal I consist of a gage glass,
a graduated scale (I or 2), adjusting rods, fittings to seal the
gage glass such that the glass can be replaced without difficulty
(cementing is not acceptable), brackets for mounting the assembly
on the test measure, and brackets to hold the scale plate rigid.
The top bracket, the left-side adjusting rod, and the left-side
graduated scale should be drilled to accept a I ead-and-w i re seal.
The assembly must be designed so that the I ead-and-w i re seal will
be broken if the graduated scale is removed or adjusted. NOTE:
Right or left side notation refers to the side when viewed from the
f ront
.
Scale Plate - The basic scale on al I standards shal I be cubic inches
or cubic centimeters. If dual scales are used to include other units
-78-
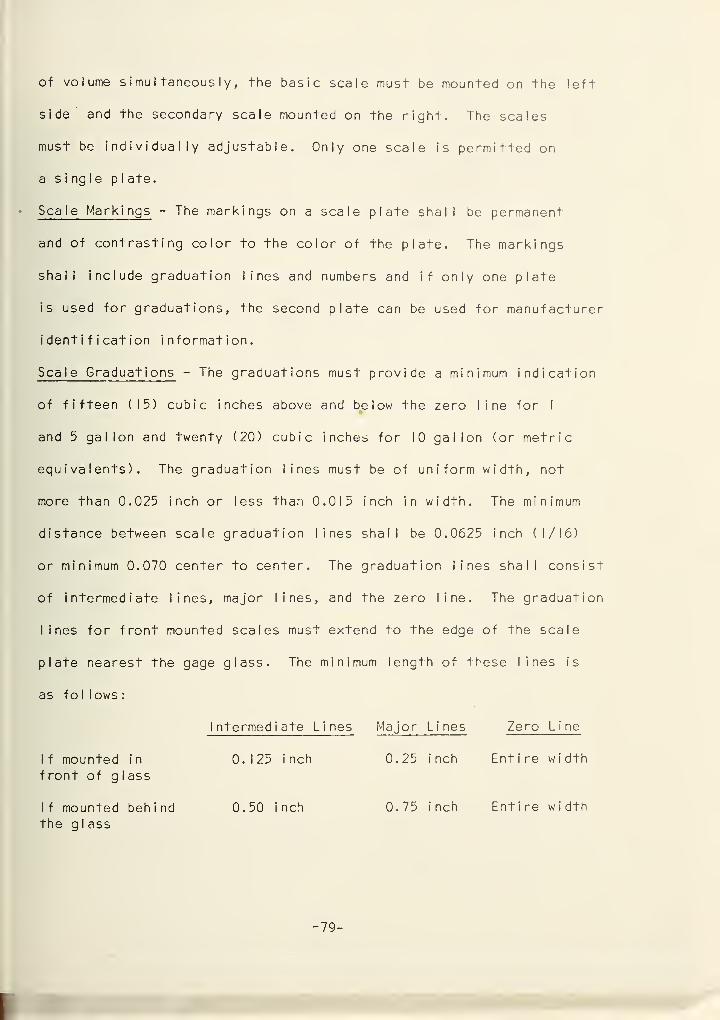
of volume simultaneously, the basic scale must be mounted on the left
side and the secondary scale mounted on the right. The scales
must be individually adjustable. Only one scale is permitted on
a single pi ate.
Sea I e Marki ngs - The markings on a scale plate shal I be permanent
and of contrasting color to the color of the plate. The markings
shall include graduation lines and numbers and if only one plate
is used for graduations, the second plate can be used for manufacturer
identification information.
Scale Graduations - The graduations must provide a minimum indication
of fifteen (15) cubic inches above and below the zero line for I
and 5 gallon and twenty (20) cubic inches for 10 gallon (or metric
equivalents). The graduation lines must be of uniform width, not
more than 0.025 inch or less than 0.015 inch in width. The minimum
distance between scale graduation lines shall be 0.0625 inch (1/16)
or minimum 0.070 center to center. The graduation lines shall consist
of intermediate lines, major lines, and the zero line. The graduation
lines for front mounted scales must extend to the edge of the scale
plate nearest the gage glass. The minimum length of these lines is
as foil ows
:
1 ntermed i ate L i nes Major L i nes Zero L i ne
1 f mounted i
n
front of glass0.125 i nch 0.25 i nch Entire w i dth
1 f mounted beh i nd
the glass0.50 inch 0.75 i nch Ent i re width
- 79 -
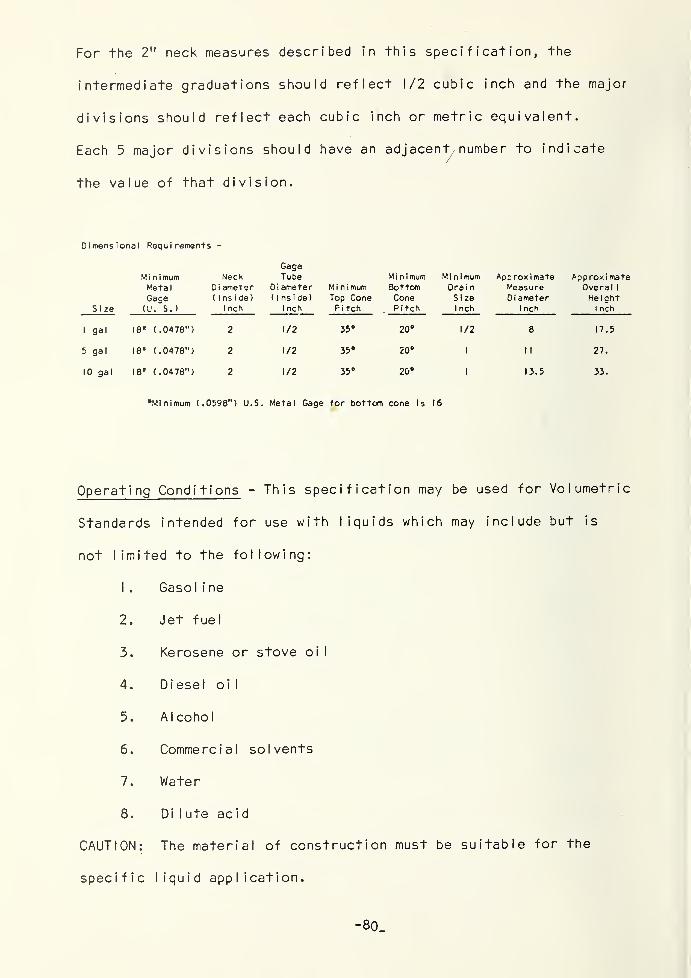
For the 2" neck measures described in this specification, the
intermediate graduations should reflect 1/2 cubic inch and the major
divisions should reflect each cubic inch or metric equivalent.
Each 5 major divisions should have an adjacent number to indicate
the value of that division.
Dimensional Requirements -
S i ze
Mini mumMeta 1
Gage<U. S.)
NeckDi ameter(Inside)
1 nch
GageTube
Di ameter( Inside)
1 nch
Mini mumTop ConeP i tch
Mini mumBottomConePitch
Mini mumDra i n
S i ze
1 nch
ApcroximateMeasureDi ameter
1 nch
ApproximateOvera 1 1
Height
1 nch
1 ga 1 18* (.0478") 2 1/2 35° K>Oo 1/2 8 17.5
5 gal 18* (.0478") 2 1/2 35° 20" 1 I 1 27.
10 gal 18* (.0478") 2 1/2 35° 20° 1 13.5 33.
•Minimum ( .0598") U.S. Metal Gage for bottom cone 1
s
16
Operating Conditions - This specification may be used for Volumetric
Standards intended for use with liquids which may include but is
not limited to the following:
1 . Gaso I i ne
2. Jet fuel
3. Kerosene or stove oi
I
4. Di ese I oil
5. Alcohol
6. Commercial solvents
7. Water
8. Di I ute aci
d
CAUTION: The material of construction must be suitable for the
specific liquid application.
- 80 .
8.0 CALIBRATION PROCEDURE . As evaluation tests were being conducted.
information was collected concerning procedural requirements to
establish repeatable measurements with metal volumetric standards.
It developed that a series of recommendations was considered
necessary for calibration activity. In evaluating the potential
audience for such a listing it was agreed that laboratory metrologists
would be the primary interested reader. The problem as to how best
to present a calibration procedure recommendation was discussed with
a number of State weights and measures laboratory metrologists.
The concensus of those contacted was preference of a step-by-step
procedure of the entire calibration procedure. A logical benefit
of such a presentation is larger acceptance and subsequently greater
calibration uniformity.
Two distinct calibrations may be encountered in volume cali-
bration activity. These different values are the amount of liquid
a vessel is able to hold or contain and the amount of liquid that
may be poured out or delivered from the vessel under specified
conditions. The two calibration values are commonly referred to as
"To Contain" and "To Deliver". The following descriptions are pre-
sented in an attempt to eliminate any misunderstanding of the two
types of calibration:
A "To Deliver" (WET) calibration reflects the volume that the
standard will deliver when emptied in a prescribed manner.
This calibration requires that the standard be initially filled
and emptied in accordance with prescribed procedures (wetted)
prior to the filling and emptying process of the calibration.
- 81 -
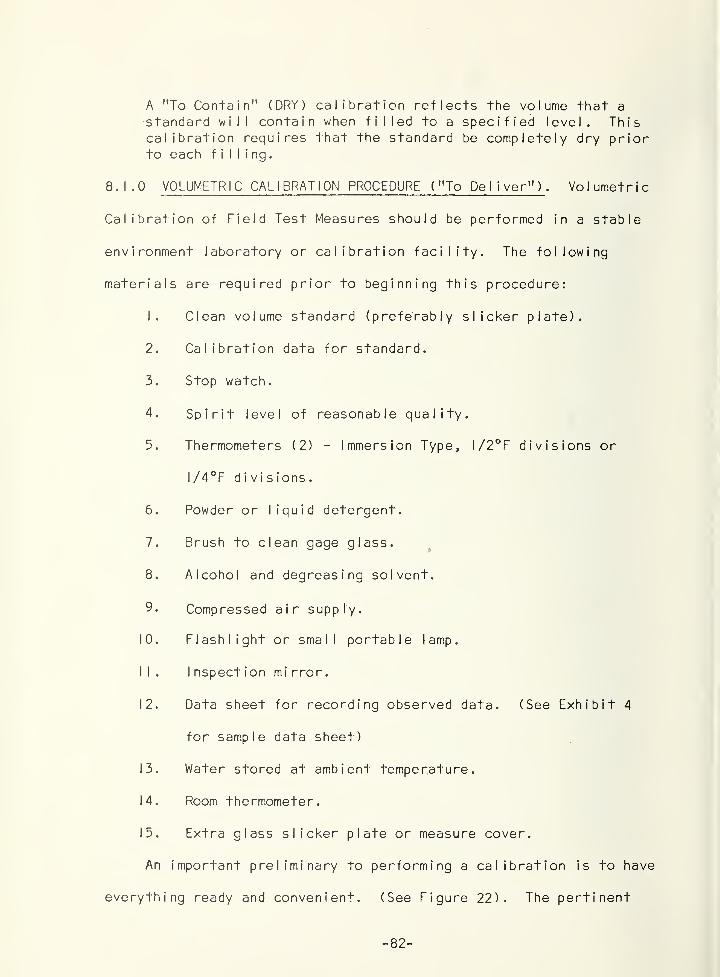
A "To Contain" (DRY) calibration reflects the volume that a
standard will contain when filled to a specified level. Thiscalibration requires that the standard be completely dry priorto each filling.
8.1.0 VOLUMETRIC CALIBRATION PROCEDURE ("To Deliver") . Volumetric
Calibration of Field Test Measures should be performed in a stable
environment laboratory or calibration facility. The following
materials are required prior to beginning this procedure:
1. Clean volume standard (preferably slicker plate).
2. Calibration data for standard.
3. Stop watch.
4. Spirit level of reasonable quality.
5. Thermometers (2) - Immersion Type, l/2°F divisions or
l/4°F di vis ions.
6. Powder or liquid detergent.
7. Brush to clean gage glass.
8. Alcohol and degreasing solvent.
9. Compressed air supply.
10. Flashlight or small portable lamp.
11. I nspect ion mi rror.
12. Data sheet for recording observed data. (See Exhibit 4
for sample data sheet)
13. Water stored at ambient temperature.
14. Room thermometer.
15. Extra glass slicker plate or measure cover.
An important preliminary to performing a calibration is to have
everything ready and convenient. (See Figure 22). The pertinent
- 82-
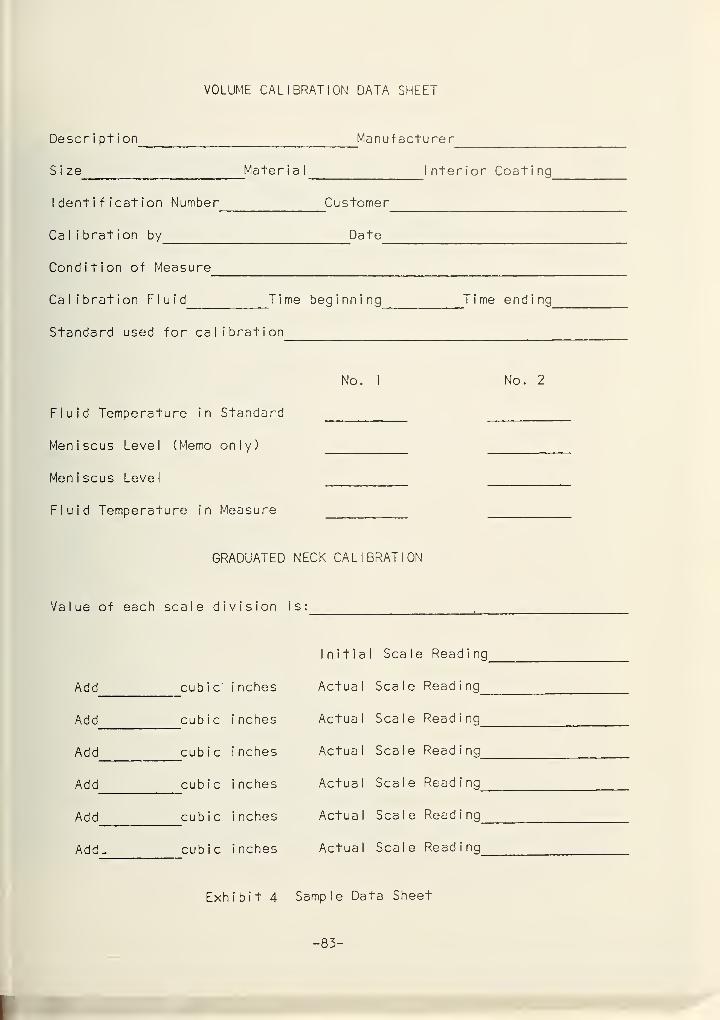
VOLUME CALIBRATION DATA SHEET
Descr i pt i on Manufacturer
Size Material Interior Coating
Identification Number Customer
Calibration by Date
Condition of Measure
Calibration Fluid Time beginning Time ending
Standard used for calibration
No. I No. 2
Fluid Temperature in Standard
Meniscus Level (Memo only)
Meniscus Level
Fluid Temperature in Measure
GRADUATED NECK CALIBRATION
Va 1 ue of each sea 1 e d
i
vision i s
:
Initial 1 Scalei Read i ng
Add cubic i nches Actua
1
Sea 1 e Read i ng
Add cubic i nches Actua
1
Scale Read i ng
Add cubic i nches Actua
1
Scale Read i ng
Add cubic i nches Actua
1
Sea 1 e Read i ng
Add cubic i nches Actua
1
Sea 1 e Read i ng
Add _ cubic i nches Actua
1
Sea 1 e Read i ng
Exhibit 4 Sample Data Sheet
-83 -
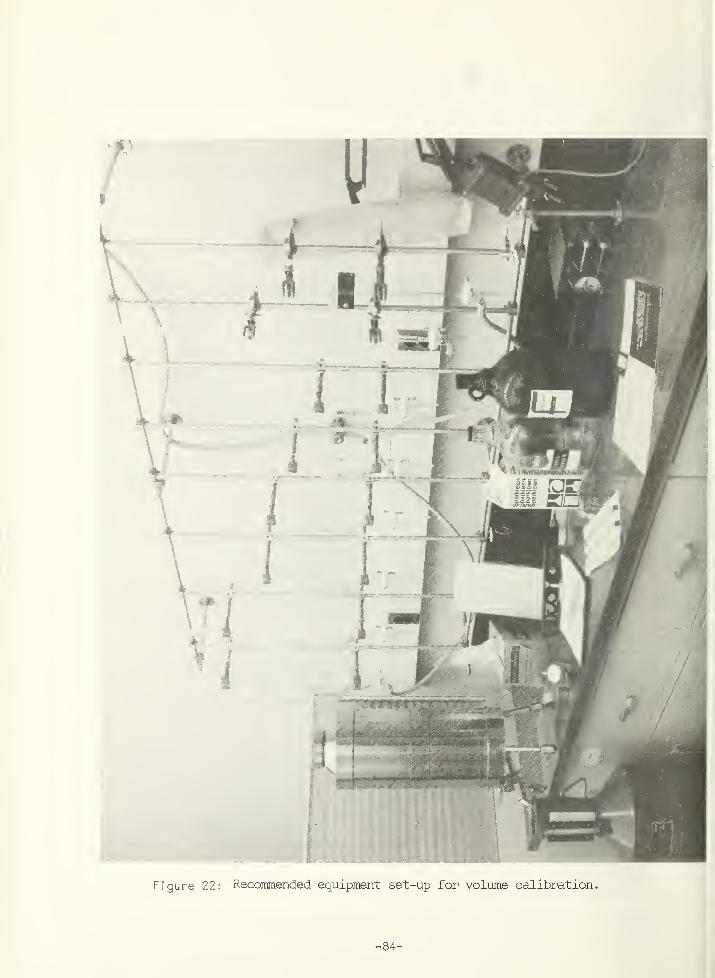
Figure 22: Recommended equipment set-up for volume calibration.
- 84-
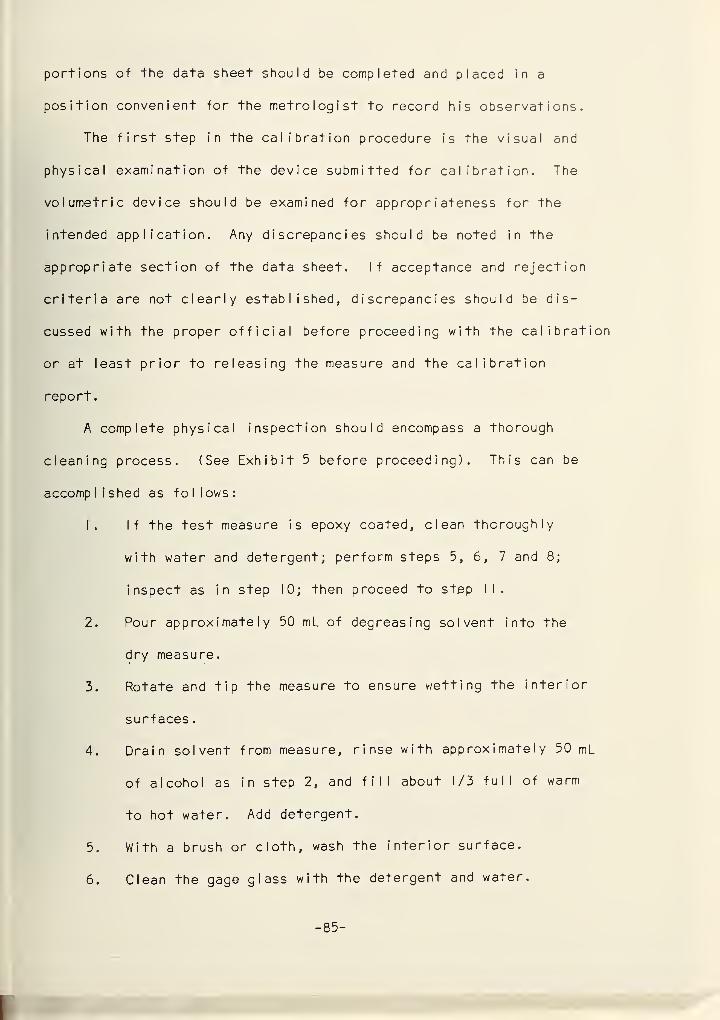
portions of the data sheet should be completed and placed in a
position convenient for the metrologist to record his observations.
The first step in the calibration procedure is the visual and
physical examination of the device submitted for calibration. The
volumetric device should be examined for appropriateness for the
intended application. Any discrepancies should be noted in the
appropriate section of the data sheet. If acceptance and rejection
criteria are not clearly established, discrepancies should be dis-
cussed with the proper official before proceeding with the calibration
or at least prior to releasing the measure and the calibration
report
.
A complete physical inspection should encompass a thorough
cleaning process. (See Exhibit 5 before proceeding). This can be
accomplished as follows:
1. If the test measure is epoxy coated, clean thoroughly
with water and detergent; perform steps 5, 6, 7 and 8;
inspect as in step 10; then proceed to step II.
2. Pour approximately 50 mL of degreasing solvent into the
dry measure.
3. Rotate and tip the measure to ensure wetting the interior
surfaces
.
4. Drain solvent from measure, rinse with approximately 50 mL
of alcohol as in step 2, and fill about 1/3 full of warm
to hot water. Add detergent.
5. With a brush or cloth, wash the interior surface.
6. Clean the gage glass with the detergent and water.
- 85 -
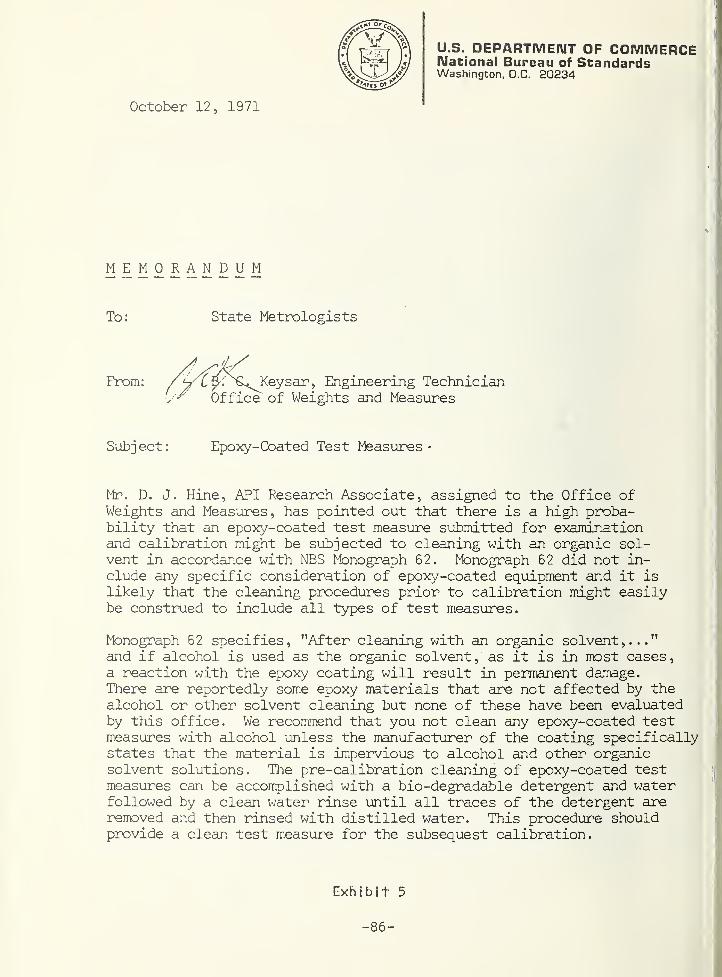
U.S. DEPARTMENT OF COMMERCENational Bureau of StandardsWashington. D.C. 20234
MEMORANDUM
To: State Metrologists
From: / thKeysar, Engineering TechnicianOffice of Weights and Measures
Subject: Epoxy-Coated Test Measures
Mr. D. J. Hine, API Research Associate, assigned to the Office ofWeights and Measures, has pointed out that there is a high proba-bility that an epoxy-coated test measure submitted for examinationand calibration might be subjected to cleaning with an organic sol-vent in accordance with NBS Monograph 62. Monograph 62 did not in-clude any specific consideration of epoxy-coated equipment ar.d it islikely that the cleaning procedures prior to calibration might easilybe construed to include all types of test measures.
Monograph 62 specifies, "After cleaning with an organic solvent,..."and if alcohol is used as the organic solvent, as it is in most cases,a reaction with the epoxy coating will result in permanent damage.There are reportedly some epoxy materials that are not affected by thealcohol or other solvent cleaning but none of these have been evaluatedby this office. We recommend that you not clean any epoxy-coated testmeasures with alcohol unless the manufacturer of the coating specificallystates that the material is impervious to alcohol and other organicsolvent solutions. The pre-calibration cleaning of epoxy-coated testmeasures can be accomplished with a bio-degradable detergent and waterfollowed by a clean water rinse until all traces of the detergent areremoved and then rinsed with distilled water. This procedure shouldprovide a clean test measure for the subsequest calibration.
Exhibit 5
- 86 -
7. Add warm water un+M the level is well up in the neck.
Let stand for 15 minutes and observe for leaks.
8. Empty the measure and flush with cool water until all
suds disappear.
9. Pour 50 to 100 mL of alcohol. Rotate and tip as in step 3.
0. Drain alcohol from measure, fill with water, inspect for
leaks and then empty measure.
1. Fill the standard (slicker-plate) with calibration quality
water. Use a thermometer to determine the water temperature
and record on the data sheet. Transfer this water to the
measure to be calibrated using the prescribed 30-second
drain following the cessation of flow. Close the drain
valve.
2. Using a thermometer, determine the water temperature and
record on data sheet. Slowly empty the test measure and
when the first drip appears on the lip, time 10 seconds.
NOTE: The vertical axis of the measure should never
exceed 85° from the horizontal. (See Figure 23). At
the end of 10 seconds, return the measure to the upright
position and place the extra glass slicker or cover on
the top of the neck of the measure to avoid excess evapora-
tion. The measure and standard are now prepared to receive
ca I i brat i on water.
3. Fill the standard with calibration water. Determine the
water temperature and record. Add water to the standard
and slide the slicker plate into position. Verify that no
- 87 -
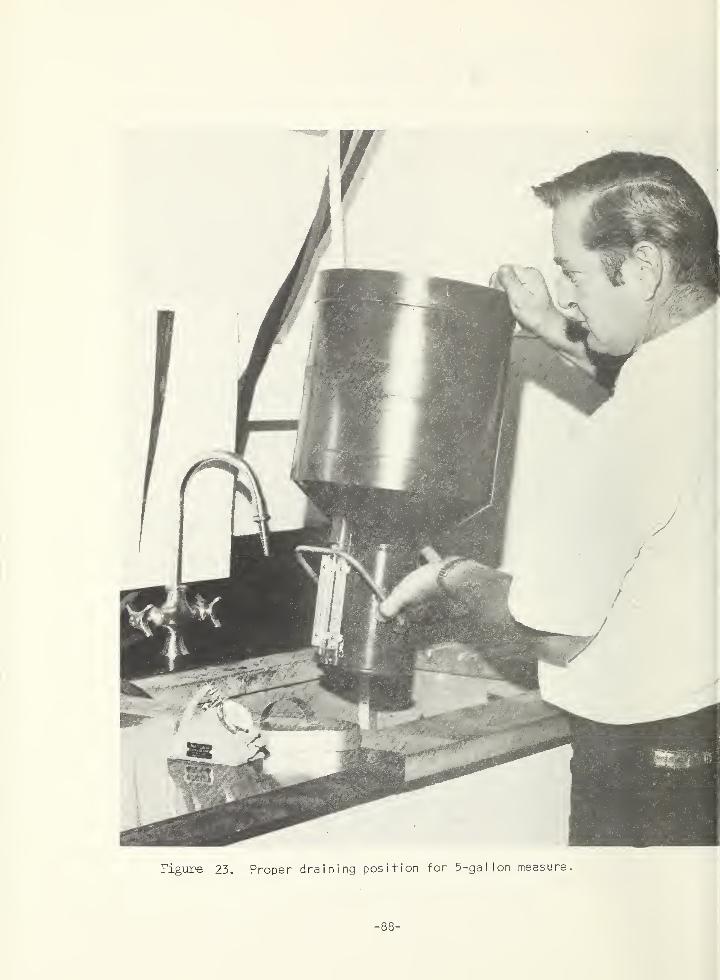
Figure 23, Proper draining position for 5-gallon measure.
- 88-
14 .
air bubbles appear under the plate.
Place the test measure, with cover removed, in position
such that the' top of the neck is slightly above and not
quite touching the open drain pipe of the standard. Open
the drain valve and immediately slide (don't lift) the
slicker plate off the top of the standard. Allow standard
to drain 30 seconds ' after cessation of flow as in step II.
Close the drain valve.
15. Carefully transfer the test measure full of water to a level
bench such that the meniscus in the gage glass is approxi-
mate I y at eye I eve I
.
16. Tilt the measure to raise the meniscus about I inch, then
return to level condition. This will insure that the
level in the neck is the same as the gage glass. NOTE:
This can also be accomplished by either blowing gently
into the top of the glass or by inserting a finger into
the top of the glass and removing quickly, causing the
water in the glass to rise.
17. When the meniscus has come to rest, estimate and record (Memo only
the scale reading correspond i ng to the meniscus level when
viewed at a distance of several feet. (ALWAYS READ AND
RECORD THE BOTTOM OF THE MENISCUS LEVEL).
18. Placing the eye close to the scale and gage glass (approxi-
mately 5 inches), read and record the scale value corres-
ponding to the level of the meniscus bottom. (Levels between
scale divisions should be estimated 1o the nearest 0.1
- 89 -
division.) A convenient aid to scale reading is a rectangular
piece of white paper with a line drawn through the center.
(See 5-Gallon measure - Figure I). The paper is inserted
between the scale plate and the adjusting rods and in
back of the gage glass. Starting with the line on the
paper below the meniscus, slowly raise the paper until the
line exactly coincides with the bottom level of the meniscus.
Record the observed level and compare with data from item
17. This will eliminate gross reading errors.
19. Insert a thermometer on a string into the gage glass and
slowly raise and lower the thermometer for approximately
20 seconds. Slowly raise the thermometer until the
/
indicated temperature is just visible in the gage glass
and can be read. This reading will be the water temperature.
Remove the thermometer and record the observed water
temperature.
20. Empty the test measure as described in step 12.
21. Repeat steps 13 through 20 recording data as indicated.
22. Compare the data from Run #1 with Run #2. If the tempera-
ture has remained virtually constant and the scale readings
do not differ by more than 1/2 of a scale division, the
calibration is finished. If the temperature is different,
the temperature corrected volumes must be calculated to
judge agreement between the two determinations.
23. Calibration of the graduated neck is accomplished by
removing water until the scale reading is significantly
- 90-
(15 in^ if possible) below zero. Add liquid from a flask
calibrated in increments of 5 scale divisions, reading
and recording each incremental level, until the fluid
level is well above zero. This should be performed twice
to establish proper accuracy.
24. If a test measure is to be stored for an extended period
in an environment that could promote rusting, the measure
should be adequately protected. It can be thoroughly
dried and stored in a sealed box containing a desiccant
or it could be thoroughly wetted with kerosene prior to
storage
.
25. Perform calculations as follows:
CHANGE IN CAPACITY CAUSED BY CHANGE OF TEMPERATURE
If the capacity of a measure at any temperature, for example
60°F, is known, the capacity at another temperature may be deter-
mined by the use of the following formula:-
V+ = V 60 [I + a(t-60)]
where V-(- = Capacity at t°F,
V 50 = Capacity at 60°F,
a = Coefficient of cubical expansion of the material
of which the measure is made, per degree F andr
t = Water temperature °F
Average coefficients (per °F) for the metals most widely used
in capacity standards are:
Brass 0.000030 (7)
Copper .000028 (7)
- 91 -
Low carbon steel .0000186 (5)
18-8 stainless steel .0000265 (8)
(Numbers in parentheses indicate reference numbers.)
CORRECTION FOR DIFFERENCE IN TEMPERATURE
If the temperature of the water in the standard differs from
that of the water in the measure being calibrated, a correction
must be applied to bring the volumes of water to the same temperature
bas i s
.
A table for this purpose has been incorporated (Table I) in
API Standard 1101 D'9ll. Lacking such a table, factors for the
adjustment of water volumes to a common temperature may be derived
from the density values. Water density tables are available from
various handbooks as well as Table I, page 24 of this report.
Any correction to the water volume is partly offset by the
volume change in the metal measures. (The temperature of a measure
is assumed to be the same as that of the water contained.) To
adjust the capacity of one measure to the capacity it would have
at the temperature of the other, a modification of formula (I) may
be used.
Correction = Va(t-t|) (2)
Where V = measured volume
a = coefficient of cubical expansion of the measure
whose volume is being adjusted,
t— t |
= temperature difference between measures.
As an example of the correction for a difference in temperature,
let us assume that the average temperature of the water in a standard
- 92 -
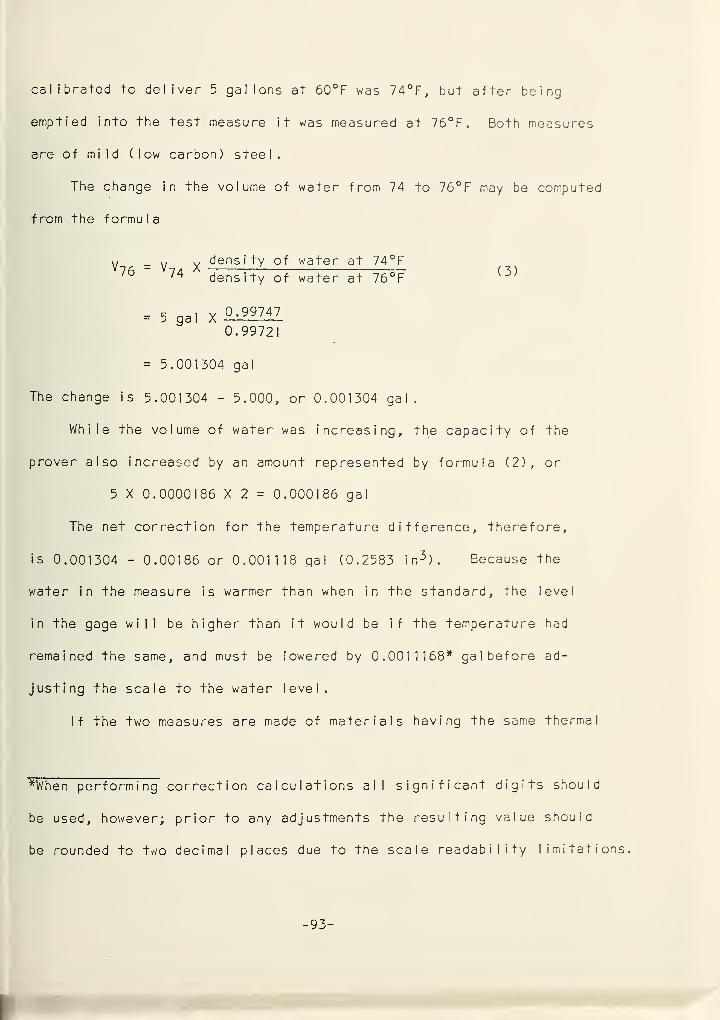
calibrated to deliver 5 gallons at 60°F was 74°F, but after being
emptied into the test measure it was measured at 76°F. Both measures
are of mild (low carbon) steel.
The change in the volume of water from 74 to 76°F may be computed
f rom the formu I a
w _ ,, w density of water at 74°F- V 7 / X - —' density of water at 76 F
= 5 gal X MiZ£L0.99721
= 5.001304 gal
The change is 5.001304 - 5.000, or 0.001304 gal.
While the volume of water was increasing, the capacity of the
proven also increased by an amount represented by formula ( 2 ), or
5 X 0.0000186 X 2 = 0.000186 gal
The net correction for the temperature difference, therefore,
is 0.001304 - 0.00186 or 0.001118 qa I (0.2583 in 3 ). Because the
water in the measure is warmer than when in the standard, the level
in the gage will be higher than it would be if the temperature had
remained the same, and must be lowered by 0.0011168* gal before ad-
justing the scale to the water level.
If the two measures are made of materials having the some thermal
*When performing correction calculations all significant digits should
be used, however; prior to any adjustments the resulting value should
be rounded to two decimal places due to the scale readability limitations.
- 93 -
expansion coefficient, no further correction is necessary since the
standard is correct at 60°F.
CORRECTION FOR DIFFERENCE IN THERMAL EXPANSION OF MEASURES
If a standard is being used to calibrate a measure made of
material having a different thermal expansion coefficient, and the
temperature is other than the standard temperature (usually 60°F),
a correction must be applied to account for the difference in volume
change of the two instruments. The correction may be represented
by the following equation:
C = V ( t-60) ( a| -a2 ) (4)
where C = correction,
V = measured volume,
t = temperature of observations (°F),
oi| = cubical coefficient of thermal expansion of metal
in standard per degree Fahrenheit, and
0.2 = cubical coefficient of thermal expansion of metal
in measure being calibrated per degree Fahrenheit.
For example, suppose that a 5-gallon measure made of low-carbon
steel is being calibrated with a 5-gallon standard made of 18-8
stainless steel. The average temperature (measured in the water when
the instruments are full) is 75°F. The correction would be:
C = 5 (75-60) (0.0000265-0.0000186)
= 0.00059 gal
.
= .1369 in 3
The standard, having a larger expansion coefficient, will, when
filled and emptied into the measure, fill the prover to a higher
- 94 -
level by 0.1369 i than it would if both measures were at the
standard temperature of 60°F. If the water level in the measure
was lowered by 0.1369 in^ and the zero line on the scale adjusted
to that level, the measure would be correct at 60°F.
When working at a temperature below 60°F, the scale should be
adjusted upward when other conditions are as in the preceding example.
At 50°F the correction would be 5 X 10 X 0.000079 or 0.0004395 gal
(0.0912 i n^) . If 0.0912 in^* of water were added to the prover and
the zero line on the scale adjusted to that level, the prover would
be correct at 60°F.
26. If the calculated equivalent scale reading does not reflect
need for scale adjustment the test measure should be sealed
with a I ead-and-w i re seal and returned to the owner along
with a report of calibration.
27. If the scale requires adjustment, the measure should be
retested using steps II through '20, inclusive, to verify
that proper adjustment had been performed'.
8.2.0 VOLUMETRIC CALIBRATION PROCEDURE ("To Contain") . "To Contain"
calibrations are best accomplished using a gravimetric technique.
If a gravimetric calibration is to be performed, it is recommended
that the procedure outlined in Section 4.0 be used.. If a volumetric
"To Contain" calibration is to be performed, the procedure outlined
in Section 8.1.0 should be modified such that the standard is thoroughly
dried prior to performing step 14 of the calibration procedure.
-95-
9.0 TEST MEASURE PROTOTYPE. The specification of Section 7.2.0 was
used to purchase a device to be used in a field test program.
The "as built" measure was thoroughly inspected to determine
compliance with the specification. The measure was found to conform
to all specification requirements with the exception of having an
approximate neck inside diameter of 2.125" instead of the specified
2". The overall height of the measure is approximately 32 inches.
The prototype measure was judged to be acceptable. The general
description of the measure as indicated on the identification plates
i nc I udes
:
Delivers 5 Gallons to zero
Model M Special, Serial Number 18994
Stainless Steel type 304
Cubical coefficient of thermal expansion 26.5 X ICT^ per °F
Figure 24 is a photograph of the measure.
The measure was subjected to a gravimetric calibration employing
the NBS procedure discussed in section 4.0.
9.1 FIELD TEST PROGRAM . A test program was devised to check operating
gasoline dispensers with both a conventional 5-gallon field standard
and the prototype. The tests consisted of routine dispenser checks
with each dispenser being checked independently with both measures.
The tests were conducted by B. C. Keysar and D. J. Hine. The pro-
cedures used for the tests, following inspection and pretest deter-
minations in accordance with NBS Handbook 112, were as follows:
-96-
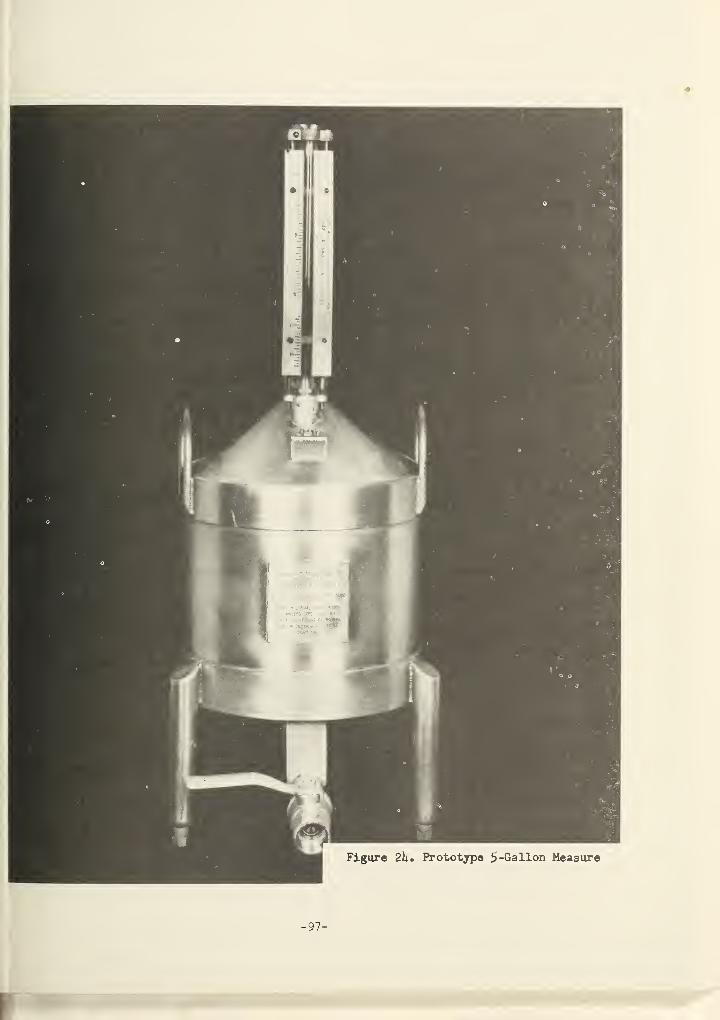
I
r
Prototype Measure
1. The measure was placed adjacent to the dispenser to be
tested and adjusted to level condition. The position of
the 3 legs of the measure was marked for convenience in
returning after each draft.
2. The dispenser register was returned to zero and the in-
dicator position noted if not zero.
3. The totalizer readings were noted and recorded.
4. The electrical switch was activated to energize the dis-
penser pump.
5. A 5-gal Ion draft was made to wet the measure with test
product.
6. The wet-down draft was returned to appropriate storage as
directed by the service station operator. A 10-second
drain following cessation of main flow was used.
7. A 5-gallon draft was made to the measure. If the dispenser
was equipped with an automatic nozzle, the fast-flow setting
was used. The draft was terminated with the register
indication as close as possible to 5.0 gallons.
8. The test measure neck scale indication was observed and
recorded
.
9. Dollar amount verified by manual price/gallon computation.
10. The product was returned to appropriate storage as in Step 6.
11. Repeat Steps 2, 4, 7, 8, and 6.
12. Repeat Steps 2 and 4 followed by a slow-flow 5-gallon draft
- 98 -
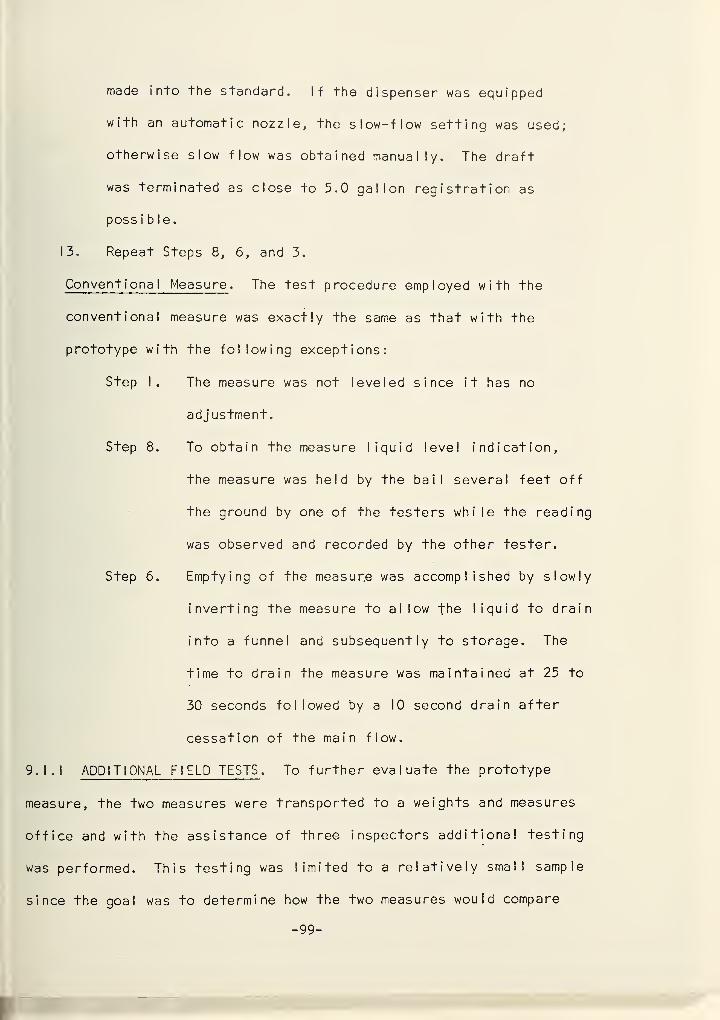
made into the standard. If the dispenser was equipped
with an automatic nozzle, the slow-flow setting was used;
otherwise slow flow was obtained manually. The draft
was terminated as close to 5.0 gallon registration as
poss i b le.
13. Repeat Steps 8, 6, and 3.
Conventional Measure . The test procedure employed with the
conventional measure was exactly the same as that with the
prototype with the following exceptions:
Step I. The measure was not leveled since it has no
adjustment.
Step 8. To obtain the measure liquid level indication,
the measure was held by the bail several feet off
the ground by one of the testers while the reading
was observed and recorded by the other tester.
Step 6. Emptying of the measure was accomplished by slowly
inverting the measure to allow the liquid to drain
into a funnel and subsequently to storage. The
time to drain the measure was maintained at 25 to
30 seconds followed by a 10 second drain after
cessation of the main flow.
9.1.1 ADDITIONAL FIELD TESTS . To further evaluate the prototype
measure, the two measures were transported to a weights and measures
office and with the assistance of three inspectors additional testing
was performed. This testing was limited to a relatively small sample
since the goal was to determine how the two measures would compare
- 99 -
when used by persons normally responsible for testing gasoline
di spensers.
9.2 F I ELD TEST DATA . When conducting the tests described in 9.1
and 9.1.1 the data was recorded on the form shown as Exhibit 6. A
summary of the data collected during the routine phase of the field
test program is shown in Exhibit 7. The results of the additional
field tests conducted on six dispensers is not included, however;
the results of those tests differed only in that the magnitude of
the difference between the two standards was greater. Comparison
of the data presented in Exhibit 7 reveals that in most tests the
results obtained with the conventional field standard were slightly
more positive (less negative) than indicated with the prototype stand-
ard .
9.3 CONCLUSIONS FROM FIELD TESTS . The field test program for testing
gasoline dispensers was very limited and was performed primarily to
verify the capability of the prototype measure. The tests did provide
evidence that the concept of the measure was extremely good.
Scale reading was greatly simplified for the width of 1/2 cubic inch
division was greater on the prototype than I cubic inch division
on a conventional measure. Additionally, the emptying procedure
was much easier since the prototype measure was drained through its
own hose and no funnel was required. Also, the drain time was not
influenced by any human factor. It was recognized that the process
of moving the standard from the dispenser to the storage tank fill
pipe was awkward for only one individual. This could easily be
- 100-
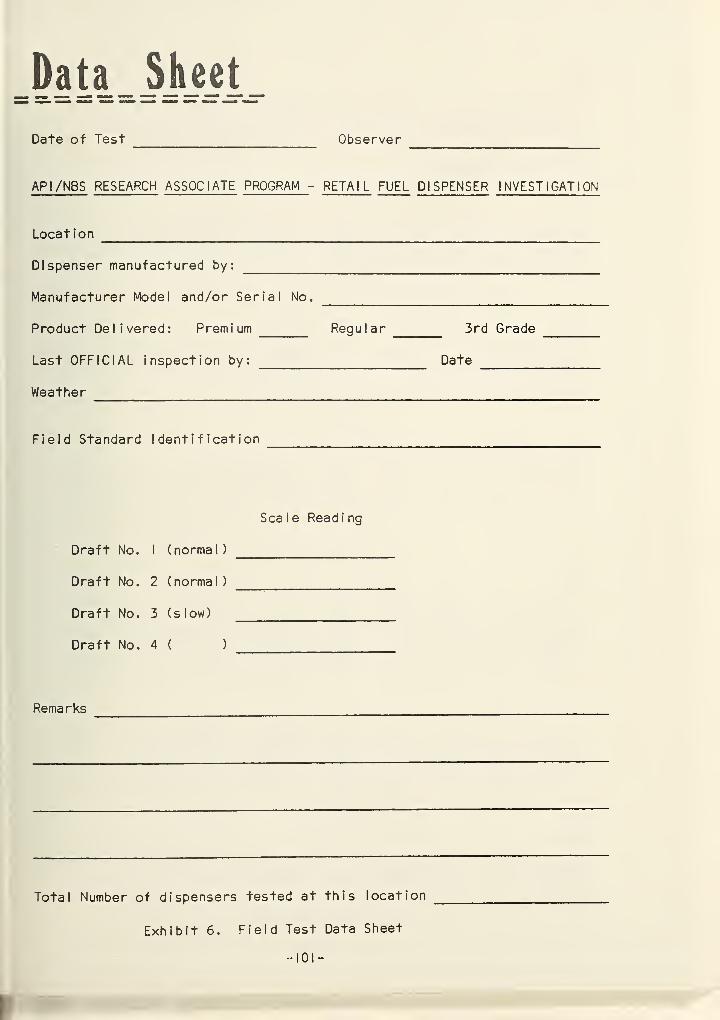
Data = S=hee|
Date of Test Observer
API/NBS RESEARCH ASSOCIATE PROGRAM - RETAIL FUEL DISPENSER INVESTIGATION
Location
Dispenser manufactured by:
Manufacturer Model and/or Serial No.
Product Delivered: Premium Regular 3rd Grade
Last OFFICIAL inspection by: Date
Weather
Field Standard Identification
Sea I e Read i ng
Draft No.
Draft No.
Draft No.
Draft No.
1 ( norma I
)
2 ( norma I
)
3 (slow)
4 ( )
Remarks
Total Number of dispensers tested at this location
Exhibit 6. Field Test Data Sheet
101 -
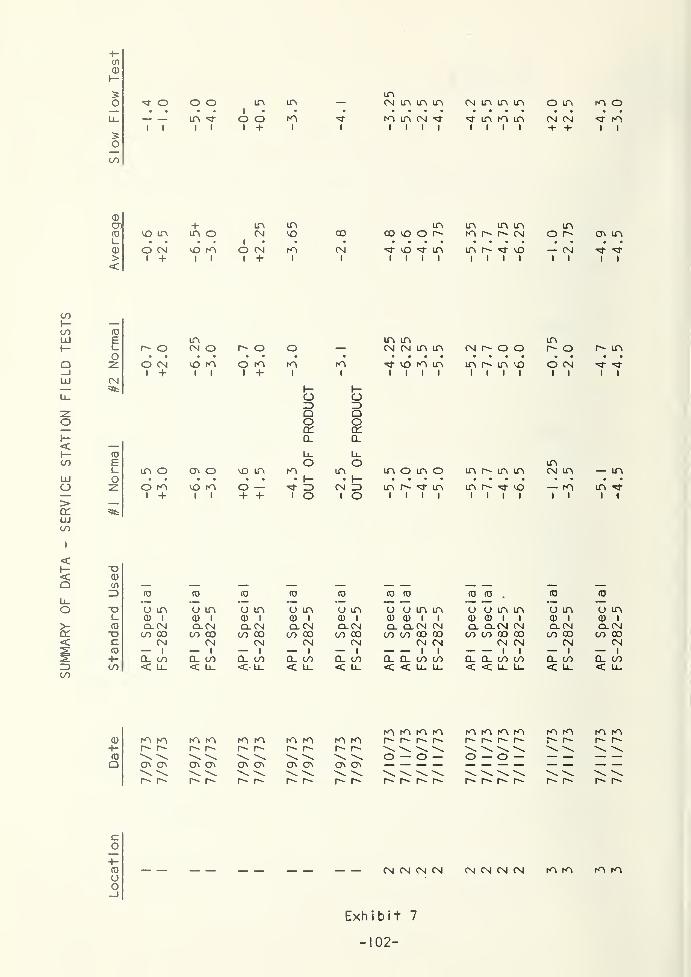
SUMMARY
OF
DATA
-
SERVICE
STATION
FIELD
TESTS
in
<d
ino M- O o o in in — CM in in in CM in in in o in m o— • • • •
i• •
Li. in o o m m in CM ^3- in m in CM CM m1 1 i i i + i i i i i i i i i i + + • i
soco
CD
cn + in in in in in in in0 no in tn o CM NO ao co NO o p- m p- r- CM o p- ON ini_ • • • •
i• •
a) O CM no m O CM m CM NO in in p- NO — CM><
1 + i i i + i 1 1 1 i i i i i i i i 1 1
(N=*fc
0EL.
o
in in in inr- o CM o r- o o — CM CM in tn CM p~ o o r- o r- in
o CM no m o m m m NO m in in p- in NO O CM ‘‘Tf
i + i i l + 1
1
—
1
1
—
1 i i i i i i 1 i i i i
o oZD ZDQ QO OCL CLCL CL
Li_ Ll.
O O inin o ON o no in m in in o in o in r~ in in cm in — in
o m no m o — m- zd CM ZD in p- in in p~ NO — m ini + i i + + l O 1 o t i i i i i i i i i l 1
T3<1)
l/l
3 0 (0 <0 CO 0
T3 O in o in o in u in <_> in1_ 0 i CD 1 a) i <D 1 (D 1
CO CL CM CL CM CL CM CL CM CL CMTJ CO CO CO CO CO 00 CO 00 CO coc CM CM CM CM CM<0 —
1— 1 —
i — 1 1
+“ CL CO CL 00 0. CO Q_ CO CL coCO < Lc < Ll. < Ll. < Ll_ < Ll.
CD 0 <0 (0 . 0 0U O in in o U in in a in a tnCD © i i 0 0 i i © i © i
CL CL (M CM Q- CL CM CM CL CM CL CMCO CO 00 co CO CO co 00 CO 00 CO CO
CM|
CM1
CM CM1
CM__ |
CM1
CL a.1
CO1
CO CL CL1
CO1
CO CL CO CLII
CO< < Lc Lc < < Li_ L_ < Ll. < U_
0+-0a
m mr- r'\ \on on
r-'
m mr- r~\ \ON ON\ \r-' r-~
m mp- r-\ \ON ON\ \r- r-
m mr- r-
ON ON
r- r-
m mp- p~\ \On ON\ \p~ p~
m m m mp- n- p- r-wwo — o —
m m m mp- p- p-\o o —
mm mmp- r- p~ p^w w
p- p- p- r-WW W \Np~ p~ r~ p" p- p~ p~
c0
CM CM CM CM cm cm cm cm mm mm
Exh i b i t 7
- 102 -
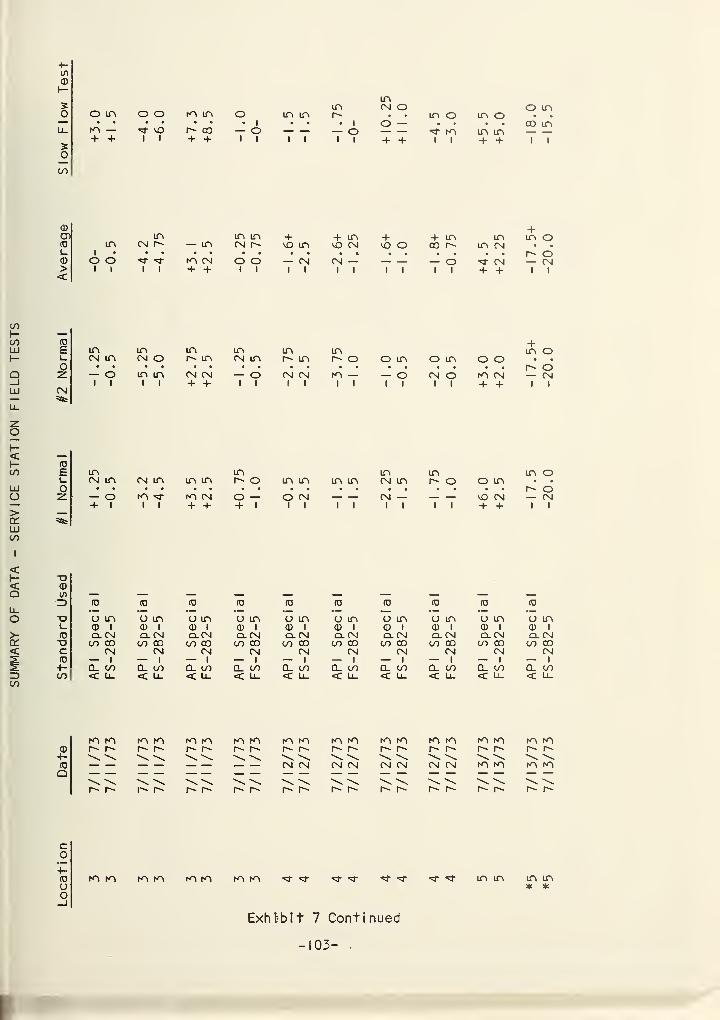
SUMMARY
OF
DATA
-
SERVICE
STATION
FIELD
TESTS
in
®
oco
o in o om — mo4- + It
ro in o• • • i
r- oo — o+ + ii
inin in r-'
• • • i— oii ii
incm o
• • in oo — • •
*3- m4- + ii
m o o in
• . 00 inin in — —4- 4- i i
©O) in in in + + in ~h + in in© in CM C" — in cm r-~ \o in vO CM MO O 00 I"" in CML. i
© o o m cm o o — CM (XI — — — — O CM>< i i i i + + i i i i i i 1 1 i i + +
(0
E in in in in in ini_ cm in CM O C" in cm in r-~ in r- o o in o in o oO.l: — o in in CM CM — o CM CM m — — o CM o m CM
CM=*fc
i i i i 4- + i i i i i i i i i i + +
©E in in in ini_ cm in cm in in in r~ o in in in in cm in r- o o inOzz — o m m cm o — O CM CM — M0 CM
=«fc
+ i i i + + 4- 1 i i i i i i i i + 4-
-O©in
ZD ro © © © ro ro © © ro•— •— •— •— •— «
—
•— •
—
-o o in <j in u in o in o in u in o in o in o inl_ © i © i © 1 © 1 © 1 © 1 © 1 © 1 © 1
© CL CM CL CM CL CM CL CM CL CM Cl XI CL CM CL CM Cl CMO CO 00 CO CO CO CO CO 00 CO 00 CO 00 CO 00 U~) CO cr> coc CM CM CM CM CM CM CM CM CM© — 1
—1
—1 — 1 — 1 — 1 — 1
— 1 — 1
4- CL CO CL CO CL CO Q_ CO Q_ co CL CO CL CO Q_ CO CL COCO < L- < U- < Ll_ < L_ < l_L_ < Ll_ < L- C Ll_ < L_
©(0Q
fn mr- i-"\ \
m m mmi"- i"- r- r-'w w m m
n- r-m m m m m m m m m mr-~ r~ r-~ r- r~ r-\ M X X X X X X X XCM CM CM CM CM CM CM CM m m
NX XXr~ i''
XX XX XXr* r-- r~ r~- r- r- c- r-~
\ xn- c- r- r-~
\ \r- r-
cO
mm mm mm mm m- m- m- x- m- M’ m- in in mm* *
Exhibit 7 Continued
- 103 -
7/13/73
API
Special
-17.5
-17.5+
-17.5
7/13/73
FS-282-5
-20.0
-20.0
-20.0
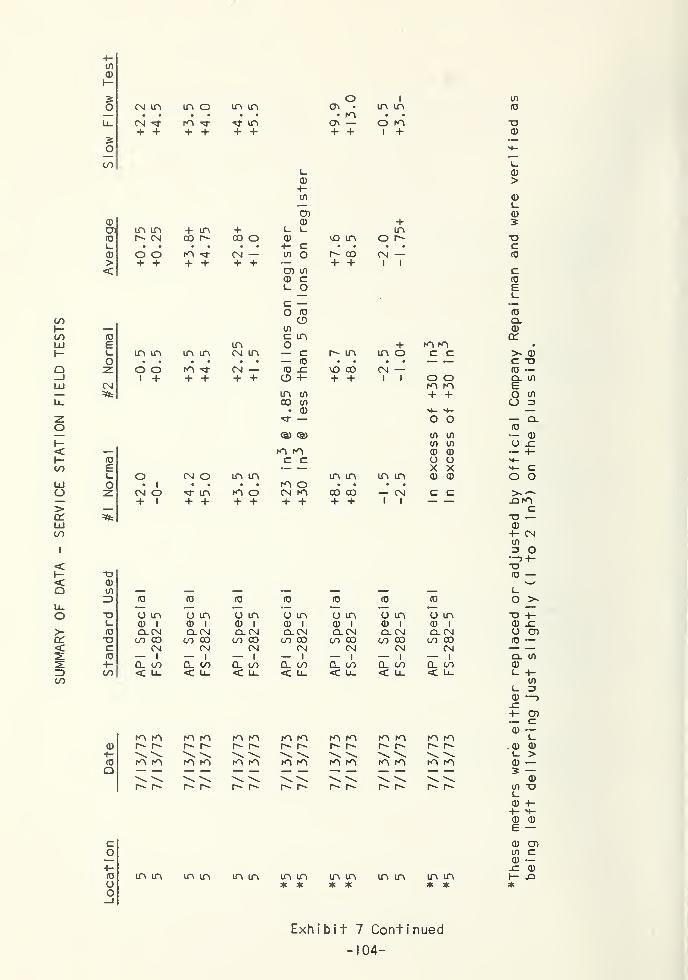
3 O i ©o cn in in o in m cr\ • in in ©
• m • •
Ll (N -"3- m in ON — o m TD
3+ + 4- 4- 4- 4- 4- 4- 1 4- ©
1_©
in
CD
©L.
C —o ©
CO CDf
— ©CO ro c inUJ E in O *+• fO enh- i_ in in in in cn in — c f" in in o c c
O — © • • • • — .
—
a 3 o o m CN — CD SZ CO CD (N —1 4- 4- 4- 4- 4- CD 4- 4- 4- 1 1 o o
UJ CN en m— =*fc in © 4- 4-
u_ CD ©• © 4- 4-^ o oO— C§) <§) © ©
h- © ©< — en en © ©1- © c c o uCO E — — X X
i_ O CN O in in in in in in © ©UJ O • I
• • • • m o • • • •
CJ 3 CN O N" in m o cn en oo CD — CN c c4- I 4- 4- 4- 4- 4- 4- + 4- 1 1
— —> —DC =*fc
UJCO
<1- X><Q ©
©3 © © © ro ro ro ©
u_ • •— •— •
—
•
—
•—o a o in o in o in u in o in o in o in
L. © i © i © i © i © i © i © i
>- © a. cn Cl (N Cl CN CL CN CL CN CL CN CL CNDC TD CO CD CO CD CO CO co <D CO CD CO CD CO CD<s:s:
C©4-
<N CN <N CN (N CN CN
CL co CL CO CL CO CL CO CL CO CL co CL CO3 CO < u_ < U. < U_ < Ll < Ll < ll < U_CO
©>
©
©©CDro
in ine- cn
4- inoo e-
“f*
00 OL_
©
0L_
vo in 0 75
+ 3
X)4- c • • • • c
© o o en n- CN — © O P~ CD CN — ro
>< + 4- 4- 4- 4- 4-
CD ©4- 4-
1 1
c©E
©CL©ac
>c©CLEOo
©
c_>
>JO
a©4-in3—
:
"O©
OX>©u©
CL©
©JZ
K'l rO
\ N.fO m
r- r-
ir> in
m mr- r~-
m in
in in
fn inr"- r~
m m
m mr- r^
m m
m mr-~ e'-
en m
m inr-~ r-
m m
r- r»
in in
r- p-
in in* *
r-'- i"
in in* *
r~ r~
in in
m mr>- e'-
en m
r- r-
m in* *
.©L-
©3©1_
©4—©£
©©©JZ.
Exhibit 7 Continued
-104-
being
left
delivering
just
slightly
(I
to
2in^)
on
the
plus
side.
corrected by attaching a carrying handle to the measure or mounting
the measure on a wheeled cart.
From the limited tests it appears that it would be impossible
to predict within several cubic inches the result of a second normal
flow test based on the result of the first. The major problem here
would seem to be that under most conditions the history of the
dispenser just prior to the first test is generally unknown to the
person performing the inspections. It might well be a questionable
philosophy to accept a single normal-flow test as an indication of
the operating capability of the dispenser.
It is felt that the tests conducted by B. C. Keysar and D. J. Hine
represent a much more controlled and exact application of a conven-
tional metal field standard than might be encountered in observing
a routine weights and measures inspector's procedure. The facilities
where dispensers are tested seldom include a means to allow
the measure to be suspended several feet off the ground to facilitate
leveling and reading of the graduated neck scale. The operation is
therefore dependent upon the island being relatively level so that
the measure can be placed on the island to allow the neck scale to
be more easily viewed. Conceding that the island is level, the proper
method to read the graduated neck scale will require the inspector
to be on his hands and knees!
- 105-
9.4 RECOMMENDED FIELD TEST PROCEDURE. For either a conventional
field test measure or a measure fabricated from the specification
of 7.2.0, a well-defined procedure is necessary.
In June 1973 the Office of Weights and Measures published NBS
Handbook 112, Examination Procedure Outlines for Commercial Weighing
and Measuring Devices. Exhibit 8 is a modified reprint of EPO No.
21 of that Handbook which covers single product motor fuel dispensers.
EPO No. 22 covers blended product motor fuel dispensers. The Exami-
nation Procedure Outline provides an excellent summary of appropriate
reference numbers to NBS Handbook 44. To supplement the EPO, an
Examination Checklist was prepared and is shown in Exhibit 9. This
checklist is intended to simplify the Device Inspection and Pre-
Test Determinations and should be completed prior to actual perfor-
mance testing.
To properly inspect a motor-fuel dispenser, a step-by-step
procedure must be followed. The procedure includes both visual and
manual inspection and should proceed as follows:
1. The dispenser panel covers are removed by authorized
personne I
.
2. With a checklist similar to Exhibit 9, complete all items
except I I and 1 6
.
3. Record the totalizer reading on the test report form.
4. Place the measure to be used adjacent to the dispenser
being tested and establish level condition for the measure.
5. Activate the switch to energize the dispenser pump.
6. Make a normal draft into the measure. During the draft
- 106-
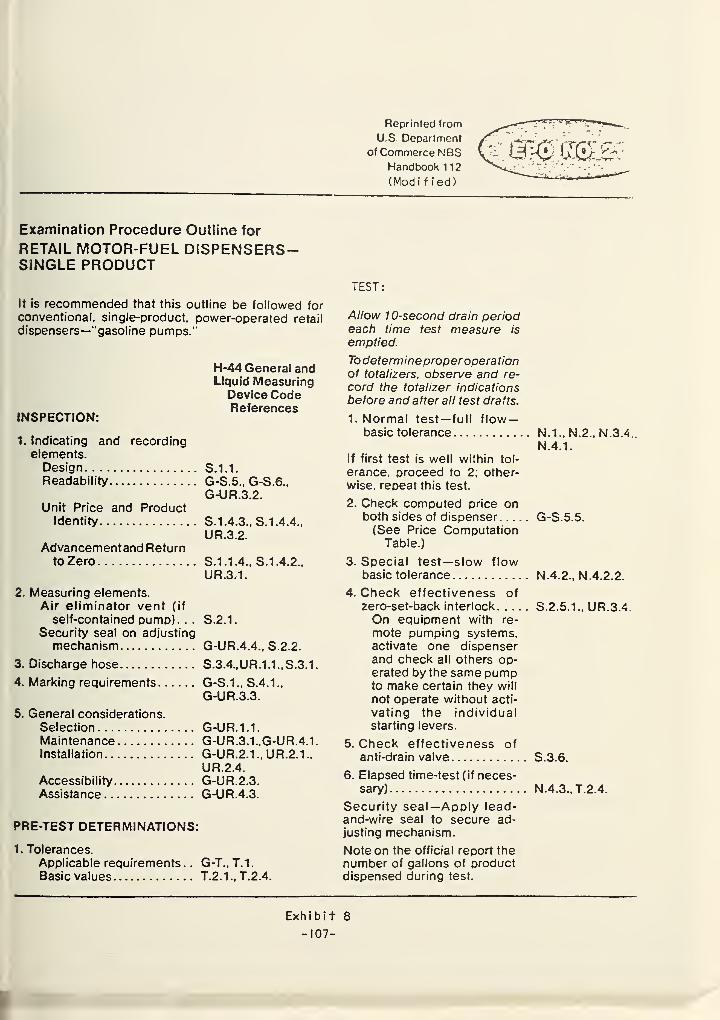
Reprinted from
U.S. Department
of Commerce NBSHandbook 112
(Mod i f i ed
)
Examination Procedure Outline for
RETAIL MOTOR-FUEL DISPENSERS-SINGLE PRODUCT
It is recommended that this outline be followed for
conventional, single-product, power-operated retail
dispensers—"gasoline pumps."
H-44 General andLiquid Measuring
Device CodeReferences
INSPECTION:
1. Indicating and recordingelements.Design S.1.1.
Readability G-S.5.. G-S.6.,
G-UR.3.2.Unit Price and Product
Identity S.I.4.3., S. 1.4.4.,
UR.3.2.
Advancementand Returnto Zero S.1.1.4., S. 1.4.2..
UR.3.1.
2. Measuring elements.Air eliminator vent (if
self-contained pump). . .
Security seal on adjusting
S.2.1.
mechanism G-UR.4.4., S.2.2.
3. Discharge hose S.3.4..UR.1.1..S.3.1.
4. Marking requirements G-S.1., S.4.I.,
G-UR.3.3.
5. General considerations.
Selection G-UR.1.1.Maintenance G-UR.3.1..G-UR.4.1.Installation G-UR.2.1., UR. 2.1.,
UR. 2.4.
Accessibility G-UR.2.3.Assistance G-UR.4.3.
PRE-TEST DETERMINATIONS:
1.
Tolerances.
Applicable requirements . . G-T.. T. 1
.
Basic values T.2.I., T.2.4.
TEST:
Allow 10-second drain periodeach time test measure is
emptied.
Todetermineproper operationof totalizers, observe and re-
cord the totalizer indications
before and after all test drafts.
1. Normal test— full flow-basic tolerance N.I., N.2., N.3.4.
N.4.1.If first test is well within tol-
erance. proceed to 2; other-
wise. repeat this test.
2. Check computed price onboth sides of dispenser G-S.5.5.
(See Price ComputationTable.)
3. Special test—slow flowbasic tolerance N.4.2., N.4.2.2.
4. Check effectiveness ofzero-set-back interlock S.2.5.I., UR.3. 4.
On equipment with re-
mote pumping systems,activate one dispenserand check all others op-erated by the same pumpto make certain they will
not operate without acti-
vating the individualstarting levers.
5.
Check effectiveness ofanti-drain valve S.3.6.
6.
Elapsed time-test (if neces-sary) N.4.3.. T.2.4.
Security seal—Apply lead-and-wire seal to secure ad-justing mechanism.
Note on the official report thenumber of gallons of productdispensed during test.
Exhibit 8
-107-
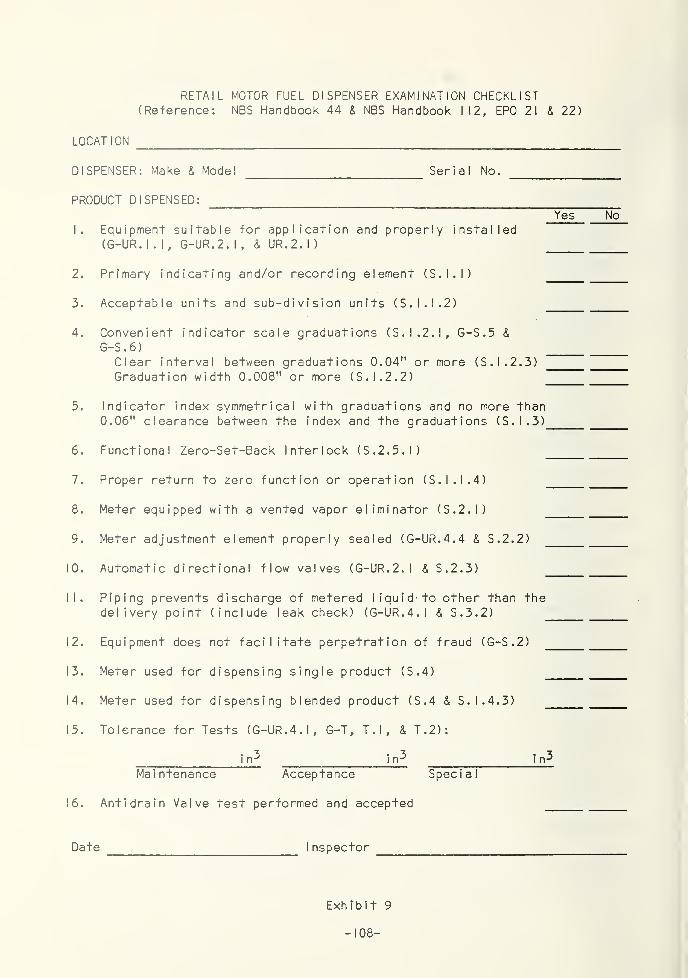
RETAIL MOTOR FUEL DISPENSER EXAMINATION CHECKLIST(Reference: NBS Handbook 44 & NBS Handbook 112, EPO 21 & 22)
LOCATION
DISPENSER: Make & Model Serial No.
PRODUCT DISPENSED:
Yes No
1. Equipment suitable for application and properly installed(G-UR.I.I, G-UR.2.1, & UR. 2.1)
2. Primary indicating and/or recording element (S.I.I)
3. Acceptable units and sub-division units (S. 1.1.2)
4. Convenient indicator scale graduations (S. 1.2.1. G-S.5 &
G-S.6)Clear interval between graduations 0.04" or more (S. I .2.3)Graduation width 0.008" or more (S. I .2.2)
5. Indicator index symmetrical with graduations and no more than0.06" clearance between the index and the graduations (S.1.3)
6. Functional Zero-Set-Back Interlock (S.2.5.1)
7. Proper return to zero function or operation (S.I.I. 4)
8. Meter equipped with a vented vapor eliminator (S.2.1)
9. Meter adjustment element properly sealed (G-UR.4.4 & S.2.2)
10. Automatic directional flow valves (G-UR.2.1 & S.2.3)
11. Piping prevents discharge of metered liquid- to other than thedelivery point (include leak check) (G-UR.4.1 & S.3.2)
12. Equipment does not facilitate perpetration of fraud (G-S.2)
13. Meter used for dispensing single product (S.4)
14. Meter used for dispensing blended product (S.4 & S. 1.4.3)
15. Tolerance for Tests (G-UR.4.1, G-T, T.l, & T.2):
i_n£ i_rv^ i
Maintenance Acceptance Special
16. Antidrain Valve test performed and accepted
Date Inspector
Exh i b i t 9
- 108 -
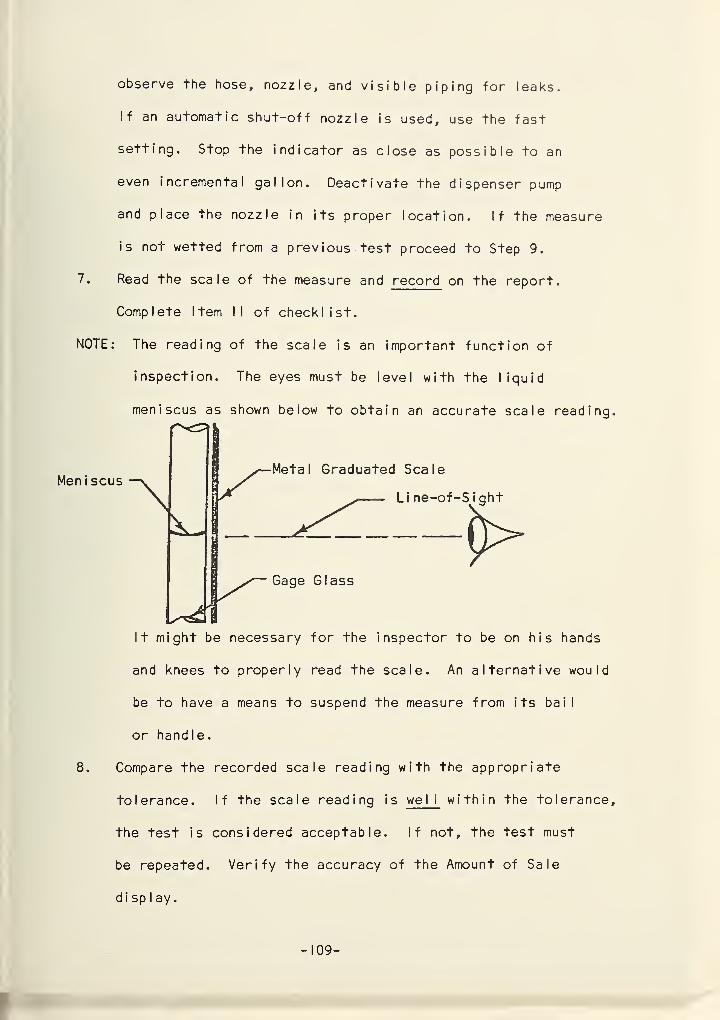
observe the hose, nozzle, and visible piping for leaks.
If an automatic shut-off nozzle is used, use the fast
setting. Stop the indicator as close as possible to an
even incremental gallon. Deactivate the dispenser pump
and place the nozzle in its proper location. If the measure
is not wetted from a previous test proceed to Step 9.
7. Read the scale of the measure and record on the report.
Complete I tern II of checklist.
NOTE: The reading of the scale is an important function of
inspection. The eyes must be level with the liquid
meniscus as shown below to obtain an accurate scale reading
It might be necessary for the inspector to be on h i s hands
and knees to properly read the scale. An alternative would
be to have a means to suspend the measure from its bail
or handle.
8. Compare the recorded scale reading with the appropriate
tolerance. If the scale reading is we I I within the tolerance
the test is considered acceptable. If not, the test must
be repeated. Verify the accuracy of the Amount of Sale
display.
MeniscusMetal Graduated Scale
Gage Glass
Li ne-of-S i qht
- 109 -
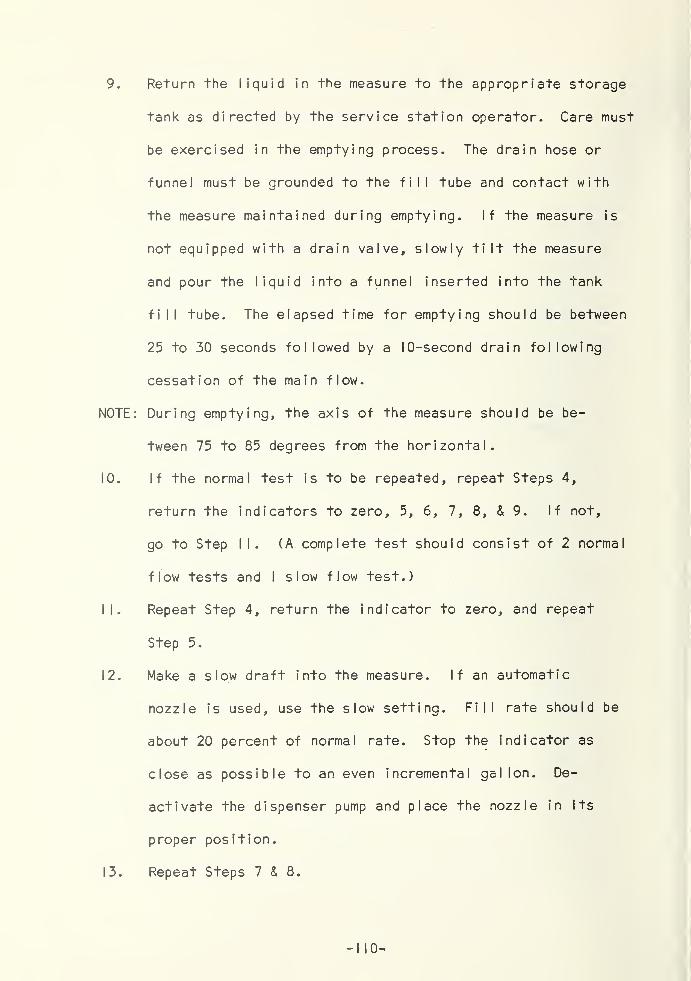
9 . Return the liquid in the measure to the appropriate storage
tank as directed by the service station operator. Care must
be exercised in the emptying process. The drain hose or
funnel must be grounded to the fill tube and contact with
the measure maintained during emptying. If the measure is
not equipped with a drain valve, slowly tilt the measure
and pour the liquid into a funnel inserted into the tank
fill tube. The elapsed time for emptying should be between
25 to 30 seconds followed by a 10-second drain following
cessation of the main flow.
NOTE: During emptying, the axis of the measure should be be-
tween 75 to 85 degrees from the horizontal.
10. If the normal test is to be repeated, repeat Steps 4,
return the indicators to zero, 5, 6, 7, 8, & 9. If not,
go to Step II. (A complete test should consist of 2 normal
flow tests and I slow flow test.)
11. Repeat Step 4, return the indicator to zero, and repeat
Step 5.
12. Make a slow draft into the measure. If an automatic
nozzle is used, use the slow setting. Fill rate should be
about 20 percent of normal rate. Stop the indicator as
close as possible to an even incremental gallon. De-
activate the dispenser pump and place the nozzle in its
proper position.
13. Repeat Steps 7 & 8.
-I 10-
14 . With the dispenser pump off, place the nozzle in the measure
and open the nozzle to check the antidrain valve. Only
a small quantity of liquid will drain and then stop if
the valve is functioning.
NOTE: Do not shake, elevate, or otherwise attempt to force
leaking. This will VOID the test.
15. Repeat Step 9. Caution: If this is the last dispenser
to be tested at this location, additional care must be
taken to completely drain the measure of f tamable liquid
before placing it in a vehicle.
16. Read and record the totalizer reading. Verify the gallons
dispensed during the test with the difference between
begin and end totalizer readings.
17. Complete the test report, affix a seal if appropriate, and
have the dispenser panels replaced by an authorized person.
10.0 TEST MEASURE EVALUATION SUMMARY. The examination of test
measure design and performance provided evidence to substantiate
the need for changes in the design of the features that contributed
most to non-uniform measurement. The two major sources of potential
error were found to be scale reading errors and emptying in a manner
other than that used when the measure was calibrated. The tentative
specification addresses itself to features that would greatly reduce
these error sources. One feature of the specification that could
require attention is the difficulty of cleaning and inspecting
through the 2" neck opening. It would require that care be taken
to protect the measure from an atmosphere that would promote rusting.
This requirement is no different than for existing measures.
Additionally, the small diameter neck may increase the foaming problems
found with some petroleum products. This condition, as with con-
ventional measures, requires the inspector to maintain continual
surveillance during testing to avoid overflow which voids the test.
In addition to design change needs, it was also established
that there was a need for uniform acceptance/reject ion criteria for
use by all volume calibration agencies. With existing practices,
the only uniform criteria that might be exercised would be rejection
if the measure leaked or was completely erroded with rust. To
establish a rust level that would control the acceptance or rejection
of a given measure would be extremely difficult and would be perhaps
even more difficult to uniformly promote with all potential users.
However, it should be realized that rust corrosion and severe dirt
films are forms of equipment abuse. A measure that conforms to the
- 112 -
design specifications included in this report will not exhibit a
severe rust condition unless it has been improperly maintained.
A calibration report specifies a volume that is based upon the
measure being clean and reasonably free of corrosion damage. If
the measure does not meet these qualifications when inspected, the
calibration is nearly meaningless.
Damage to a test measure in the form of dents is a very sensitive
problem. If the calibration is performed on a dented or otherwise
damaged measure, it is impossible to establish, to everyone’s
satisfaction, that the damage existed prior to calibration. Some
calibrating agencies attempt to include a damage description on
the report of calibration but the success of this is questionable.
Any dent or damage to a test measure should be repaired so that it
isn’t externally visible and doesn't allow air or foreign material
entrapment. This must be done prior to submitting for calibration
or reca I i bration.
Since the procedure used in the calibration of a test measure
has been found to be important to achieving reproducible calibration
values, the importance of adapting the scale reading and emptying
portions of the laboratory calibration procedure to field applications
of the test measures cannot be overemphasized. This philosophy
must be promoted by all users if uniformity is to be realized.
Every person who performs calibration work with metal volume
standards should realize that they are working with a precision in-
strument. The reference to this equipment as buckets or cans promotes
a crude image and oftentimes results in crude treatment. These
devices are instruments which deserve and require careful treatment
both in handling applications and storage.
A clean, properly maintained and used test measure will promote
improved measurement.
- 114 -

I 1.0 INTRODUCTION TO LARGE VOLUME PROVER DESIGN & EVALUATION. During
the first two years of the API/NBS Research Associate Program, it
became evident that the program must be expanded beyond the study of
I, 5, and 10 gallon field standards. Representatives of the petroleum
industry and weights and measures jurisdictions were actively suggesting
that the research program be expanded to include larger volume provers
for application in truck- I oad i ng facility meter inspection and truck-
mounted meter inspections. Approvals were obtained from API and NBS
and the expansion was begun.
12.0 PROVER DESIGN STUDIES . The study of prover design had primarily
been completed when an attempt was made to locate existing field
standards design criteria in the very early stages of the Research
Associate Project. Further studies supported the earlier conclusion
that standard prover specifications were virtually non-existent.
A review of the angle evaluation liquid retention studies and
the reports on the engineering survey conducted by American Petroleum
Institute in the mid-l960 ?s resulted in certain design criteria that
would be considered.
Since the API survey had selected API Standard 1101, "Measurement
of Petroleum Liquid Hydrocarbons by Positive Displacement Meter",
this document was used as the base starting point in developing a
"Tentative Large Volume Prover Specification". The Specification
covered 4 Volumetric Provers (50, 100, 750 & 1500 gallon) mounted on
a single tra i I er
.
The specification was completed, reviewed by API Weights and
Measures Task Force Members and representat i ves of KJBS Office of
Weights and Measures, revised to reflect comments received during
review, and submitted to four known prover manufacturers for bid.
Following receipt of the bids from the manufacturers, the bids
were evaluated and a contract was awarded to the lowest bidder.
13.0 VOLUMETRIC PROVER FABRICATION . The manufacture of the provers
was initiated immediately following award of contract. Several
changes were made to the specifications at the request of the manu-
facturers. These changes included fabricating the 50 and 100 gallon
provers of stainless steel and epoxy coating the 750 and 1500 gallon
provers in lieu of terne-plate or galvanized coating. These changes
were approved and reflected no additional cost.
During fabrication, several visits were made to the manuf acturers
'
facility. These included a visit prior to final assembly and a visit
for a final checkout and calibration by water-meter method. Several
modifications were requested to the provers before final approval
for shipment could be given. The provers were approved for shipment
prior to receipt of the scale plates to avoid unnecessary delay in
shipping to NBS
.
13.1 EXAMINATION AND CALIBRATION . When the prover system was received
at National Bureau of Standards it was immediately subjected to a
thorough inspection. Several defects were noted in -the provers that
required correction before the equipment could be calibrated. The
major problem was a weld seam on the bottom cone discovered by interior
inspection, that would deter proper draining of the large prover.
The seam was ground smooth and the epoxy coating was subsequently
patched. An excessive amount of welding slag, sand-blasting sand,
and fabrication debris resulting from the modifications required at
final checkout necessitated an extensive cleaning which included
complete disassembly of the main valve.
Following the repairs and thorough cleanup of the interior of
the provers and exterior of the trailer and provers, the provers were
subjected to a series of calibrations. The provers were received
without the scales installed and it was therefore necessary to conduct
an initial calibration to position the scales. After the scales had
been installed the provers were subjected to a check calibration.
An unacceptable difference was noted between the water-meter calibration
and the calibration against NBS standards. Due to lack of facilities
and time, the water meter was not verified for accuracy at the manu-
facturers’ facility. A water-meter "check" calibration should only be
accepted if previously checked against an approved standard. Due
to the unusual height of the two large provers mounted on the trailer,
a procedure was developed and modifications to the calibration facility
were made to permit calibration of the provers.
The provers were then subjected to a routine official calibration
by the Mass and Volume Section of the National Bureau of Standards.
14.0 PLANNED FIELD TEST PROGRAM . The field test program was devised
to verify the applicability of the large volume provers that had been
designed, fabricated, and calibrated under the auspices of the API/NBS
Research Associate Program. To accomplish this goal, it was considered
necessary to conduct a large number of tests on as many meters as
possible in an allotted period of time. Additionally, the concensus
was that tests should be conducted within as wide a range of products
and ambient temperatures as possible. For this reason, tests were
scheduled at two loading terminals in Milwaukee, Wisconsin and two
loading terminals in the Washington, D. C. area. Two series of tests
were scheduled for each terminal location so that tests could be
performed in both the cold winter months and the moderate to hot summer
months
.
A document was prepared describing the guidelines under which
the tests would be performed and was supplied to the terminal manager
prior- to initiating the test series. A copy of the document is included
as Exhibit 10.
-I 19-
F
THE AMERICAN PETROLEUM INSTITUTE IS CONDUCTING A SERIES OF TESTS
AT VARIOUS TANK TRUCK LOADING FACILITIES. THESE TESTS ARE PART OF
THE RESEARCH ASSOCIATE PROGRAM SPONSORED BY THE DIVISION OF MARKETING
IN COOPERATION WITH THE NATIONAL BUREAU OF STANDARDS. THE RESEARCH
ASSOCIATE PROGRAM INVOLVES THE DEVELOPMENT OF VOLUMETRIC STANDARDS
DESIGN AND CORRECT USE OR APPLICATION PROCEDURES.
FIELD PROVERS OF 50, 100, 750, AND 1500 GALLONS HAVE BEEN DESIGNED,
FABRICATED AND CALIBRATED IN PREPARATION FOR FIELD TEST INVESTIGATIONS.
THE MAJOR GOALS OF THE FIELD TESTING WILL BE TO ACHIEVE A UNIFORM
EQUIPMENT DESIGN SPECIFICATION AND UNIFORM METER TEST PROCEDURE
REQUIREMENTS FOR USE WITHIN THE PETROLEUM INDUSTRY AND WEIGHTS AND
MEASURES JURISDICTIONS.
ALL TESTS WILL BE CONDUCTED IN STRICT COMPLIANCE WITH INDIVIDUAL
LOADING TERMINAL OWNER SAFETY AND OPERATIONAL REQUIREMENTS AND NORMAL
OPERATION WILL HAVE PRECEDENCE OVER THE FIELD TEST REQUIREMENTS WHEN
NECESSARY.
THROUGHOUT THE TESTS, NO METER WILL BE ADJUSTED OR OTHERWISE
ALTERED BY THE TEST PERSONNEL. THE OFFICIAL TEST PERSONNEL WILL CONSIST
OF THE API RESEARCH ASSOCIATE, D. J. HINE; API SPECIAL REPRESENTATIVE,
W. A. KERLIN; AND NBS REPRESENTATIVE, B. C. KEYSAR. THESE MEN WILL
COORDINATE ALL TEST WORK WITH THE PLANT MANAGER OR A REPRESENTATIVE
DESIGNATED BY HIM.
THE TEST DATA WILL BE EVALUATED IN ACCORDANCE WITH METHODS USED
BY THE WEIGHTS AND MEASURES JURISDICTION HAVING AUTHORITY OVER THE
INSTALLATION AND/OR BY PLANT METHODS. A COPY OF ALL TEST DATA WILL
BE SUPPLIED TO THE PLANT MANAGER WHEN TESTING IS COMPLETED.
- 120-
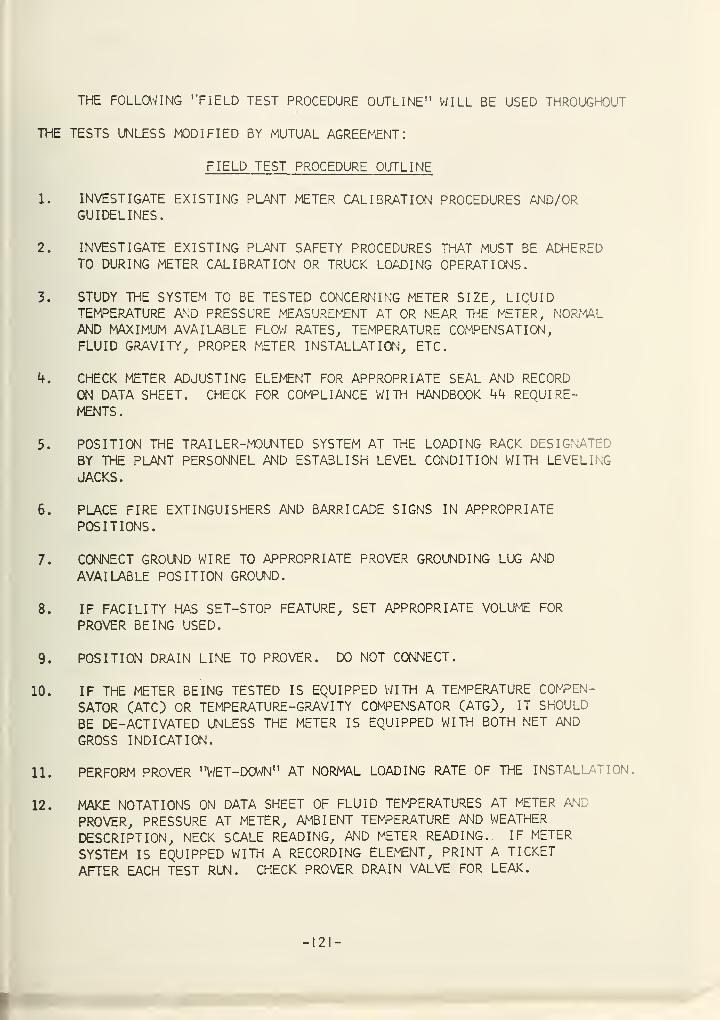
THE FOLLOWING ’’FIELD TEST PROCEDURE OUTLINE" WILL BE USED THROUGHOUT
THE TESTS UNLESS MODIFIED BY MUTUAL AGREEMENT:
FIELD TEST PROCEDURE OUTLINE
1. INVESTIGATE EXISTING PLANT METER CALIBRATION PROCEDURES AND/ORGUIDELINES.
2. INVESTIGATE EXISTING PLANT SAFETY PROCEDURES THAT MUST BE ADHEREDTO DURING METER CALIBRATION OR TRUCK LOADING OPERATIONS.
3. STUDY THE SYSTEM TO BE TESTED CONCERNING METER SIZE, LIQUIDTEMPERATURE AND PRESSURE MEASUREMENT AT OR NEAR THE METER, NORMALAND MAXIMUM AVAILABLE FLOW RATES, TEMPERATURE COMPENSATION,FLUID GRAVITY, PROPER METER INSTALLATION, ETC.
4. CHECK METER ADJUSTING ELEMENT FOR APPROPRIATE SEAL AND RECORDON DATA SHEET. CHECK FOR COMPLIANCE WITH HANDBOOK 44 REQUIRE-MENTS.
5. POSITION THE TRAI LER-MOUNTED SYSTEM AT THE LOADING RACK DESIGNATEDBY THE PLANT PERSONNEL AND ESTABLISH LEVEL CONDITION WITH LEVELINGJACKS.
6. PLACE FIRE EXTINGUISHERS AND BARRICADE SIGNS IN APPROPRIATEPOSITIONS.
7. CONNECT GROUND WIRE TO APPROPRIATE PROVER GROUNDING LUG AND
AVAILABLE POSITION GROUND.
8. IF FACILITY HAS SET-STOP FEATURE, SET APPROPRIATE VOLUME FOR
PROVER BEING USED.
9. POSITION DRAIN LINE TO PROVER. DO NOT CONNECT.
10. IF THE METER BEING TESTED IS EQUIPPED WITH A TEMPERATURE COMPEN-
SATOR (ATC) OR TEMPERATURE-GRAVITY COMPENSATOR (ATG), IT SHOULD
BE DE-ACTIVATED UNLESS THE METER IS EQUIPPED WITH BOTH NET AND
GROSS INDICATION.
11. PERFORM PROVER "WET-DOWN" AT NORMAL LOADING RATE OF THE INSTALLATION.
12. MAKE NOTATIONS ON DATA SHEET OF FLUID TEMPERATURES AT METER AND
PROVER, PRESSURE AT METER, AMBIENT TEMPERATURE AND WEATHER
DESCRIPTION, NECK SCALE READING, AND METER READING.. IF METER
SYSTEM IS EQUIPPED WITH A RECORDING ELEMENT, PRINT A TICKET
AFTER EACH TEST RUN. CHECK PROVER DRAIN VALVE FOR LEAK.
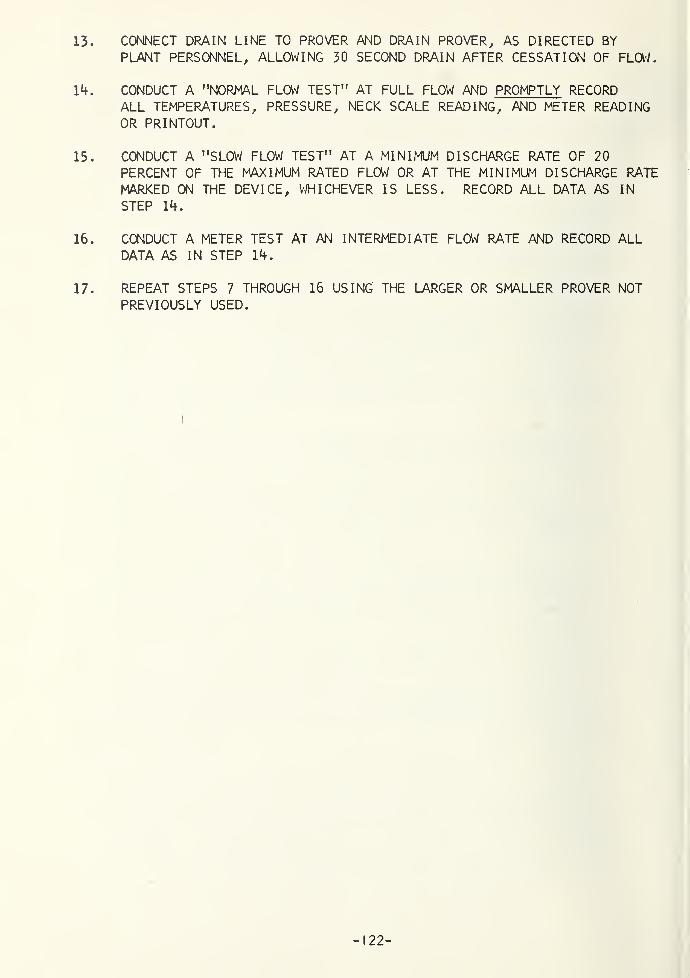
13. CONNECT DRAIN LINE TO PROVER AND DRAIN PROVER, AS DIRECTED BY
PLANT PERSONNEL, ALLOWING 30 SECOND DRAIN AFTER CESSATION OF FLOW.
14. CONDUCT A "NORMAL FLOW TEST" AT FULL FLOW AND PROMPTLY RECORDALL TEMPERATURES, PRESSURE, NECK SCALE READING, AND METER READINGOR PRINTOUT.
15. CONDUCT A "SLOW FLOW TEST" AT A MINIMUM DISCHARGE RATE OF 20
PERCENT OF THE MAXIMUM RATED FLOW OR AT THE MINIMUM DISCHARGE RATE
MARKED ON THE DEVICE, WHICHEVER IS LESS. RECORD ALL DATA AS IN
STEP 14.
16. CONDUCT A METER TEST AT AN INTERMEDIATE FLOW RATE AND RECORD ALLDATA AS IN STEP 14.
17. REPEAT STEPS 7 THROUGH 16 USING THE LARGER OR SMALLER PROVER NOTPREVIOUSLY USED.
- 122 -
15.0 INITIAL FIELD TESTS . Prior to beginning the first series of
field tests, the prover system was subjected to "shake-down" to
establish operating procedures and allow the personnel that would be
conducting the tests to become familiar with the equipment.
Prior to loading any petroleum product in either of the provers,
it was discovered that the inlet nozzle to which the bottom- load-
adapter was flanged was 3 inch size rather than 4 inch. This defect
was discovered when the adapter was removed and had not been obvious
during the initial examination. The 3 inch nozzles were cut out and
replaced with a 4 inch nozzle. A calculation based on the theoretical
dimensions of the two nozzles was performed to determine the prover
volume change created by the modification. The epoxy coating was
repaired following the welding modification.
Following the modification to the nozzles, the provers were
subjected to a series of runs and were judged to be performing to
expectations. The system was considered to be ready to begin the
scheduled field test intinerary. The prover system was towed to
Milwaukee, Wisconsin for the first series of testing.
The metering systems to be tested were subjected to a visual
examination in accordance with pre-test determinations presented in
NBS Handbook 112. To simplify the visual examination, a Check-List
was prepared utilizing NBS Handbook 112. The Check-List is shown in
Exh i b i t II.
Following the pre-test examination, the tests were initiated.
It was immediately evident that the pump-back facility of the loading
terminal would prove to be a serious deterrent to the conduct of the
- 123 -
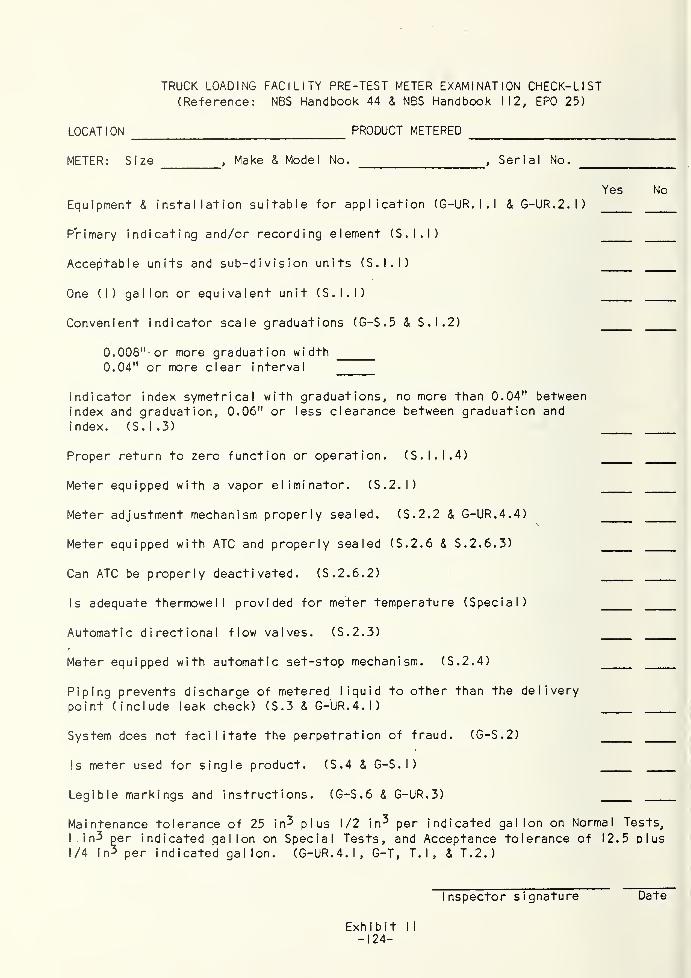
TRUCK LOADING FACILITY PRE-TEST METER EXAMINATION CHECK-LIST(Reference: NBS Handbook 44 & NBS Handbook 112, EPO 25)
LOCATION PRODUCT METERED
METER: Size ,Make & Model No.
,Serial No.
Yes NoEquipment & installation suitable for application (G-UR. I . I & G-UR.2.1)
Primary indicating and/or recording element (S.I.I)
Acceptable units and sub-division units (S.I.I)
One (I) gallon or equivalent unit (S.I.I)
Convenient indicator scale graduations (G-S.5 & S.1.2)
0.008" or more graduation width0.04" or more clear interval
Indicator index symetrical with graduations, no more than 0.04" between
index and graduation, 0.06" or less clearance between graduation and
index. (S.1.3)
Proper return to zero function or operation. (S.I.I. 4)
Meter equipped with a vapor eliminator. (S.2.1)
Meter adjustment mechanism properly sealed. (S.2.2 & G-UR. 4. 4)
Meter equipped with ATC and properly sealed (S.2.6 & S.2.6.3)
Can ATC be properly deactivated. (S.2.6. 2)
Is adequate thermowell provided for meter temperature (Special)
Automatic directional flow valves. (S.2.3)
Meter equipped with automatic set-stop mechanism. (S.2.4)
Piping prevents discharge of metered liquid to other than the delivery
point (include leak check) (S.3 & G-UR. 4.1)
System does not facilitate the perpetration of fraud. (G-S.2)
Is meter used for single product. (S.4 & G-S.l)
Legible markings and instructions. (G-S.6 & G-UR. 3)
Maintenance tolerance of 25 in^ plus 1/2 in^ per indicated gallon on Normal Tests,
I in^ per indicated gallon on Special Tests, and Acceptance tolerance of 12.5 d
I
us
1/4 in-3 per indicated gallon. (G-UR. 4. I, G-T, T. I , & T.2.)
Exhibit II
-124-
Inspector signature Date
tests. It oftentimes took several hours to prime the pump in order
to pump-off the test liquid. It was also noted that it was difficult
to determine when the prover was empty. A crewman had to stand on
top of the prover to watch the product level during unloading.
Representatives from the API Division of Marketing Weights and
Measures Task Force visited the test site to view the testing. In
addition to the pump-off problem and visual emptying determination,
concern was indicated over a small pool of liquid retained in the
bottom drain line of the provers at the junction of the screwed elbow
on the bottom of the prover to the sloped drain line leading to the
drain valve. The decision was made that the prover drain lines be
modified to correct the pool condition and provide visual indication
when the prover was empty. Also, a decision was made that a portable
pump and motor system be obtained to include with the test system to
eliminate the need to depend on plant facilities.
With these decisions, the drain lines of the two large provers
were removed and transported back to the National Bureau of Standards
for modifications. A pumping system was ordered as well as two 4 inch
sight flow indicators to incorporate in the modified drain lines.
The drain lines were subjected to several tests to determine the
amount of liquid retained i n the pool and it was discovered that the
pool in either drain line consisted of less than one-half cubic inch.
The decision to modify the drain lines was for aesthetic value as
well as visual acceptability by outside observers. The drain lines
were modified by welding a half screwed coupling to a weld elbow which
was in turn welded to a pipe nipple that was threaded on the end to
- 125 -
accept the drain valve. The sight-f low- i nd i cator was installed down-
stream of the drain valve in order to eliminate having this fixture
within the calibrated volume of the provers.
The volumes of the as-built drain lines and the modified drain
lines were determined by repeated water fillings and the calibrated
volumes of the provers were adjusted accordingly.
- 126-
16.0 FIELD TEST PROGRAM . The field test program was intended to pro-
vide a large number of meter tests in order to test the capability of
the provers. In addition to the planned large quantity of testing,
it was also necessary to observe and record a large number of test
parameters. These parameters included meter register indication,
flow rate, prover neck scale reading, meter pressure, nine or ten
temperature readings depending upon the system, prover pump-off time,
and drain-down times.
In order to help eliminate errors by omission of required data,
three sets of tasks were developed for the three persons usually in
attendance during the tests. The assignments were as follows:
Crewman #1: Responsible for the operation of the meter. This
assignment included having an appropriate ticket
in the register; determining by checking with the
other members of the crew when the test was ready
to begin; obtaining the flow rate during the run;
making the meter register reading; assist in reading
the Iiqu i d- i n-g I ass thermometers; and timing the pump-
off and drain-down periods.
Crewman # 2
:
Responsible for the operation of the prover. This
assignment included all valve manipulations, assisting
with temperature determinations during the run, deter-
mining the liquid level on the neck scale, and assist
in reading liquid-in-glass thermometers.
Crewman #3: Responsible for the general conduct of the test. This
assignment included recording all data on the data
- 127 -
sheet, assisting with temperature determi nat ions
during the run, obtaining temperature determinations
from the electronic thermometer, making periodic
gravity determinations of the metered product, and
assisting other members of the test crew as required.
With this distribution of assignments it was found that each member
of the test group was well occupied and only during pump-back of the
product from the prover to storage was there any unused time.
During the conduct of these tests it was agreed that a sequence
for the tests must be formulated so that each meter would be examined
within the same guidelines. The test sequence decided upon was as
fo I lows
:
Preliminary Run - Meter system stability check to include: flow
rate check, set-stop function, and generally
inspect the meter operation. This run could
be eliminated if the prover was wet-down from
a previous run on a different meter and the
inspection could be performed while a tank-truck
was loading through the meter to be tested.
First Run - Normal Flow Rate - one meter operating - record
a I I data
.
Second Run - Normal Flow Rate - one meter operating - record
a I I data.
Third Run - Slow Flow Rate - one meter operating - record
a I I data
.
- 128-
Additional Runs - Additional runs were made to determine the
repeatability of the meter, influence on the
flow rate and repeatability of the meter when
two or more meters were operating with the same
test liquid, and an additional slow-flow run.
16.1 TESTING PROBLEMS . During the conduct of the field tests there
were a number of problems encountered that are worthy of discussion.
16.1. I Product Pump-Off . As discussed in Section 15.0, problems
were encountered with terminal facilities for returning metered product
to storage. In addition to the pump-back facilities being either non-
existent or inoperable, it was found that in some cases product could
not be returned to storage if that same product was being loaded
through another meter. This was caused by the return line being
connected to the supply line from storage which had a higher pressure
than could be obtained with the pump-back pump.
During slow periods in the terminal, testing would proceed
quite well; but during normal loading it resulted in test delay. This
same piping configuration presented another potential problem in that
during the slow loading periods the same product would be recycled
through the meter into the prover and through the pump into the supply
line. Recycling would continue until a truck arrived to load the same
product being tested.
A further problem in the product pump-off area is that at some
locations no means is provided at the loading position to return the
product to storage. During the field tests, one such location was
encountered and the problem was resolved by the terminal operator
- 129 -
furnishing a tank truck for pumping the metered product into. Even
this resulted in delays since the truck had to move to the pump-back
facility after each 7,000 to 8,000 gallons of testing. It is also
expensive to tie up a truck and driver for the test period. Every
truck loading facility should be equipped with convenient product
pump-back facilities. The design should promote meter inspection and/or
calibration without inconvenience to either terminal operation or
test i ng personne I
.
16.1.2 Product Temperature and Pressure Measurement . It was often
difficult or impossible to find a means to measure the metered product
temperature and pressure at or near the meter. To make these measure-
ments it was necessary to find a pressure tap or other opening that
could accept a short nipple that was screwed to a pipe tee so that
both temperature and pressure could be measured. Since pressure and
temperature at the meter are important in evaluating terminal operating
equipment, the capability for making these measurements should be
included in every loading terminal design.
16.1.3 Flow-Control Valves . At several test locations the control
valves that are used to regulate meter flow-rate, starting stage,
stopping stage and meter shut-down were found to be overly sensitive
to adjustments or could not be adjusted due to faulty 0-Rings or
ruptured diaphragms. Several meters had to be bypassed during the
testing due to such difficulties. The flow rate has a decided effect
on meter performance and any auxiliary equipment that controls or
effects flow rate should be capable of proper adjustment with a minimum
of maintenance. It is also desirable that flow rate adjustment be
- 130 -
provided with a security seal to prevent unauthorized adjustments.
16.1.4 Flow Stra i ners . Most piping systems in loading terminals include
a flow strainer upstream of the meter to protect the metering element
against foreign debris. Although not every strainer baskeT was in-
spected during the field tests, of those that were inspected an
alarmingly high percentage had extensive damage. The experience of
the field tests indicates that an established routine inspection of
the strainer is needed.
16.1.5 S I ow-F I ow Contro
I
. A problem was encountered during the field
tests in establishing a slow-flow rate. To obtain slow-flow through
a meter, a valve must be throttled that is normally open. In many
cases, the only available control is through the main shut-off valve
upstream of the meter. It was found that when gasolines are throttled
through a valve upstream of the meter, the disturbance may create a
vapor-liquid mixture that subsequently passes through the meter.
The difference in meter error between upstream and downstream throttling
is significant.
The best uniform solution to this problem would be the installation
of a control valve between the prover and the bottom- load adapter so
that flow could be throttled into the prover rather than into the
meter. This solution should improve the meter accuracy and promote
a uniform method for meter testing.
- 131 -
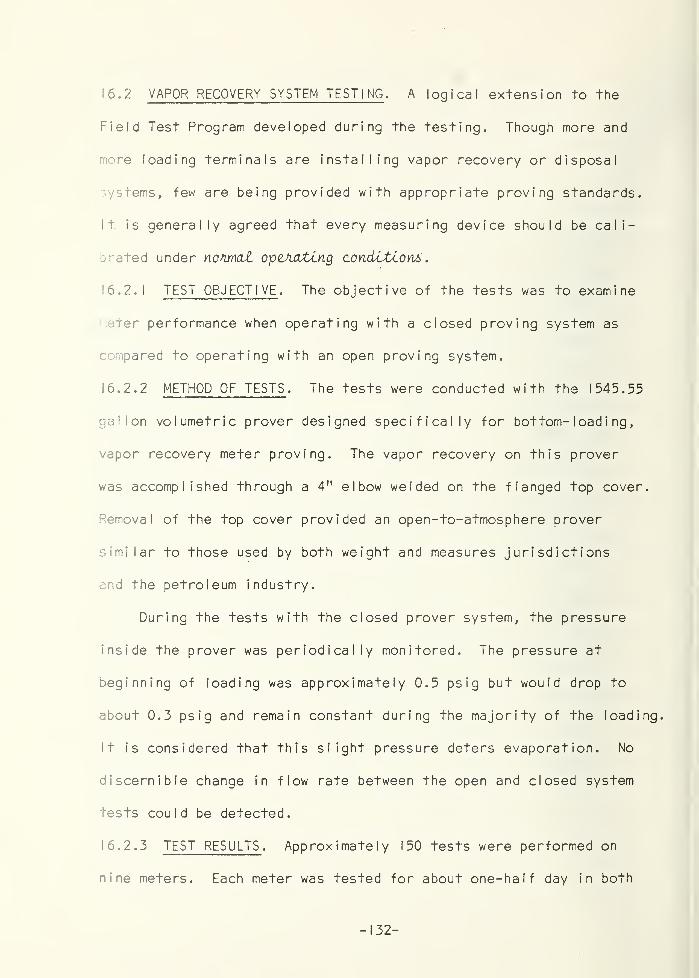
16.2
VAPOR RECOVERY SYSTEM TESTING . A logical extension to the
Field Test Program developed during the testing. Though more and
more loading terminals are installing vapor recovery or disposal
systems, few are being provided with appropriate proving standards.
It is generally agreed that every measuring device should be cali-
brated under nonmat operating conditions
.
16.2.1 TEST OBJECTIVE . The objective of the tests was to examine
neter performance when operating with a closed proving system as
compared to operating with an open proving system.
16.2.2 METHOD OF TESTS . The tests were conducted with the 1545.55
gallon volumetric prover designed specifically for bottom- I oad i ng
,
vapor recovery meter proving. The vapor recovery on this prover
was accomplished through a 4" elbow welded on the flanged top cover.
Removal of the top cover provided an open-to-atmosphere prover
similar to those used by both weight and measures jurisdictions
and the petroleum industry.
During the tests with the closed prover system, the pressure
inside the prover was periodically monitored. The pressure at
beginning of loading was approximately 0.5 psig but would drop to
about 0.3 psig and remain constant during the majority of the loading.
It is considered that this slight pressure deters evaporation. No
discernible change in flow rate between the open and closed system
tests could be detected.
16.2.3 TEST RESULTS . Approximately 150 tests were performed on
nine meters. Each meter was tested for about one-half day in both
- 132 -
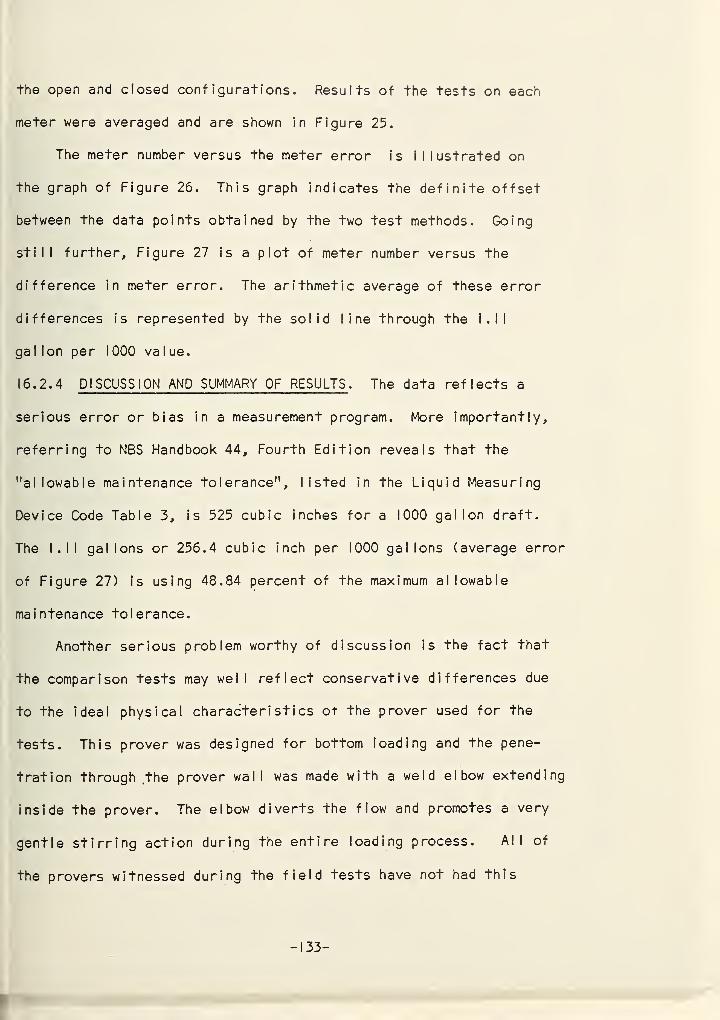
the open and closed configurations. Results of the tests on each
meter were averaged and are shown in Figure 25.
The meter number versus the meter error is illustrated on
the graph of Figure 26. This graph indicates the definite offset
between the data points obtained by the two test methods. Going
still further. Figure 27 is a plot of meter number versus the
difference in meter error. The arithmetic average of these error
differences is represented by the solid line through the l.ll
gallon per 1 000 value.
16.2.4 DISCUSSION AND SUMMARY OF RESULTS . The data reflects a
serious error or bias in a measurement program. More importantly,
referring to NBS Handbook 44, Fourth Edition reveals that the
"allowable maintenance tolerance", listed in the Liquid Measuring
Device Code Table 3, is 525 cubic inches for a 1000 gallon draft.
The l.ll gallons or 256.4 cubic inch per 1000 gallons (average error
of Figure 27) is using 48.84 percent of the maximum allowable
maintenance tolerance.
Another serious problem worthy of discussion is the fact that
the comparison tests may well reflect conservative differences due
to the ideal physical character i st ics of the prover used for the
tests. This prover was designed for bottom loading and the pene-
tration through the prover wall was made with a weld elbow extending
inside the prover. The elbow diverts the flow and promotes a very
gentle stirring action during the entire loading process. All of
the provers witnessed during the field tests have not had this
- 133 -
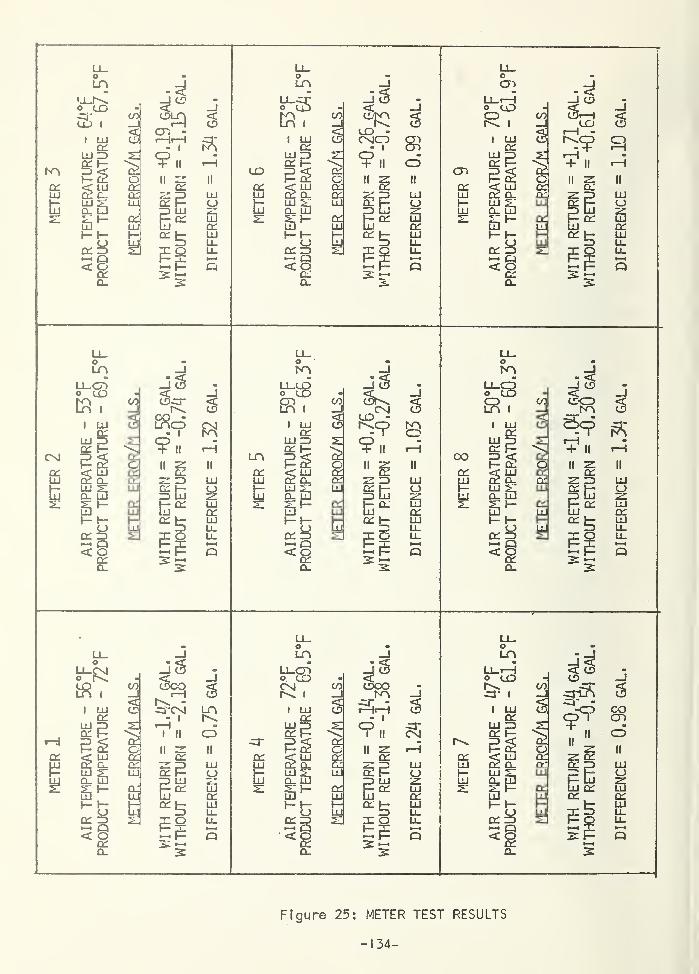
rADCLU
ti
Li—oLTV
•j_pIo_ LOui> I
I LUDC
lu zd£ b
22
2 Hp pDC 8— Q«2
0.
co_1<c
QDCCll
DCLU
£OLqCTi -
?,'i
II zrcc
DC P
II
_l
O
F*
LUcu
LUDCLULLLl_—
*
a
UDDCLUPLU
oLA
^5ts.
I LUCC
LU ZDDC P^2< LUCC CL
222: PLU
<2D_
<“IQLO -
CD CNICD- I
CO_J<
cDCCTLU
crLUl
—
LU
¥„II P2^ Pd: P
CD
II
LUO
DCLU
S 5
cr-
ocLUPLU
o
°2LL-r-Ho lOCD
1
I LUDC
£2<£ LU(2 CL
22£*-I— I
—
5|o_
COI
2
'IcDCDCLU
DC
CO 2CD
+ II 1—
I
11 p II
oZZD LU
DC P O^2 2LU DC
LULL
IILL•—
4
Q
ola
Lx.cno COCA
CNJ
DCLUI
—
LUs:
i
1 LUDC
LU ZZ>DC P£2< LUCC CLLU SIQ- [D
g PP P
CDDC ZD•— Q<8
Q_
co
<o
DCQ,DCDCLU
crLU
t
_J 22^r
11 2ZZ ZD
“5 LU
b*DC^
2
LUOzcLUDCLU
LODCLU
ti
LL
f 5
oKD
o tX)CDLT\ I
I LUDC
LU ZZ-
DC P£2< LUcr a.
222 H1— 1
—
oDC ZD
s§CL
CO
<CD
ODCDCLU
DCLU
t
2tn,
UD°^
?..
„ gItt*DC P
ll
8
LUo2DCLU
Q
Om- ^
b*-S—I O< _j
R .
CO_J
CZCDhA eJ
1 LUDC
4-1 PC5
.21 r-H.
CODCLUI
—
LU
DC PZD <P d!<C LUDC D_
22
DC Z^«— Q<2
D_
DCCDDCDC
DCLUI
—
LU
+ II
11 2^ pCC PZD LU
t*ZZ o
LUOZZLUDCLU
Q
oLX-Cslo
R
*“H
DC
2
I LUDC
2££2
DC 2< 8
DCQ_
CO_l<<d
DCODCDCLU
crLU
ti
_J 2<ocq-
=roj Ln- 1
I II
II 22£g
LUDC
P o
r\CD
ll
LUOUJDCLUU_LL—
«
Q
DCLU
oLA
y_cno loft.
I LUDC
<2LUCLt 2Sh- hCC “D
<8
CO—I<<s>
DCODCCCLU
DCLUI
—
LU
athA
xj- -
1—PH
<?;,
11 22^g
LUDC
D~ tzc otfE
_i
CNl
LUoLUcrLUU_
DCLUPLU
oLA
Ll_r—
I
o LOCJ* I
1 LUDC
LU ZDDC P
2 22SS H
•— Q< ODCO-
CO
2DCLU
DC
LD
cj-DS—
-
o?
DCDC
LU DCDC
CO<zn
CDII
LUO
DCLU
Figure 25: METER TEST RESULTS
- 134 -
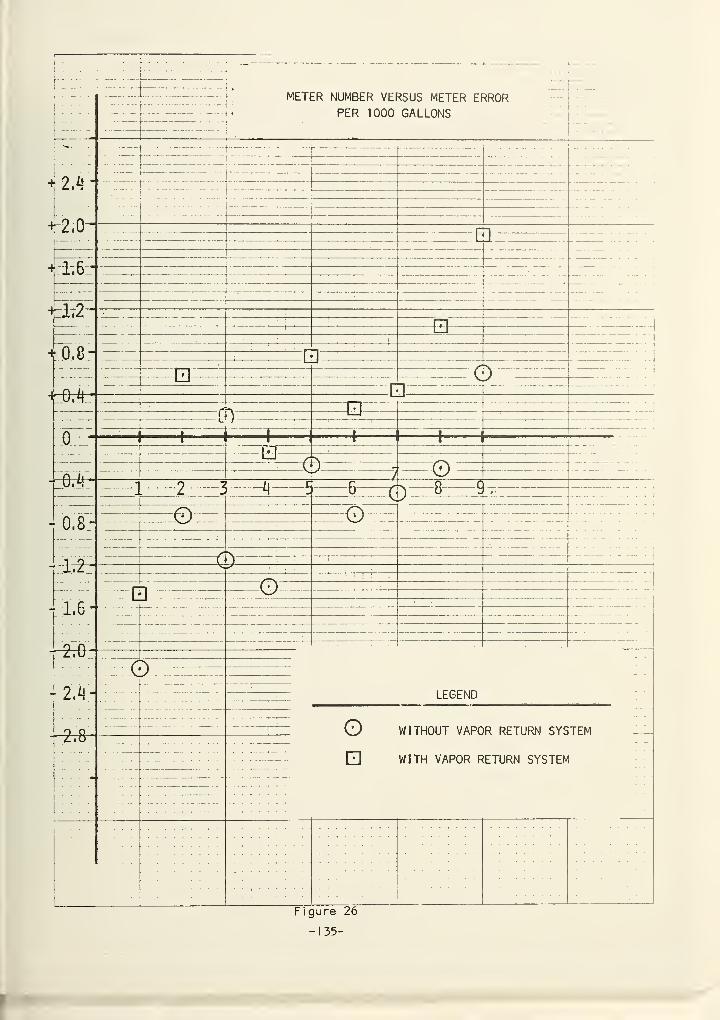
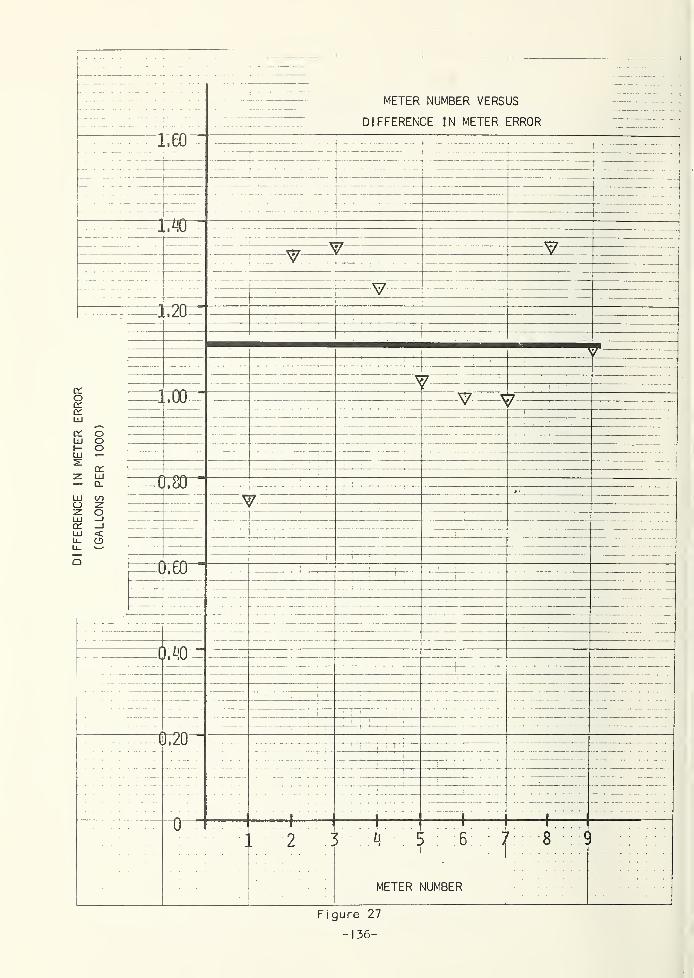
DIFFERENCE
IN
METER
ERROR
METER NUMBER VERSUS
DIFFERENCE IN METER ERROR
1.60
17*CT
1.20
H
v
ooo
ccLl]
CL
CO2O
<O
.toct
irscr^
tTTOO-
V
y
V—
V
Mr
MrM '
i
1 1—i—
; !i
+—
I
6 8 9
METER NUMBER
Figure 27
-136-
feature. The incoming stream on those provers would create a violent
boiling action during loading that assuredly would promote greater
vapor release and higher density vapor than experienced with the
prover used for the vapor recovery test series.
Still another important feature that has been indicated by the
field test program deals with the proving procedure. It was noted
that the first test on a meter should be discarded even though the
prover may be "wet-down" from a previous meter test. It is impossible
to predict the history of the meter system during the prior loading
and it is, therefore, necessary to make an initial run in order to
appropriately stabilize the system in preparing to perform the proving
operation.
From the comparison tests of vapor recovery, a cost analysis
was prepared to examine the "mi smeasurement" value. The analysis
includes several values that may not reflect any specific operation
as to monthly terminal gasoline throughput nor does it particularly
reflect a known "street value" for the product. The analysis does
reflect that the value of the measurement error is potentially very
I arge.
- 137 -
COST ANALYSIS
ITYPOTHETICAL TRUCK-LOADIfJG TERT1INAL WITH A MONTHLY GASOLINE THROUGHPUT
OF 215,000 BARRELS OR 9,030,000 GALLOfiS
IF AH INAPPROPRIATE PROVER IS USED TO CALIBRATE THE TERMINAL HETERS:
HISfEASURBElT = 9,030,000 x 6Am .oris
life
= 10,023 GALLONS
IF THESE RIISMlASURED GALLONS HAVE AN AVERAGE STREET VALUE OF $0.50;
MISMEASUREMEMT VALUE = 0.50 x 10,023 GALLONS PER MONTH
= $5,011,50 PER MONTH
OR
ANNUAL MISMEASUREMEMT VALUE = $5,011,50 x 12 MONTHS
= $50,138.00 PER YEAR
The results of the test series and the above analysis reflect
a very serious potential measurement error. The value is always
against the meter owner as the meter would be adjusted to deliver
more product than registered or "under-register". Such will be the
case if open volumetric provers are used in the calibration of
meters that normally operate as closed-fill systems.
- 138-
16.3 FIELD TEST DATA ANALYSIS . The analysis of the data collected
during the field test program was done in two ways. First, following
completion of meter tests in a particular loading terminal, the recorded
data was reported to the terminal manager or superintendent on a
special form developed for that purpose. Exhibit 12 is a copy of
the report form. A report was prepared for each meter tested with
each prover and the information was furnished only to individuals
designated by the terminal superintendent. The information was
intended for use in comparing test data when the meters were subjected
to routine calibration check by terminal personnel. Second, upon
completion of the field tests, the completed data sheets were sub-
jected to a comprehensive evaluation and data analysis process.
16.3.1 PROVER VOLUME VERIFICATION . Guarantee was needed that the
volumes of the provers, as previously determined by water calibration,
was valid. The provers were subjected to a routine volumetric cali-
bration. The 60°F Volumes were determined to be 1545.55 gallons
and 758.181 gallons as shown on the Report of Calibrations in
Exhibit 13 and Exhibit 14. The values compare favorably with the
previously determined 1545.51 gallons and 758.257 gallons with the
smaller prover having the largest difference and that being only
0.01 percent of the total volume. The values used for statistical
data analysis were 1545.51 and 758.2 gallons respectively.
16.3.2 PRODUCT TEMPERATURE MEASUREMENTS . The temperature of the
product in the prover was determined at three depths in the prover
through liquid-filled thermowells installed in the prover shell.
- 139 -
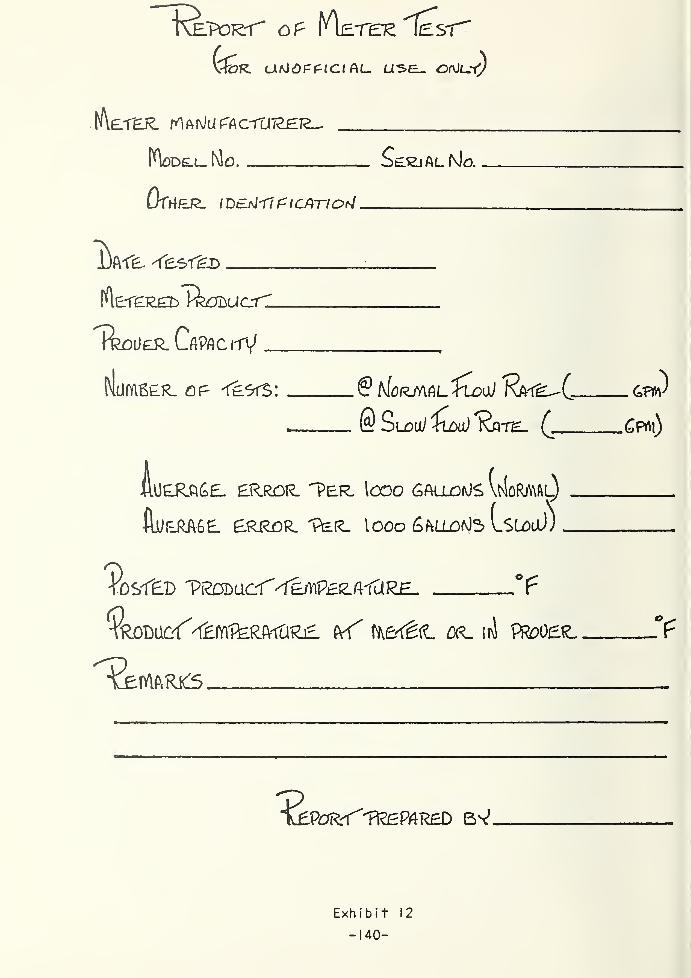
op ^Wrse- "le*sr"
G?Sk. UrJOPPtCl A£_ USE- OnJi_T^
IAe.tek. MAPJarAcrLiTeHjeL-
Mdde.l_ No.
OfHEJe. I DELPHI£ tCAT!Ohl
St.ejAl l\Ja
]>
lAEreKEijT^oBuc-r^-
TkoilER. CfiPflClTV' _
Numeer of itSrS: @ Mciz/AfiL^fu>aJ 'Rm's^-C-
@ Stoui ^ftoo) "Rate. ^
i\JER.fi££_ ERROR. "PER. ICOO GftUjOtJS ItJoRMAl) -
Ajjermr error. "Per. looo (SftuooJs LslooJ) _
-PRODUCT"'•<£/VlPj=e.A'fLlR£_VosiEd
Product"<£MfeRMiR£. fvf' tie-r^L or. itJ Proocr.
TEMftRKS
6TOD
.GPrtl)
£Port"'PREPARED BV.
Exh i b i t 12
-140-
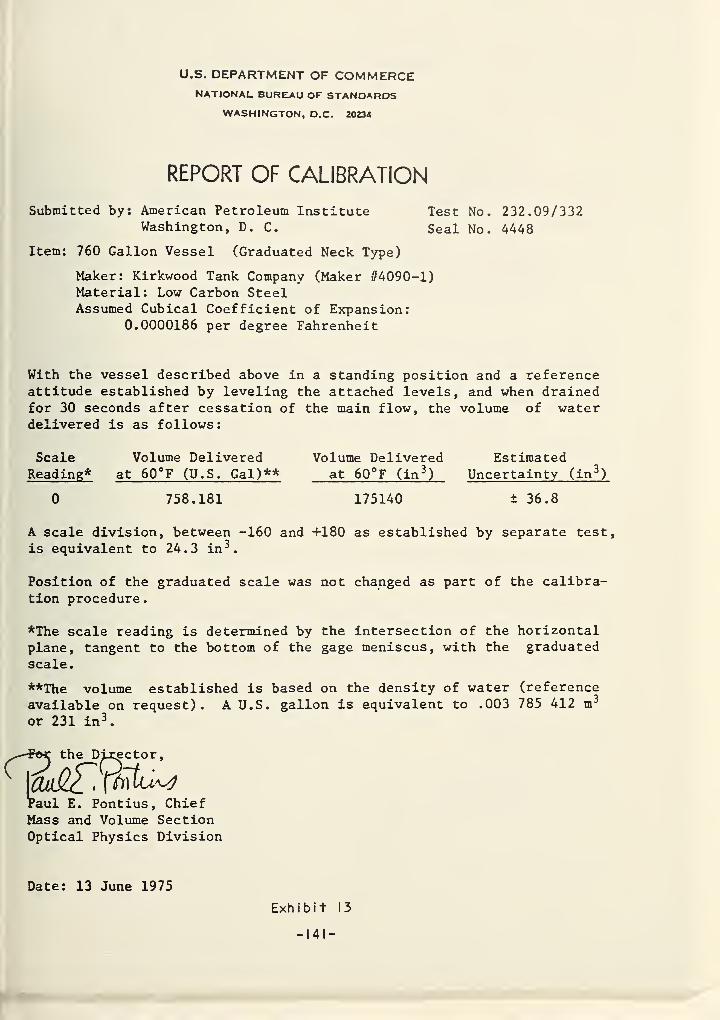
U.S. DEPARTMENT OF COMMERCENATIONAL BUREAU OE STANDARDS
WASHINGTON, O.C. 20234
REPORT OF CALIBRATION
Submitted by: American Petroleum Institute Test No. 232.09/332Washington, D. C. Seal No. 4448
Item: 760 Gallon Vessel (Graduated Neck Type)
Maker: Kirkwood Tank Company (Maker #4090-1)Material: Low Carbon SteelAssumed Cubical Coefficient of Expansion:
0.0000186 per degree Fahrenheit
With the vessel described above in a standing position and a referenceattitude established by leveling the attached levels, and when drainedfor 30 seconds after cessation of the main flow, the volume of waterdelivered is as follows
:
Scale Volume Delivered Volume Delivered EstimatedReading* at 60°F (U.S. Gal)** at 60°F (in 3
) Uncertainty (in 3)
0 758.181 175140 ± 36.8
A scale division, between -160 and +180 as established by separate test,
is equivalent to 24.3 in 3.
Position of the graduated scale was not changed as part of the calibra-tion procedure.
*The scale reading is determined by the intersection of the horizontalplane, tangent to the bottom of the gage meniscus, with the graduated
scale.
**The volume established is based on the density of water (reference
available on request). A U.S. gallon is equivalent to .003 785 412 m 3
or 231 in 3.
ector
,
?aul E. Pontius, ChiefMass and Volume SectionOptical Physics Division
Date: 13 June 1975
Exhibit 13
-141-
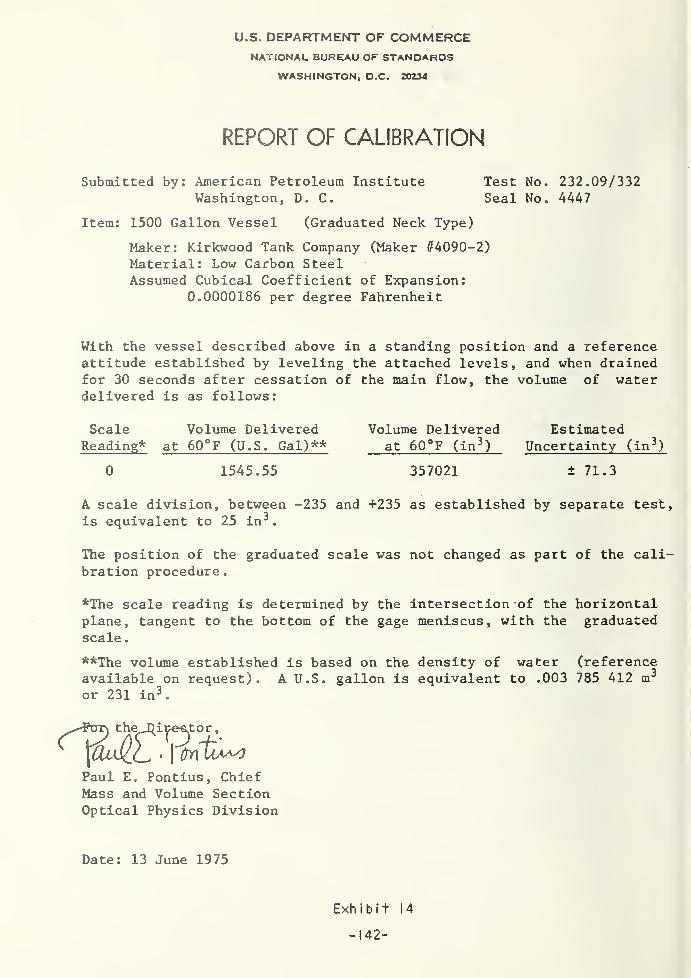
U.S. DEPARTMENT OF COMMERCENATIONAL BUREAU OF STANDARDS
WASHINGTON, D.C. 20234
REPORT OF CALIBRATION
Submitted by: American Petroleum Institute Test No. 232.09/332Washington, D. C. Seal No. 4447
Item: 1500 Gallon Vessel (Graduated Neck Type)
Maker: Kirkwood Tank Company (Maker #4090-2)Material: Low Carbon SteelAssumed Cubical Coefficient of Expansion:
0.0000186 per degree Fahrenheit
With the vessel described above in a standing position and a referenceattitude established by leveling the attached levels, and when drainedfor 30 seconds after cessation of the main flow, the volume of waterdelivered is as follows:
Scale Volume Delivered Volume Delivered EstimatedReading* at 60°F (U.S. Gal)** at 60°F (in 3
) Uncertainty (in 3)
0 1545.55 357021 ± 71.3
A scale division, between -235 and +235 as established by separate test,
is equivalent to 25 in 3.
The position of the graduated scale was not changed as part of the cali-bration procedure.
*The scale reading is determined by the intersection of the horizontalplane, tangent to the bottom of the gage meniscus, with the graduatedscale
.
**The volume established is based on the density of water (referenceavailable on request). A U.S. gallon is equivalent to .003 785 412 m 3
or 231 in 3.
Paul E. Pontius, ChiefMass and Volume SectionOptical Physics Division
Date: 13 June 1975
Exh i b i t 14
-142-
Additionally, both commercial quality I iqu i d- i n-g I ass thermometers
and quartz-crystal temperature probes with electronic digital read-out
were used at each of the three measurement ooints.
The results of data examination for the liquid temperature
measurements indicate two conclusions. First, liquid-in-glass
thermometers, read to the nearest one-tenth degree and periodically
compared with a standard thermometer for accuracy, will provide
temperature measurements of sufficient accuracy and the accuracy
associated with the electronic device is not necessary for this
application. Second, the temperature of the product can be accurately
determined by a single thermowell located at the approximate center-
height of the prover. At no time for the tests conducted during
clear, cloudy, rain, sleet, or snow in both summer and winter was
a temperature gradient of significant proportions noted and recorded.
The only possible advantage to installing more than one thermowell
in a volumetric prover would be redundancy to reveal gross reading
error or to identify an erroneous indication created by a defective
thermometer or a thermowel I with insufficient I iquid fill.
16.3.3 STATISTICAL ANALYSIS -OF FIELD TEST DATA . The data sheets
completed during the field tests were screened to eliminate any meter
tests where an insufficient amount of data was taken or tests termi-
nated because of equipment malfunction. The balance of the data
sheets were used in the analysis to evaluate the meter and prover
performance. Due to the extensive number of tests performed on each
meter, it was expedient to reduce the number of tests analyzed to
three norma I -flow tests and one s low-flow test. The tests were
- 143-
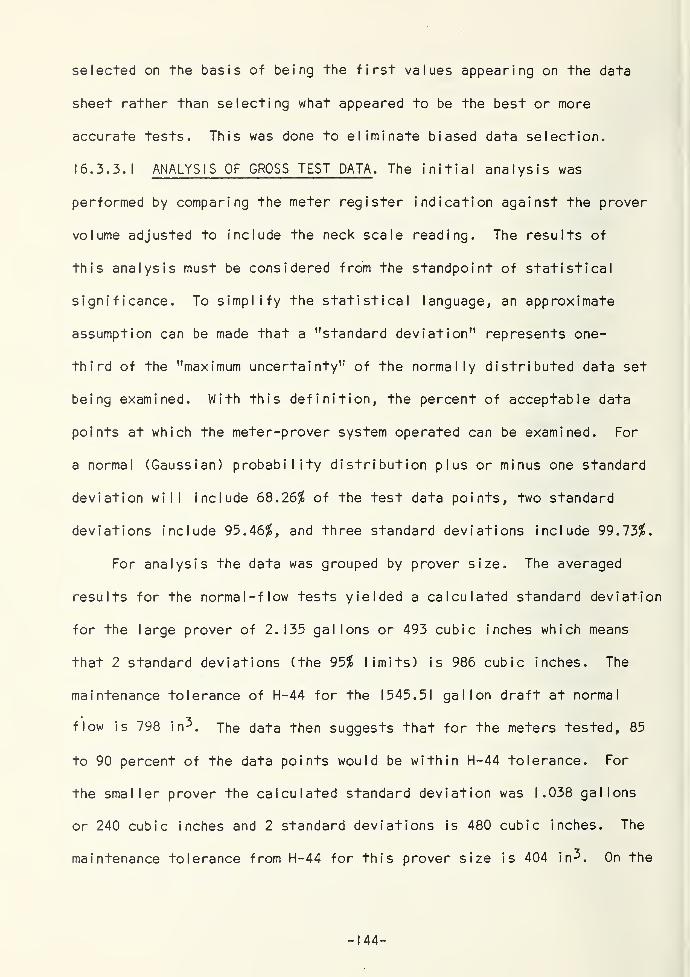
selected on the basis of being the first values appearing on the data
sheet rather than selecting what appeared to be the best or more
accurate tests. This was done to eliminate biased data selection.
16.3.3.1 ANALYSIS OF GROSS TEST DATA . The initial analysis was
performed by comparing the meter register indication against the prover
volume adjusted to include the neck scale reading. The results of
this analysis must be considered from the standpoint of statistical
significance. To simplify the statistical language, an approximate
assumption can be made that a "standard deviation" represents one-
third of the "maximum uncertainty" of the normally distributed data set
being examined. With this definition, the percent of acceptable data
points at which the meter-prover system operated can be examined. For
a normal (Gaussian) probability distribution plus or minus one standard
deviation will include 68.26$ of the test data points, two standard
deviations include 95.46$, and three standard deviations include 99.73$.
For analysis the data was grouped by prover size. The averaged
results for the normal-flow tests yielded a calculated standard deviation
for the large prover of 2.135 gallons or 493 cubic inches which means
that 2 standard deviations (the 95$ limits) is 986 cubic inches. The
maintenance tolerance of H-44 for the 1545.51 gallon draft at normal
flow is 798 in 5 . The data then suggests that for the meters tested, 85
to 90 percent of the data points would be within H-44 tolerance. For
the smaller prover the calculated standard deviation was 1.038 gallons
or 240 cubic inches and 2 standard deviations is 480 cubic inches. The
maintenance tolerance from H-44 for this prover size is 404 in 5 . On the
- 144 -
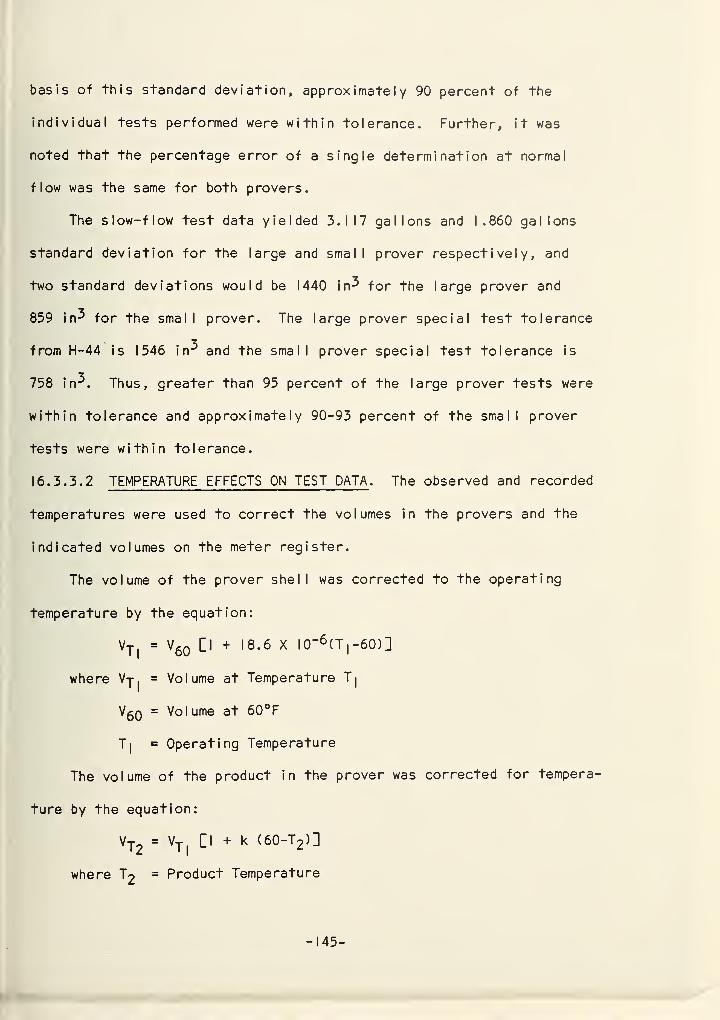
basis of this standard deviation, approximately 90 percent of the
individual tests performed were within tolerance. Further, it was
noted that the percentage error of a single determination at normal
flow was the same for both provers.
The slow-flow test data yielded 3.117 gallons and 1.860 gallons
standard deviation for the large and small prover respectively, and
two standard deviations would be 1440 in^ for the large prover and
859 in^ for the small prover. The large prover special test tolerance
from H-44 is 1546 in^ and the small prover special test tolerance is
758 in-^. Thus, greater than 95 percent of the large prover tests were
within tolerance and approximately 90-93 percent of the small prover
tests were within tolerance.
16.3.3.2 TEMPERATURE EFFECTS ON TEST DATA . The observed and recorded
temperatures were used to correct the volumes in the provers and the
indicated volumes on the meter register.
The volume of the prover shell was corrected to the operating
temperature by the equation:
VT| = V6Q[I + 18.6 X I
0
—
6
( T |-60)U
where Vjj = Volume at Temperature Tj
Vgg = Volume at 60°F
Tj = Operating Temperature
The volume of the product in the prover was corrected for tempera-
ture by the equation:
Vj2
= VT[I + k (60-T2 )]
where T2 = Product Temperature
- 145 -
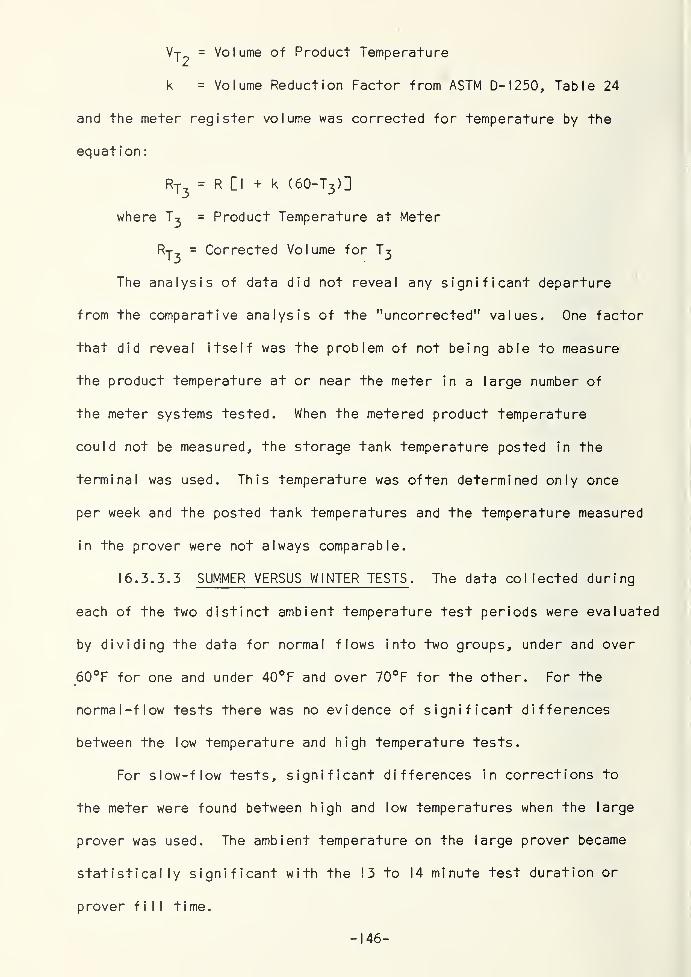
Vj^ = Volume of Product Temperature
k = Volume Reduction Factor from ASTM D— 1 250 , Table 24
and the meter register volume was corrected for temperature by the
equation
:
Rj3
= R Cl + k ( 6O-T3 )]
where T3 = Product Temperature at Meter
Rj3
= Corrected Volume for T3
The analysis of data did not reveal any significant departure
from the comparative analysis of the "uncorrected" values. One factor
that did reveal itself was the problem of not being able to measure
the product temperature at or near the meter in a large number of
the meter systems tested. When the metered product temperature
could not be measured, the storage tank temperature posted in the
terminal was used. This temperature was often determined only once
per week and the posted tank temperatures and the temperature measured
in the prover were not always comparable.
16.3.3.3 SUMMER VERSUS WINTER TESTS . The data co I I ected dur i ng
each of the two distinct ambient temperature test periods were evaluated
by dividing the data for normal flows into two groups, under and over
60°F for one and under 40°F and over 70°F for the other. For the
norma I -flow tests there was no evidence of significant differences
between the low temperature and high temperature tests.
For slow-flow tests, significant differences in corrections to
the meter were found between high and low temperatures when the large
prover was used. The ambient temperature on the large prover became
statistically significant with the 13 to 14 minute test duration or
prover fill time.
- 146 -
16.3.4 SUMMARY OF TEST DATA ANALYSIS . Analysis and evaluation of
the Field Test Data provided evidence that the volumetric field
standards (provers) designed for these tests were sufficiently ver-
satile and appropriate for the intended application. The equipment
was convenient to operate and was flexible enough to adapt to most
meter-proving situations encountered. The accuracy and repeatability
of the meter-prover were within normally acceptable limits and few
changes were required in the initial equipment specification to
develop the specification presented in Appendix A.
The meter error comparisons with existing H-44 tolerances were
within an acceptable range. The comparisons would have been improved
if the values of the calculated two standard deviations had more
closely coincided with the allowable tolerance. The data obtained,
though the number of meters tested was relatively small, reflects
that in normal meter testing the rejection or out-of-to I erance rate
would be in the order of 10 to 15 percent. This is possibly a small
amount higher than would be desired. The overall statistical analysis
for all meter systems suggests that the field test program was conducted
in a good state of system control if one uses a two standard deviation
criteria and in an excellent state of system control using the three
standard deviation theory.
- 147 -
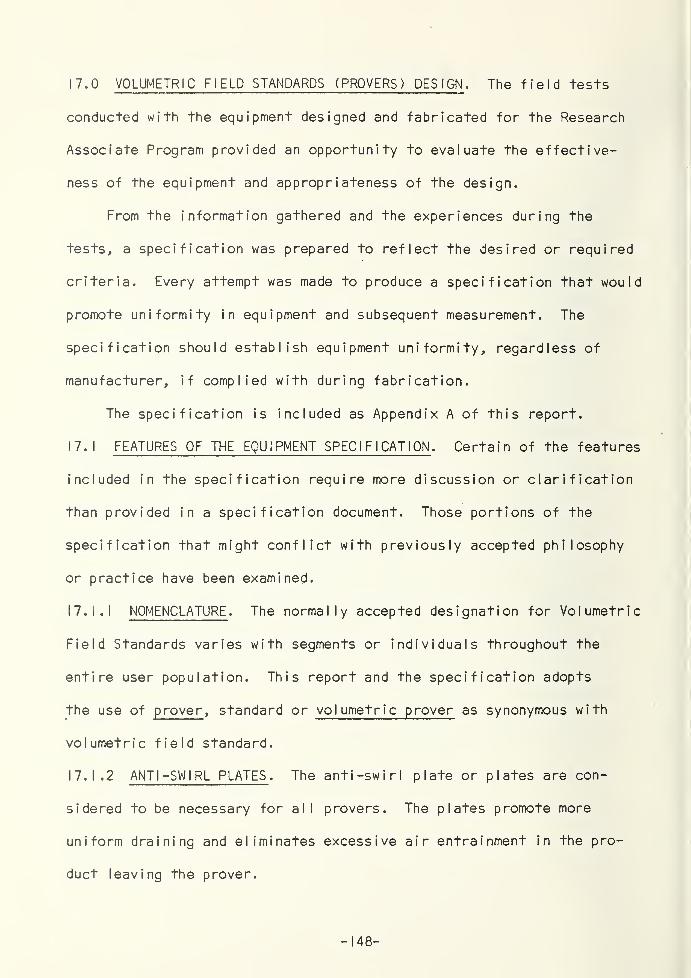
17.0
VOLUMETRIC FIELD STANDARDS (PROVERS) DESIGN. The field tests
conducted with the equipment designed and fabricated for the Research
Associate Program provided an opportunity to evaluate the effective-
ness of the equipment and appropriateness of the design.
From the information gathered and the experiences during the
tests, a specification was prepared to reflect the desired or required
criteria. Every attempt was made to produce a specification that would
promote uniformity in equipment and subsequent measurement. The
specification should establish equipment uniformity, regardless of
manufacturer, if complied with during fabrication.
The specification is included as Appendix A of this report.
17.1 FEATURES OF THE EQUIPMENT SPECIFICATION . Certain of the features
included in the specification require more discussion or clarification
than provided in a specification document. Those portions of the
specification that might conflict with previously accepted philosophy
or practice have been examined.
17.1. 1 NOMENCLATURE . The normally accepted designation for Volumetric
Field Standards varies with segments or individuals throughout the
entire user population. This report and the specification adopts
the use of p rover , standard or vol umetri c p rover as synonymous with
volumetric field standard.
17.1.2 ANT I -SWIRL PLATES . The anti -swirl plate or plates are con-
sidered to be necessary for all provers. The plates promote more
uniform draining and eliminates excessive air entrainment in the pro-
duct leaving the prover.
- 148 -
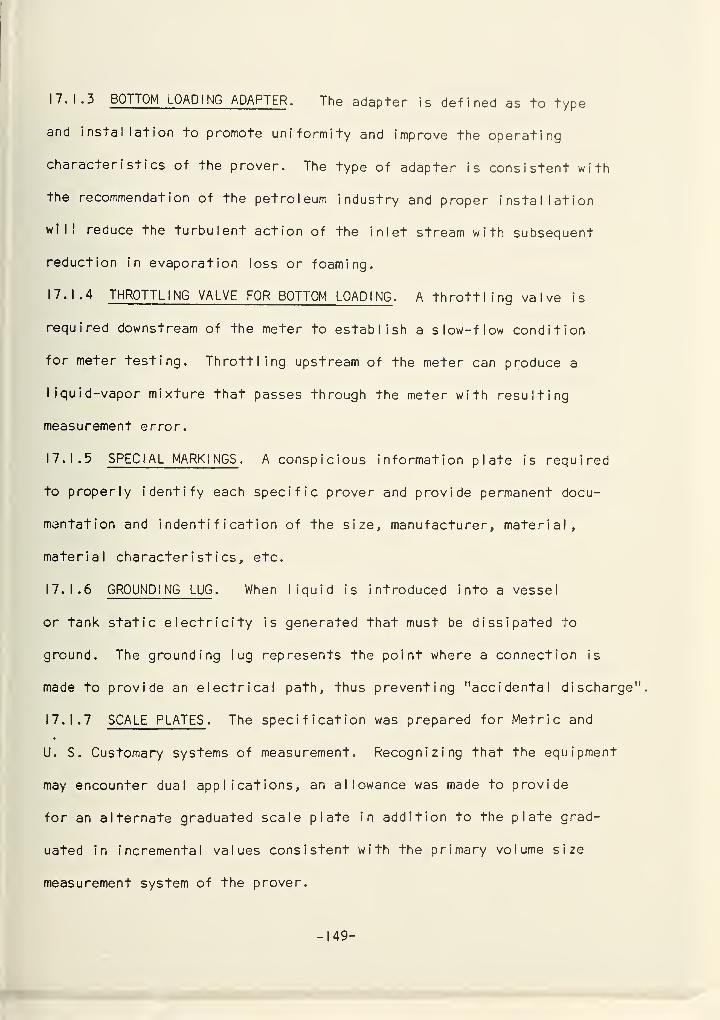
17.1.3BOTTOM LOADING ADAPTER. The adapter is defined as to type
and installation to promote uniformity and improve the operating
character i st i cs of the prover. The type of adapter is consistent with
the recommendation of the petroleum industry and proper instal lation
will reduce the turbulent action of the inlet stream with subsequent
reduction in evaporation loss or foaming.
17.1.4 THROTTLING VALVE FOR BOTTOM LOADING . A throttling valve is
required downstream of the meter to establish a s low-flow condition
for meter testing. Throttling upstream of the meter can produce a
liquid-vapor mixture that passes through the meter with resulting
measurement error.
17.1.5 SPECIAL MARKINGS . A conspicious information plate is required
to properly identify each specific prover and provide permanent docu-
mentation and i ndenti f i cation of the size, manuf acturer , material,
material character i st i cs , etc.
17.1.6 GROUNDING LUG . When liquid is introduced into a vessel
or tank static electricity is generated that must be dissipated to
ground. The grounding lug represents the point where a connection is
made to provide an electrical path, thus preventing "accidental discharge".
17.1.7 SCALE PLATES . The specification was prepared for Metric and
U. S. Customary systems of measurement. Recognizing that the equipment
may encounter dual applications, an allowance was made to provide
for an alternate graduated scale plate in addition to the plate grad-
uated in incremental values consistent with the primary volume size
measurement system of the prover.
- 149 -
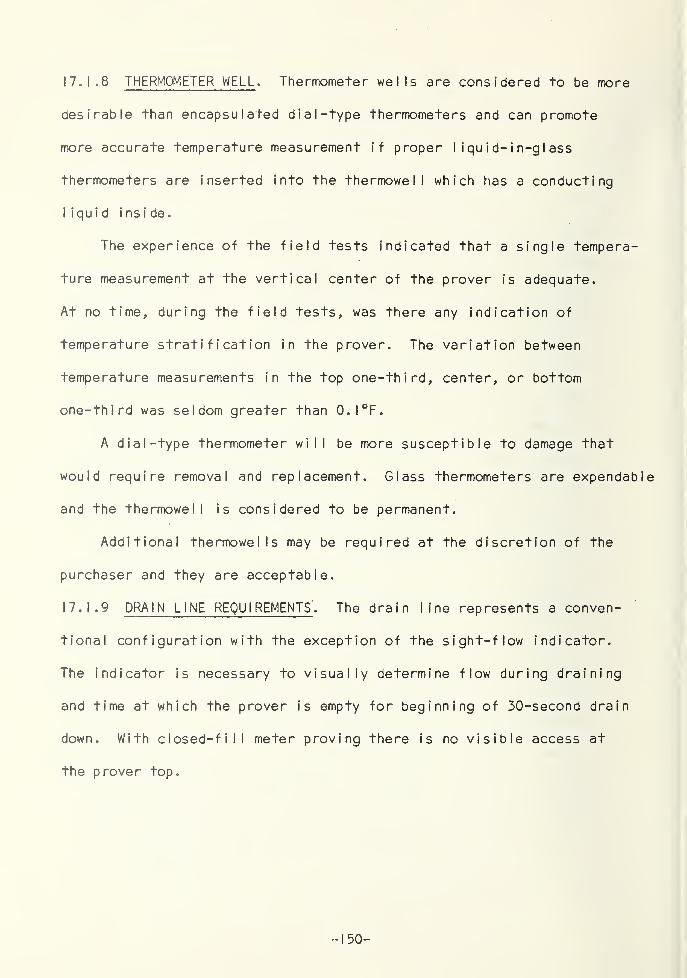
17.1.8 THERMOMETER WELL. Thermometer wells are considered to be more
desirable than encapsulated dial-type thermometers and can promote
more accurate temperature measurement if proper I
iqu i d- i n-g I ass
thermometers are inserted into the thermowell which has a conducting
liquid inside.
The experience of the field tests indicated that a single tempera-
ture measurement at the vertical center of the prover is adequate.
At no time, during the field tests, was there any indication of
temperature stratification in the prover. The variation between
temperature measurements in the top one-third, center, or bottom
one-third was seldom greater than O.I°F.
A dial-type thermometer will be more susceptible to damage that
would require removal and replacement. Glass thermometers are expendable
and the thermowell is considered to be permanent.
Additional thermowells may be required at the discretion of the
purchaser and they are acceptable.
17.1.9 DRAIN LINE REQUIREMENTS . The drain line represents a conven-
tional configuration with the exception of the sight-flow indicator.
The indicator is necessary to visually determine flow during draining
and time at which the prover is empty for beginning of 30-second drain
down. With closed-fill meter proving there is no visible access at
the prover top.
- 150 -
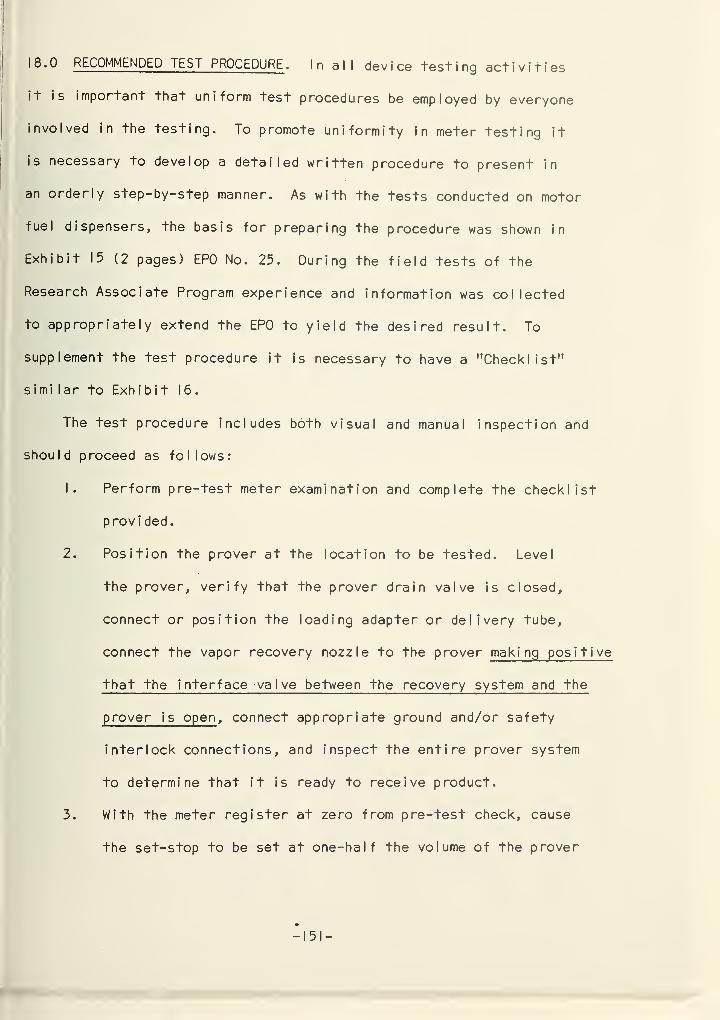
18.0 RECOMMENDED TEST PROCEDURE . In all device testing activities
it is important that uniform test procedures be employed by everyone
involved in the testing. To promote uniformity in meter testing it
is necessary to develop a detailed written procedure to present in
an orderly step-by-step manner. As with the tests conducted on motor
fuel dispensers, the basis for preparing the procedure was shown in
Exhibit 15 (2 pages) EPO No. 25. During the field tests of the
Research Associate Program experience and information was collected
to appropriately extend the EPO to yield the desired result. To
supplement the test procedure it is necessary to have a "Checklist"
similar to Exhibit 16.
The test procedure includes both visual and manual inspection and
should proceed as follows:
1. Perform pre-test meter examination and complete the checklist
provided.
2. Position the prover at the location to be tested. Level
the prover, verify that the prover drain valve is closed,
connect or position the loading adapter or delivery tube,
connect the vapor recovery nozzle to the prover making positive
that the interface valve between the recovery system and the
prover is open , connect appropriate ground and/or safety
interlock connections, and inspect the entire prover system
to determine that it is ready to receive product.
3. With the meter register at zero from pre-test check, cause
the set-stop to be set at one-half the volume of the prover
- 151 -
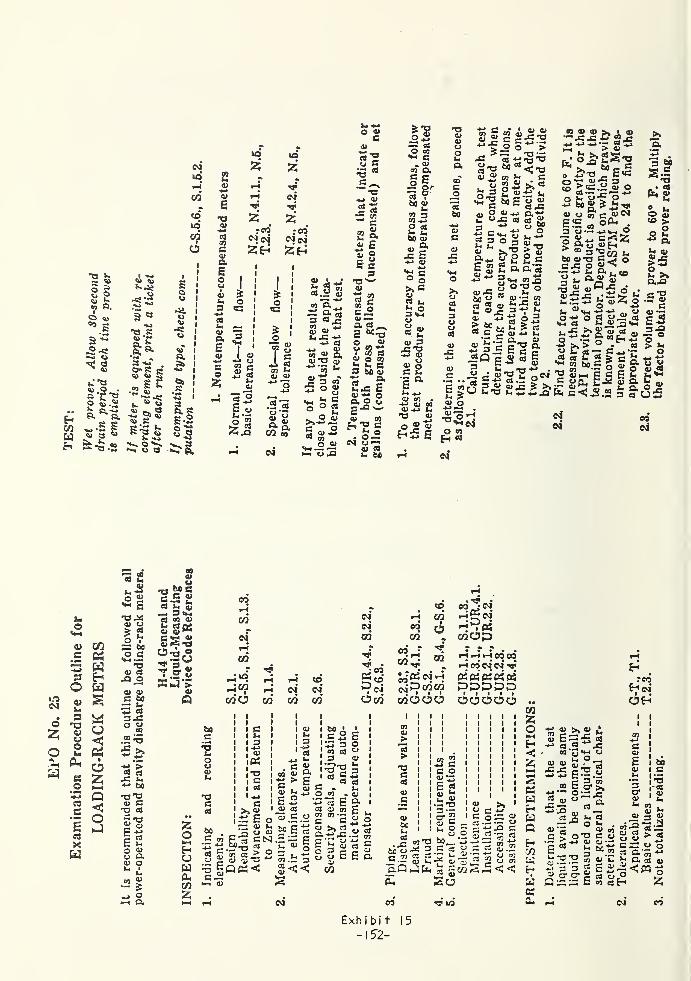
w
0 £© ?© i:
1o05 s2 ~
^ ©
t:*S© o»'C"«g&s„.g S© a «Ss -6 .8
© C^*-•4;uC£
'a s©a
(Midi“H
CO
tdid
COI
O
SClt>
•«.©
3 ti •O* R g© © i;
.= le
k »|© G•S.s
*
s-s ©h **•»
•*-. o i-vs u a
J» i
-Gi« i
, i
© ia ia i
*»i
•S
IsS-2p -s
241
41
E"T341•W
cn
G©aE©
piMC
2:
red©j oi
Zh:«
©levi
55H
io<G
S 1
© I «i-» -P ©
&o<c
•s
o
c©55
aGujj
~3 °£ ©Sg55 J§
©©c03
00 *M© ©J
fes «9-»
© ©C
©« =
>5
cM ©rt t;_pt as•5 co
c
£ l© £<4-1 7*
1>©
C °G S
© •
a wc3 .5; ©
.—. -*->
O) P. _~ getsS 01 J5a> ©5m -C -tJ•M Ctf
©ai ® a© T3 ©'— h
•o'©
s csJ© ~-<a rt
E *•©©
.2 <«
s£OT «
©3
03
3 o?O ©o
1- GO aj_ 5mO qj>4~> «
o© -*-»
03
^ O «-« © .a
©JC
Vm©>>Cc3
"3©
8 g© 03n h C3 bC ©
« &h JS E© £ ©a e vc -o >—
•
© w^1§©4 0 —
© cibi 63
IS= 03O inli G_ ©
<n O,
§ E
ca «©5m
03 303 mm>© cSh *mbo ©
if-*-> ©**1 "cO o>.CoG li>- o3 V-l©g «3 h.
© 3£•2« gC »M
E^
5m ^© 03 .
-*-> © 03© +J 5m73 ©O © aJ
•a©©
>>©035m
3©©03
©
©c
E «t. ?© o-w <^3© TT
O 03
H <3
ei
M C^ ©©• © ©
-Jf“i«<T3
^ ir? ^« s" >;
«
©©
g 3 g ©.^<2 ^ &E
"c «« 3^
£S^-S a '
"2 ^ © t-22° = e© >a^oSScE g 2 a o/5P 2 **1 wS„,£ S°^ot«u M #•- «2 g« £££
2 boO+->
:ts©G
® ® ® >» J. ®-c JC X? ® JZ** ** n "c S *»
” ^ 60 ™ Go ^"O ”E«Go*r © 7: 3£>«c.H©oO 2 o**
« « m c.®NES a •
3 © •« m Oo X >> 2« o60 © -a c J ocj= o «**•
a «•q^
> ^^2 ^
«
« C P©4J lo
*r ex ©
!d5*sSo«
3
© ©j- ^U «i "a 1- C3 ja
4 <n
3 *-o? ©"5 o’t;© i -c .• -ti
^ .t; -*-> Jr © pnj O J
5mw <h ,«J 4J -» ©
o -m o ^ u c3Vm C3 U © 3 «m
i< £ « c, j;2 «S£S»3H sa ** ?s ^ p -«jt^ « tc.S O g §• "oShPrE®•S £* £ £fe cC£.2 3 £•
3.
3 6J
siT3- • «h g
o 5;to >_ o
hi a>
otajac T3©c© *r
E -3
1 =*so «« «*
fcoJo£
•oiPJoi
cooi
hi9
<U C/3e «W
lf5
o2;
a
30OJh,
3*o<uw©hi
Si
e.2C5ea
C
1ea
Xa
HaSa©a©zE==3
Q<Oa
1m©
5*O^ E-0 93© «^ 2O I
33 600 c1H —
•
T3V as
X>£© ©C 6033 h.*_> c4
3 33° 00
.2 *3
£ >**J_-M
j ’>g ca33 h.i-* 60
T3 TD© Ga g
1 ©£ tJ
00©
-o bfiSIs .5 2
5m SPX 3«4M© 03 ©5m 03 ^2© © ^gS-§asa^3T o-gSJ>
©Q
eot~*.
CO
piaCO
a 1"h'O?
cdOI
60
.5"3ho©©u
T3GG
Z. ^2 =«•a "CJw
1
1
1 ©1 3
pjoi
©3
vH ?—tj «d
M* •
a 00.S to
p^!?=H oi oi
cd cd «3 Cm
1 GI hI 3I
-*-»
!«i-g
: g1 -4-»
G>> %^ E w3S © 5m v, C_o © © r? c cs
- *- K3 C ITT C
1
"c3
*S oS
ad © ^> E
© u 13
E 2© 03
0 0) C ©
I
I
l bfl •
1 c 3i“ 31
•c|| 2g 3 S-a|P«C
tsj.S — Eoi"oc-* 5j .E "3
g<<
tn aj3
I G 5c .O » .a c3 £G © tnm 03 —
*
C C" >c 2a.-i-> 33 .
Er oE ©
O 3 j-O © c©
CO
Eo©©s*3*JGM©aE u© o© cS— ec
a gE a
eo
CO
• •
eo /-OJa piaP«
. wapeo
col
7CO H H H CO CO
a eo oi pidtf « K« 05DPDPP
mc366 66666dPww
©"5
>73co3
©C
©bo5m
5 cn
bo © ^C O) C3• -1 <daOa
M cc o«raE gflj 5m
•E-a
§1u o «© o
73 b0_3 S <=3 y^ v 5*i!’'ig 2 cj
^ G gW
©^ C§•2
« «-*-» •—
>
c _2*£ O)
3: ©r_ ©33 c•35S.Z3
<<•2 |
aCO
c»-* ©
W-4 a So^ 2 Z . #»-» p< 1=1 rH CM CO tt* id
COzol-M
a<
C5aaaQaw
a«a
+*«>»«S E = 5“2 o
©
E-2.2E o< >1— 33
rrt°-
G S »- GO 5m
c 5 O'O a -
£03 u tol
3 ©'iS '5 3 G £« 5- a- « §1P33 £ ®
i
reoaoioa
1 1
1 1
m 1
PJ
Exh i b i
t
-152-
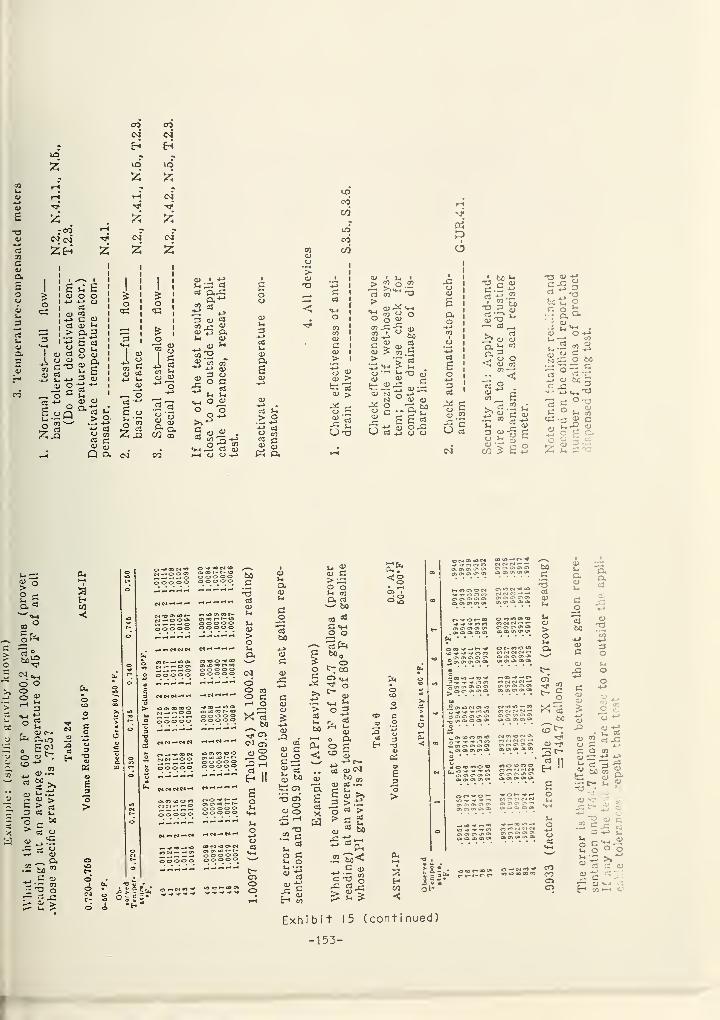
rtTj
aCJ
Q.
£o
CO CO<M* oi
• H tiVO >1 _
*& VO >0
- ZrH •
t—
<
r-H CMTT E -?
Z* CO r-H - •
CJ CM CM CM
£OCG
! I
\&l <p
<D d. u om C 'O
dQ.
Hfa -fa 3 <U
d£uoP.
o5c
>
oJQ
dJ-.
<U <D
^ d C> Q.
d c<D cuQ a
^ od -*-*
£ o>-* *e
2. S
CD-*->
d
dCO
E <D
<D ^
1
1
1
I
> 0. q 1 &-*->
CJ
1
15 0
mca
i§ 1
<dogdVj
<D CD
~ o
<D I -4-J
u EG ddP.^
J2 o*
P <DW EGd<Da.
)^3
.2 d
Q. ^CXc/3 s?
x'S
.S§
«+h ooo
>>-*-*
£ a)d coO
—< a-2*5d CD
CD
04
sCD
-*-> c3O 03
S* CCD qj
tf 04
CO
CO
LO
CO
CO
CJ CD
CD >t: 'dCD >Ccj ^
S'*EG uO T3
<D • V* •
> J o .2»—• P‘3 v-j .
rt n ^3
<u ^ V-*
^ </J O oO o OJ
CDJ. <DO > O)CD > CO
*_P «*H S$T~ s
^EGa
o<D
O d
s°ocGo
T3 qjC
<D EE-4-J
CD <D
G *5
S C3
O E^CJ CJ
Ctf
pa
I
J
& 1
.9 i
d •
£ |
2:p
d^ £cj 5<D CO
eg‘£O d
73ed
63 »-•
C ^^ 4-»
t > 05
3 '§f73_ _d ^ZZ* J~»
<D— d _jv d^ o ogs"< ”w O
CD 05
d °^ -4->CDCO
<__t
dr? CD
J-4
pcjd .-
CO ?
£•2 J-4
*
G CD~ dCD EGS-i
CD
HCD
E-S
T3 <D
O EGd ^boG
CJ
_ P'O
t: o° £04 aCDJ-4
^ dO -»-»
CO
S i!
O 60
o .05 <u ti ^
^ *-> «*-i
a 0 'cs
. -
0 ^ 3c-a 5; c<u 0“oPao <•> S ®
cj 2 -^L
c:
c
u.
2°S C!
a '1
d ”
to )2^cr
^ *wO OOO «
0 t- O c^-^ C-irt
„ E2. Etr-
«s(D ^^ <DE >
0 G> d
.E tO
—> .£d T3
50
>dufco
CJ
sCJ<Da03
(DCOOJG>
04
HCO
<
00000
C4 C-J OJ •-• -« —* C4 -
"3E
•
CD CD dV-<
EU> EGO 0
^3 CD l~t CO
d >-4 P- dCDJ— d ^ 60
^0 ao dU0)> *d
60
d «MO
0V4 4-> 'd PP4 CD d' /" G w OCvl
OCDEG-*->
Od ^ COO V-4d1 0O 03 tr-O a d -i-»
(D- .
> Ifi0is3«0 . *
rs, •— — O O 033001-0. i
“ Z- —. — — OOOOO V _»a 00000 O o o o o
<2
fa
«<s
s3
3HC/3
<:
»3 (7lON CO O -
-rtCiON
60
.£e3dCD
OCIOOI®
f or-rtoo o.
0 oi(7>a)O><» 03 <7> a> o» <»
•
3 * «NNN-•7 c.oja.ocr. ojo3 <t»^| 0» OT® C3 C3 <» t73 <» a> <3» 03 03 ca p» O•C322JSS X-S3 C.mf.oo 00^*003 w
«
^, 0(3000 OOCIOIOI C*J
2 oE. CMOrtfftO C4 C10 NC7*
O ^ eo nciNOi-; ..tcooioai 0000 a w r?W C73 C7* 0030> 0)00 o® «
t d IIioo«OB no»«o r, II
c^ u3 co E? E* E! ~ Eomcioo o 0 - ^ ^0) 0)03 0)• cn cr> o» c» c»
Sstj^ss 20^ 0) 0)0303 0) 0)0 0) 0. V-4
u.^.ao^—co
pj— °
0) 0) 00) 0) 0) 0.000a» o o) o» a» 0* 0. 0)0 0)
d
« -a .
e * »
I*H:
w CO3 ® cooo
d60
EuP4
dCD
<D'Ti
CDCO
’
O
CDu. dd EG
CD
0 cn
cj EE OU d" bo 5)
(fa
C- fa
“E S =>’*G k.
. ^ > C
“CXrt— -fa fafa _, CJ
2 goo
c -
:
cj ^-< rt
« -> c
CJ
H
Exh i b i
t
( cont i nued
)
-153-
|
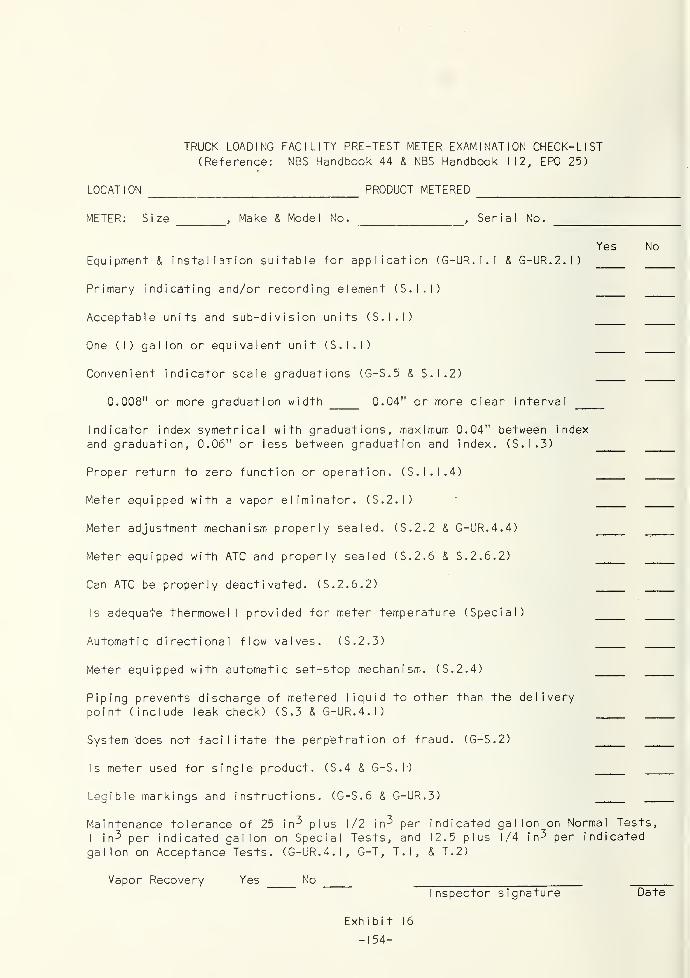
TRUCK LOADING FACILITY PRE-TEST METER EXAMINATION CHECK-LIST(Reference: NBS Handbook 44 & NBS Handbook 112, EPO 25)
LOCATION PRODUCT METERED
METER: Size,Make & Model No. Serial No.
Yes NoEquipment & installaTion suitable for application (G-UR. I . I & G-UR.2.1)
Primary indicating and/or recording element (S.I.I)
Acceptable units and sub-division units (S.I.I)
One (I) gallon or equivalent unit (S.I.I)
Convenient indicator scale graduations (G-S.5 & S.1.2)
0.008" or more graduation width 0.04" or more clear interval
Indicator index symetricai with graduations, maximum 0.04" between index
and graduation, 0.06" or less between graduation and index. (S.1.3)
Proper return to zero function or operation. (S.I.I. 4)
Meter equipped with a vapor eliminator. (S.2.1)
Meter adjustment mechanism properly sealed. (S.2.2 & G-UR. 4. 4)
Meter equipped with ATC and properly sealed (S.2.6 & S.2.6.2)
Can ATC be properly deactivated. (S.2.6.2)
Is adequate thermowell provided for meter temperature (Special)
Automatic directional flow valves. (S.2.3)
Meter equipped with automatic set-stop mechanism. (S.2.4)
Piping prevents discharge of metered liquid to other than the deliverypoint (include leak check) (S.3 & G-UR. 4.1)
System 'does not facilitate the perpetration of fraud. (G-S.2)
Is meter used for single product. (S.4 & G-S.l)
Legible markings and instructions. (G-S.6 & G-UR. 3)
Maintenance tolerance of 25 in^ plus 1/2 in^ per indicated gallon on Normal Tests,
I i n^ per indicated gallon on Special Tests, and 12.5 plus 1/4 in^ per indicated
gallon on Acceptance Tests. (G-UR. 4. I, G-T, T.l, & T.2)
Vapor Recovery Yes NoInspector signature Date
Exhibit 16
-154-
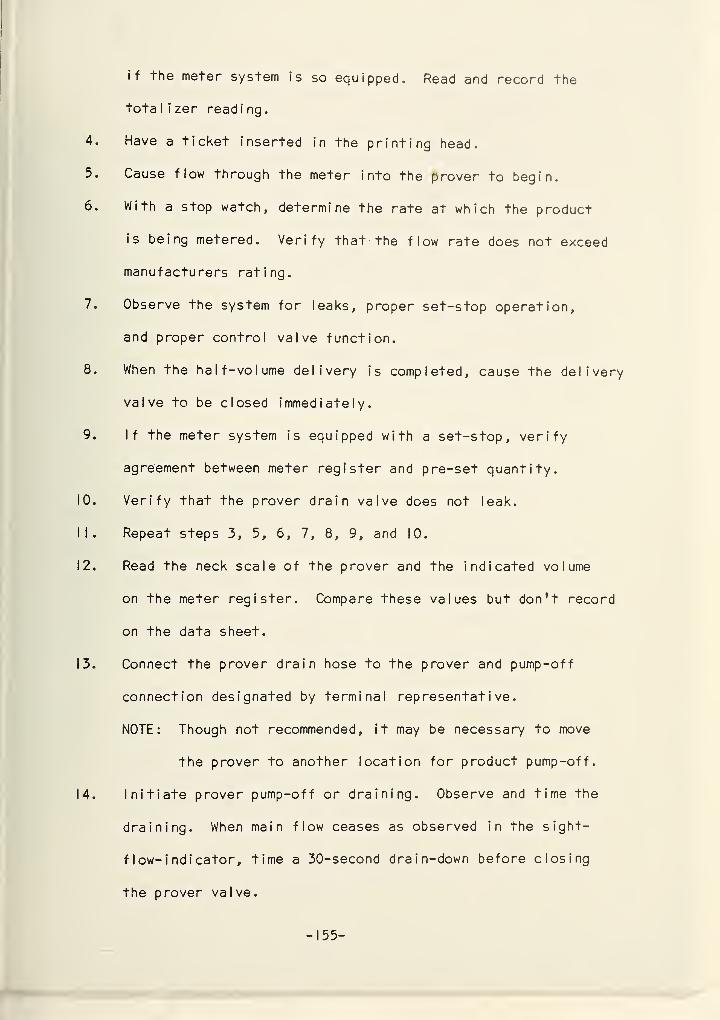
if the meter system is so equipped. Read and record the
tota I i zer read i ng
.
4. Have a ticket inserted in the printing head.
5. Cause flow through the meter into the prover to begin.
6. With a stop watch, determine the rate at which the product
is being metered. Verify that the flow rate does not exceed
manufacturers rating.
7. Observe the system for leaks, proper set-stop operation,
and proper control valve function.
8. When the half-volume delivery is completed, cause the delivery
valve to be closed immediately.
9. If the meter system is equipped with a set-stop, verify
agreement between meter register and pre-set quantity.
0. Verify that the prover drain valve does not leak.
1. Repeat steps 3, 5, 6, 7, 8, 9, and 10.
2. Read the neck scale of the prover and the indicated volume
on the meter register. Compare these values but don't record
on the data sheet.
3. Connect the prover drain hose to the prover and pump-off
connection designated by terminal representative.
NOTE: Though not recommended, it may be necessary to move
the prover to another location for product pump-off.
4. Initiate prover pump-off or draining. Observe and time the
draining. When main flow ceases as observed in the sight-
flow- i nd i cator, time a 30-second drain-down before closing
the prover valve.
- 155 -
15 . Cause the register to be zeroed and the set-stop (if so
equipped) to be set at the nominal volume of the prover.
NOTE: It may be required or desirable to print a delivery
ticket for each prover test.
16. Repeat Steps 4 (if necessary) 5, 6, and 7.
17. When the delivery is completed, cause the delivery valve to
be closed immediately.
18. Read and record the prover neck scale level to an accuracy
of one tenth scale division.
19. Read and record the meter indication to the nearest one-tenth
division.
20. Determine and record on the data sheet the temperature of
the product in the prover to nearest 0.1 degree.
21 If the meter is non-temperature compensated or compensated
with both gross and net indication, the accuracy of the non-
compensated or gross indication is determined by comparison
of data recorded in Steps 18 and 19. The meter tolerance
can be found in NBS Handbook 44 or calculated by the appropriate
equation as fol lows:
Acceptance Tolerance (in^) = (±) 12.5 + 0.25 (Prover Volume-gallons)
Maintenance Tolerance (in^) = (±) 25 + 0.5 (Prover Volume-gallons)
22. Determine the accuracy of the temperature compensated in-
dication, if meter so equipped, by the method given in EPO
No. 25.
23. Repeat Step 13 (if necessary) and 14.
- 156-
24. If the test result is near or exceeds the allowable tolerance,
the test must be repeated. If well within tolerance,
proceed with the test.
25. A temperature compensated meter with both net and gross
volume indication can be verified by comparing the value of
the net indication with the corrected gross indication (correct
as in Step 22 substituting "gross reading" for "prover
readi ng")
.
26. Test the compensator of a temperature-compensated meter with
net indication only by deactivating the compensator and
repeating Steps 4, 15, 5, 6, 7, 17, 18, 19, 20, 21, 13, and 14.
27. Cause the "throttling valve" to be adjusted to achieve
approximately 20 percent of flow rate determined in normal
test or manufacturers recommended minimum flow rate. Minor
adjustment may be necessary as flow begins.
28. Repeat Steps 4 and 15.
29. Cause flow through the meter into the prover to begin.
30. With a stop watch, determine the rate at which the product
is being metered. Verify that the flow rate does not exceed
manufacturers rating.
3t>* Observe the system for leaks, proper set-stop operation,
and proper control valve function.
32. When the delivery is completed, cause the delivery valve to
be closed immediately.
33. Read and record the prover neck scale level to an accuracy
of one-tenth scale division.
- 157-
34. Read and record the meter indication to the nearest one-tenth
division.
35. Determine and record on the data sheet the temperature of
the product in the prover to nearest 0.1 degree.
36. If the meter is non-temperature compensated or compensated
with both gross and net indication, the accuracy of the non-
compensated or gross indication is determined by comparison
of data recorded in Steps 18 and 19. The meter tolerance
can be found in NBS Handbook 44 or calculated by the appro-
priate equation as follows:
Special Test Tolerance (in^) = (±) | .0 (Prover Volume-gallons)
37. Determine the accuracy of the temperature compensated in-
dication, if meter so equipped, by the method given in EPO
No. 25.
38. If the test result is near or exceeds the allowable tolerance,
the test must be repeated. If well within tolerance the meter
test is complete.
39. Repeat Steps 13 (if necessary) and 14.
40. Reactivate temperature compensator if deactivated, affix
security seals if appropriate, complete the report of test
(data sheet), and record final totalizer reading.
- 158-
18.1 RULES FOR TESTING . During any testing process, certain rules
or guidelines must be established for the safety and protection of
personnel, equipment, and property. From the experience of the Research
Associate Program Field Tests certain rules have been identified that
are considered important in test i ng jpetro I eum product meters. These
rules include:
1. Notify appropriate plant personnel of your presence.
2. Be completely familiar with plant safety requirements and
comply with these requirements at all times.
3. Know plant emergency procedures.
4. Determine the location of plant safety equipment such as
fire extinguishers, water hose, etc.
5. Have plant representative verify proposed piping configurations
for testing, pump-off, etc.
6. Never manipulate, change or adjust plant valves, hoses,
switches, etc. without the express knowledge and approval
of the designated plant representati ve.
7. Maintain constant surveillance on the meter register, set-
stop, etc. during periods when product is flowing through
the meter into the prover. Set-stop malfunction is primary
cause for overf i I I i ng of a prover and can be eliminated by
the person watching the meter.
8. Be completely familiar with your test equipment.
9. Never attempt to pump-off or drain prover without appropriate
approval to do so.
- 159 -
Never leave the test equipment unattended during testing,
pump-off, etc.
Always leave the test site as you found it with respect to
hoses, valve positions, etc.
Never discuss the results of your testing with other than
designated or appropriate persons.
Always record a beginning and final totalizer reading to
avoid fouling plant inventory records.
- 160 -
19.0 SUMMARY OF THE API/NBS RESEARCH ASSOCIATE PROGRAM . The Research
Associate Program began on April 21, 1970. Two major areas of interest
were examined in detail. The first phase of the program dealt with
I, 5, and 10 gallon test measures or field standards. The investiga-
tions included design evaluation, calibration method examination,
and review of field test procedures. The results of the studies in
this phase of the program and which are contained in this report
include the following:
1. Development of a Recommended Inspection Procedure for all
field standard sizes,
2. Development of information on Hydrocarbon Liquid Retention for
certain geometric configuration,
3. Preparation of a specification for Improved Design Test
Measure, and
4. Development of a Field Test Procedure for testing petroleum
product retail dispensers with a field standard or test
measure.
The second phase of the program was directed to volumetric field
standards or provers normally used in testing truck-mounted meters
and tank-truck loading terminal meters. A tentative equipment specifi-
cation was written and used in obtaining a trailer-mounted meter
proving system. The meter proving system was subjected to a series
of field tests to evaluate the design configurations and meter-prover
performance. The results of the large volume field standard phase
of the program and contained in this report include:
- 161 -
1. Preparation of an Equipment Specification for 200 to 5600
Cubic Decimeter (53 to 1480 U.S. Gallons) Volumetric Field
Standards,
2. Development of a field test procedure for testing meters in
liquid hydrocarbon service, and
3. Investigation of meter performance and calibration in meter
systems with vapor recovery.
The Research Associate Program was terminated on July 31, 1975
after a duration of 50 months. The results realized from the research
efforts are expected to make a significant contribution to a uniform
measurement process throughout the petroleum industry.
- 162 -
20.0 CONCLUSIONS AND RECOMMENDATIONS . The Research Associate Program
was not defined by any document when started in 1970. The first
assigned responsibility in the program was to develop a scope outline
for the subsequent research activity. From the initial outline,
annual program reviews extended the scope of intended research with
corresponding time extensions. What started as a two-year program
to evaluate I, 5, and 10 gallon measures evolved to over 5 years and
encompassed all sizes of volumetric field standards. The API Re-
search Associate Program has become one of the longer duration projects
since the Research Associate Program was initiated at NBS in 1919.
A wide variety of subjects have been included in the activity of the
Research Associate Program. In many cases the studies on the various
segments associated with the program have resulted in solutions. In
other cases the problems were identified but solutions never reached.
The information developed within the project is expected to be
of considerable value to both weights and measures jurisdictions
and the petroleum industry. Prior to developing specifications for
test measures and provers, no uniform specification existed in the United
States. The same is true for the detailed test procedures that are
presented. They replace nothing equivalent in open literature.
Attempts early in the program to find specifications and/or detailed
procedures that might be in existence yielded very little useful
information. Implementation of the procedures and specifications will
greatly enhance meter calibration uniformity and should subsequently
contribute to advancing the state-of-the art for liquid hydrocarbon
- 163-
metering and meter calibration.
As previously mentioned, several problem areas were identified
but never subjected to research that might yield solutions. These
problems are presented for consideration of research that must be
completed in the future. They include:
1. Truck-mounted Meter Field Test Program . The equipment
,p rovers) to perform these tests was included in the tra i I er-mounted
p rover system designed and fabricated for the program. Extensive
tests will be required to evaluate the performance of the provers,
test procedures, and tolerances for the meter.
2. Tank-Truck Loading Terminal Design Recommendation . This
problem was clearly identified during the Field Test Program. A
number of design features were found to be necessary for a modern
loading terminal. The solution to the problem could be realized by
further evaluation of existing terminal facilities to establish
user requirements for facilitating proper operation and meter
ca I i brat ion
.
3. Vapor Return System Research . The tests conducted on
meters with vapor recovery during the program represented a relatively
small quantity of metering systems but did provide evidence of signi-
ficant problems. Since virtually all loading terminals will be
equired to have vapor recovery or disposal systems within several
years, the meter performance in vapor recovery systems must be
extensively examined. Testing or calibrating of meters in vapor-recovery
- 164 -
systems with open provers cannot be predicted to have either credibi I i ty
or legal base.
4. Meter Tolerance Evaluation . The field tests conducted with
the volumetric provers provided only a very small sample for evaluating
meter performance. The tests were designed to evaluate the provers
rather than the meters. Additional testing would examine meter
accuracy, time and/or volume limits for meter test interval require-
ments, and meter repeatability.
5. Upstream Versus Downstream Throttling to Control Flow Rate .
To conduct s low-flow tests for meters it is necessary to use a valve
to throttle flow to the desired rate. Investigations during the
Field Test Program provided evidence that throttling flow through a
valve upstream of the meter could promote metering of a liquid-
vapor stream for some products. The findings prompted the recommended
throttling valve between the prover and bottom- I oad i ng adapter included
in the equipment specification.
The comparison between upstream and downstream throttling
effects needs additional investigation. The research could be included
with item 4 above.
6. Test Procedure Demonstration/Training Seminars . The single
best and most reliable means to implement a recommended procedure is
considered to be by demonstration to those individuals normally
expected to use the procedure in routine job performance.
It is proposed that a coast-to-coast itinerary be established
to conduct seminars at numerous convenient locations. The seminars
- 165 -
would acquaint weights and measures and petroleum industry personnel
with appropriate meter testing procedures. The conduct of the proposed
training seminars should be a combined effort by NBS Office of Weights
and Measures and API rep resentat i ves and should be planned to include
a maximum attendance at all seminars.
7. Liquid Retention of Volumetric Provers . Liquid retention
is a feature of volumetric provers that requires further investigation.
Due to limited facilities, the tests that were conducted were on
small volume devices and did not provide sufficient information to
allow extrapolation to large volumes.
The completion of the items listed above should bring the
research program to a logical conclusion and provide information
sufficient to evaluate existing or proposed meter installations.
- 166 -
21.0 ACKNOWLEDGEMENT . Appreciation is expressed to the American
Petroleum Institute for my appointment as a Research Associate at
the National Bureau of Standards. The support of API membership
and staff has been extremely gratifying.
I would also I i ke to express my sincere appreciation to the staff
of the Office of Weights and Measures for their enthusiastic support
and assistance in the project. Particular thanks go to Blayne C.
Keysar who, as project supervisor, provided valuable guidance and
assistance throughout the project.
The work at NBS has been greatly enhanced and made more pleasure-
able by the cooperative attitude encountered in contacts with employees
throughout NBS.
A special thanks goes to P. R. deBruyn of the Office of Industrial
Liaison, NBS. He has provided a great deal of moral support and
assistance from the beginning of the API Research Associate Project.
- 167 -
22.0 LIST OF REFERENCES
Cl] Keysar, Blayne C. ,"Specifications and Tolerances for Metal Volu-
metric Field Standards", U.S. National Bureau of Standards Handbook105-3, Superintendent of Documents, U.S. Government Printing Office,Washington, D.C. 20402, 1971.
C2] Houser, John F., "Procedures for the Calibration of VolumetricTest Measures", U.S. National Bureau of Standards NBS I R 73-287(August 1973, Institute for Basic Standards, National Bureau of
Standards, Washington, D.C. 20234
C3] Bowman, Horace A. and Randall M. Schoonover, "Procedure for HighPrecision Density Determination by Hydrostatic Weighing", Journalof Research of the National Bureau of Standards - C. Engineeringand Instrumentation, Vol . 7IC, No. 3, July-August 1967, NationalBureau of Standards, Washington, D.C. 20234.
C4] Aimer, H. E., "Method of Calibrating Weights for Piston Gages",National Bureau of Standards Technical Note 577, Superintendentof Documents, U.S. Government Printing Office, Washington, D.C.
20402, May 1971.
C5] National Bureau of Standards, Technical News Bulletin, Volume 45,No. 4, April 1961, U.S. National Bureau of Standards, Washington,D.C. 20234.
[6] American Society for Testing and Materials, "Tentative RecommendedPractice for Use of the Terms Precision and Accuracy as Applied to
Measurement of a Property of a MaTerial", ASTM Designation E 177—
6IT, American Society for Testing and Materials, Philadelphia, Pa.,
1961 .
C7] Hughes, J. C. and Keysar, B. C., "Testing of Metal Volumetric
Standards", U.S. National Bureau of Standards Monograph 62,
Superintendent of Documents, U.S. Government Printing Office,Washington, D.C. 20402, 1963.
E8] American Institute of Physics Handbook, Third Edition (1972)
McGraw-Hill Book Company, New York, New York.
C9] American Petroleum Institute, "Measurement of Petroleum Liquid
Hydrocarbons by Positive Displacement Meter", API Standard 1101,
American Petroleum Institute, 1801 K Street NW, Washington, D.C.,
20006, I960.
- 168 -
[10] National Bureau of Standards, Handbook 44 - 4th Edition,"Specifications, Tolerances, and Other Technical Require-ments for Commercial Weighing and Measuring Devices",Superintendent of Documents, U.S. Government PrintingOffice, Washington, D.C. 20402, 1971.
[11] Warn I of, Otto K., "Examination Procedure Outlines for
Commercial Weighing and Measuring Devices", U.S. National
Bureau of Standards Handbook 112, Super i ntencent of
Documents, U.S. Government Printing Office, Washington,D.C. 20402, 1973.
- 169 -
23.0 BIBLIOGRAPHY
Allegheny Lud I um Steel Corporation, "Stainless STeel Handbook",Allegheny Ludlum Steel Corporation, Pittsburgh, Pennsylvania, 1959.
American Petroleum Institute, "USA Standard for Mechanical Displace-ment Meter Provers", API Standard 2531, American Petroleum Institute,1801 K Street NW, Washington, D.C. 20006, 1965.
Eisenhart, Churchill, "Expression of the Uncertainties of Final Re-sults", Science, 14 June 1968, Volume 160, pp 1201-1204, AmericanAssociation for the Advancement of Science, c. 1968.
Fung, Y. C. and Sechler, E. E., "Instability of Thin Elastic Shells",Proceedings of First Sympos i urr. on Naval Structural Mechanics, PerqamcnPress, I960.
Kaplan, A. and Fung, Y. C., "A Nonlinear Theory of Bending and Bucklingin Thin Elastic Shallow Spherical Shells", National Advisory Committeefor Aeronautics Technical Note 3212, National Advisory Committee for
Aeronautics, Washington, D.C., 1965.
Roark, Raymond J., "Formulas for Stress and Strain", McGraw-Hill BookCompany, New York, New York, c. 1965.
Smith, Ralph W., "Testing of Measuring Equipment", U.S. National Bureauof Standards Handbook 45, Superintendent of Documents, U.S. GovernmentPrinting Office, Washington, D.C., 1951 (Out of Print).
Timoshenko, S., "Theory of Plates and Shells", First Edition, McGraw-Hill Book Company, New York, New York, 1940.
U.S. National Bureau of Standards, "Report of the Thirty-Eighth National
Conference on Weights and Measures", U.S. National Bureau of StandardsMiscellaneous Publication 209, Superintendent of Documents, U.S.
Government Printing Office, Washington, D.C., 1953
Metals Handbook Committee, "Metals Handbook", Eighth Edition,American Society for Metals, Metals Park, Novelty, Ohio, 1961.
Schoonover, Randall M., "The Equivalence of Gravimetric and VolumetricTest Measure Calibration", U.S. National Bureau of Standards NBS I
R
74-454 (February 1974), Institute of Basic Standards, National Bureau
of Standards, Washington, D.C. 20234.
- 170 -
APPENDIX A
VOLUMETRIC FIELD STANDARDS SPECIFICATIONS

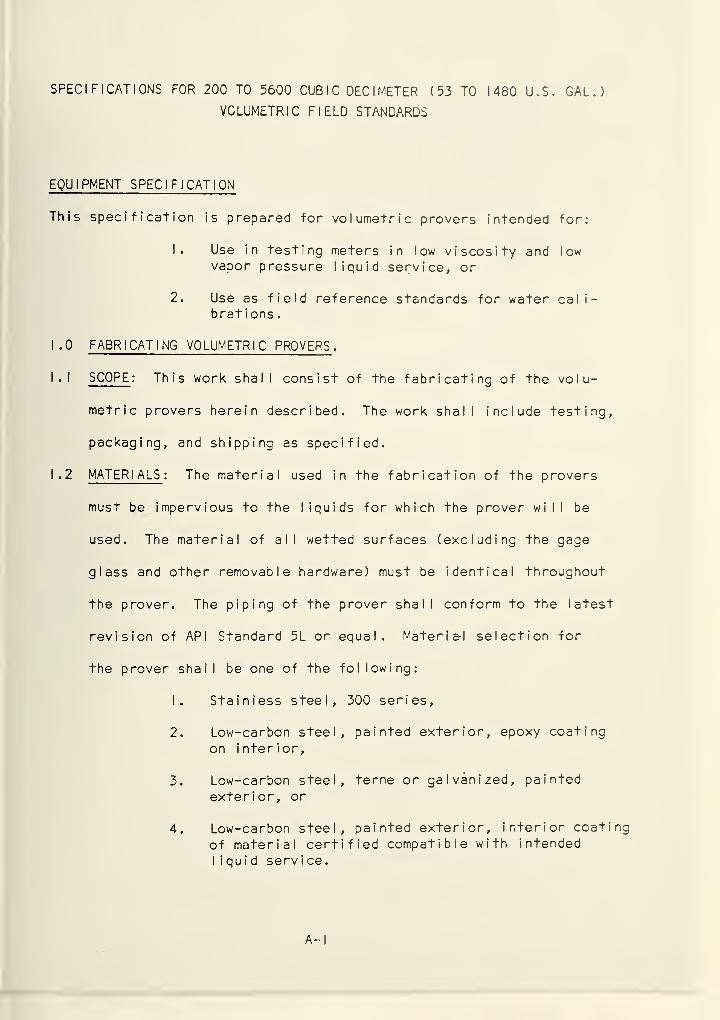
SPECIFICATIONS FOR 200 TO 5600 CUBIC DECIMETER (53 TO 1480 U.S. GAL.)
VOLUMETRIC FIELD STANDARDS
EQUIPMENT SPECIFICATION
This specification is prepared for volumetric provers intended for:
1. Use in testing meters in low viscosity and lowvapor pressure liquid service, or
2. Use as field reference standards for water cali-brations .
1 .0 FABRICATING VOLUMETRIC PROVERS .
1.1 SCOPE : This work shall consist of the fabricating of the volu-
metric provers herein described. The work shall include testing,
packaging, and shipping as specified.
1.2 MATER I ALS : The material used in the fabrication of the provers
must be impervious to the liquids for which the prover will be
used. The material of all wetted surfaces (excluding the gage
glass and other removable hardware) must be identical throughout
the prover. The piping of the prover shall conform to the latest
revision of API Standard 5L or equal. Materia-I selection for
the prover shall be one of the following:
1. Stainless steel, 300 series,
2. Low-carbon steel, painted exterior, epoxy coating
on interior,
3. Low-carbon steel, terne or galvanized, painted
exterior, or
4. Low-carbon steel, painted exterior, interior coati
of material certified compatible with intended
I
iqu i d serv i ce
.
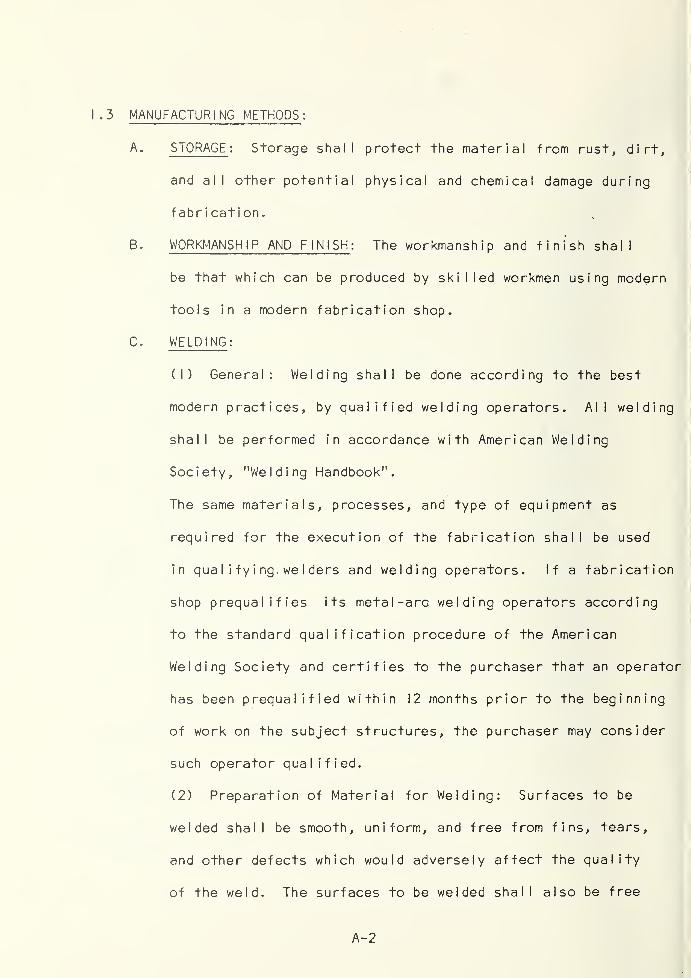
1.3 MANUFACTURING METHODS:
A. STORAGE : Storage shall protect the material from rust, dirt,
and all other potential physical and chemical damage during
fabrication.
B. WORKMANSHIP AND FINISH : The workmanship and finish shall
be that which can be produced by skilled workmen using modern
tools in a modern fabrication shop.
C. WELDING :
(1) General: Welding shall be done according to the best
modern practices, by qualified welding operators. All welding
shall be performed in accordance with American Welding
Society, "Welding Handbook".
The same materials, processes, and type of equipment as
required for the execution of the fabrication shall be used
in qua I i fy i ng, we I ders and welding operators. If a fabrication
shop prequalifies its metal-arG welding operators according
to the standard qualification procedure of the American
Welding Society and certifies to the purchaser that an operator
has been prequalified within 12 months prior to the beginning
of work on the subject structures, the purchaser may consider
such operator qualified.
(2) Preparation of Material for Welding: Surfaces to be
welded shall be smooth, uniform, and free from fins, tears,
and other defects which would adversely affect the quality
of the weld. The surfaces to be welded shall also be free
A-2
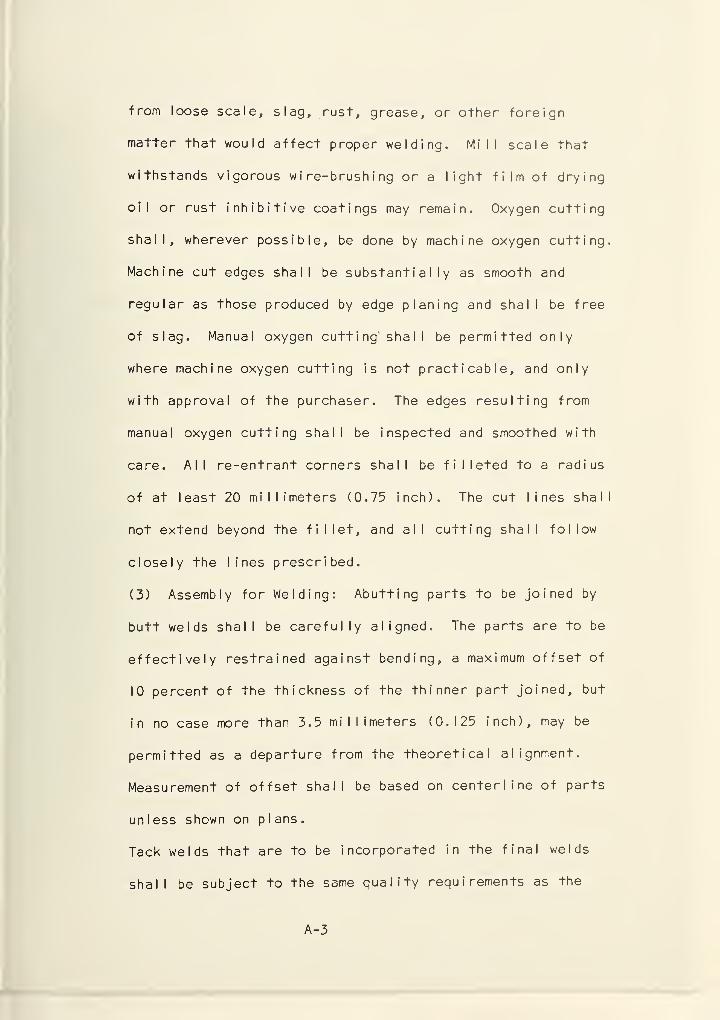
from loose scale, slag, rust, grease, or other foreign
matter that would affect proper welding. Mill scale that
withstands vigorous w i re-brush i ng or a light film of drying
oil or rust i nh i b i t i ve coatings may remain. Oxygen cutting
shall, wherever possible, be done by machine oxygen cutting.
Machine cut edges shall be substantially as smooth and
regular as those produced by edge planing and shal I be free
of slag. Manual oxygen cutting shall be permitted only
where machine oxygen cutting is not practicable, and only
with approval of the purchaser. The edges resulting from
manual oxygen cutting shall be inspected and smoothed with
care. All re-entrant corners shall be filleted to a radius
of at least 20 millimeters (0.75 inch). The cut lines shall
not extend beyond the fillet, and all cutting shall follow
closely the lines prescribed.
(3) Assembly for Welding: Abutting parts to be joined by
butt welds shall be carefully aligned. The parts are to be
effectively restrained against bending, a maximum offset of
10 percent of the thickness of the thinner part joined, but
in no case more than 3.5 millimeters (0.125 inch), may be
permitted as a departure from the theoretical alignment.
Measurement of offset shall be based on centerline of parts
unless shown on plans.
Tack welds that are to be incorporated in the final welds
shall be subject to the same quality requirements as the
A-3
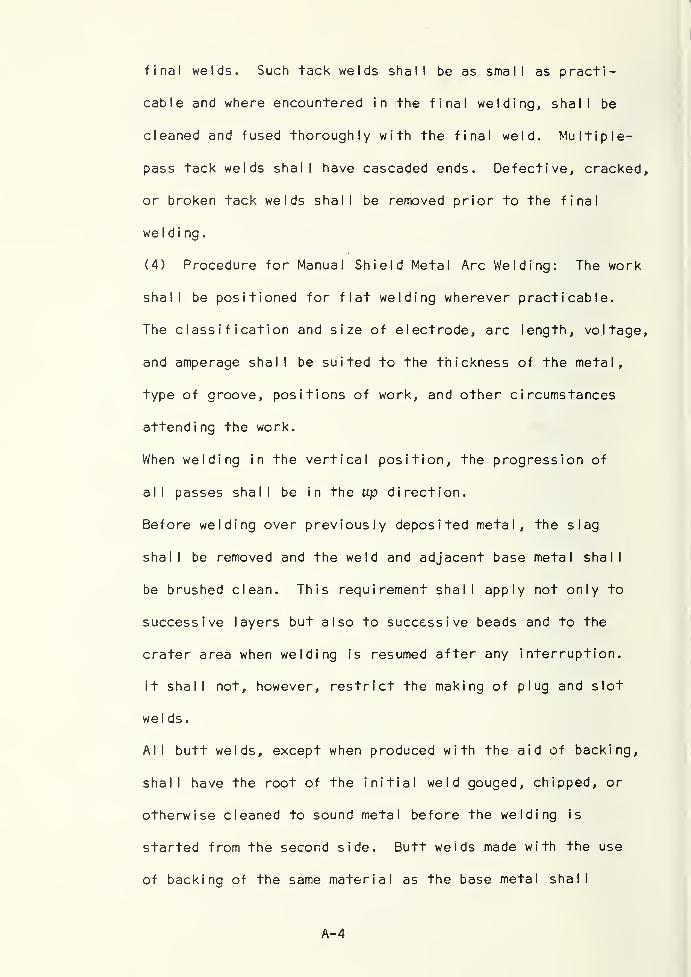
final welds. Such tack welds shall be as small as practi-
cable and where encountered in the final welding, shall be
cleaned and fused thoroughly with the final weld. Multiple-
pass tack welds shall have cascaded ends. Defective, cracked,
or broken tack welds shall be removed prior to the final
welding.
(4) Procedure for Manual Shield Metal Arc Welding: The work
shall be positioned for flat welding wherever practicable.
The classification and size of electrode, arc length, voltage,
and amperage shall be suited to the thickness of the metal,
type of groove, positions of work, and other circumstances
attending the work.
When welding in the vertical position, the progression of
all passes shall be in the up direction.
Before welding over previously deposited metal, the slag
shall be removed and the weld and adjacent base metal shall
be brushed clean. This requirement shall apply not only to
successive layers but also to successive beads and to the
crater area when welding is resumed after any interruption,
it shall not, however, restrict the making of plug and slot
welds.
All butt welds, except when produced with the aid of backing,
shall have the root of the initial weld gouged, chipped, or
otherwise cleaned to sound metal before the welding is
started from the second side. Butt welds made with the use
of backing of the same material as the base metal shall
A-4
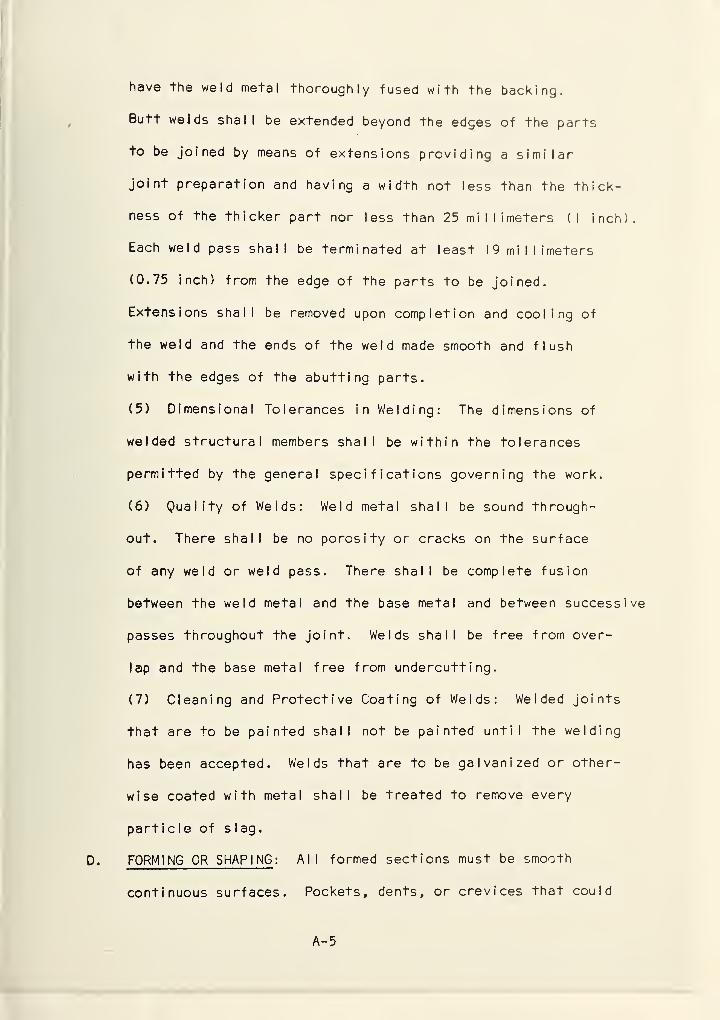
have the weld metal thoroughly fused with the backing.
Butt welds sha I I be extended beyond the edges of the parts
to be joined by means of extensions providing a similar
joint preparation and having a width not less than the thick-
ness of the thicker part nor less than 25 mi I I imeters (I inch).
Each weld pass shall be terminated at least 19 mi II imeters
(0.75 inch) from the edge of the parts to be joined.
Extensions shall be removed upon completion and cooling of
the weld and the ends of the weld made smooth and flush
with the edges of the abutting parts.
(5) Dimensional Tolerances in Welding: The dimensions of
welded structural members shall be within the tolerances
permitted by the general specifications governing the work.
(6) Quality of Welds: Weld metal shall be sound through-
out. There shall be no porosity or cracks on the surface
of any weld or weld pass. There shall be complete fusion
between the weld metal and the base metal and between successive
passes throughout the joint. Welds shall be free from over-
lap and the base metal free from undercutting.
(7) Cleaning and Protective Coating of Welds: Welded joints
that are to be painted shall not be painted until the welding
has been accepted. Welds that are to be galvanized or other-
wise coated with metal shall be treated to remove every
particle of slag.
D. FORMING OR SHAPING : A I I formed sections must be smooth
continuous surfaces. Pockets, dents, or crevices that could
A-5
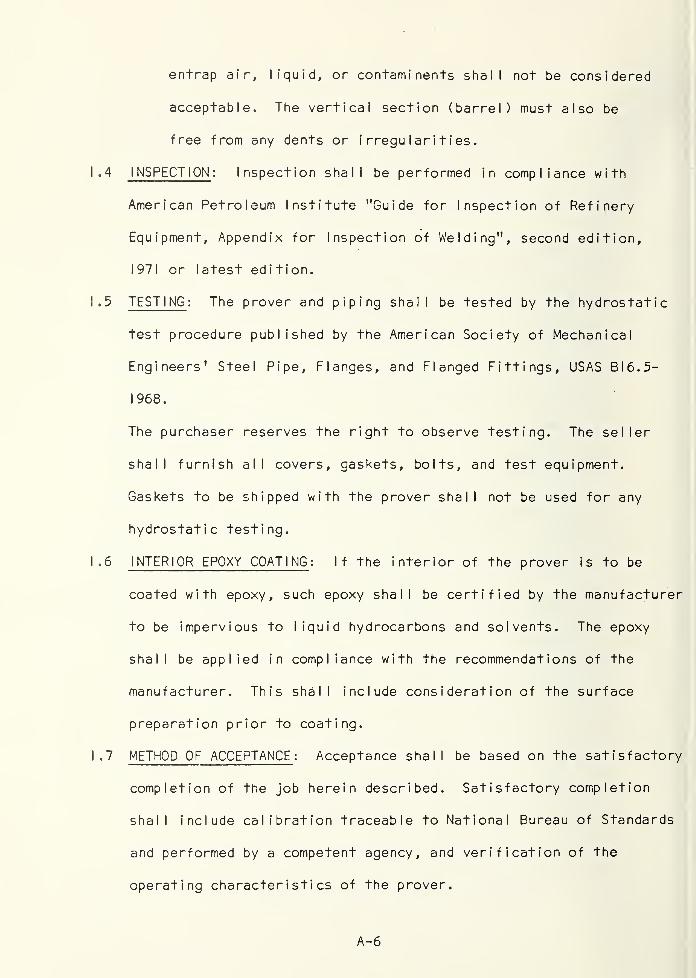
entrap air, liquid, or contaminents shall not be considered
acceptable. The vertical section (barrel) must also be
free from any dents or irregularities.
1.4 I NSPECT I ON : Inspection shall be performed in compliance with
American Petroleum Institute "Guide for Inspection of Refinery
Equipment, Appendix for Inspection of Welding", second edition,
1971 or latest edition.
1.5 TEST I NG : The prover and piping shall be tested by the hydrostatic
test procedure published by the American Society of Mechanical
Engineers' Steel Pipe, Flanges, and Flanged Fittings, USAS BI6.5-
1968.
The purchaser reserves the right to observe testing. The seller
shall furnish all covers, gaskets, bolts, and test equipment.
Gaskets to be shipped with the prover shall not be used for any
hydrostatic testing.
1.6 INTERIOR EPOXY COATING : If the interior of the prover is to be
coated with epoxy, such epoxy shall be certified by the manufacturer
to be impervious to liquid hydrocarbons and solvents. The epoxy
shall be applied in compliance with the recommendations of the
manufacturer. This shall include consideration of the surface
preparation prior to coating.
1.7 METHOD OF ACCEPTANCE : Acceptance shall be based on the satisfactory
completion of the job herein described. Satisfactory completion
shall include calibration traceable to National Bureau of Standards
and performed by a competent agency, and verification of the
operating character i st i cs of the prover.
A-6
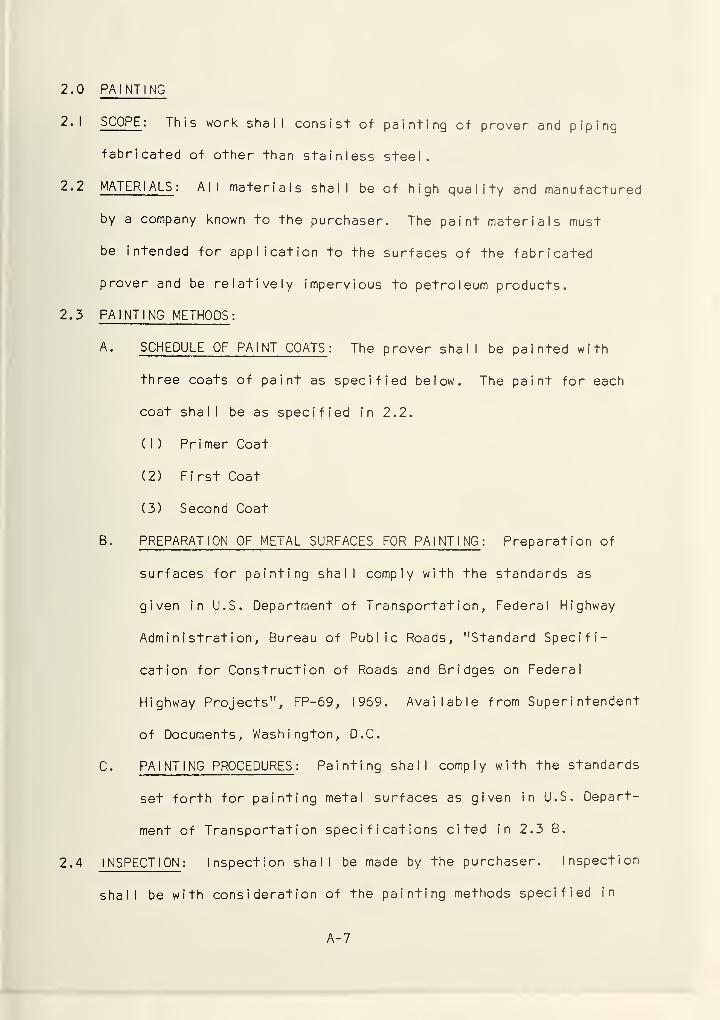
2.0
PAINTING
2.1 SCOPE : This work shall consist of painting of prover and piping
fabricated of other than stainless steel.
2.2 MATER I ALS : All materials shall be of high quality and manufactured
by a company known to the purchaser. The paint materials must
be intended for application to the surfaces of the fabricated
prover and be relatively impervious to petroleum products.
2.3 PAINTING METHODS :
A. SCHEDULE OF PAINT COATS : The prover shall be painted with
three coats of paint as specified below. The paint for each
coat shall be as specified in 2.2.
( 1 ) Primer Coat
(2) Fi rst Coat
(3) Second Coat
B. PREPARATION OF METAL SURFACES FOR PAINTING : Preparation of
surfaces for painting shall comply with the standards as
given in U.S. Department of Transportation, Federal Highway
Administration, Bureau of Public Roads, "Standard Specifi-
cation for Construction of Roads and Bridges on Federal
Highway Projects", FP-69, 1969. Available from Superintendent
of Documents, Washington, D.C.
C. PAINTING PROCEDURES : Painting shall comply with the standards
set forth for painting metal surfaces as given in U.S. Depart-
ment of Transportation specifications cited in 2.3 B.
2.4 INSPECTION: Inspection shall be made by the purchaser. Inspection
shall be with consideration of the painting methods specified in
A-7
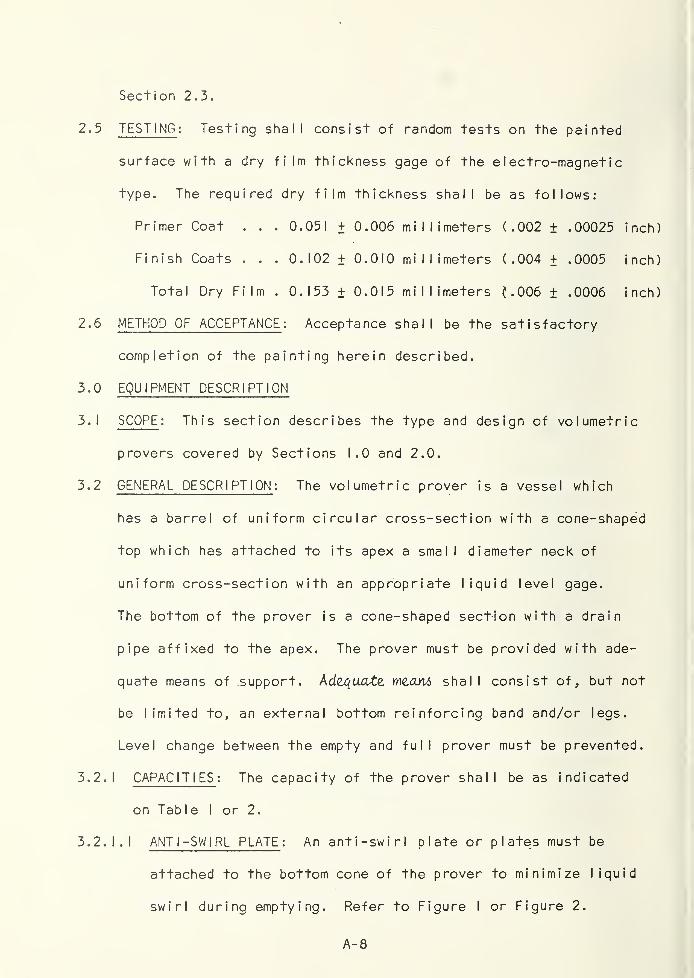
Section 2.3.
2.5 TEST I NG : Testing shall consist of random tests on the painted
surface with a dry film thickness gage of the electro-magnetic
type. The required dry film thickness shall be as follows:
Primer Coat . . . 0.051 + 0.006 millimeters (.002 ± .00025 inch)
Finish Coats . . . 0.102 + 0.010 millimeters (.004 + .0005 inch)
Total Dry Film . 0.153 + 0.015 millimeters (.006 ± .0006 inch)
2.6 METHOD OF ACCEPTANCE : Acceptance shall be the satisfactory
completion of the painting herein described.
3.0 EQUIPMENT DESCRIPTION
3.1 SCOPE : This section describes the type and design of volumetric
provers covered by Sections 1.0 and 2.0.
3.2 GENERAL DESCRIPTION : The volumetric prover is a vessel which
has a barrel of uniform circular cross-section with a cone-shaped
top which has attached to its apex a smal I diameter neck of
uniform cross-section with an appropriate liquid level gage.
The bottom of the prover is a cone-shaped sect-ion with a drain
pipe affixed to the apex. The prover must be provided with ade-
quate means of support. AdzquaXz me.ani shall consist of, but not
be limited to, an external bottom reinforcing band and/or legs.
Level change between the empty and full prover must be prevented.
3.2.1 CAPAC I T I ES : The capacity of the prover shall be as indicated
on Table I or 2.
3.2.1. 1 ANT I -SWIRL PLATE : An anti-swirl plate or plates must be
attached to the bottom cone of the prover to minimize liquid
swirl during emptying. Refer to Figure I or Figure 2.
A-
8
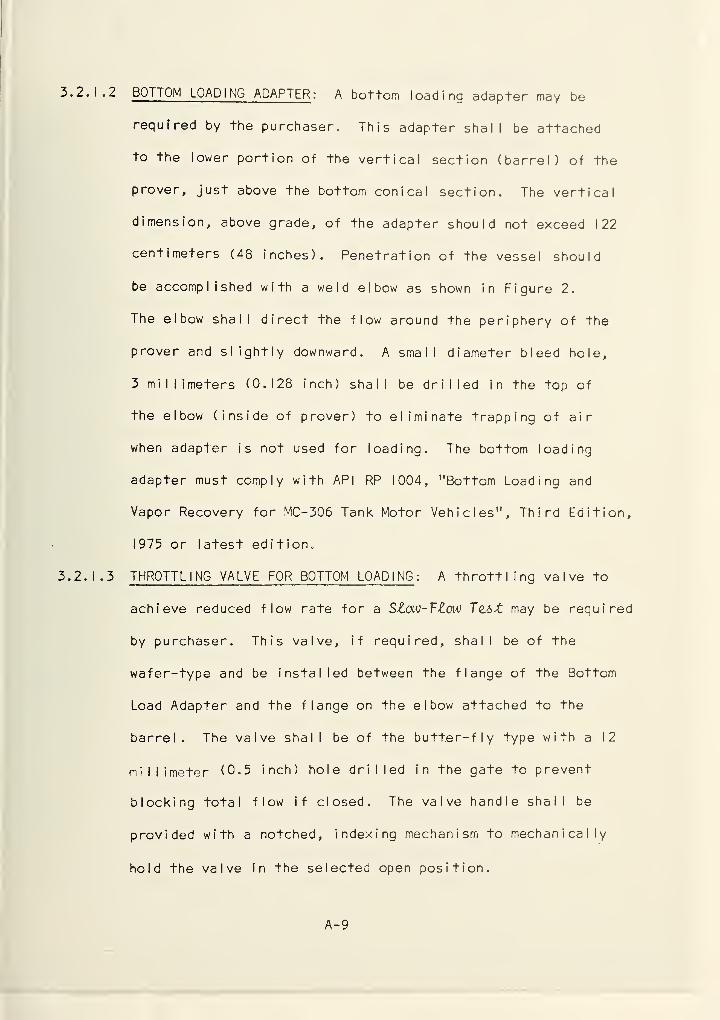
3. 2. 1.2 BOTTOM LOADING ADAFTER : A bottom loading adapter may be
required by the purchaser. This adapter shall be attached
to the lower portion of the vertical section (barrel) of the
prover, just above the bottom conical section. The vertical
dimension, above grade, of the adapter should not exceed 122
centimeters (48 inches). Penetration of the vessel should
be accomplished with a weld elbow as shown in Figure 2.
The elbow shal I direct the flow around the periphery of the
prover and slightly downward. A small diameter bleed hole,
3 millimeters (0.128 inch) shall be drilled in the top of
the elbow (inside of prover) to eliminate trapping of air
when adapter is not used for loading. The bottom loading
adapter must comply with API RP 1004, "Bottom Loading and
Vapor Recovery for MC-306 Tank Motor Vehicles", Third Edition,
1975 or latest edition.
3. 2. 1.3 THROTTLING VALVE FOR BOTTOM LOADING : A th rott I i ng va I ve to
achieve reduced flow rate for a SZaO-FlotV Tz,6t may be required
by p urchaser. This valve, if required, shal I be of the
wafer-type and be installed between the flange of the Bottom
Load Adapter and the flange on the elbow attached to the
barrel. The valve shall be of the butter-fly type with a 12
millimeter (0.5 inch) hole drilled in the gate to prevent
blocking total flow if closed. The valve handle shall be
provided with a notched, indexing mechanism to mechanically
hold the valve In the selected open position.
A-9
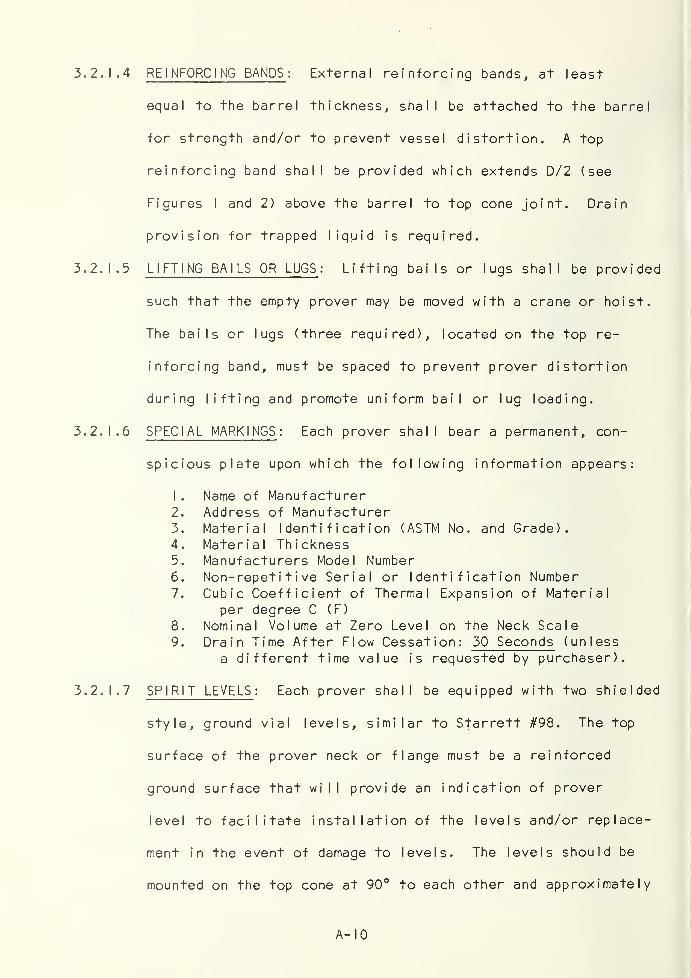
3. 2.
1.4
REINFORCING BANDS : External reinforcing bands, at least
equal to the barrel thickness, shall be attached to the barrel
for strength and/or to prevent vessel distortion. A top
reinforcing band shall be provided which extends D/2 (see
Figures I and 2) above the barrel to top cone joint. Drain
provision for trapped liquid is required.
3.2. 1.5 LIFTING BAILS OR LUGS : Lifting bails or lugs shall be provided
such that the empty prover may be moved with a crane or hoist.
The bails or lugs (three required), located on the top re-
inforcing band, must be spaced to prevent prover distortion
during lifting and promote uniform bail or lug loading.
3.2. 1.6 SPECIAL MARKINGS : Each prover shall bear a permanent, con-
spicious plate upon which the following information appears:
1 . Name of Manufacturer2. Address of Manufacturer3. Material Identification (ASTM No. and Grade).4. Material Thickness5. Manuf acturers Model Number6. Non-repet i t i ve Serial or Identification Number7. Cubic Coefficient of Thermal Expansion of Material
per degree C (F)
8. Nominal Volume at Zero Level on the Neck Scale9. Drain Time After Flow Cessation: 30 Seconds (unless
a different time value is requested by purchaser).
3.2. 1.7 SPIRIT LEVELS : Each prover shall be equipped with two shielded
style, ground vial levels, similar to Starrett #98. The top
surface of the prover neck or flange must be a reinforced
ground surface that will provide an indication of prover
level to facilitate installation of the levels and/or replace-
ment in the event of damage to levels. The levels should be
mounted on the top cone at 90° to each other and approximately
A- 10
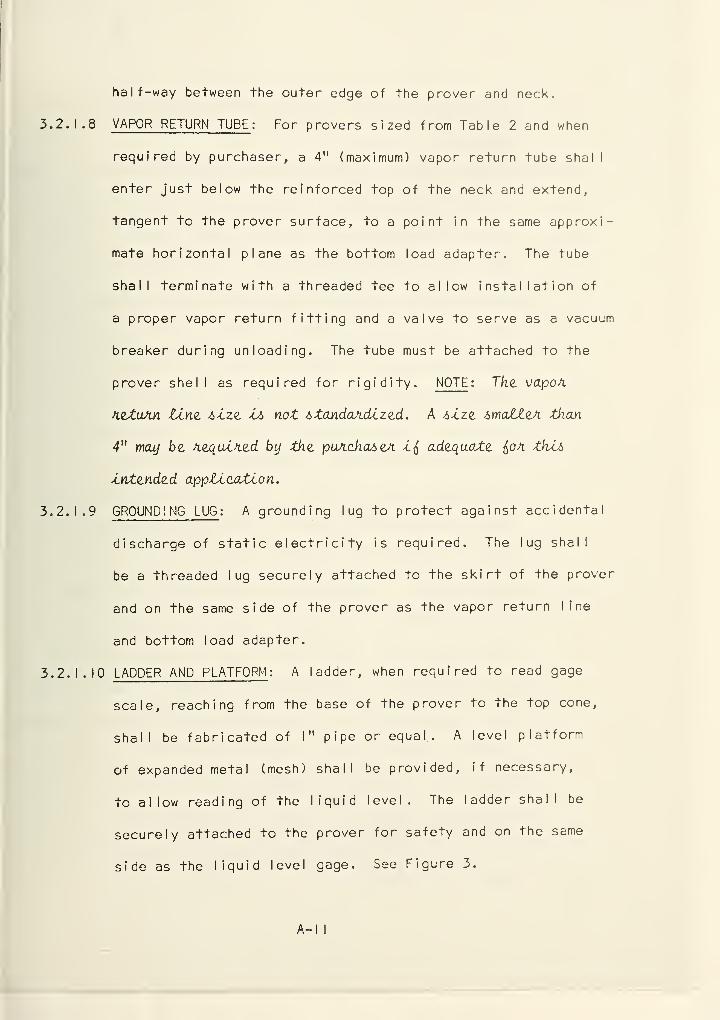
half-way between the outer edge of the prover and neck.
3. 2. 1.8 VAPOR RETURN TUBE : For provers sized from Table 2 and when
required by purchaser, a 4" (maximum) vapor return tube shall
enter just below the reinforced top of the neck and extend,
tangent to the prover surface, to a point in the same approxi-
mate horizontal plane as the bottom load adapter. The tube
shall terminate with a threaded tee to allow installation of
a proper vapor return fitting and a valve to serve as a vacuum
breaker during unloading. The tube must be attached to the
prover shell as required for rigidity. NOTE : The vapoA.
sietuAn tine i>ize tf> not standardized. A size smatieA. than
4" may be fiequified by the purchase*. ifi adequate &o*. this
intended appticatton.
3.2. 1.9 GROUNDING LUG : A grounding lug to protect against accidental
discharge of static electricity is required. The lug shali
be a threaded lug securely attached to the skirt of the prover
and on the same side of the prover as the vapor return line
and bottom load adapter.
3.2.1.10 LADDER AND PLATFORM : A ladder, when required to read gage
scale, reaching from the base of the prover to the top cone,
shall be fabricated of I" pipe or equal,. A level platform
of expanded metal (mesh) shall be provided, if necessary,
to a I I ow reading of the liquid level. The ladder shall be
securely attached to the prover for safety and on the same
side as the liquid level gage. See Figure 3.
A- I I
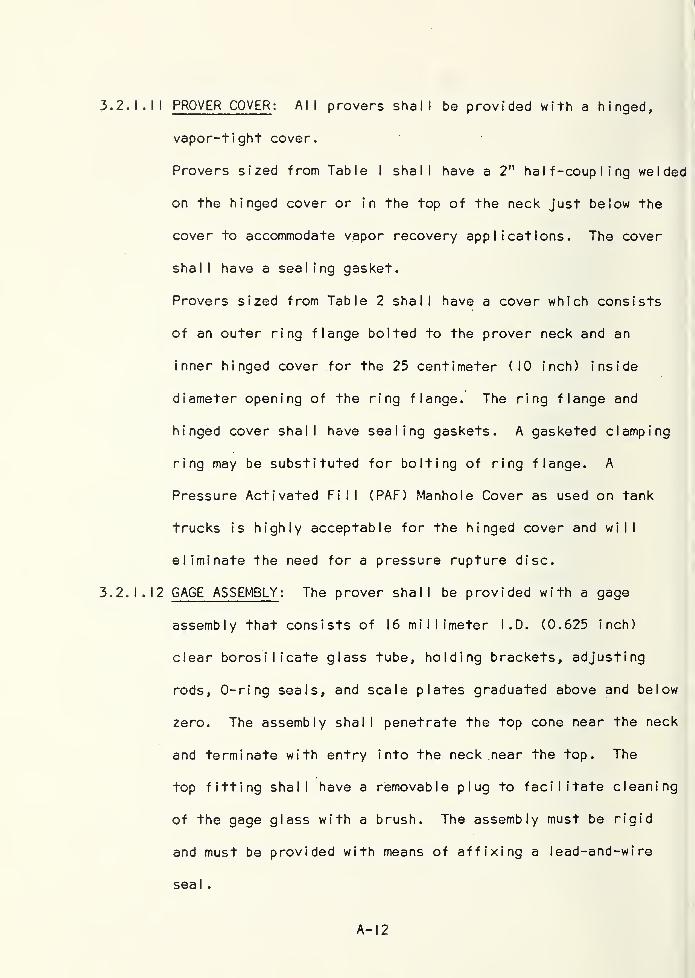
3.2.1. I I PROVER COVER : AM provers shall be provided with a hinged.
vapor-tight cover.
Provers sized from Table I shall have a 2" half-coupling welded
on the hinged cover or in the top of the neck just below the
cover to accommodate vapor recovery applications. The cover
shall have a sealing gasket.
Provers sized from Table 2 shall have a cover which consists
of an outer ring flange bolted to the prover neck and an
inner hinged cover for the 25 centimeter (10 inch) inside
diameter opening of the ring flange. The ring flange and
hinged cover shall have sealing gaskets. A gasketed clamping
ring may be substituted for bolting of ring flange. A
Pressure Activated Fill (PAF) Manhole Cover as used on tank
trucks is highly acceptable for the hinged cover and will
eliminate the need for a pressure rupture disc.
3,2.1.12 GAGE ASSEMBLY : The prover shall be provided with a gage
assembly that consists of 16 millimeter I .D. (0.625 inch)
clear borosilicate glass tube, holding brackets, adjusting
rods, 0-ring seals, and scale plates graduated above and below
zero. The assembly shall penetrate the top cone near the neck
and terminate with entry into the neck near the top. The
top fitting shall have a removable plug to facilitate cleaning
of the gage glass with a brush. The assembly must be rigid
and must be provided with means of affixing a I ead-and-wi re
sea I .
A- 1
2
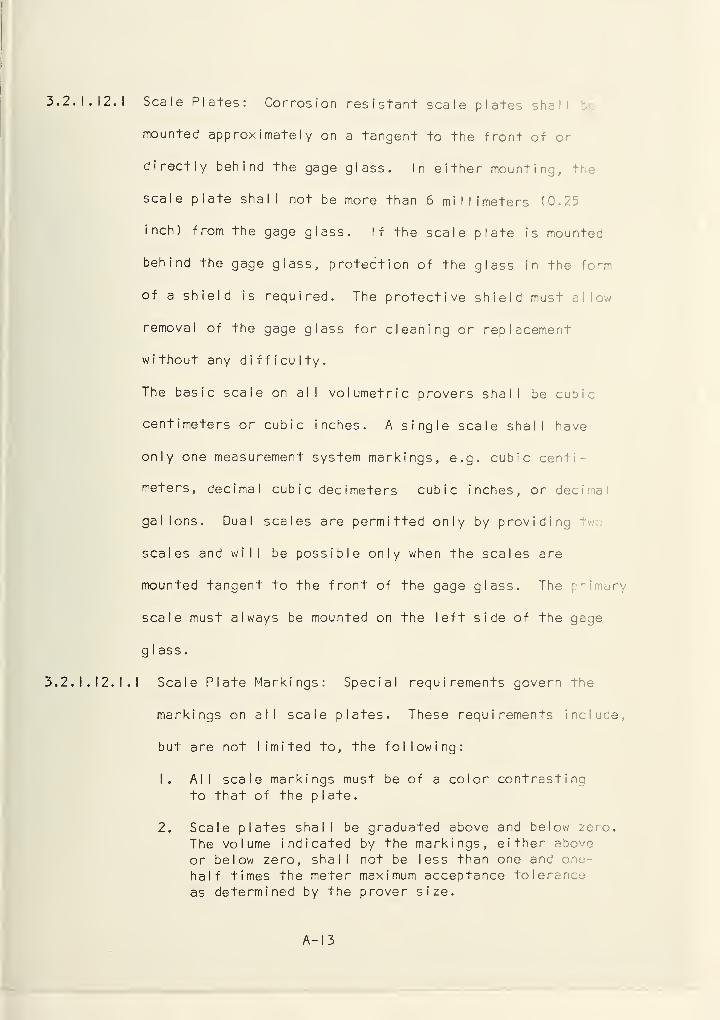
3.2. 1.12. 1 Scale Plates: Corrosion resistant scale plates shall
mounted approximately on a tangent to the front of or
directly behind the gage glass. In either mounting, the
scale plate shall not be more than 6 millimeters (0.25
inch) from the gage glass. If the scale plate is mounted
behind the gage glass, protection of the glass in the form
of a shield is required. The protective shield must allow
removal of the gage glass for cleaning or replacement
without any difficulty.
The basic scale on all volumetric provers shall be cubic
centimeters or cubic inches. A single scale shall have
only one measurement system markings, e.g. cubic centi-
meters, decimal cub i c dec imeters cubic inches, or decimal
gallons. Dual scales are permitted only by providing two
scales and will be possible only when the scales are
mounted tangent to the front of the gage glass. The primary
scale must always be mounted on the left side of the gage
g I ass
.
3.2.1. 12.1. 1 Scale Plate Markings: Special requirements govern the
markings on all scale plates. These requirements include,
but are not limited to, the following:
1. All scale markings must be of a color contrastingto that of the plate.
2. Scale plates shall be graduated above and below zero.
The volume indicated by the markings, either above
or below zero, shall not be less than one and one-
half times the meter maximum acceptance tolerance
as determined by the prover size.
A- 1 3
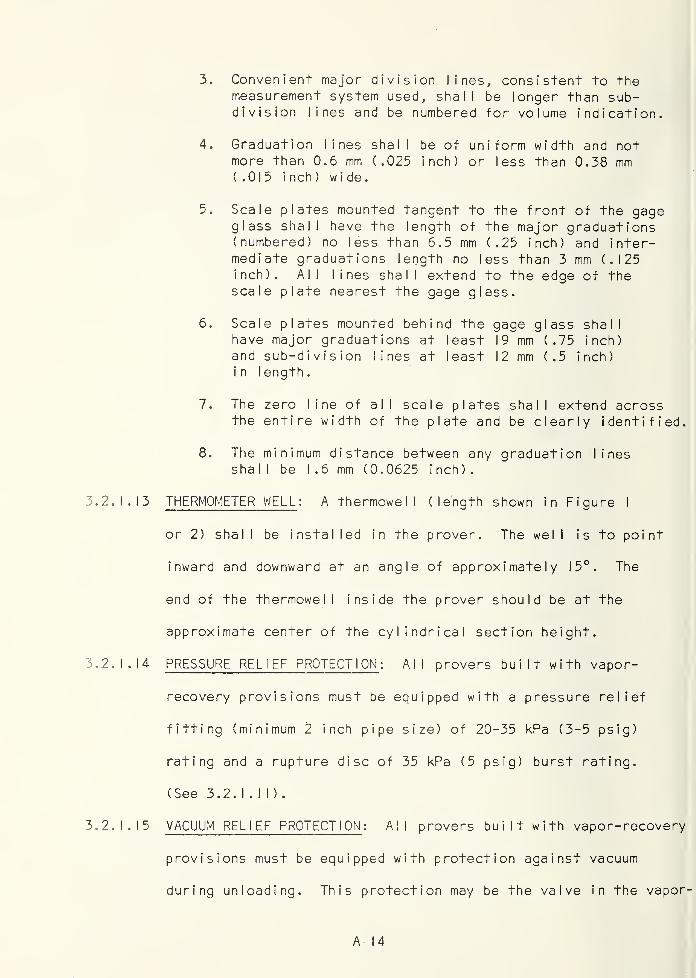
3. Convenient major division lines, consistent to themeasurement system used, shall be longer than sub-division lines and be numbered for volume indication.
4. Graduation lines shall be of uniform width and notmore than 0.6 mm (.025 inch) or less than 0.38 mm(.015 i nch ) wide.
5. Scale plates mounted tangent to the front of the gageglass shall have the length of the major graduations(numbered) no less than 6.5 mm (.25 inch) and inter-mediate graduations length no less than 3 mm (.125inch). All lines shall extend to the edge of thescale plate nearest the gage glass.
6. Scale plates mounted behind the gage glass shallhave major graduations at least 19 mm (.75 inch)and sub-division lines at least 12 mm (.5 inch)in length.
7. The zero line of all scale plates shall extend acrossthe entire width of the plate and be clearly identified.
8. The minimum distance between any graduation linesshall be 1.6 mm (0.0625 inch).
3.2.1.13 THERMOMETER WELL : A thermowell (length shown in Figure I
or 2) shal I be i nsta I led in the prover. The wel I is to point
inward and downward at an angle of approximately 15°. The
end of the thermowell inside the prover should be at the
approximate center of the cylindrical section height.
3.2.1.14 PRESSURE RELIEF PROTECTION : All provers built with vapor-
recovery provisions must be equipped with a pressure relief
fitting (minimum 2 inch pipe size) of 20-35 kPa (3-5 psig)
rating and a rupture disc of 35 kPa (5 psig) burst rating.
(See 3.2. I . II )
.
3.2.1.15 VACUUM RELIEF PROTECTION : All provers built with vapor-recovery
provisions must be equipped with protection against vacuum
during unloading. This protection may be the valve in the vapor-
A- 14
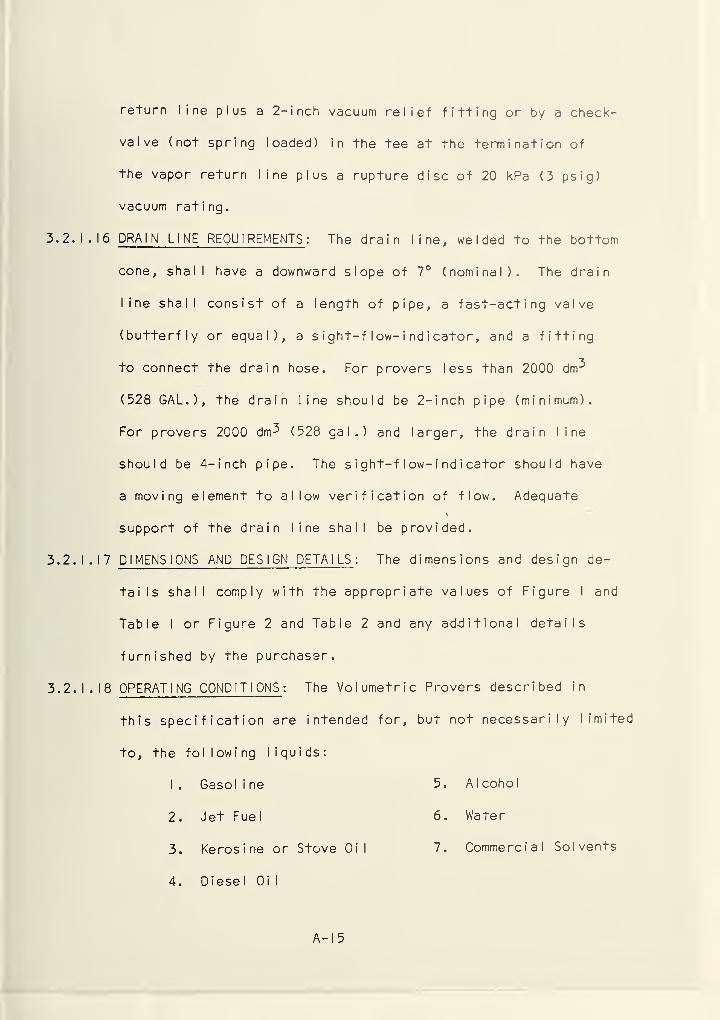
return line plus a 2-inch vacuum relief fitting or by a check-
valve (not spring loaded) in the tee at the termination of
the vapor return line plus a rupture disc of 20 kPa (3 psig)
vacuum rating.
3.2. 1 . 16 DRAIN LINE REQUIREMENTS : The dra i n line, welded to the bottom
cone, shall have a downward slope of 7° (nominal). The drain
line shall consist of a length of pipe, a fast-acting valve
(butterfly or equal), a sight-f I ow- i nd i cator, and a fitting
to connect the drain hose. For provers less than 2000 dm^
(528 GAL.), the drain line should be 2-inch pipe (minimum).
For provers 2000 dm^ (528 gal.) and larger, the drain line
should be 4-inch pipe. The sight-f I ow- i nd i cator should have
a moving element to allow verification of flow. Adequatei
support of the drain line shall be provided.
3.2.1.17 DIMENSIONS AND DESIGN DETAILS : The dimensions and design de-
tails shall comply with the appropriate values of Figure I and
Table I or Figure 2 and Table 2 and any additional details
furnished by the purchaser.
3.2.1.18 OPERATING CONDITIONS: The Volumetric Provers described in
, specification are intended for. but not necessarily limited
the following 1 i qu i ds :
1 . Gasol i ne 5. A 1 coho 1
2. Jet Fuel 6. Water
3. Keros i ne or Stove Oi
1
7. Commercial Solvents
4. Diesel Oi 1
A- 1 5
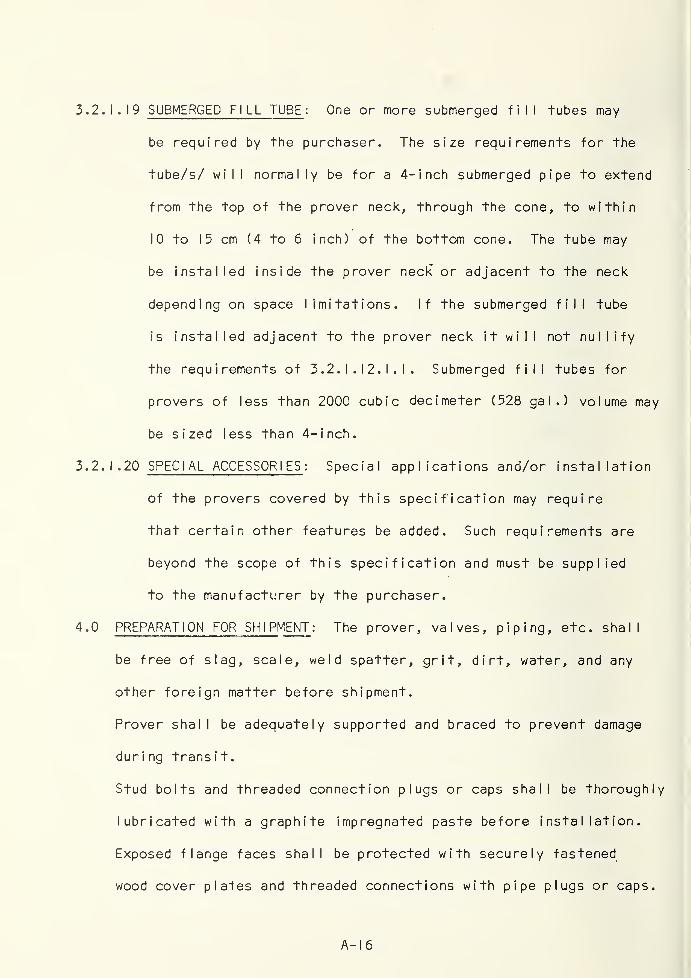
3.2. 1.19 SUBMERGED FILL TUBE : One or more submerged fill tubes may
be required by the purchaser. The size requirements for the
tube/s/ will normally be for a 4-inch submerged pipe to extend
from the top of the prover neck, through the cone, to within
10 to 15 cm (4 to 6 inch) of the bottom cone. The tube may
be installed inside the prover neck or adjacent to the neck
depending on space limitations. If the submerged fill tube
i s i nsta I I ed adj acent to the prover neck it will not nullify
the requirements of 3.2. I . 12. I . I
.
Submerged fill tubes for
provers of less than 2000 cubic decimeter (528 gal.) volume may
be sized less than 4-inch.
3.2.1.20 SPECIAL ACCESSORIES : Special applications and/or installation
of the provers covered by this specification may require
that certain other features be added. Such requirements are
beyond the scope of this specification and must be supplied
to the manufacturer by the purchaser.
4.0 PREPARATION FOR SHIPMENT : The prover, valves, piping, etc. shall
be free of slag, scale, weld spatter, grit, dirt, water, and any
other foreign matter before shipment.
Prover shall be adequately supported and braced to prevent damage
during transit.
Stud bolts and threaded connection plugs or caps shall be thoroughly
lubricated with a graphite impregnated paste before installation.
Exposed flange faces shall be protected with securely fastened
wood cover plales and threaded connections with pipe plugs or caps.
A- 1
6
All hinged covers, gage assembly, valves, etc. shall be properly
installed and provided with adequate protection for shipment.
D. J. Hine, API Research Associate
USCOMM-NBS-DC
A- 1 7
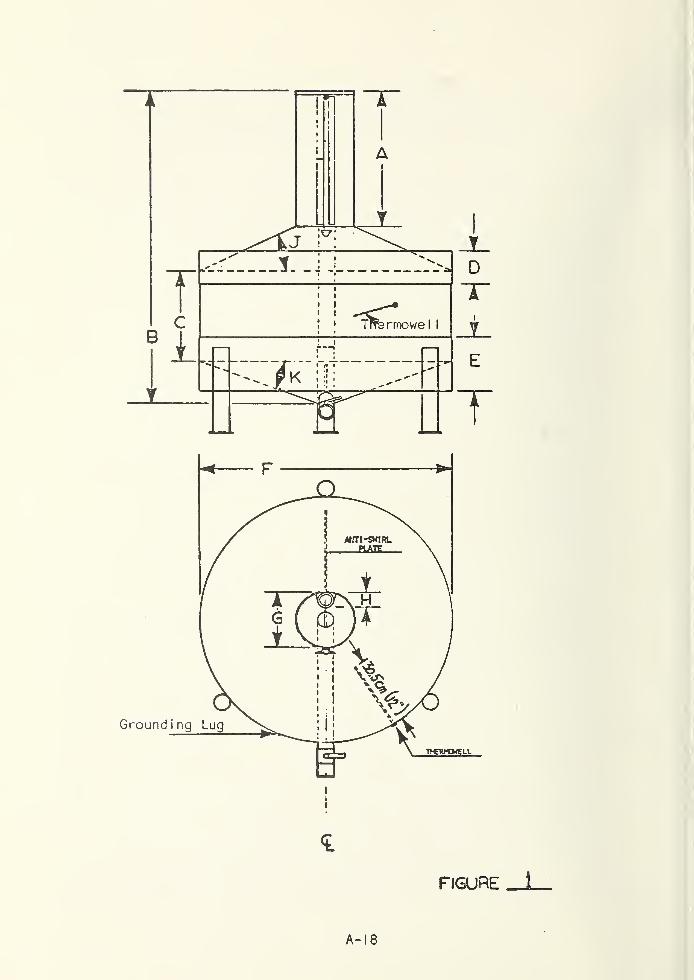
<L
FIGURE
A- 1 8
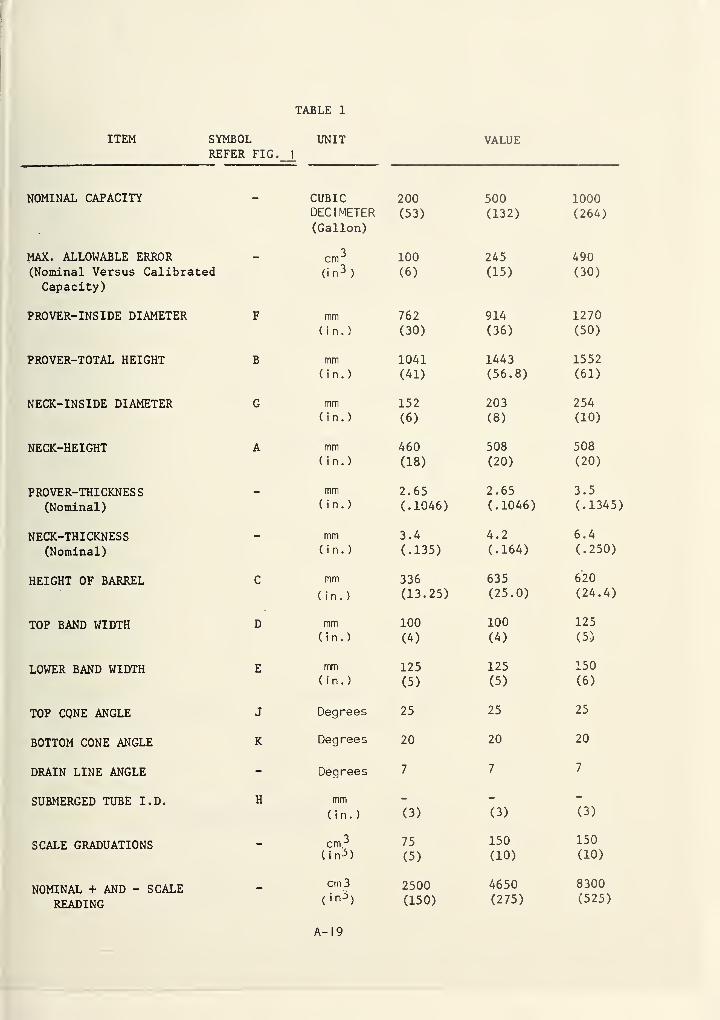
TABLE 1
ITEM SYMBOLREFER FIG. 1
UNIT VALUE
NOMINAL CAPACITY CUBIC 200 500 1000DECIMETER (53) (132) (264)(Gallon)
MAX. ALLOWABLE ERROR — cm^ 100 245 490(Nominal Versus Calibrated (i n 3
) (6) (15) (30)
Capacity)
PROVER-INSIDE DIAMETER F mm 762 914 1270
(in.) (30) (36) (50)
PROVER-TOTAL HEIGHT B mm 1041 1443 1552
(in.) (41) (56.8) (61)
NECK-INSIDE DIAMETER G mm 152 203 254(in.) (6) (8) (10)
NECK-HEIGHT A mm 460 508 508(in.) (18) (20) (20)
PROVER-THICKNESS — mm 2.65 2.65 3.5
(Nominal) (in.) (.1046) (.1046) (.1345)
NECK-THICKNESS — mm 3.4 4.2 6.4
(Nominal) (in.) (.135) (.164) (.250)
HEIGHT OF BARREL C mm 336 635 620
(in.) (13.25) (25.0) (24.4)
TOP BAND WIDTH D mm 100 100 125
(in.) (4) (4) (5)
LOWER BAND WIDTH E mm 125 125 150( in.
)
(5) (5) (6)
TOP CQNE ANGLE J Degrees 25 25 25
BOTTOM CONE ANGLE K Degrees 20 20 20
DRAIN LINE ANGLE - Degrees 7 7 7
SUBMERGED TUBE I.D. H mm - - -
(in.) (3) (3) (3)
SCALE GRADUATIONS _ cm 3 75 150 150
( i n^) (5) (10) (10)
NOMINAL + AND - SCALE cm 3 2500 4650 8300
READING (i n^>) (150) (275) (525)
A- I 9
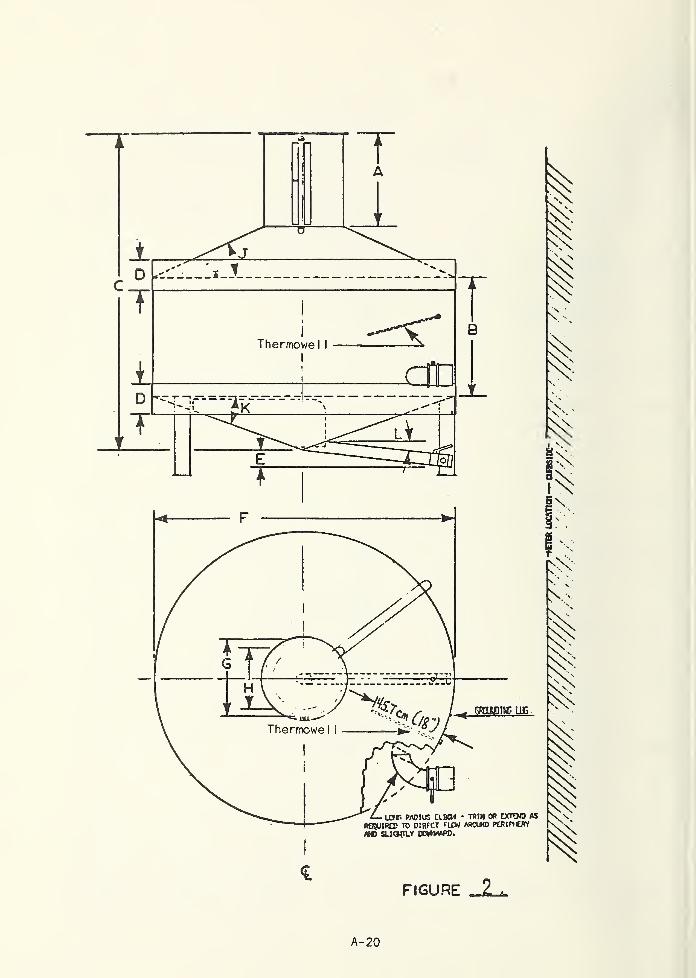
FIGURE 2 .
A-20
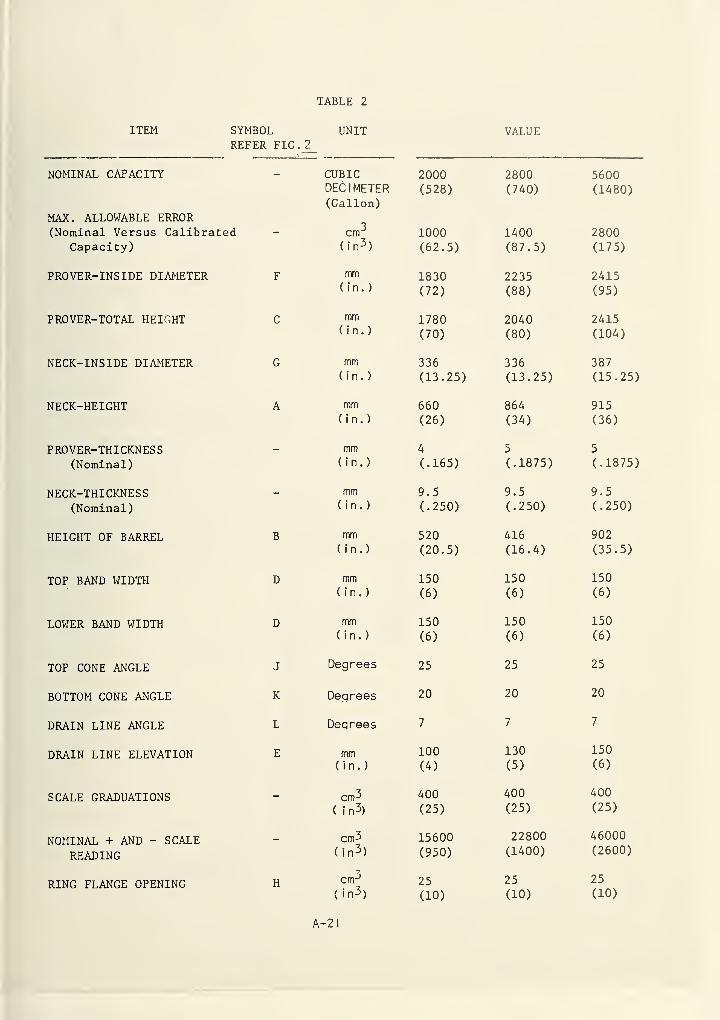
TABLE 2
ITEM SYMBOLREFER FIG.
UNIT94.
VALUE
NOMINAL CAPACITY — CUBIC 2000 2800 5600DECIMETER (528) (740) (1480)(Gallon)
MAX. ALLOWABLE ERROR(Nominal Versus Calibrated cm^ 1000 1400 2800
Capacity) (in 3 ) (62.5) (87.5) (175)
PROVER- INS IDE DIAMETER F mm 1830 2235 2415(in.) (72) (88) (95)
PROVER-TOTAL HEIGHT C mm 1780 2040 2415(in.) (70) (80) (104)
NECK-INSIDE DIAMETER G mm 336 336 387(in.) (13.25) (13.25) (15.25)
NECK-HEIGHT A mm 660 864 915(in.) (26) (34) (36)
PROVER-THICKNESS - mm 4 5 5
(Nominal) ( in.
)
(.165) (.1875) (.1875)
NECK-THICKNESS - mm 9.5 9.5 9.5
(Nominal) ( in.
)
(.250) (.250) (.250)
HEIGHT OF BARREL B mm 520 416 902(in.) (20.5) (16.4) (35.5)
TOP BAND WIDTH D mm 150 150 150( in.
)
(6) (6) (6)
LOWER BAND WIDTH D mm 150 150 150(in.) (6) (6) (6)
TOP CONE ANGLE J Degrees 25 25 25
BOTTOM CONE ANGLE K Degrees 20 20 20
DRAIN LINE ANGLE L Deqrees 7 7 7
DRAIN LINE ELEVATION E mm 100 130 150
(in.) (4) (5) (6)
SCALE GRADUATIONS _ cm3 400 400 400
( i n 3) (25) (25) (25)
NOMINAL + AND - SCALE _ cm^ 15600 22800 46000
READING (in 3 ) (950) (1400) (2600)
RING FLANGE OPENING H cm-5
25 25 25
( in 3) (10) (10) (10)
A-2 I
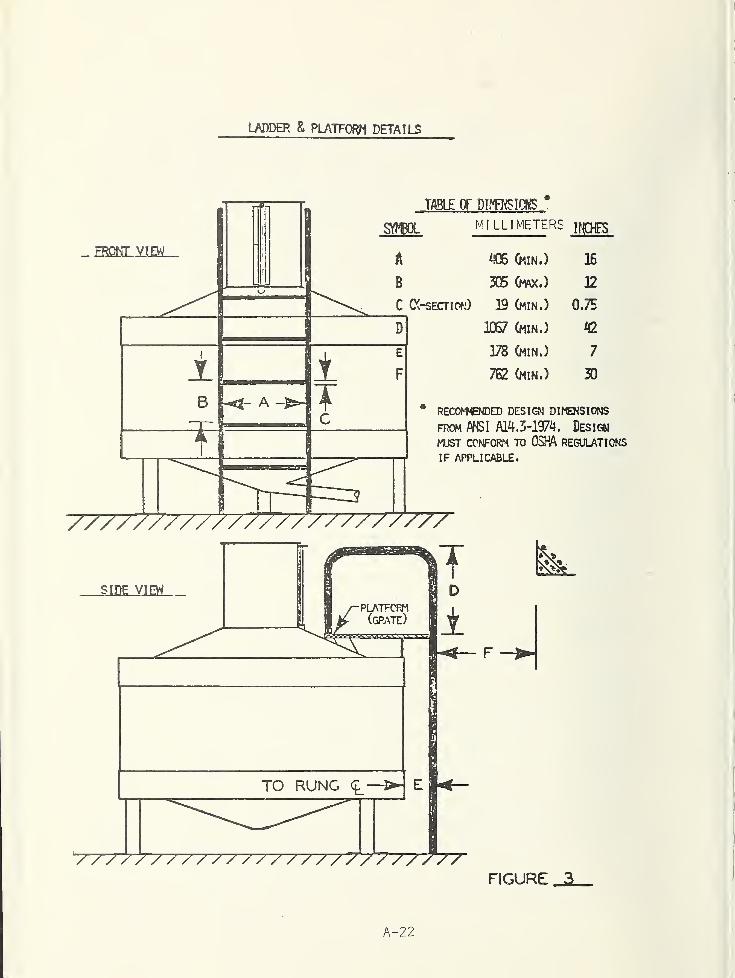
LADDER & PLATFORM DETAILS
A-22
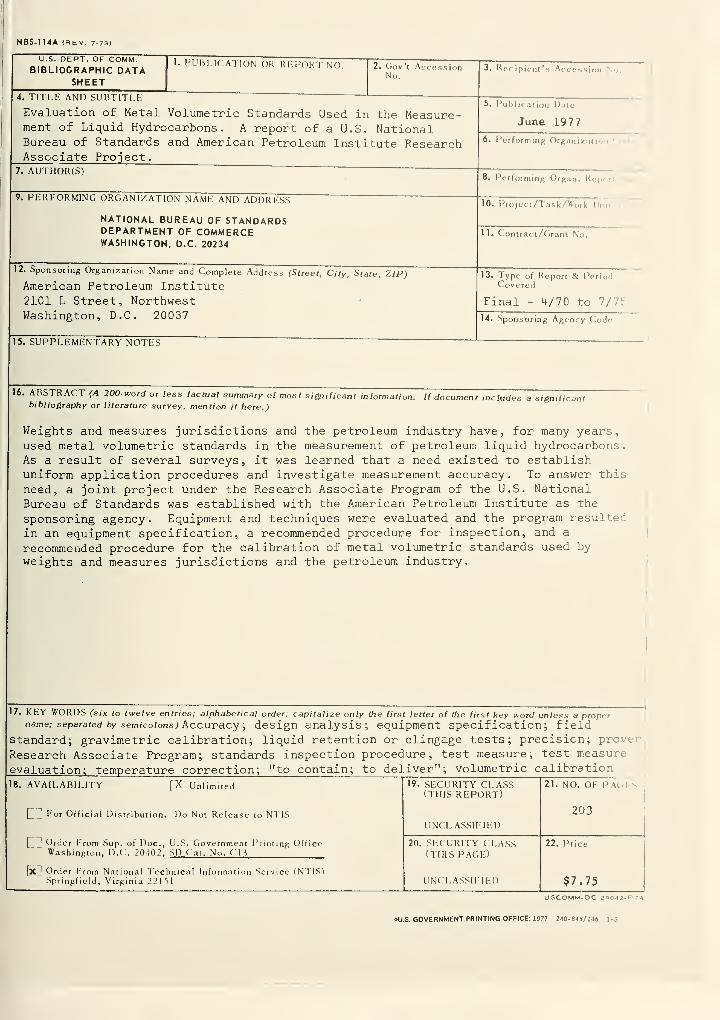
NBS-1 14A (REV. 7-73)
I
U.S. DEPT. OF COMM.BIBLIOGRAPHIC DATA
SHEET
1. PUBLIC ATTON OR REPORT NO. 2. Gov’t AccessionNo.
3. Recipient*
4. 1 1 1 LL-. AND SUBTITLE —Evaluation of Metal Volumetric Standards Used in the Measure-ment of Liquid Hydrocarbons. A report of a U.S. NationalBureau of Standards and American Petroleum Institute ResearchAssociate Project.
5. Publication Date
June 1977
6. Performing Organizing
7. AUTHOR(S)8. Performing Organ. Re|
V. PERFORMING ORGANIZATION NAME AND ADDRESS
NATIONAL BUREAU OF STANDARDSDEPARTMENT OF COMMERCEWASHINGTON, D.C. 20234
10. Project/Task/Work Unr
11. Contract/Grant No.
12. Sponsoring Organization Name and Complete Address (Street, City, State, ZIP)
American Petroleum Institute21C1 L Street, NorthwestWashington, D.C. 20037
13. Type of Report & PeriodCovered
Final - 4/70 to 7/75
14. Sponsoring Agency Code*
15. SUPPLEMENTARY NOTES
16. ABSTRACT (A 200-word or less factual summary of most significant information. If document includes a significantbibliography or literature survey, mention it here.)
Weights and measures jurisdictions and the petroleum industry have, for many years,used metal volumetric standards in the measurement of petroleum liquid hydrocarbons.As a result of several surveys, it was learned that a need existed to establishuniform application procedures and investigate measurement accuracy. To answer this
need, a joint project under the Research Associate Program of the U.S. NationalBureau of Standards was established with the American Petroleum Institute as the
sponsoring agency. Equipment and techniques were evaluated and the program resultec
in an equipment specification, a recommended procedure for inspection, and a
recommended procedure for the calibration of metal volumetric standards used by
weights and measures jurisdictions and the petroleum industry.
17. KEY WORDS (six to twelve entries; alphabetical order; capitalize only the first letter of the first key word unless a propername; separated by semicolons) Accuracy , design analysis; equipment specification; field
standard; gravimetric calibration; liquid retention or clingage tests; precision; prove
r
Research Associate Program; standards inspection procedure; test measure; test measure
evaluation; temperature correction; "to contain; to deliver"; volumetric calibration
18. AVAILABILITY [X Unlimited 19. SECURITY CLASS 21. NO. OF PAGE'-(THIS REPORT)
[j For Official Distribution. Do Not Release to NTIS 203UNCLASSIFIED
1
1 Order From Sup. of Doc., U.S. Government Printing Office 20. SECURITY CLASS 22. PriceWashington, D.C!. 20402. SD Cat. No. C M (THIS PAGE)
[x Order From National Technical Information Service (NTIS)Springfield, Virginia 22151 UNCLASSIFIED $7.75
USCOMM-DC 29042-P74
*U.S. GOVERNMENT PRINTING OFFICE: 1977 240-S43/246 1-3


WERTBOOKBINDINGMIODLETOWN PA
JUNE 80f QudK'v Bound