Embed Size (px)
Citation preview
A Teradici white paper
Quantifying Teradici APEX ™ 2800 with Login VSI
Evaluation Guide
Quantifying teradici aPeX™ 2800 with Login VSi page_2
Contents
1. Introduction ...................................................................................3
1.1 the APeX 2800 server offload card overview ...............................3
1.2 Login VsI overview.........................................................................3
1.2.1 Dynamic usability threshold .........................................................4
1.2.2 Login storms and/or boot storms ................................................5
1.2.3 steady-state performance ............................................................6
1.2.4 Limitations of Login VsI workloads for evaluating APeX 2800 ...6
1.2.5 Login VsI sensitivities ...................................................................7
2. suggested procedures for testing APeX 2800 with Login VsI .....8
2.1 Finding VsImax ..............................................................................8
2.1.1 Recommended parameters .........................................................8
2.1.2 sizing the VMs pool .......................................................................9
2.1.3 other considerations...................................................................10
2.1.4 Running the actual tests. ............................................................10
2.2 Login VsI steady-state ................................................................10
2.2.1 Analyzing steady-state data ........................................................11
2.3 Custom workloads ......................................................................12
2.3.2 Creating a video-only workload. .................................................12
2.3.3 Login VsI issue with custom workloads .....................................13
3. Results .........................................................................................13
3.1 Multimedia workload ..................................................................13
3.1.1 Multimedia VsImax .....................................................................14
3.1.2 Multimedia steady-state .............................................................14
3.2 Custom video-only workload. .....................................................15
3.2.1 Video-only VsImax.......................................................................15
3.2.2 Video-only steady-state ..............................................................15
4. Appendix ......................................................................................17

Quantifying teradici aPeX™ 2800 with Login VSi page_3
1. Introductionthe teradici APeX™ 2800 server offload card is a performance enhancement to VMware View™ deployments. the APeX 2800 offloads the PCoIP® image encoding tasks, previously performed in software, thus reducing the server’s CPU usage. this results in several benefits, including a better and more consistent user experience as well as a higher VDI consolidation ratio.
Login Virtual session Indexer (Login VsI) from Login Consultants is a VDI benchmarking tool commonly used in the industry to measure the performance and scalability of centralized desktop environments such as server Based Computing (sBC) and Virtual Desktop Infrastructure (VDI). therefore, it is reasonable to use Login VsI to quantify the benefits offered by the APeX 2800. the APeX 2800 is a unique and novel device previously unseen in the VDI space, while Login VsI is a complex tool with many possible configuration and customization options. the purpose of this paper is to explain both the APeX 2800 as well as Login VsI and how Login VsI can best be used to measure what the APeX 2800 was designed to do. We also share some of our own experiences and results using Login VsI to quantify the performance benefits of the APeX 2800.
the rest of this section provides a basic overview of the APeX 2800 as well as the Login VsI benchmarking tool. We discuss high-level issues to consider when testing with the Login VsI tool, such as the dynamic nature of the usability threshold used to calculate VsImax and the fact that VsImax is determined under login and/or boot-storm conditions. We describe how Login VsI can be used to determine another very important aspect of server performance: the steady-state performance. Finally, we briefly touch on some low-level issues which require attention when testing with Login VsI.
1.1 Teradici APEX 2800 server offload card overview
the teradici APeX 2800 server offload card is a PCIe card that is put inside an esXi server that hosts virtual machines (VMs) for a View deployment. When a View connection is established to a host VM (from a zero client or a soft client) the imaging data produced in the host VM will be encoded using the PCoIP protocol and sent to the client. the PCoIP image encoder is an application that runs inside each VM. the encoding task shares the server’s CPU along with all other applications that the VMs are running. the APeX 2800 server offload card dynamically selects up to 64 of the busiest displays (in terms of pixels changing) running on the server and offloads their PCoIP encoding tasks onto the APeX 2800 hardware. this frees server CPU cycles which would have otherwise been used to perform PCoIP encoding in software. If the server’s CPU is a limited resource then these freed cycles are available to the VMs’ applications and improve their performance. otherwise, the additional available CPU cycles can be used to add more VMs to the system without hindering performance for current users. the ability of the APeX 2800 to offload the CPU load of the peak display users protects the responsiveness and performance of the other users on the same server, guaranteeing a more consistent user experience for everyone.
1.2 Login VSI overview
Login VsI is a benchmarking tool commonly used to measure server performance in VDI deployments, like VMware View. the tool includes an infrastructure for setting up View connections, predefined automated workloads that mimic users and run on the host VMs, as well as scripts to measure application latencies on the VMs. All the latency measurements from the host VMs are then post-processed by the Login VsI Analyzer to produce VSImax, Login Consultants’ well-known metric. VsImax is the number of View sessions
Quantifying teradici aPeX™ 2800 with Login VSi page_4
that a particular system can support before the user experience, measured as the aggregate of application operation latencies, degrades beyond the usability threshold.
While comparing the improvement of VsImax between test runs with and without the APeX 2800 would seem to be the obvious way to quantify the benefit of an APeX 2800 server offload card, this is not the best or only approach to use. the VsImax experiment is conducted as VMs are constantly booting-up and or logging-in. Although this is an interesting use case, evaluating the steady-state performance of the server when the number of VMs is not changing is even more important since VDI servers spend the bulk of their time in this state. the APeX 2800 was designed specifically for the steady-state case. Furthermore, because of the way VsImax is calculated, direct comparisons between test runs with and without the APeX 2800 can be misleading. Finally, the standard workloads provided with Login VsI do not account for the peak demands that often occur during the day for a VDI deployment to office workers (versus task workers in particular) that the APeX 2800 is designed to protect against.
1.2.1 Dynamic usability threshold
Login VsI uses a concept which Login Consultants call dynamic VsImax, where the usability threshold is not a fixed number but is calculated based on the latency of the first 15 sessions to be logged in (called the baseline). the usability threshold latency is calculated as: (1.25 x baseline latency) + 3,000 ms. As such, if the first 15 VMs are slow (have high latency), the threshold for acceptable latencies is increased. Conversely if the first 15 VMs are fast (have low latency) then the usability threshold is lowered.
Because the APeX 2800 begins offloading a VM’s displays as soon as that VM logs in, and the baseline latency is calculated on the first 15 VMs (which are all being offloaded by the APeX 2800) any benefit that the APeX 2800 provides over a non-APeX 2800 test run for the first 15 VMs will penalize the APeX 2800 test run by lowering its usability threshold relative to the non-APeX 2800 test run. this creates an immediate problem for comparing APeX 2800 versus non-APeX 2800 VsImax values since the thresholds used for comparison are different between the APeX 2800 and non-APeX 2800 test runs.
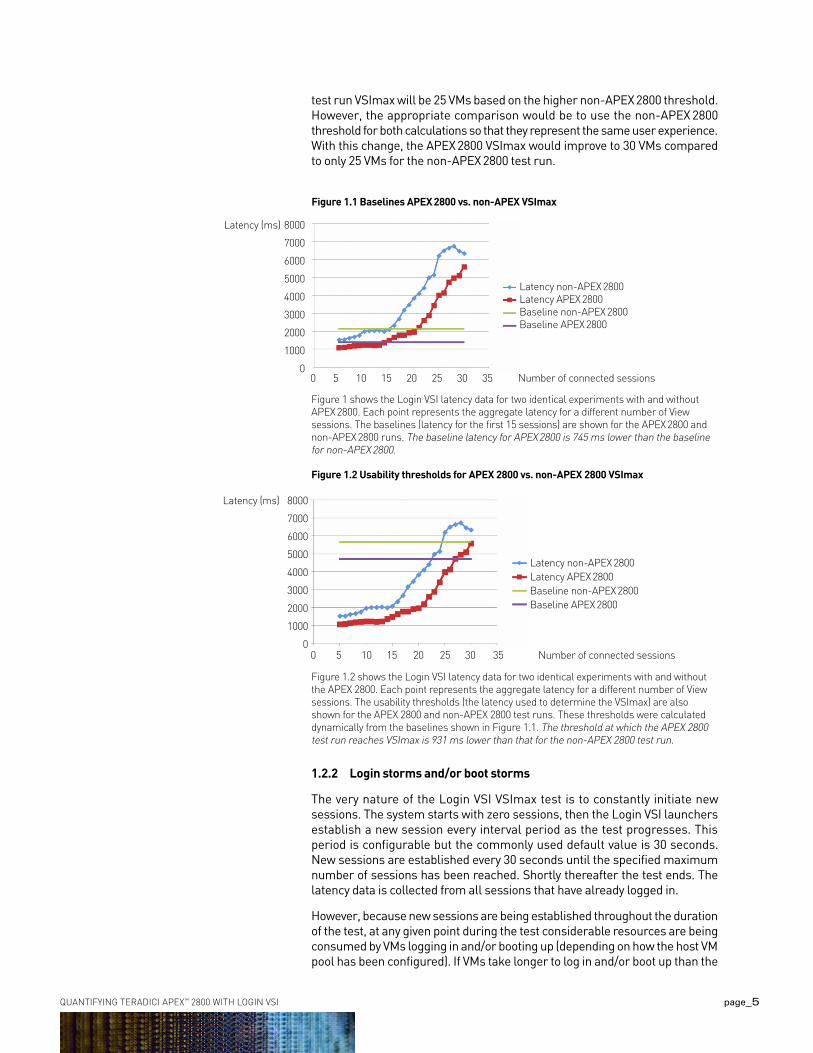
For certain workloads and systems, CPU usage with 15 VMs is low enough that the difference between the two thresholds is small and has limited impact on the test results. However, for other workloads like a custom 720p video-only workload (shown in Figures 1.1 and 1.2) the differences are dramatic.
Figures 1.1 and 1.2 show the Login VsI latency measurements for two identical experiments (differing only in whether the APeX 2800 was turned on or off). Login VsI calculates the aggregate latency for each number of sessions connected. the baseline latency is calculated based on the latencies of the first 15 sessions. the baselines latencies for the APeX 2800 and non-APeX 2800 test runs are shown in Figure 1.1.
Due to the performance improvements provided by the APeX 2800 the baseline latency for the APeX 2800 test run is 745 ms lower than without the APeX 2800. this dramatic improvement in latency penalizes the APeX 2800 test run by assigning a usability threshold which is 931 ms lower than for the non-APeX 2800 test run! (shown in Figure 1.2). the VsImax value for an experiment is calculated as the lowest number of sessions whose aggregate latency exceeds the usability threshold. Accordingly, the VsImax for the APeX 2800 test run will be 27 VMs based on the APeX 2800 threshold, and for the non-APeX 2800
Quantifying teradici aPeX™ 2800 with Login VSi page_5
test run VsImax will be 25 VMs based on the higher non-APeX 2800 threshold. However, the appropriate comparison would be to use the non-APeX 2800 threshold for both calculations so that they represent the same user experience. With this change, the APeX 2800 VsImax would improve to 30 VMs compared to only 25 VMs for the non-APeX 2800 test run.
1.2.2 Login storms and/or boot storms
the very nature of the Login VsI VsImax test is to constantly initiate new sessions. the system starts with zero sessions, then the Login VsI launchers establish a new session every interval period as the test progresses. this period is configurable but the commonly used default value is 30 seconds. new sessions are established every 30 seconds until the specified maximum number of sessions has been reached. shortly thereafter the test ends. the latency data is collected from all sessions that have already logged in.
However, because new sessions are being established throughout the duration of the test, at any given point during the test considerable resources are being consumed by VMs logging in and/or booting up (depending on how the host VM pool has been configured). If VMs take longer to log in and/or boot up than the
without APEX with APEXFigure 1.1 Baselines APEX 2800 vs. non-APEX VSImax
Figure 1 shows the Login VSI latency data for two identical experiments with and without APEX 2800. Each point represents the aggregate latency for a different number of View sessions. The baselines (latency for the first 15 sessions) are shown for the APEX 2800 and non-APEX 2800 runs. The baseline latency for APEX 2800 is 745 ms lower than the baseline for non-APEX 2800.
8000
7000
6000
5000
4000
3000
2000
1000
00 5 10 15 20 25 30 35
Latency (ms)
Figure 1.2 Usability thresholds for APEX 2800 vs. non-APEX 2800 VSImax
8000
7000
6000
5000
4000
3000
2000
1000
00 5 10 15 20 25 30 35
Latency non-APEX 2800Latency APEX 2800Baseline non-APEX 2800Baseline APEX 2800
Number of connected sessions
Latency (ms)
Figure 1.2 shows the Login VSI latency data for two identical experiments with and without the APEX 2800. Each point represents the aggregate latency for a different number of View sessions. The usability thresholds (the latency used to determine the VSImax) are also shown for the APEX 2800 and non-APEX 2800 test runs. These thresholds were calculated dynamically from the baselines shown in Figure 1.1. The threshold at which the APEX 2800 test run reaches VSImax is 931 ms lower than that for the non-APEX 2800 test run.
Latency non-APEX 2800Latency APEX 2800Baseline non-APEX 2800Baseline APEX 2800
Number of connected sessions

Quantifying teradici aPeX™ 2800 with Login VSi page_6
launch interval, then multiple VMs will be in the process of booting up/logging in throughout the test, consuming even more resources. thus, the load of the VsImax test is not only due to the workload running on the VMs, but also due to VMs booting up and/or logging in. such a test is commonly referred to as a boot storm or login storm test.
the APeX 2800 server offload card is designed to offload the PCoIP image encoding tasks only. As such it provides value only when VMs have logged in and have begun changing pixels on a screen. the APeX 2800 was not designed to help with the resource utilization issues associated with a login or boot storm. nevertheless, we measured VSImax improvements of up to 10% due to the APEX 2800 server offload card being present during a login storm test for the medium workload provided by Login VsI. this is due to the offloading of the image encoding once VMs do log in.
1.2.3 Steady-state performance
Login storm and/or boot storm tests are just one aspect of a server’s performance that is interesting to examine for a VDI deployment. However, the steady-state performance of a system where all the users have already logged in and are working is more relevant than the login storm. this is also the main use case for which the APeX 2800 server offload card was designed.
the steady state performance can be obtained using Login VsI with a few minor modifications. By extending the Auto logoff timeout (Figure 2.1 on page 9) the test set up provided by Login VsI will stay up much longer once all the sessions are established. the VMs will then continue performing and reporting application latency measurements. these latencies can be extracted from the Login VsI Analyzer and combined with the CPU data collected from VMware’s esxtop to serve as a performance metric for the steady-state test. to integrate the steady-state measurements into the VsImax infrastructure we recommend first running a VsImax test to determine the VsImax number of sessions the system can support for a given workload. then run a steady-state test with the same number of sessions connected to determine the user experience without the added resource drain of the login storm. the steady-state measurements can be performed with and without the APeX 2800 and can be compared directly.
1.2.4 Limitations of Login VSI workloads for evaluating the Teradici APEX 2800
the cornerstone of Login VsI workloads is the medium workload. It consists of 12-14 minute loops of office applications like outlook, Word, excel, Mind Map, etc. Within this workload there is also a 21 second Flash video. Because the typical scenario is to launch a new VM every 30 seconds and the video is only 21 seconds in length, this means that only one VM at a time is running a video until every 30th VM is launched. since VsImax is typically below 100 VMs, this means that at worst, no more than 2 to 3 VMs are running video at the same time. thus, this does not represent a stressful peak workload to best showcase the capabilities of the APeX 2800 server offload card.
the heavy workload is nearly identical to the medium workload except with slightly faster typing and slightly shorter idle periods. It will show nearly identical APeX 2800 performance improvements to the medium workload.
the most intense workload in the Login VsI arsenal is the multimedia workload. this workload is the same as the medium workload with the addition of an MP3 audio file being played in the background as well as the addition of another 20 second video. this second video is a 720p video played in Windows Media

Quantifying teradici aPeX™ 2800 with Login VSi page_7
Player. the APeX 2800 will show a slightly greater benefit with this workload compared to the medium workload, though not as much as one might think.
First, the addition of the MP3 audio file significantly increases the CPU load, but generates almost no pixel changes. the APeX 2800 consequently provides almost no benefit to the MP3 audio application.
the second issue is with the 720p video itself. not only is it too short to create the kind of peak workloads that would allow the APeX 2800 to perform, the selection of a 720p Windows Media Player video is actually not the worst case choice for a video workload. Windows Media Player is not very efficient at decoding video and consumes most of a CPU core when decoding a 720p video. Assuming the VDI VMs have only 1 vCPU (the typical case), this leaves very little CPU power for the PCoIP image encoder to process the video pixels in the non-APeX 2800 case. A more stressful video workload is to use a different media player and a 480p video so that the 1 vCPU VM is not at 100% utilization.
1.2.5 Login VSI sensitivities
While conducting our performance study of the APeX 2800 with Login VsI we observed several issues that may lead to delays or potential inaccuracies in the results. We list some of the main ones below.
File share scalability: Login VsI relies on a Windows file share as the backbone of the testing infrastructure. this is how the different target and launcher VMs communicate with the VsI Management Console as well as how latency results are reported. Which machine is used to host the file share as well as its location in the network can be very important. We have found that a poor choice in the file share host can become the single biggest bottleneck in the entire system, affecting scalability and results more than any other factor.
Number of powered-on VMs: Another factor that can greatly affect the test results is the total number of powered-on VMs that are on the host server. Having VMs that are powered on and idle on the server while experiments are in progress can dramatically affect the measured latencies. Login Consultants recommend that the number of powered-on VMs be no more than 10% greater than VsImax.
Workloads hang up: on the Login VsI troubleshooting web page and forum there are multiple descriptions of different ways in which workloads can hang up or become ‘stuck’ – caused by a window popping up or some other event occurring that is unexpected by the automation script. Because the script is unable to handle the event it can no longer make progress, and the VM is halted on one screen. once a VM is hung up in this way it will skew the results because it is now essentially an idle VM. However, it is still counted as an active load-generating VM during a test run. often, large numbers of VMs will become stuck and can dramatically skew the test results. the situations we encountered that caused the workloads to become stuck were:
i. A pop-up window in outlook
ii. network printers superseding the printer expected by Login VsI
iii. Cannot print because the office version is incorrectly set
iv. Cannot save because the file already exists (occurring only on the second iteration of the loop).
stuck workloads can be detected by periodically checking the sessions during testing and visually confirming that the workload is making progress. Alternatively, stuck workloads can be detected at the end of the Login VsI test.
Quantifying teradici aPeX™ 2800 with Login VSi page_8
All the VMs are programmed to log off automatically however, stuck VMs will not logoff because they will never complete the last loop. After the test has terminated and 15 minutes have passed, check if all sessions have logged off. those that have not are most likely stuck. For results to be valid there should be no stuck VMs.
Dropped sessions: View sessions can be dropped (i.e. disconnected) for a variety of reasons. Login VsI will not detect the fact that a session has been dropped and will continue with the test. However, this can significantly alter the test results for VMware View experiments. the number of connected View sessions should be constantly monitored to ensure they match the number reported by Login VsI. the web page of the View Connection server is an excellent way to do this.
2. Suggested procedures for testing the Teradici APEX 2800 with Login VSI
In this section we provide a suggested methodology to evaluate the APeX 2800 server offload card using Login VsI and discuss the correct methodology for determining VsImax. the VsImax is then used to determine the number of VMs to use for steady-state testing. We describe how to perform steady-state tests as well as how to extract and analyze the data. Finally, we focus on the workloads available in Login VsI, discuss their limitations, and provide guidance on how custom workloads can be created and used to measure the full potential of the APeX 2800 server offload card.
2.1 Finding VSImax
As discussed in the introduction, the VsImax value by itself does not provide a complete evaluation of the APeX 2800 server offload card’s performance. this has to do with the fact that VsImax is calculated under login and/or boot storm conditions for which the APeX 2800 was not specifically designed. Furthermore, the use of a dynamically obtained baseline latency to calculate the usability threshold for VsImax makes direct APeX 2800 to non-APeX 2800 test comparisons inherently inaccurate for certain workloads, penalizing the baseline latency reductions made by the APeX 2800. However, VsImax is still a useful value to obtain and a good starting point for determining the number of VMs to use in steady -state tests.
2.1.1 Recommended parameters
target (host) VM
• single vCPU
• 1.0 GB memory
•Windows 7, 32 bit
Launcher (client) VM
• 4 vCPU
•not less than 10 GB memory
•Windows 7, 64 bit
•not more than 15 clients per launcher
Login VsI settings
• Auto logoff timeout at 120 seconds (Figure 2.1. item 3)
• sequential launching (Figure 2.1. item 2 )
• Launch interval 30 seconds (Figure 2.1. item 5)
Quantifying teradici aPeX™ 2800 with Login VSi page_9
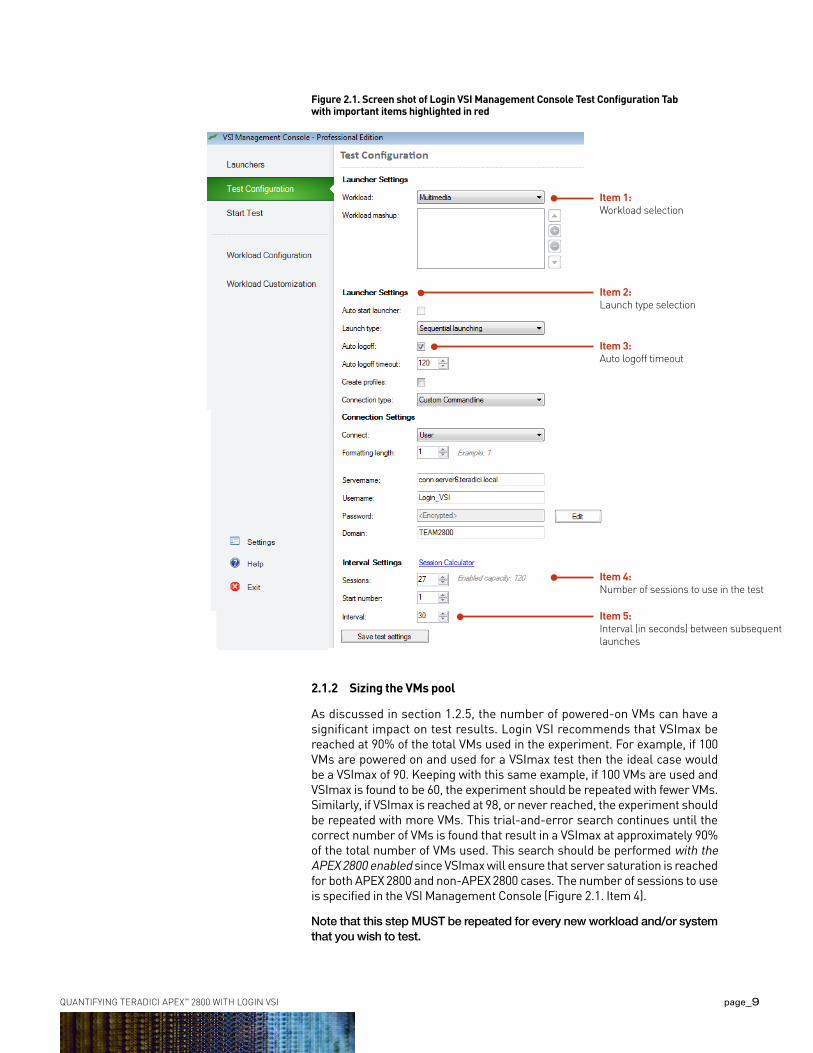
Item 1:Workload selection
Item 2:Launch type selection
Item 3:Auto logoff timeout
Item 4:Number of sessions to use in the test
Item 5:Interval (in seconds) between subsequent launches
Figure 2.1. Screen shot of Login VSI Management Console Test Configuration Tabwith important items highlighted in red
2.1.2 Sizing the VMs pool
As discussed in section 1.2.5, the number of powered-on VMs can have a significant impact on test results. Login VsI recommends that VsImax be reached at 90% of the total VMs used in the experiment. For example, if 100 VMs are powered on and used for a VsImax test then the ideal case would be a VsImax of 90. Keeping with this same example, if 100 VMs are used and VsImax is found to be 60, the experiment should be repeated with fewer VMs. similarly, if VsImax is reached at 98, or never reached, the experiment should be repeated with more VMs. this trial-and-error search continues until the correct number of VMs is found that result in a VsImax at approximately 90% of the total number of VMs used. this search should be performed with the APeX 2800 enabled since VsImax will ensure that server saturation is reached for both APeX 2800 and non-APeX 2800 cases. the number of sessions to use is specified in the VsI Management Console (Figure 2.1. Item 4).
Note that this step MUST be repeated for every new workload and/or system that you wish to test.
Quantifying teradici aPeX™ 2800 with Login VSi page_10
2.1.3 Other considerations
Along with VsImax, another useful statistic to determine is the CPU usage of the server. this can be obtained by running esxtop while performing the VsImax experiments.
It is also important to ensure that workloads do not get stuck and that sessions are not dropped, as discussed in section 1.2.5.
2.1.4 Running the actual tests
once the proper pool sizing has been determined (with the APeX 2800 enabled) and you are confident that none of the issues discussed in section 1.2.5 are occurring, obtaining VsImax data is very straightforward. Run a complete test with and without the APeX 2800 enabled and use the Login VsI Analyzer to obtain the VsImax value. It is also important to look at the usability threshold at which VsImax is reached for the APeX 2800 and non-APeX 2800 test runs. the threshold is also output by the LoginVsI Analyzer.
note that the thresholds used for the APeX 2800 and non-APeX 2800 test runs must be within 100 ms of each other, otherwise the VsImax values should not be compared directly.
Please note that both the APEX 2800 and non-APEX 2800 test runs should be performed with the same number of total VMs. this number was determined as described in section 2.1.2 (pool sizing) with the APeX 2800 enabled.
The VSImax values for the APEX 2800 and non-APEX 2800 test runs should both be calculated using the same usability threshold – that is, the one obtained for the non-APEX 2800 test run.
2.2 Login VSI steady-state
once the VsImax value has been determined with the APeX 2800 enabled for a specific workload, as described in section 2.1, steady-state data can be gathered which is ideal for evaluating the performance of the APeX 2800 server offload card. this is because there is no login and/or boot storm taking place and there is no dynamic threshold that prevents direct data comparisons.
Running a steady-state test is very similar to that completed previously for VsImax, with the following changes:
• the number of VMs that should be turned on is the VsImax value obtained earlier. this is also the number of sessions that should be set in the VsI Management Console. (Figure 2.1. Item 4)
• Change the Auto logoff timeout to 1,800 seconds. this will keep the set up in steady state for half an hour. (Figure 2.1. Item 3)
• Repeat this experiment with and without the APeX 2800 enabled.
As described in section 2.1.3, running esxtop in parallel will be helpful. Remember to make sure that workloads do not get stuck and that sessions are not dropped.
Quantifying teradici aPeX™ 2800 with Login VSi page_11
2.2.1 Analyzing steady-state data
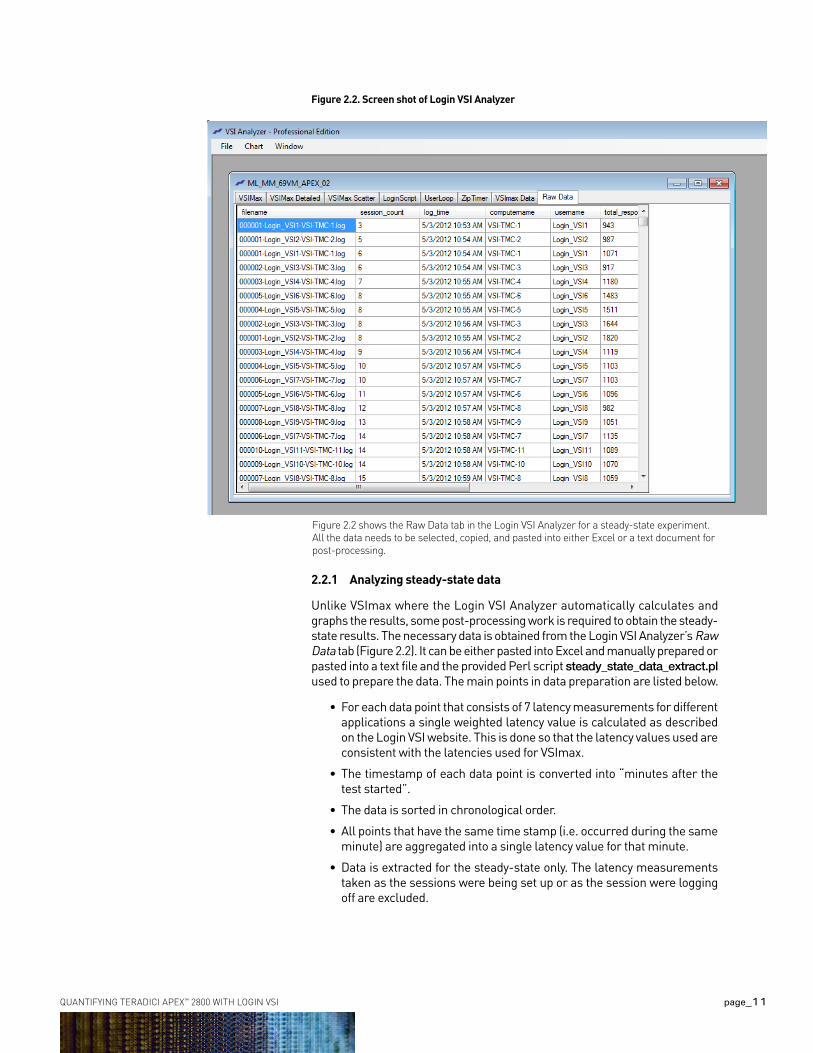
Unlike VsImax where the Login VsI Analyzer automatically calculates and graphs the results, some post-processing work is required to obtain the steady-state results. the necessary data is obtained from the Login VsI Analyzer’s Raw Data tab (Figure 2.2). It can be either pasted into excel and manually prepared or pasted into a text file and the provided Perl script steady_state_data_extract.pl used to prepare the data. the main points in data preparation are listed below.
• For each data point that consists of 7 latency measurements for different applications a single weighted latency value is calculated as described on the Login VsI website. this is done so that the latency values used are consistent with the latencies used for VsImax.
• the timestamp of each data point is converted into “minutes after the test started”.
• the data is sorted in chronological order.
• All points that have the same time stamp (i.e. occurred during the same minute) are aggregated into a single latency value for that minute.
• Data is extracted for the steady-state only. the latency measurements taken as the sessions were being set up or as the session were logging off are excluded.
Figure 2.2 shows the Raw Data tab in the Login VSI Analyzer for a steady-state experiment. All the data needs to be selected, copied, and pasted into either Excel or a text document for post-processing.
Figure 2.2. Screen shot of Login VSI Analyzer
Quantifying teradici aPeX™ 2800 with Login VSi page_12
the data extraction script may be run on any machine that has Perl installed. to run the script, put the text file with the copied data into the same folder as the script and type the following command at the command prompt:
“perl steady_state_data_extract.pl <data_file_name.txt> < number session used> “
the script will create a new file in the same folder named results.csv that will contain the processed data.
After these procedures are followed, the resulting data gives minute-by-minute aggregate system latency as measured by Login VsI in the steady-state. this data can then be plotted as latency vs. time graphs. Furthermore, the APeX 2800 and non-APeX 2800 latency vs. time curves can be plotted on the same graph and directly compared. CPU data obtained from esxtop for this same period may also be overlaid on the plot.
2.3 Custom workloads
the workloads provided by Login VsI are primarily office applications which have very few instances where the pixels on the screen are changing rapidly, such as when a video is playing. While the measured benefit of the APeX 2800 server offload card in these workloads is significant, as we will show in section 3.1, they do not provide the peak workloads that the APeX 2800 was designed to handle. to show the maximum possible benefit that can be obtained from the APeX 2800, custom workloads can be created with Login VsI that are more pixel intensive. this can be done by either augmenting the workloads provided or creating entirely new workloads.
2.3.2 Creating a video-only workload
the easiest way to introduce more video into a Login VsI workload is to use the Robotica.wmv video already provided as part of the multimedia Login VsI workload.
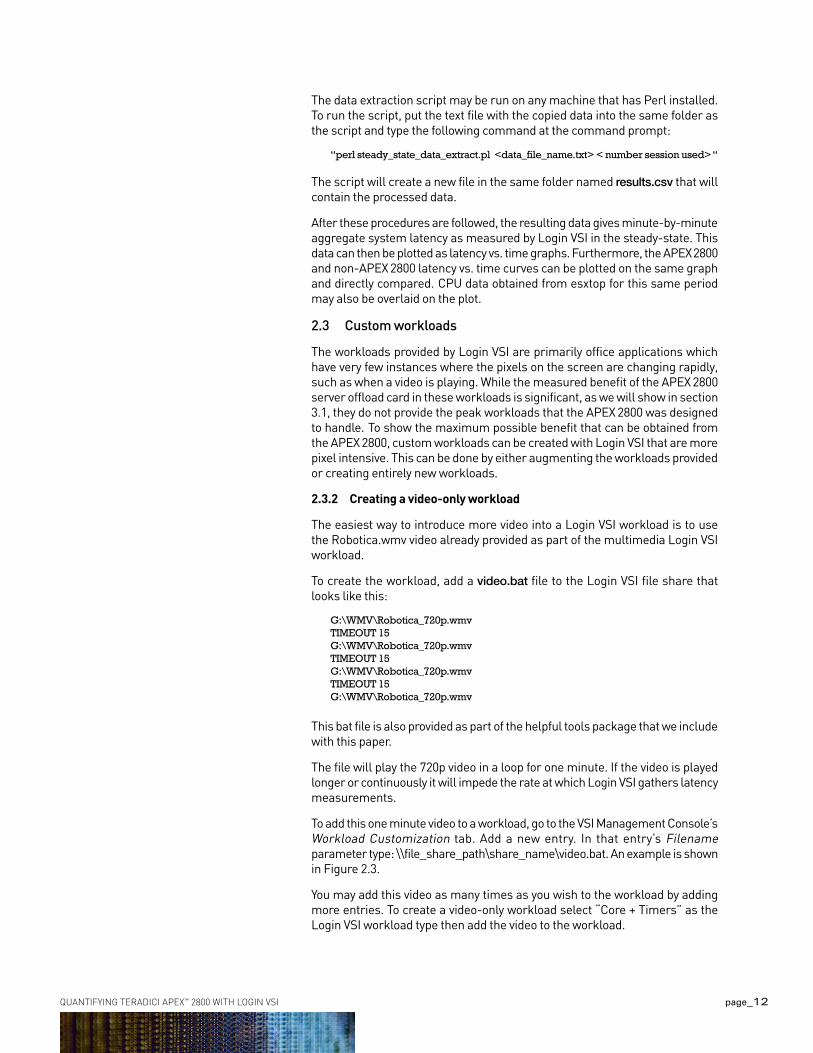
to create the workload, add a video.bat file to the Login VsI file share that looks like this:
G:\WMV\Robotica_720p.wmvTIMEOUT 15 G:\WMV\Robotica_720p.wmvTIMEOUT 15 G:\WMV\Robotica_720p.wmvTIMEOUT 15 G:\WMV\Robotica_720p.wmv
this bat file is also provided as part of the helpful tools package that we include with this paper.
the file will play the 720p video in a loop for one minute. If the video is played longer or continuously it will impede the rate at which Login VsI gathers latency measurements.
to add this one minute video to a workload, go to the VsI Management Console’s Workload Customization tab. Add a new entry. In that entry’s Filename parameter type: \\file_share_path\share_name\video.bat. An example is shown in Figure 2.3.
You may add this video as many times as you wish to the workload by adding more entries. to create a video-only workload select “Core + timers” as the Login VsI workload type then add the video to the workload.
Quantifying teradici aPeX™ 2800 with Login VSi page_13
2.3.3. Login VSI issue with custom workloads
We have observed that when running custom workloads Login VsI will incorrectly gather the first latency measurement for each VM. this can be seen as negative timer values recorded in the first line of that VM’s log. If this error occurs then the Login VsI Analyzer will not be able to parse the data and will return an unhandled exception error.
If this occurs, manually remove the first line of each VM’s log file or use the Perl script provided, called clean_data.pl, to do this. to run the script, Perl must be installed on a machine that can read/write the Login VsI file share. At the command prompt type:
“perl clean_data.pl <file share path> <name of experiment which needs its data cleaned>”
After performing this task you should now be able to run the Login VsI Analyzer without further issues.
3. ResultsIn this section we provide some of the results that were obtained while quantifying the benefits of the APeX 2800 server offload card using Login VsI. Please see section 4 for details regarding the exact characteristics of the system used to obtain these results. We break this section into two parts based on the two main workloads that were tested: the Login VsI multimedia workload and a custom video-only workload. We provide VsImax and steady-state results for these tests following the procedures introduced in section 2. We conclude with a general discussion of how the APeX 2800 performance benefit is created and how it can be used to improve VDI deployments.
3.1 Multimedia workload
the following data was obtained using the Login VsI multimedia workload without modifications.
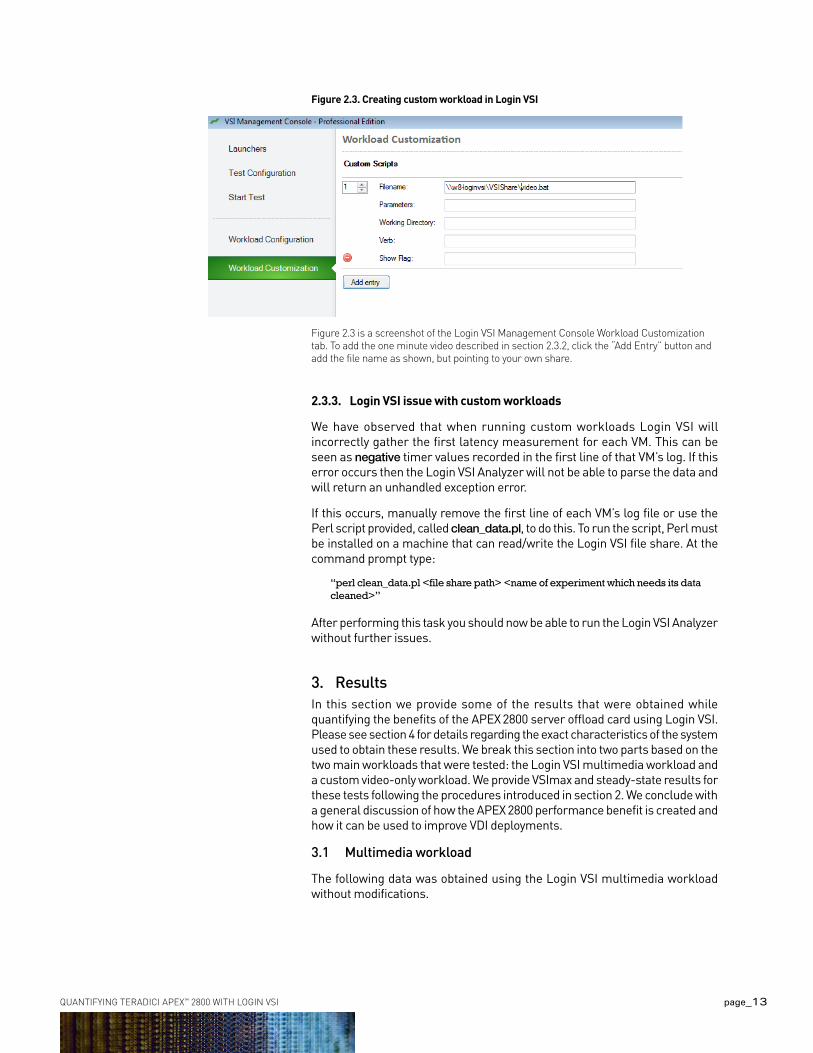
Figure 2.3. Creating custom workload in Login VSI
Figure 2.3 is a screenshot of the Login VSI Management Console Workload Customization tab. To add the one minute video described in section 2.3.2, click the “Add Entry” button and add the file name as shown, but pointing to your own share.
Quantifying teradici aPeX™ 2800 with Login VSi page_14
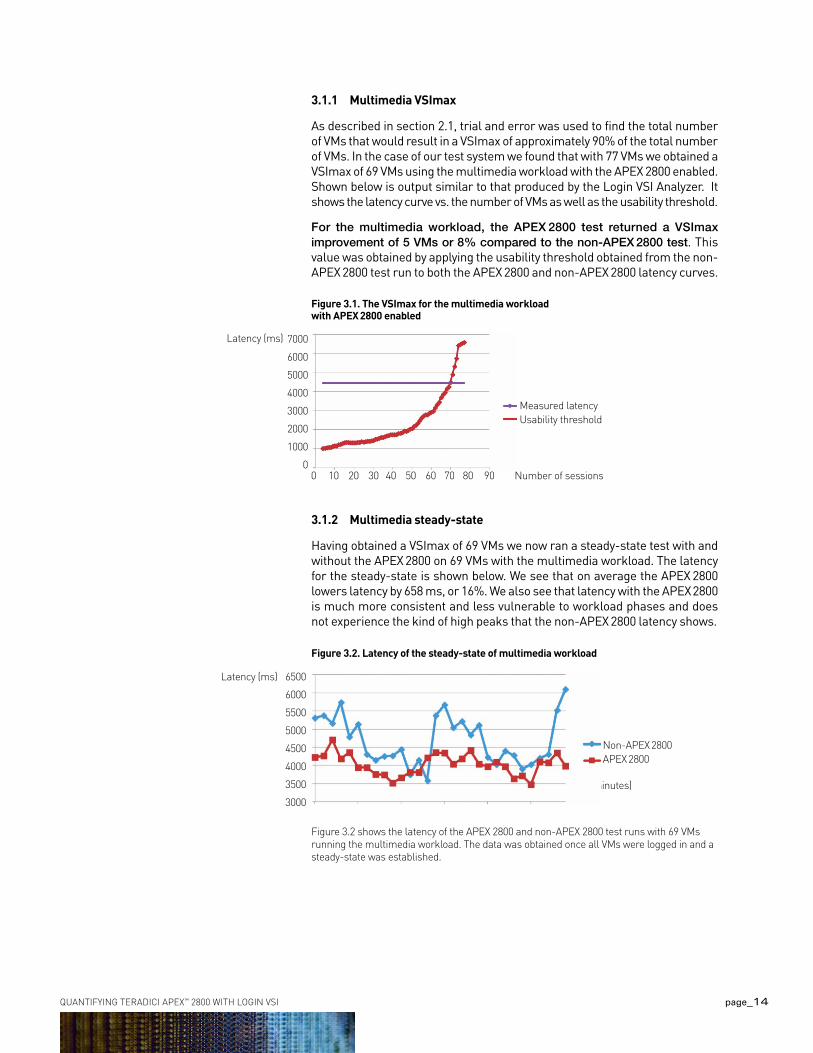
3.1.1 Multimedia VSImax
As described in section 2.1, trial and error was used to find the total number of VMs that would result in a VsImax of approximately 90% of the total number of VMs. In the case of our test system we found that with 77 VMs we obtained a VsImax of 69 VMs using the multimedia workload with the APeX 2800 enabled. shown below is output similar to that produced by the Login VsI Analyzer. It shows the latency curve vs. the number of VMs as well as the usability threshold.
For the multimedia workload, the APEX 2800 test returned a VSImax improvement of 5 VMs or 8% compared to the non-APEX 2800 test. this value was obtained by applying the usability threshold obtained from the non-APeX 2800 test run to both the APeX 2800 and non-APeX 2800 latency curves.
3.1.2 Multimedia steady-state
Having obtained a VsImax of 69 VMs we now ran a steady-state test with and without the APeX 2800 on 69 VMs with the multimedia workload. the latency for the steady-state is shown below. We see that on average the APeX 2800 lowers latency by 658 ms, or 16%. We also see that latency with the APeX 2800 is much more consistent and less vulnerable to workload phases and does not experience the kind of high peaks that the non-APeX 2800 latency shows.
0 10 20 30 40 50 60 70 80 90 Number of sessions
Measured latencyUsability threshold
Figure 3.1. The VSImax for the multimedia workload with APEX 2800 enabled
7000
6000
5000
4000
3000
2000
1000
0
Latency (ms)
35 40 45 50 55 60 Time (minutes)
Figure 3.2. Latency of the steady-state of multimedia workload
6500
6000
5500
5000
4500
4000
3500
3000
Non-APEX 2800APEX 2800
Latency (ms)
Figure 3.2 shows the latency of the APEX 2800 and non-APEX 2800 test runs with 69 VMs running the multimedia workload. The data was obtained once all VMs were logged in and a steady-state was established.
Quantifying teradici aPeX™ 2800 with Login VSi page_15
the CPU utilization for both the APeX 2800 and non-APeX 2800 experiments was determined to be 100%. this is a perfect example of the APeX 2800 server offload card providing purely latency/performance benefits. this happens in systems that are severely starved for CPU resources, so that all the CPU cycles which the APeX 2800 saves by offloading image encoding are immediately consumed by other applications. the result is that CPU utilization does not improve but the applications which are now able to use these additional cycles have better performance and lower latency. Figure 3.5 attempts to visualize this relationship.
3.2. Custom video-only workload
Following the steps outlined in section 2.3.2 we created a workload that consisted of only the 720p video and the Login VsI timers to capture latency.
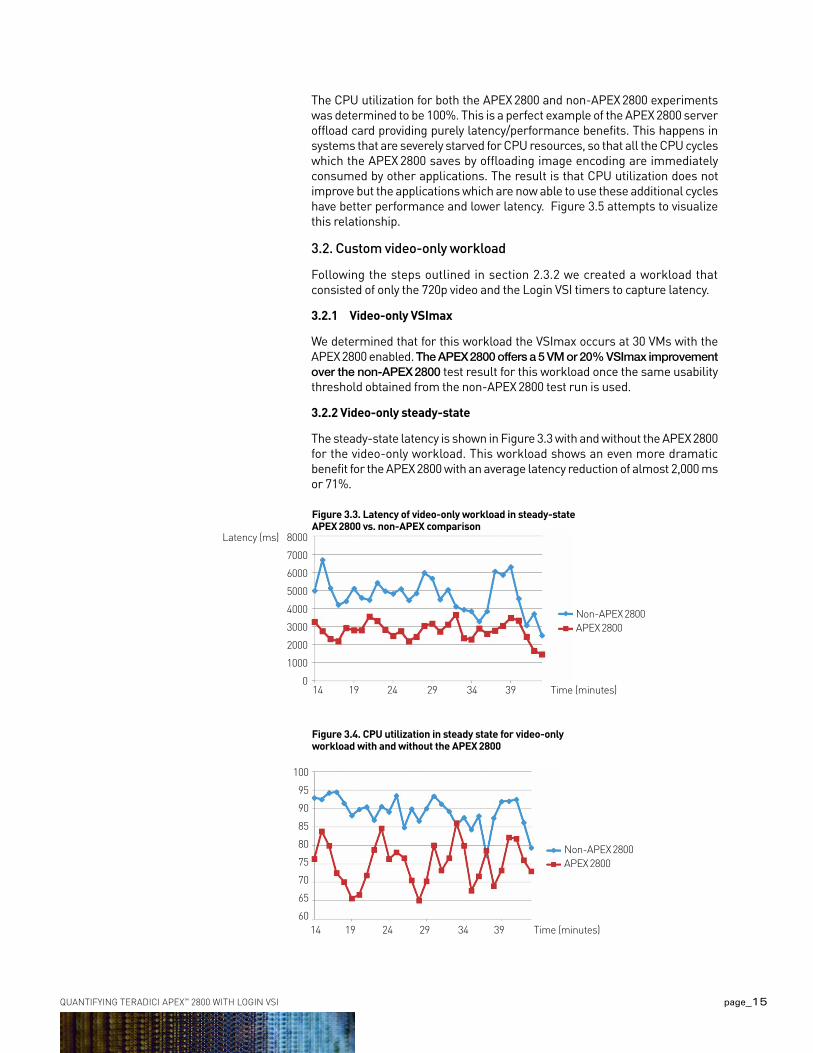
3.2.1 Video-only VSImax
We determined that for this workload the VsImax occurs at 30 VMs with the APeX 2800 enabled. The APEX 2800 offers a 5 VM or 20% VSImax improvement over the non-APEX 2800 test result for this workload once the same usability threshold obtained from the non-APeX 2800 test run is used.
3.2.2 Video-only steady-state
the steady-state latency is shown in Figure 3.3 with and without the APeX 2800 for the video-only workload. this workload shows an even more dramatic benefit for the APeX 2800 with an average latency reduction of almost 2,000 ms or 71%.
14 19 24 29 34 39 Time (minutes)
Figure 3.3. Latency of video-only workload in steady-stateAPEX 2800 vs. non-APEX comparison
Non-APEX 2800APEX 2800
8000
7000
6000
5000
4000
3000
2000
1000
0
Latency (ms)
100
95
90
85
80
75
70
65
60
Figure 3.4. CPU utilization in steady state for video-onlyworkload with and without the APEX 2800
14 19 24 29 34 39 Time (minutes)
Non-APEX 2800APEX 2800
Quantifying teradici aPeX™ 2800 with Login VSi page_16
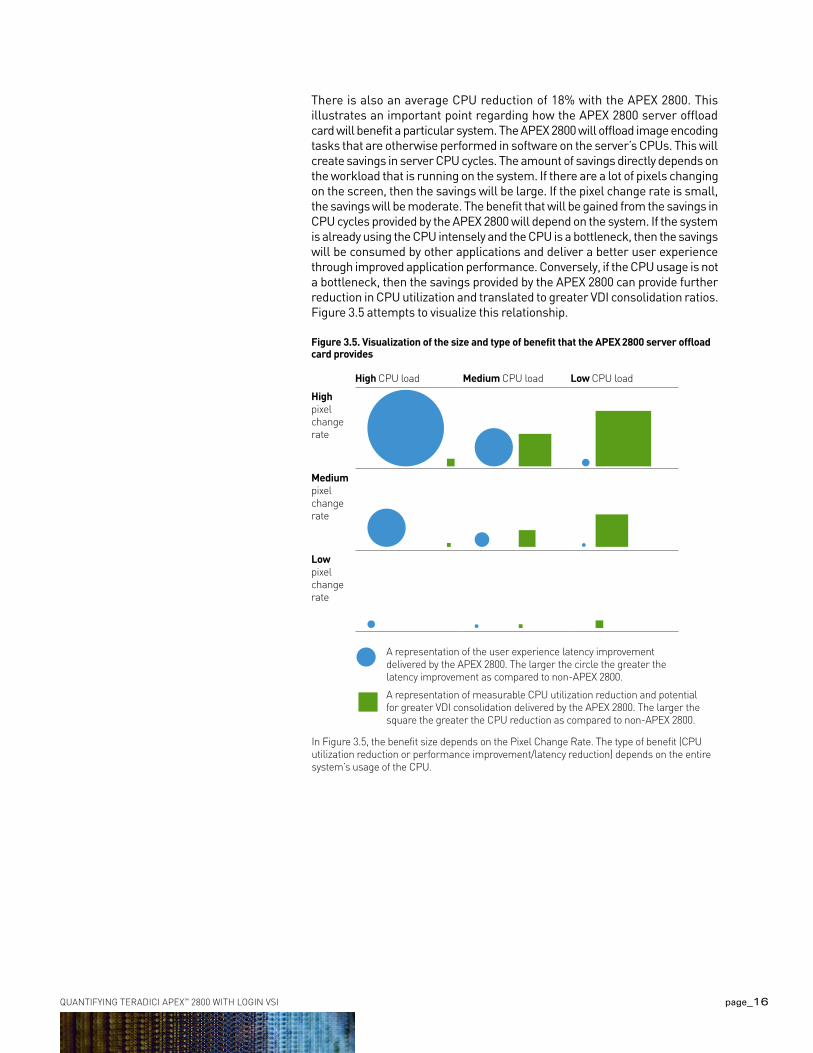
there is also an average CPU reduction of 18% with the APeX 2800. this illustrates an important point regarding how the APeX 2800 server offload card will benefit a particular system. the APeX 2800 will offload image encoding tasks that are otherwise performed in software on the server’s CPUs. this will create savings in server CPU cycles. the amount of savings directly depends on the workload that is running on the system. If there are a lot of pixels changing on the screen, then the savings will be large. If the pixel change rate is small, the savings will be moderate. the benefit that will be gained from the savings in CPU cycles provided by the APeX 2800 will depend on the system. If the system is already using the CPU intensely and the CPU is a bottleneck, then the savings will be consumed by other applications and deliver a better user experience through improved application performance. Conversely, if the CPU usage is not a bottleneck, then the savings provided by the APeX 2800 can provide further reduction in CPU utilization and translated to greater VDI consolidation ratios. Figure 3.5 attempts to visualize this relationship.
In Figure 3.5, the benefit size depends on the Pixel Change Rate. The type of benefit (CPU utilization reduction or performance improvement/latency reduction) depends on the entire system’s usage of the CPU.
High CPU load Medium CPU load Low CPU load
Highpixel change rate
Mediumpixel change rate
Lowpixel change rate
A representation of the user experience latency improvement delivered by the APEX 2800. The larger the circle the greater the latency improvement as compared to non-APEX 2800.
A representation of measurable CPU utilization reduction and potential for greater VDI consolidation delivered by the APEX 2800. The larger the square the greater the CPU reduction as compared to non-APEX 2800.
Figure 3.5. Visualization of the size and type of benefit that the APEX 2800 server offload card provides
Quantifying teradici aPeX™ 2800 with Login VSi page_17
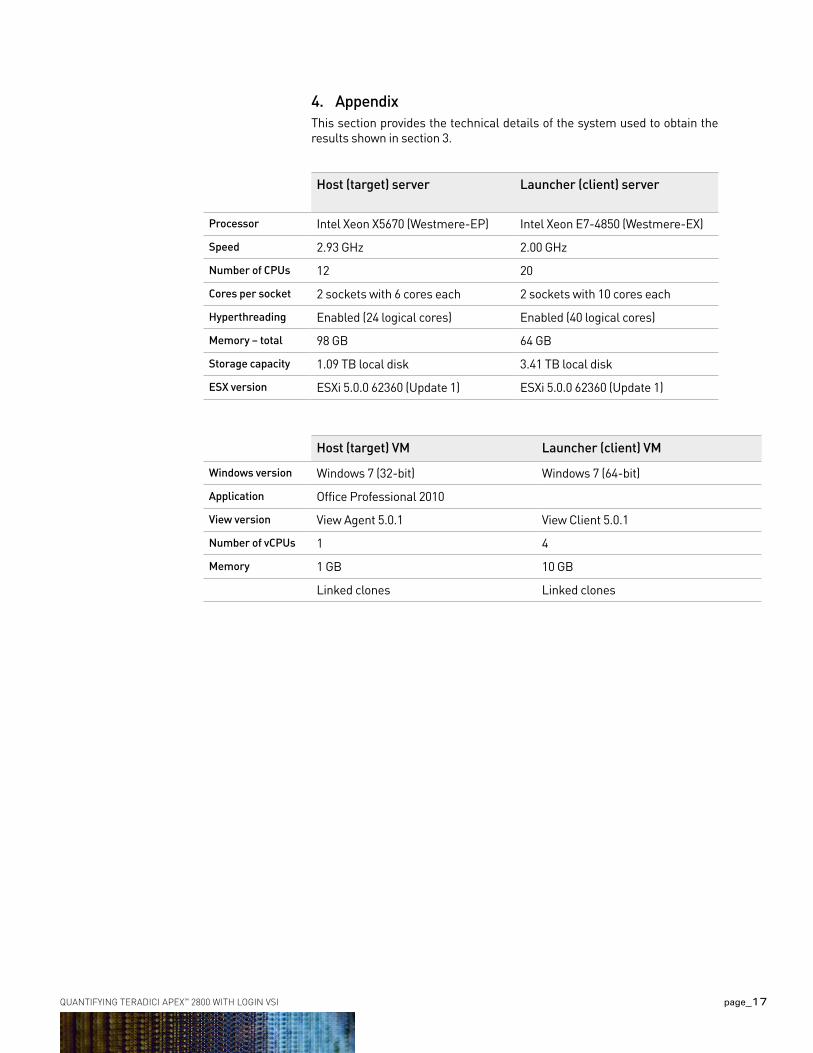
4. Appendixthis section provides the technical details of the system used to obtain the results shown in section 3.
Host (target) VM Launcher (client) VM
Windows version Windows 7 (32-bit) Windows 7 (64-bit)
Application office Professional 2010
View version View Agent 5.0.1 View Client 5.0.1
Number of vCPUs 1 4
Memory 1 GB 10 GB
Linked clones Linked clones
Host (target) server Launcher (client) server
Processor Intel Xeon X5670 (Westmere-eP) Intel Xeon e7-4850 (Westmere-eX)
Speed 2.93 GHz 2.00 GHz
Number of CPUs 12 20
Cores per socket 2 sockets with 6 cores each 2 sockets with 10 cores each
Hyperthreading enabled (24 logical cores) enabled (40 logical cores)
Memory – total 98 GB 64 GB
Storage capacity 1.09 tB local disk 3.41 tB local disk
ESX version esXi 5.0.0 62360 (Update 1) esXi 5.0.0 62360 (Update 1)
Teradici Corporation+1.604.628.1200
© 2004 – 2012 Teradici Corporation. All rights reserved. Teradici, PCoIP, PC-over-IP and APEX are trademarks of Teradici Corporation and may be registered in the United States and/or other countries. All other trademarks are property of their respective owners.
Specifications subject to change without notice. WP-04.2-120524
www.teradici.com/APEX
teradici drives innovation to fundamentally change the way people use and deploy computers by developing technology and solutions that deliver a true, uncompromised PC user experience over IP networks. our focused approach in designing advanced image processing algorithms enables the physical separation of the computer and the user, and ultimately will change the way enterprises compute.