Embed Size (px)
Citation preview

© 2021 JETIR November 2021, Volume 8, Issue 11 www.jetir.org (ISSN-2349-5162)
JETIR2111160 Journal of Emerging Technologies and Innovative Research (JETIR) www.jetir.org b468
EVALUATION AND VISUALIZATION OF
PETROLEUM PRODUCTION DATA WITH
PYTHON MOHAMMAD FEROZ BASHA, NULU PRAVEEN KUMAR, CHAVA SIVA GANGADHAR
STUDENTS
ADITYA ENGINEERING COLLEGE
M.V.V.S ANU PRAKASH
ASSISTANT PROFESSOR
ADITYA ENGINEERING COLLEGE
ABSTRACT:-
Python is a general purpose and high-level language that is the most popular programming language in now days and it is
used for data analytics and data science. Python is an open source and free software to develop the programme language with the most
impressive library of machine learning algorithms and artificial intelligence, python has proven as the most useful platform for the
highly sophisticated petroleum dataanalytic tools.
In this paper we are discussed about how the petroleum data visualizing into the graphs and how the data used in the data analytics
and how we import the data from the other sources and converts into the way we want by understanding the code in the easy way and
learning some important tools and dictionaries.
Python:- Python is an object-oriented and interpreted language that’s easy to use, and runs on many operating systems including
windows, Mac OS, Linux and More.It’s named after the cult comedy show Monty pythons flying circus(not after the snake) by Guido
VanRussum and you will find various references to many python sketches in the several documents related to python.
Python supports basic data types such as numbers and strings as well as more complex types like lists and dictionaries that can greatly
simplify data processing.python also supports several programming paradigms and can be used for procedural programming,
functional programming and Object oriented programming.
Why Python:-
Python has applications in almost every field:
AI/Machine Learning.
Big Data.
Smart device/ IOT (Internet Of Things)
Game Development
Backend Development.
What is syntax?
Similar to grammar rules in English, Hindi etc.., Each programming has a unique set of rules . these rules are called syntax.

© 2021 JETIR November 2021, Volume 8, Issue 11 www.jetir.org (ISSN-2349-5162)
JETIR2111160 Journal of Emerging Technologies and Innovative Research (JETIR) www.jetir.org b469
Basic programme in Python:-
code:-
print("Hello World!")
Output:-
Hello World!
When you called a function in python, you provide the things you want to print inside parenthesis, so we have provided a string
literal, Hello World! And that’s what got printed. A string literal is character is a sequence of characters any thing you can type in the
keyboard basically enclosed in quotes, you can use a single Quote or Double Quotes to enclose a string , we have to use same quotes
in the two ends.
The string literal “Hello world!” is called an argument, we are passed the argument to the print function.
In the one print function you are able to give arguments as much as you want.
print(“The end”, “is it?” , “Keep study to learn more”, 4).
In the end of each argument we need to give the comma and at the end we didn’t give the 4 under “ ” because it is numerical
Python has three Numeric Data types
1. Int
2. float
3. complex
List:-
Square brackets are used in three places in python and the square brackets in the lists are one of the usethe other are index a sequence
and for slices
Lists are used to store various objects in a single variable.
Lists are one of the 4built in data types in Python used to store collection of data, the other3 are Tuple, Set, and Dictionary, all
with different qualities and usage.
Lists are created using square brackets:[]
Tuple:-
A tuple is a mathematical name for an ordered set of data, In python Tuples are another sequence type: along with strings, lists and
ranges.
Tuples differ from the lists because tuples are immutable. That means they can’t be changed after they are created just like strings.
Set :-
Lists an tuples are sequence types, That means we can use indexing to access individual items.
Dictionaries and sets aren’t sequences, We can’t access the items using index positions.
A set is an unordered collection with no duplicate entries, python sets work the same way as they do in set theory in mathematics.
In the sets each item in the set is run different orders
Set is an un-ordered collection of items, every set element is
Unique
Must be Immutable
Creating a set:-
Creating by enclosing elements with in {curly} brackets.
Each item is separated by a comma.
Dictionary:-
In Dictionary we use a key to get individual values from the dictionary, Dictionaries store key/value pairs,
we’ll also find a dictionary referred to as mapping, If you know java, then a python dict is equivalent to a java Hashmap.
As an example, employees in a company might be given an employee ID . That would form their key, and the value would be their
personnel records.
Dictionary is an un-ordered collection of items.
© 2021 JETIR November 2021, Volume 8, Issue 11 www.jetir.org (ISSN-2349-5162)
JETIR2111160 Journal of Emerging Technologies and Innovative Research (JETIR) www.jetir.org b470
Every dictionary item is a Key-Value pair.
Creating a dictionary:-
Created by enclosing items with in curly brackets { }.
Each item in dictionary is a Key-Value pair separated by a comma.
Elif:-
We can add any number of elif blocks after if block. else block is not compulsory after if elif blocks. Cannot write an elif blocks
after else block.
The else keyword catches anything which isn’t caught by the preceding conditions.
NestedIf :-
In the conditional block another condition block comes that condition is called nested conditional block.
The pass statements:-
Pass statements is used as syntactic place holder.
When it is executed nothing happens.
Generally used when we have to test the code before writing the complete code.
PythonLoops :-
There are two prime ways for looping.
While loop
For loop
While loop:-
used to execute a block of code several times as long as the condition is True.
The while loop requires relevant variables to be ready, in this example we need to define an indexing variable ,i, which we set to
1.
The while loop requires relevant variables to be ready, in this example we need to define and existing variable, i,which
we set to 1.
Python standard Library:-
Python provides several such useful values (constants), classes and functions. This collection is predefined utilities is referred as the
python standard library.
All these functions are organized into different modules.
In python context any file containing a python code is called a module.
These modules are further organized into folders known as packages.
Math Module:-
Math module provides us to access some common math functions and constants.
Code:-
import math
We can also import a specific definition from a module and alias it.
Code:-
From math import factorial
Code:-
From math import factorial as fac
© 2021 JETIR November 2021, Volume 8, Issue 11 www.jetir.org (ISSN-2349-5162)
JETIR2111160 Journal of Emerging Technologies and Innovative Research (JETIR) www.jetir.org b471
WORKING WITH HUGE PRODUCTION DATA OF A PARTICULAR FIELD AND PLOTTING THEM:-
Production Engineering:-
As oil and gas fields mature, reservoir and well conditions change continuously, and most likely toward deterioration. As a result,
production declines rapidly due to an increase in water cut (fraction or percentage of water present in oil), lift equipment
inefficiencies, lack of sufficient reservoir pressure support, or surface backpressure bottlenecks, among
many others. Reservoir and field decline may be a result of individual well production decline, as well as the rapid increase of
inactive strings (non-producing wells).
Drilling new wells or the intervention of existing ones are needed to manage production decline. To improve production through an
existing well, reservoir and production engineers plan and execute workover jobs consisting of squeeze cement, well integrity,
fishing jobs, and zone isolation to optimize and maintain oil production
The role of production engineering is to ensure reservoir production delivers within the existing boundaries of the approved field
development plan, including the number of wells, facilities capacity, and limited expenditures.
The responsibilities of a production engineer may include
the following.
• Plan, gather, and interpret production surveillance data.
• Build, maintain, and exploit the use of models for well performance management.
• Establish well-operating envelopes and set points.
• Identify, rank, implement, and assess production enhancement opportunities, including well workovers
production operation includes various activities are measuring,analyzing , modeling , prioritizing, and implementing several actions to
improve productivity and profitability. Production engineers mostly consider several options to improve production system conditions
technically, Economically and Environmentally.
DISPALAYING PRODUCTION DATA:-
Importnumpyasnp
importpandasaspd
importmatplotlib.pyplotasplt
importseabornassns
importmissingnoasmsno
#loadandviewdata
filepath="http://bit.ly/piopetro-data1”
df=pd.read_csv(filepath)
print(df)

© 2021 JETIR November 2021, Volume 8, Issue 11 www.jetir.org (ISSN-2349-5162)
JETIR2111160 Journal of Emerging Technologies and Innovative Research (JETIR) www.jetir.org b472
Figure 1-1. Production data
#DISPLAYINGAPARTICULARCOLUMN
v=df["DATEPRD"]
Print(v)
Figure 1-2. Production data Date
#print all the column names / fatures
print(df.columns)

© 2021 JETIR November 2021, Volume 8, Issue 11 www.jetir.org (ISSN-2349-5162)
JETIR2111160 Journal of Emerging Technologies and Innovative Research (JETIR) www.jetir.org b473
Figure 1-3. All The Column Names of Production Data
#printallthewellnames
Print(df["NPD_WELL_BORE_NAME"])
Figure 1-4. Well Bore Names of Production Data
#PRINT ALL THE WELL NAMES (UNIQUE)
print(df["NPD_WELL_BORE_NAME"].unique())
['15/9-F-1C''15/9-F-11''15/9-F-12''15/9-F-14''15/9-F-15D''15/9-F-4''15/9-F-5']
#separate well 15/9-F-14 from data frame
mask=df["NPD_WELL_BORE_NAME"]=="15/9-F-14"
well14_df=df[mask]
mask=df["NPD_WELL_BORE_NAME"]=="15/9-F-14"
well14_df=df[mask]
© 2021 JETIR November 2021, Volume 8, Issue 11 www.jetir.org (ISSN-2349-5162)
JETIR2111160 Journal of Emerging Technologies and Innovative Research (JETIR) www.jetir.org b474
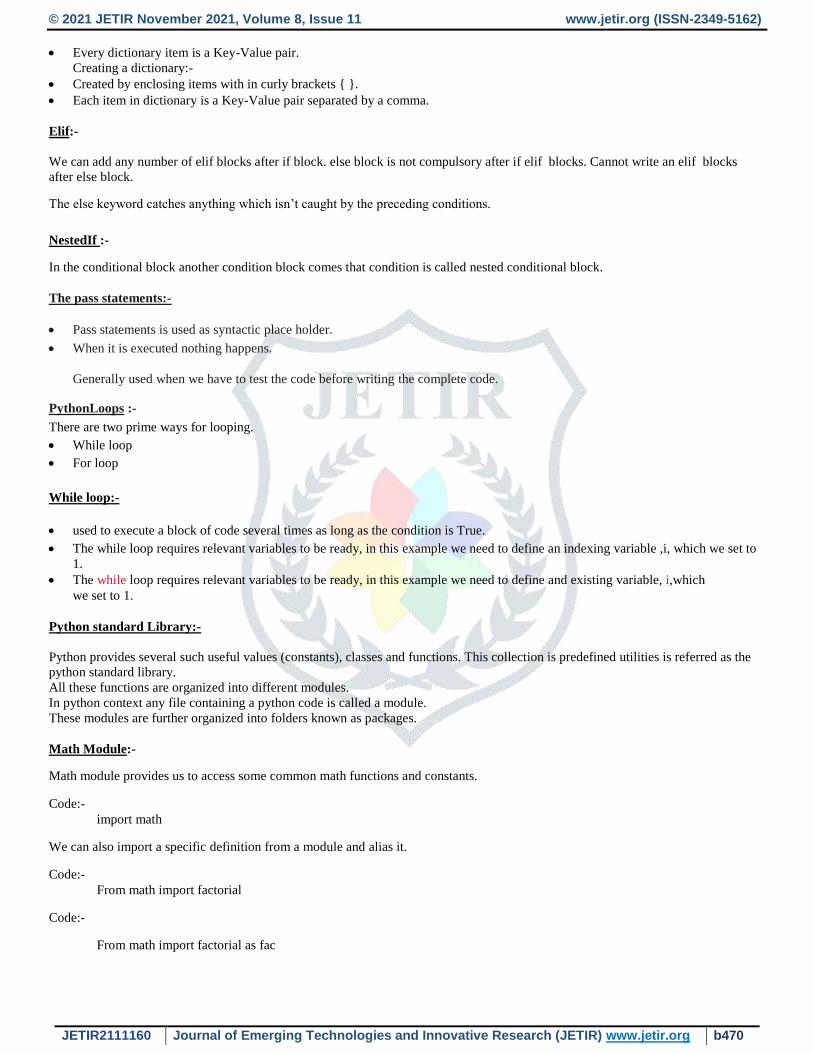
print(well14_df)
Figure 1-5. Well Bore Names
#display summary statistics data
well14_df.describe()
Figure 1-6. All The Well Bore Names
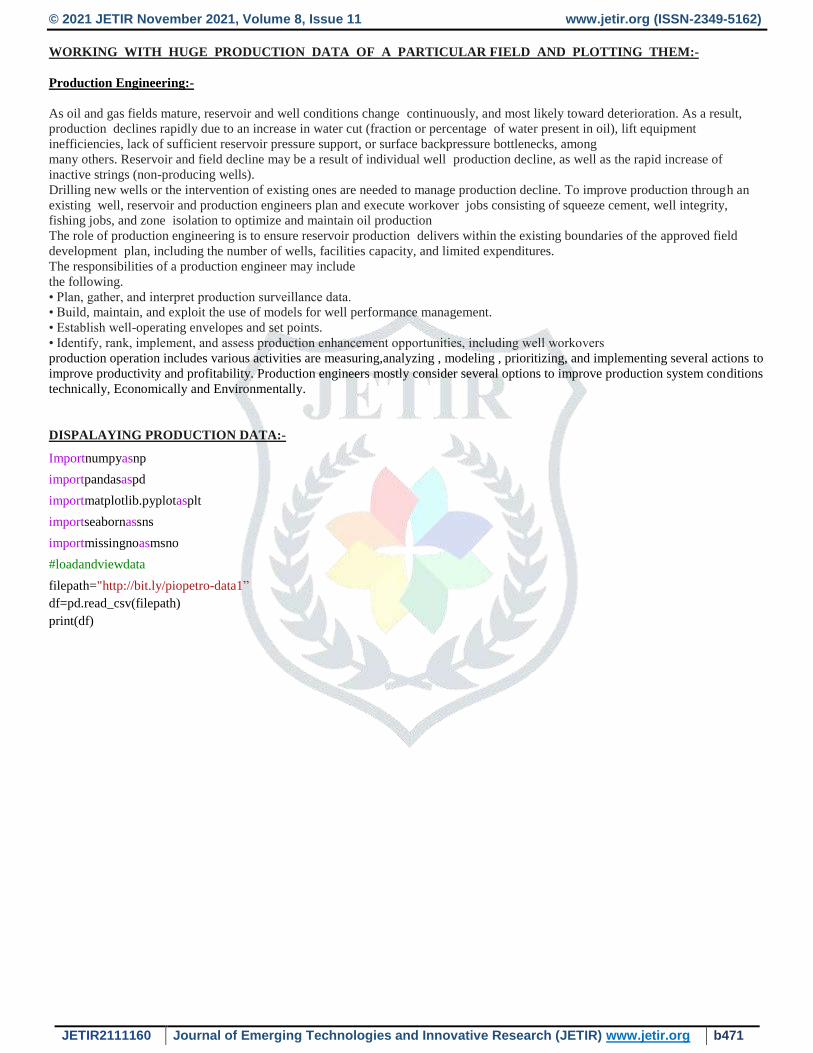
PLOTTING THE PRODUCTION DATA:-
#pl.plot ot water and oil production(usestep);BORE_WAT_VOL,BORE_WAT_OIL
plt.figure(figsize=(15,6))
plt.plot(df["DATEPRD"],df["BORE_WAT_VOL"],color="red")
plt.plot(df["DATEPRD"],df["BORE_OIL_VOL"],color="green")
plt.title("ProductionData")
plt.xlabel("Date");
plt.ylabel("Q[STB]")
plt.grid()
plt.show()
© 2021 JETIR November 2021, Volume 8, Issue 11 www.jetir.org (ISSN-2349-5162)
JETIR2111160 Journal of Emerging Technologies and Innovative Research (JETIR) www.jetir.org b475
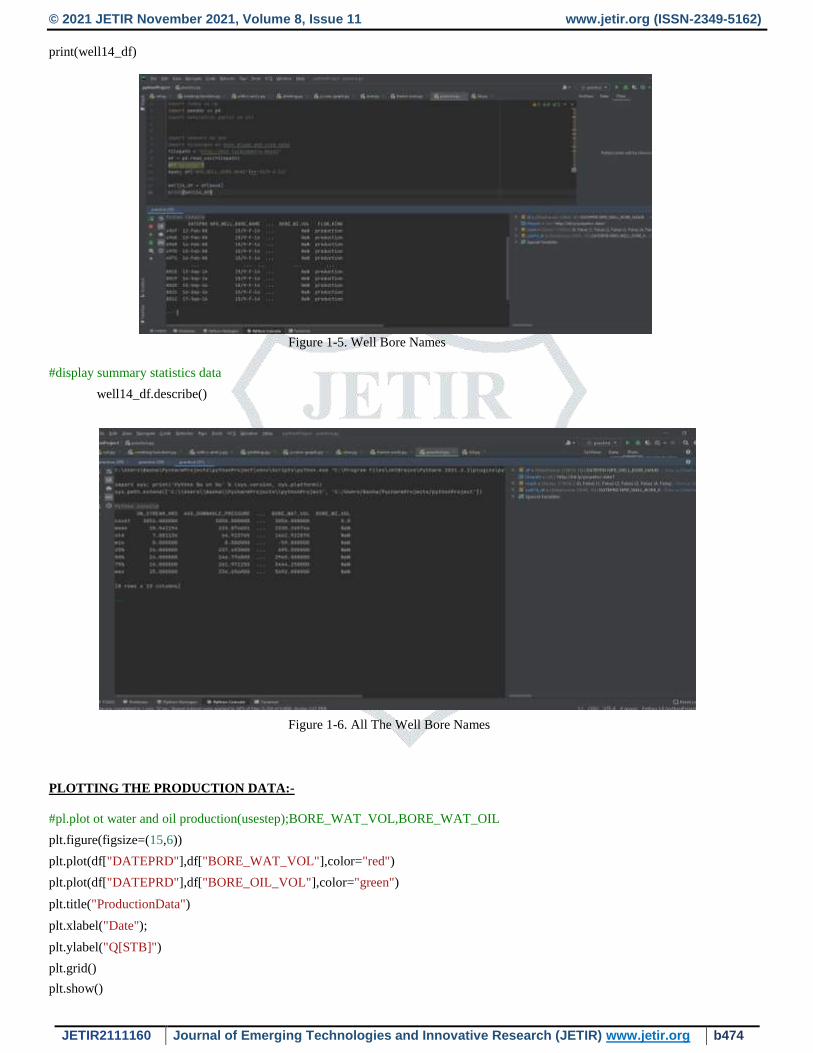
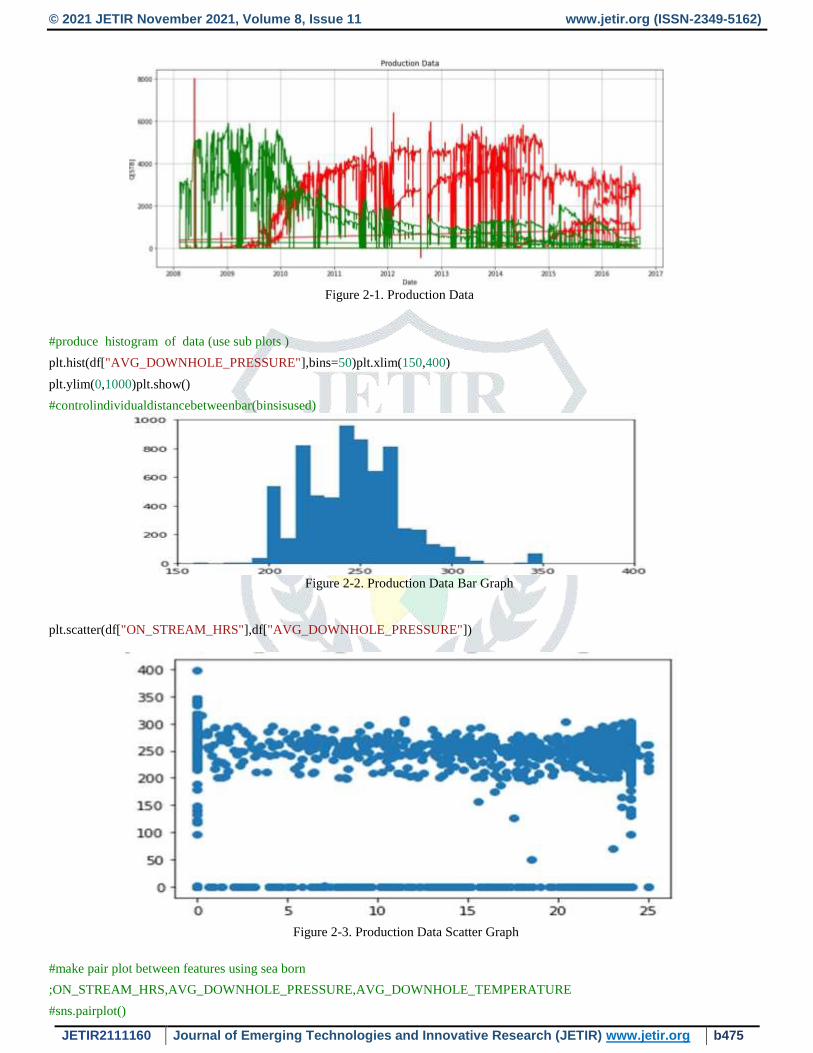
Figure 2-1. Production Data
#produce histogram of data (use sub plots )
plt.hist(df["AVG_DOWNHOLE_PRESSURE"],bins=50)plt.xlim(150,400)
plt.ylim(0,1000)plt.show()
#controlindividualdistancebetweenbar(binsisused)
Figure 2-2. Production Data Bar Graph
plt.scatter(df["ON_STREAM_HRS"],df["AVG_DOWNHOLE_PRESSURE"])
Figure 2-3. Production Data Scatter Graph
#make pair plot between features using sea born
;ON_STREAM_HRS,AVG_DOWNHOLE_PRESSURE,AVG_DOWNHOLE_TEMPERATURE
#sns.pairplot()
© 2021 JETIR November 2021, Volume 8, Issue 11 www.jetir.org (ISSN-2349-5162)
JETIR2111160 Journal of Emerging Technologies and Innovative Research (JETIR) www.jetir.org b476
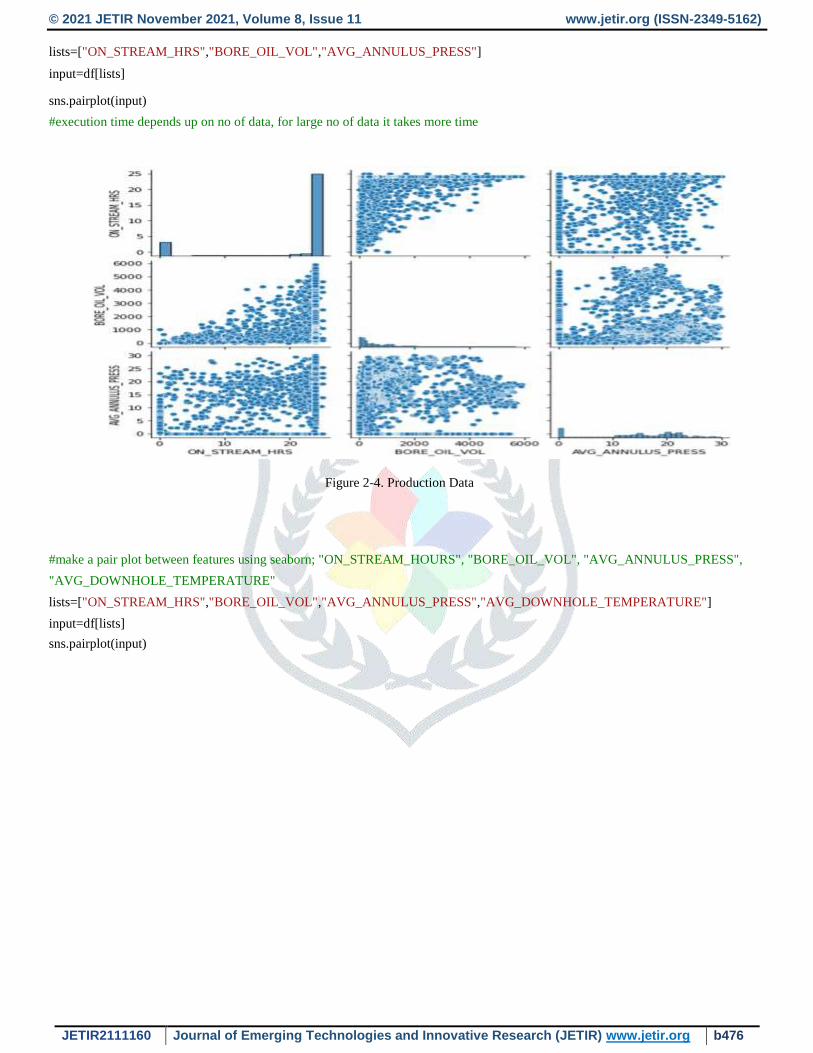
lists=["ON_STREAM_HRS","BORE_OIL_VOL","AVG_ANNULUS_PRESS"]
input=df[lists]
sns.pairplot(input)
#execution time depends up on no of data, for large no of data it takes more time
Figure 2-4. Production Data
#make a pair plot between features using seaborn; "ON_STREAM_HOURS", "BORE_OIL_VOL", "AVG_ANNULUS_PRESS",
"AVG_DOWNHOLE_TEMPERATURE"
lists=["ON_STREAM_HRS","BORE_OIL_VOL","AVG_ANNULUS_PRESS","AVG_DOWNHOLE_TEMPERATURE"]
input=df[lists]
sns.pairplot(input)

© 2021 JETIR November 2021, Volume 8, Issue 11 www.jetir.org (ISSN-2349-5162)
JETIR2111160 Journal of Emerging Technologies and Innovative Research (JETIR) www.jetir.org b477
Figure 2-5. Production Data

© 2021 JETIR November 2021, Volume 8, Issue 11 www.jetir.org (ISSN-2349-5162)
JETIR2111160 Journal of Emerging Technologies and Innovative Research (JETIR) www.jetir.org b478
#visualize missing values(non-numeric) in data using missing msno.matrix(df)
Figure 2-6. Production Data
#interpolation to fill missing values
df=df.interpolate(method="linear")
SHOWING THE MISSING PRODUCTION DATA AND ADDING THEM BY LINEAR REGRESSION
#visualizemissingaftermissingvaluesfilledw/interpolateddatamsno.matrix(df)
Figure 2-7. Production Data

© 2021 JETIR November 2021, Volume 8, Issue 11 www.jetir.org (ISSN-2349-5162)
JETIR2111160 Journal of Emerging Technologies and Innovative Research (JETIR) www.jetir.org b479
INFLOW PERFOMANCE RELATIONSHIP:-
Table-1 Case Study
PLOTTING CASE STUDY TO UNDESTAND AND BETTER WAY OF PRODUCTION:-
#IMPORTINGOFLIBRARIES
Importnumpyasnp
importpandasaspd
importmatplotlib.
pyplotasplt
#Enteringthegivendata
pr_data={'B.S(mm)':[5,6,7],'BHP':[199.38,182.38,160.6],'oilrate':[42.72,63.6,71],'GOR'
:[64.66,69.46,71.97], 'Del-p':[37.75,54.67,75.74]}
df=pd.DataFrame(pr_data)
print(df)

© 2021 JETIR November 2021, Volume 8, Issue 11 www.jetir.org (ISSN-2349-5162)
JETIR2111160 Journal of Emerging Technologies and Innovative Research (JETIR) www.jetir.org b480
Figure 2-4. Production Data
#plottingdel_pvsoilflowrate
plt.plot(df['oilrate'],df['Del-p'])plt.show()
#plotting Bean size vs oil flowrate plt.plot(df['B.S(mm)'],
df['oilrate'])
plt.xlim(0,8)
plt.ylim(0,80)
plt.show()

© 2021 JETIR November 2021, Volume 8, Issue 11 www.jetir.org (ISSN-2349-5162)
JETIR2111160 Journal of Emerging Technologies and Innovative Research (JETIR) www.jetir.org b481
#plottingBeansizevsGOR
plt.plot(df['B.S(mm)'],df['GOR'])
plt.xlim(0,8)
plt.show()

© 2021 JETIR November 2021, Volume 8, Issue 11 www.jetir.org (ISSN-2349-5162)
JETIR2111160 Journal of Emerging Technologies and Innovative Research (JETIR) www.jetir.org b482
PLOT THE IPR CURVE TO INSTALL ARTIFICIAL LIFT SYSTEM:-
Now from above data: Ps=234.63psi. where Psis bottom hole pressure when well is shut down like if we cut our
production to zero then pressure will build upto certain value Ps, now we Decreasing our pressure Pf from 234.63(Ps) psi
to 0psi,where Pf is our bottom hole flowing pressure.
Q=Qmax(1-0.2(Pf/Ps)-0.8(Pf/ps)^2) often known as Vogel's model for IPR Where Qmax is maximum
obtain able flowrate when Pfis0
GivenQmaxis140.33
table_1={'Pf':[234.63,230,200,170,150,130,120,100,50,30,20,0]}
Qmax=140.33
Ps=234.63
Df=pd.DataFrame(table_1)
q=list(Qmax*(1.0-0.2*(Df['Pf']/Ps)-0.8*(Df['Pf']/Ps)**2))Df['Q']= q
Df
Pf
Q
0 234.63 0.000000
1 230.00 4.940772
2 200.00 34.835820
3 170.00 61.060193
4 150.00 76.503844
5 130.00 90.316084
6 120.00 96.610425
7 100.00 107.975549
8 50.00 129.250934
9 30.00 134.906119
10 20.00 137.121932
11 0.00 140.330000
Table 2
© 2021 JETIR November 2021, Volume 8, Issue 11 www.jetir.org (ISSN-2349-5162)
JETIR2111160 Journal of Emerging Technologies and Innovative Research (JETIR) www.jetir.org b483
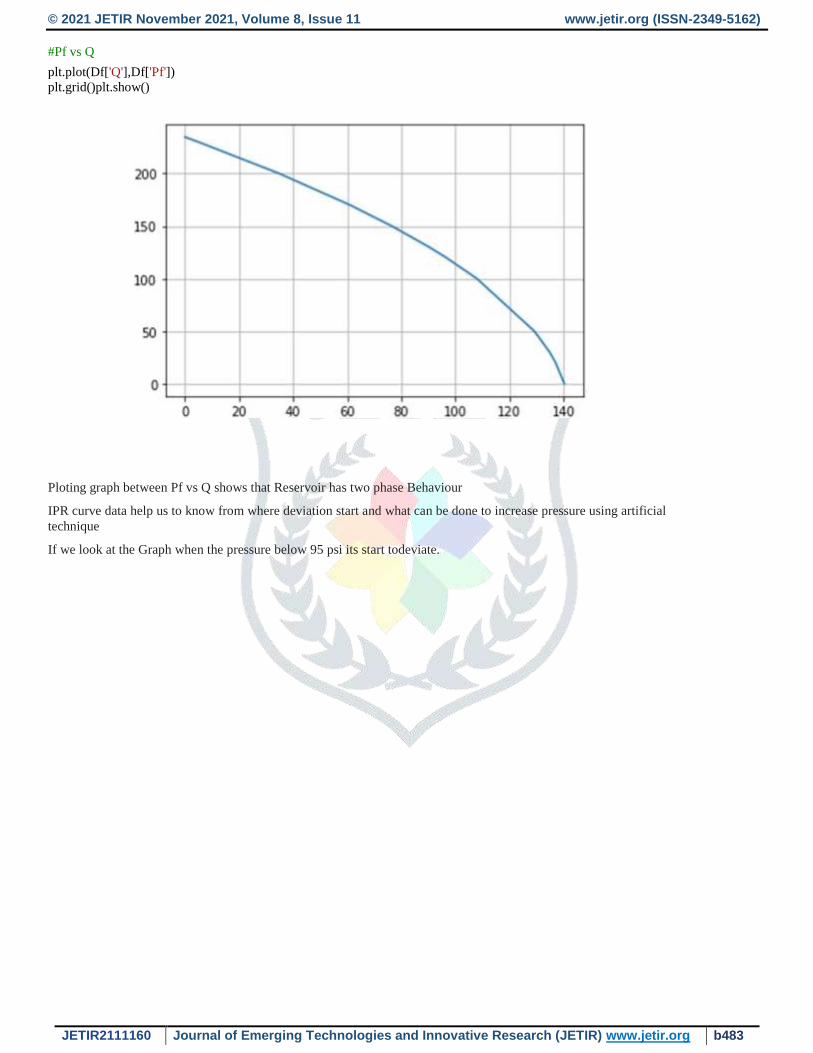
#Pf vs Q
plt.plot(Df['Q'],Df['Pf'])
plt.grid()plt.show()
Ploting graph between Pf vs Q shows that Reservoir has two phase Behaviour
IPR curve data help us to know from where deviation start and what can be done to increase pressure using artificial
technique
If we look at the Graph when the pressure below 95 psi its start todeviate.

© 2021 JETIR November 2021, Volume 8, Issue 11 www.jetir.org (ISSN-2349-5162)
JETIR2111160 Journal of Emerging Technologies and Innovative Research (JETIR) www.jetir.org b484
Conclusion:-
Python is a vast programming language, and it takes more than one book to cover all its programming concepts; however, in this
paper, we provided a brief introduction. We hope that you learned the basic data structures, control flows, and some of the standard
libraries.. We strongly recommend that you refer to the original Python documentation and other resources mentioned in this paper.
These resources provide up-to-date descriptions and well-explained examples of ever-evolving Python programming concepts and
libraries.
In this paper, we provided a brief overview of production engineering. We also discussed production optimization and the formulation
for predicting well rate performances, we presented you with the machine learning approach to virtual metering and virtual graphs to
understand the flow-rate. The graphs obtained from the oil well data can help us continuously monitor production from a well. A
section of this paper also provided example implementation of machine learning algorithms for predicting impending graphs
according to the data, using the historical production data,
References 1. Python Software Foundation. [Online]. https://www.python.org/.
2. Machine Learning in the Oil and Gas Industry Including Geosciences, Reservoir Engineering, and Production Engineering
with Python By Yogendra Narayan Pandey, Ayush Rastogi , Sribharath Kainkaryam, Srimoyee Bhattacharya, Luigi Saputelli
3. J. VanDerPlas, Python Data Science Handbook, O’Reilly Media Inc., November 2016
4. G. V. Rossum and F. L. Drake, Jr., “Python Tutorial: Release 3.2.3,” June 2012.
5. [2] L. Saputelli, C. Bravo, M. Nikolaou, C. Lopez, R. Cramer,
6. S. Mochizuki, and G. Moricca, “Best Practices and Lessons Learned After 10 Years of Digital Oilfield (DOF)
Implementations,” SPE Kuwait Oil and Gas Show and Conference, Kuwait City, Kuwait, 2013.
7. W. Omole, L. Saputelli, J. Lissanon, O. Nnaji, F. Gonzalez, G. Wachel, K. Boles, E. Leon, N. Parekh, N. Nguema, J. Borges,
and P. Hadjipieris,
8. “Real-time Production Optimization in the Okume Complex Field, Offshore Equatorial Guinea,” SPE Digital Energy
Conference and Exhibition, The Woodlands, TX, 2011.
9. W. Ramirez, “Optimal Injection Policies for Enhanced Oil Recovery: Part 1 Theory and Computational Strategies,” Society
of Petroleum Engineers Journal, June 1984.
10. W. Liu and W. Ramirez, “Interactive Personal Computer Optimal Control Calculations For Steamflooding,” Society of
Petroleum Engineers Journal, January 1992.
11. B. Sudaryanto and Y. Yortsos, “Optimization of Displacements in Porous Media Using Rate Control,” SPE Annual Technical
Conference and Exhibition, New Orleans, LA, 2001.
12. H. Darcy, Les fontaines publiques de la ville de Dijon, Paris: Dalmont, 1856.
13. H. Melbø, S. Morud, B. Bringedal, R. van der Geest and K. Stenersen, “Software that Enables Flow Metering of Well Rates
with Long Tiebacks and With Limited or Inaccurate Instrumentation,” Offshore Technology Conference, Houston, TX, 2003.
14. American Petroleum Institute, API Recommended Practice 86: Recommended Practice for Measurement of Multiphase Flow,
Washington, DC, 2005.
15. A. Petukov, L. Saputelli, J. Hermann, A. Traxler, K. Boles, O. Nnaji, B. Vrielynck, and D. Vegunopal, “Virtual Metering
System Application in the Ceiba Field, Offshore Equatorial Guinea,” SPE Digital Energy Conference and Exhibition, The
Woodlands, TX, 2011.