Embed Size (px)
Citation preview

Karnataka Veterinary, Animal and Fisheries Sciences University, Bidar
Detailed Project Report 2011-12 to 2013-14
LONESTAR INTERNATIONAL (USA) PROJECT ON
Evaluation and Validation of Proprietary Biological Formulations for Water Quality Management and Enhancing Fish Production in
Aquaculture Ponds
Principal Investigator: Dr. E.G. JAYARAJ
Professor Dept. of Aquaculture, College of Fisheries MANGALORE 575002, KARNATAKA, INDIA

Title of the project:
EVALUATION AND VALIDATION OF PROPRIETARY BIOLOGICAL FORMULATIONS FOR WATER QUALITY MANAGEMENT AND ENHANCING FISH PRODUCTION IN AQUACULTURE PONDS
Principal Investigator: Dr. E.G. JAYARAJ
Co- Principal Investigator: Dr. H. Shivananda Murthy
EXECUTIVE SUMMARY
Intensive aquaculture system employs feeds rich in protein. The chief excretory product apart from faecal matter is the ammonia, which is excreted through gills. Ammonia is toxic to fish if allowed to accumulate in fish production systems. When ammonia accumulates to toxic levels, fish cannot extract energy from feed efficiently. If the ammonia concentration gets high enough, the fish will become lethargic and eventually fall into a coma and die. Even in properly managed fish ponds also, ammonia seldom accumulates to lethal concentrations. However, ammonia can have so-called “sublethal” effects—such as reduced growth, poor feed conversion, and reduced disease resistance at concentrations that are lower than lethal concentrations.
Though several methods are available for water quality management, use of probiotic formulations are increasingly becoming the focus of attention in the recent years. Two such biological formulations manufactured by TLC Products, Cleveland, Ohio, USA, such as “Start Smart” and “Pond Perfect” were evaluated in rendering toxic ammonia to safer levels. The project was initiated in four phases on Indian major carps considering the production cycle of carps in India viz. nursery (spawn to fry), rearing (fry to fingerling) and grow-out farming (fingerling to table size) including the seed transportation activity. In all the four phases of trials, intervention of bacterial probiotics has proved its efficiency owing to following reasons,
• Bacterial formulations helped to reduce Ammonia levels in treatment ponds as against to control ponds.
• The growth of fish was superior and uniformly consistent in treatment ponds as against to control ponds where the growth was inferior and erratic.
• The intervention by bacterial biosolids appears to enhance the biogenic capacity (immunity) of fish there by providing relief from the stress.
• The treated ponds registered a high mean increase in biomass of 14.30% (fry to fingerling rearing) and 14.82% (grow-out fish farming) indicating the superiority of bacterial formulations for water quality maintenance and biomass increase.
• Addition of bacterial biosolids appear to enhance the duration of fish seed transport their by suggesting enhanced ability of the fish to tolerate stress in spite of ammonia build up as evidenced in seed packages.

PROJECT AT A GLANCE
The project became operative during April 2011, with a financial outlay of 4 lakhs, with in the Department of Aquaculture, College of Fisheries, Mangalore, with the following objectives.
Objectives of the project
• To evaluate the efficacy of various bacterial formulations on the water quality changes • To evaluate the effects of ammonia and the stress brought about on fish survival • To evaluate and validate the probiotic effects on fish growth and production.
INTRODUCTION
Water is the primary requisite supporting aquatic life and successful pond culture operations mainly depend on maintenance of a healthy aquatic environment and production of sufficient fish food organisms in ponds. Factors controlling the quality of pond water determine to a great extent the success or failure of culture operations. Intensive aquaculture of fish and shrimp employs intensive stocking and intensive feeding that deteriorate the water quality and their by deteriorating underlying pond soils too.
Intensive aquaculture system employs feeds rich in protein. The chief excretory product apart from faecal matter is the ammonia, which is excreted through gills. Ammonia is toxic to fish if allowed to accumulate in fish production systems. When ammonia accumulates to toxic levels, fish cannot extract energy from feed efficiently. If the ammonia concentration gets high enough, the fish will become lethargic and eventually fall into a coma and die.
Even in properly managed fish ponds also, ammonia seldom accumulates to lethal concentrations. However, ammonia can have so-called “sublethal” effects—such as reduced growth, poor feed conversion, and reduced disease resistance at concentrations that are lower than lethal concentrations.
In addition, H2S is produced in anaerobic conditions by the action of-microorganisms on sulphur compounds. H,S is toxic to fish and prawn and is responsible for respiratory problems. Fish are in equilibrium with potential disease organisms and their environment. Changes in this equilibrium viz. deterioration of water quality/environment can result in fish becoming stressed and vulnerable to diseases. It is therefore important to monitor the water quality parameters by application of suitable substances that can bring back normalcy in the environment.
In this regard TLC Products, Cleveland, Ohio, USA. has brought out a number of proprietary biological formulations such as “Start Smart” and “Pond Perfect” that act as nitrifiers in rendering toxic ammonia to safe levels and converting them to safer nitrates. These formulations are already popular in catfish farming industry of US and also in carp culture in China.
WORK PLAN AND METHODOLOGICAL APPROACHES
The production cycle of carps in India is of three tier system viz. Nursery (spawn to fry), Rearing (fry to fingerling) and Grow-out farming (fingerling to table size). Accordingly, the testing and evaluation of start smart formulation was done for nursery, rearing and grow-out farming including fish seed transport.

Phase 1: Nursery rearing of carps from spawn to fry
This experiment was initiated in outdoor cement ponds of size 2mx2mx0.8m with control and treatment in duplicates. The treatment will receive the dosage of “Start Smart” formulation while control without the application of “Start Smart” as detailed below in the protocol.
- Select 4 ponds, 2x2x0.8 m = 4m2 two each for treatment and control - fill 1” soil and condition the water for three days - liming @ 25 g/pond - cow dung @ 4 kg/pond - leave for 10 days - stock rohu spawn @ 4000/pond - duration 1 month - feeding with powdered rice bran and groundnut oil cake
(first fortnight: double the BW, second fortnight: thrice the BW) - Weekly sampling for water quality monitoring and fish growth
Application of product - Apply start smart (liquid), 1 quart/pond/week for 4 weeks – only for treatment ponds - For the initial dosing, add 1 quart 24 hrs before stocking the spawn
Phase 2: Rearing of fry to fingerlings of carps
This experiment was conducted in two stages one in the recirculatory sytem and the other without recirculatory system in outdoor tanks to understand the ammonia build up patterns.
Stage 1
This experiment was conducted for a period of up to 3 months in indoor rearing system consisting of fibre tanks with 120 lit. capacity with the protocol as detailed below.
- 4 recirculatory tubs 120 l cap., two each for treatment and control without aeration and
circulation. - stock rohu fingerlings – 32 fish/120 l tubs - duration 3 months - feeding with standard feed having 28% protein @ 10% BW flat - fortnightly sampling
Application of product
- Apply start smart (liquid) – only for treatment ponds - First month – 3 ounces/once each week - Second month – 2 ounces/ once each week - Third month – 1 ounce/ once each week
Stage 2
This experiment was initiated in outdoor cement ponds of size 2mx2mx0.8m with control and treatment in duplicates as detailed below in the following protocol.

- 4 ponds, 2x2x0.8 m = 4m2 two each for treatment and control - fill 1” soil and condition the water for three days - liming – 50 g/pond (250 kg/ha) - cow dung – 4 kg/pond (20,000 kg/ha) - leave for 10 days - stock fish fry (Common carp) – 80 fry/pond (70+10 mortality @3,00,000/ha) - duration 3 months - feeding powdered RB+GOC (@ 5% BW) - fortnightly sampling - duration 3 months
Application of product
- Apply start smart (liquid) - 0.5 quart start smart/pond/week
Phase 3: Grow-out farming of carps
This experiment was conducted in two stages with modified treatment of startsmart application during the course of experiment with the following protocol.
Stage 1 (up to 180 days rearing)
- 4 ponds, 5x5x0.8m= 25m2 two each for treatment and control - liming – 50 g/pond (@250 kg/ha) - cow dung (initial dose) – 25 kg/pond (@10,000 kg/ha) + monthly dose of 4.0 kg/pond
(@1600kg/ha) - leave for 10 days - stock fish fingerlings (Common carp with mean weight of 3.0 g) –
18 fingerlings/pond (@7,200 fish/ha) - feeding powdered RB+GOC (@ 5% BW) - fortnightly sampling - duration 6 months (180 days)
(a) Initial Application of Product
- Apply start smart (liquid) @ 1000 ml + 200 g powdered activator in 100 liters of water and incubate for 1 week
- Apply 25 liters of cured start smart/pond/week
(b) Modified Package of Application of the Product (After 45 days onwards)
- Add 8 Liters of Start Smart + Add 300 grams of Activator Powder in 100 liters of water
- Aerate strongly for 7 days. - Apply 25 liters incubated solution to each test pond.

- The Ammonia levels at the start point of incubation showed values of 192 ppm and at the 7th day incubation, there was no detectable Ammonia found.
Stage 2 (extended period up to 210 days)
Stage 1 experiment was extended by another one month to register rearing up to 210 days.
Phase 4: Efficacy of start smart biosolids for fish seed transportation
This is another area where “Start Smart biosolids” may have beneficial role in controlling ammonia. The fish seed when packed with oxygen and transported over long distances, usually ammonia build up and the resultant stress due to high density packing may contribute for high mortality leading to losses in fish seed transport.
The standard package for fish seed transportation was done using a rectangular type plastic bag of size 65x45 cm that holds 16-18 litres of water. In this bag, water is filled to 1/3 of the bag along with “Start Smart” and the rest 2/3 of the bag shall be filled with oxygen and allowed for observing the changes in ammonia profile till on to suffocation and exhaust by the fish seed in treatment bags. . Addition of “bacterial biosolids” to transportation bag was evaluated with the following protocol.
• The experiment was conducted in a variety of ways to assess the efficacy of startsmart (biosolids)
for fish seed transportation. • In all the cases about 4-5 litres of water was used (in an 18 litre plastic bag). • The remaining portion of the bag carried approximately 6-8 litres of medical oxygen. • About 250 ml of biosolids from bioreactor were introduced in all the treatment bags that carried
fish seed. • A control was also run simultaneously without any biosolids in all the cases. • 50% death rate of fish seed in the bags was fixed as economical threshold (from farmers point of
view) to assess the efficiency of startsmart. • Water quality parameters were analyzed initially at the start of expt. before introducing the fish
seed/biosolids in to the bags and at the closure of the expt. that recorded 50% lethal death rate both in control and treatment packages.
ACHIEVEMENTS
Phase 1: Nursery rearing of carps from spawn to fry under intensive system
(a) Weekly variations in water quality parameters in the control (C) and treatment (T) ponds.
Date of sampling: 31-8-2011 Pond Air
Temperature (°c)
Water Temperature (°c)
pH DO (mg/l)
Alkalinity (mg/l)
CO2 (mg/l)
Ammonia (mg/l)
C1 26.5 27.5 6.8 7.42 51 0.88 0.00259C2 26.5 27.5 6.8 7.03 51 1.76 0.00263T1 26.5 27.0 6.8 6.64 53 1.76 0.00596T2 26.5 27.0 6.8 6.25 53 2.64 0.00581

Date of sampling: 09-9-2011
Pond Air Temperature (°c)
Water Temperature (°c)
pH DO (mg/l)
Alkalinity (mg/l)
CO2 (mg/l)
Ammonia (mg/l)
C1 27.0 27.0 6.8 5.86 62 2.64 0.00732C2 27.0 27.0 6.8 6.25 51 2.64 0.00285T1 28.5 28.5 6.8 5.08 52 1.76 0.00016T2 28.5 28.5 6.8 5.47 63 0.88 0.00095
Date of sampling: 16-9-2011
Parameters Air Temperature (°c)
Water Temperature (°c)
pH DO (mg/l)
Alkalinity (mg/l)
CO2 (mg/l)
Ammonia (mg/l)
C1 25.0 26.0 6.8 4.69 54 3.52 0.00120C2 25.0 26.0 6.8 5.08 52 2.64 0.00155T1 25.0 26.0 6.8 5.86 45 1.76 0.000778T2 25.0 26.0 6.8 5.08 48 0.84 0.000864
Date of sampling: 23-9-2011
Pond Air Temperature (°c)
Water Temperature e (°c)
pH DO (mg/l)
Alkalinity (mg/l)
CO2 (mg/l)
Ammonia (mg/l)
C1 27 27.5 6.8 5.86 65 1.76 0.00259C2 27 27.5 6.8 6.25 62 1.88 0.00605T1 27 27.5 6.8 5.08 70 1.52 0.000691T2 27 27.5 6.8 4.69 50 1.20 0.000770
Date of sampling: 30-9-2011
Pond Air Temperature (°c)
Water Temperature (°c)
pH DO (mg/l)
Alkalinity (mg/l)
CO2 (mg/l)
Ammonia (mg/l)
C1 26.5 28 6.8 5.47 53 2.64 0.00129C2 26.5 28 6.8 5.08 54 1.76 0.00155T1 26.5 28 6.8 4.30 46 1.64 0.00029T2 26.5 28 6.8 5.08 48 1.52 0.00051
(b) Survival percentage after 1 month rearing
Pond No of fishes recovered % survivalC1 625 15.62C2 995 24.88T1 369 9.23T2 138 6.00

Observations & Recommendations
• All the parameters were well within the recommended levels with dissolved oxygen above 5.0 mg/l in most of the cases with a few exceptions.
• Reduction in the Ammonia levels is evident in treatment ponds as against to control ponds. • The start smart application in treatment ponds has significantly lowered the free carbon dioxide levels –
this would probably affect the primary productivity as evidenced by more clear waters (from 10th day onwards) in treatment ponds during the course of investigation period.
• The spawn were never appeared in surface waters in the treatment ponds probably owing to low ammonia levels, while they were found surfacing in the control ponds.
• The growth of rohu was superior and uniformly consistent in treatment ponds as against to control ponds where the growth was inferior and erratic.
• The start smart is effective in lowering the ammonia at the cost of lowered plankton production and low carbon dioxide levels that resulted in low percentage of survival as against to control.
• It appears that a change or optimizing dosing of start smart would be essential to balance ammonia levels with respect to carbon dioxide so as to retain primary productivity for increased survival of fish larvae.
Rohu fry – Sample from T1 Rohu fry – Sample from T2
Rohu fry – Sample from C1 Rohu fry – Sample from C2

Close-up view from treatment pond (T1) Note the uniform consistent growth
Close-up view from control pond (C1) Note the erratic growth
Phase 2: Rearing of fry to fingerlings of carps under intensive system
Stage 1 (indoor experiment)
The following sampling schedule (once in 15 days) was performed for collection of the data
Sampling No. DateS1 Initial Sampling 15.09.2011S2 30.09.2011S3 15.10.2011S4 30.10.2011S5 15.11.2011S6 30.11.2011S7 15.12.2011S8 Final Sampling 30.12.2011
(a) Variations in different water quality parameters in the control (C) and treatment (T) tubs.
1. Air Tempereature (’C) Range: 28-31 ‘C (for both C&T) Mean: 29.88 (for both C&T)
Tub No S1 S2 S3 S4 S5 S6 S7 S8C1 29.0 31.0 31.0 28.0 32.0 31.0 29.0 28.0 C2 29.0 31.0 31.0 28.0 32.0 31.0 29.0 28.0T1 29.0 31.0 31.0 28.0 32.0 31.0 29.0 28.0 T2 29.0 31.0 31.0 28.0 32.0 31.0 29.0 28.0

2. Water Tempereature (’C) Range: 27-31 ‘C (for both C&T) Mean: 28.88 ‘C (for both C&T)
Tub No S1 S2 S3 S4 S5 S6 S7 S8C1 28.0 30.0 30.0 27.0 31.0 30.0 28.0 27.0C2 28.0 30.0 30.0 27.0 31.0 30.0 28.0 27.0T1 28.0 30.0 30.0 27.0 31.0 30.0 28.0 27.0T2 28.0 30.0 30.0 27.0 31.0 30.0 28.0 27.0
3. pH Range: 6.5-7.0 (for both C&T) Mean: 6.56 (for both C&T)
Tub No S1 S2 S3 S4 S5 S6 S7 S8C1 7.0 6.50 6.50 6.50 6.50 6.50 6.50 6.50C2 7.0 6.50 6.50 6.50 6.50 6.50 6.50 6.50T1 7.0 6.50 6.50 6.50 6.50 6.50 6.50 6.50T2 7.0 6.50 6.50 6.50 6.50 6.50 6.50 6.50
4. Dissolved Oxygen (mg/l) Range: 3.11-4.27 mg/l for Control with a Mean of 4.37 mg/l Range: 2.19-4.47 mg/l for Treatment with a Mean of 4.55 mg/l
Tub No S1 S2 S3 S4 S5 S6 S7 S8C1 4.15 3.17 3.41 4.16 3.51 3.19 3.22 3.78C2 4.27 3.41 3.52 3.11 3.61 3.52 3.82 3.56T1 4.35 3.71 3.16 3.21 4.12 3.62 3.55 3.42T2 4.47 3.26 3.51 2.19 3.58 3.76 3.64 3.27
5. Free Carbon dioxide (mg/l) Range: 2.71-4.60 mg/l for Control with a Mean of 3.75 mg/l Range: 2.75-4.70 mg/l for Treatment with a Mean of 3.11 mg/l
Tub No S1 S2 S3 S4 S5 S6 S7 S8C1 3.52 4.35 3.52 3.92 4.26 3.79 4.25 3.45C2 2.71 4.60 3.40 3.46 3.50 3.18 3.41 3.68T1 2.87 4.50 4.10 3.71 4.37 3.90 3.85 3.72T2 2.75 4.70 3.70 3.23 4.46 4.40 3.48 3.89
6. Alkalinity (mg/l) Range: 65-85 mg/l for Control with a Mean of 75.38 mg/l Range: 69-90 mg/l for Treatment with a Mean of 77.44 mg/l
Tub No S1 S2 S3 S4 S5 S6 S7 S8C1 80 85 82 75 80 69 65 68C2 85 80 75 79 79 72 67 65T1 79 90 80 76 69 80 72 72T2 82 86 85 74 70 75 71 78
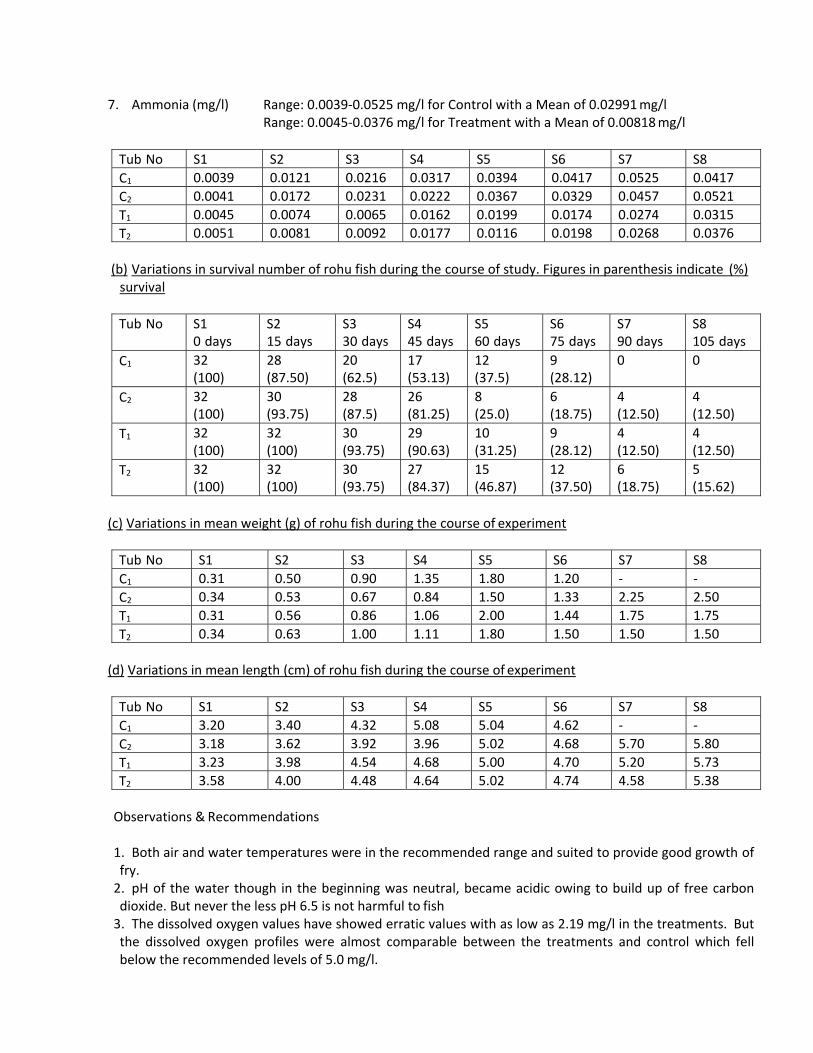
7. Ammonia (mg/l) Range: 0.0039-0.0525 mg/l for Control with a Mean of 0.02991 mg/l Range: 0.0045-0.0376 mg/l for Treatment with a Mean of 0.00818 mg/l
Tub No S1 S2 S3 S4 S5 S6 S7 S8C1 0.0039 0.0121 0.0216 0.0317 0.0394 0.0417 0.0525 0.0417C2 0.0041 0.0172 0.0231 0.0222 0.0367 0.0329 0.0457 0.0521T1 0.0045 0.0074 0.0065 0.0162 0.0199 0.0174 0.0274 0.0315T2 0.0051 0.0081 0.0092 0.0177 0.0116 0.0198 0.0268 0.0376
(b) Variations in survival number of rohu fish during the course of study. Figures in parenthesis indicate (%) survival
Tub No S1
0 days S2 15 days
S3 30 days
S4 45 days
S5 60 days
S6 75 days
S7 90 days
S8 105 days
C1 32 (100)
28 (87.50)
20 (62.5)
17 (53.13)
12 (37.5)
9 (28.12)
0 0
C2 32 (100)
30 (93.75)
28 (87.5)
26 (81.25)
8 (25.0)
6 (18.75)
4 (12.50)
4 (12.50)
T1 32 (100)
32 (100)
30 (93.75)
29 (90.63)
10 (31.25)
9 (28.12)
4 (12.50)
4 (12.50)
T2 32 (100)
32 (100)
30 (93.75)
27 (84.37)
15 (46.87)
12 (37.50)
6 (18.75)
5 (15.62)
(c) Variations in mean weight (g) of rohu fish during the course of experiment
Tub No S1 S2 S3 S4 S5 S6 S7 S8C1 0.31 0.50 0.90 1.35 1.80 1.20 - -C2 0.34 0.53 0.67 0.84 1.50 1.33 2.25 2.50T1 0.31 0.56 0.86 1.06 2.00 1.44 1.75 1.75T2 0.34 0.63 1.00 1.11 1.80 1.50 1.50 1.50
(d) Variations in mean length (cm) of rohu fish during the course of experiment
Tub No S1 S2 S3 S4 S5 S6 S7 S8C1 3.20 3.40 4.32 5.08 5.04 4.62 - -C2 3.18 3.62 3.92 3.96 5.02 4.68 5.70 5.80T1 3.23 3.98 4.54 4.68 5.00 4.70 5.20 5.73T2 3.58 4.00 4.48 4.64 5.02 4.74 4.58 5.38
Observations & Recommendations
1. Both air and water temperatures were in the recommended range and suited to provide good growth of fry.
2. pH of the water though in the beginning was neutral, became acidic owing to build up of free carbon dioxide. But never the less pH 6.5 is not harmful to fish
3. The dissolved oxygen values have showed erratic values with as low as 2.19 mg/l in the treatments. But the dissolved oxygen profiles were almost comparable between the treatments and control which fell below the recommended levels of 5.0 mg/l.

4. Alkalinity values were almost comparable between the treatments and control and were well above 50 mg/l.
5. The application of start smart has helped in the reduction of Ammonia levels in the treatment ponds as against to control ponds.
6. The survival of rohu was better initially up to 45 days of rearing and there after resulted in sudden drop in the number survived, almost reaching below 50% survival at 60 days of rearing.
7. The survival was 12 to 15% in the treatments at the end of experiment, while resulted in 100% mortality in one of the control tubs.
8. The start smart was applied in the first month @ 3 ounces/once each week, in second month @ 2 ounces/ once each week and in third month @ 1 ounce/ once each week. Probably this dosage pattern would have affected the survival of rohu. There is a gradual build up of ammonia levels from 45 days onwards which affected the survival and also partially due to reduced oxygen levels.
9. The better survival up to 45 days indicate significantly efficacy of start smart at that recommended dose of 3 ounces/once each week. But reduction in start smart doses to 2 ounces and 1 ounce in the subsequent months were in sufficient to handle the proportionate buildup of ammonia, which might have come in the way of survival of rohu.
10. Thus, it appears that an optimum dose of 3 ounces of start smart /once each week flat for the entire rearing period would be essential to balance the buildup of ammonia levels.
(A) Initial stock of fry before start of the experiment
Rohu fry – Sample from C1 Rohu fry – Sample from C2
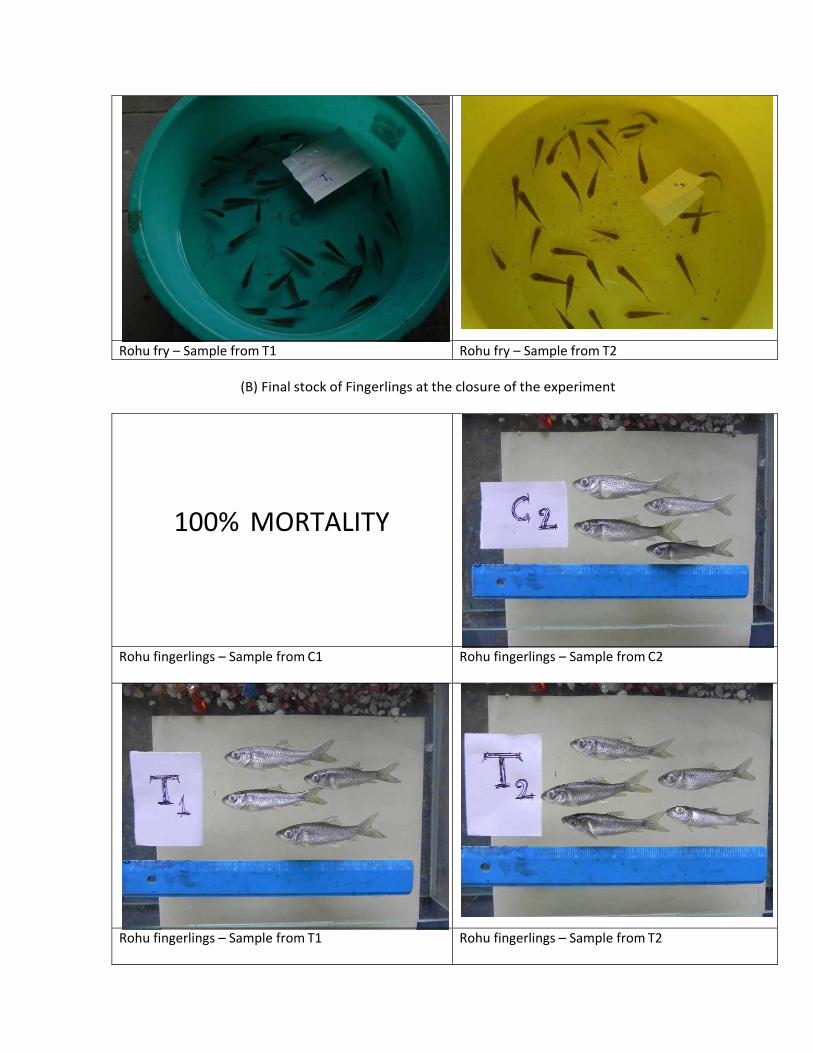
Rohu fry – Sample from T1 Rohu fry – Sample from T2
(B) Final stock of Fingerlings at the closure of the experiment
100% MORTALITY
Rohu fingerlings – Sample from C1 Rohu fingerlings – Sample from C2
Rohu fingerlings – Sample from T1 Rohu fingerlings – Sample from T2

Stage 2 (outdoor experiment)
(a) Fortnightly variations in water quality parameters in the control (C) and treatment (T) ponds.
(I) Date of sampling: 03.06.2012
Pond Air Temperature (°c)
Water Temperature (°c)
pH DO (mg/l)
Alkalinity (mg/l)
CO2 (mg/l)
Ammonia (mg/l)
C1 33.0 31.8 8.74 6.62 76 2.50 0.0052C2 33.0 31.5 8.34 5.04 73 3.34 0.0086T1 33.0 30.8 8.70 7.20 75 0.83 0.0052T2 33.0 31.5 8.29 6.70 71 1.67 0.0069
(II) Date of sampling: 18.06.2012
Pond Air Temperature (°c)
Water Temperature (°c)
pH DO (mg/l)
Alkalinity (mg/l)
CO2 (mg/l)
Ammonia (mg/l)
C1 26.5 26.3 8.58 6.91 72 1.67 0.0077C2 26.5 26.2 8.17 6.95 69 1.67 0.0060T1 26.5 26.2 7.91 5.96 67 3.34 0.0043T2 26.5 26.1 7.79 6.35 64 2.51 0.0052
(III) Date of sampling: 02.07.2012
Parameters Air Temperature (°c)
Water Temperature (°c)
pH DO (mg/l)
Alkalinity (mg/l)
CO2 (mg/l)
Ammonia (mg/l)
C1 26.5 26.0 8.01 6.52 60 5.01 0.0086C2 26.5 25.9 7.92 6.56 55 5.01 0.0052T1 26.5 25.6 7.86 7.30 51 3.34 0.0060T2 26.5 25.9 7.91 7.16 55 4.18 0.0034
(IV) Date of sampling: 18.07.2012
Pond Air Temperature (°c)
Water Temperature (°c)
pH DO (mg/l)
Alkalinity (mg/l)
CO2 (mg/l)
Ammonia (mg/l)
C1 30.0 29.3 9.34 6.95 45 1.67 0.0060C2 30.0 29.5 8.91 6.90 43 1.67 0.0052T1 30.0 29.0 8.14 5.65 53 3.34 0.0034T2 30.0 30.0 8.64 6.40 55 2.51 0.0052

(V) Date of sampling: 02.08.2012
Pond Air Temperature (°c)
Water Temperature (°c)
pH DO (mg/l)
Alkalinity (mg/l)
CO2 (mg/l)
Ammonia (mg/l)
C1 31.0 29.1 8.54 7.63 58 0.84 0.0078C2 31.0 29.4 8.44 7.20 56 0.84 0.0043T1 31.0 28.5 8.08 6.12 53 1.67 0.0043T2 31.0 29.0 8.88 7.06 62 0.84 0.0034
(VI) Date of sampling: 18.08.2012
Pond Air Temperature (°c)
Water Temperature (°c)
pH DO (mg/l)
Alkalinity (mg/l)
CO2 (mg/l)
Ammonia (mg/l)
C1 26.2 25.8 8.96 6.80 58 0.84 0.0069C2 26.2 26.0 8.69 6.56 55 1.67 0.0052T1 26.2 26.2 8.58 6.38 54 2.51 0.0052T2 26.2 26.0 8.62 6.40 54 2.51 0.0043
(VII) Date of sampling: 05.09.2012
Pond Air Temperature (°c)
Water Temperature (°c)
pH DO (mg/l)
Alkalinity (mg/l)
CO2 (mg/l)
Ammonia (mg/l)
C1 28.5 27.8 8.40 7.14 57 2.51 0.0060C2 28.5 27.8 7.87 6.84 52 3.34 0.0034T1 28.5 27.6 8.16 7.59 56 1.67 0.0052T2 28.5 27.6 7.48 6.42 54 3.34 0.0043
(b) Survival and Growth after 3 months rearing
Pond No. of fishes survived
%survival
% Mean Survival
% increase in survival over
control
Biomass (g) Mean Biomass (g)
% mean increase in
biomass overcontrol
C1 65 81.25 73.75 8.75 262.40 243.59 14.30C2 53 66.25 224.79T1 75 93.75 82.50 293.55 278.44 T2 57 71.25 263.34

Observations and Recommendations
a) The experiments were conducted for a period of 90 days in outdoor cement ponds b) Uniform sized common carp (Cyprinus carpio) fry with mean weight of 0.05g were employed for
experiments. c) All the water quality parameters were well within the recommended values with dissolved oxygen
found well above 5.0 mg/l. d) Careful planning of dosages of start smart application has resulted in balancing the dissolved free
Carbon dioxide above 2.0 mg/l (with a few exceptions) which is essential for sustenance of primary productivity to maintain the food web.
e) Fishes in start smart treated ponds exhibited more uniform growth as against to control ponds. f) Start smart treated ponds (treatment) registered a high survival as against to control ponds with a
mean increase of 8.75%. g) Similarly, start smart treated ponds registered a high biomass production as against to control
ponds with a high mean increase in biomass of 14.30%.


Phase 3: Grow-out farming of carps
Stage 1 (up to 180 days rearing)
(a) Fortnightly variations in water quality parameters in the control (C) and treatment (T) ponds.
(I) Date of sampling: 17.10.2012
Pond Air Temperature (°c)
Water Temperature (°c)
pH DO (mg/l)
Alkalinity (mg/l)
CO2 (mg/l)
Ammonia (mg/l)
C1 32.5 31.8 8.98 6.39 68 2.50 0.0086C2 32.5 31.7 8.87 6.58 35 1.67 0.0069T1 32.5 31.7 8.46 6.41 54 2.50 0.0078T2 32.5 31.6 8.76 6.70 58 1.67 0.0069
(II) Date of sampling: 30.10.2012
Pond Air Temperature (°c)
Water Temperature (°c)
pH DO (mg/l)
Alkalinity (mg/l)
CO2 (mg/l)
Ammonia (mg/l)
C1 32.8 31.5 8.34 6.86 62 1.67 0.0060C2 32.8 31.6 8.66 6.78 58 1.67 0.0052T1 32.8 31.8 8.75 6.25 60 2.50 0.0069T2 32.8 31.6 8.18 6.91 56 1.67 0.0060

(III) Date of sampling: 13.11.2012
Parameters Air Temperature (°c)
Water Temperature (°c)
pH DO (mg/l)
Alkalinity (mg/l)
CO2 (mg/l)
Ammonia (mg/l)
C1 32.5 30.7 8.97 7.47 58 0.83 0.0069C2 32.5 30.7 8.72 6.58 55 1.67 0.0052T1 32.5 30.5 9.65 7.84 69 0.83 0.0052T2 32.5 30.6 9.41 7.56 66 0.83 0.0060
(IV) Date of sampling: 27.11.2012
Pond Air Temperature (°c)
Water Temperature (°c)
pH DO (mg/l)
Alkalinity (mg/l)
CO2 (mg/l)
Ammonia (mg/l)
C1 31.0 29.6 8.64 7.27 61 0.84 0.0078C2 31.0 29.4 8.58 7.15 58 0.84 0.0060T1 31.0 29.6 8.26 6.36 53 1.60 0.0078T2 31.0 29.6 8.49 7.01 56 0.84 0.0052
(V) Date of sampling: 11.12.2012
Pond Air Temperature (°c)
Water Temperature (°c)
pH DO (mg/l)
Alkalinity (mg/l)
CO2 (mg/l)
Ammonia (mg/l)
C1 28 27.6 9.01 7.62 49 0.1672 0.0095C2 28 27.4 9.12 7.54 51 0.1672 0.0103T1 28 27.4 8.70 7.91 52 0.1672 0.0069T2 28 27.8 8.85 7.43 52 0.1672 0.0086
(VI) Date of sampling: 27.12.2012
Pond Air Temperature (°c)
Water Temperature (°c)
pH DO (mg/l)
Alkalinity (mg/l)
CO2 (mg/l)
Ammonia (mg/l)
C1 27 26.3 8.00 7.05 54 0.1672 0.0077C2 27 26.0 7.86 6.34 57 0.3344 0.0155T1 27 26.4 8.14 7.35 51 0.1672 0.0129T2 27 26.6 7.73 7.59 55 0.1672 0.0095

(VII) Date of sampling: 11.01.2013
Parameters Air Temperature (°c)
Water Temperature (°c)
pH DO (mg/l)
Alkalinity (mg/l)
CO2 (mg/l)
Ammonia (mg/l)
C1 28.5 27.6 9.32 8.43 62 nil 0.0086C2 28.5 27.3 9.18 8.70 55 nil 0.0112T1 28.5 27.9 9.89 9.38 56 nil 0.0043T2 28.5 27.9 9.53 10.59 59 nil 0.0060
(VIII) Date of sampling: 28.01.2013
Pond Air Temperature (°c)
Water Temperature (°c)
pH DO (mg/l)
Alkalinity (mg/l)
CO2 (mg/l)
Ammonia (mg/l)
C1 27.6 26.8 8.13 7.03 56 0.1672 0.0077C2 27.6 26.4 7.89 6.83 53 0.3344 0.0095T1 27.6 26.6 8.45 6.78 59 0.3344 0.0069T2 27.6 26.5 7.68 6.34 51 0.3344 0.0043
(IX) Date of sampling: 14.02.2013
Pond Air Temperature (°c)
Water Temperature (°c)
pH DO (mg/l)
Alkalinity (mg/l)
CO2 (mg/l)
Ammonia (mg/l)
C1 28.8 27.5 8.84 7.03 60 0.1672 0.0086C2 28.8 27.8 8.23 6.83 55 0.3344 0.0069T1 28.8 27.6 8.57 6.45 56 0.3344 0.0034T2 28.8 27.6 8.68 6.51 58 0.3344 0.0043
(X) Date of sampling: 01.03.2013
Pond Air Temperature (°c)
Water Temperature (°c)
pH DO (mg/l)
Alkalinity (mg/l)
CO2 (mg/l)
Ammonia (mg/l)
C1 28.4 27.8 8.75 7.12 59 0.1672 0.0095C2 28.4 27.6 8.59 6.95 56 0.3344 0.0077T1 28.4 27.6 8.41 6.56 53 0.5016 0.0043T2 28.4 27.8 8.52 6.42 55 0.5016 0.0060

(XI) Date of sampling: 15.03.2013
Pond Air Temperature (°c)
Water Temperature (°c)
pH DO (mg/l)
Alkalinity (mg/l)
CO2 (mg/l)
Ammonia (mg/l)
C1 27.6 27.2 7.81 7.50 48 0.1672 0.0112C2 27.6 26.8 8.62 7.68 54 0.1672 0.0095T1 27.6 27.0 8.48 6.78 52 0.3344 0.0034T2 27.6 27.2 8.34 6.65 50 0.3344 0.0043
(XII) Date of sampling: 30.03.2013
Pond Air Temperature (°c)
Water Temperature (°c)
pH DO (mg/l)
Alkalinity (mg/l)
CO2 (mg/l)
Ammonia (mg/l)
C1 30 29.5 7.81 6.72 56 0.3344 0.0121C2 30 29.2 8.62 7.12 62 0.1672 0.0086T1 30 29.5 8.48 6.45 50 0.5016 0.0034T2 30 29.7 8.34 6.83 58 0.3344 0.0060
(b) Mean Growth (g) after 180 days rearing
Pond 30.10.12 (30 days) 13.11.12 (45 days) 27.11.12 (60 days)C1 16.11 38.86 46.53C2 15.94 38.99 48.24T1 15.93 35.63 43.50T2 16.01 37.46 48.10
Pond 11.12.2012 (75 days)
27.12.2012 (90 days)
11.01.2013 (105 days)
28.01.2013 (120 days)
14.02.2013 (135 days)
C1 51.62 56.05 59.08 64.52 67.88 C2 52.11 56.73 62.04 67.18 71.42 T1 57.23 60.69 63.73 65.82 67.98 T2 60.51 67.66 70.12 73.74 75.52
Pond 01.03.2013 (150 days)
15.03.2013 (165 days)
30.03.2013 (180 days)
C1 69.62 70.44 77.93 C2 75.40 80.06 85.86 T1 69.37 70.56 79.03 T2 77.59 82.42 92.36

(c). Monthly Mean Growth Variations (g)
Pond 30 days 60 days 90 days 120 days 150 days 180 daysControl 16.02 47.38 56.39 65.85 72.51 81.89Treatment 15.97 45.80 64.17 69.78 73.48 85.69
2. Observations and Recommendations
h) All the water quality parameters were well within the recommended values with dissolved oxygen found well above 6.0 mg/l.
i) Carbon dioxide values were well above 0.33 ppm in most cases. j) The growth of fish in both the control and treatments were almost same up to 60 days of rearing,
but introduction of modified dosing of start smart showed marginal enhancement of growth in the treatment ponds.
Sample of fish from – C1 Sample of fish from - T1
Close-up view of fish from – C1 Close-up view of fish from – T1

Sample of fish from - C2 Sample of fish from - T2
Close-up view of fish from – C2 Close-up view of fish from – T2
Stage 2 (extended period up to 210 days)
(a) Fortnightly variations in water quality parameters in the control (C) and treatment (T) ponds.
(XIII) Date of sampling: 15/4/2013
Pond Air Temperature (°c)
Water Temperature (°c)
pH DO (mg/l)
Alkalinity (mg/l)
CO2 (mg/l)
Ammonia (mg/l)
C1 30 29.5 8.75 6.35 59 0.5016 0.0112C2 30 29.7 8.23 6.85 55 0.3344 0.0069T1 30 29.5 8.57 7.12 56 0.1672 0.0043T2 30 29.5 7.68 7.28 51 0.1672 0.0034

(XIV) Date of sampling: 30/4/2013
Pond Air Temperature (°c)
Water Temperature (°c)
pH DO (mg/l)
Alkalinity (mg/l)
CO2 (mg/l)
Ammonia (mg/l)
C1 30.2 29.6 8.10 6.38 51 0.3344 0.0121C2 30.2 29.4 8.41 6.58 56 0.3344 0.0077T1 30.2 29.8 8.52 7.29 57 0.1672 0.0060T2 30.2 29.6 8.34 7.10 55 0.1672 0.0034
(b) Mean Growth (g) after 195 and 210 days of continued rearing
Pond 15.04.2013 (195 days)
30.04.2013 (210 days)
C1 77.09 74.48 C2 75.78 84.21 T1 84.96 87.08 T2 108.57 109.35
(c). Monthly Mean Growth Variations (g)
Pond 195 days 210 daysControl 76.43 79.43Treatment 96.76 98.21
(d). Number survived and survival percent at the end of experiment
Treatment No of survivals % survival C1 16 88.88 C2 18 100.00 T1 16 88.88 T2 16 88.88

(e). Fish biomass yield in control (C) and treatment (T) ponds at the end of 210 days of growout experiment
Ponds Total Biomass (weight in g)
Mean Biomass (weight in g)
(%) increase in biomass over control
C1 1191.72 1353.75 14.82% C2 1515.79 T1 1359.38 1554.38 T2 1749.67
Observations and Recommendations
k) All the water quality parameters were well within the recommended values with dissolved oxygen found well above 6.0 mg/l.
l) The drop in carbon dioxide values were significant in start smart treated ponds may suggest some bacteria are either lowering or utilizing them as carbon source, thus warranting change/revision of the bacterial consortium in the formulations .
m) The mean growth of fish in the treatments was higher as compared to control at the end of 210 days of rearing with 88% survival.
n) The mean biomass in the treatment ponds was higher than the control ponds with an increase of 14.82% indicating that startsmart helped in enhancing the production.
Sample of fish from – C1 Sample of fish from - T1
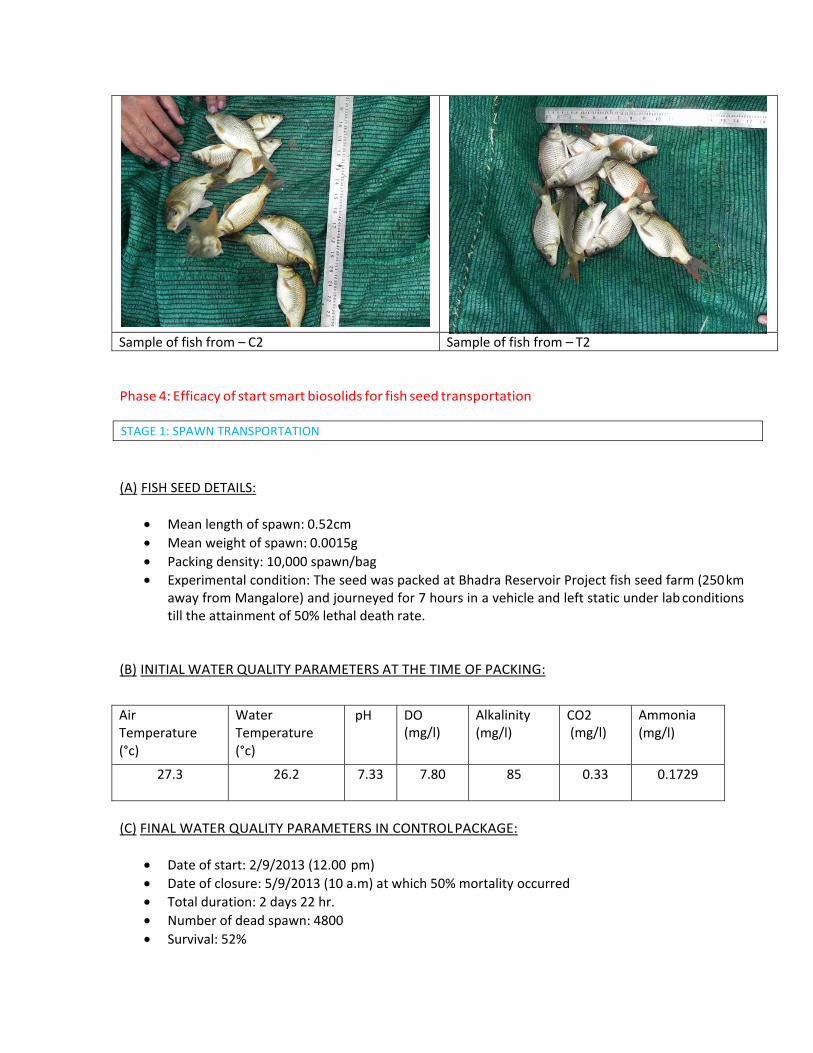
Sample of fish from – C2 Sample of fish from – T2
Phase 4: Efficacy of start smart biosolids for fish seed transportation
(A) FISH SEED DETAILS:
• Mean length of spawn: 0.52cm • Mean weight of spawn: 0.0015g • Packing density: 10,000 spawn/bag • Experimental condition: The seed was packed at Bhadra Reservoir Project fish seed farm (250 km
away from Mangalore) and journeyed for 7 hours in a vehicle and left static under lab conditions till the attainment of 50% lethal death rate.
(B) INITIAL WATER QUALITY PARAMETERS AT THE TIME OF PACKING:
Air Temperature (°c)
Water Temperature (°c)
pH DO (mg/l)
Alkalinity (mg/l)
CO2 (mg/l)
Ammonia (mg/l)
27.3 26.2 7.33 7.80 85 0.33 0.1729
(C) FINAL WATER QUALITY PARAMETERS IN CONTROL PACKAGE:
• Date of start: 2/9/2013 (12.00 pm) • Date of closure: 5/9/2013 (10 a.m) at which 50% mortality occurred • Total duration: 2 days 22 hr. • Number of dead spawn: 4800 • Survival: 52%
STAGE 1: SPAWN TRANSPORTATION
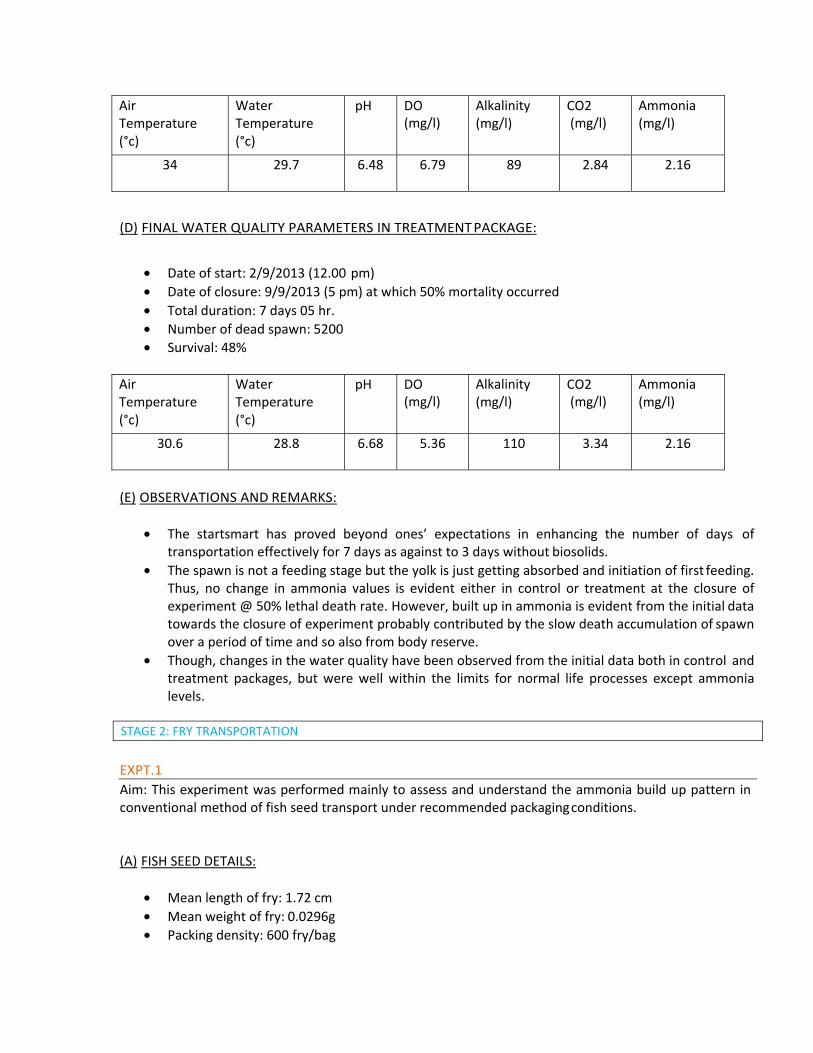
Air Temperature (°c)
Water Temperature (°c)
pH DO (mg/l)
Alkalinity (mg/l)
CO2 (mg/l)
Ammonia (mg/l)
34 29.7 6.48 6.79 89 2.84 2.16
(D) FINAL WATER QUALITY PARAMETERS IN TREATMENT PACKAGE:
• Date of start: 2/9/2013 (12.00 pm) • Date of closure: 9/9/2013 (5 pm) at which 50% mortality occurred • Total duration: 7 days 05 hr. • Number of dead spawn: 5200 • Survival: 48%
Air Temperature (°c)
Water Temperature (°c)
pH DO (mg/l)
Alkalinity (mg/l)
CO2 (mg/l)
Ammonia (mg/l)
30.6 28.8 6.68 5.36 110 3.34 2.16
(E) OBSERVATIONS AND REMARKS:
• The startsmart has proved beyond ones’ expectations in enhancing the number of days of transportation effectively for 7 days as against to 3 days without biosolids.
• The spawn is not a feeding stage but the yolk is just getting absorbed and initiation of first feeding. Thus, no change in ammonia values is evident either in control or treatment at the closure of experiment @ 50% lethal death rate. However, built up in ammonia is evident from the initial data towards the closure of experiment probably contributed by the slow death accumulation of spawn over a period of time and so also from body reserve.
• Though, changes in the water quality have been observed from the initial data both in control and treatment packages, but were well within the limits for normal life processes except ammonia levels.
EXPT.1
Aim: This experiment was performed mainly to assess and understand the ammonia build up pattern in conventional method of fish seed transport under recommended packaging conditions.
(A) FISH SEED DETAILS:
• Mean length of fry: 1.72 cm • Mean weight of fry: 0.0296g • Packing density: 600 fry/bag
STAGE 2: FRY TRANSPORTATION

(B) EXPERIMENT DETAILS:
• Experimental condition: Static, under lab conditions • Date of start: 19/08/2013 (10.30 pm) • Date of closure: 20/08/2013 (6.30 am) at which 50% mortality occurred • Total duration: 8 hr. • Number of dead fry: 316 • Survival: 47.33%
(C) INITIAL WATER QUALITY PARAMETERS AT THE TIME OF PACKING:
Air Temperature (°c)
Water Temperature (°c)
pH DO (mg/l)
Alkalinity (mg/l)
CO2 (mg/l)
Ammonia (mg/l)
28.0 26.0 7.97 7.80 35 0.0114 0.095
(D) FINAL WATER QUALITY PARAMETERS AT THE END OF EXPERIMENT:
Air Temperature (°c)
Water Temperature (°c)
pH DO (mg/l)
Alkalinity (mg/l)
CO2 (mg/l)
Ammonia (mg/l)
26.5 26.0 6.25 4.39 45 0.0342 1.48
(E) OBSERVATIONS AND REMARKS:
• This experiment has demonstrated high increase in ammonia to the tune of 1.385 mg/l and a drastic fall in dissolved oxygen by 3.41 mg/l within a span of 8 hours.
• The carbon dioxide and alkalinity values showed increasing trend while pH decreased due to carbon dioxide build up.
• The 50% lethal death time was found to be 8 hours for fry stages under static lab conditions.
EXPT.2
Aim: This experiment was performed to assess the water quality changes if any brought about by the introduction of startsmart biosolids in a span of 8 hours (based on the feedback of Expt.1) and 24 hours.
(A) FISH SEED DETAILS:
• Mean length of fry: 1.72 cm • Mean weight of fry: 0.0296g • Packing density: 600 fry/bag • Experimental condition: Static, under lab conditions

(B) INITIAL WATER QUALITY PARAMETERS AT THE TIME OF PACKING:
Air Temperature (°c)
Water Temperature (°c)
pH DO (mg/l)
Alkalinity (mg/l)
CO2 (mg/l)
Ammonia (mg/l)
28.0 27.1 6.80 7.74 51 0.0114 0.0432
(C) FINAL CHANGESS IN WATER QUALITY PARAMETERS AT 8TH HOUR:
• Date of start: 20/8/2013 (10.00 pm) • Date of closure: 21/8/2013 (6.00 am) • Total duration: 8 hr. • Number of dead spawn: No visible mortality evident • Survival: 100 %
Air Temperature (°c)
Water Temperature (°c)
pH DO (mg/l)
Alkalinity (mg/l)
CO2 (mg/l)
Ammonia (mg/l)
26.5 29.9 6.32 3.89 83 0.0532 2.16
(D) FINAL CHANGESS IN WATER QUALITY PARAMETERS AT 24TH HOUR:
• Date of start: 20/8/2013 (10.00 pm) • Date of closure: 21/8/2013 (10.00 pm) • Total duration: 24 hr. • Number of dead spawn: No visible mortality evident • Survival: 100 %
Air Temperature (°c)
Water Temperature (°c)
pH DO (mg/l)
Alkalinity (mg/l)
CO2 (mg/l)
Ammonia (mg/l)
25.5 26.4 6.34 3.65 90 0.076 2.16
(E) OBSERVATIONS AND REMARKS:
• The increase in alkalinity, carbon dioxide and ammonia were evident both at 8th and 24th hour • Ammonia values increased and registered stable values of 2.16 mg/l both at 8th and 24th hour • Notably drastic decrease in dissolved oxygen values to the tune of 3.85 mg/l and 4.09 mg/l were
evident respectively at 8th and 24th hour • This 50% loss of dissolved oxygen occurred at 8th hour and did not decrease further at 24th hour
indicating almost stable dissolved oxygen values • This drastic decrease in dissolved oxygen appears to be a normal feature, is also evident even
without introduction of startsmart biosolids (vide, Expt. 1), indicating no role of biosolids in depleting the dissolved oxygen values.

EXPT.3
Aim: This experiment was performed to assess the effect of startsmart biosolids till on to attainment of total death and its associated changes in water quality.
(A) FISH SEED DETAILS:
• Mean length of fry: 1.72 cm • Mean weight of fry: 0.0296g • Packing density: 600 fry/bag
(B) EXPERIMENT DETAILS:
• Experimental condition: The seed was packed at Bhadra Reservoir Project fish seed farm (250 km away from Mangalore) and journeyed for 7 hours in a vehicle and left static under lab conditions till the attainment of 50% lethal death rate.
• Date of start: 20/08/2013 (10.00 pm) • Date of closure: 23/08/2013 (9.00 am) at which 100% mortality occurred • Total duration: 2 days 11 hr. • Number of dead spawn: 580 • Survival: 3.33% (about 20 fry were found living)
(C) INITIAL WATER QUALITY PARAMETERS AT THE TIME OF PACKING:
Air Temperature (°c)
Water Temperature (°c)
pH DO (mg/l)
Alkalinity (mg/l)
CO2 (mg/l)
Ammonia (mg/l)
28.0 27.1 6.80 7.74 51 0.0114 0.0432
(D) FINAL WATER QUALITY PARAMETERS AT TOTAL DEATH TIME:
Air Temperature (°c)
Water Temperature (°c)
pH DO (mg/l)
Alkalinity (mg/l)
CO2 (mg/l)
Ammonia (mg/l)
30.5 28.0 6.80 0.09 500 21.73 2.16
(E) OBSERVATIONS AND REMARKS:
• This experiment has clearly demonstrated the pattern of water quality changes towards the approach of death point.
• The mortality of fish seed appears to be brought about by stress due to drop in dissolved oxygen levels and buildup of carbon dioxide levels.
• The startsmart biosolids appear to withhold concomitant rise in carbon dioxide and its associated changes on pH, thus acting as a strong buffering agent until up to the approach of death point.
• The stable pH registered in all the cases provide evidence of efficacy of startsmart biosolids in preventing death due to pH changes

(A) FISH SEED DETAILS:
• Mean length of fingerlings: 6.30 cm • Mean weight of fingerlings: 2.13 g • Packing density: 250 fingerlings/bag • Experimental condition: Static under lab conditions till the attainment of 50% lethal death rate.
(B) INITIAL WATER QUALITY PARAMETERS AT THE TIME OF PACKING:
Air Temperature (°c)
Water Temperature (°c)
pH DO (mg/l)
Alkalinity (mg/l)
CO2 (mg/l)
Ammonia (mg/l)
32 28.2 6.73 7.11 59 0.352 0.010374
(C) FINAL WATER QUALITY PARAMETERS IN CONTROL PACKAGE:
• Date of start: 14.11.2013 (3.30 P.M) • Date of closure: 15.11.2013 (9.00 A.M) at which 50% mortality occurred • Total duration: 5.00 hr. 30 min. • Number of dead fingerlings: 162 • Survival: 64.80%
Air Temperature (°c)
Water Temperature (°c)
pH DO (mg/l)
Alkalinity (mg/l)
CO2 (mg/l)
Ammonia (mg/l)
29.5 27.6 6.50 1.97 200 8.8 0.212667
(D) FINAL WATER QUALITY PARAMETERS IN TREATMENT PACKAGE:
• Date of start: 14.11.2013 (3.30 P.M) • Date of closure: 16.11.2013 (6.00 A.M) at which 50% mortality occurred • Total duration: 1 day, 14.00 hr. 30 min. • Number of dead fingerlings: 147 • Survival: 58.80%
STAGE 3: FINGERLING TRANSPORTATION

Air Temperature (°c)
Water Temperature (°c)
pH DO (mg/l)
Alkalinity (mg/l)
CO2 (mg/l)
Ammonia (mg/l)
27.5 26.3 6.91 0.28 240 22 0.216125
(E) OBSERVATIONS AND REMARKS:
• This experiment has clearly demonstrated the efficacy of startsmart biosolids in extending the transportation duration of fingerlings.
• The death of fingerlings occurred owing to drastic fall of DO and buildup of carbon dioxide • As demonstrated in other expts. here also startsmart was effective in preventing pH changes of
the water.
Please refer to Phase 3 experiments for fish seed details and the initial water quality parameters at the start of experiment. In this experiment no medical oxygen was provided for packing but the atmospheric air held in the bag was packed along with introduction of startsmart biosolids.
• Date of start: 14.11.2013 (3.30 P.M) • Date of closure: 15.11.2013 (10.00 P.M) at which 50% mortality occurred • Total duration: 6.00 hr. 30 min. • Number of dead fingerlings: 97 • Survival: 61.20%
FINAL WATER QUALITY PARAMETERS
Air Temperature (°c)
Water Temperature (°c)
pH DO (mg/l)
Alkalinity (mg/l)
CO2 (mg/l)
Ammonia (mg/l)
25.5 27.5 6.84 0.34 180 19.36 0.216125OBSERVATIONS AND REMARKS:
• The startsmart again proved its efficiency with a transport duration of 6 ½ hours without medical oxygen with a high survival of fingerlings. This cuts down the expenditure on medical oxygen. But prove to be highly worthy where no oxygen is available in remote places. • The results are comparable with the results of Phase 3 item (C) with an edge of superiority over the duration of transportation.
CONCLUDING REMARKS ON FISH SEED TRANSPORT
• Startsmart is the right product in this direction and has clearly demonstrated its efficacy in extending the duration of transport beyond expectations.
• Possible reasons that could be delineated are o Preventing pH changes in spite of carbon dioxide built up, possibly acting as a buffer? o Enhancing biogenic capacity of the fish to tolerate stress in spite of ammonia build up in
the packages.
STAGE 4. EXPERIMENTS WITH STARTSMART + ATMOSPHERIC AIR PACKAGED BAG WITH ROHU FINGERLINGS

o The nitrite produced due to ammonia degradation competes with the oxygen uptake by the fish leading to formation of methamoglobin in the blood. The slow accumulation of this methamoglobin appears to be a causative factor in fish seed mortality. The intervention by startsmart biosolids appears to enhance the biogenic capacity (immunity) of fish there by providing relief from the stress.
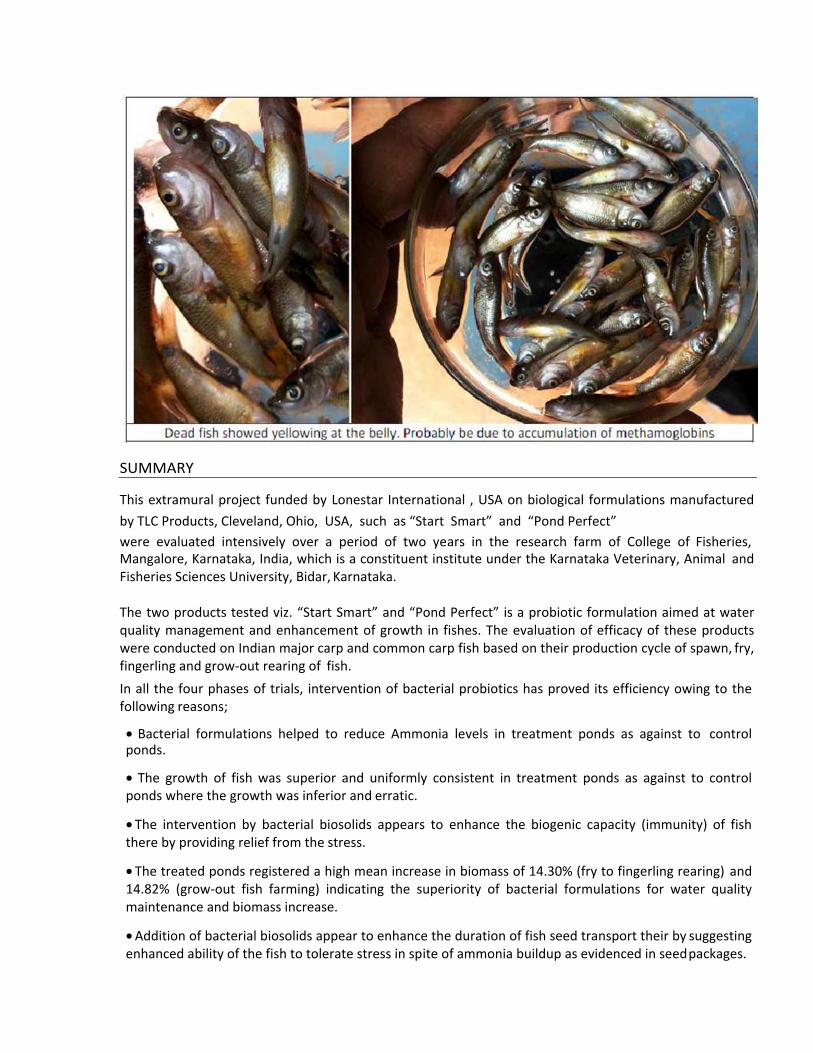
SUMMARY
This extramural project funded by Lonestar International , USA on biological formulations manufactured by TLC Products, Cleveland, Ohio, USA, such as “Start Smart” and “Pond Perfect” were evaluated intensively over a period of two years in the research farm of College of Fisheries, Mangalore, Karnataka, India, which is a constituent institute under the Karnataka Veterinary, Animal and Fisheries Sciences University, Bidar, Karnataka.
The two products tested viz. “Start Smart” and “Pond Perfect” is a probiotic formulation aimed at water quality management and enhancement of growth in fishes. The evaluation of efficacy of these products were conducted on Indian major carp and common carp fish based on their production cycle of spawn, fry, fingerling and grow-out rearing of fish. In all the four phases of trials, intervention of bacterial probiotics has proved its efficiency owing to the following reasons;
• Bacterial formulations helped to reduce Ammonia levels in treatment ponds as against to control ponds.
• The growth of fish was superior and uniformly consistent in treatment ponds as against to control ponds where the growth was inferior and erratic.
• The intervention by bacterial biosolids appears to enhance the biogenic capacity (immunity) of fish there by providing relief from the stress.
• The treated ponds registered a high mean increase in biomass of 14.30% (fry to fingerling rearing) and 14.82% (grow-out fish farming) indicating the superiority of bacterial formulations for water quality maintenance and biomass increase.
• Addition of bacterial biosolids appear to enhance the duration of fish seed transport their by suggesting enhanced ability of the fish to tolerate stress in spite of ammonia buildup as evidenced in seed packages.

OVERALL IMPACT OF THE STUDIES
The products formulated are probiotic in nature where a consortium of bacteria aimed at specific functions are employed. The products evaluated appear to have a wider application in aquaculture where ammonia management and the stress induced by ammonia becomes a crucial part. Further studies are required to understand the possible enhancement of biogenic capacity and the pattern of immunity modulation to overcome the stress experienced in high density rearing and packing of fish seed.
INFRASTRUCTURE AND FACILITIES CREATED UNDER THE PROJECT
The following equipment/ facilities have been added to the department under the project.
• Multiparameter pH analyser – 1 No. • Data documentation computer – 1 set. • Mini UPS instruments – 1 No.
BUDGET
Manpower contractuals
Designation and number of persons Monthly Emoluments(in Rupees)
Total (in Rupees)
Junior Research Fellow- 1 No. 8,000 (x 12 months) 96,000Fishery Field man - 1 No. 4,000 (x 12 months) 48,000
Total 1,44,000
Item wise break up of fund utilization
Item Total (in Rupees)A. Recurring
Manpower 1,44,000 Contingency 86,000
B. Non Recurring Multiparameter pH analyzer – 1 No
Data documentation computer – 1No Ups for small equipments – 1 No
90,000
Total (A+B) 3,20,000
C. Institutional Charges (20%) 80,000 GrandTotal 4,00,000
PRINCIPAL INVESTIGATOR Dr. E.G. JAYARAJ
Professor of Aquaculture Department of Aquaculture
College of Fisheries, KVAFS University Mangalore-575002 Karnataka, India