Embed Size (px)
Citation preview
Rochester Institute of TechnologyRIT Scholar Works
Theses Thesis/Dissertation Collections
1975
Evaluation and Testing of Color StrengthMeasuring Methods in the Graphic ArtsBarry Sullivan
Donald Wilkalis
Follow this and additional works at: http://scholarworks.rit.edu/theses
This Thesis is brought to you for free and open access by the Thesis/Dissertation Collections at RIT Scholar Works. It has been accepted for inclusionin Theses by an authorized administrator of RIT Scholar Works. For more information, please contact [email protected].
Recommended CitationSullivan, Barry and Wilkalis, Donald, "Evaluation and Testing of Color Strength Measuring Methods in the Graphic Arts" (1975).Thesis. Rochester Institute of Technology. Accessed from
EVALUATION AND TESTING OF COLOR STRENGTH
MEASURING METHODS IN THE GRAPHIC ARTS
by
Barry Sullivan
Donald Wilkalis
A thesis submitted in partial fulfillment of the
requirements for the degree of Bachelor of Science
in the School of Photographic Arts and Sciences in
the College of Graphic Arts and Photography of the
Rochester Institute of Technology
June, 1975
Thesis Advisor: Mr. Chester Daniels
yx-b\y
ACKNOWLEDGEMENTS
The following individuals and organizations
contributed greatly to our project. Without their
help this paper would not have been possible and we
thank them immensely. Special note is given here to
the Central Intelligence Agency from whom we were
given a grant at the completion of this project.
Mohamed Abouelata
Robert Bayley
George Beard
Chester Daniels
Milton Pearson
Irving Pobboravsky
Gerhard Schumann
Kathryn Wilkalis
Ron Ink Company
Central Intelligence Agency
11
TABLE OF CONTENTS
List of Tables iv
List of Figures v
Abstract vi
Introduction 1
Experimental 6
Ink Selection 6
IGT Printability Tester Method 6
Hand Roller Method 7
Comparison of Inking Methods 8
Ink-Film Thickness Sample Production 8
Colorimetric Data 9
Burn Test Sample Production . 11
Estimate of Error In Ink-Films 11
Data Reduction 12
Conclusions 14
Results 14
Discussion 16
Recommendations For Future Work 26
References 28
m
LIST OF TABLES
Table One: Experimental Ink Samples 29
Table Two: Pair Comparison Test 30
Table Three: Ink-Film Thickness 31
Table Four: Colorimetric Data 33
Table Five: Uniform Chromaticity Scale Data 35
iv
LIST OF FIGURES
Figure 1
Figure 2
Figure 3
Figure 4
Figure 5
Figure 6
Figure 7
Figure 8
Figure 9
Figure 10
Figure 11
Figure 12
Figure 13
Figure 14:
Figure 15:
Figure 16:
Figure 17:
Figure 18:
Figure 19:
Figure 20:
Figure 21:
Figure 22:
Standard CLE. Diagram Cyan Ink # 1
Standard C.I.E. Diagram Cyan Ink # 6
Standard C.I.E. Diagram Magenta Ink # 7
Standard C.I.E. Diagram Magenta Ink # 8
Standard C.I.E. Diagram Yellow Ink # 9
Standard C.I.E. Diagram Yellow Ink # 10
Standard U.C.S. Diagram Cyan Ink # 1
Standard U.C.S. Diagram Cyan Ink # 6
Standard U.C.S. Diagram Magenta Ink # 7
Standard U.C.S. Diagram Magenta Ink # 8
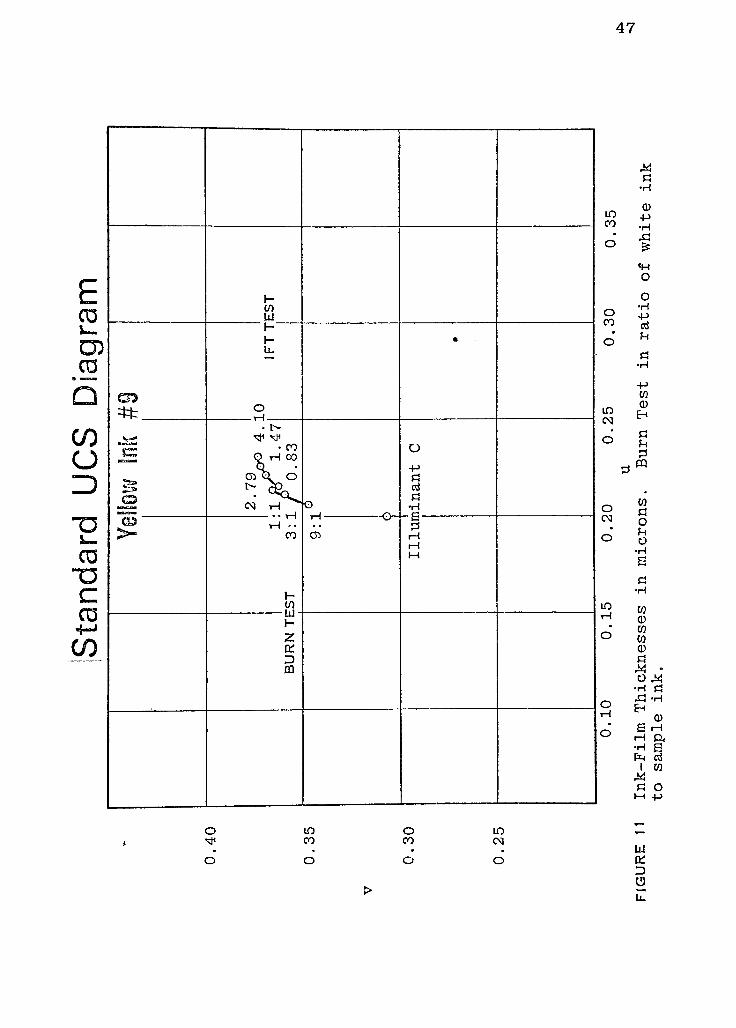
Standard U.C.S. Diagram Yellow Ink # 9
Standard U.C.S. Diagram Yellow Ink # 10
Visual Comparison Specific Gravity vs.
Color Strength
37
38
39
40
41
42
43
44
45
46
47
48
49
50
51
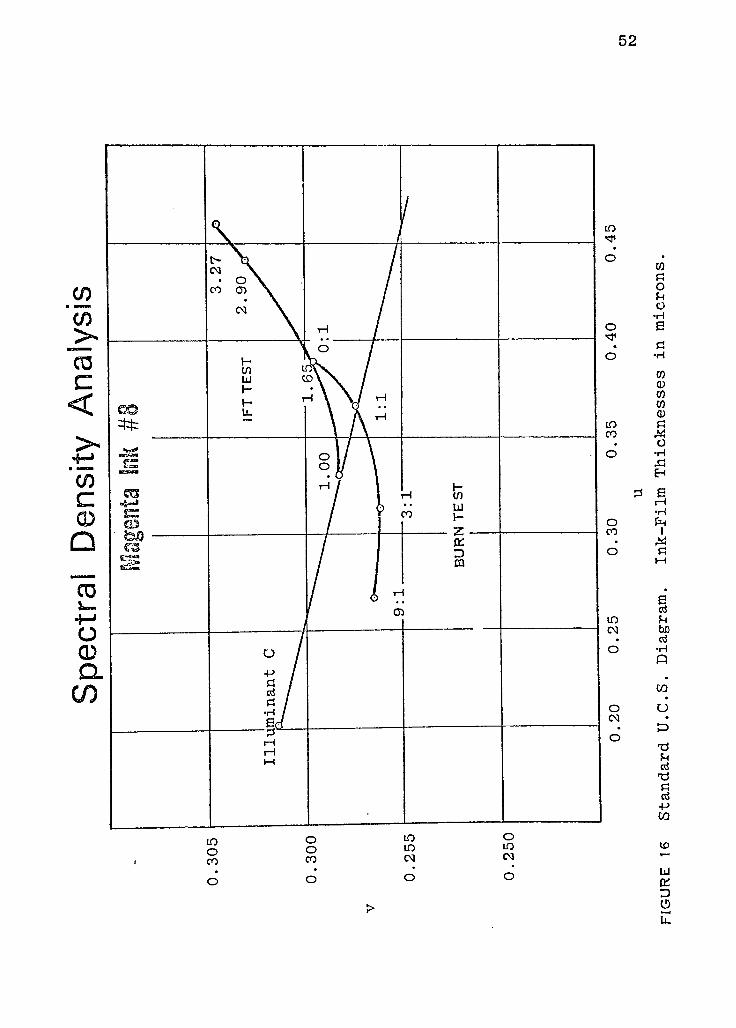
52
53
Cyan Ink Comparison
Spectral Density Analysis Magenta Ink # 7
Spectral Density Analysis Magenta Ink # 8
Modified U.C.S. Diagram Burn Test-Cyan Inks
Modified U.C.S. Diagram Burn Test-Magenta Inks 54
Modified U.C.S. Diagram Burn Test-Yellow Inks 55
Modified U.C.S. Diagram IFT Test-Cyan Inks 56
Modified U.C.S. Diagram IFT Test-Magenta Inks 57
Modified U.C.S. Diagram IFT Test-Yellow Inks 58
ABSTRACT
The term color strength is defined as the hue,
saturation, and brightness of an ink in the C.I.E.
scheme of color specification. With this definition two
color strength measuring methods are evaluated on a
common basis. A colorimeter is used to read samples
produced with varied ink-film thicknesses and varied
ratios of white pigment to sample ink. Colorimetric
properties are plotted on a U.C.S. diagram with coordinates
modified to include the C.I.E. brightness factor W*.
The ink-film thickness method is chosen as the preferred
method for determining color strength.
vi
INTRODUCTION
The printing industry today employs several methods
for determining the color strength of an ink. Unfortunately,
there are also many definitions for the term color
strength. These definitions include the amount of
colorant in an ink, its hue, saturation, and brightness,
its ability to cover a number of sheets of substrate which
is commonly referred to as mileage, and finally its
relation to another ink when it is diluted with given
amounts of white opaque ink. Other definitions may
arise to suit the user. However, in this report we will
define color strength to mean the hue, saturation, and
brightness of an ink as it relates to the C.I.E. scheme
of color specification. This definition has been chosen,
as color strength is commonly used in conjunction with
visual perception of an ink, that is, one ink looks
stronger than another if it is more saturated.
Methods of determining color strength rely heavily
on visual judgements and there is a definite lack of
instrumentation. There is no simple quantitative measure
that works well even though attempts have been made to
use spectrophotometry and several different schemes of
color specification. A visual comparison is made from
drawing down two inks simultaneously or by diluting a
known and unknown ink with equal volumes of white ink.
Densitometry may be employed on ink samples to determine
color strength but these readings are not valid unless
the filters in the densitometer match the spectral
response of the eye. Spectrophotometric methods also
have their drawbacks as will be shown.
We have chosen to examine color 'strength and its
methods of determination as there is a wide disparity
in defining and effectively utilizing the property of
color strength. A standard method would enable the
printer to predict changes needed to match inks. This
would reduce the number of trial runs needed to reproduce
a color thus conserving paper, time, and energy.
Current practices which require visual judgement
are a simple draw-down of two inks or a dilution of the
two inks with a white pigment. In the first method two
inks are placed side by side on a substrate and drawn
down together with a draw-down knife. They are then
compared with a visual judgement dependent on the
observer. A more reliable visual judgement can be made
by use of the second method which uses white ink dilution,
The known ink and the unknown ink are mixed with equal
volumes of a white opaque ink. The inks are then
drawn down as previously described. Several ratios of
white ink to sample ink are used until the perception
of color strength becomes more apparent in one of the
inks. This is commonly referred to as a burn test.
Again this method relies on visual judgement, but as
dilutions increase differences become more obvious.
Studies involving specrophotometry and color strength
have shown that the exact color specification of an ink
can be made in the C.I.E. system. Problems with this
system have been noted by Yule as follows:
1. The fact that one ink shows a higher
purity than another (that is, its plotted
point is closer to the spectrum locus)
may be purley accidental, depending on
how heavily it was printed. To overcome
this difficulty, it is necessary to use
several different ink-film thicknesses.
2. The distance between two points on the
chart does not correspond to the visual
difference between the colors, even when
luminances are equal.
3. The chromaticity gives no information
about the cleanness of color, which depends
on the relation between the saturation
and the luminance.
4. Inks which plot at the same point on
the diagram may differ not only in lumin
ance (which v/ould be represented perpen
dicularly to the plane of the paper), but
also in color saturation and, to a lesser
extent, in hue, since these characteristics
vary with luminance.
Problems with the visual and spectrophotometric methods
have been considered. In order to alleviate the problem
associated with point one, mentioned earlier, a method of
Yule, J.A.C.,Principles of Color Reproduction, Page 173,
establishing a curve with varying ink-films was considered,
A similar curve with ratios of white ink to sample ink was
also considered. Problems with unequal distances (point
two) could be overcome with the use of the Uniform
Chromaticity Scale (U.C.S.) system instead of normal
C.I.E. coordinates. Finally, if coordinates found under
the U.C.S. system were multiplied by the brightness of
the sample a new scale would be formed that should
eliminate problems associated with points three and four.
Measurements on the ink-film thickness method and
the burn test method should be made with a colorimeter
rather than a spectrophotometer. This would reduce calc
ulation as reflection data obtained could be used directly
in calculating C.I.E. values. A more involved calculation
was needed with the spectrophotometer to obtain the same
end result .
By establishing colorimetric curves of both the ink-
film thickness variations and burn test ratio variations
the two methods can be compared on a common basis. The
comparison should enable both strengths and weaknesses
of the methods to be shown. A choice to use one or both
of the methods could then be made on the basis of this
comparison.
An important consideration in this analysis was the
choice of substrate. A paper base was deemed unsuitable
as there was wide variability in paper surfaces. A paper
base would also be prone to multiple internal reflections
which gave rise to variations in reflection readings.
The ideal surface would then be non-absorbing and high
reflecting. To approximate this condition a DuPont
Cronaflex film base was used as the substrate for all
samples. The film is a high reflecting white and because
it is an acetate film base it is stable and not prone
to the variations found in fibrous paper material.
It therefore will be shown that it is possible to
establish colorimetric curves for both ink-film thick
ness variations and burn test ratio variations; that
these curves can then be expanded to include the bright
ness factor of the sample; and thus be utilized to
predict properties of unknown inks from which colorimetric
curves have been ascertained.
EXPERIMENTAL
Ink Selection
Six cyan, two magenta, and three yellow inks were
obtained to represent a wide variety of printing inks. In
addition, a two pound can of white ink for mixing was
secured. Color ink samples were drawn from twenty-five
pound containers of the ink and placed in small sample cans
Specific gravity of each ink was found by measuring
out one cubic centimeter of the ink with an IGT ink
pipette, RIT #83464. The sample was then weighed on a
Mettler analytical balance, RIT #30027, to determine its
specific gravity. Two replicates were made for each ink
and the average was taken for the final result. (See Table
One for ink data. )
IGT Printability Tester Method
The method of laying down an ink with the IGT Print-
ability Tester was examined. The sample ink was first
placed on an IGT Inking Apparatus, RIT #83458, to spread
the ink evenly on a roller. The roller was then trans
ferred to an IGT Printability Tester, RIT #70121.
Standard procedures for each of these machines were
followed. A 2.5 centimeter by 30.0 centimeter sample of
Cronaflex substrate was cut and placed on the tester. It
was then drawn over the roller by hand control of the pend
ulum drive mechanism. Samples using 0.5, 1.0, and 1.5
cubic centimeters of ink, as metered from the pipette,
were produced in this manner.
Hand Roller Method
In order to facilitate hand rolling a five inch square
vacuum frame was devised by Mr. Chester Daniels to hold a
similar sized sample of substrate. A sample ink was metered
out with the pipette onto a five inch square metal mixing
slab. The ink was then transferred to a six inch hand
brayer until it was evenly distributed on the roller. It
was subsequently rolled onto the substrate until an even
coat was built up. Samples using the three volumes of ink
as in the previous test were produced in this manner.
Problems with hand rolling occured. A four inch
soft rubber roller was used for initial testing. The
roller decomposed after inking so a four inch synthetic
rubber brayer was substituted. Another problem was that
the s'ubstrate stuck to the inked roller after inking was
started. This was solved by obtaining a roller slightly
larger than the sample width and by using a diagonal
motion across the sample.
8
Comparison of Inking Methods
The samples produced with the two methods were
measured at random spots with a Macbeth reflection
densitometer, RIT #58741, using the appropriate filtration
for each sample. A pair comparison test was run between
results obtained from the two methods. (See Table Two
for a sample test result . ) A decision to use the hand
roller method was then made based on the results of the
comparison test and the ease of application of the ink
by hand rolling.
Ink-Film Thickness Sample Production
A 12.7 centimeter square template was cut from a
metallic printing plate. This v/as used as a guide in
cutting samples from the sheet of Cronaflex substrate.
Samples were cut, numbered, and weighed on the Mettler
analytical balance.
Varied ink films were produced by placing 0.10
cubic centimeters of ink on the mixing slab. The ink was
distributed onto the synthetic rubber brayer and then
transferred to the substrate. For the next sample the
ink remaining on the slab and roller was used. The
third and fourth samples were produced in a similar manner
but an additional 0.15 cubic centimeters of ink were
metered out on the mixing slab. Four ink films from
each of the nine samples of ink were obtained in this
fashion.
The substrate was weighed before and immediately
after inking to determine the weight of the ink applied.
After the ink had air dried overnight the area of the
substrate was calculated by measuring it with a Craftsman#
vernier caliper #40257. From this data and previously
gathered data on specific gravity, the ink-film thickness
for each sample was calculated. (See Table Three, sample
numbers 1-36. )
Colorimetric Data
Samples produced from the above method were then meas
ured with a ColorMaster Differential Colorimeter, RIT
#04818, to obtain percent reflection values through red,
green, and blue filters. The colorimeter was zeroed on the
Cronaflex substrate. Data obtained from these readings
were plugged into a program designed for a Hewlett-Packard
HP9100A calculator, RIT #59995. The program was obtained
from -Mr. Irving Pobboravsky at the Graphic Arts Research
Center, and gave C.I.E. values of x, y, X, Y, Z. (See
Table Four.) Formulas involved in obtaining these C.I.E.
10
values are :
X = 0.784R + 0.196B
Y = G
Z = 1.18B
x=X/ (X+Y+Z)
y=Y/ CX+Y+Z)
Standard Uniform Chromaticity Scale coordinates were
then obtained from the C.I.E. data. Formulas involved
in this calculation are:
u = 4x / (12y - 2x + 3)
v = 6y / (12y - 2x + 3)
In addition to normal C.I.E. and U.C.S. system
coordinates a third system was created by including the
brighness factor of the ink sample. The factor
1/3W* = 25Y -
- 17 is a standard C.I.E. consideration for
brightness. The calculated value of W* was normalized by
dividing by 8.0. U.C.S. coordinates were then altered by
the following calculations:
uW* = (u - uQ)W* +
uQ
vW* = (v - vQ)W* + v
Where:uQ
= 0.2009, v = 0.3073.
The calculation includes the brightness factor and returns
the coordinates to the U.C.S. system. (See Table Five.)
11
Burn Test Sample Production
The samples for the burn test were produced in a
similar manner as for the ink-film thickness test. Sample
inks were mixed in ratios of 9:1, 3:1, and 1:1 of white
mixing ink to sample ink. For each ink sample 0.10 cubic
centimeters were metered out on the mixing slab and
consequently transferred to the Cronaflex substrate
as previously described. Twenty-seven samples were
produced in this manner. In addition to the ratio samples,
a sample of just the white mixing ink was produced.
Ink-film thickness data and colorimetric data was
obtained as previously described. (See Tables Three -
Five, sample numbers 37-64 for data.)
Estimate of Error in Ink-Films
To establish an estimate of error in ink-films
produced, all the samples produced with a volume of 0.10
cubic centimeters were used. The total number of these
samples was thirty-seven. The standard deviation of
these samples was then computed with a Hewlett-Packard
HP-45'
calculator, #1349A 18464.
12
DATA REDUCTION
The data from the colorimetric measures were plotted
on standard C.I.E. and U.C.S. diagrams. Ink-film thickness
and burn test curves for each ink were plotted together to
show their relation to each other and to each type of
diagram. With the modified U.C.S. system burn tests and
ink-film tests for each color were plotted together. In
addition, two graphs were made of the magenta inks with
their respective burn test curves plotted together. In
addition to the colorimetric plots, comparison diagrams were
made to show the relation of visual color strength to
specific gravity.
The modified U.C.S. plots were then used to analyze
the data. An arbitrary line was establ shed which ran through
the two curves and extended from the point of Illuminant C
out to the spectrum locus. Points of intersection were noted
as color ma.tches between the two curves. A visual matching
of the ink samples was then made and compared with predicted
results. Conclusions about the color strength measuring
methods were then made.
.Futher analysis of the curves involved an attempt to
correlate the ink-film thickness curves to the burn test
13
curves. This involved the use of the same arbitrary line
from Illuminant C to the spectrum locus. The ratio of
white ink to sample ink was read from the point of inter
section on the burn test curve. Another ratio was then
computed from the ink-film thickness found at the point of
intersection on the ink-film curve to the constant ink-
film thickness of the burn test samples. These ratios
were then compared to correlate the methods.
14
CONCLUSIONS
Results
Hand rolling was chosen over the IGT Printability
Tester method. No significant difference was found
between samples produced by either method. With hand
rolling sample areas could be varied, no complicated
machinery was needed, and application time was found
to be shorter.
Sample average and standard deviation for ink-films
produced with a volume of 0.10 cubic centimeters of ink
-4 -4
was: x = 1.79 X 10 centimeters, s = 0.44 X 10 centi
meters.
C.I.E. plots showed color coordinates as would normally
be obtained from colorimetric calculation. (See Figures
1-6.) Standard U.C.S. plots showed expansions and
compressions of scale as expected. (See Figures 7 - 12.)
Transformations from the standard U.C.S. system to a
brightness modified U.C.S. system showed further expansions
and compressions of scale. (See Figures 17 - 22.)
A visual comparison of color strength using a simple
draw-down test showed that weaker visual colors had higher
specific gravities. (See Figure 13.) Exceptions noted were
15
cyan ink numbers two and four.
The analysis of the modified U.C.S. diagrams with
the method of drawing a line from Illuminant C to the
spectrum locus showed that no relation between different
inks could be made with the burn test. The burn test ratios
only served to show that two inks were very similar or
very dissimilar. Ratio curves that crossed indicated hue
shifts that were readily detectable to the eye. Curves
which ran parallel to each other corresponded to samples
which showed visual hue shifts at 9:1 dilutions. Curves
which were closely parallel to each other, however, corre
sponded to samples that were visually hard to differentiate
from each other at any given dilution.
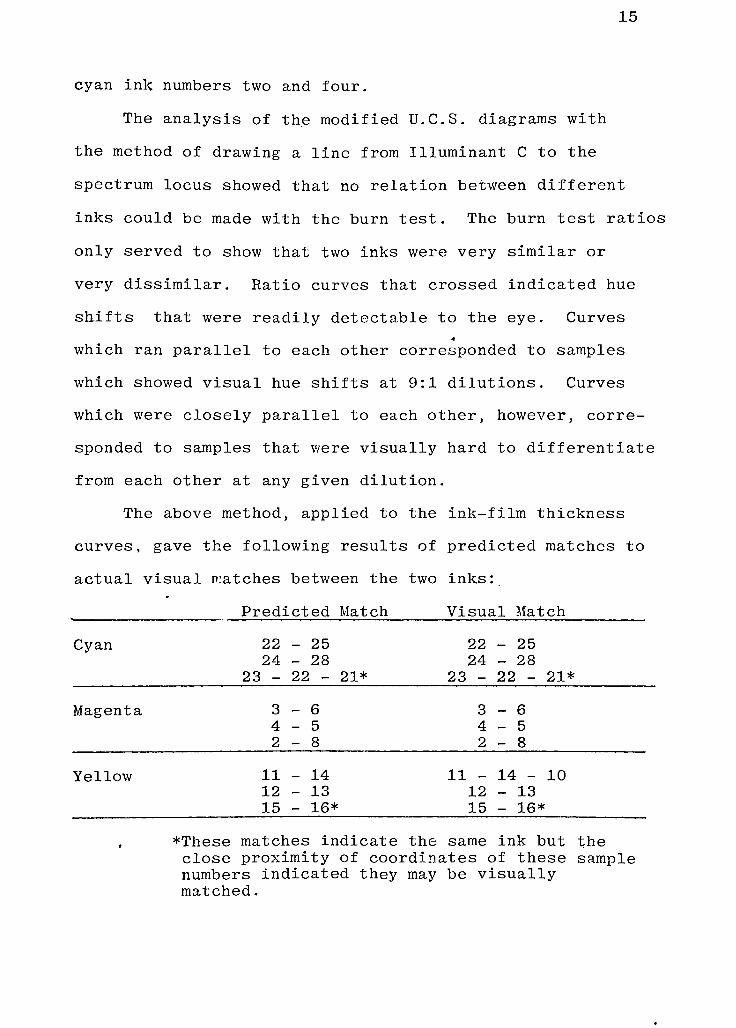
The above method, applied to the ink-film thickness
curves, gave the following results of predicted matches to
actual visual p:atches between the two inks:
Predicted Match Visual Match
Cyan 22 - 25 22 - 25
24 - 28 24 - 28
23 - 22 - 21* 23 - 22 - 21*
Magenta 3 - 6 3 - 6
4 - 5 4 - 5
2 - 8 2 - 8
Yellow 11 - 14 11 - 14 - 10
12 - 13 12 - 13
15 - 16* 15 - 16*
*These matches indicate the same ink but the
close proximity of coordinates of these sample
numbers indicated they may be visually
matched.
16
Correlation analysis between the ink-film thickness
test and burn test curves was accomplished in the U.C.S.
system. The range of burn test curves was found to
extend from a point on the ink-film thickness curve, which
is equal to the thickness of the burn test samples, to a
point where a pure white sample of the given thickness
would plot.
Ratios found in correlation analysis', as previously
described, were found to be approximately equal. The
ratio relation is as follows:
IFT (IFT curve)^
Sample Ink Concentration
IFT of Burn Test""
Total Ink Concentration
Discussion
The decision to use the hand roller was based on
several factors. Since no significant difference between
the two methods was found, other factors were considered.
One of the research objectives was to find a simple but
reliable method for ink application. By using the IGT
inking devices, two expensive pieces of machinery were
involved. Hand rolling equipment consisted of an
inexpensive hand brayer, an inexpensive mixing slab, an
inexpensive home-made vacuum frame, and a vacuum pump.
With time as a consideration the hand roller method
provided for quicker application. Long ink distribution
17
times with the inking apparatus were eliminated and clean
up time of rollers and surfaces was reduced with hand
equipment .
Sample size was another consideration. With the
IGT devices sample size was limited to 2.5 by 30.0
centimeters. With the hand method, size could be altered
to suit any requirements. The colorimeter required a
minimum 2.2 by 3.2 centimeter reading area. To insure
this would occur, a larger sample than could be produced
with the IGT apparatus was needed. For this reason a
12.7 square centimeter sample was produced with the hand
rolling method.
In the method of determining ink-film thicknesses it
was necessary to have the ink run out to the edges of the
substrate. This was possible with the hand method as
the vacuum frame held the substrate down. The IGT Print-
ability Tester required a small amounto~
the sample to
hold the substrate. This was not inked and would be
impossible to consider in determining the weight of the
ink applied.
An average of all samples produced with a volume
of 0.10 cubic centimeters of ink was found as well as
the standard deviation for these samples. The average
-4
was 1.79 X 10 centimeters with a standard deviation
-4
of 0.44 X 10 centimeters. Calculations took into
account all factors of error. These include substrate
18
area, ink tack, variations in roller pressure, error in
metering ink from the pipette, weighing, and measuring
errors. A few points were noted as extraordinarily large.
Replication of these points may have been in order but
was not deemed essential. Procedures were employed to
keep variations at a minimum. A template was used to
cut the samples in order to reduce variations in sample
area. Samples were weighed immediately after inking to
eliminate variations caused by air drying.
Ranges of ink-films varied greatly in the production
of samples for the ink-film thickness test. These
variations resulted from the method of production.
Better technique for sample production would be to clean
the brayer and mixing slab in between each sample. In this
way a specific volume of ink could be aoolied to the
mixing slab each time. The volume of ink needed to
produce a given ink-film thickness could then be
established for future reference and use with this method.
A simple draw-down test was made to establish a
general visual standing of the inks. After the inks were
ranked a plot was made of specific gravity versus relative
visual color strength. (See. Figure -.3.) The general
trend of the curves showed that as color strength
decreased, specific gravity increased. Two exceptions
were noted but this may have been an error in visual
judgement. One of the definitions encountered for
19
color strength was the amount of colorant in an ink. The
graphical evidence bears out the relation between visual
rank and color strength. As the research was not
directed in this line of investigation, the matter was
noted as having a possible bearing on analysis and for
possible further investigation.
The effectiveness of the burn test was evaluated
by use of a line from Illuminant C, passing through
the curves, to points on the spectrum locus. In theory,
equivalant hues should be found along this line. Points
on curves intersecting this line should therefore be of
the same dominant wavelength. The only difference between
these points is the excitation purity and luminance of
the sample. Keeping this in mind, burn test plots for
each ink color were evaluated. Three main trends were
noted. The burn test curves crossed, or were either
parallel or closely parallel. Curves that crossed could
not be matched by drawing the line from Illuminant C to
the spectrum locus. This condition indicated that the
colors were of different dominant wavelength and indeed,
visually, they were different for any given ratio of
white to sample ink. Informat-on gained from dilutions
would only reinforce the fact that the dominant wavelength
of the colors was different.
In the case of burn test curves that ran approximately
20
parallel to each other no matches could be made by the
dominant wavelength line method. A difference of hue was
therefore indicated but visually this was not detected
until ratios were increased.
Similar ratios were visually matched as they were
in close proximity to each other on the diagram. Larger
dilutions enabled the shift in dominant wavelength to
be discerned more readily. Luminosity increased with an
increase of white ink while purity of the sample ink
decreased. As a result, perception of color strength
became better since the perceived quality of color
strength is based on the qualitative value of darkness.
When the luminosity increased the darkness created by the
sample ink could be detected.
A problem arose in matching the yellow inks because
the curves were parallel and the yellow inks were already
bright to the eye. Cyan and magenta inks were readily
distinguishable.
In the case of the magenta inks the curves were
closely parallel to each other and it was impossible
to tell the two inks apart with visual comparison .
Similar ratios could bematcher"
but patches of one ink
could be mistaken for the other ink. Information gained
from the burn test, in this case; was that the two inks
were the same. By examining the graphs of the two inks
21
a difference could be noted. However, because of their
close proximity on the modified U.C.S. diagram, a
prediction could be made that there would be no visual
difference. It is concluded that at some distance of
separation on the modified U.C.S. diagram, colors are
perceived as the same. It would be extremely useful
to find the point of separation at which the eye can
detect a shift in dominant wavelength but this was
beyond the scope of the research.
Ink-film thickness curves were evaluated by using
the dominant wavelength line as previously described.
Curves produced showed three general tendancies. They
either crossed, were widely separated, or were in close
proximity to each other. In each case it was shown that
color matches could be accurately predicted by comparing
the inks with the dominant wavelength line.
The yellow inks examined exhibited a tendancy to
cross each other. Two matches were predicted by examin
ation of the curves. One match was at the point of
intersection where the yellow inks would cross each other
and the other match was along the dominant wavelength
line. These predicted matches were then confirmed by
visual evaluation.
i
Magenta ink curves were closely overlapping. Pre
dictions of color matches by the dominant wavelength line
22
were again confirmed by visual matching. Visual matches,
however, included other samples that were in relatively
close positions.
Cyan ink curves were widely separated. The dominant
wavelength line could not be drawn through the two curves
so no color match was indicated. Indeed, no color match
could be made by visual comparison. Samples of another
cyan ink, which were not plotted, were matched with the
original two cyan inks. Visual matches were noted. The
third ink was then plotted and visual matches were compared
with graphical matches. By visual matching it was pre
dicted that the inks would have similar curves. The plots
showed that this was true. (See Figure 14.)
As found in the burn test analysis, samples which
were in close proximity to each other were considered
to be matches. Samples of different ink-film thicknesses
of one ink were also matched if they were close to each
other on the diagram. Judgement errors could readily
occur if no method of determining the exact colorimetric
properties was used.
The analysis of the U.C.S. plots for curves of a
given ink was based on the theoretical level for which
the range of the curves would extend. Since the color
imeter was zeroed on the white base to produce readings
only affected by the ink, the range of the ink-film
23
thickness curves extended from Illuminant C out to a point
near the spectrum locus where the ink-film thickness
approaches infinity.
The range fo. the burn test curves will extend from
a point near Illuminant C, where the white pigment plots,
to a point on the ink-film thickness curve which matches
the constant thickness of the burn test curve. In
terms of ratios, the curve will extend from a ratio of
one to zero to a ratio of zero to one of white pigment
to sample ink. If the reflectance factor of the white
pigment was equal to the reflectance factor of the white
base the two curves would coincide. Therefore, the
difference between the curves is a factor of reflection
differences between particle and surface reflection and
the saturation difference of the white mixing ink.
Again, constructing a ray from Illuminant C to the spectrum
locus the curves are intersected at two points. Point
one is on the ink-film thickness curve and point two is
on the burn test curve. Considering the spectral density
of both points:
/1(A)^c1x1 and f^X)vc^2Where: c = sample ink concentration
x = ink film thickness
k for a proportionality constant:
k2v'2"2fyit\) =
J-!0!--!ar-d J2^ = kcx'
24
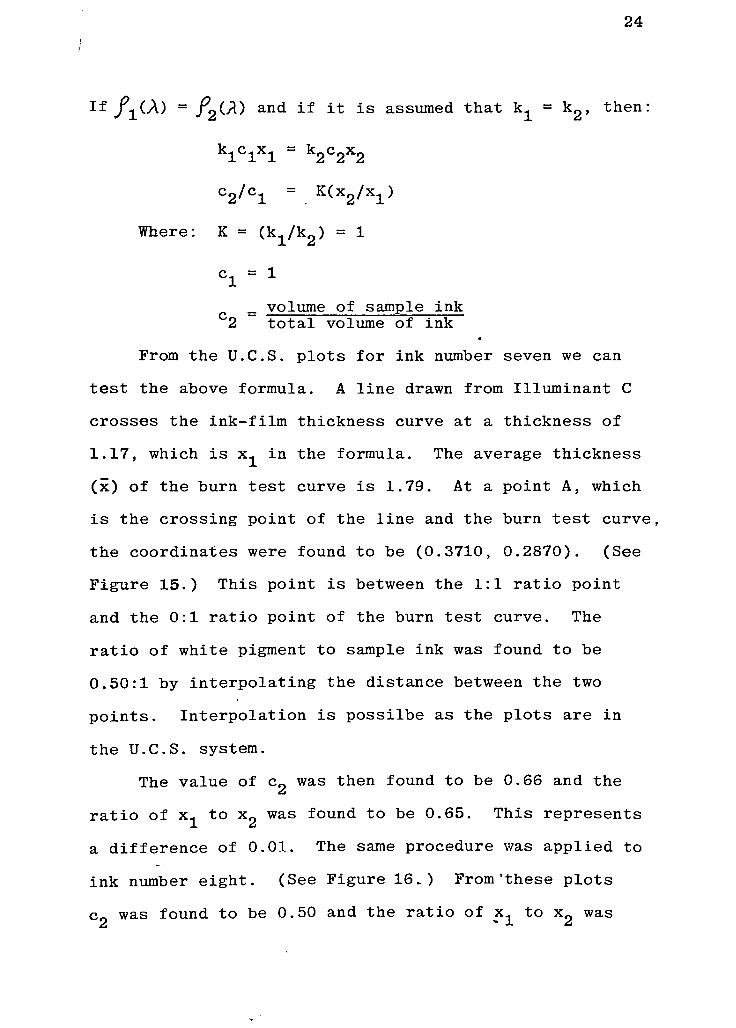
If f-^iX) = /r-(/D and if it is assumed that k^= k2, then:
klClXl=
k2C2X2
C2/Cl=
.
K<W
Where: K = (l^/kg) = 1
cx-l
_volume of sample ink
2 total volume of ink
From the U.C.S. plots for ink number seven we can
test the above formula. A line drawn from Illuminant C
crosses the ink-film thickness curve at a thickness of
1.17, which is x1in the formula. The average thickness
(x) of the burn test curve is 1.79. At a point A, which
is the crossing point of the line and the burn test curve,
the coordinates were found to be (0.3710, 0.2870). (See
Figure 15.) This point is between the 1:1 ratio point
and the 0:1 ratio point of the burn test curve. The
ratio of white pigment to sample ink was found to be
0.50:1 by interpolating the distance between the two
points. Interpolation is possilbe as the plots are in
the U.C.S. system.
The value of c9was then found to be 0.66 and the
ratio of x1to x was found to be 0.65. This represents
a difference of 0.01. The same procedure was applied to
ink number eight. (See Figure 16.) From 'these plots
c9was found to be 0.50 and the ratio of
x^to x_ was
25
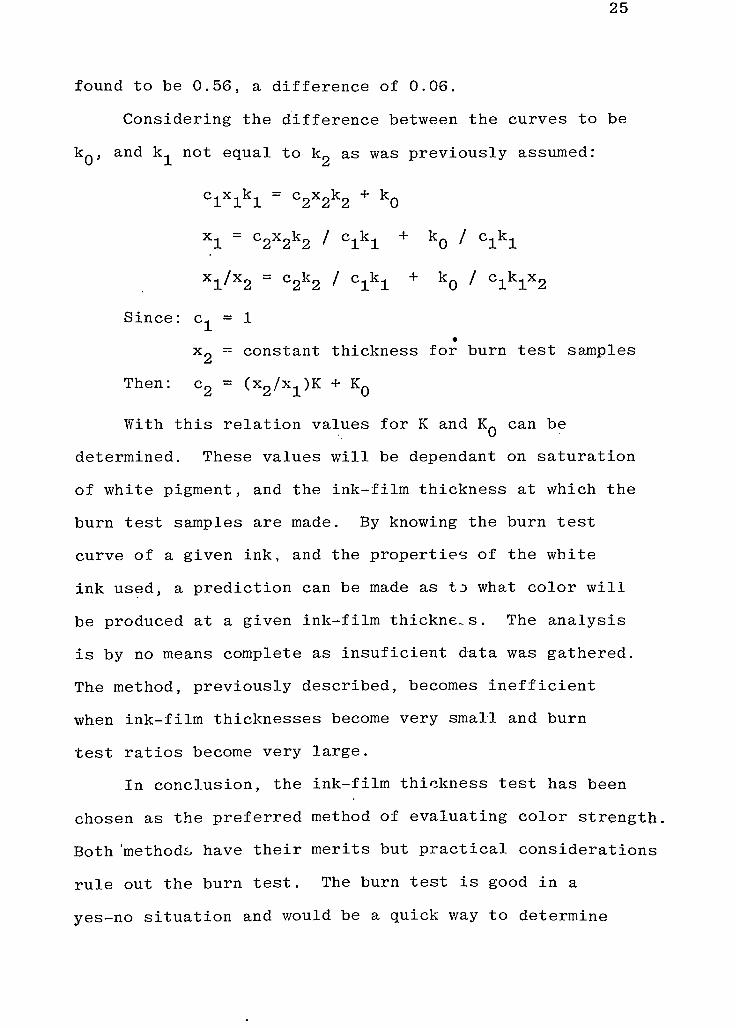
found to be 0.56, a difference of 0.06.
Considering the difference between the curves to be
kQ, and k^ not equal to kp as was previously assumed:
Clxlkl=
c2X2k2+
k0
Xl=
c2x2k2 / clkl+
k0 / Clkl
Xl/x2=
c2k2 / c1k1+
kQ / c1k1x2
Since: c. = 1
x?=constant thickness for burn test samples
Then:c2
= (x2/x1)K +KQ
With this relation values for K and K~ can be
determined. These values will be dependant on saturation
of white pigment, and the ink-film thickness at which the
burn test samples are made. By knowing the burn test
curve of a given ink, and the properties of the white
ink used, a prediction can be made as to what color will
be produced at a given ink-film thickness. The analysis
is by no means complete as insuficient data was gathered.
The method, previously described, becomes inefficient
when ink-film thicknesses become very small and burn
test ratios become very large.
In conclusion, the ink-film thickness test has been
chosen as the preferred method of evaluating color strength.
Both methods have their merits but practical considerations
rule out the burn test. The burn test is good in a
yes-no situation and would be a quick way to determine
26
the stronger of two inks. The printer is concerned with
the ink-film needed to produce a color. The burn test
does not directly give this information. The burn test
only serves to show that inks are either similar or
dissimilar. As preveiously described, burn test -curves
graphically showed hue shifts and changes of dominant
wavelength. Since the burn test is only useful in the
determination of color strength, its use is limited.
The ink-film thickness test, on the other hand,
is more useful. By examining theplots'
on the modified
U.C.S. diagram a stronger color can be picked out by
noting the change in purity along a given line of
dominant wavelength. The stronger color will be the
one whose coordinates plot closer to the spectrum locus.
The ink-film thickness test is also useful for determining
the ink-film required to match one ink with another.
Points can be read from the curves to show at what ink-
films color matches will occur. For example, if it is
known that a desired color has been laid down at an
ink-film thickness of two microns, a line can be drawn
from Illuminant C through the two micron point and a
curve of another ink. If this line crosses the second
curve at a thickness of one micron, one will know that
the second ink can be laid down at half the thickness
to produce the same visual color. It must be kept in
mind there may be a shift in purity. By knowing
27
what ink-film thickness is needed, trial runs may be
reduced and paper, time, and energy conserved. A final
visual match is still needed but the method may eliminate
alot of the guess work now used.
Recommendations For Future Work
Work is needed to further this research. The method
was tried only with a non-paper substrate and now needs
to be tried in an actual printing application. In producing
samples, tighter control of the substrate size is needed.
Hand cutting was used which lead to some unwanted variations,
Using a substrate which was machine cut may have helped
reduce these variations. In producing ink-films a fresh
supply of ink should be metered out on the mixing slab
for each sample. This would allow a relation between ink
volume and ink-film thickness to be established.
As a separate topic for research one might examine
the relation between specific gravity and color strength.
One might also examine the spectral density method of
analysis that was used with comparing ink-film thickness
curves with burn test curves. Finally, an important
area of research would be in determining the minimum
separation distance of points on the modified U.C.S.
diagram needed to perceive a change in dominant wavelength
or purity.
28
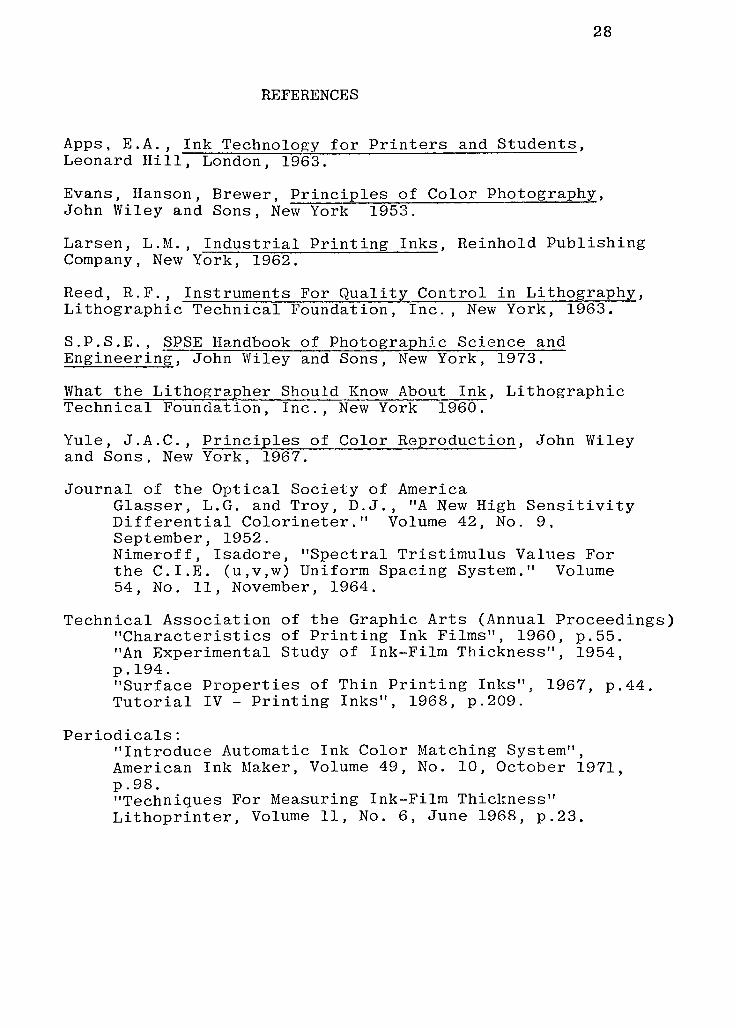
REFERENCES
Apps, E.A.,Ink Technology for Printers and Students,
Leonard Hill, London, 1963.
Evans, Hanson, Brewer, Principles of Color Photography,John Wiley and Sons, New York 1953.
Larsen, L.M., Industrial Printing Inks, Reinhold Publishing
Company, New York, 1962.
Reed, R.F.,Instruments For Quality Control in Lithography,
Lithographic Technical Foundation, Inc., New York, 1963.
S.P.S.E., SPSE Handbook of Photographic Science and
Engineering, John Wiley and Sons, New York, 1973.
What the Lithographer Should Know About Ink, Lithographic
Technical Foundation, Inc., New York 1960.
Yule, J.A.C, Principles of Color Reproduction, John Wileyand Sons, New York, 1967.
Journal of the Optical Society of America
Glasser, L.G. and Troy, D.J., "A New High SensitivityDifferential Colorineter .
"Volume 42, No. 9,
September, 1952.
Nimeroff, Isadore, "Spectral Tristimulus Values For
the C.I.E. (u,v,w) Uniform SpacingSystem,"
Volume
54, No. 11, November, 1964.
Technical Association of the Graphic Arts (Annual Proceedings)"Characteristics of Printing Ink Films", 1960, p. 55.
"An Experimental Study of Ink-Film Thickness", 1954,p. 194.
"Surface Properties of Thin Printing Inks", 1967, p. 44.
Tutorial IV - Printing Inks", 1968, p. 209.
Periodicals:
"Introduce Automatic Ink Color Matching System",American Ink Maker, Volume 49, No. 10, October 1971,p. 98.
"Techniques For Measuring Ink-Film Thickness"
Lithoprinter,Volume 11, No. 6, June 1968, p. 23.
29
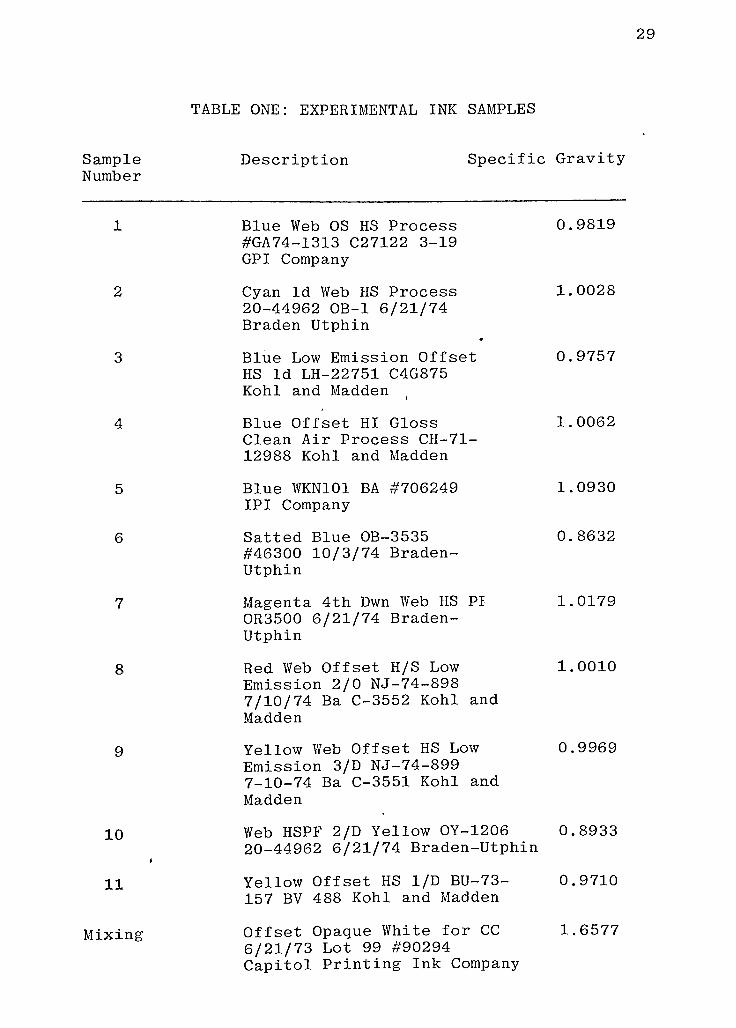
TABLE ONE: EXPERIMENTAL INK SAMPLES
Sample
Number
Description Specific Gravity
Blue Web OS HS Process 0.9819
#GA74-1313 C27122 3-19
GPI Company
Cyan Id Web HS Process 1.0028
20-44962 OB-1 6/21/74
Braden Utphin*
Blue Low Emission Offset 0.9757
HS Id LH-22751 C4G875
Kohl and Madden
Blue Offset HI Gloss 1.0062
Clean Air Process CII-71-
12988 Kohl and Madden
Blue WKN101 BA #706249 1.0930
IPI Company
Satted Blue OB-3535 0.8632
#46300 10/3/74 Braden-
Utphin
Magenta 4th Dwn Web HS PI 1.0179
OR3500 6/21/74 Braden-
Utphin
Red Web Offset H/S Low 1.0010
Emission 2/0 NJ-74-898
7/10/74 Ba C-3552 Kohl and
Madden
Yellow Web Offset HS Low 0.9969
Emission 3/D NJ-74-899
7_10-74 Ba C-3551 Kohl and
Madden
Web HSPF 2/D Yellow OY-1206 0.8933
20-44962 6/21/74 Braden-Utphin
5
6
8
10
11
Mixing
Yellow Offset HS 1/D BU-73- 0.9710
157 BV 488 Kohl and Madden
Offset Opaque White for CC 1.6577
6/21/73 Lot 99 #90294
Capitol Printing Ink Company
30
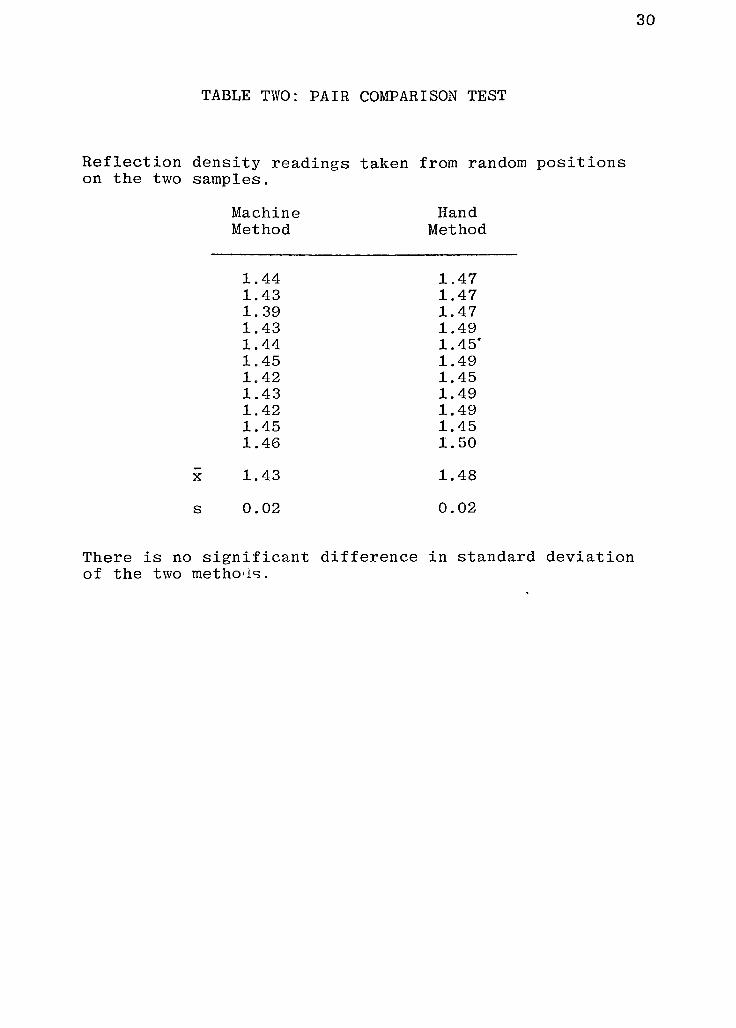
TABLE TWO: PAIR COMPARISON TEST
Reflection density readings taken from random positions
on the two samples.
Machine
Method
Hand
Method
1,
1,
1.
1,
1,
1,
1,
1,
1.
1,
1,
44
43
39
43
44
45
42
43
42
45
46
1.47
1.47
1.47
1.491.45*
1.49
1.45
1.49
1.49
1.45
1.50
1.43
0.02
1.48
0.02
There is no significant difference in standard deviation
of the two methods.

31
TABLE THREE: INK-FILM THICKNESS
Sample Specific Ink Weight Sample Ink-Film
Number Gravity grams Area Microns
10 4cmg/cmcm-*
1 Ink 7 1.0179 0.0300 161.9254 1.82
2 0.0545 161.4154 3.32
3 0.0192 161.6708 1.17
4 0.0326 161.0982 1.99
5 Ink 8 1.0010 0.0266 161.4804 1.65
6 0.0162 161.7980 1.00
7 0.0528 161.4798 3.27
8 0.0469 161.0672 2.90
9 Ink 9 0.9969 0.0237 -161.9254 1.47
10 0.0133 161.7341 0.83
11 0.0450 161.6712 2.79
12 0.0660 161.6074 4.10
13 Ink 10 0.8933 0.0251 161.4804 1.74
14 0.0163 161.7987 1.13
15 0.0568 161.6072 3.93
16 0.0634 161.2894 4.40
17 Ink 11 0.9710 0.0263 161.4798 1.68
18 0.0435 161.2891 2.78
19 0.0342 161.2896 4.58
20 0.0746 161.4169 4.76
21 Ink 1 0.<?819 0.0434 161.4161 2.74
22 0.0336 161.4788 2.12
23 0.0398 161.3517 2.51
24 0.0628 161.0352 3.97
25 Ink 3 0.9757 0.0289 161.4158 1.83
26 0.0242 161.7980 1.53
27 0.0449 161.9892 2.84
28 0.0592 161.7980 3.75
29 Ink 6 0.8632 0.0235 161.4158 1.69
30 0.0195 161.6072 1.40
31 0.0407 161.1610 2.93
32 0.0309 161.0350 2.22
33 Ink 5 1.0930 0.0274 160.9080 1.56
34 0.02C5 161.4795 1.17
35 0.0575 161.4795 3.26
36 0.0405 161.7890 2.30
37 Ink 9 1.5916 0.0446 161.9841 1.73
38 1.4925 0.0413 161.7347 1.71
39 1.3273 0.0254 161.8617 1.18
32
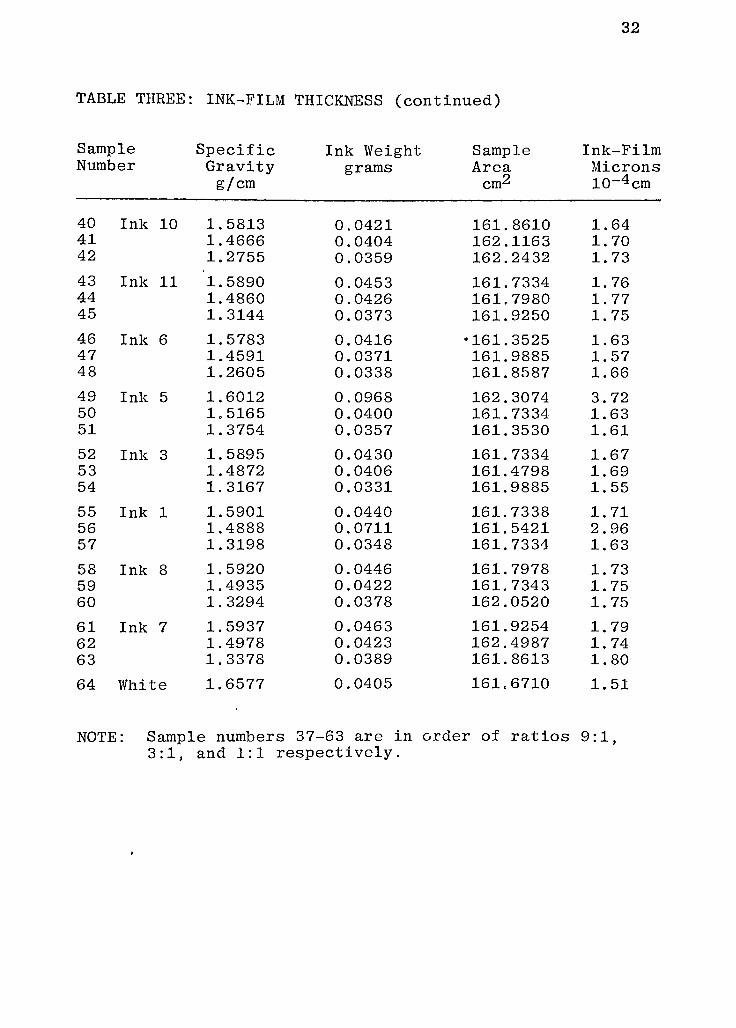
TABLE THREE: INK-FILM THICKNESS (continued)
Sample
Number
Specific
Gravityg/cm
Ink Weight
grams
Sample
Areacrn-^
Ink-Film
Microns
10-4cm
40
41
42
Ink 10 1.5813
1.4666
1.2755
0.0421
0.0404
0.0359
161.8610
162.1163
162.2432
1.64
1.70
1.73
43
44
45
Ink 11 1.5890
1.4860
1.3144
0.0453
0.0426
0.0373
161.7334
161.7980
161.9250
1.76
1.77
1.75
46
47
48
Ink 6 1.5783
1.4591
1.2605
0.0416
0.0371
0.0338
161.3525
161.9885
161.8587
1.63
1.57
1.66
49
50
51
Ink 5 1.6012
1.5165
1.3754
0.0968
0.0400
0.0357
162.3074
161.7334
161.3530
3.72
1.63
1.61
52
53
54
Ink 3 1.5895
1.4872
1.3167
0.0430
0.0406
0.0331
161.7334
161.4798
161.9885
1.67
1.69
1.55
55
56
57
Ink 1 1.5901
1.4888
1.3198
0.0440
0.0711
0.0348
161.7338
161.5421
161.7334
1.71
2.96
1.63
58
59
60
Ink 8 1.5920
1.4935
1.3294
0.0446
0.0422
0.0378
161.7978
161.7343
162.0520
1.73
1.75
1.75
61
62
63
Ink 7 1.5937
1.4978
1.3378
0.0463
0.0423
0.0389
161.9254
162.4987
161.8613
1.79
1.74
1.80
64 Whit;e 1.6577 0.0405 161.6710 1.51
NOTE: Sample numbers 37-63 are in order of ratios 9:1,
3:1, and 1:1 respectively.

33
TABLE FOUR: COLORIMETRIC DATA
Sample X y Y
Number
1 Ink 7 0.4771 0.2419 0.1639
2 0.5608 0.2701 0.1196
3 0.4326 0.2462 0.2253
4 0.5050 0.2469 0.1482
5 Ink 8 0.4865 0.2481 0.1632
6 0.4276 0.2488 0.2305
7 0.5809 0.2774 0.1137
8 0.5604 0.2666 . 0.1210
9 Ink 9 0.4481 0.5003 0.8647
10 0.4226 0.4766 0.9028
11 0.4621 0.5086 0.8318
12 0.4701 0.5080 0.8104
13 Ink 10 0.4576 0.4908 0.8066
14 0.4387 0.4812 0.8508
15 0.4896 0.4873 0.7116
16 0.4927 0.4859 0.6934
17 Ink 11 0.4434 0.4931 0.8348
18 0.4594 0.5030 0.8166
19 0.4502 0.5025 0.8406
20 0.5374 0.4353 0.6178
21 Ink 1 0.1387 0.1408 0.1492
22 0.1452 0.1510 0.1725
23 0.1423 0.1479 0.1613
24 0.1348 0.1228'
0.1060
25 Ink 3 0.1454 0.1550 0.1818
26 0.1489 0.1619 0.1991
27 0.1362 0.1330 0.1266
28 0.1343 0.1257 0.1072
29 Ink 6 0.1688 0.1247 0.1167
30 0.1746 0.1344 0.1428
31 0.1472 0.0817 0.0565
32 0.1540 0.1031 0.0862
33
t
Ink 5 0.1460 0.1585 0.1818
34 0.1553 0.1730 0.2248
35 0.1362 0.1291 0.1078
36 0.1437 0.1398 0.1351

TABLE FOUR: COLORIMETRIC DATA (continued)
34
Sample
Number
X y Y
37
38
39
Ink 9 0.3791
0.4115
0.4246
0.4258
0.4672
0.4865
0.9004
0.8873
0.7715
40
41
42
Ink 10 0.3826
0.4153
0.4417
0.4247
0.4680
0.4926
0.9031
0.8726
0.8394
43
44
45
Ink 11 0.3763
0.4092
0.4327
0.4204
0.4622
0.4905
0.9155
0.7872
0.8668
46
47
48
Ink 6 0.2480
0.2117
0.1866
0.2547
0.2074
0.1606
0.5275
0.3358
0.1968
49
50
51
Ink 5 0.2157
0.1860
0.1625
0.2619
0.2284
0.1904
0.5301
0.3797
0.2608
52
53
54
Ink 3 0.2248
0.1876
0.1645
0.2700
0.2332
0.1981
0.5616
0.4043
0.2885
55
56
57
Ink 1 0.2244
0.1888
0.1662
0.2725
0.2328
0.1988
0.5799
0.4095
0.2944
58
59
60
Ink 8 0.3514
0.3952
0.4511
0.2476
0.2346
0.2353
0.4126
0.2686
0.1845
61
62
63
Ink 7 0.3444
0.3867
0.4359
0.2507
0.2346
0.2309
0.4438
0.2909
0.2021
64 White 0.3115 0.3180 0.9474

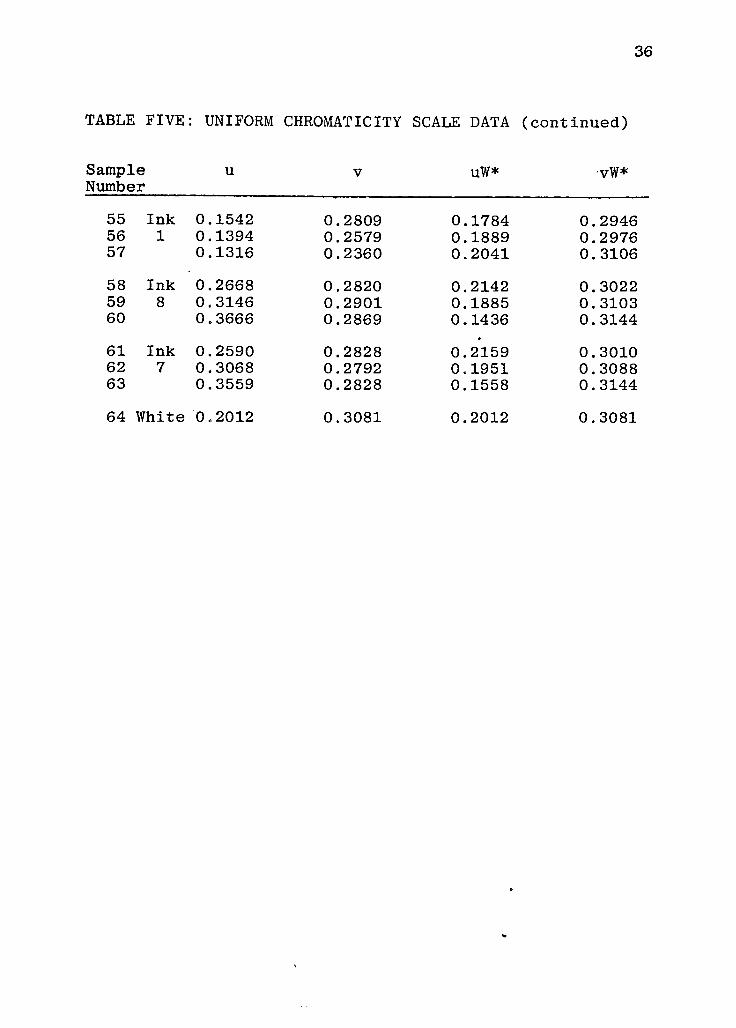
TABLE FIVE: UNIFORM CHROMATICITY SCALE DATA
35
Sample^ u V uW* vW*
Number
1 Ink 0.3856 0.2933 0.1243 0.3131
2 7 0.4382 0.3165 0.0620 0.3019
3 0.3400 0.2903 0.1698 0.3111
4 0.4079 0.2991 0.1033 0.3112
5 Ink 0.3889 0.2975 0.1225 0.3114
6 8 0.3334 0.2910 0.1732 0.3107
7 0.4497 0.3221 0.0489 0.2983
8 0.4414 0.3150 0.0616 0.3028
9 Ink 0.2211 0.3703 0.2181 0.3610
10 9 0.2147 0.3632 0.2133 0.3573
11 0.2260 0.3731 0.2213 0.3609
12 0.2306 0.3737 0.2243 0.3597
13 Ink 0.2295 0.3693 0.2233 0.3559
14 10 0.2222 0.3656 0.2187 0.3560
15 0.2489 0.3716 0.2328 0.3501
16 0.2512 0.3716 0.2331 0.3485
21 Ink 0.1257 0.1915 0.2361 0.3614
22 1 0.1285 0.2004 0.2288 0.3485
23 0.1268 0.1976 0.2C23 0.3538
.24 0.1283 0.1753 0.2478 0.3926
29 Ink 0.1624 0.1799 0.22-39 0.3835
30 6 0.1638 0.1891 0.2191 0.3654
31 0.1597 0.1330 0.2390 0.4687
32 0.1568 0.1574 0.2337 0.4189
37 Ink 0.2063 0.3475 0.2057 0.3432
38 9 0.2115 0.3602 0.2102 0.3537
39 0.2126 0.3654 0.2111 0.3581
40 Ink 0.2088 0.3476 0.2080 0.3434
41 10 0.2134 0.3607 0.2117 0.3533
42 0.2201 0.3682 0.2167 0.3574
46 Ink 0/1784 0.2748 0.1919 0.2943
47 '6 0.1672 0.2457 0.1993 0.3048
48 0.1639 0.2116 0.2123 0.3367
36
TABLE FIVE: UNIFORM CHROMATICITY SCALE DATA (continued)
Sample
Number
u V uW* vW*
55
56
57
Ink
1
0.1542
0.1394
0.1316
0.2809
0.2579
0.2360
0.1784
0.1889
0.2041
0.2946
0.2976
0.3106
58
59
60
Ink
8
0.2668
0.3146
0.3666
0.2820
0.2901
0.2869
0.2142
0.1885
0.1436
0.3022
0.3103
0.3144
61
62
63
Ink
7
0.2590
0.3068
0.3559
0.2828
0.2792
0.2828
*
0.2159
0.1951
0.1558
0.3010
0.3088
0.3144
64 White 0.2012 0.3081 0.2012 0.3081

37
CD
G)
CD
UJ
O
CD
"O
C
CD+-
C/)
u
-p
H
s
rH
i
t-H
tH \
ul'
2
cc:
DCQ
g
Oj
CO
CM
H
CQ
r-l
O H <
^-T
O
CO
lO
CM
O
CQ
O
-P
0P>
H
HH
O
oH
-P
ci
u
ari
-P
W
<D
E-"
fl?
Zi
X CQ
io
H
O
O
rH
IO
O
O
O
ri
e
rtH
CO
0)
w
w
<u
rt
Xo
H
H <D
S ftrH gH 3p4 CO
I
X Xfl fl
OCO
IO
CQ
O
CQ
IO
H
O
O
rH
o
D

38
c
-p
o flrt
c1-
S3rH
rH
r-l
ECDi
r-l
C2>03
CD
Q _i ^^o
N.11 ^sl"
03
CO \. tH CD
LU _vj;
H tH CSCS
ca CO
OCi3 CO
tH
cc
03
CQ
73UJJ-
z
~*-o
CD Di
TD CQ
C
CD
C/>
UJ
H
H-
U.
,
O
co
LO
ca
o
csi
lO
rH
O
O
rH
O
o-p
oO
-p
CO H
siO
CH
o
oH
in-P
CQ ai
.
UO
flH
-P
CO
CDo PCQ
CO i-i
tl
PQX
.
WIO cH o
ri
O o
ri
E
flH
O COrH <D
wO CQ
<D
flM
O
H
.fl
m E-< CDO iH
S ftO rH S
H ci
fe CO
X Xfl flM -H
<M
UJ
Qi
D
<3 .
U.

39
x
Xflri
CV
-P
ri
JZ\
o
oH
P
ci
U
flH
-P
CO
CD
fl
co
flo
uo
H
flH
CO
CD
CO
CO
CD
O CD
H rH
JZ\ ft
H |S CO
rH
H ^4
I
Xfl
flH
O
-P
O
CO
in
CQ
o
CQ
O
in
rH
CO
UJ
o

40
o
ci
in
CQ
o
CQ
in
rH
o-p
Xfl
in H
m
CD
O P
H
si>
<H
oo
in o. H
o -p
a
rA
flH
in -p
^ CO
0
o Ba
flJ-
X 3
CQ
O
"* .
. COo fl
0r-A
o
H
E
m flCO H
O CO
CO
0
fl
Xori
o siCO tH 0
H
o E aH gH ctf
P>H CO
X Xfl fll-H -H
M-
U
Qi
D
O
U.

41
ECDi
O)
Q
UJ
O
s
CD
"OC
CD
h-
U.UJ
H
HU.
O *
tH
"*
03 O t>
t> J <*
en<M \ rH
tt-HH-
CO
00JS!
SZ o
tHn
sa**-*
rH
o r\
amim" ""
.T"
4D CO
>
1-
tn
UI
H
rH
03
2 ODi
D -P
D3 fl
a
a
go
zi
rH
rH
l-t
O
in
m o in
co
XcrH
in 0
in -P
. rA
o si
H
O
o
O H
m -P
. a
O u
a
H
-p
CO
in 0
^ E-i
O fl.JHZi
X CQ
O W"tf< fl
o
O UO
H
B
flH
in
CO CO. 0
O CO
CO
0
fl
XO MH C
o si -H
CO E-i
0
O S rH
rH Qah EPh ci
1 CO
^!fl oH +J
m
Ul
K
D
O
>>

42
H(/}UJ
H
E O-tf*
U,
CDL_ 9 co ^
y 03
O)/
COCD 1 *
Q =tfc
l t>
\tH cn
\ ^
LU g
\^
rH
rH\.wean*
u^m
oO
rH >w
X3BBna-rai
S3 CO
L- >-
CD
T3H
CH
03
CD V)
CO
H
Z
Di
D
CQ
U
-P
flrt
So
EprH
rH
t-H
XflH
in 0
IOH->
. H
o Si
&
<H
o
o
O H
m -P
rt
O M
flH
-P
W
m 0
"tf* E-i
o C*-
2xm
O CO
"tf* c
o
o u
o
H
E
CH
in
CO CO
0
O CO
CO
0
fl
XO .14
H fl
o .fl -H
CO H. 0
O E rH
rH f-\H EPh rt
1 CO
.14
fl o1-H -p
O
in
m o-tf*
in
co
>>
CD
UJ
Di
DO

43
ECDi
O)
CDr-
---
fl L_
Q <3--ES
-tt*"
n
rt
flH
Z
Di
COIf. M
3rH
rH
HCfl
O IS 11 UJ
Z)H
03
1-
U-
w^"
i tH
"O Co3 \. CO
i H
CDc>Jb-o o
'O rH H
c. m -tf* t-
CQ C- 03
CD(M
CO
O
cn
in
CQ
o
CQ
m
rH
XflH
0
O -P
CO H
. SZ\
O
IH
O
oH
tn -P
(M ci
. U
O
CH
P
CO
0
O Eh
CQ. flO
CQ
CO
in flrH o. -(
O O
H
E
flH
O CO
tH 0. CO
O CO
0
G
Xo XH fl
.fl H
in HO 0
E rH
O iH
H
Ph1
Xfl oM -P
r-
UJ
Di
zx
o

44
O
CO
O
ECD in
L.
D)UJ o
CDo
z.
-p Qi
QCD
fl
rt
flH
ca
o
CQ
OCO
O
=fcfc s
iH
rH
h-1
cc
CQ
co
03
D<3
C3 rH
rH
CC
<M
rH
--0-
in
rH
O
CD
"OC
CD
r-
UX
UlO
tH
-J--
O
C/3 U.
m
o
O
.14
flH
04->
H
JX
<H
o
oH
-P
rt
U
flH
4->
CO
0
Eh
HrA
aCQ
CO
ao
uo
H
E
flH
CO
0
CQ
CQ
0
fl
XO XH a
si -H
Eh
ErH
H
Ph rtI CO
Xfl oM -P
0rH
Pa
E
O
co
m
CS)
o
CM
m
rH
o
00
UJ
Di
D
O
Lu

45
XflH
0
m -P
"d* H
si
O ^
H
o
oH
o -p
"tf* ci
r-i
o
CrA
-P
CO
0
m Ba
CO
fl
o U
3CQ
3
.
CO
o fl
CO o. u
o o
H
E
flH
m CO
CM 0. CO
o CO
0
C
XO .14
H C
Xi -H
o Eh
CQ 0
E rH
o rH Pah EPh ^1 CO
Xfl Ol-H H->
in
co
o
co
m
CQ
o
CQUJ
Di
DO

46
CD1
CD
CD
"a
c
CD
HV)Ul
H
f-
t-Q U.
CQ \o\
CO C3 \
C\l \
in
CS brH
\,"
\vVs*
.1 \u&a-
O 1 1(aa
&-J
H
CS^
1 rH UJ?'t-
6 HES CO
G3 Z
QiJ3eg CQ
cs
ill03
o
-p
flci
fl
^c
2rH
H
M
cH
0in -P
"tf*H
Si
o
<H
O
OH
o P
"tf< a?
o
aH
p
CO
0in Eh
CO
flo U
3CQ
3
CO
o flCO o
^Ho o
H
S
c
H
m CO
CM 0
CO
o CO
0
fl
Xo xri flX) -H
o Eh
CQ 0
E rH
o rH D,h EPh ci
I CO
44G OM H->
m
CO
o
co
in
CQ
o
CQ
UJ
Di
D
CD
u!
47
E H
CDC/)Ul
L.r-
O)y-
U.
CD
Q CDor-l
C/)
O Ji 0
o
-P
3 503 Q o fl
rt
.2 CQ HflH
05rH
CO 03
Li
flrH
H
CD M
T3
C
CD4-
1-
W. Di
Dm
XcH
(I)in
P
COH
.fl
o
H
o
oH
o
CO-P
rt
SHo
flH
-P
CQ
0m
CMEh
ofl
f-i
fl
flCQ
roo
ACM
o
uo o
H
E
flH
inro
H m
o
rH
O"tf*
tn
co
o
CO
in
CQ
CO
0
CO
CO
0
fl
X .
o xri flXJ ri
Ba
0
E rH
rH DlH EPh rt
1 CO
44fl oi-t -p
.-*
*-*
Ul
Di
D
(3

48
EUJ
CD H
JL- H
O)U.
CD> o
Q CD
"tf*
"tf*
CO
C/)++-
co \ -co
(Jmm*. \ rH rH O
Z) XXrH P
fl
rH '3ss.rt
"OJO rH H
"**"c~
Sbui 03 CO fl
CD> 03 rH
rH
~oC V)
CDUI
^-z
C/)Di
DCQ
-
Xfl
H
in 0
CO H->
. H
o X!
SH
o
oo H
CO -P
. rt
o fH
CH
-P
CO
in 0
CQ Eh
o G
*H
flfl CQ
o CO
(M fl
oo U
O
H
E
flH
m
rH CO. 0
o CO
CO
0
G
44O 44H fl
o X3 -H
rH Eh
0
o E rH
rH P,H SPh ci
1 CO
44fl orH -p
o"tf*
m
CO
o
CO
in
CQ
CM
UJ
Di
D

49
Visual ComparisonSPECIFIC GRAVITY VS. COLOR STRENGTH
CO
1.01
1.00 -
^__o
0.09
0.08
1 1
YELLOW
(III
10 11 9
0.08-
6
STRONG
FIGURE 13
4 3 2 1
(Ink Number)
Color Strength
5
WEAK

50
fl
CO
fl
o
u
orH
E
flH
CO
0
CO
CO
0
fl
Xo
H
XIEh
ErH
H
PhI
44fl
in o m o
"tf* "tf* CO CO
o o
>
o o UI
Di
D
O
Lu

51
co
fl
ou
o
H
E
flH
CQ
0CQ
CO
0
fl
XO
H
.fl
H
EH
H
PhI
XflM
rt
rA
bort
H
Q
CO
T3
rt
TX
Crt
-P
CO
in o in o
o o m m
CO CO CQ CQ
oUJ
Di
D
O
C
52
m"vl*
o .
CO
flo
Jho
H
o E"st*
fl
o H
CO
0
CO
CO
0
m fl
CO X. O
o H
X!Ba
fl ErH
H
o PhCO 1
. Xo fl
l-H
Eci
in U
CM bD. ci
o H
P
CQ
o OCM. Po
Tj
Uci
t$
flci
-P
CO
co
UJ
Di
D
O

53
H
rH
rH
E <D
rH
CD * -
&*
D) z ^\ rH
CDc/>
nV. c0
ji:z
<
Q>-
uP \ \
(/}TO
O
rt \ \tf \H \
(J
Z)1
CO
E \rH \rH \
cu
"O*-"
^ 0
QX E
a ammmCQ
TJrH 1
Ocr1 1
IAI*
z
z<>
u
rH
03 A
orH
cq
o
CQ
"tf*
CO
CO
CO
CQ
CO
rH
CO
oCO
03
CQ
o o o
*
>
o o O
Xo g
o H
CQ
0
o r-i
Di
CO
m * oC3 & -p
rH fl-p
o G0
EhDtH
Pao
03 0rH -p
.H
O X!ES
H
o
in o00 tH
rH -P
ci
O U
GH
-P
o CO
00 0
rH Eh- a
O Gu
flCQ
tN7-
UJ
oc
D
O

54
J^y
rH
03
^o -u-
/ +
/ fl
CO r>
13 rt
# fl^
CO * >7"H
CD
Vi E
sY.Z
^ rH
QCO 2
sCj
OTI-*
CO i
O 2
3 1
i/i
u CD
CD*
wmmn
cr
V^BB
^5
~a ca00
o *
1> Z
- rf
^T-^ / z
I
CQ
O
O
CM
in o m o
rH H o . o
co CO CO co
..
. .
o o
*
>
o o
03 XrH G.
H
o
0i-H
P.
E00 arH CO
O o# -p
5*
fl p
Gc* cdrH E
fctflO ri
Pa
0
-P
CO H
rH X!
o
tH
o
om H
rH-P
* rto Jh
GH
"tf*-P
rH cn
0O Eh
G*-
flCQ
CO*
UJ
Di
r>
o

55
o
co
CQ
in
<M
<MXfl
OH
0
rH
a
O
CQCO
CMo
O-p
-*
6 -p
flfl
0
E
inbD
T-l
CQPa
O0
-p
H
XJ
O
rH
CH
o
CQo
OH
-P
rt
M
fl
inH
O
CQCO
O0Eh
flrA
flCQ
o
CD
CO
in
in
CO
>
o
m
co
in
"tf<
CO
cn
Ul
Di
D
O

56
* c-
\ 03
\CO
flo 1 \
in
o 1 \ "tf*
CQrA
T T
a \ \o
iH \ \
E CO
-p
O
0
\ \1 \ *
CD03 Di
CO _
\ \l 1 ^
orJ*
CQl_ CQ\ \
_
C/> N.
0Eh
\ \ <#
- \ C^
I \
fc
O
in
CO
CM
o(/)CQ>-
CD
1
CQ
? CQ \ \o \ CQ
\ \ rH
in *
Z)i
+-*
CO
\ V
\ \\ }
CJ fl
oCO
CQ
o
CO
fl
o
O
rA
TJ0)
1
\ \
\ 3N
JrH
mtmm
LUCD
\ t CM aMM \ .
T3
o
*
ili
\ tm
H
*
\ 03 \ CQ 0
5t
\ V
\ \
O
H->
Grt
G
O
o
ra
CO
0
G
XO
H
X!
H CQ Eh
V < s CQO "JH fl E
.\rH O rH
rH, rH H
Ph
^g1
XGl-H
in O lO O
*tf< -Jl CO CO o
cD o o
#
o UJ
Di
D
O
> iH

57
CO
G
O
rH
ori
a
ra
CO
CO
0
G
Xo
ri
X!Eh
siH
ri
UaI
44fl
in
rH
CO
O
o
rH
CO
o
m
oco
*
>
O
o
CO
CM
UJ
Di
D
O
Ll,

58
co
G
Ou
o
ri
a
GH
CO
0
CO
CO
0
G
XOH
XI
H
PhI
XG
O
COCO
m
m
co
o
m
co
m"tf<
CO
*
S=e
>
CQ
(NJ
UI
Di
O
lZ