Embed Size (px)
Citation preview

EVALUATION AND SELECTION OF INNOVATION PROJECTS
Hugo Aléxis Alves Ribeiro
Thesis to obtain the Master of Science Degree in
Mechanical Engineering
Supervisor: Prof. Elsa Maria Pires Henriques
Examination Committee
Chairperson: Prof. Rui Manuel dos Santos Oliveira Baptista
Supervisor: Prof. Elsa Maria Pires Henriques
Member of the Committee: Prof. Paulo Miguel Nogueira Peças
November 2015


I
Abstract
Innovation plays a major role in the growth and economic competitiveness of companies, industries and
countries. Innovation projects are strong consumers of resources and their potential benefits occur in a long
time horizon, therefore, it is essential to develop the capacity to assess the potential performance and return
of the investment in innovation projects, which will allow companies to focus their efforts on the projects with
the highest expected return.
This thesis focused on the different approaches and methods used in the literature for evaluating and
prioritizing projects at the early stages of innovation in a context of limited resources. An exhaustive list of
different criteria and descriptors of performance was developed, establishing the foundation for the
methodology for project selection here proposed, which consists on the setting, structuring and execution of
the evaluation, risk analysis, resource allocation, decision and conclusions. This objective procedure involves
multicriteria decision-making, deals with the risk and uncertainty in innovation and supports the construction
of a portfolio of projects, therefore capturing the complexity of the problem while being simple to understand,
apply and adapt to specific company needs and constraints. It can thus constitute a valuable aid for companies
to build their own project selection process or to compare with the currently implemented one.
Keywords
Project selection; Innovation; Project portfolio management; Multicriteria decision-making.

II
Resumo
A inovação desempenha um papel importante no crescimento e competitividade económica de empresas,
indústrias e países. Os projetos de inovação são fortes consumidores de recursos e os seus potenciais
benefícios ocorrem num horizonte temporal futuro, como tal, é essencial desenvolver a capacidade de avaliar o
potencial desempenho e retorno do investimento em projetos de inovação, o que permitirá às empresas
centrarem os seus esforços nos projetos com maior retorno esperado.
Esta tese baseou-se nas diferentes abordagens e métodos utilizados na literatura para avaliar e prioritizar
projetos nas fases iniciais da inovação, num contexto de recursos limitados. Uma lista exaustiva de critérios e
descritores de desempenho foi criada, estabelecendo as bases para a metodologia de selecção de projectos
aqui proposta, composta pela definição, estruturação e execução da avaliação, análise de riscos, alocação de
recursos, decisões e conclusões. Este procedimento objetivo envolve a tomada de decisão multicritério, lida
com o risco e incerteza na inovação e apoia a construção de um portefólio de projetos, captando assim a
complexidade do problema e, simultaneamente, sendo simples de entender, aplicar e adaptar às necessidades
e limitações específicas das empresas. Esta tese pode, consequentemente, constituir uma ajuda valiosa para as
empresas que queiram construir o seu próprio processo de seleção de projetos ou comparar com o que têm
atualmente implementado.
Palavras chave
Seleção de projetos; Inovação; Gestão de portefólio de projetos; Decisão multicritério.

III
Index
Abstract .................................................................................................................................................................... I
Resumo ................................................................................................................................................................... II
List of figures .......................................................................................................................................................... IV
List of tables ............................................................................................................................................................ V
1. Introduction.................................................................................................................................................... 1
1.1. Innovation in Companies ....................................................................................................................... 1
1.2. An Overview of Project Selection .......................................................................................................... 2
1.3. Motivation and Objectives of the Thesis ............................................................................................... 3
1.4. Background of the Example of Application ........................................................................................... 3
1.5. Structure of the Thesis .......................................................................................................................... 4
2. State of the art ............................................................................................................................................... 5
2.1. Project Selection .................................................................................................................................... 5
2.2. Project Selection Models ....................................................................................................................... 7
2.3. Criteria used in Project Selection Models ............................................................................................ 16
2.4. Risk and Uncertainty ............................................................................................................................ 19
2.5. Common mistakes in Project Selection ............................................................................................... 22
2.6. Literature Research Conclusions ......................................................................................................... 23
3. Methodology for Project Selection .............................................................................................................. 24
3.1. Setting the Evaluation Process ............................................................................................................ 26
3.2. Structuring the Evaluation ................................................................................................................... 41
3.3. Project Evaluation ................................................................................................................................ 44
3.4. Risk Analysis ......................................................................................................................................... 46
3.5. Resource Allocation ............................................................................................................................. 49
3.6. Decision and Conclusions .................................................................................................................... 52
3.7. Computational tool: M-MACBETH ....................................................................................................... 53
3.8. Project Portfolio Management ............................................................................................................ 54
4. Example of application ................................................................................................................................. 55
4.1. Setting the Evaluation Process ............................................................................................................ 55
IV
4.2. Structuring the Evaluation ................................................................................................................... 60
4.3. Project Evaluation ................................................................................................................................ 63
4.4. Risk Analysis ......................................................................................................................................... 66
4.5. Resource Allocation ............................................................................................................................. 67
4.6. Decision and Conclusions .................................................................................................................... 69
5. Conclusion .................................................................................................................................................... 70
5.1. Summary .............................................................................................................................................. 70
5.2. Findings ................................................................................................................................................ 70
5.3. Contributions ....................................................................................................................................... 70
5.4. Challenges and Limitations .................................................................................................................. 71
5.5. Applications of this Thesis ................................................................................................................... 71
5.6. Recommendations for Future Development ....................................................................................... 71
6. References .................................................................................................................................................... 72
List of figures
Fig. 1: Innovation Value Chain [10] ......................................................................................................................... 2
Fig. 2: Popularity of methods employed [25] ........................................................................................................ 15
Fig. 3: Popularity of the criteria [25] ..................................................................................................................... 18
Fig. 4: Different risk methods [27] ........................................................................................................................ 21
Fig. 5: Diagram of the project selection methodology .......................................................................................... 25
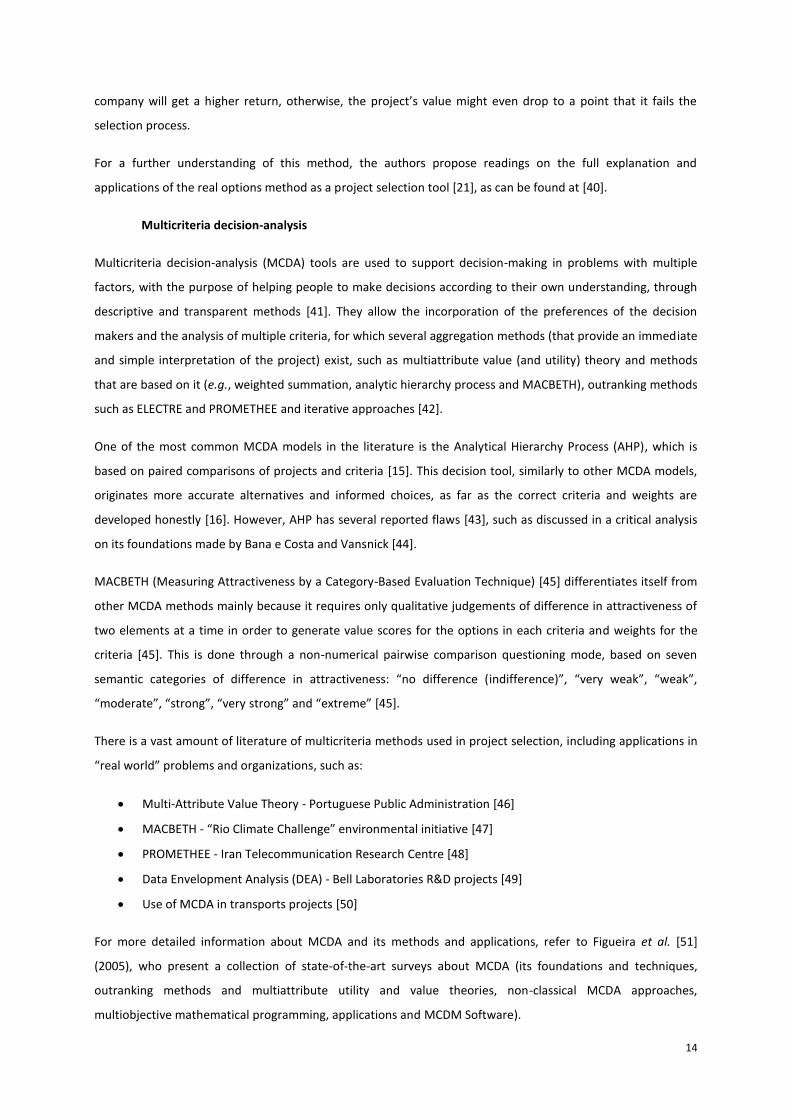
Fig. 6: List of possible criteria ................................................................................................................................ 27
Fig. 7: Example of a piecewise-linear function ...................................................................................................... 36
Fig. 8: Example of a continuous value function [faculty evaluation] .................................................................... 37
Fig. 9: Example of the determination and use of a value function ....................................................................... 38
Fig. 10: Fictitious alternatives A and B (adapted from [73]) ................................................................................. 39
Fig. 11: Swings between the reference levels (adapted from [73]) ...................................................................... 40
Fig. 12: Project type filter (adapted from [22]) ..................................................................................................... 41
Fig. 13: Triage filter (adapted from [22]) ............................................................................................................... 44
Fig. 14: Graph of overall scores ............................................................................................................................. 46
Fig. 15: Probability of Success VS Overall Score (adapted from [ref5]) ................................................................ 47
Fig. 16: Efficient frontier [16] ................................................................................................................................ 47
Fig. 17: Prioritisation of projects by their benefit-to-cost ratio and by their benefits only [12] ........................... 49

V
Fig. 18: Innovation Effectiveness Curve [80] ......................................................................................................... 51
Fig. 19: Company criteria ...................................................................................................................................... 56
Fig. 20: Tree of identified criteria .......................................................................................................................... 56
Fig. 21: Performance levels of criterion "Durability" ............................................................................................ 58
Fig. 22: Judgements matrix and value function of criterion "Net present value” ................................................. 59
Fig. 23: Weighting matrix of judgements .............................................................................................................. 59
Fig. 24: Weights histograms (at the left, proposed by M-MACBETH, at the right, a possible adjustment) .......... 60
Fig. 25: Tree of selected criteria ............................................................................................................................ 61
Fig. 26: Options and table of performances.......................................................................................................... 62
Fig. 27: Table of overall scores .............................................................................................................................. 63
Fig. 28: Sensitivity analysis on criterion C4 ........................................................................................................... 64
Fig. 29: Robustness analysis (0% variation) ........................................................................................................... 65
Fig. 30: Robustness analysis (10% variation on the left, different variations on the right) .................................. 65
Fig. 31: Probability of success VS Overall score .................................................................................................... 67
Fig. 32: Portfolios of projects ................................................................................................................................ 68
List of tables
Tab. 1: Various kinds of project selection methods (adapted from [19]) ............................................................... 8
Tab. 2: Comparison of project selection methods (adapted from [19]) ................................................................. 9
Tab. 3: Descriptor of performance of Market Attractiveness ............................................................................... 28
Tab. 4: List of possible descriptors of performance .............................................................................................. 29
Tab. 5: Example of reference levels (adapted from [64]) ..................................................................................... 34
Tab. 6: Table of performances .............................................................................................................................. 43
Tab. 7 Table of scores............................................................................................................................................ 45
Tab. 8: Table of overall scores ............................................................................................................................... 45
Tab. 9: Table of expected benefits ........................................................................................................................ 48
Tab. 10: Table of portfolios ................................................................................................................................... 50
Tab. 11: Descriptors of performance .................................................................................................................... 57
Tab. 12: Table of performances ............................................................................................................................ 62
Tab. 13: Table of expected value .......................................................................................................................... 66
Tab. 14: Possible portfolios of projects ................................................................................................................. 68

1
1. Introduction
This chapter provides an overview of project selection, its importance and the challenges in executing it, as well
as its role in the innovation value chain. The motivation and objectives of this work are then stated, followed by
the background of the example of application and the structure of this thesis.
1.1. Innovation in Companies
“Innovation, at the level of an individual firm, might be defined as the application of
new ideas to the firm, regardless of whether the new ideas are embodied in
products, processes, services, work organization, marketing or management
systems.”
Credited to Gibbons et al. [1] in [2]
Innovation strengthens the growth and dynamism of all economies and, while not a goal in itself, can play a
critical role in leading the world to a more sustainable growth path following the financial crisis, according to
OECD’s “Innovation Strategy 2015” [3]. In companies, it is also increasingly more imperative as consumer
demand becomes more sophisticated and competition more intense [4]. Consequently, companies invest in
innovation to increase competitive advantage, for instance, by gaining market share, reducing costs or
increasing productivity, spending on average 1-2% of turnover on various innovation-related activities [4]. In
turn, 5-7% of their turnover comes from products that are new to the market in most countries (6.24% in
Portugal) [4].
BCG’s 2010 global survey of senior executives on their innovation practices [5], responded by 1590 executives
representing all major markets and industries, reports that 72% of respondents say that innovation is one of
their company’s top-three priority. Furthermore, 61% of companies plan to increase their innovation spending,
most likely motivated by their rising satisfaction with their returns on innovation spending [5]. These
investments in innovation-related activities are also encourage by governments, who implement policies to
stimulate R&D, both directly (through grants or loans) and indirectly (through fiscal incentives) [3]. Hence,
public funding of innovation projects aims to produce more innovation by assisting companies to undertake
more development work, thus producing more innovation and ultimately resulting in increased financial
performance [6].
R&D projects are therefore a fundamental component of innovation and a crucial factor in developing new
competitive advantages [7]. For this reason, the Project Management Institute (PMI) calls project practitioners
“the engines of innovation” [8].

2
1.2. An Overview of Project Selection
Although there is a widespread belief that higher R&D spending translates into higher economic performance,
studies shows that there is no relationship between R&D spending and corporate success [9]. According to
Kandybin and Kihn [10], for companies to maximize their return on innovation investment (ROI2), a well-
organized innovation value chain (Fig. 1) is required, mastering four critical sets of capabilities: ideation, project
selection, development and commercialization.
Fig. 1: Innovation Value Chain [10]
At the start of this chain is the suggestion of several ideas and concepts that are conveyed through project
proposals. However, usually only a very small fraction can be selected since resources are limited, therefore,
there must be a professional method for prioritizing each potential project, just as there are systems to
manage the execution stages [11] (development and commercialization). This task is complex and difficult
because many options are present and resources have to be allocated considering costs, risks and benefits [12],
which are often uncertain and sometimes intangible.
A project is “a unique process, consisting of a set of coordinated and controlled
activities with start and finish dates, undertaken to achieve an objective conforming
to specific requirements.”
International Organization for Standardization [13]
Project selection is, therefore, a key part in this multifunctional capability that is innovation [10], which always
comes into play when the number of potential projects exceeds the number that can be effectively undertaken
within time and money constraints [14]. There are several different approaches to deal with project selection,
which should be part of an explicit formalized tool for portfolio management and applied consistently [15].
Regardless of the approach chosen by the company, choosing the right projects is a crucial step in ensuring
good project management [16], though it is not enough to guarantee innovation success [10].
The project selection problem has received plenty of attention in the literature at least since the 1960s [17],
[18], describing an abundant variety of approaches and models designed to support decision making in this
domain and taking into account different aspects and perspectives of the problem. They have evolved from
simple cost analysis to integer and linear programming to more flexible methods, such as fuzzy mathematical
3
programming [19]. However, more recent models have tried to consider more qualitative factors involved in
decision processes [20], which can easily be considered in scoring models.
The books on project management by Meredith and Mantle (2009) [21] and Pinto (2010) [16] have presented
various project selection models, criteria, examples and requisites for these models, among others. Regarding
criteria, there is an endless amount in the literature ([14], [16], [21], [22], [23], [24], [25]), which vary with the
type of projects and the models used for the selection. Sokmen [24] provides a list of the different methods
and criteria used until 2013.
In what concerns the analysis of risk, typical of innovation projects, most models developed and referred in the
literature rely on the determination or estimation of probability distributions to deal with uncertainty in some
parameters associated with the decision, as in [21] and [26], using them to estimate the risk profiles or
probability distributions of the outcomes of the decision [21]. However, risk is also sometimes treated as
criteria rather than as probabilities [12]. Ilevbare [27] presents a list of around 50 different methods and
techniques for addressing uncertainty and risk
1.3. Motivation and Objectives of the Thesis
Despite the importance of project selection and the existence of various approaches to deal with it, the
industrial use of these models is limited [17], [28], since models are not able to capture the complexity of the
problem [28] or, in contrast, they are excessively complex and mathematically elaborate themselves for
decision makers to systematically apply [17], [18], sometimes even requiring the assistance of an expert
decision analyst [17]. Bin et al. [18] recently pointed out that there is still the need for additional efforts in this
field, mostly to deal with complexity in a less complex way [18], which motivated the execution of this work.
In this context, an extensive research was conducted on the different criteria, descriptors of performance
(scaling statements) and methods used in the literature, as well as on the risk and uncertainty in innovation,
the construction of a portfolio of projects, the requisites of project selection tools and the most common
mistakes in these methods and in decision-making. As a result, a comprehensive methodology to assist
companies in selecting innovation projects is proposed, which intends to capture the complexity of the
problem and enable its application to different types of projects and companies. At the same time, it aims to be
simple to understand, apply and adapt to the specific needs of the company.
1.4. Background of the Example of Application
In order to exemplify how the developed methodology for project selection can be applied, a real case of
project selection was chosen. It was conducted in the context of a PhD Thesis [29] on the innovation in SMEs
(small and medium enterprises), where eco-design related ideas were evaluated for new product/process
development in Fapil, S.A., a manufacturer of domestic products. Innovation and sustainability are becoming
increasingly more critical in industrial companies, where mechanical/production engineers are often

4
responsible for the development of new products and processes that have to balance financial factors with
product/production characteristics, market and strategy, among others, consequently making a real example
like this more interesting and robust than a purely fictitious one.
1.5. Structure of the Thesis
The remainder of this thesis is organised into the following four chapters. Chapter II provides the foundation
for this work through the review of relevant literature. It introduces the project selection problem and
summarizes several methods to support it, as well as diverse criteria used in these models, including risk and
uncertainty. Finally, a discussion of common mistakes in project selection is made. Chapter III proposes a
comprehensive methodology to assist companies in selecting innovation projects, based on multicriteria
decision-making, which includes the evaluation of projects, risk analysis and resource allocation, resulting in a
final proposed portfolio of projects. Chapter IV presents an example of application of the methodology for
project selection. Chapter V concludes the thesis and indicates areas for further research.

5
2. State of the art
Since the beginning of the era of modern project management (around 60’s to early 00’s) project managers
focused on successfully completing projects (on time, within budget and with quality) and satisfying
stakeholders [14]. Project managers grew to be respected professionals that strived for project success, which
not always translated into business success, invoking the need for the postmodern era of project management
- Project Portfolio Management (PPM) [14]. Harvey A. Levine, former president of the board of directors of the
Project Management Institute, proposes the following definition for PPM:
PPM is a set of processes, supported by people and tools, to guide the enterprise in
selecting the right projects and the right number of projects and in maintaining a
portfolio of projects that will maximize the enterprise’s strategic goals, efficient use
of resources, stakeholder satisfaction and the bottom line.
Levine [14]
The primary components of the PPM process are the “prioritization and selection of candidate projects for the
portfolio” and “maintaining the pipeline: continuing, delaying or terminating approved projects” [14]. In this
chapter, the state of the art regarding the first component of PPM, project selection, is presented, as well as a
body of literature on this subject from the last 55 years. Different methods for prioritizing and selecting
projects are explained, followed by the criteria used, the risk in innovation and the most common mistakes in
project selection.
2.1. Project Selection
Prioritizing and selecting potential projects is one of the major challenges in PPM, which is one of the main axes
of management models of public and private organizations involved in research, development and innovation
activities [18]. For this reason, there is a large amount of literature dedicated to the project selection problem
at least since the 1960s [17], [18], describing an abundant variety of approaches and models designed to
support decision making in this domain and taking into account different aspects and perspectives of the
problem. In 1990, Harry M. Markowitz was awarded the Nobel Prize for having developed the theory of
portfolio choice, analysing investments in assets that differ in their expected return and risk (by performing
mean-variance analysis) [30], which led to the use of portfolio management in several other areas, particularly
in project management [31].
The first models for project prioritization and selection used return on investment (ROI) as the primary decision
criteria, to which more formal quantitative techniques followed, such as scoring and optimization models [32],
with developed mathematical tools becoming increasingly sophisticated but with no industry acceptance [20].
As a result, more recent models have tried to consider more qualitative factors involved in decision processes
[20].

6
Bretschneider [33] provides a complete list of project selection research from 1959 to 1990, were the
benefit/cost analysis is among the earliest references of prioritization methods. Henriksen and Traynor [17]
present an overview of the R&D project selection literature up to 1995. Graves and Ringuest [26] deliver the
latest work in this field, as of 2003, predominantly on mathematical programming. More recently, Meredith
and Mantle (2009) [21] and Pinto (2010) [16] presented various qualitative and quantitative project selection
models, as well as criteria, examples and requisites for this models, and, in 2014, Sokmen [24] organized a list
of the different methods and criteria used until 2013. There is also important work on the study of the “real
world” application of these models, such as [25] (2001), and on how to structure the scoring process for
prioritizing and selecting innovation projects [22] (2014), both of which, together with [23], include valuable
criteria that are present in the next chapter.
While literature about R&D is the most common, there is now also a great amount of work describing
Information Technology (IT) and New Product Development (NPD) portfolio selection (which is often
considered as R&D), however, it is usually assumed that the models apply equally well to R&D and IT project
selection [26], or to other capital spending projects, even though the specific criteria used for each type will
unsurprisingly differ. According to Levine [14], the process of project portfolio selection is comparable to the
one used in selecting items for an investment portfolio, which they actually are, since the company invests in
projects with the objective of maximizing the return.
“The Standard for Portfolio Management - Third Edition”, issued in 2013 by the PMI [34], identifies portfolio
management processes generally recognized as good practices, including the selection and prioritization of
projects. After the selection of the portfolio of projects, during the different stages of their life cycle, there are
two popular and proven techniques for the periodic evaluation of project status and performance [14]: earned
value analysis (EVA) and the Stage-Gate® process.
The EVA technique, which works best in conjunction with critical path scheduling techniques (CPM), compares
the value of the work scheduled with that of the work performed, at any point in time, enabling managers to
monitor schedule and cost variances in a consistent and structured manner [14]. Levine [14] describes in a
simple way the essentials of EVA and even presents a glossary of terms used in calculations.
The father of the Stage-Gate® process is Robert G. Cooper, widely recognized as a new product development
guru and a strong contributor to PPM, and though he developed the Stage-Gate® concept primarily for NPD
and technology development (which can be found in chapter 7.1 of [14]), it is frequently applied to PPM [14]. In
this process, each stage of the project life cycle is separated by a gate, which is a decision point where the
project is evaluated by a cross-functional team against pre-defined conditions for passing to the next stage.

7
2.2. Project Selection Models
Models are used to extract and deal with the relevant information about a problem, since reality is far too
complex to handle entirely [21]. Therefore, every model, however sophisticated it may be, will always
represent only a part of the reality it intends to reflect and may only yield an optimal result in its own particular
framework [21].
A project-screening model can thus be a valuable tool for an organization to help in choosing projects, mainly if
it can generate useful information in a timely and useful fashion at an acceptable cost [16]. There are various
concerns to consider when selecting a model, as well as several different types, which are approached next.
Requisites of the models 2.2.1.
According to [35], the following five aspects are the most important in a project selection model, which have
been adopted by Meredith & Mantel [21] (who added the sixth factor) and Pinto [16], who propose slightly
different definitions for the characteristics.
1. Realism: accuracy of representation of the real world [35] and in reflecting the firm’s decision
situation, objectives, limitations, risks, etc. [21].
2. Capability: ability to analyse different types of decision variables [35] and to deal with the several
factors (multiple time periods, interest rate changes, etc.) [21].
3. Flexibility: breadth of applicability to various types of projects and problems [36] and ease of
modification in response to changes in the firm’s environment [21].
4. Use: ease of comprehension and application of the model [36]. Clear, easily understood by all
organizational members and rapidly executed [16].
5. Cost: expense of setting up and using the model [35] should be inferior to the potential benefits of the
project and low relatively to the cost of the project [21].
6. Easy computerization: easily gather, store and manipulate the information with widely available
software (such as Excel®) [21].
Kerr et al. [37] published a paper on the “Key principles for developing industrially relevant strategic
technology management toolkits” (2013) that presents a vast list of “good practice” principles for technology
management tools observed by several authors, many of which apply to project selection tools in particular,
such as:
Robust (theoretically sound and reliable).
Economic, simple and practical to implement;
Integrated to other processes and tools of the business;
Flexible (adaptable to suit the particular context of the business and its environment).

8
Types of models 2.2.2.
There is an extensive amount of methods that have been used for project selection, from simple cost analysis
to integer and linear programming or more flexible methods, such as fuzzy mathematical programming [19].
Bretschneider [33] lists research on project selection dating as far as 1959, where multiple criteria and
mathematical programming methods were already used. Badri et al. [38] refer papers using the following
methods: scoring, ranking, decision trees, game-theoretic approach, Delphi technique, fuzzy logic, analytical
hierarchy process (AHP), goal programming, dynamic programming, linear 0–1 programming, quadratic
programming and non-linear programming. Dey [39] also refers goal and linear programming models, AHP and
fuzzy theory, adding the use of utility functions. Some methods can even be used together, as can be seen in
[19] and [38], which further increases the amount of possible techniques to be used for project selection.
Probably for this reason, authors usually present and discuss categories of project selection methods (such as
[16], [21] and [25]), rather than specific methods, as will also be done here later.
Tab. 1 shows several methods for project selection that have been used in different project selection decision
problems, such as construction, bid evaluation, information systems and R&D. The references to the
corresponding published papers can be found at [19].
Tab. 1: Various kinds of project selection methods (adapted from [19])
Decision method/model Decision problem
Net present value method Programming investment project selection
Cost analysis (e.g. NPV, DCF and payback) Construction project selection
Ranking and non-weighted model Project investment selection decision
Analytical hierarchy process (AHP) Industrial project selection
Multiattribute utility theory in conjunction with PRET Construction project selection
Linear and integer programming Construction project selection
Utility-theory model Bid markup decisions
Fuzzy outranking method Design evaluation
Competitive bidding strategy model Construction project selection
Multiattribute analysis in conjunction with regression models Public sector design-build project selection
Strategic classes IS project selection
Fuzzy multicriteria selection The aggregation of expert judgments
Fuzzy preference model Construction project selection
Fuzzy logic Software product selection
Mathematical programming Vendor selection decision
GREY Bid project selection
TOPSIS Bid decision making
Fuzzy stochastic Construction project selection
ELECTRE I Construction project selection
Mixed 0-1 goal programming IS project selection
Possibility theory Project investment decision
Mathematical programming R&D project selection
Analytic Network Process (ANP) R&D project selection

9
Decision method/model Decision problem
Fuzzy-logic New product development project selection
ANP Construction project selection
ANP in conjunction with Delphi and 0-1 goal programming IS project selection
Packing-multiple-boxes model R&D project selection
AHP and multiple-attribute decision-making technique Industrial project selection
Fuzzy mixed integer programming model R&D optimal portfolio selection
Chance-constrained zero-one integer programming models Random fuzzy project selection
As it can be observed, there are methods that are used for different decision problems, such as mathematical
programming, and there are decision problems that were carried out with different methods, such as
construction project selection. Therefore, it can be concluded that there is not a specific method for a certain
situation, but rather that there is a broad range of possibilities and applications. The advantages and
disadvantages of the methods should be weighted for the particular decision problem at hand in order to
choose the most appropriate one. Tab. 2 presents the explanation of some of the previous methods and
corresponding advantages and disadvantages.
Tab. 2: Comparison of project selection methods (adapted from [19])
Decision method
Method description Advantage Disadvantage
Cost analysis (e.g. NPV, DCF and payback)
It uses cost accounting and other relevant information to look for ways to cut costs and then to choose the project with the highest benefit
Controls costs and prevents waste and losses It only focuses on costs
and ignores the cost-benefit principle
Easy for the decision makers to select
Linear programming
Linear programming is a technique for optimization of a linear objective function, subject to linear equality and inequality constraints
Achieves the best outcome in a given mathematical model, given a list of requirements represented as linear equations
Perhaps no optimal solution can be found
Integer programming
A type of mathematical programming whose variables are (all or partially) integer in the problem
Greatly reduces the solution time and space
More difficult to solve than linear programming
Fuzzy logic
Fuzzy logic is a form of multi-valued logic derived from fuzzy set theory to deal with reasoning that is approximate rather than precise
It is a powerful tool to handle imprecise data
Fuzzy logic is difficult to scale to larger problems
AHP
A mathematical decision making technique that allows consideration of both qualitative and quantitative aspects of decisions
It reduces complex decisions to a series of one-on-one comparisons and then synthesizes the results
It depends on the expert's experience
The comparison and judgment process is rough, which cannot be used for high precision decision-making

10
Decision method
Method description Advantage Disadvantage
ANP It is a mathematical decision making technique similar to AHP
It can deal with the project evaluation problems
Requires large amounts of data and the decision depends on the expert's experience
Grey Target Decision
Grey Target Decision has a certain original effect on dealing with the pattern recognition problem with small samples, poor information, insufficient data and under uncertain conditions
Does not need a large number of samples and the samples do not need to have regular distribution
The optimal solution may not be the global optimization situation
It can more deeply describe the nature of things with small computational load
The results of quantitative and qualitative analysis will be consistent
It can be used for short-term or long-term predictions and is of high accuracy
Cooper et al. [25] divide the different methods into the following six categories:
1. Financial methods, such as NPV, ROI or payback period, can be used to rank-order projects against
each other or to make Go/Kill in comparison with determined acceptable levels.
2. Business strategy is used to allocate money across different types of projects. For instance, the
strategic buckets method divides the projects by buckets, that represent different dimensions (such as
type of market, type of development, product line, project magnitude, technology area, platform
types, strategic thrust or competitive needs) and distributes the money across the buckets. Then,
projects are rank-ordered within each bucket (through a financial, scoring or any other method) and
the money is spent progressively until the limit is reached for each bucket. With this method, the
spending is forced to mirror the business’s strategy [25].
3. Bubble diagrams (or portfolio maps) are used to plot projects on an X-Y plot or map (usually the
traditional risk-reward diagram [25]), categorizing them according to the quadrant they are in (e.g.:
pearls, oysters, white elephants and bread-and-butter projects).
4. Scoring models consist on scoring the projects on several criteria, for example, with {1, 2, 3, 4, 5}
scales, and then aggregating them to obtain a total score. This can be achieved by simply adding the
partial scores (unweighted scoring model) or by attributing weights to the criteria and doing a
weighted sum (weighted scoring model).
5. Check lists are a set of Yes/No questions that are answered for each project. The number of questions
answered positively can be used for prioritizing projects or to make Go/Kill decisions.

11
6. Others: all methods that do not fit in the above five categories, such as:
a. Multiple criteria without a formal scoring model;
b. Probabilities of commercial and technical success;
c. Methods that are variants or hybrids of methods comprised by the above categories;
d. Informal methods, such as decisions based on experience, top management
orders/preferences or simply intuition. Mitchell et al. [22] state that intuition can be
wonderfully effective if it derives from strong experience but surprisingly misleading in
unfamiliar situations – which is certainly the case in innovation projects – and so as much
logical structure as possible should be used to support the decision.
These categories are now further explained and some advantages and disadvantages are presented.
Financial methods 2.2.3.
According to Meredith & Mantel [21], the frequently mentioned ROI (Return On Investment), does not have a
specific method of calculation, but usually involves the NPV (Net Present Value) or the IRR (Internal Rate of
Return). Furthermore, they state that in project/investment evaluation the payback period is one of the most
commonly used, occasionally including discounted cash flows, since managers favour short payback periods in
order to minimize risk. The advantages and disadvantages of financial methods [21] are now presented:
Advantages:
1. Simple to use and understand.
2. Use readily available accounting data to determine cash flows.
3. Model output is familiar to decision makers and is usually on an “absolute” profit scale, allowing
“absolute” Go/Kill decisions.
4. Some profit models can be adjusted to account for project risk.
Disadvantages:
1. Ignore all non-monetary factors (except risk).
2. Models that do not include discounting ignore the timing of the cash flows and the time–value of
money.
3. Models that reduce cash flows to their present value are strongly biased toward the short run.
4. Payback-type models ignore cash flows beyond the payback period.
5. The internal rate of return model can result in multiple solutions.
6. Sensitive to errors in the input data for the early years of the project.
7. Non-linear, and the effects of changes/errors in the variables/ parameters are generally not
obvious to most decision makers.
8. Even though they depend on the determination of cash flows for the inputs, it is not clear exactly
how the concept of cash flow is properly defined for the purpose of evaluating projects.

12
Business strategy 2.2.4.
According to Cooper et al. [25], numerous businesses using the strategic buckets approach do not use a formal
ranking method to prioritize projects within a bucket, which indicates that strategy drives not only the
allocation by bucket but also within buckets. As a result, important indicators, such as risk or monetary factors,
might not be considered and, therefore, negatively influence the decision. Furthermore, the resulting portfolio
will possibly not have the maximum cumulative benefit for the available budget, since money can be left over
when allocating it across and within buckets.
Bubble diagrams 2.2.5.
Even though bubble diagrams appear to be more of a supporting tool than a dominant method for project
selection, their use is strongly recommended by managers, who believe that they are an effective decision tool,
yielding correct portfolio decisions [25]. Moreover, they enable managers to portray the entire portfolio in a
visual format and display portfolio balance.
Scoring models 2.2.6.
Scoring models, which differ extensively in their complexity and information requirements, have been
developed to use multiple criteria to evaluate projects, and they include the “Unweighted 0–1 Factor Scoring
Model”, equivalent to a checklist, the “Unweighted Factor Scoring Model” and the “Weighted Factor Scoring
Model” [21]. The advantages and disadvantages of scoring models [21] are now presented:
Advantages:
1. Multiple criteria can be used for evaluation and decision making, including profitability methods
and both tangible and intangible criteria.
2. Structurally simple and therefore easy to understand and use.
3. They are a direct reflection of managerial policy.
4. Easily modified according to changes in the environment or managerial policy.
5. Weighted scoring models allow to consider the relative “importance” of the criteria.
6. Allow easy sensitivity analysis, since the trade-offs between the several criteria are readily
noticeable.
Disadvantages:
1. The project score is strictly a relative measure, therefore, it does not represent its absolute value
and does not directly indicate whether or not the project should be supported.
2. Generally, scoring models are linear in form and the elements of such models are assumed to be
independent.
3. The ease of use of these models is conducive to the inclusion of a large number of criteria, most of
which have such small weights that they have little impact on the total project score.

13
4. Unweighted scoring models assume all criteria are of equal “importance”, which is almost certainly
contrary to the fact.
5. If profitability is included as criteria in the scoring model, this model will have the advantages and
disadvantages noted earlier for the profitability models themselves.
Pinto [16] states that most scoring models have important limitations, adding that they are influenced by the
relevance of the selected criteria and the accuracy of their weights, as well as by wrong interpretation and
usage of scales:
“If 3 means High and 2 means Medium, we know that 3 is better than 2, but we do
not know by how much. Furthermore, we cannot assume that the difference
between 3 and 2 is the same as the difference between 2 and 1.”
Pinto
In Chapter III a weighted scoring model is proposed, which took into account the above mentioned and
includes the construction of scales that do not fall into this mistake (i.e., the difference between two levels,
such as High and Medium, is well defined and readily noticeable through the use of value functions).
Check lists 2.2.7.
Check lists are usually employed as a Go/Kill decision tool for the individual project [25] due to the subjective
nature of the rating process [16] (using ratings such as high, medium, or low). If a check list is used to rank-
order projects, this is accomplished by simply counting the number of positive answers to obtain the final
score, which assumes that all criteria are equally “important”, almost certainly contrary to the fact [21].
Others 2.2.8.
Some examples of other methods for project selection are now presented.
Probabilistic financial models
They include decision trees and Monte Carlo simulation software or add-ons. Further explanation and
examples of these models can be found at [40].
Real options approach
The real options approach can be employed in parallel with project selection in order to reduce technological
and commercial risk [21]. According to Meredith and Mantel [21], it is based on the notion of “opportunity
cost” of an investment - the loss of potential gain from the other alternatives. If the investment in a project is
delayed, it may have a higher (or lower) value in the future, since uncertainty decreases with time. Therefore, a
project can be delayed if its NPV is expected to increase in the future and, if that prospect materializes, the
14
company will get a higher return, otherwise, the project’s value might even drop to a point that it fails the
selection process.
For a further understanding of this method, the authors propose readings on the full explanation and
applications of the real options method as a project selection tool [21], as can be found at [40].
Multicriteria decision-analysis
Multicriteria decision-analysis (MCDA) tools are used to support decision-making in problems with multiple
factors, with the purpose of helping people to make decisions according to their own understanding, through
descriptive and transparent methods [41]. They allow the incorporation of the preferences of the decision
makers and the analysis of multiple criteria, for which several aggregation methods (that provide an immediate
and simple interpretation of the project) exist, such as multiattribute value (and utility) theory and methods
that are based on it (e.g., weighted summation, analytic hierarchy process and MACBETH), outranking methods
such as ELECTRE and PROMETHEE and iterative approaches [42].
One of the most common MCDA models in the literature is the Analytical Hierarchy Process (AHP), which is
based on paired comparisons of projects and criteria [15]. This decision tool, similarly to other MCDA models,
originates more accurate alternatives and informed choices, as far as the correct criteria and weights are
developed honestly [16]. However, AHP has several reported flaws [43], such as discussed in a critical analysis
on its foundations made by Bana e Costa and Vansnick [44].
MACBETH (Measuring Attractiveness by a Category-Based Evaluation Technique) [45] differentiates itself from
other MCDA methods mainly because it requires only qualitative judgements of difference in attractiveness of
two elements at a time in order to generate value scores for the options in each criteria and weights for the
criteria [45]. This is done through a non-numerical pairwise comparison questioning mode, based on seven
semantic categories of difference in attractiveness: “no difference (indifference)”, “very weak”, “weak”,
“moderate”, “strong”, “very strong” and “extreme” [45].
There is a vast amount of literature of multicriteria methods used in project selection, including applications in
“real world” problems and organizations, such as:
Multi-Attribute Value Theory - Portuguese Public Administration [46]
MACBETH - “Rio Climate Challenge” environmental initiative [47]
PROMETHEE - Iran Telecommunication Research Centre [48]
Data Envelopment Analysis (DEA) - Bell Laboratories R&D projects [49]
Use of MCDA in transports projects [50]
For more detailed information about MCDA and its methods and applications, refer to Figueira et al. [51]
(2005), who present a collection of state-of-the-art surveys about MCDA (its foundations and techniques,
outranking methods and multiattribute utility and value theories, non-classical MCDA approaches,
multiobjective mathematical programming, applications and MCDM Software).

15
Behavioural approaches
According to Cooper et al. [15], these tools are intended to bring managers to a consensus in the project
selection decision and they are more useful at the early stage when only qualitative information is available.
Examples of these methods are the Delphi and Q-Sort techniques: Delphi is a technique for developing numeric
values that are equivalent to subjective, verbal measures of relative value [21]; the Q-Sort technique to
prioritize projects enables researchers to examine subjective perceptions of individuals on various topics and
measure the extent and nature of their agreements [31].
Popularity of the methods 2.2.9.
In 2001, Cooper et al. [25] developed a survey questionnaire answered by 205 member companies of
Washington’s Industrial Research Institute on the best practices of portfolio management. The results (in Fig. 2)
revealed that financial methods are the most popular for portfolio selection and also the most frequently used
as the dominant one, since many businesses use multiple methods.
Fig. 2: Popularity of methods employed [25]
As a result of this survey, Cooper et al. [25] noticed that the best performing companies do not give so much
emphasis to the financial models as the average and the worst performing companies do, being the business
strategy the main method applied. Furthermore, they recognise the limitations of the models and therefore
tend to use multiple methods, rather than a single one, in order to increase the information available to sustain
their decisions.
The study also identifies the scoring model as the third most used as the dominant method by the best
companies, after the business strategy and financial methods, which has the advantage of enabling the
combination of both strategic and financial criteria. Furthermore, they state that the 10.2% of the surveyed

16
companies that use the project’s financial value to rank-order projects and to make Go/Kill achieve slightly
higher performance than the businesses that use it for just one or none of these purposes.
2.3. Criteria used in Project Selection Models
According to Levine [14], even though the ROI (explained previously in Section 3.3.1 of this chapter) is one of
the primary factors for project prioritization, further aspects should be considered, such as alignment with
strategy, balance between maintenance projects and investment projects, effective allocation of resources,
probability of success and other non-financial benefits, all of which are handled throughout this work.
It is impossible to define a set of criteria suitable for all circumstances since they will strongly differ among
different companies and projects [22]. As a result, there is an endless amount of criteria referred in project
selection literature ([14], [16], [21], [22], [23], [24], [25]), which vary with the type of projects and the models
used for the selection, where the scoring models show the more extensive and vast set of criteria, usually
including more than just financial and strategic aspects. Likewise, there are different ways in which criteria can
be organized, such as by type of the criterion, which is the most common, but also by tangibility of the
criterion, as shown next.
Categories of criteria 2.3.1.
Some different ways of organizing criteria, different from the one proposed later in Chapter III Section 2.3, are
now presented. Further explanations or informations can be found in the respective author’s reference.
1. Eilat et al. [23]:
a. Financial (profitability, cash flow, cost vs. Budget, etc.).
b. Costumer (market value, stakeholder satisfaction, time to market, etc.).
c. Internal-business processes (contribution to the core competencies, mission and strategic
objectives of the organization).
d. Learning and growth (improvement on the capability of the human resources, systems and
organizational processes).
e. Uncertainty (probability of technical and commercial success, etc.).
2. Mitchell et al. [22]:
a. Volume (market size, sales potential, synergy opportunities, customer benefit, competitive
intensity in market).
b. Margin (increased margin, business cost reduction, industry / market readiness).
c. Platform for future growth (market growth, future potential).
d. Intangibles (learning potential, brand image, customer relations).

17
e. Characteristics of the product (product differentiation, sustainability of competitive, technical
challenge).
f. Skills and knowledge (market knowledge, technical capability).
g. Business processes (fit to sales and/or distribution, fit to manufacturing and/or supply chain,
finance).
h. Organisational backing (strategic fit, organisational backing).
3. Pinto [16]:
a. Risk (technical, financial, safety and quality risk, legal exposure).
b. Commercial (expected ROI, payback period, potential market share, etc.).
c. Internal operating issues (need to train employees, change in manufacturing or service
operations, etc.)
d. Additional factors (patent protection, impact on company’s image, strategic fit)
Another way of organizing the criteria can be done regarding the order of impact of the project’s cost and
benefits, similarly to what is done, for instance, in environmental disasters impact assessment. The difficulty in
the measurement/assessment of the costs and benefits increase when they change from direct to indirect and
from tangible to intangible. An example of how project criteria can be organized by their tangibility is proposed
next:
Direct and tangible (1st
order):
Direct (immediate) result of the project;
Easy measurement;
Example: net present value.
Indirect and tangible (2nd
order):
Indirect consequence of the project, which is more difficult to attribute to it;
Needs an additional tool for evaluation;
Example: complementary sales.
Intangible (3rd
order):
Intangible impacts resulting from the project that cannot be properly assessed monetarily;
Difficult to quantify;
Example: impact on brand image.
The advantage of this categorization is that it allows the company to choose different levels of complexity of
the procedure undertaken to determine the potential impacts of the projects. Naturally, if the categories are
not all considered the accuracy of the project’s benefit evaluation will be lower.

18
Intangible criteria 2.3.2.
The identification of intangible criteria related to the project should be done in order to understand the whole
scope of effects, both positive and negative, that derive from the project, not only after it is finished but also
while it is in progress. Furthermore, their impacts should be assessed whenever possible so as to determine
their impact on the company and its environment. However, this is usually difficult due to the intangible nature
of the criteria, which are difficult to quantify.
Meredith and Mantel [21] give a good example of the intangible impacts of a project: on the one hand, a
project for installing a kindergarten for the employees’ children can have substantial positive effects on their
morale and productivity; on the other hand, replacing a part of the workforce by new technology may make
sense financially but could hurt morale and productivity to a degree that it reduces profitability.
Other examples of intangible criteria are the potential for new products, new markets and learning
opportunities, brand image and customer relations [22] or regulatory, social and political impact [25].
More popular 2.3.3.
The survey questionnaire developed by Cooper et al. [25] also presented the most frequently used criteria (in
scoring models or check lists) to rank projects, as in Fig. 3. Similarly to the popularity of selection methods
presented previously (in Section 2.2.9 of this chapter), the strategic and financial aspects are the most
common.
Fig. 3: Popularity of the criteria [25]

19
Sokmen [24] presents a list of 47 different criteria used in project scoring and selection problems and several
authors using them, which can be helpful in choosing and understanding the criteria when developing the
project selection tool, in Section 3.1.1 of the next chapter.
2.4. Risk and Uncertainty
According to Mitchell et al. [22], decision theory makes a clear distinction between risk and uncertainty:
“The term risk is used when probabilities of the various possible outcomes are
known, either a priori (e.g. card games) or from objective data (e.g. health risks).
Uncertainty is used when no such objective probability data is available.”
Mitchell et al. [22]
Weber [52] places the use of “uncertainty” in strategic management into two categories: perceived
environmental uncertainty and decision-making under uncertainty, whose definitions are presented:
“Environmental uncertainty refers to the lack of complete knowledge and
unpredictability of the environment external to the organisation.”
Ilevbare [27]
“Decision-making under uncertainty, concerns choice-making circumstances where
information necessary for proper consideration of all the relevant factors associated
with a set of decision alternatives is incomplete. It is a result of insufficient
knowledge about the alternatives and their consequences, caused by limitations of
decision makers in information gathering and analysis.”
Simon [53] apud [27]
Nonetheless, the relationship between uncertainty and risk is rather ambiguous and open to different
interpretations, which is why this terms are frequently used interchangeably [27]. According to Keizer &
Halman [54], risk in innovation involves the outcome uncertainty, the level of control and the perceived impact
on the performance of the project. The outcome uncertainty of innovation activities is related to the gap
between what is available and necessary regarding knowledge, skills and experience, while the level of control
is the degree to which managers can anticipate risk factors and influence them towards the success of the
project. They conclude that an innovation issue will be perceived as “risky” if its uncertainty is high, its
controllability is low and its potential impact is high [54]. These authors [54] present the following list of 12
radical innovation risks categories, as one outcome of a case study in a company in the fast-moving consumer
sector, where 114 members of project teams where interviewed.
Product Family and Brand Positioning
Product Technology
Manufacturing Technology

20
Intellectual Property
Supply Chain and Sourcing
Consumer Acceptance and Marketing
Trade Customer
Competitors
Commercial Viability
Organization and Project Management
External
Screening and Appraisal
Risk analysis 2.4.1.
Many aspects of a project are uncertain, such as time, costs or benefits, and, even though this uncertainty may
sometimes be reduced, it usually cannot be eliminated [21]. In order to deal with this issue, risk analysis can be
applied, which provides managers with useful insight into the nature of the uncertainties that affect the project
[21]. Most models developed and referred in the literature about risk analysis rely on the determination or
estimation of probability distributions to deal with uncertainty in some parameters associated with the
decision, as in [21] and [26], using them to estimate the risk profiles or probability distributions of the
outcomes of the decision [21]. However, risk is also sometimes treated as criteria rather than as probabilities
[12].
Monte Carlo simulation is one of the most common methods used by risk analysis software, such as the
Microsoft Excel® add-ins @Risk® and Crystal Ball® of which examples of application can be found at [21] and
[40]. Despite its wide scientific use for decades, being even mentioned in the Project Management Institute’s
PMBOK (“A Guide to the Project Management Body of Knowledge”) [55], Monte Carlo simulation is not equally
established in the real practice of project management [56]. According to Kwak and Ingall [56], although this
tool is extremely powerful, it is only as good as the model it is simulating and the input information. The
authors state that in order to deal with the uncertainty associated with the information provide to the model,
detailed data and experience from previous similar projects can useful, however, these will rarely be available
in innovative projects. For further understanding the applications of Monte Carlo simulation for project
management, as well as its advantages and disadvantages, reading the article [56] is recommended.
A common tool to determine the “importance” of a risk is through a probability and impact matrix, which
combines the two dimensions of risk: probability of occurrence and impact on objectives if it occurs [55].
Ilevbare [27] presents a list of around 50 different methods and techniques for addressing uncertainty and risk,
which includes some of their characteristics (Fig. 4).

21
Fig. 4: Different risk methods [27]
Another frequent but simpler way to consider risks/uncertainty associated with projects in the selection phase
is through the probability (likelihood) of project success [26], which is more useful when probability
distributions are very hard to determine. Project success includes the probabilities of technical and commercial
success [23] explained next, which are commonly used in different methods as can be seen in [25].
Probability of technical success 2.4.2.
Cooper et al. [25] refer the following characteristics that influence the probability of technical success:
Technical gap;
Program complexity;
Existence of technological skill base;
Availability of people & facilities.
Probability of commercial success 2.4.3.
Cooper et al. [25] refer the following characteristics that influence the probability of commercial success:
Existence of a market need;
Market maturity;
Competitive intensity;
Existence of commercial applications development skills;
Commercial assumptions;
Regulatory/social/political impact.

22
Furthermore, Åstebro [57] concluded from a study of more than 500 R&D projects that the following
characteristics were excellent predictors of a project’s commercial success:
expected profitability;
technological opportunity;
development risk;
degree to which a project is appropriate for the organization.
Risk treatment 2.4.4.
Risk treatment deals with the identification and application of actions or measures that intend to mitigate risk,
which logically depend on the specific situation of the project, company and environment. ISO 31000:2009
“Risk management – Principles and guidelines” provides principles and generic guidelines on risk management
[58], as the following standard responses for risk treatment [27]:
Risk avoidance by not starting/continuing the activity that originates the risk;
Removing the risk source;
Changing the likelihood;
Changing the impact;
Sharing the risk with another party (e.g. insurance);
Retaining the risk by informed decision.
Risk mitigation strategies should thus be investigated and assessed by managers in order to fully understand
their effects and the effectiveness of the money spent, for example through cost/benefit analysis, because
even if its net effect (considering the cost of implementing the response) is an increased cost, that increase can
be justified by, for instance, the time it saves [59].
2.5. Common mistakes in Project Selection
According to Cooper et al. [25], the main reasons for ineffective portfolio management are the inexistence of
strategic criteria in project selection, resulting in efforts that do not support the company’s strategy, and of
consistent criteria for Go/Kill decisions, translating in the acceptance of low value projects and, consequently,
lack of focus in the ones with higher expected benefit. The criteria that is more used, in detriment of strategy,
is not surprisingly the financial, even though it alone does not capture the real richness of the projects [49] and
the over-reliance on financial models is commonly referred as one of the most critical mistakes made by
companies [16], [25], [42]. Cooper et al. [25] state that companies using financial methods as the dominant
portfolio selection method end up with the worst performing portfolios [25], for which they present three
reasons:

23
The sophistication of financial tools often far exceed the quality of the data inputs;
Important Go/Kill and prioritization decisions must be made at the early stages of the project,
precisely when financial data are less accurate;
Financial projections are fairly easy to manipulate, whether consciously or unconsciously.
Pinto [16] and Cooper et al. [25] also mention that the inexistence of a formal selection process means that the
selection of projects is based upon personal opinion of senior managers or politics rather than on objective
criteria, which sometimes drain financial resources until they yield satisfactory results. To avoid keep selecting
“losers”, Pinto [16] concludes, the key lies on the objectivity of the selection process, on a method that
incorporates both financial and nonfinancial criteria and on the acknowledgment that each method may only
be appropriate in certain situations, for a specific company and project circumstances.
Even considering the aforementioned, projects sometimes fail, i.e., exceed the timeline, overspend the budget
or underperform expectations [59]. According to Oracle’s White Paper on risk assessment [59], there are only
two reasons for this: overly optimistic plans and impact of external events (which should be considered during
risk analysis).
2.6. Literature Research Conclusions
The literature research allowed to understand the importance of project selection for the success of innovation
in companies but also the challenges they face in the application of project selection models. These challenges
arise because the available methods are usually too simple or excessively elaborate for most managers and
companies to understand and apply systematically [17], [18]. Furthermore, it allowed to notice that some
companies lack a formal selection process and, among the ones that do not, the most common mistakes that
lead to ineffective portfolio management are the over-reliance on financial models and the inexistence of
strategic criteria and criteria for Go/Kill decisions. It is therefore possible to conclude, as Bin et al. [18] recently
pointed out, that there is still the need for additional efforts in this field, which motivated the execution of this
work.
In this context, the following proposed methodology intends to deal with the complexity of the problem in a
less complex way, being simple to understand, apply and adapt to the specific needs of the company. At the
same time, it does not fall into the common mistakes mentioned above and approaches other areas related to
the project selection problem, such as risk analysis and resource allocation.

24
3. Methodology for Project Selection
Charvat [60] defines a methodology as a set of guidelines or steps that can be adapted and applied to a
particular situation, for example, a list of things to do in a project environment. Therefore, project managers
should not use methodologies they select just as they stand, but rather modify and tailor it in order to suit the
company’s needs [60]. Considering this, the objective of the proposed methodology is to assist companies in
selecting innovation projects to be pursued, among a set of projects proposals and in a context of limited
resources. It intends to be flexible in order to be adapted and customized to the specific needs of the company
and, at the same time, robust enough to enable its application to different types of projects and companies,
while considering the requisites for project selection tools referred in Section 2.2.1 of Chapter II. However, this
methodology is particularly helpful for companies that pursue projects with high uncertainty, such as projects
on technological innovation or new product development, due to the incorporation of risk and uncertainty in
the methodology.
The application of this methodology should be done by a team of decision makers, rather than a sole manager,
in order to eliminate the tendency to select projects by political means, power plays or emotion [14] but also to
gather a larger range of relevant knowledge and experience [22]. Even though this ensures the transparency of
the process, there can be conflicting opinions and preferences among different stakeholders and managers of
the company, since the individually optimal decision for each department is rarely collectively optimal [12]. In
some cases it might be worthwhile to execute a decision conference with the decision makers in order to
improve communication and understanding, ensuring their ownership of the model and their commitment to
the projects and company’s objectives [12]. Phillips & Bana e Costa [12] explain this social approach and its
combination with multicriteria decision analysis. The results obtained can therefore be influenced by the
number and experience of the decision makers, but also by the available data and the way it was obtained, the
choices regarding the selection of criteria, scoring the projects, among others, that is to say, the results will be
influenced by the overall effort allocated to this exercise. Nonetheless, it is a fairly simple method and does not
require complex mathematical models or formulations, for which software is sometimes recommended
throughout this work. This methodology, illustrated in Fig. 5, consists of the following main steps:
1. Setting the evaluation process: criteria identification, construction of descriptors of performance and
reference levels, criteria value functions and criteria weighting;
2. Structuring the evaluation: project type filter, criteria selection, project data collection and triage
filter;
3. Project evaluation: partial scores and overall scores;
4. Risk analysis;
5. Resource allocation;
6. Decision and conclusions.

25
Fig. 5: Diagram of the project selection methodology
The first phase of the
methodology (1), on the left, sets
the evaluation process for the
future project selection sessions. It
consists of steps that can be
executed in advance, since they do
not depend on the projects but
rather on the company, in order to
ensure that the selection of
projects is more consistent and
unbiased. This task is done once
and then occasionally reviewed,
according to changes in the
company’s objectives and situation.
The remaining parts of the
methodology (2, 3, 4, 5 and 6), on
the right, compose the structure of
an evaluation session. Before each
session, the results obtained in the
first phase should be reviewed and
confirmed, or adjusted to the
specific situation if needed.

26
Some references to the use of the M-MACBETH software, which is grounded on the MACBETH approach to
multicriteria decision-aid, are made throughout the text, since it can be used to apply the first two steps above.
Although its use is not mandatory, it has some advantages, therefore it is suggested and explained in Section 9
and an example of its application is demonstrated in Chapter IV.
The choice of a (weighted) scoring model was made considering the advantages and disadvantages of the
several different types of models presented in Chapter II, since it is as an effective prioritization tool [25].
Furthermore, according to Meredith and Mantel [21], scoring models allow the reflection of the multiple
objectives of organizations, are easily adapted to organizational and environmental changes and, at last, do not
suffer from the short-term vision inherent in profitability models when strategic criteria and other long-term
benefits and costs are included.
Cooper et al. [25] calls attention to the fact that, even though the users of scoring models find them effective
and efficient, the real value for decision makers is not to linger on the scores obtained but on the process of
walking through the criteria, discussing and gaining closure on each criterion.
3.1. Setting the Evaluation Process
In order to ensure that the selection of projects is more consistent and unbiased, i.e., not based upon personal
opinions and interests, it is proposed that some important stages of the evaluation process are undertaken
before starting to evaluate projects, which will set the evaluation process in future project selection sessions.
This part of the methodology needs to be done only once and then occasionally reviewed, according to changes
in the company’s objectives and situation. Evidently, at each project selection session, the results here
obtained should be reviewed and confirmed, or adjusted to the specific situation if needed.
Therefore, the following five steps will be executed in advance, since they do not depend on the projects but
rather on the company’s objectives: the criteria identification and the determination of the respective
descriptors of performance, reference levels, value functions and weights.
Criteria identification 3.1.1.
The first step is to identify the criteria that best reflect the company’s strategic goals, situation, typical project
characteristics, environment and other factors that may have an impact on the project or be a result of it.
Fig. 6 shows some of the most common criteria among the vast amount found in the literature (such as in [14],
[16], [21], [22], [23], [24] and [25]), divided by the following general groups: strategic, financial, market,
internal, project specifications and intangibles. This proposition of organization of the criteria may be adopted
or changed according to the set of criteria selected by the company and the preference of the managers. The
criterion marked with an (*) is discussed afterwards.

27
Fig. 6: List of possible criteria
Some common criteria in the project selection literature are discarded at this stage of the methodology,
namely “probability of technical and commercial success”, “technical/commercial capability” and “investment”
for the reasons stated below.
It is proposed that risk, reflected by the probability of success (as explained in Section 2.4.1), should be
addressed separately, in Section 3.4, so that a distinction can be made between value and risk at the project
selection stage [24]. There are a number of factors that may influence the probabilities of success, such as the
technical and commercial capability of the company, so one should be careful not to include these factors as
criteria if they are to be considered in the calculation of the probabilities of success, in order to avoid
considering the same factor twice.
Similarly, the financial investment of the project will also be excluded at this stage and considered later, during
the resource allocation procedure (Section 3.5), together with the overall benefit score obtained with this
process. However, if a company needs to select just one project, no portfolio analysis is needed and the
investment should be considered as a criteria. Furthermore, if the company uses a portfolio analysis software
that allows to take into account “synergies between projects” (as suggested in Section 3.5), this should not be
considered now as a criterion.
Project Criteria
Strategic
Fit
Impact
Financial
Funding
NPV, IRR, Discounted
payback
Reduction of operational
costs
Contribution to other sales
Market
Size
Maturity
Level of competition
Durability
Internal
Resource availability/
need
Organizational backing
Fit to manufacturing,
supply chain, distribution,
sales
Project specifications
Duration
Degree of improvement
Competitive advantage
*Synergy opportunities
Intangibles
Know-how gained
Brand image
Future potential
Costumer retention
Environmental, political and social impact

28
Descriptors of performance 3.1.2.
In order to evaluate the performance of a project on a certain criterion, it is proposed that a descriptor of
performance (i.e., an ordered set of plausible levels of performance [61]) is defined for each criterion, which is
how the project will be “measured” in that criterion. According to Bana e Costa & Beinat [62], it is intended to:
1. Operationalise the appraisal of impacts (performances or consequences) of options;
2. Describe more objectively the impacts of options;
3. Restrict the range of impact levels to a plausibility domain (by screening out impacts or options that
are non-admissible or out-of-context);
4. Verify the ordinal independence of the corresponding key-concern (criterion).
These descriptors, that can be quantitative or qualitative and continuous or discrete, will help at a later stage
to convert the performance of the projects on the criteria into a numerical score, through the use of value
functions [63]. Descriptors of performance are sometimes referred differently in the literature, for instance, as
“units of measurement” [23] or “scaling statements” [22]. The use of qualitative descriptors of performance is
very useful in the sense that they help the decision makers to consider incommensurable metrics and thus
handle more practically all the available information regarding the project.
Tab. 3 illustrates an example of a qualitative and discrete descriptor of performance and also shows that they
can be used to combine several indicators (in this example, the indicators could be “market profitability” and
“market maturity”).
Tab. 3: Descriptor of performance of Market Attractiveness
Levels Description
L1 Highly profitable and growing market
L2 Profitable and growing market
L3 Highly profitable but stagnated market
L4 Profitable but stagnated market
L5 Profitable but declining market
[good] Highly profitable but stagnated market
[neutral] Profitable but stagnated market
It should be noted that the levels of performance do not have to include every possible performance if the
rating is going to be done through value functions, since the value of a performance that stands between to
levels can be interpolated with the value function, as will be explained later in Section 0. Further information
about descriptors of performance and their construction can be found at [62]. Tab.4 presents a list of criteria
and suggested descriptors of performance for them, which should be faced as a guide to help the company in

29
constructing its own descriptors, since they strongly depend not only on the company’s preferences but also on
the characteristics of its projects. The following notes regarding the table should be made beforehand:
The criteria and descriptors of performance are presented as found in the corresponding references
and organized by the previously suggested groups (strategic, financial, market, internal, project
specifications and intangibles);
The presented descriptors have between 2 and 5 levels of performance, but there can be more or less
depending on the company and the project selection context;
Each level is more attractive than the one at its right and less attractive than the one at its left but
they are independent from the others above and under it;
The first and last levels do not necessarily reflect the best and worst possible performances on the
corresponding criteria;
Some criteria are very similar, so caution should be taken when choosing them in order to avoid
considering the same aspect/characteristic more than once.
Tab. 4: List of possible descriptors of performance
GR
OU
P
CRITERIA LEVELS OF PERFORMANCE
REF
.
More attractive Less attractive
Stra
tegi
c
Strategic fit Fits strategic intent at a high level of ambition and meets more than one specific product vision
Fits strategic intent and a specific product vision
Some doubt about how this fits into existing strategies
Project is clearly outside our strategic intent and fits no product vision
- [22]
Congruence Strong fit with several key elements of strategy
Good fit with a key element of strategy
Modest fit, but not with key element of the strategy
Only peripheral fit with strategy - [23]
Strategic alignment
Fits Supports Neutral - - [22]
Importance The success of the strategy depends on this program
Significant impact, difficult to recover if program is unsuccessful or dropped
Moderate competitive, financial impact
Minimal impact, no noticeable harm if program is dropped
- [23]
Impact Critical … Minimal - - [25]
30
GR
OU
P
CRITERIA LEVELS OF PERFORMANCE
REF
.
More attractive Less attractive
Fin
anci
al
Finance External funding available for the entire project
Well within budget or some external funding available
Within budget
Outside budget but justifiable
Extra funding will be required and possible source not yet identified
[22]
NPV 20M$ … 5M$ - - [22]
Time to break even
4 years … 6 years - - [22]
Mar
ket
Industry / market readiness
There is pent up demand for this
Definitely attractive to most customers; no change to customer behaviour required
Some customers have asked for this but requires some change in customer behaviour
No expressed demand or requires major change of customer behaviour
- [22]
Market need Product immediately responsive to customer need
Clear relationship between product and need
Need must be highlighted for customer
Extensive market development required
- [23]
Market attractiveness
High profitability
Moderate profitability
Low profitability
-
[22]
Market maturity
Rapid growth … Declining - - [25]
Market size 100,000 units 50,000 units 25,000 units 5,000 units - [22]
Market knowledge
Market size known to +/-20% and customer view established by formal survey
Enough data to size the market to +/-50% and requirements are supported by discussions with sales force
Market estimated within a factor of 2 or 3 with some data support
Market size not supported by data and requirements not yet checked with customers
- [22]
Competitive intensity in market
We will be alone in the market
Usual competition or 1 strong competitor
2 strong competitors
4 or more strong competitors
- [22]
Durability (technical and market)
Long life cycle with opportunity for incremental improvement
Moderate life cycle (4-6 years) but little opportunity for incremental improvement
May get a few good years
No distinctive advantage
- [23]

31
GR
OU
P
CRITERIA LEVELS OF PERFORMANCE
REF
.
More attractive Less attractive
Inte
rnal
Availability of people and facilities
Immediately available
Resources are available, but in demand
Acknowledged shortage in key areas
Must hire/build
- [23] and [25]
Technical capability
Well within our capability. No new skills or knowledge required
Some new skills required but they can be acquired in time
Existing staff can acquire capabilities in 3 months or less, or by recruiting one or two new people
We lack some important capabilities and a plan is needed to acquire them
We will have to buy in new major capabilities, or recruit a new technical team, or rely on a partner
[22]
Technology skill base
Widely practiced in company
Selectively practiced in company
Some R&D experience
New to the company - [23]
Skills to develop commercial applications
Already in place
… New
- - [25]
Organizational backing
Strong support from all important stakeholders
We do not anticipate trouble gaining support for this
We have some persuading to do
There is opposition from several stakeholders
- [22]
Fit to sales and/or distribution
Well within competence of existing sales and distribution
Some changes to sales or distribution but within our capabilities in the time
>75% of sales force could sell it with training or >75% of existing distribution applicable
Changes to sales or distribution will need special attention
Entirely new distribution channel required or requires new sales skills that at least half the sales force will struggle with
[22]
Fit to manufacturing /supply chain
Minor changes to manufacturing or supply chain well within usual expectations
Changes required but within our capability in the time
Adaptation of manufacturing process or change to supply chain that will require special attention
New production technology required or major change of supply chain
- [22]
Fit to existing supply chain
Fits current channels
Some change, not significant
Significant change - -
[Dupont]
apud

32
GR
OU
P
CRITERIA LEVELS OF PERFORMANCE
REF
.
More attractive Less attractive
Pro
ject
Sp
ecif
icat
ion
s
Product differentiation
Several important features are much better than competition
At least one important feature is significantly better than competition
We have some minor features that are better than the competition
At least one feature is better than offered by the competition
No features that are better than competition
[22]
Value differentiation
Significant differentiation
Moderate Slight - - [22]
Competitive advantage
Strong Moderate Slight - - [22]
Technical gap Incremental improvement
Step change Order of magnitude change proposed
Must invent new science - [23]
Technical challenge
All features have been demonstrated in prototype
Key features have been demonstrated in prototype, but others remain
Step change in at least 1 important parameter or some key features not demonstrated but we’re confident they can be
Key features not yet demonstrated by us or others, or >3x change in a important parameter
- [22]
Program complexity
Straightforward A challenge but doable
Easy to define; many hurdles
Difficult to define; many hurdles
- [23]
Sustainability of competitive advantage
Key features are protected by IPR or unique capabilities that are not easy to copy
We are at least 2 years ahead of the competition
Competitive advantage can be maintained with continuous effort
We are 6-12 months ahead of the competition. No serious IPR concerns
Key differentiating features will be easy to copy. Or serious concerns about IP against us
[22]
Proprietary position
Position protected through a combination of patents, trade secrets, raw material access…
Solidly protected with trade secrets, patents. Serves captive costumer
Protected but not a deterrent
Easily copied
- [23]
Synergy opportunities
A key part of a major initiative
Important Will help to complete product portfolio
Little None [22]
Synergy with other operations
Could be applied widely across many operations
Could be adopted or have application among several other operat.
With work could be applied to other purposes
Limited
- [23]

33
It should also be taken into account that the number of levels of performance to be used depend on the
specific criteria (for example, a criteria may have just the two levels of performance “yes” and no”) and on the
rejection conditions. For instance, if projects do not pass the triage filter when “There is opposition from
several stakeholders”, there is no point in establishing this level of performance for the “Organizational
backing” criterion because no project will have that performance (at this stage). Moreover, if a company does
not want to proceed with the proposed methodology or with their selection process altogether, the
construction of this descriptors of performance still constitutes a valuable help to the decision process, since it
enables to better understand the criteria and its different possible levels of performance in a project. It does
not, however, allow managers to compare the performance on different criteria, for which a weighting method
should be employed, as explained in Section 3.1.4.
GR
OU
P
CRITERIA LEVELS OF PERFORMANCE
REF
.
More attractive Less attractive
Inta
ngi
ble
s
Platform for growth
Opens up new technical and commercial fields
Potential for diversification
Other opportunities for extension
Dead end/ one of a kind
- [23]
Future potential
This is the beginning of a major new business or many further applications are foreseen
Could lead to a new product line or several applications
Will definitely lead to further product variants or applications
May lead to further variants of applications
Update of an existing product
[22]
Learning potential
Class leading learning in competences vital for 50% of future business
Corrects one or more core competences where we are currently weak
Useful learning
None
- [22]
Brand image Would expect favourable press comment; special feature in annual report
Will help retain the image of our company
Little impact No impact
- [22]
Customer relations
Project is vital to retaining customers for 25% of the business
Failure to do this could endanger business from an important customer
This will help retain key customers
No impact Existing customers may be worried about this
[22]
Regulatory/ social/ political impact
Positive … Negative - - [25]

34
A table should now be made with the previous identified criteria and their respective descriptors of
performance.
Reference levels 3.1.3.
Bana e Costa et al.[64] recommend the identification of two reference levels of intrinsic value in each criterion,
“good” and “neutral”, in order to operationalise the idea of a good alternative and a neutral (neither attractive
nor repulsive) alternative. They state the following three reasons for this:
The effort required to identify the reference levels contributes significantly to understand the criteria.
They make it possible to express the intrinsic attractiveness of a performance.
Allows the use of a criteria-weighting procedure that is valid in the theoretical framework of the
application of an additive aggregation model (which will be executed in Section 3.1.5).
The “neutral” reference level is defined as a performance that is neither positive nor negative for the decision
maker (such as the “status quo” or a “do nothing” option [65]) and the “good” reference level corresponds to a
satisfactory performance (such as an aspiration level or a benchmark in that criterion [65]). These reference
levels should not be established by the worst and best performances of the available alternatives, since the
“neutral” reference level is not the worst possible performance and the “good” is not the best (the decision
maker recognizes that there can be alternatives that are less attractive then the “neutral” and more attractive
than the “good”). Furthermore, they are independent from the performance of the alternatives and enable the
expression of the attractiveness of any alternative regardless of the others being considered. An example of
“neutral” and “good” reference levels is presented in Tab. 5.
Tab. 5: Example of reference levels (adapted from [64])
From the table of criteria and descriptors of performance made in the previous section, the reference levels of
each criterion should be identified, or added, among the levels of performance. They can, for instance, be
highlighted in order to be distinguished from the remaining levels. These levels are subjective, so their
determination will naturally depend on the decision makers, but the important is that their judgements of what
is a “neutral” and a “good” performance, remain consistent throughout the process.
Criteria value functions 3.1.4.
There are two ways to score a project in a given criterion (to obtain its partial value or score), directly (direct
rating) or indirectly (through value functions), and they both use the previous reference levels as anchors,
which can be rated, for example, as 100 and 0 for “good” and “neutral”, respectively. Although direct rating is
more commonly used, it is not so accurate and depends on the projects, therefore, it could only be used at a

35
later stage. For this reason, indirect rating is proposed in this methodology. Nonetheless, direct rating is also
explained for the purpose of better understanding the available techniques for scoring projects.
Direct rating
In direct rating the decision maker is asked to estimate numerically the attractiveness of the options relatively
to the references [66], for instance, “considering the rating 100 and 0 for “good” and “neutral”, respectively,
project A is rated 40, project B is rated 125, project C is rated -10, etc.”.
Bana e Costa and Chagas [66] alert to the fact that the use of this numerical techniques requires that the
decision maker should understand that, for example, 0 does not necessarily represent an absence of value
(attractiveness) and the ratio “r” of two scores does not necessarily mean that one option is “r” times more
attractive than the other. This is because this scores fall on an interval scale (and not on a ratio scale), since the
zero point and the unit of measurement were defined arbitrarily and the order and “distance” between scores
are known [67]. Interval value scales are quantitative representations of preferences used to reflect the order
of attractiveness of the alternatives for the decision maker and also the differences of their relative
attractiveness [66] and building them is a crucial part of Multiple Criteria Decision Analysis (MCDA) [68] apud
[66].
As an example, let us consider a criterion C, with the reference levels “neutral” and “good” rated 0 and 100,
respectively, a project A rated 40 and a project B rated 80. Since the 0 is not a natural limit, as it is in measuring
weight or length for instance, it is not possible to say that the project B in that criterion is twice as attractive as
project A, i.e., Vc(B)=2*Vc(A), but it is possible to say that the difference of attractiveness between the
performance of project A in that criterion and the reference level “neutral” is twice as much as the difference
between “good” and the performance of project B, i.e., Vc(A)-Vc(neutral)=2*[Vc(good)- Vc(B)]. Only the second
statement will remain true if each number (“x”) is changed to a different scale with a transformation of the
type f(x)=ax+b, because on an interval scale, the ratio of any two intervals is independent of the unit of
measurement and of the zero point [67]. A real-life example of interval scales are the scales used to measure
temperature, Centigrade (C) and Fahrenheit (F), which is the transformation F=(9/5)*C+32. Given that
40°C=104°F, 60°C=140°F and 80°C=176°F, it is not possible to say that 80°C =2x40°C since 176°F ≠2x10⁴°C,
however, it is possible to say that 80°C40°C =2x(60°C40°C) since 176°F104°F =2x(140°C104°C).
Indirect rating
Alternatively, the decision maker can score the options’ relative attractiveness indirectly, by using a value
function that will convert performance into value [63]. This value function can be constructed resorting to the
performance levels defined previously, whether they are qualitative or quantitative [69]. In this methodology
the use of this technique is recommend, since it gives the decision maker a visual support to better understand
and even reconsider his own value judgements, which is more intelligible than simply looking at numbers. For
instance, after scoring the performance levels, the decision maker might find that the resulting value function is
too close to a linear function, while in fact he considers that the function should grow more exponentially for
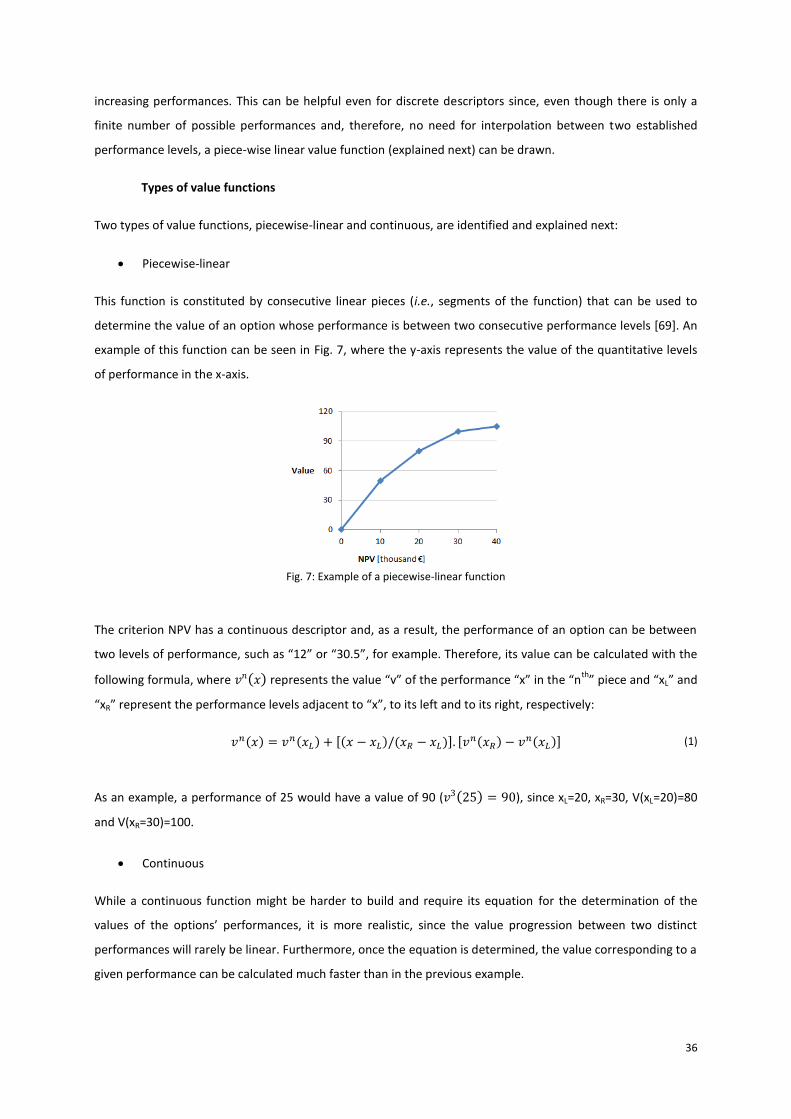
36
increasing performances. This can be helpful even for discrete descriptors since, even though there is only a
finite number of possible performances and, therefore, no need for interpolation between two established
performance levels, a piece-wise linear value function (explained next) can be drawn.
Types of value functions
Two types of value functions, piecewise-linear and continuous, are identified and explained next:
Piecewise-linear
This function is constituted by consecutive linear pieces (i.e., segments of the function) that can be used to
determine the value of an option whose performance is between two consecutive performance levels [69]. An
example of this function can be seen in Fig. 7, where the y-axis represents the value of the quantitative levels
of performance in the x-axis.
Fig. 7: Example of a piecewise-linear function
The criterion NPV has a continuous descriptor and, as a result, the performance of an option can be between
two levels of performance, such as “12” or “30.5”, for example. Therefore, its value can be calculated with the
following formula, where 𝑣𝑛(𝑥) represents the value “v” of the performance “x” in the “nth
” piece and “xL” and
“xR” represent the performance levels adjacent to “x”, to its left and to its right, respectively:
𝑣𝑛(𝑥) = 𝑣𝑛(𝑥𝐿) + [(𝑥 − 𝑥𝐿)/(𝑥𝑅 − 𝑥𝐿)]. [𝑣𝑛(𝑥𝑅) − 𝑣𝑛(𝑥𝐿)] (1)
As an example, a performance of 25 would have a value of 90 (𝑣3(25) = 90), since xL=20, xR=30, V(xL=20)=80
and V(xR=30)=100.
Continuous
While a continuous function might be harder to build and require its equation for the determination of the
values of the options’ performances, it is more realistic, since the value progression between two distinct
performances will rarely be linear. Furthermore, once the equation is determined, the value corresponding to a
given performance can be calculated much faster than in the previous example.

37
Multicriteria models have a compensatory nature [63], which means that a high value in one criterion can
compensate a low value in another. However, the decision maker might value additional performance in one
criterion up to a specific limit. One particular example of a continuous value function, that also resolves this
question, is the S-shaped, which is proposed by Bana e Costa et al. [63] in a multicriteria decision analysis
model for faculty evaluation. In that particular case, the decision makers want the use of a ceiling, a point after
which an increase of performance will not contribute to an increase of value, and of a target, that is indicative
of good performance, and as a result they propose the use of an S-shaped value function, shown in Fig. 8. This
value function tends to reward performance close to the inflection point (in this case, the target), below which
marginal increases are valued at an increasing marginal rate and above which marginal increases are valued at
a decreasing marginal rate [63].
Fig. 8: Example of a continuous value function [faculty evaluation]
Constructing a value function
The piecewise-linear value function is the one obtained when using the M-MACBETH software. However, if this
project scoring process is done without any software, there is no need to determine the equation of this
function, since the performances and scores needed for a linear interpolation are just the ones corresponding
to the performance levels, which can simply be presented in a value table (exemplified later, in Tab. 8).
On the other hand, the use of a continuous value function will require its equation, which will usually be
difficult to determine mathematically but should provide more accurate results. Therefore, it is recommended
the use of a Microsoft Excel® spreadsheet, where the decision maker can insert the performance levels and the
corresponding values, then plot them in a XY graph and add a trendline, choosing the type of line and
parameters that best fit the plotted data and showing the equation on the graph, which will be the value
function. Afterwards, the value of any option is obtained by merely substituting the “x” by its performance,
which can also be done in Microsoft Excel®, as illustrated in Fig. 9 (where it can be noticed that “2 years”
corresponds to a “good” performance and “4 years” corresponds to a “neutral” performance):

38
Fig. 9: Example of the determination and use of a value function
Criteria weighting 3.1.5.
Weights, also known as weighting coefficients or scaling constants, are needed to determine the contribution
of partial values (or scores) in each criterion to the overall value (or overall score), in the additive aggregation
model [65]. Keeney [70] states that the most common critical mistake in decision analysis is the use of
inappropriate procedures to build weights in a multicriteria model. The determination of a weight has to be
made with reference to the performance scales of the corresponding criterion because weights are substitution
rates [64] and they should capture the differences between the defined reference levels [63]. Otherwise,
according to Bana e Costa et al. [64], the weights are arbitrary and make no sense in the additive framework, as
when determined directly by reference to the psychological and intuitive notion of “importance”. Several
authors address this question of proper construction of weights, such as [70], [71] and [72], however, there is
still a vast amount of direct weighting processes that ignore these considerations and are therefore
theoretically incorrect [70].
Let us consider an example to explain that the notion of importance is incorrect in evaluating the weight of a
criterion. If a person wants to buy a car, he/she will most likely say that the price is the most important aspect
of the decision, as usual. Therefore, the weight of the criterion “price” would be set higher than the rest, for
instance, 0.6 for “price”, 0.2 for “design” and 0.2 for “comfort”. However, if the decision is between car A, that
costs 29000€, and car B, that costs 30000€, the price will probably have a much smaller influence on the
decision. For that reason, correct weighting procedures create their weights based on answers from the
decision makers to questions that require from them a comparison of reference alternatives [64] (for instance,
worst vs best, neutral vs good or base vs target), such as the trade-off procedure of Keeney and Raiffa [72] or

39
the swing weighting of von Winterfeldt and Edwards [71] (that can be used in the M-MACBETH software),
which are explained next.
Trade-off procedure
This procedure is based on the comparison of two fictitious alternatives at the time, adjusting their
performances in order to obtain a relation of indifference, and it consists on the following steps [73]:
1. Order the criteria by decreasing attractiveness of the swing from their lower reference level (Lj) to
their higher reference level (Hj). The first criterion will have the highest relative importance and,
therefore, the highest weighting coefficient.
2. Select the reference criterion (CR), which will be used for the comparison with the remaining n-1
criteria in the next step. Any criterion can be selected, provided that its value function is known, but
the first (with the highest weight) is more typically used.
3. Consider the fictitious alternatives A and B shown in Fig. 10: A has a performance at the higher
reference level (HR) on the reference criterion (CR) and at the lower reference level (Lj) on criterion j
(Cj); B has a performance at the higher reference level (Hj) on criterion j (Cj) and at the lower reference
level (LR) on the reference criterion (CR). Find the performance x on CR to which A should decrease (or
the performance y on CR to which B should increase) so that both alternatives are equally attractive, or
indifferent, which can be represented by:
(𝑥, 𝐿𝑗)~(𝐿𝑅 , 𝐻𝑗) (2)
Repeat this comparison for all the criteria, which means for n-1 pairs of fictitious alternatives.
Fig. 10: Fictitious alternatives A and B (adapted from [73])
4. Define the equations that represent this indifferences, which will be of the type:
𝑘𝑅 ∗ 𝑣𝑅(𝑥) + 𝑘𝑗 ∗ 𝑣𝑗(𝐿𝑗) = 𝑘𝑅 ∗ 𝑣𝑅(𝐿𝑅) + 𝑘𝑗 ∗ 𝑣𝑗(𝐻𝑗) (3)

40
And, if the values of the lower and higher reference levels are set as 0 and 100, respectively, the
equations will be reduced to:
𝑘𝑅 ∗ 𝑣𝑅(𝑥) = 𝑘𝑗 ∗ 100 ⇔ 𝑘𝑗 =
𝑘𝑅 ∗ 𝑣𝑅(𝑥)
100
(4)
5. Solve the system of n equations, which will consist of the previous n-1 equations and the following
one (representing the sum of the weights being one), to obtain the weights of the criteria:
𝑘1 + 𝑘2 + … + 𝑘𝑗 + ⋯ + 𝑘𝑛 = 1 (5)
Swing weighting
This procedure is simpler than the previous one since, even though it shares some steps with the trade-off
procedure, it doesn’t need the identification of the x (or y) points nor the equations. The swing weighting
procedure, which is the one used in the M-MACBETH software, consists on the following steps [73]:
1. Order the criteria by decreasing attractiveness of the swing from their lower reference level (L j) to
their higher reference level (Hj). The first criterion will have the highest relative importance and,
therefore, the highest weighting coefficient.
2. Select the reference criterion (CR), which will be used for the comparison with the remaining n-1
criteria in the next step. Any criterion can be selected, but the first (with the highest weight) is more
typically used.
3. Comparatively to an arbitrary value of, for instance, 100 points, for the swing from the lower to the
higher reference level on CR, quantify the other swings. Fig. 11 illustrates a case where the decision
makers assigned to the swings in criteria 1, 4 and 3, a value of 80%, 60% and 20%, respectively,
relatively to the swing in criteria 2, the most attractive one.
Fig. 11: Swings between the reference levels (adapted from [73])

41
4. Normalize the previous values (𝑘′𝑗), in order to obtain the final weights (𝑘𝑗) for the criteria, so that
their sum equals 1:
𝑘𝑗 =
𝑘′𝑗∑ 𝑘′𝑗
𝑛𝑗=1
, 𝑤𝑖𝑡ℎ 𝑗 = 1, … , 𝑛 (6)
In the figure above, the weights would be 0.38, 0.31, 0.23 and 0.08 for criteria 2, 1, 4 and 3,
respectively.
3.2. Structuring the Evaluation
Hereafter, all the stages of the methodology (namely Sections 3.3, 3.4, 3.5 and 3.6) will be repeated in each
project selection session, therefore skipping the previous “preparatory” section. This section approaches the
filtering of projects according to the selected criteria and collected project data, which means that the list of
potential projects needs to be established at this point.
Project type filter 3.2.1.
A company can pursue different types of projects that need different selection and management processes, or
projects that are of extreme importance, such as legal or health and safety issues, and hence may bypass the
selection process altogether [22]. Projects like this can also be motivated by operating necessity (for example, if
a flood is threatening the plant) or competitive necessity (for instance, to maintain the company’s competitive
position in the market) [21]. Let’s call them “type 2” projects. The remaining projects need a method for their
evaluation and selection, which might not be the same for all of them. Therefore, if a company has different
approaches (e.g. “selection methods 3 and 4”) for different types of projects (e.g. “type 3 and 4 projects), the
first step should be the separation of the potential projects into groups of different types of projects,
otherwise, this step can be skipped. This is illustrated in Fig. 12, where it can be seen that only “type 1 projects”
will be evaluated with the proposed methodology.
Fig. 12: Project type filter (adapted from [22])

42
Even though most companies will have a single method for evaluating all their potential projects, others may
wish to divide them into different groups and use different methods. One possible way to divide them is into a
first group composed by small and/or not very expensive projects, for which a formal method is considered not
justifiable, and a second group of projects whose costs are much higher and therefore require a strict
evaluation method, for which this methodology could be applied. Another possibility would be to separate
them into different categories. For instance, Wheelwright and Clark [74] identified five categories of projects
based on the degree of product or process change compared to existing offerings: derivative (incremental
difference in both product/service and process, such as a replacement or extension to a current offer),
platform (fundamental improvement in product or process, representing a better solution for the costumer),
breakthrough (usually involve a revolutionary new technology or material, differing profoundly from previous
generations), R&D (creation of know-how on new technologies or materials, preceding product and process
development) and alliances and partnerships (formed to pursue any type of the previous projects). Managers
may prefer, for instance, to apply the method just for “derivative” projects first, then to “platform” projects,
and so on, or to apply method X to evaluate “derivative” projects, method Y to “platform” projects, and so on.
To sum up, this step consists on separating projects of different types in case they have, or require, specific
selection methods, if not, this step should be skipped. Hereafter, one method for evaluating and selecting
projects is proposed, which companies may find applicable for all their potential projects or just for a few.
Criteria selection 3.2.2.
In order to evaluate the attractiveness of a project, appropriate criteria should be selected [23] from the list
developed in Section 3.1.1. If needed, they can be altered and new criteria can be added. However, there are
some matters that must be considered first, namely the requisites and the number of criteria that should be
selected, which are discussed next.
Number of criteria
Regarding the number of criteria to be used, managers need to resist the urge to supply a large number, which
would have the advantage of neutralizing uncertainties, since, as a consequence, less attention will be given to
each criteria [22], i.e., the majority of these criteria will have such small weights that they will have little impact
on the project’s overall score [21]. They should, on the other hand, try to select a rich set of measures that
captures all the relevant information and that includes different types of criteria. As a result, a balance
between these two considerations should be sought and companies should strive to select a set of criteria that
is complete, diversified and manageable.
Requisites
Managers should select the criteria that they feel are most important and for which they can provide valuable
information, either data or firm opinions [23]. Furthermore, they should not over-rely on financial indicators
and also include strategical indicators, which allows the company to see the “big picture” goals, market

43
indicators, among others, because the incorporation of different types of metrics in the process of project
selection usually yields the best results [25]. Finally, if a determined criterion has sub-criteria, they should be
entered in the model as criteria instead of the first criterion, however, each criterion has to be independent
from the remaining [21]. According to Eilat et al. [23], it is important that this list of criteria be complete but
not redundant.
Project data collection 3.2.3.
Afterwards, the data regarding each project should be collected, for which the company should use whatever is
available in order to get good estimates, such as past information and experience, expert opinion, among
others, and then try to verify all data resorting to other people, maybe even costumers [21], who can provide
valuable insight about the market needs, for instance. After this point, the company may find that it is
preferable to fund a project only partially to verify the assumptions or that a project should be postponed [21].
Meredith and Mantel [21] suggest identifying and examining any other special characteristics of the projects,
such as the possibility to outsource or the existence of restrictions or synergies among projects. The authors
also make a very important recommendation: to document any assumptions made during this process and
check them during the project’s lifecycle. This is particularly mandatory for innovation projects, since they are
highly uncertain and that knowledge about them can change during their development [22]. Furthermore, in
order to better define the selection criteria and evaluate the options, the top management should develop,
beforehand, a list of the company’s strategic objectives, regarding their market share, image or line of
business, for example, and also assess the availability of both internal and external resources [21].
After collecting all the necessary data it is useful to present a table with the performance of each project in
each criterion (in accordance with the descriptors of performance defined in Section 3.1.2), which can also
include the reference levels for indicative purposes (and the data about the investment and probabilities of
success, if Section 3.4 has already been read). Tab. 6 shows an example of this table, where in the first column
the different projects are presented and the other three columns have the criteria “Strategic fit” and “Market
attractiveness”, which have qualitative descriptors of performance, and “NPV”, which has a quantitative
descriptor of performance, and the performances of each project below.
Tab. 6: Table of performances
Projects Strategic fit Market attractiveness NPV [M€]
P1 Modest fit Very high profitability 7
P2 Strong fit Moderate profitability 9
P3 Peripheral fit Very high profitability 8.5
P4 No fit High profitability 10.5
P5 Modest fit High profitability 9
[good] Good fit Very high profitability 10
[neutral] Peripheral fit Low profitability 6

44
Triage filter 3.2.4.
After gathering the project data on the chosen criteria, rejection conditions can be established in order to
reject projects that do not meet a certain threshold level on some criteria [22] according to the company’s
requirements/needs, such as a minimum rate of return or a minimum acceptable potential market share [21].
Hence, this triage filter enables decision makers to restrict the evaluation and selection process to the projects
that respect the requisites. For instance, in the example of Tab. 6, if a minimum NPV of 8M€ is set, P1 will
rejected and will not proceed to the evaluation stage. This filter is illustrated in Fig. 13, next to the project type
filter approached in Section 3.1. They both precede the selection stage (“Selection filter” in the figure), which is
succeeded by the development of the project that is managed by different processes outside the scope of this
work.
Fig. 13: Triage filter (adapted from [22])
3.3. Project Evaluation
In this stage the projects that passed the filters will finally be evaluated, i.e., they will be assigned scores
accordingly to their performance on the chosen criteria (partial scores) and then their overall score will be
computed by a weighted average.
Partial scores 3.3.1.
The criteria value functions determined in Section 0 should now be checked in order to see if they are still valid,
i.e., if they still reflect the company’s preferences regarding the attractiveness of the performances on the
criterion, and slightly adapted only if needed. Using the value functions, the score (or partial value) of a project
in a certain criteria can be determined given its performance, which is presented on the previously constructed
table of performances (as in Tab. 6). The values of all projects on each criterion should be presented in a table
of scores (Tab. 7) similar to the table of performances, but replacing the performances by the scores obtained.
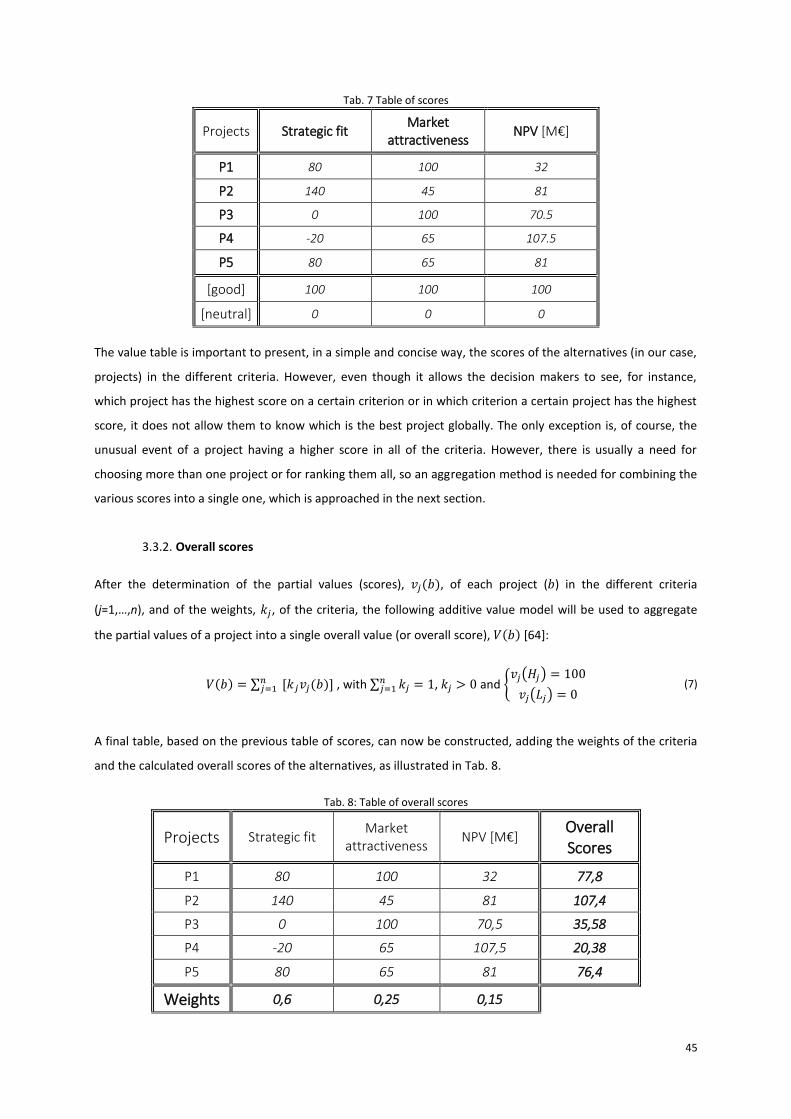
45
Tab. 7 Table of scores
Projects Strategic fit Market
attractiveness NPV [M€]
P1 80 100 32
P2 140 45 81
P3 0 100 70.5
P4 -20 65 107.5
P5 80 65 81
[good] 100 100 100
[neutral] 0 0 0
The value table is important to present, in a simple and concise way, the scores of the alternatives (in our case,
projects) in the different criteria. However, even though it allows the decision makers to see, for instance,
which project has the highest score on a certain criterion or in which criterion a certain project has the highest
score, it does not allow them to know which is the best project globally. The only exception is, of course, the
unusual event of a project having a higher score in all of the criteria. However, there is usually a need for
choosing more than one project or for ranking them all, so an aggregation method is needed for combining the
various scores into a single one, which is approached in the next section.
Overall scores 3.3.2.
After the determination of the partial values (scores), 𝑣𝑗(𝑏), of each project (𝑏) in the different criteria
(j=1,…,n), and of the weights, 𝑘𝑗, of the criteria, the following additive value model will be used to aggregate
the partial values of a project into a single overall value (or overall score), 𝑉(𝑏) [64]:
𝑉(𝑏) = ∑ [𝑘𝑗𝑣𝑗(𝑏)]𝑛
𝑗=1 , with ∑ 𝑘𝑗 = 1𝑛𝑗=1 , 𝑘𝑗 > 0 and {
𝑣𝑗(𝐻𝑗) = 100
𝑣𝑗(𝐿𝑗) = 0 (7)
A final table, based on the previous table of scores, can now be constructed, adding the weights of the criteria
and the calculated overall scores of the alternatives, as illustrated in Tab. 8.
Tab. 8: Table of overall scores
Projects Strategic fit Market
attractiveness NPV [M€]
Overall Scores
P1 80 100 32 77,8
P2 140 45 81 107,4
P3 0 100 70,5 35,58
P4 -20 65 107,5 20,38
P5 80 65 81 76,4
Weights 0,6 0,25 0,15

46
With a Microsoft Excel® spreadsheet it is possible to calculate the overall scores of the alternatives and to plot
them in a graph (Fig. 14), providing a visual tool to understand the difference in the scores and to support the
decision process.
Fig. 14: Graph of overall scores
Sensitivity analysis can be made by changing, for instance, the weights assigned. However, this can be difficult
and time-consuming, especially for a large number of alternatives, for which a computational tool is
recommended, as explained in the next section.
3.4. Risk Analysis
According to what was referred in Section 3.1.1, the risk associated to the projects was not yet considered.
Therefore, a technique for taking it into account is now proposed, expressed by the probabilities of technical
and commercial success. It should be acknowledged, however, that it will be useful in cases where the
probability distributions of the possible events are unknown or very difficult to estimate, otherwise, more
robust tools can be used, such as software based on Monte Carlo simulation or decision trees.
After the identification of the risks associated with the project, and before its analysis/assessment, risk
mitigation actions (as referred in Section 2.4.2 of this chapter) should be studied and considered when viable in
order to minimize risk, decreasing its negative impact on the project’s overall attractiveness.
The probabilities of technical success (Pt) and of commercial success (Pc) are the most commonly referred in
the project selection literature, although others can also be used by the decision makers if applicable. For
instance, a probability of financial success (Pf) can be useful if the capacity to fund the project is uncertain or if
there is a considerable possibility of not being able to produce a required quantity at a certain cost. These
probabilities should then be determined to the best of the company’s capacity, using the desired procedure,
for which reading Section 2.4 of Chapter II can be helpful. Managers should recognise that the quality of this
estimates can affect the final decision and that they should not consider the factors that were already used as a
criterion, or exclude the criterions whose data are used to estimate this probabilities, in order to avoid
considering the same aspects twice.

47
The overall probability of success (P), or probability of realising the estimated benefits, can be calculated for
each project (b) by multiplying the several probabilities (technical, commercial, financial, etc.) estimated [14],
through the equation:
𝑃(𝑏) = 𝑃𝑡(𝑏) ∗ 𝑃𝑐(𝑏) ∗ 𝑃𝑓(𝑏) ∗ … (8)
The scores obtained through the multicriteria analysis, in Section 8, and the calculated probabilities of success,
can now be plotted, similarly to the typical Risk-Reward matrix. A similar procedure applied to the project
selection problem has already been executed by Sokmen [24], where the author plots the project scoring value
against the project risk value. Fig. 15 shows an example of how the results can be presented, where the x-axis
represents the probability of success (to which the risk is inversely proportional) and the y-axis represents the
overall score (or reward). In addition, projects can be represented as circles, with their size depicting their cost
and the inside pattern depicting one or two of its attributes (criteria) [31].
Fig. 15: Probability of Success VS Overall Score (adapted from [ref5])
Moreover, an “efficient frontier” (the set of options that are not dominated [72]) could also be drawn in order
to show projects that optimally balance risk and reward, i.e., the projects that offer the highest return for a
given level of risk [31]. An example is shown in Fig. 16, where X2 and X4 are dominated projects, since X3 has a
lower risk for the same return and X5 has a higher return for the same risk, respectively.
Fig. 16: Efficient frontier [16]

48
The matrix in Fig. 15 segments the investment on projects into four different categories: intelligent, gamble,
avoid and safe. If the decision is to be made based on this matrix (without considering the following resource
allocation section), decision makers should naturally favour “intelligent” projects, possibly choose some “safe”
or “gamble” projects (while considering some risk mitigation actions) and avoid projects with high risk (or low
probability of success) and low expected reward. This decision can depend on some other factors though, such
as the number of projects to include in the portfolio, the desired balance of high-risk and low-risk projects or
the risk aversion/tolerance of the decision makers. A probability and impact matrix can also be used, as well as
other methods shown in Fig.4 in Section 2.4.1 of Chapter II.
Alternatively, a risk-adjusted benefit can be calculated in order to ensure consistency of preference between
projects with different benefits and probabilities of success [75] apud [12]. This can be accomplished for each
project, b, by multiplying the benefit estimated in Section 8, V(b), by the probability of realising it, P(b), just
calculated, obtaining an expected benefit, E(b), as in the following equation:
𝐸(𝑏) = 𝑉(𝑏) ∗ 𝑃(𝑏) (9)
Then, use the E(b) of the projects together with their implementation costs in during the portfolio selection,
keeping in mind that a high V(b) can compensate a low P(b) in the calculation of the E(b) and, consequently, in
the portfolio selection stage. If the decision maker is risk adverse, he can exclude a project that has a
probability of success lower than desired (or a high negative impact) before the portfolio selection.
Furthermore, if he feels strongly unsure about the accuracy of the probability estimations and in a particular
case where there is a group of projects with a high and similar reward/risk ratio (considerably distant from the
remaining) and this group has much more projects than the number that the portfolio can have (considering
their costs and the available budget), he could pass only the projects in that group to the portfolio selection
stage, considering only their V(b), thus reducing the effects of an incorrect risk estimation. However, this would
hold a great simplification in the process, therefore, the first option should preferably be considered.
Continuing with the example presented previously, the final table should be similar to Tab. 9:
Tab. 9: Table of expected benefits
Projects Overall Scores
Probability of Success
Expected Benefit
P1 77,8 70% 54,46
P2 107,4 50% 53,7
P3 35,58 80% 28,46
P4 20,38 60% 12,225
P5 76,4 90% 68,76

49
3.5. Resource Allocation
For the final stage of the selection phase, the construction of a project portfolio is proposed, in the context of
limited resources, where the previously calculated expected benefits of the projects will be considered
together with their associated costs (referred until now as investment). The exhaustive enumeration and
comparison of all possible portfolios is impractical since there are 2n possible portfolios for n projects (for
instance, 10 projects can create 1024 portfolios) [43], so a more practical approach should be applied.
According to Phillips & Bana e Costa [12], all the main perspectives on portfolio resource allocation decisions
(originated from corporate finance, operations research optimisation methods and decision analysis) agree
that risk-adjusted benefit divided by cost is the correct basis for prioritisation, ensuring the best value-for-
money. However, those authors’ experience says that usually projects are prioritised on the basis of benefits
only, which, as can be seen in the figure below (Fig. 17) that shows real projects prioritised on the basis of
benefit only and benefit-to-cost ratio, make a less effective use of the available resources [12].
In the figure, each point depicts a project and its position represents an increment of cost, to the right, and
benefit, upwards, from the previous project to the left. The slope of the upper curve decreases progressively
because the projects are ordered by decreasing benefit/cost ratio, while the lower curve “snakes” upward,
since the projects are ordered by decreasing benefit only [12]. The benefit/cost prioritization curve is,
therefore, always above the benefit curve, which originates portfolios with a much higher benefit for the same
budget, or a much lower cost for the same benefit. For instance, given a budget of 2000 cost units, the lower
curve creates a portfolio of 3 projects with a cumulative benefit of ≈23 benefit units, while the upper curve
creates a portfolio of 38 projects with a cumulative benefit of ≈48 benefit units, approximately two times more.
Evidently, that number of projects in the portfolio might be excessive, hence, less money can be spent.
Fig. 17: Prioritisation of projects by their benefit-to-cost ratio and by their benefits only [12]

50
As a result, managers should prioritize projects by decreasing order of their benefit-to-cost ratio and add them
to the portfolio until the budget is reached. However, even though this ensures the highest benefit for the
money spent, it does not necessarily achieve the maximum possible benefit with the available budget, since
this approach excludes projects with a ratio lower than unselected projects [76], that is to say, once a project
does not fit the budget anymore, the following ones (with lower benefit-to-cost ratio) are not considered and
the portfolio is complete. For instance, in the previous example the budget of 2000 cost units would not be
completely spent (there is around 1000 left in the upper curve).
In order to deal with this issue, i.e., to ensure the maximum cumulative benefit within the available budget, an
optimization approach could be pursued through mathematical programming [76], for which there are several
techniques and software described in most operations research textbooks [77], such as in [78]. Tab. 10 shows
an example of a table that the company should now make, with 5 projects and a budget of 35 cost units, where
the projects and the portfolios are presented by decreasing order of their benefit-to-cost ratio. A prioritization
approach would result in a portfolio consisting of projects A and B (including C would exceed the budget), that
have the best possible value-for-money (a ratio of 2.19). If other projects can be added, by order of their ratio,
project D can be included in the portfolio, but the benefit-to-cost ratio would decrease. However, if managers
want to maximize value within the budget constraints (optimization perspective), the portfolio formed by
projects A, C, D and E offers 6 additional value units, taking advantage of the full amount of the budget of 35
cost units.
Tab. 10: Table of portfolios
Project Benefit (E) Cost (C) E/C
A 33 15 2,20
B 24 11 2,18
C 21 10 2,10
D 10 5 2,00
E 9 5 1,80
A+B 57 26 2,19
A+B+D 67 31 2,16
A+C+D+E 73 35 2,09
In order to find this optimal portfolio, and to enable the inclusion of further considerations, such as constraints
or synergies between projects, the use of software is advised. In [43], an analysis is made on four commercial
software packages for multicriteria resource allocation that use different types of procedures for resource
allocation: Equity (benefit-to-cost ratio), HiPriority (benefit-to-cost ratio and exhaustive enumeration), Logical
Decisions Portfolio (mathematical programming) and Expert Choice Resource Aligner (mathematical
programming). The authors later proposed a new decision support system for multicriteria portfolio analysis,
PROBE (Portfolio Robustness Evaluation) that implements the optimization approach and also finds the

51
solutions given by the prioritization approach [76]. It allows the construction of an additive value model
(inputting the project's value scores and costs and the criteria weights), to account for constraints on projects,
synergies among them and costs of not financing projects [79] and to perform analysis of the robustness of the
results. For these reasons, the use of the PROBE software is suggested, but naturally this decision will depend
on the needs and preferences of the company and its decision makers.
Innovation spending 3.5.1.
But what if there is not a predetermined budget? This is not unlikely since optimizing innovation spending is
difficult [9]. In order to do a first and rapid estimate of how much money to spend on innovation projects, and
considering the fact that no strategy is universally recognized as the most effective [9], a simple and visual aid
is proposed based on the concept of “Innovation Effectiveness Curve”, introduced by Booz & Co.’s study on the
return on innovation investment (ROI2) [10]. In addition, reading Booz & Co.’s “Money Isn’t Everything” [9] is
suggested.
According to Kandybin [80], the effectiveness curve is built by plotting the annual spending on innovation
projects against the ROI2 (measured as a projected internal rate of return) from those projects, as in Fig. 18.
The higher the curve, the greater is the expected return from the innovation investments.
Fig. 18: Innovation Effectiveness Curve [80]
A company’s effectiveness curve stays remarkably consistent (i.e., with a similar overall shape) over time and
usually has three distinct sections:
Hits: a few high-return projects that usually cannot be consistently replicated;
Healthy Innovation: solid projects that provide the majority of returns;
Tail: low-return projects that shouldn’t remain in the portfolio.

52
After determining the risk-adjusted benefit of the projects, managers can draw a curve similar to the one
above, plotting the E(b) of the projects (instead of the ROI2) against the cumulative costs, and identify the
distinct sections, particularly the “tail”. These low-return projects would drain resources from the company
while offering very little in return, or possibly even no return at all if things do not go as planned, which usually
happens [10], therefore, they should be left out of the portfolio. By cutting its “tail”, the total investment for
the “hits” and “healthy innovations” would be the budget necessary to fund the projects with the highest
expected returns. On the one hand, if this value is considerably superior to what the company is willing to
spend, managers can simply shift their cut-out point to the left until a reasonable budget is reached. On the
other hand, if the value is inferior, funding more projects to the right would only extend the tail portion of the
effectiveness curve [80], each additional dollar spent ultimately yielding a lower and lower return [10]. Instead,
this money should be spent in increasing the height of the curve, which can be achieved by three ways [10]:
increase the return on their innovation spending (e.g. invest in higher quality and lower costs) and get
an option to invest more (and sooner);
master the entire innovation value chain (ideation, project selection, development and
commercialization);
learn to outsource segments of the innovation value chain, namely idea generation and development,
as superior innovators are doing, and explore the “open innovation models” (addressed in “Open
Innovation: The New Imperative for Creating and Profiting from Technology” [81]).
Evaluation of innovation spending 3.5.2.
When evaluating the results of the company’s investments, after knowing (or at least having better estimates
of) the returns of the projects, the effectiveness curve can be used for its expected purpose: assessing the
effectiveness of the company’s innovation spending. This will let the company understand which customer
segments or categories generate higher returns and which of “The Seven Types of Innovators” it is, helping it to
reprioritize initiatives and redistribute resources [80]. At this stage, reading [10] and [80], in addition to
dedicated literature on innovation performance measurement, is recommended.
A word of advice by Kandybin and Kihn [10] is that only after improving effectiveness should companies spend
more in order to earn more.
3.6. Decision and Conclusions
Having reached the main goal of evaluating the potential projects, and constructing a portfolio of projects,
decision makers should interpret the results as a recommendation and aid for making the decision, which
originates from a specific approach, while considering and discussing the sensitivity/robustness of these results
[82]. Meredith & Mantel [21] reminds the critically important fact that models do not make decisions - people
do, i.e., regardless of the model used to assist the selection process, the managers will always bear
responsibility for the decision. Furthermore, the outcome of this process should include a statement of the key

53
assumptions made, the issues to be addressed in the next decision [22] and a summary of the lessons learned
in this process. Without these, according to [83] apud [84], an organization can even regress to a lower level in
project management. Todorović et al. [84] recently published a paper on the relationship between project
success analysis and knowledge management (by gathering data from over one hundred project managers in
different industries in Serbia during 2013), whose reading can be useful for the post-project stages.
An evaluation of projects at the closing stages can help to compare the more recent available data with the
assumptions made during the selection stage, which can help to identify and understand errors on the
estimates and possibly make adjustments on the criteria, descriptors of performance, value functions or ratings
for the next selection phase, thus improving continuously the selection of the projects and the decision-making
process itself.
3.7. Computational tool: M-MACBETH
To support the application of this methodology, namely the first three sections, the use of the M-MACBETH
software [69] is proposed, which applies the MACBETH approach [45] presented in Section 0 of Chapter II. The
use of this software has three main advantages for the selection of innovation projects:
1. The qualitative nature of many of their benefits makes it difficult to score projects directly and
numerically and, with MACBETH, managers can construct interval value scales based only on
qualitative judgements.
2. The uncertainty associated with innovation projects and, consequently, with the predictions of their
future performances, can generate hesitation in the evaluation process, which can be compensated by
the possibility of choosing a sequence of qualitative categories instead of being forced to decide on
just one. For instance, if the decision maker is not sure if the difference of attractiveness in a certain
case is “strong” or “very strong”, or if multiple decision makers do not agree in one category, both can
be chosen. Also, as the judgements are given, their consistency is verified [66].
3. It provides several types of sensitivity and robustness analyses in visual and dynamic tools, which are
valuable supports for the decision makers throughout the process and at the decision stage, ensuring
their trust in the constructed multicriteria model [61].
There are a large number of applications of the MACBETH approach and the M-MACBETH software reported in
the literature, as presented by Bana e Costa et al. [85], and an example of its application in the context of
project selection is demonstrated in Chapter IV.

54
3.8. Project Portfolio Management
According to Levine [14], after selecting the portfolio of projects, managers should not only strive to achieve
the specific project goals and commitments but also evaluate project performance in order to verify if the
previously determined expected benefits continue to be met. Furthermore, they should develop adequate
measures to consider terminating or delaying projects that fail to represent efficient use of resources or
adequate value. These measures should rely more on formal financial methods as more data becomes available
[22].
Another important aspect to be discussed after the selection of the project portfolio is the amount of projects
simultaneously in progress. Still according to Levine [14], an overload of the pipeline can cause delay in the
projects, decrease in its value and even losing clients. Furthermore, the author states that, by limiting the
amount of work, projects can be completed faster, with more profits and more satisfied clients, as well as
enabling to start other projects sooner [14]. Naturally, the amount of concerns that influence the development
phase of projects and the management of portfolios goes much farther from what is approached here,
therefore, reading literature more focused on project management, as in [14], [16], [21], [34], is advised.
55
4. Example of application
In this chapter, an example of application of the proposed methodology for project selection is presented. It is
motivated by a real application of project selection and it uses some of the real projects and includes some
criteria about eco-design. The remaining information was either added or arbitrated for illustrative purposes,
therefore, the intention of this example is not to highlight the projects/criteria/data but rather to demonstrate
how the methodology can be applied for a project selection problem. The sections of this chapter are ordered
equally to the previous one in order to simplify the search for clarifications in the methodology if needed.
Furthermore, reading the M-MACBETH guide [69] can be helpful since it presents a more thorough explanation
of all the steps needed to construct a model in the software, although not all of them are in the same order as
proposed here.
The real application aforementioned was conducted in the context of a PhD Thesis [29] on the innovation in
SMEs (small and medium enterprises), where ideas (that is to say potential projects) were evaluated for new
product/process development in Fapil, S.A., a manufacturer of domestic products, such as cleaning tools.
Considering innovation and sustainability as critical success factors, the eco-innovation is a strategic objective
for the company, translating in the eco-design of their innovations, which focuses on the reduction of
environmental impacts and efficient use of resources and also improves the brand image. For this reason, the
criteria used during the project selection phase include the eco-design principles (possible solutions to improve
the environmental impact of a product life cycle [86]) that correspond to the eco-design strategies (EDS) that
the company pursues, among other commons ones (financial, market, strategic, intangibles, etc.).
Furthermore, it is recommended, as explained previously, the application of this methodology by a team of
decision makers, preferably formed by managers of different areas and other stakeholders. In the case stated
above, opinions and ratings were collected among the company, suppliers, clients and final users, therefore
gathering a larger range of relevant knowledge and insights.
4.1. Setting the Evaluation Process
Criteria identification 4.1.1.
Fig. 19 shows the (hypothetical) list of criteria that the company has identified, organized in 6 different groups.

56
Fig. 19: Company criteria
The probabilities of commercial and technical success and the financial investment are not present here since
they will be considered later, during the “Risk Analysis” and “Resource Allocation” chapters, respectively. The
company should now create an M-MACBETH file with all the identified criteria that will be used as a template
for the succeeding evaluation sessions, which are organized in a “value tree”. In M-MACBETH, groups of criteria
can be inserted by right-clicking the default node (“Overall”) and clicking “Add a node”, then right-click each
group node to add the criteria nodes. Each node properties can be changed at any time by right-clicking it. Fig.
20 shows an example of this tree and the software’s interface.
Fig. 20: Tree of identified criteria
Project Criteria
Strategic
Fit
Financial
NPV
Reduction of operational
costs
Market
Size
Maturity
Internal
Fit to manufacturing,
supply chain, distribution,
sales
Intangibles
Know-how gained
Brand image
Eco-innovation
Eco-design principles
(production waste,
durability, recycling of
product, etc.)

57
Descriptors of performance 4.1.2.
Some of the descriptors of performance constructed for the previous criteria are presented in
Tab. 11 (as referred previously, the values/statements are for illustration purposes only, since no real data is
available).
Tab. 11: Descriptors of performance
In M-MACBETH, performance levels can be defined in the “Node properties” of each criterion (by right-clicking
it), which are shown in Fig. 21.
GR
OU
P
CRITERIA More attractive LEVELS OF PERFORMANCE Less attractive
L1 L2 L3 L4 L5
Eco
-des
ign
C1: Production waste
[g/kg of product] 100 200 500 1000 2000
C2: Durability
[years] 10 6 4 2 1
C3: Recycling of product Easily
recyclable Recyclable
Difficult to recycle
Very difficult to recycle
Impossible to recycle
Fin
anci
al
C4: NPV
[Thousand Euros] 24 22 20 18 16
Mar
ket
C5: Market size [units/year]
50’000 20’000 10’000 4’000 2’000
Inta
ngi
ble
s
C6: Impact on image Great impact Good impact Little impact No impact Bad impact
…
… … … … … …

58
Fig. 21: Performance levels of criterion "Durability"
Reference levels 4.1.3.
The reference levels “neutral” and “good” were chosen, indicated by the bold letters in
Tab. 11 and by the colours in Fig. 21, where “4” is set as the upper reference level and “2” as the lower
reference level. In M-MACBETH, reference levels can be defined by right-clicking a performance level.
Criteria value functions 4.1.4.
As explained in Section 3.8.3 of Chapter II, qualitative judgements of difference in attractiveness will be used to
generate value-functions for the criteria, by choosing for two elements at a time one (or more) of the following
categories of difference in attractiveness: “no (difference)”, “very weak”, “weak”, “moderate”, “strong”, “very
strong” and “extreme”. A higher/stronger category means a higher slope of the value function curve.
In M-MACBETH, these judgements will be inserted in a “judgments matrix” (opened by double-clicking a
criterion in the value tree). Fig. 22 shows the judgements matrix and value function of the criterion "Net
present value”, where it can be seen that the difference in attractiveness between 16000€ and 18000€ was
defined as being “moderate to strong”, and a pop-up window that appears when the “build (MACBETH) scale”
button in the bottom is clicked before all judgements are inserted. If “yes” is clicked the value function will still
be built (possibly “simpler” than it should actually be) but the scores can then be adjusted by manually
dragging the respective dots or by using other options in the bottom of the window.

59
Fig. 22: Judgements matrix and value function of criterion "Net present value”
Criteria weighting 4.1.5.
The weights of the criteria will also be determined by qualitative judgements of difference in attractiveness. In
M-MACBETH, the weighting matrix of judgements, shown in Fig. 23, opens in the tab “Weighting –
Judgements”, and the software uses the “swing weighting” method explained in Section 0 of Chapter III. The
criteria names between brackets (“Cj”) represent an overall reference of the respective criteria (j). Considering
that “good” and “neutral” were chosen as references, the overall reference [Cj] has a “good” performance in
criterion Cj and a “neutral” performance in the remaining criteria, while [all lower] has a “neutral” performance
in all criteria. For instance, the cell {[C4], [C5]} means that a fictitious project with a “good” performance in
criterion C4 and a “neutral” performance in the remaining criteria is moderately more attractive than a
fictitious project with a “good” performance in criterion C5 and a “neutral” performance in the remaining
criteria. Another way to interpret it is to consider the [all lower] fictitious project and ask oneself: “How much
more attractive is it to improve the project’s performance to “good” in criterion C4 than in criterion C5?”.
Fig. 23: Weighting matrix of judgements
After filling in the table, click “Build (MACBETH) scale” and choose either “swing weights”, attributing 100 to
the most attractive swing, or “fix sum of weights”, which will show the weights normalized to 100 . The

60
calculated weights appear in a histogram (Fig. 24 at the left), which can also be altered if desired by clicking in
“Show thresholds” or “propose scale” (and also “Round to integers” if preferred (Fig. 24 at the right)). The
original weights, at the left, will be used hereafter.
Fig. 24: Weights histograms (at the left, proposed by M-MACBETH, at the right, a possible adjustment)
Fig. 24 (left) shows that C4 (NPV) and C5 (Market size) account for almost 2/3 of the total of the weights, C1
(Production waste) has an average weight, followed by C6 (Impact on image), C2 (Durability) and C3 (Recycling
of product) that have decreasing weights on the final scores.
It is therefore concluded this preparation stage, after having identified the criteria and determined the
respective descriptors of performance, reference levels, value functions and weights. The next stage consists in
structuring the evaluation.
4.2. Structuring the Evaluation
A list of ideas (potential projects) was collected among the different stakeholders of the company [29], from
which the following were selected for this example: supply chain optimization (P1), weight reduction of plastic
products (P2), utilization of natural fibres (P3), utilization of biodegradable materials (P4), bi-material injection
products (P5) and materials that minimize detergent utilization (P6).
Project type filter 4.2.1.
The company (hypothetically) has one selection method for projects on product development and a different
selection method for projects on process improvement. For that reason, it decides to apply this methodology
for the first type of projects, therefore leaving the “supply chain optimization” project out of this evaluation
session.
Criteria selection 4.2.2.

61
Among the several eco-design principles that the company can consider as criteria for evaluating and selecting
its projects, three principles, which apply to the projects that passed to this stage, where selected for this
example, specifically production waste (EDS: “optimization of production techniques”), durability (EDS:
“optimization of the impact during its life”) and recycling of product (EDS: “optimization of the product end-of-
life”). Another three criteria were also selected, namely the net present value (financial criterion), market size
(market criterion) and impact on image (intangible criterion). In a real application more criteria can, and
should, be used, such as strategic fit (if applicable) or level of competition in the market, for instance.
The template created in Section 3.1.1 can now be edited in order to show only the selected criteria (copy the
template, to preserve it for future project selection sessions, and delete the spare criteria). Fig. 25 shows the
resulting tree of criteria for this example.
Fig. 25: Tree of selected criteria
Project data collection 4.2.3.
All data and information concerning the projects that passed the “Project type filter” should now be collected
for each criterion and then inserted and organized in a table of performances (in accordance with the
descriptors of performance defined in Section 4.1.2), exemplified in

62
Tab. 12. As explained before, the company should use whatever is available in order to get good estimates on
the projects’ data, such as past information and experience, expert opinion, among others, and then try to
verify all data resorting to other people, maybe even costumers [21], who can often provide valuable insight on
the products.

63
Tab. 12: Table of performances
Projects C1 C2 C3 C4 C5 C6 Technical Success
[%]
Financial Success
[%]
Investment
[thousand €]
P2 250 4 Recyclable 21.5 31’000 Little 95 80 40
P3 520 6 Difficult 22.5 9’000 Great 88 86 25
P4 410 5 Easy 18 11’500 Great 86 91 35
P5 1140 6.5 Difficult 20 7’500 Good 93 90 30
P6 380 1.5 Difficult 15 43’000 No 95 82 20
[good] 200 4 Recyclable 22 10’000 Good
[neutral] 1000 2 Impossible 16 4’000 No
Triage filter 4.2.4.
Supposing that among the company’s requisites/requirements are a maximum investment (cost of the project)
of 35000€ and a minimum NPV (C4) of 15500€, projects P2 and P6 are therefore rejected. Hence, the rest of
the selection process will be restricted to projects P3, P4 and P5. In M-MACBETH, these three projects can now
be inserted in the tab “Options – Define” and their respective performances after clicking in “Performances”,
illustrated in Fig. 26.
Fig. 26: Options and table of performances

64
4.3. Project Evaluation
In this stage the projects that passed the filters will finally be evaluated, i.e., they will be assigned scores
accordingly to their performance on the chosen criteria (partial scores) and then their overall score will be
computed by a weighted average.
Scores of the projects 4.3.1.
Since M-MACBETH already has all the information regarding projects, criteria, performances, value functions
and weights, a final table containing the partial and overall scores of the projects can be seen in the tab
“Options – Table of scores”, as illustrated in Fig. 27.
Fig. 27: Table of overall scores
It can be seen that P3 has the highest overall score (102.16), mainly due to having the highest score in criterion
C4 (“NPV”), which also has the highest weight. It is interesting to notice that only P3 has an overall score over
100, which means that, considering that the reference level “good” is worth 100, it is the only project whose
overall performance is understood as better than just “good”, while P4 and P5 are less than “good” but well
over “neutral”.
Sensitivity and robustness analysis 4.3.2.
The weight of criterion C4 has a big impact in the additional score that P3 has over the other projects, but its
value is obviously subjective since there is always some uncertainty in the decision makers’ judgements (mainly
due to the lack of information in the early stages of innovation projects), so what would happen if this weight
was smaller? Would P3 still be the most attractive project?
In order to answer this questions, i.e., to understand the influence of the weights, a sensitivity analysis can be
performed (by clicking on the tab “Weighting – Sensitivity analysis on weight”). M-MACBETH plots the overall
score of all projects, varying the weight of the selected criterion between 0 and 100%, as shown in Fig. 28,
while the others change automatically but maintain the same proportion among them. It can be seen that for
the current weight of 36.53% on C4 (red line), P3 has the highest score, but for a weight lower than 24.4%, P4
would have the highest score. The two inner dotted lines represent the “margin of uncertainty” that the
calculated value of this weight has, while still respecting the judgements. The two outer dotted lines represent
the interval in which is possible to change the weight of C4 if other weights are also changed manually. Since
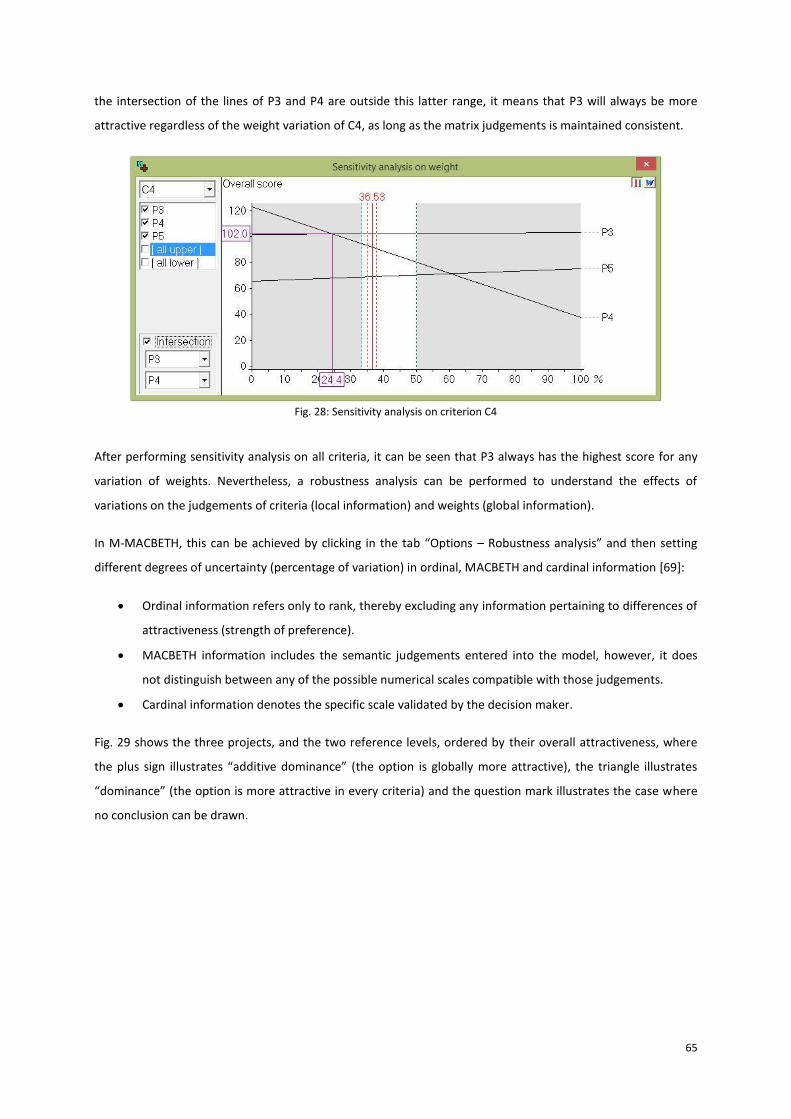
65
the intersection of the lines of P3 and P4 are outside this latter range, it means that P3 will always be more
attractive regardless of the weight variation of C4, as long as the matrix judgements is maintained consistent.
Fig. 28: Sensitivity analysis on criterion C4
After performing sensitivity analysis on all criteria, it can be seen that P3 always has the highest score for any
variation of weights. Nevertheless, a robustness analysis can be performed to understand the effects of
variations on the judgements of criteria (local information) and weights (global information).
In M-MACBETH, this can be achieved by clicking in the tab “Options – Robustness analysis” and then setting
different degrees of uncertainty (percentage of variation) in ordinal, MACBETH and cardinal information [69]:
Ordinal information refers only to rank, thereby excluding any information pertaining to differences of
attractiveness (strength of preference).
MACBETH information includes the semantic judgements entered into the model, however, it does
not distinguish between any of the possible numerical scales compatible with those judgements.
Cardinal information denotes the specific scale validated by the decision maker.
Fig. 29 shows the three projects, and the two reference levels, ordered by their overall attractiveness, where
the plus sign illustrates “additive dominance” (the option is globally more attractive), the triangle illustrates
“dominance” (the option is more attractive in every criteria) and the question mark illustrates the case where
no conclusion can be drawn.

66
Fig. 29: Robustness analysis (0% variation)
As a result of increasing the uncertainty in all information (by 1% at a time), a “questions mark” appears first
for {P3, all upper} and then for {all upper, P4}. However, as can be seen in Fig. 30 (left), only at 10% an “additive
dominance” between two projects was lost, namely P3 and P4. The “additive dominance” between P4 and P5
was lost at 11%.
Fig. 30: Robustness analysis (10% variation on the left, different variations on the right)
As a conclusion, P3 appears to be a relatively robust choice, since it remains the most attractive project for
variations of up to 10% in all information. Furthermore, it is interesting to notice that the variation in C4 has
the biggest impact in this scenario, as illustrated in Fig. 30 (right): if a 5% variation is chosen for C4, all the other
parameters have to change 25% in order to change P3’s “additive dominance”.

67
4.4. Risk Analysis
Risk will now be taken into account, expressed by the probabilities of technical (Pt) and financial (Pf) success,
whose values were estimated in Section 4.2.3. The commercial success was not included since, hypothetically
speaking, the company cannot provide valid estimates for it or because the probabilities are identical among all
projects.
Henceforth, the two projects that failed the triage filter (P2 and P6) will also be used, simulating that they
passed the triage filter, merely for the purpose of making a more interesting illustration of risk and resource
allocation analysis. Obviously, this should not be done in a real situation.
The overall probabilities of success (P) and overall scores (V) of the five projects are shown in Tab. 13, together
with their respective computed expected benefit (E).
Tab. 13: Table of expected value
Projects Probability of success (%) Overal score Expected benefit
Pt Pf P = Pt*Pf V E =V*P
P3 88 86 76 102.16 77.31
P4 86 91 78 91.67 71.74
P5 93 90 84 68.99 57.74
P2 95 80 76 96.13 72.78
P6 95 82 78 80.40 62.94
Fig. 15 shows a graph of the “final projects” (P3, P4 and P5) and the “other projects” (P2 and P6) with their
overall scores plotted against the probability of success, where the size of the circles depict the investment.

68
Fig. 31: Probability of success VS Overall score
The dotted line represents the “efficient frontier”, formed by the non-dominated projects P3, P4 and P5, since
P4 has a higher return than P6 for the same probability of success (78%) and likewise to P3 and P2. If the
decision was to be made based on this graph, decision makers could reject P2 since not only it is dominated by
P3 but it is also more expensive, while P6 is cheaper than P4 and could be worth the 11.27 score difference.
4.5. Resource Allocation
Finally, admitting the same five projects that are competing for limited resources, a resource allocation analysis
will be performed to reach a final portfolio of projects, using their expected (risk-adjusted) benefit and
investment (cost).
Tab. 14 shows some portfolios that can be constructed supposing that the company has a predetermined
budget of 115.000€, organized by decreasing order of E/C ratio. The common (E/C ratio) prioritization approach
would result in portfolio A (project 2 does not fit in the budget), while an optimization approach would result in
portfolio C, which has a higher benefit for the available budget than portfolio A but has a lower E/C ratio.
Nevertheless, either approach is better than a prioritization based of benefit only, which would originate
portfolio D that has a much smaller benefit for the available budget and a smaller E/C ratio.

69
Tab. 14: Possible portfolios of projects
Portfolio of Projects
Expected benefit Investment [thousand €]
Ratio
E C E/C
{6} 62,94 20 3,15
{3} 77,31 25 3,09
{4} 71,74 35 2,05
{5} 57,74 30 1,92
{2} 72,78 40 1,82
A: {6,3,4,5} 269,74 110 2,45
B: {6,3,4,2} 284,78 120 2,37
C: {6,3,5,2} 270,78 115 2,35
D: {3,2,4} 221,84 100 2,22
Fig. 32 shows all the possible 32 (=25) portfolios that can be created with this five projects, where the grey line
represents the efficient frontier (non-dominated portfolios) and the black dotted line represents the convex
efficient frontier [76] (formed by the portfolios that have the highest benefit/investment ratio, depicted by
circles).
Fig. 32: Portfolios of projects
In a decision-making perspective, it could be recommendable to increase the available budget to 120.000€ and
choose portfolio B, which ensures a higher benefit and also better value-for-money than portfolio C, as can be
seen in Fig. 32. Furthermore, if there is a much higher number of projects and also constraints/synergies
between projects, the use of software is advised, as explained in Section 3.5 of Chapter III.
0
50
100
150
200
250
300
350
0 25 50 75 100 125 150
Cu
mu
lati
ve E
xpec
ted
Be
ne
fit
Cumulative Investment [thousands]
Efficient projects
Remaining projects
{6,3,4,5,2}
A: {6,3,4,5}
{6,3,4}
{6,3}
{6}
{}
B C
D

70
It should be noted that in order to choose an “optimal” portfolio, the company should also seek the right
balance of projects, in terms of number, long/short duration, high/low risk, alignment with the business's
strategy, types of projects and products/technologies/markets [14] and address other relevant issues, such as
the possibility to partially fund some projects and the costs of not financing projects [79].
4.6. Decision and Conclusions
This evaluation session resulted in the recommendation of portfolios C or A, depending on the preference
(highest E or highest E/C ratio, respectively), or portfolio B, in case the company is willing to spend an extra
5.000€. Decision makers should now discuss the robustness of these results in order to make a well-founded
choice, since they will always bear responsibility for the decision [21], in addition to making a statement of the
key assumptions made, the issues to be addressed in the next decision [22] and a summary of the lessons
learned in this process. Later, at the closing stage of the projects, they should compare the more recent
available data with the assumptions made during the selection stage in order to identify and understand errors
on the estimates and improve their project selection process.
71
5. Conclusion
This chapter provides a summary of the foregoing chapters of this thesis, as well as the resulting conclusions
and suggestions for future developments.
5.1. Summary
This thesis explained the importance of project selection in order to have a successful innovation value chain,
as well as the challenges in their application in companies. It focused on the different approaches and methods
used in the literature for evaluating and prioritizing potential projects at the early stages of innovation in a
context of limited resources and different business constraints. An exhaustive list of different criteria and
descriptors of performance was developed, establishing the foundation for the evaluation of the potential
benefits of the projects that, together with the incorporation of risk and the construction of a portfolio of
projects, compose the proposed methodology for project selection, which is the main contribution of this
thesis. Furthermore, in order to demonstrate how the methodology could be applied in a real scenario, an
example of application is presented, which also illustrates the use of the M-MACBETH software.
5.2. Findings
The literature research allowed to verify the challenges stated in the introduction, that the methods are usually
too simple or excessively elaborate for most managers and companies. Furthermore, it allowed to notice that
some companies lack a formal selection process and, among the ones that do not, the most common mistakes
that lead to ineffective portfolio management are the over-reliance on financial models and the inexistence of
strategic criteria and criteria for Go/Kill decisions.
5.3. Contributions
In order to deal with these issues, a comprehensive methodology to assist companies in selecting innovation
projects was proposed. It is an objective procedure that involves multicriteria (including non-financial and
intangible) decision-making, filters projects according to requisites and deals with risk analysis and resource
allocation, therefore achieving the objective of being simultaneously complete and simple to understand, apply
and adapt to the specific needs of the company, while generating valuable information in a timely and useful
fashion.
This thesis contributes to theoretical and practical knowledge, both in Chapter II - State of the Art, and in
Chapter III - Methodology for Project Selection. On the one hand, by founding typical project selection
steps/techniques with theoretical ground that is often absent in the literature, regarding, for instance,
decision-making, options rating, scores aggregation and portfolio construction. On the other hand, practical
contributions are made with the proposition of a new methodology, where there is a logical sequence of stages

72
that a company should execute in order to ensure a complete, simple and transparent process of project
evaluation and selection.
5.4. Challenges and Limitations
The main challenges faced while carrying out the research for thesis are concerned with the models for project
selection, the descriptors of performance and risk. Firstly, the extremely vast amount of different types and
variations of models made it impractical to mention, explain and discuss all of them. For this reason, only more
broad and common types of models were presented, omitting the explanation of, for instance, more complex
programming models. Secondly, the use of descriptors of performance (or scaling statements) is rare in the
literature and was challenging to find. The more valuable contributions in this topic belong to [22], [23] and
[25]. Finally, although the probability of success is sometimes referred as an option to address risk and
uncertainty, practical examples of its incorporation in the project selection process were not found except for
its use as a criterion. Therefore, it is acknowledged that the approach developed here for risk analysis is a new
proposition that, in some cases, might fall behind more sophisticated techniques.
5.5. Applications of this Thesis
It is the author’s belief that the reading of this thesis can be helpful for any manager responsible for project
selection but especially for companies that do not have a formal and objective project selection process. The
information collected regarding the importance of this task, the different methods and criteria available, the
analysis of risk, the resource allocation and the proposed methodology itself, can constitute a valuable aid for
companies to build their own project selection process or to compare with the currently implemented one. It is
recognized, however, that each method may only be appropriate in certain situations, for a specific company
and project circumstances.
5.6. Recommendations for Future Development
Based on the challenges identified earlier, two suggestions of additional work are made. A thorough list of all
the available methods for project selection, together with their explanation, advantages and disadvantages
and, when required, exemplification and application, would strongly contribute to this field. It would expedite
and improve the research conducted by academics and companies, assisting them in choosing the most
adequate method for each situation.
In addition, it would be interesting to use and compare, in a real project selection scenario, the risk analysis
proposed with the use of probabilities of success as criteria and especially with the usual models based on the
estimation of probability distributions. This would allow comparing the simplicity and practicality of the first
two approaches with the sophistication and complexity of the latter.

73
6. References
[1] Nowotny H. et al. Gibbons, M. C.; Limoges, C. The New Production of Knowledge. Sage, London, 1994.
[2] Rogers, M. The Definition and Measurement of Innovation. Technical Report, Melbourne Institute of
Applied Economic and Social Research, The University of Melbourne, Working Paper nº 10/98, 1998.
[3] Organisation for Economic Co-operation and Development (OCDE). OECD Innovation Strategy 2015 an
Agenda for Policy Action. Meeting of the OECD Council at Ministerial Level, 2015.
[4] Organisation for Economic Co-operation and Development (OCDE). Measuring Innovation a New
Perspective. Technical Report, 2010.
[5] Andrew, J. P.; Manget J.; Michael D. C.; Taylor A.; Zablit H. Innovation 2010: A Return to Prominence -
and the Emergence of a New World Order. Technical Report, Boston Consulting Group, 2010.
[6] Directorate-General for Regional Policy European Commission. Evaluation of Innovation Activities
Guidance on Methods and Practices. Technical Report, European Union, 2012.
[7] Heneric, O.; Licht, G.; Sofka W. Europe’s Automotive Industry on the Move: Competitiveness in a
Changing World, volume 32. ZEW - Centre for European Economic Research, Mannheim, 2005.
[8] Shaker, K. Project Management Institute, Inc., Projects are the Engines of Innovation, 2014. Available
on <http://www.pmi.org/learning/PM-Network/2014/projects-are-engines-of-innovation.aspx> Last access
Sept. 12, 2015.
[9] Bordia, R. Jaruzelski, B.; Dehoff, K. Money isn’t Everything. Strategy + Business, The Global Innovation
1000, 41, winter 2005.
[10] Kandybin, A.; Kihn, M. Raising your Return on Innovation Investment. Strategy + Business, 35, 2004.
[11] Heising, W. The Integration of Ideation and Project Portfolio Management - A key factor for
Sustainable Success. International Journal of Project Management, 30(5):582 – 595, 2012. Special Issue on
Project Portfolio Management.
[12] Phillips, L. D.; Bana e Costa, C. A. Transparent Prioritisation, Budgeting and Resource Allocation with
Multi-criteria Decision Analysis and Decision Conferencing. Annals of Operations Research, 154(1):51–68, 2007.
[13] International Organization for Standardization. ISO 31000:2009, Risk Management - Principles and
Guidelines, 2009.
[14] Harvey, A. L.; Foreword by Wideman, M. Project Portfolio Management A Practical Guide to Selecting
Projects, Managing Portfolios, and Maximizing Benefits. Jossey-Bass, a Wiley Imprint, 2005.

74
[15] Cooper, R. G.; Edgett, S. J.; Kleinschmidt, E. J. New Product Portfolio Management: Practices and
Performance. Journal of Product Innovation Management, 16(4):333 – 351, 1999.
[16] Pinto, J. K. Project Management: Achieving Competitive Advantage, Chapter Project Selection and
Portfolio Management, pages 70–105. Prentice Hall, 2010.
[17] Henriksen, A.D. and Traynor, A.J. A Practical R&D Project-selection Scoring Tool. Engineering
Management, IEEE Transactions on, 46(2):158–170, 1999.
[18] Bin, A.; Azevedo, A.; Duarte, L.; Salles-Filho, S.; Massaguer, P. R&D and Innovation Project Selection:
Can Optimization Methods be Adequate? Procedia Computer Science, 55:613 – 621, 2015. In 3rd International
Conference on Information Technology and Quantitative Management, {ITQM} 2015.
[19] Wang, J.; Xu, Y.; Li, Z. Research on Project Selection System of Pre-evaluation of Engineering Design
Project Bidding. International Journal of Project Management, 27(6):584 – 599, 2009.
[20] Adams, R.; Bessant, J.; Phelps, R. Innovation Management Measurement: A review. International
Journal of Management Reviews, 8(1):21–47, 2006.
[21] Meredith, J. R.; Mantel Jr., S. J. Project Management: A managerial Approach. John Wiley & Sons, Inc.,
2009.
[22] Mitchell, R.; Phaal R.; Athanassopoulou, N. Scoring Methods for Prioritizing and Selecting Innovation
Projects. In Proceedings of PICMET ’14: Infrastructure and Service Integration, 2014.
[23] Eilat, H.; Golany, B.; Shtub, A. R&D Project Evaluation: An Integrated DEA and Balanced Scorecard
Approach. Omega, 36(5):895 – 912, 2008.
[24] Sokmen, N. A Multi-criteria Project Assessment Framework for R&D Organizations in the IT Sector. In
Proceedings of PICMET ’14: Infrastructure and Service Integration, 2014.
[25] Cooper, R. G.; Edgett; S. J.; Kleinschmidt, E J. Portfolio Management for New Product Development:
Results of an Industry Practices Study. Technical Report, Product Development Institute Inc., 2001.
[26] Graves, S. B.; Ringuest, J. L. Models & Methods for Project Selection: Concepts/rom Management
Science, Finance & Information Technology. Springer Science+Business Media New York, 2003.
[27] Ilebavare, I. M. An Investigation into the Treatment of Uncertainty and Risk in Roadmapping: A
Framework and a Practical Process. PhD thesis, Wolfson College, University of Cambridge, 2013.
[28] Solak, S.; Clarke, J. B.; Johnson, E. L.; Barnes, E. R. Optimization of R&D Project Portfolios under
Endogenous Uncertainty. European Journal of Operational Research, 207(1):420 – 433, 2010.

75
[29] Teixeira, P. C. R. Potenciar a inovação em PMEs industriais de baixa incorporação tecnológica: uma
abordagem de caso de estudo. PhD thesis, Instituto Superior Técnico, Universidade Técnica de Lisboa, 2011.
[30] Nobel Media AB 2014. The Prize in Economics 1990 - Press Release. Available on
<http://www.nobelprize.org/nobel_prizes/economic-sciences/laureates/1990/press.html>. Access on Oct. 15
2015.
[31] Rod, P.F.; Levin, G. Project Portfolio Management Tools and Techniques. IlL Publishing, New York,
2006.
[32] Bard, J.F.; Balachandra, R.; Kaufmann, P.E. An Interactive Approach to R&D Project Selection and
Termination. Engineering Management, IEEE Transactions on, 35(3):139–146, 1988.
[33] Bretschneider, S. Evaluating R&D Impacts: Methods and Practice, chapter Operations Research
Contributions to Evaluation of R&D Projects (Chapter 7). Springer Science+Business Media, LLC, New York,
1993.
[34] The standard for portfolio management. Project Management Institute, 2013.
[35] Souder, E. W. A Scoring Methodology for Assessing the Suitability of Management Science Models.
Management Science, 18(10), 1972.
[36] Souder, E. W. Comparative Analysis of R&D Investment Models. AIIE Transactions, 4(1):57–64, 1972.
[37] Kerr, C.; Farrukh, C.; Phaal, R.; Probert, D. Key principles for developing Industrially Relevant Strategic
Technology Management Toolkits. Technological Forecasting and Social Change, 80(6):1050 – 1070, 2013.
[38] Badri, M. A.; Davis, D.; Davis, D. A Comprehensive 0-1 Goal Programming Model for Project Selection.
International Journal of Project Management, 19(4):243 – 252, 2001.
[39] Dey, P. K. Integrated Project Evaluation and Selection Using Multiple-attribute Decision-making
Technique. International Journal of Production Economics, 103(1):90 – 103, 2006.
[40] Brealey, R. A.; Myers, S. C.; Allen, F. Principles of Corporate Finance. McGraw-Hill/Irwin, 2011.
[41] Saaty, T.L. Multiple Criteria Decision Analysis: State of the Art Surveys, chapter ‘‘The analytic hierarchy
and analytic network processes for the measurement of intangible criteria and for decision-making’’, Process:
What the AHP is and what it is not, page 345–407. Springer, New York, 2005.
[42] Marques, G.; Gourc, D.; Lauras, M. Multi-criteria Performance Analysis for Decision Making in Project
Management. International Journal of Project Management, 29(8):1057 – 1069, 2011.
[43] Lourenco, J.C.; Bana e Costa, C.A.; Morton, A. Software Packages for Multi-criteria Resource Allocation.
Engineering Management Conference, 2008. IEMC Europe 2008. IEEE International, pages 1–6, 2008.

76
[44] Bana e Costa, C. A.; Vansnick, J. A Critical Analysis of the Eigenvalue Method Used to Derive Priorities
in AHP. European Journal of Operational Research, 187(3):1422 – 1428, 2008.
[45] Bana e Costa, C. A.; de Corte. J.; Vansnick, J. Macbeth. International Journal of Information Technology
& Decision Making, 11:359–387, 2012.
[46] Van Herwijnen, M. Multi-attribute Value Theory. Available on <http://www.ivm.vu.nl/en/index.aspx
>Access on July 14, 2015.
[47] Bana e Costa, C. A.; Meza-Angulo, L.; Oliveira, M. D. O Método Macbeth e Aplicação no Brasil.
Engevista, 15:3–27, 2013.
[48] Shakhsi-Niaei, M.; Torabi, S. A.; Iranmanesh, S. H. A Comprehensive Framework for Project Selection
Problem Under Uncertainty and Real-world Constraints. Computers & Industrial Engineering, 61(1):226 – 237,
2011.
[49] Linton, J. D.; Walsh, S. T.; Morabito, J. Analysis, Ranking and Selection of R&D Projects in a Portfolio.
R&D Management, 32(2):139–148, 2002.
[50] Macharis, C.; Bernardini, A. Reviewing the Use of Multi-criteria Decision Analysis for the Evaluation of
Transport Projects: Time for a multi-actor approach. Transport Policy, 37:177 – 186, 2015.
[51] Figueira, J.; Greco, S.; Ehrgott, M., editor. Multiple Criteria Decision Analysis: State of the Art Surveys.
Springer Science + Business Media, Inc., Boston, 2005.
[52] Weber, J. A. Handbook of Strategic Management, chapter Uncertainty and Strategic Management.
Marcel Dekker Inc., 2nd ed., 2000.
[53] Simon, H. A. Administrative Behaviour: A Study of Decision-Making Processes in Administrative
Organizations. 1997.
[54] Keizer, J. A.; Halman, J. I. M. Diagnosing Risk in Radical Innovation Projects. Research Technology
Management, 2007.
[55] A Guide to the Project Management Body of Knowledge (PMBOOK Guide). Project Management
Institute, Inc., 2008.
[56] Kwak, Y. H.; Ingall, L. Exploring Monte Carlo Simulation Applications for Project Management. Risk
Mana, 9:44–57, 2007.
[57] Åstebro, T. Key Success Factors for Technological Entrepreneurs’ R&D Projects. IEEE Transactions on
Engineering Management, 2004.
[58] International Organization for Standardization. Risk Management – Principles and Guidelines.

77
[59] Oracle white paper—The Benefits of Risk Assessment for Projects, Portfolios, and Businesses Executive
Overview. Technical Report, Oracle, 2009.
[60] Charvat, J. Project Management Methodologies: Selecting, Implementing, and Supporting
Methodologies and Processes for Projects. John Wiley & Sons, 2003.
[61] Bana e Costa, C. A.; Ensslin, L.; Cornêa, E. M.; Vansnick, J. Decision Support Systems in Action:
Integrated Application in a Multicriteria Decision Aid Process. European Journal of Operational Research,
113(2):315 – 335, 1999.
[62] Bana e Costa, C. A.; Beinat, E. Model Structuring in Public Decision Aiding, Working Paper Lseor 05.79.
Technical Report, The London School of Economics and Political Science, 2005.
[63] Bana e Costa, C.A., Oliveira, M.D. A Multicriteria Decision Analysis Model for Faculty Evaluation.
OMEGA, The International Journal of Management Science, 40(4):424–436, 2012.
[64] Bana e Costa, C. A.; Corrêa, E. C.; De Corte, J; Vansnick, J. Facilitating Bid Evaluation in Public Call for
Tenders: A Socio-Technical Approach. Omega, 30(3):227 – 242, 2002.
[65] Bana e Costa, C.; Corte, J.M.; Vansnick, J.C. Macbeth, Working paper 03.56. London School of
Economics, 2003.
[66] Bana e Costa, C.; Chagas, M. A career choice problem: An example of how to use MACBETH to build a
quantitative value model based on qualitative value judgments. The London School of Economics and Political
Science, 2002.
[67] Siegel, S. Nonparametric statistics for the behavioral sciences. American Statistical Association
11(3):13-19, 1957.
[68] Belton, V.; Stewart, T.J. Multiple Criteria Decision Analysis: An Integrated Approach. Kluwer Academic
Publishers, Boston, 2002.
[69] Bana e Costa, C.; Corte, J.M.; Vansnick, J.C. M-MACBETH Version 1.1 User's Guide. Bana Consulting,
Lisbon, 2005.
[70] Keney, R. L. Value-Focused Thinking: A Path to Creative Decisionmaking. Harvard University Press,
Cambridge, 1992.
[71] Winterfeldt, D.; Edwards, W. Decision Analysis and Behavorial Research. Cambridge University Press,
Cambridge, 1986.
[72] Keeney, R. L.; Raiffa, H. Decisions with multiple objectives preferences and value tradeoffs. Wiley, New
York, 1976.

78
[73] Bana e Costa, C.; Lourenço, J. "Decision Support Models" course notes. Instituto Superior Técnico,
Lisboa, 2013.
[74] Wheelwright, S. C.; Clark, K. B. Creating Project Plans to Focus Product Development. Harvard Business
Review, 70(2): 70–82, 1992.
[75] H. Raiffa. Decision Analysis: Introductory Lectures on Choices under Uncertainty. Addison-Wesley,
Reading, 1968.
[76] Lourenço, J; Morton, A.; Bana e Costa, C. PROBE—A multicriteria decision support system for portfolio
robustness evaluation. Decision Support Systems, 54:534–550, 2012.
[77] Kleinmuntz, D.N. Resource allocation decisions, in: W. Edwards, R.F. Miles Jr., D. von Winterfeldt
(Eds.), Advances in Decision Analysis: From Foundations to Applications, Cambridge University Press,
Cambridge, 400–418, 2007.
[78] Hillier, F. Introduction To Operations Research, 7ed. MCGRAW HILL INC, 2001.
[79] Lourenço, J. C.; Bana e Costa, C.; Soares, J. O. Portfolio decision analysis with PROBE: addressing costs
of not financing projects. In Proceedings of the 12th WSEAS international conference on Mathematical and
computational methods in science and engineering, 340-344. World Scientific and Engineering Academy and
Society (WSEAS), 2010.
[80] Kandybin, A. Which innovation efforts will pay? Sloan Management Review, 51(1), 2009.
[81] Chesbrough, H. Open Innovation: The New Imperative for Creating and Profiting from Technology,
Harvard Business School Press, 2003.
[82] Bana e Costa, C.; Vansnick, J.C. Applications of the MACBETH Approach in the Framework of an
Additive Aggregation Model. JOURNAL OF MULTI-CRITERIA DECISION ANALYSIS, 6:107-114, 1997.
[83] Williams, T. Post-project reviews to Gain Effective Lessons Learned. Newtown Square, Pennsylvania.
Project Management Institute, Inc., 2007.
[84] Todorović, M. L.; Petrović, D. C.; Mihić, M. M.; Obradović, V. L.; Bushuyev, S. D. Project Success
Analysis Framework: A Knowledge-based Approach in Project Management. International Journal of Project
Management, 33(4):772 – 783, 2015.
[85] Bana e Costa, C.; Corte, J.M.; Vansnick, J.C. ON THE MATHEMATICAL FOUNDATIONS OF MACBETH,
Working Paper 04.61. The London School of Economics and Political Science, 2004.
[86] Hemel, C.; Cramer, J. Barriers and stimuli for ecodesign in SMEs. Journal of Cleaner Production,
10:439–453, 2002.