Embed Size (px)
Citation preview

* Corresponding author. E-mail address: [email protected] (P. B. Lanjewar) © 2016 Growing Science Ltd. All rights reserved. doi: 10.5267/j.dsl.2015.10.001
Decision Science Letters 5 (2016) 327–348
Contents lists available at GrowingScience
Decision Science Letters
homepage: www.GrowingScience.com/dsl
Evaluation and selection of energy technologies using an integrated graph theory and analytic hierarchy process methods
P. B. Lanjewara*, R. V. Raob, A. V. Kalec, J. Talerd and P. Ocłońd
aDept. of Mech. Engg., St. Vincent Pallotti College of Engg. & Technology, Nagpur, India bDept. of Mech. Engg., S. V. National Institute of Technology, Surat, India cDept. of Mech. Engg., Yashwantrao Chavan College of Engineering, Nagpur, India dPolitechnika Krakowska, Instytut Maszyn i Urządzeń Energetycznych, Al. Jana Pawła II 37, 31-864 Kraków, Poland
C H R O N I C L E A B S T R A C T
Article history: Received June 25, 2015 Received in revised format: October 12, 2015 Accepted October 20, 2015 Available online October 22 2015
The evaluation and selection of energy technologies involve a large number of attributes whose selection and weighting is decided in accordance with the social, environmental, technical and economic framework. In the present work an integrated multiple attribute decision making methodology is developed by combining graph theory and analytic hierarchy process methods to deal with the evaluation and selection of energy technologies. The energy technology selection attributes digraph enables a quick visual appraisal of the energy technology selection attributes and their interrelationships. The preference index provides a total objective score for comparison of energy technologies alternatives. Application of matrix permanent offers a better appreciation of the considered attributes and helps to analyze the different alternatives from combinatorial viewpoint. The AHP is used to assign relative weights to the attributes. Four examples of evaluation and selection of energy technologies are considered in order to demonstrate and validate the proposed method.
Growing Science Ltd. All rights reserved.6© 201
Keywords: Analytic hierarchy process Energy technology Preference index Multiple attribute decision making Graph theory
1. Introduction
The study of thermal engineering began with man’s desire to convert heat into work and to produce desired changes in the system by means of exchange of heat or work in the most economical way. Solid, liquid and gaseous fuels are basic sources of heat energy which can be converted into mechanical work and further into electrical energy, the cleanest and most versatile form of energy available today. Demand of electricity is doubling virtually every decade. For this reason, it is important that the conversion process by which it is produced be operated as efficiently as possible if the nation is to make maximum use of its finite fuel resources. It thus becomes an immense challenge to future engineers to

328
improve upon the performance of today’s power generation equipments so that the world’s finite resources can be used most efficiently. Energy conversion deals with the principles of conversion of naturally available energy into a useful form (usually electrical or mechanical) as well as the devices used in such conversion process. The study of energy conversion therefore involves familiarization with various energy forms, their availability, collection and utilization. The use of ever increasing amount of energy has freed man from drudgery and has considerably improved standard of living all over the world. The expectation is that man’s demand for energy will increase even more rapidly in the coming years, since advances in science and technology have been occurring continuously. It is therefore essential that energy conversion should be a subject of vital importance to all engineers. Population and societal growth coupled with technological progress, have all lead to a rapid increase in energy usage and consequent depletion of fossil fuel reserves. At the same time, there is a growing belief that the use of fossil fuel and the consequent release of greenhouse gases are mainly responsible for the observed global warming trend. Hence there is a big push for developing new sources of clean, alternative energy for replacing the fossil fuels. In addition, if the source is renewable, that will further help provide a long term solution. Thus energy source has become an important commodity for survival and progress and has to be evaluated on thermoeconomic and socioeconomic bases. It requires 21st century cutting edge science, technology and systems for harvesting energy from the available sources and transforming it efficiently and economically into electricity, heat or power required for human consumption with minimal perturbation to the ecology. It is also important to note that the present energy crisis has occurred mainly because of dependence on only a few sources. Hence this needs to be addressed not only by exploring and evaluating all possible sources but also by developing systems for efficient transformation, storage and distribution of energy. Therefore the scientific and engineering communities have to develop advanced energy technologies, which will meet the need of all the sectors: industry, transport and building. Three main options have to be considered (i) improve existing energy technologies and reduce their environmental impact, (ii) develop innovative technologies for better energy management and promote energy efficiency and (iii) develop advanced energy technologies such as renewable energies and new energy carriers. Earlier, the energy technologies have been selected mainly on the cost-benefit analysis. Nowadays, such decisions are typically made on the basis of life-cycle costs; however, as environmental issues become increasingly important, the traditional single criteria analysis becomes unacceptable. Thus, the evaluation of energy technologies is complex and depends on a number of parameters such as economic, technological, environmental, social, geographical, ethics, and so on. In order to deal with such a difficult problem, multiple criteria decision making (MCDM) is always employed. As one of the major parts of decision theory, it provides a flexible idea that is able to handle and bring together a wide range of variables appraised in different ways and thus offer valid assistance to the decision makers. 2. Literature review Many multiple criteria based decision making methods for evaluation and selection of energy technologies has been developed. Analysis and synthesis of parameters under information deficiency (ASPID) methodology was adopted to evaluate the combined heat and power (CHP) system options (Pilavachi et al., 2006) and power system options (Begic and Afgan, 2007). The methodology comprised the system of stochastic model of uncertainty and normalization of indexes by using non-numeric, non-exact and non-complete information with respective reliability and probability. However, this approach has its limitations due to the lack of data for serious consideration of the system. Also, no method was proposed to deal with non-numeric information. A multiple criteria methodology called novel approach to imprecise assessment and decision environments (NAIADE) was presented to select

P. B. Lanjewar et al./ Decision Science Letters 5 (2016)
329
and rank the natural gas turbines (Dincaa et al., 2007). The multidimensional assessment of technologies was represented in the form of a matrix composed of rows with the target criteria and columns with the alternatives. The alternatives were analyzed by a methodology based on NAIADE principle and the results were compared by performing sensitivity analysis. The method proposed is complicated and requires more computation. Decision support models based on sustainability index rating method have been proposed to evaluate different energy systems such as hydrogen energy systems (Afgan and Carvalho, 2004), natural gas energy systems (Afgan et al., 2007), hydrogen production processes (Afgan et al., 2007) and hybrid energy systems (Afgan and Carvalho, 2008). The analysis was based on determination of general index of sustainability composed of linear aggregative functions of all indicators with respective weighting function. Analytic hierarchy process (AHP) had been employed for the evaluation and selection of hydrogen production processes (Pilavachi et al., 2009a), hydrogen and natural gas fuelled power plants (Pilavachi et al., 2009b) and space heating systems for an industrial building (Chinese et al., 2011). Amir and Daim (2011) applied AHP for the selection and prioritization of various renewable energy technologies for electricity generation in Pakistan. Wind energy, solar photovoltaic, solar thermal and biomass energy were the options assessed from technical, economical, social, environmental and political aspects. The relative weights of 20 sub criteria were determined by pairwise comparison using AHP. Biomass energy and wind energy emerged as the preferred alternatives. The AHP can effectively address both objective and subjective attributes but sometimes unmanageable pairwise comparisons may result due to large number of attributes and alternatives. Rastogi et al. (2015) carried out performance assessment of phase change materials (PCM) for heating, ventilation and air-conditioning (HVAC) applications. The performance of PCMs was graded using figure of merits (FOM) which were further subjected to Pareto Optimality test. The graded PCMs were ranked using TOPSIS (Technique for Order of Preference by Similarity to Ideal Solution) method. The relative weights for the different attributes were calculated using Shannon’s entropy method. Garg et al. (2007) suggested elimination search method for identification and coding of the thermal power plant selection attributes and employed TOPSIS approach for the selection of power plants. A five point scale was adopted for coding of the attributes. However, in general, the TOPSIS method deals mainly with objective attributes and has been proved to be less efficient as compared to AHP. Hence, the application of TOPSIS for power plant selection may not provide reliable results. Cavallaro (2009) employed a methodology based on the method of outranking called PROMETHEE (Preference Ranking Organisation Method for Enrichment of Evaluations) for the assessment of concentrated solar thermal technologies. Three economic and four technical criteria were identified for comparison and assessment of twelve different alternatives. Simos technique was applied to compute the criteria weights and the alternatives were ranked on the basis of preference flows derived using PROMETHEE. A comparative evaluation of four different scenarios for the development of power generation sector in Greece was carried out using CBA (cost based analysis) and PROMETHEE (Diakoulaki and Karangelis, 2007). Renewable energy was reported as the best option for power generation under economic, technical and environmental consideration. Another outranking methodology, ELECTRE III (ELimination Et Cholx Traduisant la REalite), was proposed by Cavallaro (2010) to evaluate the production processes of thin film solar cells. Eight different production processes were examined with respect to utilization rate of material, cost of material, thickness of material, cost of the module and state of art of technology. Simos method was used to calculate the weights of criteria having quantitative and qualitative measures. Avgelis and Papadopoulos (2009) utilized ELECTRE III method for the assessment of HVAC (heating, ventilation and air-conditioning) systems with respect to economic, energy, environmental and user’s satisfaction criteria. A sensitivity analysis was also performed by changing the weights of the criteria to examine the stability of the results. Computation using ELECTRE III is too complex and is not normally used

330
for actual selection of alternatives but may be suitable for the initial screening process. Kabak and Dagdeviren (2014) proposed a hybrid decision model based on BOCR (benefits, opportunities, costs and risks) and analytic network process (ANP) to prioritise alternative renewable energy sources among hydro, geothermal, solar, wind and biomass energy with regards to 19 criteria. Kaya and Kahraman (2011) proposed a modified fuzzy methodology combining fuzzy AHP and TOPSIS for the selection of best energy technology. The weights of the selection criteria were determined by fuzzy AHP and the energy technologies were evaluated using TOPSIS. Wind energy was found to be the best option among the alternatives considered. Kahraman et al. (2009) suggested a combined fuzzy AHP and fuzzy axiomatic design (FAD) procedure to determine the most appropriate renewable energy alternative. The proposed fuzzy AHP methodology determined the most appropriate alternative based on pairwise comparisons and flexible evaluations by experts, whereas, in fuzzy axiomatic design, the alternative which most satisfied the functional requirements for each criterion was selected as the best. The fuzzy methods are complex and the use of fuzzy set approach with AHP as a decision making tool does not necessarily lead to better results. (Saaty, 2007, 2010). A modified fuzzy AHP methodology was suggested and utilized by Kahraman and Kaya (2010) for the selection of best energy policy for Turkey. In their method, fuzzy aggregation was used to create group decisions and priority weights were computed by defuzzifying the fuzzy scales into crisp values. Different renewable energy alternatives were evaluated on the basis of four main and seventeen sub-criteria. However, the fuzzy models proposed by the authors are complicated and knowledge intensive. After a detailed study of the above mentioned MADM methods and their applications for the evaluation and selection of energy technologies, it is observed that
The multiple criteria decision making methods mentioned above tend to be complex, knowledge intensive, involves more computations and are less effective in dealing with the decision making situations of energy technologies.
There does not exist a single MADM method which can be applied to all decision problems equally efficiently.
There is a need for simple, systematic, logical and consistent method or tool to guide decision makers in making optimal selection.
Hence a methodology is developed by integrating Graph Theory (GT) and Analytic Hierarchy Process (AHP) methods for the evaluation and selection of energy technologies.
3. Proposed integrated graph theory and analytic hierarchy process (GT-AHP) methodology Graph theory is a systematic and logical approach that can be used to model and analyze various engineering systems. Graph theory and matrix approach (GTMA) method has been employed for the evaluation of cutting fluids (Rao & Gandhi, 2001), environmentally conscious manufacturing programs (Rao, 2004), flexible manufacturing systems (Rao, 2006a), material selection (Rao, 2006b), and selection of industrial robots (Rao and Padmanabhan, 2006). GTMA helps in identifying attributes, and offer a better visual appraisal of the attributes and their interrelations (Rao, 2007). On the other hand, AHP is an analytical tool that can be applied to selection problems involving large number of alternatives and criteria. The consistency check of relative importance of the attributes is a significant feature of AHP. In view of these advantages, a methodology integrating graph theory and AHP method is proposed in this work for evaluation and selection of energy technologies. AHP is applied to determine the relative weights of the considered attributes and graph theory is applied to evaluate and rank the alternatives. This approach is similar to the one presented by Rao and Parnichkun (2009) and Singh and Rao (2011). Recently, Lanjewar et al. (2015) applied this methodology for selection of fuels in transportation systems and the same methodology is extended here for evaluation and selection of alternative energy technologies.
P. B. Lanjewar et al./ Decision Science Letters 5 (2016)
331
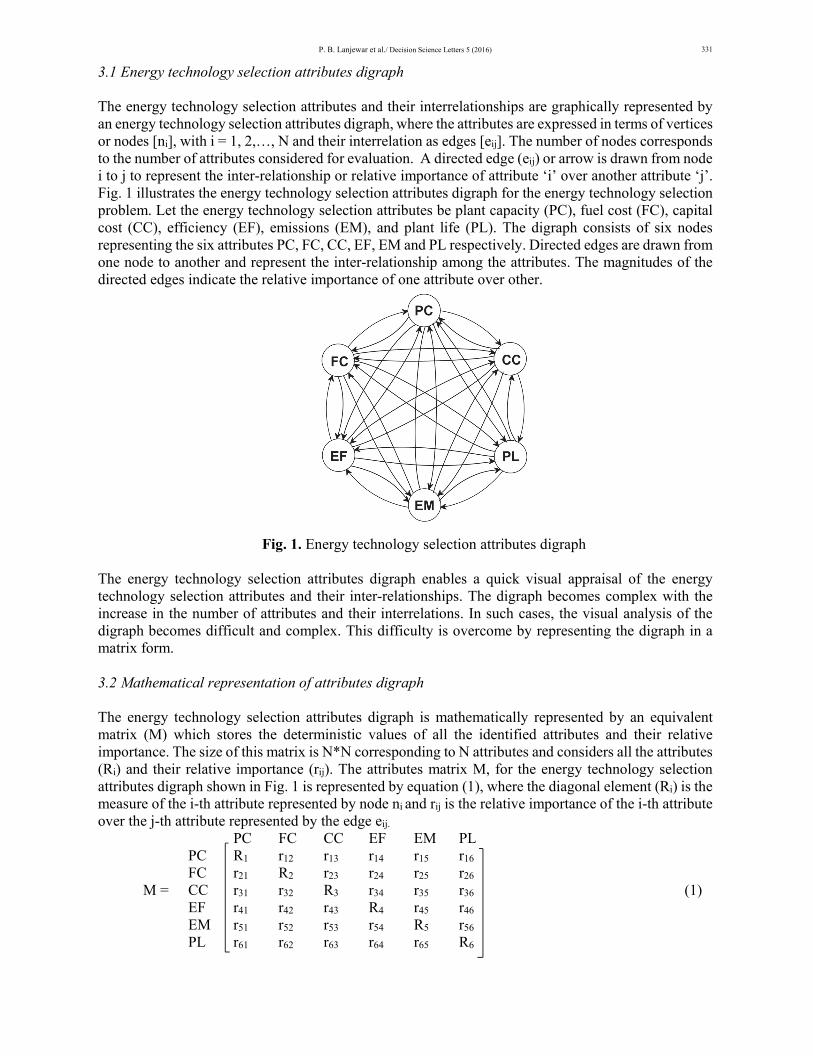
3.1 Energy technology selection attributes digraph The energy technology selection attributes and their interrelationships are graphically represented by an energy technology selection attributes digraph, where the attributes are expressed in terms of vertices or nodes [ni], with i = 1, 2,…, N and their interrelation as edges [eij]. The number of nodes corresponds to the number of attributes considered for evaluation. A directed edge (eij) or arrow is drawn from node i to j to represent the inter-relationship or relative importance of attribute ‘i’ over another attribute ‘j’. Fig. 1 illustrates the energy technology selection attributes digraph for the energy technology selection problem. Let the energy technology selection attributes be plant capacity (PC), fuel cost (FC), capital cost (CC), efficiency (EF), emissions (EM), and plant life (PL). The digraph consists of six nodes representing the six attributes PC, FC, CC, EF, EM and PL respectively. Directed edges are drawn from one node to another and represent the inter-relationship among the attributes. The magnitudes of the directed edges indicate the relative importance of one attribute over other.
Fig. 1. Energy technology selection attributes digraph
The energy technology selection attributes digraph enables a quick visual appraisal of the energy technology selection attributes and their inter-relationships. The digraph becomes complex with the increase in the number of attributes and their interrelations. In such cases, the visual analysis of the digraph becomes difficult and complex. This difficulty is overcome by representing the digraph in a matrix form. 3.2 Mathematical representation of attributes digraph The energy technology selection attributes digraph is mathematically represented by an equivalent matrix (M) which stores the deterministic values of all the identified attributes and their relative importance. The size of this matrix is N*N corresponding to N attributes and considers all the attributes (Ri) and their relative importance (rij). The attributes matrix M, for the energy technology selection attributes digraph shown in Fig. 1 is represented by equation (1), where the diagonal element (Ri) is the measure of the i-th attribute represented by node ni and rij is the relative importance of the i-th attribute over the j-th attribute represented by the edge eij.
PC FC CC EF EM PL PC R1 r12 r13 r14 r15 r16 FC r21 R2 r23 r24 r25 r26 M = CC r31 r32 R3 r34 r35 r36 (1) EF r41 r42 r43 R4 r45 r46 EM r51 r52 r53 r54 R5 r56 PL r61 r62 r63 r64 r65 R6

332
The matrix representation of the energy technology selection attributes diagraph provides a systematic mapping among the various attributes and enables a clear understanding regardless of its size. The matrix model is one-to-one representation of the diagraph and represents decision maker preferences and value judgments. The matrix model is easy to understand and can be processed by the computer in an efficient manner.
3.3 Characteristic permanent function
The permanent function of the attributes matrix M, i.e. per (M) is defined as the characteristic permanent function. The permanent of a matrix is very important in many fields especially in combinatorics, where it is used to characterize configurations of a system or the structure of a graph. (Marcus & Mine, 1965; Jurkat & Ryser, 1966). A characteristic permanent function is a complete representation of the attributes of a system and retains all possible information of the attributes and their interrelations. The permanent is defined similar to the determinant of a matrix with all the determinant terms as positive terms. Moreover, no negative sign appears in the permanent function of a matrix and hence no information will be lost. The attribute permanent function for ‘n’ attributes matrix when expanded, will have (n!) terms which may be arranged in (n+1) groups.
Per M
(2)
The characteristic permanent function for above Eq. (1) is written as Eq. (2). All attributes and all their possible interrelations are completely represented by Eq. (2). The different terms in the Eq. (2) are the sets of distinct diagonal elements (Ri) and loops of off-diagonal elements of different sizes (i.e. rijrji, rijrjkrkl, etc.). Application of permanent concept leads to better appreciation of the selection problem as it contains all the structural components of the attributes and their inter-relations.
3.4 Preference index
The preference index represents the measure of performance of a alternative with respect to the attributes. The numerical value of attributes permanent function is called the preference index. In order

P. B. Lanjewar et al./ Decision Science Letters 5 (2016)
333
to make the computation simple and fast, a computer program is developed in C language that evaluates the permanent function of a matrix. As the function contains only positive terms, higher values of Ri and rij will result in increased value of preference index. The system with highest preference index represents the most preferred option for the given application and is ranked first on the preference list.
3.5 Relative importance matrix
It is difficult to determine with sufficient accuracy the individual importance of each attribute. Therefore, the relative importance of one attribute over another (i.e. rij) is expressed using pairwise comparisons. For pair-wise comparison, a verbal scale (Table 1) proposed by Saaty (1980) is commonly used that enables the decision maker to incorporate subjectivity, experience, and knowledge in an intuitive and natural way. Table 1 AHP pair-wise comparison scale Scores Intensity of importance of one attribute over another 1 Equal importance 3 Moderate importance 5 Strong importance 7 Very strong importance 9 Absolute importance 2,4,6,8 Intermediate values
The procedure to assign relative importance degree to attributes and checking the consistency of the judgements using AHP method is explained below. (i) Construction of relative importance matrix A relative importance matrix (Eq. (3)) is constructed using a pairwise comparison scale of AHP. Assuming n attributes, the pairwise comparison of attribute i with attribute j yields a square matrix Mn*n where rij denotes the relative importance of attribute i with respect to attribute j. An attribute compared with it is always assigned a value 1, so all the diagonal entries of the pairwise comparison matrix are equal to 1. In the matrix rij = 1 when i = j and rji = 1/ rij.
⋯
⋮
⋮
⋮
(3)
(ii) Determination of relative weights The weights of the attributes (Wi) are determined using the normalization of geometric mean method (Eq. (4)).
∑
, 1,2, … , (4)
(iii) Obtain the principal eigen value
The principal eigen value (max) is obtained using the Eq. (5) and Eq. (6). The principal eigen value (max) represents the measure of consistency. The closer max to the number of attributes is the more consistent the matrix of relative importance.

334
⋯
⋮
⋮
⋮ ∗
⋮
′
′⋮′
(5)
1∗
`
`⋯
` (6)
(iv) Consistency check The Consistency Index (CI) is calculated as CI – n n 1⁄ ), where n is the number of attributes (7)
The CI shows the deviation from consistency. Smaller value of CI indicates lesser deviation from the consistency. The Consistency Ratio (CR) is determined as CR CI RI⁄ (8)
The random index RI for the number of attributes used in decision making is obtained from Table 2. Usually, a CR of 0.1 or less is accepted as it reflects sufficient consistency made in the judgments. Table 2 Random index (RI) values (Saaty, 2000) Number of Attributes Random Index 1 0.00 2 0.00 3 0.52 4 0.89 5 1.11 6 1.25 7 1.35 8 1.40 9 1.45 10 1.49
3.6 Normalization of attributes
The measures of the energy technology selection attributes can be obtained from specified or estimated data, experimental results, technical handbooks and published literature. The selection attributes (Ri) may have different units and consequently they cannot be directly compared with each other. Hence, there is need for normalizing the values of the attributes in order to make them dimensionless and unit-free. The attributes are classified as beneficial and non-beneficial attributes. An attribute whose higher value is desirable (e.g. efficiency) is called beneficial attribute. On the other hand, an attribute whose lower measure is desirable (e.g. capital cost) is a non-beneficial attribute. A beneficial attribute is normalized as yi/yj, where yi is the measure of beneficial attribute for i-th alternative and yj is measure of the same beneficial attribute for the j-th alternative that has the highest measure of the attribute among the considered alternatives. For non-beneficial attribute the normalized value is calculated as yj/ yi where yi is the measure of non-beneficial attribute for i-th alternative and yj is the measure of same non-beneficial attribute for the j-th alternative that has the lowest measure of the attribute among the considered alternatives.

P. B. Lanjewar et al./ Decision Science Letters 5 (2016)
335
3.6.1 Conversion of linguistic terms into crisp score
Most of the real world MADM situations contain a mixture of crisp and linguistic data where some of the attributes are expressed qualitatively and others quantitatively. It is relatively difficult for the decision maker to provide exact quantitative values for the attributes. The evaluation data for the various subjective attributes are usually expressed in linguistic terms by the decision makers. Such uncertainties in human preferences can be successfully addressed using fuzzy logic which deals with imprecise information. Since the comparison of alternatives is performed using the final performance scores which are real numbers, conversion of linguistic measures into crisp values is needed for computation of final scores. Hence, to deal with linguistic information of the qualitative attributes, a conversion scale is suggested and presented in Table 3. Instead of assigning arbitrary values for various subjective attributes, these conversion scales reflects the exact linguistic description in terms of crisp values and provides a better appreciation of the linguistic descriptions that are widely used. The subjective measures of the attributes are converted to objective values and then normalized as explained above. Table 3 Conversion of linguistic terms into crisp scores (11-point fuzzy scale) (Rao, 2007) Subjective measure of attribute Crisp value Subjective measure of attribute Crisp value Exceptionally low 0.045 Above Average 0.590 Extremely low 0.135 High 0.665 Very low 0.255 Very High 0.745 Low 0.335 Extremely high 0.865 Below Average 0.410 Exceptionally high 0.955 Average 0.500
It may be mentioned that one may choose any scale for Ri, the final ranking will not change as these are relative values. More details about these scales are available in Rao (2007, 2013).
3.7 Methodology of integrated GT-AHP as a decision making method
The major steps of the proposed integrated GT-AHP method as a decision making methodology are summarized below.
Step 1: Shortlist the energy technology alternatives for the given application and identify the attributes on the basis of which analysis is to be performed. The choice of attributes depends on the user’s requirements. An objective or subjective value or its range is assigned to each identified attribute as a threshold value for its acceptance for the considered application. The performance measures of the identified attributes are normalized as explained in section 3.6.
Step 2: Compose a relative importance matrix by assigning the relative importance (rij) to the attributes and check the consistency made in the judgments. Refer to section 3.5 for details.
Step 3: Model the energy technology selection attributes digraph with number of nodes equal to the number of identified attributes. The magnitude of the edges and their directions will be determined from the relative importance between the attributes. Refer to section 3.1 for details.
Step 4: Represent the energy technology selection attributes diagraph in the form of a matrix. This will be a square matrix of order n with diagonal elements representing the values of attributes (Ri) and off-diagonal elements representing the attribute’s relative importance (rij). Develop the characteristic permanent function for the attributes matrix. Refer to section 3.2 and 3.3 for details.
Step 5: Evaluate the preference index for all the alternatives by substituting the normalized value (Ri) of attributes and their relative importance (rij) in the characteristic permanent function. The alternative having the highest value of preference index is the best choice for the given application and is ranked first on the priority list.

336
4. Examples To demonstrate and validate the proposed integrated graph theory and analytic hierarchy process (GT-AHP) method the following examples of evaluation and selection of energy technologies are considered.
4.1 Evaluation and selection of conventional and renewable energy systems
Afgan and Carvalho (2004) presented a method based on sustainability index rating for the evaluation of conventional energy systems and their comparison with renewable energy systems. They compared the performance of hydrogen fuel cell systems with natural gas turbine, photovoltaic and wind energy systems. In the present work, the energy system options and attributes considered are same as of Afgan and Carvalho (2004).
The five energy system options under evaluation are;
Phosphoric acid fuel cells: PAFC Solid oxide fuel cells: SOFC Natural gas turbine system: NGTS Photovoltaic system: PVS Wind energy system: WES
The conventional and renewable energy systems are assessed on the basis of the following attributes.
Efficiency (%): EFF Electricity cost (Euro/KWh): EC Capital cost (Euro/KWh): CC Lifetime (Years): LT
Now to demonstrate and validate the proposed method, various steps of the methodology, mentioned in section 3.7, are carried out.
Step 1:
The example problem considering four attributes and five options is shown in Table 4. The quantitative values of the energy system attributes given in Table 4 are to be normalized. Efficiency (EFF) and Lifetime (LT) are beneficial attributes and higher values are desirable. Electricity cost (EC) and capital costs (CC) are non- beneficial attributes and lower values are desirable. Values of these attributes are normalized, as explain in section 3.6, and given in Table 5 in the respective columns.
Table 4 Objective data of conventional and renewable energy system attributes (Afgan & Carvalho, 2004)
Options Attributes EFF EC CC LT PAFC 40 0.41 1500 5 SOFC 46 0.35 4500 7 NGTS 35 0.035 750 20 PVS 25 0.03 5000 15 WES 45 0.06 1000 15
Table 5 Normalized data of conventional and renewable energy system attributes
Options Attributes EFF EC CC LT PAFC 0.8696 0.0732 0.5000 0.2500SOFC 1.0000 0.0857 0.1667 0.3500 NGTS 0.7609 0.8571 1.0000 1.0000 PVS 0.5435 1.0000 0.1500 0.7500 WES 0.9783 0.5000 0.7500 0.7500
P. B. Lanjewar et al./ Decision Science Letters 5 (2016)
337
Step 2:
Afgan and Carvalho (2004) considered four different cases; in each case more importance was given to one attribute and equal importance to remaining three attributes. These cases do not reflect the realistic situation as the weights assigned are too simplistic, hence different weights are considered in the present example and the following relative importance matrix is prepared (Eq. (9)). EFF EC CC LT EFF 1 1/3 1/5 3 EC 3 1 1/3 5 (9) CC 5 3 1 7 LT 1/3 1/5 1/7 1 Following the steps given in section 3.5, relative normalized weights (Wi) of each selection attribute is calculated as: WEFF = 0.1178; WEC = 0.2634; WCC = 0.5638; WLT = 0.0550. The consistency ratio (CR) value is found to be 0.04372 which is less than the allowed CR of 0.1 and hence acceptable. Thus there is a good consistency in the judgments made in the present example. However, it may be added that, in actual practice, these values of relative importance can be judiciously decided by the user/experts depending on the requirements. The assigned values in this work are for demonstration purpose only. Step 3:
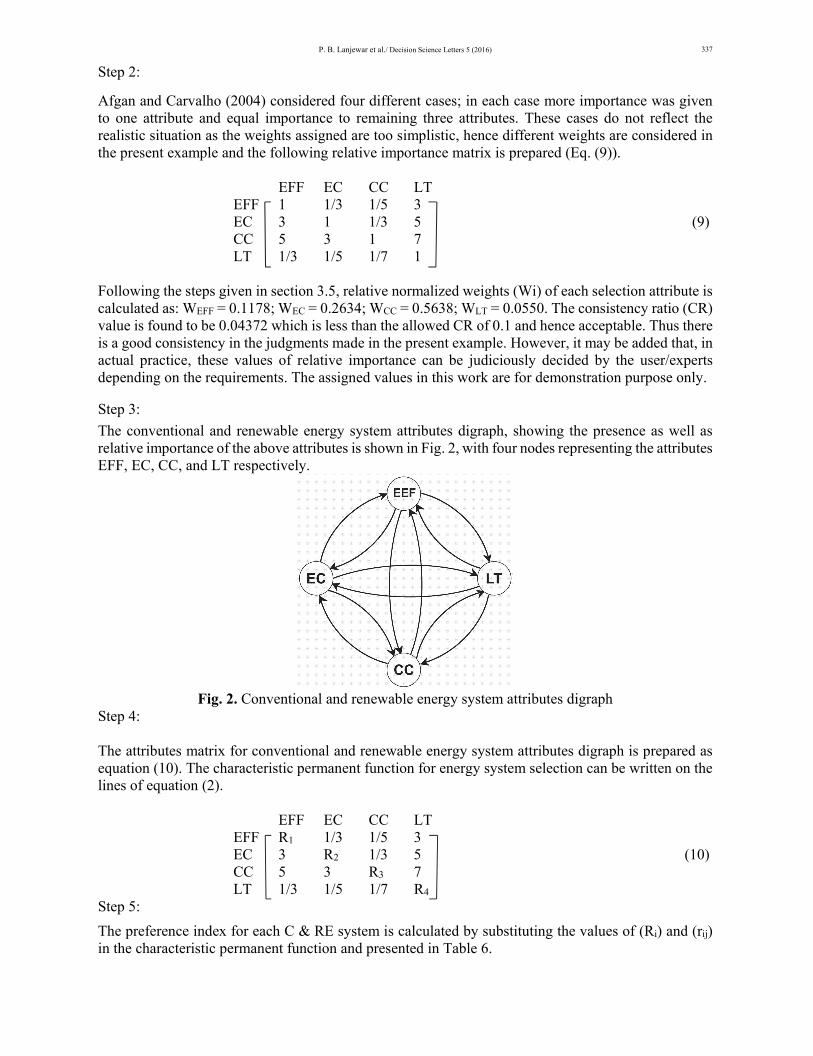
The conventional and renewable energy system attributes digraph, showing the presence as well as relative importance of the above attributes is shown in Fig. 2, with four nodes representing the attributes EFF, EC, CC, and LT respectively.
Fig. 2. Conventional and renewable energy system attributes digraph
Step 4: The attributes matrix for conventional and renewable energy system attributes digraph is prepared as equation (10). The characteristic permanent function for energy system selection can be written on the lines of equation (2). EFF EC CC LT EFF R1 1/3 1/5 3 EC 3 R2 1/3 5 (10) CC 5 3 R3 7 LT 1/3 1/5 1/7 R4 Step 5:
The preference index for each C & RE system is calculated by substituting the values of (Ri) and (rij) in the characteristic permanent function and presented in Table 6.

338
Table 6 Final ranking of conventional and renewable energy systems
Options Preference Index Rank PAFC 16.273401 4 SOFC 15.902949 5 NGTS 25.615211 1 PVS 19.396077 3 WES 22.077136 2
From the above values of preference index, it is observed that among the energy systems considered for evaluation, the natural gas turbine system (NGTS) is the first choice for the given application followed by wind energy system (WES) and photovoltaic system (PVS). The phosphoric acid fuel cell (PAFC) and solid oxide fuel cell (SOFC) acquires the last position on the selection list and these results are consistent with those presented by Afgan and Carvalho (2004) using sustainability index rating method. Thus the ranking presented by the proposed method is validated. Unlike the proposed integrated GT-AHP method, Afgan and Carvalho (2004) had not suggested any systematic method to assign relative weights to the attributes. Also the methodology suggested by Afgan and Carvalho (2004) did not have any provision for checking the consistency of weights of attributes. Thus the ranking suggested using the proposed method is more reliable and genuine.
4.2 Evaluation and selection of hybrid energy systems
In order to further demonstrate the proposed methodology, evaluation and selection of hybrid energy systems is carried out. Afgan and Carvalho (2008) evaluated the hybrid energy systems using sustainability assessment method. Five different hybrid energy systems were evaluated on the basis of technical, economical, environmental and social aspects. The following hybrid energy system options have been considered in this work:
Solar PV power plant, wind turbine power plant (WTPP), biomass thermal steam turbine power plant (BTSTPP) for production of electricity and hydrogen.
Diesel and Wind power plant for production of electricity and hydrogen. BTSTPP and WPP for production of electricity and hydrogen. Combined cycle gas turbine power plant for electricity and hydrogen production. Cogeneration of electricity and water by the hybrid system.
The above mentioned hybrid energy system options are evaluated with respect to the following five attributes:
Efficiency (%): EFF Electricity cost ($/KWh): EC Investment cost (($/KW): IC CO2 emissions (Kg/MWh): CE NOx emission (Kg/MWh): NE
Now, to demonstrate and validate the proposed methodology, various steps of the methodology as detailed in section 3.7 are carried out.
Step 1:
The hybrid energy system options and the attributes considered for evaluation are same as of Afgan and Carvalho (2008). The objective data of hybrid energy system attributes is illustrated in Table 7. The values of attributes are to be normalized. The attribute EFF is a beneficial attribute whereas attributes EC, IC, CE and NE are non-beneficial attributes. Moreover, the attribute CE has a value 0 for two options. Processing this value will lead to loss of information. Hence a number 1 is added to all measures of CE and then the attributes are normalized as explained in section 3.6 and the normalized values are presented in Table 8.

P. B. Lanjewar et al./ Decision Science Letters 5 (2016)
339
Table 7 Objective data of hybrid energy system attributes (Afgan and Carvalho, 2008)
Options Attributes EFF EC IC CE NE PV-Wind-Biomass PP 43.28 12.16 1960 0.00 0.406Wind-Diesel PP 46.48 24.28 1450 0.59 2.00 Biomass-Wind PP 68.56 8.00 1464 0.00 0.406 Combined cycle PP 56.00 4.00 65 0.38 0.415 Cogeneration cycle PP 36.00 6.20 1000 0.85 2.00
Table 8 Normalized data of hybrid energy system attributes
Options Attributes EFF EC IC CE NE PV-Wind-Biomass PP 0.6313 0.3289 0.0332 1.0000 1.0000 Wind-Diesel PP 0.6779 0.1647 0.0448 0.6289 0.2030 Biomass-Wind PP 1.0000 0.5000 0.0444 1.0000 1.0000 Combined cycle PP 0.8168 1.0000 1.0000 0.7246 0.9783 Cogeneration cycle PP 0.5251 0.6452 0.0650 0.5405 0.2030
Step 2: Afgan and Carvalho (2008) had given priority to the electricity cost, followed by the efficiency, investment cost, CO2 emissions and NOx emissions. They had not mentioned any definite weights of the attributes. With the same priority (EC > EFF > IC > CE > NE) as considered by Afgan and Carvalho (2008) a relative importance matrix (equation 11) is prepared by assigning relative importance values to the attributes. The relative weights of the attributes are calculated as WEFF = 0.2638, WEC = 0.5100, WIC = 0.1295, WCE = 0.0636 and WNE = 0.0329. The consistency ratio is calculated as 0.0534 which is less than 0.1, thus indicating good consistency of relative importance judgement. EFF EC IC CE NE EFF 1 1/3 3 5 7 EC 3 1 5 7 9 IC 1/3 1/5 1 3 5 (11) CE 1/5 1/7 1/3 1 3 NE 1/7 1/9 1/5 1/3 1
Step 3: An attributes digraph showing presence of attributes as well as their relative importance is modelled. This attributes digraph have five nodes that represent the five attributes considered in this evaluation.
Fig. 3. Hybrid energy system attributes digraph

340
Step 4: The attribute digraph is further converted into an attributes matrix (Eq. (12)) having measures of attributes and their relative importance as diagonal elements and off-diagonal elements respectively. The characteristic permanent function for this attributes matrix is written similar to Eq. (2). EFF EC IC CE NE EFF R1 1/3 3 5 7 EC 3 R2 5 7 9 IC 1/3 1/5 R3 3 5 (12) CE 1/5 1/7 1/3 R4 1 NE 1/7 1/9 1/5 1/3 R5
Step 5: The preference index for all the hybrid energy system options is estimated by substituting the normalized measures of attributes and relative importance values in the characteristic permanent function. The final ranking of the hybrid energy system options is presented in Table 9. Table 9 Final ranking of hybrid energy systems
Options Preference Index Rank PV-Wind-Biomass PP 109.671738 3 Wind-Diesel PP 88.313509 5 Biomass-Wind PP 121.295199 2 Combined Cycle PP 146.769308 1 Cogeneration Cycle PP 92.138461 4
The values of preference index indicate that the Combined Cycle PP is the best hybrid energy system option for the given application under the given condition followed by Biomass-Wind PP, PV-Wind-Biomass PP, Cogeneration Cycle PP and Wind-Diesel PP. These results exactly match with that suggested by Afgan and Carvalho (2008) using sustainability assessment method. However, it may be mentioned that the final ranking depends upon the weights of the attributes. The ranking presented may change if different relative importance values are assigned to the attributes. The proposed integrated GT-AHP method is superior to the sustainability assessment method proposed by Afgan and Carvalho (2008). Afgan and Carvalho (2008) have not suggested any definite method to assign relative weights to the attributes. Also Afgan and Carvalho (2008) did not assign any definite weights to the attributes. Instead they assigned preferences to the attributes which were arbitrary and too simplistic. Hence, the proposed integrated GT-AHP method provides a logical and consistent approach for evaluation and selection of hybrid energy systems. 4.3 Evaluation and selection of residential energy systems The application of proposed integrated GT-AHP methodology is demonstrated for evaluation and selection of residential energy systems (RES). Ren et al. (2009) developed an integrated design and evaluation method by combining linear programming and MCDM method to select optimal residential energy system. Linear programming was employed for optimal design of RES and the RES alternatives were assessed against economic, energetic and environmental criteria using AHP and PROMETHEE methods. Ren et al. (2009) selected a two-floor residential building in Kitakyushu, Japan for analysis of RES alternatives. The RES alternatives and attributes considered for evaluation in this work are same as of Ren et al. (2009). In the following comparative analysis, the overall performances of the following energy

P. B. Lanjewar et al./ Decision Science Letters 5 (2016)
341
systems as illustrated in Table 10 have been examined. All alternatives are market available and some of them have been spread widely in Japan. Furthermore, all alternatives are assumed to be grid-connected, and no isolated system is taken into consideration here. The energy technologies considered are summarized by utility grid (UG), photovoltaic (PV), wind turbine (WT), battery (BT), gas engine (GE), fuel cell (FC), air conditioner (AC), gas boiler(GB) and electric boiler (EB). The attributes taken into consideration for assessment of the above ten RES alternatives are investment cost (IC), running cost (RC), CO2 emissions (CE) and energy consumption (EC). Now, to demonstrate and validate the proposed integrated GT-AHP methodology, various steps are carried out as explained in section 3.7. Step 1: The data of RES attributes considered for evaluation is presented in Table 11. All the attributes are non-beneficial attributes and a lower value is preferred. The values of the attributes are normalized as explained in section 3.6 and the normalized values are shown in Table 12. Table 10 Description of residential energy system alternatives (Ren et al., 2009)
RES Description System combination RES1 Conventional system UG + AC + GB RES2 All electric system UG + AC + EB RES3 Energy storage system UG + BT (7 KWh) + AC + EB RES4 PV system UG + PV (3 KW) + AC + GB RES5 PV all electric system UG + PV (3 KW) + AC + EB RES6 PV energy storage system UG + PV (3 KW) + BT (7 KWh) + AC + EB RES7 Wind energy system UG + WT (3.2 KW) + AC + EB RES8 Hybrid system UG + WT (3.2 KW) + PV (0.2 KW) + AC + EB RES9 Gas engine system UG + GE (1 KW) + AC RES10 Fuel cell system UG + FC (1 KW) + AC
Table 11 Objective data of RES attributes (Ren et al., 2009)
RES Alternatives Attributes IC (* 103 $) RC (* 103 $) CE (ton) EC (GJ) RES1 0.41 5.22 8.55 219.09 RES2 0.76 3.74 7.35 201.28 RES3 1.99 3.33 7.62 205.89 RES4 1.38 4.09 7.54 191.39 RES5 1.73 2.61 6.28 171.96 RES6 2.96 2.64 5.90 161.60 RES7 1.56 3.72 7.31 200.27 RES8 1.68 3.66 7.25 198.50 RES9 0.67 1.83 8.94 215.70RES10 2.34 1.74 8.29 199.72
Step 2: Ren et al. (2009) assigned the relative importance values to the attributes as shown in the relative importance matrix (equation 13) and obtained the relative weights of attributes using AHP. To have a fair comparison, the same relative importance matrix is considered in this work and the relative weights of the attributes are calculated as WIC = 0.416, WRC = 0.416, WCE = 0.083 and WEC = 0.083. The consistency ratio (C.R.) is found to be 0 indicating complete consistency of relative importance matrix.

342
Table 12 Normalized data of RES attributes
RES Alternatives Attributes IC RC CE EC RES1 1.0000 0.3333 0.6900 0.7376 RES2 0.5395 0.4652 0.8027 0.8029 RES3 0.2060 0.5225 0.7743 0.7849 RES4 0.2971 0.4254 0.7825 0.8443 RES5 0.2370 0.6667 0.9395 0.9397 RES6 0.1385 0.6591 1.0000 1.0000 RES7 0.2628 0.4677 0.8071 0.8069 RES8 0.2441 0.4754 0.8138 0.8141 RES9 0.6119 0.9508 0.6599 0.7492 RES10 0.1752 1.0000 0.7117 0.8091
IC RC CE EC IC 1 1 5 5 RC 1 1 5 5 CE 1/5 1/5 1 1 (13) EC 1/5 1/5 1 1
Step 3:
An attributes digraph is drawn with four nodes IC, RC, CE and EC representing the four RES attributes and the directed edges representing their inter-relations.
Fig. 4. RES attributes digraph
Step 4: For further processing, the digraph is converted into an equivalent attributes matrix (Eq. (14)) having measures of attributes (Ri) and relative importance values (rij) as diagonal and off-diagonal elements respectively. The characteristic permanent function for the attribute matrix is written similar to Eq. (2). IC RC CE EC IC R1 1 5 5 RC 1 R2 5 5 CE 1/5 1/5 R3 1 (14) EC 1/5 1/5 1 R4 Step 5: The preference index is calculated by substituting the relative importance values (rij) and normalized values of attributes (Ri) in the characteristic permanent function. The final ranking of the residential

P. B. Lanjewar et al./ Decision Science Letters 5 (2016)
343
energy system alternatives is presented in Table 13.
Table 13 Final ranking of RES alternatives
RES alternatives Preference Index Rank RES1 17.437094 3 RES2 16.890960 6 RES3 15.492075 10 RES4 15.744513 7 RES5 17.444386 2 RES6 17.372971 4 RES7 15.722234 8 RES8 15.721515 9 RES9 18.509430 1 RES10 17.031167 5
The values of preference index indicate that the alternative RES9 is the best choice under the given conditions. Ren et al. (2009) also suggested RES9 as first choice using AHP and PROMETHEE methods. The ranking suggested by integrated GT-AHP method differs slightly as compared to that of AHP and PROMETHEE. Application of different MADM methods may give different RES rankings for the considered weights of attributes. However, it does not matter so long as the first choice is consistent. Unlike integrated GT-AHP method, the PROMETHEE method involves complex calculations and requires high computational time. On the other hand, using AHP, sometimes unmanageable pairwise comparisons may result due to large number of alternatives and attributes. The proposed method is easy to understand, involves simple calculations and fewer steps. The attributes digraph facilitates the visualization of the considered RES selection problem and reflects the interrelations among the attributes. The use of permanent concept characterizes the considered selection problem as it contains all possible structural components of the attributes and their relative importance. The preference index provides a single objective value for comparing and ranking the RES alternatives. Hence, the integrated GT-AHP method is a simple, logical and convenient approach for selection of residential energy systems.
4.4 Evaluation and selection of new and renewable energy power plants
In order to further demonstrate the proposed integrated GT-AHP method, evaluation and selection of new and renewable (NRE) power plants is carried out. Afgan and Carvalho (2002) presented an assessment of power plants based on new and renewable energy technologies. They employed ASPID method to determine the sustainability index for ranking the power plants on the basis of technical, economic, environmental and social factors. The power plant options and the attributes considered in this example are same as those of Afgan and Carvalho (2002). The following ten NRE power plant options are considered for evaluation.
Pulverised coal fired power plant (PCPP) Solar thermal power plant (STPP) Geothermal power plant (GPP) Biomass power plant (BPP) Nuclear power plant (NPP) PV solar power plant (PVSPP) Wind power plant (WPP) Ocean power plant (OPP) Hydro power plant (HPP) Natural gas combined power plant (NGCPP)
The NRE power plants are evaluated with respect to the following five attributes. Efficiency (%): EFF

344
Installation Cost (USD/KWh): IC Electricity Cost (c/KWh): EC CO2 Emissions (KgCO2/KWh): CE Area required (Km2/KW): AR
Now, to demonstrate and validate the proposed method, the step-wise procedure of the methodology as explained in section 3.7 is carried out.
Step 1:
The evaluation data of NRE power plant attributes is tabulated in Table 14. Out of above five attributes, EFF is a beneficial attributes whereas IC, EC, CE and AR are non-beneficial attributes. All the attributes are normalized as explained in section 3.6 and the normalized data is presented in Table 15. Table 14 Objective data of NRE power plant attributes (Afgan and Carvalho, 2002)
Power Plants Attributes EFF IC EC CE AR PCCC 43 1000 5.4 0.82 0.4 STPP 15 3500 17 0.1 0.08 GPP 8 2500 8 0.06 0.03 BPP 1 2500 14 1.18 5.2 NPP 33 2300 4 0.025 0.01 PVSPP 10 4500 75 0.1 0.12 WPP 28 1100 7 0.02 0.79 OPP 3 10000 25 0.02 0.28 HPP 80 2000 8 0.04 0.13 NGCPP 38 650 4 0.38 0.04
Table 15 Normalized data of NRE power plant attributes
Power Plants Attributes EFF IC EC CE AR PCCC 0.5375 0.65 0.7407 0.0244 0.025 STPP 0.1875 0.1857 0.2353 0.2 0.125 GPP 0.1 0.26 0.5 0.3333 0.3333 BPP 0.0125 0.26 0.2857 0.0169 0.0019 NPP 0.4125 0.2826 1.0 0.8 1.0 PVSPP 0.125 0.1444 0.0533 0.2 0.0833 WPP 0.35 0.5910 0.5714 1.0 0.0126 OPP 0.0375 0.065 0.16 1.0 0.0357 HPP 1.0 0.325 0.5 0.5 0.0769 NGCPP 0.475 1.0 1.0 0.0526 0.25
Step 2:
Afgan and Carvalho (2002) considered the weights of the attributes as 0.46, 0.27, 0.15, 0.08 and 0.04. The same weights are considered in this work in order to make a fair comparison. The attributes are assigned relative importance values as explained in section 3.5 and the following relative importance matrix is prepared (Eq. (15)).
EFF IC EC CE AR EFF 1 2 4 5 9 IC 1/2 1 2 3 7 EC 1/4 1/2 1 2 4 (15) CE 1/5 1/3 1/2 1 2 AR 1/9 1/7 1/4 1/2 1

P. B. Lanjewar et al./ Decision Science Letters 5 (2016)
345
The relative weights of the attributes are calculated as WEFF = 0.4667, WIC = 0.2643, WEC = 0.1438, WCE = 0.0836 and WAR = 0.0414. These weights are same as assigned by Afgan and Carvalho (2002). The C.R is found to 0.008273 which is within the permissible limit. Hence a good consistency exists in the judgements of relative importance of the attributes.
Step 3:
An attributes digraph is modelled with five nodes representing the attributes EFF, IC, EC, CE and AR and the directed edges representing the relative importance among them.
Fig. 5. NRE power plant attributes digraph
Step 4: The attribute digraph is represented in the form of an attributes matrix (Eq. (16)) with the measures of attributes as diagonal elements and relative importance values as off-diagonal elements. The corresponding characteristic permanent function is written similar to Eq. (2). EFF IC EC CE AR EFF R1 2 4 5 9 IC 1/2 R2 2 3 7 EC 1/4 1/2 R3 2 4 (16) CE 1/5 1/3 1/2 R4 2 AR 1/9 1/7 1/4 1/2 R5 Step 5: The preference index of each option under consideration is estimated by substituting the normalized values of attributes (Ri) and relative importance values (rij) in the characteristic permanent function. The power plant options and their preference index are presented in Table 16.
Table 16 Final ranking of NRE power plants
Power Plants Preference Index Rank PCCC 68.258152 5 STPP 56.335809 8 GPP 63.255546 6 BPP 52.420852 10 NPP 92.257961 1 PVSPP 52.820908 9 WPP 76.421187 3 OPP 59.874832 7 HPP 74.271622 4 NGCPP 79.466500 2

346
From the values of preference index it is clear that the Nuclear power plant (NPP) is ranked first on the priority list. Afgan and Carvalho (2002) also suggested NPP as first choice using ASPID. The second, third and fourth place in the final ranking is acquired by Natural gas combined power plant (NGCCP), Wind power plant (WPP) and Hydro power plant (WPP) respectively, whereas Afgan and Carvalho (2002) suggested HPP as second, NGCPP as third and WPP as sixth choice. The normalized data reveals that the option NGCPP is having higher values for three attributes (IC, EC and AR) as compared to HPP and WPP. Also the option WPP is better than HPP with respect to three attributes (IC, EC and CE). Thus suggesting NGCPP as second, WPP as third and HPP as fourth choice is logical. Moreover, Afgan and Carvalho (2002) had not suggested any systematic procedure to assign weights to the attributes and to check the consistency of the judgements. To determine the relative weights of the attributes they introduced randomization of uncertainty that produces a random weight vector. The ASPID method suggested by Afgan and Carvalho (2002) for ranking of power plants is quite cumbersome and difficult to understand. Comparatively, the integrated GT-AHP methodology provides a simple, logical and consistent approach for assessment of new and renewable energy power plants. 5. Conclusions
This work introduces a novel approach called integrated graph theory and analytic hierarchy process (GT-AHP) method for evaluation and selection of energy technologies. This methodology is developed by integrating graph theory (GT) and analytic hierarchy process (AHP) methods and has some desirable properties for modeling and solving complex decision making problems. The integrated GT-AHP method is successfully applied for evaluation and selection of energy technologies and the results are compared with those of other MADM methods employed by previous researchers.
The computational procedure used in the proposed method is relatively simple compared to most of the other multiple attribute decision making methods.
The method enables a graphical visualization of various attributes and their inter-relations in the form of a digraph model and thus helps to understand the complexity of the problem at a glance.
The matrix representation of the digraph enables faster processing through the use of computer and permits to solve the problem with any large number of attributes.
The proposed method can take into account large number of attributes as well as alternatives, offering very simple and computationally efficient approach by using fewer formulations.
The measures of the attributes and their relative importance are used together to rank the alternatives and hence it provides a better evaluation of the alternatives.
The proposed method allows the decision maker to systematically assign relative importance to the attributes using AHP. The check of consistency in the judgement of relative importance of attributes adds advantage to the proposed methodology and reflects its robustness.
The permanent function characterizes the considered selection problem as it contains all possible structural components of the attributes and their relative importance. Application of matrix permanent offers a better appreciation of the considered attributes and helps to analyse the different alternatives from combinatorial viewpoint.
The use of permanent concept in computing the preference index leads to a total objective value without any loss of information. A slight variation in the measure of attributes and their relative importance leads to a significant difference in the preference index and hence it is easy to compare the alternatives on the basis of their preference index.
A comparative analysis of the results obtained by using the integrated GT-AHP method with those obtained by past researchers using the other MADM methods showed a good correlation, thus proving its applicability, effectiveness and usefulness for application in solving complex decision making problems of energy technology selection.
P. B. Lanjewar et al./ Decision Science Letters 5 (2016)
347
References Afgan, N. H., & Carvalho, M. G. (2002). Multi-criteria assessment of new and renewable energy power
plants. Energy, 27(8), 739-755. Afgan, N. H., & Carvalho, M. G. (2004). Sustainability assessment of hydrogen energy
systems. International Journal of Hydrogen Energy, 29(13), 1327-1342. Afgan, N. H., & Carvalho, M. G. (2008). Sustainability assessment of a hybrid energy system. Energy
Policy, 36(8), 2903-2910. Afgan, N. H., Pilavachi, P. A., & Carvalho, M. G. (2007). Multi-criteria evaluation of natural gas
resources. Energy Policy, 35(1), 704-713. Amer, M., & Daim, T. U. (2011). Selection of renewable energy technologies for a developing county:
a case of Pakistan. Energy for Sustainable Development,15(4), 420-435. Avgelis, A., & Papadopoulos, A. M. (2009). Application of multicriteria analysis in designing HVAC
systems. Energy and Buildings, 41(7), 774-780. Begić, F., & Afgan, N. H. (2007). Sustainability assessment tool for the decision making in selection
of energy system—Bosnian case. Energy, 32(10), 1979-1985. Cavallaro, F. (2009). Multi-criteria decision aid to assess concentrated solar thermal
technologies. Renewable Energy, 34(7), 1678-1685. Cavallaro, F. (2010). A comparative assessment of thin-film photovoltaic production processes using
the ELECTRE III method. Energy Policy, 38(1), 463-474. Chinese, D., Nardin, G., & Saro, O. (2011). Multi-criteria analysis for the selection of space heating
systems in an industrial building. Energy, 36(1), 556-565. Diakoulaki, D., & Karangelis, F. (2007). Multi-criteria decision analysis and cost–benefit analysis of
alternative scenarios for the power generation sector in Greece. Renewable and Sustainable Energy Reviews, 11(4), 716-727.
Dinca, C., Badea, A., Rousseaux, P., & Apostol, T. (2007). A multi-criteria approach to evaluate the natural gas energy systems. Energy Policy, 35(11), 5754-5765.
Garg, R. K., Agrawal, V. P., & Gupta, V. K. (2007). Coding, evaluation and selection of thermal power plants–A MADM approach. International Journal of Electrical Power & Energy Systems, 29(9), 657-668.
Kabak, M., & Dağdeviren, M. (2014). Prioritization of renewable energy sources for Turkey by using a hybrid MCDM methodology. Energy Conversion and Management, 79, 25-33.
Kahraman, C., & Kaya, İ. (2010). A fuzzy multicriteria methodology for selection among energy alternatives. Expert Systems with Applications, 37(9), 6270-6281.
Kahraman, C., Kaya, İ., & Cebi, S. (2009). A comparative analysis for multiattribute selection among renewable energy alternatives using fuzzy axiomatic design and fuzzy analytic hierarchy process. Energy, 34(10), 1603-1616.
Kaya, T., & Kahraman, C. (2011). Multicriteria decision making in energy planning using a modified fuzzy TOPSIS methodology. Expert Systems with Applications, 38(6), 6577-6585.
Lanjewar, P. B., Rao, R. V., & Kale, A. V. (2015). Assessment of alternative fuels for transportation using a hybrid graph theory and analytic hierarchy process method. Fuel, 154, 9-16.
Pilavachi, P. A., Chatzipanagi, A. I., & Spyropoulou, A. I. (2009). Evaluation of hydrogen production methods using the analytic hierarchy process.International Journal of hydrogen energy, 34(13), 5294-5303.
Pilavachi, P. A., Roumpeas, C. P., Minett, S., & Afgan, N. H. (2006). Multi-criteria evaluation for CHP system options. Energy Conversion and Management, 47(20), 3519-3529.
Pilavachi, P. A., Stephanidis, S. D., Pappas, V. A., & Afgan, N. H. (2009). Multi-criteria evaluation of hydrogen and natural gas fuelled power plant technologies. Applied Thermal Engineering, 29(11), 2228-2234.
Rao, R. V. (2004). Digraph and matrix methods for evaluating environmentally conscious manufacturing programs. International Journal of Environmentally Conscious Design and Manufacturing, 12(2), 23-33.

348
Rao, R. V. (2006a). A decision-making framework model for evaluating flexible manufacturing systems using digraph and matrix methods. The International Journal of Advanced Manufacturing Technology, 30(11-12), 1101-1110.
Rao, R. V. (2006b). A material selection model using graph theory and matrix approach. Materials Science and Engineering: A, 431(1), 248-255.
Rao, R. V. (2007). Decision making in the manufacturing environment: using graph theory and fuzzy multiple attribute decision making methods. Springer Science & Business Media.
Rao, R. V. (2013). Decision making in the manufacturing environment: using graph theory and fuzzy multiple attribute decision making methods –Vol.2. Springer Science & Business Media.
Rao, R. V., & Gandhi, O. P. (2001). Digraph and matrix method for the selection, identification and comparison of metal-cutting fluids. Proceedings of the Institution of Mechanical Engineers, Part J: Journal of Engineering Tribology, 215(1), 25-33.
Rao, R. V., & Padmanabhan, K. K. (2006). Selection, identification and comparison of industrial robots using digraph and matrix methods. Robotics and Computer-Integrated Manufacturing, 22(4), 373-383.
Rao, R. V., & Parnichkun, M. (2009). Flexible manufacturing system selection using a combinatorial mathematics-based decision-making method.International Journal of Production Research, 47(24), 6981-6998.
Rastogi, M., Chauhan, A., Vaish, R., & Kishan, A. (2015). Selection and performance assessment of Phase Change Materials for heating, ventilation and air-conditioning applications. Energy Conversion and Management, 89, 260-269.
Ren, H., Gao, W., Zhou, W., & Nakagami, K. I. (2009). Multi-criteria evaluation for the optimal adoption of distributed residential energy systems in Japan.Energy Policy, 37(12), 5484-5493.
Saaty T. L. (1980). The analytic hierarchy process. McGraw Hill, New York. Saaty, T. L. (2000). Fundamentals of decision making and priority theory with the analytic hierarchy
process (Vol. 6). Rws Publications. Saaty, T. L., & Tran, L. T. (2007). On the invalidity of fuzzifying numerical judgments in the Analytic
Hierarchy Process. Mathematical and Computer Modelling, 46(7), 962-975. Saaty T. L., & Tran L. T. (2010). Fuzzy Judgments and Fuzzy Sets. International Journal of Strategic
Decision Sciences, 1, 23-40. Singh, D., & Rao, R. (2011). A hybrid multiple attribute decision making method for solving problems
of industrial environment. International Journal of Industrial Engineering Computations, 2(3), 631-644.