Embed Size (px)
Citation preview
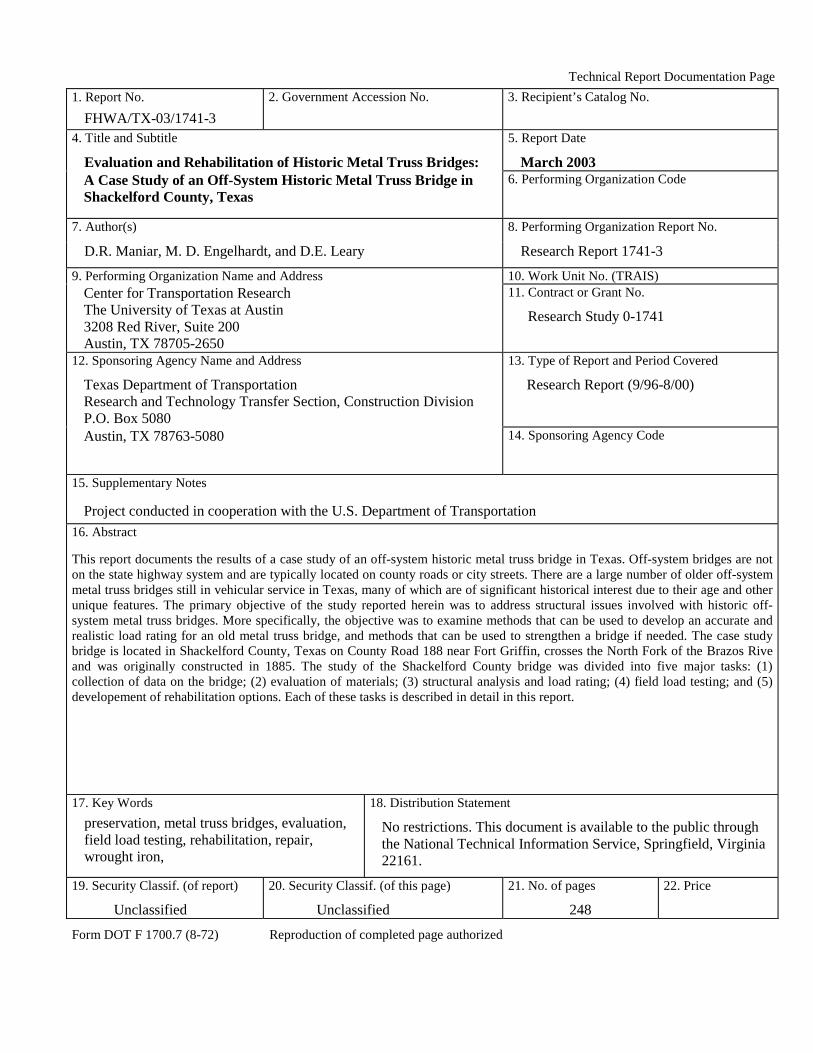
Technical Report Documentation Page 1. Report No.
FHWA/TX-03/1741-3 2. Government Accession No. 3. Recipient’s Catalog No.
4. Title and Subtitle
Evaluation and Rehabilitation of Historic Metal Truss Bridges:
5. Report Date
March 2003 A Case Study of an Off-System Historic Metal Truss Bridge in Shackelford County, Texas
6. Performing Organization Code
7. Author(s) 8. Performing Organization Report No.
D.R. Maniar, M. D. Engelhardt, and D.E. Leary Research Report 1741-3
9. Performing Organization Name and Address 10. Work Unit No. (TRAIS) Center for Transportation Research The University of Texas at Austin 3208 Red River, Suite 200 Austin, TX 78705-2650
11. Contract or Grant No.
Research Study 0-1741
12. Sponsoring Agency Name and Address
Texas Department of Transportation Research and Technology Transfer Section, Construction Division P.O. Box 5080
13. Type of Report and Period Covered
Research Report (9/96-8/00)
Austin, TX 78763-5080 14. Sponsoring Agency Code
15. Supplementary Notes
Project conducted in cooperation with the U.S. Department of Transportation 16. Abstract
This report documents the results of a case study of an off-system historic metal truss bridge in Texas. Off-system bridges are not on the state highway system and are typically located on county roads or city streets. There are a large number of older off-system metal truss bridges still in vehicular service in Texas, many of which are of significant historical interest due to their age and other unique features. The primary objective of the study reported herein was to address structural issues involved with historic off-system metal truss bridges. More specifically, the objective was to examine methods that can be used to develop an accurate andrealistic load rating for an old metal truss bridge, and methods that can be used to strengthen a bridge if needed. The case study bridge is located in Shackelford County, Texas on County Road 188 near Fort Griffin, crosses the North Fork of the Brazos Rive and was originally constructed in 1885. The study of the Shackelford County bridge was divided into five major tasks: (1) collection of data on the bridge; (2) evaluation of materials; (3) structural analysis and load rating; (4) field load testing; and (5) developement of rehabilitation options. Each of these tasks is described in detail in this report.
17. Key Words preservation, metal truss bridges, evaluation, field load testing, rehabilitation, repair, wrought iron,
18. Distribution Statement
No restrictions. This document is available to the public through the National Technical Information Service, Springfield, Virginia 22161.
19. Security Classif. (of report)
Unclassified
20. Security Classif. (of this page)
Unclassified
21. No. of pages
248
22. Price
Form DOT F 1700.7 (8-72) Reproduction of completed page authorized

EVALUATION AND REHABILITATION
OF HISTORIC METAL TRUSS BRIDGES:
A CASE STUDY OF AN OFF-SYSTEM HISTORIC METAL TRUSS
BRIDGE IN SHACKELFORD COUNTY, TEXAS
by
D. R. Maniar, M. D. Engelhardt and D.E. Leary
Research Report 1741-3
Research Project 0-1741
PRESERVATION ALTERNATIVES
FOR HISTORIC TRUSS BRIDGES
Conducted for the
Texas Department of Transportation
In cooperation with the
U.S. Department of Transportation
Federal Highway Administration
by the
CENTER FOR TRANSPORTATION RESEARCH
BUREAU OF ENGINEERING RESEARCH
THE UNIVERSITY OF TEXAS AT AUSTIN
March 2003
iv
Research performed in cooperation with the Texas Department of Transportation and the U.S. Department of Transportation, Federal Highway Administration.
ACKNOWLEDGEMENTS
The authors gratefully acknowledge the financial support provided for this project by the Texas Department of Transportation (TxDOT). The support of the individuals that have served as Project Directors at TxDOT is appreciated, including Barbara Stocklin, Steve Sadowsky, Cherise Bell, and Charles Walker. The continuing support for this project provided by the Project Coordinator, Dianna Noble, is also appreciated. Assistance and support from Lisa Hart of TxDOT is appreciated. Special thanks are extended to Charles Walker of for his support and guidance throughout this project. Thanks are also extended to Charles Bowen, Mathew Haberling, Karl Frank and Joe Yura of the University of Texas at Austin for their assistance with this project. Finally, the authors thanks Mr. Abba Lichtenstein for advice provided on this project.
DISCLAIMER
The contents of this report reflect the views of the authors, who are responsible for the facts and the accuracy of the data presented herein. The contents do not necessarily reflect the view of the Federal Highway Administration or the Texas Department of Transportation. This report does not constitute a standard, specification, or regulation.
NOT INTENDED FOR CONSTRUCTION,
PERMIT, OR BIDDING PURPOSES
M. D. Engelhardt, P.E., TX # 88934
Research Supervisor
v
TABLE OF CONTENTS
CHAPTER 1: INTRODUCTION....................................................................................................1 1.1 BACKGROUND................................................................................................................11.2 PROJECT DESCRIPTION ..................................................................................................11.3 SCOPE OF REPORT..........................................................................................................2
1.3.1 Data Collection and Material Evaluation........................................................3 1.3.2 Analysis and Load Rating of Bridge...............................................................3 1.3.3 Rehabilitation Options ....................................................................................3
CHAPTER 2: DATA COLLECTION.............................................................................................5 2.1 INTRODUCTION ..............................................................................................................52.2 COMPONENTS OF BRIDGE RECORDS .............................................................................52.3 CASE STUDY ..................................................................................................................7
2.3.1 Bridge History.................................................................................................7 2.3.2 Bridge Description ..........................................................................................7
2.3.2.1 Floor System ....................................................................................9 2.3.2.2 Floor Supporting System .................................................................9 2.3.2.2.1 Main Truss Span ...........................................................................9 2.3.2.2.2 South and North Approach Spans...............................................10 2.3.2.3 Substructure ...................................................................................10 2.3.2.4 Railing............................................................................................10
2.3.3 Field Observations ........................................................................................10 2.3.3.1 Flooring System.............................................................................10 2.3.3.2 Floor Supporting System ...............................................................16 2.3.3.3 Substructure ...................................................................................16 2.3.3.4 Miscellaneous Items.......................................................................17
CHAPTER 3: MATERIAL EVALUATION.................................................................................19 3.1 INTRODUCTION ............................................................................................................193.2 NEED FOR MATERIAL EVALUATION ...........................................................................193.3 METALS........................................................................................................................20
3.3.1 Metal Identification Tests .............................................................................20 3.3.1.1 Wrought Iron Identification in the Field........................................21
3.3.2 Chemical Composition..................................................................................21 3.3.3 Microstructure...............................................................................................21 3.3.4 Macrostructure ..............................................................................................22 3.3.5 Hardness Testing...........................................................................................22 3.3.6 Detection of Defects .....................................................................................23
3.4 STRUCTURAL TIMBER .................................................................................................233.5 MASONRY ....................................................................................................................243.6 METAL EVALUATION FOR CASE STUDY BRIDGE .......................................................24
3.6.1 Material Removal and Replacement .............................................................25 3.6.1.1 Selection of Location for Material Removal .................................25 3.6.1.2 Removal and Replacement of Material..........................................25
3.6.2 Laboratory Tests on Lacing Members ..........................................................26 3.6.3 Field Testing .................................................................................................30 3.6.4 Discussion of Material Test Results .............................................................32
vi
CHAPTER 4: ANALYSIS AND LOAD RATING.......................................................................35 4.1 INTRODUCTION ............................................................................................................354.2 RATING EQUATION ......................................................................................................354.3 LOADINGS ....................................................................................................................364.4 BRIDGE MEMBER PROPERTIES....................................................................................364.5 STRUCTURAL ANALYSIS .............................................................................................38
4.5.1 Truss Analysis...............................................................................................38 4.5.2 Truss Analysis Discussion and Results.........................................................40 4.5.3 Deck Analysis ...............................................................................................40 4.5.4 Deck Analysis Discussion and Results .........................................................43 4.5.5 Metal Floor Beam Analysis ..........................................................................45
4.6 NOMINAL CAPACITY CALCULATIONS.........................................................................454.6.1 Truss..............................................................................................................45
4.6.1.1 Inventory Level ..............................................................................46 4.6.1.2 Operating Level .............................................................................46
4.6.2 Timber Deck .................................................................................................46 4.6.3 Metal Floor Beams........................................................................................47
4.7 LOAD RATING ..............................................................................................................484.8 DISCUSSION OF LOAD RATINGS ..................................................................................52
CHAPTER 5: FIELD LOAD TESTING .......................................................................................55 5.1 INTRODUCTION ............................................................................................................555.2 OBJECTIVE ...................................................................................................................555.3 OVERVIEW OF FIELD LOAD TESTING..........................................................................555.4 STRAIN GAGE LOCATIONS ..........................................................................................56
5.4.1 Gage Locations for Field Test No. 1.............................................................56 5.4.2 Gage Locations for Field Test No. 2.............................................................62
5.5 DESCRIPTION OF TEST LOADING VEHICLES ...............................................................655.6 FIELD LOAD TESTS ......................................................................................................655.7 ANALYSIS OF THE FIELD LOAD TEST DATA ...............................................................665.8 THEORETICAL ANALYSIS OF LOAD TEST VEHICLE ....................................................675.9 FIELD LOAD TEST ISSUES............................................................................................675.10 COMPARISON OF THE TEST DATA AND THEORETICAL ANALYSIS ...........................67
5.10.1 Field Test No. 1...........................................................................................68 5.10.2 Field Test No. 2...........................................................................................69
5.11 FURTHER DISCUSSION OF FIELD LOAD TESTS..........................................................75CHAPTER 6: REHABILITATION OPTIONS.............................................................................79
6.1 INTRODUCTION ............................................................................................................796.2 COMMON DEFICIENCIES IN OLDER METAL TRUSS BRIDGES .....................................79
6.2.1 Inadequate Load Capacity of Truss ..............................................................79 6.2.2 Damage and Deterioration to Truss ..............................................................80 6.2.3 Geometrical Deficiencies..............................................................................81 6.2.4 Deficiencies in Substructure .........................................................................82
6.3 REHABILITATION TECHNIQUES ...................................................................................826.3.1 Bridge Floor and Deck System.....................................................................82 6.3.2 Damage and Deterioration ............................................................................83 6.3.3 Truss Strengthening ......................................................................................83 6.3.4 Truss Strengthening by Post-Tensioning ......................................................84 6.3.5 Substructures.................................................................................................85
vii
6.4 CASE STUDY BRIDGE: REHABILITATION OPTIONS.....................................................866.4.1 Timber Deck .................................................................................................86 6.4.2 Metal Floor Beams........................................................................................89 6.4.3 Truss..............................................................................................................89 6.4. Substructure and Approach Spans ..................................................................90
6.5 CASE STUDY BRIDGE: REHABILITATION PLAN ..........................................................906.5.1 Plan I: Do Nothing ........................................................................................91 6.5.2 Plan II: Rehabilitate the Bridge for H15 Loading.........................................91 6.5.3 Plan III: Rehabilitate the Bridge for HS20 Loading .....................................91
CHAPTER 7: SUMMARY AND CONCLUSIONS.....................................................................93 7.1 REVIEW OF PROJECT SCOPE AND OBJECTIVES ...........................................................937.2 SUMMARY OF MAJOR PROJECT TASKS AND FINDINGS ..............................................93
7.2.1 Data Collection .............................................................................................94 7.2.2 Evaluation of Materials.................................................................................95 7.2.3 Structural Analysis and Load Rating ............................................................96 7.2.4 Field Load Testing ........................................................................................97 7.2.5 Development of Rehabilitation Options .......................................................99
7.3 CONCLUSIONS............................................................................................................100REFERENCES ............................................................................................................................101APPENDIX A: PHOTOGRAPHS OF THE CASE STUDY BRIDGE ......................................109 APPENDIX B: DRAWINGS OF THE CSE STUDY BRIDGE.................................................137 APPENDIX C: BACKGROUND INFORMATION ON WROUGHT IRON............................161 APPENDIX D: FIELD LOAD TEST DATA..............................................................................181

viii
ix
LIST OF FIGURES
FIGURE PAGE
2.1 Overall elevation of the case study bridge...........................................................................8 2.2 Details of the floor system on the truss..............................................................................11 2.3 Details of the floor system on the approach spans.............................................................12 2.4 Details of the metal floor beam..........................................................................................132.5 Truss geometry and dimensions.........................................................................................14 2.6 Details of typical metal bent ..............................................................................................152.7 Details of the stone masonry piers .....................................................................................15 2.8 Details of the metal railing.................................................................................................163.1 Locations of photomicrographs .........................................................................................28 3.2 Photomicrograph on surface “A”.......................................................................................29 3.3 Photomicrograph on surface “B” .......................................................................................29 3.4 Photomicrograph on surface “C” .......................................................................................30 4.1 2-D model of truss .............................................................................................................384.2 3-D bridge model ...............................................................................................................394.3 2-D model of bridge deck with spring supports.................................................................41 4.4 3-D model of bridge deck ..................................................................................................424.5 Inventory level “H” load rating for truss members............................................................50 4.6 Operating level “H” load rating for truss members ...........................................................50 4.7 Inventory level “HS” load rating for truss members .........................................................51 4.8 Operating level “HS” load rating for truss members .........................................................51 5.1 Typical strain gage installed on bridge member ................................................................56 5.2 Field Test No. 1 – Locations of instrumented members ....................................................57 5.3 Field Test No. 1 – Gage identification for upstream truss.................................................58 5.4 Field Test No. 1 – Gage identification for downstream truss ............................................59 5.5 Field Test No. 1 – Location of strain gages on member cross-sections ............................60 5.6 Field Test No. 2 – Location of strain gages on member cross-sections ............................62 5.7 Details of the loading vehicle used for Field Test No. 1 ...................................................65 5.8 Details of the loading vehicle used for Field Test No. 2 ...................................................65 5.9 Average stress in bottom chord member L2L3..................................................................70 5.10 Stress variation among gages for chord member L0U1.....................................................71 5.11 Average stress in chord member L0U1 .............................................................................72 5.12 Average stress in top chord member U2U3.......................................................................72 5.13 Stress variation among gages for one element of vertical member L1U1.........................73 5.14 Average stress in vertical member L1U1...........................................................................74 5.15 Average stress in diagonal member L2U1.........................................................................74 6.1 New timber deck layout with all timber stringers..............................................................88 6.2 New timber deck layout with steel-timber composite stringers.........................................88 6.3 New timber deck layout with W-shape stringers...............................................................88 A.1 Case study bridge – View looking south .........................................................................110 A.2 South approach span ........................................................................................................110A.3 Main truss span of the bridge...........................................................................................111
x
A.4 North approach span ........................................................................................................111A.5 Upstream truss .................................................................................................................112A.6 Downstream truss.............................................................................................................113A.7 Roller support at southwest corner of main truss span ....................................................114 A.8 Hinge support at northwest corner of main truss span.....................................................115 A.9 Bottom chord joint L1......................................................................................................116A.10 Bottom chord joint L2......................................................................................................117A.11 Bottom chord joint L1......................................................................................................118A.12 Bottom chord joint L1......................................................................................................118A.13 Tension rod L2U3 with turnbuckle connection ...............................................................119 A.14 Upper chord joint U1 .......................................................................................................120A.15 Upper chord joint U2 .......................................................................................................120A.16 Top bracing connection....................................................................................................121A.17 View of deck from underneath main truss span...............................................................121 A.18 View of deck from underneath main truss span...............................................................122 A.19 North stone masonry pier.................................................................................................123A.20 South stone masonry pier.................................................................................................124A.21 Top lateral bracing system...............................................................................................125A.22 Turnbuckle at top bracing tension rod .............................................................................125 A.23 Metal railing.....................................................................................................................126A.24 Metal railing connection to truss member .......................................................................126 A.25 Timber deck on the south approach span.........................................................................127 A.26 Metal bent in the south approach span.............................................................................128 A.27 Timber deck on the north approach span.........................................................................129 A.28 Connection between timber stringers in the north approach span ...................................130 A.29 Timber stringers of the main truss span resting on the south pier ...................................130 A.30 Base of the south pier.......................................................................................................131A.31 Metal retaining wall at the north abutment ......................................................................131 A.32 Base of pipe column of metal bent for north approach span ...........................................132 A.33 Base of pipe column of metal bent for north approach span ...........................................132 A.34 Deteriorated foundation of metal bents for north approach span ....................................133 A.35 Deteriorated abutment at south end of south approach span ...........................................133 A.36 Metal bent of the north approach span.............................................................................134 A.37 Metal retaining wall at the north abutment ......................................................................134 A.38 Metal retaining wall at the north abutment ......................................................................135 B.1 Overall view of case study bridge....................................................................................138 B.2 Details of the metal truss..................................................................................................139B.3 Cross-sections of the truss members................................................................................140 B.4 Details of the top compression chord...............................................................................141 B.5 Details of the vertical members (L2U2, L3U3 and L4U4)..............................................142 B.6 Details of the hangers (L1U1 and L5U5) ........................................................................143 B.7 Details of the bottom chord members (L0L1, L1L2, L2L3, L3L4, L4L5 and L5L6) .....144 B.8 Details of the diagonal members (L2U1 and L4U5) .......................................................145 B.9 Details of the diagonal members (L3U2 and L3U40.......................................................146 B.10 Details of the tension rods (L2U3 and L4U3) .................................................................147 B.11 Details of the timber deck – Plan view ............................................................................148 B.12 Details of the cross-section of the timber bridge deck.....................................................149 B.13 Details of the metal floor beam........................................................................................150
xi
B.14 Details of the top lateral bracing......................................................................................151B.15 Details of the bottom lateral bracing................................................................................152 B.16 Details of portal bracing and intermediate bracing..........................................................153 B.17 Details of the south approach spans.................................................................................154 B.18 Details of the north approach spans .................................................................................155 B.19 Details of the timber deck of the approach spans ............................................................156 B.20 Details of metal bent for approach spans.........................................................................157 B.21 Details of metal bent for approach spans.........................................................................158 B.22 Details of metal railing.....................................................................................................159B.23 Details of the stone masonry piers ...................................................................................160 C.1 Longitudinal section of wrought iron ..............................................................................167 C.2 Transverse section of wrought iron..................................................................................167 D.1 Field Test No. 1 – Member L0L1 (Outside) of upstream truss .......................................182 D.2 Field Test No. 1 – Member L0L1 (Inside) of upstream truss ..........................................182 D.3 Field Test No. 1 – Member L0L1 (Outside) of downstream truss...................................183 D.4 Field Test No. 1 – Member L1L2 (Outside) of upstream truss .......................................183 D.5 Field Test No. 1 – Member L1L2 (Inside) of upstream truss ..........................................184 D.6 Field Test No. 1 – Member L1L2 (Outside) of downstream truss...................................184 D.7 Field Test No. 1 – Member L2L3 (Outside) of upstream truss .......................................185 D.8 Field Test No. 1 – Member L2L3 (Inside) of upstream truss ..........................................185 D.9 Field Test No. 1 – Member L2L3 (Outside) of downstream truss...................................186 D.10 Field Test No. 1 – Member L3L4 (Outside) of upstream truss .......................................186 D.11 Field Test No. 1 – Member L3L4 (Inside) of upstream truss ..........................................187 D.12 Field Test No. 1 – Member L4L5 (Outside) of upstream truss .......................................187 D.13 Field Test No. 1 – Member L5L6 (Outside) of upstream truss .......................................188 D.14 Field Test No. 1 – Member L5L6 (Inside) of upstream truss ..........................................188 D.15 Field Test No. 1 – Member L0U1 of upstream truss .......................................................189 D.16 Field Test No. 1 – Member L0U1 of downstream truss ..................................................189 D.17 Field Test No. 1 – Member U1U2 of upstream truss.......................................................190 D.18 Field Test No. 1 – Member U1U2 of downstream truss..................................................190 D.19 Field Test No. 1 – Member U2U3 of upstream truss.......................................................191 D.20 Field Test No. 1 – Member U2U3 of downstream truss..................................................191 D.21 Field Test No. 1 – Member U2U3 of upstream truss (Near U3 joint, Top).....................192 D.22 Field Test No. 1 – Member U2U3 of upstream truss (Near U3 joint, Bottom) ...............192 D.23 Field Test No. 1 – Member U3U$ of upstream truss.......................................................193 D.24 Field Test No. 1 – Member U4U5 of upstream truss.......................................................193 D.25 Field Test No. 1 – Member L6U5 of upstream truss .......................................................194 D.26 Field Test No. 1 – Member L1U1 of upstream truss .......................................................194 D.27 Field Test No. 1 – Member L1U1 of downstream truss ..................................................195 D.28 Field Test No. 1 – Member L2U2 of upstream truss .......................................................195 D.29 Field Test No. 1 – Member L2U2 of downstream truss ..................................................196 D.30 Field Test No. 1 – Member L3U3 of upstream truss .......................................................196 D.31 Field Test No. 1 – Member L3U3 of downstream truss ..................................................197 D.32 Field Test No. 1 – Member L4U4 of upstream truss .......................................................197 D.33 Field Test No. 1 – Member L5U5 of upstream truss .......................................................198 D.34 Field Test No. 1 – Member L2U1 of upstream truss .......................................................198 D.35 Field Test No. 1 – Member L2U1 of downstream truss ..................................................199 D.36 Field Test No. 1 – Member L2U3 of upstream truss .......................................................199
xii
D.37 Field Test No. 1 – Member L2U3 of downstream truss ..................................................200 D.38 Field Test No. 1 – Member L4U3 of upstream truss .......................................................200 D.39 Field Test No. 1 – Member L4U5 of upstream truss .......................................................201 D.40 Field Test No. 1 – Member L3U2 of upstream truss .......................................................201 D.41 Field Test No. 1 – Member L3U2 of downstream truss ..................................................202 D.42 Field Test No. 1 – Member L3U4 of upstream truss .......................................................202 D.43 Field Test No. 1 – Mid-span section of metal floor beam ...............................................203 D.44 Field Test No. 1 – Section at 23” away from mid-span of metal floor beam ..................203 D.45 Field Test No. 2 – Bottom chord L2L3 (Inside) ..............................................................204 D.46 Field Test No. 2 – Bottom chord L2L3 (Outside) ...........................................................204 D.47 Field Test No. 2 – Bottom chord L2L3 (Outside) ...........................................................205 D.48 Field Test No. 2 – Bottom chord L1L2 (Outside) ...........................................................205 D.49 Field Test No. 2 – Bottom chord L1L2 (Outside) ...........................................................206 D.50 Field Test No. 2 – Top chord L0U1.................................................................................206 D.51 Field Test No. 2 – Top chord L0U1.................................................................................207 D.52 Field Test No. 2 – Top chord L0U1.................................................................................207 D.53 Field Test No. 2 – Top chord L0U1.................................................................................208 D.54 Field Test No. 2 – Top chord L0U1.................................................................................208 D.55 Field Test No. 2 – Top chord U1U2 ................................................................................209 D.56 Field Test No. 2 – Top chord U1U2 ................................................................................209 D.57 Field Test No. 2 – Top chord U1U2 ................................................................................210 D.58 Field Test No. 2 – Top chord U1U2 ................................................................................210 D.59 Field Test No. 2 – Top chord U2U3 ................................................................................211 D.60 Field Test No. 2 – Top chord U2U3 ................................................................................211 D.61 Field Test No. 2 – Top chord U2U3 ................................................................................212 D.62 Field Test No. 2 – Top chord U2U3 ................................................................................212 D.63 Field Test No. 2 – Top chord U2U3 ................................................................................213 D.64 Field Test No. 2 – Vertical hanger L1U1 ........................................................................213 D.65 Field Test No. 2 – Vertical hanger L1U1 ........................................................................214 D.66 Field Test No. 2 – Vertical hanger L1U1 ........................................................................214 D.67 Field Test No. 2 – Vertical hanger L1U1 ........................................................................215 D.68 Field Test No. 2 – Vertical hanger L1U1 ........................................................................215 D.69 Field Test No. 2 – Vertical hanger L1U1 ........................................................................216 D.70 Field Test No. 2 – Vertical hanger L1U1 ........................................................................216 D.71 Field Test No. 2 – Vertical hanger L1U1 ........................................................................217 D.72 Field Test No. 2 – Vertical hanger L1U1 ........................................................................217 D.73 Field Test No. 2 – Diagonal member L2U1 ....................................................................218 D.74 Field Test No. 2 – Diagonal member L2U1 ....................................................................218 D.75 Field Test No. 2 – Diagonal member L2U1 ....................................................................219 D.76 Field Test No. 2 – Diagonal member L2U1 ....................................................................219 D.77 Field Test No. 2 – Diagonal member L3U2 ....................................................................220 D.78 Field Test No. 2 – Diagonal member L3U2 ....................................................................220 D.79 Field Test No. 2 – Diagonal member L3U2 ....................................................................221 D.80 Field Test No. 2 – Diagonal member L2U3 ....................................................................221 D.81 Field Test No. 2 – Diagonal member L2U3 ....................................................................222 D.82 Field Test No. 2 – Vertical member L2U2 ......................................................................222 D.83 Field Test No. 2 – Vertical member L2U2 ......................................................................223 D.84 Field Test No. 2 – Vertical member L2U2 ......................................................................223
xiii
D.85 Field Test No. 2 – Vertical member L2U2 ......................................................................224 D.86 Field Test No. 2 – Vertical member L2U2 ......................................................................224 D.87 Field Test No. 2 – Average stress: Bottom chord (L1L2) ...............................................225 D.88 Field Test No. 2 – Average stress: Bottom chord (L2L3) ...............................................225 D.89 Field Test No. 2 – Average stress: Top chord (L0U1) ....................................................226 D.90 Field Test No. 2 – Average stress: Top chord (U1U2) ....................................................226 D.91 Field Test No. 2 – Average stress: Top chord (U2U3) ....................................................227 D.92 Field Test No. 2 – Average stress: Vertical hanger (L1U1) ............................................227 D.93 Field Test No. 2 – Average stress: Diagonal member (L2U1) ........................................228 D.94 Field Test No. 2 – Average stress: Diagonal member (L3U2) ........................................228 D.95 Field Test No. 2 – Average stress: Diagonal member (L2U3) ........................................229 D.96 Field Test No. 2 – Average stress: Vertical member (L2U2) ..........................................229 D.97 Field Test No. 2 – Stress variation: Vertical hanger (L1U1)...........................................230 D.98 Field Test No. 2 – Stress variation: Top chord (L0U1) ...................................................230

xiv
xv
LIST OF TABLES
TABLE PAGE
3.1 Metal sample identification................................................................................................263.2 Results of tension tests.......................................................................................................273.3 Hardness measurements.....................................................................................................273.4 Chemical analysis ..............................................................................................................283.5 Field hardness values measured on members of upstream truss........................................30 3.6 Field hardness values measured on members of downstream truss...................................31 4.1 Truss member properties....................................................................................................374.2 Timber stringer properties..................................................................................................374.3 Metal floor beam properties...............................................................................................384.4 Maximum truss member forces due to dead and live load ................................................41 4.5 Forces in the timber stringers due to dead load .................................................................44 4.6 Forces in the timber stringers due to live load of AASHTO H15 truck ............................45 4.7 Forces in the metal floor beam...........................................................................................454.8 Capacity of truss members.................................................................................................474.9 Capacity of timber stringers...............................................................................................474.10 Capacity of metal floor beams ...........................................................................................484.11 Truss member “H” load rating...........................................................................................48 4.12 Truss member “HS” load rating.........................................................................................49 4.13 Timber stringers “H” load rating .......................................................................................49 4.14 Metal floor beam “h” and “HS” ratings .............................................................................49 5.1 Details of test runs for Field Test No. 1.............................................................................66 5.2 Details of test runs for Field Test No. 2.............................................................................66 C.1 Typical chemical composition of wrought iron ...............................................................163 C.2 Distribution of impurities between the base metal and the slag ......................................163 C.3 Influence of chemical composition on the properties of wrought iron............................165 C.4 Order of qualities graded from No. 1 to No. 19...............................................................165 C.5 Longitudinal and transverse tensile properties of wrought iron ......................................169 C.6 Average tensile properties of plain and alloyed wrought iron.........................................170 C.7 Physical properties of different varieties of wrought iron ...............................................171 C.8 ASTM Specifications for tensile properties of wrought iron...........................................171 C.9 British standard specification of wrought iron.................................................................172 C.10 Impact strength of wrought iron ......................................................................................172 C.11 Effect of temperature on physical properties of wrought iron.........................................174 C.12 Effect of repeated heating ................................................................................................174C.13 Physical properties of wrought iron plates from shear and universal mills .....................175 C.14 Properties of wrought iron ...............................................................................................178C.15 Chemical analysis of wrought iron ..................................................................................179 C.16 Average properties of wrought iron.................................................................................180

xvi
xvii
SUMMARY
This report documents the results of a case study of an off-system historic metal truss bridge. This case study was conducted as part of a larger research project on Preservation Alternatives for Historic Metal Truss Bridges. The overall objective of this larger project was to develop information and tools to aid engineers and decision-makers in addressing problems with historic metal truss bridges in Texas, with a goal of maintaining these bridges in vehicular service.
This report specifically addresses “off-system” metal truss bridges in Texas. Off-system bridges are not on the state highway system and are typically located on county roads or city streets. There are a large number of older off-system metal truss bridges still in vehicular service in Texas, many of which are of significant historical interest due to their age and other unique features. Many of the historic off-system metal truss bridges in Texas were constructed in the late 1800’s and early 1900’s, predating the automobile. The primary objective of the study reported herein was to address structural issues involved with historic off-system metal truss bridges. More specifically, the primary objective was to examine methods that can be used to develop an accurate and realistic load rating for an old metal truss bridge, and methods that can be used to strengthen a bridge if needed.
In order to investigate structural issues involved with off-system historic metal truss bridges, a case study bridge was chosen as the focus of this study. The case study bridge was used to provide a real-world example of the types of problems encountered in an old metal truss bridge, and to provide a model for evaluation techniques that can be applied to other off-system truss bridges. The case study bridge is located in Shackelford County, Texas on County Road 188 near Fort Griffin, and crosses the North Fork of the Brazos River. This single lane bridge was originally constructed in 1885 by a private bridge company, and remained in vehicular service for over one hundred years. The bridge is a wrought iron pin-connected Pratt through truss with a span of 109-feet and is the oldest surviving Pratt through truss in Shackelford County and one of the oldest in the state of Texas. The floor system consists of wrought iron tapered transverse floor beams with longitudinal timber stringers and timber plank decking.
A primary focus of this study was to identify techniques that go beyond standard load rating methods that would permit the most realistic assessment of the structural condition and capacity of the bridge. Techniques that were examined included materials testing and evaluation, the use of advanced structural analysis, and the use of field load testing.
Efforts directed towards testing and evaluation of the materials in a historic metal truss bridge can provide a great deal of valuable information that can aid in realistically load rating a bridge, in assessing damage and deterioration, and in developing a rehabilitation plan for a bridge. Further, materials testing can often be conducted at relatively low cost. The Shackelford County case study bridge was constructed of wrought iron, an archaic material no longer used in bridge construction. As part of the investigation of this bridge, background studies were conducted to better understand the composition and key characteristics of wrought iron. This was followed by laboratory testing of small samples of material removed from the bridge. Laboratory tests included tension tests, hardness tests, chemical analysis, and metallographic examination.
xviii
This was supplemented by field hardness testing at numerous locations on the bridge. The background information on wrought iron combined with the field and laboratory materials tests provided a great deal of information useful for evaluating the structural condition of the bridge.
Conducting a structural analysis is a key element in load rating a bridge. An issue addressed in this study was to determine if the use of advanced structural models leads to more accurate assessment of structural response and therefore more accurate load ratings. For the Shackelford County case study bridge, the trusses were analyzed with simple classical analysis methods that can be done by hand, as well as with computer models. Several computer models were examined, including two and three-dimensional models, as well as models that included fixity at some truss joints. All models predicted essentially the same member forces. This work suggested that the use of advanced computer models offered no significant advantages for the trusses. Simple hand methods of analysis or simple computer models of the truss appear quite adequate.
Structural analysis was also conducted for the timber stringers in the floor system of the case study bridge. A key issue in this analysis was the distribution of wheel loads to the stringers. The stringers were first analyzed using simple hand methods of analysis with distribution factors specified by American Association of State Highway and Transportation Officials (AASHTO) design standards. Various computer models were also developed of the floor system, including a three dimensional model. The computer models showed significantly lower forces in the timber stringers than the calculations based on AASHTO distribution factors. Consequently, while the use of advanced computed models did not appear to be of value for the trusses, they appear to offer some advantage in obtaining a better estimate of member forces in the floor stringers. While these computer models require more effort than the simplified AASHTO procedures, these models are still relatively simple and can be developed using commonly available commercial structural analysis software.
Extensive field load testing was also conducted on the Shackelford County case study bridge. The purpose of field load testing was to study the actual structural response of the bridge, to evaluate the accuracy of the structural analysis, and to help identify any potential problem areas in the bridge. Two field load tests were conducted on the bridge. In each test, a number of bridge members were instrumented with strain gages. A vehicle with known axle weights was then passed over the bridge, and readings were taken from the gages. The measured strains were converted to stresses, and then compared to the stresses predicted by a structural analysis of the bridge for the same vehicle.
A key observation from the field load tests was that the measured stresses in a number of truss members differed significantly from the stresses predicted by structural analysis. This observation indicated that the bridge is behaving in a manner different than assumed in the analysis. For some members, the measured stresses were somewhat higher than predicted, whereas for others, the measured stresses were significantly smaller than predicted. The load rating for the truss was controlled by the bottom chord members of the truss, which were constructed of pin-connected eyebars. Notably, the stresses measured in these members in the field load tests were less than half of the stresses predicted from structural analysis. Further detailed analysis of the data indicated the low levels of stress measured in the bottom chord eyebars was likely a result of roller bearings at the truss supports no longer functioning properly.
xix
This, in turn, permits transfer of horizontal forces between the truss supports and the bridge piers. Consequently, when vertical load is applied to the bridge, a portion of the tension forces that would normally develop in the bottom chord members are instead being resisted by horizontal reactions developed at the truss supports. The bridge piers, in turn, resist these horizontal reactions. Because of the non-functioning roller bearings, the bridge, in effect, is exhibiting some degree of arch action, with a portion of the horizontal thrust being resisted by the bridge piers. The fact that the roller bearings are not functioning properly is, in effect, providing a beneficial effect for the truss. The truss members with the lowest load rating are the central bottom chord members, and the non-functioning roller bearings substantially reduce the stress levels in these members. However, it is not recommended that this beneficial effect be used as a basis for an increased load rating, as the consistency and reliability of this condition is uncertain. For example, heavier loads on the bridge will develop larger horizontal reactions at the rollers, and may cause the rollers to move, reducing or eliminating the arch action in the bridge.
Although the field measured stresses differed significantly from those predicted by simple truss analysis, this observation does not suggest the need for more advanced structural models, such as three-dimensional models. Simple two-dimensional models can still provide reasonable predictions of structural response. However, the possibility that roller bearings on the bridge may not be functioning properly should be reflected in the model, by replacing the roller support (horizontal movement permitted) with a pin support (horizontal movement restrained). It is recommended that trusses be analyzed for both conditions to bound the possible range of member responses.
Based on the experience of this case study, it appears that field load testing is not likely justified for most historic off-system metal truss bridges. Field load testing can be a difficult and costly undertaking, requiring specialized equipment and expertise. Further, interpretation of the field data requires considerable experience and judgment, and can be quite difficult and time consuming. While very useful in the context of a research project, field load testing is not likely a cost-effective measure for routine evaluation purposes. Nonetheless, for particularly critical or complex bridges, field load testing can provide very useful insights into the behavior of the bridge, and may be justified in some cases. Based on lessons learned from this research project, several recommendations with regard to planning and executing field load tests are provided in this report.
Combining materials evaluation efforts with the results of the structural analysis and with the results of the field load tests, several possible load rating scenarios were investigated for the Shackelford County case study bridge. It was found that an inventory load rating of H10 (or HS6) would result for this bridge by replacing the timber deck and by making minor repairs. This load rating can therefore be achieved without the need for any strengthening measures for any metal component of the bridge, i.e., without any strengthening required for the metal floor beams or for the truss members.
Alternatively, to achieve an H15 inventory rating (or HS10) would require replacement of the timber stringers as well as strengthening of the metal floor beams, but without the need for any strengthening measures on the truss. Further, strengthening of the metal floor beams can likely be achieved quite economically by bolting thin cover plates to the beams.
xx
In order to achieve an HS20 inventory load rating would require replacement of the timber deck, major strengthening of the metal floor beams, and major strengthening measures for the truss itself. Developing an HS20 rating is therefore likely to require very major and costly modifications to the bridge, and is likely an unrealistic rehabilitation goal. Nonetheless, only minor strengthening and repairs are needed to achieve an HS10 rating to permit this bridge to remain in vehicular service.
The results of this investigation and the detailed evaluation of the case study bridge have demonstrated a number of techniques useful for load rating of historic off-system metal truss bridges. While these bridges typically exhibit a number of apparent structural deficiencies, many of these deficiencies can be addressed using simple and cost effective remedies. As demonstrated by the case study bridge, only minor repair and strengthening measures may be needed to allow continued use of the bridge in vehicular service. Of course, not all historic metal truss bridges can be saved. In some cases, the deterioration, damage or inherent lack of strength will be so severe as to practically preclude structural rehabilitation. However, in many other cases, only a small additional effort may be all that is required to save an important historical resource.
1
Chapter 1: Introduction
1.1 BACKGROUND
Nearly 40% of the nations’ bridges are structurally and/or geometrically deficient [National 1987]. Some of the deficient bridges are in service with speed and/or load restrictions and some are out of service. Deficiencies that may be found in bridges are numerous, including uncertainty in load carrying capacity, damage to bridge members due to accidents, excessive loss of the member cross-sectional area due to corrosion, inadequate geometrical clearances, foundation deficiencies, etc.
Options available for addressing the problems associated with a deficient bridge include both rehabilitation and replacement. Many issues are involved in the decision of whether to rehabilitate or to replace a deficient bridge. The decision becomes even more complex when the bridge in question is of historic interest. Engineering, social and political factors may all play a role when addressing such a bridge. When the decision is made to rehabilitate a bridge, further questions arise as to the most cost effective rehabilitation options that maintain the historical integrity of the bridge and that address the various engineering, social and political constraints. One class of historic bridge that is frequently found to be either structurally or geometrically deficient is historic metal truss bridges. Rehabilitation of historic metal truss bridges is the subject of this report.
1.2 PROJECT DESCRIPTION
The work reported herein is part of a larger project conducted for the Texas Department of Transportation (TxDOT) entitled: “Preservation Alternatives for Historic Metal Truss Bridges.” (TxDOT Project 0-1741). The overall objectives of this larger project were to develop information and tools to aid engineers and decision-makers involved with historic metal truss bridges and to help maintain these bridges in vehicular service.
Historic metal truss bridges in Texas can be divided into two broad categories: “on-system” bridges and “off-system” bridges. On-system bridges are those on the state highway system, and are found on state highways, US highways, farm-to-market routes, ranch-to-market routes, interstate frontage roads, etc. The surviving on-system historic trusses were typically constructed in the 1920s and 1930s, and were designed by TxDOT for H10 to H15 loads.
The “off-system” bridges are those not on the state highway system, and are typically found on county roads or city streets. Many of the off-system historic truss bridges in Texas were constructed in the late 1800’s or early 1900’s. These bridges were often designed and erected by private bridge companies. The off-system bridges are typically constructed of light steel, wrought iron or cast iron components and usually have timber decks. Many of the off-system trusses pre-date the automobile, and originally carried horse traffic and livestock.
Research for Project 0-1741 was organized into the following tasks:
2
1. Conduct a survey of literature and of the practices of other DOTs on metal truss bridge evaluation and rehabilitation.
2. Conduct a case study of an off-system historic metal truss bridge.
The bridge selected for this case study is located on County Road 188 in Shackelford County, Texas. Constructed in 1885, this bridge crosses the Clear Fork of the Brazos River, and is an example of a Pratt through-truss.
3. Conduct a case study of an on-system historic metal truss bridge.
The bridge selected for this case study is located on State Highway 16 in Llano, Texas and crosses the Llano River. Also known as the Roy Inks Bridge, it was constructed in 1936 and consists of four main spans. Each span is a 198 ft. long Parker through-truss.
4. Conduct laboratory studies on floor systems representative of on-system historic truss bridges in Texas.
5. Conduct studies on the application of historic preservation principles to projects involving historic metal truss bridges.
1.3 SCOPE OF REPORT
This research report represents the completion of the second task identified above: conduct a case study of an off-system historic metal truss bridge. The specific bridge chosen for this study is located in Shackelford County, Texas on County Road 188, and crosses the Clear Fork of the Brazos River. The bridge was constructed in 1885 and is currently closed to traffic. Further description of the bridge is provided in Chapter 2.
The purpose of this case study was to examine the procedures and diagnostic tools that may prove useful in evaluating an off-system historic truss bridge. The case study is intended to serve as a model for evaluating such a bridge. Work on this case study was divided into three major categories:
• collect data on the bridge and the materials used to construct the bridge;
• conduct a detailed structural evaluation of the bridge, including structural analysis and field load testing;
• identify rehabilitation options for the bridge.
This report concentrates on the engineering aspects of historic truss evaluation, although some key preservation issues are considered as part of the engineering evaluation. The focus of this engineering evaluation was to establish the most realistic and accurate load rating possible for the bridge, identify deficiencies, and identify methods to correct deficiencies and improve the load rating, if needed. The scope of this work primarily covers evaluation of the truss. Evaluation of approach spans to the truss is not the primary focus of this project.
3
The following sections provide a brief introduction and overview of the major elements of this case study.
1.3.1 Data Collection and Material Evaluation
This task involved collecting all relevant data about the bridge and the materials used for its construction. Generally, the data required for load rating a bridge is available from construction drawings, specifications, and bridge records. This data may not be available for an old off-system bridge. In this case the required data must be collected from other sources. This task demonstrates how to collect the required data for an old metal truss bridge. The data required for the load rating are geometry of the bridge, properties of material used for construction of the bridge and the current condition of the bridge. For the case study bridge, field observations, field measurements, and materials testing were carried out. A description of the data required and data collected is provided in Chapter 2. Methods available for in-situ material evaluation and details of the materials testing conducted for the case study bridge are discussed in Chapter 3.
1.3.2 Analysis and Load Rating of the Bridge
This task demonstrates the process of analysis and load rating. Different rating levels and load rating methods are described. The rating equation and the calculation of nominal capacity and different loadings to be considered are also briefly described in this task. This task involved analysis of the bridge truss and the deck followed by the calculation of nominal capacity and load rating. Both the analyses for the truss and the deck were carried out in two phases: preliminary analysis and detailed analysis. The nominal capacities of the truss and the deck were calculated based on material testing results and/or the American Association of State Highway and Transportation Officials (AASHTO) Manual for Condition Evaluation of Bridges [1994]. The rating of the bridge was based on the analysis results and calculated nominal capacities. The ratings were based on allowable stress design and load factor design methods for both inventory and operating levels. Description of this task can be found in Chapter 4. To evaluate the accuracy of the mathematical models used for analyses, two field load tests were carried out. The complete details of load testing are provided in Chapter 5.
1.3.3 Rehabilitation Options
This task involved looking at different rehabilitation options available for metal truss bridges. From the analysis and load rating, the structural deficiencies in the bridge were identified. For each deficiency, various rehabilitation options were studied. In addition, other rehabilitation methods were also studied to present more complete information on bridge rehabilitation. Common structural deficiencies in off-system truss bridges are inadequate strength of bottom chords of the truss and the deck system. A number of rehabilitation methods are available for these types of deficiencies. Other deficiencies are damaged truss members, excessive corrosion, fatigue damage, welding of nonstructural components to fracture critical members, inadequate railings, and damaged bearings. Common methods of rehabilitation are reducing dead load, adding strengthening elements to members, adding external post-tensioning, increasing bridge stiffness, providing continuity, providing composite action, modifying the load

4
path, and increasing redundancy. Fatigue damaged members and impact damaged members require special techniques for rehabilitation. The rehabilitation options should be economical, easy to construct, durable, maintainable, replaceable and consistent with historic preservation principles. The complete details of this segment of the research work are described in Chapter 6.
5
Chapter 2: Data Collection
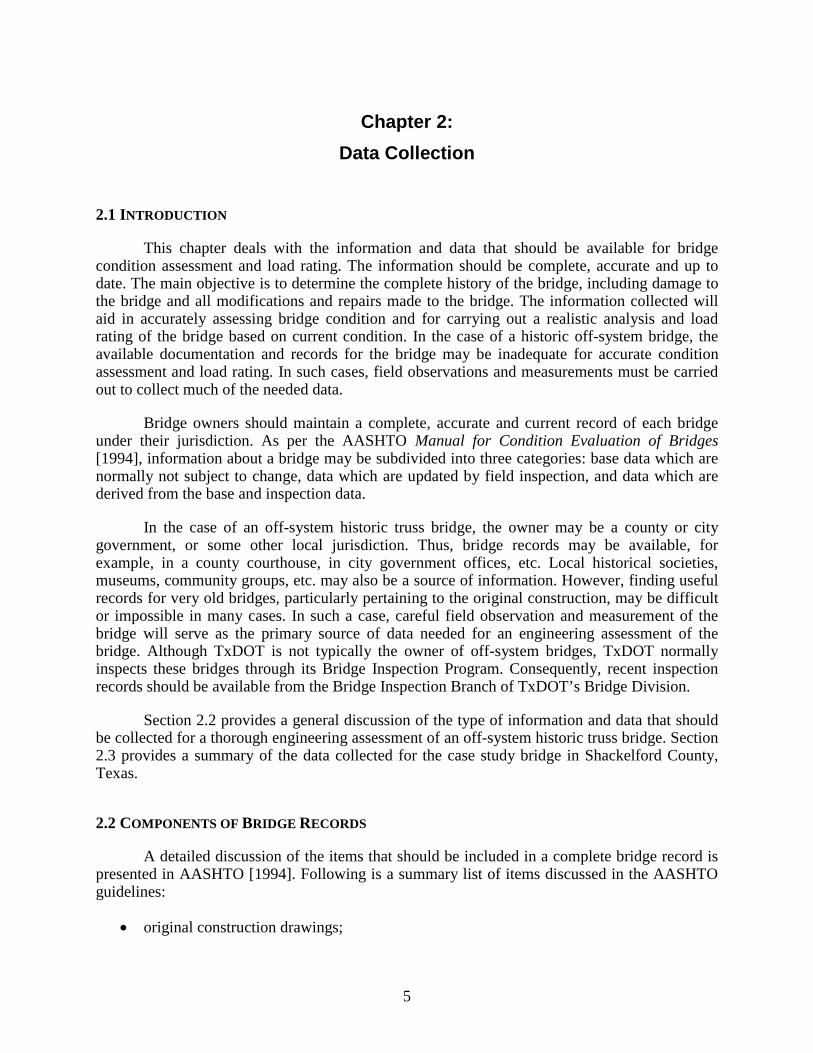
2.1 INTRODUCTION
This chapter deals with the information and data that should be available for bridge condition assessment and load rating. The information should be complete, accurate and up to date. The main objective is to determine the complete history of the bridge, including damage to the bridge and all modifications and repairs made to the bridge. The information collected will aid in accurately assessing bridge condition and for carrying out a realistic analysis and load rating of the bridge based on current condition. In the case of a historic off-system bridge, the available documentation and records for the bridge may be inadequate for accurate condition assessment and load rating. In such cases, field observations and measurements must be carried out to collect much of the needed data.
Bridge owners should maintain a complete, accurate and current record of each bridge under their jurisdiction. As per the AASHTO Manual for Condition Evaluation of Bridges[1994], information about a bridge may be subdivided into three categories: base data which are normally not subject to change, data which are updated by field inspection, and data which are derived from the base and inspection data.
In the case of an off-system historic truss bridge, the owner may be a county or city government, or some other local jurisdiction. Thus, bridge records may be available, for example, in a county courthouse, in city government offices, etc. Local historical societies, museums, community groups, etc. may also be a source of information. However, finding useful records for very old bridges, particularly pertaining to the original construction, may be difficult or impossible in many cases. In such a case, careful field observation and measurement of the bridge will serve as the primary source of data needed for an engineering assessment of the bridge. Although TxDOT is not typically the owner of off-system bridges, TxDOT normally inspects these bridges through its Bridge Inspection Program. Consequently, recent inspection records should be available from the Bridge Inspection Branch of TxDOT’s Bridge Division.
Section 2.2 provides a general discussion of the type of information and data that should be collected for a thorough engineering assessment of an off-system historic truss bridge. Section 2.3 provides a summary of the data collected for the case study bridge in Shackelford County, Texas.
2.2 COMPONENTS OF BRIDGE RECORDS
A detailed discussion of the items that should be included in a complete bridge record is presented in AASHTO [1994]. Following is a summary list of items discussed in the AASHTO guidelines:
• original construction drawings;
6
• shop drawings;
• as-built drawings;
• technical specifications used for bridge construction;
• photographs of the overall bridge as well as of key features or details;
• copies of construction logs and other pertinent correspondence related to the design or construction of the bridge;
• material certifications such as: certified mill test reports for steel, concrete delivery slips, manufacturers certifications, etc.
• material test data such as results of concrete compressive strength tests, independent steel tension coupon tests, etc.
• reports from field load tests, if any;
• records of any major maintenance or repairs done on the bridge since original construction;
• records of coatings applied to the bridge;
• records of damage to the bridge due to accidents and any subsequent repairs;
• records of load rating calculations and any resultant load postings on the bridge;
• records of major flood events and scour activity for bridge over waterways;
• traffic data showing the frequency and type of vehicles using the bridge, including ADT (average daily traffic) and ADTT (average daily truck traffic);
• inspection and load rating reports for the bridge;
• bridge inventory data such as geometrical details and general information about the bridge;
• bridge inspection data describing current physical condition of the bridge as well as waterway, if any;
• bridge load rating data evaluated based on inventory and current inspection data.
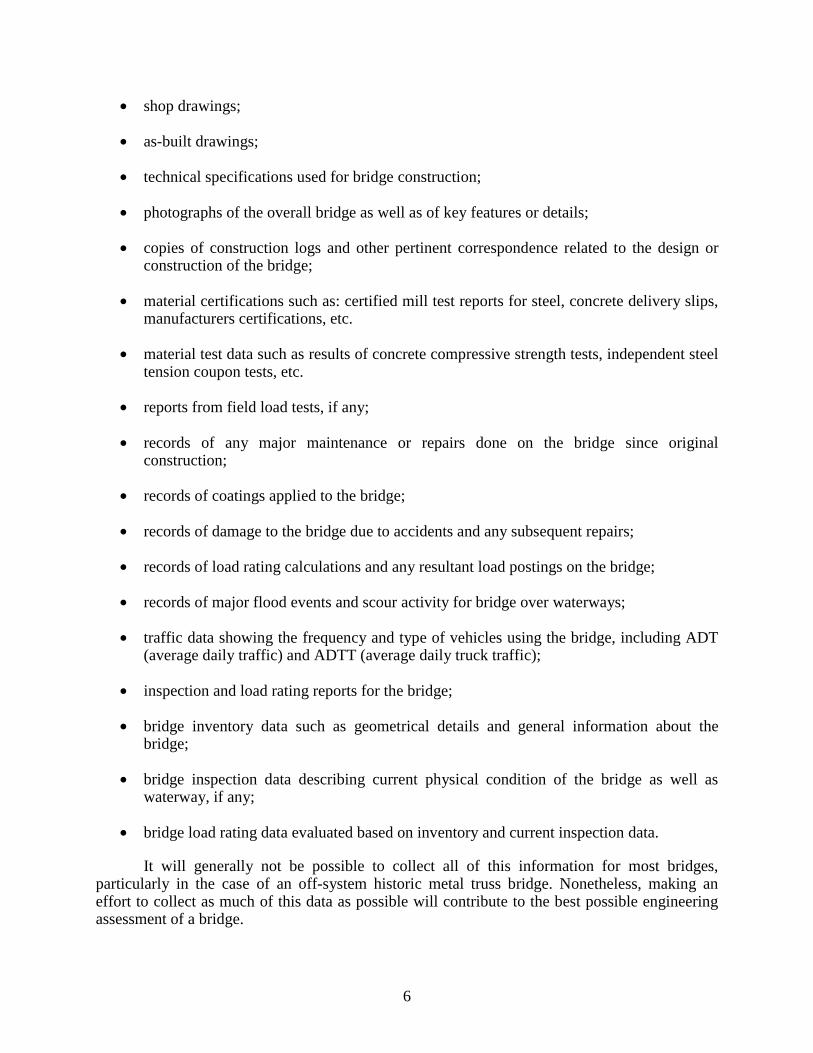
It will generally not be possible to collect all of this information for most bridges, particularly in the case of an off-system historic metal truss bridge. Nonetheless, making an effort to collect as much of this data as possible will contribute to the best possible engineering assessment of a bridge.
7
2.3 CASE STUDY
This section describes the information collected by the authors for the case study bridge in Shackelford County. Being an old bridge, only very limited information was available about the bridge. To collect the required data, a thorough field examination of the bridge was conducted. This examination included measuring all the dimensions of the bridge components and member sections, and conducting a detailed inspection of the bridge. From the measured dimensions, drawings were prepared. Photographs were taken to document important details and damage. In the following sections, the bridge history, bridge description, and field observations are described.
2.3.1 Bridge History
Historic details of the case study bridge were collected from several references. The main source was a report prepared by the Historic American Engineering Record, [HAER, 1996]. The other source was a file record of the bridge available from TxDOT. In addition, an inspection and load rating report prepared by ARS Engineers, Inc. in 1996 was available from TxDOT. A few bridge catalogs of King Iron and Bridge Manufacturing Company, the original manufacturer of the bridge, were available from an Austin based structural consulting firm. The details available from these catalogs, however, were different than those found in the case study bridge.
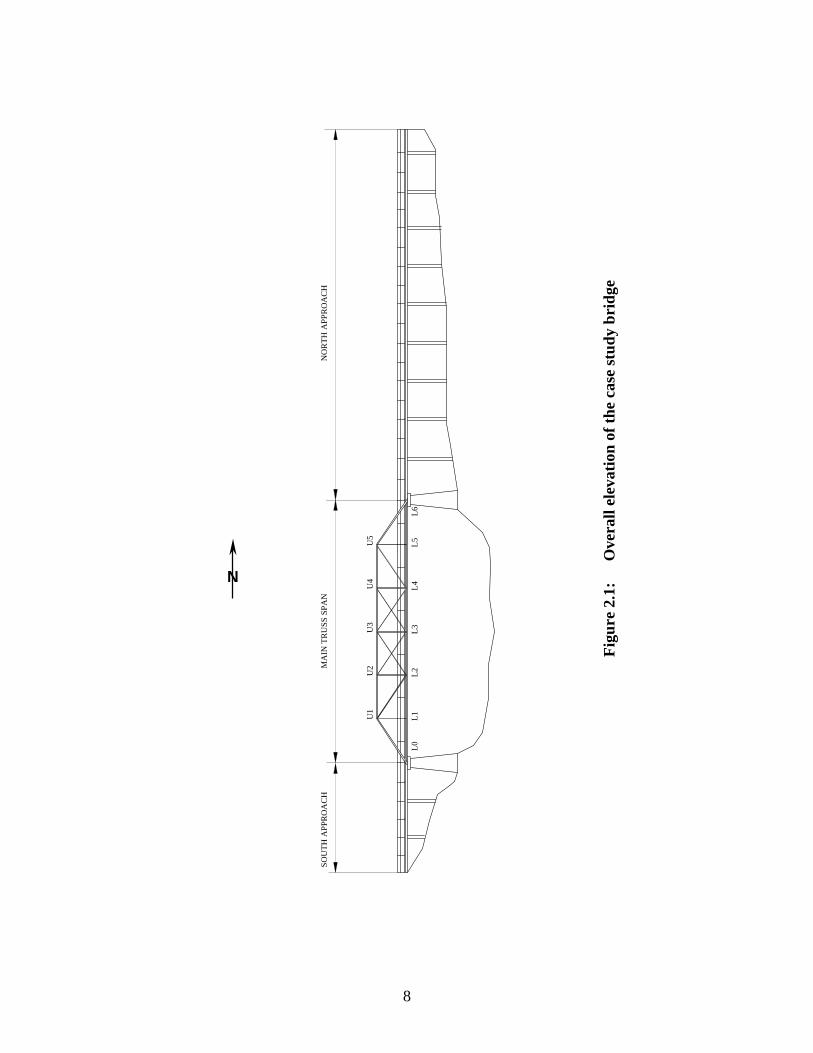
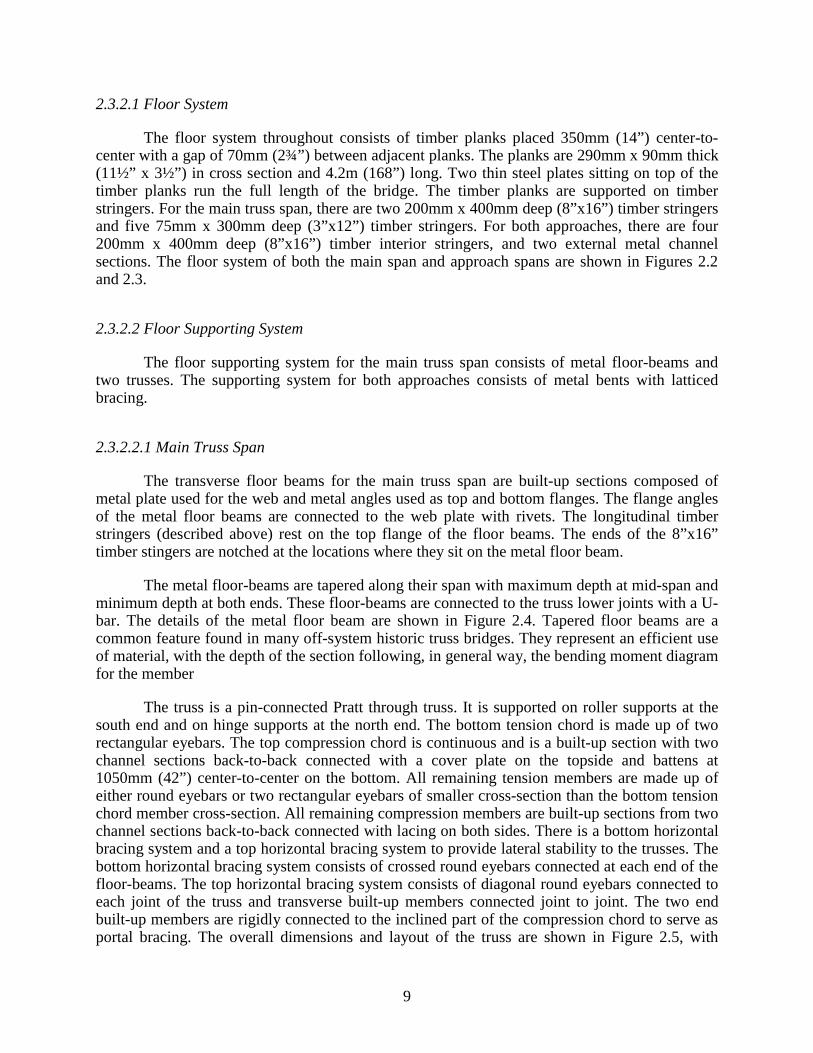
The bridge selected for this case study is located in the Shackelford County, Texas. The bridge is spanning the Clear Fork of the Brazos River on County Road (CR) 188, Shackelford County, Texas. This bridge is referred as the “Fort Griffin Iron Truss Bridge” in HAER [1996]. King Iron and Bridge Manufacturing Company located in Cleveland, Ohio constructed the bridge in 1885. The company was responsible for design, fabrication and construction of the bridge. The metal for the fabrication of the bridge was supplied by Phoenix Iron Company. The bridge is presently owned by Shackelford County, and was closed to traffic in 1998. An overall view of the case study bridge is presented in Figure 2.1.
According to the HAER record, the historic significance of this bridge is as follows:
The Fort Griffin Iron Truss Bridge is the oldest functioning and surviving bridge in Shackelford County, Texas. Built to accommodate traffic between Albany – Ft. Griffin – Throckmorton, the bridge cuts through what used to be Fort Griffin, a military checkpoint and cattle town. It is the last bridge employing a pin-connected Pratt through truss in Shackelford County, Texas.
2.3.2 Bridge Description
The bridge consists of the main truss span, the south approach and the north approach as shown in Figure 2.1. The main components of the bridge are the floor system, floor-supporting system, substructure and railing. Each of the components is described in the following paragraphs. Photographs and drawings by the authors are presented in Appendix A and Appendix B respectively.
8
L0L1
L2L3
L4L5
L6
U1
U2
U3
U4
U5
NO
RTH
APP
RO
AC
HM
AIN
TR
USS
SPA
NSO
UTH
APP
RO
AC
H
Figu
re 2
.1:
Ove
rall
elev
atio
n of
the
case
stud
y br
idge
N
9
2.3.2.1 Floor System
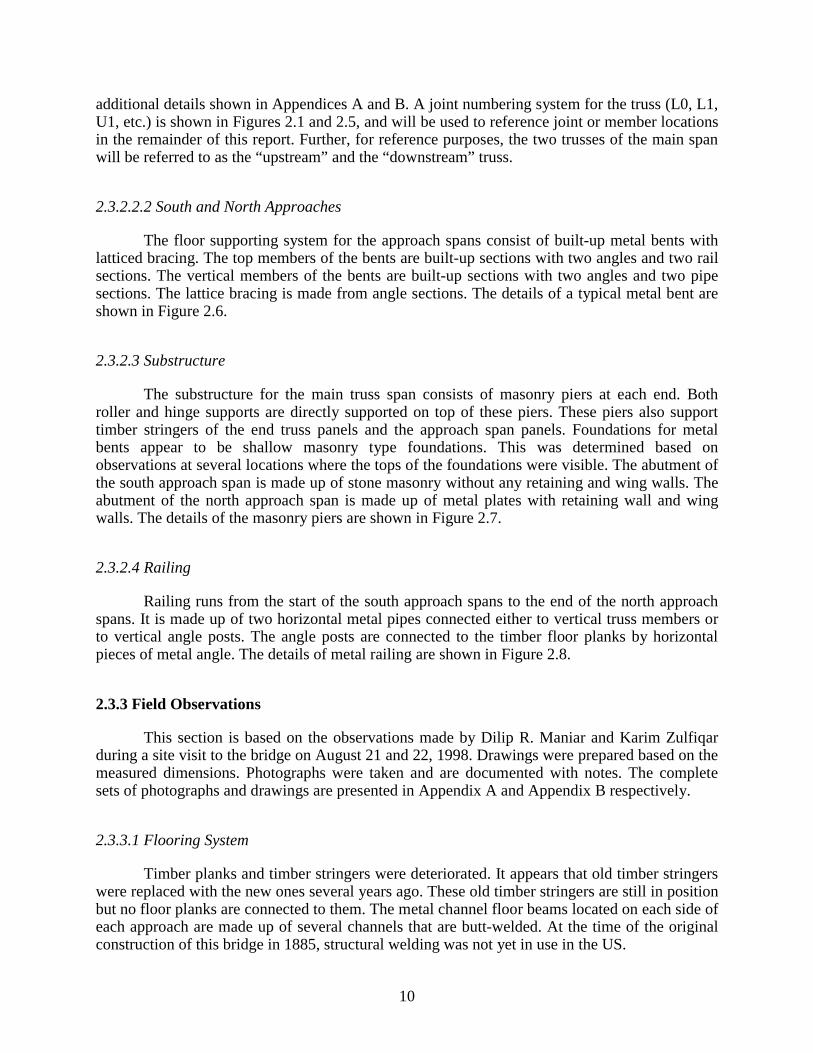
The floor system throughout consists of timber planks placed 350mm (14”) center-to-center with a gap of 70mm (2¾”) between adjacent planks. The planks are 290mm x 90mm thick (11½” x 3½”) in cross section and 4.2m (168”) long. Two thin steel plates sitting on top of the timber planks run the full length of the bridge. The timber planks are supported on timber stringers. For the main truss span, there are two 200mm x 400mm deep (8”x16”) timber stringers and five 75mm x 300mm deep (3”x12”) timber stringers. For both approaches, there are four 200mm x 400mm deep (8”x16”) timber interior stringers, and two external metal channel sections. The floor system of both the main span and approach spans are shown in Figures 2.2 and 2.3.
2.3.2.2 Floor Supporting System
The floor supporting system for the main truss span consists of metal floor-beams and two trusses. The supporting system for both approaches consists of metal bents with latticed bracing.
2.3.2.2.1 Main Truss Span
The transverse floor beams for the main truss span are built-up sections composed of metal plate used for the web and metal angles used as top and bottom flanges. The flange angles of the metal floor beams are connected to the web plate with rivets. The longitudinal timber stringers (described above) rest on the top flange of the floor beams. The ends of the 8”x16” timber stingers are notched at the locations where they sit on the metal floor beam.
The metal floor-beams are tapered along their span with maximum depth at mid-span and minimum depth at both ends. These floor-beams are connected to the truss lower joints with a U-bar. The details of the metal floor beam are shown in Figure 2.4. Tapered floor beams are a common feature found in many off-system historic truss bridges. They represent an efficient use of material, with the depth of the section following, in general way, the bending moment diagram for the member
The truss is a pin-connected Pratt through truss. It is supported on roller supports at the south end and on hinge supports at the north end. The bottom tension chord is made up of two rectangular eyebars. The top compression chord is continuous and is a built-up section with two channel sections back-to-back connected with a cover plate on the topside and battens at 1050mm (42”) center-to-center on the bottom. All remaining tension members are made up of either round eyebars or two rectangular eyebars of smaller cross-section than the bottom tension chord member cross-section. All remaining compression members are built-up sections from two channel sections back-to-back connected with lacing on both sides. There is a bottom horizontal bracing system and a top horizontal bracing system to provide lateral stability to the trusses. The bottom horizontal bracing system consists of crossed round eyebars connected at each end of the floor-beams. The top horizontal bracing system consists of diagonal round eyebars connected to each joint of the truss and transverse built-up members connected joint to joint. The two end built-up members are rigidly connected to the inclined part of the compression chord to serve as portal bracing. The overall dimensions and layout of the truss are shown in Figure 2.5, with
10
additional details shown in Appendices A and B. A joint numbering system for the truss (L0, L1, U1, etc.) is shown in Figures 2.1 and 2.5, and will be used to reference joint or member locations in the remainder of this report. Further, for reference purposes, the two trusses of the main span will be referred to as the “upstream” and the “downstream” truss.
2.3.2.2.2 South and North Approaches
The floor supporting system for the approach spans consist of built-up metal bents with latticed bracing. The top members of the bents are built-up sections with two angles and two rail sections. The vertical members of the bents are built-up sections with two angles and two pipe sections. The lattice bracing is made from angle sections. The details of a typical metal bent are shown in Figure 2.6.
2.3.2.3 Substructure
The substructure for the main truss span consists of masonry piers at each end. Both roller and hinge supports are directly supported on top of these piers. These piers also support timber stringers of the end truss panels and the approach span panels. Foundations for metal bents appear to be shallow masonry type foundations. This was determined based on observations at several locations where the tops of the foundations were visible. The abutment of the south approach span is made up of stone masonry without any retaining and wing walls. The abutment of the north approach span is made up of metal plates with retaining wall and wing walls. The details of the masonry piers are shown in Figure 2.7.
2.3.2.4 Railing
Railing runs from the start of the south approach spans to the end of the north approach spans. It is made up of two horizontal metal pipes connected either to vertical truss members or to vertical angle posts. The angle posts are connected to the timber floor planks by horizontal pieces of metal angle. The details of metal railing are shown in Figure 2.8.
2.3.3 Field Observations
This section is based on the observations made by Dilip R. Maniar and Karim Zulfiqar during a site visit to the bridge on August 21 and 22, 1998. Drawings were prepared based on the measured dimensions. Photographs were taken and are documented with notes. The complete sets of photographs and drawings are presented in Appendix A and Appendix B respectively.
2.3.3.1 Flooring System
Timber planks and timber stringers were deteriorated. It appears that old timber stringers were replaced with the new ones several years ago. These old timber stringers are still in position but no floor planks are connected to them. The metal channel floor beams located on each side of each approach are made up of several channels that are butt-welded. At the time of the original construction of this bridge in 1885, structural welding was not yet in use in the US.
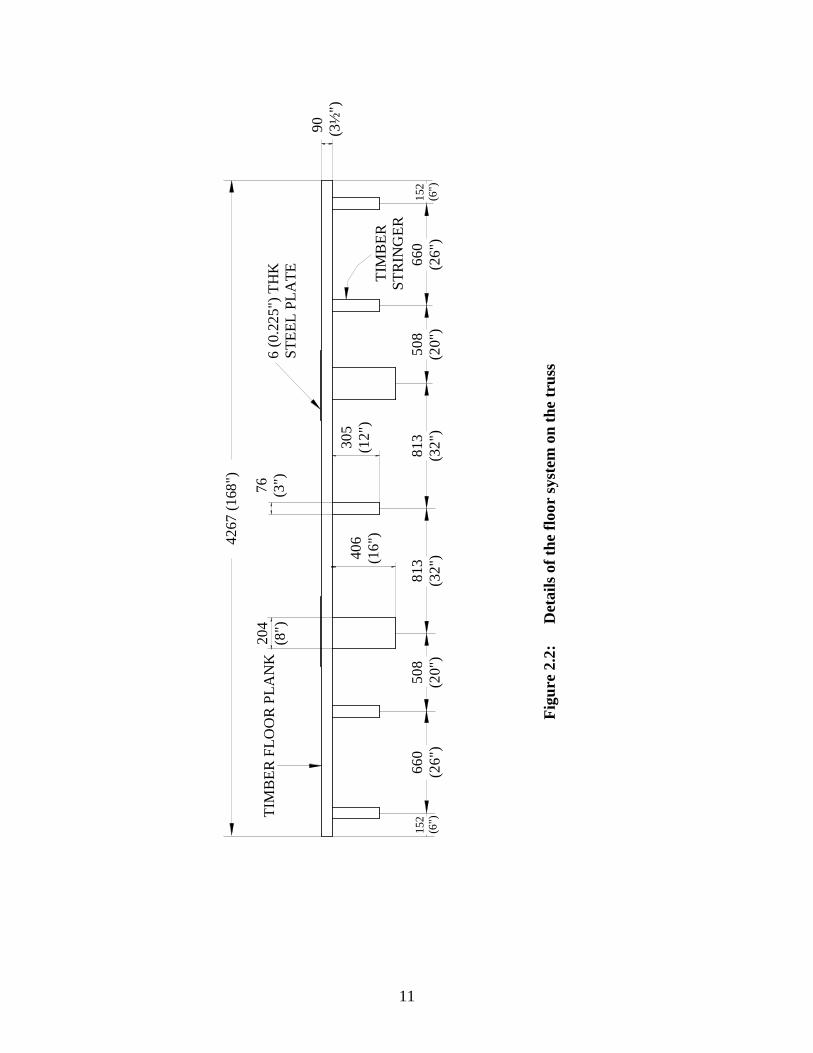
11
Figu
re 2
.2:
Det
ails
of t
he fl
oor
syst
em o
n th
e tr
uss
152
(6")
660
(26"
)50
8(2
0")
813
(32"
)81
3(3
2")
508
(20"
)15
2(6
")66
0(2
6")
4267
(168
")
90 (3½
")
204
(8")
406
(16"
)
76 (3")
305
(12"
)
6 (0
.225
") T
HK
STEE
L PL
ATE
TIM
BER
FLO
OR
PLA
NK
TIM
BER
STR
ING
ER
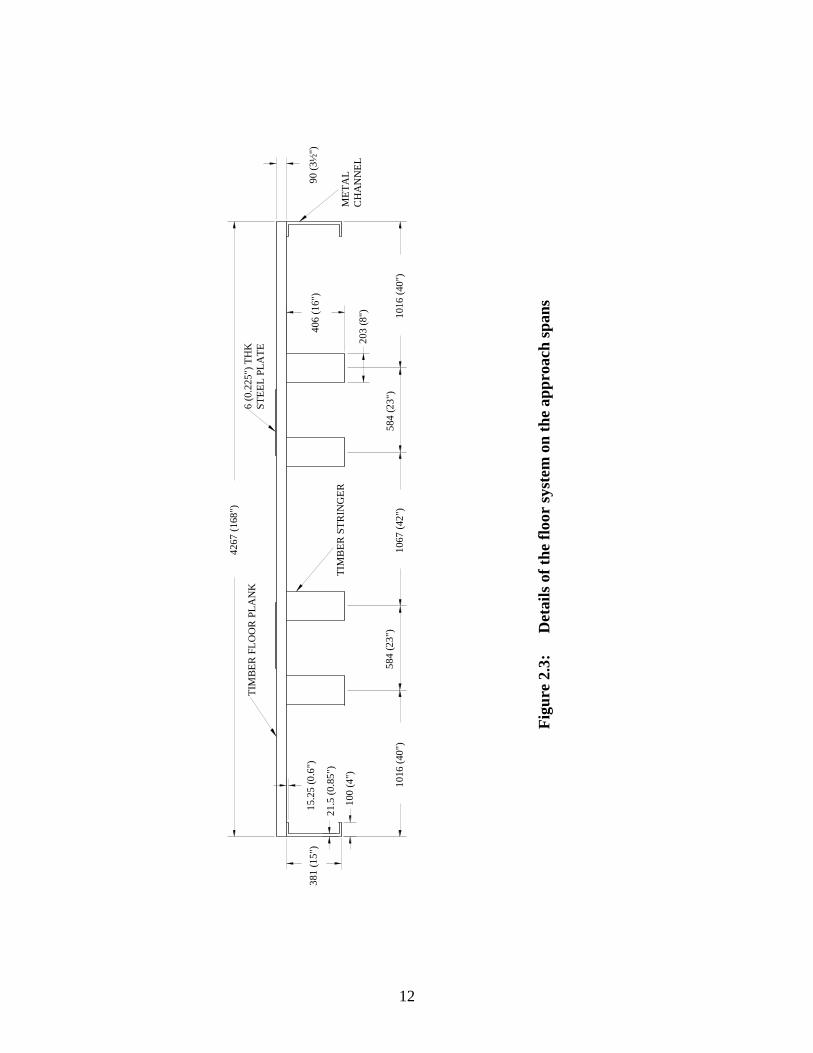
12
6 (0
.225
") T
HK
STEE
L PL
ATE
4267
(168
")
90 (3
½")
1016
(40"
)
203
(8")
406
(16"
)
584
(23"
)10
67 (4
2")
584
(23"
)10
16 (4
0")
100
(4")
21.5
(0.8
5")
15.2
5 (0
.6")
381
(15"
)
MET
AL
CH
AN
NEL
TIM
BER
FLO
OR
PLA
NK
TIM
BER
STR
ING
ER
Figu
re 2
.3:
Det
ails
of t
he fl
oor
syst
em o
n th
e ap
proa
ch sp
ans
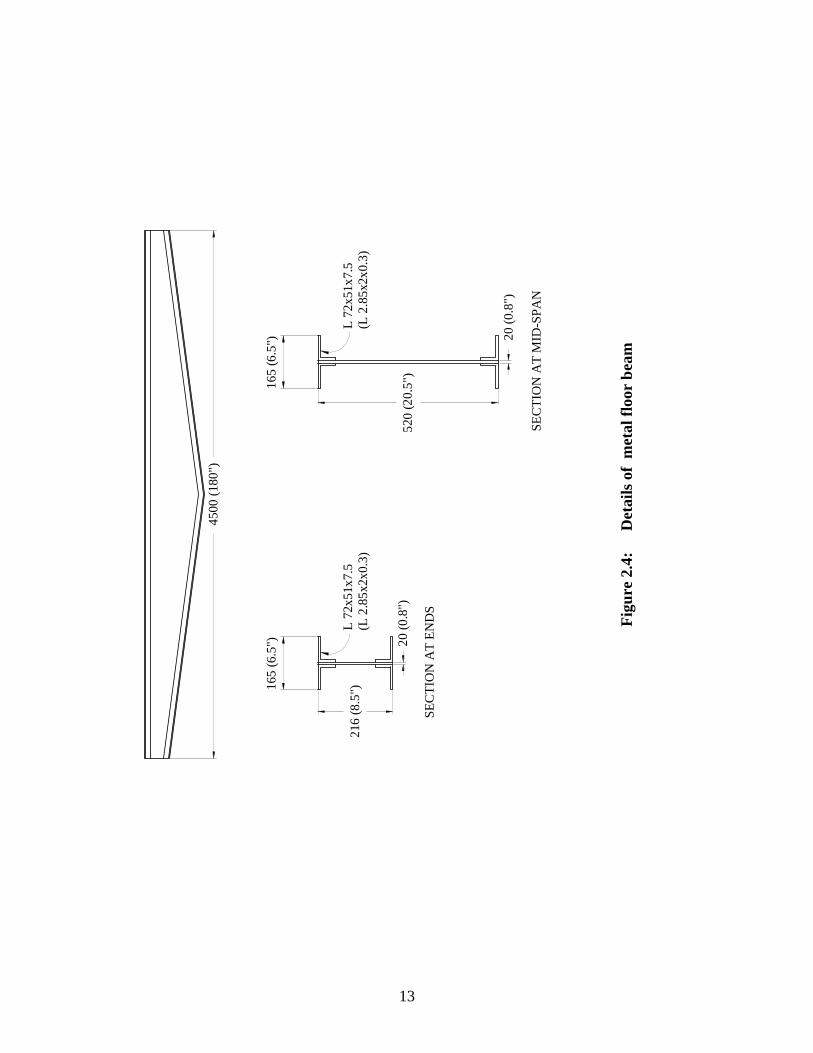
13
4500
(180
")
SEC
TIO
N A
T EN
DS
L 72
x51x
7.5
(L 2
.85x
2x0.
3)
SEC
TIO
N A
T M
ID-S
PAN
L 72
x51x
7.5
(L 2
.85x
2x0.
3)21
6 (8
.5")16
5 (6
.5") 20
(0.8
")
165
(6.5
") 20 (0
.8")
520
(20.
5")
Figu
re 2
.4:
Det
ails
of
met
al fl
oor
beam
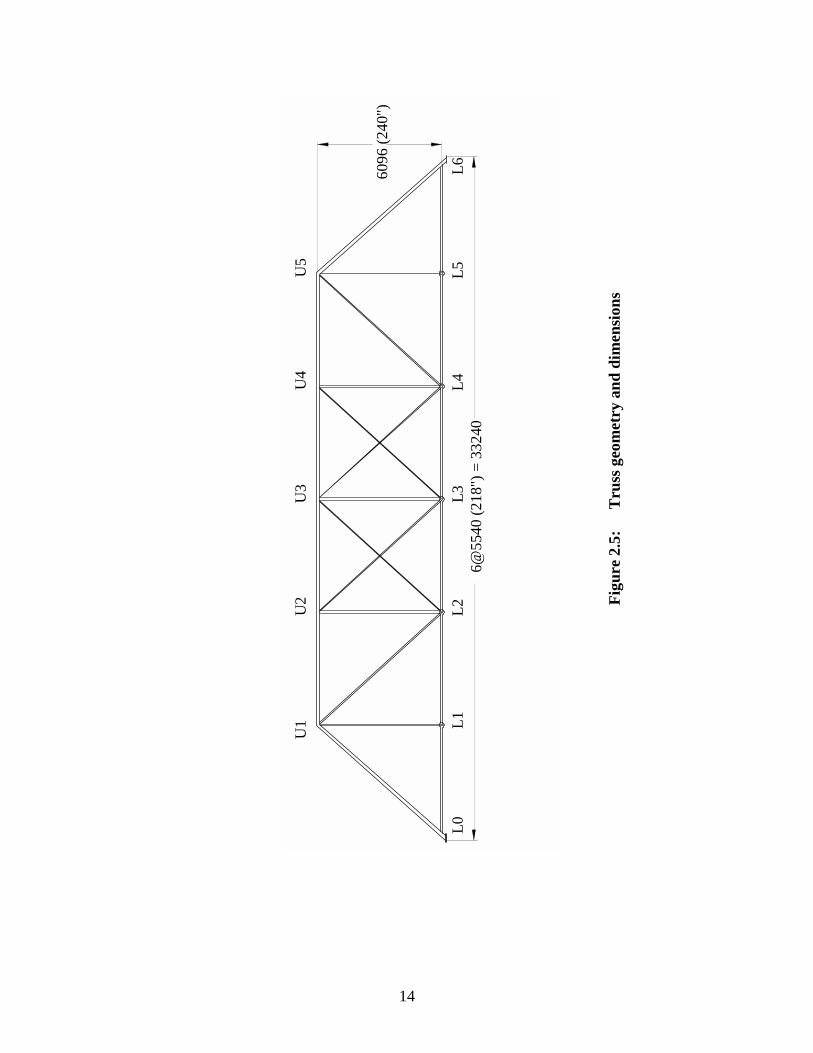
14
U1
6@55
40 (2
18")
= 3
3240
L0L1
L2L3
L4L5
L6
U2
U3
U4
U5
6096
(240
")
Figu
re 2
.5:
Tru
ss g
eom
etry
and
dim
ensi
ons
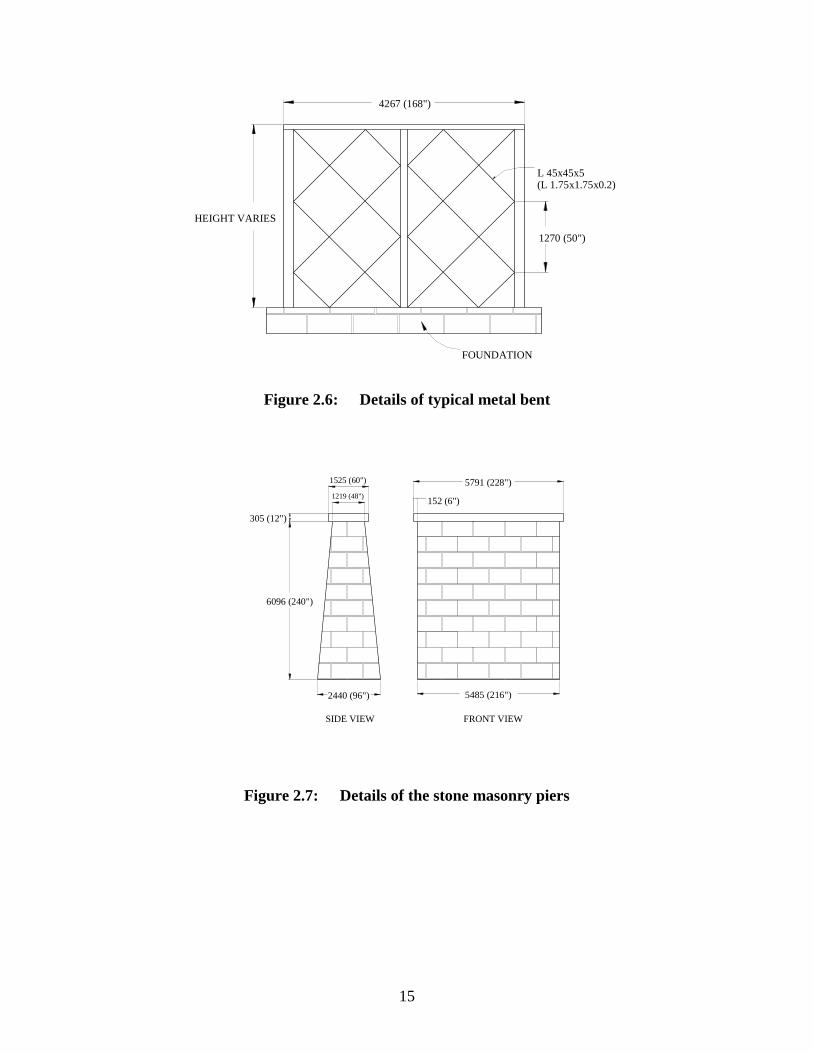
15
HEIGHT VARIES
1270 (50")
L 45x45x5(L 1.75x1.75x0.2)
FOUNDATION
4267 (168")
Figure 2.6: Details of typical metal bent
5485 (216")2440 (96")
6096 (240")
305 (12")
1525 (60")
1219 (48") 152 (6")
5791 (228")
SIDE VIEW FRONT VIEW
Figure 2.7: Details of the stone masonry piers
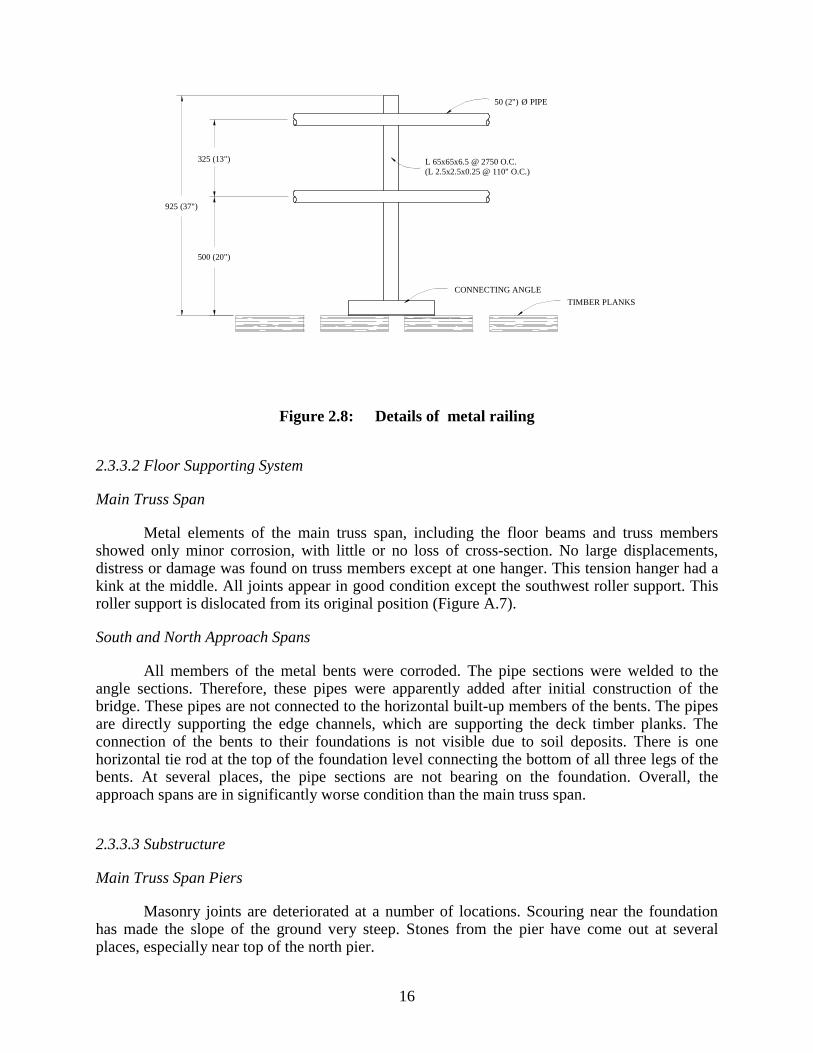
16
50 (2") Ø PIPE
L 65x65x6.5 @ 2750 O.C.(L 2.5x2.5x0.25 @ 110" O.C.)
TIMBER PLANKS
925 (37")
325 (13")
500 (20")
CONNECTING ANGLE
Figure 2.8: Details of metal railing
2.3.3.2 Floor Supporting System
Main Truss Span
Metal elements of the main truss span, including the floor beams and truss members showed only minor corrosion, with little or no loss of cross-section. No large displacements, distress or damage was found on truss members except at one hanger. This tension hanger had a kink at the middle. All joints appear in good condition except the southwest roller support. This roller support is dislocated from its original position (Figure A.7).
South and North Approach Spans
All members of the metal bents were corroded. The pipe sections were welded to the angle sections. Therefore, these pipes were apparently added after initial construction of the bridge. These pipes are not connected to the horizontal built-up members of the bents. The pipes are directly supporting the edge channels, which are supporting the deck timber planks. The connection of the bents to their foundations is not visible due to soil deposits. There is one horizontal tie rod at the top of the foundation level connecting the bottom of all three legs of the bents. At several places, the pipe sections are not bearing on the foundation. Overall, the approach spans are in significantly worse condition than the main truss span.
2.3.3.3 Substructure
Main Truss Span Piers
Masonry joints are deteriorated at a number of locations. Scouring near the foundation has made the slope of the ground very steep. Stones from the pier have come out at several places, especially near top of the north pier.

17
South and North Approaches
Foundations for metal bents are not visible at most locations. At one bent of the north approach, the foundation is visible as it is projecting above the ground. The masonry joints of this foundation are open. This suggests the possibility that the foundations of all bents may have open joints. The south approach span abutment has many stones dislocated from their original positions. All the joints of the abutment are filled with soil. The north approach abutment is not visible due to the metal retaining plate.
2.3.3.4 Miscellaneous Items
Railing
All the parts of railing exhibit some corrosion. The railing-posts are not connected to the bridge deck i.e. to the timber floor planks at many places.
Metal Retaining wall at the North Approach
This metal retaining wall is heavily corroded. This plate appears to be taken out from another structure and then added to this bridge.

18
19
Chapter 3: Material Evaluation
3.1 INTRODUCTION
Information on the type, grade and properties of materials used for relatively new bridges may be obtained from construction drawings, specifications, and bridge records. This may not be the case with older bridges. In this case, it is necessary to evaluate the material properties before doing analysis and load rating of the bridge. A variety of techniques, tests and methods are available to assess material properties. The final choice of method to be used will depend on the type of material being evaluated, the desired properties, the desired level of reliability in the measured properties, availability of equipment, availability of experienced technicians, cost and other factors.
This chapter describes the need for material evaluation and includes an overview of methods available for material evaluation both in the laboratory and in the field. The focus of this chapter is evaluation methods for the metal materials in historic metal truss bridges. However, brief discussions are also included on structural timber and masonry. At the end of this chapter, material evaluations conducted on the metal for the case study bridge are described. Appendix C reproduces information from several sources on the characteristics of wrought iron, a common material used in off-system historic metal truss bridges, and the material used for the case study bridge.
3.2 NEED FOR MATERIAL EVALUATION
A thorough understanding of the materials used in an older bridge is a key element in developing a realistic load rating for the bridge. Material properties of interest in bridge evaluation usually include yield strength, ultimate strength, and may also include ductility, fracture toughness, modulus of elasticity, weldability and others. In addition to these, identifying the chemical composition and microstructure of the material may be of additional help to better understand the material.
When steel properties are not known, AASHTO [1994] provides yield stresses of metal based on the year of construction of the bridge, which may be used for load rating. These values may be used for preliminary analysis and for load rating. However, these values of yield stress may be quite conservative in some cases. Measuring the actual yield stress of the metals used in the bridge may show a higher value than those specified by AASHTO, and can help justify an increase in load rating of the bridge. Proper materials evaluation will also help in identifying any defects or flaws in the material. For older bridges, it is very important to know the presence of cracks or other defects in the members, especially for fracture critical members. Material evaluation will also help identify any changes in the bridge material, such as replacement of some member/s or addition of certain components of the bridge as a part of a prior repair or rehabilitation program.
20
Various testing methods, both in field and laboratory, are available to assess properties of different materials. In the following sections, several field test methods available for metal, timber and masonry are described. Typical laboratory methods for metal and wood are well known and hence are not described. However, a brief discussion of laboratory test methods for masonry is included.
3.3 METALS
The evaluation of a metal must identify the type of metal as well as its mechanical properties and condition. For identification of the metal, metal sorting or chemical composition tests can be used to establish if the metal is steel, wrought iron, cast iron, or some other metal. There are various methods available which can give an estimate of mechanical properties of the metal. To evaluate the condition of the metal, visual observation and defect determination tests can be conducted.
3.3.1 Metal Identification Tests
Several field based test methods are available to assist in identifying the type of metal used in a bridge component. These include:
• Ultrasonic;
• Electromagnetic methods;
• Spark testing; and
• Chemical testing.
Ultrasonic testing can be used to differentiate cast iron from steel by the velocity of longitudinal waves. Ultrasonic testing cannot be used to determine the type of steel because the velocity of sonic waves through different types of steel are very near to each other. Metal identification can often be done by using electromagnetic methods, especially using the eddy current method. This is because of the influence of alloying elements on electrical conductivity and magnetic permeability. Both of these influencing parameters are imaged in the impedance of an eddy current coil. The tests can be carried out using different frequencies. The choice of frequency is based on trials to separate the different classes of metal as far as possible from each other.
Spark testing depends on the oxidation of the heated particles removed from the metal with a high-speed grinding wheel. The test requires considerable operator skill and judgment. The test can be used for separation of high-carbon steel from iron and low-carbon steel.
Chemical nondestructive field tests can also be used to identify different types of metals. Three primary techniques are: chemical spot testing, testing with ion-selective electrodes, and thin-layer chromatography. There are several metal and alloy identification kits commercially available to do chemical spot testing. These kits are developed such that nonchemists in the
21
metal working industries can use them. These kits have an advantage of immediate usefulness for the identification of industrial metals and alloys with simplified instructions.
For detailed discussion of the tests available for metal identification, the reader is referred to the nondestructive testing references, Goebbels [1994], and Bray and McBride [1992].
3.3.1.1 Wrought Iron Identification in Field
Depending on the age of the bridge, information in the literature is available on average properties of the material. In the United States, manufacturing of steel started somewhere around 1890. Hence, if the structure was built before 1890, then the metal is likely to be either cast iron or wrought iron. The ability to cut out a corner of metal with the help of a sharp knife without much effort suggests that the metal is wrought iron. In this case, detailed visual inspection may assist in the accurate identification of wrought iron. For detailed inspection, the metal surface must be prepared. Grinding, sanding, and acid etching can be used to prepare the metal surface. After preparation, a magnifying glass can be used for inspection. If the metal is wrought iron, then laminations and inclusions of slag will be clearly visible. For further verification, an acid etch test can be performed in the laboratory on a sample of metal removed from the bridge. Background information on wrought iron reproduced from several references is provided in Appendix C.
3.3.2 Chemical Composition
For more detailed examination of the metal, chemical composition tests can be used. This generally requires removing a small sample of the metal from the bridge. Once this sample is obtained, chemical analysis can be conducted by commercial test laboratories. Chemical analysis is relatively inexpensive, and can provide a great deal of useful information on the type of metal. Chemical analysis can also be a very useful in assessing the weldability of the metal.
The accuracy of a chemical analysis will depend, in part, on the purity of the collected sample. To get a chemical composition that is representative of the actual metal, the collected sample should be free of any contamination. The main source of contamination of a collected metal sample is the method used for the collection of the sample. If the surface of the metal is corroded, then the collected sample will be contaminated with oxides of metal elements. In this case, it is necessary to prepare the surface carefully. The method used for preparation of the surface may be a source of contamination. For example, the deposit of carbides from a grinder or from sandpaper will be collected along with the metal sample. Files used for preparation of a surface will also contaminate the sample with its particles. Both the carbide and/or file particle content in the collected sample will change the results of spectroscopy. Hence, it is very important to prepare the surface carefully.
3.3.3 Microstructure
Metallography is a standard technique for developing an image of a metal’s microstructure. The properties of a material are a direct consequence of the microstructural features of the material. Grinding, polishing, and etching allow a detailed view of the material’s
22
structure under a microscope with more than 1000 times magnification. Grain size, grain shape, grain boundaries, inclusions, and segregates/precipitates are some of the parameters that can be studied with high resolution.
On-site metallography is comparable to conventional metallography with a need for grinding, polishing, and etching of the surface. The technique is sufficiently developed so that magnifications up to 10,000 times can be used. On-site metallography can be used to detect microstructure damage due to fatigue, creep, and incorrect heat treatment, prior to development of macrostructure damage. Microstructure determination is discussed by Goebbels [1994], Bray and McBride [1992], and Kehl [1949].
3.3.4 Macrostructure
Parameters that describe the macrostructure of a metal are homogeneity of the microstructure over the thickness and the lateral extension of a sample, texture for direction dependant behavior, and residual stresses. Density is an important property in considering macroscopic behavior.
Density measurements are useful, primarily, for describing the soundness of a material. Local density variations are indicative of an inhomogeneous material. Density correlates directly to nondestructive test measuring parameters such as velocity, sound impedance, and reflection coefficient of ultrasonic waves and x-ray absorption coefficient. By using appropriate measuring techniques, local densities can be obtained with satisfactory resolution. For density, homogeneity and texture determination of a metal sample, tests based on ultrasonic, x-ray, or Gamma-rays can be used.
3.3.5 Hardness Testing
Hardness testing is a descriptive term for a number of methods for the measurement of the resistance of a metal surface to the action of a body, which is forced into it under pressure or by means of an impact. Care must be taken before conducting any hardness test on an unknown metal, especially when the metal is likely to be cast iron. Cast iron is very brittle, and the indentation created by hardness test may initiate a fracture in an otherwise sound member. Care must also be exercised when conducting field hardness tests in regions with cold temperatures as the brittleness of cast iron increases as temperature goes down. Hence, it is important to identify the metal before doing a hardness test. If is the metal is wrought iron, then the hardness test will not harm the member.
The hardness of a metal can be determined using cutting hardness, abrasive hardness, tensile hardness, rebound hardness, indentation hardness, or deformation hardness. The hardness values measured will depend upon mechanical properties, homogeneity, and surface finish of the metal sample. Furthermore, the geometry of the test body, the force of the test body and the velocity during the application of pressure or impact as well as the loading time will all affect the result. Hardness tests are often conducted to obtain an estimate of a metal’s tensile strength. Correlation between hardness and tensile strength is possible because hardness is related to plastic deformation of metals. For a ductile material, hardness increases with yield and tensile strength and reduces with plasticity and ductility.
23
Portable Brinell hardness testing instruments are available. These instruments are calibrated to give equivalent results to those of a standard laboratory Brinell machine on a comparison test bar of approximately the same hardness as the material to be tested. Detailed descriptions of the portable tests are available from the latest version of American Society for Testing and Materials (ASTM) Standard E 110. Boving [1989] discusses hardness testing in more detail.
3.3.6 Detection of Defects
The most common methods used for defect detection in metals are X-ray radiography, magnetic particle tests, eddy current tests, dye penetration tests and ultrasonic tests. Other test methods are also available to estimate material degradation, plastic deformation and fatigue of metals. For a thorough discussion on these methods, refer to AASHTO [1994].
Apart from the above methods, other devices are available for detecting cracks. These are the acoustic crack detector and magnetic crack definer. Both instruments are portable, fully contained devices, battery operated, and commercially available. The acoustic crack detector is a survey device based on ultrasonic pulse echo techniques; the magnetic crack definer is a device based on magnetic field disturbance techniques. Both devices can be used for determination of the location and length of the crack.
3.4 STRUCTURAL TIMBER
Timber is frequently used as part of the floor system in off-system metal truss bridges. Evaluation of load capacity of existing timber members requires knowledge of the species and grade of the timbers, as well as consideration of the effects of deterioration on load capacity.
For timber members that do not exhibit significant decay or other forms of deterioration, allowable stresses can be determined from AASHTO [1996]. Allowable stresses are based on Design Values of stress, modified by a wet service factor, a load duration factor, and other factors. Establishing design stress values require knowledge of the wood species and visual stress grade of the member. In some cases, this can be determined from grade marks visible on the member, or from design drawings for the bridge. If this information is not available, several courses of action are possible. One possibility is to use the lowest allowable stresses reported in AASHTO [1996] for any species and grade for the type of member under consideration. An alternative approach is to conduct further evaluations to establish the species and grade. The species can be determined by removing a small sample of material and sending it to a laboratory for species identification. Such identification is typically accomplished by examining the sample under a microscope. Species identification services are available from the United States Department of Agriculture (USDA) Forest products Laboratory (http://www.fpl.fs.fed.us/). In some cases, an experienced wood evaluator can visually identify species in the field.
Design stress values for timber members depend not only on the species of wood, but also on the visual grade and on the size classification of the member. Typical visual grades are Dense Select Structural, Select Structural, No. 1 and No. 2. The visual grades are established by experienced graders based on the presence of strength reducing factors in the member, such as
24
knots, checks and shakes. For existing timber members in a bridge deck, it may be necessary to retain an experienced wood evaluator to make a grade determination.
As an example of design stress values, consider design bending stress for members classified as “beams and stringers.” The lowest value given in AASHTO [1996] for any species or grade is 575 psi. This corresponds to No. 2 grade Spruce-Pine-Fur. The highest value is 1900 psi, which corresponds to Dense Select Structural grade Douglas Fir-Larch. Consequently, identifying the species and grade of timbers can significantly affect design stress values.
The design stress values based on species and grade, as given in AASHTO [1996] are applicable to undeteriorated members. For existing bridge deck timbers, a reduction in design stress values may be needed to account for various types of deterioration, such as decay, splitting, or other types of damage. A review of literature revealed no quantitative guidelines on how to reduce design stress values for various types of damage and deterioration. Such reductions require the judgment of an experienced wood engineer.
Several methods and instruments are available to estimate extent of decay, moisture content, and other properties of a wood structural member in the field, such as manual inspection and probing and various moisture meters. Electrical resistance measuring devices and ultrasonic devices are also available to detect internal rot. A detailed discussion on various methods is presented in Wilson [1984]. Additional useful references that pertain to the evaluation of existing timber members and structures are available from the American Society of Civil Engineers [ASCE 1982, ASCE 1986a].
3.5 MASONRY
Supporting piers for historic metal truss bridge are sometime constructed of masonry, as with the case study bridge. Allowable stresses for evaluation of masonry in existing bridges are provided by AASHTO [1994]. However, these stresses may need to be reduced if the masonry or mortar are deteriorated or damaged. This may require considerable judgment. Evaluation of the condition of existing masonry can be assisted by a variety of non-destructive and destructive tests.
A comprehensive discussion on available laboratory and in-situ test methods for masonry assemblages (units and mortar) and masonry is presented in Wilson [1984]. The test methods presented in this handbook are useful for determination of strength and durability properties, such as compressive, tensile and shear strength, permeability and water absorption, resistance to environmental changes, and structural soundness of masonry assemblages and masonry. The nondestructive test methods presented are ultrasonic tests, gamma radiography, flatjack test, Schmidt rebound hammer test, and in-place bedjoint shear test. Additional discussion on test methods for masonry is presented by Fattal [1975], Clifton [1985], and Kingsley [1988].
3.6 METAL EVALUATION FOR CASE STUDY BRIDGE
This section describes methods used for identifying and evaluating the metal of the case study bridge in Shackelford County, Texas. Both laboratory and in-situ tests were conducted. Laboratory testing involved identification of the locations from where the materials could be
25
removed with minimum impact on the strength and historical fabric of the bridge, removal of the materials and testing. The in-situ testing consisted of selecting the type of tests to be performed and selection of test locations. The main objectives of the material testing were to identify the material of construction and its mechanical properties. Each of these tasks is described in the following sections.
3.6.1 Material Removal and Replacement
3.6.1.1 Selection of Location for Material Removal
The location of material removal should be selected in such way that the removal of material will not adversely affect the strength of the part of the bridge from which the material is removed, nor the strength of the overall bridge. The selection of the location should be based on the properties to be determined. As far as possible the material should be removed from the members or parts that are critical or need to be rehabilitated. From a preservation perspective, the removal of original fabric from a historic resource should be done in such a way as to do minimum or no damage to the remaining materials. New additions should be compatible and obvious.
Prior to choosing material sampling locations, a detailed structural analysis should be done. The analyses will determine the critical members as well as the least stressed members of the bridge. In the structural analysis of the case study bridge (see Chapter 4), it was found that the lower tension chord members were the critical members with respect to the load rating. The ideal location of material removal should be these members. However, since these members were eyebars, removal of any significant amount of material may have adversely affected their strength. Structural analysis showed that the least stressed members were the vertical compression members located at mid-span of the trusses. These compression members are built-up sections with two channels connected back-to-back with lacing members. Several lacing members were removed for material testing. New lacings members were put in place of the removed lacings.
3.6.1.2 Removal and Replacement of Material
Lacing members from the compression members L3U3 (see Figure 2.5) of both the upstream and downstream trusses were removed by cutting the rivet heads by using a disc grinder. The grinding operation was carried out carefully to avoid damaging the channel sections. After cutting the rivet heads, they were removed by hammering. Two lacing members were removed from each member. The lacing members were removed from the bridge in May 1999. Once removed, the lacing members were labeled for identification, as listed in Table 3.1.
Replacement steel lacing members were installed in place of the removed members, and structural bolts were installed in place of the removed rivets. The replacement lacing members were fabricated from structural steel plate, with dimensions identical to the original lacing members. The original lacing members were attached by rivets. Since structural rivets are now obsolete, the replacement-lacing members were attached with structural bolts. However, instead of using conventional hex head bolts, structural bolts were obtained with a rounded rivet-like
26
head. Thus, the head of the bolt resembles a rivet, although the difference between the bolts and existing rivets are clear upon close inspection. Further, the threaded ends of the bolts were provided with a conventional hexagonal nut. The bolts were installed so that the round heads faced outwards on the built-up laced members. This method for replacing and reattaching the lacing members was considered to be compatible with the existing bridge construction, but clear and obvious that a change had occurred. It would not be appropriate to attempt to conceal the change.
Table 3.1: Metal sample identification
Sample Identification
Location
1 Downstream truss – Central column, L3U3 – North face – lacing 2 Upstream truss – Central column, L3U3 – South face –lacing 3 Downstream truss – Central column, L3U3 – North face –lacing 4 Upstream truss – Central column, L3U3 – South face –lacing
3.6.2 Laboratory Tests on Lacing Members
For metal lacing samples, the following laboratory tests were conducted:
• Tension test;
• Chemical composition;
• Hardness test; and
• Metallography.
Tension and hardness tests were conducted at the University of Texas Ferguson Structural Engineering Laboratory in Austin. Chemical analysis and production of photomicrographs were done by An-Tech Laboratories, Inc., a commercial materials testing laboratory located in Houston.
Tension coupons were prepared from lacing sample Nos. 1 and 2. Typical sheet type tension coupons with a reduced section per ASTM A370 were machined from the lacing members. The length of the reduced section was about 2½ inches and the width of the reduced section was ½ inch. The thickness of the specimen was equal to the full thickness of the lacing member, which was approximately 0.20 inches.
The coupons were tested in a screw-driven test machine. An extensometer with an initial 2-inch gage length was used. Testing was done using a constant test machine crosshead rate of 0.02 inches/minute. Once the material reached the yield plateau during the test, the crossheads were stopped and held stationary for 3 minutes. The load after a 3-minute load hold was used to compute a static yield stress. The value of load at the yield plateau measured with the machine crossheads in motion was used to compute the dynamic yield stress. Finally, the ultimate load on the coupon was measured with the machine crossheads in motion to determine the ultimate yield stress. After fracture of the coupon, the distance between gage marks on the coupon, initially at
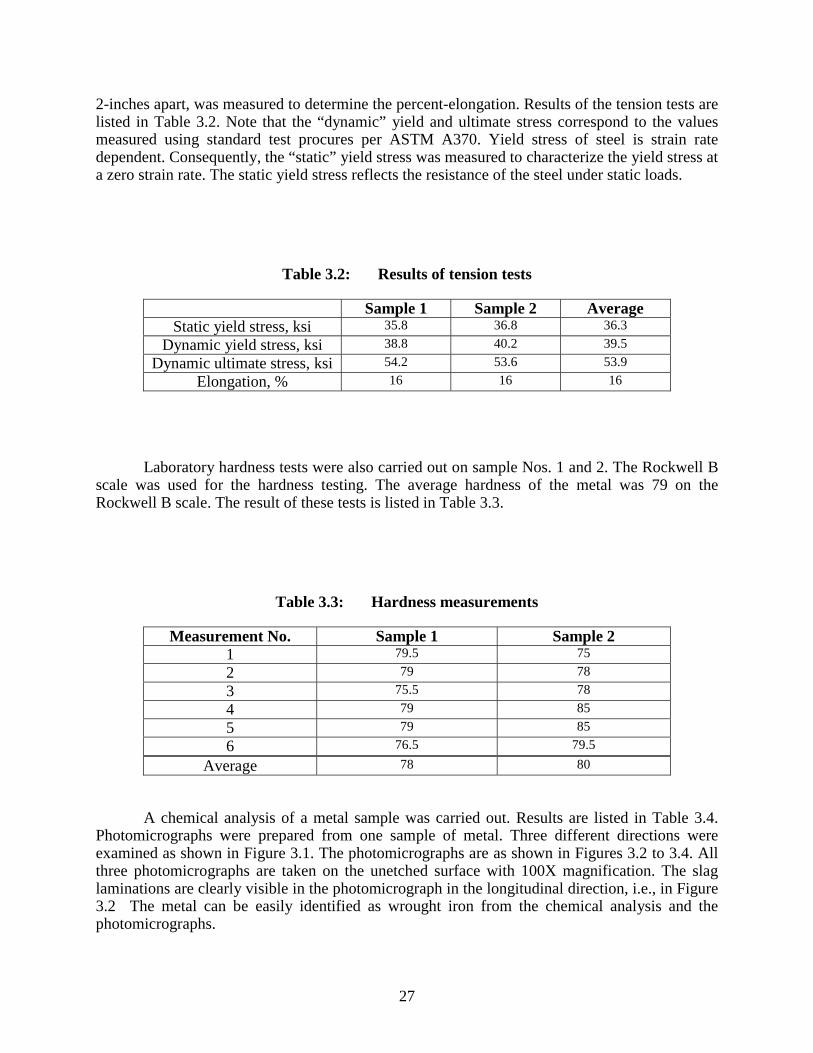
27
2-inches apart, was measured to determine the percent-elongation. Results of the tension tests are listed in Table 3.2. Note that the “dynamic” yield and ultimate stress correspond to the values measured using standard test procures per ASTM A370. Yield stress of steel is strain rate dependent. Consequently, the “static” yield stress was measured to characterize the yield stress at a zero strain rate. The static yield stress reflects the resistance of the steel under static loads.
Table 3.2: Results of tension tests
Sample 1 Sample 2 Average Static yield stress, ksi 35.8 36.8 36.3
Dynamic yield stress, ksi 38.8 40.2 39.5 Dynamic ultimate stress, ksi 54.2 53.6 53.9
Elongation, % 16 16 16
Laboratory hardness tests were also carried out on sample Nos. 1 and 2. The Rockwell B scale was used for the hardness testing. The average hardness of the metal was 79 on the Rockwell B scale. The result of these tests is listed in Table 3.3.
Table 3.3: Hardness measurements
Measurement No. Sample 1 Sample 2 1 79.5 75 2 79 78 3 75.5 78 4 79 85 5 79 85 6 76.5 79.5
Average 78 80
A chemical analysis of a metal sample was carried out. Results are listed in Table 3.4. Photomicrographs were prepared from one sample of metal. Three different directions were examined as shown in Figure 3.1. The photomicrographs are as shown in Figures 3.2 to 3.4. All three photomicrographs are taken on the unetched surface with 100X magnification. The slag laminations are clearly visible in the photomicrograph in the longitudinal direction, i.e., in Figure 3.2 The metal can be easily identified as wrought iron from the chemical analysis and the photomicrographs.
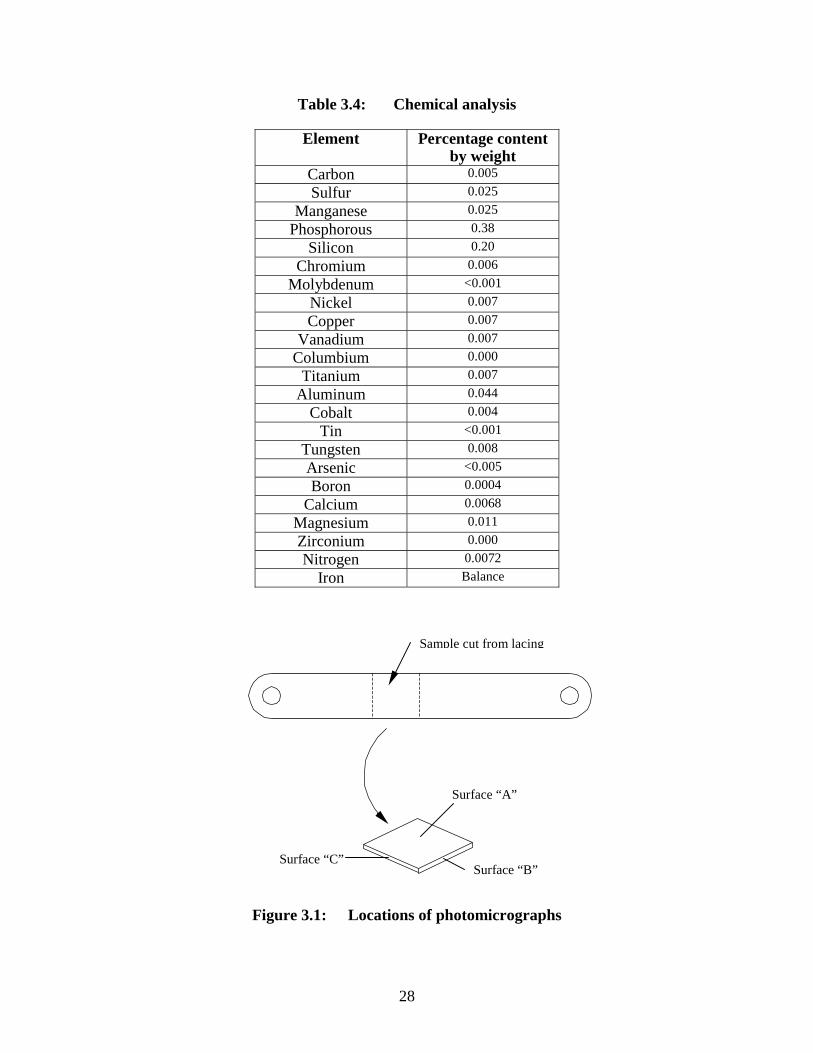
28
Table 3.4: Chemical analysis
Element Percentage content by weight
Carbon 0.005Sulfur 0.025
Manganese 0.025Phosphorous 0.38
Silicon 0.20Chromium 0.006
Molybdenum <0.001Nickel 0.007Copper 0.007
Vanadium 0.007Columbium 0.000
Titanium 0.007Aluminum 0.044
Cobalt 0.004Tin <0.001
Tungsten 0.008Arsenic <0.005Boron 0.0004
Calcium 0.0068 Magnesium 0.011Zirconium 0.000Nitrogen 0.0072
Iron Balance
Figure 3.1: Locations of photomicrographs
Sample cut from lacing
Surface “A”
Surface “B”Surface “C”
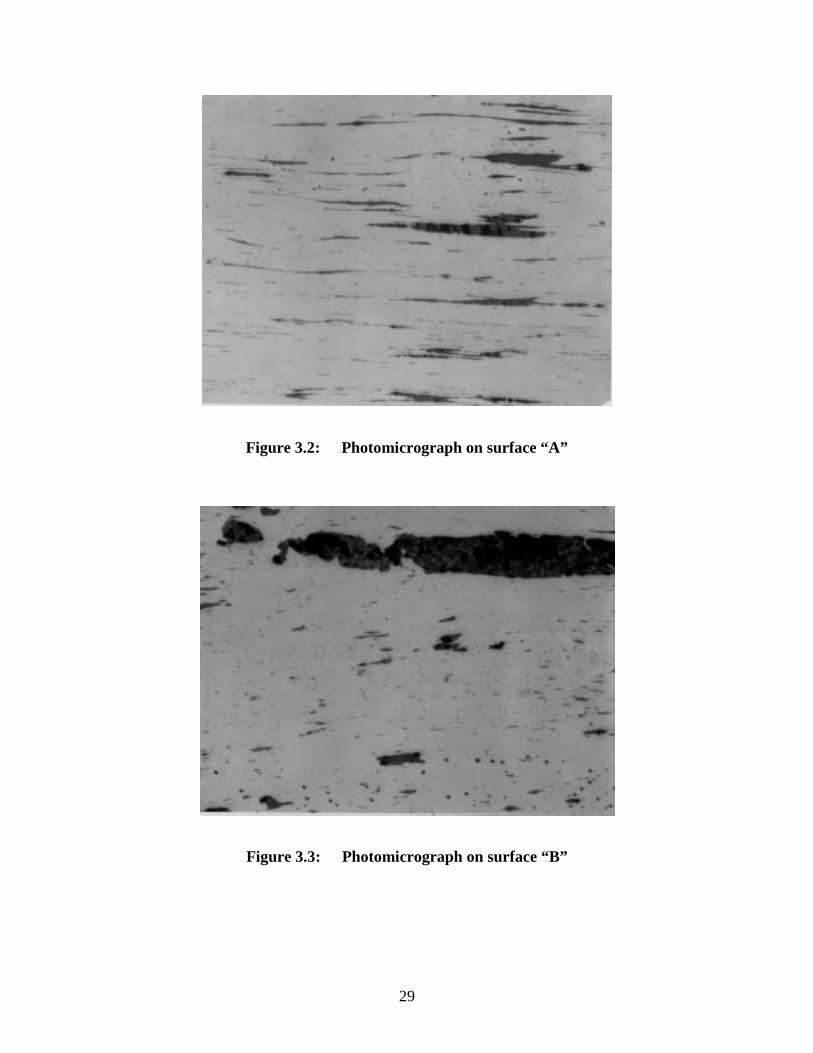
29
Figure 3.2: Photomicrograph on surface “A”
Figure 3.3: Photomicrograph on surface “B”
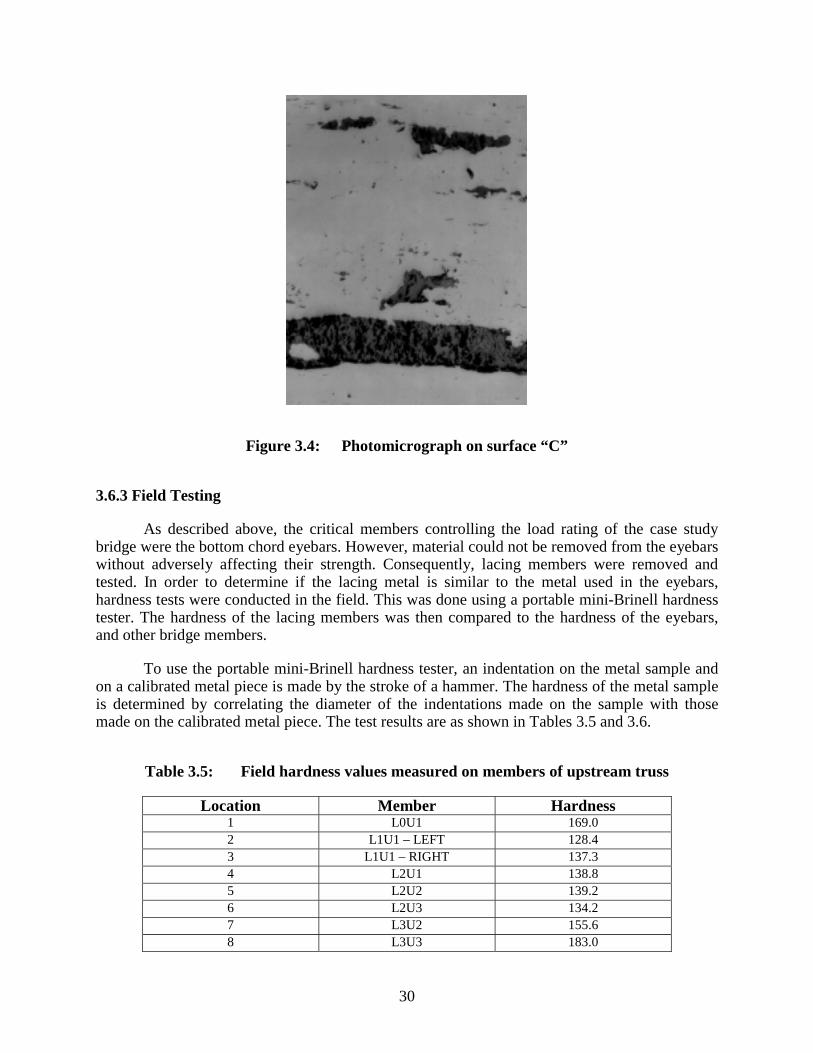
30
Figure 3.4: Photomicrograph on surface “C”
3.6.3 Field Testing
As described above, the critical members controlling the load rating of the case study bridge were the bottom chord eyebars. However, material could not be removed from the eyebars without adversely affecting their strength. Consequently, lacing members were removed and tested. In order to determine if the lacing metal is similar to the metal used in the eyebars, hardness tests were conducted in the field. This was done using a portable mini-Brinell hardness tester. The hardness of the lacing members was then compared to the hardness of the eyebars, and other bridge members.
To use the portable mini-Brinell hardness tester, an indentation on the metal sample and on a calibrated metal piece is made by the stroke of a hammer. The hardness of the metal sample is determined by correlating the diameter of the indentations made on the sample with those made on the calibrated metal piece. The test results are as shown in Tables 3.5 and 3.6.
Table 3.5: Field hardness values measured on members of upstream truss
Location Member Hardness 1 L0U1 169.0 2 L1U1 – LEFT 128.4 3 L1U1 – RIGHT 137.3 4 L2U1 138.8 5 L2U2 139.2 6 L2U3 134.2 7 L3U2 155.6 8 L3U3 183.0
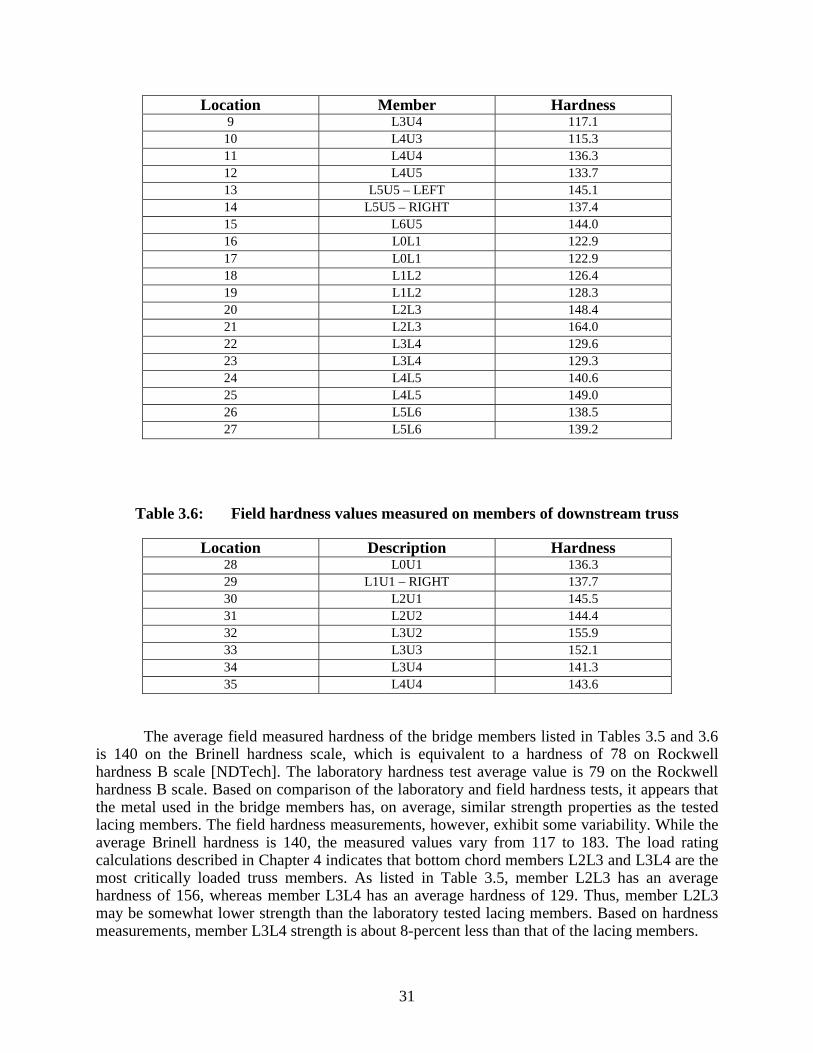
31
Location Member Hardness 9 L3U4 117.1
10 L4U3 115.3 11 L4U4 136.3 12 L4U5 133.7 13 L5U5 – LEFT 145.1 14 L5U5 – RIGHT 137.4 15 L6U5 144.0 16 L0L1 122.9 17 L0L1 122.9 18 L1L2 126.4 19 L1L2 128.3 20 L2L3 148.4 21 L2L3 164.0 22 L3L4 129.6 23 L3L4 129.3 24 L4L5 140.6 25 L4L5 149.0 26 L5L6 138.5 27 L5L6 139.2
Table 3.6: Field hardness values measured on members of downstream truss
Location Description Hardness 28 L0U1 136.3 29 L1U1 – RIGHT 137.7 30 L2U1 145.5 31 L2U2 144.4 32 L3U2 155.9 33 L3U3 152.1 34 L3U4 141.3 35 L4U4 143.6
The average field measured hardness of the bridge members listed in Tables 3.5 and 3.6 is 140 on the Brinell hardness scale, which is equivalent to a hardness of 78 on Rockwell hardness B scale [NDTech]. The laboratory hardness test average value is 79 on the Rockwell hardness B scale. Based on comparison of the laboratory and field hardness tests, it appears that the metal used in the bridge members has, on average, similar strength properties as the tested lacing members. The field hardness measurements, however, exhibit some variability. While the average Brinell hardness is 140, the measured values vary from 117 to 183. The load rating calculations described in Chapter 4 indicates that bottom chord members L2L3 and L3L4 are the most critically loaded truss members. As listed in Table 3.5, member L2L3 has an average hardness of 156, whereas member L3L4 has an average hardness of 129. Thus, member L2L3 may be somewhat lower strength than the laboratory tested lacing members. Based on hardness measurements, member L3L4 strength is about 8-percent less than that of the lacing members.
32
3.6.4 Discussion of Material Test Results
If no material tests are conducted, AASHTO [1994] indicates that for bridges constructed prior to 1905, a yield stress of 26 ksi and a tensile strength of 52 ksi may be assumed. The measured strength of the lacing samples was approximately 36 ksi for the yield strength, and 54 ksi for the tensile strength. Thus, these tests indicate a substantially higher yield stress than the AASHTO assumed value. Some uncertainty remains whether or not the strength of the lacing members is representative of the other truss members, particularly the bottom chord eyebars, although the similarity in hardness values between the lacing members and the eyebars suggests these members are similar in strength. While some judgment is needed in the application of these test results, this strength data can be useful when load rating the bridge (Chapters 4 and 5). Even if the higher yield stress value is not used directly in calculating member strength, the test results help build confidence that the AASHTO assumed yield stress of 26 ksi is likely quite conservative, and can be used to guide engineering judgments related to various uncertainties involved in load rating.
The test results also clearly confirmed that the metal in the case study bridge is wrought iron, and that the quality of the wrought iron appears to be quite good. The very low carbon content and low manganese content (Table 3.4) are clear indicators of wrought iron. The fibrous structure revealed in the photomicrographs (Figures 3.2 to 3.4) provides further confirmation of wrought iron.
Typical properties of wrought iron found in the literature are reproduced in Appendix C. Comparing this information with the material tests conducted on the case study bridge lacing members can provide additional insights into the case study bridge material. The chemical analysis of the lacing member (Table 3.5) compares well with typical chemical analyses of wrought iron. However, the chemical analysis of the lacing member shows somewhat lower carbon content and somewhat higher phosphorus content than typical wrought iron samples reported in the literature. The very low carbon content is particularly advantageous with respect to weldability.
Literature reproduced in Appendix C indicates that typical values of yield stress for wrought iron are in the range of 26 to 35 ksi, typical values of tensile strength are in the range of 42 to 50 ksi, and typical values of elongation are in the range of 25 to 40 percent. The actual measured yield stress for the lacing member of 36 ksi and tensile strength of 54 ksi are somewhat higher than the upper end of the reported typical values, although not by a substantial margin. Further, the measured elongation of 16 percent is somewhat lower than typical. The reasons for these somewhat atypical values are unclear. The lacing samples had somewhat higher phosphorus content than is typical. Increased phosphorus could account for an increase in strength and a decrease in elongation. Alternatively, rolling of wrought iron into thin lacing members (0.2 inches thick) could also account for an increase in strength and a decrease in elongation. Higher strength values can also be achieved by alloying wrought iron with nickel. However, the very low nickel content of the lacing member suggests that the sample is not an alloyed wrought iron. Consequently, the most likely reasons for the increased strength and decreased elongation on the lacing sample are either the high phosphorus content and/or the effects of rolling.
As indicated above, material tests clearly indicate that the case study bridge is constructed of a good quality wrought iron. As indicted in the literature (see Appendix C),
33
wrought iron has a number of properties that are advantageous in bridge construction. Although wrought iron has somewhat lower strength than structural steels, wrought iron typically exhibits excellent weldability, and very good corrosion resistance and resistance to fatigue and fracture. This information is useful for evaluating the load capacity of the bridge, and can be very useful when evaluating various repair and rehabilitation options for the bridge, as discussed in Chapter 6. Overall, when evaluating a historic metal truss bridge, efforts directed towards material identification and testing appear well justified. Many material tests can be done quite economically, and can provide a great deal of useful information for evaluation and rehabilitation.

34
35
Chapter 4: Analysis and Load Rating
4.1 INTRODUCTION
The main objective of this chapter is to illustrate the analysis and load rating of the Shackelford County case study bridge structure. This is a key step for evaluation of an existing bridge structure. In the following sections, a general discussion of load rating is provided, followed by analysis and load rating of the case study bridge.
These calculations will provide a basis for determining the safe load capacity of the bridge according to AASHTO standards. The calculations are based on the best available information on the current condition of bridge as described in Chapters 2 and 3. The load rating was accomplished following the guidelines presented in the AASHTO Manual for Condition Evaluation of Bridges [AASHTO 1994]. Load ratings were determined at the inventory and operating levels using both the allowable stress method and the load factor method.
As described in AASHTO [1994], the inventory level rating reflects the live load level that can safely be applied to the structure for an indefinite period of time. The inventory rating is comparable with the capacity of new bridges. The operating level rating is intended to reflect the maximum live load that can be sustained by the bridge on a limited basis. A large number of live load applications at the operating level would presumably shorten the life of the bridge. Operating level ratings are higher than inventory level ratings for the same bridge.
4.2 RATING EQUATION
As specified by AASHTO [1994], the following expression was used in determining the load rating of the bridge structure:
)1(2
1
ILADACRF
+−= (4.1)
where:
RF = the rating factor for the live-load carrying capacity. The rating factor multiplied by the rating vehicle in tons gives the rating of the structure;
C = the capacity of the member;
D = the dead load effect on the member;
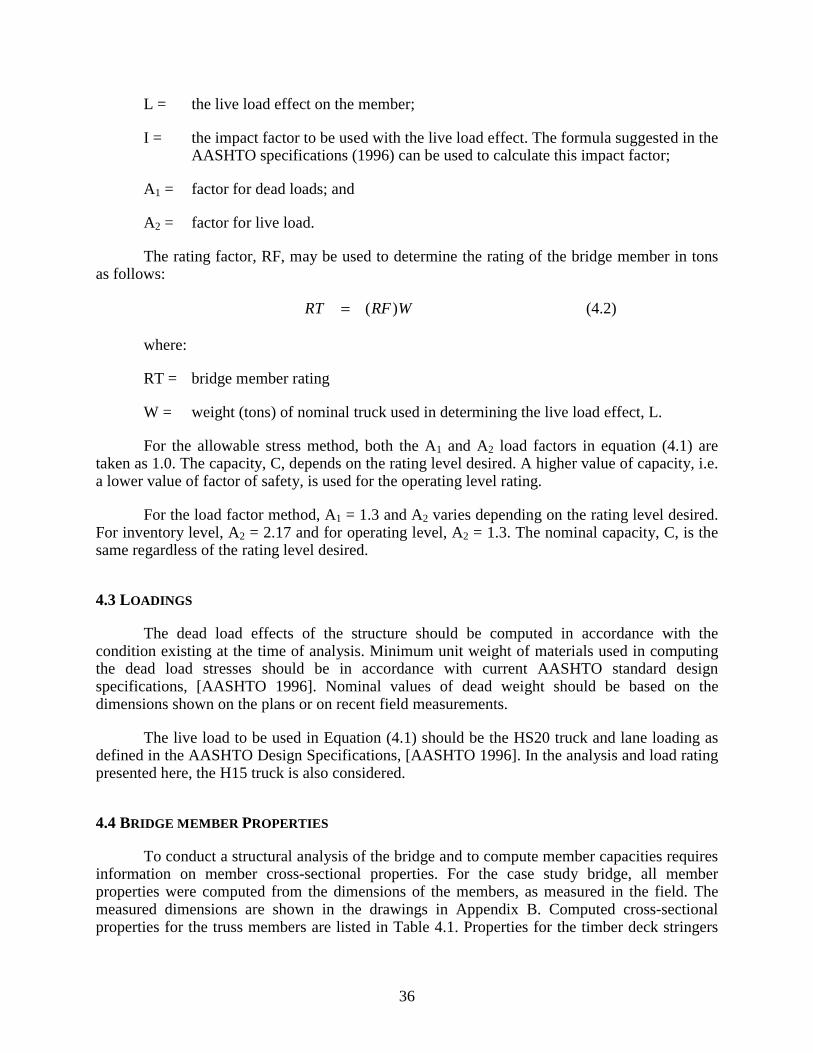
36
L = the live load effect on the member;
I = the impact factor to be used with the live load effect. The formula suggested in the AASHTO specifications (1996) can be used to calculate this impact factor;
A1 = factor for dead loads; and
A2 = factor for live load.
The rating factor, RF, may be used to determine the rating of the bridge member in tons as follows:
WRFRT )(= (4.2)
where:
RT = bridge member rating
W = weight (tons) of nominal truck used in determining the live load effect, L.
For the allowable stress method, both the A1 and A2 load factors in equation (4.1) are taken as 1.0. The capacity, C, depends on the rating level desired. A higher value of capacity, i.e. a lower value of factor of safety, is used for the operating level rating.
For the load factor method, A1 = 1.3 and A2 varies depending on the rating level desired. For inventory level, A2 = 2.17 and for operating level, A2 = 1.3. The nominal capacity, C, is the same regardless of the rating level desired.
4.3 LOADINGS
The dead load effects of the structure should be computed in accordance with the condition existing at the time of analysis. Minimum unit weight of materials used in computing the dead load stresses should be in accordance with current AASHTO standard design specifications, [AASHTO 1996]. Nominal values of dead weight should be based on the dimensions shown on the plans or on recent field measurements.
The live load to be used in Equation (4.1) should be the HS20 truck and lane loading as defined in the AASHTO Design Specifications, [AASHTO 1996]. In the analysis and load rating presented here, the H15 truck is also considered.
4.4 BRIDGE MEMBER PROPERTIES
To conduct a structural analysis of the bridge and to compute member capacities requires information on member cross-sectional properties. For the case study bridge, all member properties were computed from the dimensions of the members, as measured in the field. The measured dimensions are shown in the drawings in Appendix B. Computed cross-sectional properties for the truss members are listed in Table 4.1. Properties for the timber deck stringers
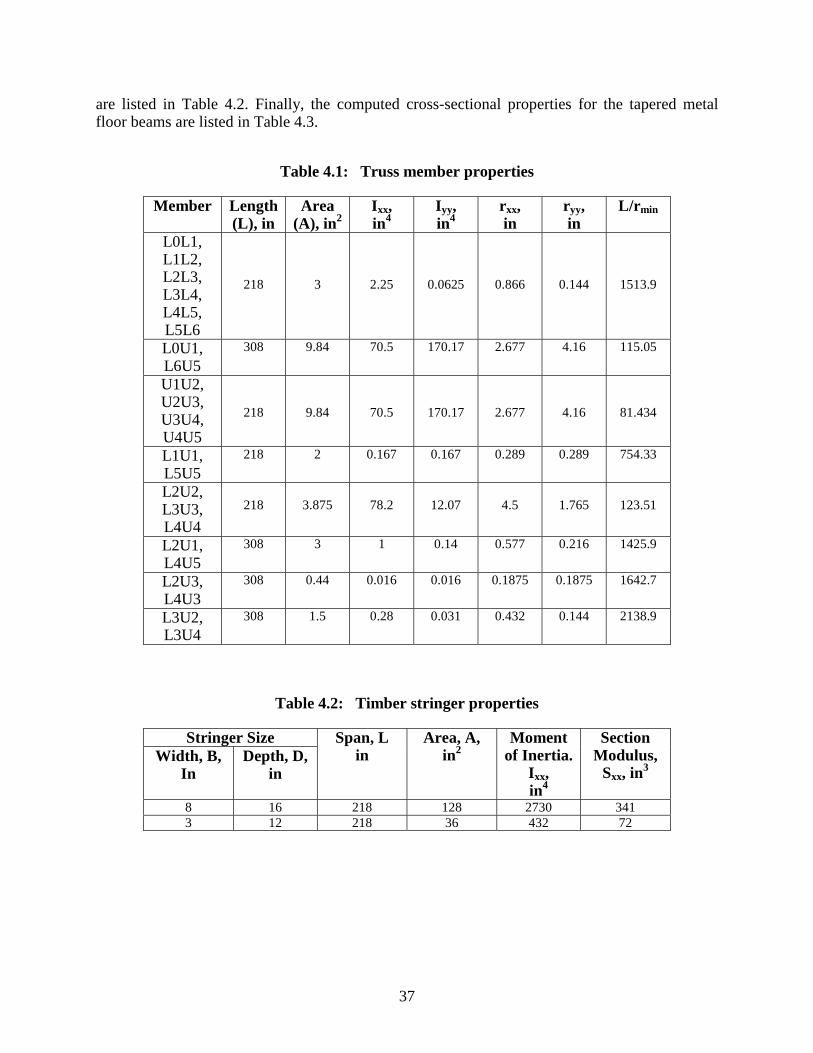
37
are listed in Table 4.2. Finally, the computed cross-sectional properties for the tapered metal floor beams are listed in Table 4.3.
Table 4.1: Truss member properties
Member Length (L), in
Area(A), in2
Ixx,in4
Iyy,in4
rxx,in
ryy,in
L/rmin
L0L1, L1L2, L2L3, L3L4, L4L5, L5L6
218 3 2.25 0.0625 0.866 0.144 1513.9
L0U1, L6U5
308 9.84 70.5 170.17 2.677 4.16 115.05
U1U2,U2U3,U3U4,U4U5
218 9.84 70.5 170.17 2.677 4.16 81.434
L1U1, L5U5
218 2 0.167 0.167 0.289 0.289 754.33
L2U2, L3U3, L4U4
218 3.875 78.2 12.07 4.5 1.765 123.51
L2U1, L4U5
308 3 1 0.14 0.577 0.216 1425.9
L2U3, L4U3
308 0.44 0.016 0.016 0.1875 0.1875 1642.7
L3U2, L3U4
308 1.5 0.28 0.031 0.432 0.144 2138.9
Table 4.2: Timber stringer properties
Stringer Size Width, B,
InDepth, D,
in
Span, L in
Area, A,in2
Moment of Inertia.
Ixx,in4
Section Modulus,
Sxx, in3
8 16 218 128 2730 341 3 12 218 36 432 72
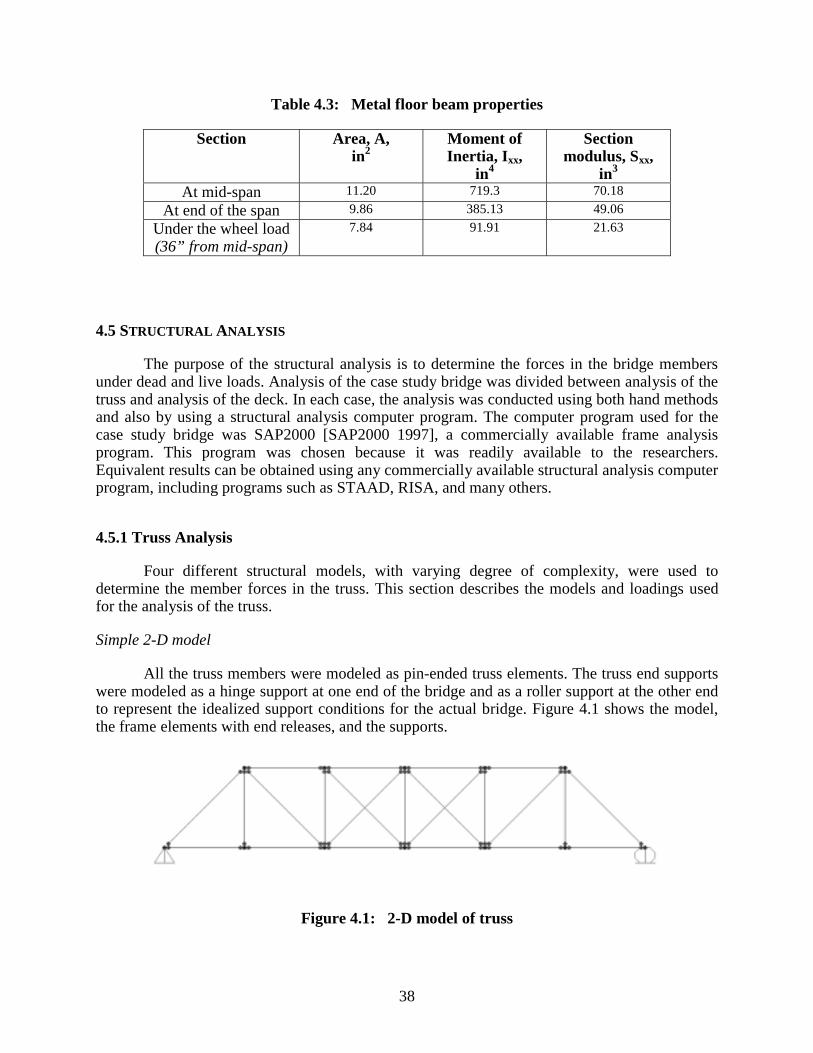
38
Table 4.3: Metal floor beam properties
Section Area, A, in2
Moment of Inertia, Ixx,
in4
Section modulus, Sxx,
in3
At mid-span 11.20 719.3 70.18 At end of the span 9.86 385.13 49.06
Under the wheel load (36” from mid-span)
7.84 91.91 21.63
4.5 STRUCTURAL ANALYSIS
The purpose of the structural analysis is to determine the forces in the bridge members under dead and live loads. Analysis of the case study bridge was divided between analysis of the truss and analysis of the deck. In each case, the analysis was conducted using both hand methods and also by using a structural analysis computer program. The computer program used for the case study bridge was SAP2000 [SAP2000 1997], a commercially available frame analysis program. This program was chosen because it was readily available to the researchers. Equivalent results can be obtained using any commercially available structural analysis computer program, including programs such as STAAD, RISA, and many others.
4.5.1 Truss Analysis
Four different structural models, with varying degree of complexity, were used to determine the member forces in the truss. This section describes the models and loadings used for the analysis of the truss.
Simple 2-D model
All the truss members were modeled as pin-ended truss elements. The truss end supports were modeled as a hinge support at one end of the bridge and as a roller support at the other end to represent the idealized support conditions for the actual bridge. Figure 4.1 shows the model, the frame elements with end releases, and the supports.
Figure 4.1: 2-D model of truss
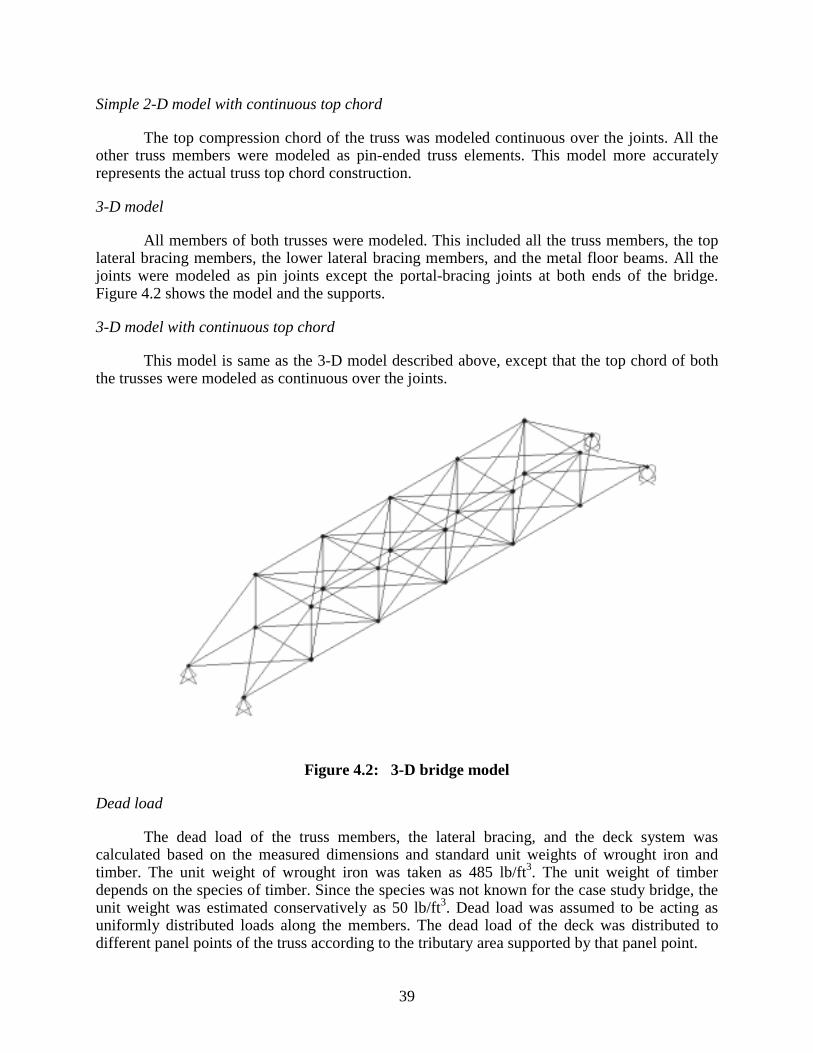
39
Simple 2-D model with continuous top chord
The top compression chord of the truss was modeled continuous over the joints. All the other truss members were modeled as pin-ended truss elements. This model more accurately represents the actual truss top chord construction.
3-D model
All members of both trusses were modeled. This included all the truss members, the top lateral bracing members, the lower lateral bracing members, and the metal floor beams. All the joints were modeled as pin joints except the portal-bracing joints at both ends of the bridge. Figure 4.2 shows the model and the supports.
3-D model with continuous top chord
This model is same as the 3-D model described above, except that the top chord of both the trusses were modeled as continuous over the joints.
Figure 4.2: 3-D bridge model
Dead load
The dead load of the truss members, the lateral bracing, and the deck system was calculated based on the measured dimensions and standard unit weights of wrought iron and timber. The unit weight of wrought iron was taken as 485 lb/ft3. The unit weight of timber depends on the species of timber. Since the species was not known for the case study bridge, the unit weight was estimated conservatively as 50 lb/ft3. Dead load was assumed to be acting as uniformly distributed loads along the members. The dead load of the deck was distributed to different panel points of the truss according to the tributary area supported by that panel point.
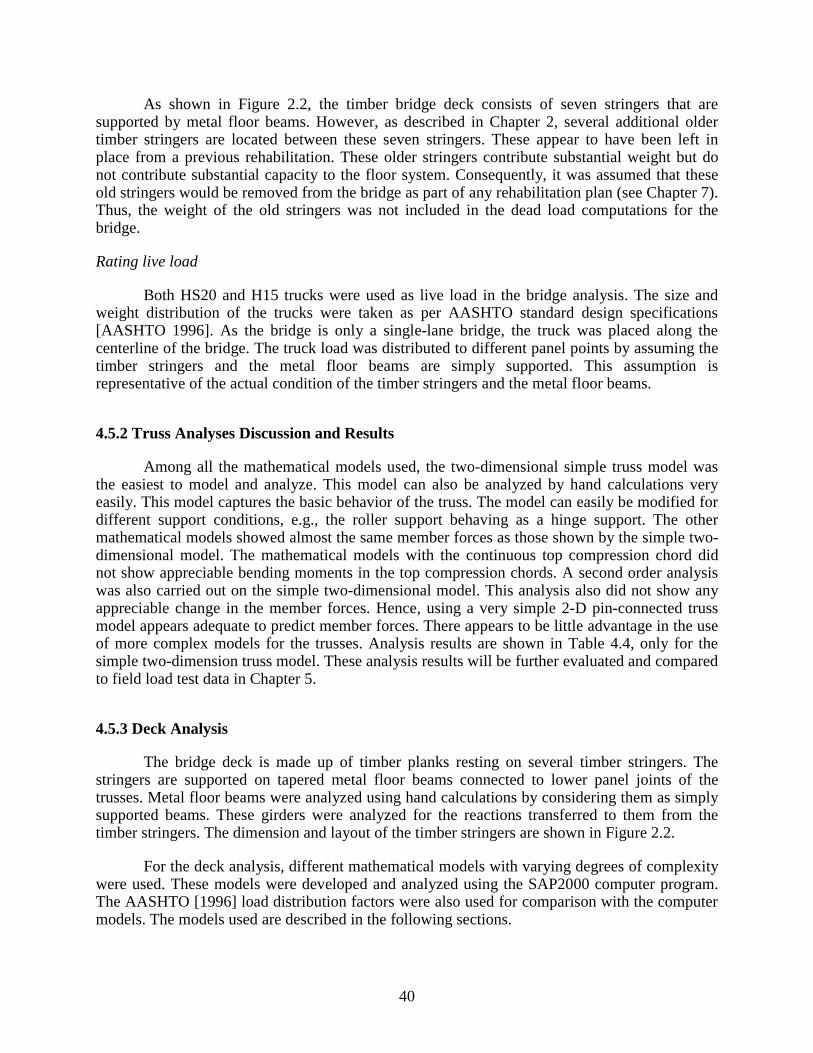
40
As shown in Figure 2.2, the timber bridge deck consists of seven stringers that are supported by metal floor beams. However, as described in Chapter 2, several additional older timber stringers are located between these seven stringers. These appear to have been left in place from a previous rehabilitation. These older stringers contribute substantial weight but do not contribute substantial capacity to the floor system. Consequently, it was assumed that these old stringers would be removed from the bridge as part of any rehabilitation plan (see Chapter 7). Thus, the weight of the old stringers was not included in the dead load computations for the bridge.
Rating live load
Both HS20 and H15 trucks were used as live load in the bridge analysis. The size and weight distribution of the trucks were taken as per AASHTO standard design specifications [AASHTO 1996]. As the bridge is only a single-lane bridge, the truck was placed along the centerline of the bridge. The truck load was distributed to different panel points by assuming the timber stringers and the metal floor beams are simply supported. This assumption is representative of the actual condition of the timber stringers and the metal floor beams.
4.5.2 Truss Analyses Discussion and Results
Among all the mathematical models used, the two-dimensional simple truss model was the easiest to model and analyze. This model can also be analyzed by hand calculations very easily. This model captures the basic behavior of the truss. The model can easily be modified for different support conditions, e.g., the roller support behaving as a hinge support. The other mathematical models showed almost the same member forces as those shown by the simple two-dimensional model. The mathematical models with the continuous top compression chord did not show appreciable bending moments in the top compression chords. A second order analysis was also carried out on the simple two-dimensional model. This analysis also did not show any appreciable change in the member forces. Hence, using a very simple 2-D pin-connected truss model appears adequate to predict member forces. There appears to be little advantage in the use of more complex models for the trusses. Analysis results are shown in Table 4.4, only for the simple two-dimension truss model. These analysis results will be further evaluated and compared to field load test data in Chapter 5.
4.5.3 Deck Analysis
The bridge deck is made up of timber planks resting on several timber stringers. The stringers are supported on tapered metal floor beams connected to lower panel joints of the trusses. Metal floor beams were analyzed using hand calculations by considering them as simply supported beams. These girders were analyzed for the reactions transferred to them from the timber stringers. The dimension and layout of the timber stringers are shown in Figure 2.2.
For the deck analysis, different mathematical models with varying degrees of complexity were used. These models were developed and analyzed using the SAP2000 computer program. The AASHTO [1996] load distribution factors were also used for comparison with the computer models. The models used are described in the following sections.
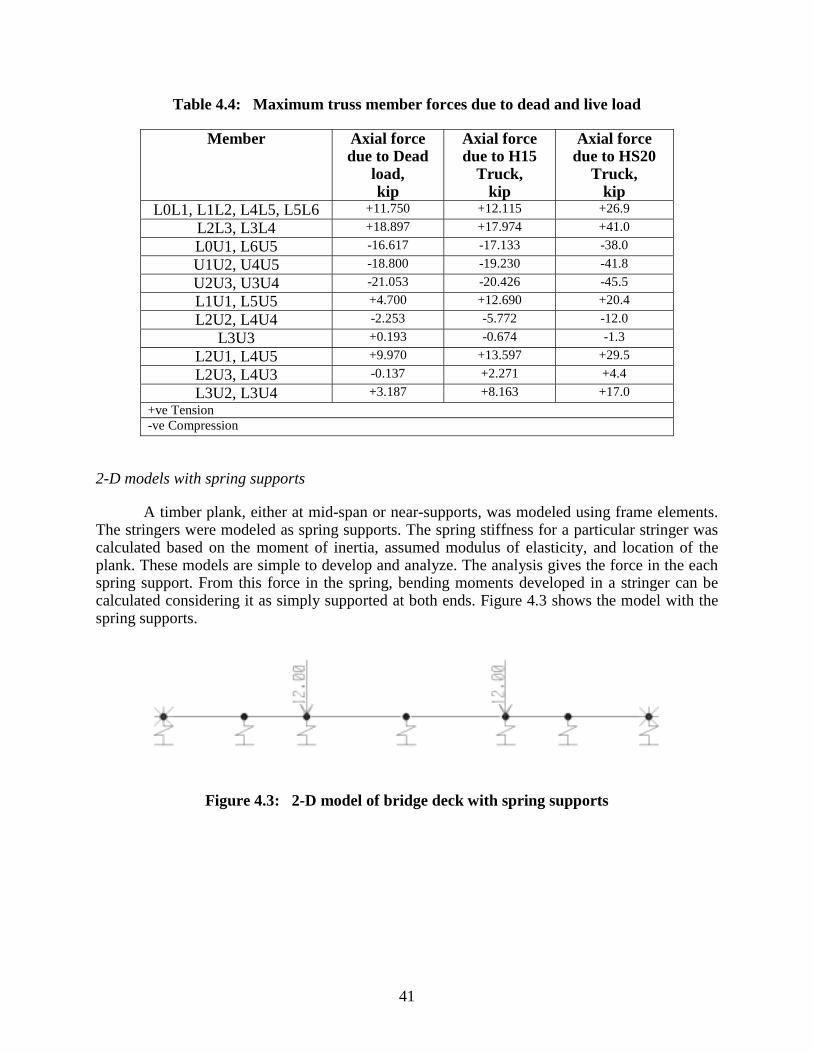
41
Table 4.4: Maximum truss member forces due to dead and live load
Member Axial force due to Dead
load,kip
Axial force due to H15
Truck, kip
Axial force due to HS20
Truck, kip
L0L1, L1L2, L4L5, L5L6 +11.750 +12.115 +26.9 L2L3, L3L4 +18.897 +17.974 +41.0 L0U1, L6U5 -16.617 -17.133 -38.0 U1U2, U4U5 -18.800 -19.230 -41.8 U2U3, U3U4 -21.053 -20.426 -45.5 L1U1, L5U5 +4.700 +12.690 +20.4 L2U2, L4U4 -2.253 -5.772 -12.0
L3U3 +0.193 -0.674 -1.3 L2U1, L4U5 +9.970 +13.597 +29.5 L2U3, L4U3 -0.137 +2.271 +4.4 L3U2, L3U4 +3.187 +8.163 +17.0
+ve Tension -ve Compression
2-D models with spring supports
A timber plank, either at mid-span or near-supports, was modeled using frame elements. The stringers were modeled as spring supports. The spring stiffness for a particular stringer was calculated based on the moment of inertia, assumed modulus of elasticity, and location of the plank. These models are simple to develop and analyze. The analysis gives the force in the each spring support. From this force in the spring, bending moments developed in a stringer can be calculated considering it as simply supported at both ends. Figure 4.3 shows the model with the spring supports.
Figure 4.3: 2-D model of bridge deck with spring supports
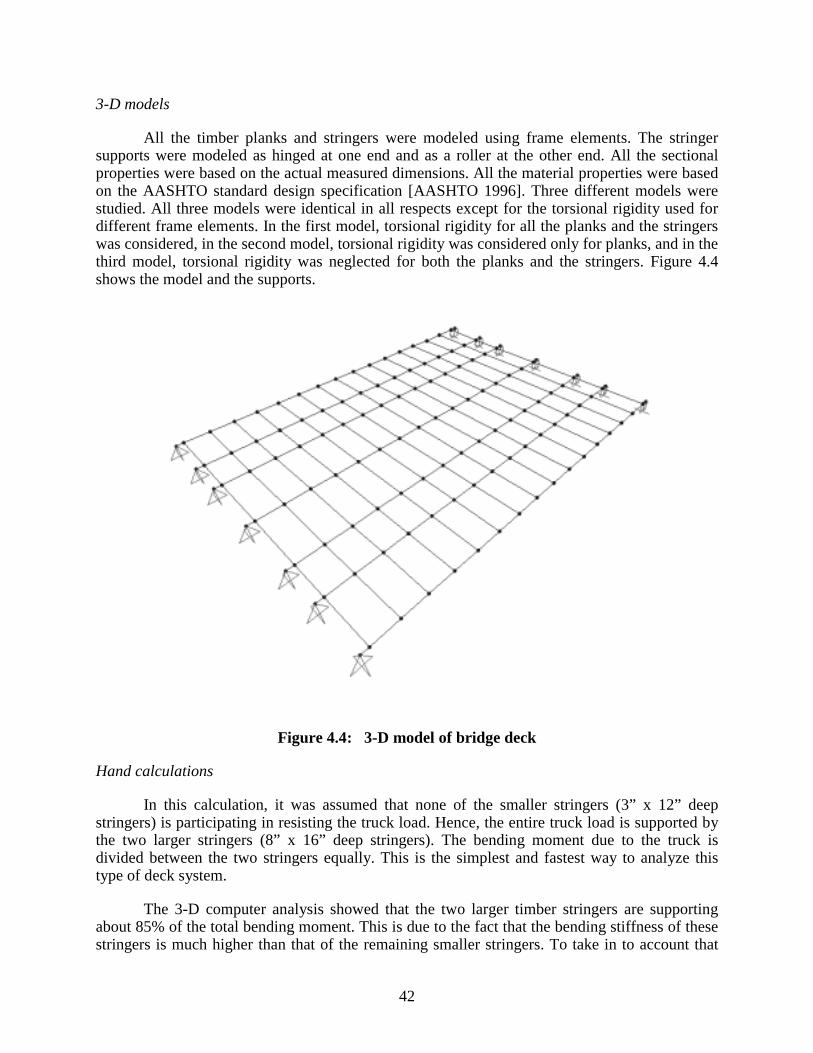
42
3-D models
All the timber planks and stringers were modeled using frame elements. The stringer supports were modeled as hinged at one end and as a roller at the other end. All the sectional properties were based on the actual measured dimensions. All the material properties were based on the AASHTO standard design specification [AASHTO 1996]. Three different models were studied. All three models were identical in all respects except for the torsional rigidity used for different frame elements. In the first model, torsional rigidity for all the planks and the stringers was considered, in the second model, torsional rigidity was considered only for planks, and in the third model, torsional rigidity was neglected for both the planks and the stringers. Figure 4.4 shows the model and the supports.
Figure 4.4: 3-D model of bridge deck
Hand calculations
In this calculation, it was assumed that none of the smaller stringers (3” x 12” deep stringers) is participating in resisting the truck load. Hence, the entire truck load is supported by the two larger stringers (8” x 16” deep stringers). The bending moment due to the truck is divided between the two stringers equally. This is the simplest and fastest way to analyze this type of deck system.
The 3-D computer analysis showed that the two larger timber stringers are supporting about 85% of the total bending moment. This is due to the fact that the bending stiffness of these stringers is much higher than that of the remaining smaller stringers. To take in to account that
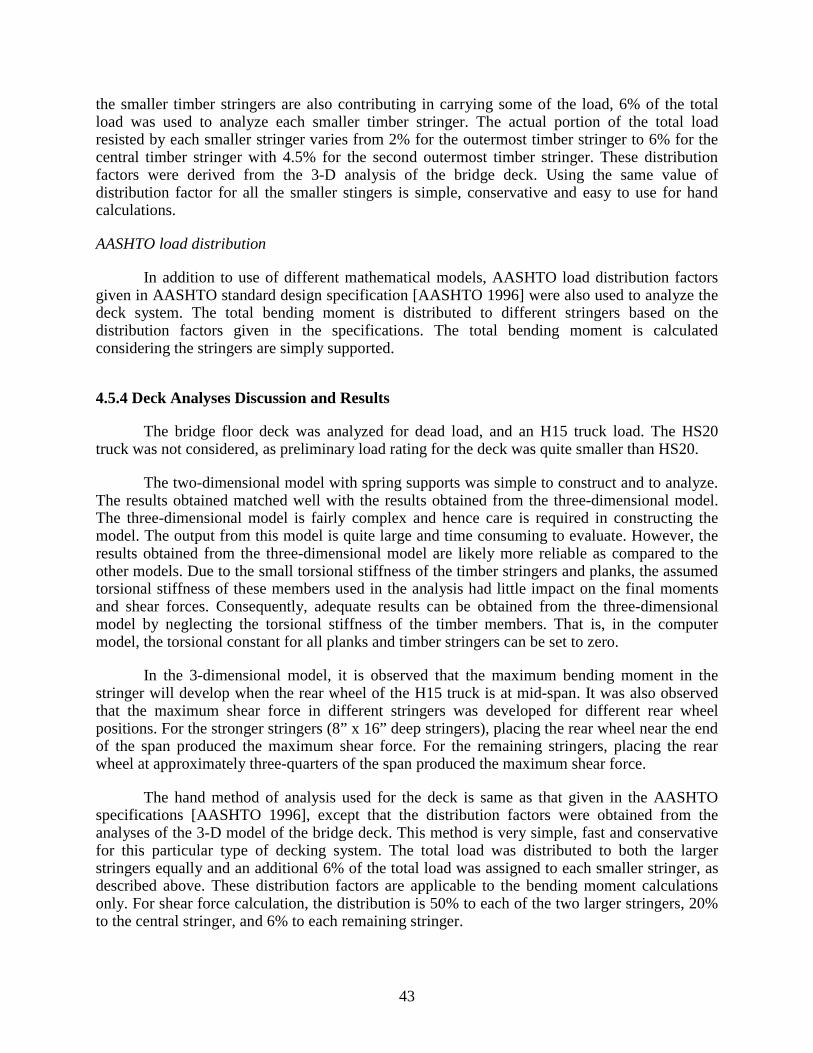
43
the smaller timber stringers are also contributing in carrying some of the load, 6% of the total load was used to analyze each smaller timber stringer. The actual portion of the total load resisted by each smaller stringer varies from 2% for the outermost timber stringer to 6% for the central timber stringer with 4.5% for the second outermost timber stringer. These distribution factors were derived from the 3-D analysis of the bridge deck. Using the same value of distribution factor for all the smaller stingers is simple, conservative and easy to use for hand calculations.
AASHTO load distribution
In addition to use of different mathematical models, AASHTO load distribution factors given in AASHTO standard design specification [AASHTO 1996] were also used to analyze the deck system. The total bending moment is distributed to different stringers based on the distribution factors given in the specifications. The total bending moment is calculated considering the stringers are simply supported.
4.5.4 Deck Analyses Discussion and Results
The bridge floor deck was analyzed for dead load, and an H15 truck load. The HS20 truck was not considered, as preliminary load rating for the deck was quite smaller than HS20.
The two-dimensional model with spring supports was simple to construct and to analyze. The results obtained matched well with the results obtained from the three-dimensional model. The three-dimensional model is fairly complex and hence care is required in constructing the model. The output from this model is quite large and time consuming to evaluate. However, the results obtained from the three-dimensional model are likely more reliable as compared to the other models. Due to the small torsional stiffness of the timber stringers and planks, the assumed torsional stiffness of these members used in the analysis had little impact on the final moments and shear forces. Consequently, adequate results can be obtained from the three-dimensional model by neglecting the torsional stiffness of the timber members. That is, in the computer model, the torsional constant for all planks and timber stringers can be set to zero.
In the 3-dimensional model, it is observed that the maximum bending moment in the stringer will develop when the rear wheel of the H15 truck is at mid-span. It was also observed that the maximum shear force in different stringers was developed for different rear wheel positions. For the stronger stringers (8” x 16” deep stringers), placing the rear wheel near the end of the span produced the maximum shear force. For the remaining stringers, placing the rear wheel at approximately three-quarters of the span produced the maximum shear force.
The hand method of analysis used for the deck is same as that given in the AASHTO specifications [AASHTO 1996], except that the distribution factors were obtained from the analyses of the 3-D model of the bridge deck. This method is very simple, fast and conservative for this particular type of decking system. The total load was distributed to both the larger stringers equally and an additional 6% of the total load was assigned to each smaller stringer, as described above. These distribution factors are applicable to the bending moment calculations only. For shear force calculation, the distribution is 50% to each of the two larger stringers, 20% to the central stringer, and 6% to each remaining stringer.
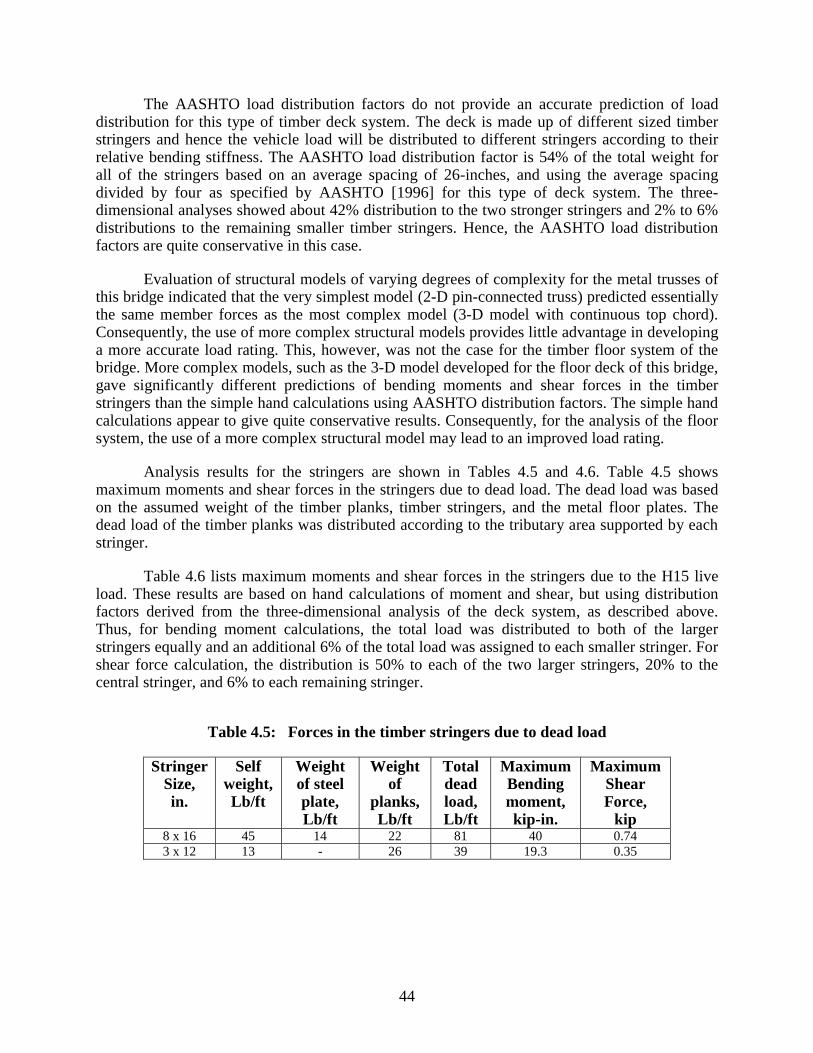
44
The AASHTO load distribution factors do not provide an accurate prediction of load distribution for this type of timber deck system. The deck is made up of different sized timber stringers and hence the vehicle load will be distributed to different stringers according to their relative bending stiffness. The AASHTO load distribution factor is 54% of the total weight for all of the stringers based on an average spacing of 26-inches, and using the average spacing divided by four as specified by AASHTO [1996] for this type of deck system. The three-dimensional analyses showed about 42% distribution to the two stronger stringers and 2% to 6% distributions to the remaining smaller timber stringers. Hence, the AASHTO load distribution factors are quite conservative in this case.
Evaluation of structural models of varying degrees of complexity for the metal trusses of this bridge indicated that the very simplest model (2-D pin-connected truss) predicted essentially the same member forces as the most complex model (3-D model with continuous top chord). Consequently, the use of more complex structural models provides little advantage in developing a more accurate load rating. This, however, was not the case for the timber floor system of the bridge. More complex models, such as the 3-D model developed for the floor deck of this bridge, gave significantly different predictions of bending moments and shear forces in the timber stringers than the simple hand calculations using AASHTO distribution factors. The simple hand calculations appear to give quite conservative results. Consequently, for the analysis of the floor system, the use of a more complex structural model may lead to an improved load rating.
Analysis results for the stringers are shown in Tables 4.5 and 4.6. Table 4.5 shows maximum moments and shear forces in the stringers due to dead load. The dead load was based on the assumed weight of the timber planks, timber stringers, and the metal floor plates. The dead load of the timber planks was distributed according to the tributary area supported by each stringer.
Table 4.6 lists maximum moments and shear forces in the stringers due to the H15 live load. These results are based on hand calculations of moment and shear, but using distribution factors derived from the three-dimensional analysis of the deck system, as described above. Thus, for bending moment calculations, the total load was distributed to both of the larger stringers equally and an additional 6% of the total load was assigned to each smaller stringer. For shear force calculation, the distribution is 50% to each of the two larger stringers, 20% to the central stringer, and 6% to each remaining stringer.
Table 4.5: Forces in the timber stringers due to dead load
Stringer Size, in.
Self weight, Lb/ft
Weightof steel plate, Lb/ft
Weightof
planks,Lb/ft
Total dead load,Lb/ft
Maximum Bending moment, kip-in.
Maximum Shear Force,
kip8 x 16 45 14 22 81 40 0.74 3 x 12 13 - 26 39 19.3 0.35
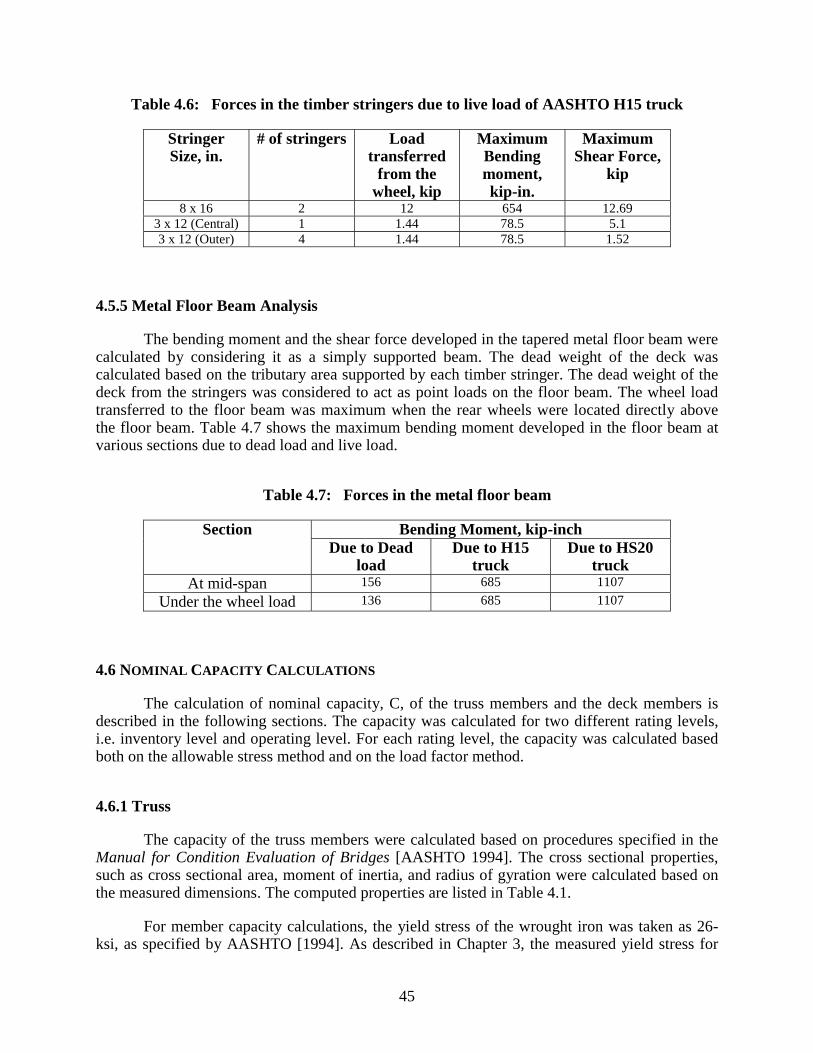
45
Table 4.6: Forces in the timber stringers due to live load of AASHTO H15 truck
Stringer Size, in.
# of stringers Load transferred
from the wheel, kip
Maximum Bending moment, kip-in.
Maximum Shear Force,
kip
8 x 16 2 12 654 12.69 3 x 12 (Central) 1 1.44 78.5 5.1 3 x 12 (Outer) 4 1.44 78.5 1.52
4.5.5 Metal Floor Beam Analysis
The bending moment and the shear force developed in the tapered metal floor beam were calculated by considering it as a simply supported beam. The dead weight of the deck was calculated based on the tributary area supported by each timber stringer. The dead weight of the deck from the stringers was considered to act as point loads on the floor beam. The wheel load transferred to the floor beam was maximum when the rear wheels were located directly above the floor beam. Table 4.7 shows the maximum bending moment developed in the floor beam at various sections due to dead load and live load.
Table 4.7: Forces in the metal floor beam
Bending Moment, kip-inch Section Due to Dead
loadDue to H15
truck Due to HS20
truck At mid-span 156 685 1107
Under the wheel load 136 685 1107
4.6 NOMINAL CAPACITY CALCULATIONS
The calculation of nominal capacity, C, of the truss members and the deck members is described in the following sections. The capacity was calculated for two different rating levels, i.e. inventory level and operating level. For each rating level, the capacity was calculated based both on the allowable stress method and on the load factor method.
4.6.1 Truss
The capacity of the truss members were calculated based on procedures specified in the Manual for Condition Evaluation of Bridges [AASHTO 1994]. The cross sectional properties, such as cross sectional area, moment of inertia, and radius of gyration were calculated based on the measured dimensions. The computed properties are listed in Table 4.1.
For member capacity calculations, the yield stress of the wrought iron was taken as 26-ksi, as specified by AASHTO [1994]. As described in Chapter 3, the measured yield stress for
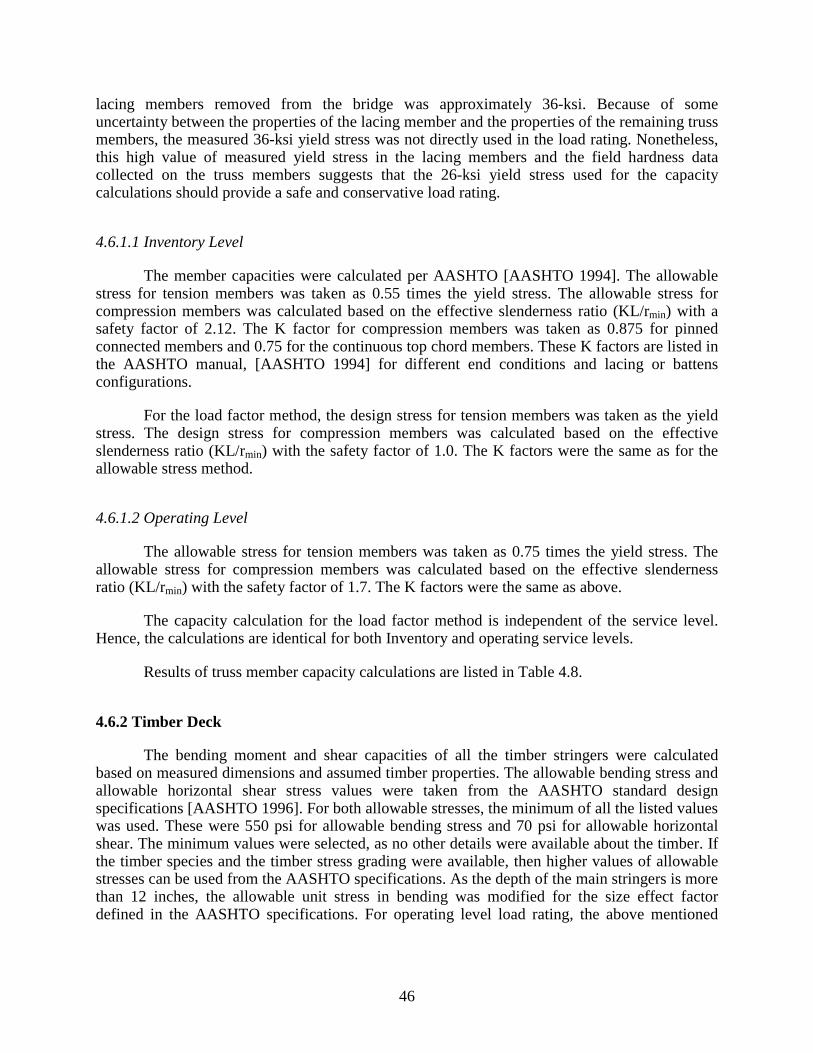
46
lacing members removed from the bridge was approximately 36-ksi. Because of some uncertainty between the properties of the lacing member and the properties of the remaining truss members, the measured 36-ksi yield stress was not directly used in the load rating. Nonetheless, this high value of measured yield stress in the lacing members and the field hardness data collected on the truss members suggests that the 26-ksi yield stress used for the capacity calculations should provide a safe and conservative load rating.
4.6.1.1 Inventory Level
The member capacities were calculated per AASHTO [AASHTO 1994]. The allowable stress for tension members was taken as 0.55 times the yield stress. The allowable stress for compression members was calculated based on the effective slenderness ratio (KL/rmin) with a safety factor of 2.12. The K factor for compression members was taken as 0.875 for pinned connected members and 0.75 for the continuous top chord members. These K factors are listed in the AASHTO manual, [AASHTO 1994] for different end conditions and lacing or battens configurations.
For the load factor method, the design stress for tension members was taken as the yield stress. The design stress for compression members was calculated based on the effective slenderness ratio (KL/rmin) with the safety factor of 1.0. The K factors were the same as for the allowable stress method.
4.6.1.2 Operating Level
The allowable stress for tension members was taken as 0.75 times the yield stress. The allowable stress for compression members was calculated based on the effective slenderness ratio (KL/rmin) with the safety factor of 1.7. The K factors were the same as above.
The capacity calculation for the load factor method is independent of the service level. Hence, the calculations are identical for both Inventory and operating service levels.
Results of truss member capacity calculations are listed in Table 4.8.
4.6.2 Timber Deck
The bending moment and shear capacities of all the timber stringers were calculated based on measured dimensions and assumed timber properties. The allowable bending stress and allowable horizontal shear stress values were taken from the AASHTO standard design specifications [AASHTO 1996]. For both allowable stresses, the minimum of all the listed values was used. These were 550 psi for allowable bending stress and 70 psi for allowable horizontal shear. The minimum values were selected, as no other details were available about the timber. If the timber species and the timber stress grading were available, then higher values of allowable stresses can be used from the AASHTO specifications. As the depth of the main stringers is more than 12 inches, the allowable unit stress in bending was modified for the size effect factor defined in the AASHTO specifications. For operating level load rating, the above mentioned
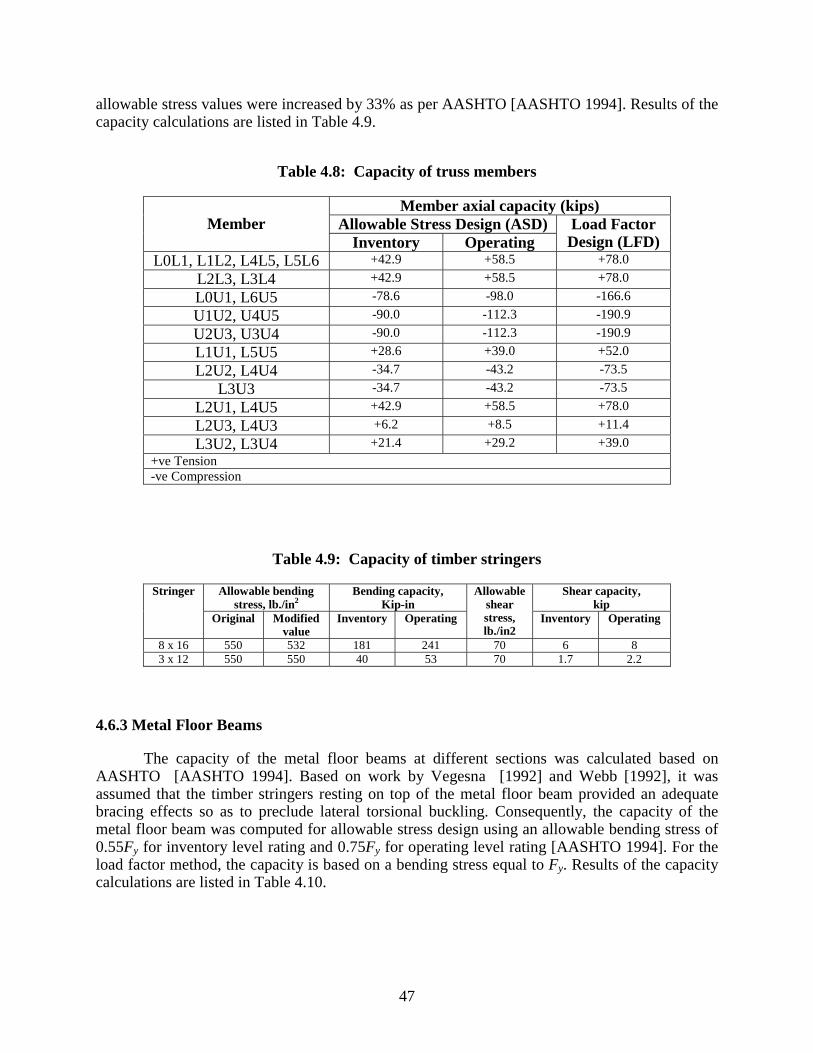
47
allowable stress values were increased by 33% as per AASHTO [AASHTO 1994]. Results of the capacity calculations are listed in Table 4.9.
Table 4.8: Capacity of truss members
Member axial capacity (kips) Allowable Stress Design (ASD) Member
Inventory Operating Load Factor
Design (LFD) L0L1, L1L2, L4L5, L5L6 +42.9 +58.5 +78.0
L2L3, L3L4 +42.9 +58.5 +78.0 L0U1, L6U5 -78.6 -98.0 -166.6 U1U2, U4U5 -90.0 -112.3 -190.9 U2U3, U3U4 -90.0 -112.3 -190.9 L1U1, L5U5 +28.6 +39.0 +52.0 L2U2, L4U4 -34.7 -43.2 -73.5
L3U3 -34.7 -43.2 -73.5 L2U1, L4U5 +42.9 +58.5 +78.0 L2U3, L4U3 +6.2 +8.5 +11.4 L3U2, L3U4 +21.4 +29.2 +39.0
+ve Tension -ve Compression
Table 4.9: Capacity of timber stringers
Allowable bending stress, lb./in2
Bending capacity, Kip-in
Shear capacity, kip
Stringer
Original Modified value
Inventory Operating
Allowable shear stress, lb./in2
Inventory Operating
8 x 16 550 532 181 241 70 6 8 3 x 12 550 550 40 53 70 1.7 2.2
4.6.3 Metal Floor Beams
The capacity of the metal floor beams at different sections was calculated based on AASHTO [AASHTO 1994]. Based on work by Vegesna [1992] and Webb [1992], it was assumed that the timber stringers resting on top of the metal floor beam provided an adequate bracing effects so as to preclude lateral torsional buckling. Consequently, the capacity of the metal floor beam was computed for allowable stress design using an allowable bending stress of 0.55Fy for inventory level rating and 0.75Fy for operating level rating [AASHTO 1994]. For the load factor method, the capacity is based on a bending stress equal to Fy. Results of the capacity calculations are listed in Table 4.10.
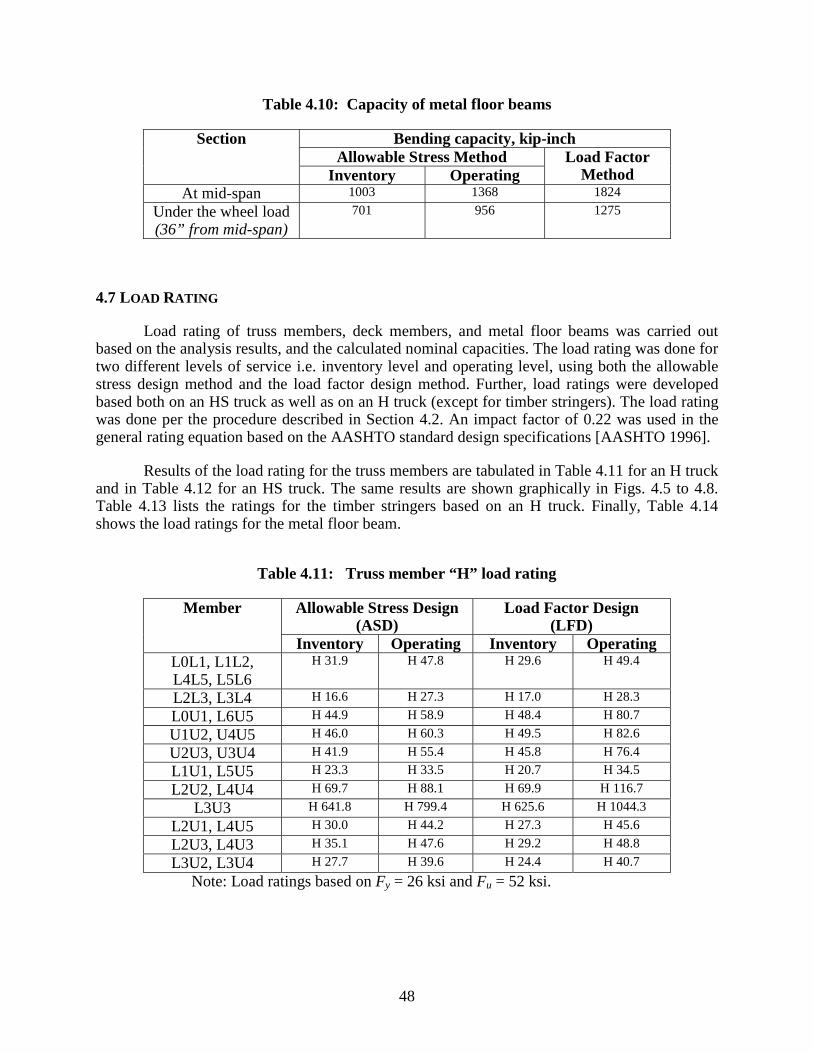
48
Table 4.10: Capacity of metal floor beams
Bending capacity, kip-inch Allowable Stress Method
Section
Inventory Operating Load Factor
Method At mid-span 1003 1368 1824
Under the wheel load (36” from mid-span)
701 956 1275
4.7 LOAD RATING
Load rating of truss members, deck members, and metal floor beams was carried out based on the analysis results, and the calculated nominal capacities. The load rating was done for two different levels of service i.e. inventory level and operating level, using both the allowable stress design method and the load factor design method. Further, load ratings were developed based both on an HS truck as well as on an H truck (except for timber stringers). The load rating was done per the procedure described in Section 4.2. An impact factor of 0.22 was used in the general rating equation based on the AASHTO standard design specifications [AASHTO 1996].
Results of the load rating for the truss members are tabulated in Table 4.11 for an H truck and in Table 4.12 for an HS truck. The same results are shown graphically in Figs. 4.5 to 4.8. Table 4.13 lists the ratings for the timber stringers based on an H truck. Finally, Table 4.14 shows the load ratings for the metal floor beam.
Table 4.11: Truss member “H” load rating
Allowable Stress Design (ASD)
Load Factor Design (LFD)
Member
Inventory Operating Inventory Operating L0L1, L1L2, L4L5, L5L6
H 31.9 H 47.8 H 29.6 H 49.4
L2L3, L3L4 H 16.6 H 27.3 H 17.0 H 28.3 L0U1, L6U5 H 44.9 H 58.9 H 48.4 H 80.7 U1U2, U4U5 H 46.0 H 60.3 H 49.5 H 82.6 U2U3, U3U4 H 41.9 H 55.4 H 45.8 H 76.4 L1U1, L5U5 H 23.3 H 33.5 H 20.7 H 34.5 L2U2, L4U4 H 69.7 H 88.1 H 69.9 H 116.7
L3U3 H 641.8 H 799.4 H 625.6 H 1044.3 L2U1, L4U5 H 30.0 H 44.2 H 27.3 H 45.6 L2U3, L4U3 H 35.1 H 47.6 H 29.2 H 48.8 L3U2, L3U4 H 27.7 H 39.6 H 24.4 H 40.7
Note: Load ratings based on Fy = 26 ksi and Fu = 52 ksi.
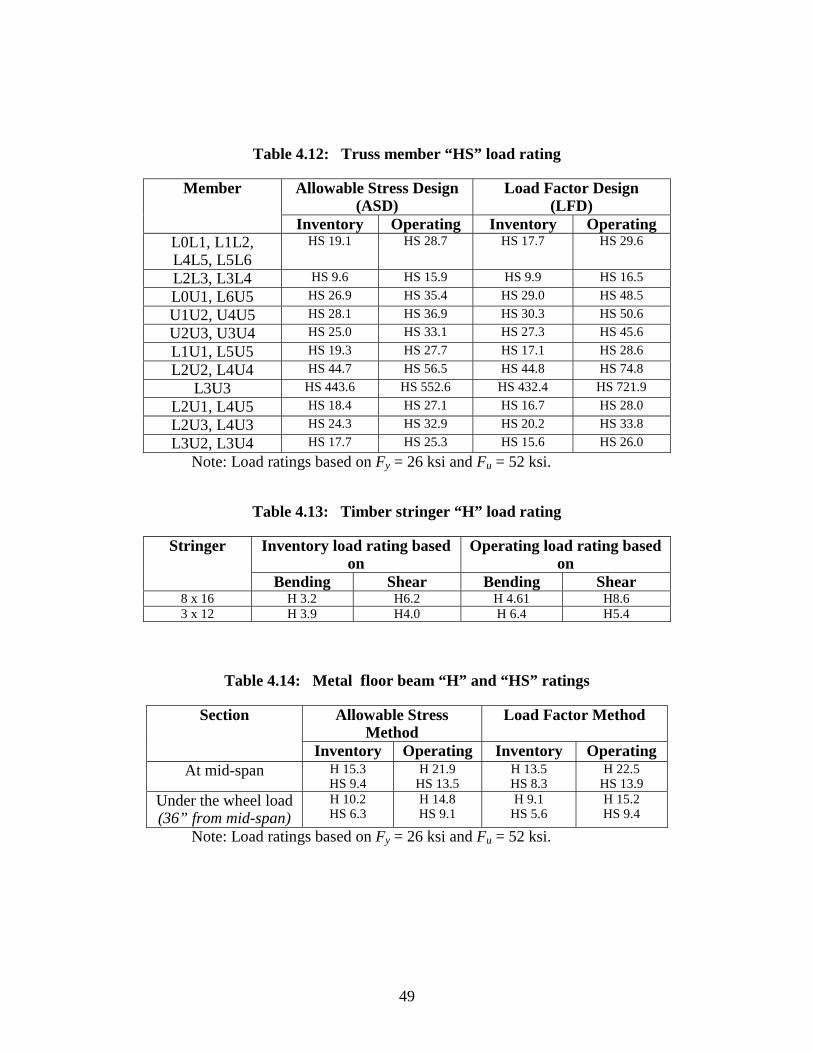
49
Table 4.12: Truss member “HS” load rating
Allowable Stress Design (ASD)
Load Factor Design (LFD)
Member
Inventory Operating Inventory Operating L0L1, L1L2, L4L5, L5L6
HS 19.1 HS 28.7 HS 17.7 HS 29.6
L2L3, L3L4 HS 9.6 HS 15.9 HS 9.9 HS 16.5 L0U1, L6U5 HS 26.9 HS 35.4 HS 29.0 HS 48.5 U1U2, U4U5 HS 28.1 HS 36.9 HS 30.3 HS 50.6 U2U3, U3U4 HS 25.0 HS 33.1 HS 27.3 HS 45.6 L1U1, L5U5 HS 19.3 HS 27.7 HS 17.1 HS 28.6 L2U2, L4U4 HS 44.7 HS 56.5 HS 44.8 HS 74.8
L3U3 HS 443.6 HS 552.6 HS 432.4 HS 721.9 L2U1, L4U5 HS 18.4 HS 27.1 HS 16.7 HS 28.0 L2U3, L4U3 HS 24.3 HS 32.9 HS 20.2 HS 33.8 L3U2, L3U4 HS 17.7 HS 25.3 HS 15.6 HS 26.0
Note: Load ratings based on Fy = 26 ksi and Fu = 52 ksi.
Table 4.13: Timber stringer “H” load rating
Inventory load rating based on
Operating load rating based on
Stringer
Bending Shear Bending Shear 8 x 16 H 3.2 H6.2 H 4.61 H8.6 3 x 12 H 3.9 H4.0 H 6.4 H5.4
Table 4.14: Metal floor beam “H” and “HS” ratings
Allowable Stress Method
Load Factor Method Section
Inventory Operating Inventory Operating At mid-span H 15.3
HS 9.4 H 21.9
HS 13.5 H 13.5 HS 8.3
H 22.5 HS 13.9
Under the wheel load (36” from mid-span)
H 10.2 HS 6.3
H 14.8 HS 9.1
H 9.1 HS 5.6
H 15.2 HS 9.4
Note: Load ratings based on Fy = 26 ksi and Fu = 52 ksi.
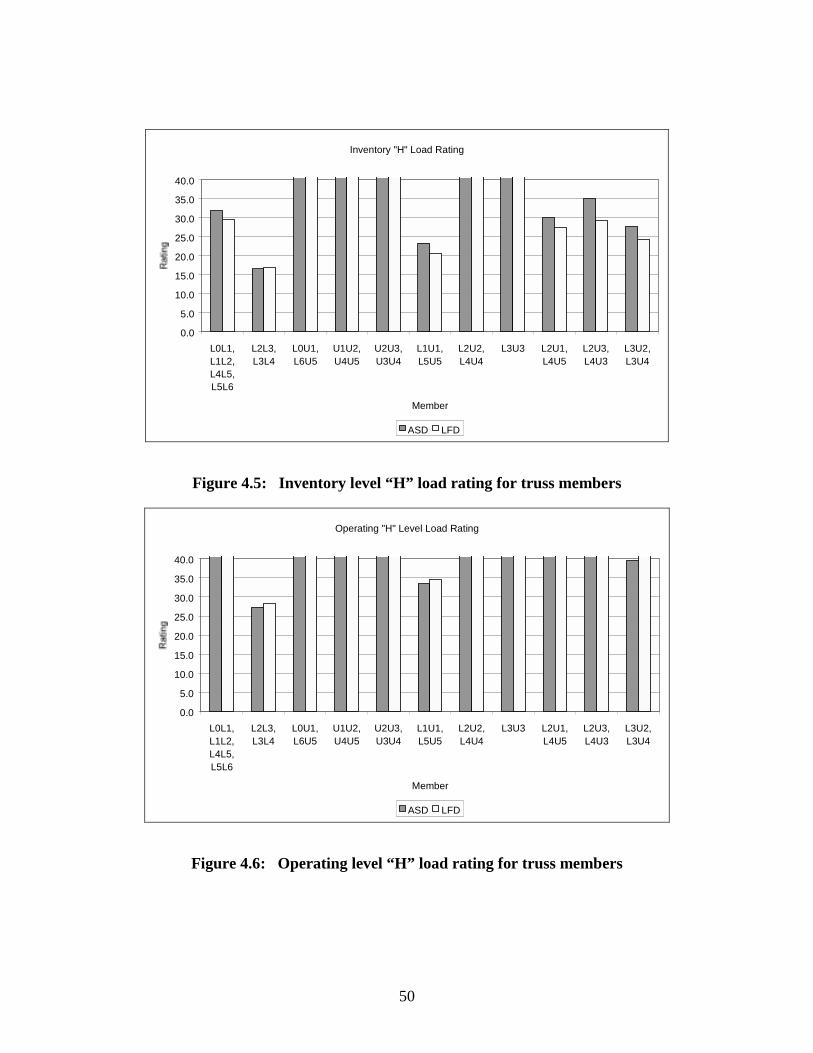
50
Inventory "H" Load Rating
0.0
5.0
10.0
15.0
20.0
25.0
30.0
35.0
40.0
L0L1,L1L2,L4L5,L5L6
L2L3,L3L4
L0U1,L6U5
U1U2,U4U5
U2U3,U3U4
L1U1,L5U5
L2U2,L4U4
L3U3 L2U1,L4U5
L2U3,L4U3
L3U2,L3U4
Member
ASD LFD
Figure 4.5: Inventory level “H” load rating for truss members
Operating "H" Level Load Rating
0.0
5.0
10.0
15.0
20.0
25.0
30.0
35.0
40.0
L0L1,L1L2,L4L5,L5L6
L2L3,L3L4
L0U1,L6U5
U1U2,U4U5
U2U3,U3U4
L1U1,L5U5
L2U2,L4U4
L3U3 L2U1,L4U5
L2U3,L4U3
L3U2,L3U4
Member
ASD LFD
Figure 4.6: Operating level “H” load rating for truss members
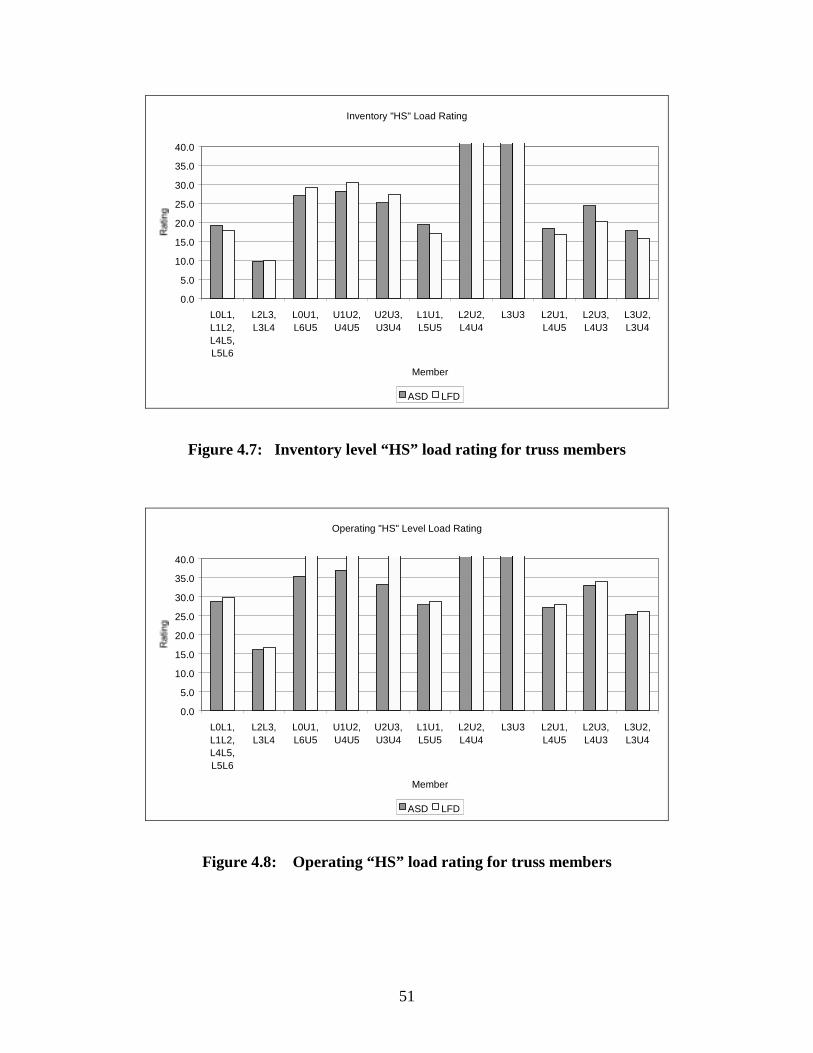
51
Inventory "HS" Load Rating
0.0
5.0
10.0
15.0
20.0
25.0
30.0
35.0
40.0
L0L1,L1L2,L4L5,L5L6
L2L3,L3L4
L0U1,L6U5
U1U2,U4U5
U2U3,U3U4
L1U1,L5U5
L2U2,L4U4
L3U3 L2U1,L4U5
L2U3,L4U3
L3U2,L3U4
Member
ASD LFD
Figure 4.7: Inventory level “HS” load rating for truss members
Operating "HS" Level Load Rating
0.0
5.0
10.0
15.0
20.0
25.0
30.0
35.0
40.0
L0L1,L1L2,L4L5,L5L6
L2L3,L3L4
L0U1,L6U5
U1U2,U4U5
U2U3,U3U4
L1U1,L5U5
L2U2,L4U4
L3U3 L2U1,L4U5
L2U3,L4U3
L3U2,L3U4
Member
ASD LFD
Figure 4.8: Operating “HS” load rating for truss members
52
4.8 DISCUSSION OF LOAD RATINGS
Several observations of interest can be made from the load rating data presented in the previous section. One item of interest is a comparison between the ratings using allowable stress design (ASD) versus load factor design (LFD). Both methods were used for rating the truss members and the metal floor beams (only allowable stress design was used for the timber stringers). This comparison was made to determine if one method provided consistently higher ratings than the other. As can be seen from the ratings data in Section 4.7, neither method gives consistently higher or lower ratings. For the majority of the members of this bridge, the ASD ratings were quite close to the LFD ratings. In some cases, LFD gave slightly higher ratings, whereas in other cases, ASD gave slightly higher ratings. Consequently, there was no significant or consistent difference between the ASD and the LFD ratings. For the discussion that follows, ASD ratings will be examined, as ASD represents the most common design method currently used for rating truss bridges. Further, emphasis will be placed on inventory level ratings, as these are most comparable to the design standards used for new bridges.
The inventory level ASD ratings for the truss members are listed in Tables 4.11 and 4.12, and are shown graphically in Figs. 4.5 to 4.8. Recall that the member capacities were based on a conservative estimate of yield stress of 26-ksi (versus the measured yield stress of 36-ksi). Examining the “H” ratings first, it can be seen that all truss members rate greater than H15. This suggests that despite its age, the main truss possesses substantial structural capacity. The lowest rating of all truss members was H16.6, for members L2L3 and L3L4. These are the central lower chord members, which are constructed of eyebars. One possible rehabilitation goal for this bridge, as discussed in Chapter 6, might be to achieve an H15 rating for the entire bridge. For this goal, no strengthening measures would be required for the truss members.
Examining the inventory level ASD ratings for the truss members for an “HS” truck (Table 4.12) reveals that a number of truss members rate below HS20. The lowest rating, HS 9.6, occurs for members L2L3 and L3L4, as above. The next lowest rating is HS17.7 for members L3U2 and L4U3. These are diagonal tension members. Based on these ratings, it appears that substantial strengthening measures would be required to develop an HS 20 rating for this bridge. However, an HS10 rating can be justified for the truss members without the need for strengthening measures. Although the central bottom chord members currently rate as HS9.6, the small increase in capacity required to achieve HS10 can be justified on the basis of the materials evaluation described in Chapter 3.
The inventory level ASD rating for the metal floor beams (Table 4.14) based on an “H” truck is H10.2. Based on an “HS” truck, the rating is HS6.3. Consequently, of all metal components of the bridge (truss members and floor beams), the floor beams have the lowest load rating. However, as described in Chapter 6, simple strengthening measures for the floor beams can be implemented to bring their rating to a level comparable with the truss members.
Finally, the inventory level ASD load rating for the timber stringers was H3.2 (Table 4.13), contolled by the bending capacity of the 8″ ×12″ members. This represents the lowest rating for any portion of this bridge.
Based on the results discussed above, the current load rating for the Shackelford County Bridge, based on its current condition, is H3.2. This is controlled by the timber stringers and is substantially smaller than the ratings for the metal components of the bridge. At least two options
53
are available to address the very low rating caused by the timber deck. The first option is to conduct a more thorough materials evaluation for the timber stringers. As discussed in Chapter 3, through materials testing and through visual stress grading by a wood specialist, it may be possible to justify substantially higher allowable stresses for the timber and thereby substantially increase the load rating for the timber stringers. Alternatively, since the current timber deck is deteriorated, another option would be to replace the deck with a new deck. This second option is considered in Chapter 6.
Assuming that the timber deck is replaced, the next member controlling the load rating for this bridge are the tapered metal floor beams. However, as discussed in Chapter 6, these beams can likely be strengthened using simple methods such as cover plating.
Finally, if the metal floor beams are strengthened, then the central bottom chord truss members will be the controlling elements for the bridge’s load rating. Strengthening the main truss, as compared to strengthening the floor beams or replacing the timber deck, likely represents a costly undertaking with significant preservation implications. Consequently, the main truss members represent the most critical element of a preservation plan for the Shackelford County case study bridge. The load rating for the truss members has been based on standard structural analysis and load rating techniques, as described in this chapter. To determine if the main truss members are, in fact, responding as predicted using standard analysis techniques, a series of field load tests were conducted on the bridge. These tests are described in the following chapter.

54
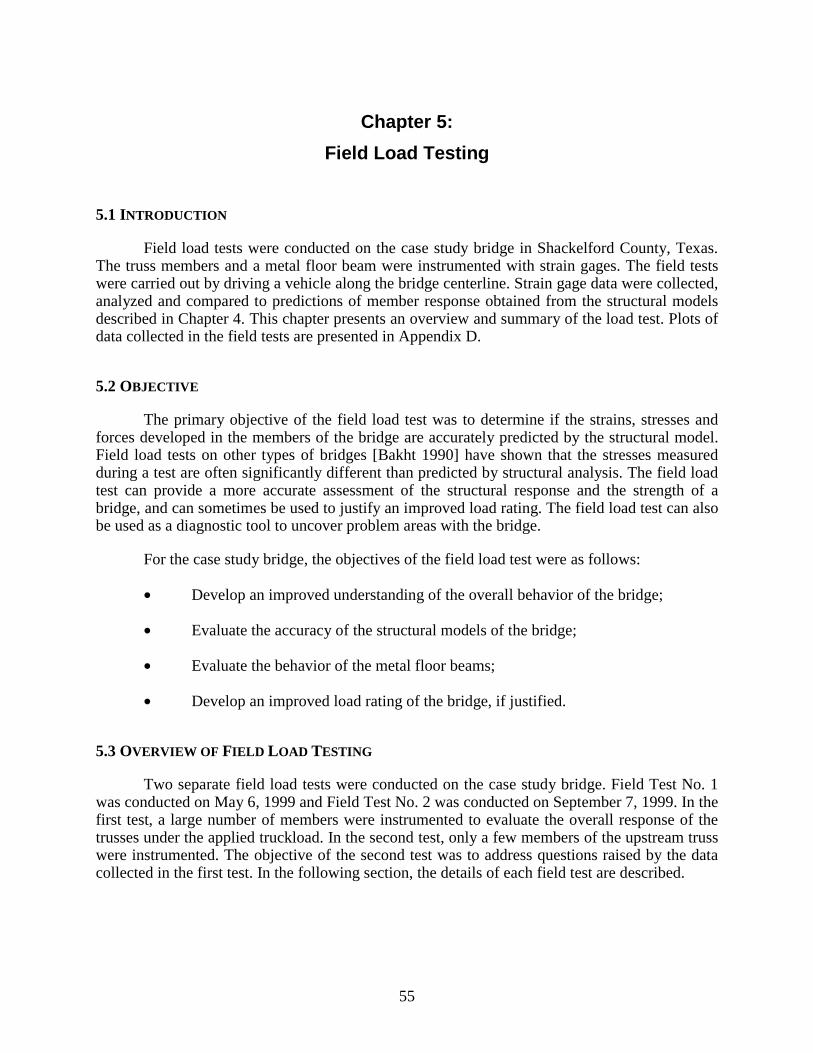
55
Chapter 5: Field Load Testing
5.1 INTRODUCTION
Field load tests were conducted on the case study bridge in Shackelford County, Texas. The truss members and a metal floor beam were instrumented with strain gages. The field tests were carried out by driving a vehicle along the bridge centerline. Strain gage data were collected, analyzed and compared to predictions of member response obtained from the structural models described in Chapter 4. This chapter presents an overview and summary of the load test. Plots of data collected in the field tests are presented in Appendix D.
5.2 OBJECTIVE
The primary objective of the field load test was to determine if the strains, stresses and forces developed in the members of the bridge are accurately predicted by the structural model. Field load tests on other types of bridges [Bakht 1990] have shown that the stresses measured during a test are often significantly different than predicted by structural analysis. The field load test can provide a more accurate assessment of the structural response and the strength of a bridge, and can sometimes be used to justify an improved load rating. The field load test can also be used as a diagnostic tool to uncover problem areas with the bridge.
For the case study bridge, the objectives of the field load test were as follows:
• Develop an improved understanding of the overall behavior of the bridge;
• Evaluate the accuracy of the structural models of the bridge;
• Evaluate the behavior of the metal floor beams;
• Develop an improved load rating of the bridge, if justified.
5.3 OVERVIEW OF FIELD LOAD TESTING
Two separate field load tests were conducted on the case study bridge. Field Test No. 1 was conducted on May 6, 1999 and Field Test No. 2 was conducted on September 7, 1999. In the first test, a large number of members were instrumented to evaluate the overall response of the trusses under the applied truckload. In the second test, only a few members of the upstream truss were instrumented. The objective of the second test was to address questions raised by the data collected in the first test. In the following section, the details of each field test are described.
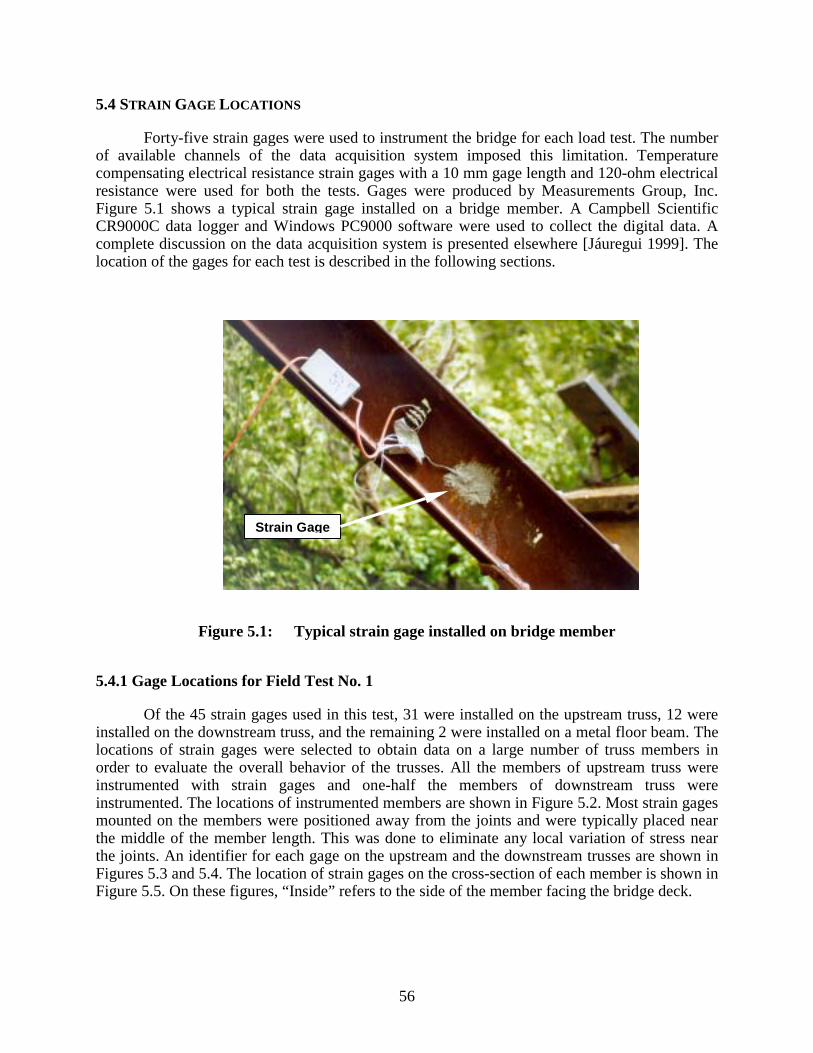
56
5.4 STRAIN GAGE LOCATIONS
Forty-five strain gages were used to instrument the bridge for each load test. The number of available channels of the data acquisition system imposed this limitation. Temperature compensating electrical resistance strain gages with a 10 mm gage length and 120-ohm electrical resistance were used for both the tests. Gages were produced by Measurements Group, Inc. Figure 5.1 shows a typical strain gage installed on a bridge member. A Campbell Scientific CR9000C data logger and Windows PC9000 software were used to collect the digital data. A complete discussion on the data acquisition system is presented elsewhere [Jáuregui 1999]. The location of the gages for each test is described in the following sections.
Figure 5.1: Typical strain gage installed on bridge member
5.4.1 Gage Locations for Field Test No. 1
Of the 45 strain gages used in this test, 31 were installed on the upstream truss, 12 were installed on the downstream truss, and the remaining 2 were installed on a metal floor beam. The locations of strain gages were selected to obtain data on a large number of truss members in order to evaluate the overall behavior of the trusses. All the members of upstream truss were instrumented with strain gages and one-half the members of downstream truss were instrumented. The locations of instrumented members are shown in Figure 5.2. Most strain gages mounted on the members were positioned away from the joints and were typically placed near the middle of the member length. This was done to eliminate any local variation of stress near the joints. An identifier for each gage on the upstream and the downstream trusses are shown in Figures 5.3 and 5.4. The location of strain gages on the cross-section of each member is shown in Figure 5.5. On these figures, “Inside” refers to the side of the member facing the bridge deck.
Strain Gage
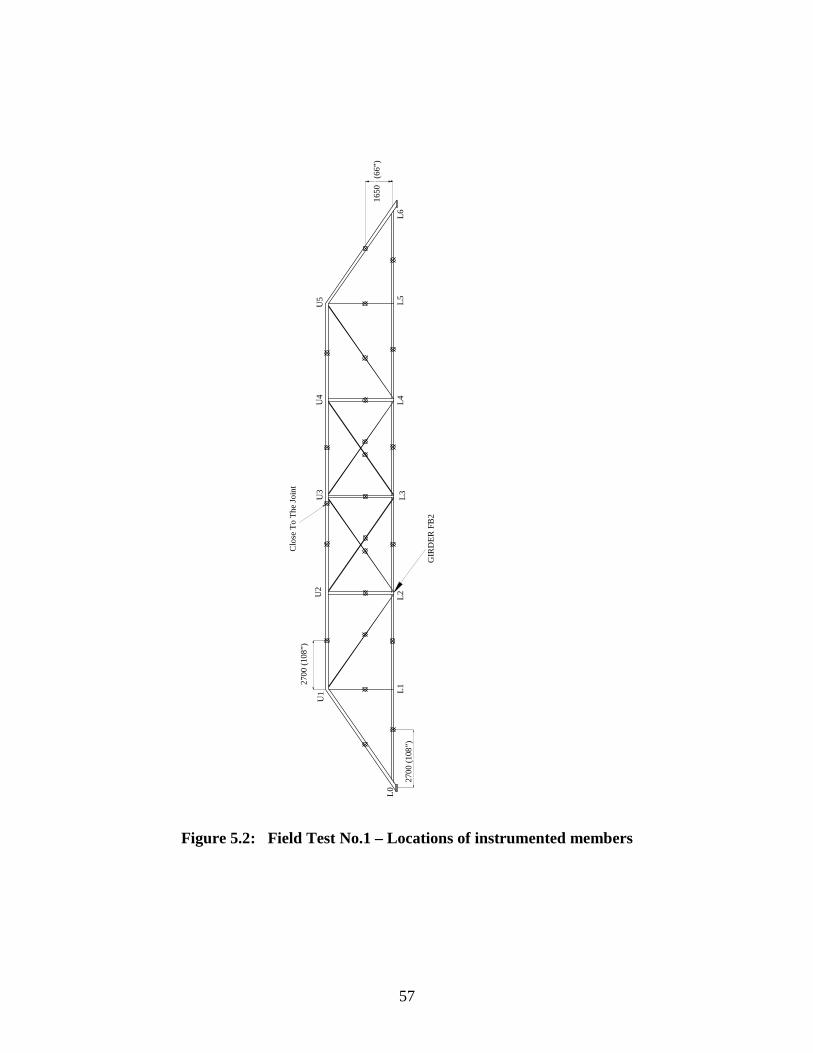
57
L0L1
U1
U5 L5
L2L3
U2
U3
L4U4
L627
00 (1
08”)
GIR
DER
FB
2
Clo
se T
oTh
e Jo
int
1650
(6
6”)
2700
(108
”)
Figure 5.2: Field Test No.1 – Locations of instrumented members
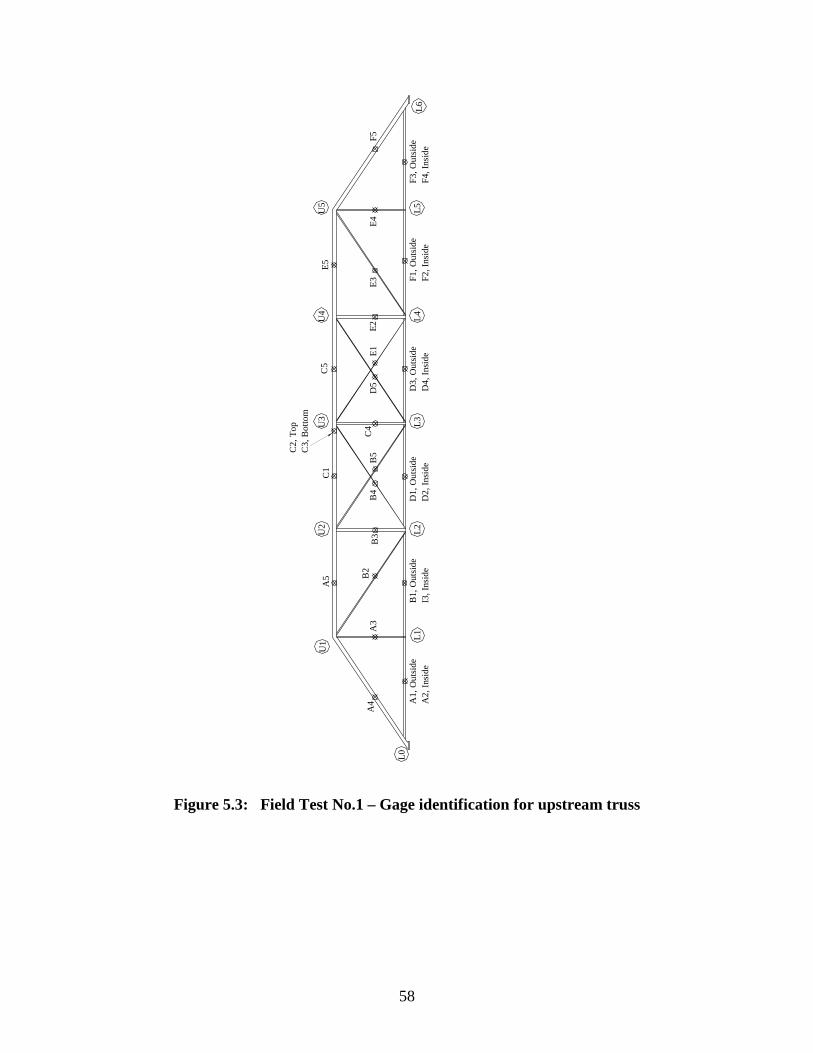
58
L0
U1 L1
U5
U4
U3
U2
L5L2
L3L4
L6A
1, O
utsi
deA
2, In
side
A3
A4
B2
B3
B4
B5
B1,
Out
side
I3, I
nsid
eD
1, O
utsi
deD
2, In
side
C4
E1E2
E3E4
F5
A5
C2,
Top
C3,
Bot
tom
C1
C5
E5
D3,
Out
side
D4,
Insi
de
D5
F1, O
utsi
deF2
, Ins
ide
F3, O
utsi
deF4
, Ins
ide
Figure 5.3: Field Test No.1 – Gage identification for upstream truss
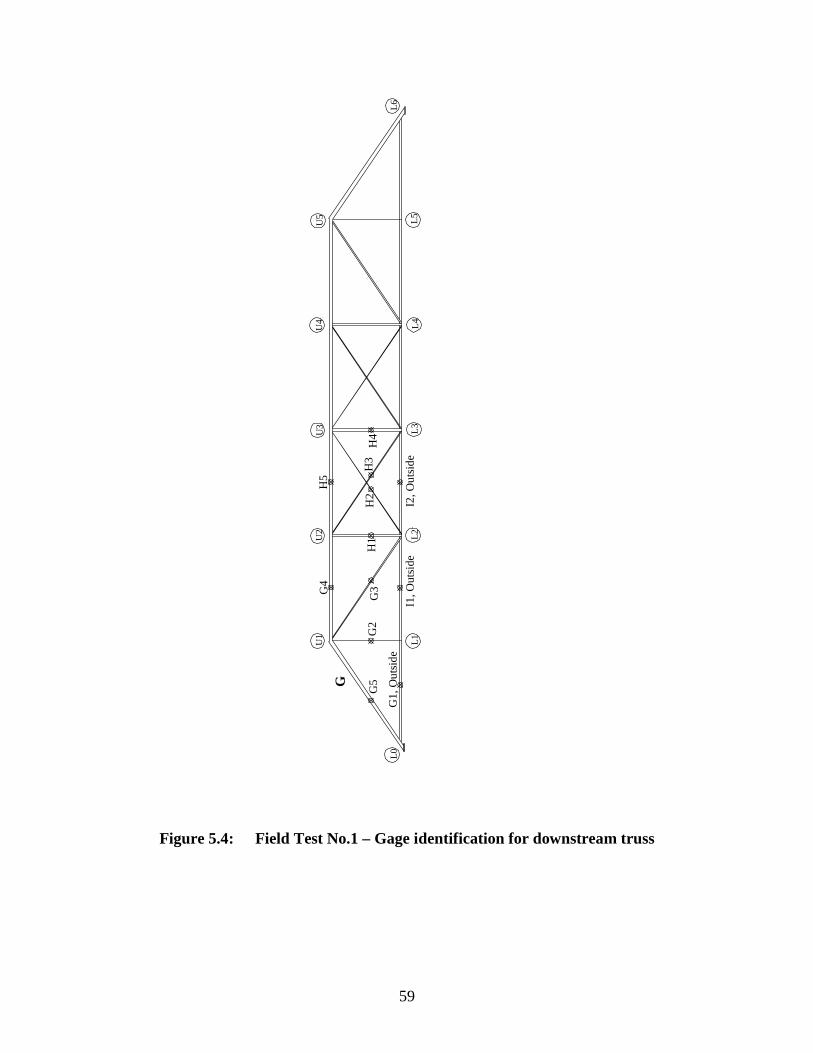
59
L0
L4L3
L2L1U
1U
2U
3U
4
L6
L5U5
G5
G1,
Out
side
G2
G4
G3
I1, O
utsi
de
H1
H2
H3
I2, O
utsi
de
H5
H4
G
Figure 5.4: Field Test No.1 – Gage identification for downstream truss
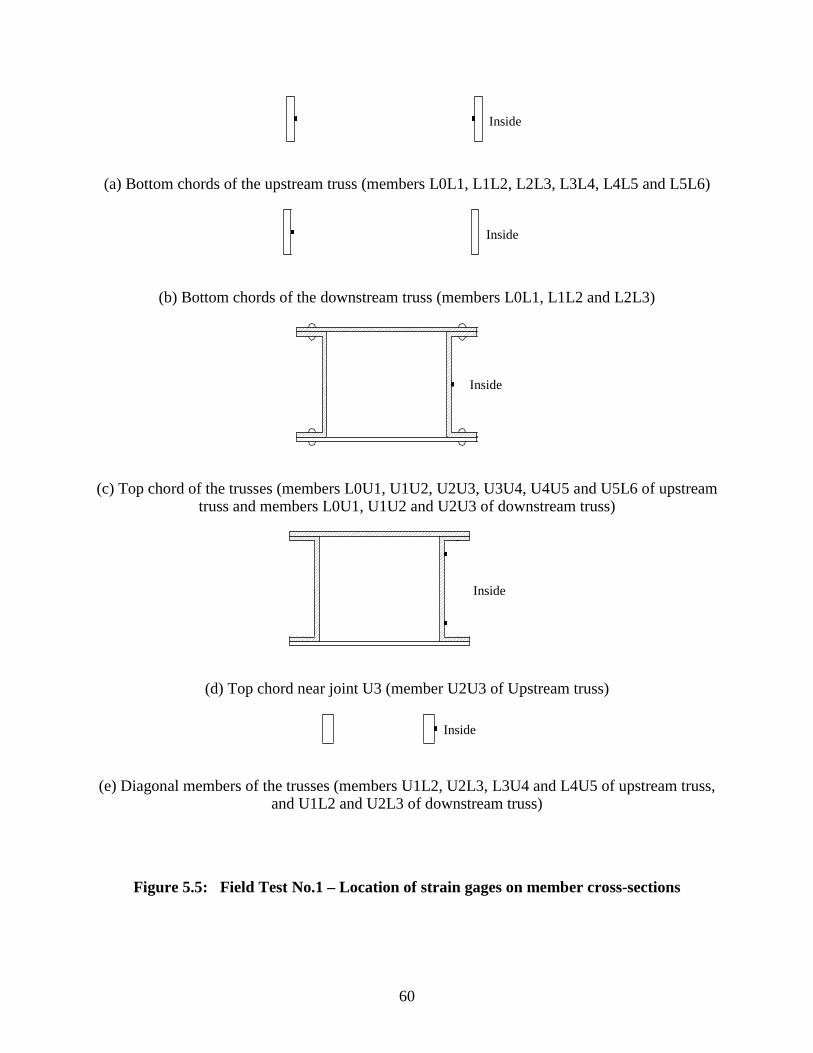
60
Inside
(a) Bottom chords of the upstream truss (members L0L1, L1L2, L2L3, L3L4, L4L5 and L5L6)
Inside
(b) Bottom chords of the downstream truss (members L0L1, L1L2 and L2L3)
Inside
(c) Top chord of the trusses (members L0U1, U1U2, U2U3, U3U4, U4U5 and U5L6 of upstream truss and members L0U1, U1U2 and U2U3 of downstream truss)
Inside
(d) Top chord near joint U3 (member U2U3 of Upstream truss)
Inside
(e) Diagonal members of the trusses (members U1L2, U2L3, L3U4 and L4U5 of upstream truss, and U1L2 and U2L3 of downstream truss)
Figure 5.5: Field Test No.1 – Location of strain gages on member cross-sections
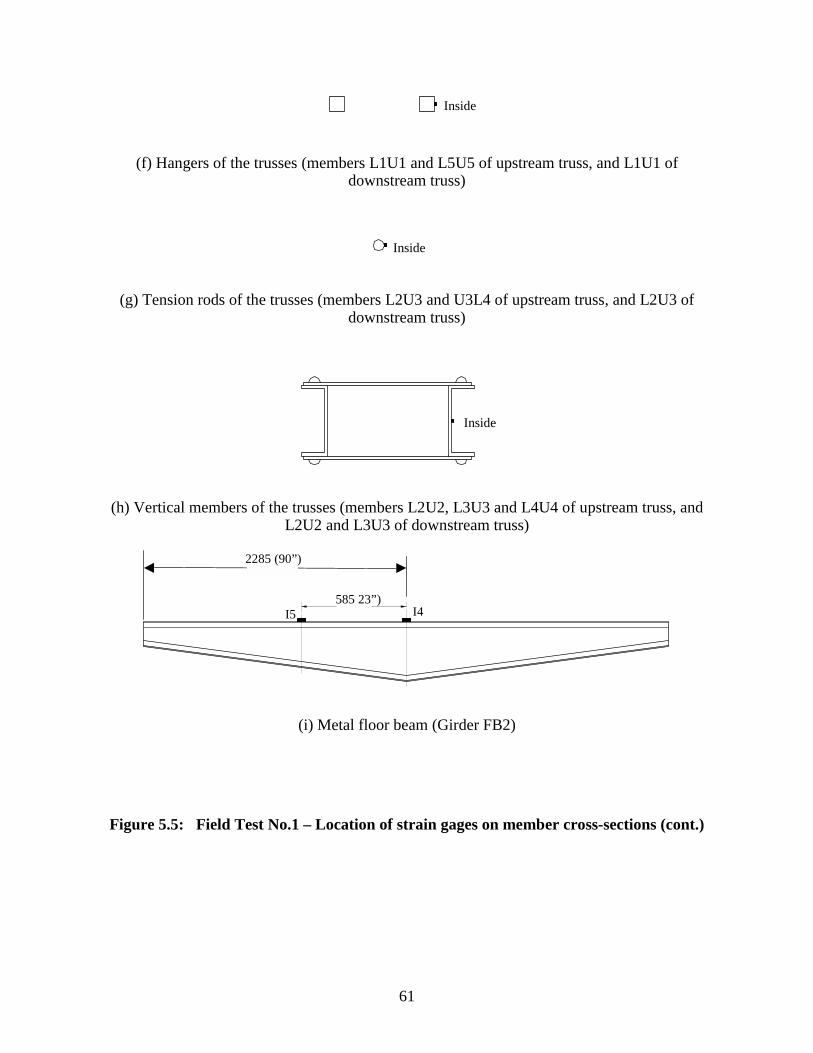
61
Inside
(f) Hangers of the trusses (members L1U1 and L5U5 of upstream truss, and L1U1 of downstream truss)
Inside
(g) Tension rods of the trusses (members L2U3 and U3L4 of upstream truss, and L2U3 of downstream truss)
Inside
(h) Vertical members of the trusses (members L2U2, L3U3 and L4U4 of upstream truss, and L2U2 and L3U3 of downstream truss)
585 23”) I5 I4
2285 (90”)
(i) Metal floor beam (Girder FB2)
Figure 5.5: Field Test No.1 – Location of strain gages on member cross-sections (cont.)
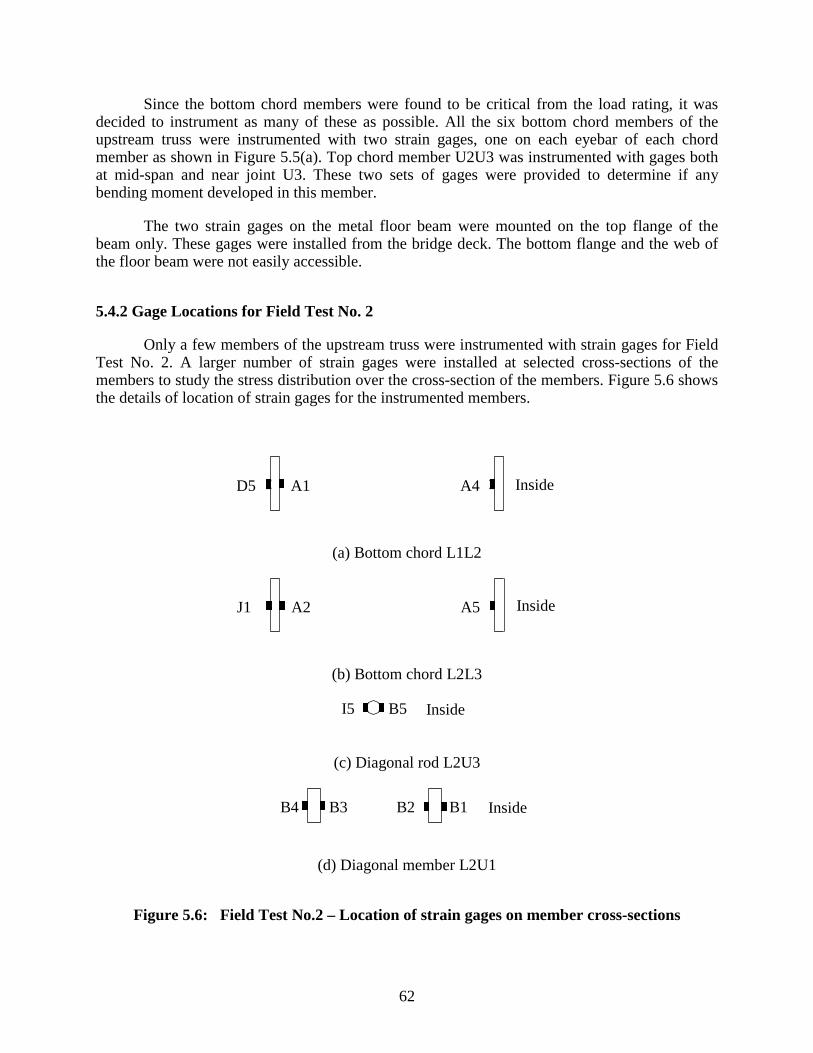
62
Since the bottom chord members were found to be critical from the load rating, it was decided to instrument as many of these as possible. All the six bottom chord members of the upstream truss were instrumented with two strain gages, one on each eyebar of each chord member as shown in Figure 5.5(a). Top chord member U2U3 was instrumented with gages both at mid-span and near joint U3. These two sets of gages were provided to determine if any bending moment developed in this member.
The two strain gages on the metal floor beam were mounted on the top flange of the beam only. These gages were installed from the bridge deck. The bottom flange and the web of the floor beam were not easily accessible.
5.4.2 Gage Locations for Field Test No. 2
Only a few members of the upstream truss were instrumented with strain gages for Field Test No. 2. A larger number of strain gages were installed at selected cross-sections of the members to study the stress distribution over the cross-section of the members. Figure 5.6 shows the details of location of strain gages for the instrumented members.
A1 A4D5 Inside
(a) Bottom chord L1L2
InsideJ1 A5A2
(b) Bottom chord L2L3
InsideB5I5
(c) Diagonal rod L2U3
InsideB1B3 B2B4
(d) Diagonal member L2U1
Figure 5.6: Field Test No.2 – Location of strain gages on member cross-sections
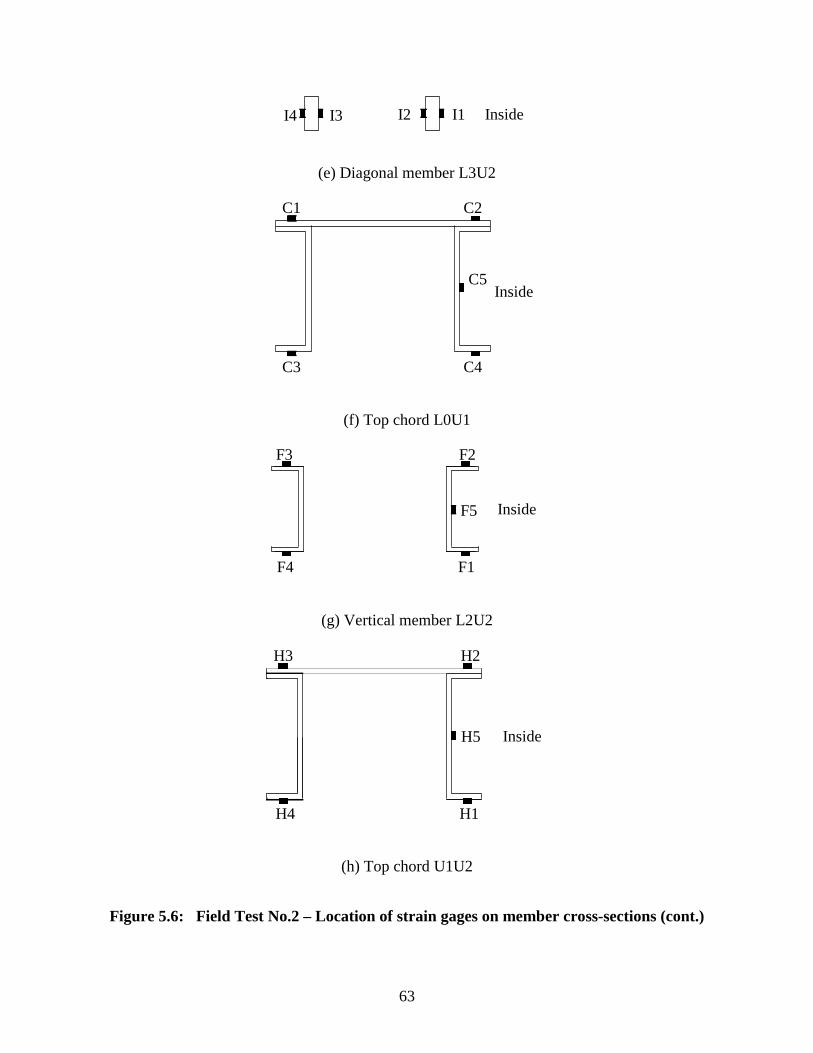
63
InsideI1I3 I2I4
(e) Diagonal member L3U2
Inside
C1 C2
C3 C4
C5
(f) Top chord L0U1
InsideF5
F2
F1
F3
F4
(g) Vertical member L2U2
InsideH5
H2
H1
H3
H4
(h) Top chord U1U2
Figure 5.6: Field Test No.2 – Location of strain gages on member cross-sections (cont.)
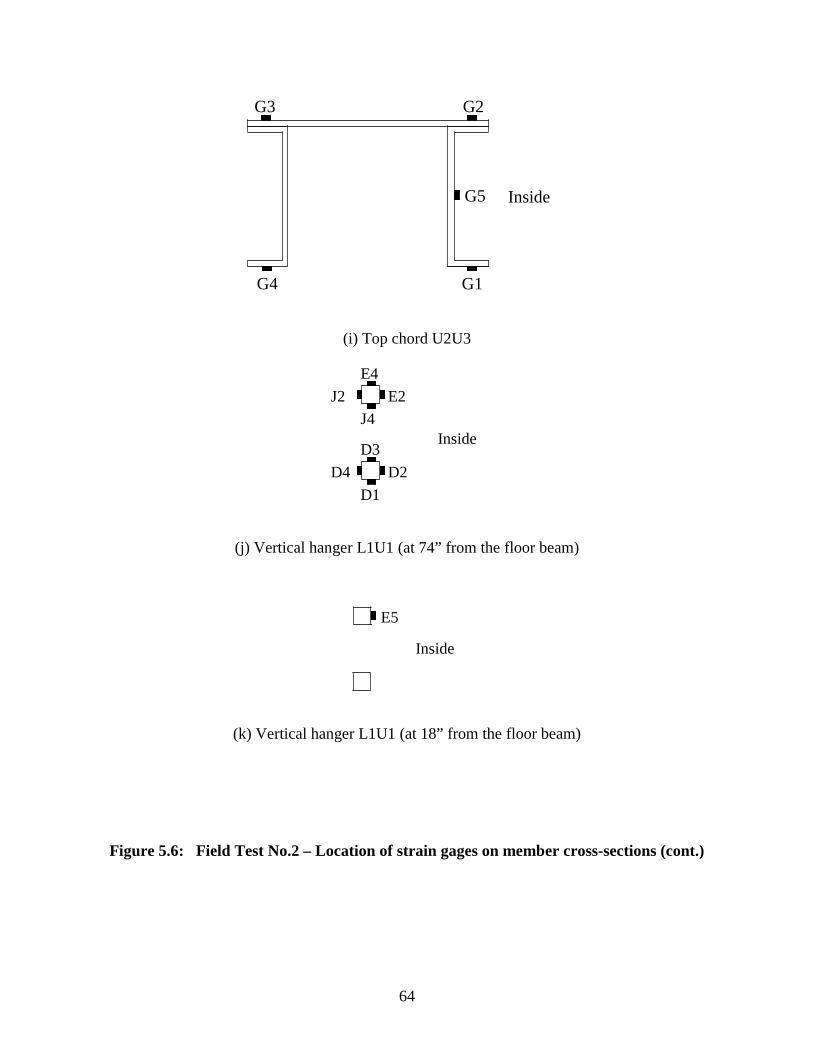
64
InsideG5
G2
G1
G3
G4
(i) Top chord U2U3
InsideD3
D1D4 D2
J2J4
E2E4
(j) Vertical hanger L1U1 (at 74” from the floor beam)
Inside
E5
(k) Vertical hanger L1U1 (at 18” from the floor beam)
Figure 5.6: Field Test No.2 – Location of strain gages on member cross-sections (cont.)
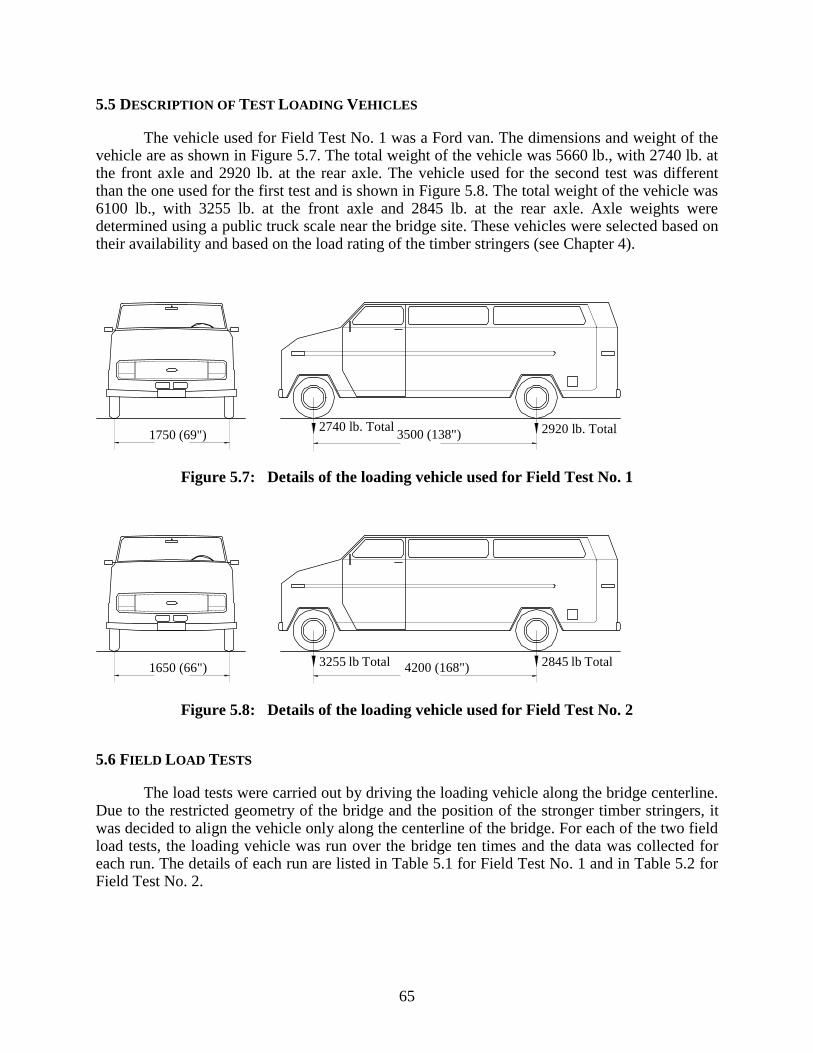
65
5.5 DESCRIPTION OF TEST LOADING VEHICLES
The vehicle used for Field Test No. 1 was a Ford van. The dimensions and weight of the vehicle are as shown in Figure 5.7. The total weight of the vehicle was 5660 lb., with 2740 lb. at the front axle and 2920 lb. at the rear axle. The vehicle used for the second test was different than the one used for the first test and is shown in Figure 5.8. The total weight of the vehicle was 6100 lb., with 3255 lb. at the front axle and 2845 lb. at the rear axle. Axle weights were determined using a public truck scale near the bridge site. These vehicles were selected based on their availability and based on the load rating of the timber stringers (see Chapter 4).
1750 (69") 3500 (138")2740 lb. Total 2920 lb. Total
Figure 5.7: Details of the loading vehicle used for Field Test No. 1
1650 (66") 4200 (168")3255 lb Total 2845 lb Total
Figure 5.8: Details of the loading vehicle used for Field Test No. 2
5.6 FIELD LOAD TESTS
The load tests were carried out by driving the loading vehicle along the bridge centerline. Due to the restricted geometry of the bridge and the position of the stronger timber stringers, it was decided to align the vehicle only along the centerline of the bridge. For each of the two field load tests, the loading vehicle was run over the bridge ten times and the data was collected for each run. The details of each run are listed in Table 5.1 for Field Test No. 1 and in Table 5.2 for Field Test No. 2.
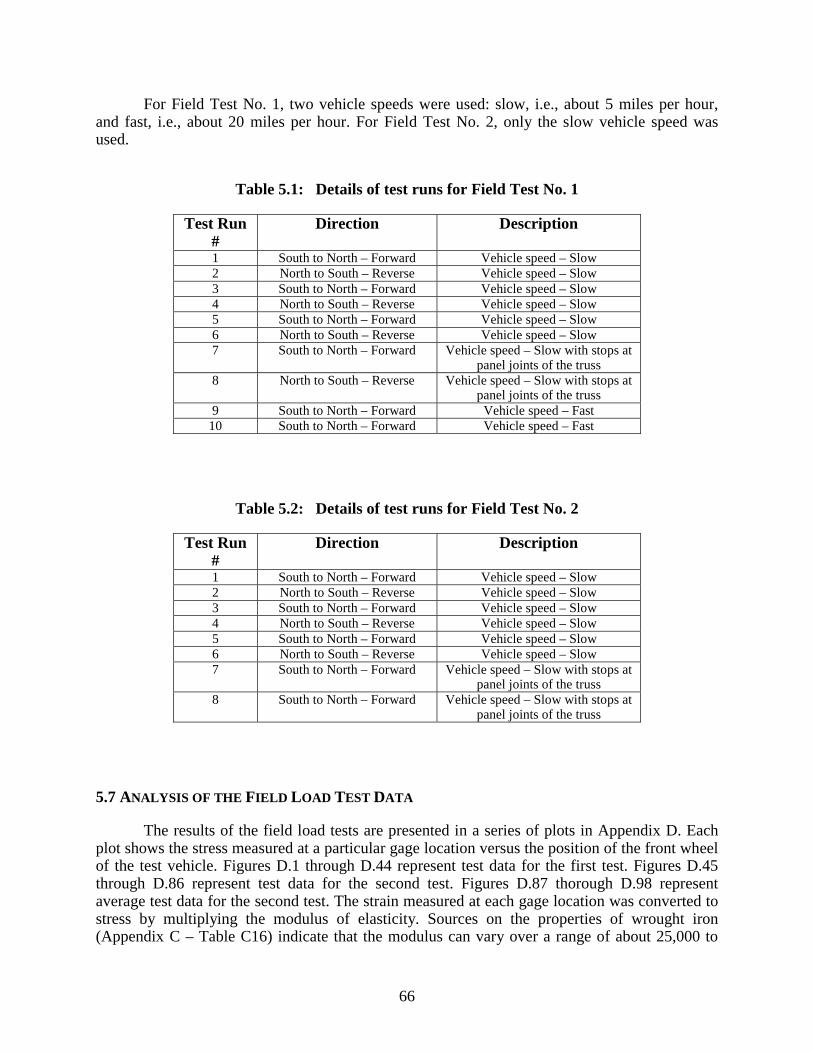
66
For Field Test No. 1, two vehicle speeds were used: slow, i.e., about 5 miles per hour, and fast, i.e., about 20 miles per hour. For Field Test No. 2, only the slow vehicle speed was used.
Table 5.1: Details of test runs for Field Test No. 1
Test Run #
Direction Description
1 South to North – Forward Vehicle speed – Slow 2 North to South – Reverse Vehicle speed – Slow 3 South to North – Forward Vehicle speed – Slow 4 North to South – Reverse Vehicle speed – Slow 5 South to North – Forward Vehicle speed – Slow 6 North to South – Reverse Vehicle speed – Slow 7 South to North – Forward Vehicle speed – Slow with stops at
panel joints of the truss 8 North to South – Reverse Vehicle speed – Slow with stops at
panel joints of the truss 9 South to North – Forward Vehicle speed – Fast
10 South to North – Forward Vehicle speed – Fast
Table 5.2: Details of test runs for Field Test No. 2
Test Run #
Direction Description
1 South to North – Forward Vehicle speed – Slow 2 North to South – Reverse Vehicle speed – Slow 3 South to North – Forward Vehicle speed – Slow 4 North to South – Reverse Vehicle speed – Slow 5 South to North – Forward Vehicle speed – Slow 6 North to South – Reverse Vehicle speed – Slow 7 South to North – Forward Vehicle speed – Slow with stops at
panel joints of the truss 8 South to North – Forward Vehicle speed – Slow with stops at
panel joints of the truss
5.7 ANALYSIS OF THE FIELD LOAD TEST DATA
The results of the field load tests are presented in a series of plots in Appendix D. Each plot shows the stress measured at a particular gage location versus the position of the front wheel of the test vehicle. Figures D.1 through D.44 represent test data for the first test. Figures D.45 through D.86 represent test data for the second test. Figures D.87 thorough D.98 represent average test data for the second test. The strain measured at each gage location was converted to stress by multiplying the modulus of elasticity. Sources on the properties of wrought iron (Appendix C – Table C16) indicate that the modulus can vary over a range of about 25,000 to
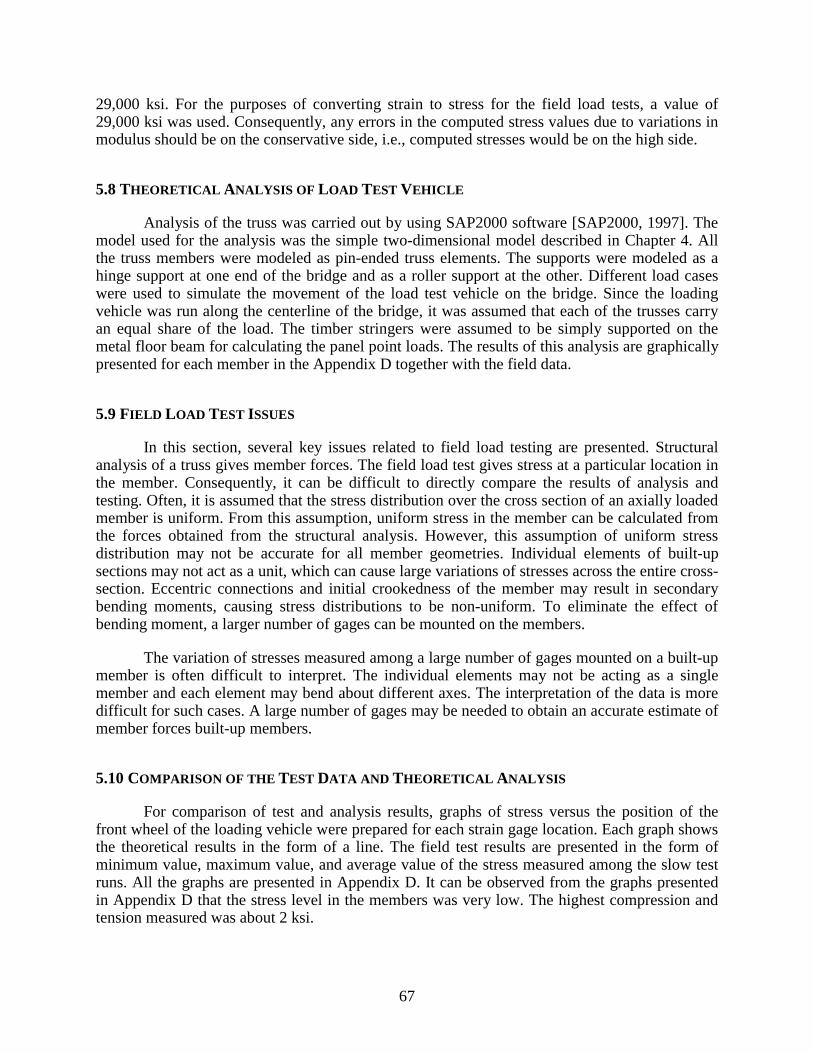
67
29,000 ksi. For the purposes of converting strain to stress for the field load tests, a value of 29,000 ksi was used. Consequently, any errors in the computed stress values due to variations in modulus should be on the conservative side, i.e., computed stresses would be on the high side.
5.8 THEORETICAL ANALYSIS OF LOAD TEST VEHICLE
Analysis of the truss was carried out by using SAP2000 software [SAP2000, 1997]. The model used for the analysis was the simple two-dimensional model described in Chapter 4. All the truss members were modeled as pin-ended truss elements. The supports were modeled as a hinge support at one end of the bridge and as a roller support at the other. Different load cases were used to simulate the movement of the load test vehicle on the bridge. Since the loading vehicle was run along the centerline of the bridge, it was assumed that each of the trusses carry an equal share of the load. The timber stringers were assumed to be simply supported on the metal floor beam for calculating the panel point loads. The results of this analysis are graphically presented for each member in the Appendix D together with the field data.
5.9 FIELD LOAD TEST ISSUES
In this section, several key issues related to field load testing are presented. Structural analysis of a truss gives member forces. The field load test gives stress at a particular location in the member. Consequently, it can be difficult to directly compare the results of analysis and testing. Often, it is assumed that the stress distribution over the cross section of an axially loaded member is uniform. From this assumption, uniform stress in the member can be calculated from the forces obtained from the structural analysis. However, this assumption of uniform stress distribution may not be accurate for all member geometries. Individual elements of built-up sections may not act as a unit, which can cause large variations of stresses across the entire cross-section. Eccentric connections and initial crookedness of the member may result in secondary bending moments, causing stress distributions to be non-uniform. To eliminate the effect of bending moment, a larger number of gages can be mounted on the members.
The variation of stresses measured among a large number of gages mounted on a built-up member is often difficult to interpret. The individual elements may not be acting as a single member and each element may bend about different axes. The interpretation of the data is more difficult for such cases. A large number of gages may be needed to obtain an accurate estimate of member forces built-up members.
5.10 COMPARISON OF THE TEST DATA AND THEORETICAL ANALYSIS
For comparison of test and analysis results, graphs of stress versus the position of the front wheel of the loading vehicle were prepared for each strain gage location. Each graph shows the theoretical results in the form of a line. The field test results are presented in the form of minimum value, maximum value, and average value of the stress measured among the slow test runs. All the graphs are presented in Appendix D. It can be observed from the graphs presented in Appendix D that the stress level in the members was very low. The highest compression and tension measured was about 2 ksi.
68
5.10.1 Field Test No .1
The measured stresses for different members are presented in Figures D.1 through D.44. The following observations were made from comparison of the first field load test and corresponding analysis results:
a) Significantly lower stresses were measured in the bottom chord members, i.e., members L0L1, L1L2, L2L3, L3L4, L4L5, and L5L6, than predicted by analysis. This is indicated by Figures D.1 through D.14. It was also observed that the distribution of stresses among each element of these members was not uniform. This is indicated by the difference in measured stresses on each eyebar of the same bottom chord member. The difference in measured stresses can be observed by comparing Figure D.1 with D.2, D.4 with D.5, D.7 with D.8, D.10 with D.11, and D.13 with D.14. The variation of stress between the two eyebars that make up a single bottom chord member can be due to bending of the eyebars and/or due to unequal sharing of load between the two eyebars. In this test, only one face of each eyebar was instrumented. Mounting gages on both sides of the element will permit minimizing the effects of bending when computing an estimate of axial force in the eyebars. However, despite variations in measured stresses caused by unequal load sharing among eyebars and by secondary bending of eyebars, it is important to note that the measured stresses were less than the predicted stresses at all strain gage locations on bottom chord members. This result indicates a clear trend that the bottom chord members are experiencing smaller stresses than predicted by simple truss analysis. This may be an important result, since the bottom chord members L2L3 and L3L4 had the smallest load rating of all truss members (see Figures 4.5 to 4.8).
b) Higher stresses were measured in the inclined chord members (L0U1 and U5L6) than predicted by analysis. This is indicated by Figures D.15, D.16 and D.25. These members are rigidly connected to portal braces. This rigid connection may be a source of bending moment in the member. These members were instrumented with a single gage. These members are built-up sections made from two-channel sections connected back-to-back by a cover plate and battens. As discussed above, a built-up section may not act as a single member. The measured stress by a single gage may therefore not give an accurate indication of the state of stress in this member.
c) The measured stresses in the top chord members (U1U2, U2U3, U3U4, and U4U5) agreed reasonably well with stresses predicted by analysis. Data for these members is plotted in Figures D.17 through D.24. In general, the measured stresses are slightly higher, perhaps on the order of 10-percent, than the predicted stresses.
d) Higher stresses were measured in the vertical hangers (L1U1 and L5U5) than predicted by analysis. This is indicated Figures D.26, D.27 and D.33. Based on the construction details, higher stresses in these members are difficult to justify. The hanger system is determinate and non-redundant; hence, the reasons for higher stresses are difficult to evaluate. However, possible reasons for the higher stresses may be a lower cross-sectional area as compared to that used in the analysis and the effect of any initial crookedness of the hangers. These members were instrumented with a single gage, which may be influenced by any secondary bending in the members.
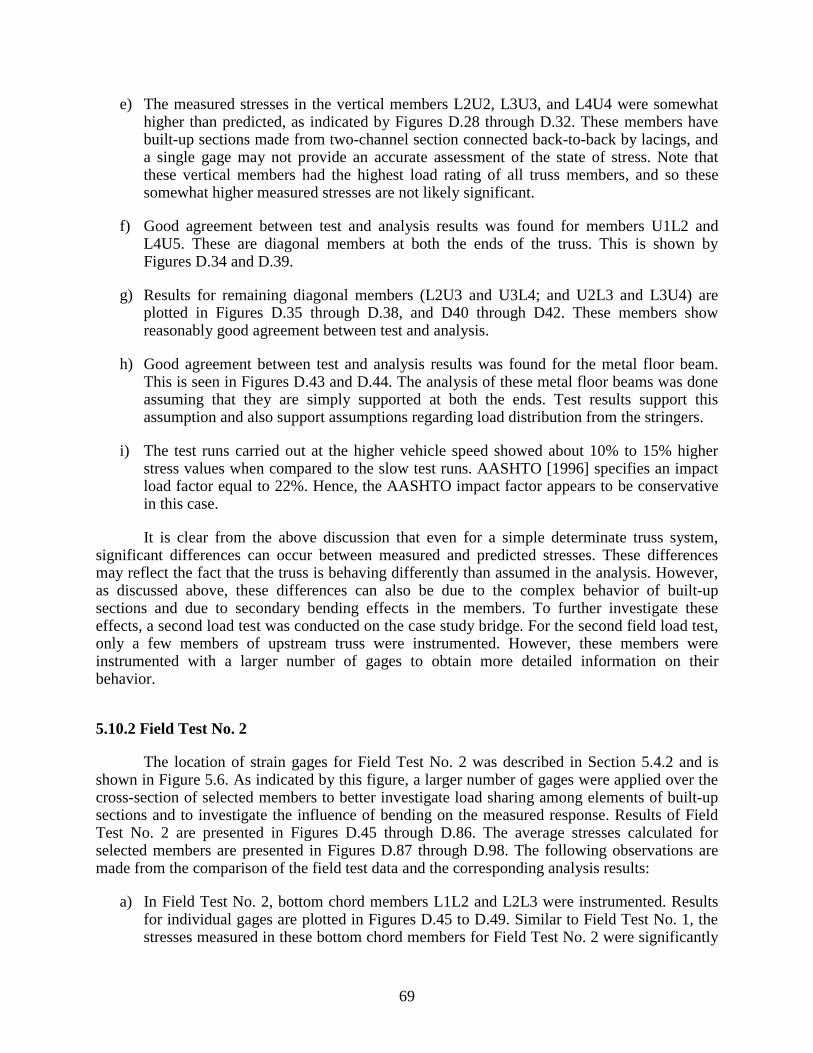
69
e) The measured stresses in the vertical members L2U2, L3U3, and L4U4 were somewhat higher than predicted, as indicated by Figures D.28 through D.32. These members have built-up sections made from two-channel section connected back-to-back by lacings, and a single gage may not provide an accurate assessment of the state of stress. Note that these vertical members had the highest load rating of all truss members, and so these somewhat higher measured stresses are not likely significant.
f) Good agreement between test and analysis results was found for members U1L2 and L4U5. These are diagonal members at both the ends of the truss. This is shown by Figures D.34 and D.39.
g) Results for remaining diagonal members (L2U3 and U3L4; and U2L3 and L3U4) are plotted in Figures D.35 through D.38, and D40 through D42. These members show reasonably good agreement between test and analysis.
h) Good agreement between test and analysis results was found for the metal floor beam. This is seen in Figures D.43 and D.44. The analysis of these metal floor beams was done assuming that they are simply supported at both the ends. Test results support this assumption and also support assumptions regarding load distribution from the stringers.
i) The test runs carried out at the higher vehicle speed showed about 10% to 15% higher stress values when compared to the slow test runs. AASHTO [1996] specifies an impact load factor equal to 22%. Hence, the AASHTO impact factor appears to be conservative in this case.
It is clear from the above discussion that even for a simple determinate truss system, significant differences can occur between measured and predicted stresses. These differences may reflect the fact that the truss is behaving differently than assumed in the analysis. However, as discussed above, these differences can also be due to the complex behavior of built-up sections and due to secondary bending effects in the members. To further investigate these effects, a second load test was conducted on the case study bridge. For the second field load test, only a few members of upstream truss were instrumented. However, these members were instrumented with a larger number of gages to obtain more detailed information on their behavior.
5.10.2 Field Test No. 2
The location of strain gages for Field Test No. 2 was described in Section 5.4.2 and is shown in Figure 5.6. As indicated by this figure, a larger number of gages were applied over the cross-section of selected members to better investigate load sharing among elements of built-up sections and to investigate the influence of bending on the measured response. Results of Field Test No. 2 are presented in Figures D.45 through D.86. The average stresses calculated for selected members are presented in Figures D.87 through D.98. The following observations are made from the comparison of the field test data and the corresponding analysis results:
a) In Field Test No. 2, bottom chord members L1L2 and L2L3 were instrumented. Results for individual gages are plotted in Figures D.45 to D.49. Similar to Field Test No. 1, the stresses measured in these bottom chord members for Field Test No. 2 were significantly
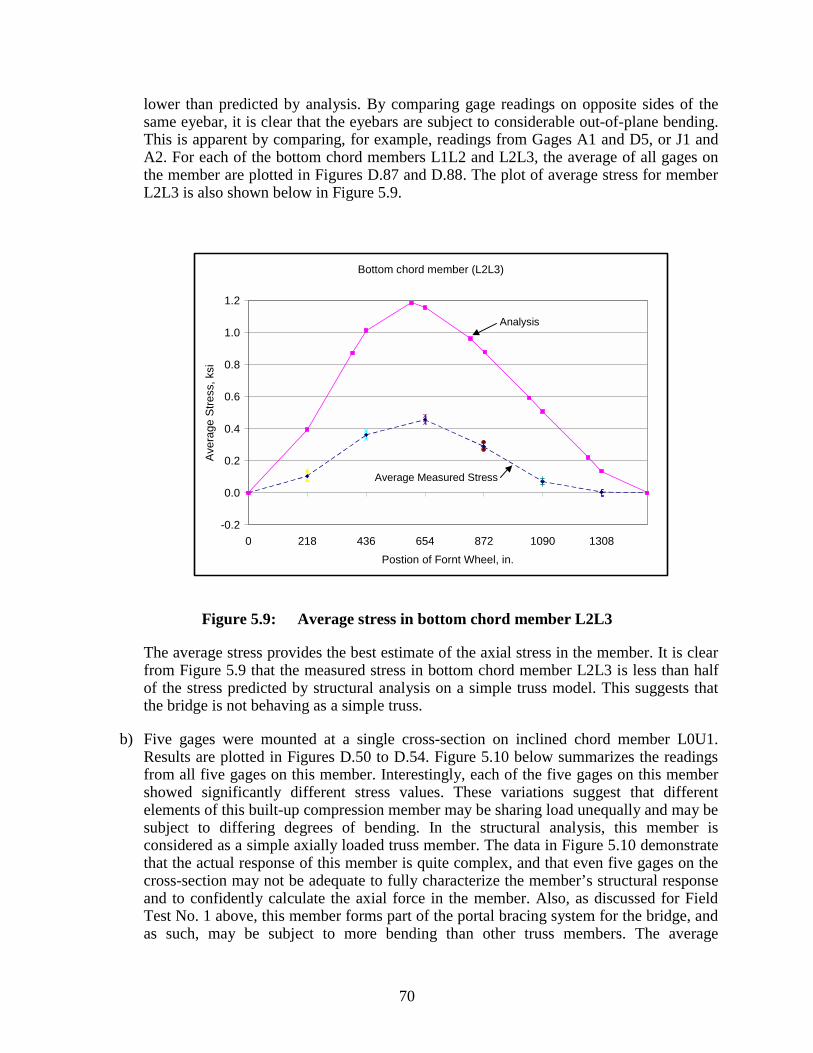
70
lower than predicted by analysis. By comparing gage readings on opposite sides of the same eyebar, it is clear that the eyebars are subject to considerable out-of-plane bending. This is apparent by comparing, for example, readings from Gages A1 and D5, or J1 and A2. For each of the bottom chord members L1L2 and L2L3, the average of all gages on the member are plotted in Figures D.87 and D.88. The plot of average stress for member L2L3 is also shown below in Figure 5.9.
Bottom chord member (L2L3)
-0.2
0.0
0.2
0.4
0.6
0.8
1.0
1.2
0 218 436 654 872 1090 1308Postion of Fornt Wheel, in.
Aver
age
Stre
ss, k
si
Figure 5.9: Average stress in bottom chord member L2L3
The average stress provides the best estimate of the axial stress in the member. It is clear from Figure 5.9 that the measured stress in bottom chord member L2L3 is less than half of the stress predicted by structural analysis on a simple truss model. This suggests that the bridge is not behaving as a simple truss.
b) Five gages were mounted at a single cross-section on inclined chord member L0U1. Results are plotted in Figures D.50 to D.54. Figure 5.10 below summarizes the readings from all five gages on this member. Interestingly, each of the five gages on this member showed significantly different stress values. These variations suggest that different elements of this built-up compression member may be sharing load unequally and may be subject to differing degrees of bending. In the structural analysis, this member is considered as a simple axially loaded truss member. The data in Figure 5.10 demonstrate that the actual response of this member is quite complex, and that even five gages on the cross-section may not be adequate to fully characterize the member’s structural response and to confidently calculate the axial force in the member. Also, as discussed for Field Test No. 1 above, this member forms part of the portal bracing system for the bridge, and as such, may be subject to more bending than other truss members. The average
Analysis
Average Measured Stress
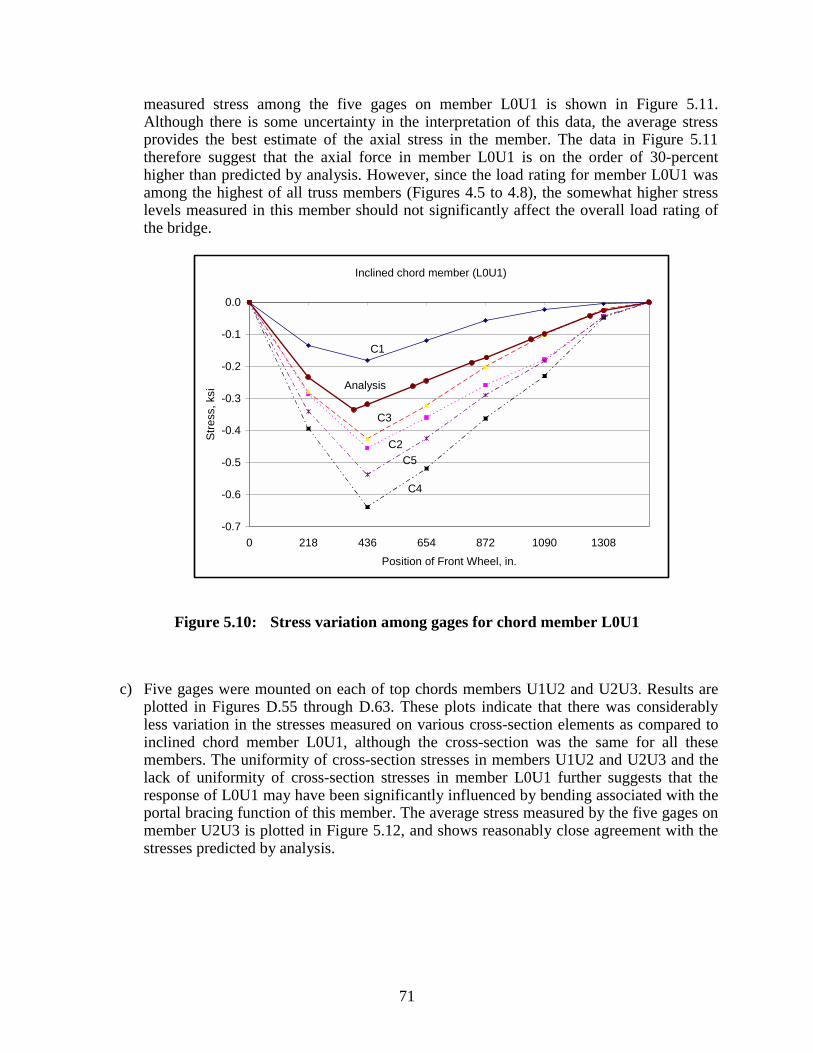
71
measured stress among the five gages on member L0U1 is shown in Figure 5.11. Although there is some uncertainty in the interpretation of this data, the average stress provides the best estimate of the axial stress in the member. The data in Figure 5.11 therefore suggest that the axial force in member L0U1 is on the order of 30-percent higher than predicted by analysis. However, since the load rating for member L0U1 was among the highest of all truss members (Figures 4.5 to 4.8), the somewhat higher stress levels measured in this member should not significantly affect the overall load rating of the bridge.
Inclined chord member (L0U1)
-0.7
-0.6
-0.5
-0.4
-0.3
-0.2
-0.1
0.0
0 218 436 654 872 1090 1308Position of Front Wheel, in.
Stre
ss, k
si
C1
C2
C3
C4
C5
Analysis
Figure 5.10: Stress variation among gages for chord member L0U1
c) Five gages were mounted on each of top chords members U1U2 and U2U3. Results are plotted in Figures D.55 through D.63. These plots indicate that there was considerably less variation in the stresses measured on various cross-section elements as compared to inclined chord member L0U1, although the cross-section was the same for all these members. The uniformity of cross-section stresses in members U1U2 and U2U3 and the lack of uniformity of cross-section stresses in member L0U1 further suggests that the response of L0U1 may have been significantly influenced by bending associated with the portal bracing function of this member. The average stress measured by the five gages on member U2U3 is plotted in Figure 5.12, and shows reasonably close agreement with the stresses predicted by analysis.
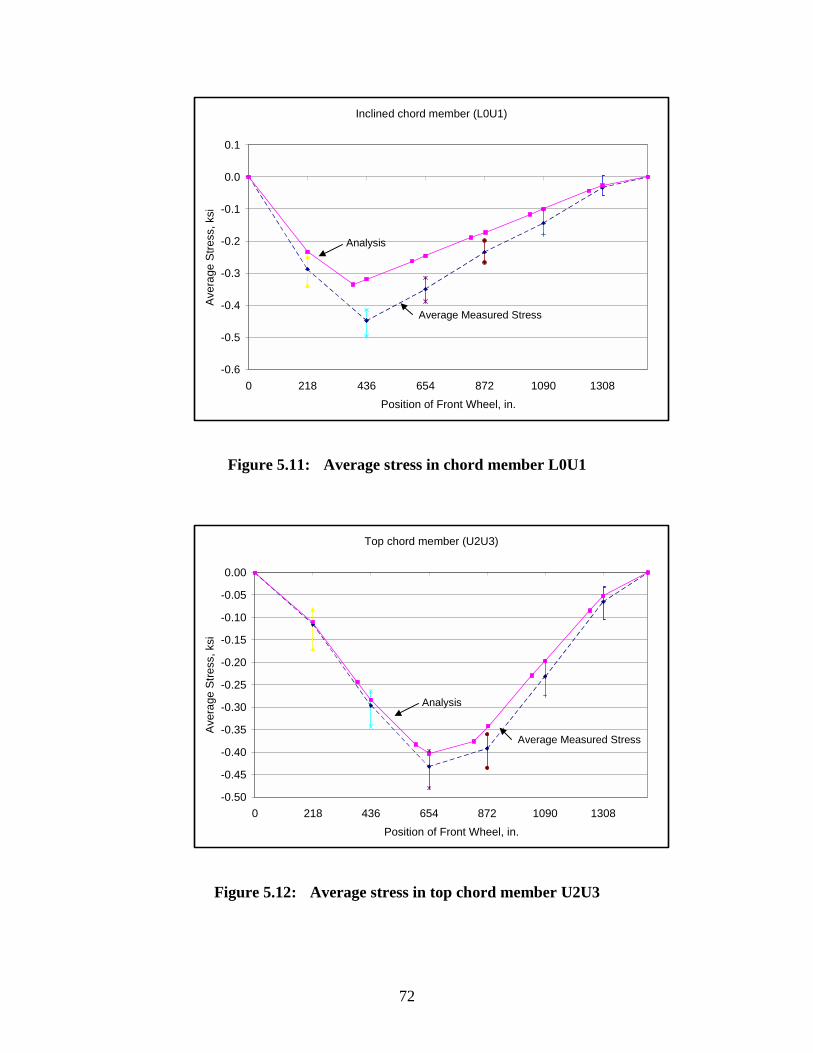
72
Inclined chord member (L0U1)
-0.6
-0.5
-0.4
-0.3
-0.2
-0.1
0.0
0.1
0 218 436 654 872 1090 1308Position of Front Wheel, in.
Aver
age
Stre
ss, k
si
Figure 5.11: Average stress in chord member L0U1
Top chord member (U2U3)
-0.50
-0.45
-0.40
-0.35
-0.30
-0.25
-0.20
-0.15
-0.10
-0.05
0.00
0 218 436 654 872 1090 1308Position of Front Wheel, in.
Aver
age
Stre
ss, k
si
Figure 5.12: Average stress in top chord member U2U3
Analysis
Average Measured Stress
Analysis
Average Measured Stress
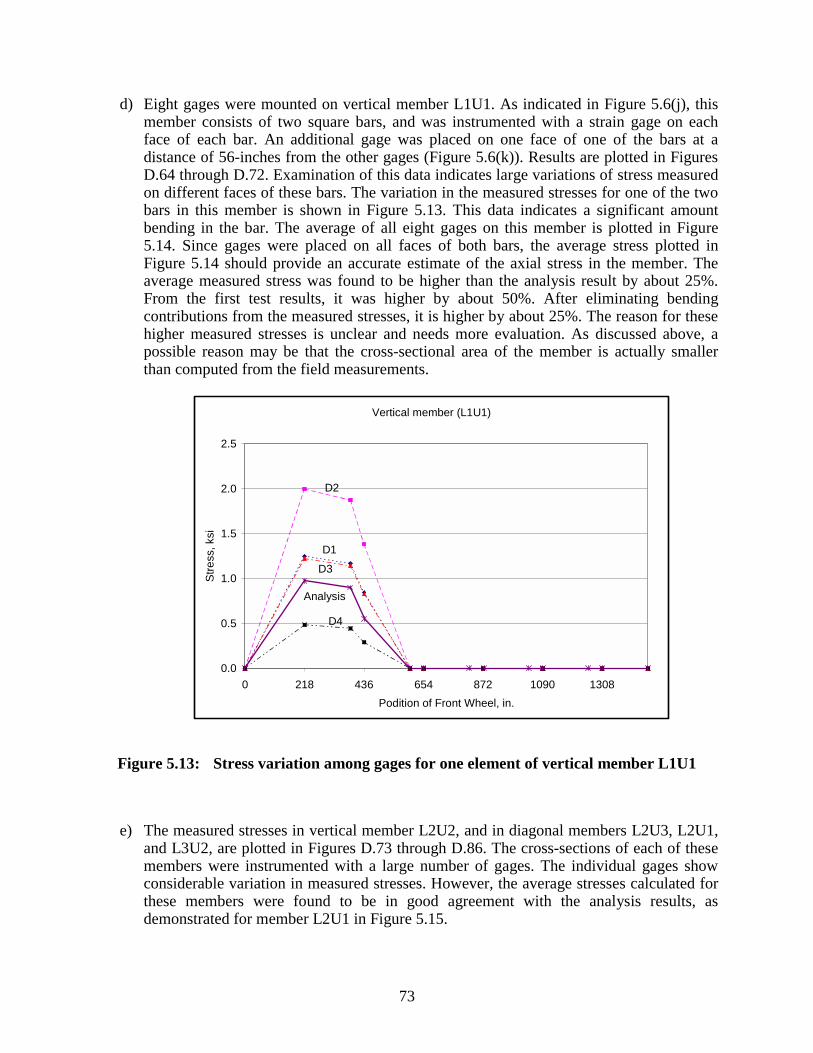
73
d) Eight gages were mounted on vertical member L1U1. As indicated in Figure 5.6(j), this member consists of two square bars, and was instrumented with a strain gage on each face of each bar. An additional gage was placed on one face of one of the bars at a distance of 56-inches from the other gages (Figure 5.6(k)). Results are plotted in Figures D.64 through D.72. Examination of this data indicates large variations of stress measured on different faces of these bars. The variation in the measured stresses for one of the two bars in this member is shown in Figure 5.13. This data indicates a significant amount bending in the bar. The average of all eight gages on this member is plotted in Figure 5.14. Since gages were placed on all faces of both bars, the average stress plotted in Figure 5.14 should provide an accurate estimate of the axial stress in the member. The average measured stress was found to be higher than the analysis result by about 25%. From the first test results, it was higher by about 50%. After eliminating bending contributions from the measured stresses, it is higher by about 25%. The reason for these higher measured stresses is unclear and needs more evaluation. As discussed above, a possible reason may be that the cross-sectional area of the member is actually smaller than computed from the field measurements.
Vertical member (L1U1)
0.0
0.5
1.0
1.5
2.0
2.5
0 218 436 654 872 1090 1308Podition of Front Wheel, in.
Stre
ss, k
si
D1
D2
D3
D4
Analysis
Figure 5.13: Stress variation among gages for one element of vertical member L1U1
e) The measured stresses in vertical member L2U2, and in diagonal members L2U3, L2U1, and L3U2, are plotted in Figures D.73 through D.86. The cross-sections of each of these members were instrumented with a large number of gages. The individual gages show considerable variation in measured stresses. However, the average stresses calculated for these members were found to be in good agreement with the analysis results, as demonstrated for member L2U1 in Figure 5.15.
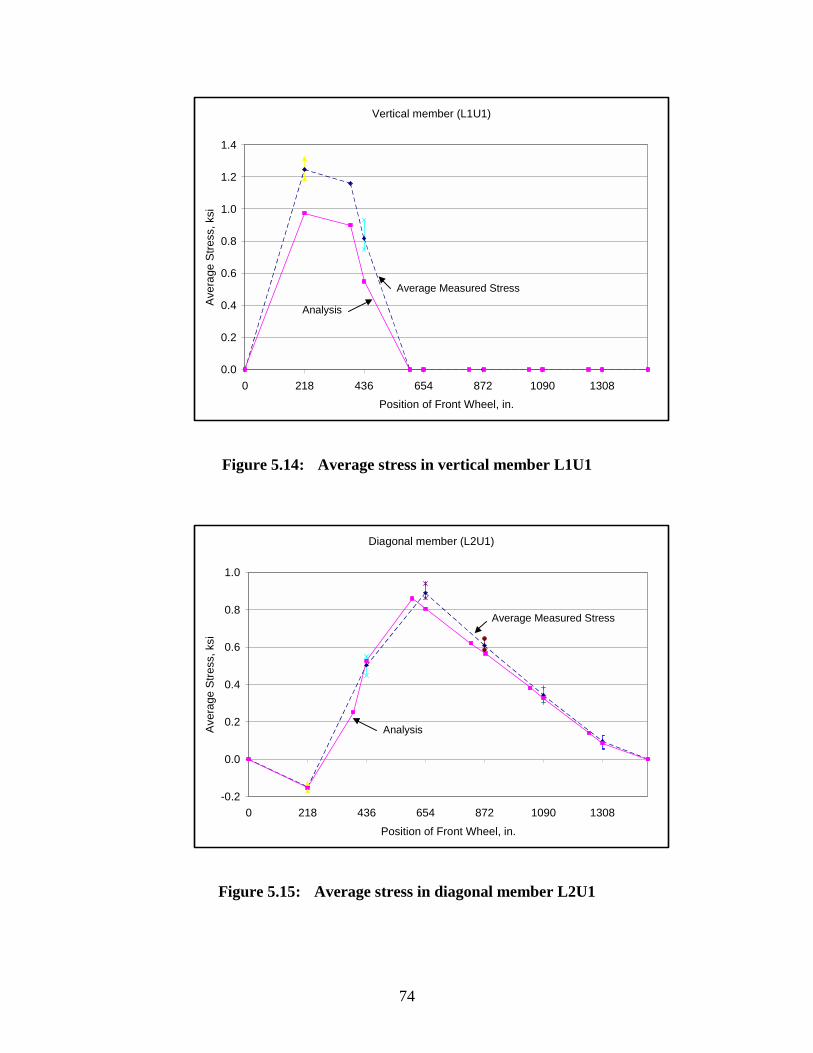
74
Vertical member (L1U1)
0.0
0.2
0.4
0.6
0.8
1.0
1.2
1.4
0 218 436 654 872 1090 1308Position of Front Wheel, in.
Aver
age
Stre
ss, k
si
Figure 5.14: Average stress in vertical member L1U1
Diagonal member (L2U1)
-0.2
0.0
0.2
0.4
0.6
0.8
1.0
0 218 436 654 872 1090 1308Position of Front Wheel, in.
Aver
age
Stre
ss, k
si
Figure 5.15: Average stress in diagonal member L2U1
Analysis
Average Measured Stress
Analysis
Average Measured Stress
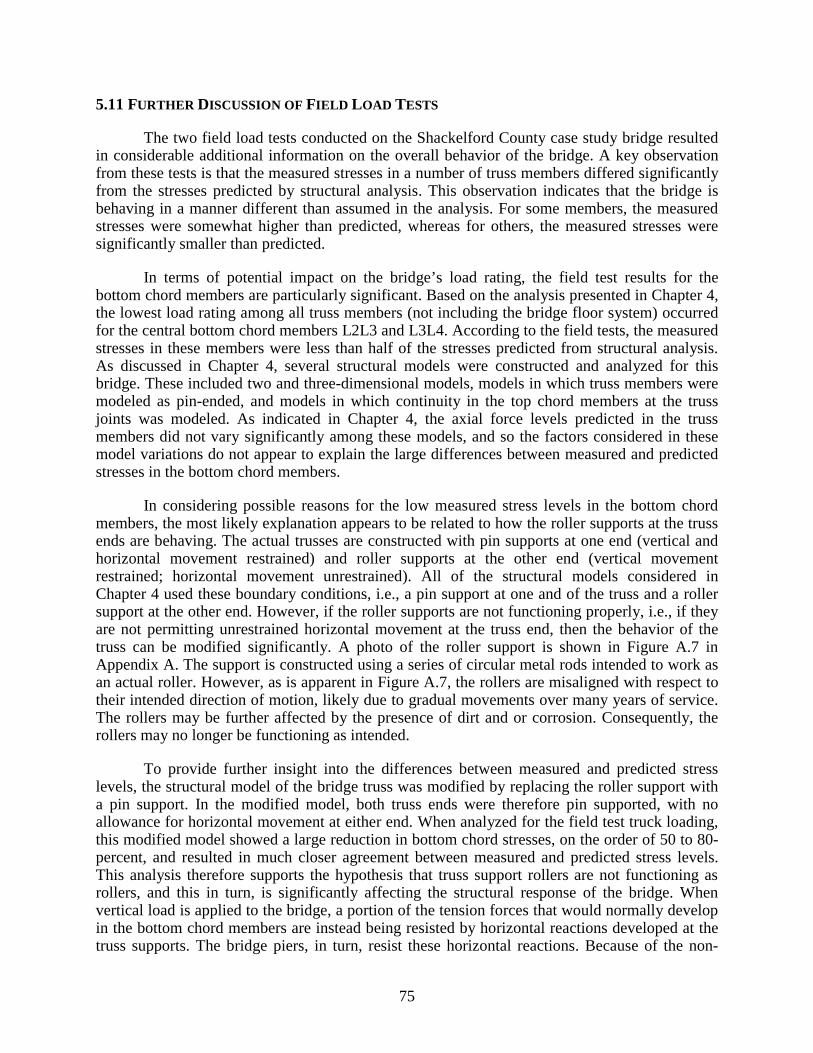
75
5.11 FURTHER DISCUSSION OF FIELD LOAD TESTS
The two field load tests conducted on the Shackelford County case study bridge resulted in considerable additional information on the overall behavior of the bridge. A key observation from these tests is that the measured stresses in a number of truss members differed significantly from the stresses predicted by structural analysis. This observation indicates that the bridge is behaving in a manner different than assumed in the analysis. For some members, the measured stresses were somewhat higher than predicted, whereas for others, the measured stresses were significantly smaller than predicted.
In terms of potential impact on the bridge’s load rating, the field test results for the bottom chord members are particularly significant. Based on the analysis presented in Chapter 4, the lowest load rating among all truss members (not including the bridge floor system) occurred for the central bottom chord members L2L3 and L3L4. According to the field tests, the measured stresses in these members were less than half of the stresses predicted from structural analysis. As discussed in Chapter 4, several structural models were constructed and analyzed for this bridge. These included two and three-dimensional models, models in which truss members were modeled as pin-ended, and models in which continuity in the top chord members at the truss joints was modeled. As indicated in Chapter 4, the axial force levels predicted in the truss members did not vary significantly among these models, and so the factors considered in these model variations do not appear to explain the large differences between measured and predicted stresses in the bottom chord members.
In considering possible reasons for the low measured stress levels in the bottom chord members, the most likely explanation appears to be related to how the roller supports at the truss ends are behaving. The actual trusses are constructed with pin supports at one end (vertical and horizontal movement restrained) and roller supports at the other end (vertical movement restrained; horizontal movement unrestrained). All of the structural models considered in Chapter 4 used these boundary conditions, i.e., a pin support at one and of the truss and a roller support at the other end. However, if the roller supports are not functioning properly, i.e., if they are not permitting unrestrained horizontal movement at the truss end, then the behavior of the truss can be modified significantly. A photo of the roller support is shown in Figure A.7 in Appendix A. The support is constructed using a series of circular metal rods intended to work as an actual roller. However, as is apparent in Figure A.7, the rollers are misaligned with respect to their intended direction of motion, likely due to gradual movements over many years of service. The rollers may be further affected by the presence of dirt and or corrosion. Consequently, the rollers may no longer be functioning as intended.
To provide further insight into the differences between measured and predicted stress levels, the structural model of the bridge truss was modified by replacing the roller support with a pin support. In the modified model, both truss ends were therefore pin supported, with no allowance for horizontal movement at either end. When analyzed for the field test truck loading, this modified model showed a large reduction in bottom chord stresses, on the order of 50 to 80-percent, and resulted in much closer agreement between measured and predicted stress levels. This analysis therefore supports the hypothesis that truss support rollers are not functioning as rollers, and this in turn, is significantly affecting the structural response of the bridge. When vertical load is applied to the bridge, a portion of the tension forces that would normally develop in the bottom chord members are instead being resisted by horizontal reactions developed at the truss supports. The bridge piers, in turn, resist these horizontal reactions. Because of the non-
76
functioning roller, the bridge, in effect, is exhibiting some degree of arch action, with a portion of the horizontal thrust being resisted by the bridge piers.
The fact that the roller supports are not functioning properly is, in fact, providing a beneficial effect for the truss. The truss members with the lowest load rating are the central bottom chord members, and the non-functioning roller substantially reduces the stress levels in these members. However, it is not recommended that this beneficial effect be used as a basis for an increased load rating, as the consistency and reliability of this condition is uncertain. For example, heavier loads on the bridge will develop larger horizontal reactions at the rollers, and may cause the rollers to move, reducing or eliminating the arch action in the bridge.
Since the non-functioning roller is providing a benefit to the truss, the question arises as to whether or not the rollers should be repaired. While the damaged rollers are providing a benefit by reducing stress levels in the critical bottom chord members, the damaged rollers can also pose some potentially detrimental effects. For example, the horizontal forces developed at the damaged rollers are transferred to the bridge piers, and may subject the piers to loads for which they were not designed. The Shackelford County case study bridge is supported on massive masonry piers, which likely can resist these horizontal forces without distress. For other bridges with less substantial piers, however, this effect may be more important and should be evaluated. Another concern with damaged rollers is that any horizontal movement of the piers may transfer large forces to the truss. For example, if the top of a pier moves inwards towards the bridge due to small foundation movements, compressive forces may develop within the bottom chord members of the truss. If the bottom chords are slender eyebars, as is the case with this bridge, the chord members may buckle under these forces. Although this condition has not occurred in the Shackelford County case study bridge, the writers have observed bottom chord eyebars that are buckled out-of-plane on other similar off-system truss bridges. Large out-of-plane displacements of the eyebars may induce significant second-order bending moments in the eyebars that may have detrimental effects on the eyebar. Conversely, if the top of a pier moves outwards due to small foundation movements, very large tension forces may develop in the bottom chord members, which also may be detrimental. Thus, while the damaged roller is providing an apparent benefit in this case by reducing bottom chord tension stresses, the damaged roller can also have potentially significant detrimental effects on the bridge. Consequently, it would appear prudent to repair or replace the roller assembly so that the support actually behaves as a roller, as intended.
In addition to instrumenting the truss members, a metal floor beam was also instrumented in the first load test. As discussed in Chapter 4, the metal floor beams had the lowest load rating of all the metal components of the bridge. The stresses in the floor beam measured in the field test were very close to those predicted by structural analysis. For the analysis, the floor beam was modeled as a simply supported member, and the field test data suggest this simple model is quite accurate.
While field load testing may not be practical nor necessary as part of routine load rating of off-system historic metal truss bridges, a great deal can be learned about the actual behavior and condition of a bridge from a load test. For the case study bridge, the field load test data does not support an increase in the load rating, as discussed above. Nonetheless, the field test showed that the trusses were behaving differently than assumed by conventional truss analysis, and was very useful in diagnosing the presence and effects of the damaged roller bearings. For cases of particularly important historic truss bridges, or in cases where there is significant doubt as to the
77
behavior and condition of a bridge, a field load test can be a valuable aid in guiding engineering decisions. However, collecting high quality field data and properly interpreting the data can be a potentially lengthy, costly and difficult process.
In the course of conducting the field load tests on the case study bridge, several lessons were learned that might be useful in planning future load tests. Following are some suggestions for planning load tests:
• Plan for multiple load tests.
For the case study bridge, two load tests were conducted. In the first test, a large number of bridge members were instrumented for an initial assessment of bridge response. After evaluation of the data from the first test, a second load test was planned where only selected members were instrumented very thoroughly. The second test was planned, in effect, to answer questions raised in the first test. This proved to be a very useful process. By planning a series of two or more load tests, instrumentation layouts can be progressively refined in later tests to address problem areas, data anomalies or unexpected results seen in the initial tests. To obtain maximum benefit from the later tests, it is essential that the data from the initial tests be carefully evaluated prior to planning the later tests. Consequently, the load tests may need to be conducted over a period of several weeks or longer.
• Use a sufficient number of strain gages on a truss member to permit accurate determination of member response.
Truss members are typically modeled as members that carry pure axial force. However, data collected from the case study bridge clearly showed some degree of bending in all truss members that were instrumented. Even for members with very simple cross-sections, such as the bottom chord eyebars, the data showed there was always some bending present in addition to the axial force. Consequently, placing only a single gage on such a member may give a highly misleading estimate of member force. Enough gages must be placed on any given cross-section to permit bending stress components to be separated from axial stress components. For truss members with complex built-up cross-sections, such as the top chord members in the case study bridge, even more gages may be needed to evaluate member response. For built-up sections, each element of the cross-section may be carrying a different level of axial force and moment. The data plotted in Figure 5.10 demonstrates the complex response of a built-up member. In general, planning a field test with only a single gage or a small number of gages on each member can give highly misleading results.
• Use multiple truck runs and data averaging.
For each load test conducted on the case study bridge, the load truck was run over the bridge ten times, and the data from the ten runs was averaged. Each of the ten runs showed some variation in results (as shown in the plots in Appendix D). These variations are likely due to small errors in tracking the exact position of the truck at any given instant during the test. Averaging the results from multiple runs can minimize the effect of these errors. This process should result in more reliable field data.
• Use the heaviest possible test truck.
78
For the case study bridge, the test truck generally induced live load stresses in the instrumented members less than 1 ksi. Very small stress levels may be more prone to measurement errors, and considerable care is required to assure that the measurement system is properly calibrated. Also, the bridge may exhibit behavioral characteristics at very low load levels that differ somewhat from those exhibited at higher load levels. Consequently, it is desirable to use the heaviest possible test vehicle consistent with estimates of safe bridge load capacity made prior to the load test, and consistent with the availability of vehicles.
Going through the field observations and measurements, materials evaluation, detailed structural analysis, and field load testing has revealed a great deal of information about the capabilities and deficiencies of the case study bridge structure. Based on this information, different rehabilitation options can be considered. In Chapter 6, some of the rehabilitation options that may be used for the case study bridge are described.
79
Chapter 6: Rehabilitation Options
6.1 INTRODUCTION
Previous chapters addressed issues and techniques involved with the evaluation of older metal truss bridges. These included data collection, material evaluation, structural analysis, and field load testing. These techniques are intended to provide the most realistic load rating possible for the bridge and to identify problem areas and deficiencies in the bridge. For older metal truss bridges, the evaluation process will often indicate the need for some type of repair or rehabilitation in order to keep the bridge in vehicular service. This chapter discusses some options available to engineers to address common deficiencies in older metal truss bridges.
In the following section, common deficiencies found in older metal truss bridges are reviewed. This is followed by a discussion of repair or rehabilitation options that may be useful in dealing with these deficiencies. At the end of this chapter, deficiencies found in the case-study bridge will be discussed along with possible rehabilitation measures.
6.2 COMMON DEFICIENCIES IN OLDER METAL TRUSS BRIDGES
This section briefly reviews deficiencies and problems commonly found in older metal truss bridges, particularly in off-system bridges. The discussion focuses primarily on problems with the truss bridge superstructure.
6.2.1 Inadequate Load Capacity of Truss
The load rating process for a bridge may indicate that the load capacity is insufficient for the intended use of the bridge. For typical older off-system truss bridges, achieving an HS20 load rating will often prove difficult, and will frequently not be a realistic goal. For example, the inventory load rating determined for the truss portion of the Shackelford County case study bridge was approximately HS10 (see Section 4.7). However, many off-system bridges can likely remain in service with lower load ratings, although load posting may be required. Nonetheless, in a number of cases, the load rating for the bridge may still be adequate for the intended service, even though the required capacity may be well below HS20.
Inadequate load capacity in off-system metal truss bridges can result from two causes. The first cause is inherent lack of strength due to initial low design loads for the bridge. That is, even in the absence of damage or deterioration, the bridge members are simply too light to carry the required loads. Many older off-system truss bridges were supplied by private bridge companies and were not designed for any specific load standard. Further, many of these bridges were not originally designed for automobile or truck loads.
The second cause for inadequate load capacity is damage or deterioration to the bridge. If in good condition, many off-system truss bridges may have adequate load capacity for their
80
intended service. However, due to either damage and/or deterioration to bridge components, the load rating may be reduced below a level where the bridge can remain in service.
If the cause of an inadequate load rating is damage or deterioration, then repair of the damaged or deteriorated bridge components will be the primary focus of a bridge rehabilitation plan. On the other hand, if the cause of an inadequate load rating is inherent lack of strength, then more significant and costly strengthening measures may be called for.
6.2.2 Damage and Deterioration to Truss
Older off-system metal truss bridges commonly exhibit a variety of different types of damage or deterioration. Following is a brief list of typical problem areas.
• Corrosion
Due to their age, off-system metal truss bridges exhibit corrosion problems in varying degrees. These problems are typically exacerbated by the member fabrication techniques used in these bridges. Many truss bridge members are built-up cross-section in which plates, structural shapes and lacing members are riveted together to form a single member. These types of members collect water and debris between the elements that make up the cross-section. Moisture and debris also commonly accumulate at truss joints.
• Fatigue Cracks
Typical off-system metal truss bridges were constructed prior to the common use of welding in bridge construction. Instead of welding, members are joined by rivets, bolts and pins. Consequently, many of the fatigue prone details associated with welding are not present. Nonetheless, because of their age, fatigue cracking can still be a concern in these bridges. Areas of severe corrosion or pitting, or areas where members have been dented or bent can act as stress riders to initiate fatigue cracks.
Although welding was not normally used in the original construction of off-system truss bridges, welded components are sometimes found on these bridges. In some cases, welds may have been used as part of a repair for a damaged member. In other cases, brackets can be found welded to bridge members to carry pipes or other utilities across the bridge. In many of these instances, such welds may have been done by unqualified welders, without proper evaluation of the weldability of the metal, without approved welding procedures, without proper preheat, etc. Such uncontrolled welds represent a potential source of fatigue cracking. Defects at these welds, such as undercuts, act as notches that can cause fatigue cracks. Uncontrolled welding may also adversely affect the toughness of the base metal, which may exacerbate fatigue problems or initiate a brittle fracture.
• Impact Damage
Bridge members with various types of damage from vehicle impacts are frequently found in off-system truss bridges. The very light (or sometimes nonexistent) railings found on these bridges provide little protection to the truss members.
81
Consequently, dented or bent members are a common occurrence. In the case of through-trusses, damage to the portal bracing can sometimes be found due to impact with over-height vehicles.
• Damaged or Nonfunctional Bridge Bearings
One end of a truss bridge is normally provided with roller bearings. In many cases, these bearings are found to be deteriorated, damaged or filled with debris. In such cases, the bearings are not likely functioning as intended, i.e., they are no longer permitting free horizontal movement. When these bearings become “locked,” additional stresses can be developed in the truss members due to restrained thermal expansion, due to certain live load cases, or due to bridge pier movements, as discussed below.
• Bent Bottom Chord Members
In some cases, eyebars in the bottom chord of a truss are found to be bent out of the plane of the truss. This bending does not appear to be impact damage, as the eyebars are located in an area where vehicle impact is unlikely. Rather, it appears that these eyebars have buckled due to compressive loads in the members. Since they are in the bottom chord, these members would normally be expected to be under tension and therefore not subject to buckling. It appears this buckling of bottom chord members may be related to failure of the bridge roller bearings to function properly. If the roller bearings cease to function due to damage or debris accumulation, then compressive forces can, in fact, develop within the bottom chord. Structural analysis of a truss, with the roller bearings locked, will show small compression forces in the bottom chord members for certain live load cases. The field load test of the Shackelford County case study bridge, for example, showed compressive strains in the bottom chord eyebars for some loading cases. Restraint of thermal expansion due to locked bearings could also produce compression in the bottom chord. Perhaps a more likely cause for buckling of the bottom chord eyebars may be failure of the roller bearings combined with small movements of the bridge piers. If the roller bearings are locked, and the bridge piers move inward even a small amount, sufficient compression may be developed in the eyebars to cause buckling. The buckling capacity of eyebars is quite small, so even a small compressive load can cause the members to buckle.
• Deteriorated Timber Decks
Portions of timber decks in truss bridges are often found with varying degrees of deterioration due to rot and decay, splitting, etc.
6.2.3 Geometrical Deficiencies
Restricted horizontal clearance and/or vertical clearance, inadequate vertical and horizontal alignment, and limited vehicle sight distance are a common problem in older truss bridges. Similar to the Shackelford County case study bridge, many off-system trusses are narrow single lane bridges. In many cases, however, these bridges serve lightly traveled rural roads where a single lane bridge does not pose a serious traffic problem. However, when located
82
on more heavily traveled roads or city streets, the restricted clearances of an older truss bridge can pose more significant traffic and safety problems.
6.2.4 Deficiencies in Substructure
Piers and foundations of older truss bridges may also be subject to damage and deterioration. A variety of different types of piers are found on these bridges. In the case of the Shackelford County case study bridge, large masonry piers were provided. As described in Chapter 2, these piers exhibited considerable deterioration, with a number of loose or missing stones. For some older truss bridges, the piers are large circular metal columns, also frequently deteriorated. The foundation for the piers may have also deteriorated, settled or moved laterally. In some cases, the foundation and piers may have experienced considerable lateral movement or tilting over the years, producing distortions of the superstructure.
6.3 REHABILITATION TECHNIQUES
In a companion portion of this research project, techniques and options for rehabilitation of historic metal truss bridges were summarized based on a review of literature and a review of current practices of various transportation agencies. This summary of rehabilitation techniques is summarized in Thiel et al [2001], and the reader is referred to this document for a thorough discussion of historic metal bridge rehabilitation. A number of options for addressing common deficiencies in older off-system metal truss bridges are also briefly discussed below. These options impact the historic bridge in varying degrees. The physical changes required by each technique should be evaluated according to The Secretary of the Interior’s Treatment for Historic Properties. The method that retains maximum physical integrity of engineering and materials while addressing the deficiency should be employed.
6.3.1 Bridge Floor and Deck System
A common type of rehabilitation for older truss bridges is replacement of the bridge deck. The life of a bridge deck is often considerably less than that of the bridge, particularly for timber decks. Consequently, due to deterioration, the deck may be replaced several times during the life of the bridge. The existing deck of the bridge may also be replaced with a lighter deck system, in order to reduce the dead load on the bridge. Reduction of dead load, in turn, will permit an increase in the live load capacity of the bridge.
Several options are available to the designer when replacing a bridge deck. The most common approach is to replace the existing deck with the same type of decking. For example, a deteriorated timber deck is frequently replaced with a new timber deck of the same basic design. However, as noted above, an existing deck can sometimes be replaced with a lighter weight system in order to increase the load rating of the bridge. Three options for a lighter weight replacement deck are: (1) open grid steel or fiberglass grating; (2) cold formed corrugated metal decking; and (3) laminated timber decking.
Steel or fiberglass grating can provide high load capacities at low weight. This is particularly true for fiberglass grating, where very high strength to weight ratios can be achieved.
83
However, skid resistance of grating can be a concern when wet. Further, fiberglass grating can be quite costly compared to other options. The corrugated plate system can be placed over existing stringers and some supplemental floor beams. The corrugated plate is normally covered with concrete or asphalt to provide a wearing surface. Glue laminated or prestressed timber deck is a recent innovation. Prefabricated panels are normally clamped or bolted to existing stringers. Laminated panels can offer good resistance to deicing chemicals.
The metal floor beams that support the floor deck of the truss bridge may also need repair, replacement or strengthening. If severely deteriorated or if significant strengthening is needed, girder replacement is an option. Existing metal floor beams can be strengthened by the addition of cover plates. Attachment of cover plates by bolting is generally preferable to welding to avoid fatigue prone welding details. For older metal trusses, weldability of older steels or wrought iron may also be questionable, and must be carefully investigated prior to welding.
If the deck of the bridge is reinforced concrete, strengthening of the metal floor beams may also be possible by the addition of shear connectors, in order to develop composite action between the deck and the beams.
Metal floor beams can also be strengthened by the use of post-tensioning. Steel cables are connected at the ends of the tension flange, and are tightened by turnbuckles or other tensioning devices. This induces a bending moment in the beam that counteracts the dead and live load moment, thereby increasing the capacity of the beam.
If adequate clearance is available under the bridge, metal floor beams can also be strengthened by the addition of a kingpost truss system. This requires the installation of a truss with one or more posts to the bottom flange of the beam. Threaded end connections are provided so that proper tension can be induced in the system.
6.3.2 Damage and Deterioration
As discussed in Section 6.2, a variety of different types of damage or deterioration may be found in older truss bridges. Bridge members that exhibit impact damage or other geometric distortions can frequently be repaired by flame straightening. Information on repair techniques for a variety of different types of distress in bridge members is available in the National Cooperative Highway Research Program (NCHRP) Report No. 271 [NCHRP #271, 1984].
Corrosion of truss bridges can be reduced by repainting the bridge, and addressing drainage problem areas. This includes repairing or replacing expansion joints that permit water to infiltrate the bridge floor system.
Repair of fatigue damaged details is case specific and is generally dependent on the size and location of cracks. Repair techniques include hole drilling and peening. Fatigue crack repair methods are described in [Fisher, J.W., 1990].
Nonfunctional bridge bearings can be replaced, or cleaned and adjusted to the proper alignment.
84
6.3.3 Truss Strengthening
Several techniques are available for increasing the load capacity of existing trusses, as follows:
• Addition of Supplemental Members
Additional chord or diagonal members can be added to increase truss capacity. These are typically added parallel to existing members. For example, if the tension chord is made of a pair of eyebars, an additional member can sometimes be added between the two eyebars. Connections between the new members and the existing truss requires careful consideration.
• Post-Tensioning
Post-tensioned steel cables can be used to increase the load capacity of tension members in the truss. Cables are attached to the member ends and tensioned with turnbuckles or other devices. A similar procedure can be used along the entire tension chord of a truss. In this case, the cables are attached to the end bearing points and then tensioned. Post-tensioning can also be used for floor beams, as discussed earlier. Section 6.3.4 provides a more detailed description of post-tensioning.
• Supplemental Truss Supports
In some cases, it may be feasible to add supports to a truss bridge. By placing these supports under the first interior panel point, the truss span can be reduced significantly. Connections to the truss should be designed to provide vertical support without changing the expansion characteristic of the bridge.
6.3.4 Truss Strengthening by Post-Tensioning
Post-tensioning truss bridges is a means of strengthening and creating redundancy in the structural system. Post-tensioning increases strength, fatigue resistance, and redundancy, and reduces deflections and member stresses. Thus, the remaining life of a truss bridge can be increased by this technique.
The post-tensioning forces needed to strengthen the deficient members are a function of the tendon layout, tendon cross-sectional area, and truss type. The effect of post-tensioning forces on the members is dependent on the truss type, connectivity of the members, and tendon layout within the group of members.
The analyses of a post-tensioned truss can be carried out in three stages. In the first stage, an analysis of the truss is carried out under dead load only. The second stage of analysis is performed using the post-tensioning loads as applied to the truss joints. In the third stage, an analysis is performed using live, impact, and any additional loads. The stiffness of the tendons is considered only in the third analysis stage. The final solution is obtained by superimposing the solutions of all the three analyses.
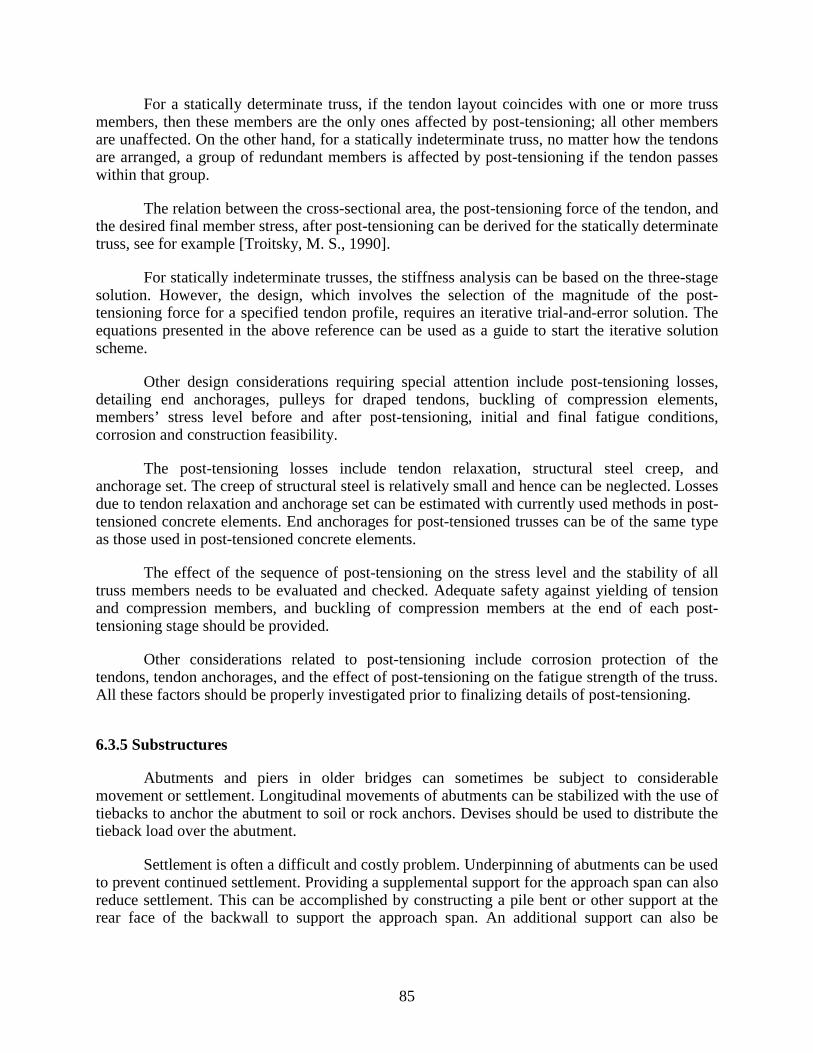
85
For a statically determinate truss, if the tendon layout coincides with one or more truss members, then these members are the only ones affected by post-tensioning; all other members are unaffected. On the other hand, for a statically indeterminate truss, no matter how the tendons are arranged, a group of redundant members is affected by post-tensioning if the tendon passes within that group.
The relation between the cross-sectional area, the post-tensioning force of the tendon, and the desired final member stress, after post-tensioning can be derived for the statically determinate truss, see for example [Troitsky, M. S., 1990].
For statically indeterminate trusses, the stiffness analysis can be based on the three-stage solution. However, the design, which involves the selection of the magnitude of the post-tensioning force for a specified tendon profile, requires an iterative trial-and-error solution. The equations presented in the above reference can be used as a guide to start the iterative solution scheme.
Other design considerations requiring special attention include post-tensioning losses, detailing end anchorages, pulleys for draped tendons, buckling of compression elements, members’ stress level before and after post-tensioning, initial and final fatigue conditions, corrosion and construction feasibility.
The post-tensioning losses include tendon relaxation, structural steel creep, and anchorage set. The creep of structural steel is relatively small and hence can be neglected. Losses due to tendon relaxation and anchorage set can be estimated with currently used methods in post-tensioned concrete elements. End anchorages for post-tensioned trusses can be of the same type as those used in post-tensioned concrete elements.
The effect of the sequence of post-tensioning on the stress level and the stability of all truss members needs to be evaluated and checked. Adequate safety against yielding of tension and compression members, and buckling of compression members at the end of each post-tensioning stage should be provided.
Other considerations related to post-tensioning include corrosion protection of the tendons, tendon anchorages, and the effect of post-tensioning on the fatigue strength of the truss. All these factors should be properly investigated prior to finalizing details of post-tensioning.
6.3.5 Substructures
Abutments and piers in older bridges can sometimes be subject to considerable movement or settlement. Longitudinal movements of abutments can be stabilized with the use of tiebacks to anchor the abutment to soil or rock anchors. Devises should be used to distribute the tieback load over the abutment.
Settlement is often a difficult and costly problem. Underpinning of abutments can be used to prevent continued settlement. Providing a supplemental support for the approach span can also reduce settlement. This can be accomplished by constructing a pile bent or other support at the rear face of the backwall to support the approach span. An additional support can also be
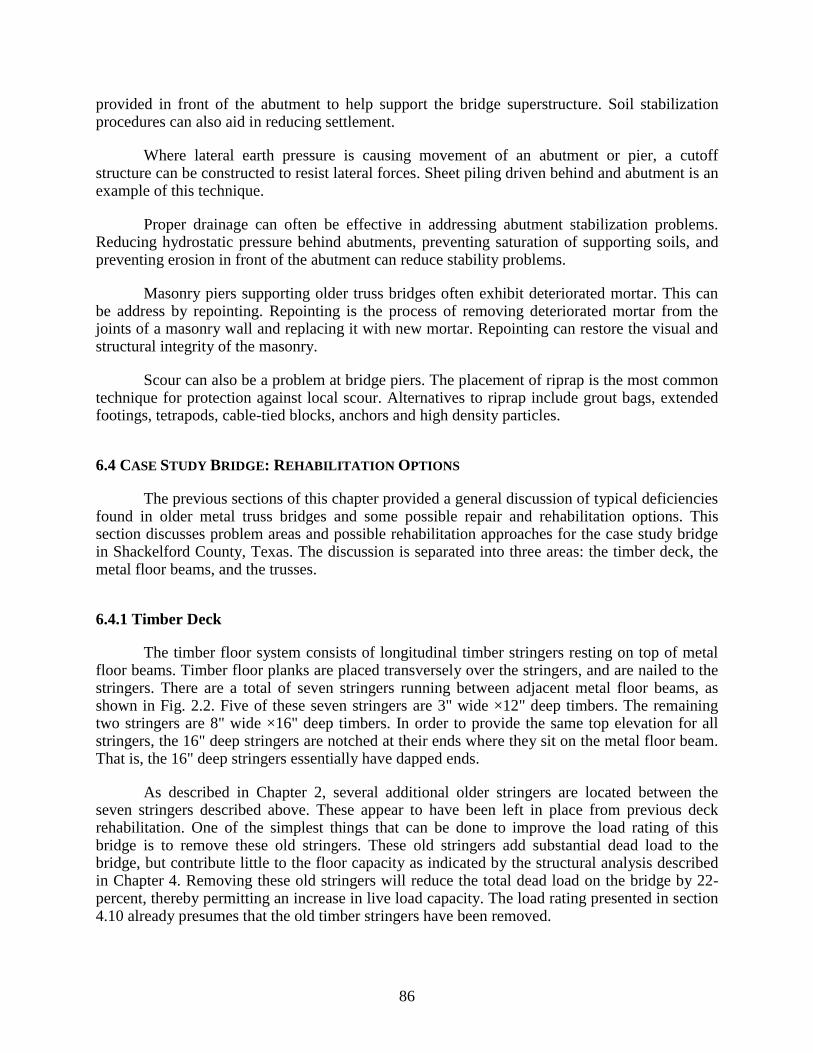
86
provided in front of the abutment to help support the bridge superstructure. Soil stabilization procedures can also aid in reducing settlement.
Where lateral earth pressure is causing movement of an abutment or pier, a cutoff structure can be constructed to resist lateral forces. Sheet piling driven behind and abutment is an example of this technique.
Proper drainage can often be effective in addressing abutment stabilization problems. Reducing hydrostatic pressure behind abutments, preventing saturation of supporting soils, and preventing erosion in front of the abutment can reduce stability problems.
Masonry piers supporting older truss bridges often exhibit deteriorated mortar. This can be address by repointing. Repointing is the process of removing deteriorated mortar from the joints of a masonry wall and replacing it with new mortar. Repointing can restore the visual and structural integrity of the masonry.
Scour can also be a problem at bridge piers. The placement of riprap is the most common technique for protection against local scour. Alternatives to riprap include grout bags, extended footings, tetrapods, cable-tied blocks, anchors and high density particles.
6.4 CASE STUDY BRIDGE: REHABILITATION OPTIONS
The previous sections of this chapter provided a general discussion of typical deficiencies found in older metal truss bridges and some possible repair and rehabilitation options. This section discusses problem areas and possible rehabilitation approaches for the case study bridge in Shackelford County, Texas. The discussion is separated into three areas: the timber deck, the metal floor beams, and the trusses.
6.4.1 Timber Deck
The timber floor system consists of longitudinal timber stringers resting on top of metal floor beams. Timber floor planks are placed transversely over the stringers, and are nailed to the stringers. There are a total of seven stringers running between adjacent metal floor beams, as shown in Fig. 2.2. Five of these seven stringers are 3" wide ×12" deep timbers. The remaining two stringers are 8" wide ×16" deep timbers. In order to provide the same top elevation for all stringers, the 16" deep stringers are notched at their ends where they sit on the metal floor beam. That is, the 16" deep stringers essentially have dapped ends.
As described in Chapter 2, several additional older stringers are located between the seven stringers described above. These appear to have been left in place from previous deck rehabilitation. One of the simplest things that can be done to improve the load rating of this bridge is to remove these old stringers. These old stringers add substantial dead load to the bridge, but contribute little to the floor capacity as indicated by the structural analysis described in Chapter 4. Removing these old stringers will reduce the total dead load on the bridge by 22-percent, thereby permitting an increase in live load capacity. The load rating presented in section 4.10 already presumes that the old timber stringers have been removed.
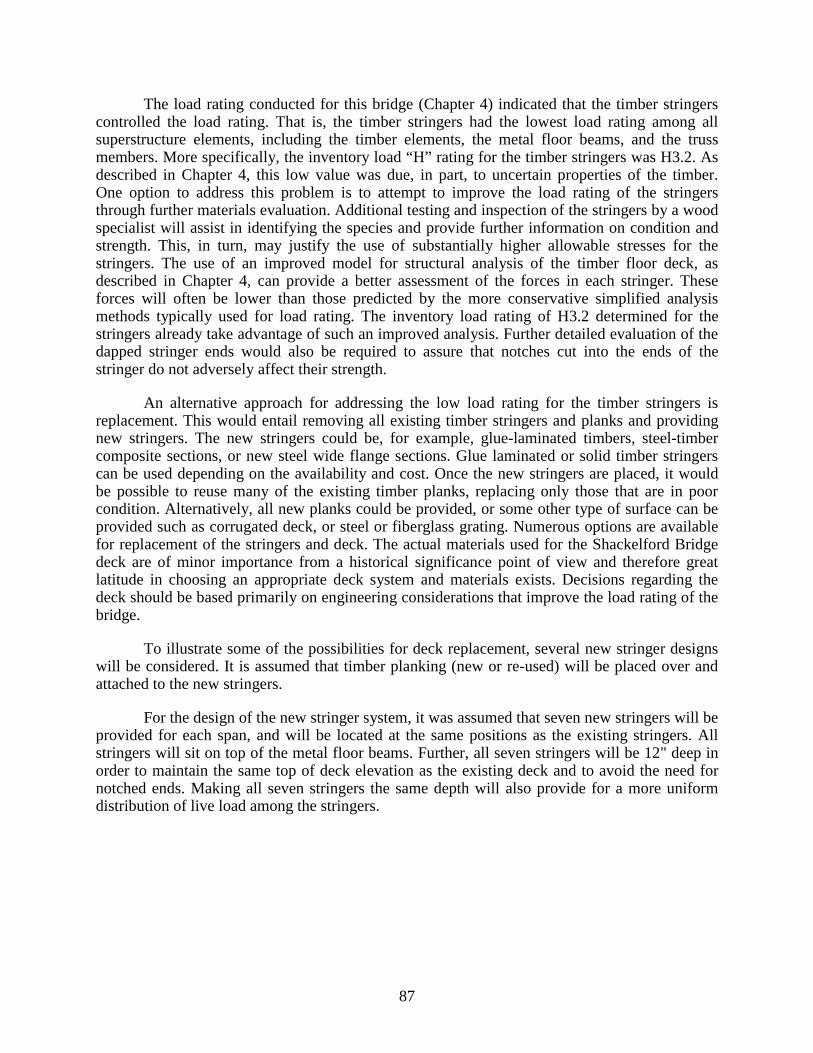
87
The load rating conducted for this bridge (Chapter 4) indicated that the timber stringers controlled the load rating. That is, the timber stringers had the lowest load rating among all superstructure elements, including the timber elements, the metal floor beams, and the truss members. More specifically, the inventory load “H” rating for the timber stringers was H3.2. As described in Chapter 4, this low value was due, in part, to uncertain properties of the timber. One option to address this problem is to attempt to improve the load rating of the stringers through further materials evaluation. Additional testing and inspection of the stringers by a wood specialist will assist in identifying the species and provide further information on condition and strength. This, in turn, may justify the use of substantially higher allowable stresses for the stringers. The use of an improved model for structural analysis of the timber floor deck, as described in Chapter 4, can provide a better assessment of the forces in each stringer. These forces will often be lower than those predicted by the more conservative simplified analysis methods typically used for load rating. The inventory load rating of H3.2 determined for the stringers already take advantage of such an improved analysis. Further detailed evaluation of the dapped stringer ends would also be required to assure that notches cut into the ends of the stringer do not adversely affect their strength.
An alternative approach for addressing the low load rating for the timber stringers is replacement. This would entail removing all existing timber stringers and planks and providing new stringers. The new stringers could be, for example, glue-laminated timbers, steel-timber composite sections, or new steel wide flange sections. Glue laminated or solid timber stringers can be used depending on the availability and cost. Once the new stringers are placed, it would be possible to reuse many of the existing timber planks, replacing only those that are in poor condition. Alternatively, all new planks could be provided, or some other type of surface can be provided such as corrugated deck, or steel or fiberglass grating. Numerous options are available for replacement of the stringers and deck. The actual materials used for the Shackelford Bridge deck are of minor importance from a historical significance point of view and therefore great latitude in choosing an appropriate deck system and materials exists. Decisions regarding the deck should be based primarily on engineering considerations that improve the load rating of the bridge.
To illustrate some of the possibilities for deck replacement, several new stringer designs will be considered. It is assumed that timber planking (new or re-used) will be placed over and attached to the new stringers.
For the design of the new stringer system, it was assumed that seven new stringers will be provided for each span, and will be located at the same positions as the existing stringers. All stringers will sit on top of the metal floor beams. Further, all seven stringers will be 12" deep in order to maintain the same top of deck elevation as the existing deck and to avoid the need for notched ends. Making all seven stringers the same depth will also provide for a more uniform distribution of live load among the stringers.
88
All the timber stringers are 6”x12” deep
Figure 6.1: New timber deck layout with all timber stringers
All timber stringers are 6”x12” deep. The central three stringers arestrengthened with the 1”x12” deep steel plates.
Figure 6.2: New timber deck layout with the steel-timber composite stringers
All the stringers are 12” deep. The three W-shapes are centrallylocated and remaining are 6”x12” deep timber stringers.
Figure 6.3: New timber deck layout with W-shape stringers
Figures 6.1 to 6.3 shows three possible options for stringer replacement. There are, of course, many other suitable options. Figure 6.1 shows the case where all seven new stringers are 6" wide ×12" deep timbers. Treated glue-laminated timber or solid timber stringers can be used depending on availability and cost.
An additional option is the use of steel-timber composite sections, as illustrated in Figure 6.2. Steel plates are attached to the sides of timber sections. Placing the steel plates on the sides enhances both the bending and shear strength of the composite section, and leaves the top free to accept nails for attaching planks. For economy, it may be possible to only provide steel plates in the center three stringers, as shown in the figure. The composite steel-timber stringer sections can be designed based on the procedure presented in [Ryder, G.H., 1957].
A third option is shown in Figure 6.3, where the central three stringers are steel wide flange sections, and the remaining outer stringers are timber. The steel sections could be simply supported between metal floor beams, or could be made continuous over the metal floor beams. Steel wide flange stringers that are continuous would provide greater strength, but may pose problems with transporting, handling and placing very long members. A particular W-shape can be selected based on the desired load rating level. Various connection details to attach timber planks to steel stringer are presented in [Vegesna, S., 1992 and Webb, S. T., 1992].
89
Whatever new deck system is chosen, if its weight is substantially different than the existing deck, the bridge should be reanalyzed considering the new deck weight.
6.4.2 Metal Floor Beams
The metal floor beams are tapered sections, as shown in Figure 2.4. The inventory load rating for the floor beams (Table 4.14) was H10.2 or HS 6.3 based on allowable stress design. Based on this low rating, strengthening of the floor beam may be necessary. Options for increasing the capacity of these metal floor beams are attaching cover plates or structural shapes at top and bottom of the floor beams or providing post-tensioning. The preliminary design for attaching cover plates is presented in sections 6.5.2 and 6.5.3. Detailed discussion on cover plating is presented in [NCHRP #293, 1987 and NCHRP #222, 1980]. Due to the high historical significance of the metal bridge components, care should be taken in the placement and attachment of cover plates so the modification remains unobtrusive to the casual observer.
6.4.3 Truss
As indicated in Section 4.7, the inventory load rating for the truss superstructure (not including metal floor beams) based on allowable stress design, was H16.6 for an H-loading, or HS9.6 for an HS-loading. This relatively high rating may be adequate, depending on the intended future service of the bridge. Should this rating be inadequate, some approaches for strengthening the truss will be presented in the following section.
Even if it is deemed that the current load rating for the truss is adequate for continued vehicular service, some repair and maintenance of the truss is recommended, as follows:
• Bracing and tension rods with turnbuckles should be tightened to remove slack from the rods.
• There is a bent hanger, L1U1, on the downstream truss. Since this is a tension member, the kink in this member should have little impact on member capacity, and it is likely acceptable to leave this bent hanger as is. Nonetheless, the kink in this tension member could potentially lead to a fatigue crack. Consequently, if the member is not repaired, this area should be examined in future routine inspections. If repair of this member is desired, heat straightening techniques can likely be used.
• In general, unless a formal design exception is granted, all bridge railing retrofit by TxDOT is required to meet crash test requirements set forth in NCHRP 350 Recommended Procedures for the Safety Performance Evaluation of Highway Features[NCHRP 1993]. The original railing on the Shackelford Bridge is still in good condition. The railing supports are disconnected from the deck in a number of locations and could be reconnected to the new deck. However, the original railing provides little more than a visual delimiter for vehicles and has little capacity to redirct an errant vehicle. It is therefore not likely to meet NCHRP 350 requirements. The issue of bridge railing retrofit is outside the scope of this report.
90
• The truss members, despite being in service for over one hundred years, exhibit remarkably little corrosion. No paint is currently visible. It appears that the truss can likely be left unpainted, and just inspected periodically for the development of any corrosion problems. Although not essential, painting the bridge will help mitigate future corrosion, and will enhance the aesthetics of the bridge.
• The roller bearings are dislocated from their original position and are filled with debris. The rollers should cleaned, lubricated and properly aligned.
• There are several brackets welded to the bottom tension chord eyebars of the truss. It appears that these welds were likely made with unqualified procedures. Poorly made welds can initiate a fatigue crack. Since these bottom chord eyebars are fracture critical members, these welded brackets represent a potential safety problem. The brackets and welds should be removed from the eyebars. This can be done by carefully grinding off the welds, taking care not to remove material from the eyebars and without introducing nicks or gouges. The area should then be inspected from any cracks using a method such as dye penetrant. Ultrasonic examination of the eyebars in the region of the removed welds can provide further assurance against the presence of cracks.
6.4.4 Substructure and Approach Spans
The masonry piers for the truss should be repaired. This will require regrouting and repointing of open masonry joints. Stone masonry units, which have become dislocated or have fallen out of the pier should be repositioned or replaced as needed. Regrouting and repointing should match the historic appearance in color and texure. Some scour protection, such as the placement of riprap, is recommended at the base of the piers.
The approach spans of the truss bridge were not included in the scope of this study. However, the approach spans are in considerably poorer condition than the truss, and would need to be addressed as part of an overall rehabilitation plan, either by repair or replacement.
6.5 CASE STUDY BRIDGE: REHABILITATION PLAN
To further illustrate options for rehabilitating the case study bridge, three overall rehabilitation plans were considered, as follows:
I) Do nothing;
II) Rehabilitate the bridge for H15 Inventory loading;
III) Rehabilitate the bridge for HS20 Inventory loading.
91
6.5.1 Plan I: Do Nothing
If no strengthening is done to the bridge, the load rating at the inventory level will be H3.2, and will be controlled by the timber stringers. This may be adequate for light vehicles with a load posting on the bridge. The minor repairs described in Section 6.4.3 are still advisable.
6.5.2 Plan II: Rehabilitate the Bridge for H15 Loading
The truss is already adequate for H15 loading at the inventory level, and would only require the repair items noted in section 6.4.3. The timber deck and metal floor beams, however, will require strengthening to an H15 level. For the timber deck, the options suggested in Section 6.4.1 can be used. A new timber deck can be easily designed for an H15 load rating.
The metal floor beams can be strengthened by attaching top and bottom cover plates. Calculations show that cover plates of 6½” width x 3/8” thickness of A36 steel will be sufficient to bring the metal floor beam to H15 load rating. The cover plates can be attached to the floor beams during replacement of the timber stringers. Timber deck dead load and truck load will act on the composite section of the metal floor beam and hence overall sectional properties can be used for load rating calculations. The cover plates can be bolted to the existing floor beams during the timber deck replacement.
6.5.3 Plan III: Rehabilitate the Bridge for HS20 Loading
The trusses, metal floor beams and timber deck would all require strengthening to achieve an HS20 load rating at the inventory level. For the timber deck, the options suggested in the Section 6.4.1 can be used, with the new timber deck designed for an HS20 load rating.
The truss tension chord, hangers and all diagonal members are currently rated below HS20. Hence, major strengthening measures would be needed. For rehabilitation of the tension chord, a wide-flange member can be placed between the pair of existing eyebars and connected to the existing pins with a bent plate. This detail is presented in a paper by Bondi, [Bondi, R.W., 1985]. The hangers will likely need to be replaced with new hangers as the geometry of the cross-section does not easily allow strengthening. The diagonal members can be strengthened either by the addition of new members or by post-tensioning. The other details of the truss i.e. pins, joint details, and the U-bolt connection details at the metal floor beam ends must also be properly evaluated for the higher load levels.
The metal floor beams will require 6½” wide x 1.15” thick top and bottom A36 steel cover plates to increase their bending capacity to achieve an HS20 rating. Bolting cover plates that are over one-inch in thickness to the existing thin flanges of the floor beams may prove problematic. In addition, the floor beam is deficient for shear developed by HS20 truck, and consequently, the web of the tapered beam will also require reinforcement. Strengthening of the web may also prove quite difficult. A more practical solution may be to replace the floor beams either with W-shape beams or with fabricated tapered beams with the required capacity.

92
While increasing the bridge rating to HS 20 is feasible, major modifications would be needed to the deck, floor beams and to the trusses. Thus, while feasible, this option does not appear to be practical or economical for the case study bridge.
93
Chapter 7: Summary and Conclusions
7.1 REVIEW OF PROJECT SCOPE AND OBJECTIVES
This report has documented a study on the structural evaluation and rehabilitation of historic metal truss bridges. More specifically, this study focused on historic “off-system” metal truss bridges in Texas. The term “off-system” indicates that these bridges are not on the state highway system. Rather, off-system bridges are typically located on county roads or city streets. The term “metal” is used to describe these bridges, as they may be constructed using wrought iron, cast iron or steel. There are a large number of older off-system metal truss bridges still in vehicular service in Texas. A number of these are of significant historical interest due to their age and other unique features, and are either listed or eligible for the National Register of Historic Places.
Many of the historic off-system metal truss bridges in Texas were constructed in the late 1800’s and early 1900’s by private bridge companies located in Texas and elsewhere. They were not designed to modern highway bridge loading standards using “H” or “HS” truck loading criteria. In fact, a number of these bridges predate the automobile, and were initially intended to carry horses, livestock, farm vehicles, etc.
Considerable interest exists in maintaining historic metal truss bridges in continued vehicular service. However, achieving this goal is often problematic due to structural and functional deficiencies found in these bridges. The structural load rating can often be very low due to the initial low design loads used for the bridge combined with damage and deterioration that has occurred over the very long service life of the bridge. In addition to structural problems, off-system truss bridges also frequently suffer from functional deficiencies due to narrow widths and constricted vertical clearances. Many off-system historic metal truss bridges in Texas are single lane bridges.
The primary objective of the study reported herein was to address structural issues involved with historic off-system metal truss bridges. More specifically, the objectives were to examine methods that can be used to develop an accurate and realistic load rating for an old metal truss bridge, to examine methods that can be used to strengthen the bridge, if needed, and to address problems of damage and deterioration.
7.2 SUMMARY OF MAJOR PROJECT TASKS AND FINDINGS
In order to investigate structural issues involved with historic metal truss bridges, a case study bridge was chosen as the focus of this study. The case study bridge was used to provide a real-world example of the types of problems encountered in an old metal truss bridge, and to provide a model of evaluation and rehabilitation techniques that can be applied to other off-system truss bridges.
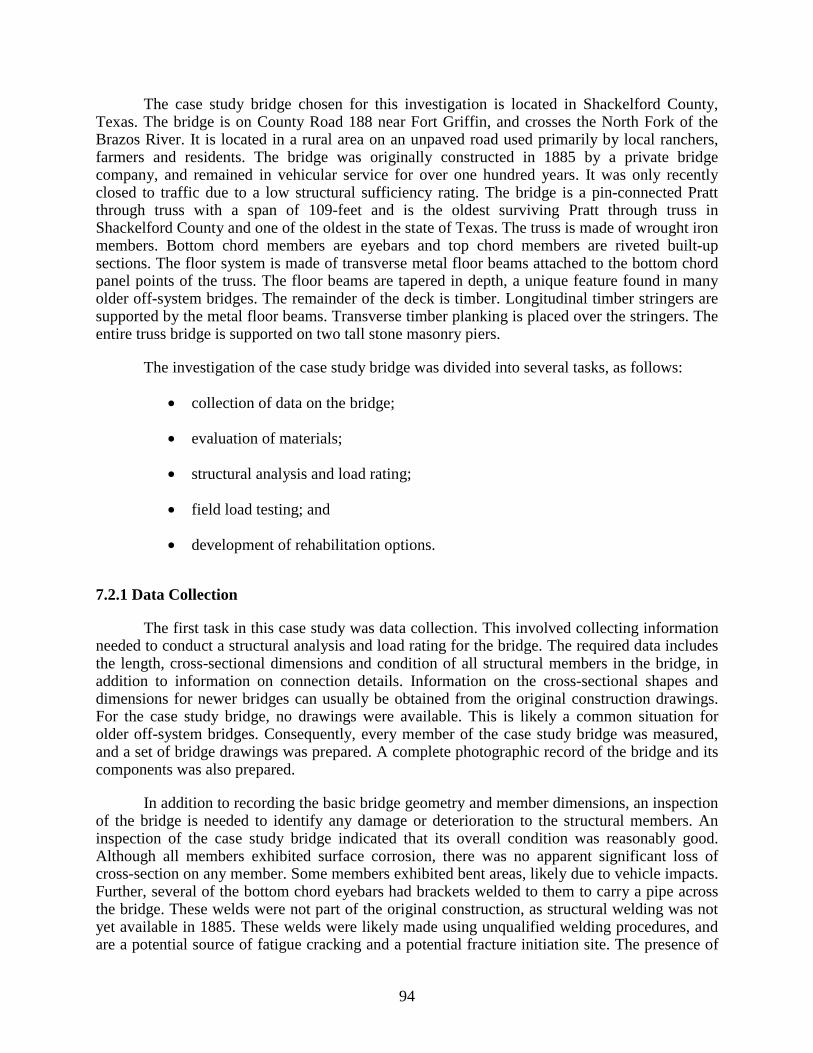
94
The case study bridge chosen for this investigation is located in Shackelford County, Texas. The bridge is on County Road 188 near Fort Griffin, and crosses the North Fork of the Brazos River. It is located in a rural area on an unpaved road used primarily by local ranchers, farmers and residents. The bridge was originally constructed in 1885 by a private bridge company, and remained in vehicular service for over one hundred years. It was only recently closed to traffic due to a low structural sufficiency rating. The bridge is a pin-connected Pratt through truss with a span of 109-feet and is the oldest surviving Pratt through truss in Shackelford County and one of the oldest in the state of Texas. The truss is made of wrought iron members. Bottom chord members are eyebars and top chord members are riveted built-up sections. The floor system is made of transverse metal floor beams attached to the bottom chord panel points of the truss. The floor beams are tapered in depth, a unique feature found in many older off-system bridges. The remainder of the deck is timber. Longitudinal timber stringers are supported by the metal floor beams. Transverse timber planking is placed over the stringers. The entire truss bridge is supported on two tall stone masonry piers.
The investigation of the case study bridge was divided into several tasks, as follows:
• collection of data on the bridge;
• evaluation of materials;
• structural analysis and load rating;
• field load testing; and
• development of rehabilitation options.
7.2.1 Data Collection
The first task in this case study was data collection. This involved collecting information needed to conduct a structural analysis and load rating for the bridge. The required data includes the length, cross-sectional dimensions and condition of all structural members in the bridge, in addition to information on connection details. Information on the cross-sectional shapes and dimensions for newer bridges can usually be obtained from the original construction drawings. For the case study bridge, no drawings were available. This is likely a common situation for older off-system bridges. Consequently, every member of the case study bridge was measured, and a set of bridge drawings was prepared. A complete photographic record of the bridge and its components was also prepared.
In addition to recording the basic bridge geometry and member dimensions, an inspection of the bridge is needed to identify any damage or deterioration to the structural members. An inspection of the case study bridge indicated that its overall condition was reasonably good. Although all members exhibited surface corrosion, there was no apparent significant loss of cross-section on any member. Some members exhibited bent areas, likely due to vehicle impacts. Further, several of the bottom chord eyebars had brackets welded to them to carry a pipe across the bridge. These welds were not part of the original construction, as structural welding was not yet available in 1885. These welds were likely made using unqualified welding procedures, and are a potential source of fatigue cracking and a potential fracture initiation site. The presence of
95
such unqualified welds on the eyebars, which are fracture critical members, was an area of concern. The inspection also revealed that the roller bearings for the bridge were dislocated from their original position, were filled with debris, and were likely no longer functioning as rollers. The portion of the case study bridge which exhibited the greatest degree of deterioration was the timber deck. A number of the timber stingers were in rather poor condition.
The case study bridge exhibited problem areas typical of many older off-system metal truss bridges: corrosion, impact damage, presence of unqualified welds, nonfunctional bearings, and a deteriorated timber deck.
7.2.2 Evaluation of Materials
The second major task in this study was materials evaluation for the bridge. Since no original construction records were available for the bridge, the type and properties of the metal used in the bridge were unknown. Based on the age of the bridge, the material of construction was most likely wrought iron, although this was not completely certain. For evaluation of older bridges, AASHTO (1994) provides a recommended yield stress for metals, based on the age of the bridge. Consequently, these AASHTO specified values could be used for load rating, with no additional materials evaluation or testing required.
For the case study bridge, additional testing was conducted on the bridge metal. The purpose of this testing was to determine if the AASHTO specified material properties were appropriate for the bridge, and to provide additional information that would be useful in evaluating the bridge and addressing problem areas. As part of this evaluation, the material was first examined in the field. Small areas of various members were polished, etched and examined under a magnifying glass. This visual examination revealed the presence of lines of slag, suggesting the material was wrought iron.
As a next step in the materials evaluation process, several small lacing members were removed from the bridge and subjected to laboratory testing. Lacing members were used for this purpose as these could be removed without endangering the safety of the bridge. The critical members of the bridge were the bottom chord eyebars and the metal floor beams. However, a sufficient amount of material to permit laboratory testing could not be removed from these members without adversely affecting their strength.
Laboratory tests conducted on the lacing members included tension testing, hardness testing, chemical analysis, and metallographic examination. These laboratory tests indicated that the material was in fact a high quality wrought iron. The material showed a yield stress approximately 10 ksi higher than the values specified by AASHTO, and also showed good elongation. High quality wrought iron exhibits a number of desirable properties, including resistance to fatigue and fracture, good corrosion resistance, and good weldability. The slag inclusions characteristically found in wrought iron serve as natural barriers to the propagation of cracks and corrosion, and the very low content of carbon and other alloys make most types of wrought iron quite weldable. This type of information is useful when evaluating the potential consequences of various types of damage and for the development of appropriate repair or strengthening procedures.
96
As a last step in the materials evaluation process for the case study bridge, field hardness tests were conducted on a number of bridge members. The purpose of these tests was to compare the hardness of the lacing members with that of other members. These tests indicated that the bridge members showed hardness values very similar to that of the lacing members. This suggested at least some degree of similarity between the laboratory tested lacing members and the other, more critical bridge members such as the eyebars.
Ultimately, when load rating the bridge, the AASHTO specified values of yield stress were used rather than the significantly higher measured values from the lacing members. Despite the similarity of hardness values, there was not complete certainty that the mechanical properties of the lacing members were the same as that of the other members. Nonetheless, the material tests provided confidence that the AASHTO specified values for material yield strength was safe, and likely quite conservative. Further, the data provided by the materials tests provided valuable information to aid in the overall evaluation of the bridge.
The materials evaluation tests conducted on the case study bridge were all standard tests that can be performed inexpensively by most testing laboratories. Further, these tests provided a great deal of useful information on the bridge. The use of such simple material testing techniques appears to be a highly useful and cost-effective measure for evaluation of historic off-system metal truss bridges.
7.2.3 Structural Analysis and Load Rating
The next major task in this study was structural analysis and load rating. This task was separated into three analyses: the trusses, the metal floor beams, and the timber deck. The trusses were analyzed with simple classical analysis methods that can be done by hand, as well as with computer models. Several computer models were examined, including two and three-dimensional models, as well as models that included fixity at some truss joints. All models predicted essentially the same member forces. This work suggested that the use of advanced computer models offered no significant advantages for the trusses. Simple hand methods of analysis or simple computer models of the truss appear quite adequate. The trusses of the case study bridge, typical of many off-system trusses, are simple structures with a low degree of redundancy. Consequently, there are few alternate load paths within the truss, and simple methods of analysis are appropriate.
Interestingly, data collected in the subsequent field load tests showed measured stresses that differed significantly from those predicted by the structural analyses described above. These differences were attributed to modeling issues related to the truss supports. The actual trusses have roller supports at one end of the bridge. The structural models of the trusses therefore also employed roller supports. The field load test data suggested that these rollers were not functioning properly and were not permitting free horizontal movement, as intended. Consequently, the actual behavior of the trusses was significantly different than predicted by the structural models. This observation does not suggest the need for more advanced structural models, such as three-dimensional models. Simple two-dimensional models can still provide reasonable predictions of structural response. However, the possibility that rollers on the bridge may not be functioning properly should be reflected in the model, by replacing the roller support (horizontal movement permitted) with a pin support (horizontal movement restrained). It is
97
recommended that trusses be analyzed for both conditions to bound the possible range of member responses.
Very simple analysis methods were also used for the metal floor beams. These members were analyzed as simply supported beams, with loads applied at the location of the timber stringers. The floor beams were non-prismatic members, with the depth varying over the length of the member. The variable depth was considered in the analysis of the members, but posed no particular complication. The accuracy of this very simple model for the metal floor beams was later confirmed in the field load test of the bridge.
The final analysis conducted for the bridge was for the timber stringers. A key issue in this analysis was the distribution of wheel loads to the stringers. The stringers were first analyzed using simple hand methods of analysis with AASHTO (1996) specified distribution factors. Various computer models were also developed of the floor system, including a three dimensional model. The computer models showed significantly lower forces in the timber stringers than the simple AASHTO procedures. Consequently, while the use of advanced computed models did not appear to be of value for the trusses or for the metal floor beams, they appear to offer some advantage in obtaining a better estimate of member forces in the floor stringers. Further, while these computer models require more effort than the simplified AASHTO procedures, these models are still relatively simple, and can be developed using commonly available commercial structural analysis software.
After completion of the structural analysis, load ratings were developed for the bridge using AASHTO procedures. Inventory and operating level ratings were developed using both the allowable stress design (ASD) and load factor design (LFD) procedures in AASHTO. Further, the bridge was rated for both an “H” truck and for an “HS” truck. Results of the load rating were essentially the same using the ASD or LFD procedures.
The inventory load rating for the truss (not including the floor system) was H16.6 for an “H” truck, or approximately HS10 for an “HS” truck. The load rating for the truss was controlled by the bottom chord eyebars. The inventory rating for the metal floor beams was H10.2 for an “H” truck, or HS6.3 for an “HS” truck. The timber stringers had the lowest load rating among all bridge components. Only an “H” rating was developed for the timber stringers. The inventory rating for the timber stringers was H3.2.
7.2.4 Field Load Testing
The next major task undertaken in the case study was field load testing. Two field load tests were conducted on the bridge. In each test, a number of bridge members were instrumented with strain gages. A vehicle with known axle weights was then passed over the bridge, and readings were taken from the gages. The measured strains were converted to stresses, and then compared to the stresses predicted by a structural analysis of the bridge for the same vehicle. The purpose of the field test was to evaluate the accuracy of the structural analysis and to help identify any potential problem areas in the bridge. Only the metal truss members and metal floor beams were instrumented. Although the timber stringers were critical for the load rating, these were not instrumented in the load test, as interpreting strain data for a timber member would have been difficult and likely inconclusive. Further, it was assumed that the timber would likely be replaced as part of any bridge rehabilitation plan.
98
Several observations were made from the field load test. First, it was found that interpretation of the field data was quite difficult for truss members with built-up cross-sections. Members made of various shapes and plates that are riveted together exhibited very complex distributions of stress among the elements of the cross-section. It was found that even with a large number of gages on the cross-section, it was quite difficult to reliably estimate the axial force in the member from the strain gage data.
The field load test data for the simpler, single element members such as eyebars, rods, and hangers could be interpreted more clearly. Although all of these members exhibited bending in varying degrees, the axial force in the members could still be accurately estimated by using a sufficient number of gages over the cross section of the member.
Evaluation of the reliable field load data indicated that the truss behaved somewhat differently than predicted by a simple structural model. The largest differences occurred in the bottom chord eyebars. The field-measured stresses were typically much smaller than those predicted by structural analysis. Interestingly, for some loading cases, the field data showed compressive stresses in the bottom chord eyebars. As described earlier, this anomaly was ultimately attributed to the bridge’s nonfunctional roller bearings. By not permitting free horizontal movement at the rollers, the bridge exhibited a degree of arch action in resisting loads. To examine this hypothesis, the structural model for the bridge was modified to restrict horizontal movement at the roller. For this model, the analysis showed similar trends in the bottom chord stresses as seen in the field data. However, it was deemed that these lower measured stresses in the bottom chord could not be used to increase the load rating of the bridge, as the roller bearings may move at larger loads or after receiving maintenance.
The metal floor beams were also instrumented in the field load test. The stresses measured in the beams showed very close agreement with those predicted from the simple analysis model used for the beams.
In addition to providing valuable data on the overall structural response of the bridge, the field load test was also useful for diagnosing the problem with the nonfunctioning roller bearings. Interestingly, the field test data indicated that the nonfunctioning roller bearings were not detrimental to the live load capacity of the bridge, and were even somewhat beneficial by reducing tension stress levels in the critical bottom chord members. Ultimately, however, nonfunctional roller bearings can cause other problems associated with the development of additional stresses due to constrained thermal movements of the bridge or due to substructure movements. An interesting phenomenon observed in a number of off-system truss bridges is buckled eyebars in the bottom “tension” chord of the truss. This appears to be due to compressive stresses in the eyebars developed when the roller bearings have frozen, and the bridge piers have moved or tilted slightly inwards. Due to the very low buckling capacity of an eyebar, only very small movements of the piers are needed to cause buckling of the bottom chord if the roller bearings are not properly functioning.
Based on the experience of this case study, it appears that field load testing is not likely justified for most historic off-system metal truss bridges. Field load testing can be a difficult and costly undertaking, requiring specialized equipment and expertise. Further, interpretation of the field data requires considerable experience and judgment, and can be quite difficult and time consuming. While very useful in the context of a research project, field load testing is not likely a cost-effective measure for routine evaluation purposes. Nonetheless, for particularly critical or
99
complex bridges, field load testing can provide very useful insights into the behavior of the bridge, and may be justified in some cases. Based on lessons learned from this research project, several recommendations with regard to planning and executing field load tests are provided in Chapter 5.
7.2.5 Development of Rehabilitation Options
The final task of this study was to evaluate options to rehabilitate the case study bridge so that it can be returned to vehicular service. The required rehabilitation measures depend, in part, on the desired load rating of the bridge. For new bridges or for bridges on the state highway system, a load rating of HS20 is generally required. However, for many historic off-system metal truss bridges, developing an HS20 load rating is not practical, and is not likely needed. For the traffic demands on these bridges, a lower HS or H rating may be quite acceptable, combined possibly with a load posting on the bridge. The desired load rating depends on local traffic conditions and the types of vehicles expected to use the bridge, and must be established on a case by case basis.
For the case study bridge, several possible load rating scenarios were investigated. All of the scenarios had several items in common. In all cases, it was assumed that the existing timber stringers would be replaced due to their rather poor condition and uncertain load capacity. It was also assumed that damaged truss members would be repaired. For the case study bridge, this would require straightening of bent members and removal of the welds holding pipe brackets on the bottom chord eyebars. These repairs can likely be accomplished quite easily and inexpensively. Finally, the roller bearings should be realigned and cleaned.
An inventory load rating of H10 (or HS6) would result for this bridge by replacing the timber deck and by making the minor repairs noted above. This load rating can therefore be achieved without the need for any strengthening measures for any metal component of the bridge, i.e., without any strengthening required for the metal floor beams or for the truss members.
To achieve an H15 rating (or HS10) would require replacement of the timber stringers as well as strengthening of the metal floor beams. Larger timber stringers would be needed to achieve an H15 rating. Alternatively, composite timber-steel stringers could be used, or steel wide flange stringers could be used. The metal floor beams would also need to be strengthened. This could be accomplished by a variety of methods, including the addition of thin cover plates bolted to the existing member. No strengthening would be required of the truss, as it already satisfies an H15 rating (or HS 10).
The final option evaluated was rehabilitating the bridge to achieve an HS20 rating. Substantial strengthening would be needed for the stringers, metal floor beams, and a number of truss members. The metal floor beams would require the addition of very thick cover plates or other strengthening measures, or replacement with new steel floor beams. The truss itself would also require major strengthening. This could be accomplished by replacing understrength members, supplementing understrength members with additional members, post tensioning of the bottom chord, and a variety of other techniques. Developing an HS20 rating is likely to require very major and costly modifications to the bridge.
100
In summary, the results of the investigation of the case study bridge indicate that the bridge can likely be returned to vehicular service with an H10 or H15 rating, with only minor repairs, replacement of the timber stringers, and minor strengthening measures. With continued inspection and maintenance, this bridge should be capable of providing many more years of service. The investigation also indicated that returning the bridge to service with an HS20 rating will require major strengthening measures, and is not likely a practical option.
7.3 CONCLUSIONS
The results of this investigation and the detailed evaluation of the case study bridge have demonstrated a number of techniques useful for load rating, repairing and strengthening of historic off-system metal truss bridges. While these bridges typically exhibit a number of apparent structural deficiencies, many of these deficiencies can be addressed using simple and cost effective remedies. As demonstrated by the case study bridge, only minor repair and strengthening measures may be needed to allow continued use of the bridge in vehicular service. Of course, not all historic metal truss bridges can be saved. In some cases, the deterioration, damage or inherent lack of strength will be so severe as to practically preclude structural rehabilitation. However, in many other cases, only a small additional effort may be all that is required to save an important historical resource.
101
References
Alibe, B. (1990). “Characteristics of columns with uncertain end restraint.” Journal of Structural Engineering, 116 (6), 1522-1534.
American Association of State Highway and Transportation Officials, (AASHTO). (1996). “Standard Specification for Highway bridges.” Washington, D.C.
American Association of State Highway and Transportation Officials, (AASHTO). (1994). “Manual for condition evaluation of bridges.” Washington, D.C.
American Association of State Highway and Transportation Officials, (AASHTO). (1989). “Guide specifications for strength evaluation of existing steel and concrete bridges.” Washington, D.C.
American Association of State Highway and Transportation Officials, (AASHTO). (1989a). “Guide specifications for fatigue design of steel bridges.” Washington, D.C.
American Concrete Institute, (ACI) (1985). “Rehabilitation, renovation, and preservation of concrete and masonry structures.” Sabnis, G.M., editor, special publication No. 85.
American Society of Civil Engineers, (ASCE) (1982). “Evaluation, Maintenance and Upgrading of Wood Structures – A Guide and Commentary.”
American Society of Civil Engineers, (ASCE) (1986a). “Evaluation and Upgrading of Wood Structures –Ccase Studies.” Vijay K.A. Gopu, Editor.
American Society of Civil Engineers, (ASCE). (1986b). “Experimental assessment of performance of bridges.” Wang, L.R.L. and Sabnis, G.M., editors.
American Standards for Testing of Materials, (ASTM). (1973) “Metallography – A practical tool for correlating the structure and properties of material.” special technical publication No. 557.
Arnold, L. K. and Walker, R. E. (1953). “Wood Preservation.” Iowa Engineering Experiment Station, LI (41), Department of Civil Engineering, Iowa State College, Ames, Iowa. Iowa Engineering Experiment Station Bulletin No. 174.
Aston, J. (1936). “Wrought iron: Its manufacture, characteristics and applications.” A. M. Byers, Pittsburgh, PA.
Avent, R. R. (1985). “Decay, weathering and epoxy repair of timber.” The Journal of Structural Engineering, 111 (2), 328-342.
Avent, R.R. (1989). “Heat-straightening of steel: Fact and fable.” Journal of Structural Engineering, 115 (11), 2773-2793.
102
Ayyub, B.M., Ibrahim, A., and Schelling, D. (1990). “Posttensioned trusses: Analysis and design.” Journal of Structural Engineering, 116 (6), 1491-1506.
Ayyub, B.M. and Ibrahim, A. (1990). “Posttensioned trusses: Reliability and redundancy.” Journal of Structural Engineering, 116 (6), 1507-1521.
Badoux, M. and Sparks, P. (1998). “Fracture critical study of an historic wrought iron bridge.” Structural Engineering International, 2, 136-139.
Bahaa Machaly, E., (1986). “Buckling contribution to the analysis of steel trusses.” Computersand Structures, 22 (3), 445-458.
Bakht, B. and Csagoly, P.F. (1977). “Strengthening and widening of steel pony truss bridges.” Canadian Journal of Civil Engineering, 4, 214-225.
Bakht, B. and Jaeger, L.G. (1987). “Behavior and evaluation of pin-connected steel truss bridges.” Canadian Journal of Civil Engineering, 14, 327-335.
Bakht, B. and Jaeger, L.G. (1990). “Bridge testing – A surprise every time.” The Journal of Structural Engineering, 116 (5), 1370-1383.
Barr, B. I. G., Evans, H. R. and Harding, J. E. (1994). “Bridge assessment management and design.” Proceedings of the Centenary Year Bridge Conference, Cardiff, UK, 26-30.
Beauchamp, J.C., Chan, M.Y.T. and Pion, R.H. (1984). “Repair and evaluation of a damaged truss bridge – Lewes, Yukon River.” Canadian Journal of Civil Engineering, 11, 494-504.
Belenya, E.I. and Gorovskii, D.M. (1971/72). “The analysis of steel beams strengthening by a tie rod.” I.C.E. monthly, 2 (9), 412-419.
Bettigole, N. H. and Robinson, R. (1997). “Bridge decks: Design, construction, rehabilitation, and replacement.” ASCE Press.
Bondi, R.W. (1985). “Adding redundancy to fracture critical 2-eyebar members in a cantilever truss bridge.” Proceedings of second annual International Bridge Conference, Engineers’ Society of Western Pennsylvania, Pittsburgh, Pennsylvania.
Bondi, R.W. (1985a). “Pin replacement on a 100-year-old Whipple truss bridge.” Proceedings of second annual International Bridge Conference, Engineers’ Society of Western Pennsylvania, Pittsburgh, Pennsylvania.
Bousfield, B. (1992). “Surface preparation and microscopy of materials.” John-Wiley & Sons, Inc.
Boving, K. G. (1989). “NDE handbook: Non-destructive examination methods for condition monitoring.” Bason, F., translator, Butterworths, England.
Bray D. E. and McBride D. (1992). “Nondestructive testing techniques.” John-Wiley & Sons, Inc.
103
Brinckerhoff, P. (1993). “Bridge inspection and rehabilitation: A practical guide.” Silano, L.G., Henderson, A.C., editors, John-Wiley & Sons, Inc.
Cain, J. R. (1924). “Influence of sulfur, oxygen, copper and manganese on the red-shortness of iron.” Department of Commerce, Bureau of Standards, Technologic papers of the bureau of standards, 18(261).
Carver, D. R. and Hanson, N. W. (1953). “A determination of the stiffness factors of the upper chord of a continuous pony truss bridge.” Engineering Experiment Station, Kansas State College Bulletin No. 68, Department of Applied Mechanics, Kansas State College, Manhattan, Kansas.
Chajes, M.J., Kaliakin, V.N., Holsinger, S.D. and Meyer, A.J., Jr. (1995). “Experimental testing of composite wood beams for use in Timber bridges.” Fourth International Bridge Engineering Conference, 2, 371-380.
Clauser, H. R., Fabian, R., Peckner, D., and Riley, M. W. (1963). “The encyclopedia of engineering materials and processes.” Reinhold Pub. Corp., New York.
Clifton, J.R. (1985). “Nondestructive evaluation in rehabilitation and preservation of concrete and masonry materials.” Rehabilitation, Renovation, and Preservation of concrete and masonry structures, ACI-SP-85, 19-29.
Cole H. A, Jr. and Reed R. E. Jr. (1974). “Detection of structural deterioration in bridges.” ASCE, Specialty Conference on Metal Bridges, 411-436.
Column Research Council (CRC). (1966). “Guide to design criteria for metal compression members.” Johnston, B. G., editor.
Csagoly, P.F. and Bakht, B. (1978). “In-plane buckling of steel trusses.” Canadian Journal of Civil Engineering, 5, 533-541.
Ensminger, D. (1988). “Ultrasonics: Fundamentals, technology, and application.” Marcel Dekker, Inc. New York.
Fattal, S. G. and Cattaneo, L. E. (1975). “Evaluation of structural properties of masonry in existing buildings.” US National Bureau of Standards Building Science Series No. 62.
Fisher, J.W., Yen, B.T. and Wang, D. “Corrosion and its influence on strength of steel bridge members.” Transportation Research Board 1290.
Fisher, J.W. (1976). “Detection and repair of fatigue cracking in highway bridges.” Transportation Research Board, Washington, D.C.
Fisher, J.W. and Menzemer, C. (1990). “Bridge repair Methods: U.S./Canadian practice.” BridgeEvaluation, Repair and Rehabilitation, Nowak, A.S., editor, 495-512, Kluwer Academic Publishers.
Frangopol, D.M. and Nakib, R. “Effects of damage and redundancy on the safety of existing bridges.” Transportation Research Board 1290, 9-16.
104
Frank, K. H. (1974). “Mechanical and chemical properties of selected steels used in bridge structures.” FHWA-RD-75-79.
Ghosn, M. (1995). “Redundancy in highway bridge superstructure.” Fourth International Bridge Engineering Conference, 2, 338-348.
Goebbels, K. (1994). “Material characterization for process control and product conformity.” CRC Press.
Green, M. (1985). “Masonry rehabilitation: Practice and research.” Rehabilitation, Renovation, and Reconstruction of Buildings, ASCE, 84-92.
Griffith, J. H. and Bragg, J. G. (1918). “Tests on large bridge columns.” Technologic Papers of the Bureau of Standards No. 101, Department of Commerce, Washington, D.C.
Hambly, E.C. (1979). “Bridge foundation and substructure.” Department of the Environment, Building Research Establishment Report.
Harding, J. E., Parke, G. E. R. and Ryall M. J. (1996). “Bridge Management 3: Inspection, Maintenance, Assessment and Repair.” E & FN SPON.
Historic American Engineering Record, (HAER). 1996. “Fort Griffin Iron Truss Bridge”, HAER No. TX-63, the report prepared as a part of the Texas Historic Bridge Recording Project sponsored by the Texas Department of Transportation.
Holt, E. C. Jr. (1956). “The lateral stability of Pony truss bridge chords.” PhD thesis, Department of Civil, Environmental, and Architectural Engineering, The Pennsylvania State University.
International Bridge Conference. (1986). “Proceedings of Third Annual International Bridge Conference.” Engineers’ society of western Pennsylvania, Pittsburgh.
Jáuregui, D.V. (1999). “Measurement-based evaluation of non-composite steel girder bridges.” PhD thesis, Department of Civil Engineering, The University of Texas at Austin, Austin, Texas.
Jones, J.S. (1995). “Alternatives to riprap as a scour countermeasure.” Fourth International Bridge Engineering Conference, 2, 261-278.
Kehl G. L. (1949). “The principles of metallographic laboratory practice.” The McGraw-Hill Book Co., New York.
Kent, W. (1916). “The mechanical engineers’ pocket-book.” John-Wiley & Sons, Inc.
Kerekes, F and Hulsbos, C. L. (1954). “Elastic Stability of the top chord of a three-span continuous pony truss bridge.” Iowa Engineering Experiment Station, LIII (1), Department of Civil Engineering, Iowa State College, Ames, Iowa. Iowa Engineering Experiment Station, Bulletin No. 177.
105
Kim, J.B., Brungraber, R.J., and Yadlosky, J.M. (1984). “Truss bridge rehabilitation using steel arches.” Journal of Structural Engineering, 110 (7), 1589-1597.
Kingsley, G. R. and Noland, J. L. (1988). “Nondestructive methods for evaluation of masonry structures.” Agbablan, M.S. and Maari, S.F., editors, Proceedings of the International Workshop on Nondestructive Evaluation for Performance of Civil Structures, Los Angles, California, 252-261.
Lash, S. D. and Joyce, T. C. R. (1962). “Laboratory tests of a full scale pony truss bridge part 1: Test with a laminated timber deck.” Department of Civil Engineering, Queen’s University, Kingston, Ontario, Canada, Ontario Joint Highway Research Program Report No. 16.
Li, G. (1987). “Analysis of box girders and truss bridges.” China Academic Publisher and Springer-Verlag, New York.
Mack, R.C., de Teel, P.T. and Askins, J.S. (1980). “Repointing mortar joints in historic brick buildings.” Preservation Briefs: 2, HCRS, US Department of the Interior.
Mark, L.S. (1930). “Marks’ mechanical engineering handbook.” The McGraw-Hill Co., New York.
Martin, R.A. and Iffland, J.S.B. (1983). “Marine Parkway bridge truss member replacement.” Journal of Structural Engineering, 10 (7), 1602-1616.
Mazurek, D. F. and DeWolf, J. T. (1990). “Experimental study of bridge monitoring technique.” The Journal of Structural Engineering, 116 (9), 2532-2549.
Melaragno, M. (1998). “Preliminary design of bridges for architects and engineers.” Marcel Dekker, Inc.
Mills, A. P., Hayward, H. W., Rader, L. F. (1939). “Material of construction: Their manufacture and properties.” John-Wiley & Sons, Inc., New York.
Miner, D. F. and seasstone, J. B. (1955). “Handbook of engineering materials.” John-Wiley & Sons, Inc.
Narayanan, R. (1988). “Axially compressed structures: Stability and strength.” Applied Science Publisher.
National Academy of Science (1952). “Distribution of load stresses in highway bridges.” National Research Council Publication No. 253.
National Cooperative Highway Research Program, NCHRP #222. 1980. “Bridges on secondary highways and local roads.” Transportation Research Board, Washington, D.C.
National Cooperative Highway Research Program, NCHRP #271. 1984. “Guidelines for evaluation and repair of damaged steel bridge members.” Transportation Research Board, Washington, D.C.

106
National Cooperative Highway Research Program #293. 1987. “Methods of strengthening existing highway bridges.” Klaiber, F.W., Dunker, K.F., Wipf, T.J., and Sanders W.W., authors, Transportation Research Board, Washington, D.C.
National Cooperative Highway Research Program #350. 1993. “Recommended procedures for the safety performance evaluation of highway features.” Ross, H.E., Sicking, R.A. and Zimmer, R.A., authors, Transportation Research Board, Washington, D.C.
NDTech. “Operating instructions for the MiniBrinellerTM portable hardness tester.” NDTech, New Jersey.
Nowak, A.S. and Ritter, M.A. (1995). “Load and Resistance factor design code for wood bridges.” Fourth International Bridge Engineering Conference, 2, 351-357.
Organization for Economic Cooperation and Development (1979). “Evaluation of load carrying capacity of bridges.” Road Research, Paris.
Planck, S.M., Klaiber, F.W. and Dunker, K.F. (1993). “Postcompression and superimposed trusses for bridge rehabilitation.” Journal of Structural Engineering, 119 (3), 978-991.
Pullaro, J.J. and Sivakumar, B. (1990). “Increasing the capacity of bridge truss tension members via post tensioning strands.” Proceedings of second workshop on bridge engineering research in progress, National Science Foundation and Civil Engineering Department, University of Nevada, Reno, 107-109.
Rawdon, H. S. and Epstein, S. (1924). “The nick-bend test for wrought iron.” Department of Commerce, Bureau of Standards, Technologic papers of the bureau of standards, 18(252).
Rawdon, H. S. (1917). “Some unusual features in the microstructure of wrought iron.” Department of Commerce, Bureau of Standards, Technologic papers of the bureau of standards, 97.
Ritter, M.A., Wacker, J.P. and Tice, E.D. (1995). “Design, construction, and evaluation of timber bridge constructed of cottonwood lumber.” Fourth International Bridge Engineering Conference, 2, 358-370.
Ryder, G.H. 1957. “Strength of Materials.” Cleaver-Hume Press, London.
SAP2000 analysis reference vol. I and II – version 6.1. (1997). Computers and Structures, Inc., Berkeley, California.
Saraf, V.K. and Nowak, A.S. (1996). “Bridge evaluation using proof load testing.” Recent advances in bridge engineering, Casas, J.R., Klaiber, E.W., and Mari, A.R., editors, CIMNE, Barcelona, Spain.
Sedlacek, G., Hensen, W., and Axchen, R. (1992). “New design methods for the rehabilitation of old steel bridges.” Proceedings of the Third International Workshop on Bridge Rehabilitation, Gert König and A.S.Nowak, editors, The Technical University of Darmstadt and The University of Michigan, 301-317.
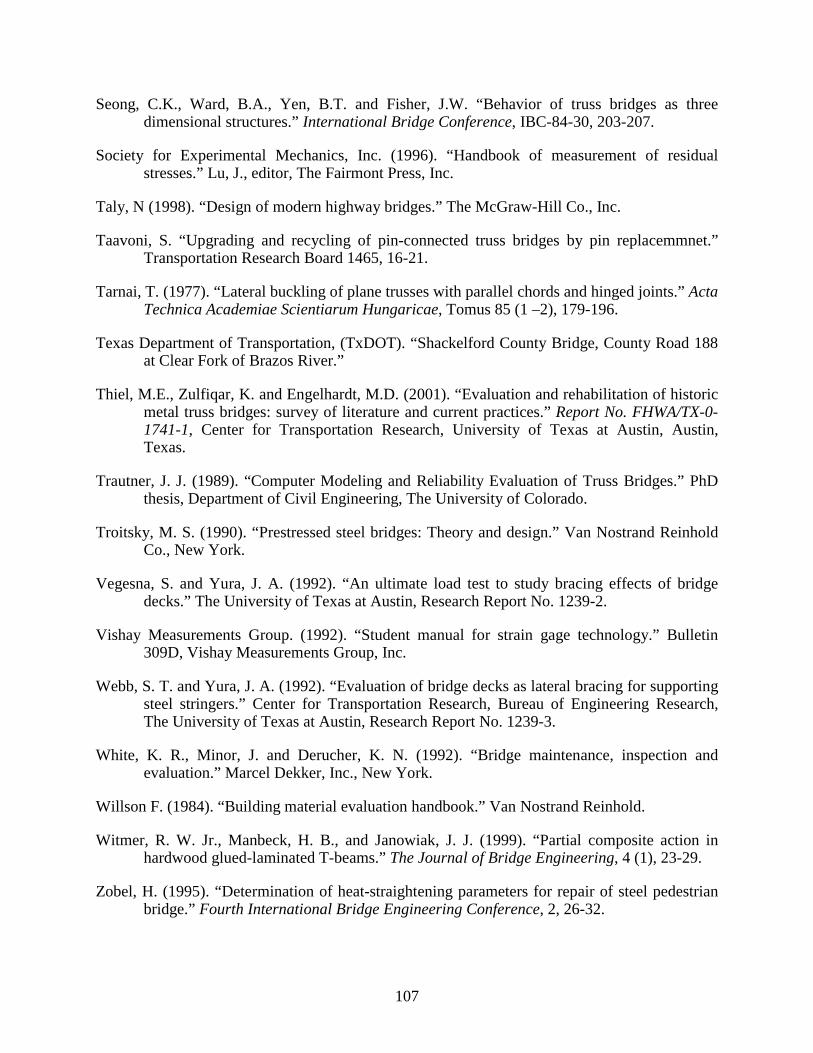
107
Seong, C.K., Ward, B.A., Yen, B.T. and Fisher, J.W. “Behavior of truss bridges as three dimensional structures.” International Bridge Conference, IBC-84-30, 203-207.
Society for Experimental Mechanics, Inc. (1996). “Handbook of measurement of residual stresses.” Lu, J., editor, The Fairmont Press, Inc.
Taly, N (1998). “Design of modern highway bridges.” The McGraw-Hill Co., Inc.
Taavoni, S. “Upgrading and recycling of pin-connected truss bridges by pin replacemmnet.” Transportation Research Board 1465, 16-21.
Tarnai, T. (1977). “Lateral buckling of plane trusses with parallel chords and hinged joints.” Acta Technica Academiae Scientiarum Hungaricae, Tomus 85 (1 –2), 179-196.
Texas Department of Transportation, (TxDOT). “Shackelford County Bridge, County Road 188 at Clear Fork of Brazos River.”
Thiel, M.E., Zulfiqar, K. and Engelhardt, M.D. (2001). “Evaluation and rehabilitation of historic metal truss bridges: survey of literature and current practices.” Report No. FHWA/TX-0-1741-1, Center for Transportation Research, University of Texas at Austin, Austin, Texas.
Trautner, J. J. (1989). “Computer Modeling and Reliability Evaluation of Truss Bridges.” PhD thesis, Department of Civil Engineering, The University of Colorado.
Troitsky, M. S. (1990). “Prestressed steel bridges: Theory and design.” Van Nostrand Reinhold Co., New York.
Vegesna, S. and Yura, J. A. (1992). “An ultimate load test to study bracing effects of bridge decks.” The University of Texas at Austin, Research Report No. 1239-2.
Vishay Measurements Group. (1992). “Student manual for strain gage technology.” Bulletin 309D, Vishay Measurements Group, Inc.
Webb, S. T. and Yura, J. A. (1992). “Evaluation of bridge decks as lateral bracing for supporting steel stringers.” Center for Transportation Research, Bureau of Engineering Research, The University of Texas at Austin, Research Report No. 1239-3.
White, K. R., Minor, J. and Derucher, K. N. (1992). “Bridge maintenance, inspection and evaluation.” Marcel Dekker, Inc., New York.
Willson F. (1984). “Building material evaluation handbook.” Van Nostrand Reinhold.
Witmer, R. W. Jr., Manbeck, H. B., and Janowiak, J. J. (1999). “Partial composite action in hardwood glued-laminated T-beams.” The Journal of Bridge Engineering, 4 (1), 23-29.
Zobel, H. (1995). “Determination of heat-straightening parameters for repair of steel pedestrian bridge.” Fourth International Bridge Engineering Conference, 2, 26-32.

108
Zuk, W. and McKeel, W.T., Jr. “Adaptive use of historic metal truss bridges.” Transportation Research Board 834.
Zulfiquar, K. (1998). “Preservation alternatives for the historic metal truss bridges: Literature survey.” Master’s report, Department of Civil Engineering, The University of Texas at Austin, Austin, Texas.

109
Appendix A: Photographs of the Case Study Bridge
This appendix presents a series of photographs of the case study bridge in Shackelford County, Texas. All photos were taken during spring 1999. Designations for bridge components referred to in these photographs are identified in the bridge drawings shown in Appendix B.
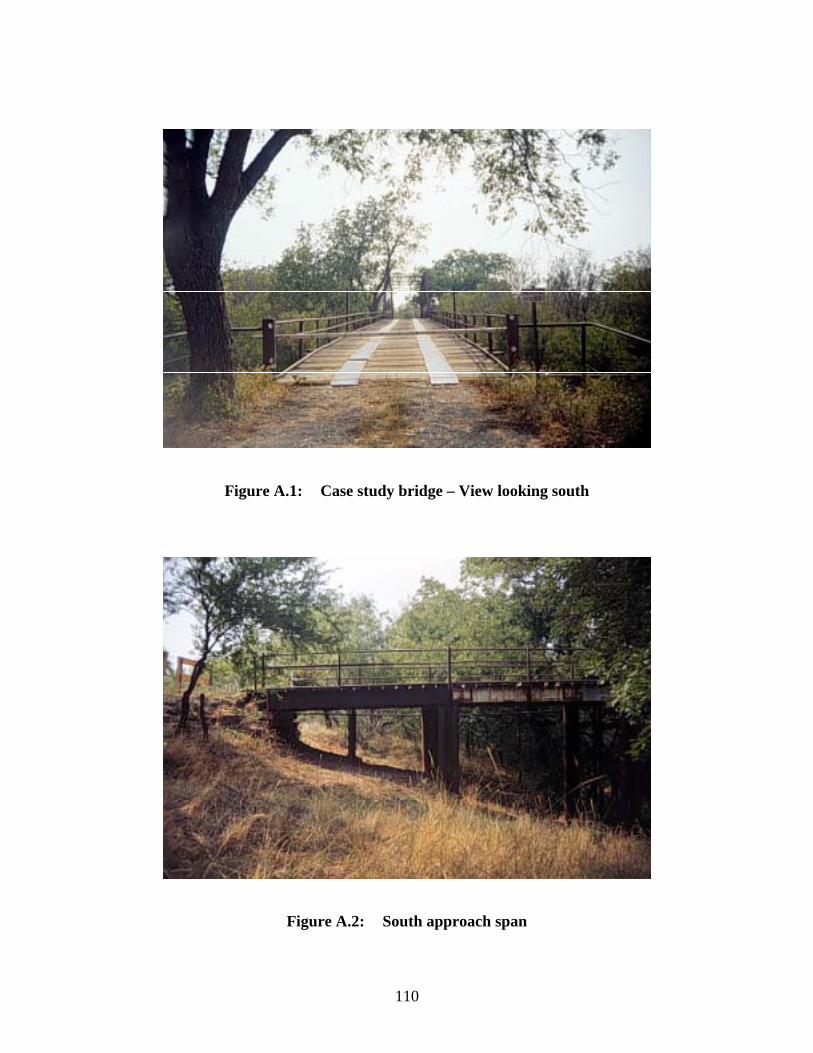
110
Figure A.1: Case study bridge – View looking south
Figure A.2: South approach span
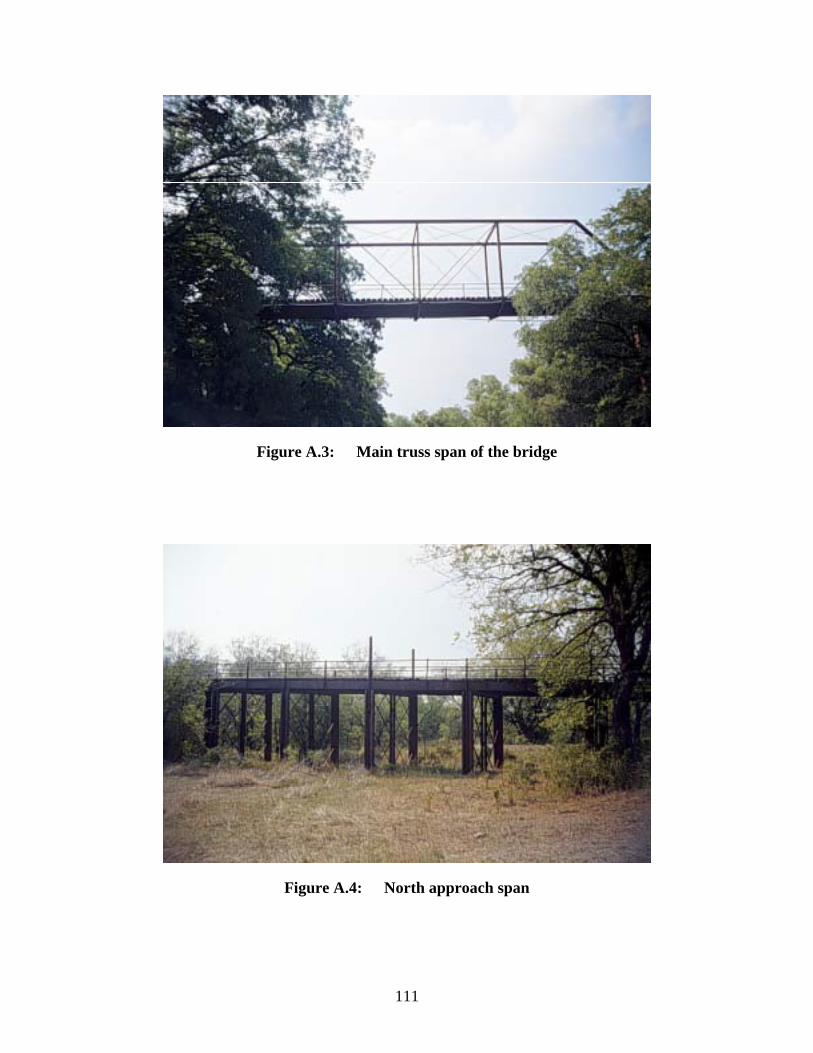
111
Figure A.3: Main truss span of the bridge
Figure A.4: North approach span
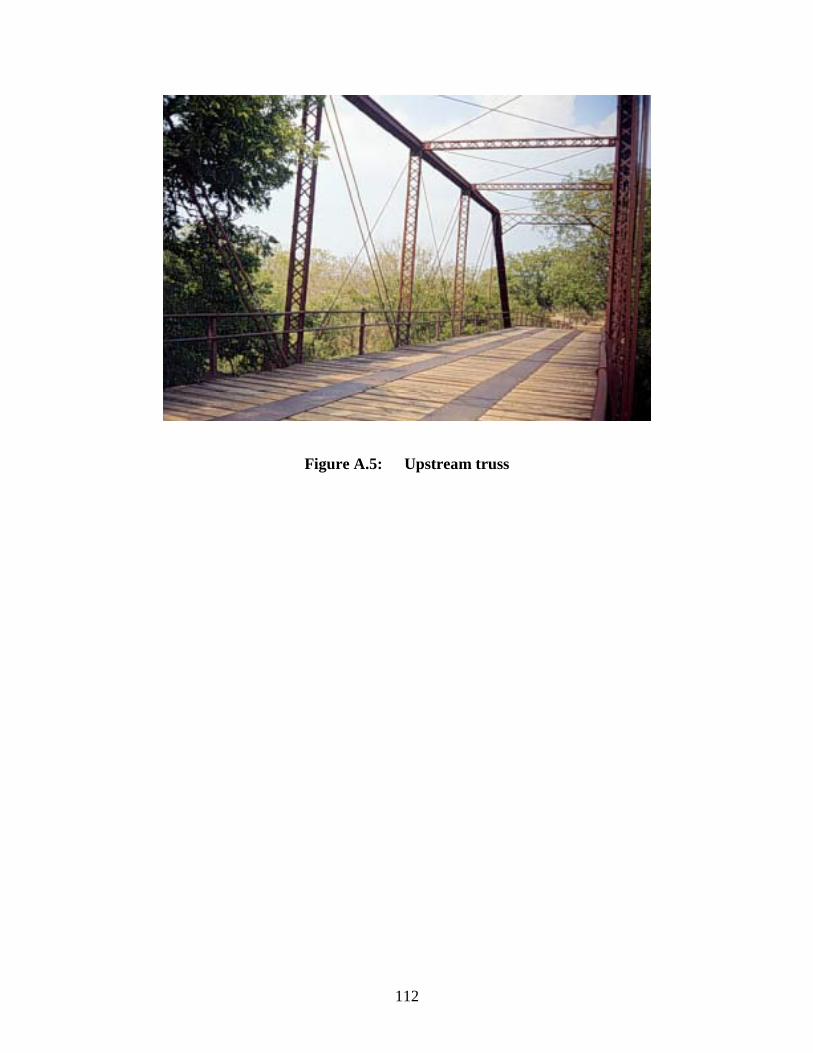
112
Figure A.5: Upstream truss
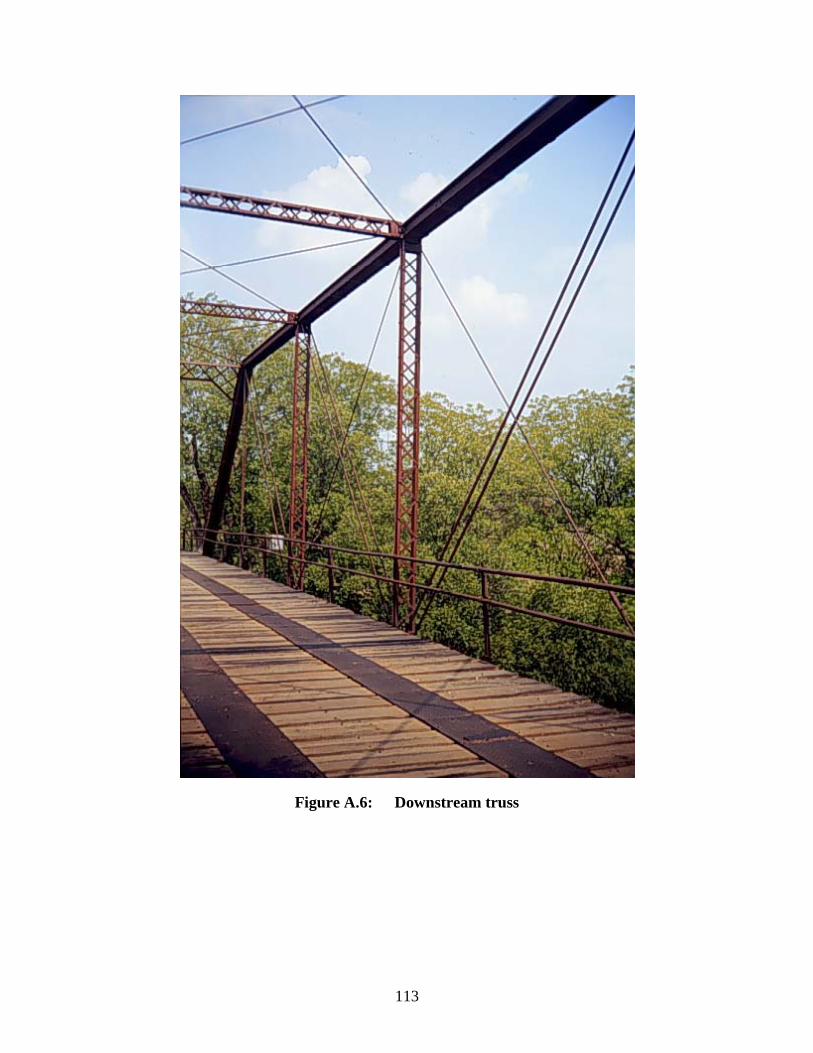
113
Figure A.6: Downstream truss
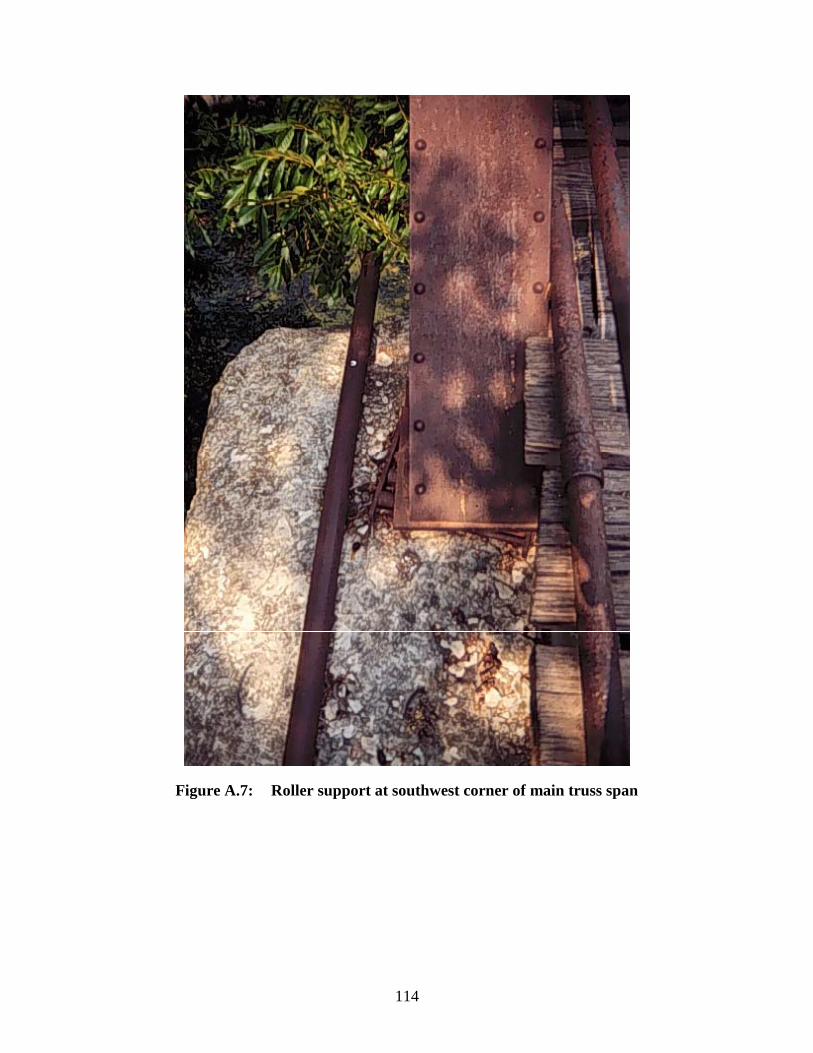
114
Figure A.7: Roller support at southwest corner of main truss span
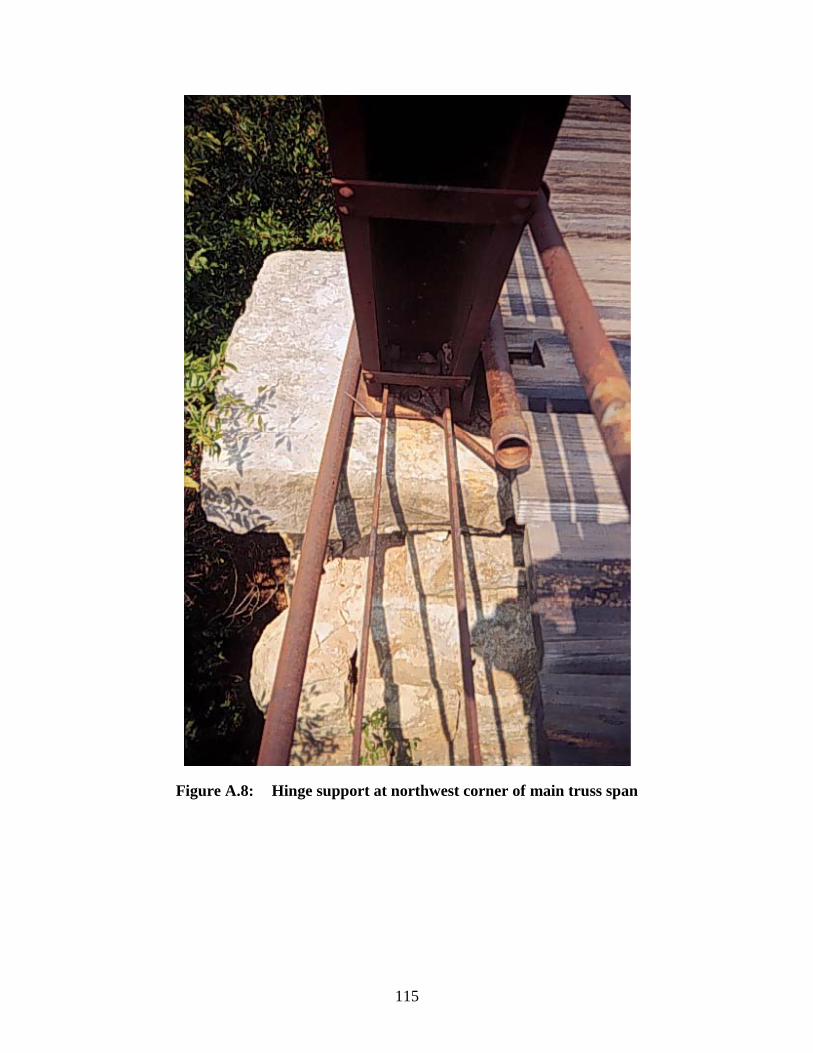
115
Figure A.8: Hinge support at northwest corner of main truss span
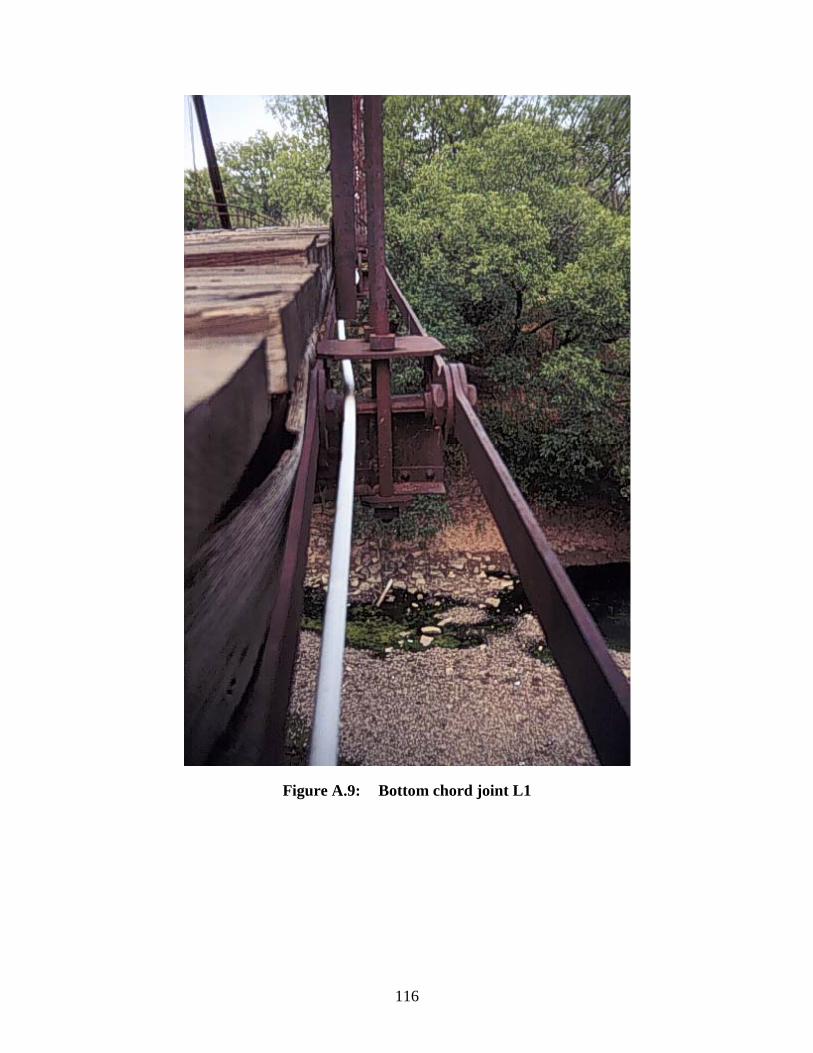
116
Figure A.9: Bottom chord joint L1
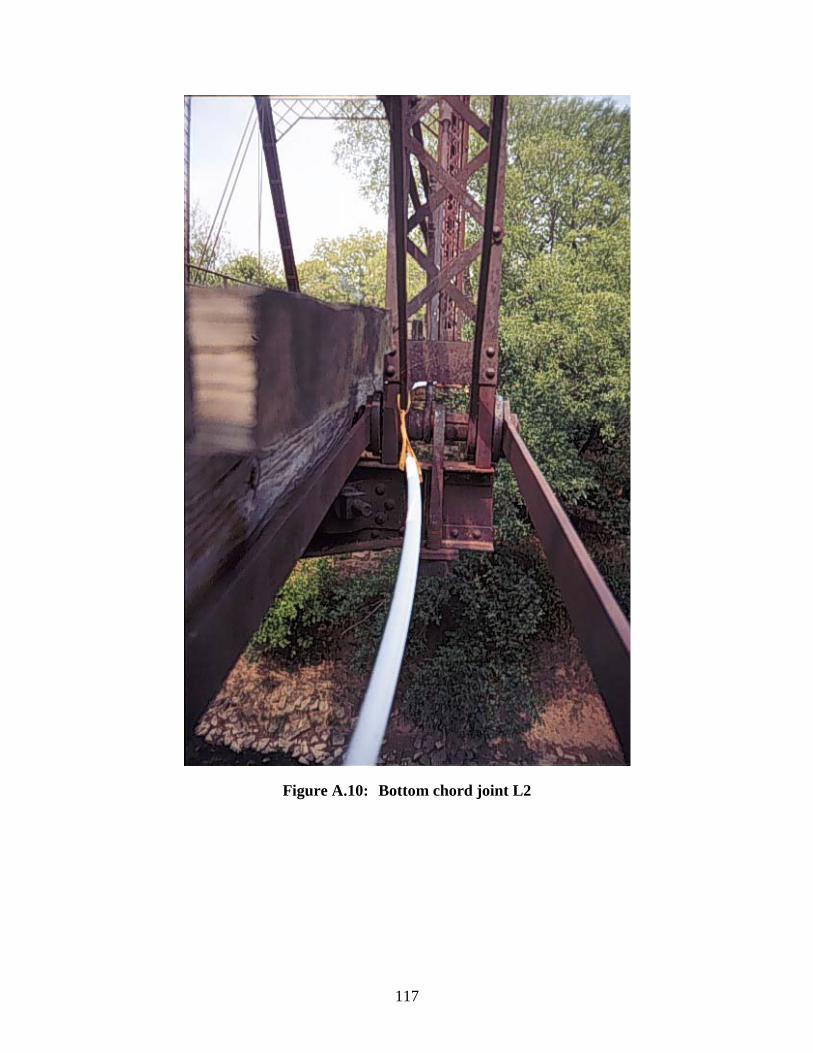
117
Figure A.10: Bottom chord joint L2
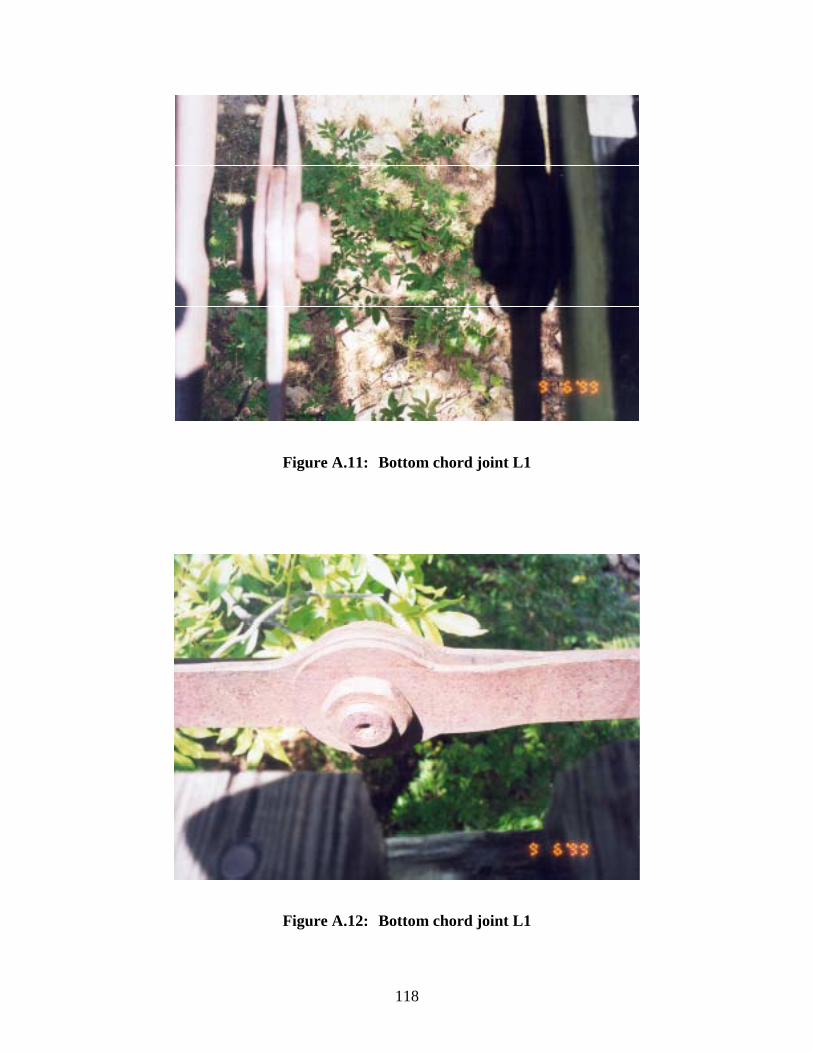
118
Figure A.11: Bottom chord joint L1
Figure A.12: Bottom chord joint L1
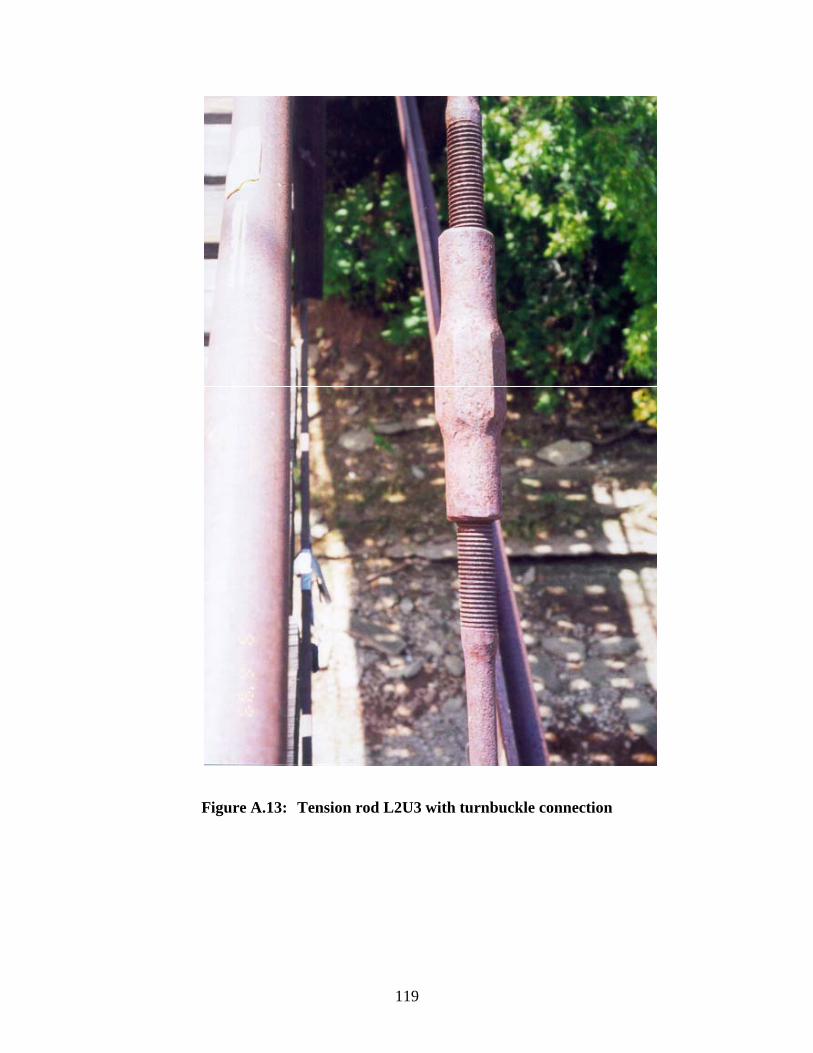
119
Figure A.13: Tension rod L2U3 with turnbuckle connection
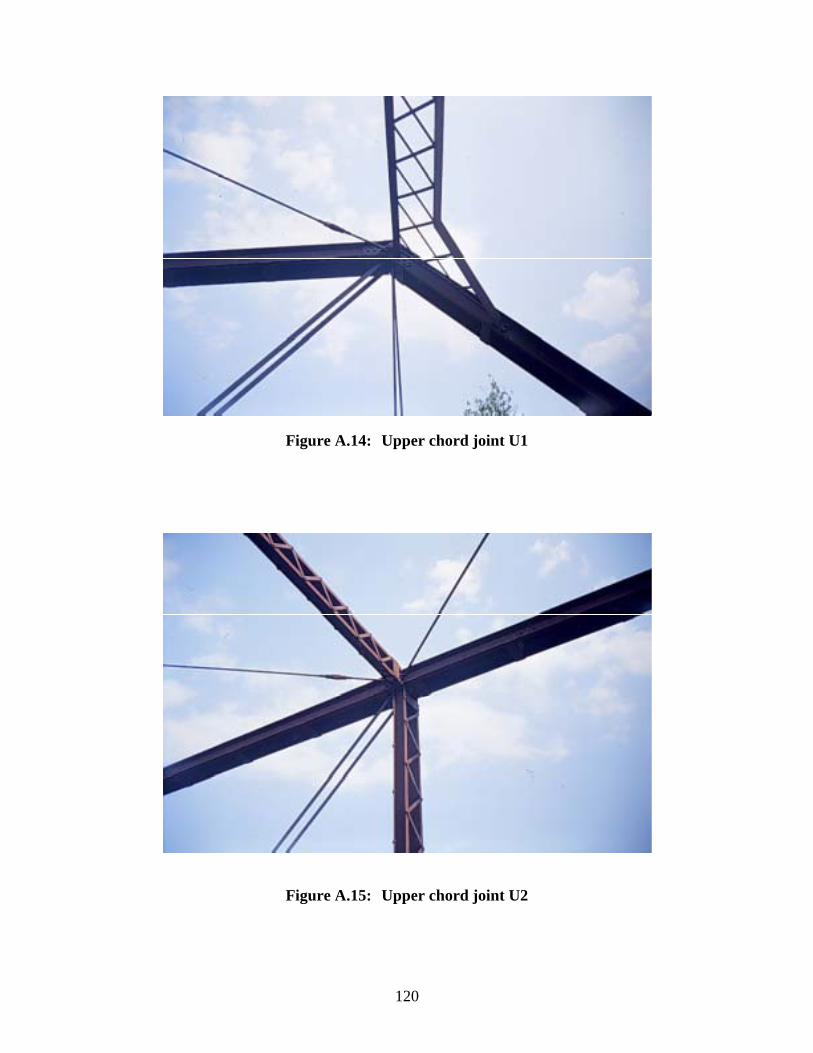
120
Figure A.14: Upper chord joint U1
Figure A.15: Upper chord joint U2
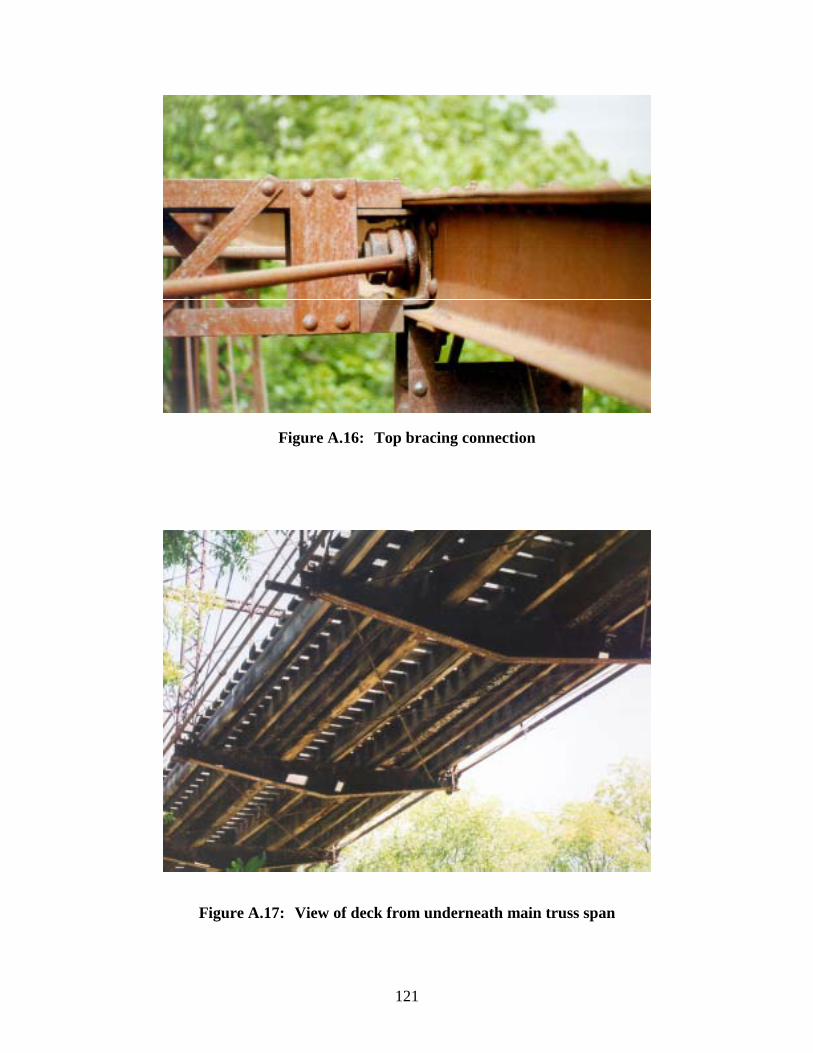
121
Figure A.16: Top bracing connection
Figure A.17: View of deck from underneath main truss span
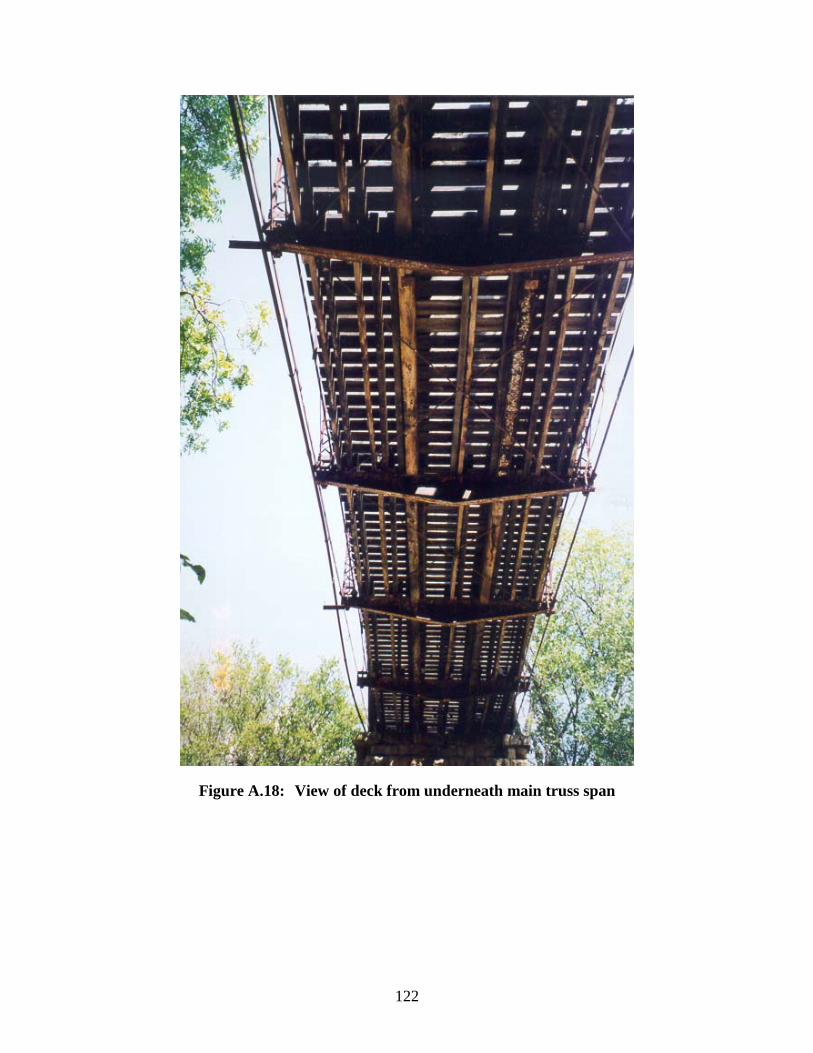
122
Figure A.18: View of deck from underneath main truss span
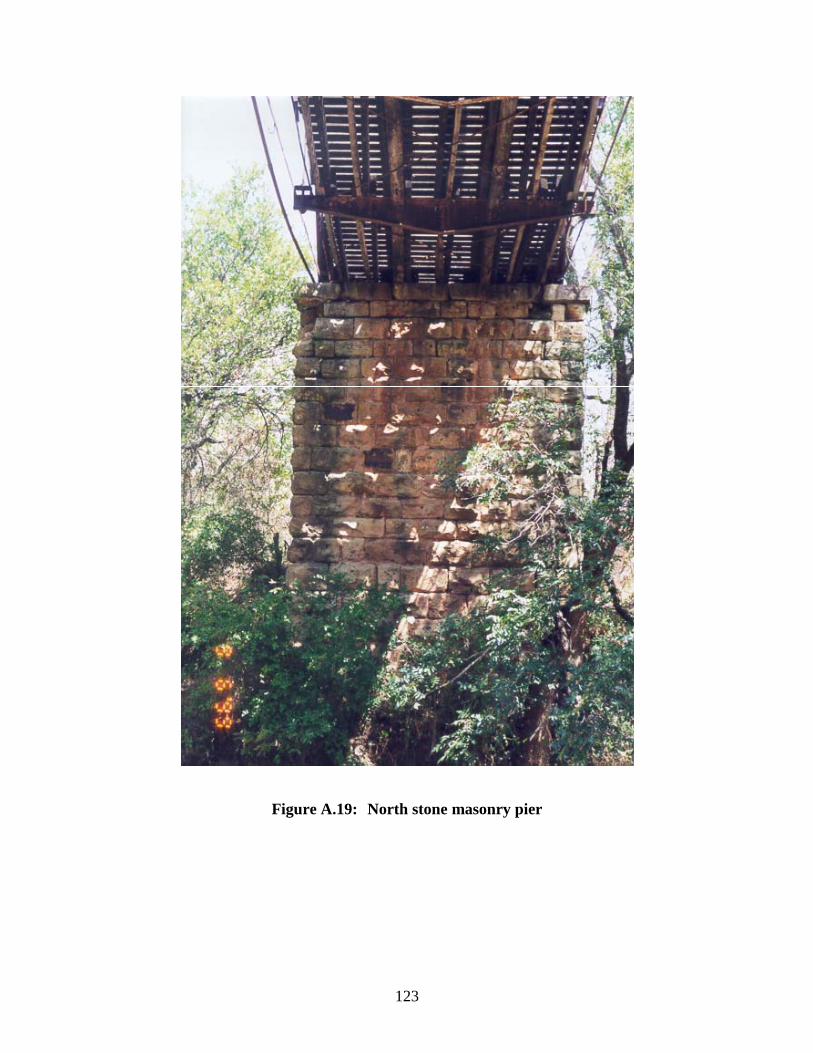
123
Figure A.19: North stone masonry pier
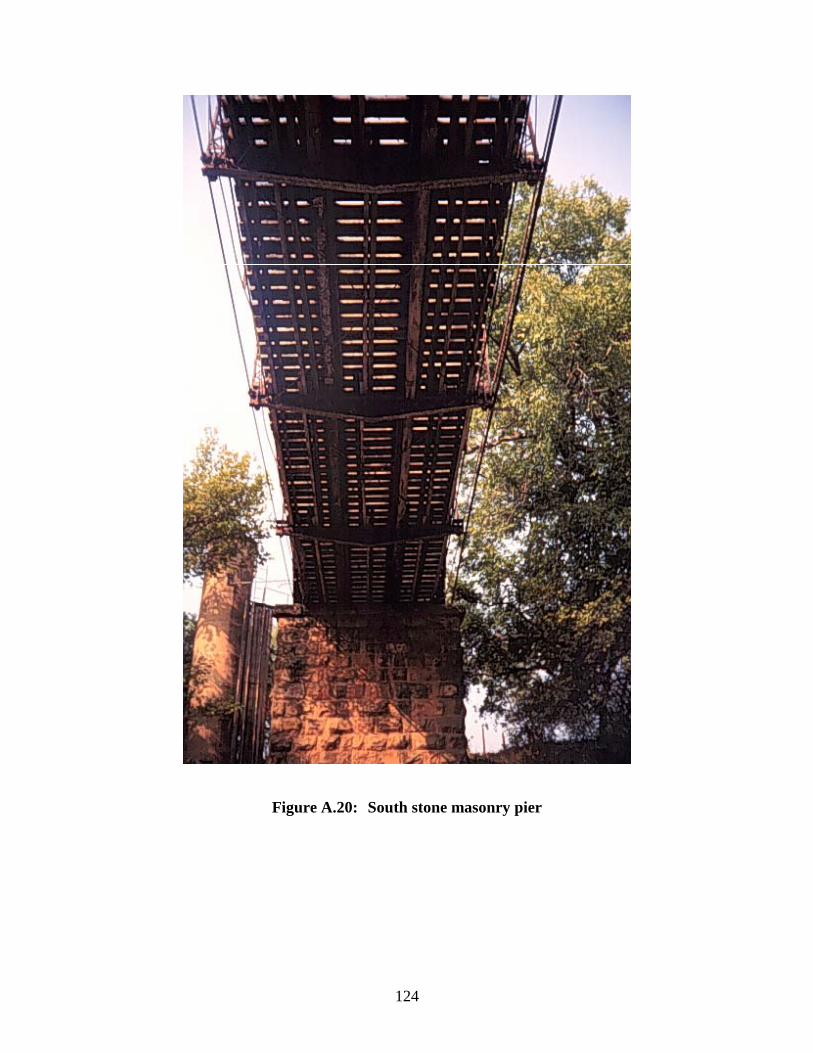
124
Figure A.20: South stone masonry pier
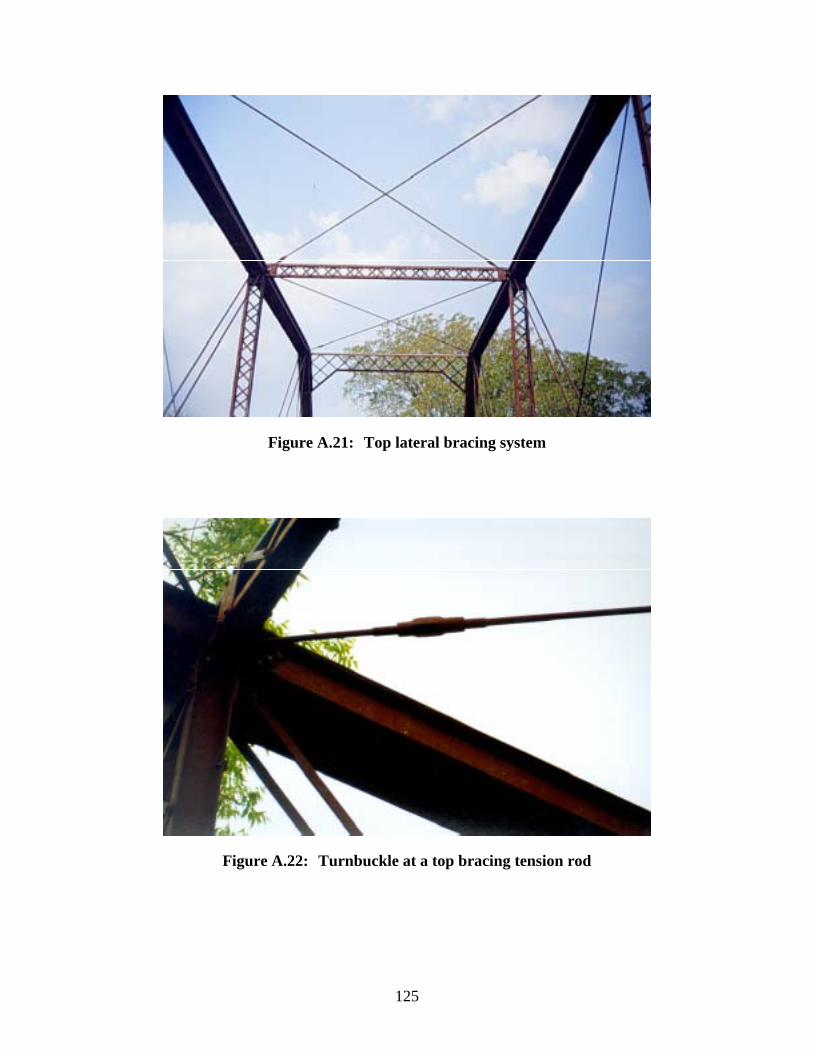
125
Figure A.21: Top lateral bracing system
Figure A.22: Turnbuckle at a top bracing tension rod
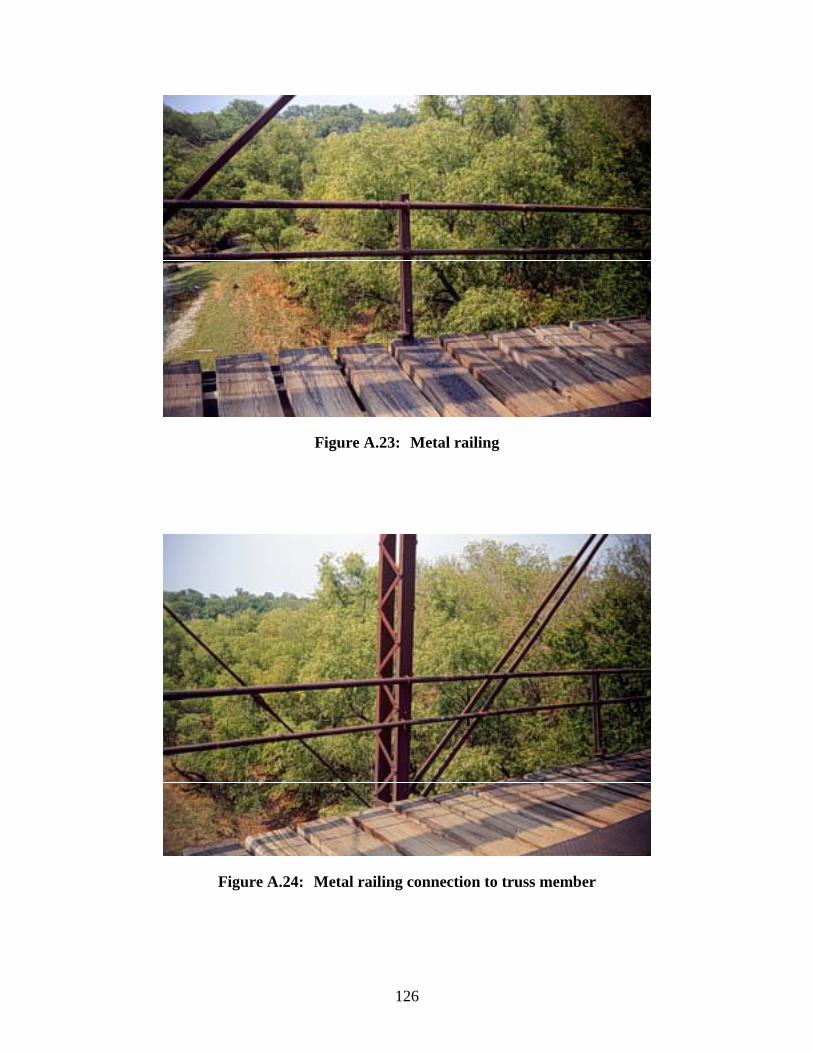
126
Figure A.23: Metal railing
Figure A.24: Metal railing connection to truss member
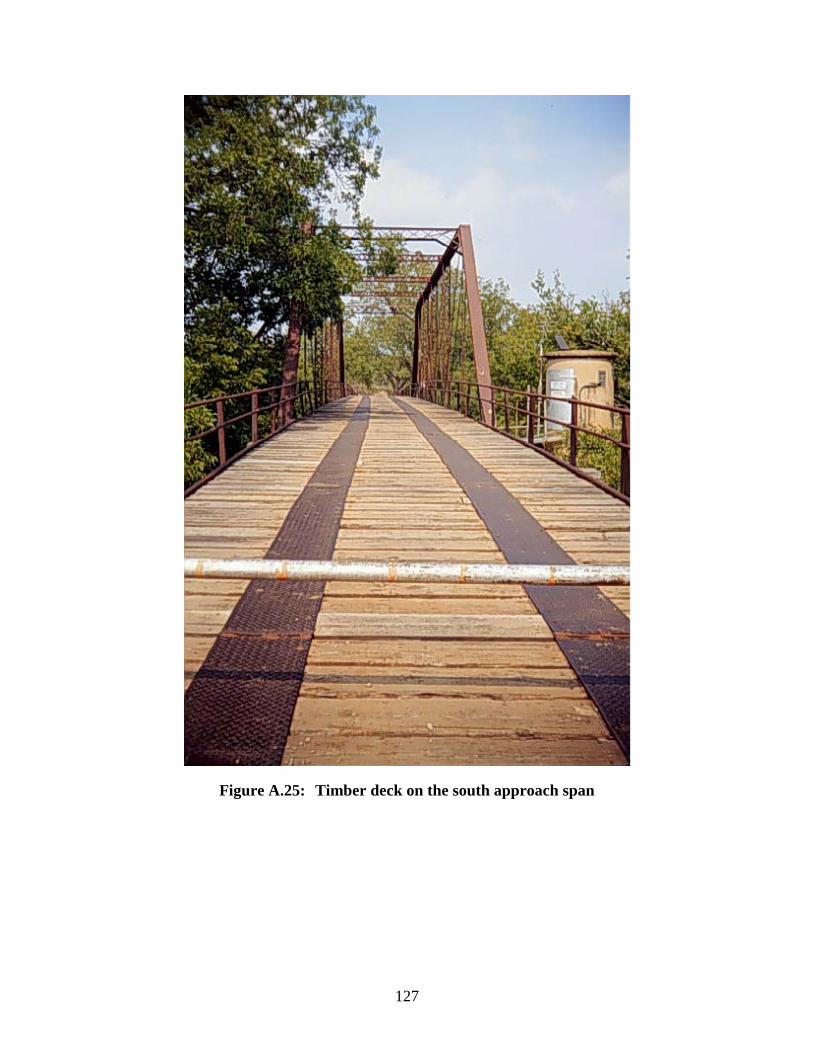
127
Figure A.25: Timber deck on the south approach span
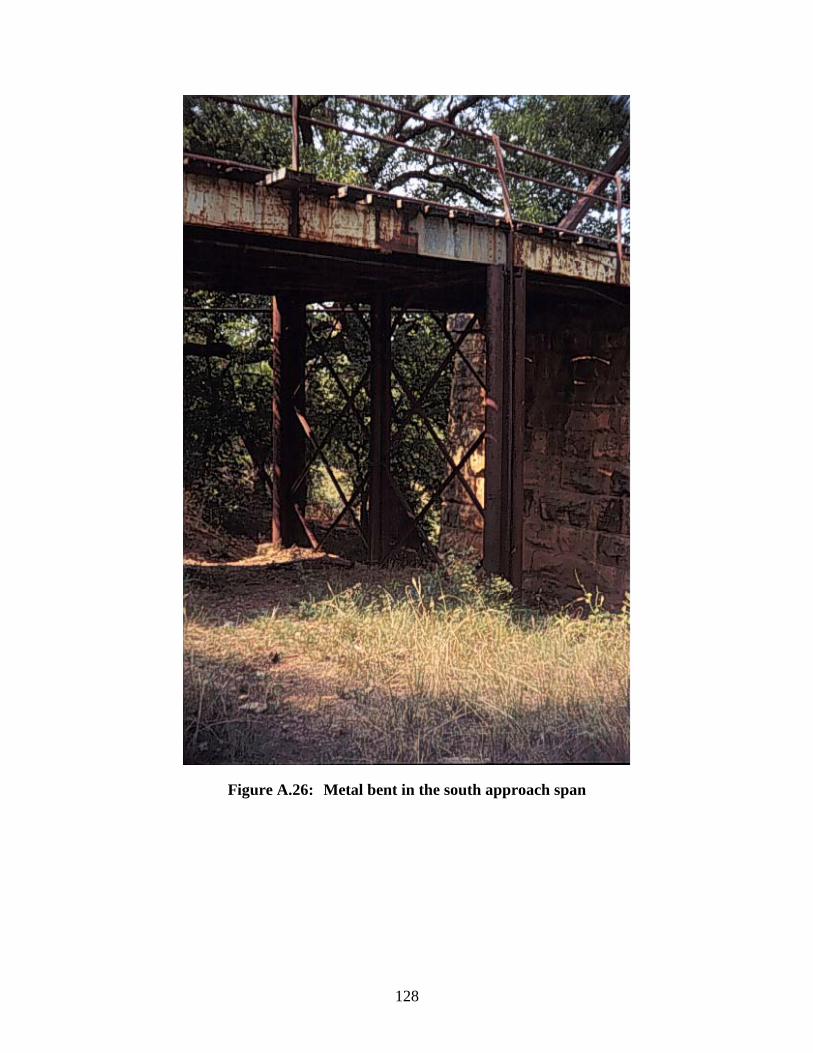
128
Figure A.26: Metal bent in the south approach span
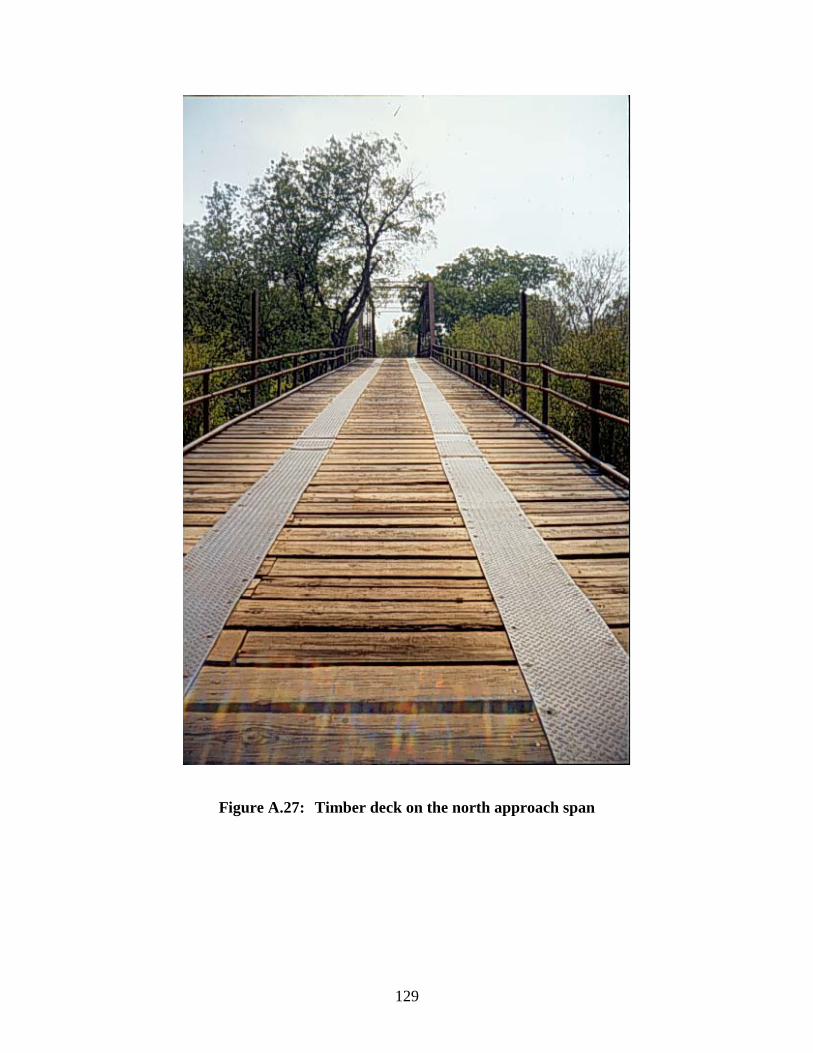
129
Figure A.27: Timber deck on the north approach span
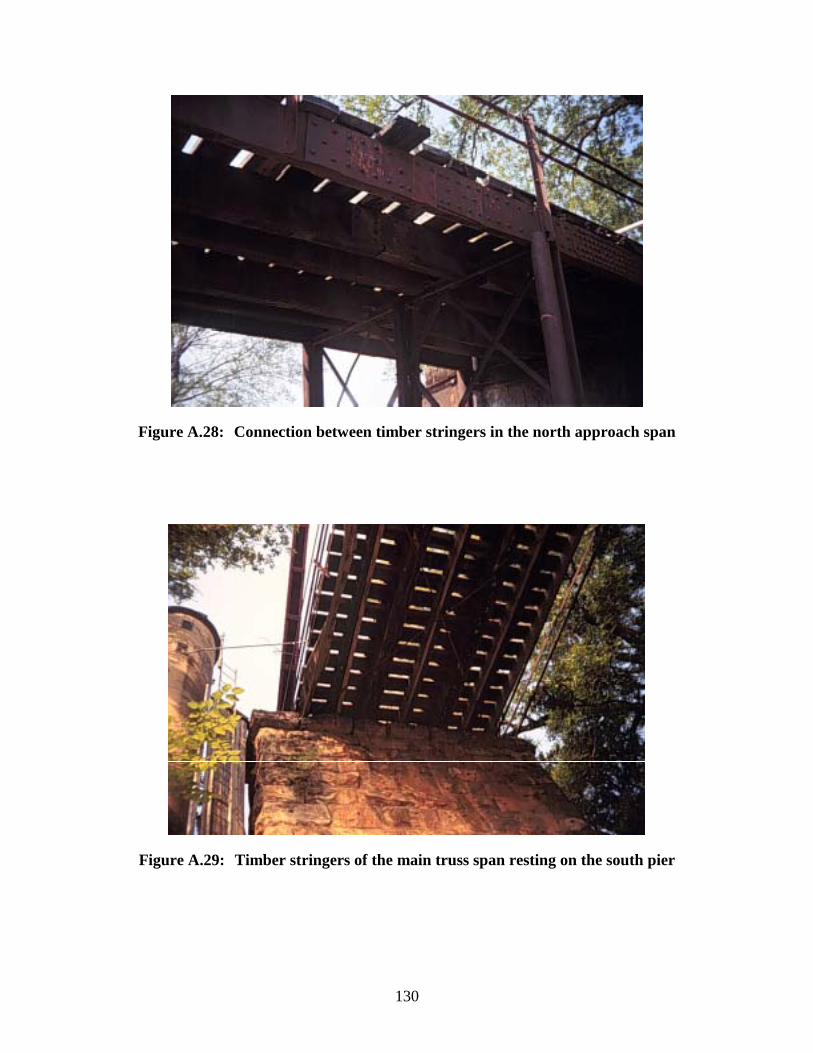
130
Figure A.28: Connection between timber stringers in the north approach span
Figure A.29: Timber stringers of the main truss span resting on the south pier
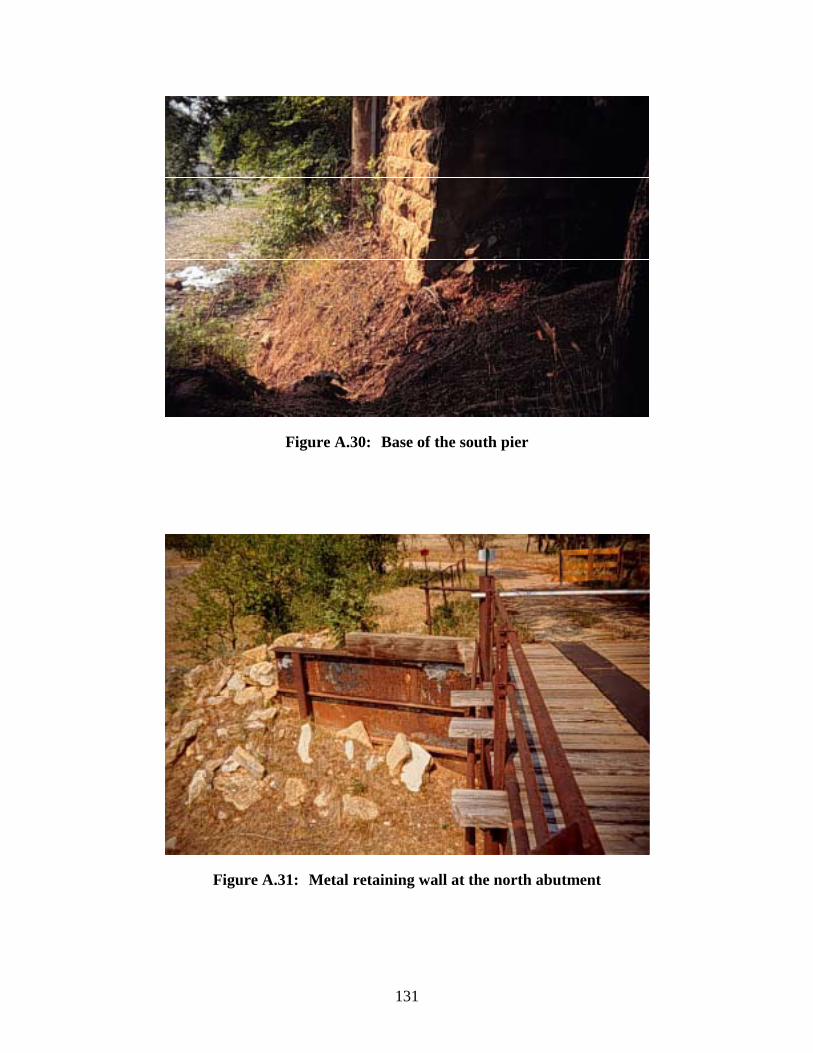
131
Figure A.30: Base of the south pier
Figure A.31: Metal retaining wall at the north abutment
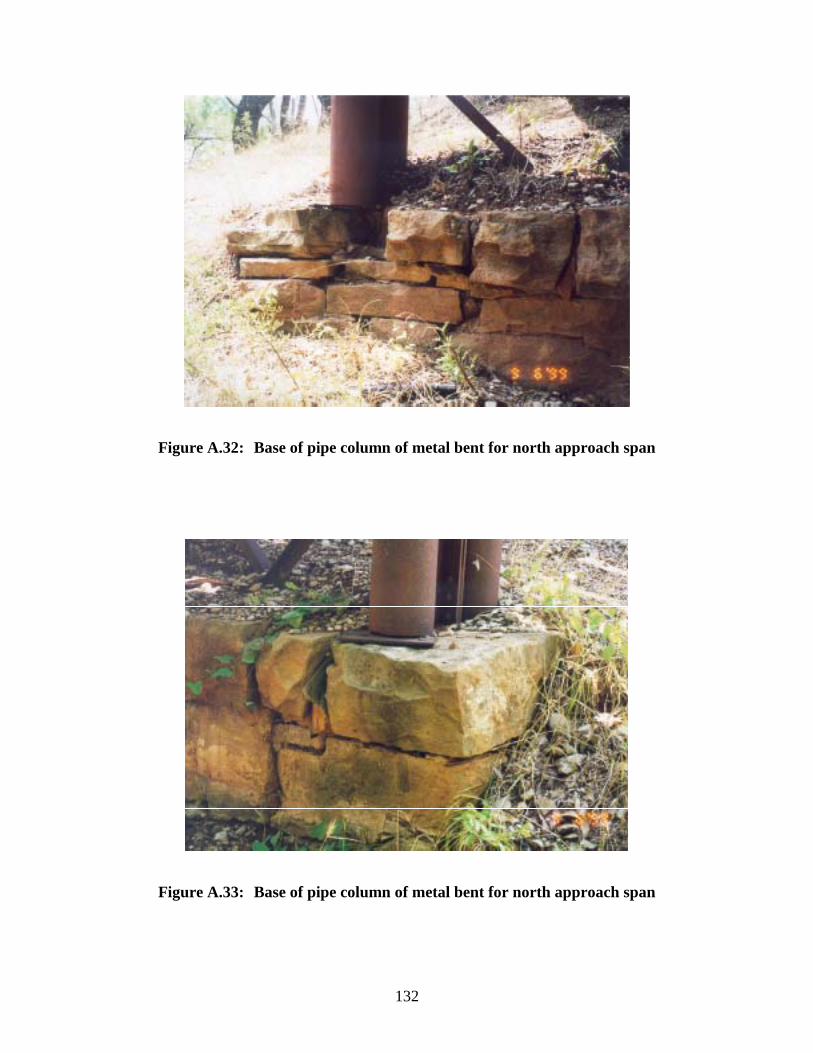
132
Figure A.32: Base of pipe column of metal bent for north approach span
Figure A.33: Base of pipe column of metal bent for north approach span
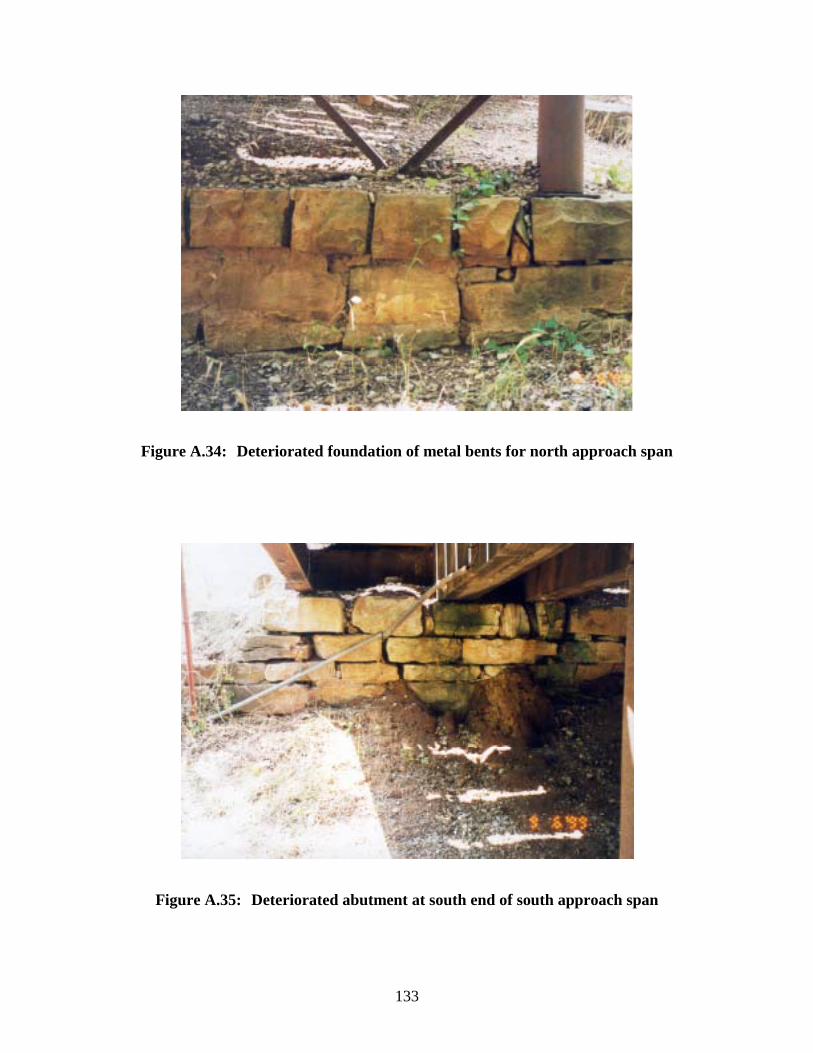
133
Figure A.34: Deteriorated foundation of metal bents for north approach span
Figure A.35: Deteriorated abutment at south end of south approach span
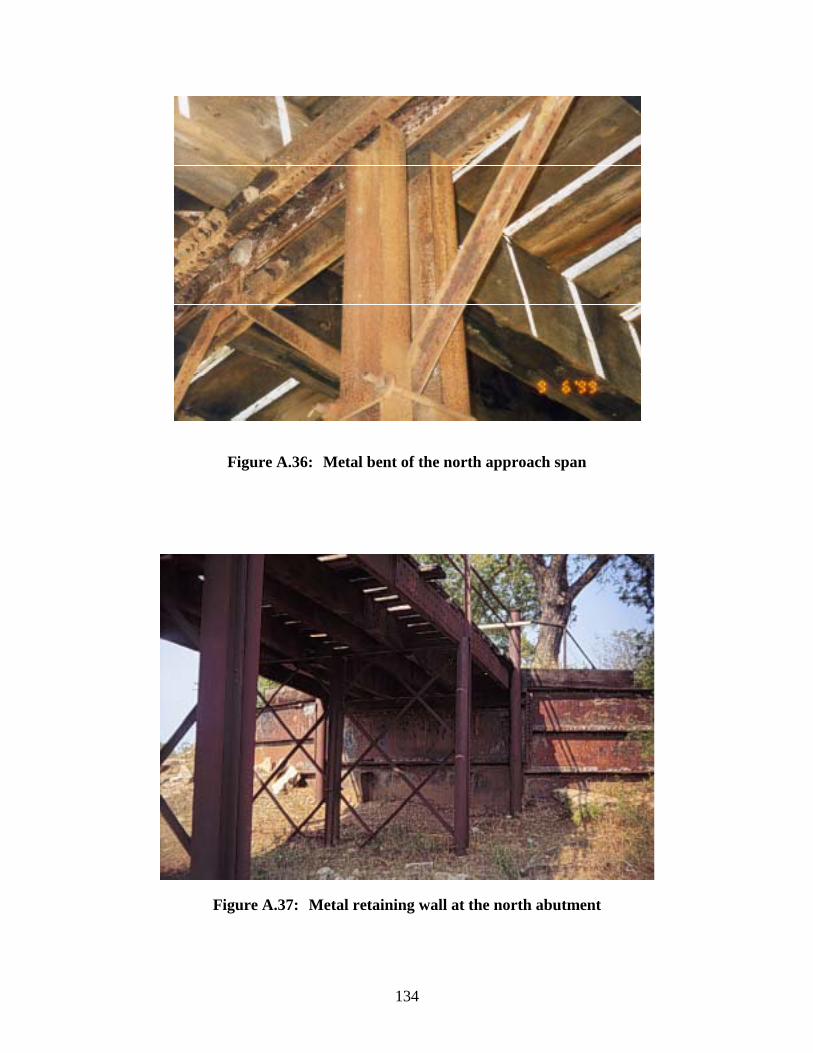
134
Figure A.36: Metal bent of the north approach span
Figure A.37: Metal retaining wall at the north abutment
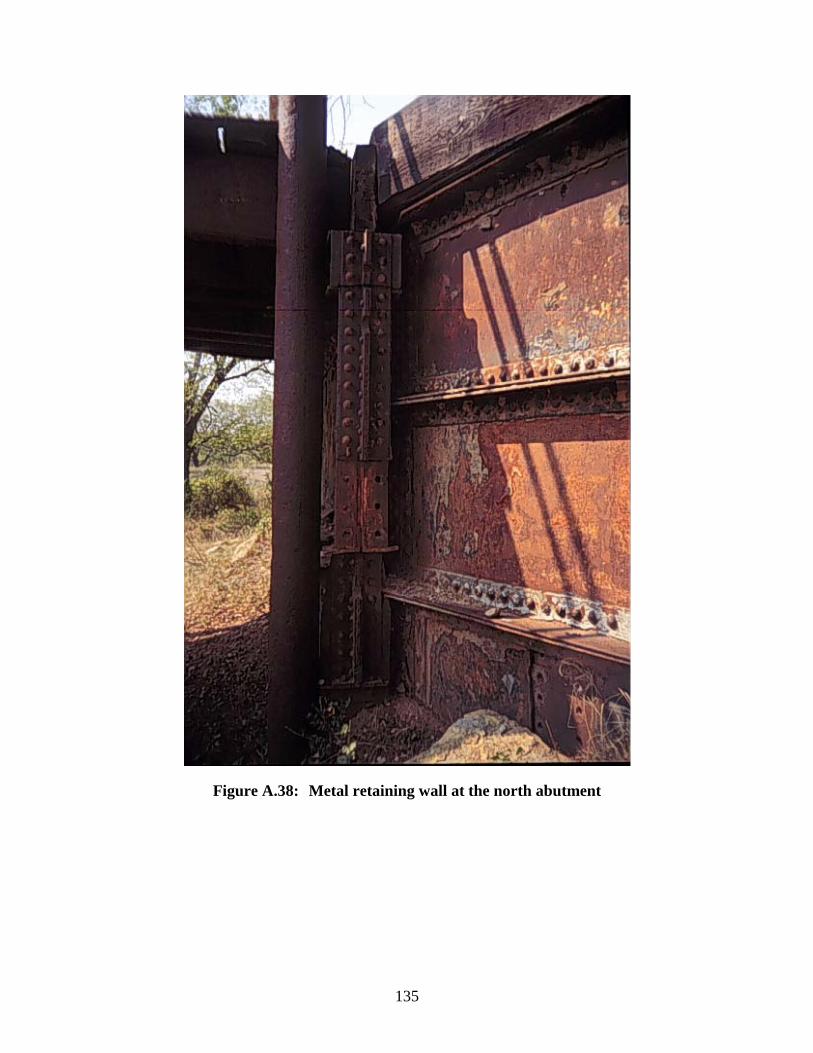
135
Figure A.38: Metal retaining wall at the north abutment

136
137
Appendix B: Drawings of the Case Study Bridge
This appendix presents a series of drawings of the case study bridge in Shackelford County, Texas. All drawings are based on field measurements and observation of the bridge made in August 1998. Dimensions shown on the drawings are in millimeters, with equivalent dimensions in inches shown in parenthesis.
Figure B.1 provides an overall view of the bridge, and identifies the three major components: the main truss span, the north approach span and the south approach span. Figures B.2 to B.16 show details of the main truss span. The remaining figures show details of the approach spans and the bridge piers.
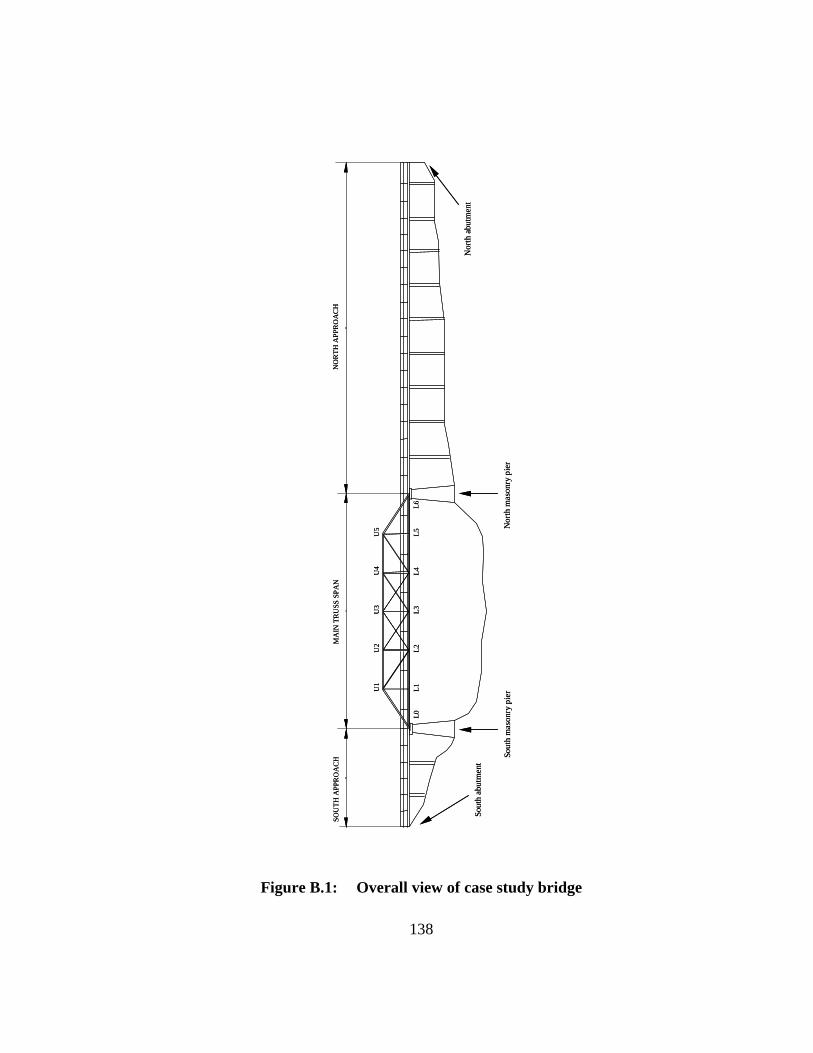
138
Figure B.1: Overall view of case study bridge
L0L1
L2L3
L4L5
L6
U1
U2
U3
U4
U5
NO
RTH
APP
RO
AC
HM
AIN
TRU
SS S
PAN
SOU
TH A
PPR
OA
CH
Sout
h ab
utm
ent
Sout
h m
ason
ry p
ier
Nor
th m
ason
ry p
ier
Nor
th a
butm
ent
L0L1
L2L3
L4L5
L6
U1
U2
U3
U4
U5
NO
RTH
APP
RO
AC
HM
AIN
TRU
SS S
PAN
SOU
TH A
PPR
OA
CH
Sout
h ab
utm
ent
Sout
h m
ason
ry p
ier
Nor
th m
ason
ry p
ier
Nor
th a
butm
ent
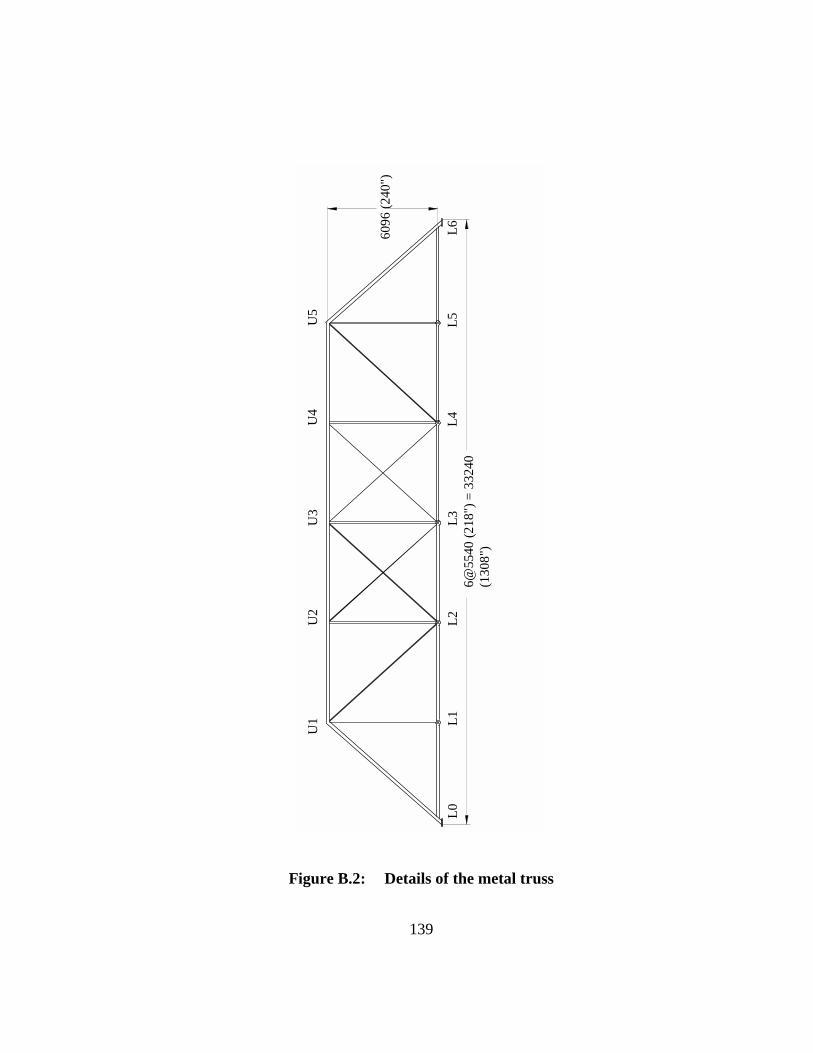
139
Figure B.2: Details of the metal truss
U1
6@55
40 (2
18")
= 3
3240
(130
8")
L0L1
L2L3
L4L5
L6
U2
U3
U4
U5
6096
(240
")
U1
6@55
40 (2
18")
= 3
3240
(130
8")
L0L1
L2L3
L4L5
L6
U2
U3
U4
U5
6096
(240
")
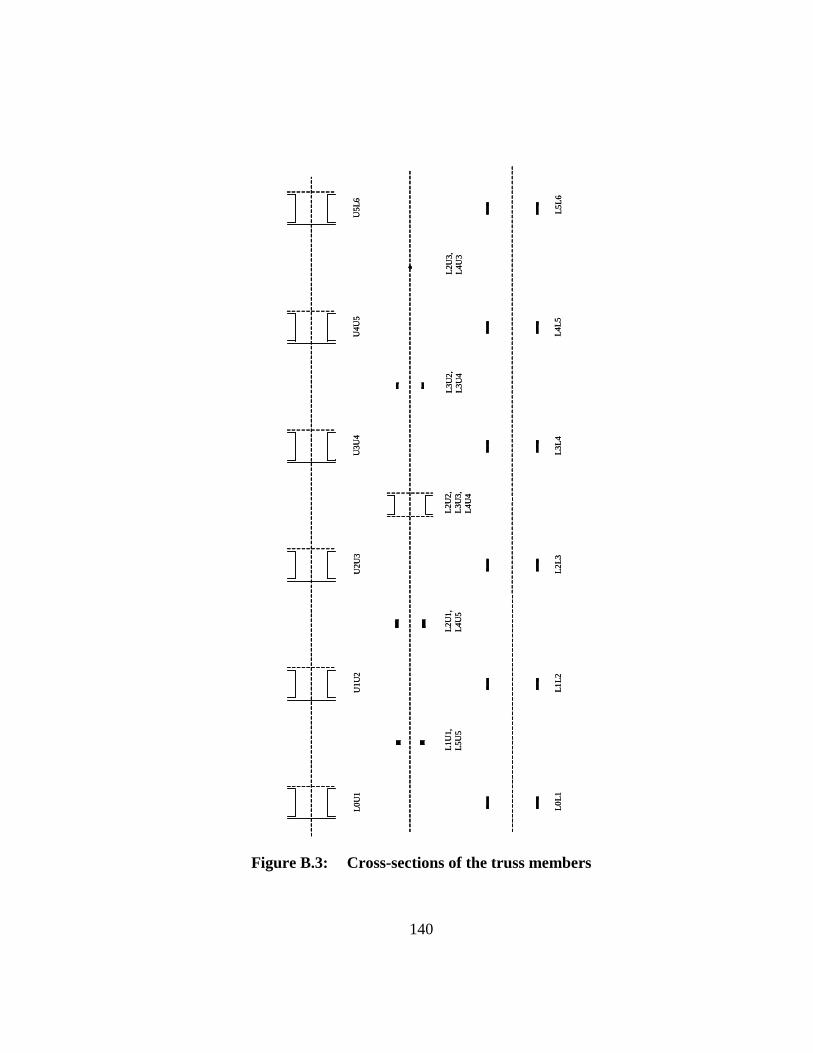
140
Figure B.3: Cross-sections of the truss members
L0U
1U
1U2
U2U
3U
3U4
U4U
5U
5L6
L2L3
L0L1
L1L2
L3L4
L4L5
L5L6
L2U
2,L3
U3,
L4U
4
L1U
1,L5
U5
L2U
1,L4
U5
L3U
2,L3
U4
L2U
3,L4
U3
L0U
1U
1U2
U2U
3U
3U4
U4U
5U
5L6
L2L3
L0L1
L1L2
L3L4
L4L5
L5L6
L2U
2,L3
U3,
L4U
4
L1U
1,L5
U5
L2U
1,L4
U5
L3U
2,L3
U4
L2U
3,L4
U3
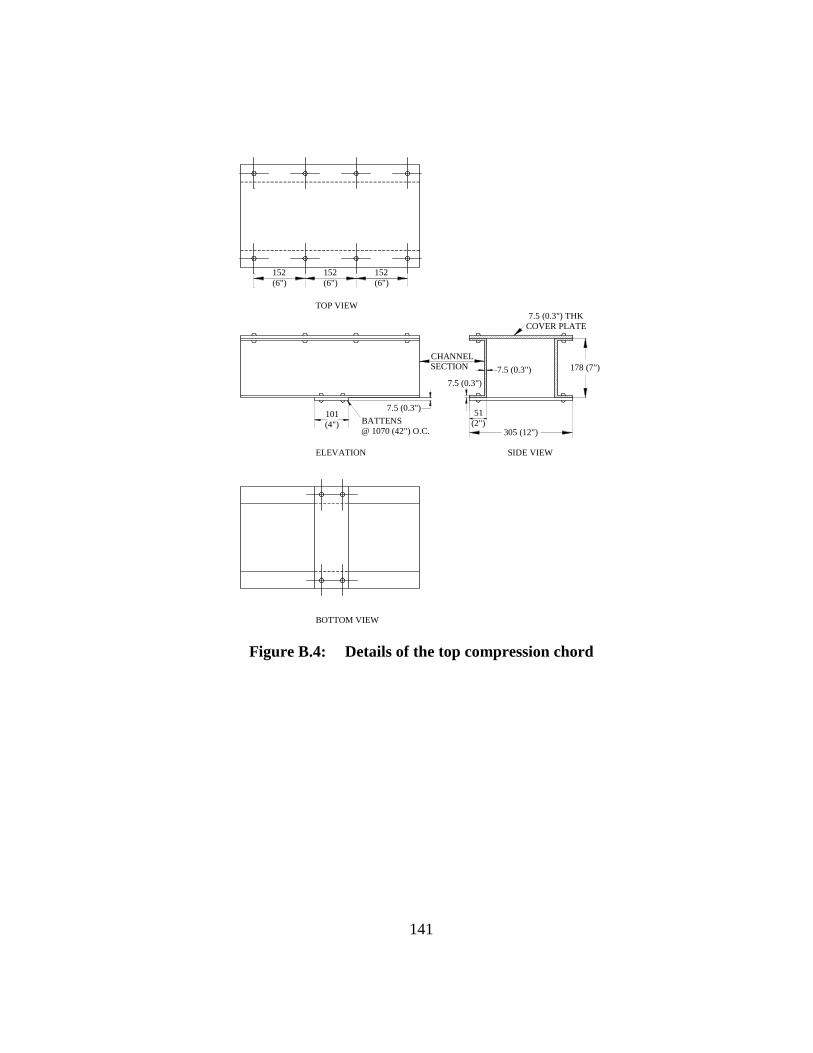
141
178 (7")
51(2")
305 (12")
7.5 (0.3")
101(4")
7.5 (0.3")
7.5 (0.3")
152(6")
152(6")
152(6")
BATTENS@ 1070 (42") O.C.
7.5 (0.3") THKCOVER PLATE
CHANNELSECTION
SIDE VIEWELEVATION
TOP VIEW
BOTTOM VIEW
Figure B.4: Details of the top compression chord
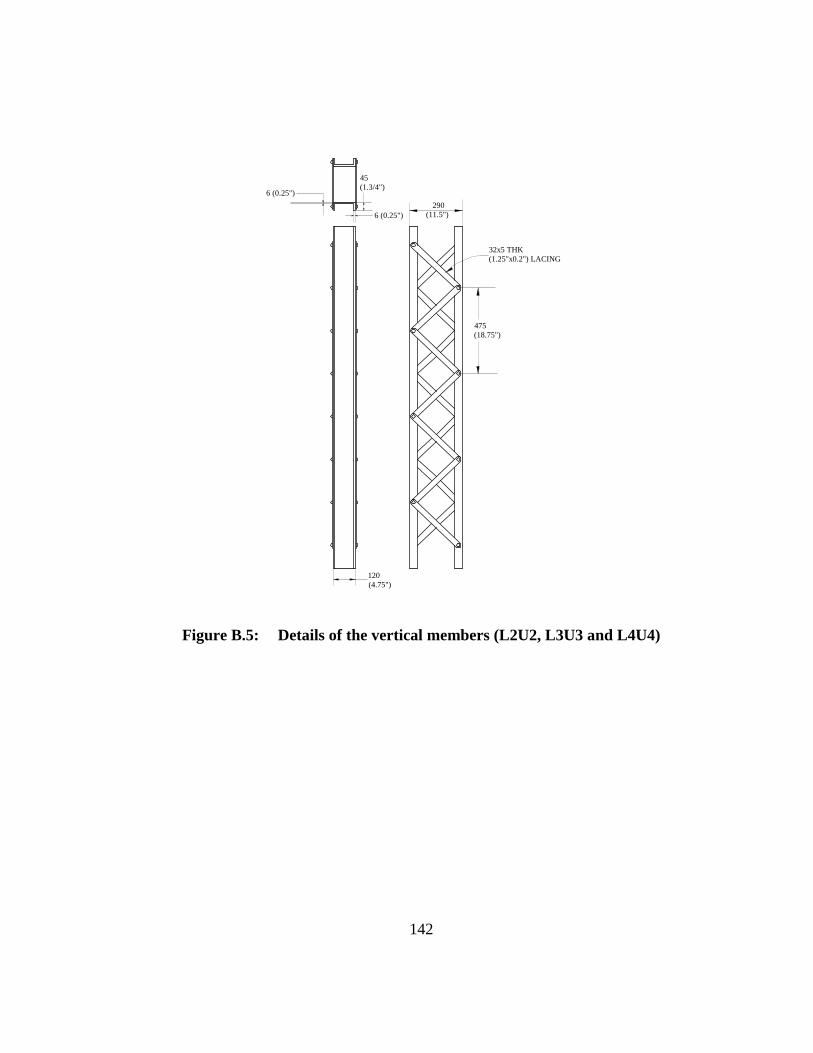
142
475(18.75")
6 (0.25")
45(1.3/4")
6 (0.25")
120(4.75")
32x5 THK(1.25"x0.2") LACING
290(11.5")
Figure B.5: Details of the vertical members (L2U2, L3U3 and L4U4)
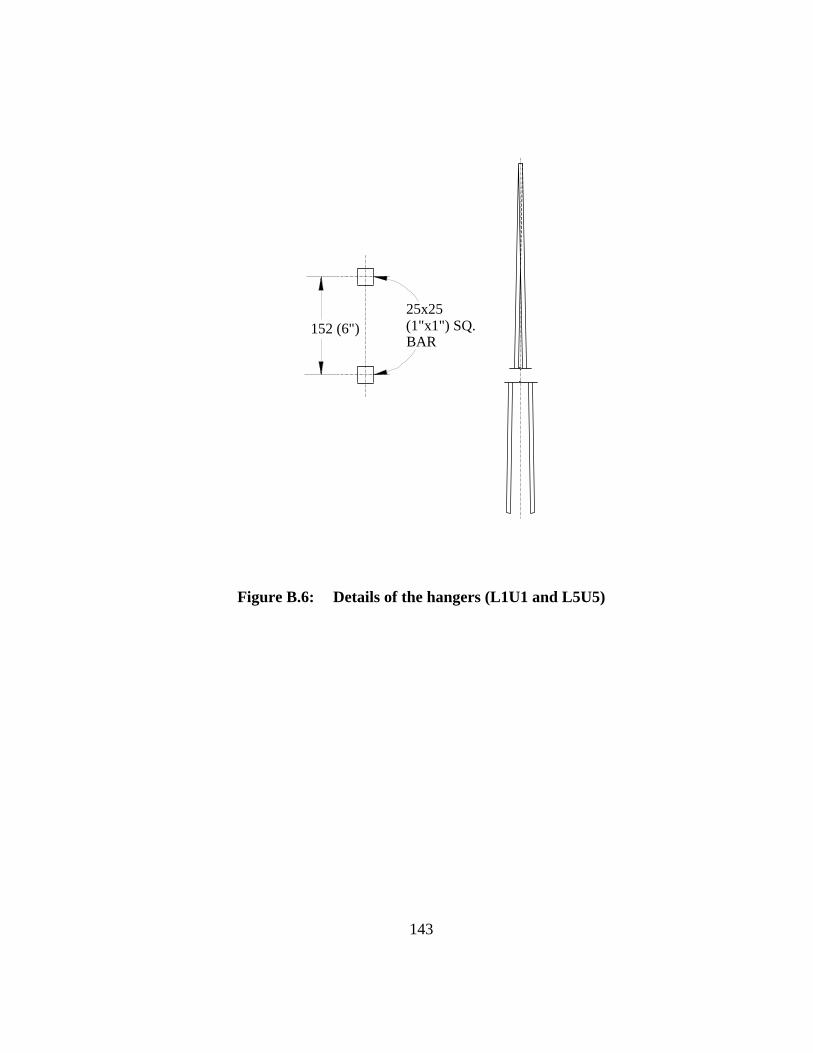
143
152 (6")25x25(1"x1") SQ.BAR
Figure B.6: Details of the hangers (L1U1 and L5U5)
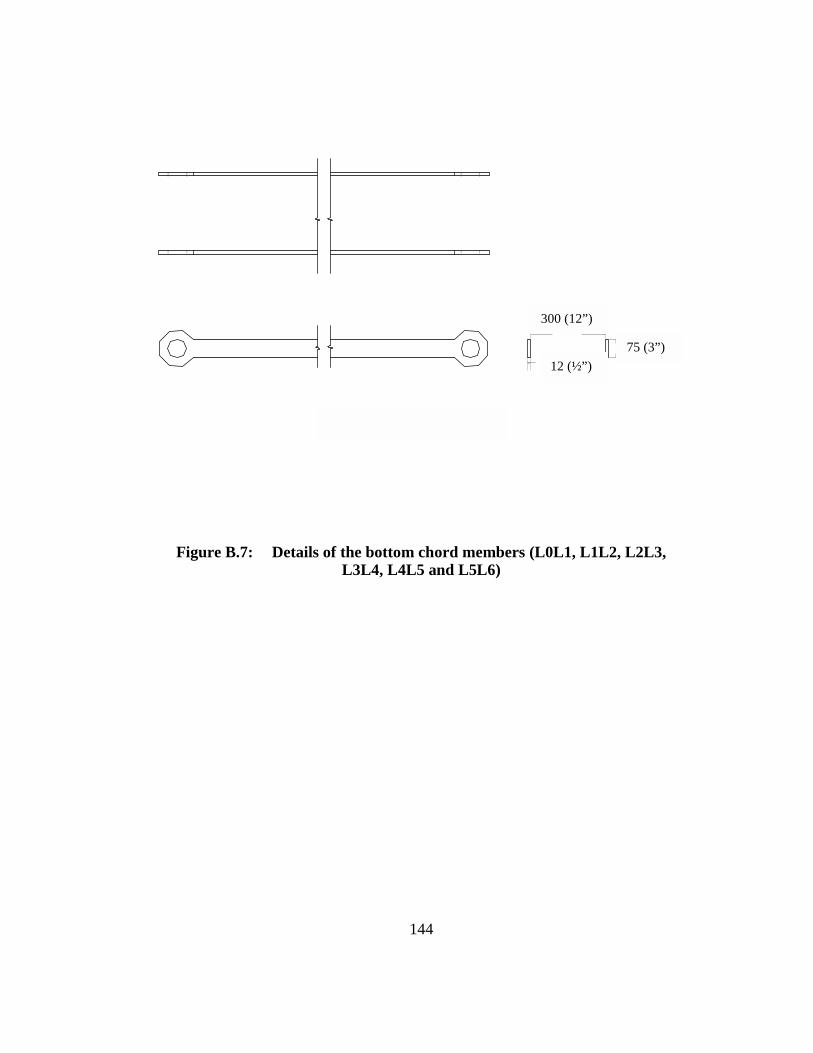
144
300 (12”)
75 (3”)12 (½”)
Figure B.7: Details of the bottom chord members (L0L1, L1L2, L2L3, L3L4, L4L5 and L5L6)
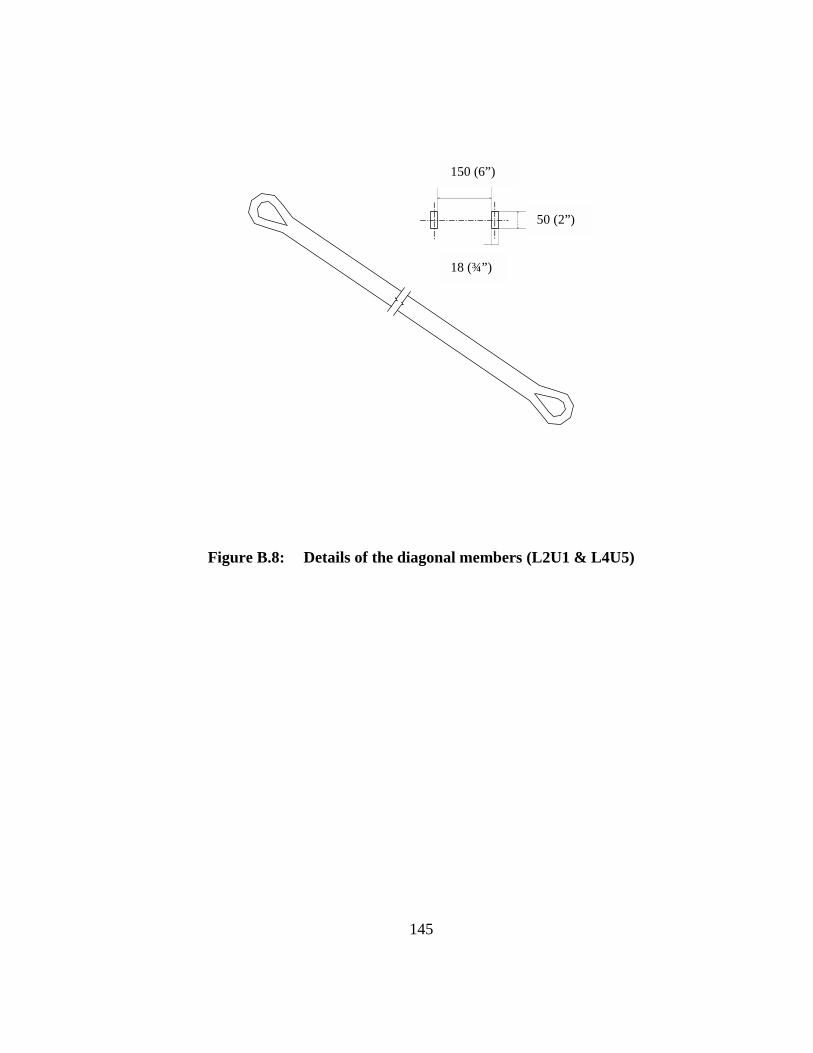
145
50 (2”)
150 (6”)
18 (¾”)
Figure B.8: Details of the diagonal members (L2U1 & L4U5)
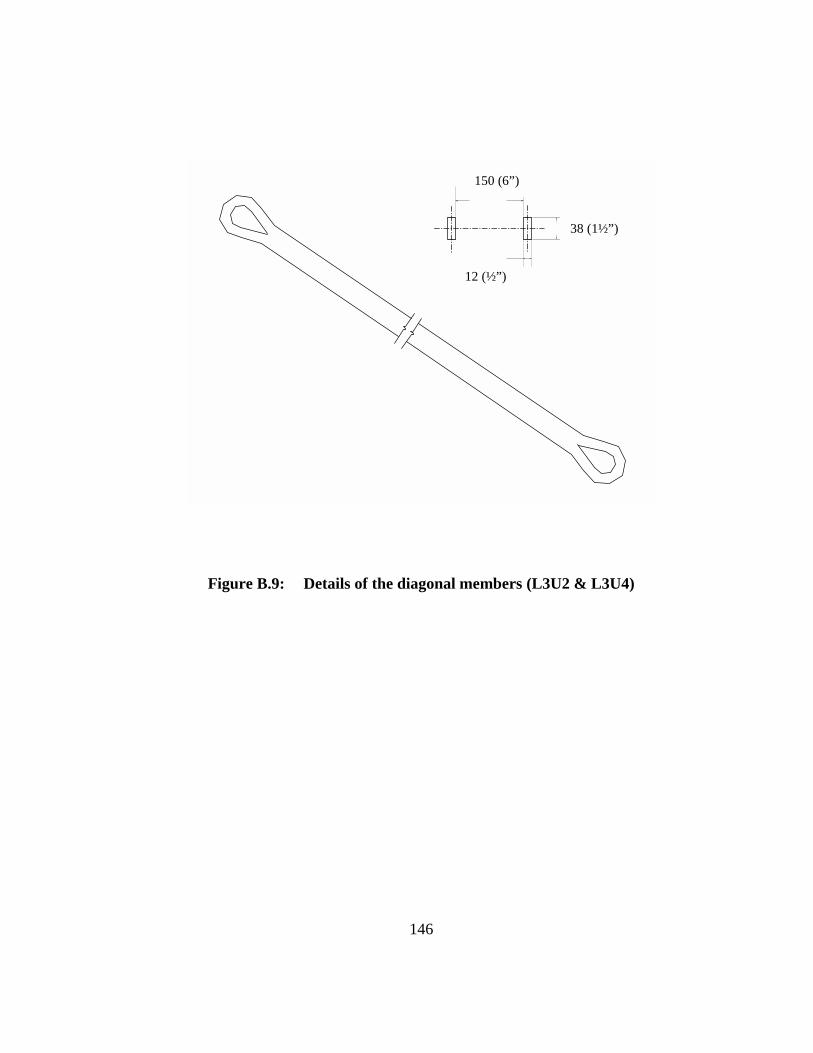
146
150 (6”)
38 (1½”)
12 (½”)
Figure B.9: Details of the diagonal members (L3U2 & L3U4)
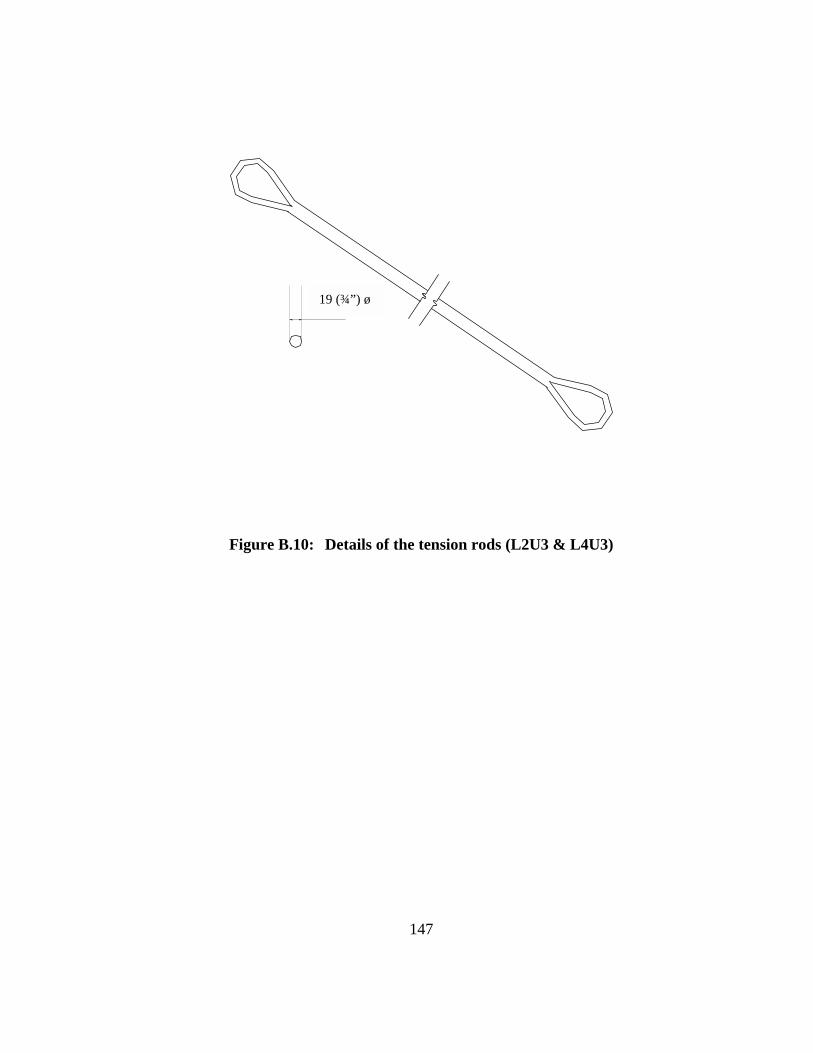
147
19 (¾”) ø
Figure B.10: Details of the tension rods (L2U3 & L4U3)
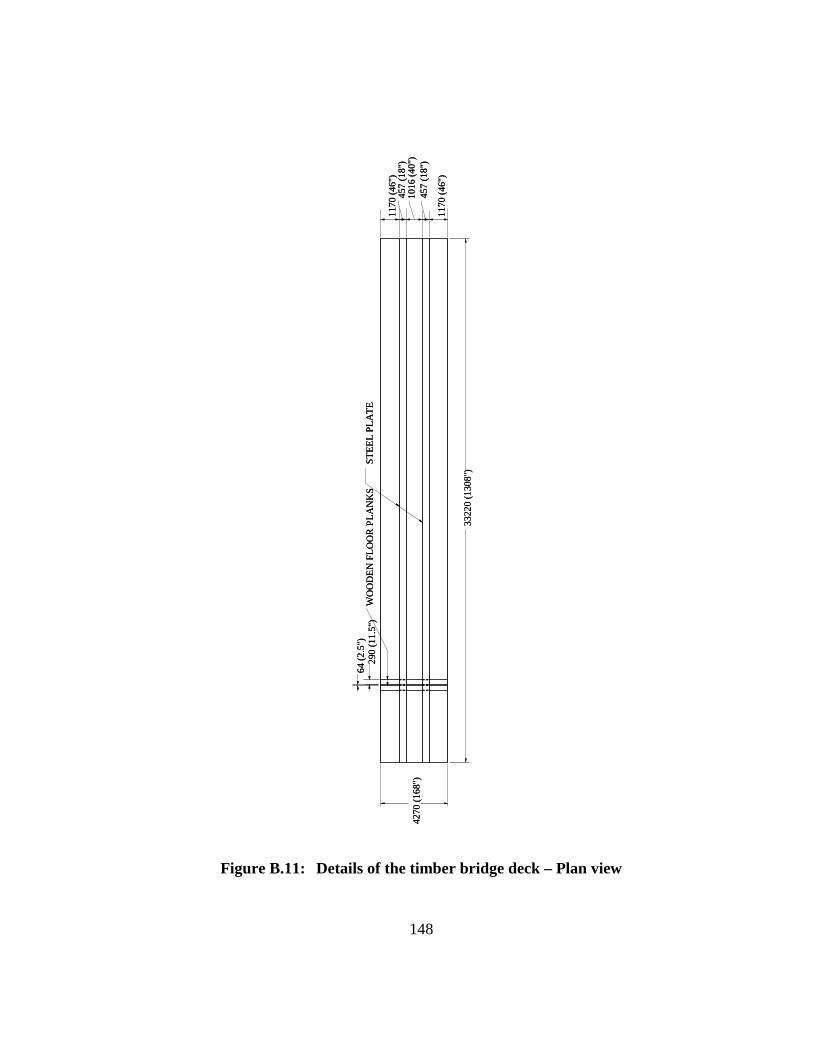
148
Figure B.11: Details of the timber bridge deck – Plan view
WO
OD
EN F
LOO
R P
LAN
KS
290
(11.
5")
STEE
L PL
ATE
1170
(46"
)45
7 (1
8")
1016
(40"
)42
70 (1
68")
3322
0 (1
308"
)
1170
(46"
)
457
(18"
)
64 (2
.5")
WO
OD
EN F
LOO
R P
LAN
KS
290
(11.
5")
STEE
L PL
ATE
1170
(46"
)45
7 (1
8")
1016
(40"
)42
70 (1
68")
3322
0 (1
308"
)
1170
(46"
)
457
(18"
)
64 (2
.5")
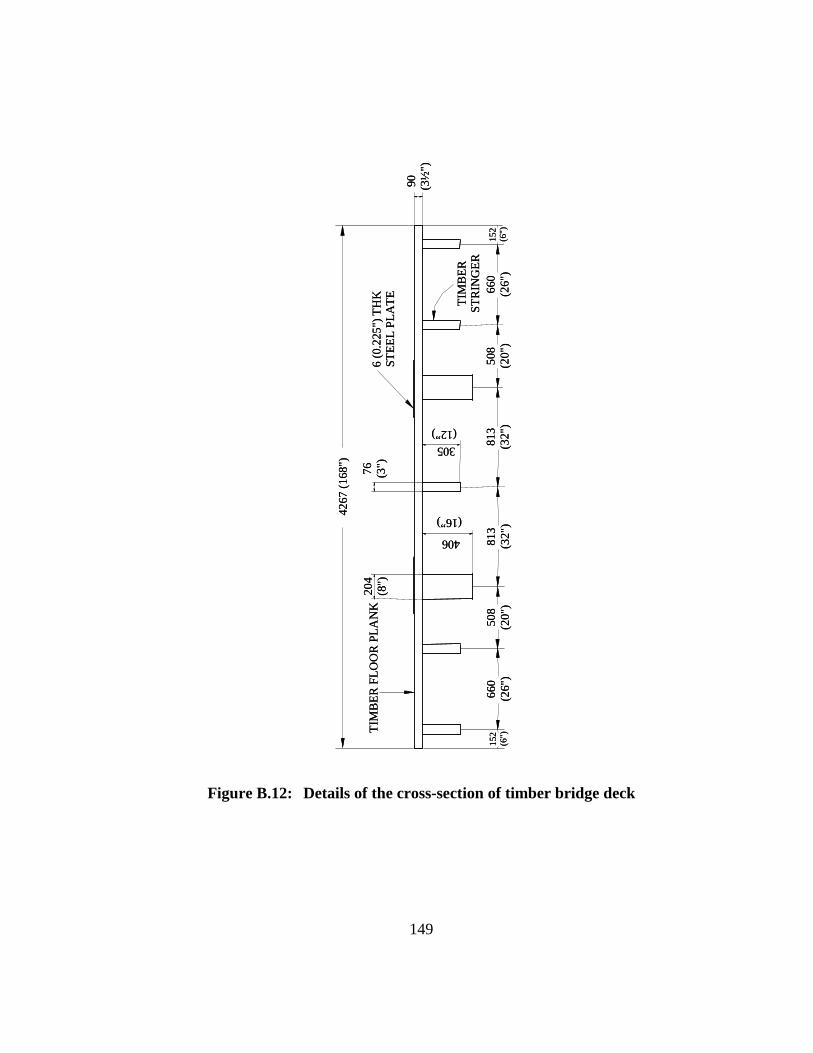
149
Figure B.12: Details of the cross-section of timber bridge deck
152
(6")
660
(26"
)50
8(2
0")
813
(32"
)81
3(3
2")
508
(20"
)15
2(6
")66
0(2
6")
4267
(168
")
90 (3½
")
204
(8")
406
(16”)
76 (3")
305(12”)
6 (0
.225
") T
HK
STEE
L PL
ATE
TIM
BER
FLO
OR
PLA
NK
TIM
BER
STR
ING
ER15
2(6
")66
0(2
6")
508
(20"
)81
3(3
2")
813
(32"
)50
8(2
0")
152
(6")
660
(26"
)
4267
(168
")
90 (3½
")
204
(8")
406
(16”)
76 (3")
305(12”)
6 (0
.225
") T
HK
STEE
L PL
ATE
TIM
BER
FLO
OR
PLA
NK
TIM
BER
STR
ING
ER
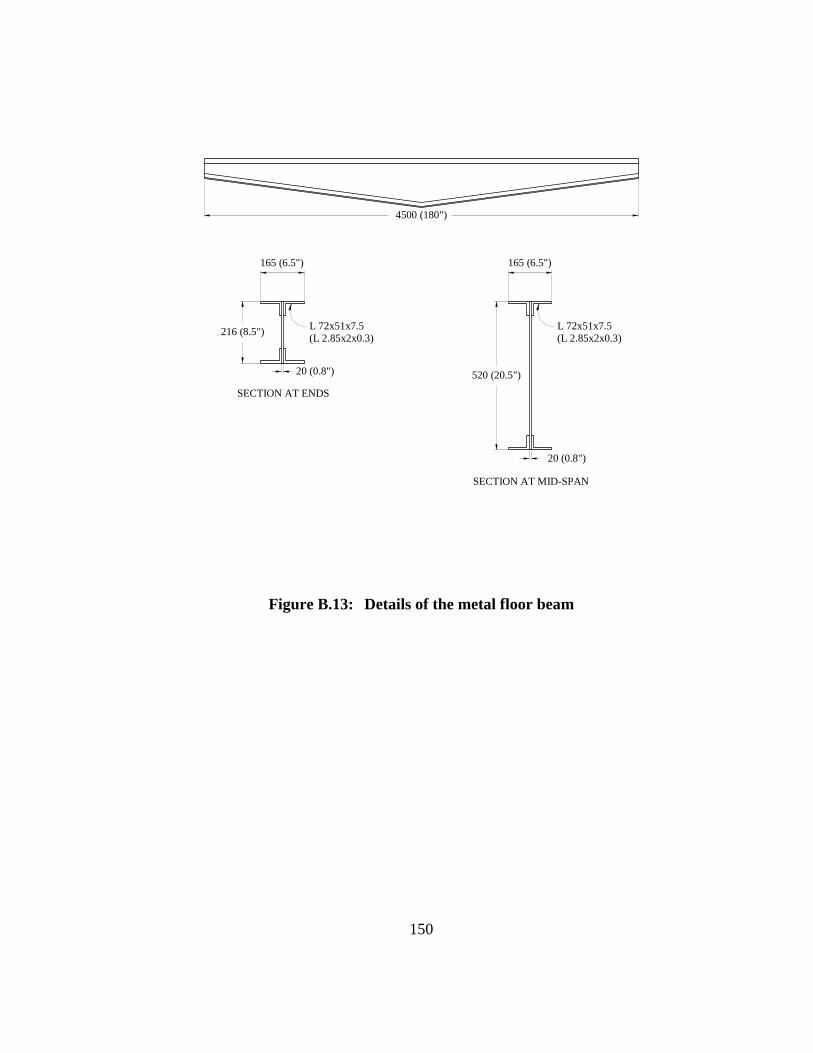
150
4500 (180")
SECTION AT ENDS
L 72x51x7.5(L 2.85x2x0.3)
SECTION AT MID-SPAN
L 72x51x7.5(L 2.85x2x0.3)216 (8.5")
165 (6.5")
20 (0.8")
165 (6.5")
20 (0.8")
520 (20.5")
Figure B.13: Details of the metal floor beam
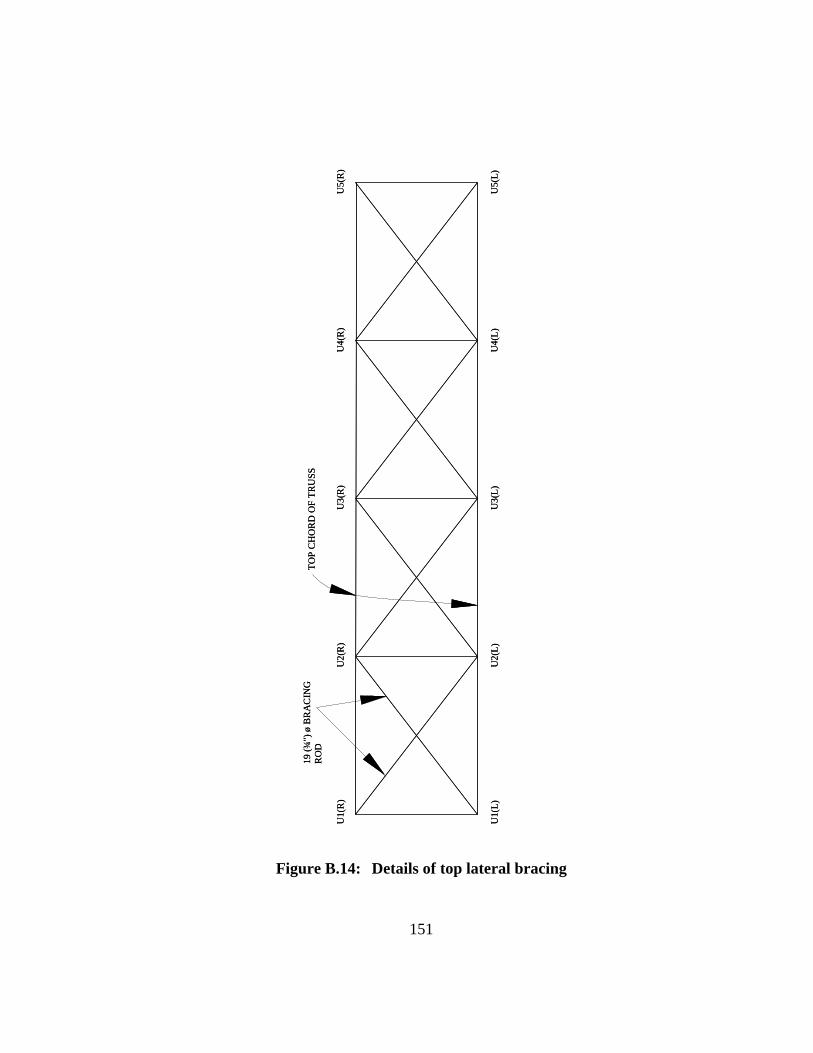
151
Figure B.14: Details of top lateral bracing
U1(
L)U
2(L)
U3(
L)U
4(L)
U5(
L)
U1(
R)
U2(
R)
U3(
R)
U4(
R)
U5(
R)
19 (¾
") ø
BR
AC
ING
RO
DTO
P C
HO
RD
OF
TRU
SS
U1(
L)U
2(L)
U3(
L)U
4(L)
U5(
L)
U1(
R)
U2(
R)
U3(
R)
U4(
R)
U5(
R)
19 (¾
") ø
BR
AC
ING
RO
DTO
P C
HO
RD
OF
TRU
SS
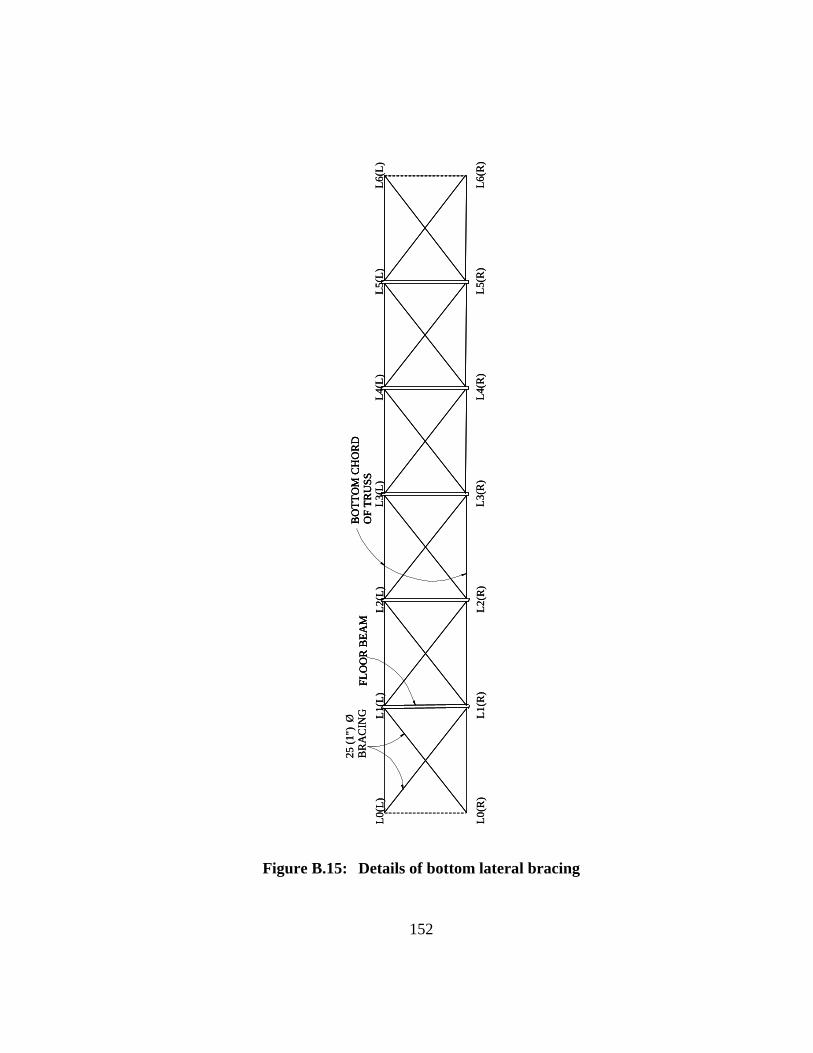
152
Figure B.15: Details of bottom lateral bracing
L0(R
)L1
(R)
L2(R
)L3
(R)
L4(R
)L5
(R)
L6(R
)
L0(L
)L1
(L)
L2(L
)L3
(L)
L4(L
)L5
(L)
L6(L
)
25 (1
")Ø
BR
AC
ING
FLO
OR
BEA
MB
OTT
OM
CH
OR
DO
F TR
USS
L0(R
)L1
(R)
L2(R
)L3
(R)
L4(R
)L5
(R)
L6(R
)
L0(L
)L1
(L)
L2(L
)L3
(L)
L4(L
)L5
(L)
L6(L
)
25 (1
")Ø
BR
AC
ING
FLO
OR
BEA
MB
OTT
OM
CH
OR
DO
F TR
USS
FLO
OR
BEA
MB
OTT
OM
CH
OR
DO
F TR
USS
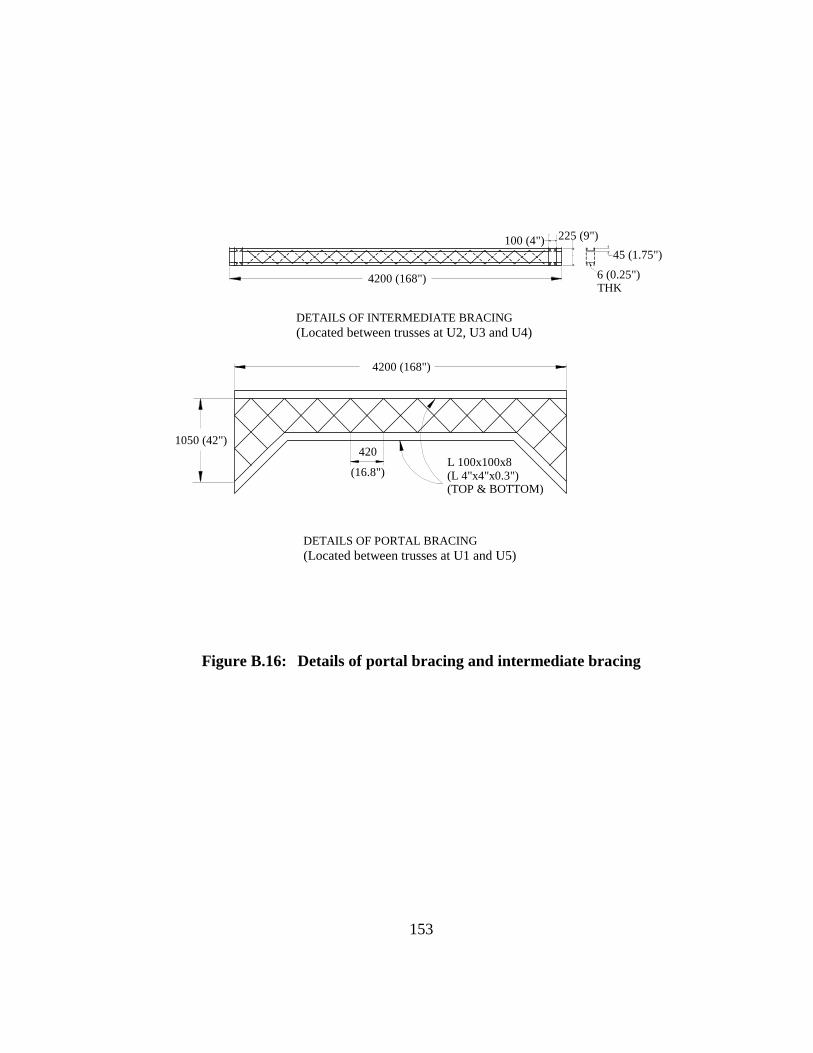
153
L 100x100x8(L 4"x4"x0.3")(TOP & BOTTOM)
4200 (168")
4201050 (42")
225 (9")45 (1.75")
100 (4")
4200 (168") 6 (0.25")THK
(16.8")
DETAILS OF INTERMEDIATE BRACING (Located between trusses at U2, U3 and U4)
DETAILS OF PORTAL BRACING (Located between trusses at U1 and U5)
Figure B.16: Details of portal bracing and intermediate bracing
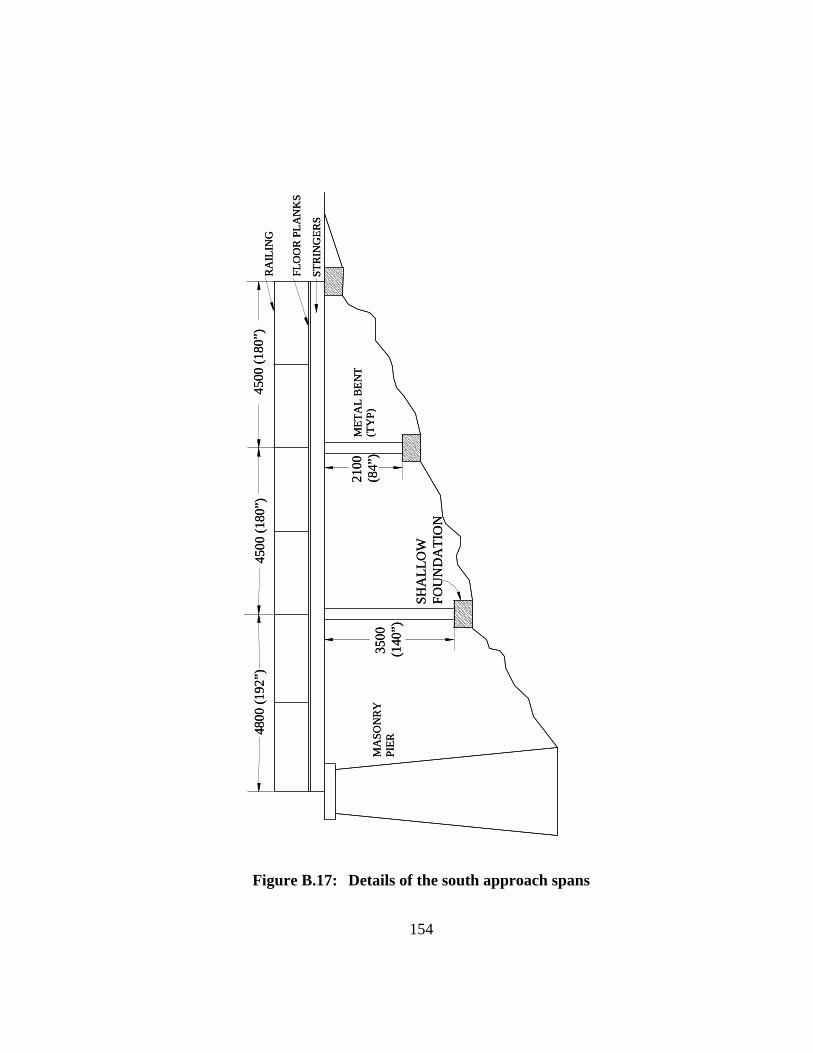
154
Figure B.17: Details of the south approach spans
RA
ILIN
G
FLO
OR
PLA
NK
S
STR
ING
ERS
MET
AL
BEN
T(T
YP)
MA
SON
RY
PIER
4800
(192
”)45
00 (1
80”)
4500
(180
”)
2100
(84”
)35
00(1
40”)
SHA
LLO
WFO
UN
DA
TIO
N
RA
ILIN
G
FLO
OR
PLA
NK
S
STR
ING
ERS
MET
AL
BEN
T(T
YP)
MA
SON
RY
PIER
4800
(192
”)45
00 (1
80”)
4500
(180
”)
2100
(84”
)35
00(1
40”)
SHA
LLO
WFO
UN
DA
TIO
N
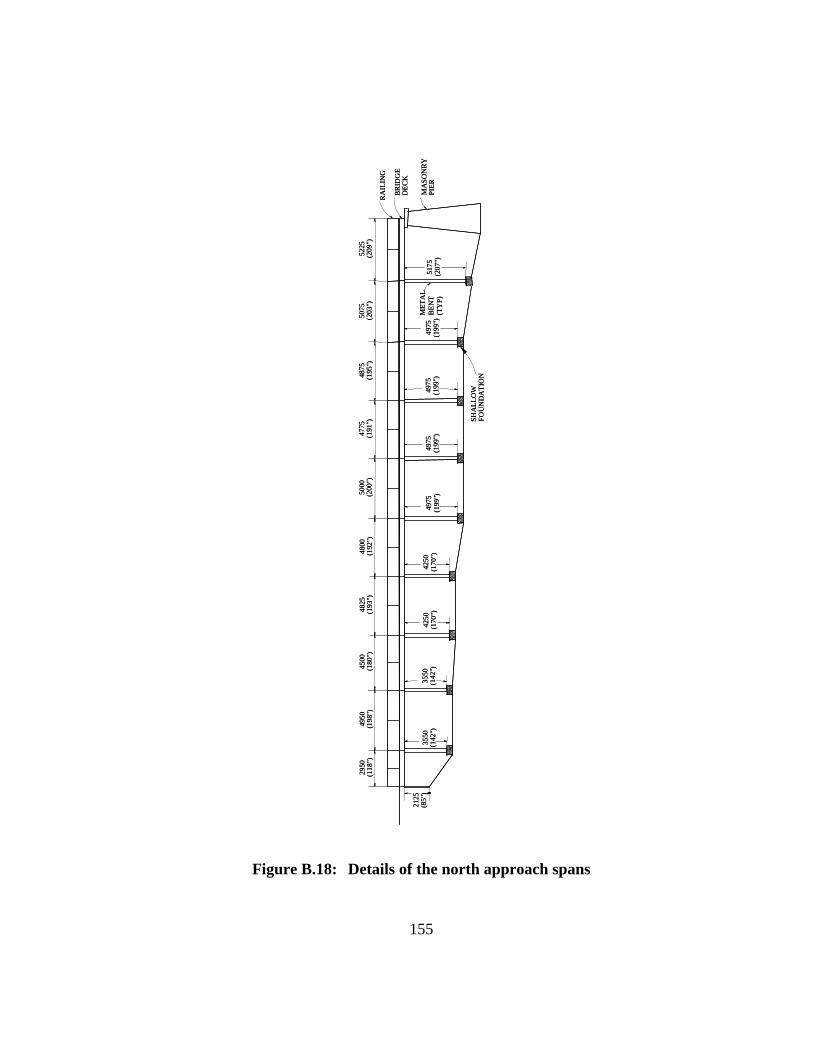
155
Figure B.18: Details of the north approach spans
2950
(118
")49
50(1
98")
4500
(180
")48
25(1
93")
4800
(192
")50
00(2
00")
4775
(191
")48
75(1
95")
5075
(203
")52
25(2
09")
2125
(85"
)35
50(1
42")
3550
(142
")42
50(1
70")
4975
(199
")51
75(2
07")
4250
(170
")49
75(1
99")
4975
(199
")49
75(1
99")
RA
ILIN
G
BRID
GE
DEC
K
MA
SON
RY
PIER
MET
AL
BEN
T(T
YP)
SHA
LLO
WFO
UN
DA
TIO
N
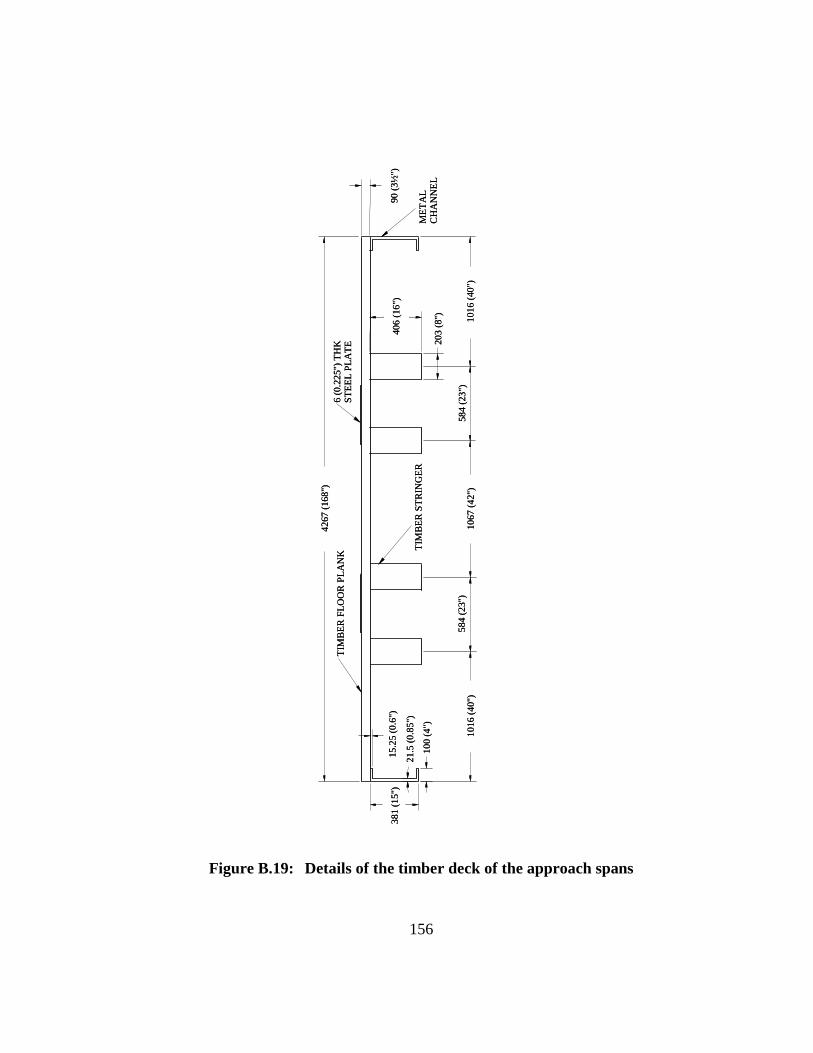
156
Figure B.19: Details of the timber deck of the approach spans
6 (0
.225
") T
HK
STEE
L PL
ATE
4267
(168
")
90 (3
½")
1016
(40"
)
203
(8")
406
(16"
)
584
(23"
)10
67 (4
2")
584
(23"
)10
16 (4
0")
100
(4")
21.5
(0.8
5")
15.2
5 (0
.6")
381
(15"
)
MET
AL
CH
AN
NEL
TIM
BER
FLO
OR
PLA
NK
TIM
BER
STR
ING
ER
6 (0
.225
") T
HK
STEE
L PL
ATE
4267
(168
")
90 (3
½")
1016
(40"
)
203
(8")
406
(16"
)
584
(23"
)10
67 (4
2")
584
(23"
)10
16 (4
0")
100
(4")
21.5
(0.8
5")
15.2
5 (0
.6")
381
(15"
)
MET
AL
CH
AN
NEL
TIM
BER
FLO
OR
PLA
NK
TIM
BER
STR
ING
ER
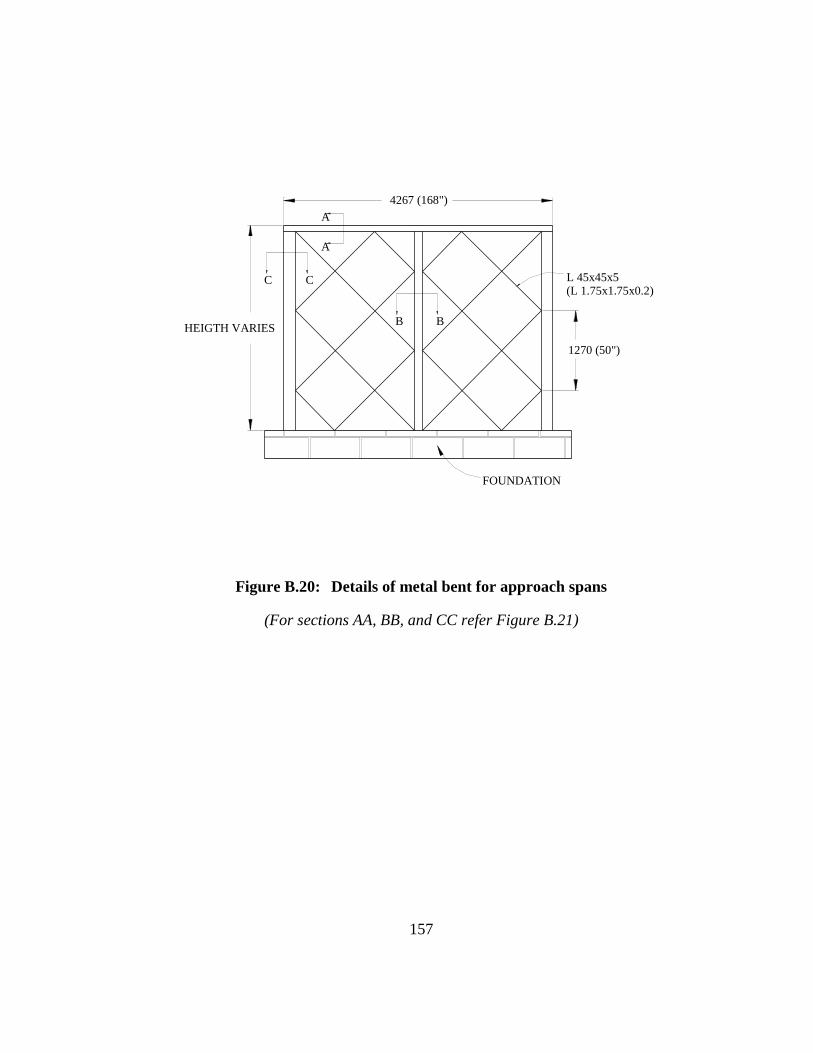
157
A
A
C C
B BHEIGTH VARIES
1270 (50")
L 45x45x5(L 1.75x1.75x0.2)
FOUNDATION
4267 (168")
Figure B.20: Details of metal bent for approach spans
(For sections AA, BB, and CC refer Figure B.21)
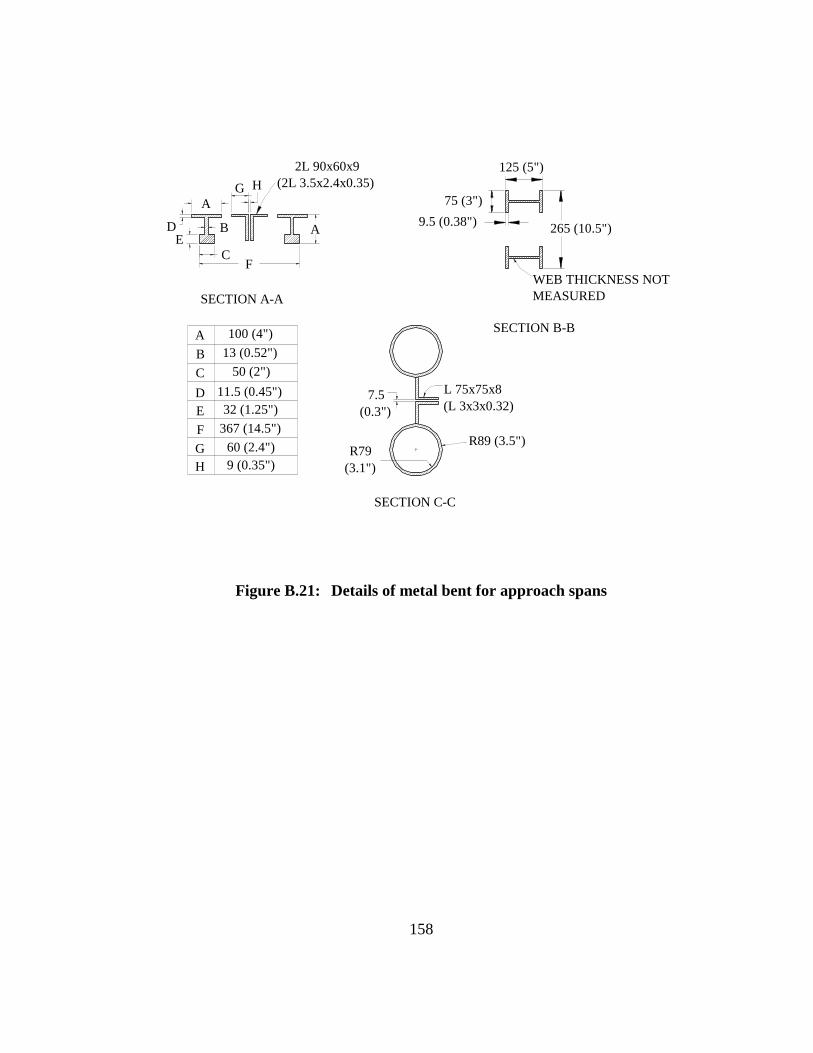
158
7.5(0.3")
R79(3.1")
SECTION C-C
ABE
SECTION A-A
FC
A
D
G H
265 (10.5")
R89 (3.5")
L 75x75x8(L 3x3x0.32)
WEB THICKNESS NOT MEASURED
SECTION B-B
125 (5")
9.5 (0.38")75 (3")
2L 90x60x9(2L 3.5x2.4x0.35)
A 100 (4") B 13 (0.52") C 50 (2") D 11.5 (0.45") E 32 (1.25") F 367 (14.5") G 60 (2.4") H 9 (0.35")
Figure B.21: Details of metal bent for approach spans
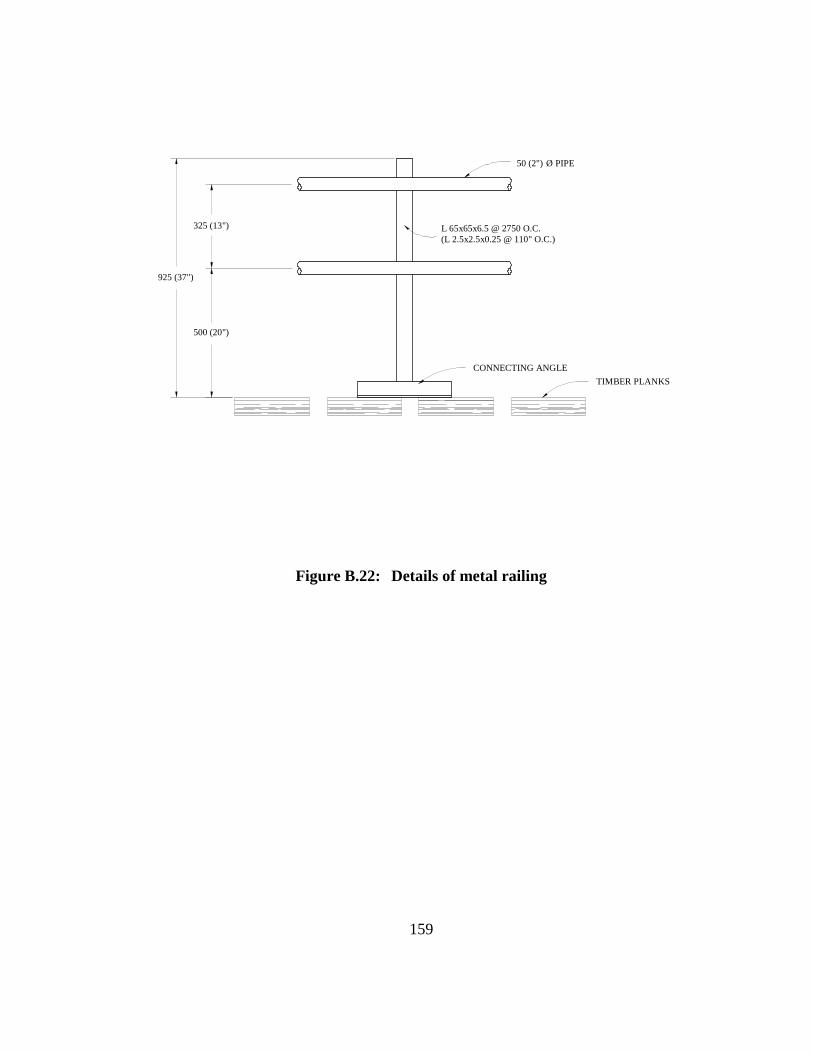
159
50 (2") Ø PIPE
L 65x65x6.5 @ 2750 O.C.(L 2.5x2.5x0.25 @ 110" O.C.)
TIMBER PLANKS
925 (37")
325 (13")
500 (20")
CONNECTING ANGLE
Figure B.22: Details of metal railing
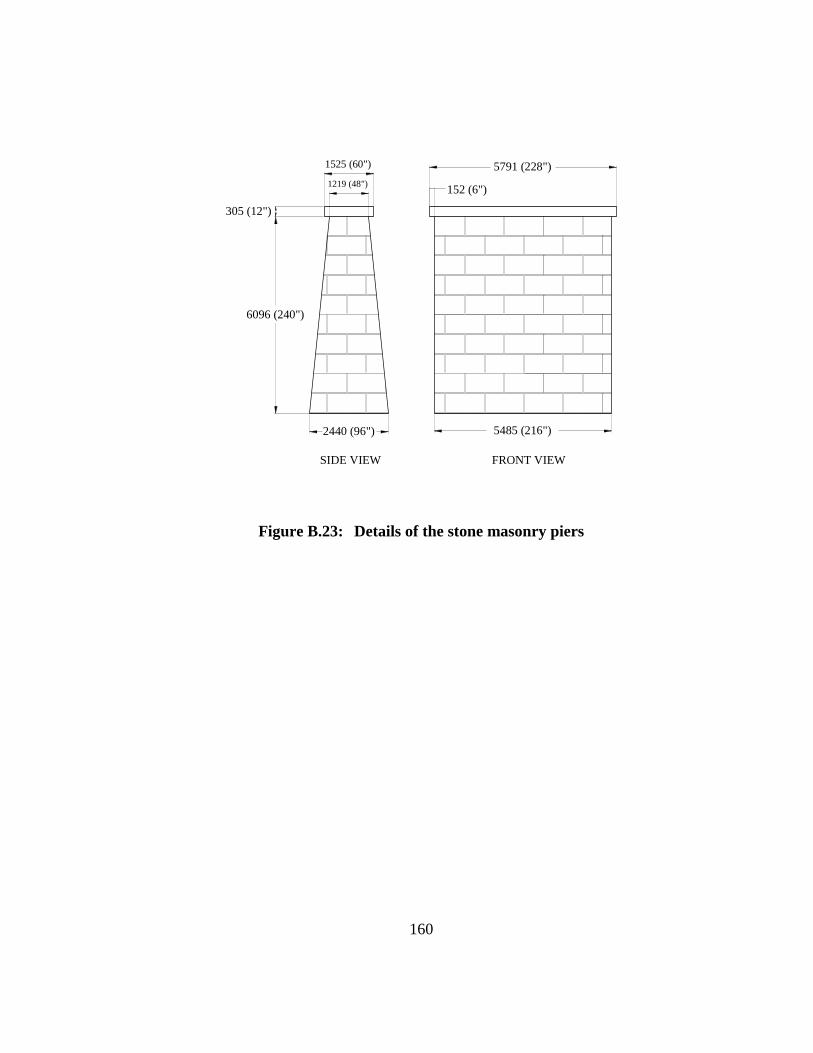
160
5485 (216")2440 (96")
6096 (240")
305 (12")
1525 (60")
1219 (48") 152 (6")
5791 (228")
SIDE VIEW FRONT VIEW
Figure B.23: Details of the stone masonry piers
161
Appendix C: Background Information on Wrought Iron
Background information on wrought iron is available from several sources [Aston 1936, Cain 1924, Clauser 1963, Frank 1974, Kent 1916, Mark 1930, Mills 1939, Miner 1955, Rawdon 1924, and Rawdon 1917]. Many of these sources are older publications that are no longer widely available. Consequently, information available in the above noted references has been reproduced and adapted in this appendix for the convenience of the reader.
C.1 INTRODUCTION
The definition of wrought iron given by the American Society for Testing Materials is: “A ferrous material, aggregated from a solidifying mass of pasty particles of highly refined metallic iron, with which, without subsequent fusion, is incorporated a minutely and uniformly distributed quantity of slag”.
Wrought iron is one of the oldest forms of ferrous metal made by man. It is a tough, ductile, and easily malleable metal. These properties are due to its low carbon content, usually less than 0.12 percent, and absence of impurities. It can be forged and welded, and has a high capacity to withstand the action of shocks and vibrations; but it cannot be tempered so as to form cutting tools. Wrought iron melts at white heat, but is pasty at lower temperatures, and in this condition can be easily worked and welded. It is ductile when cold. Wrought iron differs from all other metals in that it is produced in a pasty, rather than a molten condition and it contains a large percentage of iron silicate slag distributed throughout the mass. There is no chemical combination between the two materials. For this reason, wrought iron is called a “two component” metal, in contrast to the chemical or alloy relationship that generally exists between the constituents of other metals. Hence wrought iron is a two-component metal composed of high-purity iron and iron silicate, which is an inert non-rusting glasslike slag. The slag content varies from about 1 to 3 percent in finished wrought iron. The slag is distributed throughout the iron in the form of threads or fibers which extend in the direction of rolling and are so thoroughly distributed throughout the iron that there may be 250,000 or more per square inch of cross-section. The slag content is responsible for the laminated or fibrous structure which characterizes wrought iron, and which serves to differentiate it from steel.
Wrought iron may be graded as Charcoal iron, Puddle iron, and Busheled iron. The first is the purest grade of wrought iron. The second is classified as staybolt (grade A) and merchant iron (grades B and C). The third grade is made from iron scrap, with which steel sometimes is mixed. It is irregular in quality.
C.2 THE MANUFACTURING OF WROUGHT IRON
There are two processes by which wrought iron can be manufactured. These are the puddling process and the Aston process or New Byers process. Both the methods are described in the following sections.
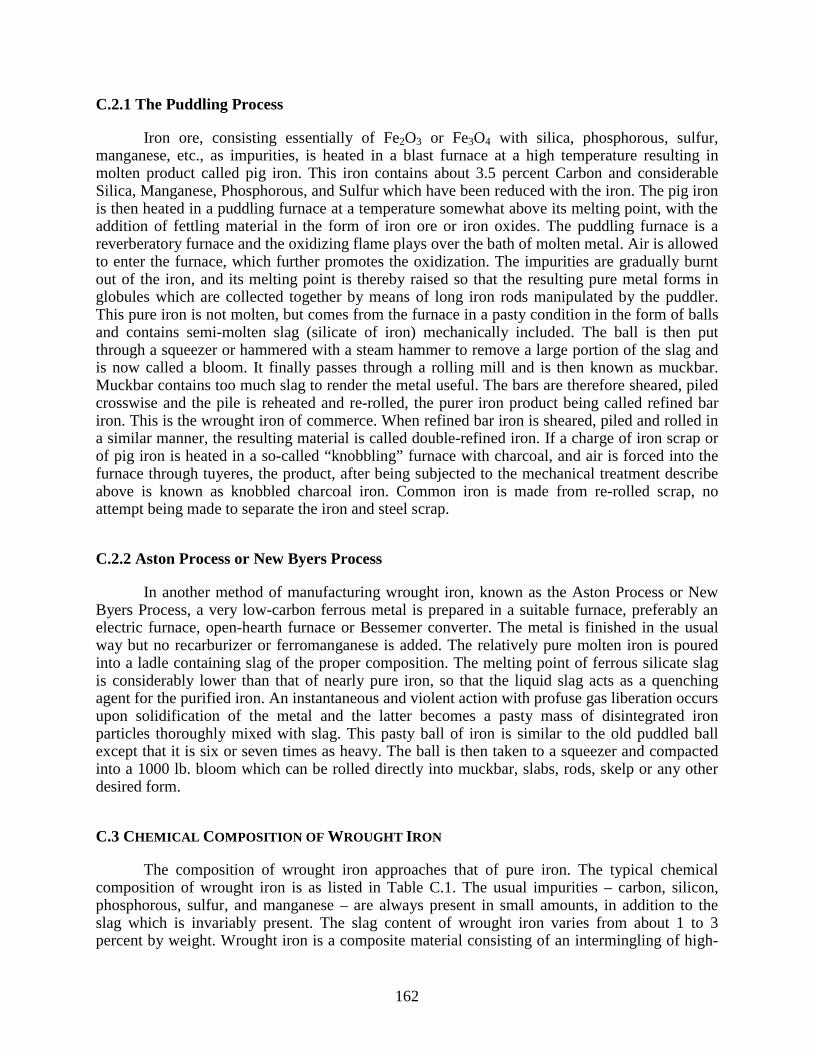
162
C.2.1 The Puddling Process
Iron ore, consisting essentially of Fe2O3 or Fe3O4 with silica, phosphorous, sulfur, manganese, etc., as impurities, is heated in a blast furnace at a high temperature resulting in molten product called pig iron. This iron contains about 3.5 percent Carbon and considerable Silica, Manganese, Phosphorous, and Sulfur which have been reduced with the iron. The pig iron is then heated in a puddling furnace at a temperature somewhat above its melting point, with the addition of fettling material in the form of iron ore or iron oxides. The puddling furnace is a reverberatory furnace and the oxidizing flame plays over the bath of molten metal. Air is allowed to enter the furnace, which further promotes the oxidization. The impurities are gradually burnt out of the iron, and its melting point is thereby raised so that the resulting pure metal forms in globules which are collected together by means of long iron rods manipulated by the puddler. This pure iron is not molten, but comes from the furnace in a pasty condition in the form of balls and contains semi-molten slag (silicate of iron) mechanically included. The ball is then put through a squeezer or hammered with a steam hammer to remove a large portion of the slag and is now called a bloom. It finally passes through a rolling mill and is then known as muckbar. Muckbar contains too much slag to render the metal useful. The bars are therefore sheared, piled crosswise and the pile is reheated and re-rolled, the purer iron product being called refined bar iron. This is the wrought iron of commerce. When refined bar iron is sheared, piled and rolled in a similar manner, the resulting material is called double-refined iron. If a charge of iron scrap or of pig iron is heated in a so-called “knobbling” furnace with charcoal, and air is forced into the furnace through tuyeres, the product, after being subjected to the mechanical treatment describe above is known as knobbled charcoal iron. Common iron is made from re-rolled scrap, no attempt being made to separate the iron and steel scrap.
C.2.2 Aston Process or New Byers Process
In another method of manufacturing wrought iron, known as the Aston Process or New Byers Process, a very low-carbon ferrous metal is prepared in a suitable furnace, preferably an electric furnace, open-hearth furnace or Bessemer converter. The metal is finished in the usual way but no recarburizer or ferromanganese is added. The relatively pure molten iron is poured into a ladle containing slag of the proper composition. The melting point of ferrous silicate slag is considerably lower than that of nearly pure iron, so that the liquid slag acts as a quenching agent for the purified iron. An instantaneous and violent action with profuse gas liberation occurs upon solidification of the metal and the latter becomes a pasty mass of disintegrated iron particles thoroughly mixed with slag. This pasty ball of iron is similar to the old puddled ball except that it is six or seven times as heavy. The ball is then taken to a squeezer and compacted into a 1000 lb. bloom which can be rolled directly into muckbar, slabs, rods, skelp or any other desired form.
C.3 CHEMICAL COMPOSITION OF WROUGHT IRON
The composition of wrought iron approaches that of pure iron. The typical chemical composition of wrought iron is as listed in Table C.1. The usual impurities – carbon, silicon, phosphorous, sulfur, and manganese – are always present in small amounts, in addition to the slag which is invariably present. The slag content of wrought iron varies from about 1 to 3 percent by weight. Wrought iron is a composite material consisting of an intermingling of high-
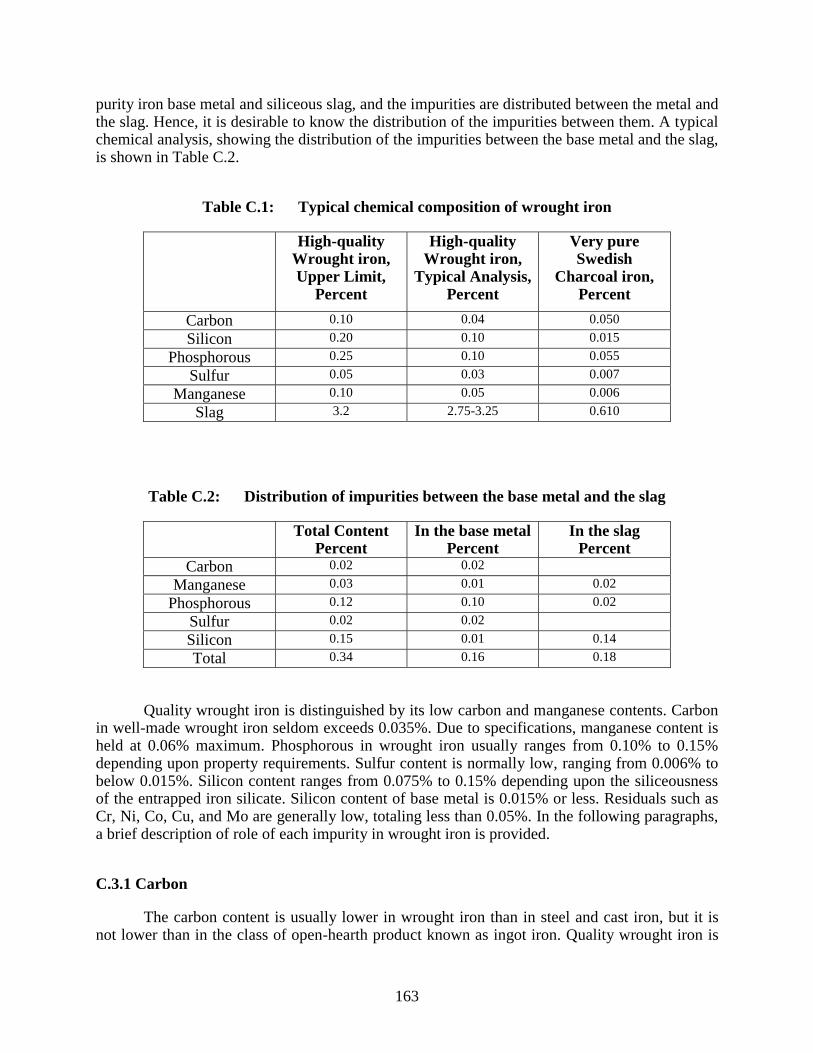
163
purity iron base metal and siliceous slag, and the impurities are distributed between the metal and the slag. Hence, it is desirable to know the distribution of the impurities between them. A typical chemical analysis, showing the distribution of the impurities between the base metal and the slag, is shown in Table C.2.
Table C.1: Typical chemical composition of wrought iron
High-quality Wrought iron, Upper Limit,
Percent
High-quality Wrought iron,
Typical Analysis, Percent
Very pure Swedish
Charcoal iron, Percent
Carbon 0.10 0.04 0.050 Silicon 0.20 0.10 0.015
Phosphorous 0.25 0.10 0.055 Sulfur 0.05 0.03 0.007
Manganese 0.10 0.05 0.006 Slag 3.2 2.75-3.25 0.610
Table C.2: Distribution of impurities between the base metal and the slag
Total Content Percent
In the base metalPercent
In the slag Percent
Carbon 0.02 0.02 Manganese 0.03 0.01 0.02
Phosphorous 0.12 0.10 0.02 Sulfur 0.02 0.02 Silicon 0.15 0.01 0.14 Total 0.34 0.16 0.18
Quality wrought iron is distinguished by its low carbon and manganese contents. Carbon in well-made wrought iron seldom exceeds 0.035%. Due to specifications, manganese content is held at 0.06% maximum. Phosphorous in wrought iron usually ranges from 0.10% to 0.15% depending upon property requirements. Sulfur content is normally low, ranging from 0.006% to below 0.015%. Silicon content ranges from 0.075% to 0.15% depending upon the siliceousness of the entrapped iron silicate. Silicon content of base metal is 0.015% or less. Residuals such as Cr, Ni, Co, Cu, and Mo are generally low, totaling less than 0.05%. In the following paragraphs, a brief description of role of each impurity in wrought iron is provided.
C.3.1 Carbon
The carbon content is usually lower in wrought iron than in steel and cast iron, but it is not lower than in the class of open-hearth product known as ingot iron. Quality wrought iron is
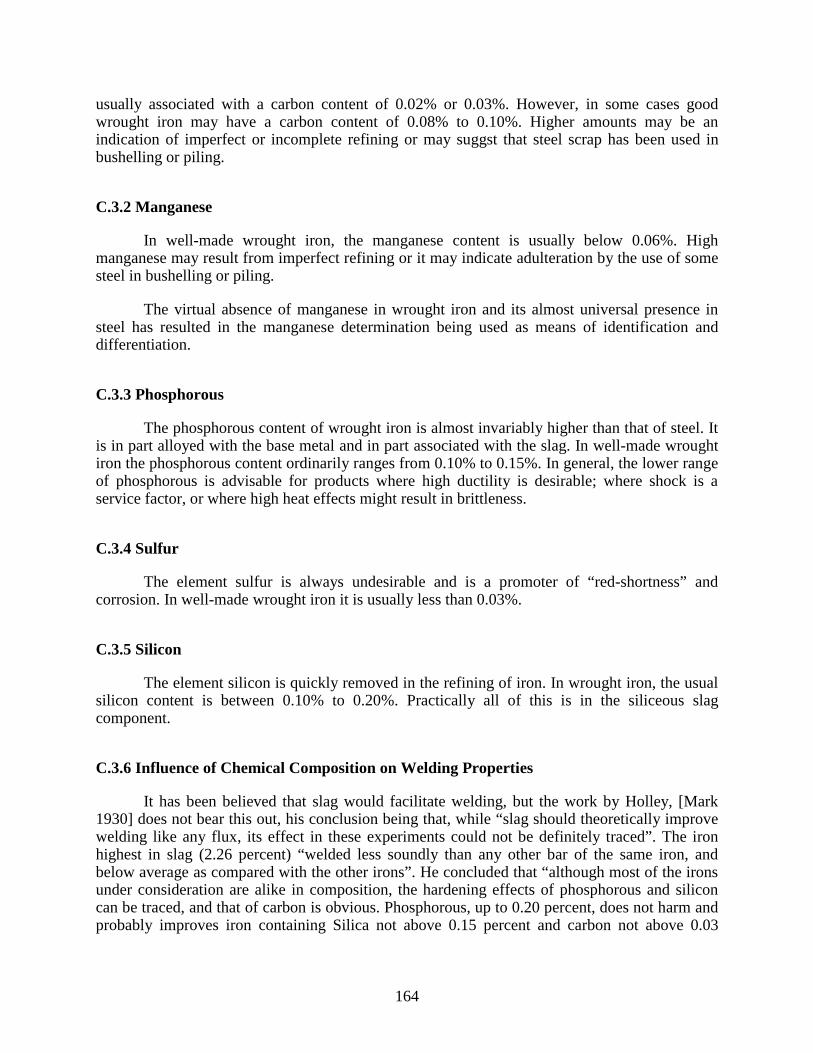
164
usually associated with a carbon content of 0.02% or 0.03%. However, in some cases good wrought iron may have a carbon content of 0.08% to 0.10%. Higher amounts may be an indication of imperfect or incomplete refining or may suggst that steel scrap has been used in bushelling or piling.
C.3.2 Manganese
In well-made wrought iron, the manganese content is usually below 0.06%. High manganese may result from imperfect refining or it may indicate adulteration by the use of some steel in bushelling or piling.
The virtual absence of manganese in wrought iron and its almost universal presence in steel has resulted in the manganese determination being used as means of identification and differentiation.
C.3.3 Phosphorous
The phosphorous content of wrought iron is almost invariably higher than that of steel. It is in part alloyed with the base metal and in part associated with the slag. In well-made wrought iron the phosphorous content ordinarily ranges from 0.10% to 0.15%. In general, the lower range of phosphorous is advisable for products where high ductility is desirable; where shock is a service factor, or where high heat effects might result in brittleness.
C.3.4 Sulfur
The element sulfur is always undesirable and is a promoter of “red-shortness” and corrosion. In well-made wrought iron it is usually less than 0.03%.
C.3.5 Silicon
The element silicon is quickly removed in the refining of iron. In wrought iron, the usual silicon content is between 0.10% to 0.20%. Practically all of this is in the siliceous slag component.
C.3.6 Influence of Chemical Composition on Welding Properties
It has been believed that slag would facilitate welding, but the work by Holley, [Mark 1930] does not bear this out, his conclusion being that, while “slag should theoretically improve welding like any flux, its effect in these experiments could not be definitely traced”. The iron highest in slag (2.26 percent) “welded less soundly than any other bar of the same iron, and below average as compared with the other irons”. He concluded that “although most of the irons under consideration are alike in composition, the hardening effects of phosphorous and silicon can be traced, and that of carbon is obvious. Phosphorous, up to 0.20 percent, does not harm and probably improves iron containing Silica not above 0.15 percent and carbon not above 0.03
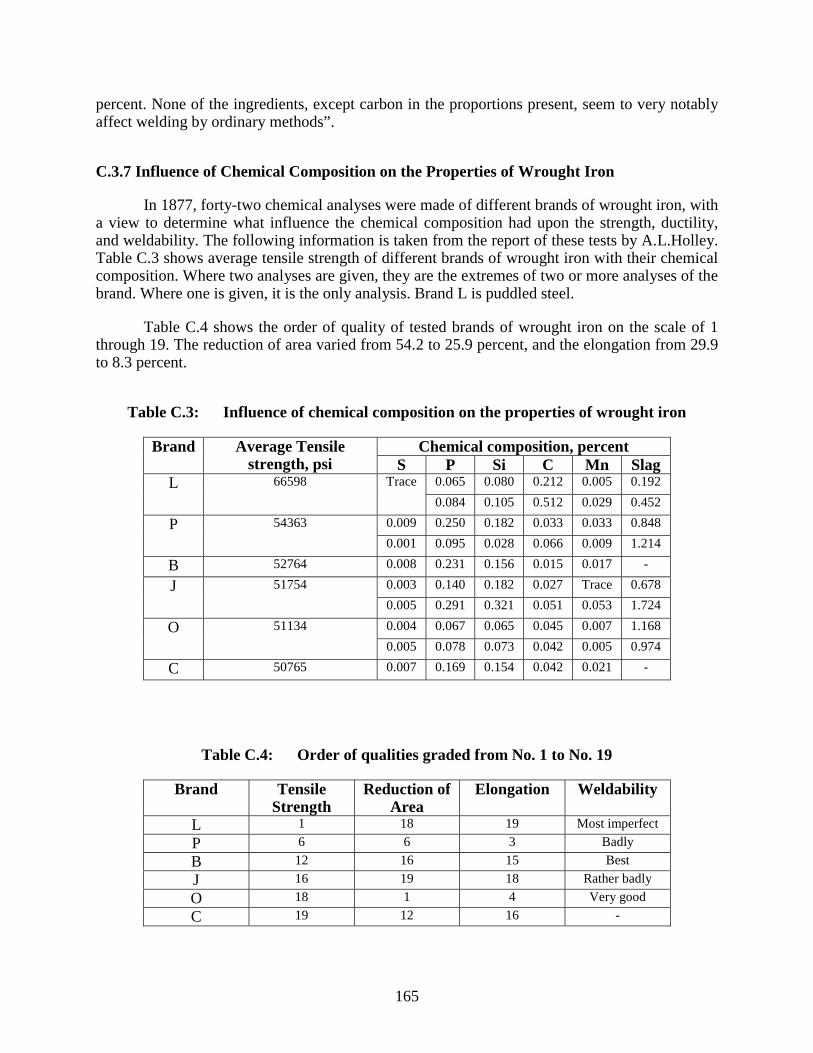
165
percent. None of the ingredients, except carbon in the proportions present, seem to very notably affect welding by ordinary methods”.
C.3.7 Influence of Chemical Composition on the Properties of Wrought Iron
In 1877, forty-two chemical analyses were made of different brands of wrought iron, with a view to determine what influence the chemical composition had upon the strength, ductility, and weldability. The following information is taken from the report of these tests by A.L.Holley. Table C.3 shows average tensile strength of different brands of wrought iron with their chemical composition. Where two analyses are given, they are the extremes of two or more analyses of the brand. Where one is given, it is the only analysis. Brand L is puddled steel.
Table C.4 shows the order of quality of tested brands of wrought iron on the scale of 1 through 19. The reduction of area varied from 54.2 to 25.9 percent, and the elongation from 29.9 to 8.3 percent.
Table C.3: Influence of chemical composition on the properties of wrought iron
Chemical composition, percent Brand Average Tensile strength, psi S P Si C Mn Slag
0.065 0.080 0.212 0.005 0.192 L 66598 Trace 0.084 0.105 0.512 0.029 0.452
0.009 0.250 0.182 0.033 0.033 0.848 P 54363 0.001 0.095 0.028 0.066 0.009 1.214
B 52764 0.008 0.231 0.156 0.015 0.017 - 0.003 0.140 0.182 0.027 Trace 0.678 J 51754 0.005 0.291 0.321 0.051 0.053 1.724 0.004 0.067 0.065 0.045 0.007 1.168 O 51134 0.005 0.078 0.073 0.042 0.005 0.974
C 50765 0.007 0.169 0.154 0.042 0.021 -
Table C.4: Order of qualities graded from No. 1 to No. 19
Brand Tensile Strength
Reduction of Area
Elongation Weldability
L 1 18 19 Most imperfect P 6 6 3 Badly B 12 16 15 Best J 16 19 18 Rather badly O 18 1 4 Very good C 19 12 16 -
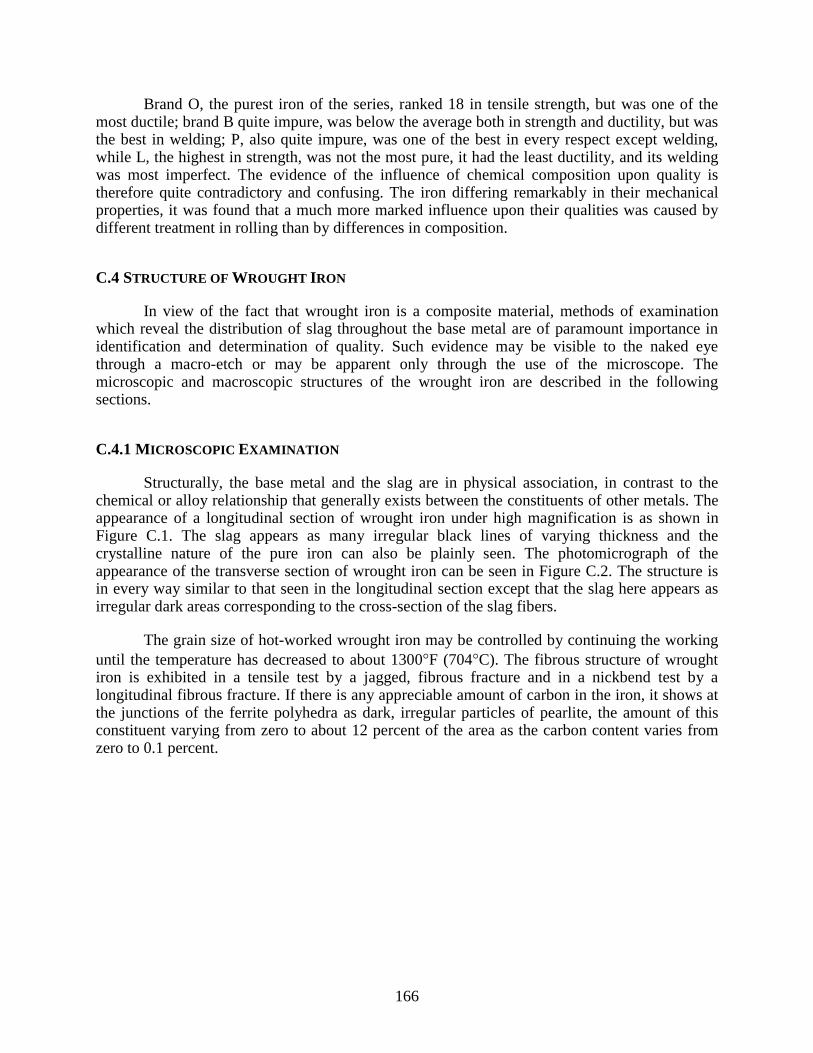
166
Brand O, the purest iron of the series, ranked 18 in tensile strength, but was one of the most ductile; brand B quite impure, was below the average both in strength and ductility, but was the best in welding; P, also quite impure, was one of the best in every respect except welding, while L, the highest in strength, was not the most pure, it had the least ductility, and its welding was most imperfect. The evidence of the influence of chemical composition upon quality is therefore quite contradictory and confusing. The iron differing remarkably in their mechanical properties, it was found that a much more marked influence upon their qualities was caused by different treatment in rolling than by differences in composition.
C.4 STRUCTURE OF WROUGHT IRON
In view of the fact that wrought iron is a composite material, methods of examination which reveal the distribution of slag throughout the base metal are of paramount importance in identification and determination of quality. Such evidence may be visible to the naked eye through a macro-etch or may be apparent only through the use of the microscope. The microscopic and macroscopic structures of the wrought iron are described in the following sections.
C.4.1 MICROSCOPIC EXAMINATION
Structurally, the base metal and the slag are in physical association, in contrast to the chemical or alloy relationship that generally exists between the constituents of other metals. The appearance of a longitudinal section of wrought iron under high magnification is as shown in Figure C.1. The slag appears as many irregular black lines of varying thickness and the crystalline nature of the pure iron can also be plainly seen. The photomicrograph of the appearance of the transverse section of wrought iron can be seen in Figure C.2. The structure is in every way similar to that seen in the longitudinal section except that the slag here appears as irregular dark areas corresponding to the cross-section of the slag fibers.
The grain size of hot-worked wrought iron may be controlled by continuing the working until the temperature has decreased to about 1300°F (704°C). The fibrous structure of wrought iron is exhibited in a tensile test by a jagged, fibrous fracture and in a nickbend test by a longitudinal fibrous fracture. If there is any appreciable amount of carbon in the iron, it shows at the junctions of the ferrite polyhedra as dark, irregular particles of pearlite, the amount of this constituent varying from zero to about 12 percent of the area as the carbon content varies from zero to 0.1 percent.
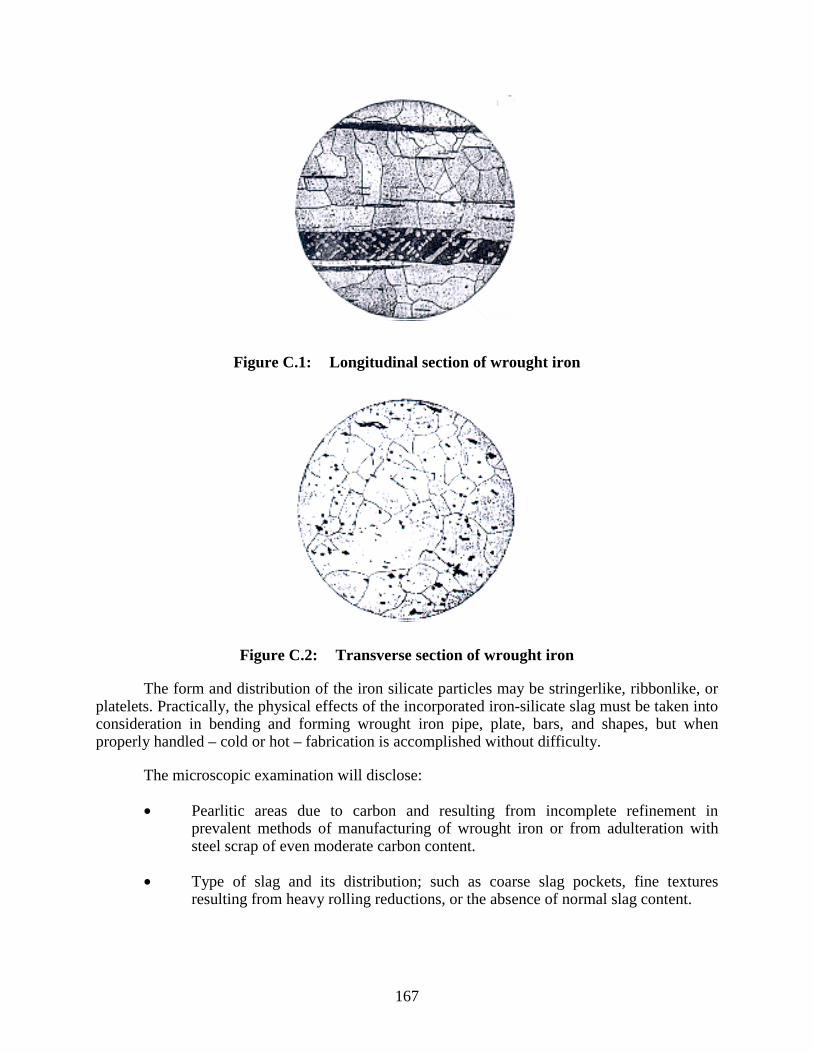
167
Figure C.1: Longitudinal section of wrought iron
Figure C.2: Transverse section of wrought iron
The form and distribution of the iron silicate particles may be stringerlike, ribbonlike, or platelets. Practically, the physical effects of the incorporated iron-silicate slag must be taken into consideration in bending and forming wrought iron pipe, plate, bars, and shapes, but when properly handled – cold or hot – fabrication is accomplished without difficulty.
The microscopic examination will disclose:
• Pearlitic areas due to carbon and resulting from incomplete refinement in prevalent methods of manufacturing of wrought iron or from adulteration with steel scrap of even moderate carbon content.
• Type of slag and its distribution; such as coarse slag pockets, fine textures resulting from heavy rolling reductions, or the absence of normal slag content.
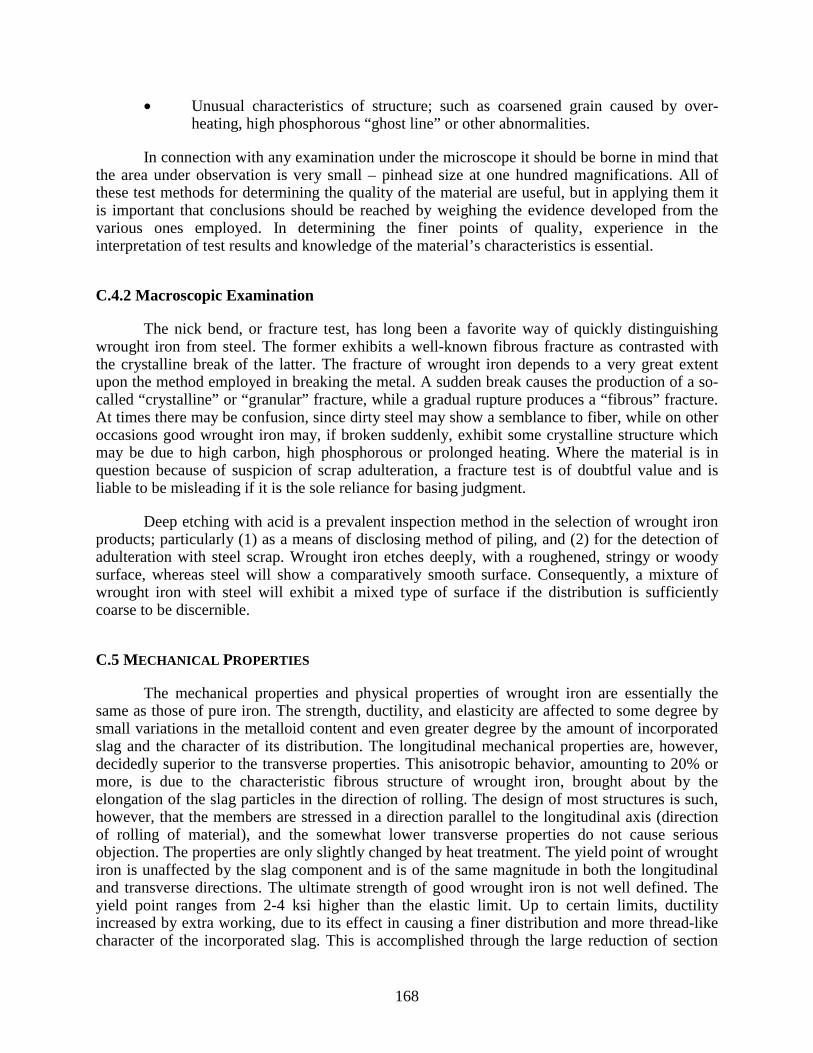
168
• Unusual characteristics of structure; such as coarsened grain caused by over-heating, high phosphorous “ghost line” or other abnormalities.
In connection with any examination under the microscope it should be borne in mind that the area under observation is very small – pinhead size at one hundred magnifications. All of these test methods for determining the quality of the material are useful, but in applying them it is important that conclusions should be reached by weighing the evidence developed from the various ones employed. In determining the finer points of quality, experience in the interpretation of test results and knowledge of the material’s characteristics is essential.
C.4.2 Macroscopic Examination
The nick bend, or fracture test, has long been a favorite way of quickly distinguishing wrought iron from steel. The former exhibits a well-known fibrous fracture as contrasted with the crystalline break of the latter. The fracture of wrought iron depends to a very great extent upon the method employed in breaking the metal. A sudden break causes the production of a so-called “crystalline” or “granular” fracture, while a gradual rupture produces a “fibrous” fracture. At times there may be confusion, since dirty steel may show a semblance to fiber, while on other occasions good wrought iron may, if broken suddenly, exhibit some crystalline structure which may be due to high carbon, high phosphorous or prolonged heating. Where the material is in question because of suspicion of scrap adulteration, a fracture test is of doubtful value and is liable to be misleading if it is the sole reliance for basing judgment.
Deep etching with acid is a prevalent inspection method in the selection of wrought iron products; particularly (1) as a means of disclosing method of piling, and (2) for the detection of adulteration with steel scrap. Wrought iron etches deeply, with a roughened, stringy or woody surface, whereas steel will show a comparatively smooth surface. Consequently, a mixture of wrought iron with steel will exhibit a mixed type of surface if the distribution is sufficiently coarse to be discernible.
C.5 MECHANICAL PROPERTIES
The mechanical properties and physical properties of wrought iron are essentially the same as those of pure iron. The strength, ductility, and elasticity are affected to some degree by small variations in the metalloid content and even greater degree by the amount of incorporated slag and the character of its distribution. The longitudinal mechanical properties are, however, decidedly superior to the transverse properties. This anisotropic behavior, amounting to 20% or more, is due to the characteristic fibrous structure of wrought iron, brought about by the elongation of the slag particles in the direction of rolling. The design of most structures is such, however, that the members are stressed in a direction parallel to the longitudinal axis (direction of rolling of material), and the somewhat lower transverse properties do not cause serious objection. The properties are only slightly changed by heat treatment. The yield point of wrought iron is unaffected by the slag component and is of the same magnitude in both the longitudinal and transverse directions. The ultimate strength of good wrought iron is not well defined. The yield point ranges from 2-4 ksi higher than the elastic limit. Up to certain limits, ductility increased by extra working, due to its effect in causing a finer distribution and more thread-like character of the incorporated slag. This is accomplished through the large reduction of section
169
obtained in rolling or forging large initial blooms into proportionately small final sections; or it may be obtained by rolling smaller initial masses to bar sections, which in turn are built into piles, heated to welding temperature and rolled to desire forms. In common practice this is done once for single-refined wrought iron and twice for double-refined wrought iron products.
The development of rolling procedures affected an equalization of the normal ultimate strength and ductility in the two directions. This important advance in technique has had a marked influence in making possible the use of wrought iron plates for applications where severe fabrication requirements must be met.
C.5.1 Tensile Properties
The tensile properties of wrought iron are largely those of ferrite plus the strengthening effect of any phosphorous content which adds approximately 1000 psi for each 0.01% above 0.10% of contained phosphorous. Strength, elasticity, and ductility are affected to some degree by small variations in the metalloid content and in even greater degree by the amount of the incorporated slag and the character of its distribution. Nickel, molybdenum, copper and phosphorous are added to wrought iron to increase yield and ultimate strengths without materially detracting from toughness as measured by elongation and reduction in area.
The tensile strength of a given wrought iron depends to a considerable extent upon the direction of stress with respect to the “grain” of the iron. The tensile strength of wrought iron, in the direction of rolling, ranges from about 45 to over 50 ksi. The size of cross-section of a tensile specimen affects the strength to some extent and this fact can be taken into consideration by decreasing the minimum limit of tensile strength of specimens above certain sizes when full-size sections of bars are employed for testing. The yield point of wrought iron is strongly indicated in testing by the “drop of the beam” or “halt of the gage” of the testing machine, and occurs at from 50 percent to somewhat over 60 percent of the tensile strength. The ductility of wrought iron undergoing tension is less than that of very low carbon steel, owing to the presence of the slag. The elongation in the direction of rolling will vary from about 20 percent to about 30 percent. The typical physical properties of wrought iron in the longitudinal and transverse direction are given in the Table C.5.
Table C.5: Longitudinal and transverse tensile properties of wrought iron
Property Longitudinal Transverse Tensile strength, ksi 48-50 36-38
Yield point, ksi 27-30 27-30 Elongation in 8 in., % 18-25 2-5 Reduction of area, % 35-45 3-6
The tensile strength and ductility of wrought iron at right angles to the direction of rolling are considerably less than the longitudinal strength and ductility. This is to be expected, since the continuity of the metal in a direction transverse to the direction of rolling is interrupted by numerous strands of slag, which are comparatively weak. The tensile strength of wrought iron in a transverse direction has usually been found to be between 0.6 to 0.9 of the strength in the
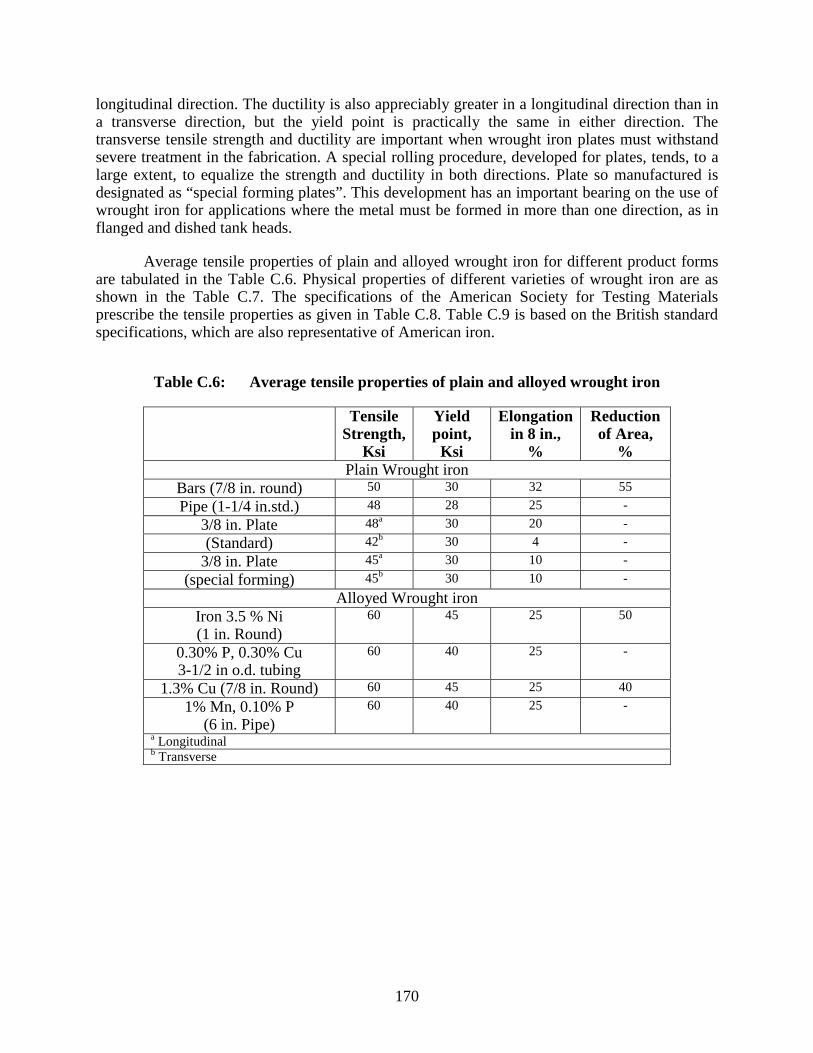
170
longitudinal direction. The ductility is also appreciably greater in a longitudinal direction than in a transverse direction, but the yield point is practically the same in either direction. The transverse tensile strength and ductility are important when wrought iron plates must withstand severe treatment in the fabrication. A special rolling procedure, developed for plates, tends, to a large extent, to equalize the strength and ductility in both directions. Plate so manufactured is designated as “special forming plates”. This development has an important bearing on the use of wrought iron for applications where the metal must be formed in more than one direction, as in flanged and dished tank heads.
Average tensile properties of plain and alloyed wrought iron for different product forms are tabulated in the Table C.6. Physical properties of different varieties of wrought iron are as shown in the Table C.7. The specifications of the American Society for Testing Materials prescribe the tensile properties as given in Table C.8. Table C.9 is based on the British standard specifications, which are also representative of American iron.
Table C.6: Average tensile properties of plain and alloyed wrought iron
Tensile Strength,
Ksi
Yield point,
Ksi
Elongationin 8 in.,
%
Reduction of Area,
%Plain Wrought iron
Bars (7/8 in. round) 50 30 32 55 Pipe (1-1/4 in.std.) 48 28 25 -
3/8 in. Plate 48a 30 20 - (Standard) 42b 30 4 -
3/8 in. Plate 45a 30 10 - (special forming) 45b 30 10 -
Alloyed Wrought iron Iron 3.5 % Ni (1 in. Round)
60 45 25 50
0.30% P, 0.30% Cu 3-1/2 in o.d. tubing
60 40 25 -
1.3% Cu (7/8 in. Round) 60 45 25 40 1% Mn, 0.10% P
(6 in. Pipe) 60 40 25 -
a Longitudinal b Transverse
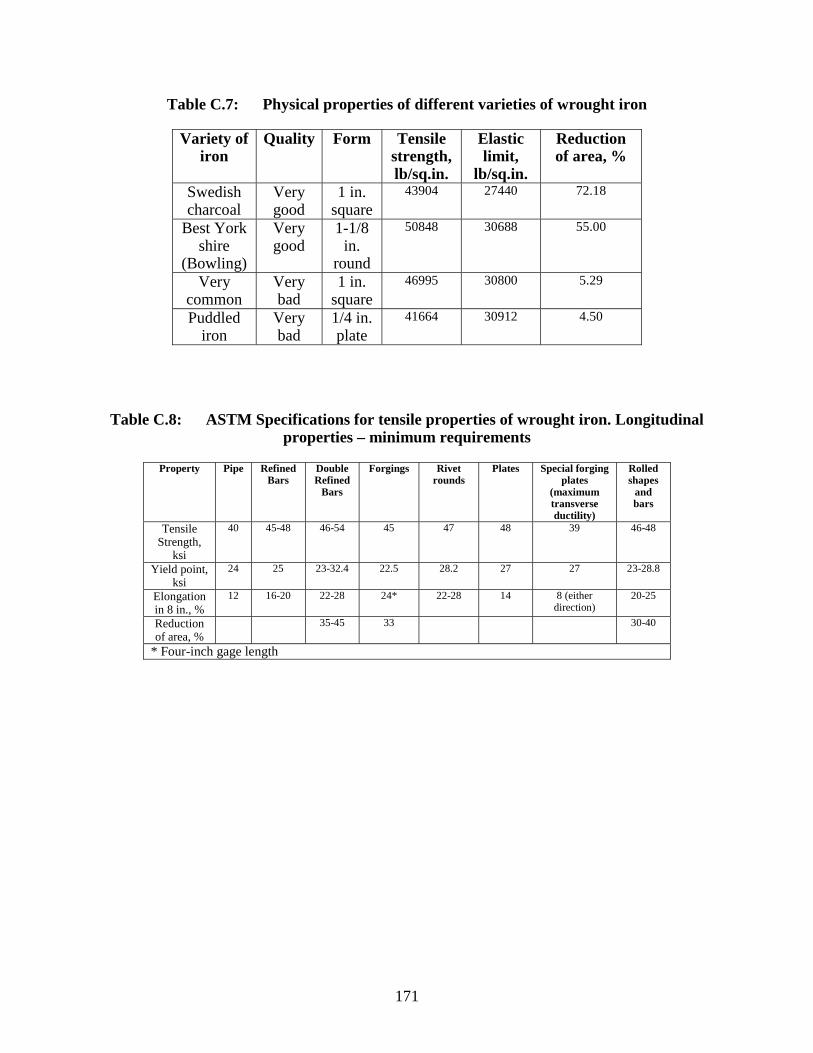
171
Table C.7: Physical properties of different varieties of wrought iron
Variety of iron
Quality Form Tensile strength, lb/sq.in.
Elastic limit,
lb/sq.in.
Reduction of area, %
Swedish charcoal
Very good
1 in. square
43904 27440 72.18
Best York shire
(Bowling)
Very good
1-1/8in.
round
50848 30688 55.00
Very common
Very bad
1 in. square
46995 30800 5.29
Puddlediron
Very bad
1/4 in. plate
41664 30912 4.50
Table C.8: ASTM Specifications for tensile properties of wrought iron. Longitudinal properties – minimum requirements
Property Pipe Refined Bars
Double Refined
Bars
Forgings Rivet rounds
Plates Special forging plates
(maximum transverse ductility)
Rolled shapes
and bars
Tensile Strength,
ksi
40 45-48 46-54 45 47 48 39 46-48
Yield point, ksi
24 25 23-32.4 22.5 28.2 27 27 23-28.8
Elongation in 8 in., %
12 16-20 22-28 24* 22-28 14 8 (either direction)
20-25
Reduction of area, %
35-45 33 30-40
* Four-inch gage length
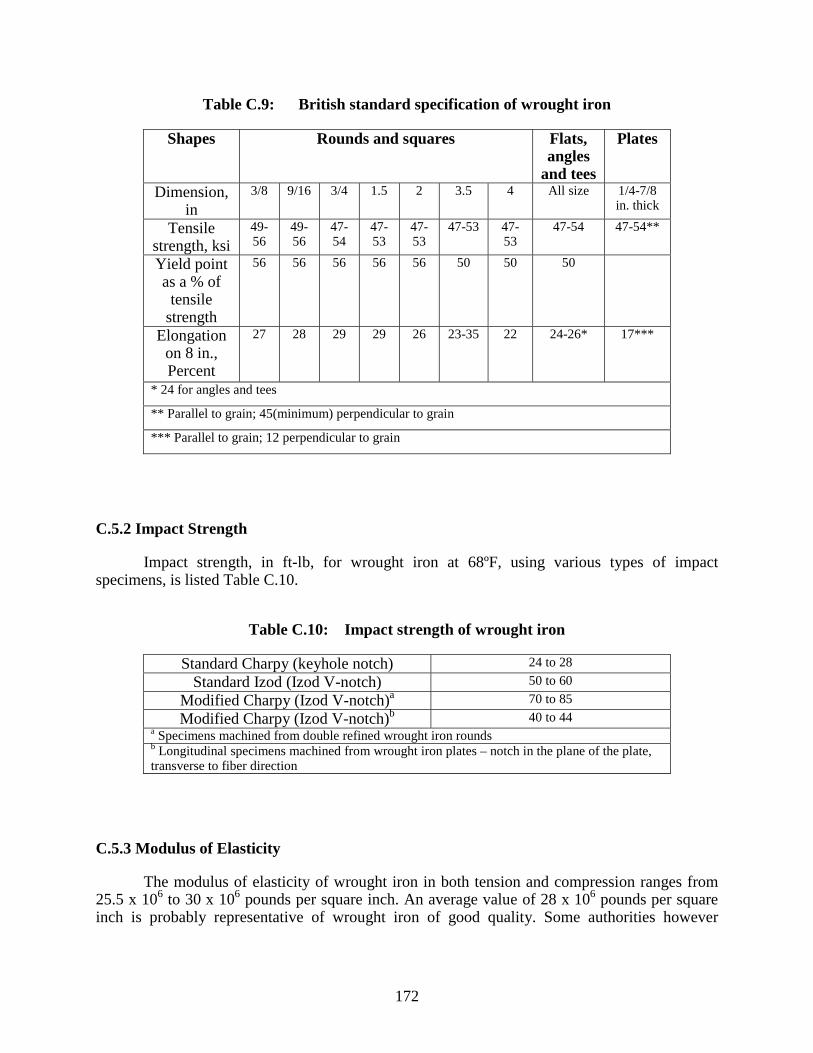
172
Table C.9: British standard specification of wrought iron
Shapes Rounds and squares Flats, angles
and tees
Plates
Dimension,in
3/8 9/16 3/4 1.5 2 3.5 4 All size 1/4-7/8 in. thick
Tensile strength, ksi
49-56
49-56
47-54
47-53
47-53
47-53 47-53
47-54 47-54**
Yield point as a % of
tensile strength
56 56 56 56 56 50 50 50
Elongation on 8 in.,Percent
27 28 29 29 26 23-35 22 24-26* 17***
* 24 for angles and tees
** Parallel to grain; 45(minimum) perpendicular to grain
*** Parallel to grain; 12 perpendicular to grain
C.5.2 Impact Strength
Impact strength, in ft-lb, for wrought iron at 68ºF, using various types of impact specimens, is listed Table C.10.
Table C.10: Impact strength of wrought iron
Standard Charpy (keyhole notch) 24 to 28 Standard Izod (Izod V-notch) 50 to 60
Modified Charpy (Izod V-notch)a 70 to 85 Modified Charpy (Izod V-notch)b 40 to 44
a Specimens machined from double refined wrought iron rounds b Longitudinal specimens machined from wrought iron plates – notch in the plane of the plate, transverse to fiber direction
C.5.3 Modulus of Elasticity
The modulus of elasticity of wrought iron in both tension and compression ranges from 25.5 x 10⁶ to 30 x 106 pounds per square inch. An average value of 28 x 106 pounds per square inch is probably representative of wrought iron of good quality. Some authorities however
173
recommend an average value of 29 x 106 pounds per square inch for design purposes. The modulus of elasticity in torsion shear is approximately 11 x 106 pounds per square inch.
C.5.4 Fatigue Resistance
Wrought iron shows good resistance to fatigue fracture, or progressive failure of the crystals. Its ability to resist fatigue fracture explains the reason for its extensive use, particularly in the railroad and marine industries. The slag fibers which confer on the metal a tough, fibrous structure somewhat analogous to that of stranded wire cables, are responsible for this desirable property. These strands serve to minimize the stress concentration and deflect the path of the slip planes that develop in a metal under the influence of conditions that would ordinarily result in fatigue failure. For this reason wrought iron has a much longer life than other commonly used metals when subjected to conditions where sudden shocks and vibrations are encountered.
C.5.5 Hardness
Hardness of wrought iron is, to a large extent, a reflection of the hardness of the base metal. The hardness will range from 97 to 105 by the Brinell method and from 55 to 60 on the “B” scale of the Rockwell hardness-testing machine.
C.5.6 Machinability
Wrought iron ranks high in machinability; the base metal is soft and short chips, resulting from the presence of the slag, produce clean, sharp threads on pipe or bars.
C.5.7 Specific Gravity
The specific gravity of wrought iron usually is taken to be 7.70. The unit weight corresponding to this specific gravity is 480 pounds per cubic foot.
C.5.8 Coefficient of Linear Expansion
The thermal coefficient of linear expansion of wrought iron has been determined to be 0.00000673 per degree Fahrenheit.
C.6 EFFECT OF HIGH AND LOW TEMPERATURES ON THE PHYSICAL PROPERTIES
Extreme cold increases the elastic limit of the wrought iron, but does not affect the tensile strength appreciably. It increases the ductility very slightly, and decreases the resistance to impact by 3%. The tensile strength increases with temperature from 0º F up to a maximum at from 400 to 600º F, the increase being from 8 to 10 ksi, and then decreases steadily until the strength of only 6 ksi is shown at 1500º F. The comparative strength, taking strength at 68º F as 100, are shown in Table C.11.
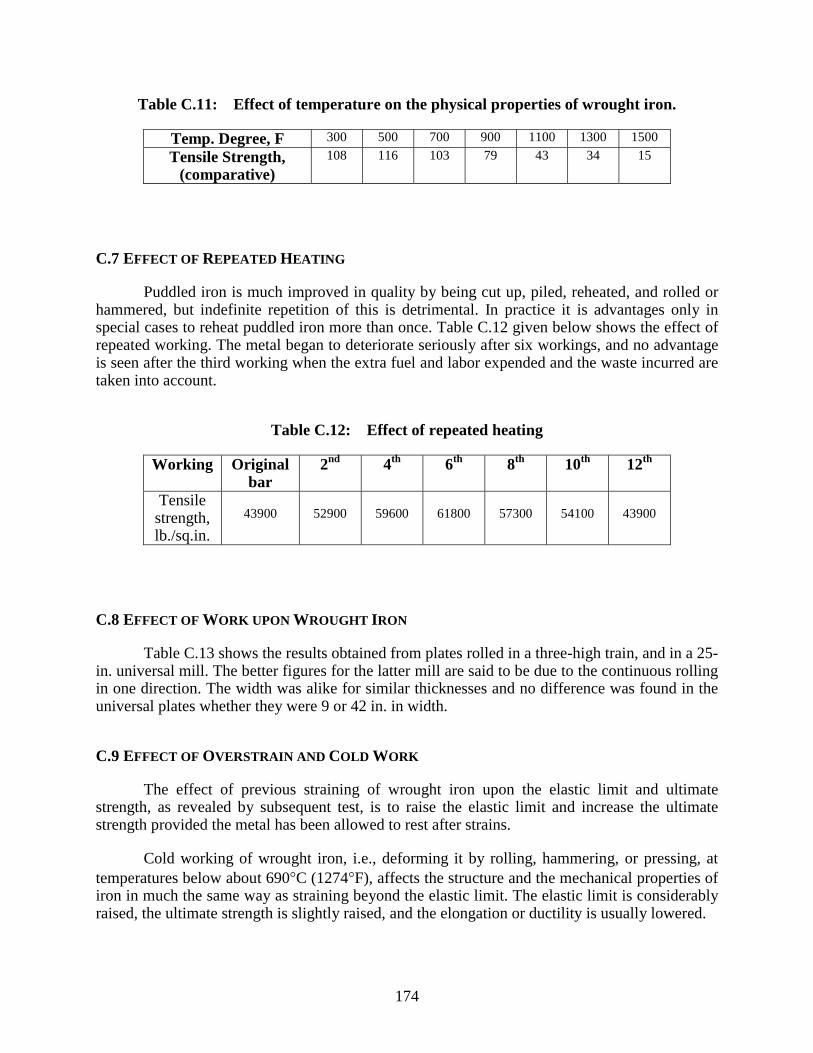
174
Table C.11: Effect of temperature on the physical properties of wrought iron.
Temp. Degree, F 300 500 700 900 1100 1300 1500 Tensile Strength,
(comparative) 108 116 103 79 43 34 15
C.7 EFFECT OF REPEATED HEATING
Puddled iron is much improved in quality by being cut up, piled, reheated, and rolled or hammered, but indefinite repetition of this is detrimental. In practice it is advantages only in special cases to reheat puddled iron more than once. Table C.12 given below shows the effect of repeated working. The metal began to deteriorate seriously after six workings, and no advantage is seen after the third working when the extra fuel and labor expended and the waste incurred are taken into account.
Table C.12: Effect of repeated heating
Working Original bar
2nd 4th 6th 8th 10th 12th
Tensile strength, lb./sq.in.
43900 52900 59600 61800 57300 54100 43900
C.8 EFFECT OF WORK UPON WROUGHT IRON
Table C.13 shows the results obtained from plates rolled in a three-high train, and in a 25-in. universal mill. The better figures for the latter mill are said to be due to the continuous rolling in one direction. The width was alike for similar thicknesses and no difference was found in the universal plates whether they were 9 or 42 in. in width.
C.9 EFFECT OF OVERSTRAIN AND COLD WORK
The effect of previous straining of wrought iron upon the elastic limit and ultimate strength, as revealed by subsequent test, is to raise the elastic limit and increase the ultimate strength provided the metal has been allowed to rest after strains.
Cold working of wrought iron, i.e., deforming it by rolling, hammering, or pressing, at temperatures below about 690°C (1274°F), affects the structure and the mechanical properties of iron in much the same way as straining beyond the elastic limit. The elastic limit is considerably raised, the ultimate strength is slightly raised, and the elongation or ductility is usually lowered.
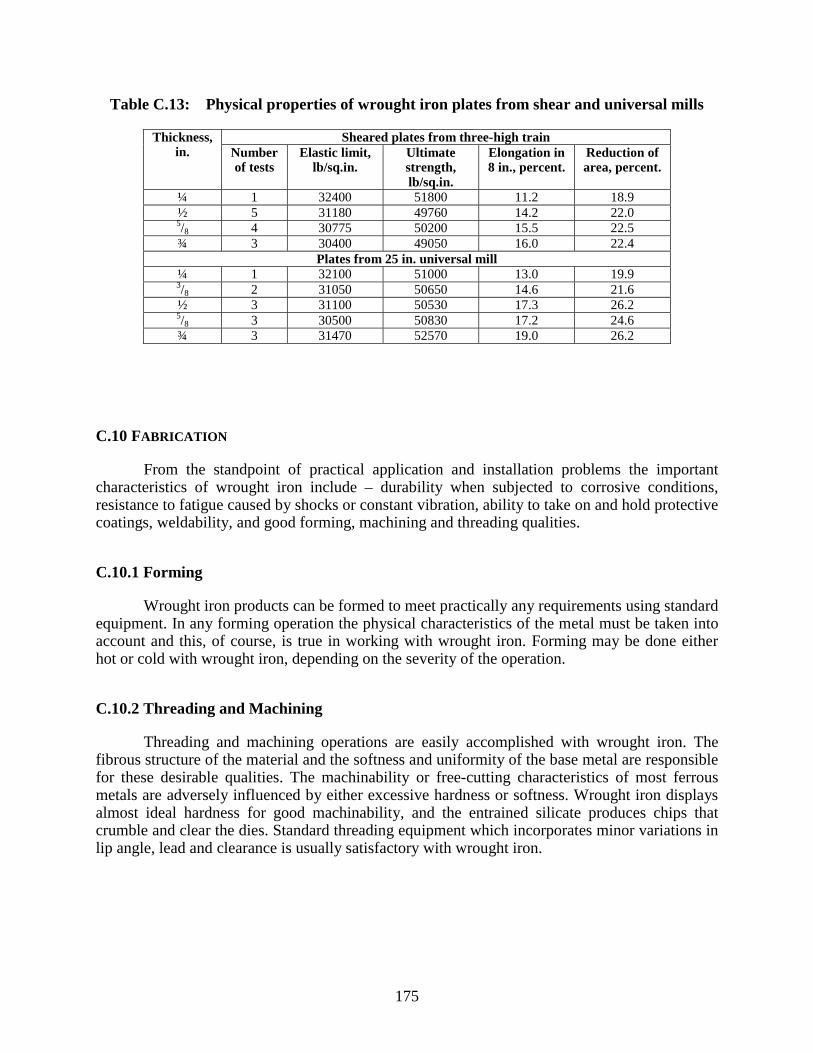
175
Table C.13: Physical properties of wrought iron plates from shear and universal mills
Sheared plates from three-high train Thickness, in. Number
of tests Elastic limit,
lb/sq.in. Ultimate strength, lb/sq.in.
Elongation in 8 in., percent.
Reduction of area, percent.
¼ 1 32400 51800 11.2 18.9 ½ 5 31180 49760 14.2 22.0 5/8 4 30775 50200 15.5 22.5 ¾ 3 30400 49050 16.0 22.4
Plates from 25 in. universal mill ¼ 1 32100 51000 13.0 19.9 3/8 2 31050 50650 14.6 21.6 ½ 3 31100 50530 17.3 26.2 5/8 3 30500 50830 17.2 24.6 ¾ 3 31470 52570 19.0 26.2
C.10 FABRICATION
From the standpoint of practical application and installation problems the important characteristics of wrought iron include – durability when subjected to corrosive conditions, resistance to fatigue caused by shocks or constant vibration, ability to take on and hold protective coatings, weldability, and good forming, machining and threading qualities.
C.10.1 Forming
Wrought iron products can be formed to meet practically any requirements using standard equipment. In any forming operation the physical characteristics of the metal must be taken into account and this, of course, is true in working with wrought iron. Forming may be done either hot or cold with wrought iron, depending on the severity of the operation.
C.10.2 Threading and Machining
Threading and machining operations are easily accomplished with wrought iron. The fibrous structure of the material and the softness and uniformity of the base metal are responsible for these desirable qualities. The machinability or free-cutting characteristics of most ferrous metals are adversely influenced by either excessive hardness or softness. Wrought iron displays almost ideal hardness for good machinability, and the entrained silicate produces chips that crumble and clear the dies. Standard threading equipment which incorporates minor variations in lip angle, lead and clearance is usually satisfactory with wrought iron.
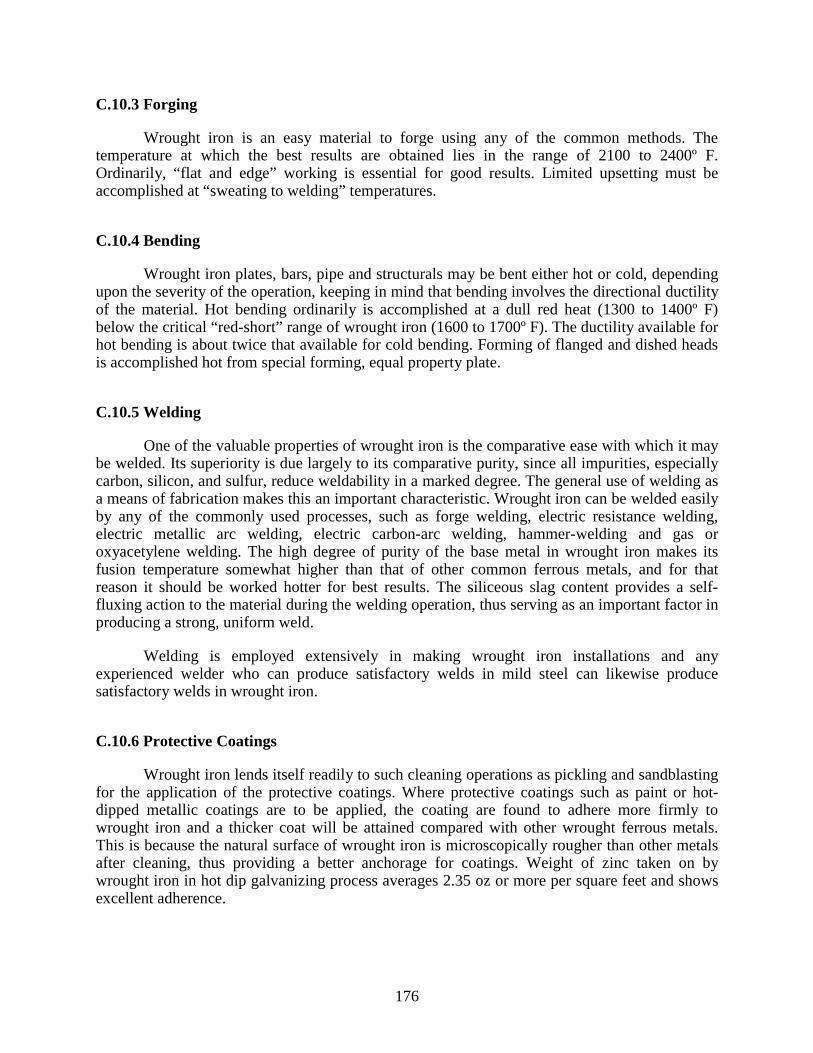
176
C.10.3 Forging
Wrought iron is an easy material to forge using any of the common methods. The temperature at which the best results are obtained lies in the range of 2100 to 2400º F. Ordinarily, “flat and edge” working is essential for good results. Limited upsetting must be accomplished at “sweating to welding” temperatures.
C.10.4 Bending
Wrought iron plates, bars, pipe and structurals may be bent either hot or cold, depending upon the severity of the operation, keeping in mind that bending involves the directional ductility of the material. Hot bending ordinarily is accomplished at a dull red heat (1300 to 1400º F) below the critical “red-short” range of wrought iron (1600 to 1700º F). The ductility available for hot bending is about twice that available for cold bending. Forming of flanged and dished heads is accomplished hot from special forming, equal property plate.
C.10.5 Welding
One of the valuable properties of wrought iron is the comparative ease with which it may be welded. Its superiority is due largely to its comparative purity, since all impurities, especially carbon, silicon, and sulfur, reduce weldability in a marked degree. The general use of welding as a means of fabrication makes this an important characteristic. Wrought iron can be welded easily by any of the commonly used processes, such as forge welding, electric resistance welding, electric metallic arc welding, electric carbon-arc welding, hammer-welding and gas or oxyacetylene welding. The high degree of purity of the base metal in wrought iron makes its fusion temperature somewhat higher than that of other common ferrous metals, and for that reason it should be worked hotter for best results. The siliceous slag content provides a self-fluxing action to the material during the welding operation, thus serving as an important factor in producing a strong, uniform weld.
Welding is employed extensively in making wrought iron installations and any experienced welder who can produce satisfactory welds in mild steel can likewise produce satisfactory welds in wrought iron.
C.10.6 Protective Coatings
Wrought iron lends itself readily to such cleaning operations as pickling and sandblasting for the application of the protective coatings. Where protective coatings such as paint or hot-dipped metallic coatings are to be applied, the coating are found to adhere more firmly to wrought iron and a thicker coat will be attained compared with other wrought ferrous metals. This is because the natural surface of wrought iron is microscopically rougher than other metals after cleaning, thus providing a better anchorage for coatings. Weight of zinc taken on by wrought iron in hot dip galvanizing process averages 2.35 oz or more per square feet and shows excellent adherence.
177
C.10.7 Corrosion Resistance
The resistance of wrought iron to corrosion has been demonstrated by long years of service life in many applications. Some have attributed successful performance to the purity of the iron base, the presence of considerable quantity of phosphorous or copper, freedom from segregation, to the presence of the inert slag fibers disseminated throughout the metal, or to combinations of such attributes.
One point definitely established, namely, that the slag fibers in wrought iron are present in such a great numbers that they serve in one capacity as an effective mechanical barrier against corrosion and, under most conditions, force it to spread over the surface of the metal rather than pit or penetrate. There is also a reason to believe that they have a definite influence upon the chemical composition, density, and adherence to the metal surface of any corrosion products that might be formed. As a result, the film or layer of corrosion products on the surface, although of microscopic thickness in many cases, affords a high degree of protection to the underlying metal. This, of course, is highly desirable because it tends to make the corrosion uniform rather than to permit it to localize, thereby causing premature failure.
The record for durability that wrought iron has established over a long period of years, subjected to a wide variety of actual operating conditions, provides a sound engineering basis for its use in the many services. Lacking imperishability in a metal, it is obviously safe and economical to employ one that has definitely proved its durability.
Laboratory corrosion testing has shown that wrought iron has very definite directional corrosion properties; that is, transverse and longitudinal sections or faces show significantly higher corrosion rates than rolled surfaces or faces.
In actual service the corrosion resistance of wrought iron has shown superior performance in such applications as radiant heating and snow-melting coils, skating-rink piping, condenser and heat exchanger equipment, and other industrial and building piping services. Wrought iron has long been specified for steam condensate piping where dissolved oxygen and carbon dioxide present severe corrosion problem. Cooling water cycles of the once-through and open-recirculating variety are solved by the use of wrought iron pipe.
C.11 USE OF WROUGHT IRON
The general uses of wrought iron are numerous. Wrought iron is well suited to certain applications because of such properties and characteristics as softness, fibrous structure, ease of welding, and resistance to vibratory and fatigue stresses. It is important to keep in mind that wrought iron may be produced to obtain high fatigue strength or high corrosion resistance, or, sometime, a good combination of both of these properties. High fatigue strength requires much more rolling than high corrosion resistance and extensive rolling decreases corrosion resistance. In the manufacture of wrought iron, for stay bolt, engine bolt, sucker rods, and coupling rods, a high endurance ratio is the most important physical property.
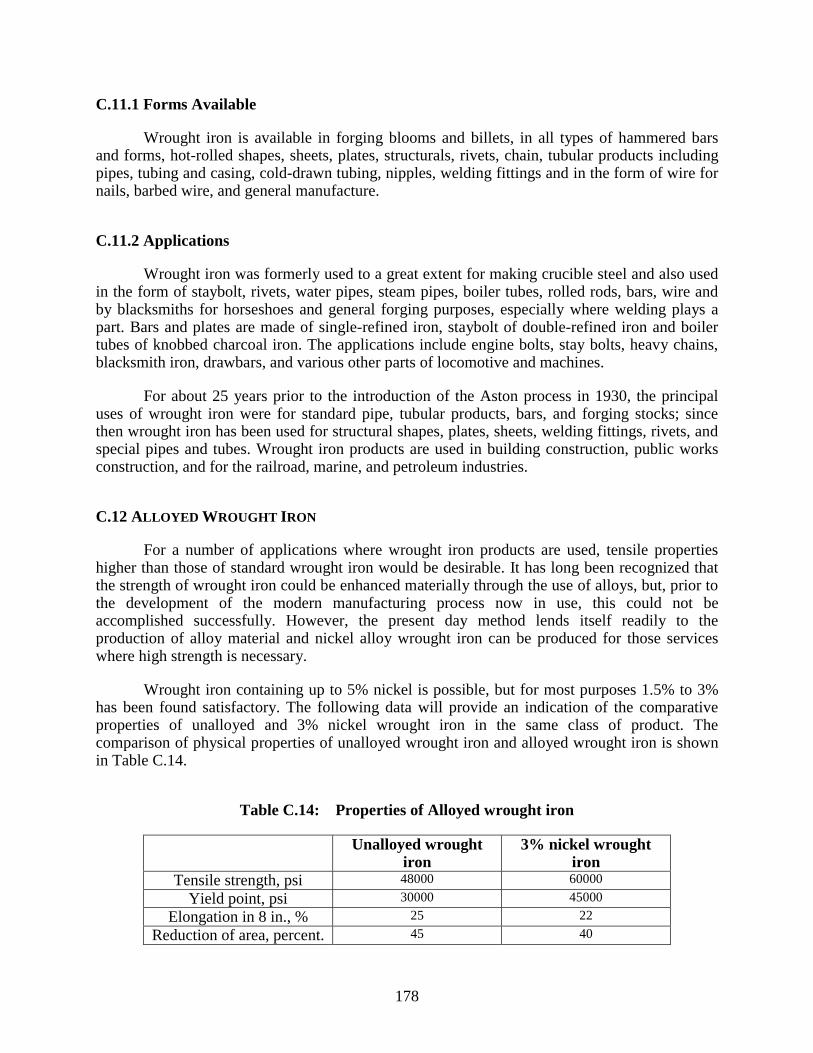
178
C.11.1 Forms Available
Wrought iron is available in forging blooms and billets, in all types of hammered bars and forms, hot-rolled shapes, sheets, plates, structurals, rivets, chain, tubular products including pipes, tubing and casing, cold-drawn tubing, nipples, welding fittings and in the form of wire for nails, barbed wire, and general manufacture.
C.11.2 Applications
Wrought iron was formerly used to a great extent for making crucible steel and also used in the form of staybolt, rivets, water pipes, steam pipes, boiler tubes, rolled rods, bars, wire and by blacksmiths for horseshoes and general forging purposes, especially where welding plays a part. Bars and plates are made of single-refined iron, staybolt of double-refined iron and boiler tubes of knobbed charcoal iron. The applications include engine bolts, stay bolts, heavy chains, blacksmith iron, drawbars, and various other parts of locomotive and machines.
For about 25 years prior to the introduction of the Aston process in 1930, the principal uses of wrought iron were for standard pipe, tubular products, bars, and forging stocks; since then wrought iron has been used for structural shapes, plates, sheets, welding fittings, rivets, and special pipes and tubes. Wrought iron products are used in building construction, public works construction, and for the railroad, marine, and petroleum industries.
C.12 ALLOYED WROUGHT IRON
For a number of applications where wrought iron products are used, tensile properties higher than those of standard wrought iron would be desirable. It has long been recognized that the strength of wrought iron could be enhanced materially through the use of alloys, but, prior to the development of the modern manufacturing process now in use, this could not be accomplished successfully. However, the present day method lends itself readily to the production of alloy material and nickel alloy wrought iron can be produced for those services where high strength is necessary.
Wrought iron containing up to 5% nickel is possible, but for most purposes 1.5% to 3% has been found satisfactory. The following data will provide an indication of the comparative properties of unalloyed and 3% nickel wrought iron in the same class of product. The comparison of physical properties of unalloyed wrought iron and alloyed wrought iron is shown in Table C.14.
Table C.14: Properties of Alloyed wrought iron
Unalloyed wrought iron
3% nickel wrought iron
Tensile strength, psi 48000 60000 Yield point, psi 30000 45000
Elongation in 8 in., % 25 22 Reduction of area, percent. 45 40
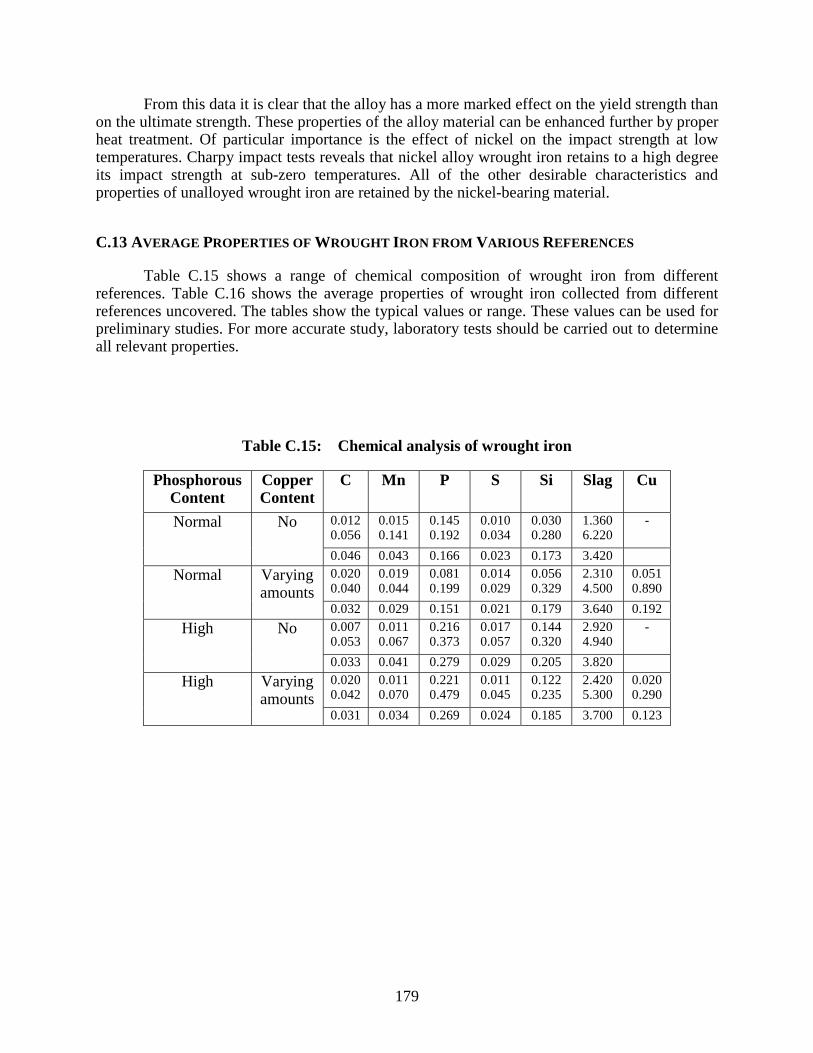
179
From this data it is clear that the alloy has a more marked effect on the yield strength than on the ultimate strength. These properties of the alloy material can be enhanced further by proper heat treatment. Of particular importance is the effect of nickel on the impact strength at low temperatures. Charpy impact tests reveals that nickel alloy wrought iron retains to a high degree its impact strength at sub-zero temperatures. All of the other desirable characteristics and properties of unalloyed wrought iron are retained by the nickel-bearing material.
C.13 AVERAGE PROPERTIES OF WROUGHT IRON FROM VARIOUS REFERENCES
Table C.15 shows a range of chemical composition of wrought iron from different references. Table C.16 shows the average properties of wrought iron collected from different references uncovered. The tables show the typical values or range. These values can be used for preliminary studies. For more accurate study, laboratory tests should be carried out to determine all relevant properties.
Table C.15: Chemical analysis of wrought iron
Phosphorous Content
Copper Content
C Mn P S Si Slag Cu
0.0120.056
0.0150.141
0.1450.192
0.0100.034
0.0300.280
1.3606.220
-Normal No
0.046 0.043 0.166 0.023 0.173 3.420 0.0200.040
0.0190.044
0.0810.199
0.0140.029
0.0560.329
2.3104.500
0.0510.890
Normal Varying amounts
0.032 0.029 0.151 0.021 0.179 3.640 0.192 0.0070.053
0.0110.067
0.2160.373
0.0170.057
0.1440.320
2.9204.940
-High No
0.033 0.041 0.279 0.029 0.205 3.820 0.0200.042
0.0110.070
0.2210.479
0.0110.045
0.1220.235
2.4205.300
0.0200.290
High Varying amounts
0.031 0.034 0.269 0.024 0.185 3.700 0.123
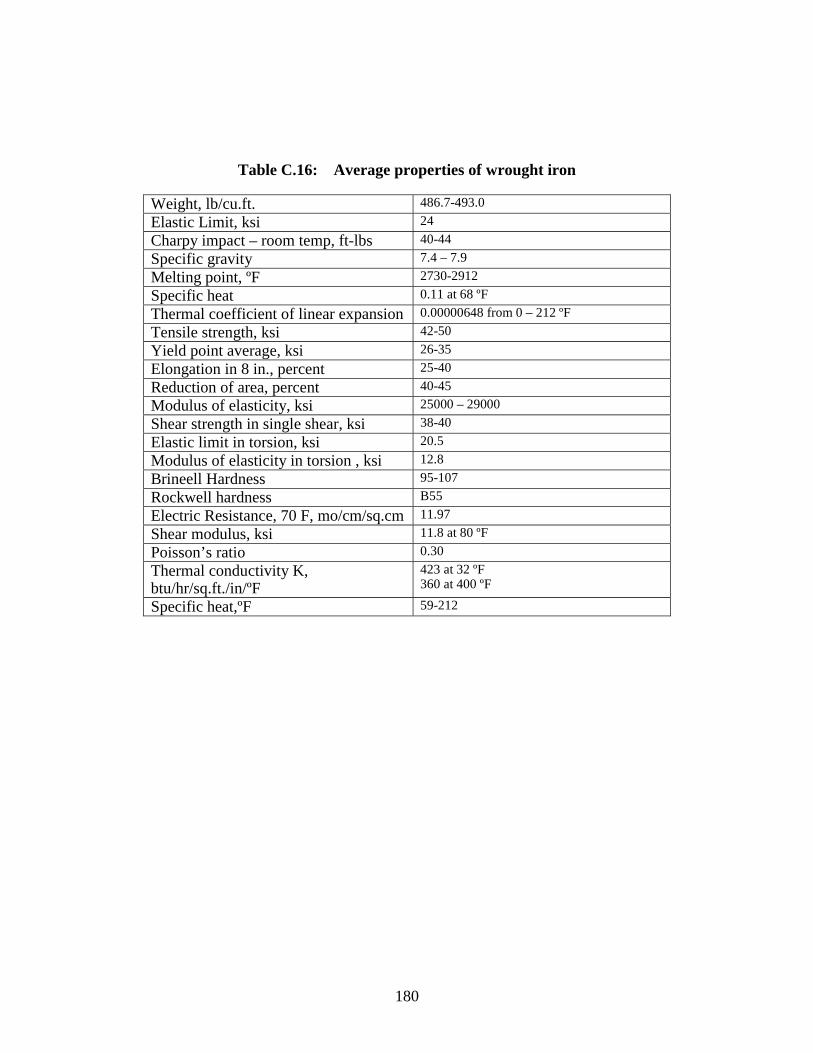
180
Table C.16: Average properties of wrought iron
Weight, lb/cu.ft. 486.7-493.0 Elastic Limit, ksi 24Charpy impact – room temp, ft-lbs 40-44 Specific gravity 7.4 – 7.9 Melting point, ºF 2730-2912 Specific heat 0.11 at 68 ºF Thermal coefficient of linear expansion 0.00000648 from 0 – 212 ºF Tensile strength, ksi 42-50 Yield point average, ksi 26-35 Elongation in 8 in., percent 25-40 Reduction of area, percent 40-45 Modulus of elasticity, ksi 25000 – 29000 Shear strength in single shear, ksi 38-40 Elastic limit in torsion, ksi 20.5Modulus of elasticity in torsion , ksi 12.8Brineell Hardness 95-107 Rockwell hardness B55Electric Resistance, 70 F, mo/cm/sq.cm 11.97Shear modulus, ksi 11.8 at 80 ºF Poisson’s ratio 0.30Thermal conductivity K, btu/hr/sq.ft./in/ºF
423 at 32 ºF 360 at 400 ºF
Specific heat,ºF 59-212
181
Appendix D: Field Load Test Data
As described in Chapter 5, two field load tests were conducted on the case study bridge. Data collected in these tests are presented in this appendix. For each strain gage, results are displayed in a plot of stress versus location of the front wheel of the test vehicle. Strain values were converted to stress values by multiplying by the modulus of elasticity, which was taken as 29,000 ksi. No results are presented for gage F2, as this gage malfunctioned during the first field load test. Figures D1 to D44 present data for Field Test No. 1. Figures D45 to D98 present data for Field Test No. 2.
For each of the two field load tests, ten test runs of the vehicle were conducted. Data points are plotted corresponding to the minimum value, maximum value, and average value of the stress at different vehicle locations for these ten tests. Average test data values are shown as a dotted line on each plot. For comparison, the theoretical stress values predicted by a simple two-dimensional truss analysis for the bridge loaded by the test vehicles also shown on the plots as a solid line.
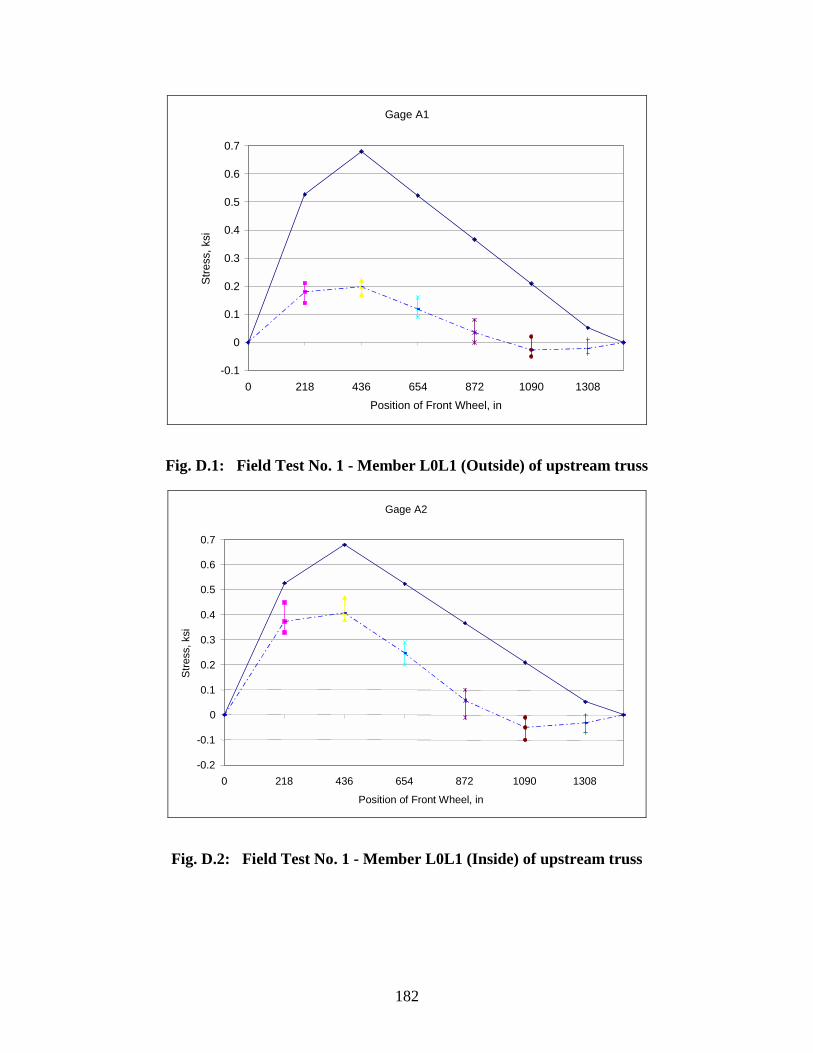
182
Gage A1
-0.1
0
0.1
0.2
0.3
0.4
0.5
0.6
0.7
0 218 436 654 872 1090 1308Position of Front Wheel, in
Stre
ss, k
si
Fig. D.1: Field Test No. 1 - Member L0L1 (Outside) of upstream truss
Gage A2
-0.2
-0.1
0
0.1
0.2
0.3
0.4
0.5
0.6
0.7
0 218 436 654 872 1090 1308
Position of Front Wheel, in
Stre
ss, k
si
Fig. D.2: Field Test No. 1 - Member L0L1 (Inside) of upstream truss
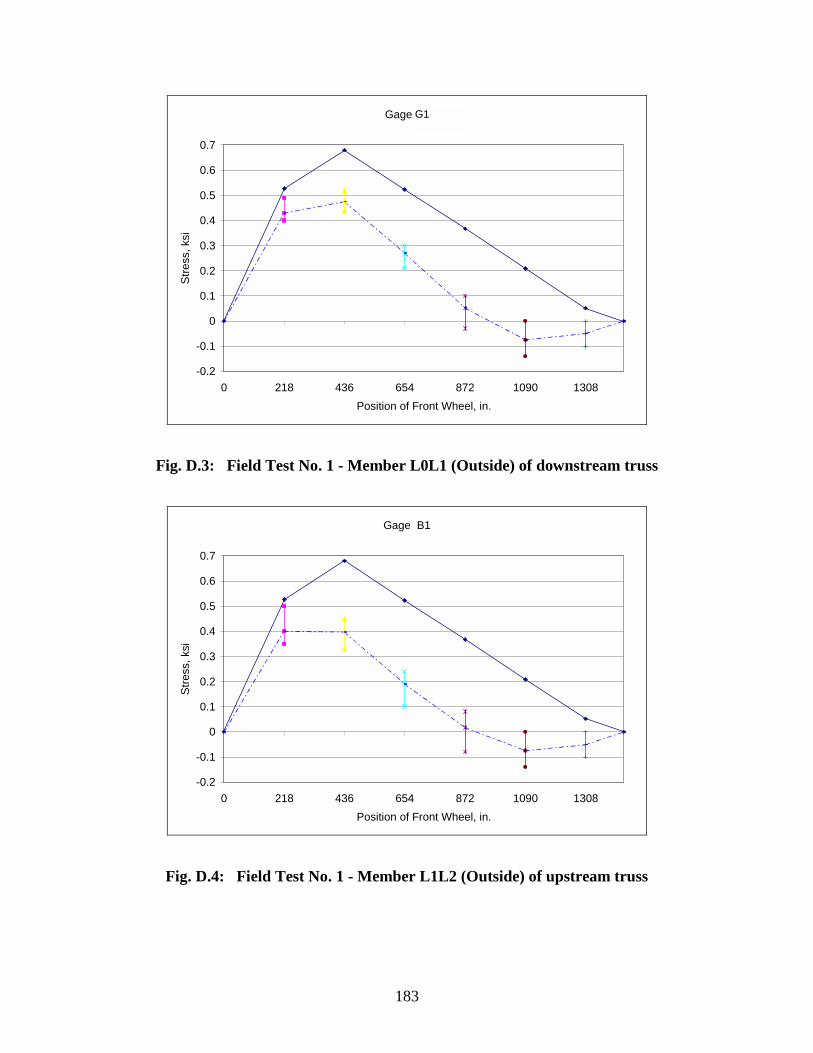
183
Gage K1
-0.2
-0.1
0
0.1
0.2
0.3
0.4
0.5
0.6
0.7
0 218 436 654 872 1090 1308Position of Front Wheel, in.
Stre
ss, k
si
Fig. D.3: Field Test No. 1 - Member L0L1 (Outside) of downstream truss
Gage B1
-0.2
-0.1
0
0.1
0.2
0.3
0.4
0.5
0.6
0.7
0 218 436 654 872 1090 1308Position of Front Wheel, in.
Stre
ss, k
si
Fig. D.4: Field Test No. 1 - Member L1L2 (Outside) of upstream truss
G1
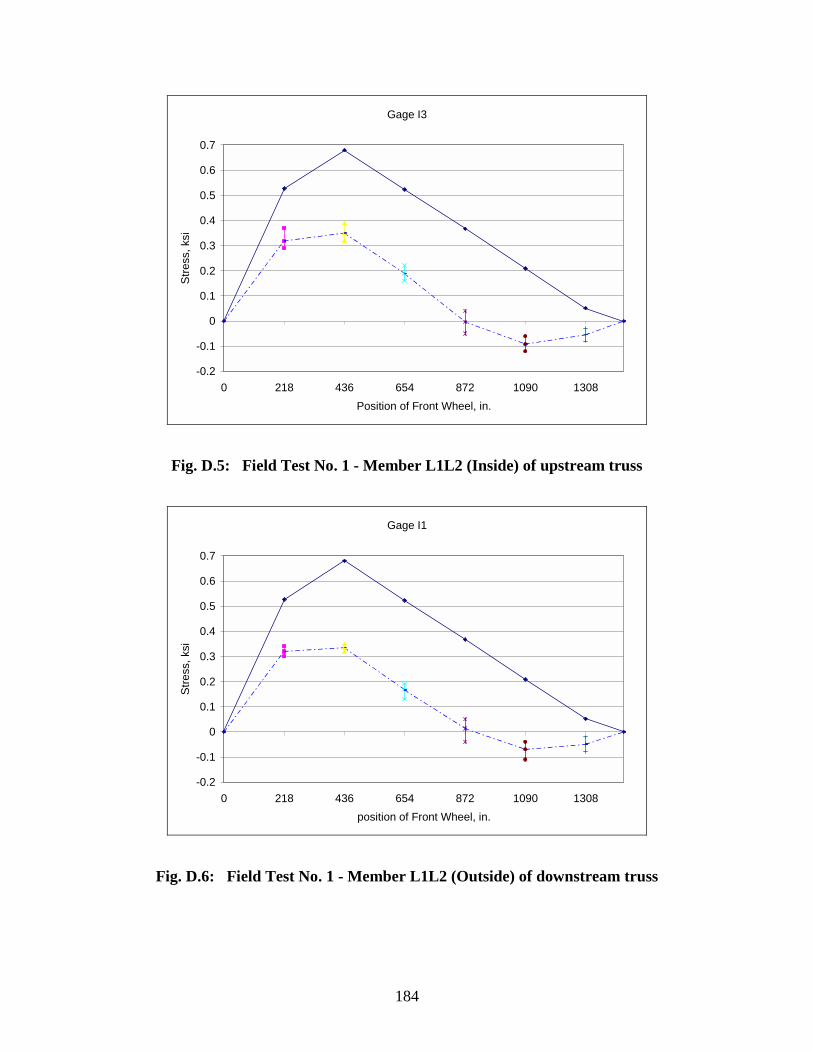
184
Gage I3
-0.2
-0.1
0
0.1
0.2
0.3
0.4
0.5
0.6
0.7
0 218 436 654 872 1090 1308Position of Front Wheel, in.
Stre
ss, k
si
Fig. D.5: Field Test No. 1 - Member L1L2 (Inside) of upstream truss
Gage I1
-0.2
-0.1
0
0.1
0.2
0.3
0.4
0.5
0.6
0.7
0 218 436 654 872 1090 1308position of Front Wheel, in.
Stre
ss, k
si
Fig. D.6: Field Test No. 1 - Member L1L2 (Outside) of downstream truss
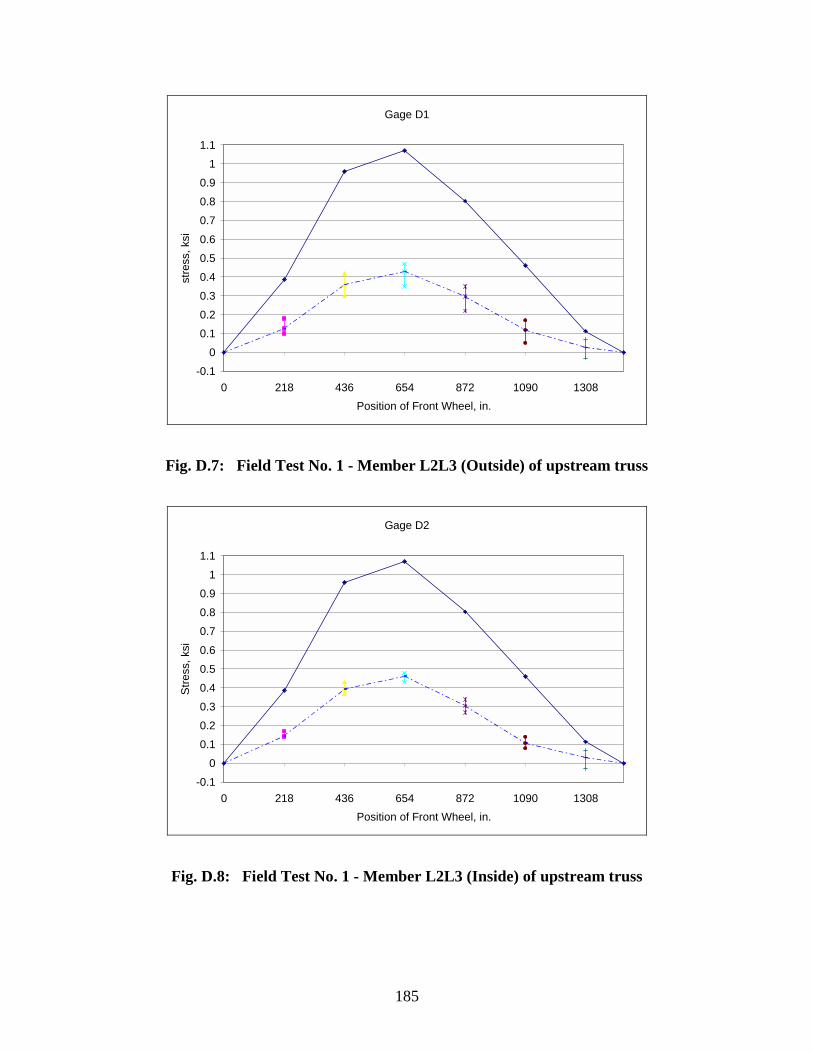
185
Gage D1
-0.10
0.10.20.30.40.50.60.70.80.9
11.1
0 218 436 654 872 1090 1308Position of Front Wheel, in.
stre
ss, k
si
Fig. D.7: Field Test No. 1 - Member L2L3 (Outside) of upstream truss
Gage D2
-0.10
0.10.20.30.40.50.60.70.80.9
11.1
0 218 436 654 872 1090 1308Position of Front Wheel, in.
Stre
ss, k
si
Fig. D.8: Field Test No. 1 - Member L2L3 (Inside) of upstream truss
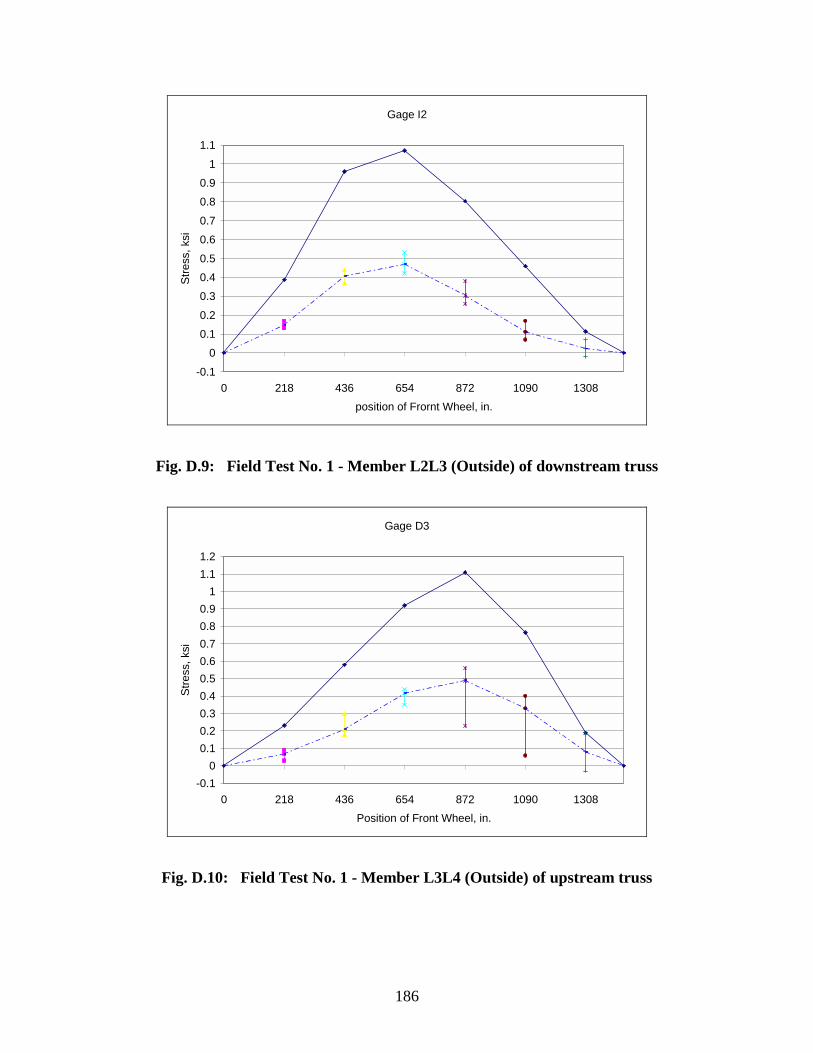
186
Gage I2
-0.10
0.10.20.30.40.50.60.70.80.9
11.1
0 218 436 654 872 1090 1308position of Frornt Wheel, in.
Stre
ss, k
si
Fig. D.9: Field Test No. 1 - Member L2L3 (Outside) of downstream truss
Gage D3
-0.10
0.10.20.30.40.50.60.70.80.9
11.11.2
0 218 436 654 872 1090 1308Position of Front Wheel, in.
Stre
ss, k
si
Fig. D.10: Field Test No. 1 - Member L3L4 (Outside) of upstream truss
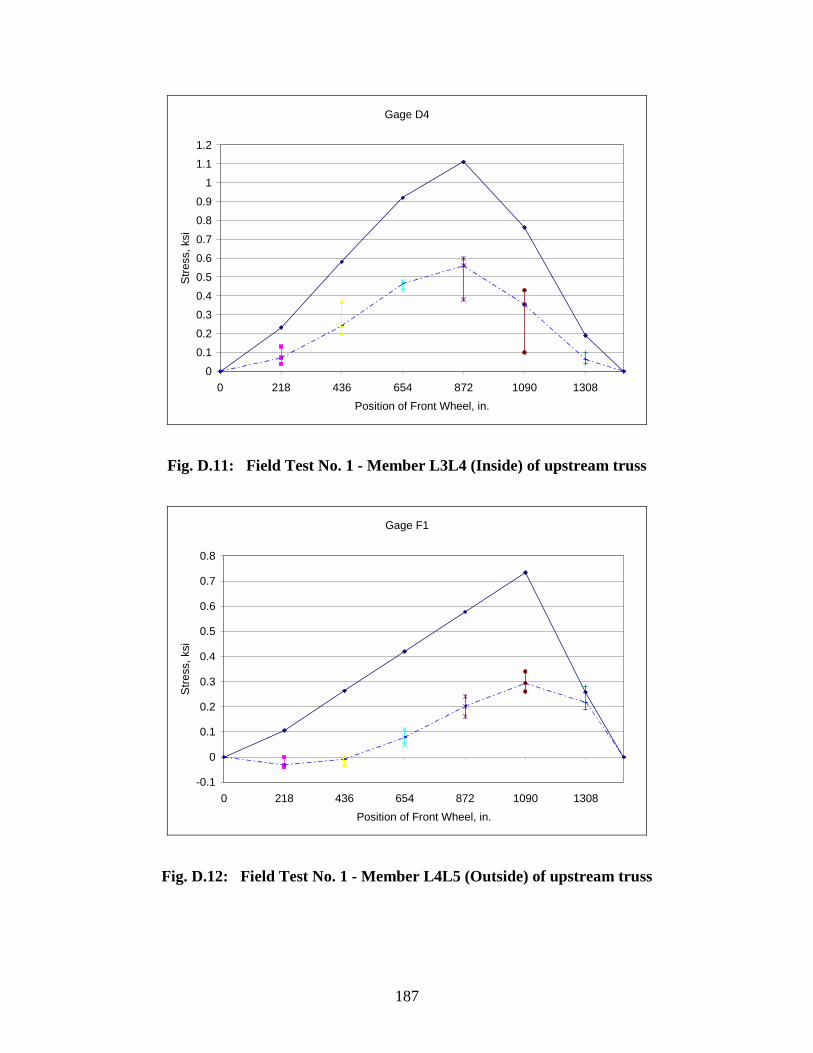
187
Gage D4
00.10.20.30.40.50.60.70.80.9
11.11.2
0 218 436 654 872 1090 1308Position of Front Wheel, in.
Stre
ss, k
si
Fig. D.11: Field Test No. 1 - Member L3L4 (Inside) of upstream truss
Gage F1
-0.1
0
0.1
0.2
0.3
0.4
0.5
0.6
0.7
0.8
0 218 436 654 872 1090 1308Position of Front Wheel, in.
Stre
ss, k
si
Fig. D.12: Field Test No. 1 - Member L4L5 (Outside) of upstream truss
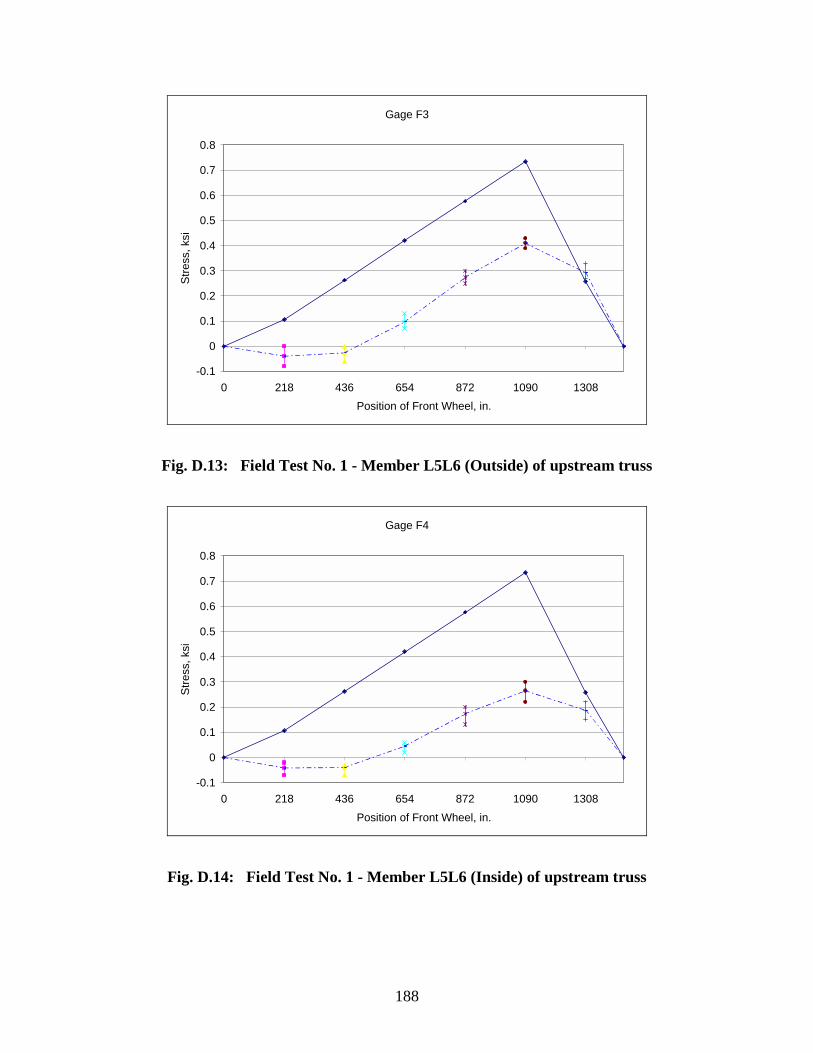
188
Gage F3
-0.1
0
0.1
0.2
0.3
0.4
0.5
0.6
0.7
0.8
0 218 436 654 872 1090 1308Position of Front Wheel, in.
Stre
ss, k
si
Fig. D.13: Field Test No. 1 - Member L5L6 (Outside) of upstream truss
Gage F4
-0.1
0
0.1
0.2
0.3
0.4
0.5
0.6
0.7
0.8
0 218 436 654 872 1090 1308Position of Front Wheel, in.
Stre
ss, k
si
Fig. D.14: Field Test No. 1 - Member L5L6 (Inside) of upstream truss
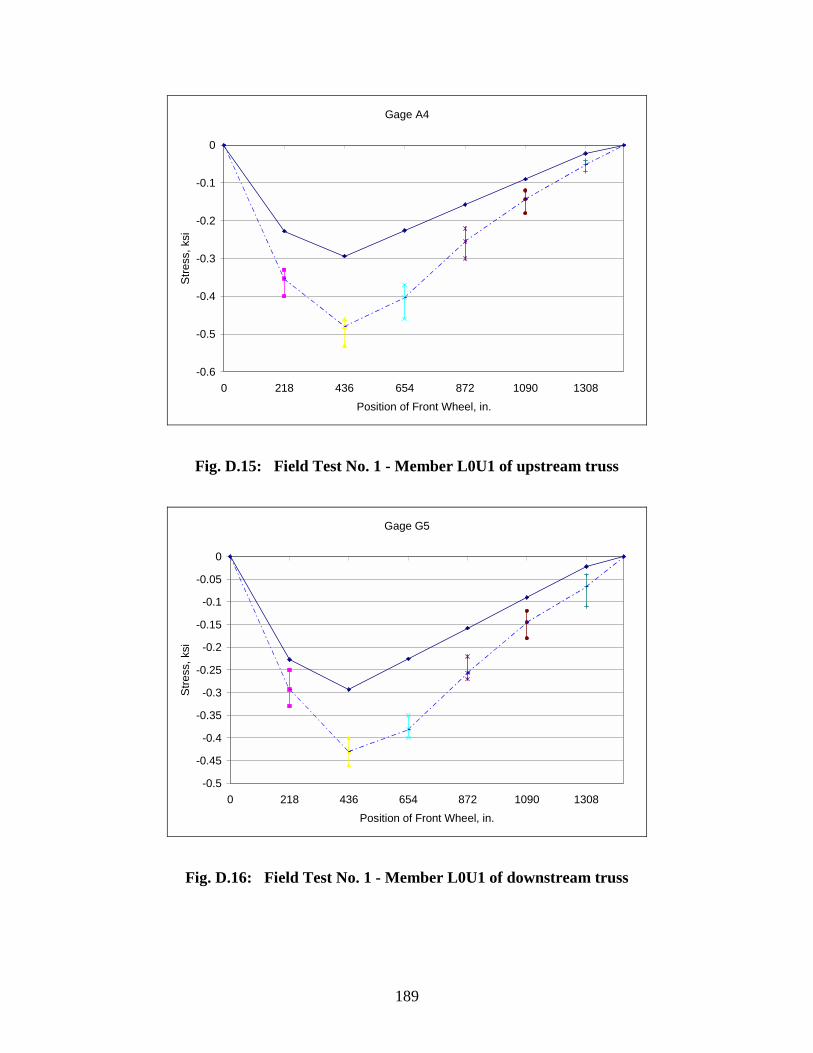
189
Gage A4
-0.6
-0.5
-0.4
-0.3
-0.2
-0.1
0
0 218 436 654 872 1090 1308Position of Front Wheel, in.
Stre
ss, k
si
Fig. D.15: Field Test No. 1 - Member L0U1 of upstream truss
Gage G5
-0.5
-0.45
-0.4
-0.35
-0.3
-0.25
-0.2
-0.15
-0.1
-0.05
0
0 218 436 654 872 1090 1308Position of Front Wheel, in.
Stre
ss, k
si
Fig. D.16: Field Test No. 1 - Member L0U1 of downstream truss
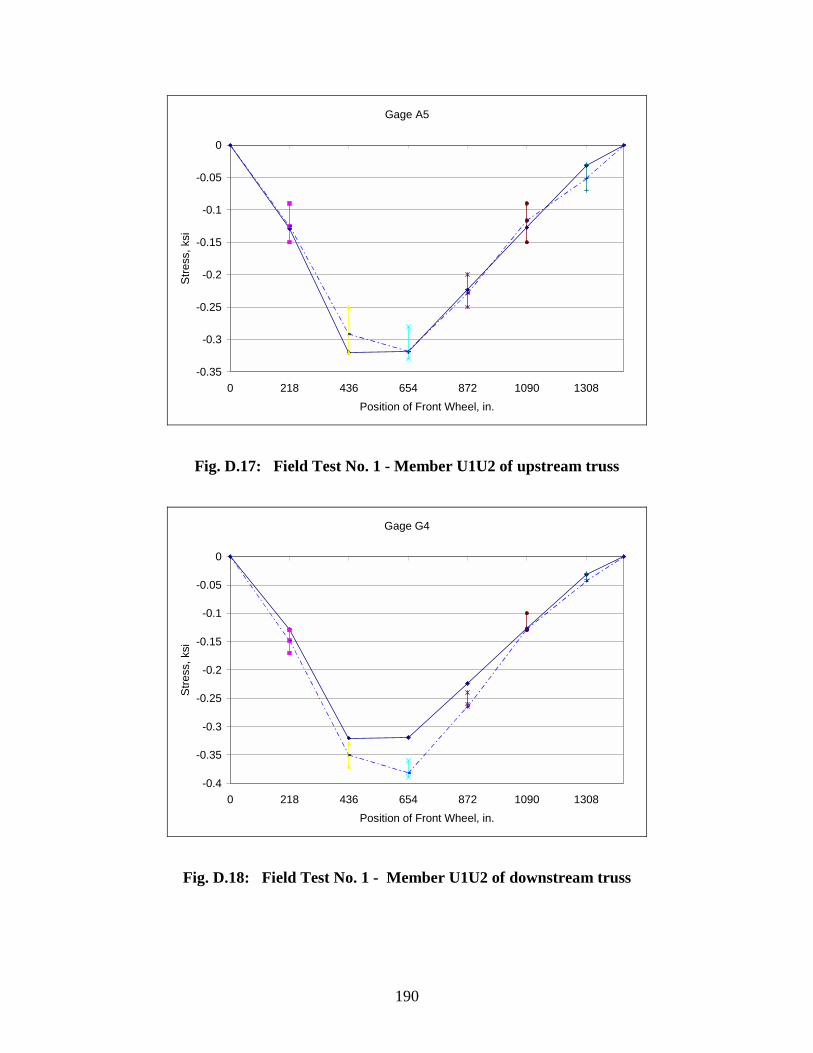
190
Gage A5
-0.35
-0.3
-0.25
-0.2
-0.15
-0.1
-0.05
0
0 218 436 654 872 1090 1308Position of Front Wheel, in.
Stre
ss, k
si
Fig. D.17: Field Test No. 1 - Member U1U2 of upstream truss
Gage G4
-0.4
-0.35
-0.3
-0.25
-0.2
-0.15
-0.1
-0.05
0
0 218 436 654 872 1090 1308Position of Front Wheel, in.
Stre
ss, k
si
Fig. D.18: Field Test No. 1 - Member U1U2 of downstream truss
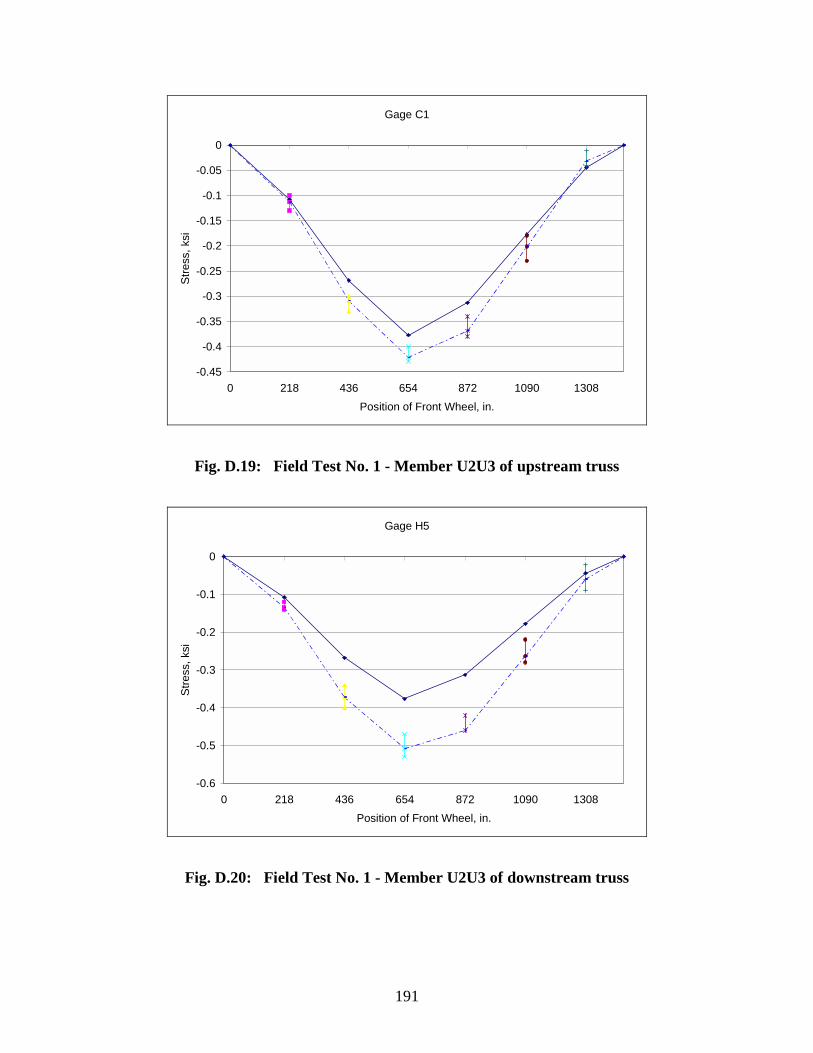
191
Gage C1
-0.45
-0.4
-0.35
-0.3
-0.25
-0.2
-0.15
-0.1
-0.05
0
0 218 436 654 872 1090 1308Position of Front Wheel, in.
Stre
ss, k
si
Fig. D.19: Field Test No. 1 - Member U2U3 of upstream truss
Gage H5
-0.6
-0.5
-0.4
-0.3
-0.2
-0.1
0
0 218 436 654 872 1090 1308Position of Front Wheel, in.
Stre
ss, k
si
Fig. D.20: Field Test No. 1 - Member U2U3 of downstream truss
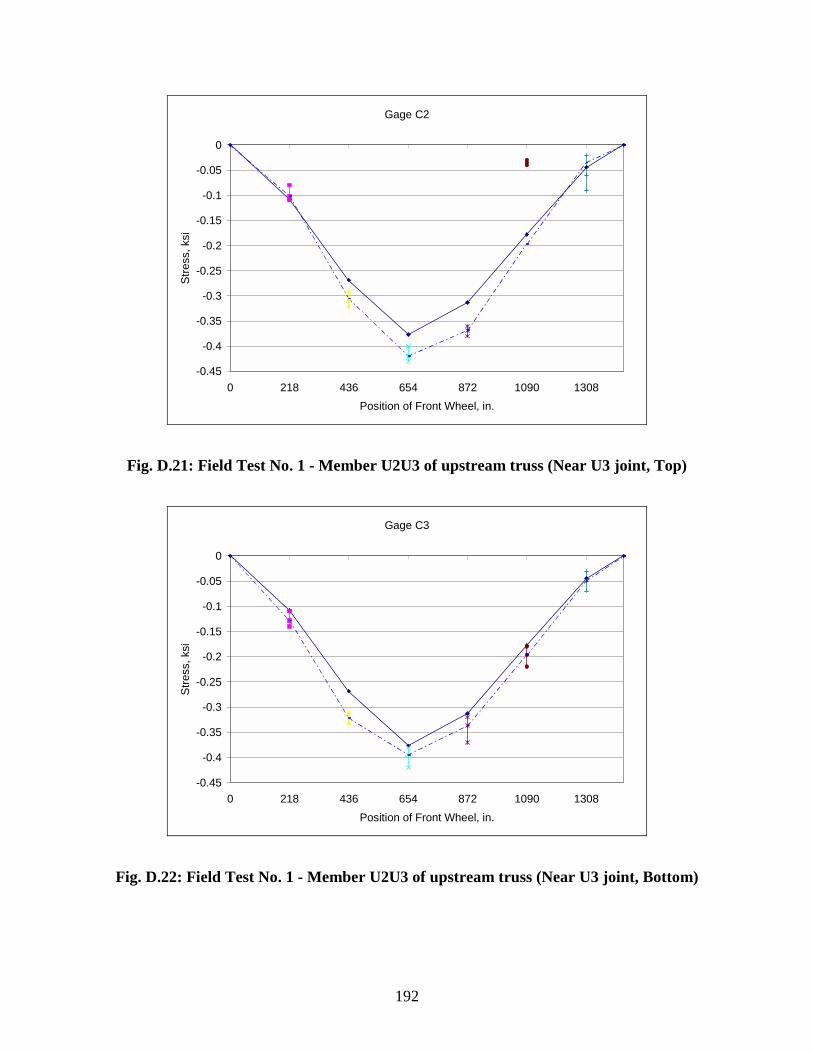
192
Gage C2
-0.45
-0.4
-0.35
-0.3
-0.25
-0.2
-0.15
-0.1
-0.05
0
0 218 436 654 872 1090 1308Position of Front Wheel, in.
Stre
ss, k
si
Fig. D.21: Field Test No. 1 - Member U2U3 of upstream truss (Near U3 joint, Top)
Gage C3
-0.45
-0.4
-0.35
-0.3
-0.25
-0.2
-0.15
-0.1
-0.05
0
0 218 436 654 872 1090 1308Position of Front Wheel, in.
Stre
ss, k
si
Fig. D.22: Field Test No. 1 - Member U2U3 of upstream truss (Near U3 joint, Bottom)
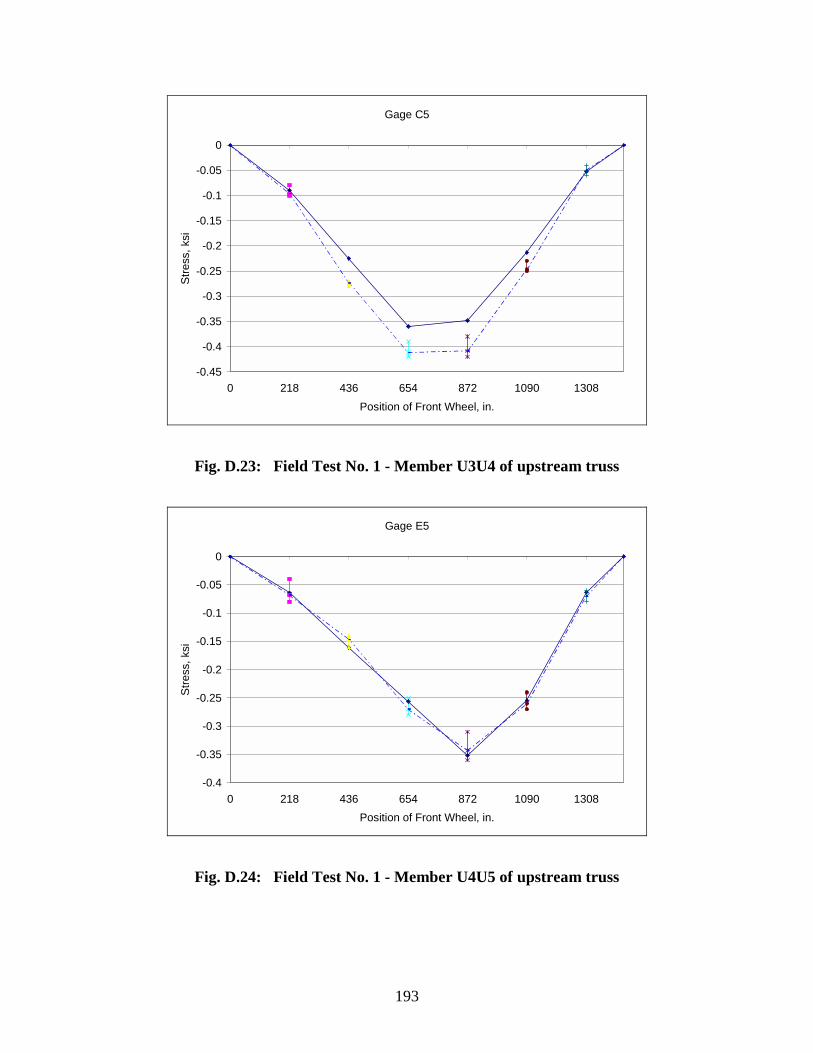
193
Gage C5
-0.45
-0.4
-0.35
-0.3
-0.25
-0.2
-0.15
-0.1
-0.05
0
0 218 436 654 872 1090 1308Position of Front Wheel, in.
Stre
ss, k
si
Fig. D.23: Field Test No. 1 - Member U3U4 of upstream truss
Gage E5
-0.4
-0.35
-0.3
-0.25
-0.2
-0.15
-0.1
-0.05
0
0 218 436 654 872 1090 1308Position of Front Wheel, in.
Stre
ss, k
si
Fig. D.24: Field Test No. 1 - Member U4U5 of upstream truss
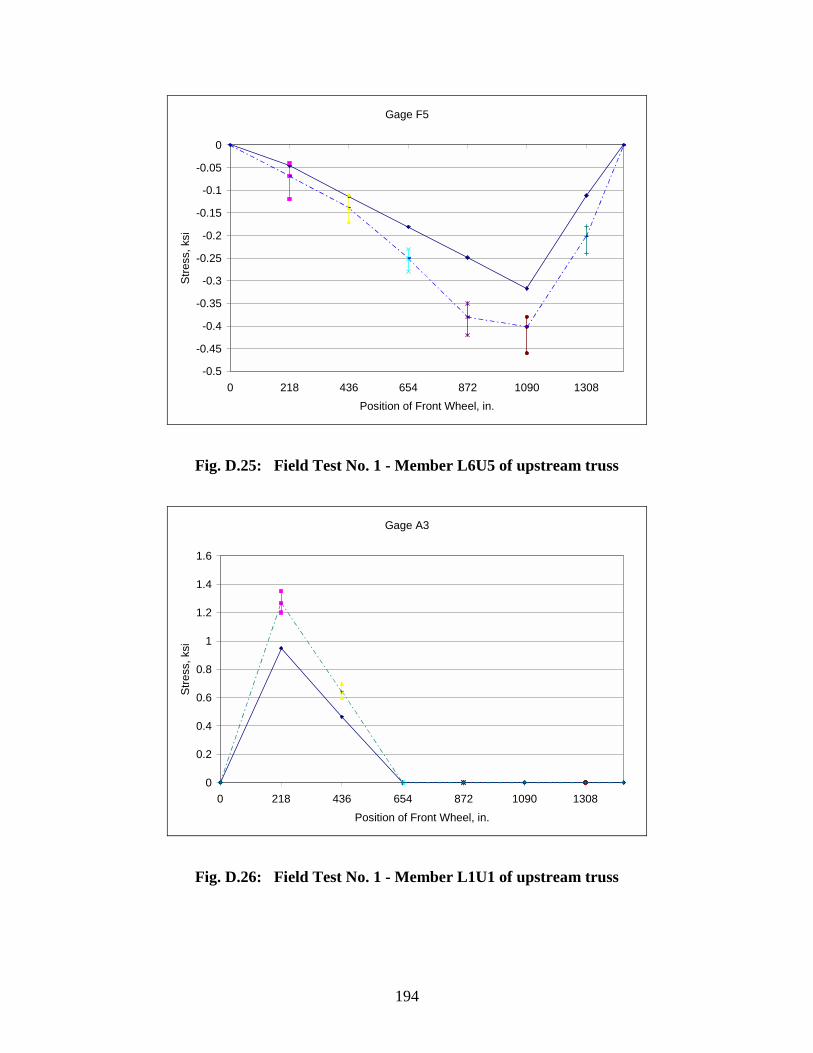
194
Gage F5
-0.5
-0.45
-0.4
-0.35
-0.3
-0.25
-0.2
-0.15
-0.1
-0.05
0
0 218 436 654 872 1090 1308Position of Front Wheel, in.
Stre
ss, k
si
Fig. D.25: Field Test No. 1 - Member L6U5 of upstream truss
Gage A3
0
0.2
0.4
0.6
0.8
1
1.2
1.4
1.6
0 218 436 654 872 1090 1308Position of Front Wheel, in.
Stre
ss, k
si
Fig. D.26: Field Test No. 1 - Member L1U1 of upstream truss
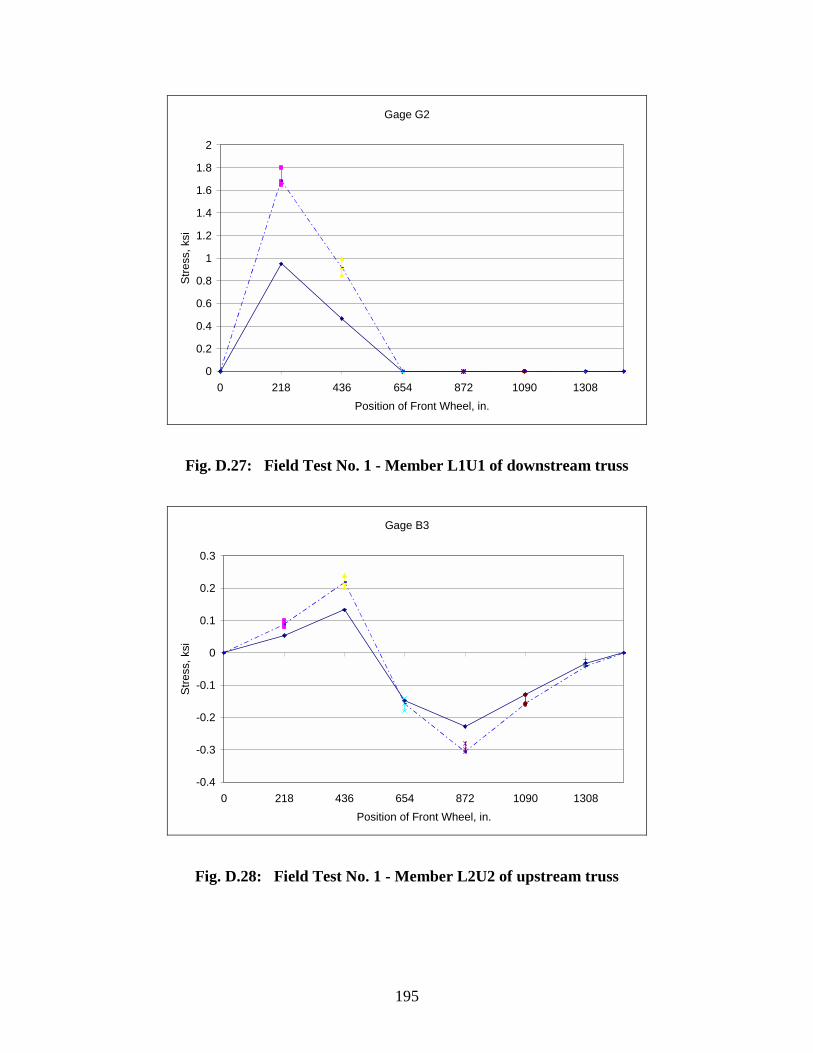
195
Gage G2
0
0.2
0.4
0.6
0.8
1
1.2
1.4
1.6
1.8
2
0 218 436 654 872 1090 1308Position of Front Wheel, in.
Stre
ss, k
si
Fig. D.27: Field Test No. 1 - Member L1U1 of downstream truss
Gage B3
-0.4
-0.3
-0.2
-0.1
0
0.1
0.2
0.3
0 218 436 654 872 1090 1308Position of Front Wheel, in.
Stre
ss, k
si
Fig. D.28: Field Test No. 1 - Member L2U2 of upstream truss
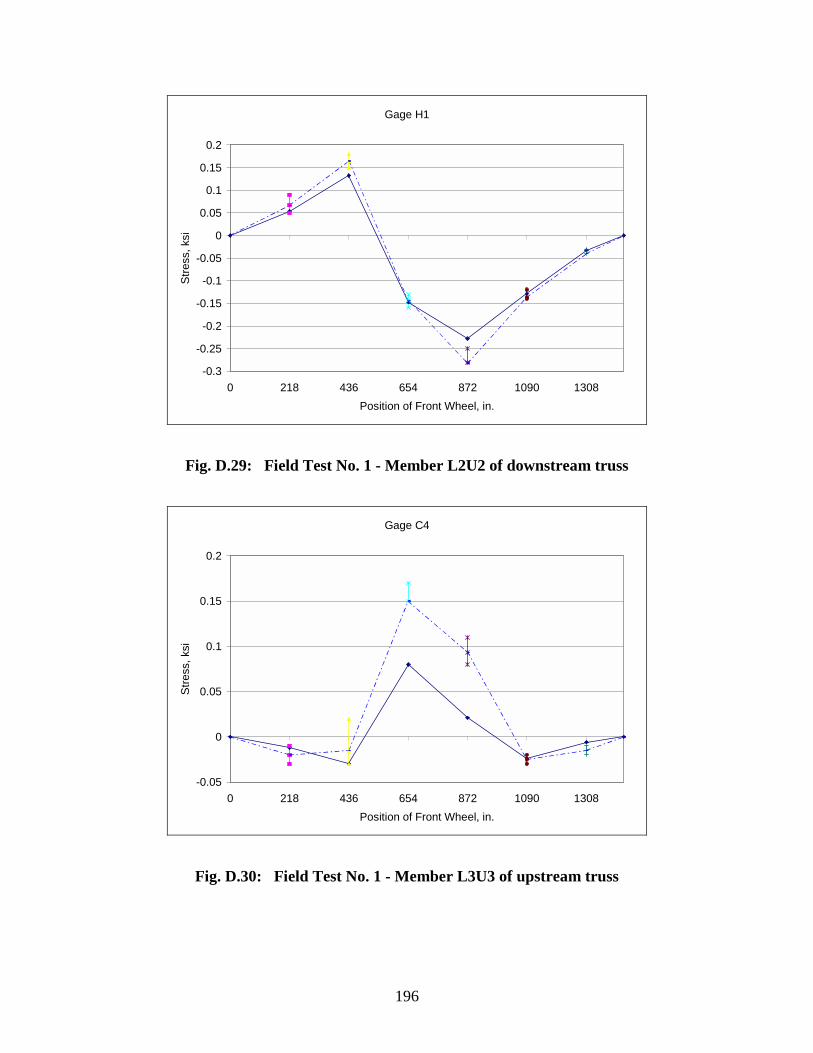
196
Gage H1
-0.3
-0.25
-0.2
-0.15
-0.1
-0.05
0
0.05
0.1
0.15
0.2
0 218 436 654 872 1090 1308Position of Front Wheel, in.
Stre
ss, k
si
Fig. D.29: Field Test No. 1 - Member L2U2 of downstream truss
Gage C4
-0.05
0
0.05
0.1
0.15
0.2
0 218 436 654 872 1090 1308Position of Front Wheel, in.
Stre
ss, k
si
Fig. D.30: Field Test No. 1 - Member L3U3 of upstream truss
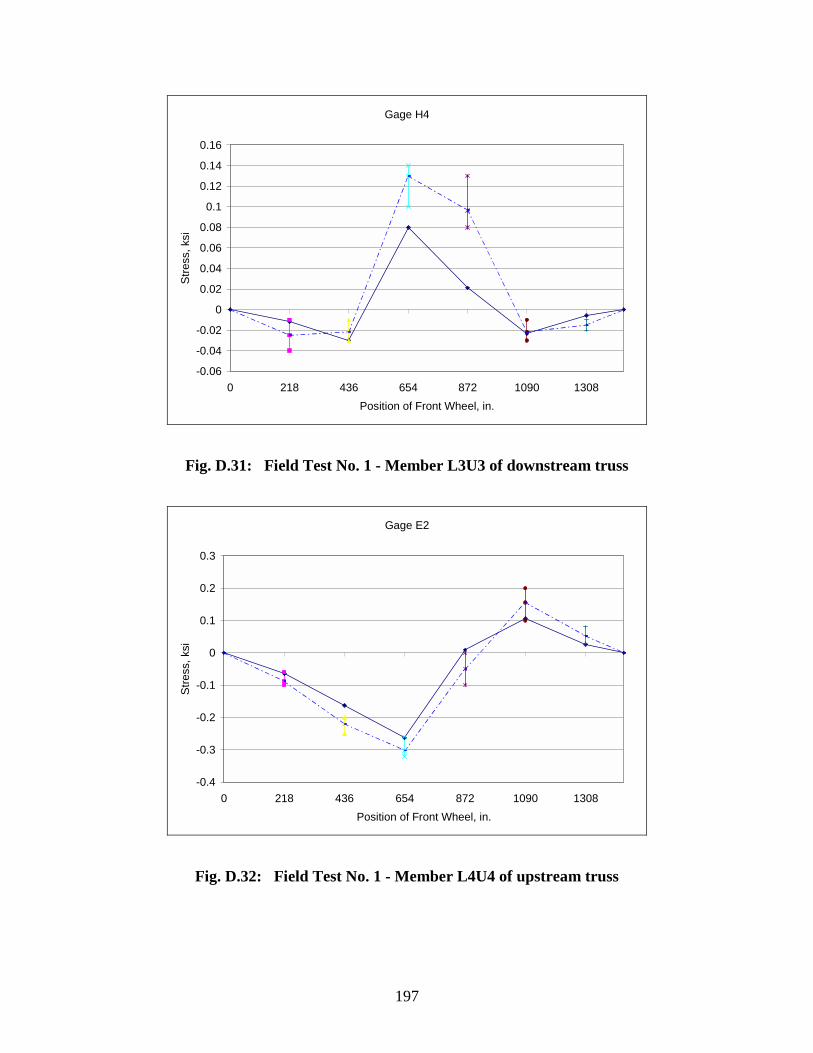
197
Gage H4
-0.06
-0.04
-0.02
0
0.02
0.04
0.06
0.08
0.1
0.12
0.14
0.16
0 218 436 654 872 1090 1308Position of Front Wheel, in.
Stre
ss, k
si
Fig. D.31: Field Test No. 1 - Member L3U3 of downstream truss
Gage E2
-0.4
-0.3
-0.2
-0.1
0
0.1
0.2
0.3
0 218 436 654 872 1090 1308Position of Front Wheel, in.
Stre
ss, k
si
Fig. D.32: Field Test No. 1 - Member L4U4 of upstream truss
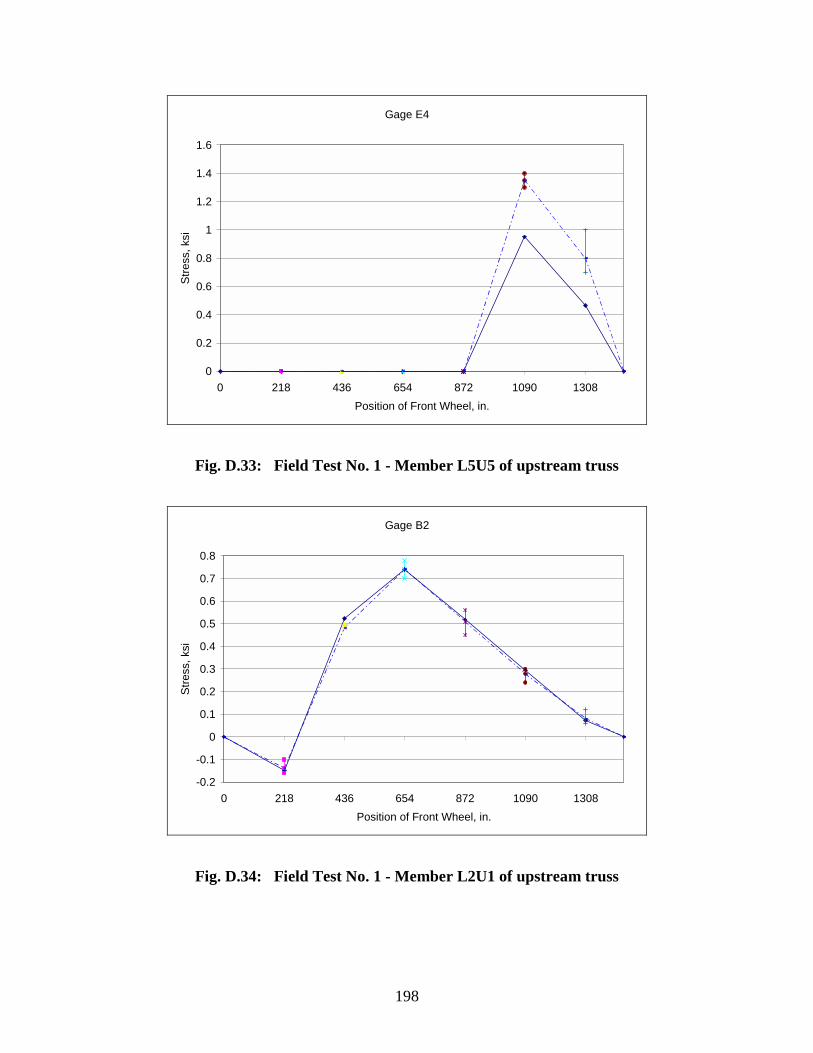
198
Gage E4
0
0.2
0.4
0.6
0.8
1
1.2
1.4
1.6
0 218 436 654 872 1090 1308Position of Front Wheel, in.
Stre
ss, k
si
Fig. D.33: Field Test No. 1 - Member L5U5 of upstream truss
Gage B2
-0.2
-0.1
0
0.1
0.2
0.3
0.4
0.5
0.6
0.7
0.8
0 218 436 654 872 1090 1308Position of Front Wheel, in.
Stre
ss, k
si
Fig. D.34: Field Test No. 1 - Member L2U1 of upstream truss
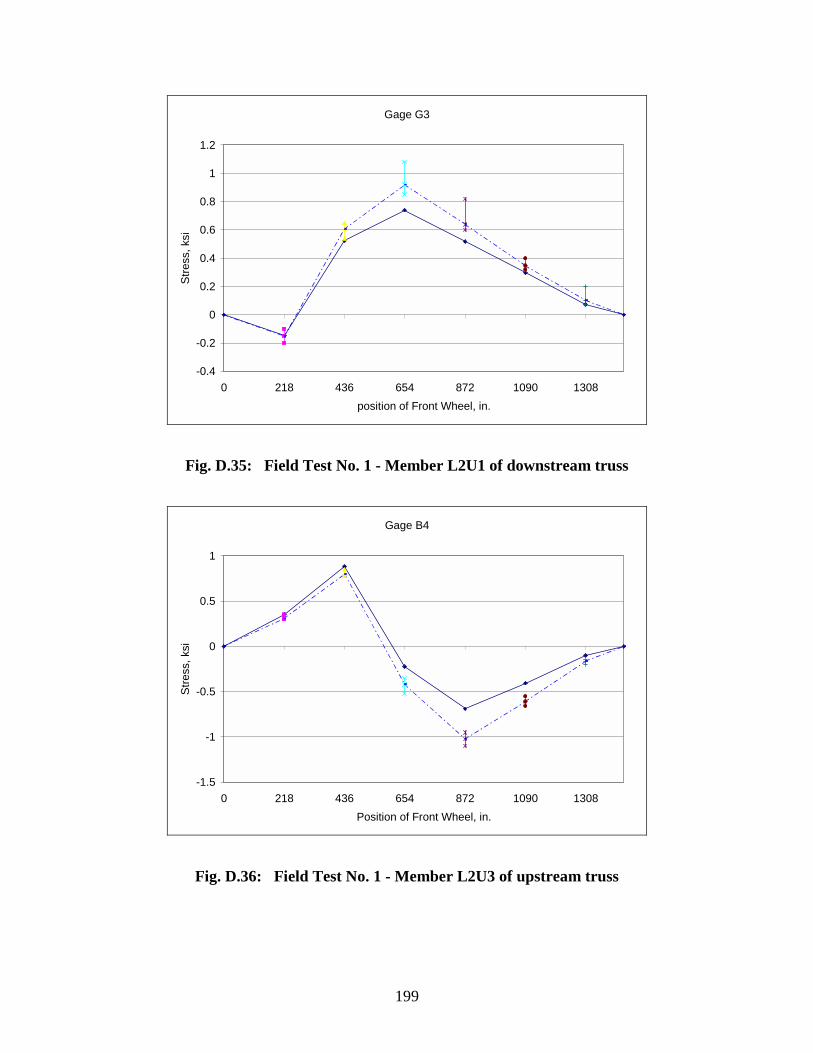
199
Gage G3
-0.4
-0.2
0
0.2
0.4
0.6
0.8
1
1.2
0 218 436 654 872 1090 1308position of Front Wheel, in.
Stre
ss, k
si
Fig. D.35: Field Test No. 1 - Member L2U1 of downstream truss
Gage B4
-1.5
-1
-0.5
0
0.5
1
0 218 436 654 872 1090 1308Position of Front Wheel, in.
Stre
ss, k
si
Fig. D.36: Field Test No. 1 - Member L2U3 of upstream truss
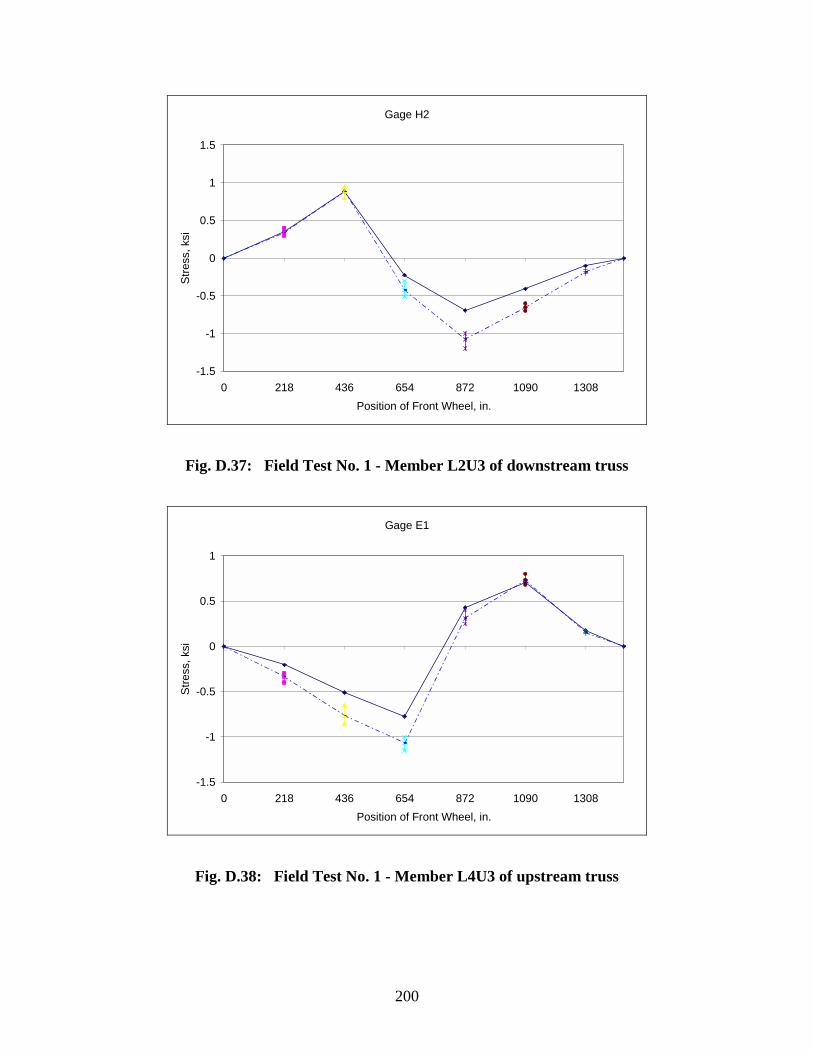
200
Gage H2
-1.5
-1
-0.5
0
0.5
1
1.5
0 218 436 654 872 1090 1308Position of Front Wheel, in.
Stre
ss, k
si
Fig. D.37: Field Test No. 1 - Member L2U3 of downstream truss
Gage E1
-1.5
-1
-0.5
0
0.5
1
0 218 436 654 872 1090 1308Position of Front Wheel, in.
Stre
ss, k
si
Fig. D.38: Field Test No. 1 - Member L4U3 of upstream truss
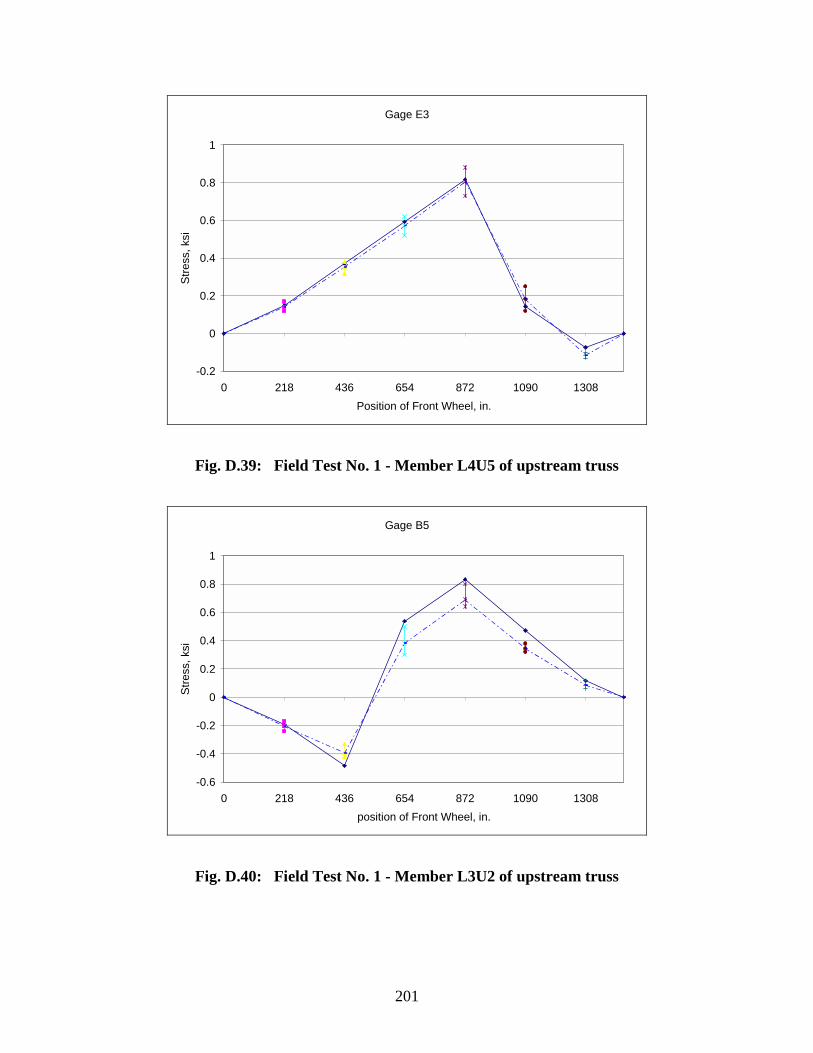
201
Gage E3
-0.2
0
0.2
0.4
0.6
0.8
1
0 218 436 654 872 1090 1308Position of Front Wheel, in.
Stre
ss, k
si
Fig. D.39: Field Test No. 1 - Member L4U5 of upstream truss
Gage B5
-0.6
-0.4
-0.2
0
0.2
0.4
0.6
0.8
1
0 218 436 654 872 1090 1308position of Front Wheel, in.
Stre
ss, k
si
Fig. D.40: Field Test No. 1 - Member L3U2 of upstream truss
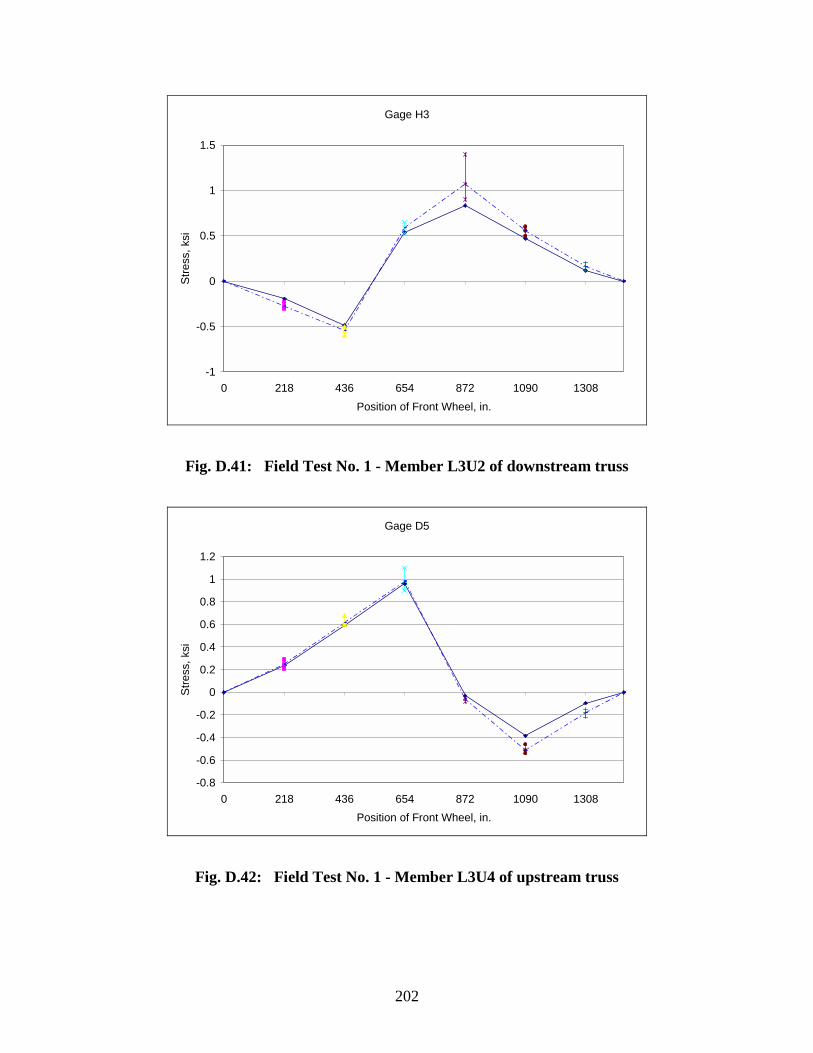
202
Gage H3
-1
-0.5
0
0.5
1
1.5
0 218 436 654 872 1090 1308Position of Front Wheel, in.
Stre
ss, k
si
Fig. D.41: Field Test No. 1 - Member L3U2 of downstream truss
Gage D5
-0.8
-0.6
-0.4
-0.2
0
0.2
0.4
0.6
0.8
1
1.2
0 218 436 654 872 1090 1308Position of Front Wheel, in.
Stre
ss, k
si
Fig. D.42: Field Test No. 1 - Member L3U4 of upstream truss
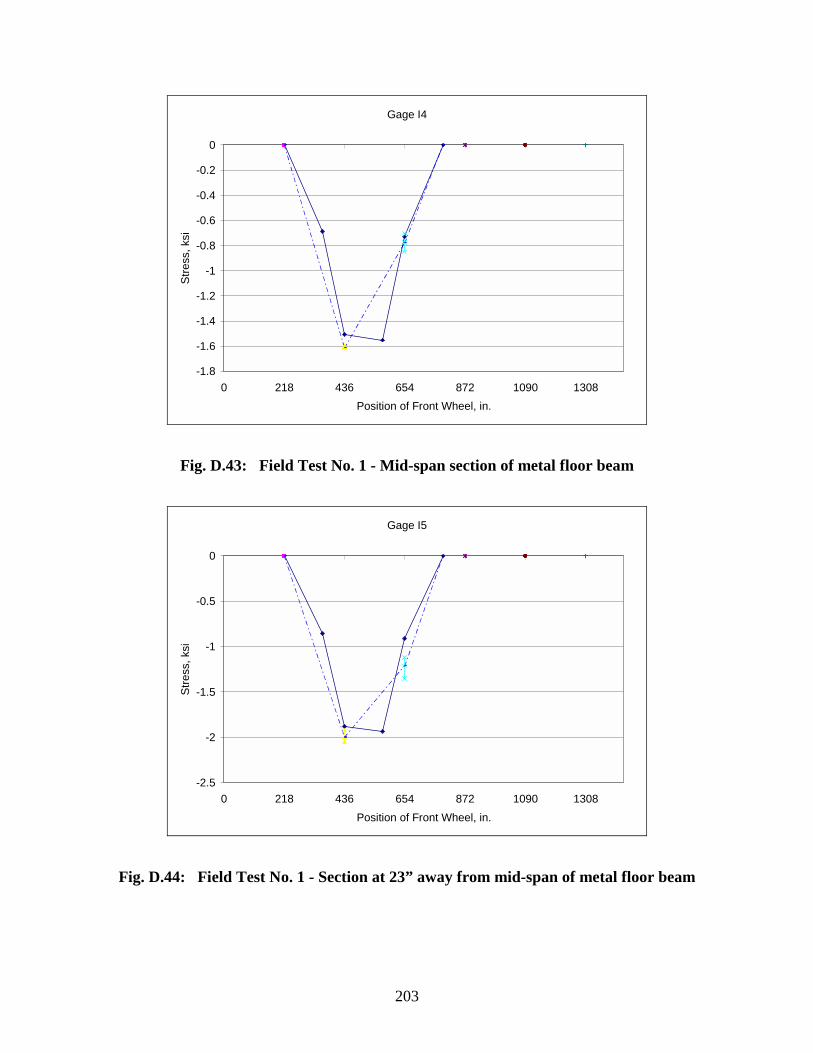
203
Gage I4
-1.8
-1.6
-1.4
-1.2
-1
-0.8
-0.6
-0.4
-0.2
0
0 218 436 654 872 1090 1308Position of Front Wheel, in.
Stre
ss, k
si
Fig. D.43: Field Test No. 1 - Mid-span section of metal floor beam
Gage I5
-2.5
-2
-1.5
-1
-0.5
0
0 218 436 654 872 1090 1308Position of Front Wheel, in.
Stre
ss, k
si
Fig. D.44: Field Test No. 1 - Section at 23” away from mid-span of metal floor beam
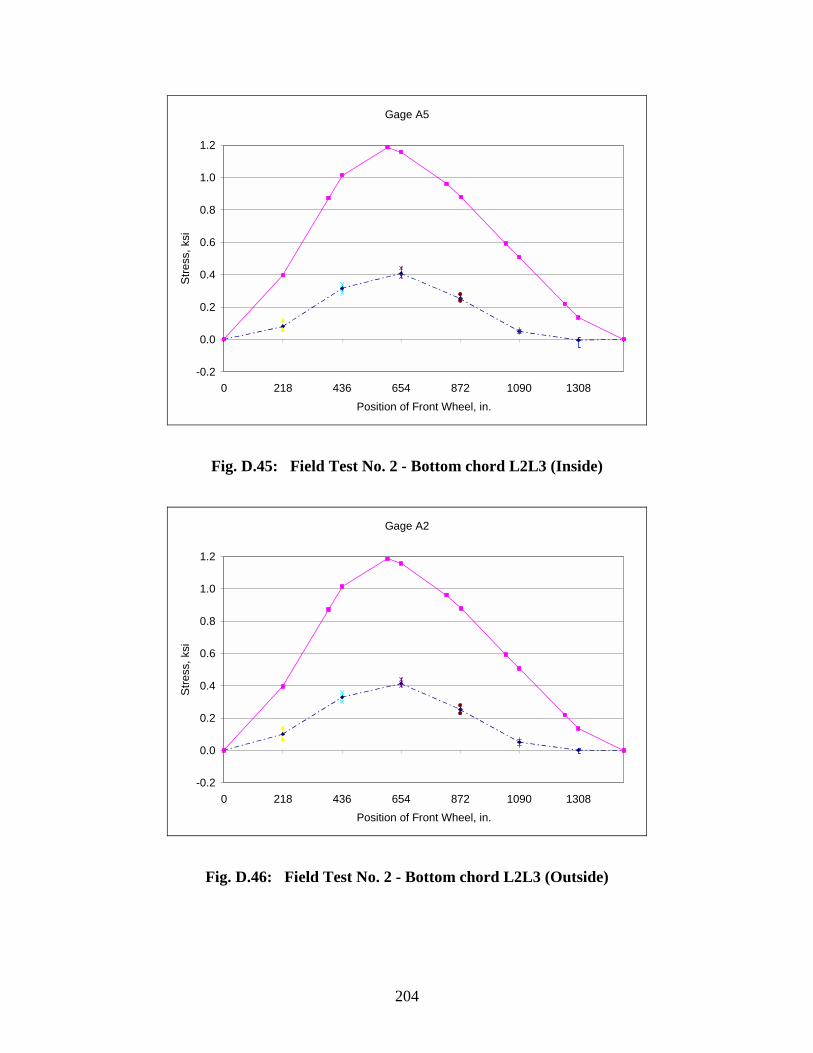
204
Gage A5
-0.2
0.0
0.2
0.4
0.6
0.8
1.0
1.2
0 218 436 654 872 1090 1308Position of Front Wheel, in.
Stre
ss, k
si
Fig. D.45: Field Test No. 2 - Bottom chord L2L3 (Inside)
Gage A2
-0.2
0.0
0.2
0.4
0.6
0.8
1.0
1.2
0 218 436 654 872 1090 1308Position of Front Wheel, in.
Stre
ss, k
si
Fig. D.46: Field Test No. 2 - Bottom chord L2L3 (Outside)
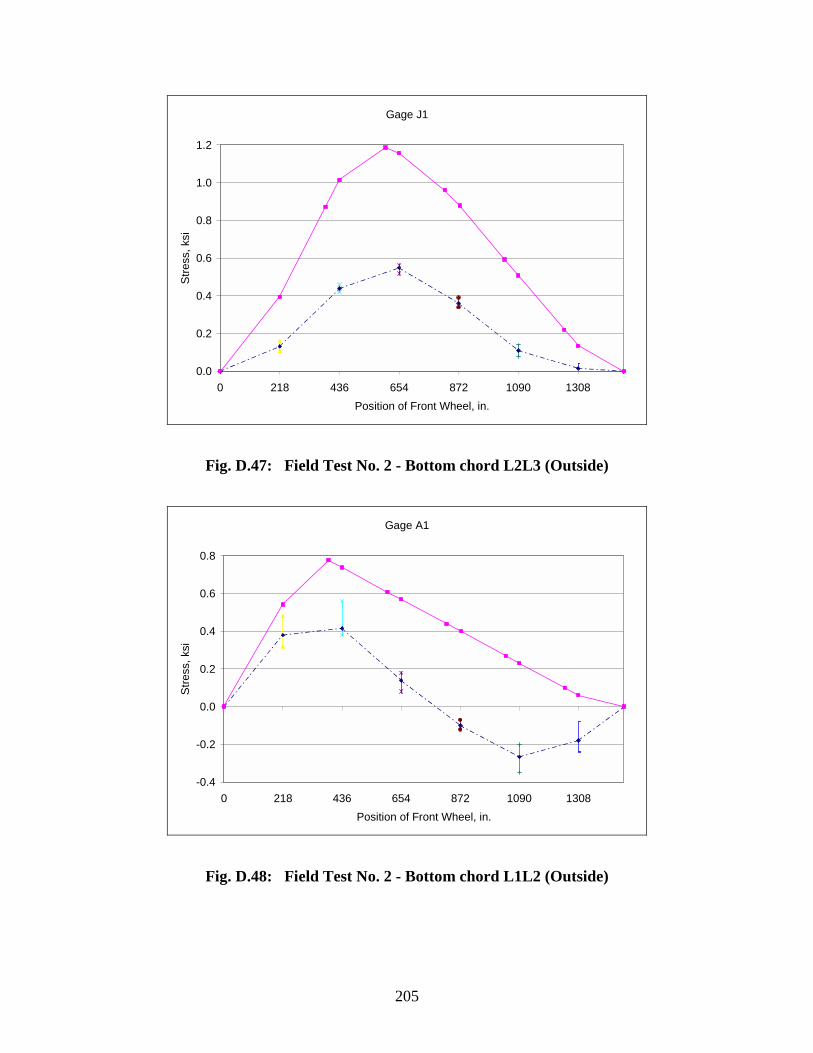
205
Gage J1
0.0
0.2
0.4
0.6
0.8
1.0
1.2
0 218 436 654 872 1090 1308Position of Front Wheel, in.
Stre
ss, k
si
Fig. D.47: Field Test No. 2 - Bottom chord L2L3 (Outside)
Gage A1
-0.4
-0.2
0.0
0.2
0.4
0.6
0.8
0 218 436 654 872 1090 1308Position of Front Wheel, in.
Stre
ss, k
si
Fig. D.48: Field Test No. 2 - Bottom chord L1L2 (Outside)
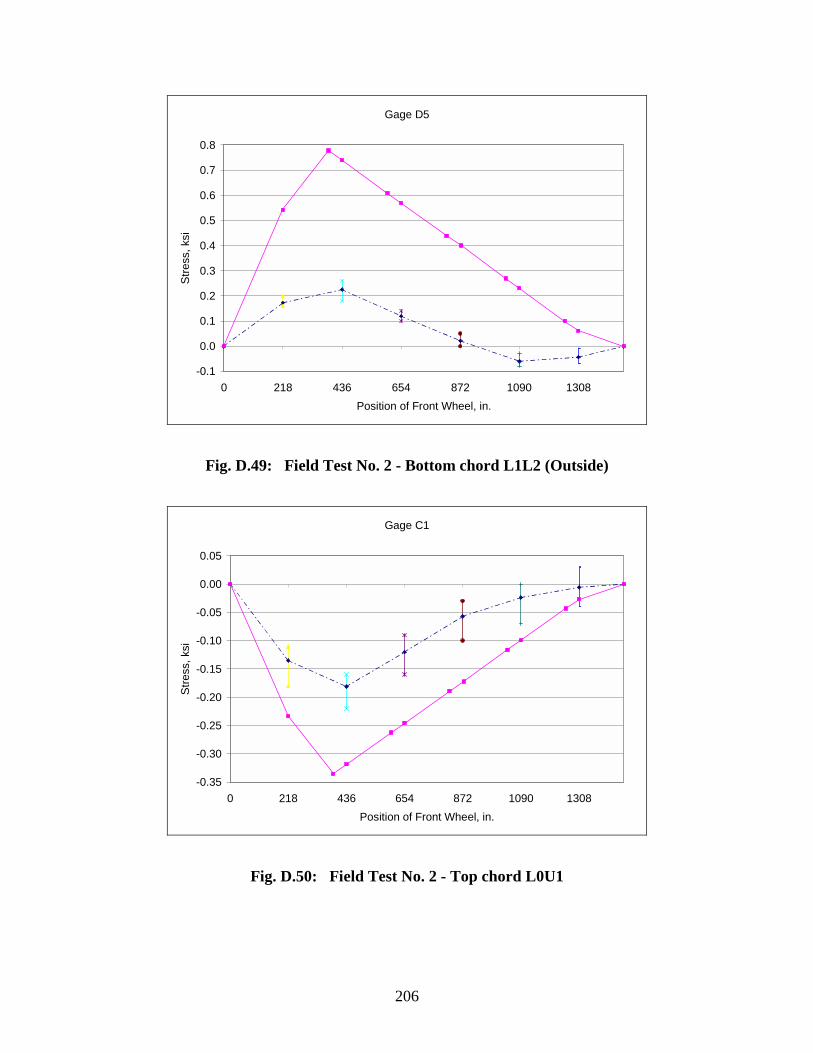
206
Gage D5
-0.1
0.0
0.1
0.2
0.3
0.4
0.5
0.6
0.7
0.8
0 218 436 654 872 1090 1308Position of Front Wheel, in.
Stre
ss, k
si
Fig. D.49: Field Test No. 2 - Bottom chord L1L2 (Outside)
Gage C1
-0.35
-0.30
-0.25
-0.20
-0.15
-0.10
-0.05
0.00
0.05
0 218 436 654 872 1090 1308Position of Front Wheel, in.
Stre
ss, k
si
Fig. D.50: Field Test No. 2 - Top chord L0U1
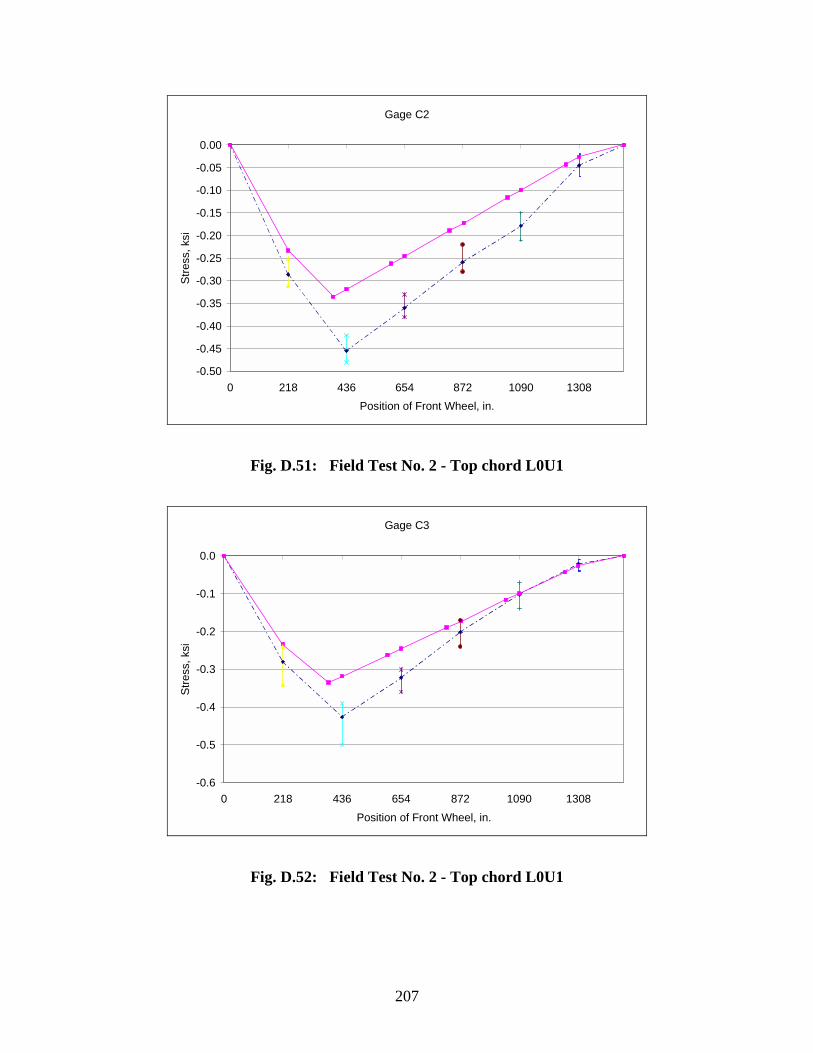
207
Gage C2
-0.50
-0.45
-0.40
-0.35
-0.30
-0.25
-0.20
-0.15
-0.10
-0.05
0.00
0 218 436 654 872 1090 1308Position of Front Wheel, in.
Stre
ss, k
si
Fig. D.51: Field Test No. 2 - Top chord L0U1
Gage C3
-0.6
-0.5
-0.4
-0.3
-0.2
-0.1
0.0
0 218 436 654 872 1090 1308Position of Front Wheel, in.
Stre
ss, k
si
Fig. D.52: Field Test No. 2 - Top chord L0U1
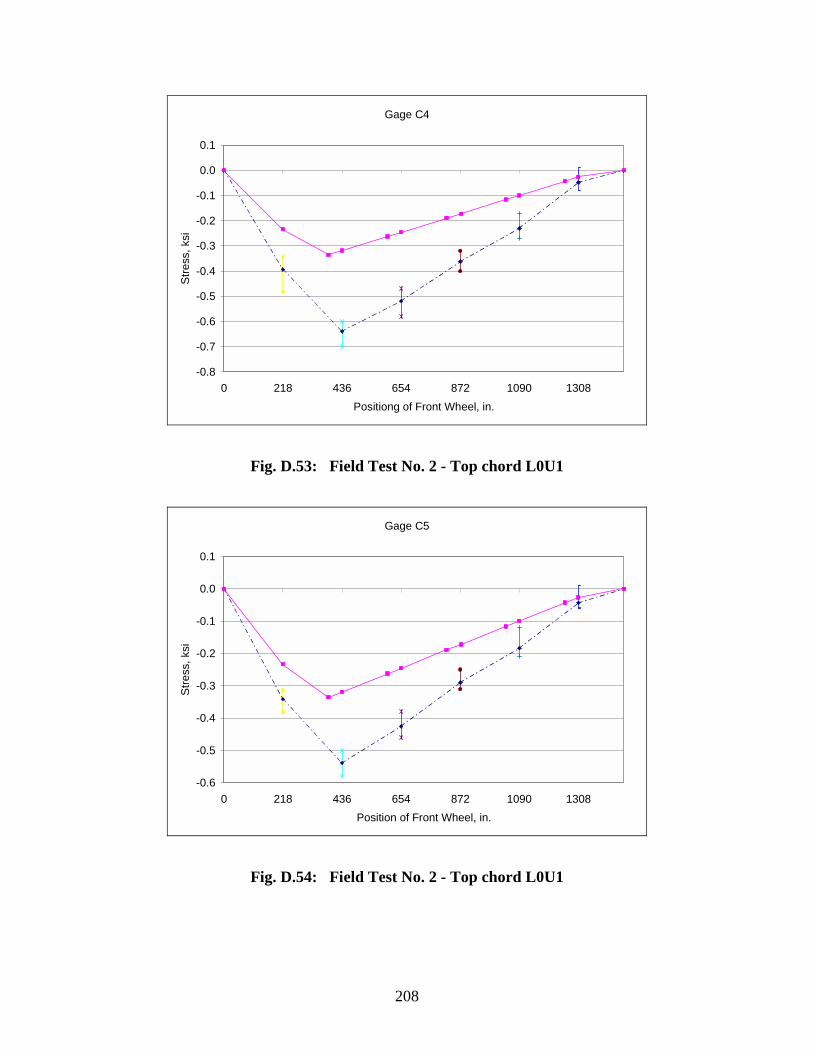
208
Gage C4
-0.8
-0.7
-0.6
-0.5
-0.4
-0.3
-0.2
-0.1
0.0
0.1
0 218 436 654 872 1090 1308Positiong of Front Wheel, in.
Stre
ss, k
si
Fig. D.53: Field Test No. 2 - Top chord L0U1
Gage C5
-0.6
-0.5
-0.4
-0.3
-0.2
-0.1
0.0
0.1
0 218 436 654 872 1090 1308Position of Front Wheel, in.
Stre
ss, k
si
Fig. D.54: Field Test No. 2 - Top chord L0U1
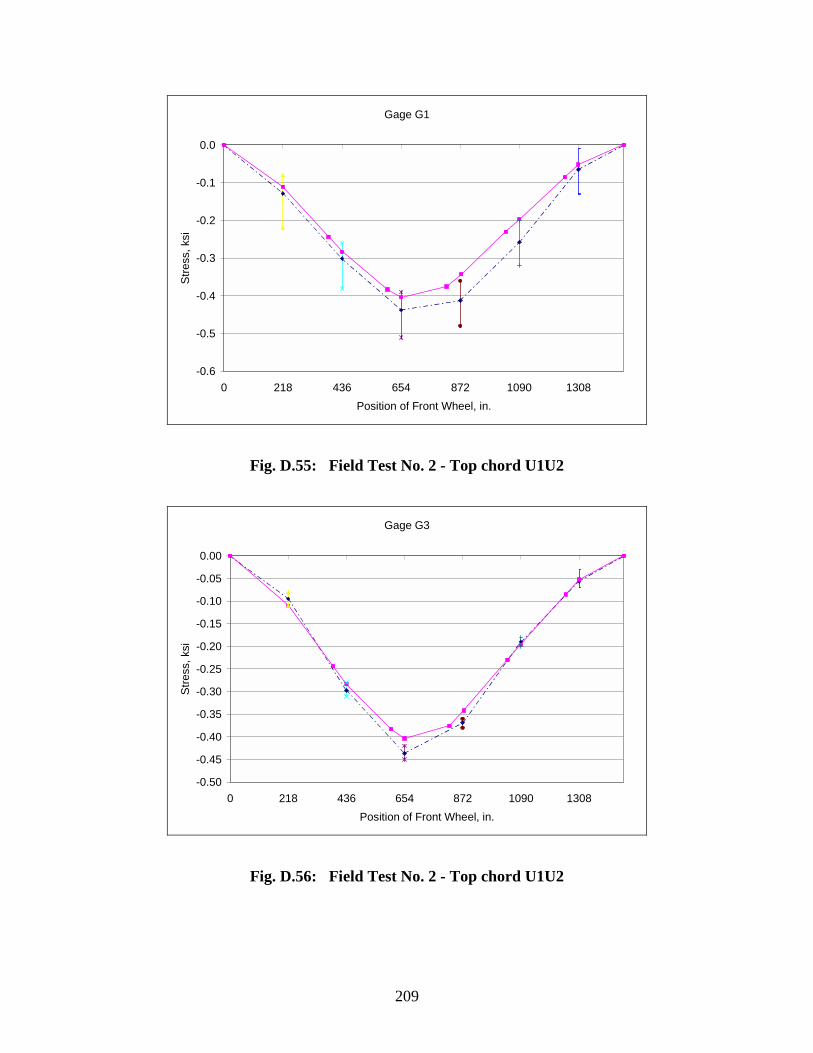
209
Gage G1
-0.6
-0.5
-0.4
-0.3
-0.2
-0.1
0.0
0 218 436 654 872 1090 1308Position of Front Wheel, in.
Stre
ss, k
si
Fig. D.55: Field Test No. 2 - Top chord U1U2
Gage G3
-0.50
-0.45
-0.40
-0.35
-0.30
-0.25
-0.20
-0.15
-0.10
-0.05
0.00
0 218 436 654 872 1090 1308Position of Front Wheel, in.
Stre
ss, k
si
Fig. D.56: Field Test No. 2 - Top chord U1U2

210
Gage G4
-0.50
-0.45
-0.40
-0.35
-0.30
-0.25
-0.20
-0.15
-0.10
-0.05
0.00
0 218 436 654 872 1090 1308Position of Front Wheel, in.
Stre
ss, k
si
Fig. D.57: Field Test No. 2 - Top chord U1U2
Gage G5
-0.6
-0.5
-0.4
-0.3
-0.2
-0.1
0.0
0 218 436 654 872 1090 1308Position of Front Wheel, in.
Stre
ss, k
si
Fig. D.58: Field Test No. 2 - Top chord U1U2
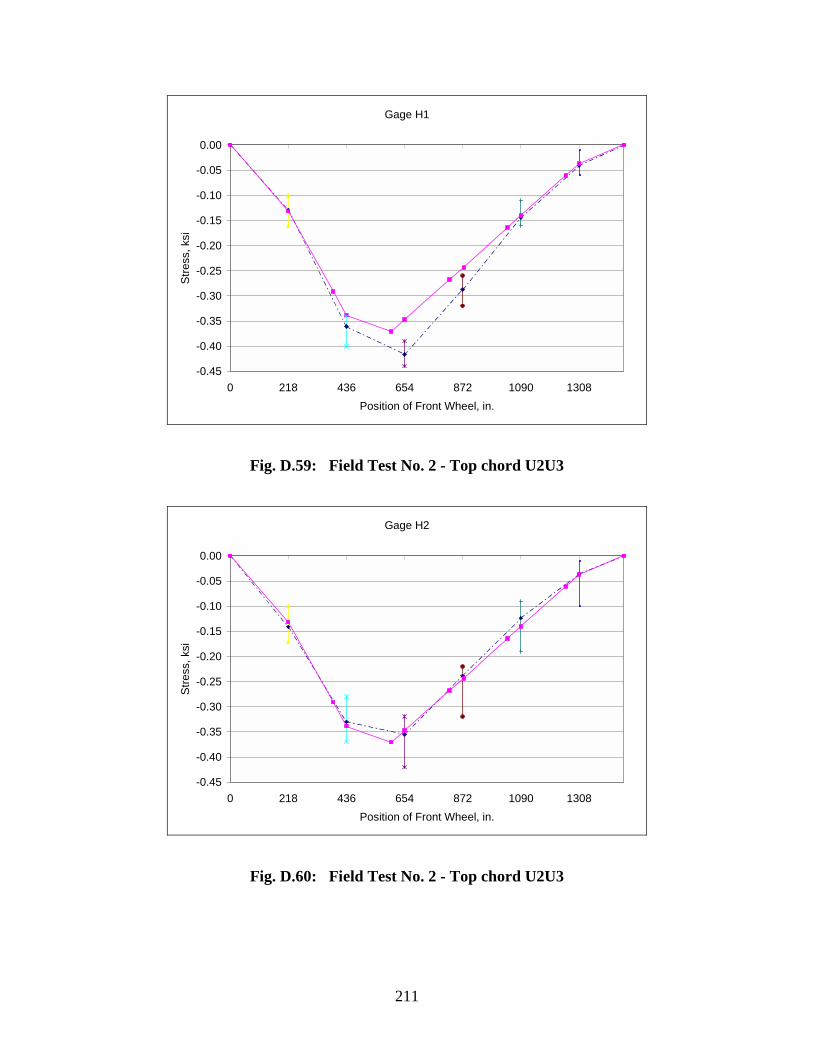
211
Gage H1
-0.45
-0.40
-0.35
-0.30
-0.25
-0.20
-0.15
-0.10
-0.05
0.00
0 218 436 654 872 1090 1308Position of Front Wheel, in.
Stre
ss, k
si
Fig. D.59: Field Test No. 2 - Top chord U2U3
Gage H2
-0.45
-0.40
-0.35
-0.30
-0.25
-0.20
-0.15
-0.10
-0.05
0.00
0 218 436 654 872 1090 1308Position of Front Wheel, in.
Stre
ss, k
si
Fig. D.60: Field Test No. 2 - Top chord U2U3
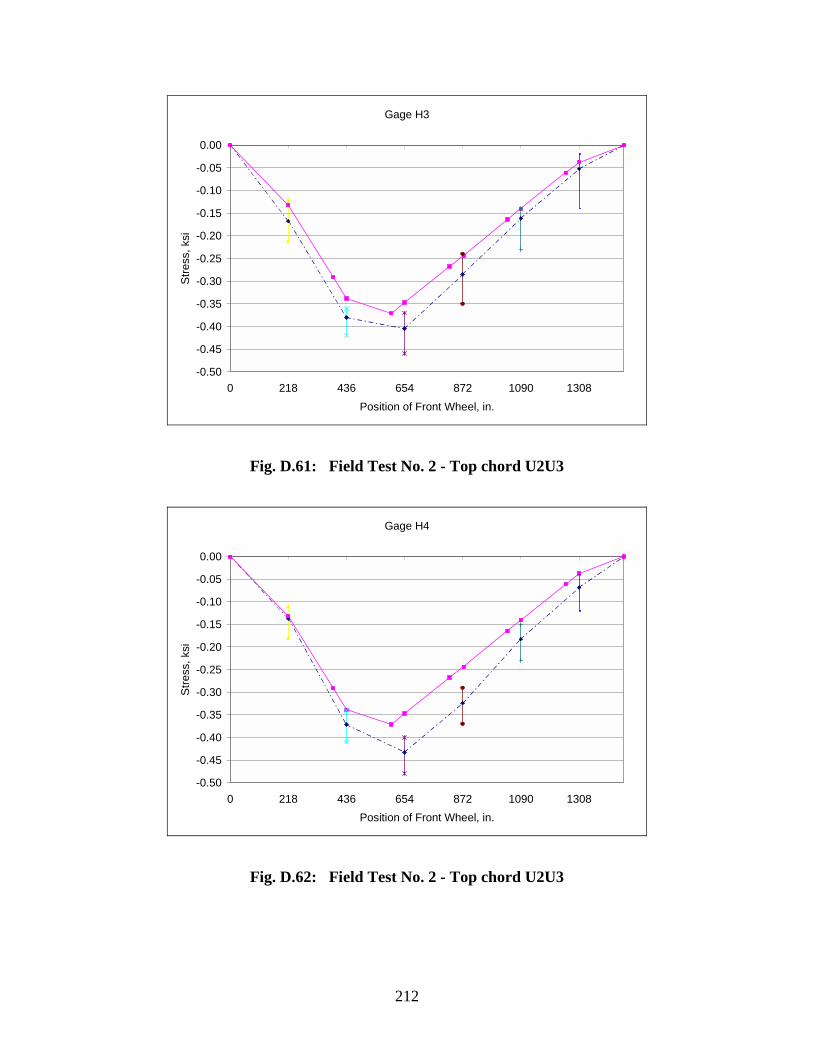
212
Gage H3
-0.50
-0.45
-0.40
-0.35
-0.30
-0.25
-0.20
-0.15
-0.10
-0.05
0.00
0 218 436 654 872 1090 1308Position of Front Wheel, in.
Stre
ss, k
si
Fig. D.61: Field Test No. 2 - Top chord U2U3
Gage H4
-0.50
-0.45
-0.40
-0.35
-0.30
-0.25
-0.20
-0.15
-0.10
-0.05
0.00
0 218 436 654 872 1090 1308Position of Front Wheel, in.
Stre
ss, k
si
Fig. D.62: Field Test No. 2 - Top chord U2U3
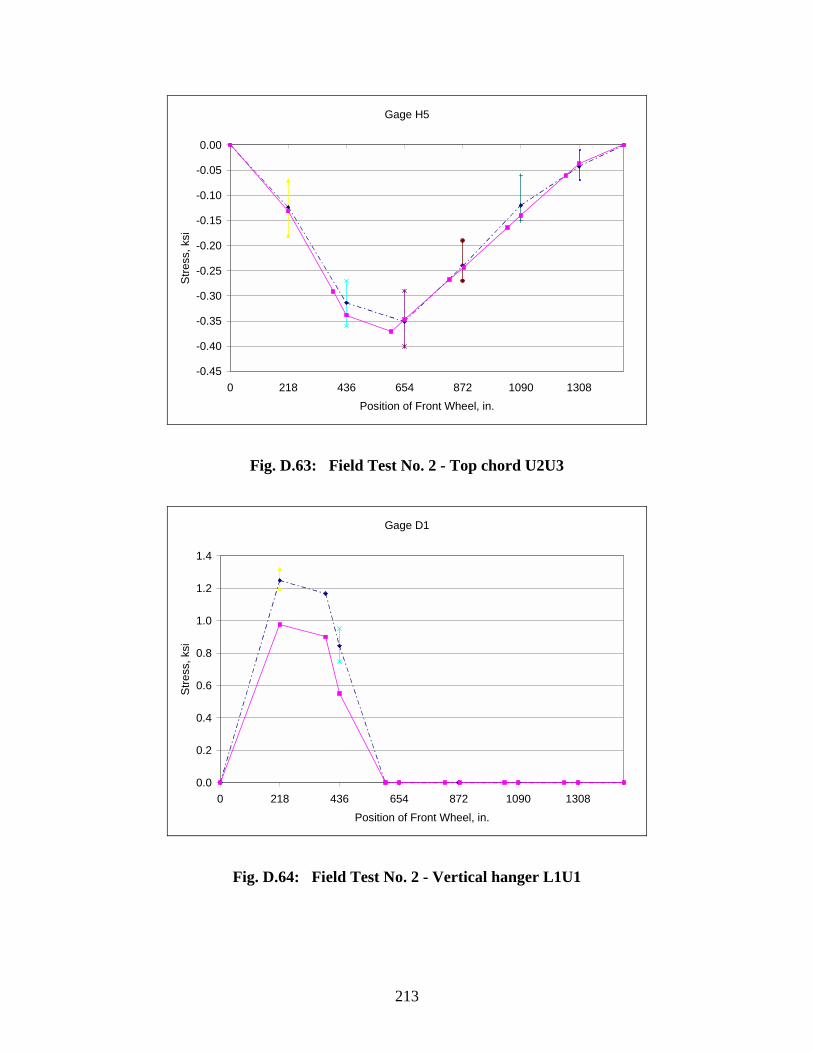
213
Gage H5
-0.45
-0.40
-0.35
-0.30
-0.25
-0.20
-0.15
-0.10
-0.05
0.00
0 218 436 654 872 1090 1308Position of Front Wheel, in.
Stre
ss, k
si
Fig. D.63: Field Test No. 2 - Top chord U2U3
Gage D1
0.0
0.2
0.4
0.6
0.8
1.0
1.2
1.4
0 218 436 654 872 1090 1308Position of Front Wheel, in.
Stre
ss, k
si
Fig. D.64: Field Test No. 2 - Vertical hanger L1U1
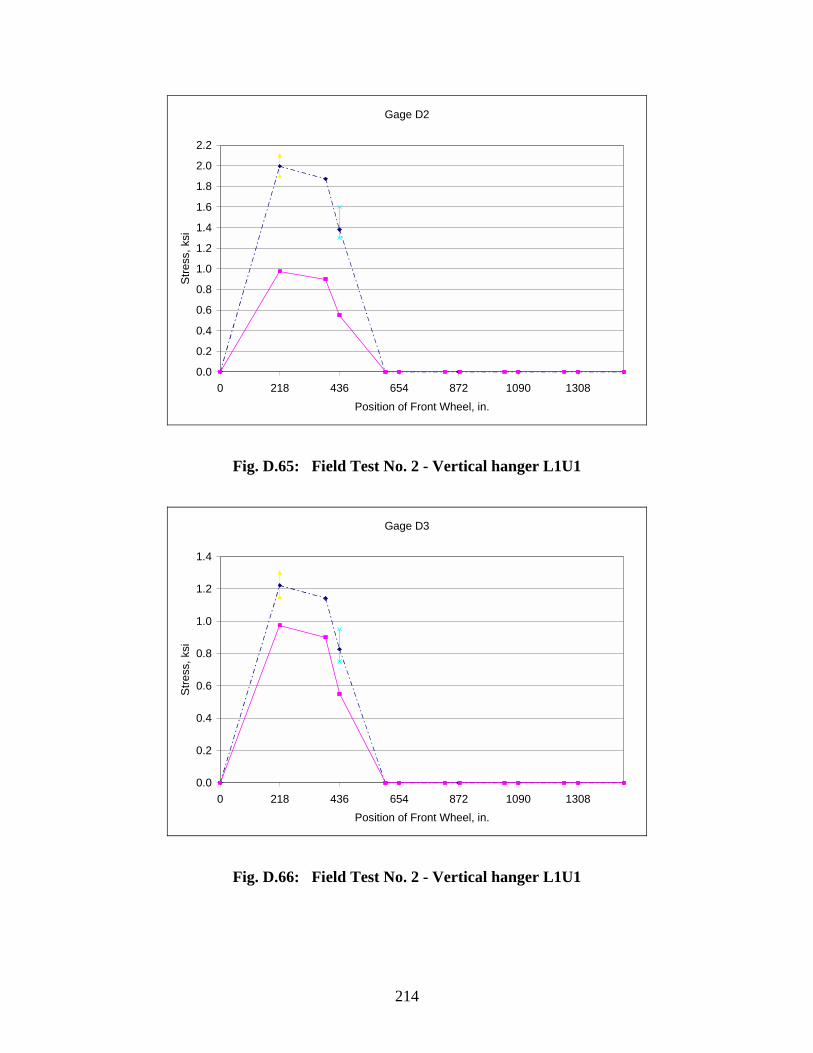
214
Gage D2
0.0
0.2
0.4
0.6
0.8
1.0
1.2
1.4
1.6
1.8
2.0
2.2
0 218 436 654 872 1090 1308Position of Front Wheel, in.
Stre
ss, k
si
Fig. D.65: Field Test No. 2 - Vertical hanger L1U1
Gage D3
0.0
0.2
0.4
0.6
0.8
1.0
1.2
1.4
0 218 436 654 872 1090 1308Position of Front Wheel, in.
Stre
ss, k
si
Fig. D.66: Field Test No. 2 - Vertical hanger L1U1
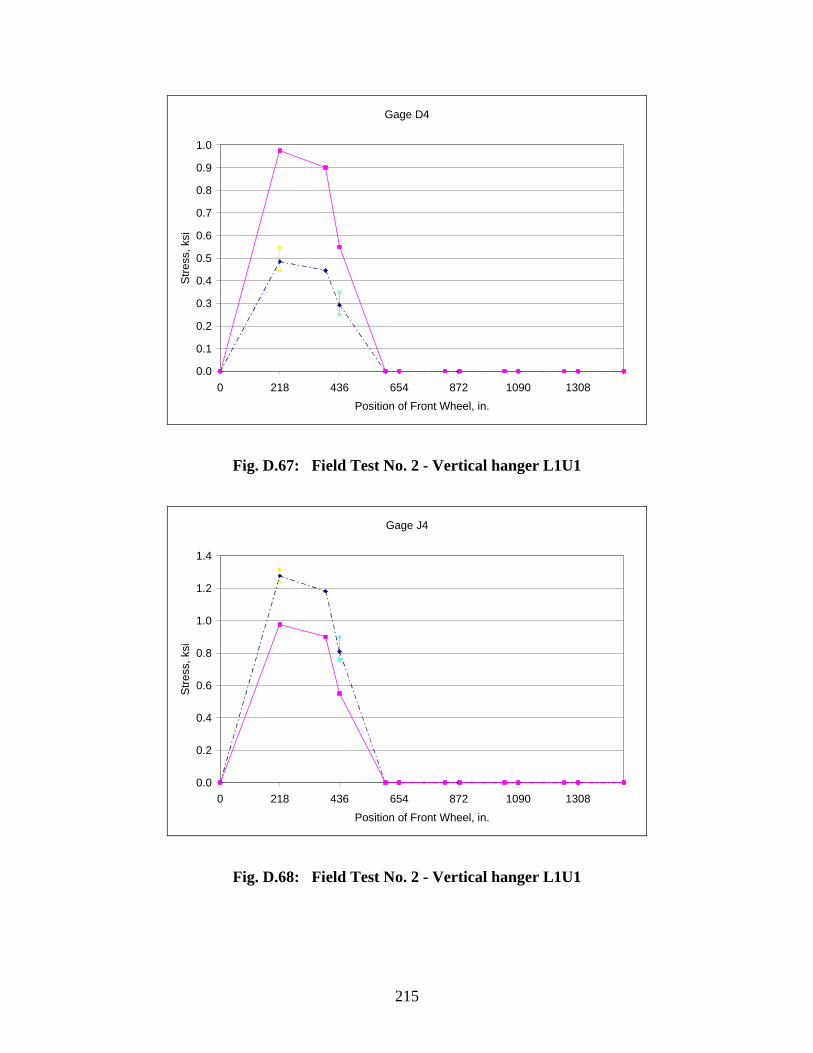
215
Gage D4
0.0
0.1
0.2
0.3
0.4
0.5
0.6
0.7
0.8
0.9
1.0
0 218 436 654 872 1090 1308Position of Front Wheel, in.
Stre
ss, k
si
Fig. D.67: Field Test No. 2 - Vertical hanger L1U1
Gage J4
0.0
0.2
0.4
0.6
0.8
1.0
1.2
1.4
0 218 436 654 872 1090 1308Position of Front Wheel, in.
Stre
ss, k
si
Fig. D.68: Field Test No. 2 - Vertical hanger L1U1
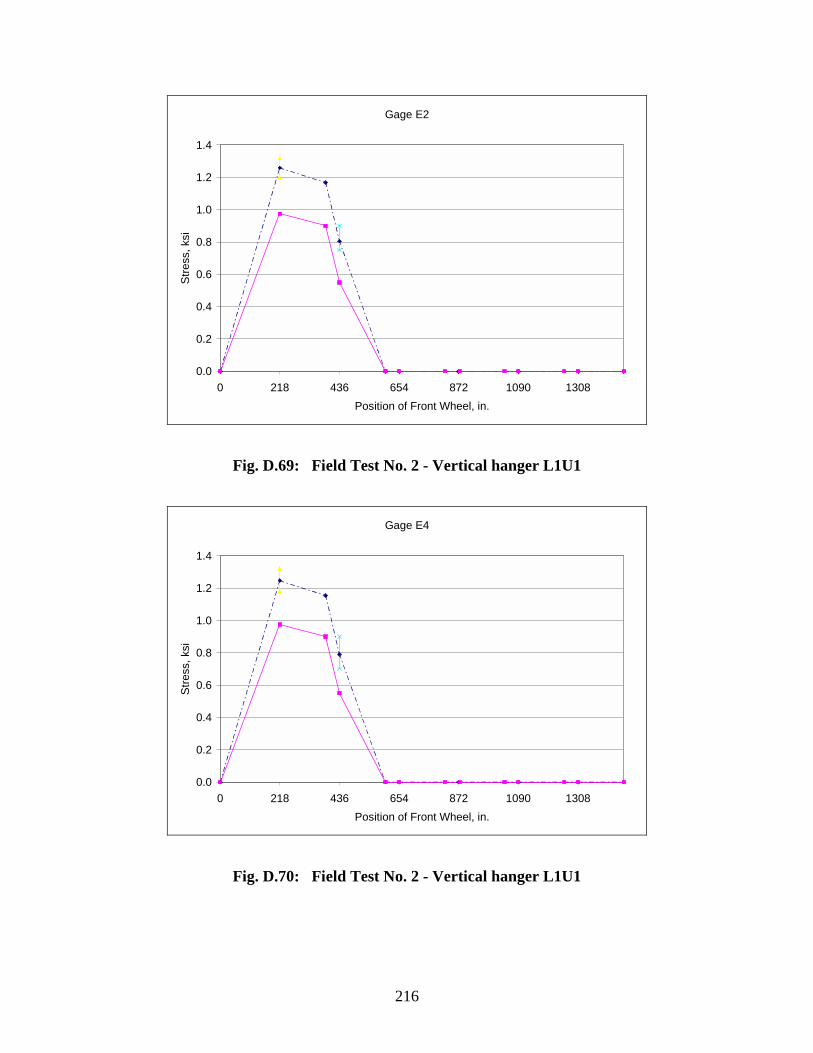
216
Gage E2
0.0
0.2
0.4
0.6
0.8
1.0
1.2
1.4
0 218 436 654 872 1090 1308Position of Front Wheel, in.
Stre
ss, k
si
Fig. D.69: Field Test No. 2 - Vertical hanger L1U1
Gage E4
0.0
0.2
0.4
0.6
0.8
1.0
1.2
1.4
0 218 436 654 872 1090 1308Position of Front Wheel, in.
Stre
ss, k
si
Fig. D.70: Field Test No. 2 - Vertical hanger L1U1
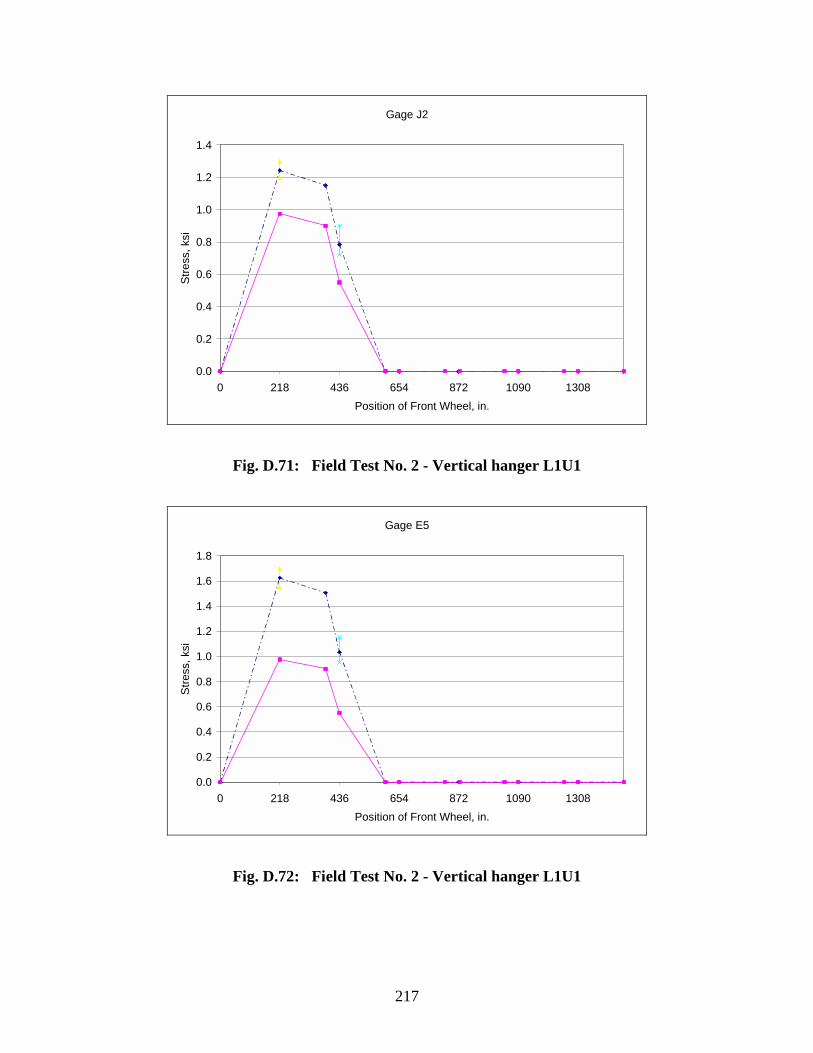
217
Gage J2
0.0
0.2
0.4
0.6
0.8
1.0
1.2
1.4
0 218 436 654 872 1090 1308Position of Front Wheel, in.
Stre
ss, k
si
Fig. D.71: Field Test No. 2 - Vertical hanger L1U1
Gage E5
0.0
0.2
0.4
0.6
0.8
1.0
1.2
1.4
1.6
1.8
0 218 436 654 872 1090 1308Position of Front Wheel, in.
Stre
ss, k
si
Fig. D.72: Field Test No. 2 - Vertical hanger L1U1
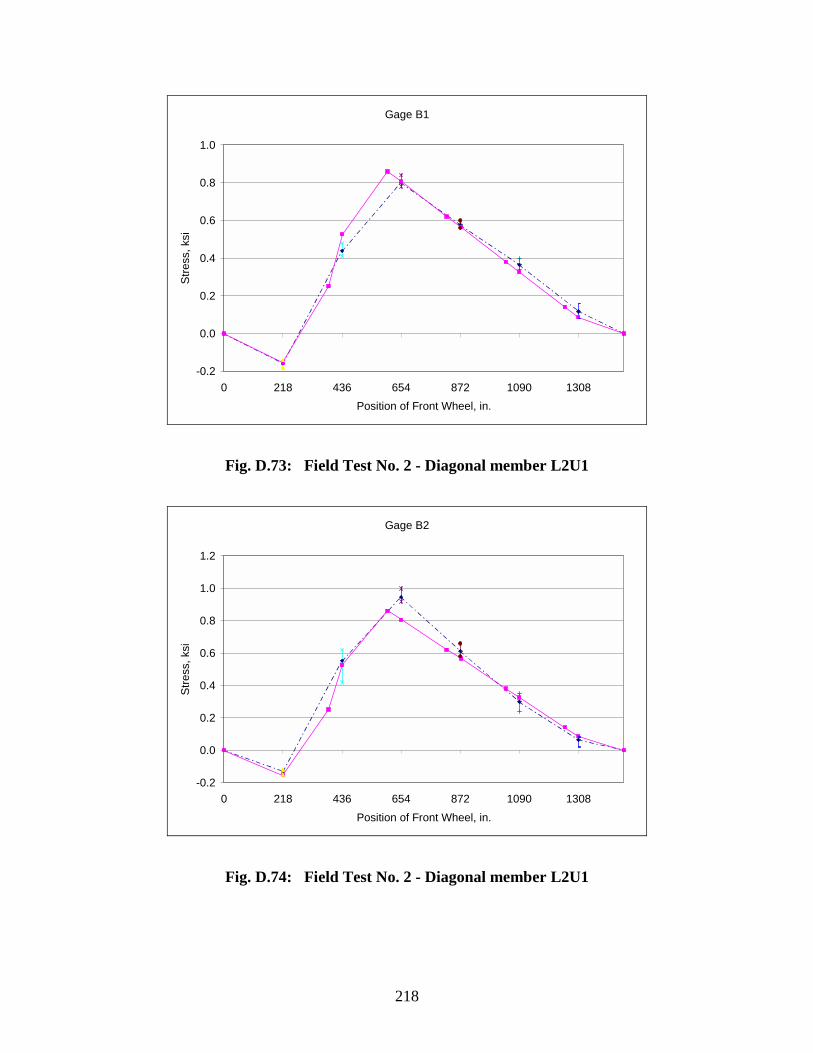
218
Gage B1
-0.2
0.0
0.2
0.4
0.6
0.8
1.0
0 218 436 654 872 1090 1308Position of Front Wheel, in.
Stre
ss, k
si
Fig. D.73: Field Test No. 2 - Diagonal member L2U1
Gage B2
-0.2
0.0
0.2
0.4
0.6
0.8
1.0
1.2
0 218 436 654 872 1090 1308Position of Front Wheel, in.
Stre
ss, k
si
Fig. D.74: Field Test No. 2 - Diagonal member L2U1
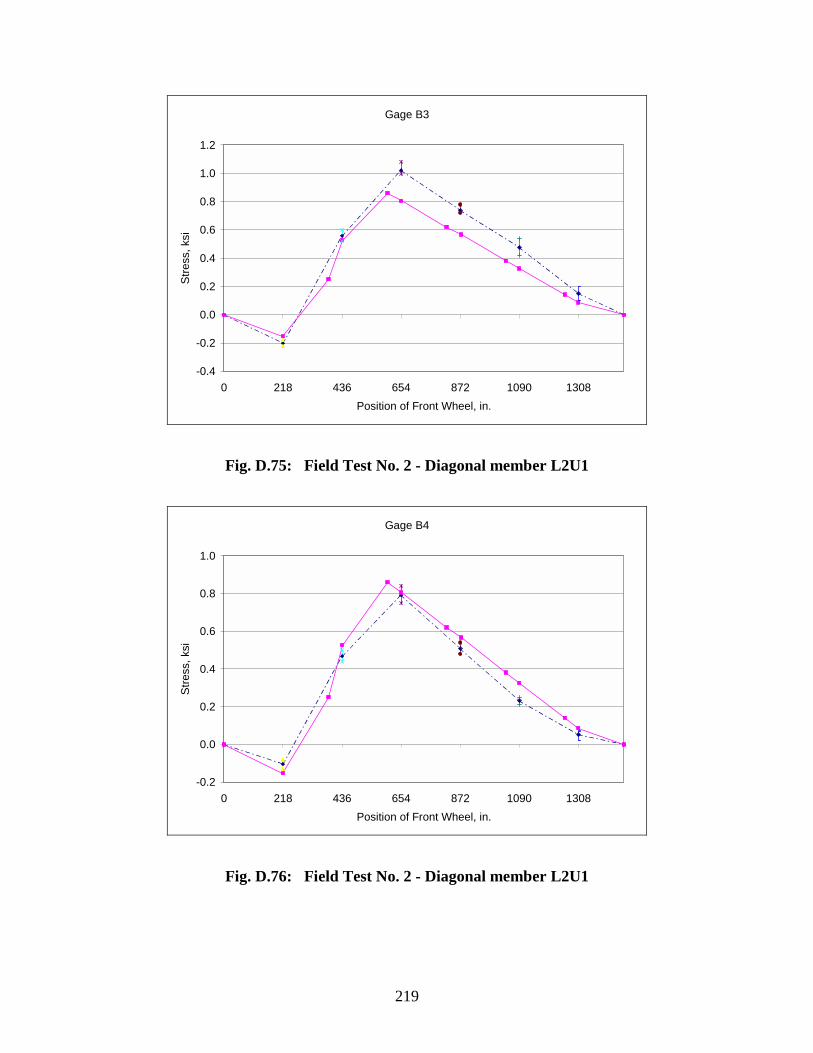
219
Gage B3
-0.4
-0.2
0.0
0.2
0.4
0.6
0.8
1.0
1.2
0 218 436 654 872 1090 1308Position of Front Wheel, in.
Stre
ss, k
si
Fig. D.75: Field Test No. 2 - Diagonal member L2U1
Gage B4
-0.2
0.0
0.2
0.4
0.6
0.8
1.0
0 218 436 654 872 1090 1308Position of Front Wheel, in.
Stre
ss, k
si
Fig. D.76: Field Test No. 2 - Diagonal member L2U1
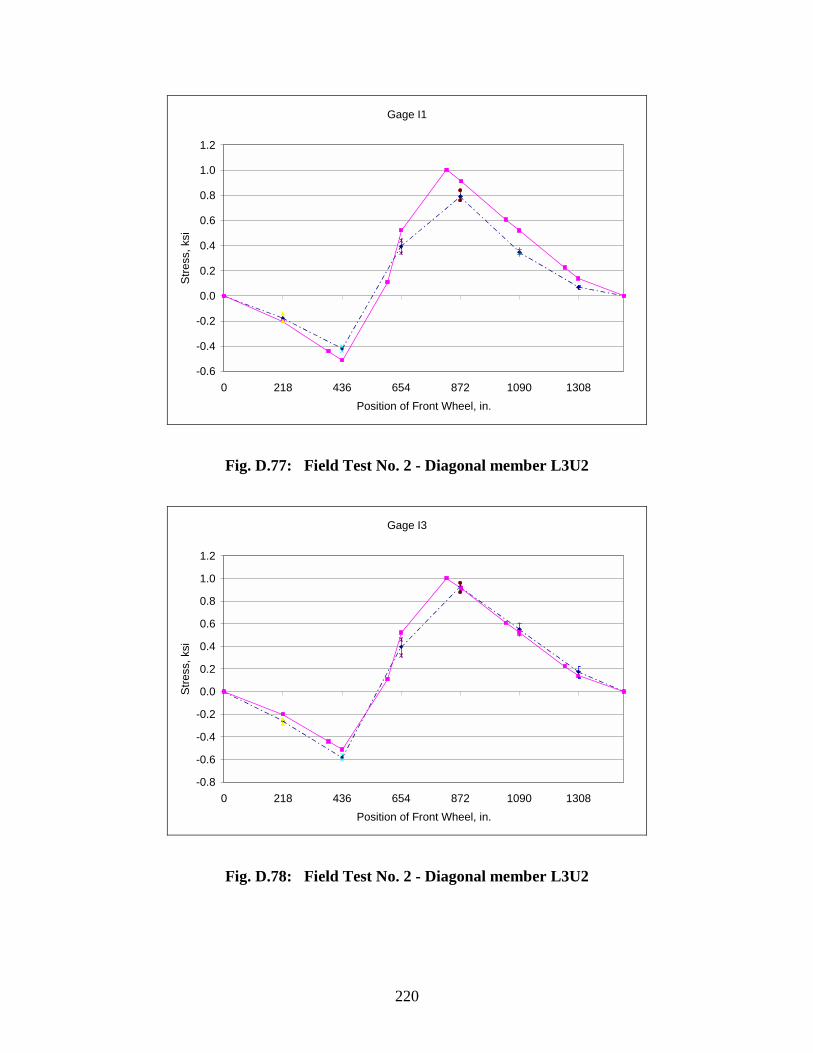
220
Gage I1
-0.6
-0.4
-0.2
0.0
0.2
0.4
0.6
0.8
1.0
1.2
0 218 436 654 872 1090 1308Position of Front Wheel, in.
Stre
ss, k
si
Fig. D.77: Field Test No. 2 - Diagonal member L3U2
Gage I3
-0.8
-0.6
-0.4
-0.2
0.0
0.2
0.4
0.6
0.8
1.0
1.2
0 218 436 654 872 1090 1308Position of Front Wheel, in.
Stre
ss, k
si
Fig. D.78: Field Test No. 2 - Diagonal member L3U2
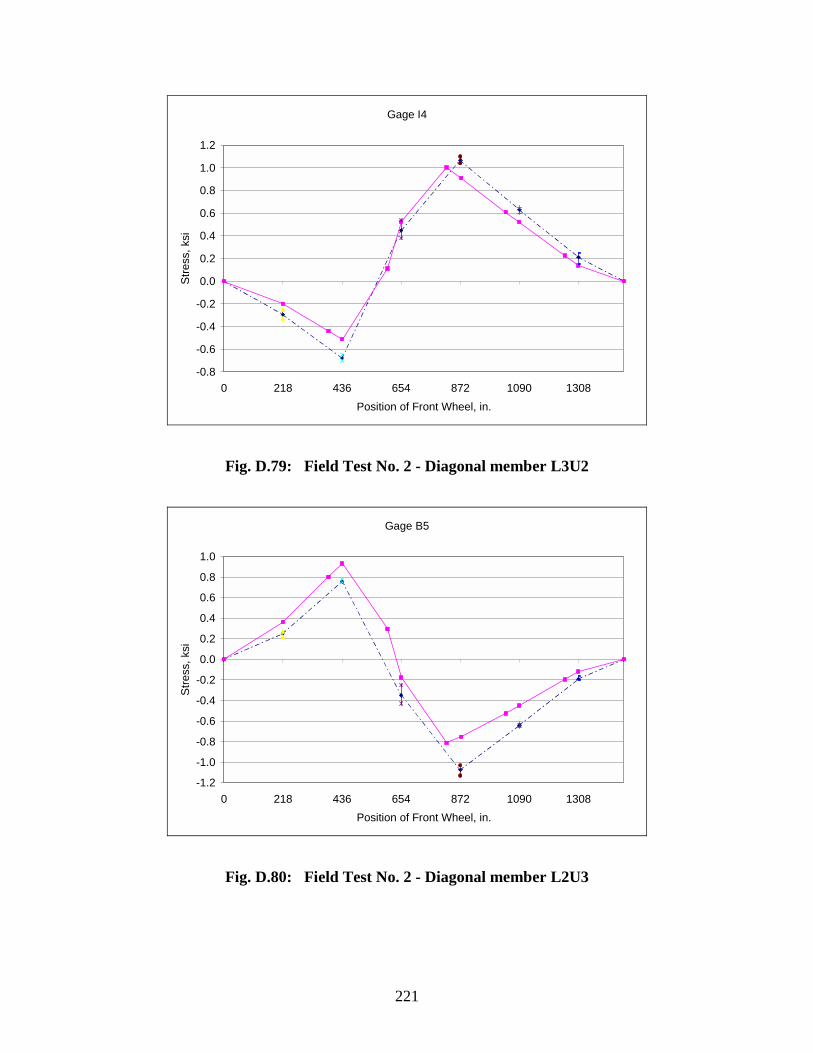
221
Gage I4
-0.8
-0.6
-0.4
-0.2
0.0
0.2
0.4
0.6
0.8
1.0
1.2
0 218 436 654 872 1090 1308Position of Front Wheel, in.
Stre
ss, k
si
Fig. D.79: Field Test No. 2 - Diagonal member L3U2
Gage B5
-1.2
-1.0
-0.8
-0.6
-0.4
-0.2
0.0
0.2
0.4
0.6
0.8
1.0
0 218 436 654 872 1090 1308Position of Front Wheel, in.
Stre
ss, k
si
Fig. D.80: Field Test No. 2 - Diagonal member L2U3
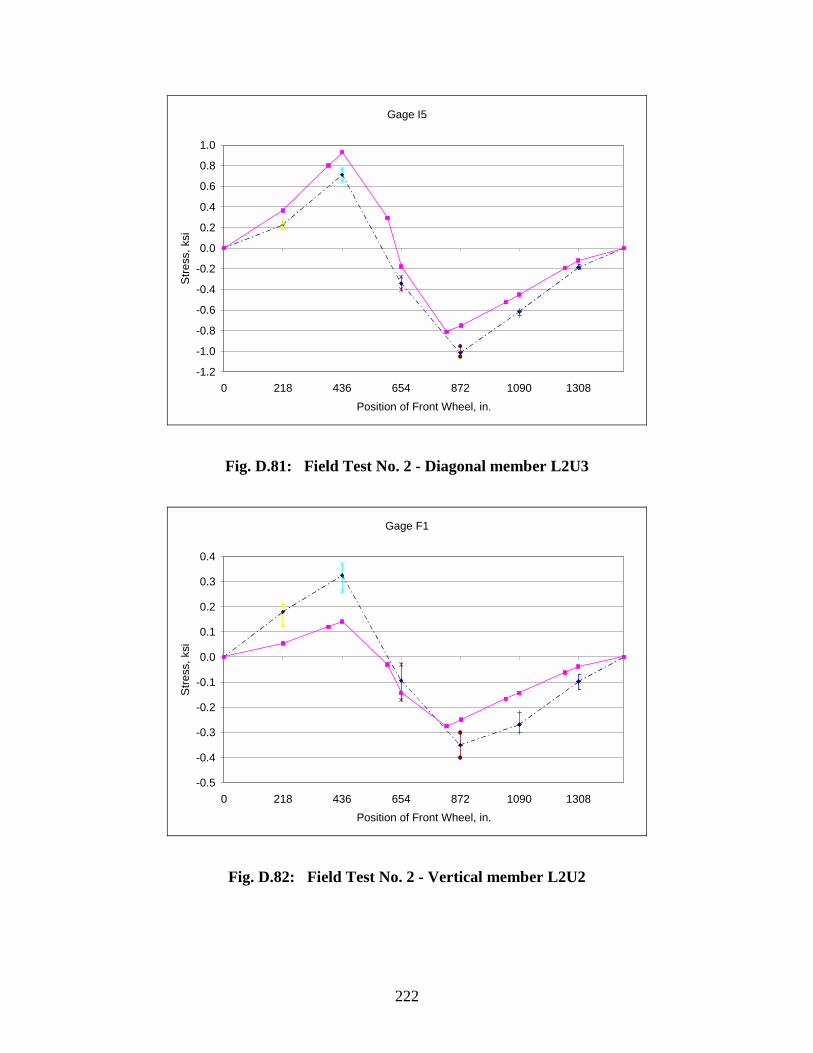
222
Gage I5
-1.2
-1.0
-0.8
-0.6
-0.4
-0.2
0.0
0.2
0.4
0.6
0.8
1.0
0 218 436 654 872 1090 1308Position of Front Wheel, in.
Stre
ss, k
si
Fig. D.81: Field Test No. 2 - Diagonal member L2U3
Gage F1
-0.5
-0.4
-0.3
-0.2
-0.1
0.0
0.1
0.2
0.3
0.4
0 218 436 654 872 1090 1308Position of Front Wheel, in.
Stre
ss, k
si
Fig. D.82: Field Test No. 2 - Vertical member L2U2
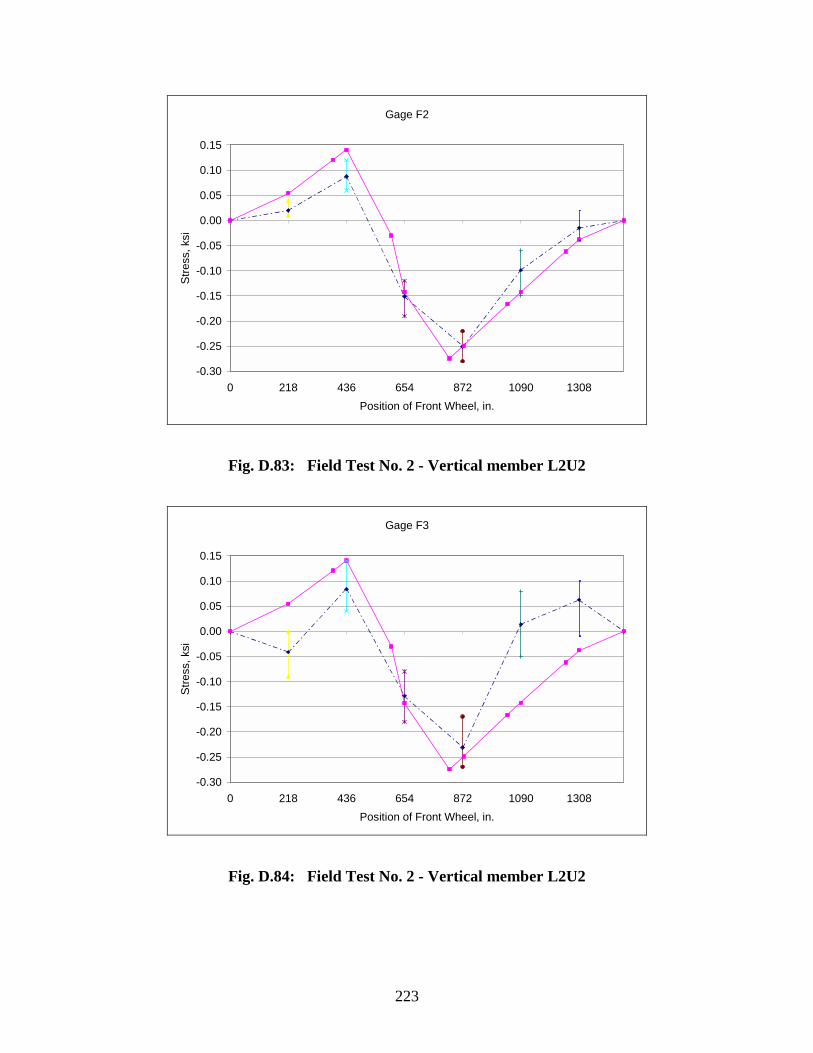
223
Gage F2
-0.30
-0.25
-0.20
-0.15
-0.10
-0.05
0.00
0.05
0.10
0.15
0 218 436 654 872 1090 1308Position of Front Wheel, in.
Stre
ss, k
si
Fig. D.83: Field Test No. 2 - Vertical member L2U2
Gage F3
-0.30
-0.25
-0.20
-0.15
-0.10
-0.05
0.00
0.05
0.10
0.15
0 218 436 654 872 1090 1308Position of Front Wheel, in.
Stre
ss, k
si
Fig. D.84: Field Test No. 2 - Vertical member L2U2
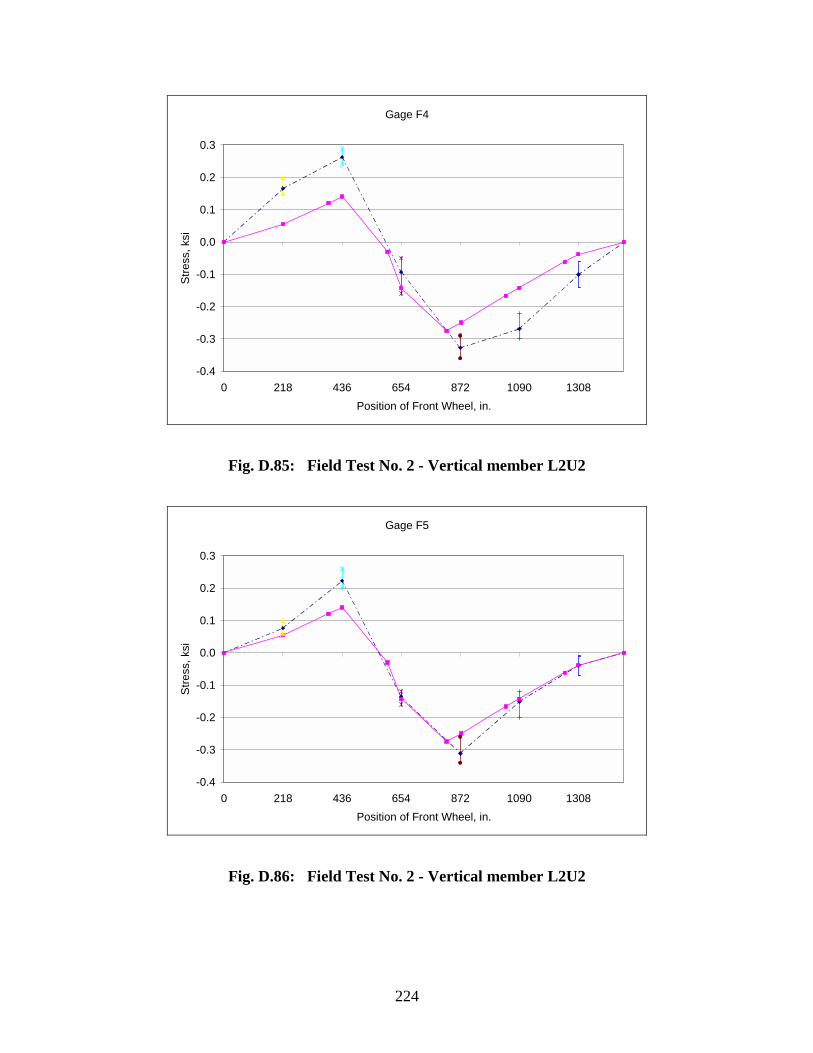
224
Gage F4
-0.4
-0.3
-0.2
-0.1
0.0
0.1
0.2
0.3
0 218 436 654 872 1090 1308Position of Front Wheel, in.
Stre
ss, k
si
Fig. D.85: Field Test No. 2 - Vertical member L2U2
Gage F5
-0.4
-0.3
-0.2
-0.1
0.0
0.1
0.2
0.3
0 218 436 654 872 1090 1308Position of Front Wheel, in.
Stre
ss, k
si
Fig. D.86: Field Test No. 2 - Vertical member L2U2
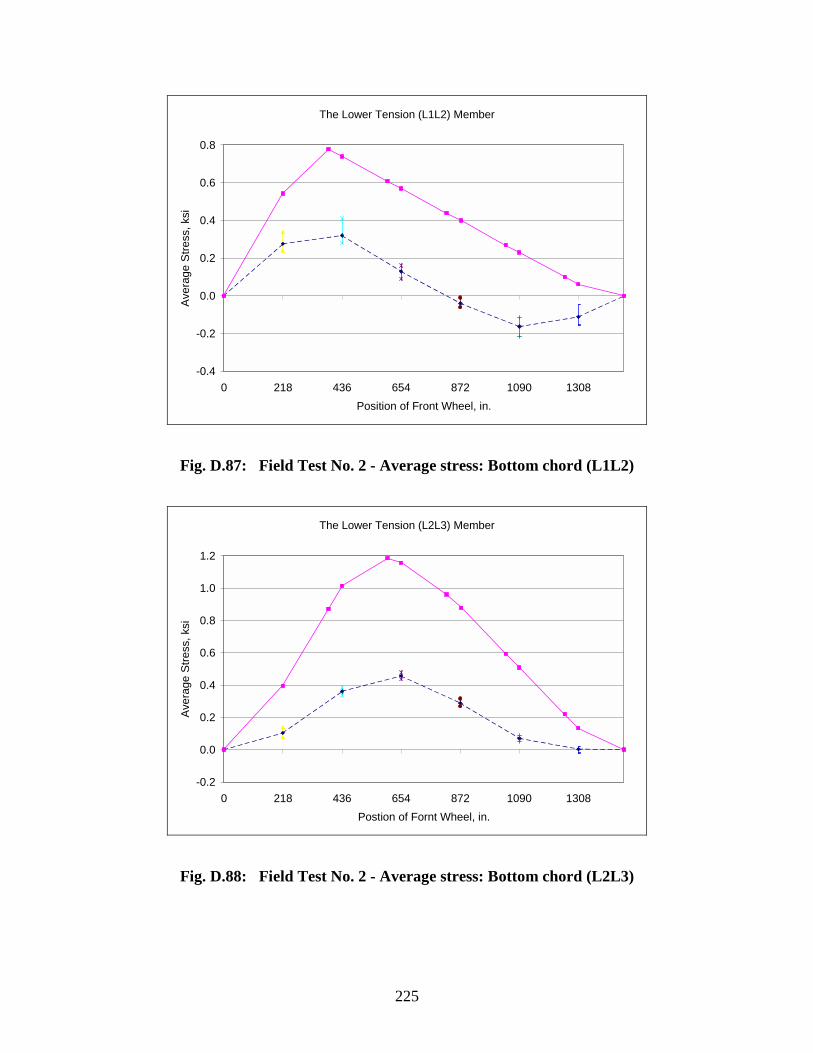
225
The Lower Tension (L1L2) Member
-0.4
-0.2
0.0
0.2
0.4
0.6
0.8
0 218 436 654 872 1090 1308Position of Front Wheel, in.
Aver
age
Stre
ss, k
si
Fig. D.87: Field Test No. 2 - Average stress: Bottom chord (L1L2)
The Lower Tension (L2L3) Member
-0.2
0.0
0.2
0.4
0.6
0.8
1.0
1.2
0 218 436 654 872 1090 1308Postion of Fornt Wheel, in.
Aver
age
Stre
ss, k
si
Fig. D.88: Field Test No. 2 - Average stress: Bottom chord (L2L3)
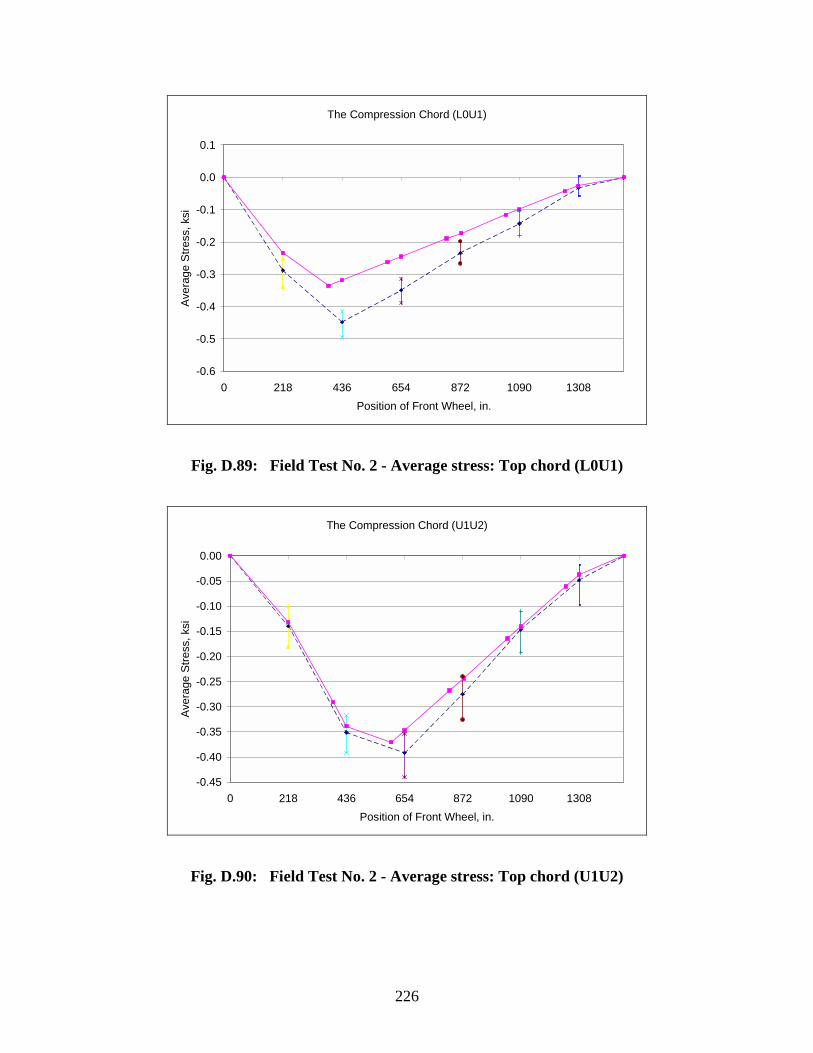
226
The Compression Chord (L0U1)
-0.6
-0.5
-0.4
-0.3
-0.2
-0.1
0.0
0.1
0 218 436 654 872 1090 1308Position of Front Wheel, in.
Aver
age
Stre
ss, k
si
Fig. D.89: Field Test No. 2 - Average stress: Top chord (L0U1)
The Compression Chord (U1U2)
-0.45
-0.40
-0.35
-0.30
-0.25
-0.20
-0.15
-0.10
-0.05
0.00
0 218 436 654 872 1090 1308Position of Front Wheel, in.
Aver
age
Stre
ss, k
si
Fig. D.90: Field Test No. 2 - Average stress: Top chord (U1U2)
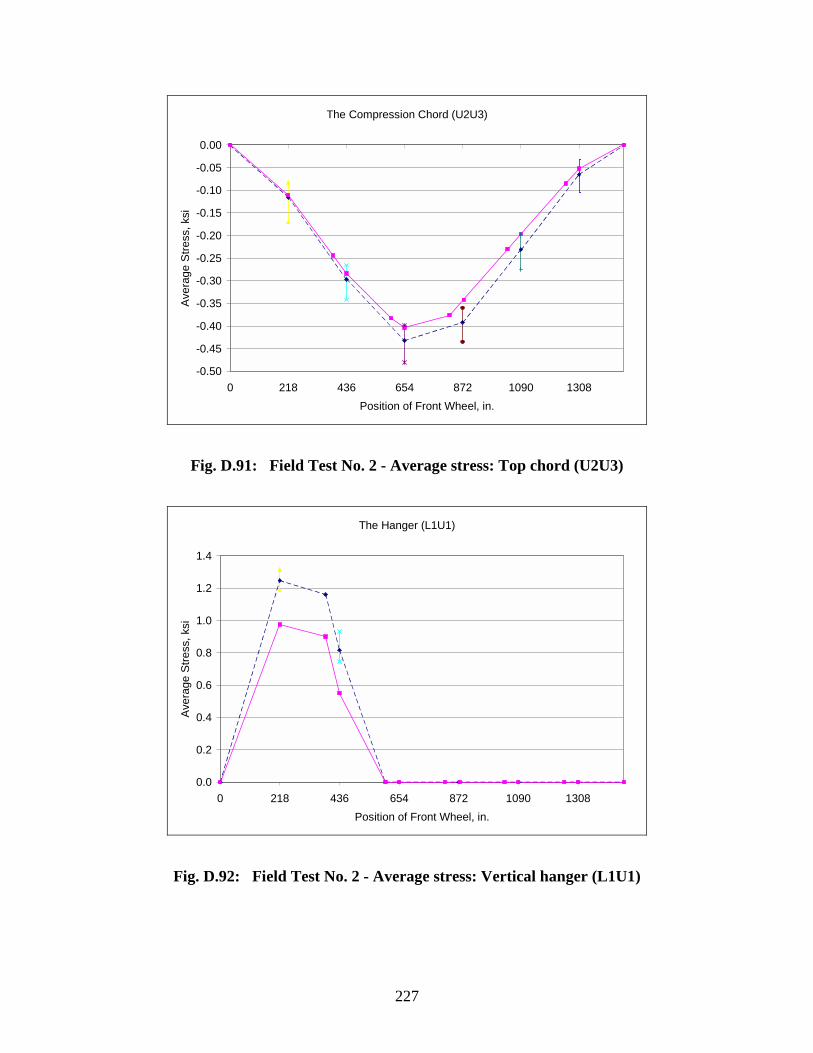
227
The Compression Chord (U2U3)
-0.50
-0.45
-0.40
-0.35
-0.30
-0.25
-0.20
-0.15
-0.10
-0.05
0.00
0 218 436 654 872 1090 1308Position of Front Wheel, in.
Aver
age
Stre
ss, k
si
Fig. D.91: Field Test No. 2 - Average stress: Top chord (U2U3)
The Hanger (L1U1)
0.0
0.2
0.4
0.6
0.8
1.0
1.2
1.4
0 218 436 654 872 1090 1308Position of Front Wheel, in.
Aver
age
Stre
ss, k
si
Fig. D.92: Field Test No. 2 - Average stress: Vertical hanger (L1U1)
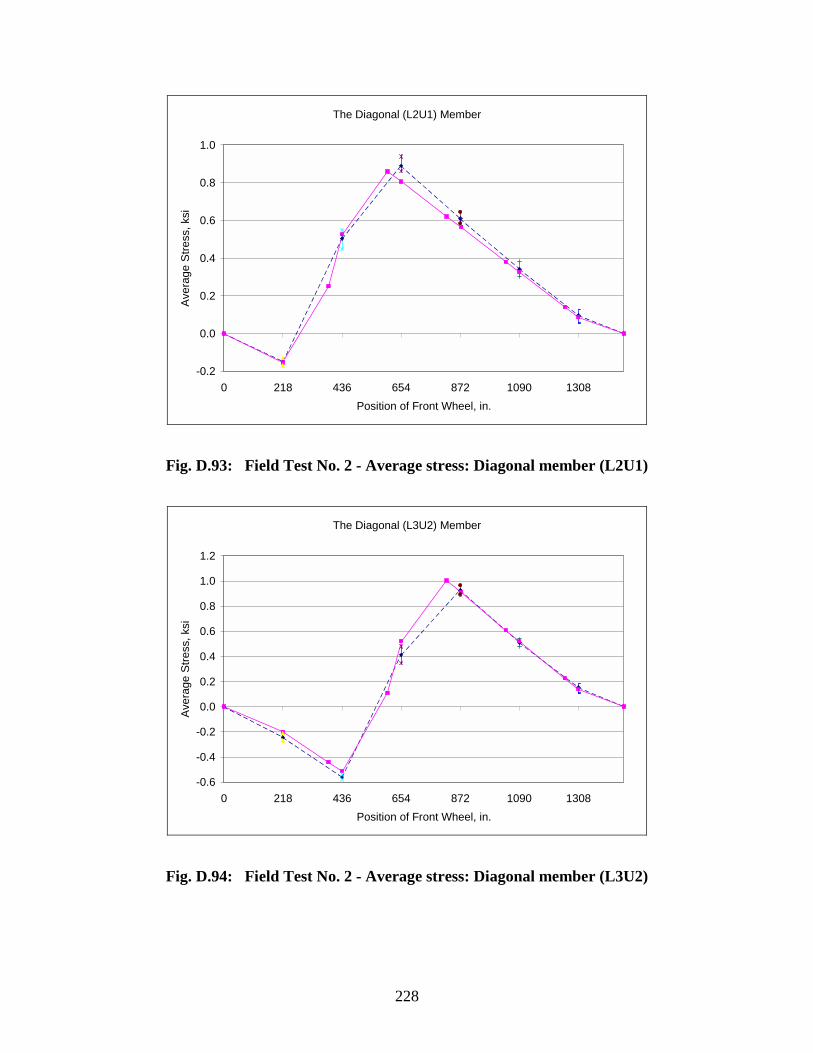
228
The Diagonal (L2U1) Member
-0.2
0.0
0.2
0.4
0.6
0.8
1.0
0 218 436 654 872 1090 1308Position of Front Wheel, in.
Aver
age
Stre
ss, k
si
Fig. D.93: Field Test No. 2 - Average stress: Diagonal member (L2U1)
The Diagonal (L3U2) Member
-0.6
-0.4
-0.2
0.0
0.2
0.4
0.6
0.8
1.0
1.2
0 218 436 654 872 1090 1308Position of Front Wheel, in.
Aver
age
Stre
ss, k
si
Fig. D.94: Field Test No. 2 - Average stress: Diagonal member (L3U2)
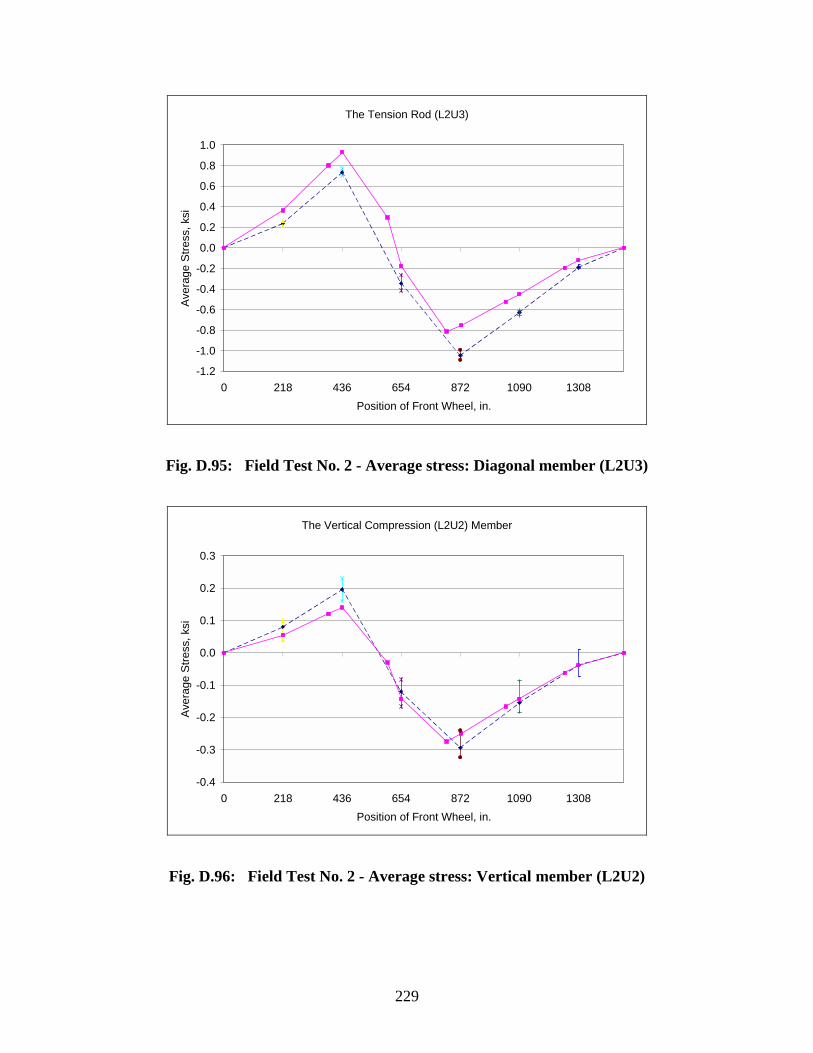
229
The Tension Rod (L2U3)
-1.2
-1.0
-0.8
-0.6
-0.4
-0.2
0.0
0.2
0.4
0.6
0.8
1.0
0 218 436 654 872 1090 1308Position of Front Wheel, in.
Aver
age
Stre
ss, k
si
Fig. D.95: Field Test No. 2 - Average stress: Diagonal member (L2U3)
The Vertical Compression (L2U2) Member
-0.4
-0.3
-0.2
-0.1
0.0
0.1
0.2
0.3
0 218 436 654 872 1090 1308Position of Front Wheel, in.
Aver
age
Stre
ss, k
si
Fig. D.96: Field Test No. 2 - Average stress: Vertical member (L2U2)
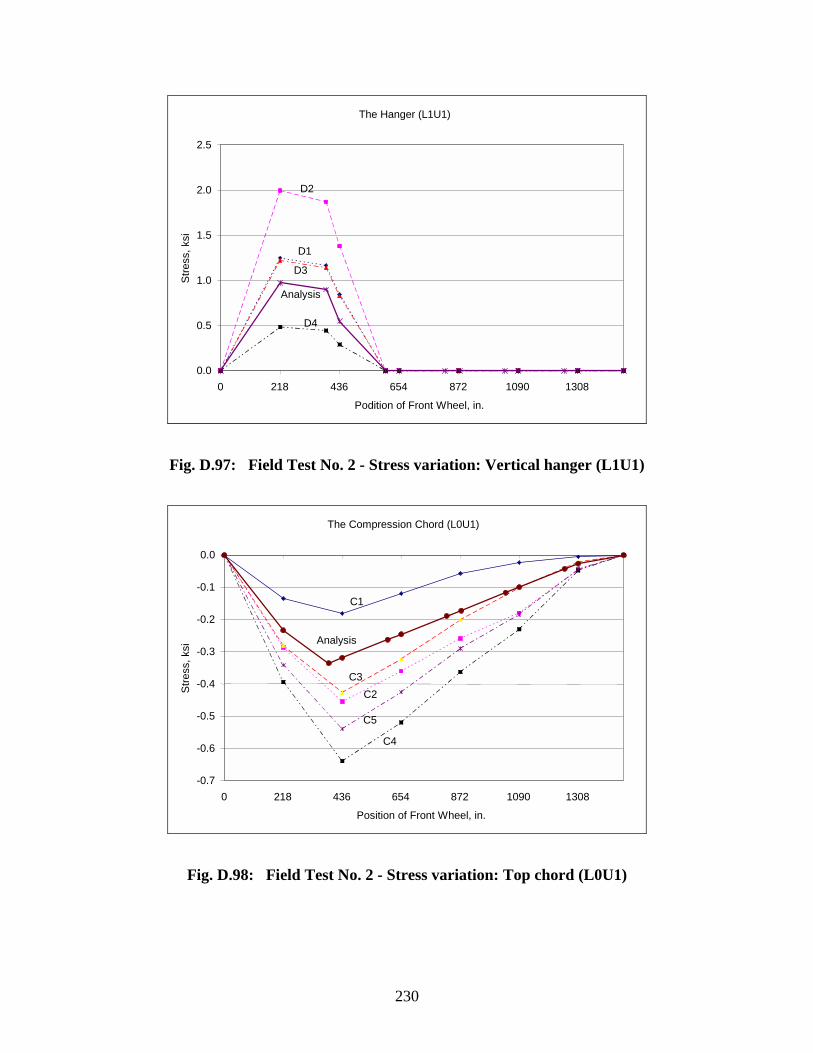
230
The Hanger (L1U1)
0.0
0.5
1.0
1.5
2.0
2.5
0 218 436 654 872 1090 1308
Podition of Front Wheel, in.
Stre
ss, k
si
D1
D2
D3
D4
Analysis
Fig. D.97: Field Test No. 2 - Stress variation: Vertical hanger (L1U1)
The Compression Chord (L0U1)
-0.7
-0.6
-0.5
-0.4
-0.3
-0.2
-0.1
0.0
0 218 436 654 872 1090 1308
Position of Front Wheel, in.
Stre
ss, k
si
C1
C2C3
C4
C5
Analysis
Fig. D.98: Field Test No. 2 - Stress variation: Top chord (L0U1)


![0 Engelhardt FIRST HALF - ppt[1] [Lecture seule]€¦ · Richard A Engelhardt Regional Advisor for Culture in Asia and the Pacific UNESCO UNESCO Expert Symposium on Arts Education](https://img.pdfslide.us/doc/110x75/5fa613d7c2a7be403a72f211/0-engelhardt-first-half-ppt1-lecture-seule-richard-a-engelhardt-regional-advisor.jpg)