Embed Size (px)
Citation preview

EVALUATING TRANSPORTATION ALTERNATIVES

The term evaluation is used in planning and engineering to refer to the merits of alternative proposals. The essence of evaluation is the assessments of the comparative merits of different courses of action. One of these actions may include the “do nothing” alternative.

EVALUATION OF ALTERNATIVES
• Impact Assessment• Equity• Economic Efficiency• Financial Feasibility• Legal and Administrative Feasibility• Sensitivity of Findings to Uncertainties and Value-Laden Assumptions

ECONOMIC AND FINANCIAL CONCEPTSTime Value of Money• Discount Rate. The appropriate discount rate is an estimate of the average rate of return that is expected on private investment before taxes and after inflation. This interpretation is based on the concept that the alternative to the capital investment by government is to leave the capital in the private sector.
• Inflation Rate. Inflation can be ignored in performing most aspects of the basic economic evaluation if the evaluation is prepared in present value terms, since inflation has no effect on present values. However, if the costs used are out of date, they should be adjusted to a more current year.

ANALYSIS TECHNIQUESThe objective of economic evaluation analysis techniques is to provide sufficient summary information to decision makers and interest groups to do the following;1.Determine whether the costs of improvements are justified by the anticipated benefits (i.e. whether a proposed improvement is superior to doing nothing).2.Make comparative overall assessments of different alternative improvements with each other.3.For large-scale, costly improvements, it may also be necessary to assess the distribution of benefits and costs among those affected by the improvement, such as user cost, operator cost, and societal cost.

Economic Evaluation Method (Efficiency Analysis)
Four common methods of evaluating transportation projects:(1)Net present worth (NPW),(2)Equivalent uniform annual cost (EUAC),(3)Internal rate of return (ROR), and(4)Benefit-cost (B/C) analysis.
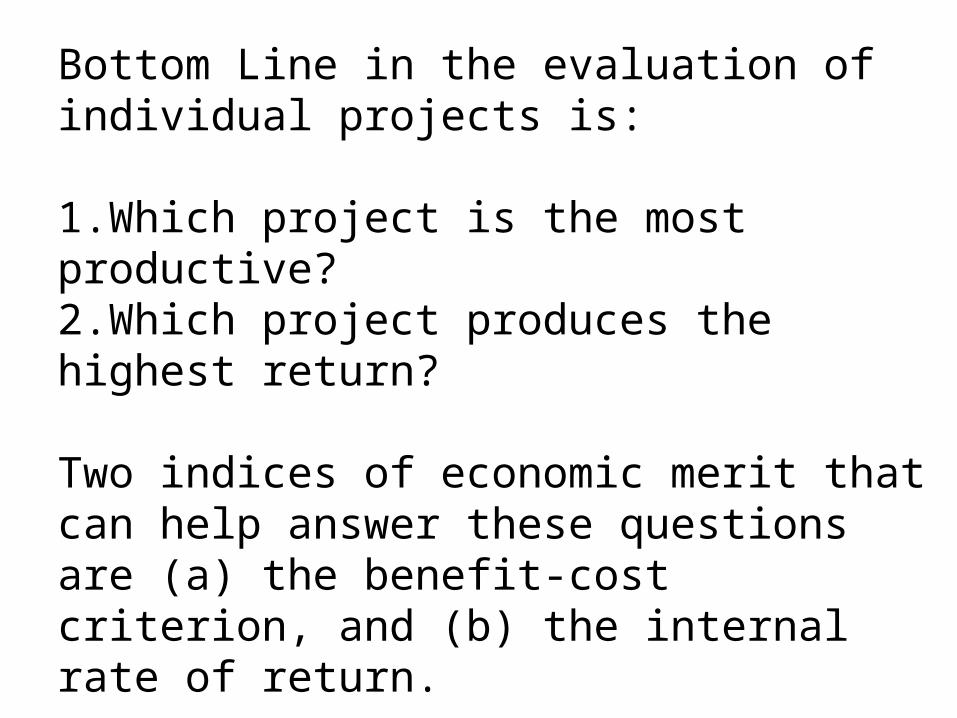
Bottom Line in the evaluation of individual projects is:
1.Which project is the most productive?2.Which project produces the highest return?
Two indices of economic merit that can help answer these questions are (a) the benefit-cost criterion, and (b) the internal rate of return.

Present Worth of a Single Payment F, n years from now, with a discount rate of i is
The Present Worth of a Uniform Series of equal annual payments is the sum of the present worth of each cost, here A is the equivalent uniform annual cost (EUAC). The term in brackets is known as the Present Worth Uniform Series factor.
Also,
The term in brackets is called the capital recovery factor.
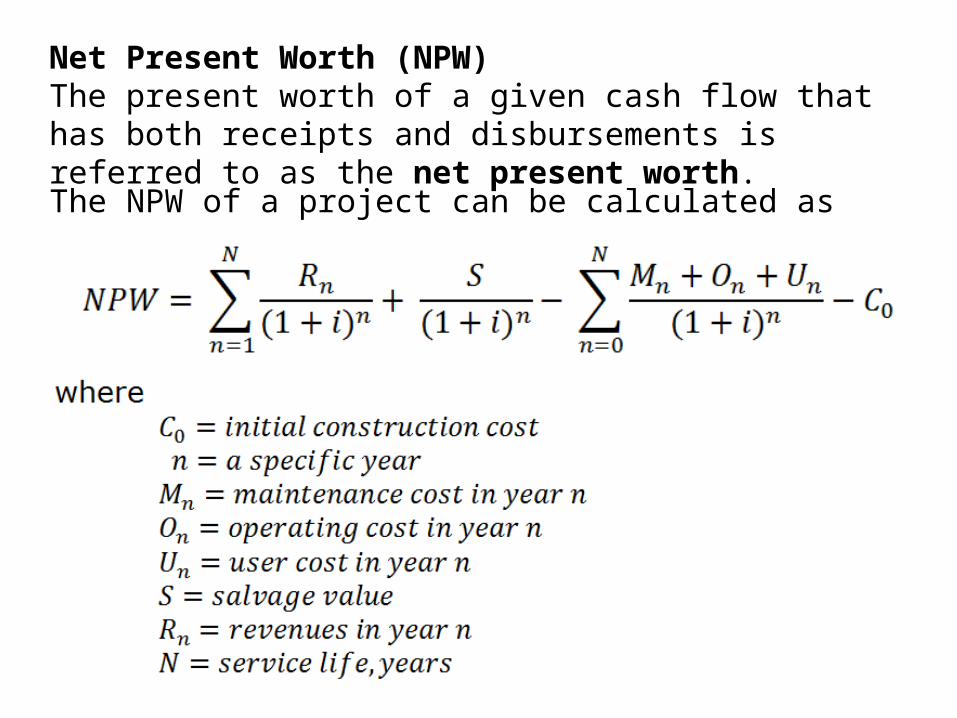
Net Present Worth (NPW) The present worth of a given cash flow that has both receipts and disbursements is referred to as the net present worth.
The NPW of a project can be calculated as

Example: Three alternatives are being considered for improving a street intersection. The annual dollar savings on account of the improvement is shown. Assume that the intersection will last for 25 years and the interest rate is 5%. It is assumed that each of the three improvements is mutually exclusive but provides similar benefits.
9
Solve the problem using (a) NPW, (b) EUAC, and (c) ROR.

Solution:NPW method: Use the net present worth factor for uniform series
NPW(A) = -10,000 + (800 x 14.094) = $1275.2
NPW(B) = -12,000 + (1000 x 14.094) = $2094.0
NPW(C) = -19,000 + (1400 x 14.094) = $731.6
Therefore, select alternative B with the highest net present worth.

EUAC method: Use the capital recovery factor (CRF)
EUAC(A) = -(10,000 x .07095) + 800 = 90.50EUAC(B) = -(12,000 x .07095) + 1000 = 148.60EUAC(C) = -(19,000 x .07095) + 1400 = 51.95
Alternative B has the highest EUAC and should be selected.

ROR method: Compare the ROR figure with the “do-nothing” alternative.
NPW(A) = -10,000 +(800)(P/A, i, 25yr) = 0(P/A, i, 25yr) = 10,000/800 = 12.5 = > i = 6.25%
NPW(B) = -12,000 +(1000)(P/A, i, 25yr) = 0(P/A, i, 25yr) = 12,000/1000 = 12 = > i = 6.7%
NPW(C) = -19,000 +(1400)(P/A, i, 25yr) = 0(P/A, i, 25yr) = 19,000/1400 = 13.57 = > i = 5.77%
Alternative B is the least of the three because the rate of return is the highest (and, of course, higher than 5%, so better than the “do-nothing” alternative).

Example:The Metro Manila Development Authority (MMDA) is considering three improvement plans for a heavily traveled intersection in Metro Manila. The intersection improvement is expected to achieve three goals: improve travel speeds, increase safety, and reduce operating expenses for motorists. The annual dollar value of savings compared with existing conditions for each criterion as well as additional construction and maintenance costs is shown in Table 1. If the life of the road is considered to be 50 years and the discount rate is 3%, which alternative should be selected? Solve the problem using (a) NPW, (b) EUAC, (c) BCR, and (d) ROR. Values are in pesos.
Table 1

Solution:1. Compare the NPW of each project.
NPWI = -9250000 + (-75000 + 250000 + 150000 + 25000)(P/A, 3%, 50yr) = -9250000 + 350000(25.729) = -9250000 + 9005150 = -244850
NPWII = -11000000 + (-125000 + 250000 + 325000 + 25000)(P/A, 3%, 50yr) = - 11000000 + 475000(25.729) = -11000000 + 12221275 = 1221275
NPWIII = -15500000 + (-150000 + 350000 + 300000 + 140000)(P/A, 3%, 50yr) = -15500000 + 640000(25.729) = -15500000 + 16466560 = 966560
Therefore the project with the highest NPW is Alternative II.
(P/A, 3%, 50yr)

Solve by the EUAC method. Note (A/P, 3%, 50yr) = 1/25.729 = 0.03887
EUACI = -9250000(A/P, 3%, 50yr) – 75000 + 250000 + 150000 + 25000 = -9250000(.03887) + 350000 = -9547.5
EUACII = -11000000(A/P, 3%, 50yr) – 125000 + 250000 + 325000 + 25000 = -11000000(.03887) + 475000 = 47430
EUACIII = -15500000(A/P, 3%, 50yr) – 150,000 + 350,000 + 300,000 + 140,000 = -15500000(.03887) + 640,000 = 37515
Therefore the project with the highest EUAC is Alternative II, which is as expected since EUAC = NPW (.03887)

Solve by the BCR method
Step 1. Compared the BCR of Alternative I with respect to do nothing (DN)
BCRI/DN = 9005150/9250000 = 0.974
Since BCRI/DN is less than 1, we would not build alternative I
Step 2. Compare BCR of Alternative Ii with respect to DN
BCRI/DN = 12221275/11000000 = 1.111
Since BCR > 1, we would select Alternative II over DN.
Step 3. Compare BCR of Alternative III with respect to Alternative II.
BCRIII/II = (16466560 – 12221275)/(15500000 – 11000000) = 4245285/4500000 = 0.943
Since BCR is less than 1, we would not select Alternative III, which is to select Alternative II.
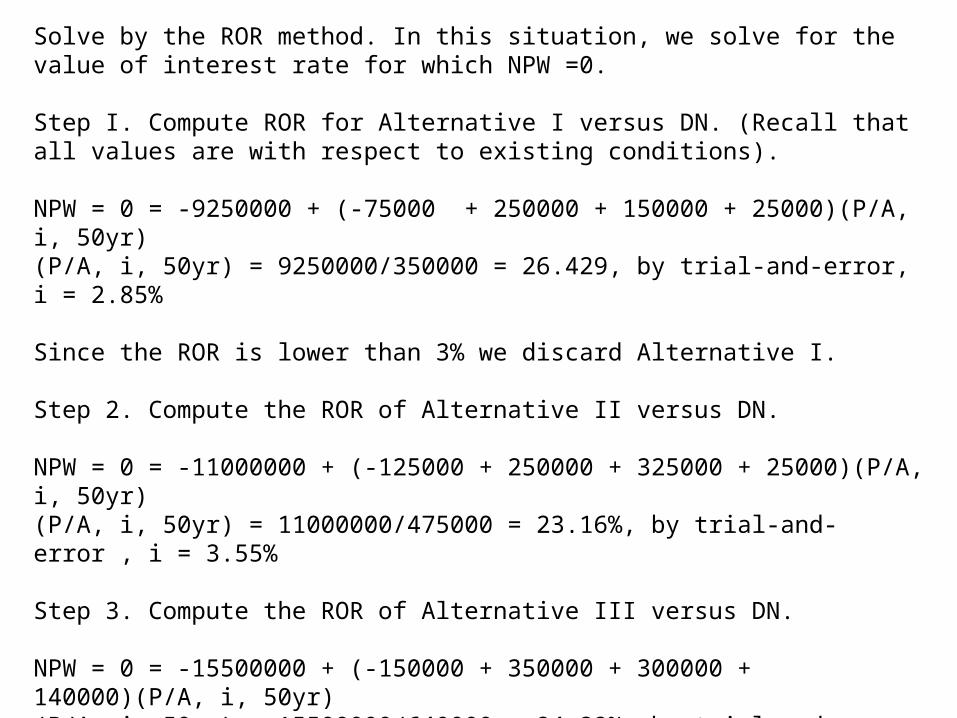
Solve by the ROR method. In this situation, we solve for the value of interest rate for which NPW =0.
Step I. Compute ROR for Alternative I versus DN. (Recall that all values are with respect to existing conditions).
NPW = 0 = -9250000 + (-75000 + 250000 + 150000 + 25000)(P/A, i, 50yr)(P/A, i, 50yr) = 9250000/350000 = 26.429, by trial-and-error, i = 2.85%
Since the ROR is lower than 3% we discard Alternative I.
Step 2. Compute the ROR of Alternative II versus DN.
NPW = 0 = -11000000 + (-125000 + 250000 + 325000 + 25000)(P/A, i, 50yr)(P/A, i, 50yr) = 11000000/475000 = 23.16%, by trial-and-error , i = 3.55%
Step 3. Compute the ROR of Alternative III versus DN.
NPW = 0 = -15500000 + (-150000 + 350000 + 300000 + 140000)(P/A, i, 50yr)(P/A, i, 50yr) = 15500000/640000 = 24.22%, by trial-and-error, i = 3.3%
Alternative II is the least of the three because the rate of return is the highest at 3.55% (and, of course, higher than 3%, so better than the “do-nothing” alternative).

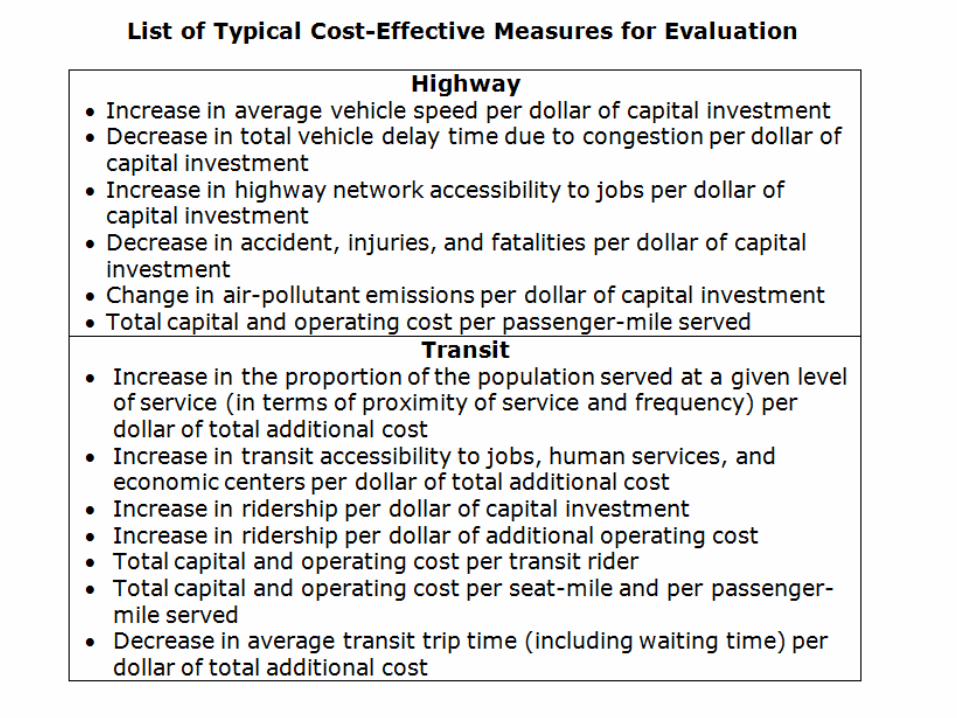
COST-EFFECTIVENESS ANALYSIS
Cost-Effectiveness is a strategy for making decisions rather than establishing a decision rule.
In cost-effectiveness analysis, the characteristics of each alternative are separated into two categories: (1) costs and (2) measures of effectiveness.

COSTCost are defined in terms of all the resources necessary for the design, construction, operation, and maintenance of the alternative.
Cost can be considered in monetary or other units.
EFFECTIVENESSEffectiveness is the degree to which an alternative achieves its objective.

Cost-effectiveness analysis arose out of a recognition that it is frequently difficult to transform all major impact measures into monetary terms in a credible manner, and that important evaluation factors can often be stated in more meaningful measures than dollar costs.
The method should be used when pre-established requirements exist regarding the improvement.
These requirements seek to establish the minimum investment (input) required for the maximum performance (output) among several alternative improvements.

Example:Pedestrian (including a large number of schoolchildren) need a transportation facility to connect their community across a six-lane freeway by means of a footbridge over the freeway or a tunnel under the freeway. The objectives of the project are (1) to provide a safe and efficient system for crossing the freeway, and (2) to maintain and improve (if possible) the visual environment of the neighbourhood. The table gives the construction and operating costs of the two alternatives. Annual costs are computed using a 25-year service life and an 8% interest rate. It is anticipated that about 5000 pedestrians will use either of the two facilities each day.

Solution:
• The annual difference in cost is $9,618.• The average cost per pedestrian per trip using the bridge is 9468/(5000 x 465) = 0.52 cent• While using the tunnel it is 19086/(5000 x 365) = 1.05 cents
The performance of the two alternatives may be summarized as follows:1.The tunnel would need long, steep grades and may cause inconvenience to the elderly and handicapped. On the other hand, the bridge will be provided with stairs at either end, and this will eliminate its use by the elderly and handicapped. If ramps are to be provided, long steep grades would have to be provided at three times the cost of the bridge with stairs.2.The tunnel is safer than the footbridge during the long winter months.3.From the point of view of aesthetics, the tunnel is preferred to the footbridge.4.It is possible to predict that the tunnel would be safer than the bridge.

Example:A city is considering eight different minibus network configurations, which are mutually exclusive. The only objective is to adopt a configuration that will maximize the number of potential riders in that sector of the city. The city has established a minimum number of potential riders that the alternative will serve and also maximize the amount of money it is willing to spend. Figure 15-4 shows the results of the analysts.
Comments:• Alternatives 1, 7, and 8 do not qualify under the criteria set.• Alternative 5 would be the one that serves the maximum number of users.

Multicriteria Evaluation Method
• In transportation planning process, one usually is dealing with many objectives (or criteria) that reflect the interests of the community.• To incorporate several, often conflicting, objectives (or criteria) systematically, planners have developed methods to tackle this situation and one of these methods is the multicriteria evaluation method.

Example: Multicriteria Evaluation Method
The city of Athens, Greece, is considering the improvement of its transportation systems by adopting the following mutually exclusive alternatives: (1) a bus-only system, (2) a light-rail system, (3) a bus + heavy rail system, and (4) a subway system. The city (elected officials and citizens) has recently identified and adopted the following goals and objectives for this improvement project:1.The alternatives must reduce congestion in the city by capturing the maximum number of commuters in the peak hour.2.The air-pollution and noise level should be reduced to tolerable acceptance levels through this improvement.3.The total net revenue to the city should be maximized by adopting one of the alternatives.4.The rate of deaths and injuries due to accidents should be reduced by at least 50% by adopting one of the alternatives.5.The alternative chosen should cover the maximum area of the city and should be equitable to all patrons.
The alternatives prepared by consultants to the city are acceptable in principle. However, they all differ in quality, cost, alignment, coverage, and so on. City planners have formulated the following measures of effectiveness for each objective:

• Objective 1: percentage reduction of motor vehicles on main arterials and corridors of the city• Objective 2: percentage reduction of pollution• Objective 3: net annual revenue/annual capital cost• Objective 4: probable accident rate/million trips• Objective 5: square mile covered by the proposed network (0.25 mile on either end of line)
Note that each alternative has been assigned a figure representing a particular measure of effectiveness.

• If these highest scores are matched to the corresponding relative weighting factor, one can erect another matrix, as shown. The city’s elected officials (through brainstorming methods and Delphi techniques) have allocated weights on a 10-point scale to each objective as indicated:
This assignment of weights is subjective, but it is one way of assessing the collective opinion of a large group of people who are affected positively (or negatively) by the proposed implementation of the chosen alternative.

• Next, planners, engineers, sociologists, economists, and estimators set about collecting data and costs for assigning values to each alternative, as shown in the following matrix. • This step is the most crucial and involves a lot of work in gathering appropriate data.
• It is obvious from the column that the light-rail system and the bus + heavy-rail system each score 81 points and can be declared as winners in comparison to the other two alternatives.

• It is natural that these two alternatives will be subjected to further detailed scrutiny and analysis before a final winner is declared.• If these two top-ranking alternatives are examined by an investigating team who perform an environmental impact study, it is quite possible that a more calculated decision can be taken.•This example illustrates the difficulty in considering situations involving multicriteria applications, because the outcome is sensitive to the weights assigned to the criteria.

Benefit-Cost Analysis• Public expenditure decisions are generally evaluated using benefit-cost analysis.
Example:An existing highway is 20 miles long connecting two small cities. It is proposed to improve the alignment by constructing a highway 15 miles long costing $500,000 per mile. Maintenance costs are likely to be $10,000 per mile per year. Land acquisition costs run $75,000 per mile. It is proposed to abandon the old road and sell the land for $10,000 per mile. Money can be borrowed at 8% per annum. It has been estimated that passenger vehicles travel at 35 mph at a cost of 20 cents per mile with a car occupancy of 1.5 persons per car. What should be the traffic demand for this new road to make the project feasible if the cost of the time of the car’s occupants is assessed at $10 per hour?
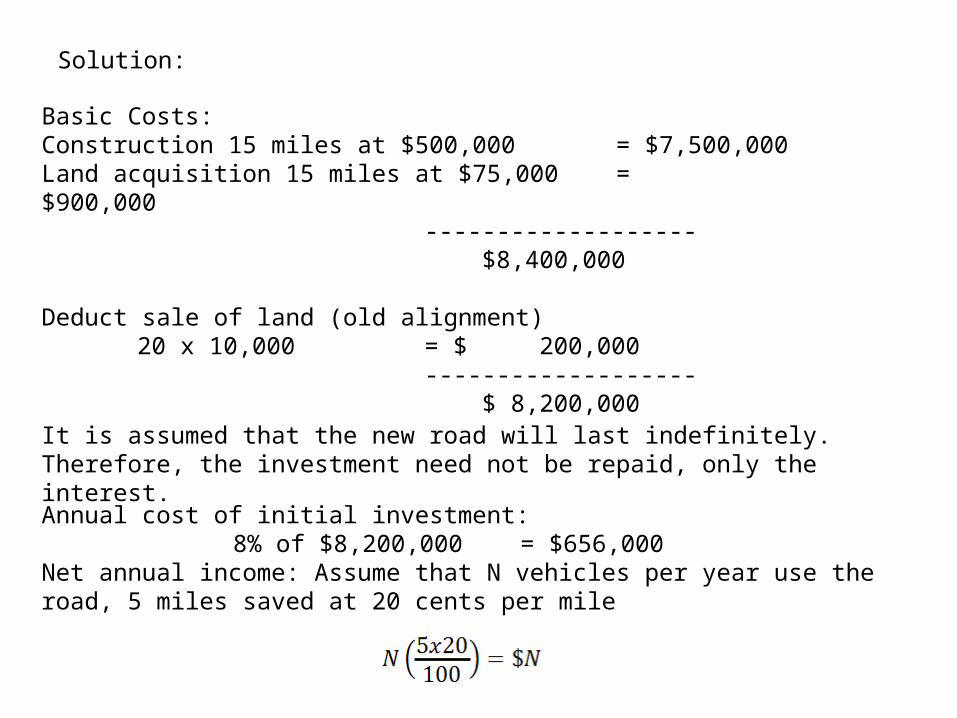
Solution:
Basic Costs:Construction 15 miles at $500,000 = $7,500,000Land acquisition 15 miles at $75,000 = $900,000
------------------- $8,400,000
Deduct sale of land (old alignment)20 x 10,000 = $ 200,000
------------------- $ 8,200,000
It is assumed that the new road will last indefinitely. Therefore, the investment need not be repaid, only the interest.
Annual cost of initial investment:8% of $8,200,000 = $656,000
Net annual income: Assume that N vehicles per year use the road, 5 miles saved at 20 cents per mile
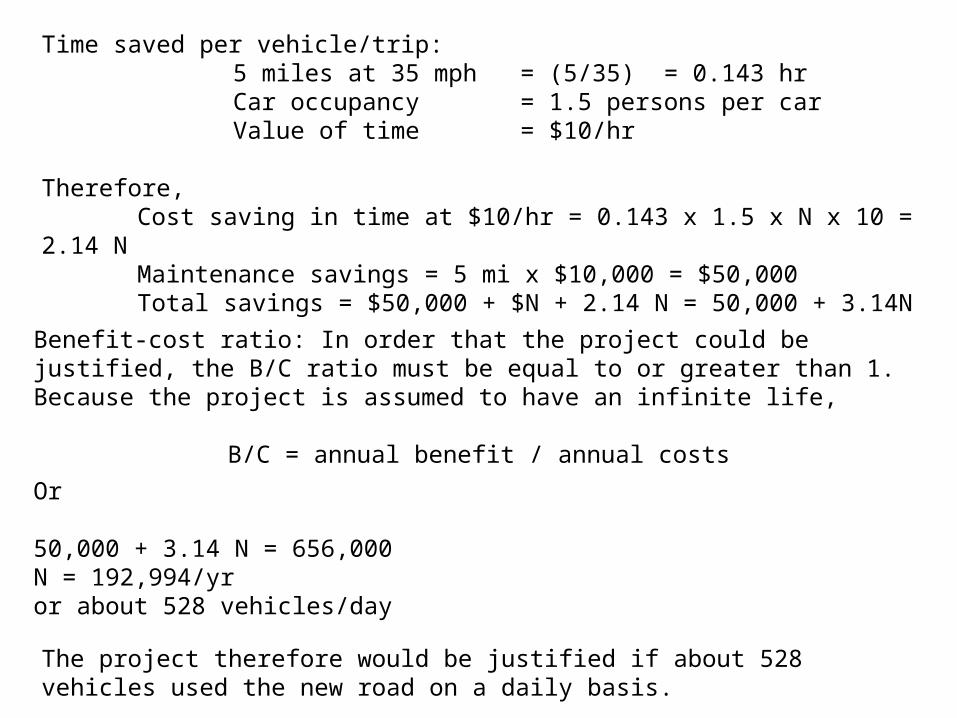
Time saved per vehicle/trip:5 miles at 35 mph = (5/35) = 0.143 hrCar occupancy = 1.5 persons per carValue of time = $10/hr
Therefore,Cost saving in time at $10/hr = 0.143 x 1.5 x N x 10 = 2.14 NMaintenance savings = 5 mi x $10,000 = $50,000Total savings = $50,000 + $N + 2.14 N = 50,000 + 3.14N
Benefit-cost ratio: In order that the project could be justified, the B/C ratio must be equal to or greater than 1. Because the project is assumed to have an infinite life,
B/C = annual benefit / annual costs
Or
50,000 + 3.14 N = 656,000N = 192,994/yror about 528 vehicles/day
The project therefore would be justified if about 528 vehicles used the new road on a daily basis.

Further Discussion:
The following points should be noted regarding this problem:1.The social costs of land use have not been considered. For example, the land on either side of the old road would decrease in value, whereas the land adjacent to the new route would increase in value. The net result would raise the value of N.
2. When one works out the B/C ratio, it is generally advisable to
use total benefits and total costs. In this problem, B/C was assumed to be 1 and is therefore permissible.

The Willingness-to-Pay Concept
• The willingness-to-pay concept is useful in visualizing the view point of users of a system, such as a bridge or a toll road.• In the case of a single-service variable, as shown in Figure 15-6(a), if DD is the demand and the price (p0 changes from p1 to p2, there will be a corresponding change in volume (v) from v1 to v2.• The (v1 – v2) users who abandoned the system are those who got just enough benefit from the system at price p1 to use it.

• If we consider Figure 15-6(b) using the same argument, reducing the price from p0 to p1 increases the number of users from v0 to v1. there are three alternative views on the method of measuring the amount of benefit to users.
1.Gross-benefit view
Total benefit to users = (E) + (A) + (D), when = v0
Total benefit to users = (E) + (A) + (D) + (B) + (C) , for v1
Difference between the two actions = (B) + (C)
2. Consumer surplus view: it is the amount of benefit received by users beyond what they actually pay = (A) + (B)
3. User-cost view = (A) – (C)

APPROXIMATION
Gross benefit B + C = (1/2)(p0 + p1)(v1 – v0)
Consumer surplus A + B = (1/2)(p0 – p1)(v1 + v0)
User cost A – C = v0p0 – v1p1
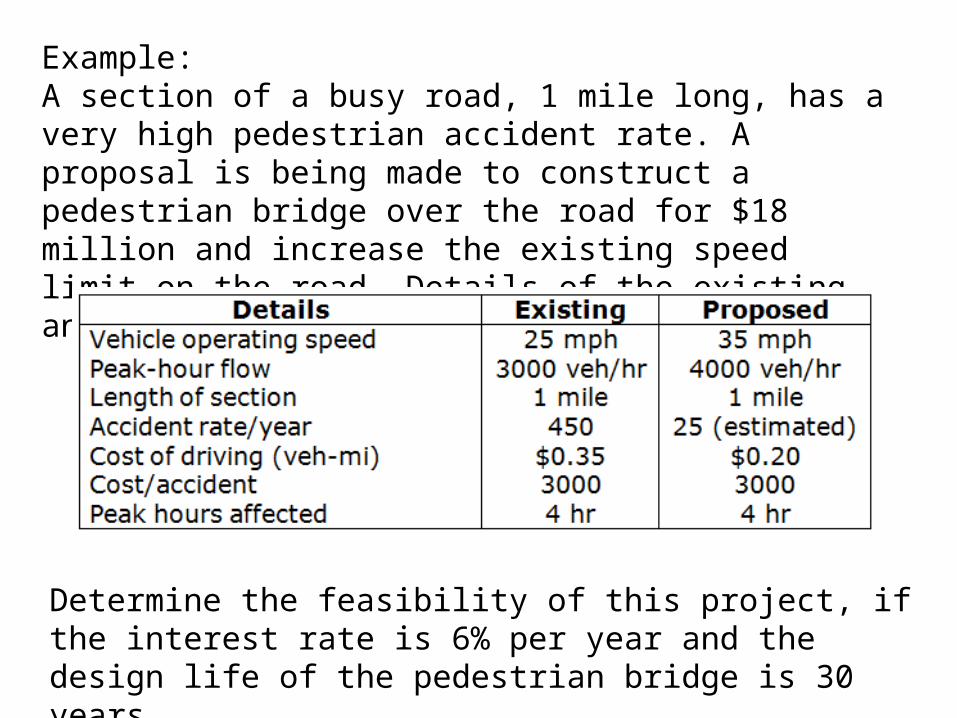
Example:A section of a busy road, 1 mile long, has a very high pedestrian accident rate. A proposal is being made to construct a pedestrian bridge over the road for $18 million and increase the existing speed limit on the road. Details of the existing and proposed conditions are as follows:
Determine the feasibility of this project, if the interest rate is 6% per year and the design life of the pedestrian bridge is 30 years.

Solution:The direct benefits derived from the construction of the pedestrian bridge can be determined by applying the concept of consumer surplus. The following analysis shows the gain in consumer surplus.
Existing price = $0.35/veh-mi x 1 mi = $0.35/vehProposed price = $0.20/veh-mi x 1 mi = $0.20/veh
Annual number of users:Existing: 3000 veh/hr x 4 hr/day x 365 days = 4.38 million veh/yrProposed: 4000 veh/hr x 4 hr/day x 365 days = 5.84 million veh/yr
Consumer surplus as annual savings:= 0.5(0.35 – 0.20)(4.38 + 5.84)million = $0.7665 million/yrAnnual savings from accident reduction = 3000(450 – 25) = $1.275 million/yr
Total benefits = $2.0415 million/yr
NPW factor @ 6% for 30 years = 13.7649 NPW = ($2.0415 million x 13.7649) – 18 = $10.1041 million
Because the NPW of this project is greater than zero, the pedestrian project is sound.