Embed Size (px)
Citation preview

Evaluating the Vulnerability of Boston’s Inner Harbor
Designated Port Areas to Sea Level Rise and Coastal Storms
An Interactive Qualifying Project Report
Submitted to the Faculty of the
WORCESTER POLYTECHNIC INSTITUTE
in partial fulfillment of the requirements for the
Degree of Bachelor of Science
This report represents the work of four WPI undergraduate students submitted to the faculty as evidence of completion
of a degree requirement. WPI routinely publishes these reports on its website without editorial or peer review. For more
information about the projects program at WPI, please see: http://www.wpi.edu/Academics/Projects
Written By: Submitted To:
Jacob Bouchard (PH) Professor Seth Tuler, Worcester Polytechnic Institute
Austen Crawford (CE) Professor Jennifer deWinter, Worcester Polytechnic Institute
Caroline Warchol (CH) Jill Valdes Horwood, Boston Harbor Now
Kyle Whittaker (ME)

i
Abstract
As climate change raises sea levels (SLR) and exacerbates storm surges, the frequency
and severity of coastal flooding will increase. Boston’s shoreline is increasingly vulnerable to
flooding. Industries in the Designated Port Areas (DPAs) of Boston Harbor pose risks to public
health and the environment because of toxic chemicals used and stored on-site. The goal of this
project was to assess the vulnerability of DPAs in Boston harbor to SLR and coastal storms. We
evaluated three different aspects of vulnerability: exposure, sensitivity, and ability to cope on 18
different sites within four of Boston’s DPAs. Our report highlights the need for more systematic
evaluation and planning by stakeholders to mitigate the risks associated with flooding due to
SLR and coastal storm surge.

ii
Acknowledgements
We would like to thank the following people and organizations for making this project
possible:
Boston Harbor Now
Jennifer deWinter, Worcester Polytechnic Institute
Lisa Berry Engler, Massachusetts Coastal Zone Management
Jill Valdes Horwood, Boston Harbor Now
Paul Kirshen, University of Massachusetts Boston
Steve Lehmann, NOAA
Massachusetts Coastal Zone Management
MassDOT
Massachusetts Emergency Management Agency
Dan Ryan, Channel Fish Co.
Seth Tuler, Worcester Polytechnic Institute
Sarah White, Massachusetts Emergency Management Agency
We would like to extend a special thank you to our advisors Seth Tuler and Jennifer deWinter for
providing guidance and support. We would also like to thank Jill Valdes Horwood and the rest of
Boston Harbor Now for encouraging us and providing us with insight and experience.

iii
Executive Summary
The goal of this project was to assess the vulnerability of Designated Port Areas in
Boston Harbor to sea level rise and coastal storms. Boston is notably vulnerable to flooding
events because of its proximity to three rivers and its position on the Atlantic Coast. Since 1991
the City of Boston has experienced 21 flooding events that have triggered federal or state disaster
declarations (Climate Ready Boston, 2016, P. 2). Over the entire twentieth century sea levels
rose about 9 inches relative to land in Boston (Climate Ready Boston, 2016, P. 8). With the pace
of relative sea levels rise accelerating, by 2030 another eight inches of sea level rise may
occur, and as much as 3 ft. by 2070 (City of Boston Hazard Mitigation Plan, 2014). Severe
flooding in Boston could result in damage to infrastructure, public health, environment and the
economy (City of Boston, 2014). The Boston Hazard Mitigation Plan states that “In Boston,
Massachusetts, the increase in flooding caused by sea level rise this century could cost up to $94
billion from damage to buildings, loss of building contents, and associated emergency activities,
depending on the amount of sea level rise and adaptation measures taken” (US EPA, n.d.). Areas
within Boston Harbor will continue to have accelerated rates of vulnerability unless precautions
are implemented to protect the coast from the effects of sea level rise.
Since 2007 Boston has maintained a climate action plan which details measures the city
has taken, and intends to take, in order to mitigate the impacts of climate change. The City of
Boston’s Climate Ready Report (Walsh, 2014), City of Boston Natural Hazard Mitigation Plan
(The City of Boston, 2014), and Greenovate Boston (Greenovate Boston, 2012) are all parts of
the city’s climate action plans. The plans that have been implemented come together to reduce
the vulnerability to different climate risks. Vulnerability can be defined by three dimensions: the
exposure to a threat, the sensitivity to a threat, and the ability to cope with a threat and its
impacts. Although these reports and proposals do a thorough job of evaluating the vulnerability
of residential and mixed use areas in Boston, they do not complete a thorough evaluation
regarding the vulnerability of the working port.
Boston is home to a vibrant working port that deals with a wide array of industries and
employs a large number of people (Martin Associates, 2012). Boston specifically has areas
classified as Designated Port Areas (DPA), which are set aside for water-dependent industrial
uses on Boston’s coast. Our project has focused on the four inner harbor DPAs: Chelsea Creek,
Mystic River, East Boston, and South Boston. The impacts associated with sea level rise and
storm surge on industrial businesses along the harbor shoreline have not been evaluated (Climate
Ready Boston, 2016). Understanding the vulnerability of harbor based industries is a crucial step
for Boston to help identify the impacts of sea level rise and allow for better preventative
measures to be taken in DPAs in the future.

iv
Figure i: Inner Boston Harbor DPA Boundaries courtesy of Massachusetts Government. (2016). Chapter 91, The
Massachusetts Public Waterfront Act | MassDEP. Retrieved April 24, 2017
Assessing the Vulnerability of DPAs
The DPAs of Boston’s inner harbor consist of over 60 water dependent industrial
businesses. A representative sample of 18 parcels was investigated in our study. A list of the
selected parcel can be seen in Table i.

v
Table i: Selected Parcels
Name Of Business DPA Industry
Preferred Freezer Mystic Cargo
Distrigas of Massachusetts Everett Marine LNG Terminal
Wharf
Mystic Fuel
Prolerized New England Co. Everett Wharf Mystic Cargo
Winnisimmet Landing Pier No. 1-5 Mystic Mooring
Constellation Mystic Power , LLC Mystic Station Wharf Mystic Old Industrial
MA Port Authority, Paul W. Conley Marine Terminal Berth
#14-17
South
Boston
Vacant
MA Port Authority, South Boston Ship Dock and Barge Dock South
Boston
Old Industrial
Boston Marine Industrial Park Berth No. 6 South
Boston
Cargo
Perini Corp. Quarterdeck Marina Chelsea Cargo
Global Revco Terminal LLC Revere Terminal Ship Pier Chelsea Fuel
Gulf Oil Chelsea Terminal Tanker Wharf Chelsea Fuel
Vacant Land with Bulkhead Chelsea Vacant
245 & 257 Marginal St. LLC Bulkhead Chelsea Vacant/Parkin
g
Channel Fish Co. Inc. Pier Chelsea Fishing
Irving Oil Terminals Inc Revere Terminal Pier Global Revco
Berth No. 1
Chelsea Fuel
Mahoney Terminal LLC Chelsea (AKA Eastern Salt Co.) Chelsea Salt
Boston Forging & Welding East Boston Boat Repair
Boston Towing & Transportation; Boston Fuel Transportation East Boston Fuel
The vulnerability of each parcel was assessed by looking at the exposure, sensitivity, and
ability to cope to SLR and coastal storm surge. If the parcel was within the predicted flood zone
from the Surging Seas: Risk Zone Map, then it was not deemed vulnerable in terms of exposure.
Sensitivity was determined by the condition of the flood prevention infrastructure on the parcel
and by whether or not the business on the parcel stores chemicals in large quantities. Ability to
cope was determined by looking at the net worth of the business, what emergency flood plans the
business had in place, and the potential cost of damages the business could receive from flooding
from SLR and storm surge. Miscellaneous data was also gathered relating to the effects that DPA
flooding could pose on the surrounding area. What we have evaluated are indicators for the
corresponding dimensions of vulnerability, they are not direct measurements.
Preliminary information for each of the 18 selected parcels was found online. Area,
industry, chemical storage, land and building value, as well as the net worth of the business
could all be found on their city’s assessor's parcels (Boston, Chelsea, Everett, Revere). The
predicted flood zone in and around the parcels was determined using Surging Seas: Risk Zone
Map for 5ft of sea level rise by 2100, which is the likely estimate for emissions scenarios used in
Climate Ready Boston (Climate Ready Boston, 2016).
We attempted to get in touch with DPA businesses either through email or over the
phone. The companies that got back to us were sent emails that contained variations of our
vi
generic interview questions. They were given the option to respond by email or call us to go over
their answers. We hoped their responses would give us insight to their day to day operations as
well as their opinion of their vulnerability to SLR and coastal storms.
A water taxi was taken out along the shorelines of the parcels that were selected. We took
pictures of each site that we were able to visit on the taxi. Photos from the harbor were used in
order to understand the current state of SLR infrastructure. We used these photos in conjunction
with the 2009 Storm Smart Coasts CZM report to analyze the exposure of sites to SLR and
coastal storm surge.
Potential Vulnerability and Risks of DPAs
We determined that Boston’s Inner Harbor DPAs are potentially vulnerable to sea level
rise and coastal storm surge, as these areas have never fully been investigated. We have also
found that this vulnerability has the potential to pose great risk to the city and its inhabitants.
The immediate exposure to SLR and coastal storms greatly increases the vulnerability of
the majority of parcels within Boston’s working port. Of the investigated parcels, 88% are
expected to be in the predicted flood zone for 5 feet of SLR (Global climate change, n.d.). With
the DPA’s direct access to the waterfront, they are exposed to the effects of SLR and coastal
storms more than other areas of Boston.
SLR preventative infrastructure on our selected DPA sites can be improved. Of our 18
selected parcels, only 6 had publicly listed SLR preventative infrastructure (CZM, 2009). Of
those 6 parcels, five were ranked as needing a moderate level of action or higher according to
CZM (CZM, 2009).
During our water taxi tour, we were able to look at some SLR preventative infrastructure.
The high water mark on SLR preventative infrastructure was less than five feet from the top of
the structures. Since 5 feet of SLR is expected by 2100, when coastal storms hit, these areas will
most likely experience flooding. The SLR preventative infrastructure on these sites demonstrates
the exposure to SLR and coastal storms, adding to the vulnerability of these working port areas.
The fact that many businesses within the DPAs store hazardous chemicals on site makes
them more sensitive to sea level rise. Many of the companies we evaluated would lose their
ability to function for a time should their chemicals damaged or lost. Ten of the parcels in the
sample use chemicals in their day to day operations. We know of nine chemicals that are present
in large quantities within the DPAs. The sheer amount of these chemicals along the harbor, in
addition to their hazardous nature, is alarming because in extreme events they may find their way
into the harbor. For example, within the investigated parcels, there are over 345,811,200 gallons
of fuel stored. The issues presented by the release of the chemicals could impact public health,
the environment, and the economy of Boston.
Based off of the information available to us, one third of the businesses investigated
potentially have the resources to recover from severe flooding events. The sheer cost of the land
and infrastructure on many of these parcels would make it difficult for businesses to rebuild after
severe flooding. After reviewing the land and building value provided by tax assessor’s websites,
we identified that out of the parcels investigated, 61% of them were worth over $1M. Only six of
the eighteen businesses that we evaluated were publicly traded and those businesses were all
worth well over $100M. The other twelve parcels are either abandoned or local businesses.
During major flooding events, 66% of businesses are expected to have between $10M-$100M of
predicted damage per acre. The other 33% are predicted to experience between $1M- $10M of
damage per acre to their property. Since two thirds of all investigated businesses have no public

vii
information on their net worth, one third of the businesses evaluated could possibly have the
resources to rebuild after a severe flood.
Based off of interviews and the information available to us, few of the businesses within
the DPAs that we investigated have public emergency plans to deal with flooding. Of the 16
businesses that we contacted, only two answered any of our interview questions. One of the
businesses that we contacted said that they had an emergency plan in place, but that it was not
public information. This lack of transparency regarding emergency planning makes it impossible
to make any accurate statement on the level of preparedness that exists within the DPAs.
We found that the regulation of the DPAs is split between MEMA, CZM, USCG, and the
EPA. In our research of emergency preparedness plans within the DPAs, we conducted an
interview with a hazard mitigation expert from MEMA, we learned that the only regulating body
that deals with hazardous materials is local fire departments. Local fire departments enforce EPA
regulations concerned with the handling of hazardous materials. The EPA only requires that
businesses report the quantity of hazardous materials on their sites to their area fire department
and the EPA. The Massachusetts Tier II Reporting Entities main purpose is to “provide the
framework and methodology to efficiently respond to hazardous materials emergencies”
(Hazardous materials emergency plan, 2011). The current regulations are reactionary in nature,
only having plans for chemicals once they spill. We have found no measures in place to help
prevent the release of toxic chemicals into the environment. The only other regulatory body that
exists within Boston’s harbor is the United States Coast Guard. The Coast Guard is mostly
concerned with ships and materials that are moving on the water. They receive hazardous cargo
manifests from ships entering the harbor in order to keep updated on the hazardous materials
within Boston harbor. From our research it doesn’t seem that there is much communication
between these groups. This lack of communication means that in an emergency situation
important information may not be available to first responders.
Recommendations to Better Prepare DPAs to SLR and Coastal Storms
There are still major gaps in data concerning vulnerability of Boston to SLR and storm
surges. Many of the vulnerability assessments do not address the DPAs in any capacity. As
students reaching out to businesses, we found many unwilling to participate or even get back to
us. Though we managed to gather a lot of information on DPAs in a short amount of time, there
is a lot more data that should be gathered. We recommend that the Massachusetts Coastal Zone
Management (CZM) and The Boston Green Ribbon Commission (GRC) continue their
partnership and produce a vulnerability assessment of the DPAs. This is the partnership that
produces the Climate Ready Boston report, which provides an in depth understanding of
Boston’s vulnerability to climate change. With their previous experience, they can conduct a
vulnerability assessment to give a more detailed description of the state that the DPAs are in.
This report, in conjunction with the Climate Ready Boston report, could create a more complete
understanding of the vulnerability of Boston and its harbor to climate change.
Throughout the completion of this project, we found that there is no organization that
directly regulates emergency preparedness plans in the DPAs. We recommend that
Massachusetts Coastal Zone Management (CZM), the Department of Environmental Protection
(DEP), the Massachusetts Emergency Management Agency (MEMA), and the United States
Coast Guard (USCG) form a regulatory committee concerned with emergency preparedness
plans within the DPAs. The partnership should integrate CZM’s knowledge of businesses and
infrastructure within the DPAs, DEP’s experience with brownfield remediation, USCG’s

viii
authority over the harbor and the cargo within it, and MEMAs experience with emergency
management in Massachusetts.
The committee should have a set of regulations to enforce on the DPA businesses. The
two regulations that we are recommending this committee enforce are: that chemicals and
hazardous materials used by businesses within the DPAs must be stored in flood-proof
containers, and that more frequent inspections and repairs be performed on the SLR prevention
infrastructure within the DPAs. The first regulation would reduce business sensitivity to SLR and
coastal storms by reducing the risk of chemical spills. The second regulation would reduce the
business's exposure to SLR and coastal storms by ensuring that the SLR prevention infrastructure
on the sites are up to date and in good condition.
If these regulations were to be put in place, they could reduce the vulnerability of DPA
businesses to sea level rise and coastal storm surges by limiting exposure and sensitivity. This
committee and its regulations would ensure that the unique needs of these industrial areas are
met, while simultaneously keeping the surrounding communities and environment safe during
flooding events.
Conclusion
Over the course of seven weeks we learned a lot about DPAs and their uniquely industrial
nature. We understand that our work has limitations stemming from the short amount of time that
we had to complete this project as well as the lack of transparency on the part of the DPA
businesses. There still remains a gap in knowledge on the vulnerability of the DPAs, and further
investigation is needed to fully understand Boston’s vulnerability to SLR and coastal storm
surge.

ix
Table of Contents Abstract ............................................................................................................................................ i
Acknowledgements ......................................................................................................................... ii
Executive Summary ....................................................................................................................... iii
List of Figures ................................................................................................................................ xi
List of Tables ................................................................................................................................. xi
Chapter 1.0: Introduction ................................................................................................................ 1
Chapter 2.0: Background on DPAs and Climate Change ............................................................... 3
2.1 Designated Port Areas in Boston Harbor .............................................................................. 3
2.2 Vulnerability of Coastal Cities to Major Flooding Events in a Time of Climate Change .... 4
2.2.1 Sea Level Rise in the Northeastern United States .......................................................... 5
2.2.2 Flooding From Storm Surge ..................................................................................... 5
2.3 Impacts of Storm Surge and Coastal Urban Flooding...................................................... 6
2.3.1 Failed Infrastructure Effects from SLR and Storm Surge ........................................ 6
2.3.2 Impacts of Storms and Flooding on Public Health ................................................... 6
2.3.3 Impacts of Storms and Flooding on the Environment .............................................. 7
2.3.4 Impacts of Storms and Flooding on the Economy ................................................... 7
2.4 Gaps in Knowledge .......................................................................................................... 8
Chapter 3.0: Assessing the Vulnerability of DPAs ......................................................................... 9
3.1 Selecting Parcels for Assessment .......................................................................................... 9
3.2 Gathering Data .................................................................................................................... 10
3.2.1 Gathering Data From Online Resources ....................................................................... 10
3.2.2 Contacting DPA Businesses Representatives ............................................................... 11
3.2.3 Evaluating Sites from the Water ................................................................................... 11
3.3 Data Analysis ...................................................................................................................... 11
Chapter 4.0: Potential Vulnerability and Risks of DPAs .............................................................. 14
4.1 - Exposure of DPAs to SLR and Coastal Storms ................................................................ 14
4.1.1 - Predicted Flood Zones ................................................................................................ 14
4.1.2 - DPA Business Interview Response Regarding Exposure .......................................... 16
4.2 - Sensitivity to SLR and Coastal Storms ............................................................................. 17
4.2.1 - Infrastructure Evaluations .......................................................................................... 17
x
4.2.2 - Sensitivity due to Chemical Storage .......................................................................... 19
4.3 Parcel’s Ability to Cope with SLR and Coastal Storms...................................................... 20
4.3.1 Financial Aspects .......................................................................................................... 20
4.3.2 - Emergency Plans ........................................................................................................ 20
4.4 DPAs Impacts on Boston During Flooding Events ............................................................. 21
4.4.1 Populations at Risk from Flooding in DPAs ................................................................ 21
4.4.2 Risks Posed by Chemicals in the DPA ......................................................................... 22
4.5 Lack of Transparency Within the DPAs ............................................................................. 24
Chapter 5.0: Recommendations to Better Prepare DPAs to SLR and Coastal Storms ................. 25
5.1 Recommendations to Better Understand Vulnerability within DPAs ................................. 25
5.1.1 Use of More Sophisticated Models for Vulnerability Assessments ............................. 25
5.2 Centralized Regulations for Emergency Preparedness Plans .............................................. 26
Chapter 6.0: Conclusions .............................................................................................................. 28
Chapter 7.0: References ................................................................................................................ 29
Chapter 8.0: Appendices ............................................................................................................... 33
Appendix A: Mystic River DPA Boundaries ............................................................................ 33
Appendix B: Chelsea Creek DPA Boundaries .......................................................................... 34
Appendix C: South Boston DPA Boundaries ........................................................................... 35
Appendix D: East Boston DPA Boundaries .............................................................................. 36
Appendix E: Boston Inner Harbor DPA Boundaries ................................................................ 37
Appendix F: Python Code ......................................................................................................... 38
Appendix G: Parcel Land Use ................................................................................................... 39
Appendix H: Generic Email and Phone Script.......................................................................... 40
Appendix I: Generic Questions ................................................................................................. 41
Appendix J: Water Taxi Route .................................................................................................. 42
Appendix K: CZM Infrastructure Sheets .................................................................................. 43
Appendix L: Hazardous Materials Emergency Plan ................................................................. 59
Appendix M: Vulnerable Population Maps .............................................................................. 63
Appendix N: Authorship ........................................................................................................... 65

xi
List of Figures
Figure i: Inner Boston Harbor DPA Boundaries…………………………………………………iv
Figure 1: Inner Boston Harbor DPA Boundaries…………………………….................................4
Figure 2: Predicted Sea Level Rise in Boston…………………………….....................................5
Figure 3: Effects of Flooding on Boston’s Economy…………………..........................................8
Figure 4: Chelsea Creek DPA Flood Zone………………………………………………………15
Figure 5: Mystic River DPA Flood Zone………………………………………………………..15
Figure 6: South Boston DPA Flood Zone………………………………………………………..16
Figure 7: East Boston DPA Flood Zone……………………………………………………...….16
Figure 8: Flooding in East Boston……………………………………………………………….17
Figure 9: Riprap Located at Prolerized………………………………………………………..…18
Figure 10: Bulkhead Located at Eastern Salt…………………………………………………….18
Figure 11: Potential Flooding of 5 Feet with Spring Tide…………………………………..…...26
List of Tables
Table i: Selected Parcels……………………………………………………………….….............v
Table 1: List of Selected Businesses………………………………………………………..……10
Table 2: Selected DPA Parcel Data……………………………………………………………...12
Table 3: Chemical Storage Information………………………………………………………….19
Table 4: Vulnerable Residential Populations Surrounding DPAs…………………………….…22
Table 5: Chemical Effects on Public Health and the Environment……………………………...23

1
Chapter 1.0: Introduction
Climate change is a growing problem facing coastal cities. Though climate change is
accompanied with many consequences, perhaps the most threatening to the populations of
coastal urban cities are the rise in sea levels paired with the rise in coastal storm frequency. The
impacts of coastal flooding on a city's infrastructure, public health, environment, and economy
have been experienced throughout the country (US EPA,). These impacts can be highlighted
during severe hurricanes. For example, during Hurricane Katrina, New Orleans’ lack of adequate
infrastructure coupled with the severity of the storm would lead to disaster for the city. The City
of New Orleans did have levees in place in order to help minimize the effects of severe coastal
storms, but those levees were “...built in a disjointed fashion using outdated data”(Hoar, 2006).
In addition to major issues to infrastructure sea level rise and coastal storms are dangerous to
public health. For example in the aftermath of Hurricane Harvey, flood waters from storms
contained many different and dangerous chemicals (Sifferlin, 2017). Harvey’s flood waters were
dangerous enough in Houston, Texas to cause death from flesh eating bacteria (Astor, 2017).
Major flooding events also pose many dangers to the environment. For example, the impacts of
Hurricane Sandy has caused significant damage to some local islands flora, an estimated 90% of
the mature mangroves have been destroyed, and an estimated 100,000 gallons of fuel has spilled
in the Simpson Bay Lagoon from over 120 shipwrecked vessels (Nature Foundation, 2017).
Finally, the economy of area can also be greatly impacted by a severe coastal storm and SLR.
During Hurricane Sandy, the New York Stock Exchange was forced to shut down for two days
(Library, 2016).The impacts on infrastructure, public health, environment, and economy caused
by these severe storms highlight some of the negative effects of extreme coastal flooding for
modern port cities such as Boston.
Boston is notably vulnerable to flooding events because of its proximity to three rivers
and its position on the Atlantic Coast. Since 1991 the City of Boston has experienced 21 flooding
events that have triggered federal or state disaster declarations (Climate Ready Boston, 2016, P.
2). Over the entire twentieth century sea levels rose about 9 inches relative to land in Boston
(Climate Ready Boston, 2016, pg. 8). With the pace of relative sea levels rise accelerating, by
2030 another eight inches of sea level rise may occur, with about 1.5 ft. by 2050, and as much as
3 ft. by 2070 (City of Boston Hazard Mitigation Plan, 2014). Thus the likelihood of coastal and
riverine flooding will continue to increase. With higher sea levels, storm water outfalls may not
be able to discharge or may even start to backflow (City of Boston Hazard Mitigation Plan,
2014). Severe flooding in Boston could result in damage to infrastructure, public health,
environment and economy similar to that experienced in New Orleans (City of Boston, 2014).
The Boston Hazard Mitigation Plan states that “In Boston, Massachusetts, the increase in
flooding caused by sea level rise this century could cost up to $94 billion from damage to
buildings, loss of building contents, and associated emergency activities, depending on the
amount of sea level rise and adaptation measures taken” (US EPA,). Areas within Boston Harbor
will continue to have accelerated rates of vulnerability unless precautions are implemented to
protect the coast, infrastructure, and people from the effects of sea level rise.
Since 2007 Boston has maintained a climate action plan which details measures the City
has taken, and plans to take, in order to mitigate the impacts of climate change (City of Boston
Hazard Mitigation Plan, 2014). The City of Boston’s Climate Ready Report (Walsh, 2014), City
of Boston Natural Hazard Mitigation Plan (The City of Boston, 2014), and Greenovate Boston

2
(Greenovate Boston, 2012) are all parts of the city’s climate preparedness actions. The plans that
have been implemented are intended to reduce the vulnerability to different climate risks,
including exposure to threats, sensitivity to threats, and ability to cope after events occur
(Bralower, 2017). With this in mind, some of the adaptations being implemented are to increase
the amount of permeable ground, improving drainage systems, updating building codes, and
restoring building and hazard mitigation infrastructure (The City of Boston, 2014). There are
also several proposals being reviewed by the City of Boston with regards to different sea level
rise adaptations, such as a large sea wall that completely surrounds the harbor. “City officials are
exploring the feasibility of building a vast sea barrier from Hull to Deer Island, forming a
protective arc around Boston Harbor” (Abel, 2017). Although these reports and proposals do a thorough job of evaluating the vulnerability of
residential and mixed use areas in Boston, they do not complete a thorough evaluation regarding
the vulnerability of the working port.
The goal of this project was to assess the vulnerability of designated port areas in Boston
Harbor to sea level rise and coastal storms. Our project focused on the four inner harbor DPAs:
Chelsea Creek, Mystic River, East Boston, and South Boston. We selected a sample of DPA
businesses to represent each industry and DPA located within the harbor. An analysis of selected
sites was conducted, by reviewing tax assessors info, interviewing business representatives, and
looking at SLR prevention infrastructure to determine the overall vulnerability of Boston’s
DPA’s. Our assessment resulted in a report that may be used to inform policy and interested
stakeholders of the vulnerability of working port areas in Boston Harbor to sea level rise.

3
Chapter 2.0: Background on DPAs and Climate Change
As sea levels rise and coastal storms become more frequent, it is necessary for coastal
cities to understand their vulnerability. The City of Boston has done vulnerability assessments
focused on residential and mixed use areas but no assessment of the DPAs has been conducted.
In order to understand the context in which the DPAs exist, some background information is
necessary. We will start by describing Boston Harbor and its designated port areas, then move
into why there is an increased risk of severe flooding in the project area. We then address the
negative effects that would be experienced during severe flooding events.
2.1 Designated Port Areas in Boston Harbor
Boston is a historic city built around its harbor. Boston Harbor has emerged into a large
trading market, which increased the industrialization of the city because of its location on the
Atlantic Ocean. The harbor is critical to Boston’s economy. In 2012, $4.6 billion was generated
by Boston’s port in overall economic value, while the business’ themselves generated $1.2
billion in revenue (Woolhouse, 2014). Due to the port industry's importance to the economic
value of Boston, the Commonwealth of Massachusetts wanted to protect more industrial sectors
of the port from being displaced by non-industrial uses. Designated Port Areas (DPAs) were the
regulatory mechanism created by the Commonwealth to ensure access to the water for water
dependent industrial businesses. DPAs were created in 1978 by the Massachusetts Coastal Zone
Management (CZM) “to satisfy both the unforeseeable and unanticipated space needs of
industrial use that depend on the withdrawal/discharge of large volumes of process water” (New
England School of Law, 2009). Site characteristics and infrastructure needs of designated port
areas include a developed waterfront, adjacent land suitable for industrial use, and access to land
transportation for industrial purposes (Mass.gov, n.d.).
DPAs ensure that water dependent industries have access to Boston Harbor. There are 10
DPA’s in Massachusetts, four of which will be the main focus of this project: Mystic River
(Appendix A), Chelsea Creek (Appendix B), East Boston (Appendix C), and South Boston
(Appendix D). A map of all four DPAs being investigated by our team can be seen in Figure 1. A
variety industries utilize access to the waterfront that these DPAs provide. Some examples of
industries within the DPAs are commercial fishing and processing, fuel transportation and
storage, as well as import and export businesses.

4
Figure 1: Inner Boston Harbor DPA Boundaries courtesy of Massachusetts Government.
(2016). Chapter 91, The Massachusetts Public Waterfront Act | MassDEP. Retrieved April 24, 2017.
DPAs pose a threat to Boston Harbor. Industrial sites within DPAs often contain hazardous
chemicals that if released would pose significant risks to Boston’s public health and environment.
These threats are exacerbated with the threat of sea level rise and severe flooding events anticipated
as a result of changing climate.
2.2 Vulnerability of Coastal Cities to Major Flooding Events in a Time of Climate Change
Impacts from climate change are not a new issue for the City of Boston. The City has
been hit by 8 significant hurricanes in the past 75 years and has been developing different hazard
mitigation preparations to minimize the risks from storm surge and storm water for over 100
years. But, as the climate continues to change, the risk of coastal urban flooding is continuing to
increase, and most cities are not prepared for the up-surging threats outlined in this section.

5
2.2.1 Sea Level Rise in the Northeastern United States
Cities along coastal Northeastern United States are predicted to encounter escalating sea
level rise (SLR). In the Northeast, the relative sea level has risen by approximately one foot,
since 1900, which has caused more frequent flooding of coastal areas (Climate Change in the
Northeast, 2016). Boston’s sea level is predicted to have a minimum increase of 2.4 feet and a
maximum of 7.4 feet, by the year of 2100, as shown in Figure 2 (Climate Ready Boston, 2016).
Reducing Boston’s SLR to less than 2.4 feet. by the end of the century would require massive
and unprecedented cuts in greenhouse gases worldwide (Climate Ready Boston, 2016).The lower
end of this range assumes moderate cuts in global greenhouse gas emissions, with the upper end
of this range assuming no changes in global emissions. SLR is driven by a combination of
melting land ice, the expansion of water as its temperature increases, and changes in the amounts
of water extracted from below ground or stored behind dams (Climate Change Indicators: Sea
Level, 2014). Most of the coastal Northeast is expected to exceed the global average sea level
rise due to local land subsidence, with the possibility of even greater regional sea level rise if the
Gulf Stream weakens (Chapter 16 Northeast, 2014).Rising sea level will result in areas within
coastal cities, such as Boston, to become more vulnerable to flooding by exacerbating impacts
accompanied with storm surge.
Figure 2: Predicted Sea Level Rise in Boston From: (2016). Climate Ready Boston, | City of Boston.
Retrieved April 24, 2017
2.2.2 Flooding From Storm Surge
Another threat facing coastal urban cities is the predicted increase in severe coastal
storms, which is intensifying by sea level rise (Pierre-Louis, 2017). A storm surge is an abnormal
rise in sea level accompanying a hurricane or other intense storm, and whose height is the
difference between the observed level of the sea surface and the level that would have occurred
in the absence of the storm (Hurricane Science: Storm Surge, 2015). With global sea levels

6
already on the rise, storms will cause more flooding in the future than they would today. This is
because “the higher water level provides a higher base for the waves so they are able to strike
structures that might otherwise be elevated above the waves; effect and shore erosion caused by
sea level rise allows the waves to strike farther inland”(Greenhouse effect and Sea Level Rise,
2007). An example of an overwhelming and unanticipated storm surge coupled with
precipitation, occurred during Hurricane Harvey. This hurricane unloaded nearly 33 trillion
gallons of water in the U.S (Fritz & Samenow, 2017). This unprecedented amount of water had
displaced over one million people and about 185,000 homes have been either damaged or
destroyed across the Southeast US (Gallagher, 2017). Storm surges are particularly damaging in
cities or other areas with high population densities, such as Boston.
2.3 Impacts of Storm Surge and Coastal Urban Flooding
Coastal urban flooding has many negative Impacts on its surroundings. Impacts of coastal
flooding can affect infrastructure, public health, the environment, and the economy of coastal
cities and regions.
2.3.1 Failed Infrastructure Effects from SLR and Storm Surge
As flooding severity worsens, the challenge of keeping important SLR prevention
infrastructure, such as riprap and bulkheads, in good conditions increases. However, once the
upkeep is not continued the infrastructure will deteriorate, putting it more at risk of failure under
flooding conditions (Portland, 2014).
Failure of infrastructure during severe flooding events often exacerbates the issues caused
by severe flooding. One potentially devastating form of infrastructure failure is the failure
seawalls and other sea level rise prevention infrastructure. For example, if New Orleans had
maintained their infrastructure, the flooding would not have been as detrimental from Hurricane
Katrina: “Flood protection systems such as levee, canal systems, etc., were constructed to
safeguard the city of New Orleans. However, these systems were poorly maintained and did not
withstand the impact of the hurricane resulting in widespread damage to the city of New
Orleans,” (Deshmukh et al., 2011). Upkeep of flood protection systems is critical to helping
mitigate the impacts of SLR.
Similarly, the state of a building plays a role in the effect SLR has on it. The City of
Boston has fully adopted the International Building Code (IBC) set of standards for building
construction. The IBC does not adequately prepare the City of Boston for SLR (International
Code Council, n.d.). To combat this, the Commonwealth of Massachusetts has made its own
modification to the IBC to be implemented in the state (Massachusetts Board of Building
Regulations and Standards, 2010). Although these modifications improve upon the IBC in
regards to SLR building code criteria, more research should be done to ensure that buildings are
able to withstand more severe coastal flooding. The impacts of collapsed or damaged buildings
would not only affect the aesthetic of the city, they could damage the health of the city’s
residents.
2.3.2 Impacts of Storms and Flooding on Public Health
Floods pose many threats to the health of a community, including discharging pollutants
into water and forcing people to reside within damp toxic living conditions. A major threat to

7
Boston’s public health from DPAs is the use and storage of harmful chemicals. If storage
systems were to fail, dangerous chemicals have the ability to contaminate water. Some major
hazardous materials that could spill into Boston Harbor are formaldehyde, petroleum, ammonia,
and salt (Environmental, Health, and Safety Guidelines for Fish Processing, April 30, 2007). If
during a severe flooding event these chemicals were to get into the water, they would have
detrimental impacts on people’s health.
Public health can also be negatively impacted from increased storms and floods that lead
to damp air and living/working conditions (Climate Ready Boston, 2016). If the water does not
dry completely, mold and mildew can start to appear in buildings. This was the case after
Hurricane Sandy hit areas of New York (Nir, 2013). The dampened conditions lead to increased
growth of black mold. Residents are subjected to increased allergen exposure due to mold
growth in flooded homes and other structures (Climate Change Impacts in the Unites States,
2014). Depending on the severity of the mold and mildew exposure, there can be various effects
on the health of residents and citizens working in the area. Mold can cause minor effects such as
coughing or something as serious as severe lung infections (National Center for Environmental
Health, 2014). Many areas directly surrounding DPAs are residential, so flooding from SLR
would likely have a negative impact on the public.
2.3.3 Impacts of Storms and Flooding on the Environment
Just as the public health is threatened by what can happen during sea level rise and storm
surges, the environment is as well. In May, NOAA predicted a 45 percent chance that the 2017
Atlantic Hurricane season—which runs from June 1 through November 30—would be more
active than normal (Pierre-Louis, 2017). With increased water levels and severity of storms,
there will be wider areas of ecosystems that will be vulnerable. Vulnerability assessments have
been able to start looking at what the potential impacts on the environment could be (Climate
Ready Boston, 2016).
Wildlife faces many similar threats that the public does. Petroleum and salt are
particularly hazardous to aquatic life. Another threat posed to the environment from SLR is the
increase of runoff and sediment into waterways (Huston, 2010). Storm surge can cause more
erosion and carry pollutants, into waterways and large bodies of water (Huston, 2010). This
increase in pollutants can lead to increases in algal blooms (Huston, 2010) which are already a
problem in Boston waterways. Algal blooms are one of the causes of a decrease in dissolved
oxygen in water (Hewett, 2016). When there is less oxygen in the water fish and aquatic plants
suffer because they do not have access to the needed amount of oxygen. Less oxygen also leads
to higher water temperatures, which can cause distress for the aquatic life that is used to cooler
temperatures (Hewett, 2016).
2.3.4 Impacts of Storms and Flooding on the Economy
The economy of a region can be affected directly and indirectly by a changing climate. In
the above sections, some of the general impacts of sea level rise, flooding, and storms have been
described. In the end, all of these impacts can subsequently affect the economy of a region. Some
effects from flooding will be more immediate, while others may take a while to appear and be
fixed. Figure 3 below shows some of the potential long term or short term impacts that can come
from flooding to coastal cities. If important structures fall into disrepair, then they will need to
be repaired (Massachusetts Department of Conservation and Recreation, 2009). When Texas was

8
ravaged by Hurricane Harvey in 2017 many of the oil refineries on the coast were damaged and,
“almost 22 percent of current oil production in the Gulf of Mexico has been ‘shut-in’...” (Rosoff,
2017). Oil refining made up a majority of the economy in Texas’s ports, and it is predicted that
because of Harvey, “it could be months or even years before the region is experiencing some
sense of normalcy again” (O'Keefe & Williams, 2017). Harvey not only affected Texas’
economy, it had an impact on the whole country, “analysts said prices at the pump are likely to
rise between 5 cents and 15 cents nationwide in the weeks ahead” (Ivanova, 2017).
Figure 3: Effects of Flooding on Boston’s Economy
2.4 Gaps in Knowledge
The City of Boston has done quite a bit of work to protect residential and mixed-used
areas from sea level rise, but there is still one area that the vulnerability assessments has not
focused on: DPAs. A vulnerability assessment of the working port on the inner harbor of Boston
has not been completed. Gaps in information include the exposure of DPAs to SLR and coastal
storms, current state of infrastructure within the DPAs, the toxic chemicals stored within these
DPAs and their potential effects on the harbor and its residents, as well as the ability for the
working port to recover after damage occurs. Understanding the vulnerability of Boston’s
working port to SLR and coastal storms is necessary. This understanding will allow Boston to
have a complete idea of the risks posed to the city by SLR and coastal storm surge.

9
Chapter 3.0: Assessing the Vulnerability of DPAs
The goal of this project was to assess the vulnerability of designated port areas in Boston
Harbor to sea level rise and coastal storms. We focused on the four Boston inner harbor DPAs
which are Chelsea Creek, Mystic River, East Boston, and South Boston (See Appendices A-D).
Within these DPAs we selected a sample of parcels to represent the different industries. The
vulnerability of individual parcels was assessed to help determine the vulnerability DPAs as a
whole. Our project resulted in a report that has been given to Boston Harbor Now (BHN) for
their use to inform policy and interested stakeholders of our findings. In this chapter we outline
how we picked parcels and how the parcels were studied and evaluated.
3.1 Selecting Parcels for Assessment
The DPAs of Boston’s inner harbor consist of over 60 water dependent industrial
businesses. To complete a vulnerability assessment of these parcels, a representative sample of
18 was selected, due the limited timeframe of this project. To reduce bias in our sampling
process, we utilized random sampling to select each business. A database of parcels within the
four inner harbor DPAs was obtained from Massachusetts Coastal Zone Management (CZM).
We classified the businesses in the DPAs into eight different industries: mooring, cargo, fish
processing, fuel, boat repair, salt, old industrial, and vacant/parking lots. Each industry is unique
in how it operates, making each one vulnerable in different ways from each other.
To accurately represent the DPAs, a variety of each industry needed to be selected. First,
we calculated the percentage of land each industry occupied within the DPAs. Based on the
percentage of land each industry took up, parcels were selected weighted to that percentage. For
example, cargo occupied 20.52% of land within all four inner harbor DPAs, and 20% of 15
parcels is roughly 4 parcels, therefore four cargo parcels were randomly selected (Appendix G).
In order to conduct a random sample, each parcel was assigned a number 1-55, 55 being
the total amount of businesses. The parcels were grouped by industry. For example, Boat Repair
included parcel numbers 1-9, Cargo was parcel numbers 10-21, and so on. Then to select the
specific parcels, we randomly selected numbers using a Python script (Appendix F). We
discovered two of the selected parcels were the same parcel but separated into two industries.
This resulted in us having selected a total 14 businesses.
After we identified all of the parcels, we discovered that East Boston DPA was not
represented. In order to ensure that each DPA and industry was represented in our study, we
decided to add more parcels to our selection. Another random sample with just the parcels in the
East Boston DPA was conducted, resulting in the selection of Boston Forging and Welding and
Boston Towing and Transportation. Two industries were not represented in any of our random
parcel selections: salt and fish processing. To select a salt parcel, we again ran the above script to
randomly select one of the two salt parcels within the DPAs, which resulted in Eastern Salt Co.
There was only one fish processing parcel to choose from: Channel Fish Co. The final selected
businesses/parcels can be seen in Table 1 below.

10
Table 1: List of Selected Businesses
Name Of Business DPA Industry
Preferred Freezer Mystic Cargo
Distrigas of Massachusetts Everett Marine LNG Terminal
Wharf
Mystic Fuel
Prolerized New England Co. Everett Wharf Mystic Cargo
Winnisimmet Landing Pier No. 1-5 Mystic Mooring
Constellation Mystic Power , LLC Mystic Station Wharf Mystic Old Industrial
MA Port Authority, Paul W. Conley Marine Terminal Berth
#14-17
South
Boston
Vacant
MA Port Authority, South Boston Ship Dock and Barge Dock South
Boston
Old Industrial
Boston Marine Industrial Park Berth No. 6 South
Boston
Cargo
Perini Corp. Quarterdeck Marina Chelsea Cargo
Global Revco Terminal LLC Revere Terminal Ship Pier Chelsea Fuel
Gulf Oil Chelsea Terminal Tanker Wharf Chelsea Fuel
Vacant Land with Bulkhead Chelsea Vacant
245 & 257 Marginal St. LLC Bulkhead Chelsea Vacant/Parkin
g
Channel Fish Co. Inc. Pier Chelsea Fishing
Irving Oil Terminals Inc Revere Terminal Pier Global Revco
Berth No. 1
Chelsea Fuel
Mahoney Terminal LLC Chelsea (AKA Eastern Salt Co.) Chelsea Salt
Boston Forging & Welding East Boston Boat Repair
Boston Towing & Transportation; Boston Fuel Transportation East Boston Fuel
3.2 Gathering Data
To characterize the vulnerability of each parcel, we gathered preliminary data from the
internet, we attempted to interview representatives from each business, and conducted site
reviews by water taxi.
3.2.1 Gathering Data From Online Resources
Preliminary information for each selected parcel within the DPAs was found online.
Area, industry, elevation, chemical storage, land and building value, as well as the net worth of
the business could all be found on the respective city’s tax assessor's website (Boston, Chelsea,
Everett, Revere). The predicted flood zone in and around the parcels was determined using
Surging Seas: Risk Zone Map for 5ft of sea level rise by 2100, which is the likely/ middle of the
road for emissions scenarios used in Climate Ready Boston (Climate Ready Boston, 2016). This
same sea level rise viewer was used to gather the predicted property exposure, social
vulnerability exposure, and the vulnerable population exposure of the population surrounding
each parcel.

11
3.2.2 Contacting DPA Businesses Representatives
Using the contact information available to us, we attempted to get in touch with the
businesses either through email or a phone call. We utilized a generic email template and phone
script (Appendix H). The companies that got back to us were sent emails that contained
variations of our generic interview questions (Appendix I). They were given the option to
respond by email or call us to go over their answers.
3.2.3 Evaluating Sites from the Water
A water taxi was taken out along the shorelines of the parcels that were selected. Based
on the location of our selected parcels and the location of shoreline stabilization structures, a
water taxi route was mapped out (Appendix J). We took pictures of each site that we were able to
get to with the taxi. We used these photos in conjunction with the 2009 Storm Smart Coasts
CZM report in order to understand the current state of SLR infrastructure.
3.3 Data Analysis
All of the data gathered through interviews and site visits was compiled into a
spreadsheet.

12
Table 2: Selected DPA Parcel Data
Vulnerability Evaluated Source Why?
DPA CZM Spreadsheet What DPA the parcel is in.
Industry CZM Spreadsheet What industry the parcel is in.
Exposure
Area (sq ft) Assessor's Parcel Viewer More land exposed to flooding.
In Predicted Flood Zone for
SLR by 2100 (5ft SLR) (Y/N) Surging Seas: Risk Zone Map
Parcel is predicted to be flooded
by 2100.
Sensitivity
SLR Preventative
Infrastructure
Water Taxi/2009 Storm Smart
Coasts
Poor condition of SLR prevention
infrastructure adds to sensitivity.
Chemical Type CZM Spreadsheet
Different chemicals are
dangerous in different ways.
Chemical Quantity CZM Spreadsheet
High quantity of chemicals could
cause more damage.
Chemical Storage CZM Spreadsheet
Proper chemical storage can
prevent against chemical spills,
lowering overall sensitivity.
Building Condition Interviews
Poor building condition adds to
the parcels sensitivity to SLR and
storm surge.
Ability to
Cope
Predicted Property Exposure
5ft Sea Level Rise (Price per
acre) Surging Seas: Risk Zone Map
Expensive damages require more
money to repair.
Net Worth of Business Assessor’s Parcel Viewer
Smaller businesses may not be
able to afford repairs.
Emergency Plans Interviews
How well a company can respond
to flooding events and related
outcomes affects their ability to
cope.
Misc.
Social Vulnerability Exposure
5ft SLR Surging Seas: Risk Zone Map
The citizens in the surrounding
area’s ability to prepare and
respond to flooding.
Vulnerable Population
Exposure 5ft SLR (People per
square mile) Surging Seas: Risk Zone Map
More vulnerable people
surrounding parcel.
Land and Building Value ($) Assessor’s Parcel Viewer
Higher valued land/buildings may
cost more to repair.
The vulnerability of each parcel was assessed by looking at the exposure, sensitivity, and
ability to cope to SLR and coastal storm surge. If the parcel was within the predicted flood zone
from the Surging Seas: Risk Zone Map, then not was deemed vulnerable in terms of exposure.
Sensitivity was determined by the condition of the flood prevention infrastructure on the parcel
and by whether or not the business on the parcels stores chemicals in large quantities. Ability to
cope was determined by looking at the net worth of the business, what emergency flood plans the
business had in place, and the potential cost of damages the businesses could receive from

13
flooding from SLR and storm surge. Miscellaneous data were also gathered relating to the effects
that DPA flooding could pose on the surrounding area shown in Table 2. What we have
evaluated are indicators for the corresponding dimension of vulnerability, they are not direct
measurements.

14
Chapter 4.0: Potential Vulnerability and Risks of DPAs
Boston’s Inner Harbor DPAs are potentially vulnerable to sea level rise and coastal storm
surge. There is a gap in knowledge as these areas have never fully been investigated. We have
also found that this vulnerability has the potential to greatly impact the city and its inhabitants.
This chapter outlines our findings relating to the three dimensions of vulnerability:
exposure, sensitivity, and ability to cope. Within each of these dimensions, we have evaluated
many different variables that all contribute to the parcels overall vulnerability. We also discuss
the DPA’s potential impact on the city of Boston during flooding events. We then highlight the
lack of transparency throughout the businesses within the DPAs in regards to contacting
representatives and gathering information.
4.1 - Exposure of DPAs to SLR and Coastal Storms
In order for an area to be vulnerable to SLR and coastal storms, it needs to be exposed to
SLR and coastal storms. A sites location within Boston Harbor greatly affects its potential
exposure. Depending on a sites elevation and proximity to the harbor, it will be exposed to
different levels of flooding.
4.1.1 - Predicted Flood Zones
The exposure to SLR and coastal storms greatly increases the vulnerability of the
majority of parcels within Boston’s working port. With moderate cuts in carbon emissions, the
likely amount of sea level rise by the year 2100 is 5 ft (Global Climate Change, n.d.). Of the
investigated parcels, 88% are expected to be underwater by 2100. With the DPA’s situated
directly on the water, they are more exposed to the effects of SLR and coastal storms than other
areas of Boston. Figures 4-7 are maps of the four DPA’s, showing the predicted flood zones
(PFZ) during 5 ft SLR.

15
Figure 4: Chelsea Creek DPA Flood Zone From: (2017). Surging Seas: Risk Zone Map, | NOAA.
Retrieved April 5, 2017
Figure 5: Mystic River DPA Flood Zone From: (2017). Surging Seas: Risk Zone Map, | NOAA.
Retrieved April 5, 2017

16
Figure 6: South Boston DPA Flood Zone From: (2017). Surging Seas: Risk Zone Map, | NOAA.
Retrieved April 5, 2017
Figure 7: East Boston DPA Flood Zone From: (2017). Surging Seas: Risk Zone Map, | NOAA. Retrieved
April 5, 2017
4.1.2 - DPA Business Interview Response Regarding Exposure
In response to our interview questions, a representative from Channel Fish Co. Inc. said
that he was very concerned for his business’s safety regarding SLR and coastal storms. This

17
representative stated “We are very concerned that our backyard could flood and portions of the
property could be damaged by severe storms.”
Channel Fish Co. is located in the East Boston DPA, with direct access to the waterfront
along Chelsea Creek. The East Boston area has been prone to serious erosion along the coast,
and is located within the boundaries of the PFZ with regards to 5 feet SLR, shown in Figure 7
above. The representative stated that his business has been prone to flooding in the past, with an
example of this flooding shown below in Figure 8. In regards to flooding on this property, the
representative said “It’s been pretty severe at times: the most recent occurrence on Aug. 2, the
standing water was about a foot tall. It’s also gotten into our basement in the past.”
It is evident this business located within the DPA has extreme exposure to flooding,
increasing its overall vulnerability to SLR and coastal storm surge.
Figure 8: Flooding Within East Boston August 2, 2017 From: Margaret Farmer
4.2 - Sensitivity to SLR and Coastal Storms
A sites vulnerability to SLR and coastal storms is also a function of its sensitivity. For the
purpose of this project, the sensitivity analysis is based on the state of the infrastructure on the
parcel. The infrastructure that we evaluated included both the sea level rise prevention
infrastructure, chemical type, chemical storage, and chemical quantity. These are all indicators of
sensitivity that contribute to the overall vulnerability of a parcel.
4.2.1 - Infrastructure Evaluations
SLR preventative infrastructure on DPA our selected DPA sites can be improved. Of our
18 selected parcels, only 6 had publicly listed SLR preventative infrastructure (CZM, 2009). Of
those 6 parcels, five were ranked as needing a moderate level of action or higher according to
CZM (CZM, 2009) (Appendix K). After our water taxi tour, we did not have an adequate amount
of information to correctly correlate each parcels SLR prevention infrastructure to the previous
CZM report.

18
During our water taxi tour, we were unable to visit all of the parcels from our sample due
to limited time and travel restrictions. We were able to look at some SLR preventative
infrastructure near some of the sites. Figure 9 shows riprap located on Prolerized. It can be seen
that the high water mark on the rocks is more than halfway up the structure. We were not able to
gain the exact measurements of the height of the rip rap, but we can safely estimate there is less
than 5 feet of riprap above the high water mark. This is concerning due to the fact that 5 feet of
SLR is expected by 2100, and if coastal storms hit the area, they will most likely experience
more than 5 feet of coastal storm surge, resulting in the Prolerized site being flooded. Similar
flooding would be experienced at the Eastern Salt site under the same future conditions. As seen
in Figure 10, the Eastern Salt parcel has bulkheads. However, the high water mark is also located
less than 5 feet from the top of the structure. The quality of SLR prevention infrastructure on
these sites demonstrates the exposure to SLR and coastal storms, adding to the vulnerability of
these working port areas.
Figure 9: Riprap located at Prolerized
Figure 10: Bulkhead located at Eastern Salt

19
4.2.2 - Sensitivity due to Chemical Storage
The fact that many businesses within the DPAs rely on large amounts of chemicals stored
on site to function makes them more sensitive to sea level rise. Different types of chemicals are
stored differently. The condition of the storage facilities can contribute to how vulnerable the site
is to flooding. The worse the condition is the more vulnerable the area is. Unfortunately we were
unable to analyze the condition of the storage facilities themselves. Since we could not analyze
the storage facilities we investigated which companies would lose their ability to function for a
time should they damage or lose the chemicals. Ten of the parcels that we investigated use
chemicals in their day to day operations. The companies that store chemicals on these ten parcels
would not be able to function normally without their chemicals. This limit in their ability to
function is what makes them vulnerable in the sense of chemical storage.
Table 3: Chemical Storage Information
Business Chemical Type Chemical Quantity Chemical Storage
Preferred Freezer Ammonia N/A N/A
Distrigas of
Massachusetts
Liquid Natural Gas
(LNG)
25,000 gallons 2 Cryogenic, 3 Tanks
Constellation Mystic
Power
Petroleum/ LNG 590,000 barrels 4 Tanks
MA Port Authority
South Boston Ship
and Barge Dock
Petroleum
Molasses
2,292,000 barrels
4,437,000 Gallons
26 Tanks
12 Steel Tanks
Boston Marine
Industrial Park Berth
6
Cement N/A 2 Storage Silos
Global Revco
Terminal
Petroleum 1,400,000 Barrels 24 Steel Tanks
Gulf Oil Petroleum 1,677,600 Barrels 21 Steel Tanks
Channel Fish Co. Inc.
Pier
Salt
Formaldehyde
Ammonia
N/A N/A
Irving Oil Terminal Petroleum 1,300,000 Barrels 18 Steel Tanks
Eastern Salt Salt
Coal
170,000 Tons Pile

20
4.3 Parcel’s Ability to Cope with SLR and Coastal Storms
A site’s vulnerability is also a function of its ability to cope after a major flooding event
has happened. If a site can respond and recover quickly from SLR or a major storm, they are less
vulnerable to it. Things such as a business's worth and income can give some indication on a
business's ability to reconstruct their site. Emergency plans that are in place when flooding
occurs also will reduce that sites vulnerability to SLR and coastal storms. If a site has the ability
to cope with SLR and coastal storms both during and after they occur, they are consequently less
vulnerable.
4.3.1 Financial Aspects
The sheer cost of the land and infrastructure on many of these parcels would make it
difficult for businesses rebuild after severe flooding. After reviewing the land and building value
provided by tax assessor’s websites, we identified that out of the parcels investigated, 61% of
them were worth over $1M. Only six of the eighteen businesses that we evaluated were publicly
traded and those businesses were all worth well over $100M. The other twelve parcels are either
abandoned or local businesses. During major flooding events, 66% of businesses are expected to
have between $10M-$100M of predicted damage per acre. The other 33% is predicted to
experience between $1M- $10M of damage per acre to their property. Since two thirds of all
investigated businesses have no public information on their net worth, one third of the businesses
evaluated could possibly have the resources to rebuild after a severe flood, this is still
undetermined.
4.3.2 - Emergency Plans
To our knowledge, few of the businesses within the DPAs have publicly available
emergency plans to deal with flooding. One of the businesses that we contacted said that they
had an emergency plan in place, but that it was not public information. Businesses are not
required to make their emergency plans public, due to risks associated with terrorism. Through
an interview with a hazard mitigation expert from MEMA, we learned that the only real
regulating body that deals with hazardous materials is local fire departments. Local fire
departments enforce EPA regulations concerned with the handling of hazardous materials. The
EPA only requires that businesses report the quantity of hazardous materials on their sites to
their area fire department and the EPA. According to the Massachusetts Tier II Reporting
Entities, a source referred to us by MEMA, the hazard mitigation plan’s main purpose is to
“provide the framework and methodology to efficiently respond to hazardous materials
emergencies”(Hazardous materials emergency plan, 2011)(template version of Hazardous
Materials Emergency Plan can be seen in Appendix L). The current regulations are reactionary in
nature, only having plans for chemicals once they spill. We found no regulatory requirements to
help prevent the release of toxic chemicals into the environment.
The only other agency that regulates industrial activities within Boston’s harbor is the
United States Coast Guard. The Coast Guard is mostly concerned with ships and materials that

21
are moving on the water. They receive hazardous cargo manifests from ships entering the harbor
in order to keep updated on the hazardous materials within Boston Harbor.
We learned that the regulation of the DPAs is split between MEMA, CZM, USCG, and
the EPA. From our research it doesn’t seem that there is much communication between these
groups. This is based off of our experience with these agencies representatives. We were
continually being referred to different people within various state agencies, none of whom knew
much about regulations within the DPAs. This lack of communication means that in an
emergency situation important information may not be available to first responders.
4.4 DPAs Impacts on Boston During Flooding Events
DPAs vulnerability to SLR and coastal storms is a problem, but the effects that those
flooded DPAs may have on the surrounding areas is another issue. Populations that live behind
these DPAs are at risk due to their proximity to the water as well as being exposed to the toxic
chemicals that are stored on some DPA properties. The impacts of flooded DPAs on the
surrounding areas of Boston is also a threat.
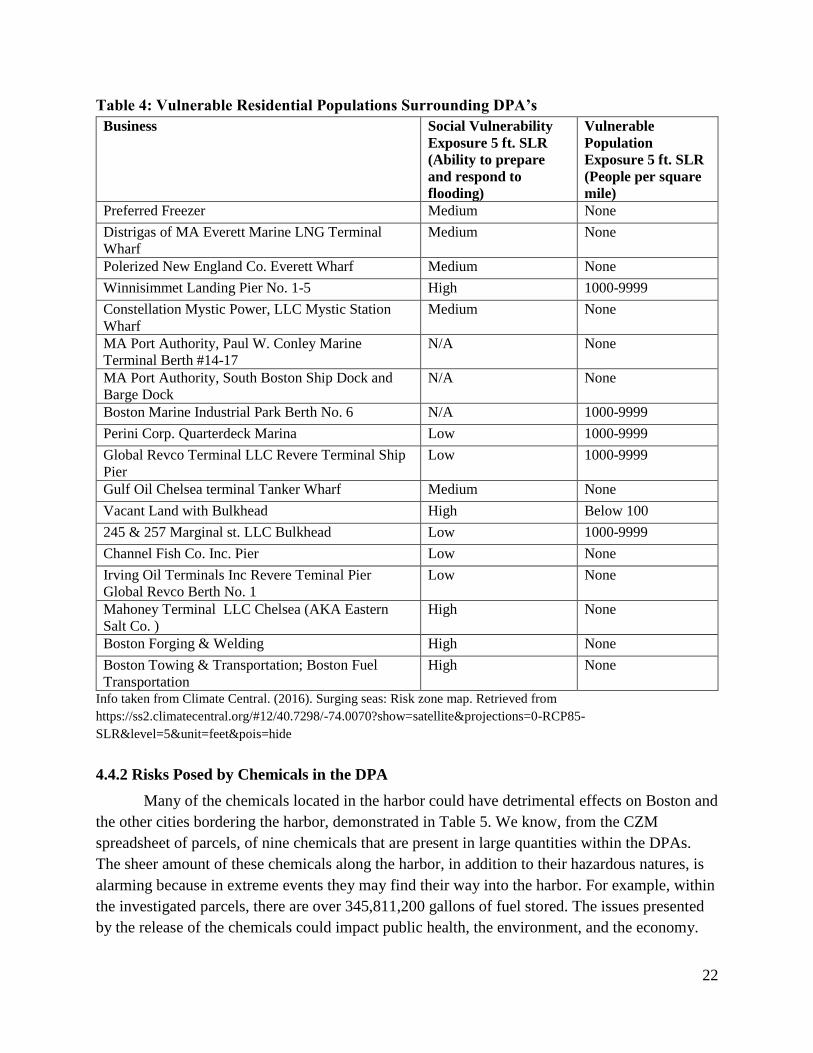
4.4.1 Populations at Risk from Flooding in DPAs
Residential populations located directly behind the DPA’s can be vulnerable to the effects
SLR. If you refer to the vulnerable populations table (Appendix M), you can see many of the
inhabitants surrounding the DPA parcels will be exposed to the effects of SLR. Using the
Surging Seas: Risk Zone Map we were able to apply Social Vulnerability and Vulnerable
Population layers. The Social Vulnerability Exposure ranks how the population can prepare and
react to SLR and flooding events. The businesses that have a rank of “Low” have populations
behind them with low exposure, meaning they have a better ability to prepare and respond to the
flooding. “High” means that the population surrounding the parcel are not able to respond and
prepare well for flooding events. The Vulnerable Population Exposure is how many people per
square mile that would be impacted by a 5 foot sea level rise. These show that the populations
behind the DPA’s are vulnerable to SLR and coastal storms. During major flooding events,
floodwater from the DPA’s pose the risk of spreading contaminants to the surrounding areas.
This has the potential to exacerbate the impacts of flooding on the already vulnerable residential
populations.
22
Table 4: Vulnerable Residential Populations Surrounding DPA’s
Business Social Vulnerability
Exposure 5 ft. SLR
(Ability to prepare
and respond to
flooding)
Vulnerable
Population
Exposure 5 ft. SLR
(People per square
mile)
Preferred Freezer Medium None
Distrigas of MA Everett Marine LNG Terminal
Wharf
Medium None
Polerized New England Co. Everett Wharf Medium None
Winnisimmet Landing Pier No. 1-5 High 1000-9999
Constellation Mystic Power, LLC Mystic Station
Wharf
Medium None
MA Port Authority, Paul W. Conley Marine
Terminal Berth #14-17
N/A None
MA Port Authority, South Boston Ship Dock and
Barge Dock
N/A None
Boston Marine Industrial Park Berth No. 6 N/A 1000-9999
Perini Corp. Quarterdeck Marina Low 1000-9999
Global Revco Terminal LLC Revere Terminal Ship
Pier
Low 1000-9999
Gulf Oil Chelsea terminal Tanker Wharf Medium None
Vacant Land with Bulkhead High Below 100
245 & 257 Marginal st. LLC Bulkhead Low 1000-9999
Channel Fish Co. Inc. Pier Low None
Irving Oil Terminals Inc Revere Teminal Pier
Global Revco Berth No. 1
Low None
Mahoney Terminal LLC Chelsea (AKA Eastern
Salt Co. )
High None
Boston Forging & Welding High None
Boston Towing & Transportation; Boston Fuel
Transportation
High None
Info taken from Climate Central. (2016). Surging seas: Risk zone map. Retrieved from
https://ss2.climatecentral.org/#12/40.7298/-74.0070?show=satellite&projections=0-RCP85-
SLR&level=5&unit=feet&pois=hide
4.4.2 Risks Posed by Chemicals in the DPA
Many of the chemicals located in the harbor could have detrimental effects on Boston and
the other cities bordering the harbor, demonstrated in Table 5. We know, from the CZM
spreadsheet of parcels, of nine chemicals that are present in large quantities within the DPAs.
The sheer amount of these chemicals along the harbor, in addition to their hazardous natures, is
alarming because in extreme events they may find their way into the harbor. For example, within
the investigated parcels, there are over 345,811,200 gallons of fuel stored. The issues presented
by the release of the chemicals could impact public health, the environment, and the economy.

23
Table 5: Chemical Effects on Public Health and Environment
Chemical Public Health Environment
Petroleum (CHEMTREC, n.d.) Toxic Acute aquatic toxicity,
flammable
LNG (Elengy, 2014) Frostbite, severe burns Flammable
Liquid Nitrogen(Airgas, 2016) Frostbite, severe burns N/A
Salt (MSDS, n.d.) Skin irritant, eye irritant N/A
Cane Molasses (Sugar
Australia, n.d.)
Eye irritant Depletes Oxygen levels in
Water
Ammonia (Airgas, 2017) Frostbite, severe burns Acute Aquatic Toxicity
Formaldehyde (MSDS, n.d.) Toxic, Carcinogen Flammable
Coal (URSI, 2008) Carcinogen Flammable
Portland Cement (PPC, 2016) Skin irritant Lowers pH of water
Of the nine chemicals that we know are present in the harbor, six of them are would
cause harm to a person if they were exposed. Petroleum oil and formaldehyde are the only toxic
chemicals to humans, while formaldehyde and coal dust are classified as carcinogens. The other
three chemicals that we identified as being dangerous to public health are ammonia, liquid
natural gas, and liquid nitrogen. These chemicals are stored under great pressure in their liquid
form, once exposed to the atmosphere, they would vaporize, making them less likely to be
ingested. Despite this, they can still be very harmful. Each can cause severe burns similar to
frostbite. They are also dangerous if inhaled and can cause unconsciousness. Rock salt, portland
cement, and cane molasses are all relatively safe for humans to be around. The first two can
cause skin irritation while all three can cause eye irritation. Chemicals pose many dangers to the
environment as well.
Flooding could cause facilities’ chemical storage to leak. Petroleum and ammonia are
both chemicals that are acutely toxic to aquatic life. Portland cement can change the pH of the
water and the molasses will lower the oxygen levels; these effects would lead to a heightened
mortality of aquatic life. In addition to being toxic and unstable, four of the chemicals are highly
flammable. Should they get into the harbor many of them will not mix with the water. Should
this mixture of chemicals somehow come into contact with a spark or flame, it could cause a
large portion of the harbor to catch on fire. Leakage of chemicals could also cause a detrimental
effect on the economics of region.
Both salt and petroleum would impact the economy of the surrounding area in more
severe ways than the other chemicals that we are aware of. The salt pile in Chelsea is the main

24
source of rock salt for the roads in the Greater Boston area. If the large portions of the salt were
to be washed away, the Boston Metropolitan Area would need to obtain salt from elsewhere in
short notice. Boston could also lose a large amount of petroleum during major flooding events.
With Logan International Airport being one of the largest consumers of petroleum in the area,
with over 38,000 passenger flights in August 2017 alone (MassPort, 2017), it would be greatly
impacted should the petroleum in the DPAs be lost. Planes would not be able to refuel at the
airport for some time, effectively shutting it down.
4.5 Lack of Transparency Within the DPAs
The businesses in the DPA lack transparency about flooding preparedness. Of the 16
businesses that we contacted, only two responded to us. We emailed a set of 15 different
questions to the businesses. The response below was all we had received from one of the
business representatives.
In response to your questions below, the... [Parcel]...has not had a problem with
flooding at this facility in the past, nor do we foresee any problems for the future.
This facility is highly regulated, and those regulations call for contingency plans
to cover all types of scenarios, from natural disasters to manmade events. These
contingency plans are not public information.
This shows how difficult it has been for us to get information from these businesses. We
were unable to gather a lot of data about different businesses beyond what is publically available
online. This lack of transparency makes it impossible to make any accurate statement on the
level of preparedness that exists within the DPAs. Without clear communication from DPA
businesses about their SLR preparedness, neither the city of Boston nor a third-party could
accurately predict the effects of flooding in the Boston area. This lack of transparency may come
down to the fact that we are college students and businesses may not have been sure of our
intentions, possibly afraid of self-incriminating answers.

25
Chapter 5.0: Recommendations to Better Prepare DPAs to
SLR and Coastal Storms
Within Boston’s inner harbor DPAs, many improvements can be made to planning and
regulations in order to reduce their vulnerability to SLR and coastal storms. Further research can
also be conducted in order to further evaluate the vulnerability of DPAs in the harbor. A
committee that could regulate DPA businesses’ emergency preparedness plans as well
infrastructure evaluations could help to decrease their vulnerability.
5.1 Recommendations to Better Understand Vulnerability within DPAs
Major gaps in data concerning vulnerability of Boston to the sea level rise and storm
surges still exist. The vulnerability assessment, Climate Ready Boston does not address the
DPAs in any capacity. As students reaching out to businesses, we found many unwilling to
participate or even get back to us. Though we managed to gather a lot of information on DPAs in
a short amount of time, a lot more data regarding the businesses in the DPA’s should still be
gathered.
We recommend that the Massachusetts Coastal Zone Management (CZM) and The
Boston Green Ribbon Commission (GRC) continue their partnership and produce a vulnerability
assessment of the DPAs. This is the partnership that produces the Climate Ready Boston report,
which provides an in depth understanding of Boston’s vulnerability to climate change. With their
previous experience, they can conduct their own vulnerability assessment that will give a more
detailed description of the state that the DPAs are in. This report, in conjunction with the Climate
Ready Boston report, will create a more complete understanding of the vulnerability of Boston
and its harbor to Climate Change.
5.1.1 Use of More Sophisticated Models for Vulnerability Assessments
To complete our initial vulnerability assessment of the given DPA’s parcels we utilized
the Surging Seas: Risk Zone Map to gather information about potential flood zones. Using this
source we were able to gather some preliminary information about sea level rise and its effects
on the harbor, but no detailed information such as flood depths were available for our group.
According to Paul Kirshen, a professor at the University of Massachusetts Boston, the Surging
Seas: Risk Zone Map uses the “bathtub model” to predict sea level rise. This model is not the
most detailed and or accurate ways to predict sea level rise. As we neared the end of our project,
we were given access to an extremely accurate sea level rise viewer that is not open to the public,
courtesy of the Massachusetts Department of Transportation. Due to the lack of time we were not
able to utilize these GIS maps to their fullest potential. An example of this GIS can be found
below in Figure 11. We recommend that whoever continues this research within the DPA’s
should utilize this resource as it will add extremely accurate and in depth data.

26
Figure 11:Potential Flooding of 5 Feet with Spring Tide From: given citation (2017). MassDOT-FHWA Pilot
Project Report, | Bosma et. al.. Retrieved October 3, 2017
5.2 Centralized Regulations for Emergency Preparedness Plans
Throughout the completion of this project, we found that no existing organization directly
regulates emergency preparedness plans in the DPAs. We believe this to be a serious issue.
During Hurricane Harvey the Akema chemical plant in Crosby Texas lost power to its
refrigeration units. These units were critical as without them, the stored chemicals would ignite
and explode (Gallagher, 2017). Had the Akema chemical plant been required to keep an updated
flood preparedness plan, it may not have lost power to its refrigeration units.
Without a centralized organization governing emergency preparedness in these industrial
areas, the City of Boston cannot be certain that the businesses will be prepared to handle
flooding events. We recommend that Massachusetts Coastal Zone Management (CZM), the
Department of Environmental Protection (DEP), the Massachusetts Emergency Management
Agency (MEMA), and the United States Coast Guard (USCG) form a regulatory committee
concerned with emergency preparedness plans within the DPAs. The partnership should integrate
CZM’s knowledge of businesses and infrastructure within the DPAs, DEP’s experience with
brownfield remediation, USCG’s authority over the harbor and the cargo within it, and MEMAs
experience with emergency management in Massachusetts.

27
The committee should have a set of regulations to enforce on the DPA businesses. The
two regulations that we are recommending this committee enforce are: that chemicals and
hazardous materials used by businesses within the DPAs must be stored in flood-proof
containers, and that more frequent inspections and repairs be performed on the SLR prevention
infrastructure within the DPAs. The first regulation would reduce business sensitivity to SLR and
coastal storms by reducing the risk of chemical spills. The second regulation would reduce the
business's exposure to SLR and coastal storms by ensuring that the SLR prevention infrastructure
on the sites are up to date and in good condition.
If these regulations were to be put in place, the city could be more confident that the DPA
businesses may better withstand flooding events. These regulations could reduce the
vulnerability of DPA businesses to sea level rise and coastal storm surges by limiting exposure
and sensitivity. This committee and its regulations would ensure that the unique needs of these
industrial areas are met, while simultaneously keeping the surrounding communities and
environment safe during flooding events.
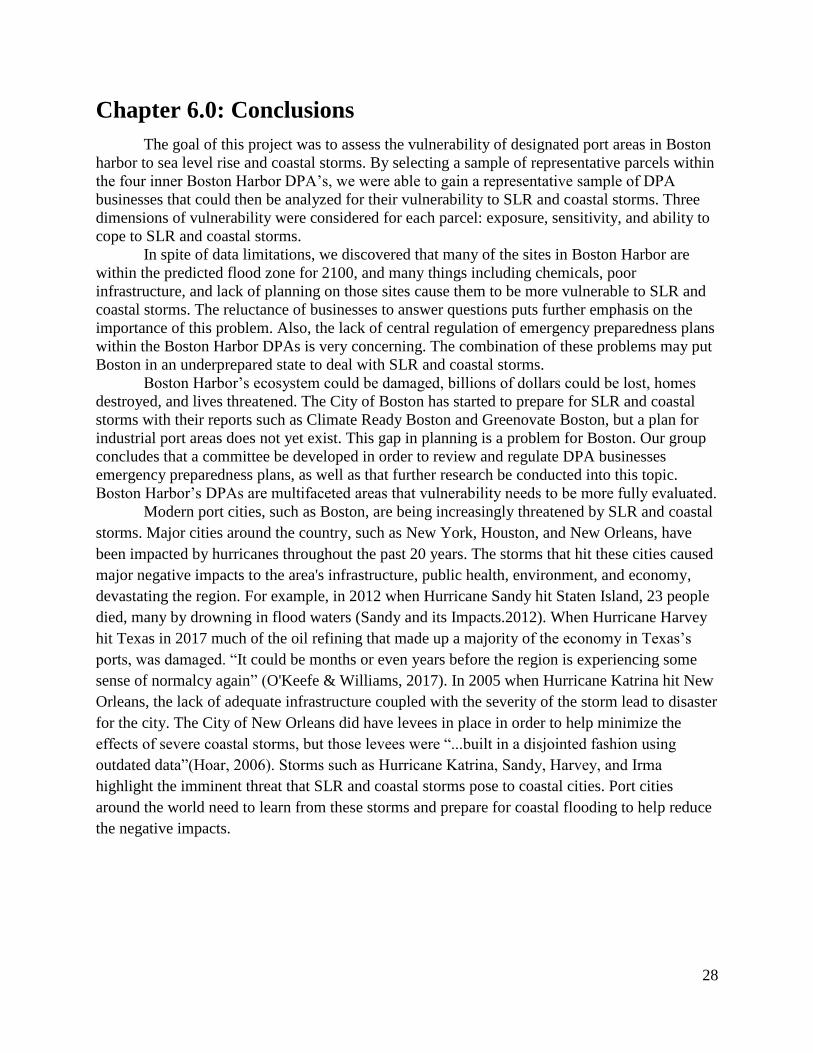
28
Chapter 6.0: Conclusions
The goal of this project was to assess the vulnerability of designated port areas in Boston
harbor to sea level rise and coastal storms. By selecting a sample of representative parcels within
the four inner Boston Harbor DPA’s, we were able to gain a representative sample of DPA
businesses that could then be analyzed for their vulnerability to SLR and coastal storms. Three
dimensions of vulnerability were considered for each parcel: exposure, sensitivity, and ability to
cope to SLR and coastal storms.
In spite of data limitations, we discovered that many of the sites in Boston Harbor are
within the predicted flood zone for 2100, and many things including chemicals, poor
infrastructure, and lack of planning on those sites cause them to be more vulnerable to SLR and
coastal storms. The reluctance of businesses to answer questions puts further emphasis on the
importance of this problem. Also, the lack of central regulation of emergency preparedness plans
within the Boston Harbor DPAs is very concerning. The combination of these problems may put
Boston in an underprepared state to deal with SLR and coastal storms.
Boston Harbor’s ecosystem could be damaged, billions of dollars could be lost, homes
destroyed, and lives threatened. The City of Boston has started to prepare for SLR and coastal
storms with their reports such as Climate Ready Boston and Greenovate Boston, but a plan for
industrial port areas does not yet exist. This gap in planning is a problem for Boston. Our group
concludes that a committee be developed in order to review and regulate DPA businesses
emergency preparedness plans, as well as that further research be conducted into this topic.
Boston Harbor’s DPAs are multifaceted areas that vulnerability needs to be more fully evaluated.
Modern port cities, such as Boston, are being increasingly threatened by SLR and coastal
storms. Major cities around the country, such as New York, Houston, and New Orleans, have
been impacted by hurricanes throughout the past 20 years. The storms that hit these cities caused
major negative impacts to the area's infrastructure, public health, environment, and economy,
devastating the region. For example, in 2012 when Hurricane Sandy hit Staten Island, 23 people
died, many by drowning in flood waters (Sandy and its Impacts.2012). When Hurricane Harvey
hit Texas in 2017 much of the oil refining that made up a majority of the economy in Texas’s
ports, was damaged. “It could be months or even years before the region is experiencing some
sense of normalcy again” (O'Keefe & Williams, 2017). In 2005 when Hurricane Katrina hit New
Orleans, the lack of adequate infrastructure coupled with the severity of the storm lead to disaster
for the city. The City of New Orleans did have levees in place in order to help minimize the
effects of severe coastal storms, but those levees were “...built in a disjointed fashion using
outdated data”(Hoar, 2006). Storms such as Hurricane Katrina, Sandy, Harvey, and Irma
highlight the imminent threat that SLR and coastal storms pose to coastal cities. Port cities
around the world need to learn from these storms and prepare for coastal flooding to help reduce
the negative impacts.

29
Chapter 7.0: References
Airgas. (2016). Material Safety Data Sheet, Liquid Nitrogen. n.p.
Airgas. (2017). Material Safety Data Sheet Ammonia. n.p.
Astor, M. (2017). ‘Flesh-Eating Bacteria’ From Harvey’s Floodwaters Kill A Woman.’ The New
York Times Retrieved from https://www.nytimes.com/2017/09/28/health/necrotizing-fasciitis-
houston-texas.html
Bosma, K., Douglas, E., Kirshen, P., McArthur, K., Miller, S., & Watson, C. (2015). MassDOT-
FHWA Pilot Project Report. MassDOT. Boston: MassDOT
Chapter 91, The Massachusetts Public Waterfront Act. (2012). Retrieved from
http://www.mass.gov/eea/agencies/massdep/water/watersheds/chapter-91-the-massachusetts-
public-waterfront-act.html
CHEMTREC. (n.d). Safety data sheet: Crude Oil. n.p.: CHEMTREC.
City of Boston. (2014). Boston Revised Hazard Mitigation Plan: 2014 update. n.p.: City of
Boston
City of Boston. (2016). Climate Ready Boston. n.p.: City of Boston.
Climate Central. (2016). Surging Seas: Risk zone map. Retrieved from
https://ss2.climatecentral.org/#12/40.7298/-74.0070?show=satellite&projections=0-RCP85-
SLR&level=5&unit=feet&pois=hide
Elengy. (2014). Material Safety Data Sheet LNG. n.p.: Elengy.
Environmental, Health, and Safety Guidelines For Fish Processing; (2007). n.p.: International
Finance Corporation
Fritz, A., & Samenow, J. (2017). Harvey Unloaded 33 Trillion Gallons of Water in the U.S.
Retrieved from https://www.washingtonpost.com/news/capital-weather-
gang/wp/2017/08/30/harvey-has-unloaded-24-5-trillion-gallons-of-water-on-texas-and-louisiana/

30
Gallagher, J. J. (2017). Hurricane Harvey Wreaks Historic Devastation: By the Numbers.
Retrieved from http://abcnews.go.com/US/hurricane-harvey-wreaks-historic-devastation-
numbers/story?id=49529063
EPA. (2011). Hazardous Materials Emergency Plan.n.p.: EPA
Health, National Center for Environmental.CDC - Mold - General Information. Retrieved from
http://www.cdc.gov/mold/dampness_facts.htm
Hewett, F. (2016). Dirty water: Good and Bad News About the Future of the Charles River.
Retrieved from http://www.wbur.org/cognoscenti/2016/08/26/boston-climate-change-frederick-
hewett
Hoar, J. (2006). Katrina Report Blames Levees. Retrieved from
https://www.cbsnews.com/news/katrina-report-blames-levees/
Horton, R., & Yohe, G. (2014). Chapter 16 Northeast. n.p. globalchange.gov.
Hurricane science: Storm Surge. (n.d.). Retrieved from
http://www.hurricanescience.org/glossary/?letter=S#glossaryword347
Inventories of Seawalls and Other Coastal Structures. (2013). Retrieved from
http://www.mass.gov/eea/agencies/czm/program-areas/stormsmart-coasts/seawall-
inventory/index.html
Ivanova, I. (2017). How Hurricane Harvey is Affecting Gas Prices. Retrieved from
https://www.cbsnews.com/news/how-hurricane-harvey-is-affecting-gas-prices/
Library, C. N. N. (2016). Hurricane Sandy Fast Facts. Retrieved from
http://www.cnn.com/2013/07/13/world/americas/hurricane-sandy-fast-facts/index.html
Martin Associates. (2012). Economic Impact of the Port of Boston.(n.p.).Martin Associates.
MassPort. (2017). Boston-Logan International Airport Monthly Airport Traffic Summary -
August 2017.n.p.:MassPort.
MSDS. (a). Material Safety Data Sheet Formaldehyde 37% Solution MSDS.(n.d.). n.p.:n.p.
MSDS. (b). Material Safety Data Sheet Sodium Chloride (Rock Salt) MSDS.(n.d.). n.p.:n.p.

31
Nature Foundation. (2017, September, 17). Assessments of Environmental Damage Carried Out
Post Hurricane Irma by The Sint Maarten Nature Foundation. Saint Martin News Network
Retrieved from http://smn-news.com/st-maarten-st-martin-news/27074-assessments-of-
environmental-damage-carried-out-post-hurricane-irma-by-the-sint-maarten-nature-
foundation.html
NOAA.Sea level rise viewer. Retrieved from https://coast.noaa.gov/digitalcoast/tools/slr
O'Keefe, L., & Williams, C. (2017). Harvey Hammers Oil Refineries, Impacts Spill Into
Commercial Real Estate. Retrieved from https://www.bisnow.com/national/news/energy/harvey-
slams-into-us-refineries-why-the-commercial-real-estate-industry-should-care-78293
Pierre-Louis, K. (2017, August 25,). Hurricane Harvey is Hitting Texas Even Harder Than
Expected. Here's What You Need To Know. Popular Science,
Portland. (2014). Risk and Vulnerabilities Assessment Climate Change Preparation Strategy.
Retrieved from https://multco.us/file/36550/download
PPC. (2016). Material Safety Data Sheet For Cement. Retrieved from
https://www.ppc.co.za/media/18085/MSDS-Cementitous-Materials-Safety.pdf
Rosoff, M. (2017). Hurricane Harvey: Refineries Shutting Down. Retrieved from
https://www.cnbc.com/2017/08/27/hurricane-harvey-refineries-shutting-down.html
City of New York. (2012). Sandy and Its Impacts. n.p.: City of New York.
Sifferlin, A. (2017, Aug 29,). Here's How Dirty Flood Water Really Is. Time.
Sugar Australia. Material Safety Data Sheet Cane Molasses. (n.d.). n.p.: Sugar Australia
URSI. (2008). Material Safety Data Sheet Coal Dust. n.p.:URSI.
US EPA, O. A. (a). Climate Change Indicators: Sea Level. Retrieved from
https://www.epa.gov/climate-indicators/climate-change-indicators-sea-level
US EPA, O. A. (b). Climate Impacts in The Northeast. Retrieved from
https://www.epa.gov/climate-impacts/climate-impacts-northeast
Walsh, M. J. (2014). Greenovate Boston: 2014 Climate Action Plan Update. Boston: City of
Boston
32
Woolhouse, M. (2014). Report Touts Economic Impact Value of Port of Boston - The Boston
Globe. Retrieved from https://www.bostonglobe.com/business/2014/07/20/report-touts-
economic-impact-value-port-boston/44iuIALcbuyvlgw6RtrWrM/story.html

33
Chapter 8.0: Appendices
Appendix A: Mystic River DPA Boundaries
The following DPA boundary maps outline DPA boundaries.
Mystic River DPA Boundaries courtesy of Massachusetts Government. (2016). Chapter 91, The Massachusetts
Public Waterfront Act | MassDEP. Retrieved April 24, 2017.

34
Appendix B: Chelsea Creek DPA Boundaries
Chelsea Creek DPA Boundaries courtesy of Massachusetts Government. (2016). Chapter 91, The Massachusetts
Public Waterfront Act | MassDEP. Retrieved April 24, 2017.

35
Appendix C: South Boston DPA Boundaries
South Boston DPA Boundaries courtesy of Massachusetts Government. (2016). Chapter 91, The Massachusetts
Public Waterfront Act | MassDEP. Retrieved April 24, 2017.

36
Appendix D: East Boston DPA Boundaries
East Boston DPA Boundaries courtesy of Massachusetts Government. (2016). Chapter 91, The Massachusetts
Public Waterfront Act | MassDEP. Retrieved April 24, 2017

37
Appendix E: Boston Inner Harbor DPA Boundaries
Inner Boston Harbor DPA Boundaries courtesy of Massachusetts Government. (2016). Chapter 91, The
Massachusetts Public Waterfront Act | MassDEP. Retrieved April 24, 2017.

38
Appendix F: Python Code
This is the Python 3.5 code for our parcel picking process

39
Appendix G: Parcel Land Use
Industry % of land used Number of parcels selected
Boat Repair 9.72 0
Cargo 20.52 4
Fish Processing 0.28 0
Fuel 35.25 5
Mooring 7.83 1
Old Industrial 16.52 2
Salt 0.59 0
Vacant/Parking 9.13 3
This is a table showing the percentage of land in the DPAs used by each industry. These
percentages were used to weight our random sample.

40
Appendix H: Generic Email and Phone Script
Dear____________,
We are a team of four Worcester Polytechnic Institute (WPI) students completing
our Interactive Qualifying Project (IQP), which is a research project all students
are required to complete in order to graduate. For our project, our sponsor is the
nonprofit Boston Harbor Now. We are gathering data about specific businesses
within the Designated Port Areas of Boston Harbor and we were hoping to ask
you a few questions about your business. We are on a tight schedule and it would
be helpful if we could hear back from you by September 15th. If you would be
willing to meet with us either in person or over the phone it would be greatly
appreciated. You can contact us at [email protected].
Thank you,
Austen Crawford, Caroline Warchol, Jacob Bouchard, And Kyle Whittaker
This is the generic email that we initially sent out to each DPA business that we wanted to talk
to.

41
Appendix I: Generic Questions
1. How long have you been working at______?
2. What is your job here?
3. What does your business “do” (have specific questions based on the
business)
4. Have you experienced flooding in the past?
a. If so, how severe was it and how did you cope?
b. What are your emergency flooding plans at this company?
5. Are you familiar with the SLR prevention infrastructure on your property?
a. If so, do you believe it to be in good condition?
b. Did it help to prevent/ lessen the flooding
6. When was this building last refurbished/updated?
7. What types of chemicals does this company use?
a. How are they stored?
b. Has your company thought about changing the way chemicals are
stored?
8. Is your company concerned about SLR or severe storms?
a. Are there any plans being made to address these concerns
This is the list of generic questions that we asked businesses to answer either over the phone or
through email.

42
Appendix J: Water Taxi Route
This the map of the route that we planned to take on our water taxi. In reality we did not go as far
up Chelsea Creek.

43
Appendix K: CZM Infrastructure Sheets
These structure assessment forms were taken from CZM’s Coastal Infrastructure Inventory and
Assessment. The below forms are for structures on our selected parcels.

44

45

46

47

48

49

50

51

52

53

54

55

56

57

58
Massachusetts Department of Conservation and Recreation Office of Waterways. (2009). Massachusetts
coastal infrastructure inventory and assessment project. ().

59
Appendix L: Hazardous Materials Emergency Plan
THE COMMONWEALTH OF MASSACHUSETTS
EXECUTIVE OFFICE OF PUBLIC SAFETY AND SECURITY
_____________________________
MASSACHUSETTS EMERGENCY MANAGEMENT AGENCY 400 Worcester Road Framingham, MA 01702-5399
TO: Massachusetts Tier II Reporting Entities
FROM: Kurt N. Schwartz
Director, Massachusetts Emergency Management Agency
Chair, Massachusetts State Emergency Response Commission
THROUGH: Massachusetts State Emergency Response Commission
CC: Massachusetts Emergency Planning Committees and Fire Departments
RE: Tier II Reporting Year 2016: Massachusetts State Emergency Response
Commission Reporting Requirements
DATE: December 29, 2016
Facilities covered by the reporting requirements of the federal Emergency Planning and
Community Right-to-Know Act (EPCRA) must submit Tier II reports to their: Emergency
Planning Committee (EPC), their Local Fire Department, and the State Emergency
Response Commission (SERC) annually. Tier II Reports for 2016 must be filed by March 1,
2017.
The Massachusetts Emergency Management Agency (MEMA) has, per Governor’s
Executive Memorandum, been designated as the State Emergency Response Commission
(SERC) in Massachusetts.
This memorandum is being sent to Massachusetts Tier II reporting entities on behalf of the
Massachusetts SERC. This memorandum is specific to the Massachusetts SERC Tier II
reporting requirements for Reporting Year (RY) 2016.
For Reporting Year 2016, the Massachusetts SERC will require filers to submit reports via

60
the web-based Tier II Manager System. The SERC will not accept reports developed or
submitted via other means.
This only affects how Tier II reports are submitted to the Massachusetts SERC; this does
not change any Massachusetts EPC and/or Fire Department reporting requirements.
Filers should contact their respective EPC and Fire Department regarding their reporting
requirements.
The fact that you are receiving this memorandum does not necessarily mean you are
required to file a Tier II report. It does mean you should determine whether the federal Tier
II regulations are applicable to your facility. Please use the reference table below to assist in
this determination.
Tier II reporting thresholds:
Extremely hazardous
substances (EHS)*
500 pounds (227 kg) or threshold planning
quantity, whichever is less.
All other hazardous substances: 10,000 pounds (4,540 kg) for any material
that has an SDS
*You may obtain a list of EHS substances on the EPA website here:
https://www.epa.gov/epcra/final-rule-extremely-hazardous-substance-list-
and-threshold-planning-quantities-emergency
Use of the Tier II Manager System:
The Tier II Manager System is now ready for 2016 reporting. The URL for the Tier II system
is: http://massachusetts.idsimaps.com.
New filers must first register to use the Tier II Manager System. Registration is a one-time
process; if you have already registered you do not need to do so again.
To register, please follow the steps outlined within MEMA’s Tier II Manager System: Filer
Registration Process memo, which may be found on MEMA’s website at:
http://www.mass.gov/eopss/agencies/mema/resources/serc/. This memo also contains the
system requirements needed to use the Tier II Manager System. Once you have successfully
registered, you may use the Tier II Manager System.

61
If you have lost or forgotten your Username and/or Password, you may re-set them via the
System’s website.
If you have filed a Tier II report with MEMA in a prior year, but do not see this in the System
please contact MEMA for assistance.
A User’s Guide (comprised of powerpoint slides and FAQ’s) and training video will be
available on the Tier II Manager System website. To access the User’s Guide materials, log-
in to the System, click Continue, then click the green ‘?’
A link to the training video will be on the Tier II Manager System’s home page. The training
video provides an overview on how to access and use the System, including changes to the
System’s ‘export tool’. MEMA highly recommends that filers review the User’s Guide
materials and/or training video prior to developing their RY 2016 report.
To facilitate use of the Tier II Manager System by filers, MEMA is providing a ‘Tier II
Submit export tool’ within the Tier II Manager System. There have been some changes to
this tool, and directions on use of this tool may be found within the User’s Guide materials
and training video.
Once a filer completes and submits a report via the Tier II Manager System, the export
tool will convert their report into a format that may be used with the EPA’s Tier II Submit
software and CAMEO.
The converted file may then be submitted – by the filer – to its respective EPC and Fire
Department per their reporting requirements.
As a change from last year, the exported reports function will work off-line. This is being
done to minimize disruptions to the System. Detailed instructions on use of the export tool
may be found in the User’s Guide materials and training video. As an additional change,
exported reports will be converted directly into a .t2s format that is compatible with the
EPA’s Tier II Submit software.
Once you have created a file using the Export Tool it is important that you carefully review
the export file to ensure that it is accurate. In particular, if converting a Tier II Manager file
to a Tier II Submit file, you may receive Tier II Submit validation errors for: attachments
over 2MB; latitude and longitude coordinates; NAICS codes; or facility contact last name. If
you receive a validation error, you must open the Tier II Submit file and manually correct
the information before the file is sent to the EPC and/or FD.

62
Massachusetts-Specific Tier II Reporting Fields:
Massachusetts uses state-specific Tier II data fields and guidance on how filers should
complete these fields is found within the Tier II Manager System.
Other SERC Tier II Reporting Information:
The following apply to the Massachusetts SERC. Your EPC and/or Fire Department may
have different reporting requirements.
§ If you submit a report via the Tier II Manager System you will receive an automatic reply
acknowledging receipt.
§ Submitting a report via the Tier II Manager System does NOT fulfill your EPC and Fire
Department reporting requirement. Filers must still submit reports to their respective EPC
and Fire Department.
§ There is no filing fee for the SERC.
§ The SERC does not require submission of SDS’ or facility site plans.
§ A list of EPCs in Massachusetts may be found on MEMA’s website here:
http://www.mass.gov/eopss/docs/mema/resources/serc/all-epc-spreadsheet-november-
2016.pdf
If you have any questions regarding this memorandum please contact Mayra Quintana
(508.820.204; [email protected]); Jeff Timperi (508.820.2019;
[email protected]); or Paula Krumsiek (508.820.1424; [email protected]).
From: http://www.mass.gov/eopss/agencies/mema/resources/serc/

63
Appendix M: Vulnerable Population Maps
Boston Inner Harbor Vulnerability Population Exposure Map From: (2017). Surging Seas: Risk Zone Map, |
NOAA. Retrieved April 5, 2017
This map defines social vulnerability as the ability of communities to prepare and
respond to hazards like flooding. "High" and "low" indicate the 20% most and least vulnerable in
coastal areas of each state during a 5 ft. SLR scenario. The yellow color represents low exposure,
orange represents medium exposure, and red represents high exposure. Census tract resolution
data. Data source: Hazards and Vulnerability Research Institute (HVRI)'s Social Vulnerability
Index. (Map layer currently available only within the U.S.)

64
Boston Inner Harbor Affected Population Map From: (2017). Surging Seas: Risk Zone Map, | NOAA. Retrieved
April 5, 2017
This map shows the people per square mile exposed to flooding events during 5 ft SLR. The key
for this map can be seen below.
65
Appendix N: Authorship
Abstract - Primary Writer: All, Primary Editors: All
1.0 Introduction – Primary Writers: All
Primary Editors: All
2.0 Background – Primary Writers: All, Primary Editor: All
2.1 – Primary writer: Austen Crawford
2.2 – Primary writer: Kyle Whittaker
2.3 – Primary writer: All
2.4 – Primary writer: All
3.0 Methodology – Primary Writers: All, Primary Editor: All
3.1 - Primary writer: Austen Crawford and Jacob Bouchard
3.2 - Primary writer: All
3.3 - Primary writer: Caroline Warchol, Kyle Whittaker, Jacob Bouchard
4.0 Findings - Primary Writers: All, Primary Editor: All
4.1 - Primary writer: Jacob Bouchard and Kyle Whittaker
4.2 - Primary writer: Austen Crawford and Caroline Warchol
4.3 - Primary writer: All
4.4 - Primary writer: Caroline Warchol and Kyle Whittaker
4.5 - Primary writer: Jacob Bouchard and Kyle Whittaker
5.0 Recommendation - Primary Writers: All, Primary Editor: All
5.1 - Primary writer: Jacob Bouchard and Kyle Whittaker
5.2 - Primary writer: Jacob Bouchard and Kyle Whittaker
6.0 Conclusion- Primary Writers: All, Primary Editor: All
7.0 References - Primary Writer: Jacob Bouchard
8.0 Appendices - Primary writer: All