Embed Size (px)
Citation preview
Evaluating the Spraycan: understanding participant interaction with a PPGIS
J. J. Huck 1, D. Whyatt 2 and P. Coulton 1
1 Imagination Lancaster, LICA, Lancaster University
2 Lancaster Environment Centre, Lancaster University
March 9th 2015
Summary Whilst widely accepted as an important facet of software design, the evaluation of PPGIS usability is often overlooked in research. This work comprises a novel approach to the evaluation of the Spraycan
PPGIS, whereby rich insights into participant behaviour are drawn from data that are natively collected by the platform as opposed to through additional questionnaires, log files or similar. The
approach will be validated against a ‘traditional’ questionnaire, before conclusions are drawn relating to the usability of the Spraycan as a platform for the collection of vague spatial data, in the hope of
developing a greater understanding into the way in which people interact with geographic problems.
KEYWORDS: PPGIS, Fuzzy Geography, Place, HCI, Usability. 1. Introduction Huck et al. (2013, 2014) introduced the Spraycan PPGIS platform for capturing imprecise notions of place from the public. Utilising an airbrush interface and the multi-point-and-attribute relational data structure, this PPGIS is designed to collect geographic data from participants without restricting those data to the primitive point, line and polygon structures upon which traditional systems rely. Rather, a participant may use the airbrush interface to define ‘fuzzy’ geographic regions, without defined boundaries, and with variations in intensity of the spray reflecting perceived spatial variations in membership or meaning. Whilst this platform has successfully been used for a range of applications, there has thus far been no investigation into how participants use and interact with the map and interface. Public Participatory GIS (PPGIS) typically refers to a system for the collection of geospatial data from the public, and is a concept that may be traced back to Carver (1991). PPGIS aims to produce maps and spatial stories that help to characterise the local space (Bugs, 2010), a goal which can be limited by the difficulties associated with the collection of non-Cartesian, contradictory, or shifting forms of knowledge (Elwood, 2006; Montello et. al. 2003; Huck et. al. 2014). It is the collection of ‘vague’ or ‘fuzzy’ data such as these that the Spraycan aims to facilitate. Sieber (2006) and Rinner (2009) lament the lack of studies designed to measure the effectiveness of PPGIS’, with emphasis traditionally placed upon the development of the systems themselves, rather than the study of whether the system is useful or how it is used (Zhao and Coleman, 2006). Some projects have addressed this issue using techniques drawn from the discipline of Human-Computer Interaction (HCI) (Haklay and Tobon, 2002; Haklay and Tobon, 2003; Zhao and Coleman, 2006; Bugs, 2010). HCI examines the interaction between humans and computers and the extent to which a computer system supports users to achieve specific goals (Zhao and Coleman, 2006). Haklay and Tobon (2003) suggest that HCI studies are vital to the success of PPGIS because they aim to understand how people interact with computer applications, and therefore help researchers understand users’ expectations as well as the ways in which they use, understand and value the
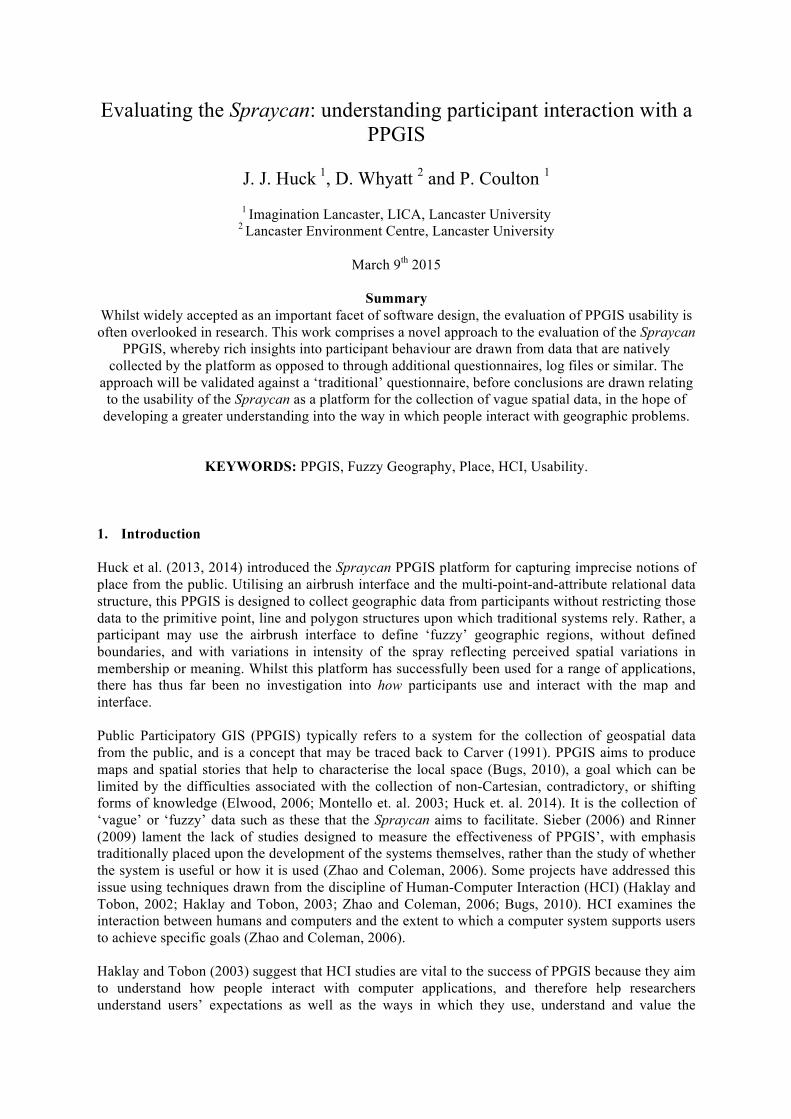
system (Zhao and Coleman, 2006). Attempts to apply HCI techniques to PPGIS thus far have relied upon techniques such as audio and screen recording, ‘thinking aloud’ protocols, the examination of system log files, interviews, and questionnaires (Haklay and Toban, 2002; Demsar, 2007). The Spraycan platform, however, provides the facility to undertake some investigation into participant interactions ‘natively’, using the data that are already collected as part of the analysis, thus reducing the requirement for expensive and invasive evaluation techniques as well as allowing for the retrospective analysis of data collected in previous surveys. This ‘native’ approach is, however, of limited use without validation, and so this work will also employ a traditional survey questionnaire for comparison, in order to assess the extent to which the findings from these ‘native’ techniques match those from more ‘traditional’ HCI approaches. As well as the validation of the ‘native’ approach, this work will also comprise an investigation into how participants interact with the Spraycan, in order to learn more about the suitability of this platform for the collection of vague spatial data from participants. 2. Methodology The airbrush interface of the Spraycan allows participants to construct vaguely defined regions by continuously adding random dots within a specified distance of the mouse location. Each individual ‘dot’ of paint created by the user is stored in the multi-point-and-attribute data format along with a number of attributes relating to its own spatial and aspatial properties, including properties relating to the user that created it (illustrated in Figure 1). These attributes include: a latitude-longitude location; a millisecond timestamp; the zoom level of the map at the point of creation; the bounds of the map at the point of creation; and free text comments provided by the participant, amongst others.
Figure 1: Illustration of the multi-point-and-attribute data format, with each ‘dot’ of paint related to a number of attributes. Reproduced from Huck et. al. (2014).

A group of 100 undergraduate geography students at Lancaster University have participated in this analysis, which comprised a short spatial survey using the Spraycan (via http://map-me.org), followed by a questionnaire (via http://www.surveymonkey.com) allowing them to reflect upon their experience. The questions from the Map-Me survey are given below, with one spatial question (in bold, answered by spraying onto the map) accompanied by three aspatial ‘contextual’ questions (bullet-points, answered with free-text):
• Where do you feel safe in Lancaster? – What do you call this area? – How often do you go there? – What makes it feel safe?
• Where do you feel unsafe in Lancaster?
– What do you call this area? – How often do you go there? – What makes it feel unsafe?
A screenshot of one of the above questions is shown in Figure 2. Automated analysis of the collected spray patterns and their associated attributes will permit investigation into how the Spraycan is used, how effective it is in the collection of spatially-vague thoughts and feelings from participants, and whether or not any bias may be introduced into surveys by the interface or platform itself. Findings relating to these topics will then be compared to supporting questions asked via the ‘traditional’ questionnaire, in order to evaluate the quality of such analysis in comparison to more traditional techniques.
Figure 2: Screenshot of one of the questions from the Map-Me survey (via http://map-me.org). Participants use the Spraycan interface to answer the spatial question (in bold), and the free-text boxes to answer the aspatial questions, which are intended to add context to the spray patterns.
In order to explore these themes, each participant was directed to a web address, which redirected them to one of five different Map-Me surveys using a pseudorandom number generator. Each of these

surveys comprised exactly the same questions, but there were differences in the survey itself such as: the order of the questions, initial map location, initial zoom level and initial base map (road map, aerial photography, terrain map etc). In this way, analyses may be undertaken in order to identify the impact of these changes upon the data created by the participants, as well as an overall assessment of the way in which participants use the Spraycan platform. Results of these analyses may then be compared with the results of the questionnaire in order to validate these native, automated approaches to the investigation of HCI with a PPGIS. 3. Preliminary Results Figure 3 demonstrates the overall ‘consensus’ of where participants identified as ‘safe’ and ‘unsafe’ around Lancaster, calculated as described by Huck et al. (2014). The patterns here are very much ‘as expected’, with Lancaster town centre, the University campus, the Infirmary (hospital) and areas of parkland generally considered to be ‘safe’ places; whilst outlying areas including some housing estates and main roads are generally considered to be more ‘unsafe’.
Figure 3: A map displaying the ‘consensus’ of all participants of whether or not an area is considered
to be ‘safe’ or ‘unsafe’ around Lancaster (calculated as per Huck et al. 2014). Some examples taken from the preliminary stages of the analysis described in this abstract are given in Figure 4. Figure 4a displays all of the different ‘places’ (each in a different random colour) that were identified by participants within the study area. Each of these places has been named and reasoned as ‘safe’ or ‘unsafe’ by each participant for use in further analysis. Figure 4b shows the track taken by the Spraycan tool (green) all of the participants, allowing interrogation of how participants moved around the map. The expected focus upon the town centre (upper hotspot) and University campus (lower hotspot) are clearly visible. Figure 4c illustrates the position and bounds of
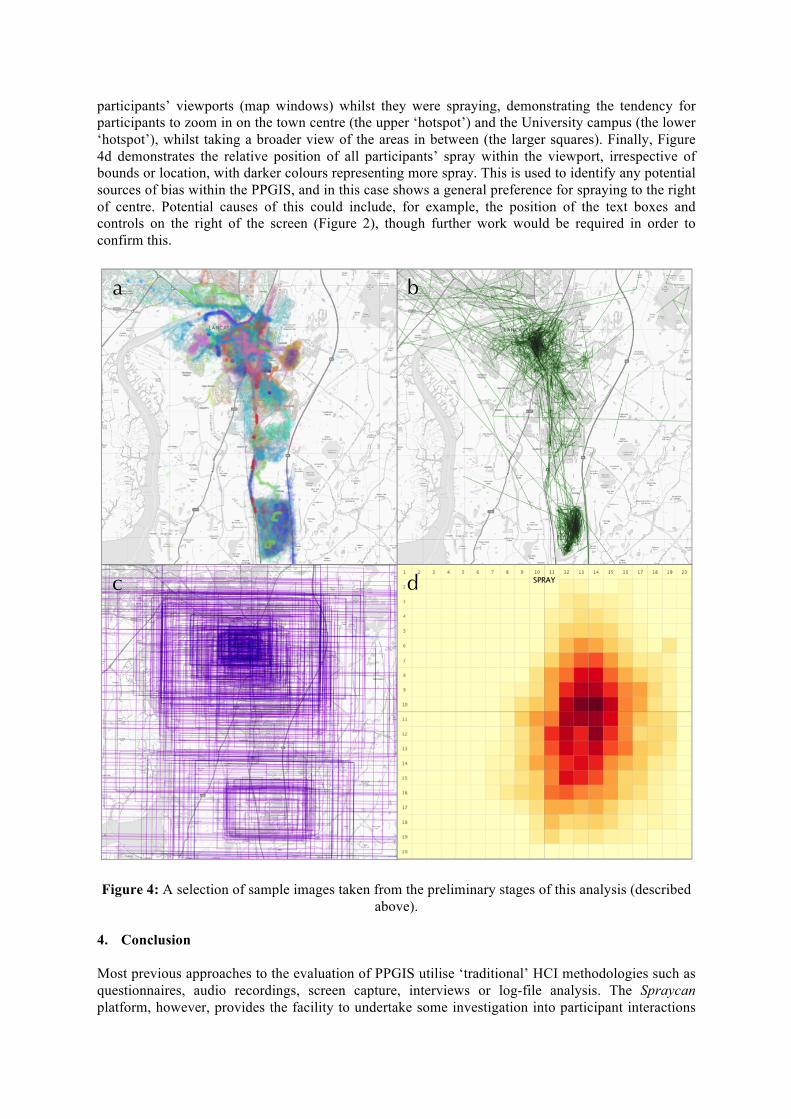
participants’ viewports (map windows) whilst they were spraying, demonstrating the tendency for participants to zoom in on the town centre (the upper ‘hotspot’) and the University campus (the lower ‘hotspot’), whilst taking a broader view of the areas in between (the larger squares). Finally, Figure 4d demonstrates the relative position of all participants’ spray within the viewport, irrespective of bounds or location, with darker colours representing more spray. This is used to identify any potential sources of bias within the PPGIS, and in this case shows a general preference for spraying to the right of centre. Potential causes of this could include, for example, the position of the text boxes and controls on the right of the screen (Figure 2), though further work would be required in order to confirm this.
Figure 4: A selection of sample images taken from the preliminary stages of this analysis (described
above). 4. Conclusion Most previous approaches to the evaluation of PPGIS utilise ‘traditional’ HCI methodologies such as questionnaires, audio recordings, screen capture, interviews or log-file analysis. The Spraycan platform, however, provides the facility to undertake some investigation into participant interactions
a b
c d

‘natively’ using the data that are already collected as part of the analysis, thus reducing or even removing the requirement for additional evaluation techniques, as well as permitting the retrospective analysis of data collected in previous surveys. This work will aim to validate these ‘native’ approaches by comparison of findings with those of a traditional questionnaire, and to learn more about how participants use the Spraycan; gaining deeper insights into the factors that influence the way that people interact with vague geographic problems. 5. Biography Jonny Huck is a 4th year part-time PhD student researching Geographical Information Science jointly with Imagination Lancaster and the Lancaster Environment Centre at Lancaster University. His interests include web mapping, the representation of ‘place’, geospatial visualisation, and the application of new technologies to spatial analysis. Dr Duncan Whyatt is a Senior Lecturer in GIS within the Lancaster Environment Centre, Lancaster University. His research interests span social and environmental applications of GIS, with specialisms in air pollution. Dr Paul Coulton is a Senior Lecturer in Design within Imagination Lancaster. His research interests are primarily around experience design, interaction design, and design fictions. His research often encompasses an ‘in the wild’ evaluation methodology, utilising ‘app stores’ and social networks as experimental platforms. References Bugs, G., Granell, C., Fonts, O., Huerta, J., & Painho, M. (2010). An assessment of Public
Participation GIS and Web 2.0 technologies in urban planning practice in Canela, Brazil. Cities, 27(3), 172-181.
Carver, S. J. (1991). Integrating multi-criteria evaluation with geographical information systems.
International Journal of Geographical Information System, 5(3), 321-339. Demšar, U. (2007). Combining formal and exploratory methods for evaluation of an exploratory
geovisualization application in a low-cost usability experiment. Cartography and Geographic Information Science, 34(1), 29-45.
Elwood, S. (2006). Critical issues in participatory GIS: Deconstructions, reconstructions, and new
research directions. Transactions in GIS, 10(5), 693-708. Haklay, M., & Tobón, C. (2002). Usability Engineering and PPGIS-Towards a Learning-improving
Cycle. http://discovery.ucl.ac.uk/16784/1/16784.pdf. Retrieved 24th October 2014. Haklay, M., & Tobón, C. (2003). Usability evaluation and PPGIS: towards a user-centred design
approach. International Journal of Geographical Information Science, 17(6), 577-592. Huck, J., Whyatt, D., & Coulton, P. (2013). Development and application of a "spray-can" tool for
fuzzy geographical analysis. In Proceedings of the GIS Research UK 21st Annual Conference. Huck, J., Whyatt, D., & Coulton, P. (2014). Spraycan: A PPGIS for capturing imprecise notions of
place, Applied Geography, 55, 229-237. Montello, D. R., Goodchild, M. F., Gottsegen, J., & Fohl, P. (2003). Where's downtown?: Behavioral
methods for determining referents of vague spatial queries. Spatial Cognition & Computation, 3(2-

3), 185-204. Rinner, C., & Bird, M. (2009). Evaluating community engagement through argumentation mapsöa
public participation GIS case study. Environment and Planning B: Planning and Design, 36, 588-601.
Sieber, R. (2006) Public Participation Geographic Information Systems: A Literature Review and
Framework. Annals of the Association of American Geographers. 96 (3), 491-507. Zhao, J., & Coleman, D. J. (2007). An empirical assessment of a web-based PPGIS Prototype. In
Submitted to the 2007 Annual Conference of the Urban and Regional Information Systems Association.


![[Date] [Participant Name Participant Address1 …Date] [Participant Name Participant Address1 Participant City ST Zip] Dear Participant: RE: Request for Hardship Distribution under](https://img.pdfslide.us/doc/110x75/5b002b357f8b9af1148c48bc/date-participant-name-participant-address1-date-participant-name-participant.jpg)


![January 10, 2012 [Participant Name] [Participant Street ......January 10, 2012 [Participant Name] [Participant Street Address] [Participant City, State Zip code] Dear [Participant](https://img.pdfslide.us/doc/110x75/5f8ad691c7ddf87a4309ec05/january-10-2012-participant-name-participant-street-january-10-2012.jpg)