Embed Size (px)
Citation preview
©2016 MFMER | slide-1
Evaluating the Role of MRSA Nasal Swabs
Josh Arnold, PharmD PGY1 Pharmacy Resident Pharmacy Grand Rounds
February 28, 2017
©2016 MFMER | slide-2
Objectives
• Identify the pathophysiology of MRSA nasal colonization
• Discuss current evidence for the utility of MRSA nasal swabs in specific patient populations
• Describe the clinical considerations associated with MRSA nasal swabs
©2016 MFMER | slide-3
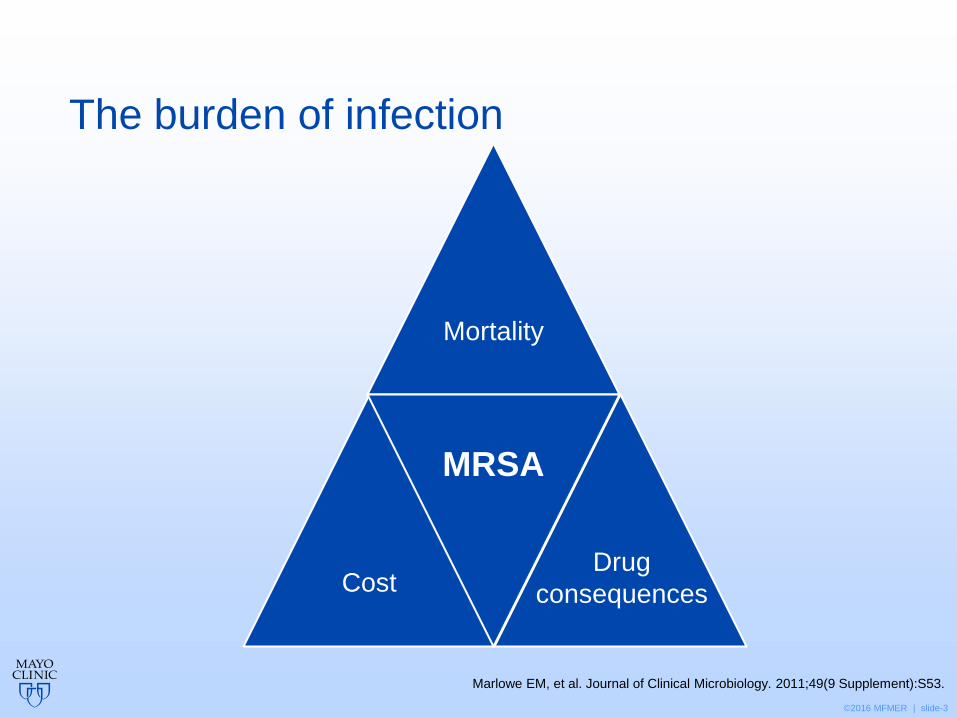
The burden of infection
Mortality
Cost
MRSA
Marlowe EM, et al. Journal of Clinical Microbiology. 2011;49(9 Supplement):S53.
Drug
consequences
©2016 MFMER | slide-4
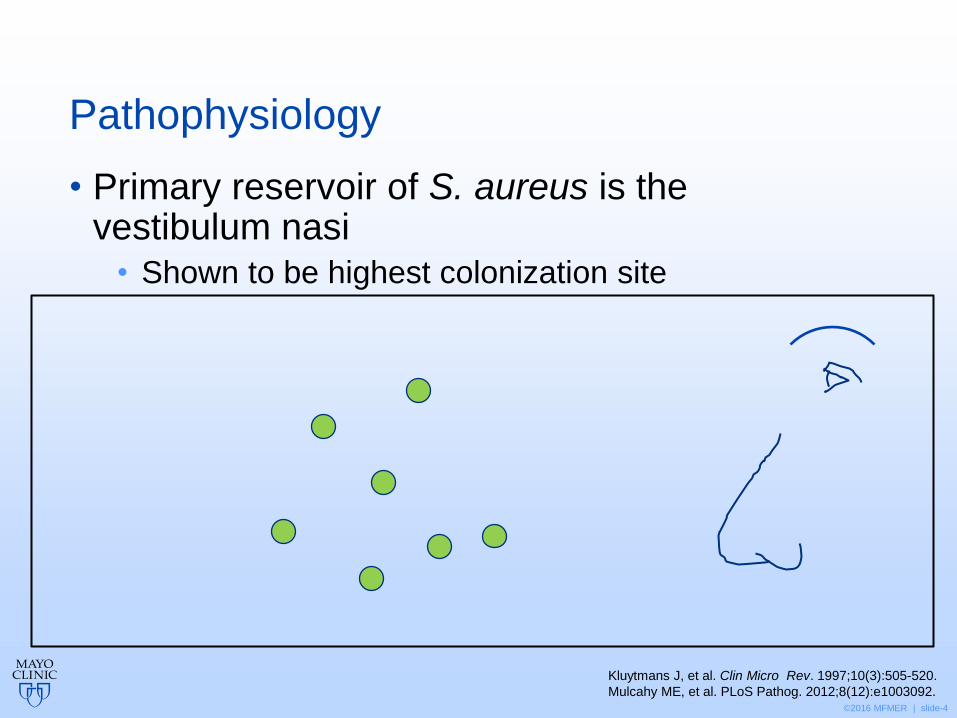
Pathophysiology
• Primary reservoir of S. aureus is the vestibulum nasi
• Shown to be highest colonization site
Kluytmans J, et al. Clin Micro Rev. 1997;10(3):505-520.
Mulcahy ME, et al. PLoS Pathog. 2012;8(12):e1003092.

©2016 MFMER | slide-5
Pathophysiology
• Primary reservoir of S. aureus is the vestibulum nasi
• Shown to be highest colonization site
- S. aureus with ClfB
- Loricrin
Kluytmans J, et al. Clin Micro Rev. 1997;10(3):505-520.
Mulcahy ME, et al. PLoS Pathog. 2012;8(12):e1003092. ClfB: clumping factor B
©2016 MFMER | slide-6
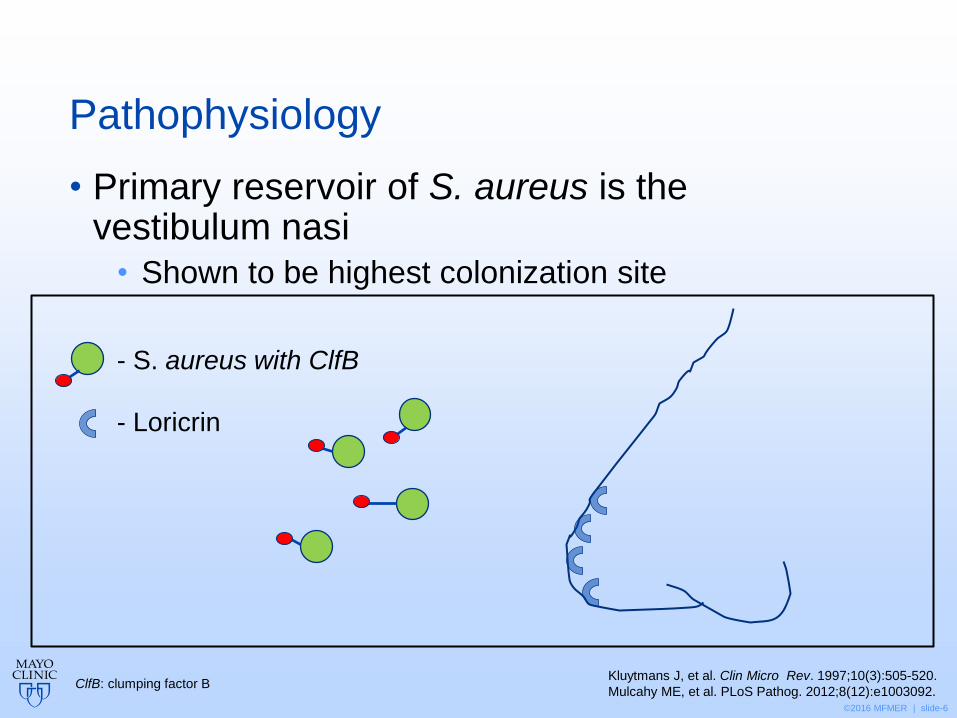
Pathophysiology
• Primary reservoir of S. aureus is the vestibulum nasi
• Shown to be highest colonization site
- S. aureus with ClfB
- Loricrin
Kluytmans J, et al. Clin Micro Rev. 1997;10(3):505-520.
Mulcahy ME, et al. PLoS Pathog. 2012;8(12):e1003092. ClfB: clumping factor B
©2016 MFMER | slide-7
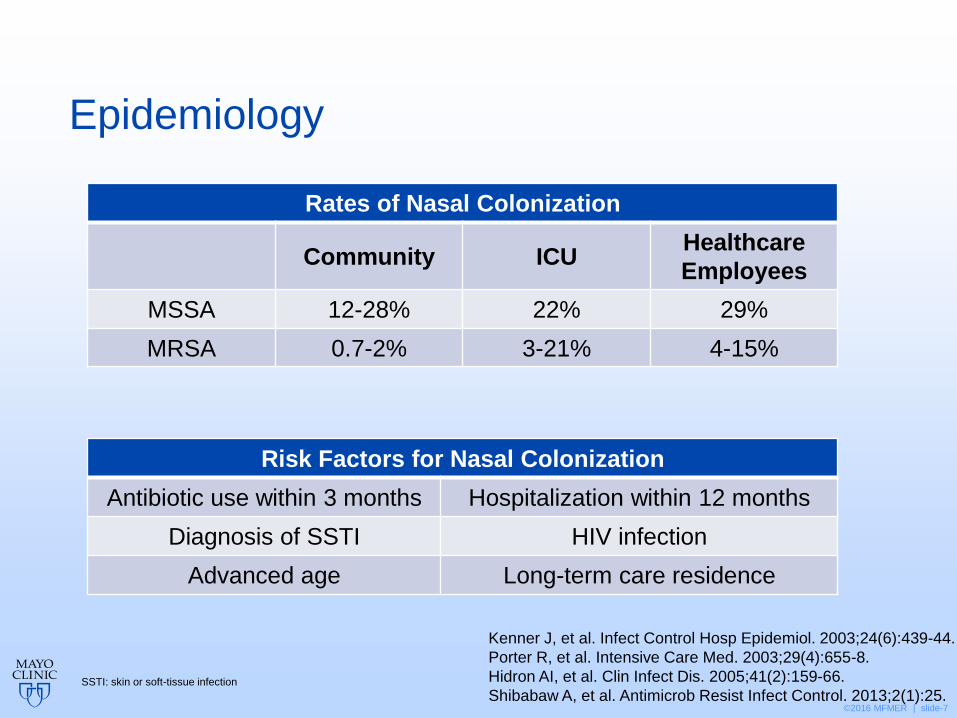
Epidemiology
SSTI: skin or soft-tissue infection
Kenner J, et al. Infect Control Hosp Epidemiol. 2003;24(6):439-44.
Porter R, et al. Intensive Care Med. 2003;29(4):655-8.
Hidron AI, et al. Clin Infect Dis. 2005;41(2):159-66.
Shibabaw A, et al. Antimicrob Resist Infect Control. 2013;2(1):25.
Risk Factors for Nasal Colonization
Antibiotic use within 3 months Hospitalization within 12 months
Diagnosis of SSTI HIV infection
Advanced age Long-term care residence
Rates of Nasal Colonization
Community ICU Healthcare
Employees
MSSA 12-28% 22% 29%
MRSA 0.7-2% 3-21% 4-15%
©2016 MFMER | slide-8
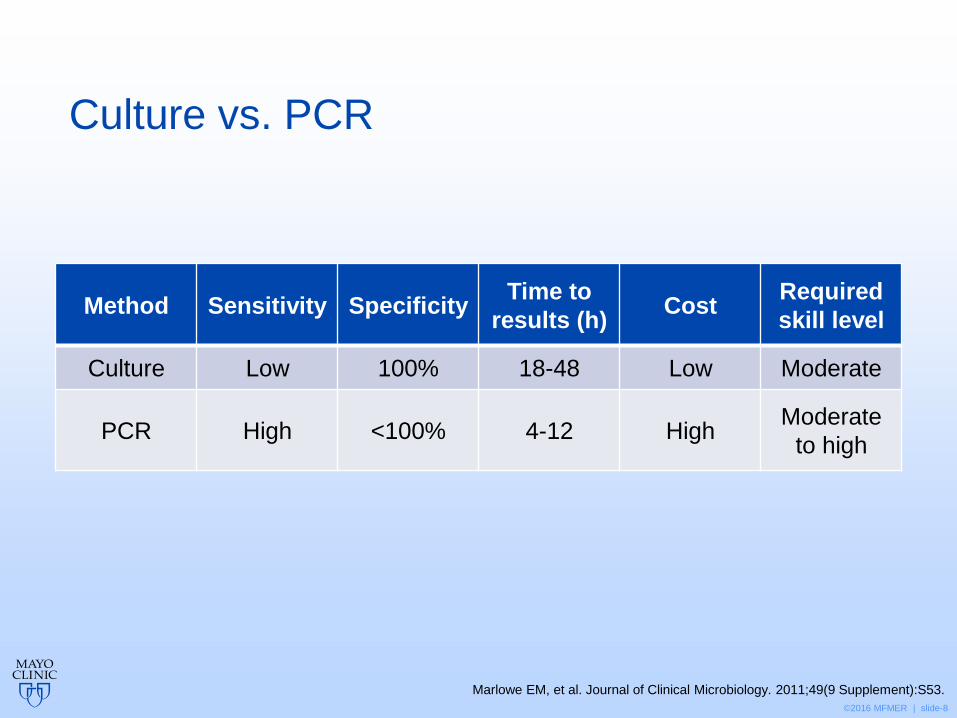
Culture vs. PCR
Method Sensitivity Specificity Time to
results (h) Cost
Required
skill level
Culture Low 100% 18-48 Low Moderate
PCR High <100% 4-12 High Moderate
to high
Marlowe EM, et al. Journal of Clinical Microbiology. 2011;49(9 Supplement):S53.
©2016 MFMER | slide-9
What gene detected by PCR is associated with methicillin-resistant S. aureus?
A. Loricrin
B. mecA
C. VISA
D. ClfB

©2016 MFMER | slide-10
Universal screening
• Prospective, interventional case-control study
• Two community hospitals approximately 175 beds Design
• 15,049 adults
• All adults admitted during study period Population
• Evaluate the clinical effectiveness and cost-benefit of universal versus targeted screening for MRSA to prevent hospital-acquired MRSA infections
Objective
• 9-month baseline: targeted screening for both hospitals
• 5-month intervention: universal screening at intervention hospital
Intervention
Leonhardt KK, et al. Infect Control Hosp Epidemiol 2011;32(8):797-803
©2016 MFMER | slide-11
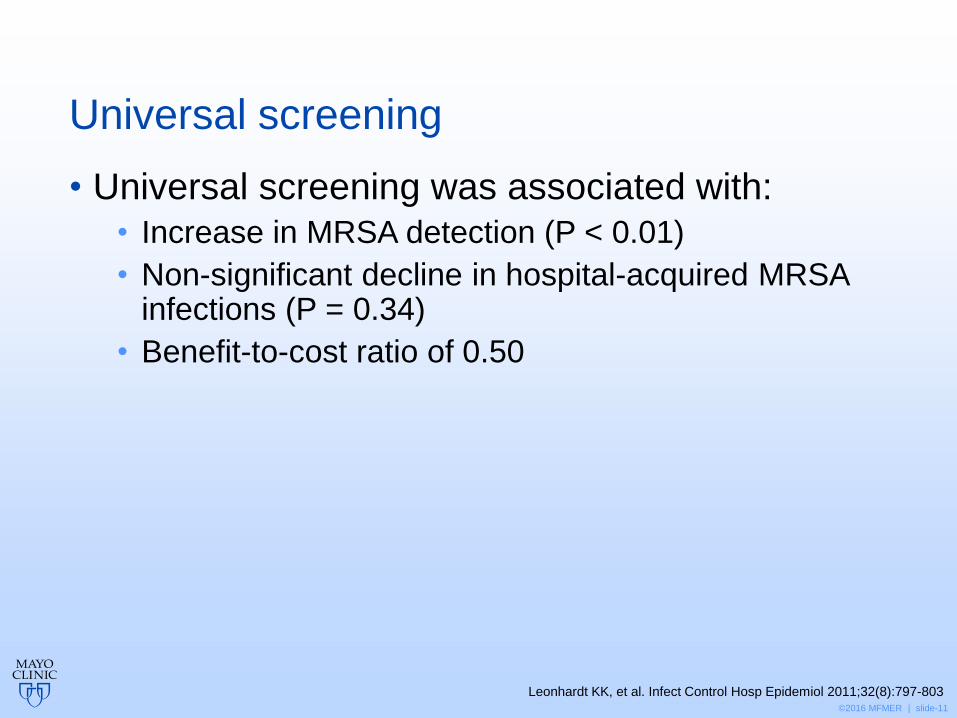
Universal screening
• Universal screening was associated with:
• Increase in MRSA detection (P < 0.01)
• Non-significant decline in hospital-acquired MRSA infections (P = 0.34)
• Benefit-to-cost ratio of 0.50
Leonhardt KK, et al. Infect Control Hosp Epidemiol 2011;32(8):797-803
©2016 MFMER | slide-12
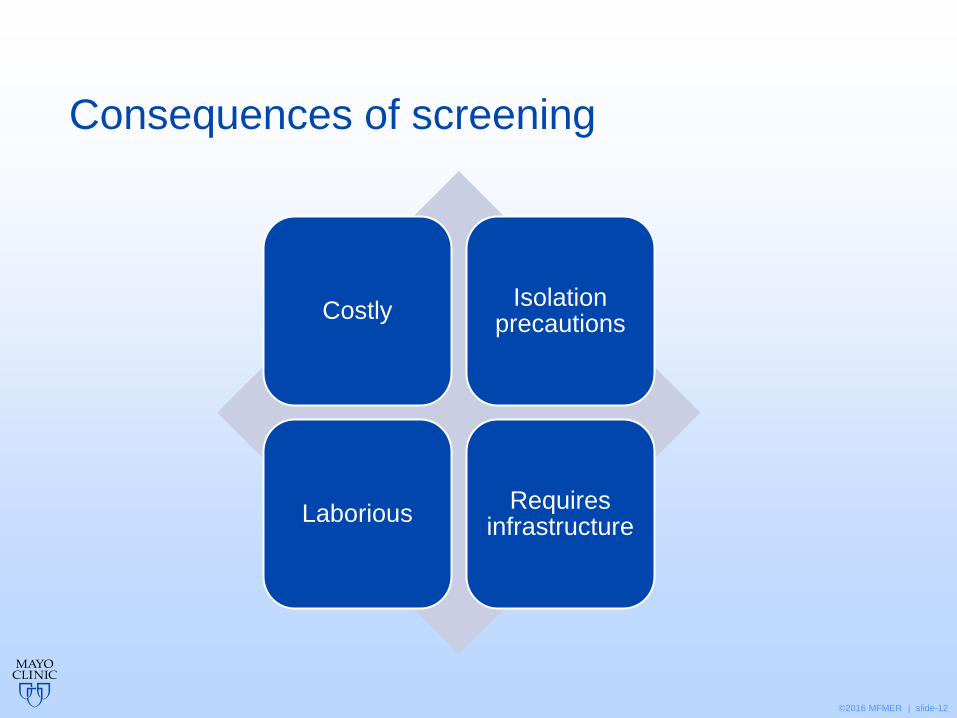
Consequences of screening
Costly Isolation
precautions
Laborious Requires
infrastructure
©2016 MFMER | slide-13
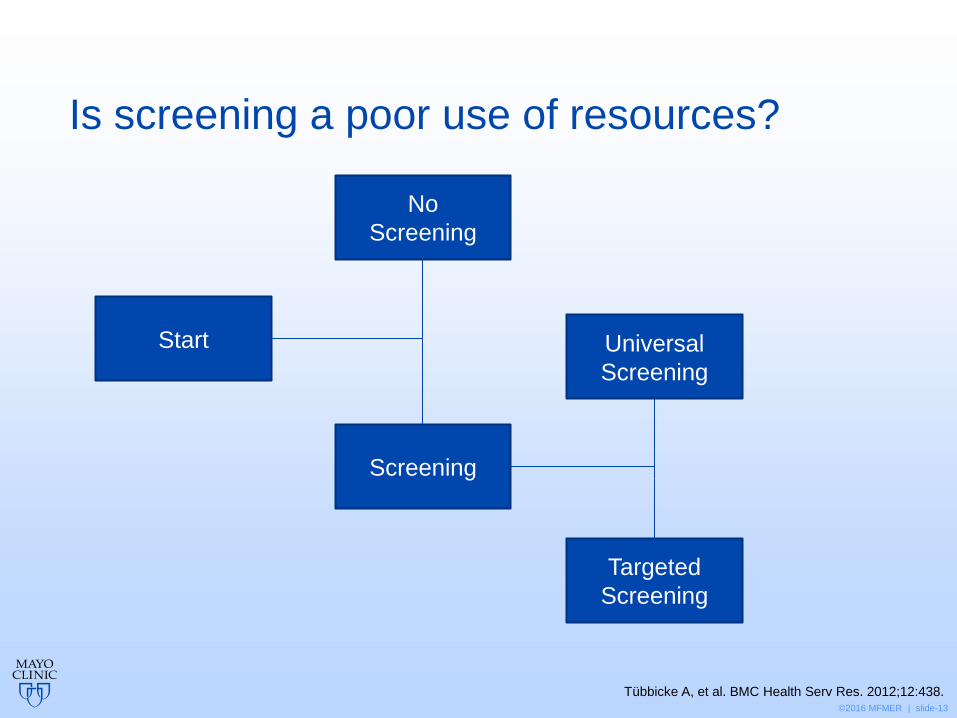
Is screening a poor use of resources?
Targeted
Screening
Tübbicke A, et al. BMC Health Serv Res. 2012;12:438.
Universal
Screening
No
Screening
Screening
Start
©2016 MFMER | slide-14
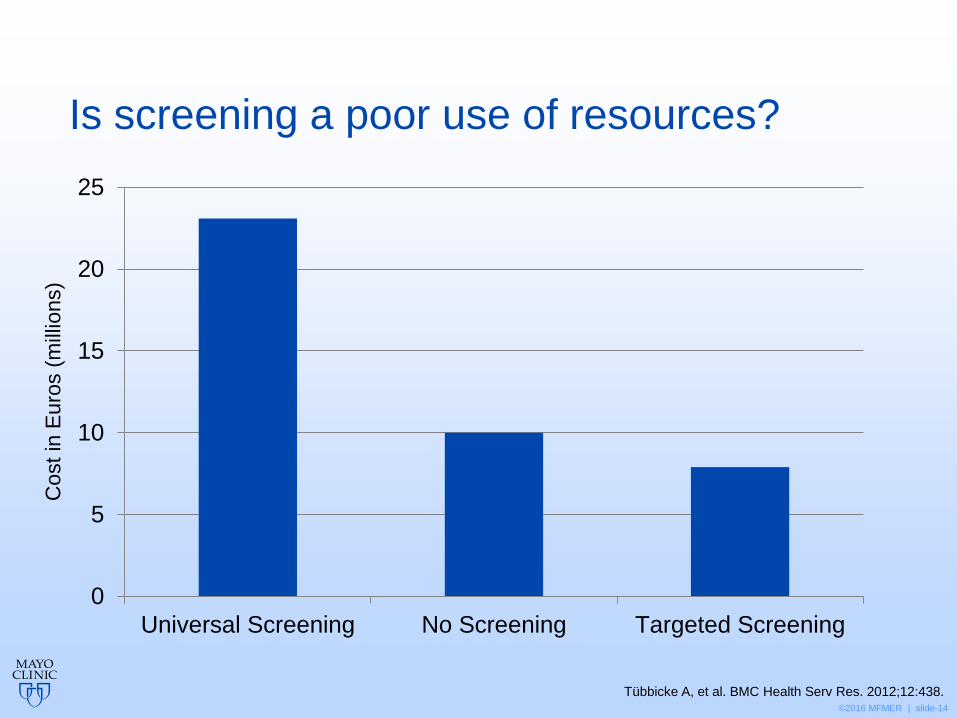
Is screening a poor use of resources?
0
5
10
15
20
25
Universal Screening No Screening Targeted Screening
Tübbicke A, et al. BMC Health Serv Res. 2012;12:438.
Cost in
Eu
ros (
mill
ions)
©2016 MFMER | slide-15
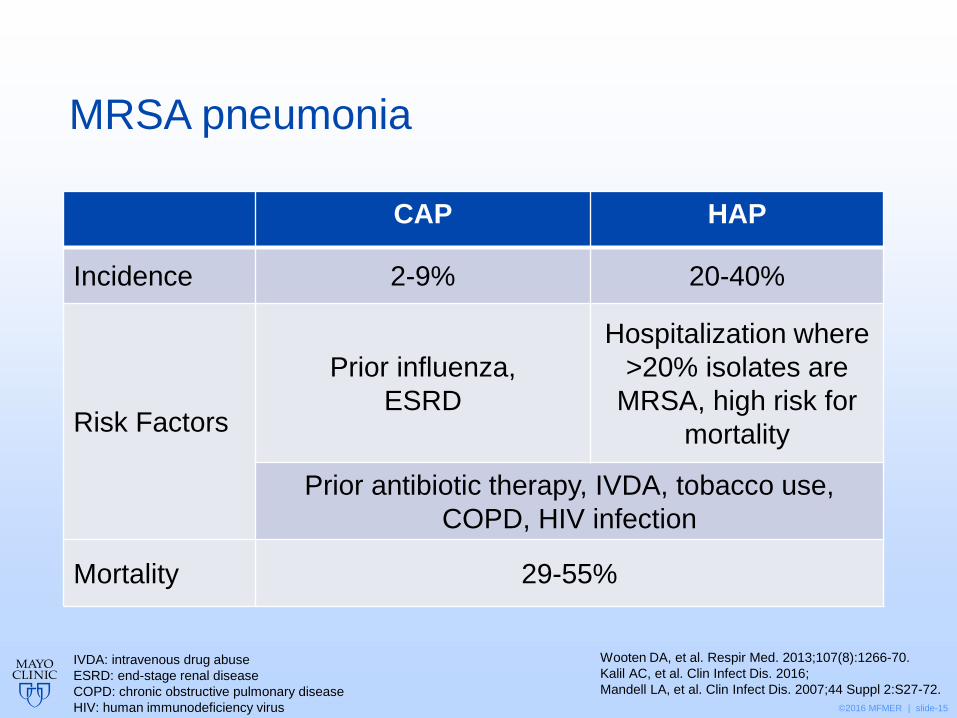
MRSA pneumonia
CAP HAP
Incidence 2-9% 20-40%
Risk Factors
Prior influenza,
ESRD
Hospitalization where
>20% isolates are
MRSA, high risk for
mortality
Prior antibiotic therapy, IVDA, tobacco use,
COPD, HIV infection
Mortality 29-55%
IVDA: intravenous drug abuse
ESRD: end-stage renal disease
COPD: chronic obstructive pulmonary disease
HIV: human immunodeficiency virus
Wooten DA, et al. Respir Med. 2013;107(8):1266-70.
Kalil AC, et al. Clin Infect Dis. 2016;
Mandell LA, et al. Clin Infect Dis. 2007;44 Suppl 2:S27-72.
©2016 MFMER | slide-16
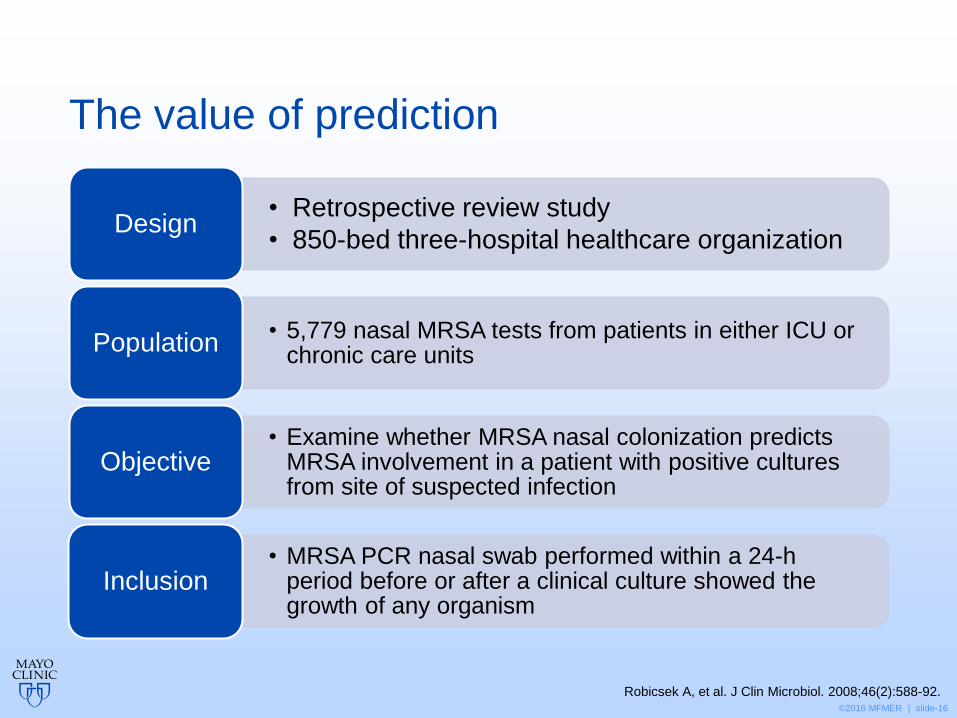
The value of prediction
• Retrospective review study
• 850-bed three-hospital healthcare organization Design
• 5,779 nasal MRSA tests from patients in either ICU or chronic care units
Population
• Examine whether MRSA nasal colonization predicts MRSA involvement in a patient with positive cultures from site of suspected infection
Objective
• MRSA PCR nasal swab performed within a 24-h period before or after a clinical culture showed the growth of any organism
Inclusion
Robicsek A, et al. J Clin Microbiol. 2008;46(2):588-92.
©2016 MFMER | slide-17
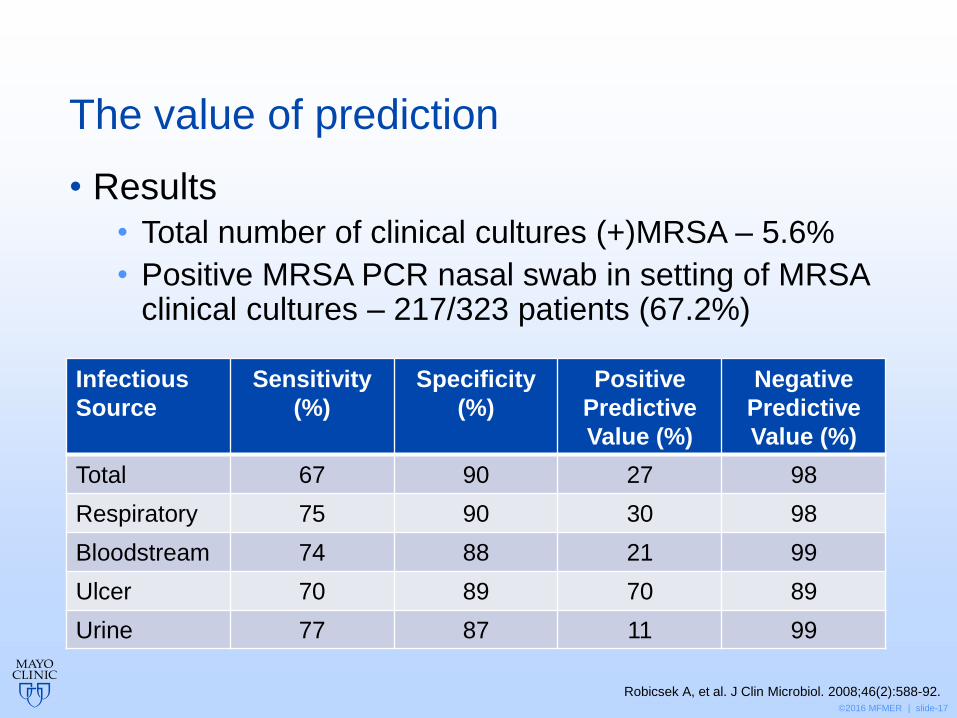
The value of prediction
Robicsek A, et al. J Clin Microbiol. 2008;46(2):588-92.
• Results
• Total number of clinical cultures (+)MRSA – 5.6%
• Positive MRSA PCR nasal swab in setting of MRSA clinical cultures – 217/323 patients (67.2%)
Infectious
Source
Sensitivity
(%)
Specificity
(%)
Positive
Predictive
Value (%)
Negative
Predictive
Value (%)
Total 67 90 27 98
Respiratory 75 90 30 98
Bloodstream 74 88 21 99
Ulcer 70 89 70 89
Urine 77 87 11 99

©2016 MFMER | slide-18
Definitions
• Sensitivity • Probability that a test result will be positive when the
disease is present (true positive rate)
• Specificity • Probability that a test result will be negative when the
disease is not present (true negative rate)
• Positive predictive value • Probability that the disease is present when the test is
positive
• Negative predictive value • Probability that the disease is not present when the test
is negative
©2016 MFMER | slide-19
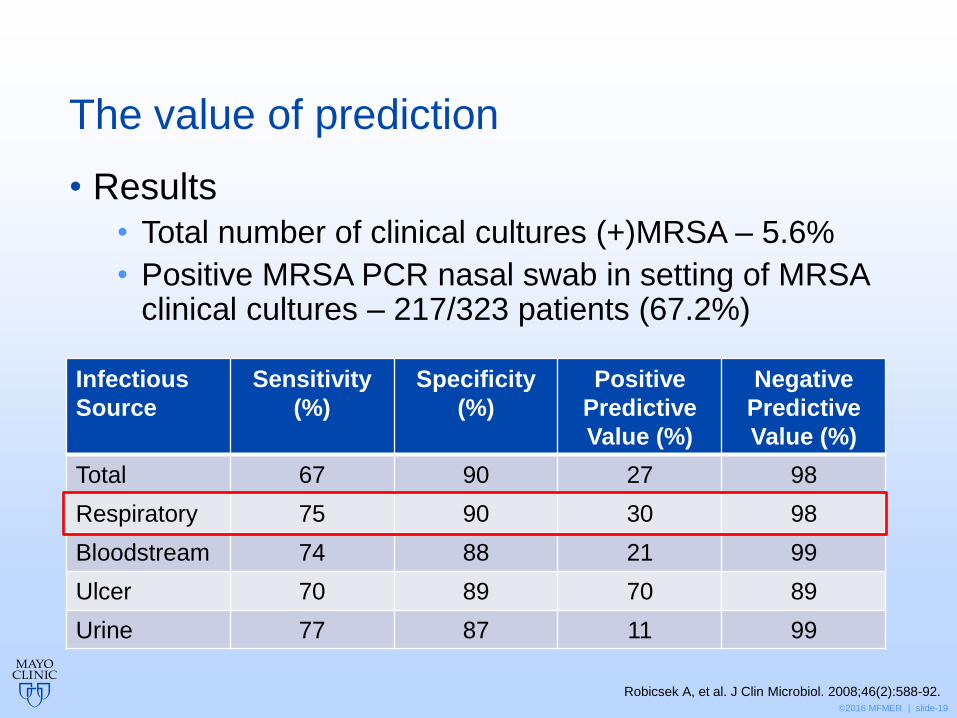
The value of prediction
Robicsek A, et al. J Clin Microbiol. 2008;46(2):588-92.
• Results
• Total number of clinical cultures (+)MRSA – 5.6%
• Positive MRSA PCR nasal swab in setting of MRSA clinical cultures – 217/323 patients (67.2%)
Infectious
Source
Sensitivity
(%)
Specificity
(%)
Positive
Predictive
Value (%)
Negative
Predictive
Value (%)
Total 67 90 27 98
Respiratory 75 90 30 98
Bloodstream 74 88 21 99
Ulcer 70 89 70 89
Urine 77 87 11 99

©2016 MFMER | slide-20
Prediction in the ICU
• Prospective cohort study
• 1252-bed urban teaching hospital Design
• 749 consecutive patients admitted to the medical ICU
Population
• Test whether ICU nasal screening for MRSA predicts the presence or absence of MRSA infections requiring antimicrobial treatment
Objective
• Nasal swabs were obtained at ICU admission and weekly thereafter for MRSA detection
Intervention
Sarikonda KV, et al. Crit Care Med. 2010;38(10):1991-5.
©2016 MFMER | slide-21
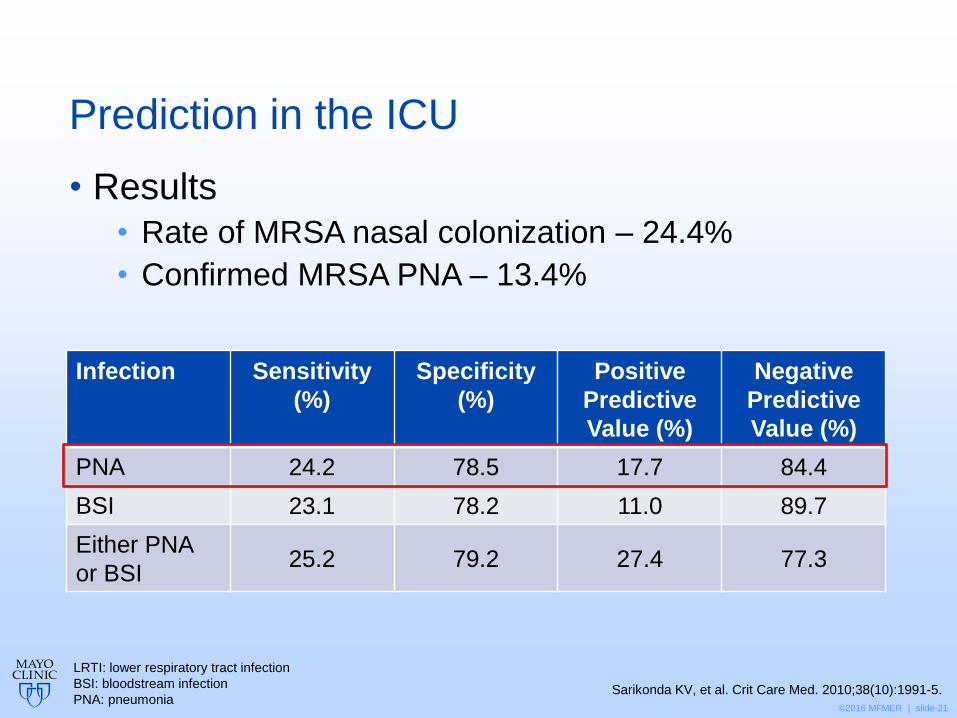
Prediction in the ICU
• Results
• Rate of MRSA nasal colonization – 24.4%
• Confirmed MRSA PNA – 13.4%
Infection Sensitivity
(%)
Specificity
(%)
Positive
Predictive
Value (%)
Negative
Predictive
Value (%)
PNA 24.2 78.5 17.7 84.4
BSI 23.1 78.2 11.0 89.7
Either PNA
or BSI 25.2 79.2 27.4 77.3
LRTI: lower respiratory tract infection
BSI: bloodstream infection
PNA: pneumonia Sarikonda KV, et al. Crit Care Med. 2010;38(10):1991-5.
©2016 MFMER | slide-22
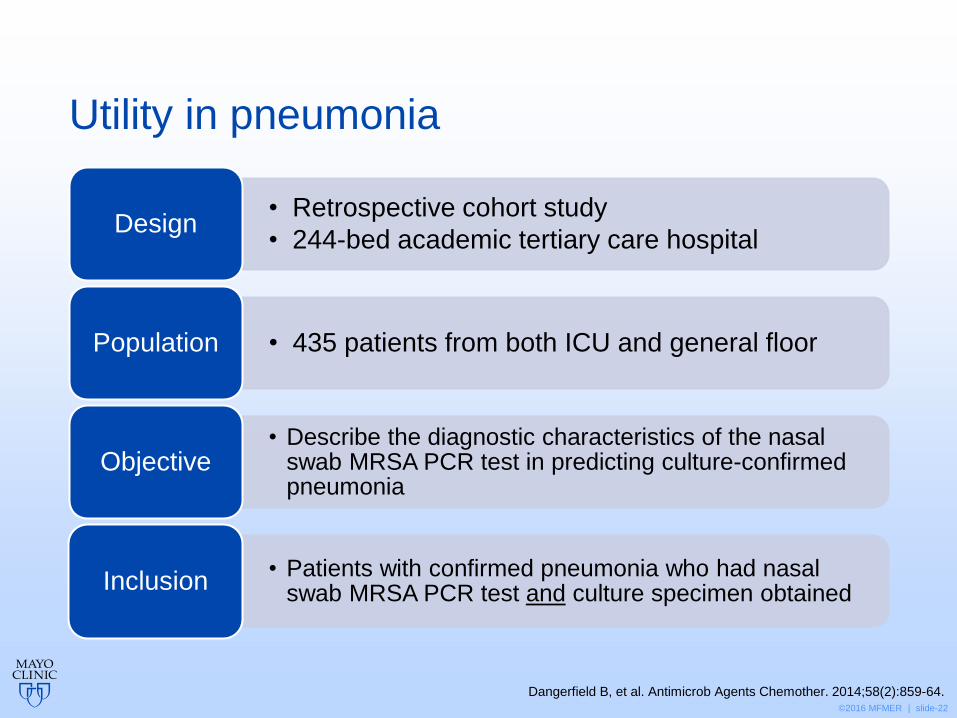
Utility in pneumonia
• Retrospective cohort study
• 244-bed academic tertiary care hospital Design
• 435 patients from both ICU and general floor Population
• Describe the diagnostic characteristics of the nasal swab MRSA PCR test in predicting culture-confirmed pneumonia
Objective
• Patients with confirmed pneumonia who had nasal swab MRSA PCR test and culture specimen obtained
Inclusion
Dangerfield B, et al. Antimicrob Agents Chemother. 2014;58(2):859-64.
©2016 MFMER | slide-23
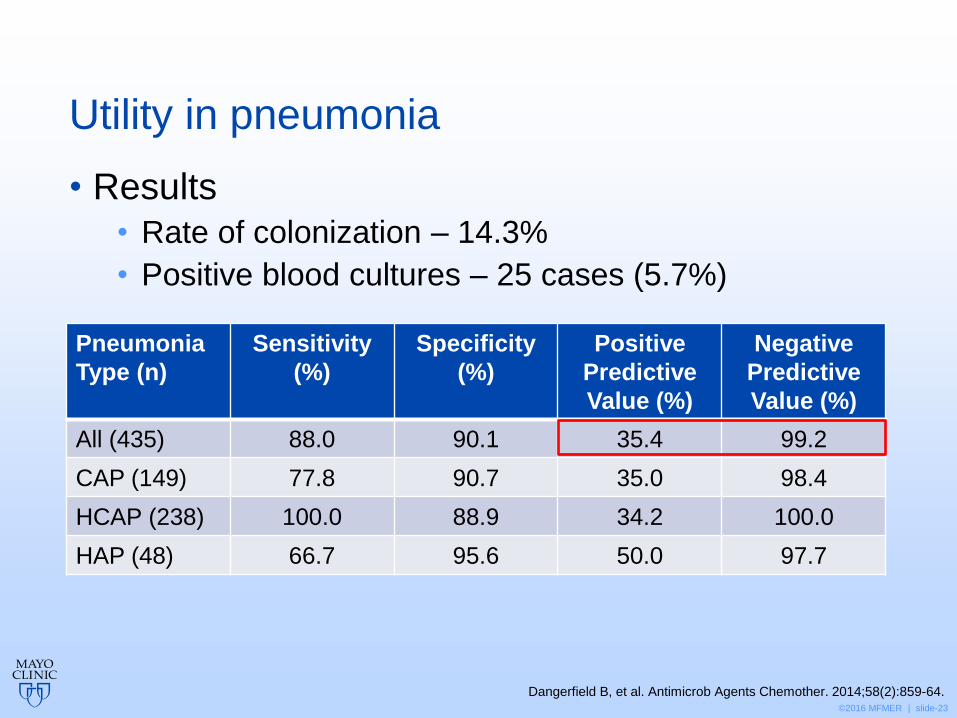
Utility in pneumonia
Dangerfield B, et al. Antimicrob Agents Chemother. 2014;58(2):859-64.
• Results
• Rate of colonization – 14.3%
• Positive blood cultures – 25 cases (5.7%)
Pneumonia
Type (n)
Sensitivity
(%)
Specificity
(%)
Positive
Predictive
Value (%)
Negative
Predictive
Value (%)
All (435) 88.0 90.1 35.4 99.2
CAP (149) 77.8 90.7 35.0 98.4
HCAP (238) 100.0 88.9 34.2 100.0
HAP (48) 66.7 95.6 50.0 97.7
©2016 MFMER | slide-24
CAP guidelines 2007
No discussion of utility of MRSA nasal swab culture or PCR technology
Mandell LA, et al. Clin Infect Dis. 2007;44 Suppl 2:S27-72.
©2016 MFMER | slide-25
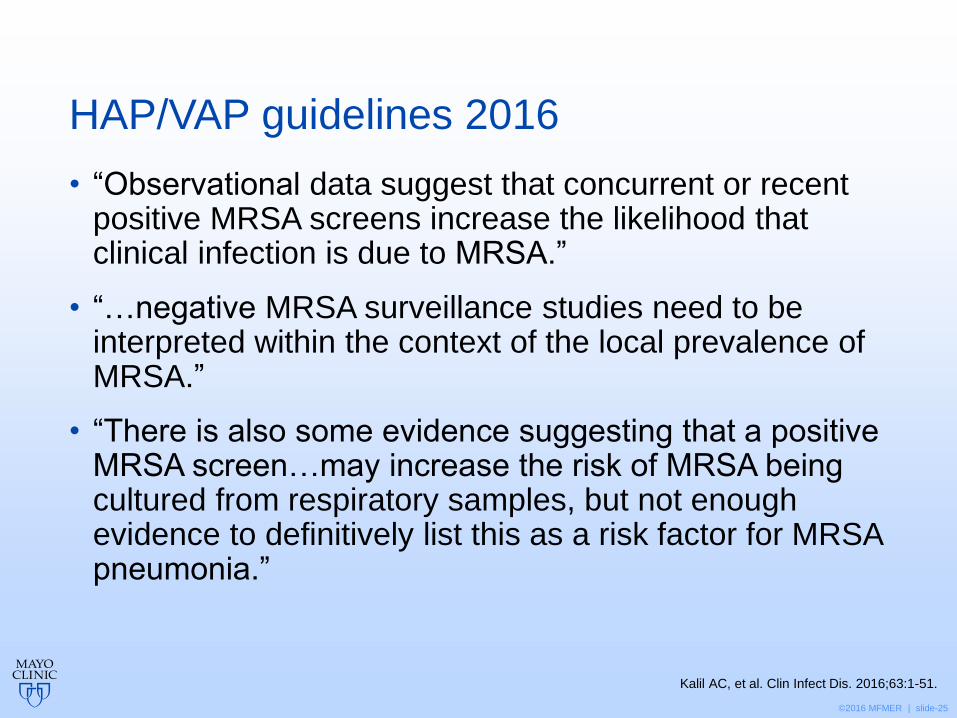
HAP/VAP guidelines 2016
• “Observational data suggest that concurrent or recent positive MRSA screens increase the likelihood that clinical infection is due to MRSA.”
• “…negative MRSA surveillance studies need to be interpreted within the context of the local prevalence of MRSA.”
• “There is also some evidence suggesting that a positive MRSA screen…may increase the risk of MRSA being cultured from respiratory samples, but not enough evidence to definitively list this as a risk factor for MRSA pneumonia.”
Kalil AC, et al. Clin Infect Dis. 2016;63:1-51.
©2016 MFMER | slide-26
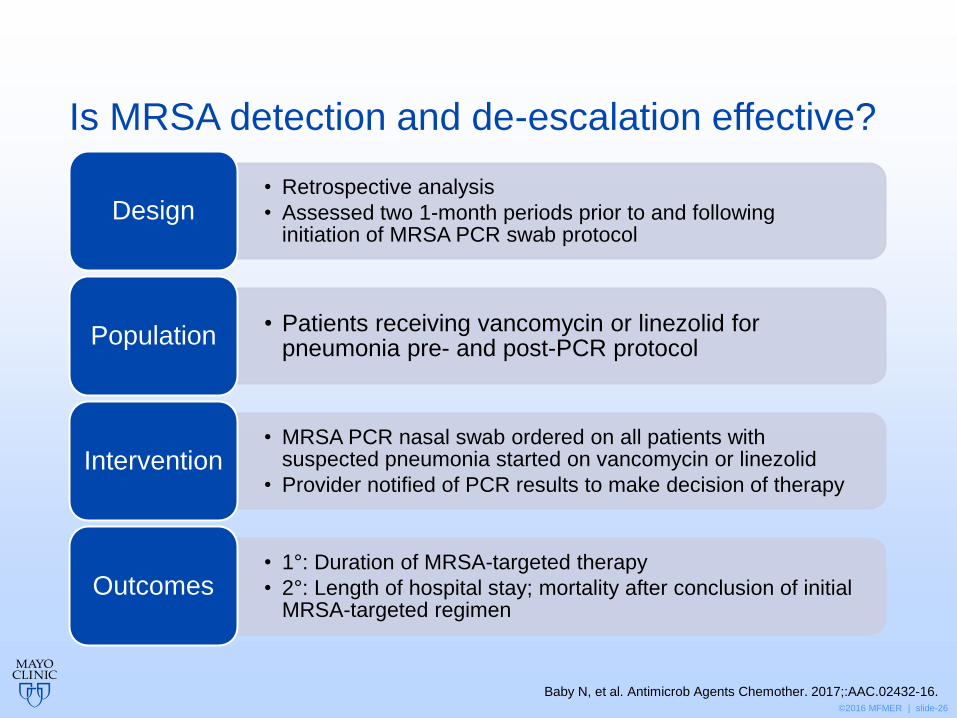
Is MRSA detection and de-escalation effective?
• Retrospective analysis
• Assessed two 1-month periods prior to and following initiation of MRSA PCR swab protocol
Design
• Patients receiving vancomycin or linezolid for pneumonia pre- and post-PCR protocol
Population
• MRSA PCR nasal swab ordered on all patients with suspected pneumonia started on vancomycin or linezolid
• Provider notified of PCR results to make decision of therapy Intervention
• 1°: Duration of MRSA-targeted therapy
• 2°: Length of hospital stay; mortality after conclusion of initial MRSA-targeted regimen
Outcomes
Baby N, et al. Antimicrob Agents Chemother. 2017;:AAC.02432-16.
©2016 MFMER | slide-27
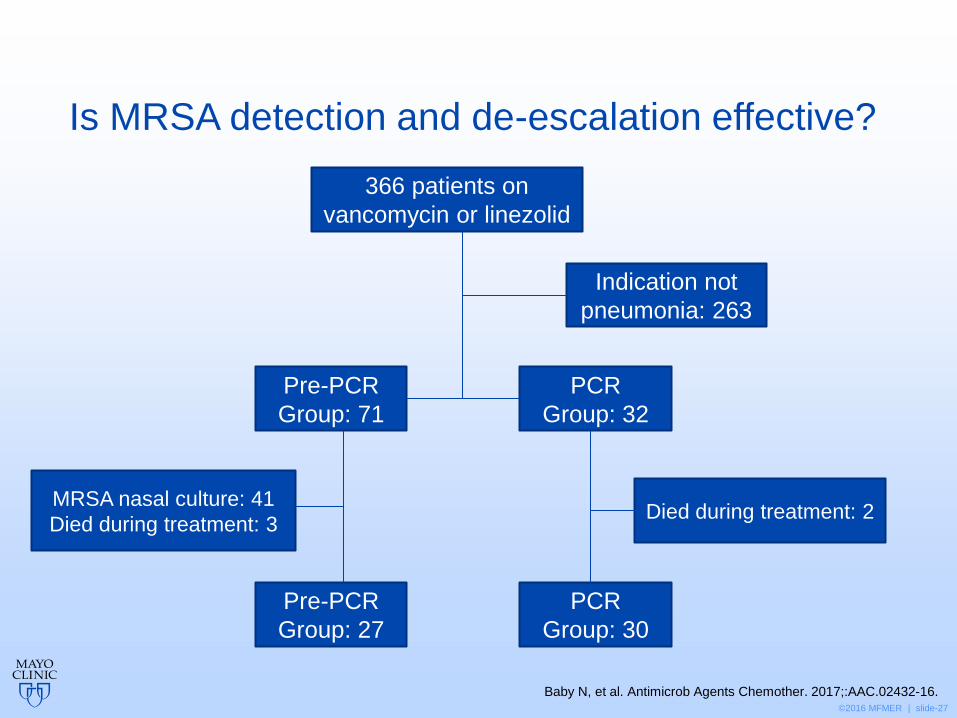
Is MRSA detection and de-escalation effective?
366 patients on
vancomycin or linezolid
Indication not
pneumonia: 263
Pre-PCR
Group: 71
PCR
Group: 32
MRSA nasal culture: 41
Died during treatment: 3 Died during treatment: 2
Pre-PCR
Group: 27
PCR
Group: 30
Baby N, et al. Antimicrob Agents Chemother. 2017;:AAC.02432-16.
©2016 MFMER | slide-28
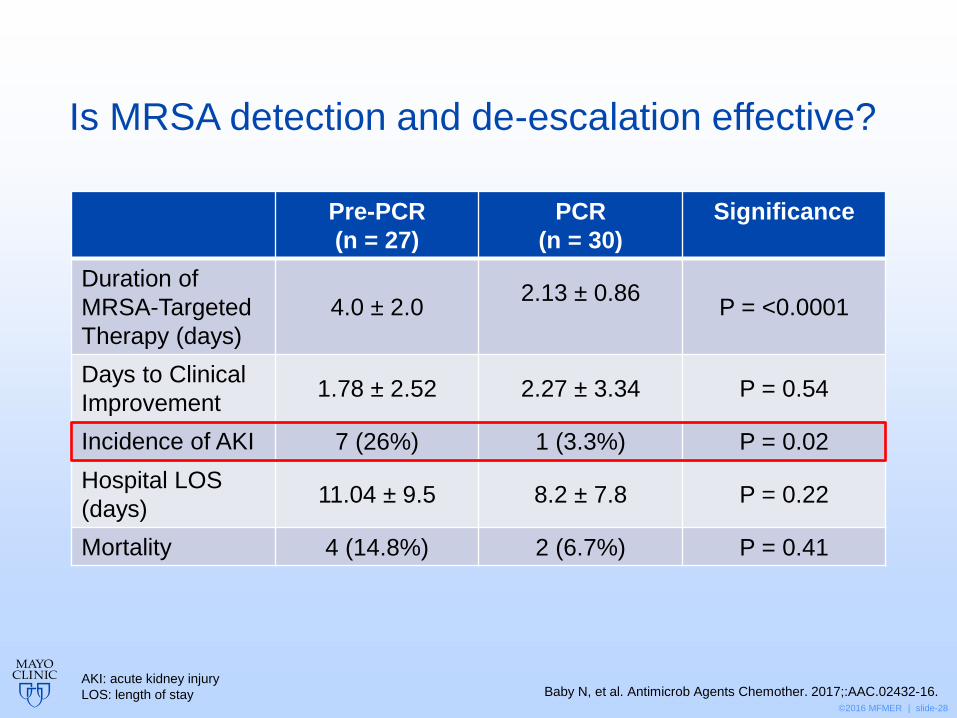
Is MRSA detection and de-escalation effective?
Baby N, et al. Antimicrob Agents Chemother. 2017;:AAC.02432-16.
Pre-PCR
(n = 27)
PCR
(n = 30)
Significance
Duration of
MRSA-Targeted
Therapy (days)
4.0 ± 2.0 2.13 ± 0.86
P = <0.0001
Days to Clinical
Improvement 1.78 ± 2.52 2.27 ± 3.34 P = 0.54
Incidence of AKI 7 (26%) 1 (3.3%) P = 0.02
Hospital LOS
(days) 11.04 ± 9.5 8.2 ± 7.8 P = 0.22
Mortality 4 (14.8%) 2 (6.7%) P = 0.41
AKI: acute kidney injury
LOS: length of stay
©2016 MFMER | slide-29
There is evidence to support de-escalating antimicrobial therapy based on MRSA nasal swab results in pneumonia.
A. True
B. False
©2016 MFMER | slide-30
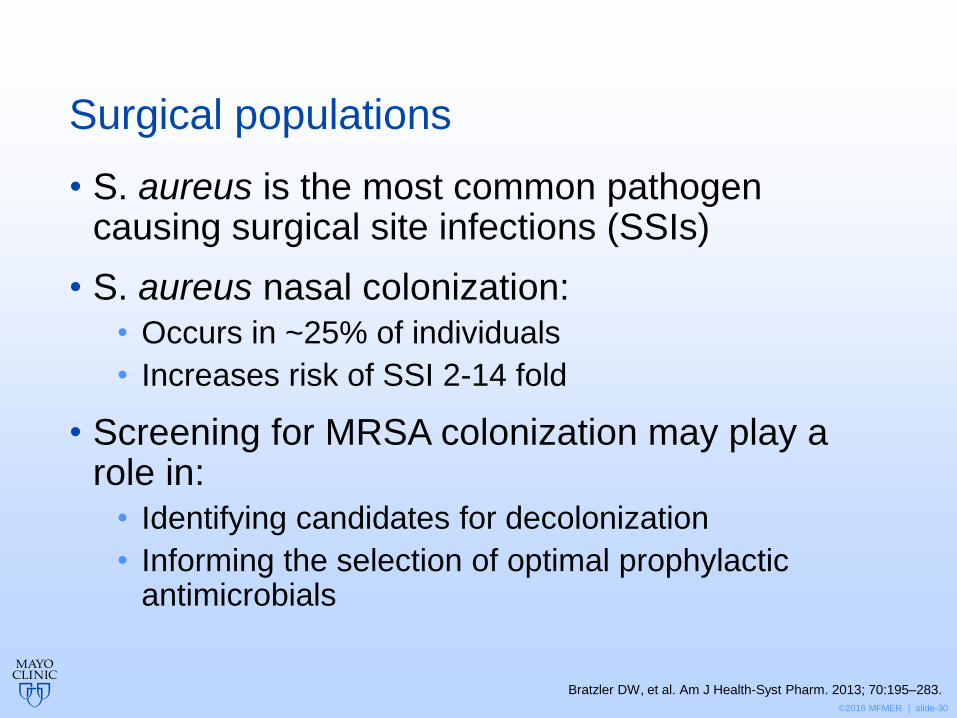
Surgical populations
• S. aureus is the most common pathogen causing surgical site infections (SSIs)
• S. aureus nasal colonization:
• Occurs in ~25% of individuals
• Increases risk of SSI 2-14 fold
• Screening for MRSA colonization may play a role in:
• Identifying candidates for decolonization
• Informing the selection of optimal prophylactic antimicrobials
Bratzler DW, et al. Am J Health-Syst Pharm. 2013; 70:195–283.
©2016 MFMER | slide-31
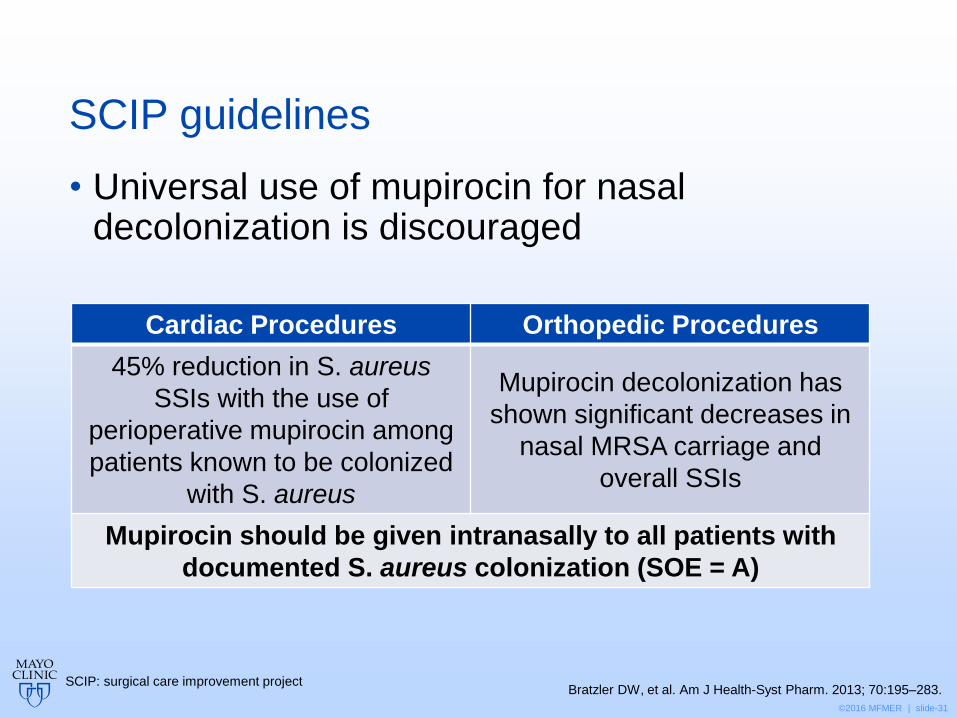
SCIP guidelines
• Universal use of mupirocin for nasal decolonization is discouraged
Cardiac Procedures Orthopedic Procedures
45% reduction in S. aureus
SSIs with the use of
perioperative mupirocin among
patients known to be colonized
with S. aureus
Mupirocin decolonization has
shown significant decreases in
nasal MRSA carriage and
overall SSIs
Mupirocin should be given intranasally to all patients with
documented S. aureus colonization (SOE = A)
Bratzler DW, et al. Am J Health-Syst Pharm. 2013; 70:195–283. SCIP: surgical care improvement project
©2016 MFMER | slide-32
Skin and soft tissue infections
• MRSA nasal colonization is a risk factor
• Predictive value increases significantly when paired with MRSA swab from another site
• Decolonization may play a role in recurrent SSTIs
• Limited data exists
Schleyer AM, et al. Am J Infect Control. 2010;38(8):657-9. SSTI: skin and soft tissue infection
©2016 MFMER | slide-33
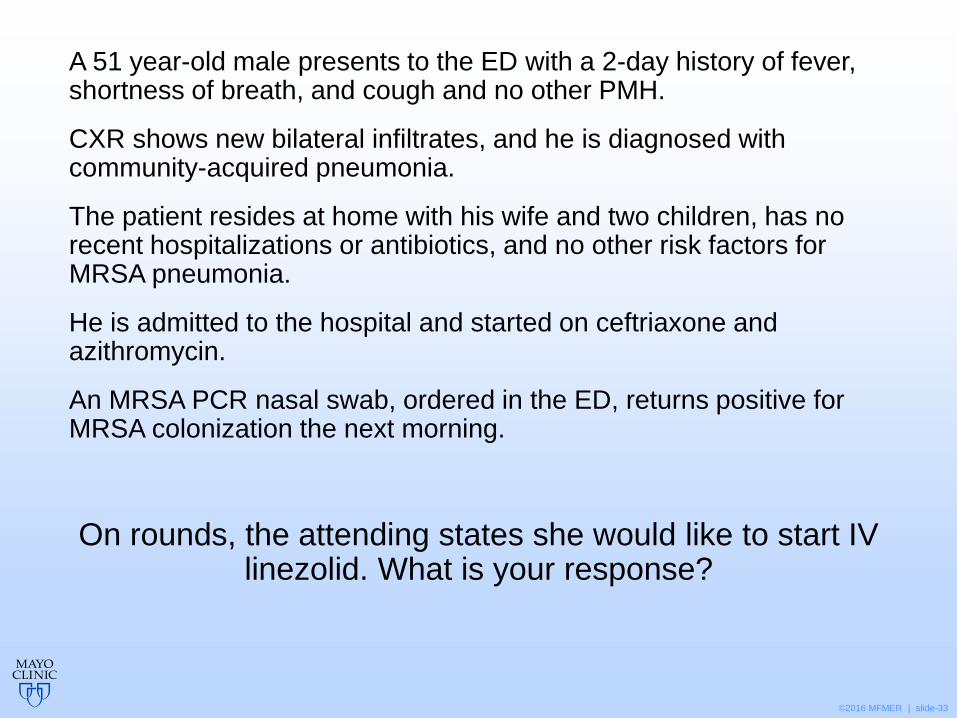
A 51 year-old male presents to the ED with a 2-day history of fever, shortness of breath, and cough and no other PMH.
CXR shows new bilateral infiltrates, and he is diagnosed with community-acquired pneumonia.
The patient resides at home with his wife and two children, has no recent hospitalizations or antibiotics, and no other risk factors for MRSA pneumonia.
He is admitted to the hospital and started on ceftriaxone and azithromycin.
An MRSA PCR nasal swab, ordered in the ED, returns positive for MRSA colonization the next morning.
On rounds, the attending states she would like to start IV linezolid. What is your response?
©2016 MFMER | slide-34
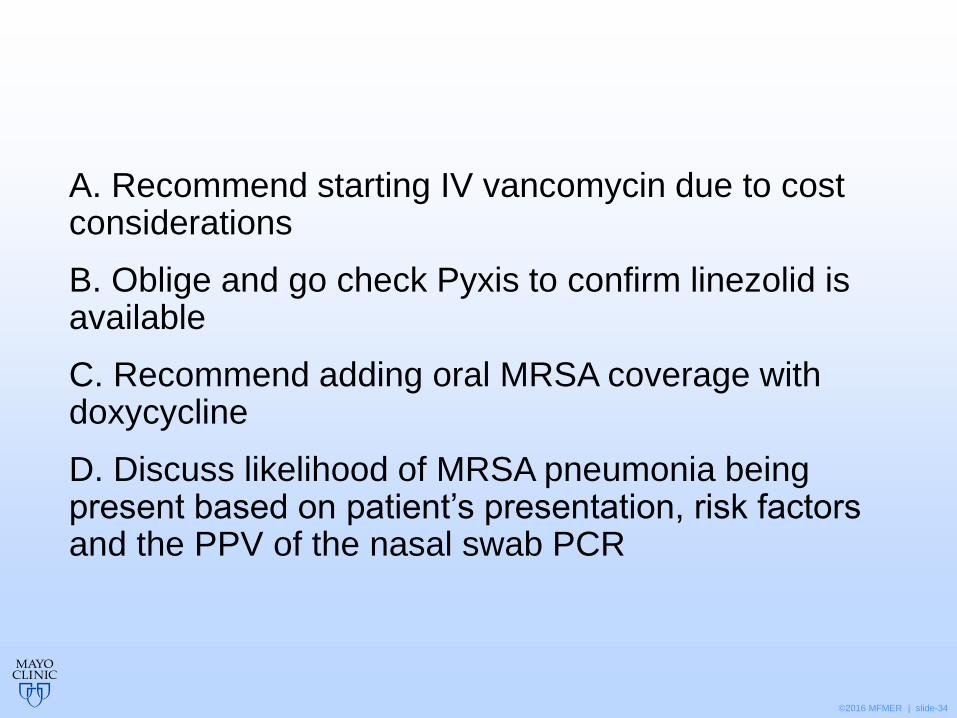
A. Recommend starting IV vancomycin due to cost considerations
B. Oblige and go check Pyxis to confirm linezolid is available
C. Recommend adding oral MRSA coverage with doxycycline
D. Discuss likelihood of MRSA pneumonia being present based on patient’s presentation, risk factors and the PPV of the nasal swab PCR
©2016 MFMER | slide-35
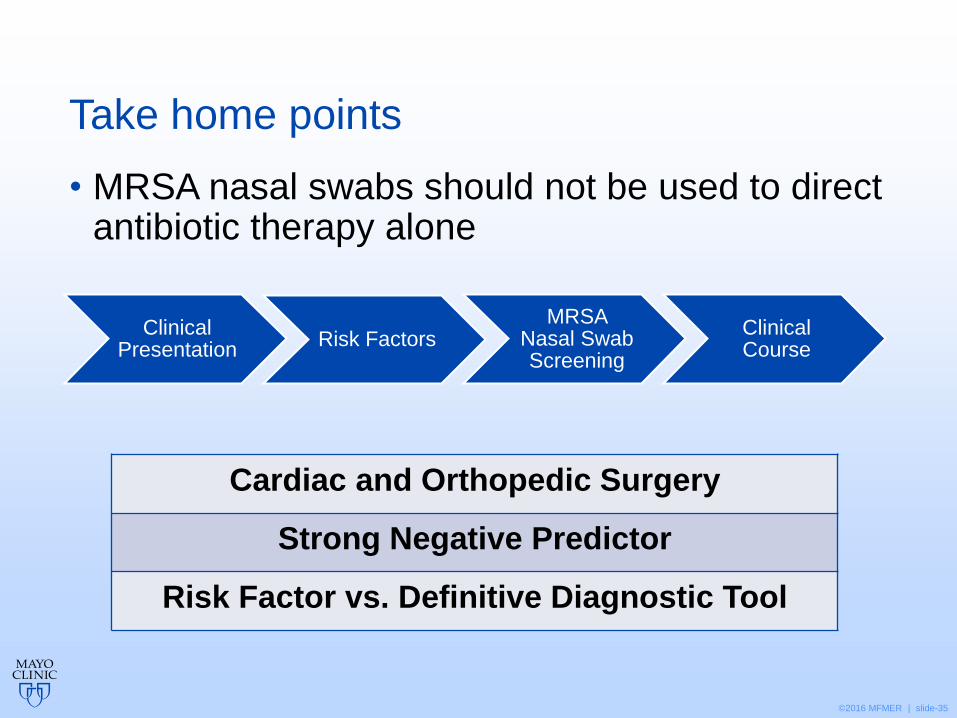
Take home points
• MRSA nasal swabs should not be used to direct antibiotic therapy alone
Clinical Presentation
Risk Factors MRSA
Nasal Swab Screening
Clinical Course
Cardiac and Orthopedic Surgery
Strong Negative Predictor
Risk Factor vs. Definitive Diagnostic Tool

©2016 MFMER | slide-36
Evaluating the Role of MRSA Nasal Swabs
Josh Arnold, PharmD PGY1 Pharmacy Resident Pharmacy Grand Rounds
February 28, 2017
©2016 MFMER | slide-37
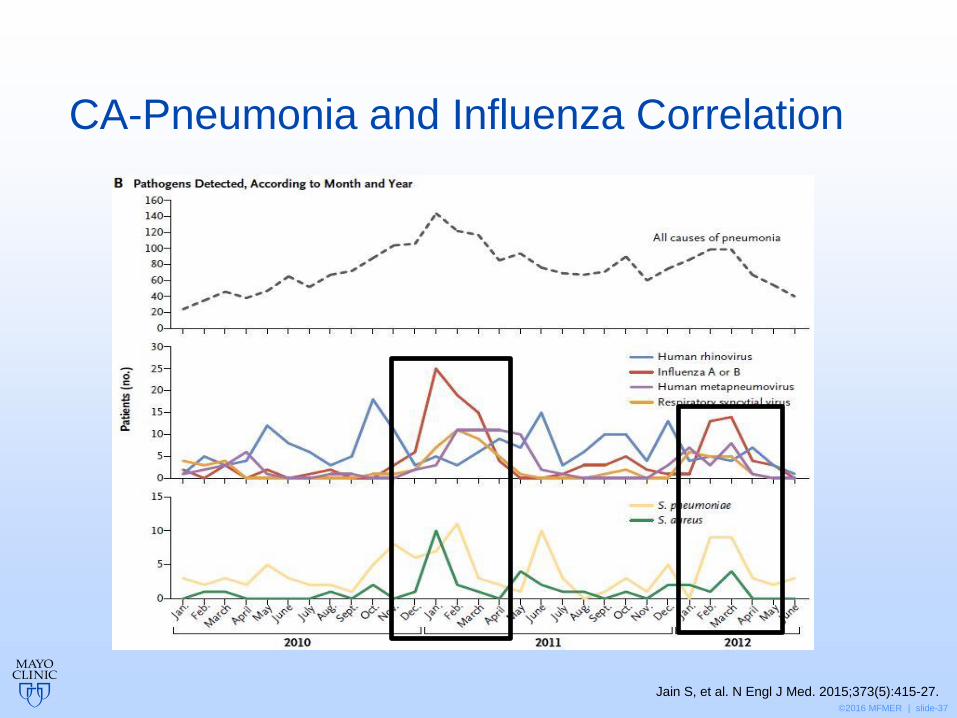
Jain S, et al. N Engl J Med. 2015;373(5):415-27.
CA-Pneumonia and Influenza Correlation
©2016 MFMER | slide-38
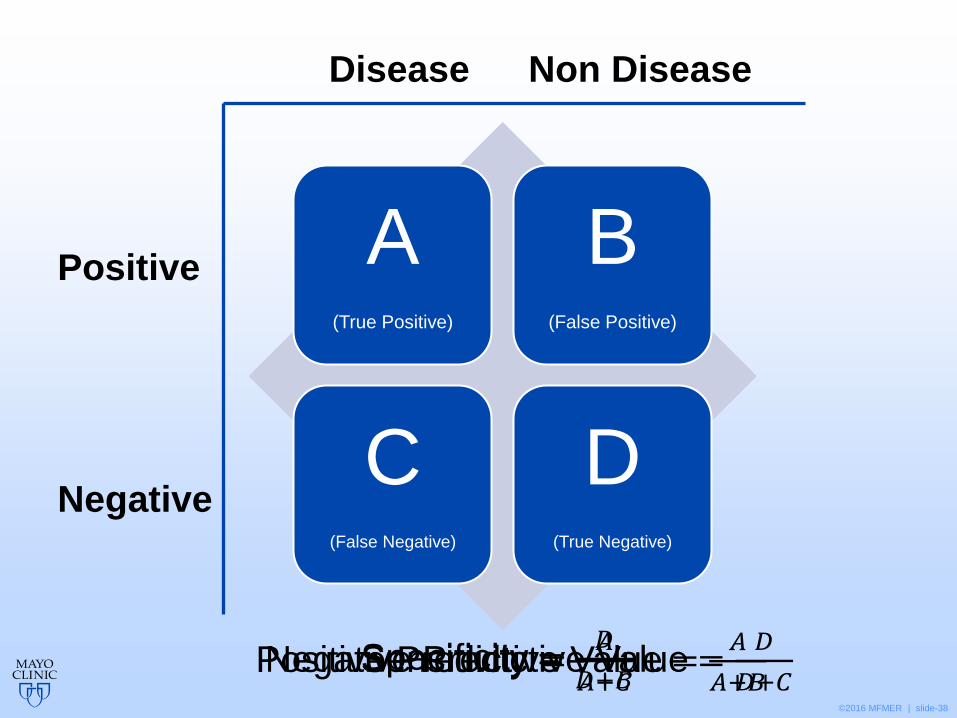
Sensitivity Specificity
Positive Predictive
Value
Negative Predictive
Value
A (True Positive)
B (False Positive)
C (False Negative)
D (True Negative)
Positive
Negative
Disease Non Disease
Sensitivity =𝐴
𝐴+𝐶 Specificity =
𝐷
𝐷+𝐵 Positive Predictive Value =
𝐴
𝐴+𝐵 Negative Predictive Value =
𝐷
𝐷+𝐶
©2016 MFMER | slide-39
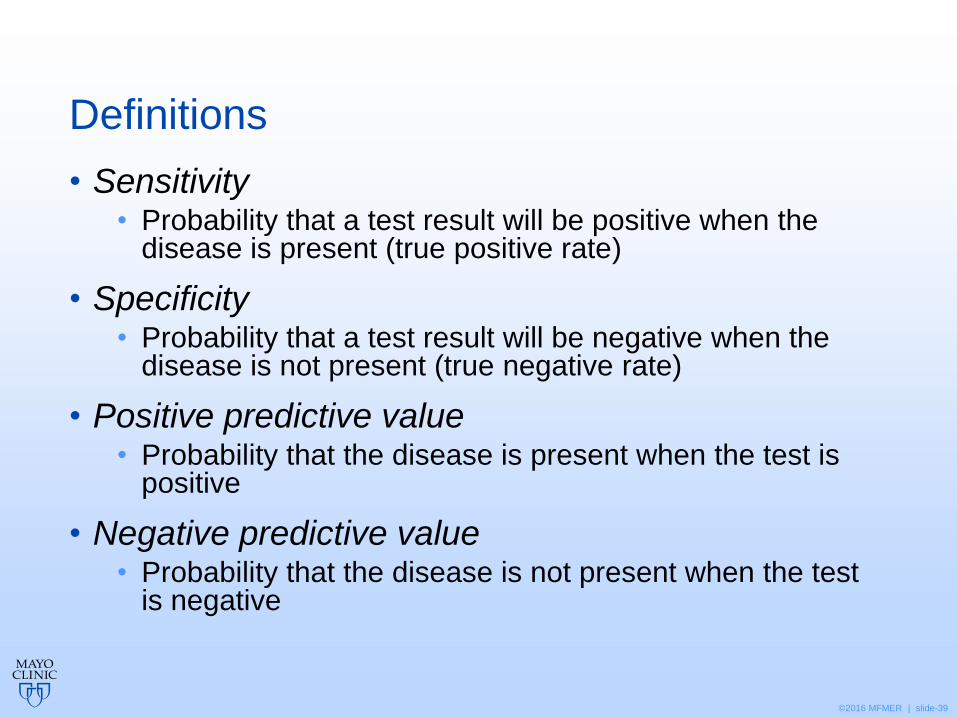
Definitions
• Sensitivity • Probability that a test result will be positive when the
disease is present (true positive rate)
• Specificity • Probability that a test result will be negative when the
disease is not present (true negative rate)
• Positive predictive value • Probability that the disease is present when the test is
positive
• Negative predictive value • Probability that the disease is not present when the test
is negative