Embed Size (px)
Citation preview

Evaluating the reliability of users as human sensorsof social media security threats
Ryan HeartfieldComputing and Information Systems
University of Greenwich, UKEmail: [email protected]
George LoukasComputing and Information Systems
University of Greenwich, UKEmail: [email protected]
Abstract—While the human as a sensor concept has beenutilised extensively for the detection of threats to safety andsecurity in physical space, especially in emergency response andcrime reporting, the concept is largely unexplored in the areaof cyber security. Here, we evaluate the potential of utilisingusers as human sensors for the detection of cyber threats,specifically on social media. For this, we have conducted anonline test and accompanying questionnaire-based survey, whichwas taken by 4,457 users. The test included eight realistic socialmedia scenarios (four attack and four non-attack) in the formof screenshots, which the participants were asked to categoriseas “likely attack” or “likely not attack”. We present the overallperformance of human sensors in our experiment for each exhibit,and also apply logistic regression to evaluate the feasibility ofpredicting that performance based on different characteristics ofthe participants. Such prediction would be useful where accuracyof human sensors in detecting and reporting social media securitythreats is important. We identify features that are good predictorsof a human sensor’s performance and evaluate them in both atheoretical ideal case and two more realistic cases, the lattercorresponding to limited access to a user’s characteristics.
Keywords—Social media, computer security, semantic attacks,phishing, social engineering, human as a sensor.
I. INTRODUCTION
The concept of the human as a sensor has been usedextensively and successfully for the detection of threats andadverse conditions in physical space. Examples include di-agnosing a city’s noise pollution [1], road traffic anomalies[2], monitoring water availability [3], neighborhood watchschemes [4], detecting unfolding emergencies [5] and gener-ally augmenting the situational awareness of first respondersthrough social media [6]. Yet, rather surprisingly the conceptis very new in relation to detecting and reporting threats incyber space. We are aware of only one very recent exampleof research geared specifically towards phishing attacks [7].Here, we take the first steps towards exploring the applicabilityof the concept more generally by testing the reliability ofhuman users as sensors of security threats. Our focus is onthreats to social media. We have conducted a large-scale onlineexperiment where we have asked 4,457 users to distinguishbetween attacks and non-attacks on different online usagescenarios presented to them as visual exhibits. The focusof this paper is the analysis of the performance of humanusers as threat sensors with four examples of social mediaattacks and four examples of legitimate social media usage.Also, complementing previous research on predicting whethera particular attacker will be successful in their attack [8], [9],
here we identify features and models for predicting whether aparticular user will successfully detect an attack.
II. RELATED WORK
Stembert et al. [7] have very recently proposed combininga reporting function with blocking and warning of suspiciousemails and the provision of educative tips, so as to harnessthe intelligence of expert and novice users in detecting emailphishing attacks in a corporate environment. Initial experi-mental results of their mock-up have been encouraging forthe applicability of the human as a sensor concept in thiscontext. Here, we focus on the detection capability of the usersby evaluating the performance of a large number of users ofdifferent profiles and for a wider range of attacks than onlyphishing emails. That is because before building a system thatdepends extensively on a particular type of sensors (and thehuman sensor is no exception), one needs to be aware of theiroverall reliability and to be able to predict how well they willperform in different conditions (in this case, with regards tothe profiles of the users and the type and difficulty of attacksthey are expected to detect and report).
Specifically in relation to social media, it is particularlyimportant to be able to tell to what extent users can correctlydetect and report deception-based security threats [10]. In thisrespect, the related work on user susceptibility to phishing andother semantic social engineering attacks is highly relevant.Predicting whether a user will be deceived into clickingon a fraudulent link or not has traditionally been studiedin the realm of behavioural science, where different studieshave found that higher degrees of normative, affective andcontinuance commitment, obedience to authority and trust[11], submissiveness [12], neurotic behaviour [13] and con-scientiousness [14] all correlate with high susceptibility tophishing. Also, research in [15] has reported openness, positivebehaviour (e.g., use of positive language) and high levels ofconversationalist activity as predictors of vulnerability to anonline social network bot. However, such behavioural featuresare rarely practical if the aim is to predict a user’s ability todetect attacks within a technical platform. For instance, howwould a system measure conscientiousness or submissivenessin real-time, automatically and ethically? Similarly, a numberof research studies have reported that female participants werefound to be more susceptible to phishing attacks than maleparticipants [14], [16]–[18], but again this is not a predictorthat could be used, for instance, in a corporate environment,as it would amount to discrimination. Instead, more practical

Fig. 1: Geographical distribution of study participants
is to know whether users have previously received training onsocial media security or generally on security threats, which isconsistently seen as a useful predictor of their ability to spotthem [19], albeit to a varying degree.
Here, we utilise the literature to identify a first set ofpredictors of a user’s ability to detect deception-based attacksand using statistical analysis we select the most relevantamong them for different environments. We extend the scopebeyond phishing and spear-phishing by including fake apps andQRishing, and measure the ability of users to detect them andthe ability of our statistical models to predict whether theywill. As the longer-term aim is to incorporate prediction toa technical platform, we are primarily interested in predictorsthat can be considered as practical, in the sense that their valuecan be provided or measured in real-time, automatically andethically.
Fig. 2: Percentage of participants that identified correctlywhether each exhibit corresponds to a non-attack (NA1, NA2,NA3, NA4) or an attack (A1, A2, A3, A4)
III. METHODOLOGY
We have conducted a quantitative on-line experiment im-plemented in the on-line survey platform Qualtrics, consistingof a short survey for the collection of demographic andplatform behaviour data, and an exhibit-based test. Participants
were recruited primarily via popular on-line forums and socialmedia communities, such as Reddit, 4CHAN, StumbleUpon,Facebook and Twitter, with an online advertisement challeng-ing them to test their ability to detect attacks. Figure 1 showsthe geographical distribution of the participants.
Fig. 3: Example of Twitter phishing website (A1)
Fig. 4: Example of a Twitter phishing email (A2)
A. User profile features
The survey portion of the experiment required participantsto answer a series of questions related to their age (A), gender(G), security training (S1, S2, S3), platform familiarity (FA),frequency (FR), duration of use (DR), computer literacy (CL),security awareness (SA) and education (EDU). These featuresare described below:
A. Age. Coded in groups as: 18-24(1), 25-34(2), 35-44(3),45-54(4), 55-64(5), 65+(6)G. Gender.S1. Formal computer security education (S1), Coded asa binary response. In relation to the terminology used in[20], S1 is “Formal Learning”.S2. Work-based computer security training (S2). Codedas a binary response. In relation to the terminology usedin [20], S1 is “Non-formal Learning”.
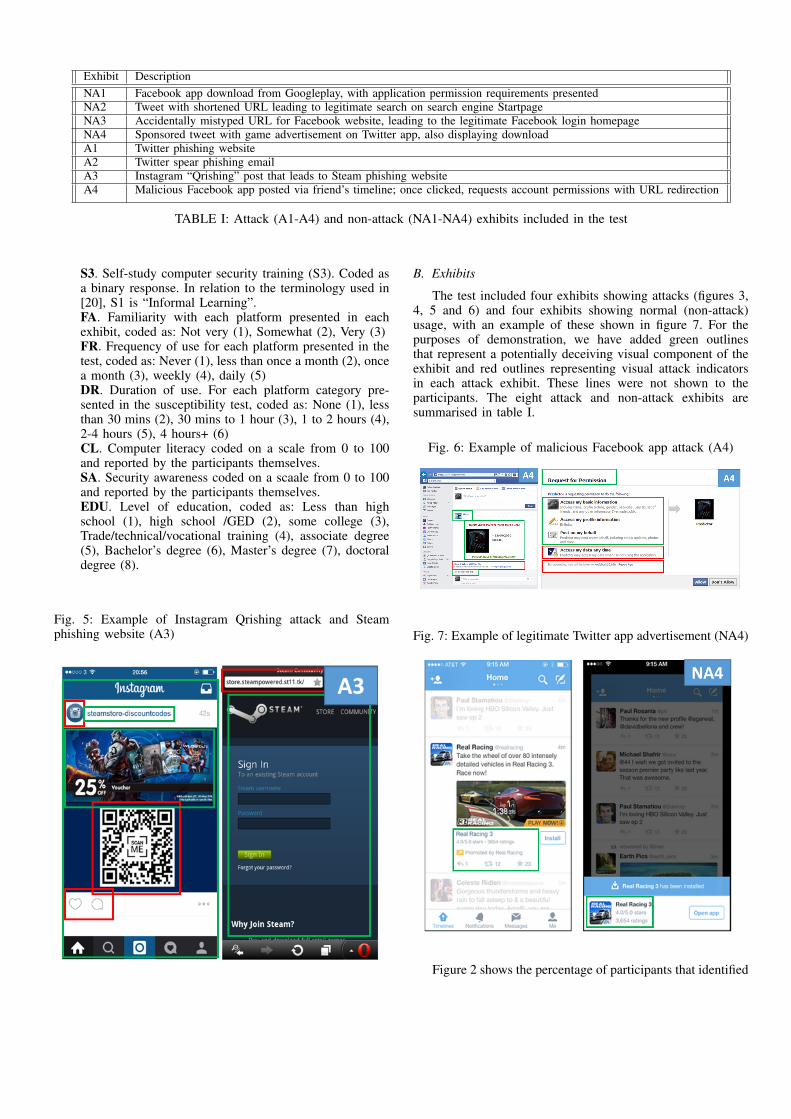
Exhibit DescriptionNA1 Facebook app download from Googleplay, with application permission requirements presentedNA2 Tweet with shortened URL leading to legitimate search on search engine StartpageNA3 Accidentally mistyped URL for Facebook website, leading to the legitimate Facebook login homepageNA4 Sponsored tweet with game advertisement on Twitter app, also displaying downloadA1 Twitter phishing websiteA2 Twitter spear phishing emailA3 Instagram “Qrishing” post that leads to Steam phishing websiteA4 Malicious Facebook app posted via friend’s timeline; once clicked, requests account permissions with URL redirection
TABLE I: Attack (A1-A4) and non-attack (NA1-NA4) exhibits included in the test
S3. Self-study computer security training (S3). Coded asa binary response. In relation to the terminology used in[20], S1 is “Informal Learning”.FA. Familiarity with each platform presented in eachexhibit, coded as: Not very (1), Somewhat (2), Very (3)FR. Frequency of use for each platform presented in thetest, coded as: Never (1), less than once a month (2), oncea month (3), weekly (4), daily (5)DR. Duration of use. For each platform category pre-sented in the susceptibility test, coded as: None (1), lessthan 30 mins (2), 30 mins to 1 hour (3), 1 to 2 hours (4),2-4 hours (5), 4 hours+ (6)CL. Computer literacy coded on a scale from 0 to 100and reported by the participants themselves.SA. Security awareness coded on a scaale from 0 to 100and reported by the participants themselves.EDU. Level of education, coded as: Less than highschool (1), high school /GED (2), some college (3),Trade/technical/vocational training (4), associate degree(5), Bachelor’s degree (6), Master’s degree (7), doctoraldegree (8).
Fig. 5: Example of Instagram Qrishing attack and Steamphishing website (A3)
B. Exhibits
The test included four exhibits showing attacks (figures 3,4, 5 and 6) and four exhibits showing normal (non-attack)usage, with an example of these shown in figure 7. For thepurposes of demonstration, we have added green outlinesthat represent a potentially deceiving visual component of theexhibit and red outlines representing visual attack indicatorsin each attack exhibit. These lines were not shown to theparticipants. The eight attack and non-attack exhibits aresummarised in table I.
Fig. 6: Example of malicious Facebook app attack (A4)
Fig. 7: Example of legitimate Twitter app advertisement (NA4)
Figure 2 shows the percentage of participants that identified
correctly whether each exhibit corresponds to an attack or not.This can also be considered as a metric of the difficulty ofeach exhibit.
Our focus is on achieving prediction of a user’s abilityto correctly distinguish between attacks and non-attacks. Forthis, we consider the theoretical ideal case, where all featurescan be utilised (case A), as well as two more constrained andmore likely future implementations: (case B) as a reliabilityprediction module in a security threat reporting mechanismon a social media platform, and (case C) as a mechanism forpredicting susceptibility to attacks in enterprise environmentswith extensive monitoring of the users.
Case A: Ideal case with all features
This is the theoretical ideal case, where we predict whethera user will correctly detect an attack or non-attack with accessto the complete profile of a user.
Case B: Report reliability prediction in lightly-monitored so-cial media
Here, we consider the case where the users of a socialmedia platform are encouraged to act as human sensors andreport security threats when they spot them. The social mediaplatform would want to evaluate the trustworthiness of each re-port based on the human sensor’s predicted ability to correctlydetect attacks (true positives) and avoid mislabelling normalsocial media usage as attacks (false positives). The challengeis that only a few of the predictors discussed in Section IIIare practical. Specifically, it is assumed that the social mediaprovider collects data only on frequency and duration of use,and can additionally request the user to self-report computerliteracy, security awareness and platform familiarity. The focushere is on achieving a balance between true positive and falsepositive reports.
Case C: Susceptibility prediction in heavily-monitored enter-prise environment
Here, we consider the case where the users are employ-ees within an enterprise environment. Their organisation isinterested in estimating the likelihood that they would bedeceived by an attack, for instance to determine whether theyshould control their usage of social media, display warnings,recommend training etc. The organisation can have access tomore input features than in case B, including their traininghistory, but for ethical reasons cannot make use of protectedinformation, such as age and gender, which were available incase A. Also, in this context where there is no reporting, falsepositives and true negatives are of lower importance than truepositives and false negatives.
IV. PREDICTION MODEL
The prediction of whether a user will correctly or incor-rectly detect an attack (or non-attack) is a binary classificationproblem. Using R [21], we have performed forward stepwiselogistic regression to identify models that can predict a user’sability to detect attacks and non-attacks. The forward stepselection process is initiated by creating a null model, whichincludes no feature variables and then proceeds to iteratively
test the addition of each variable in the feature space againsta model comparison criterion, such as Akaike or Bayes infor-mation criterion, Pseudo R2 or cross-validation; at each stepadding variables to the model that improve prediction. Thisroutine is repeated for each variable in the feature space untilno improvement is achieved. In this study, we have selected 5-fold cross-validation to estimate the test error against differentnumbers of predictors. Here, the user sample is partitionedinto 5 equal folds. Four folds are used to train the model andthe remaining fold is used to test the model. The process isrepeated 5 times so that the model is tested on each fold inorder to produce an average model test error; which in ourcase reports model test error at each variable selection step inthe forward stepwise process.
The result of the regression is the selection of those featuresthat have a statistically significant impact on the probability ofa user’s correct prediction. For K number of features usedin the prediction, and a given user’s value for each featurek ∈ {1,K} being X = {xk}, that user’s predicted probabilityof correct detection is given by:
p =eβ0+
∑βkxk
1 + eβ0+∑
βkxk
where bk is the coefficient of feature k, as computed by thelogistic regression.
The three cases (A, B, C) are practically differentiated bytheir set of features X (and the corresponding coefficients βk).
In model A, X = {S1, S2, S3, FA, FR,DR, SA,CL,A,G}.In model B, X = {FA,FR,DR, SA,CL}.In model C, X = {S1, S2, FA, FR,DR, SA,CL}.
Following the most common practice in logistic regression,we provide the result in the form of p
1−p odds ratios (OR),where:
OR =p
1− p= eβ0+
∑βkxk
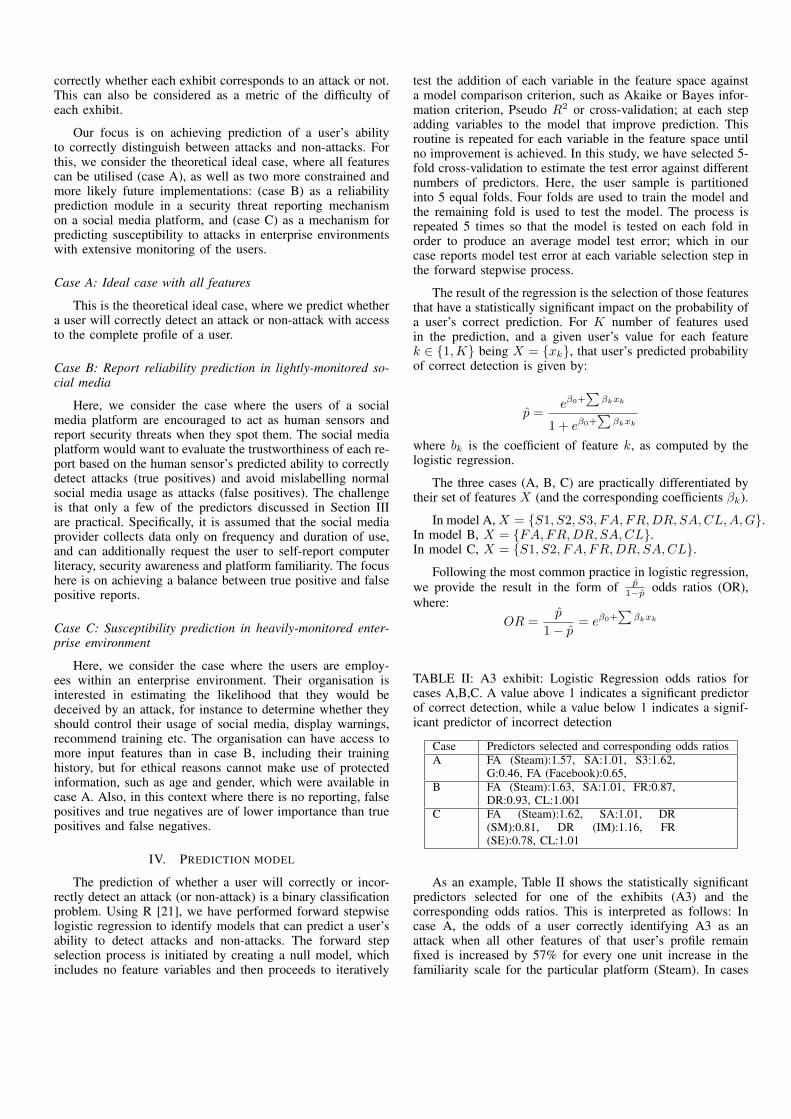
TABLE II: A3 exhibit: Logistic Regression odds ratios forcases A,B,C. A value above 1 indicates a significant predictorof correct detection, while a value below 1 indicates a signif-icant predictor of incorrect detection
Case Predictors selected and corresponding odds ratiosA FA (Steam):1.57, SA:1.01, S3:1.62,
G:0.46, FA (Facebook):0.65,B FA (Steam):1.63, SA:1.01, FR:0.87,
DR:0.93, CL:1.001C FA (Steam):1.62, SA:1.01, DR
(SM):0.81, DR (IM):1.16, FR(SE):0.78, CL:1.01
As an example, Table II shows the statistically significantpredictors selected for one of the exhibits (A3) and thecorresponding odds ratios. This is interpreted as follows: Incase A, the odds of a user correctly identifying A3 as anattack when all other features of that user’s profile remainfixed is increased by 57% for every one unit increase in thefamiliarity scale for the particular platform (Steam). In cases

Fig. 8: ROC curves for prediction performance for each exhibitin case B
B and C, this is 63% and 62%, which shows that despitethe effect of platform habitation [22], here familiarity is avery useful predictor of a human sensor’s ability to detectthe particular attack. This agrees with previous results on theimportance of familiarity with a system as a key enabler ofdistinguishing between what visually looks normal and whatis normal behaviour [23], [24]. Also very important is thesecurity self-study (S3) feature with an improvement of 62%for every one unit increase on the self-study scale if all otherfeatures of the user’s profile remain fixed. However, this couldbe used only in the ideal case (A), as whether a user has indeedcarried out self-study cannot be monitored or confirmed inpractice by the social media platform (case B) or the user’semployer in an enterprise environment (case C).
V. PREDICTION PERFORMANCE RESULTS
Next, we have performed 5-fold cross validation to estimatethe prediction test error and plot it against the number ofpredictors utilised. The cross-validated test error depends onthe logit probability threshold cut-off, which is effectively thetuning parameter of our prediction model. For case A, figures10 and 11 summarise the test error against the number ofpredictors that were added with the stepwise approach. Inaccordance with the generally accepted practice in logisticregression [25], the cut-off value is chosen to be close to theevent rate for each exhibit (i.e., the percentage of participantswho were correct, as shown in figure 2). We observe that theprediction test error is sufficiently low with 2-5 predictorsfor most of the exhibits, and adding further predictors hasdiminishing returns. This can be seen also in Table II, where,although case A had all features available to it, the model usedonly five of them as useful predictors.
To evaluate the performance of the models in a morerealistic manner, we focus on cases B and C. In figures 8 and9, we summarise the overall performance of the models with
Fig. 9: ROC curves for prediction performance for each exhibitin case C
the constrained sets of predictors that were chosen via logisticregression for these two cases. We use receiver operatingcharacteristic curves to plot average true positive rate againstfalse positive rate for different thresholds. The further above ofthe red diagonal line that goes from (0.0) to (1.1) the better theperformance. We observe that the performance of predictionfor non-attacks is rather poor, being close to the diagonal line.However, the approach achieves good performance for theprediction of three out of four attacks (A1, A2, A3), whichwould be the primary aim of a system predicting the abilityof a user to correctly detect an attack.
VI. CONCLUSION
We have presented the results of a large-scale onlineexperiment, measuring the performance of users as humansensors of deception-based security attacks in social media. Incases B and C we have demonstrated the utilisation of human-generated attributes as a practical measure to predict useraccuracy and credibility of reported semantic attacks againsta social media platform; identifying consistent performancebetween a number of attack across a limited set of indicatorsthat are ethical and can be measured automatically and in real-time. We have shown that it is feasible to predict to some extentusers’ ability as detectors of such attacks, which can be highlyuseful in environments where the concept of the human sensorof security threats may be considered, including the socialmedia platforms themselves or corporate environments whereemployees use social media. The next stage in this work willinvolve the development of a technical system that can operatein both a corporate environment and external independentplatform. Future research in this field can also investigate thefeasibility of using human sensors for deception-based attacksin different environments, such as in the context of cloudcomputing [26], the Internet of Things and cyber-physicalsystems [27].
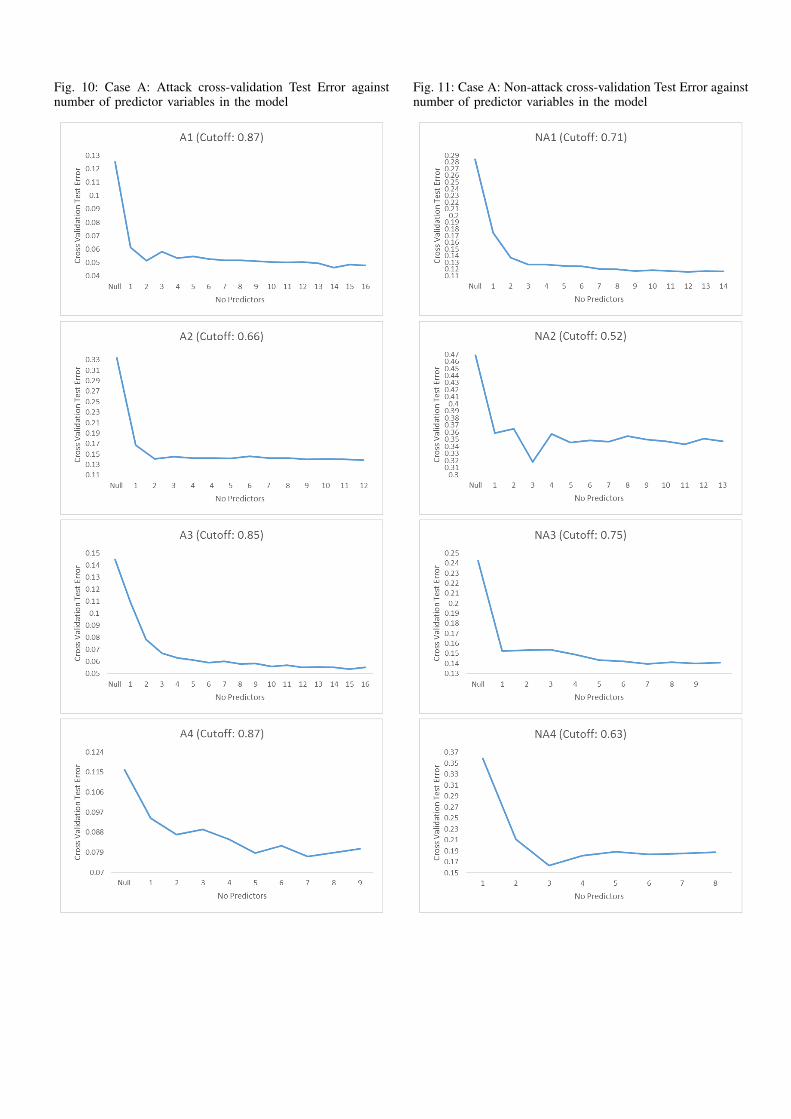
Fig. 10: Case A: Attack cross-validation Test Error againstnumber of predictor variables in the model
Fig. 11: Case A: Non-attack cross-validation Test Error againstnumber of predictor variables in the model

Up to now, we have focused on deception-based attacks,where the user is deceived into performing a compromisingaction. However, it is likely that the concept of the humansensor can potentially be extended to attacks that do notinvolve deception. For instance, it is the human users of awebsite that often first notice that a website is experiencingpoor availability and their reports could complement networkmonitoring and help speed up denial of service detection[28], [29]. Also, in cyber-physical systems, such as semi-autonomous vehicles, the human operator is likely to be thefirst to observe the adverse physical impact of a commandinjection attack [30], [31]. In the future, we intend to extend thescope of this research on human sensors of security threats interms of types of attacks and platforms involved. The aim is byno means to replace technical security systems, but to enhancethem by leveraging human sensing capacity and experience.
REFERENCES
[1] Y. Zheng, T. Liu, Y. Wang, Y. Zhu, Y. Liu, and E. Chang, “Diagnosingnew york city’s noises with ubiquitous data,” in ACM InternationalJoint Conference on Pervasive and Ubiquitous Computing, Sep. 2014,pp. 715–725.
[2] B. Pan, Y. Zheng, D. Wilkie, and C. Shahabi, “Crowd sensing oftraffic anomalies based on human mobility and social media,” in ACMSIGSPATIAL International Conference on Advances in GeographicInformation Systems, November 2013, pp. 344–353.
[3] E. Jurrens, A. Broring, and S. Jirkai, “A human sensor web for wateravailability monitoring,” in OneSpace, 2009.
[4] T. Bennett, K. Holloway, and D. P. Farrington, “Does neighborhoodwatch reduce crime? a systematic review and meta-analysis,” Journalof Experimental Criminology, vol. 2, no. 4, pp. 437–458, 2006.
[5] M. Avvenuti, M. G. Cimino, S. Cresci, A. Marchetti, and M. Tesconi,“A framework for detecting unfolding emergencies using humans assensors,” SpringerPlus, vol. 5, no. 1, pp. 1–23, 2016.
[6] S. K. Boddhu, R. Dave, R. Williams, M. McCartney, and J. West.,“Augmenting situational awareness for first responders using socialmedia as a sensor,” Analysis, Design, and Evaluation of Human-Machine Systems, vol. 12, no. 1, pp. 133–140, 2013.
[7] N. Stembert, A. Padmos, M. S. Bargh, S. Choenni, and F. Jansen, “Astudy of preventing email (spear) phishing by enabling human intelli-gence,” in European Intelligence and Security Informatics Conference,September 2015, pp. 113–120.
[8] A. Filippoupolitis, G. Loukas, and S. Kapetanakis, “Towards real-timeprofiling of human attackers and bot detection,” in 7th InternationalConference on Cybercrime Forensics Education and Training (CFET),Canterbury, UK, July 2014.
[9] S. Kapetanakis, A. Filippoupolitis, G. Loukas, and T. A. Murayziq,“Profiling cyber attackers using case-based reasoning,” in 19th UKworkshop on Case-Based Reasoning (UK-CBR), Cambridge, UK, De-cember 2014.
[10] R. Heartfield and G. Loukas, “A taxonomy of attacks and a surveyof defence mechanisms for semantic social engineering attacks,” ACMComputing Surveys, vol. 48, no. 3, 2016.
[11] M. Workman, “Wisecrackers: A theorygrounded investigation of phish-ing and pretext social engineering threats to information security,” Jour-nal of the American Society for Information Science and Technology,vol. 59, no. 4, pp. 662–674, 2008.
[12] I. M. A. Alseadon, “The impact of users’ characteristicson their ability to detect phishing emails,” Ph.D. dissertation,Queensland University of Technology, Brisbane, May 2014. [Online].Available: http://eprints.qut.edu.au/72873/1/Ibrahim\%20Mohammed\%20A Alseadoon Thesis.pdf
[13] T. Halevi, J. Lewis, and N. Memon, “A pilot study of cyber securityand privacy related behavior and personality traits,” in Internationalconference on World Wide Web, May 2013, pp. 737–744.
[14] T. Halevi, N. Memon, and O. Nov. (2015, January) Spear-phishingin the wild: A real-world study of personality, phishing self-efficacyand vulnerability to spear-phishing attacks. [Online]. Available:http://dx.doi.org/10.2139/ssrn.2544742
[15] J. G. Mohebzada, A. E. Zarka, A. H. Bhojani, and A. Darwish, “Phish-ing in a university community: Two large scale phishing experiments,”in IIT, Cambridge, United Kingdom, April 2012, pp. 373–382.
[16] S. Sheng, M. Holbrook, P. Kumaraguru, L. Cranor, and J. Downs, “Whofalls for phish?: a demographic analysis of phishing susceptibility andeffectiveness of interventions,” in SIGCHI CHI, Atlanta, GA, USA,2010, pp. 373–382.
[17] M. Blythe, H. Petrie, and J. A. Clark, “F for fake: four studies onhow we fall for phish,” in SIGCHI Conference on Human Factors inComputing Systems, May 2011, pp. 3469–3478.
[18] J. Hong, “The state of phishing attacks,” Communications of the ACM,vol. 55, no. 1, pp. 74–81, 2012.
[19] P. Kumaraguru, J. Cranshaw, A. Acquisti, L. Cranor, J. Hong,M. A.Blair, and T. Pham, “School of phish: a real-world evaluation ofanti-phishing training,” in Symposium on Usable Privacy and Security,July 2009.
[20] D. Colardyn and J. Bjornavold, “Validation of formal, nonformal andinformal learning: Policy and practices in eu member states,” Europeanjournal of education, vol. 39, no. 1, pp. 69–89, 2004.
[21] R. Ihaka and R. Gentleman, “The R project for statistical computing,”2016.
[22] S. Egelman, L. F. Cranor, and J. Hong, “You’ve been warned: anempirical study of the effectiveness of web browser phishing warnings,”in SIGCHI Conference on Human Factors in Computing Systems.ACM, 2008, pp. 1065–1074.
[23] J. S. Downs, M. B. Holbrook, and L. F. Cranor, “Decision strategiesand susceptibility to phishing,” in Second symposium on Usable privacyand security. ACM, 2006, pp. 79–90.
[24] J. S. Downs, M. Holbrook, and L. F. Cranor, “Behavioral response tophishing risk,” in Anti-phishing working group’s 2nd annual eCrimeresearchers’ summit, October 2007, pp. 37–44.
[25] D. W. Hosmer Jr, S. Lemeshow, and R. X. Sturdivant, Applied logisticregression (Vol. 398). John Wiley and Sons, 2013.
[26] R. Heartfield and G. Loukas, “On the feasibility of automated semanticattacks in the cloud,” in Computer and Information Sciences III.Springer London, 2013, pp. 343–351.
[27] G. Loukas, Cyber-Physical Attacks: A Growing Invisible Threat.Butterworth-Heinemann (Elsevier), 2015.
[28] E. Gelenbe, M. Gellman, and G. Loukas, “Defending networks againstdenial-of-service attacks,” in European Symposium on Optics andPhotonics for Defence and Security (SPIE), London, UK, October 2004,pp. 233–243.
[29] G. Loukas and G. Oke, “Likelihood ratios and recurrent random neuralnetworks in detection of denial of service attacks,” in InternationalSymposium of Computer and Telecommunication Systems (SPECTS),San Diego, CA, USA, July 2007.
[30] T. Vuong, G. Loukas, and D. Gan, “Performance evaluation of cyber-physical intrusion detection on a robotic vehicle,” in Proceedings of13th International Conference on Pervasive Intelligence and Computing(PICOM). IEEE, 2015.
[31] T. Vuong, G. Loukas, D. Gan, and A. Bezemskij, “Decision tree-baseddetection of denial of service and command injection attacks on roboticvehicles,” in Proceedings of 7th International Workshop on InformationForensics and Security (WIFS). IEEE, 2015.