Embed Size (px)
Citation preview

Evaluating the Quality and Impact of Reproductive Health Research
Jane T. Bertrand
FRONTIERS/Tulane Southampton
Jan. 23, 2001
Why Evaluate?
To determine whether OR studies have the desired impact of changing service delivery or policy
To identify factors influencing utilization To highlight the importance of utilizing the
results to researchers involved To apply lessons learned to other OR studies To be accountable to donors
What are we evaluating?
Interventions:– What has been the impact of the intervention on the
target population?– Example: teen pregnancy program in England
Research:– what has been the impact of research on service
delivery and policy?
Advantages of op. research to government official/policy makers
Allows them to test out controversial interventions on a small scale at lower political risk
If successful, take credit and scale up.
If unsuccessful, “that was just a trial.”
Increased emphasis on evaluation in USAID-funded projects
The EVALUATION Project in 1991:– Improve state-of-the art in program evaluation
MEASURE Evaluation – 1997 to present:– Apply improved evaluation methods in the field
USAID switched from log frame approach to results framework:– Strategic objective, intermediate results– EMPHASIS ON RESULTS, not on ACTIVITIES– Based on a tracking of indicators
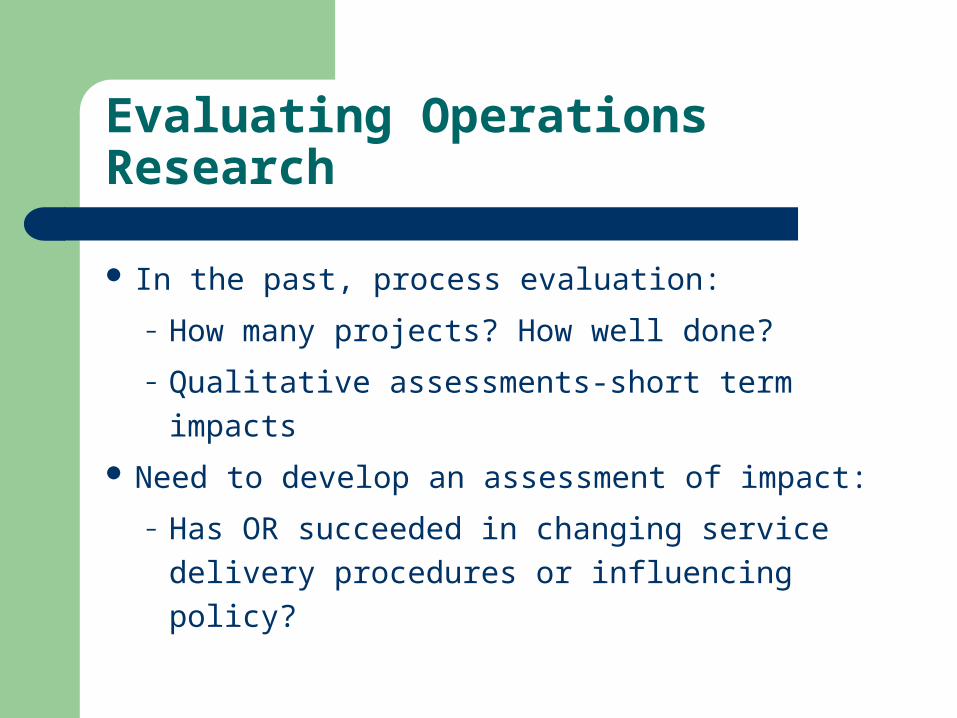
Evaluating Operations Research
In the past, process evaluation:
– How many projects? How well done?
– Qualitative assessments-short term impacts
Need to develop an assessment of impact:
– Has OR succeeded in changing service
delivery procedures or influencing policy?
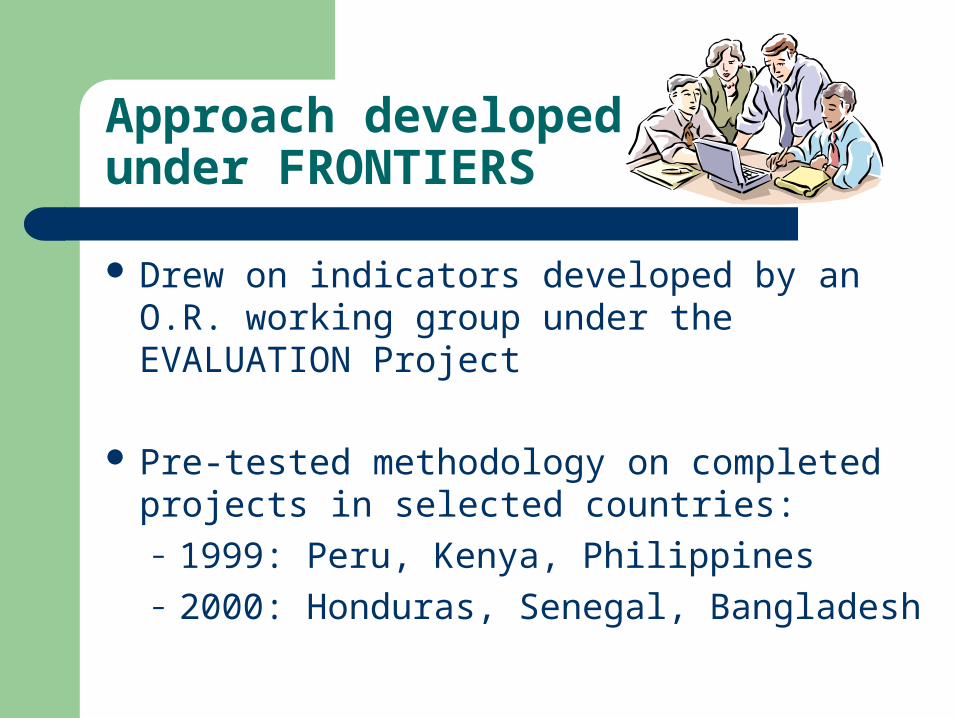
Approach developed under FRONTIERS
Drew on indicators developed by an O.R. working group under the EVALUATION Project
Pre-tested methodology on completed projects in selected countries:– 1999: Peru, Kenya, Philippines– 2000: Honduras, Senegal, Bangladesh
Data collection process
Two person evaluation team:– FRONTIERS/Tulane staff, consultant
Duration of data collection: – one week in country
Sources of data– Project reports, other documentation– Key informant interviews using assessment form
Assessment forms: (see Appendix A)– used to guide discussion– used to present/document results
Types of indicators
Process
Impact
Contextual factors

Process Indicators
P-1. Implementing organization actively participated in study design
P-2. Implementing organization actively participated in conduct of OR project
P-3. Study accomplished its research objectives P-4. Intervention was implemented as planned P-5. Completed without delays that would
compromise validity of research design
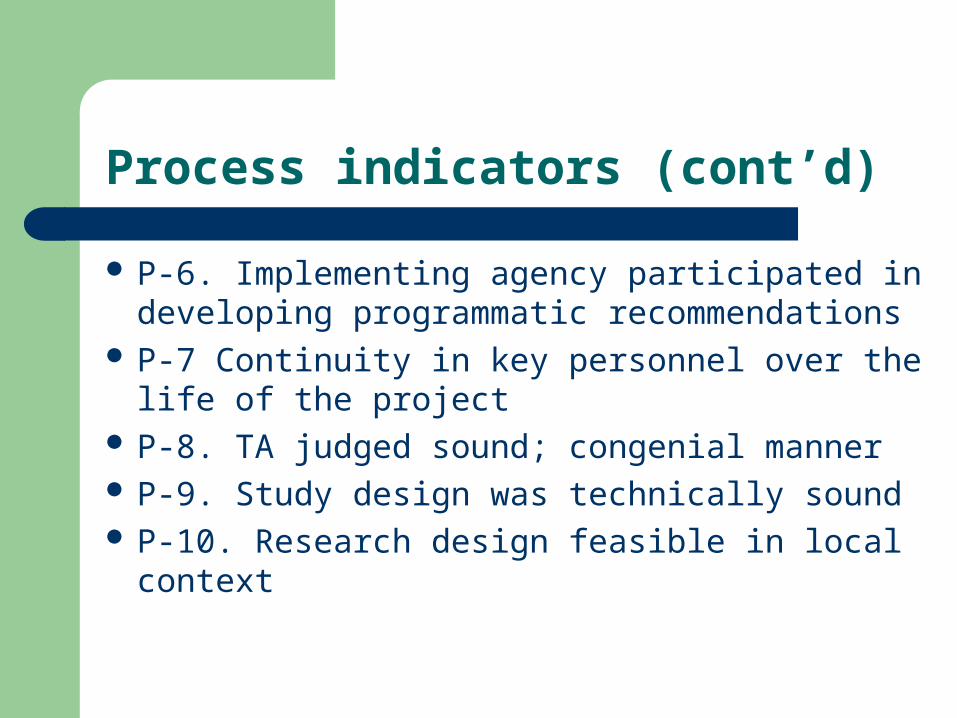
Process indicators (cont’d)
P-6. Implementing agency participated in developing programmatic recommendations
P-7 Continuity in key personnel over the life of the project
P-8. TA judged sound; congenial manner P-9. Study design was technically sound P-10. Research design feasible in local context
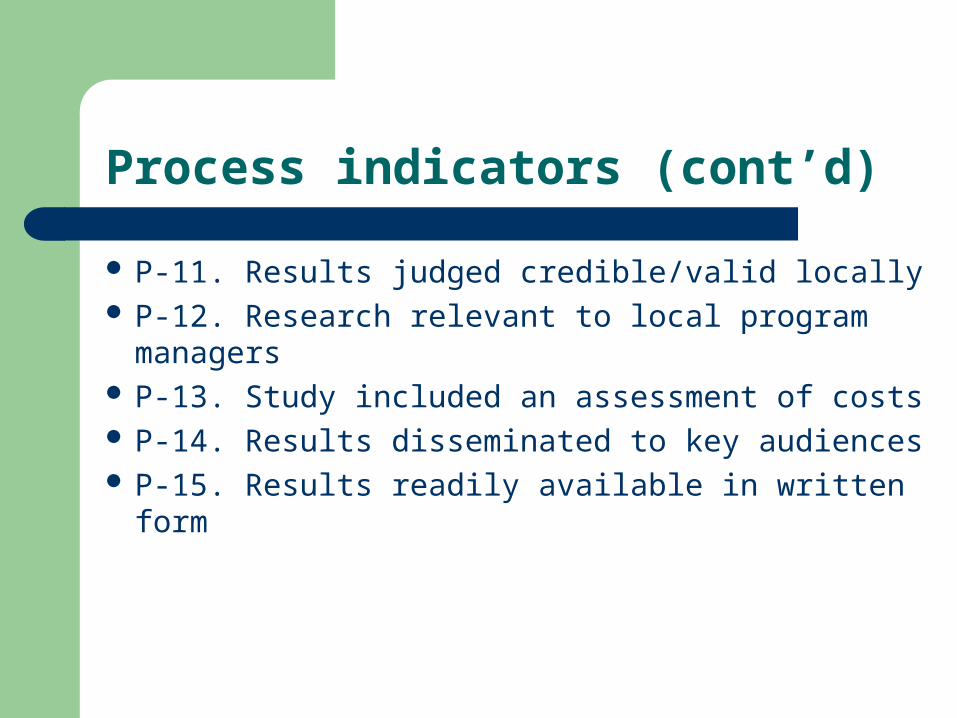
Process indicators (cont’d)
P-11. Results judged credible/valid locally P-12. Research relevant to local program
managers P-13. Study included an assessment of costs P-14. Results disseminated to key audiences P-15. Results readily available in written form
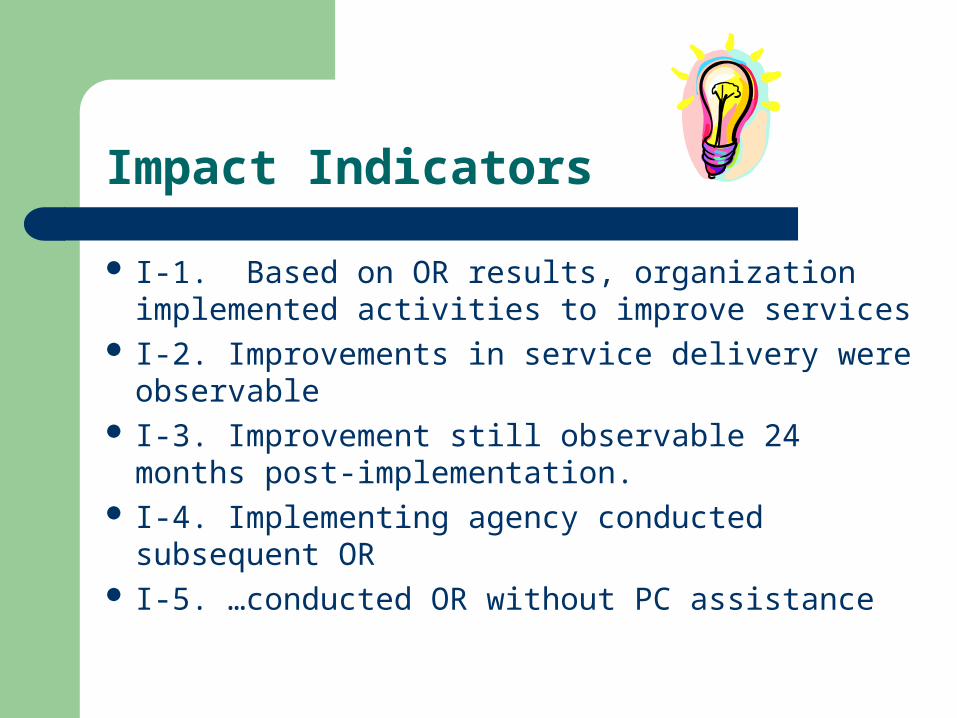
Impact Indicators
I-1. Based on OR results, organization implemented activities to improve services
I-2. Improvements in service delivery were observable
I-3. Improvement still observable 24 months post-implementation.
I-4. Implementing agency conducted subsequent OR I-5. …conducted OR without PC assistance
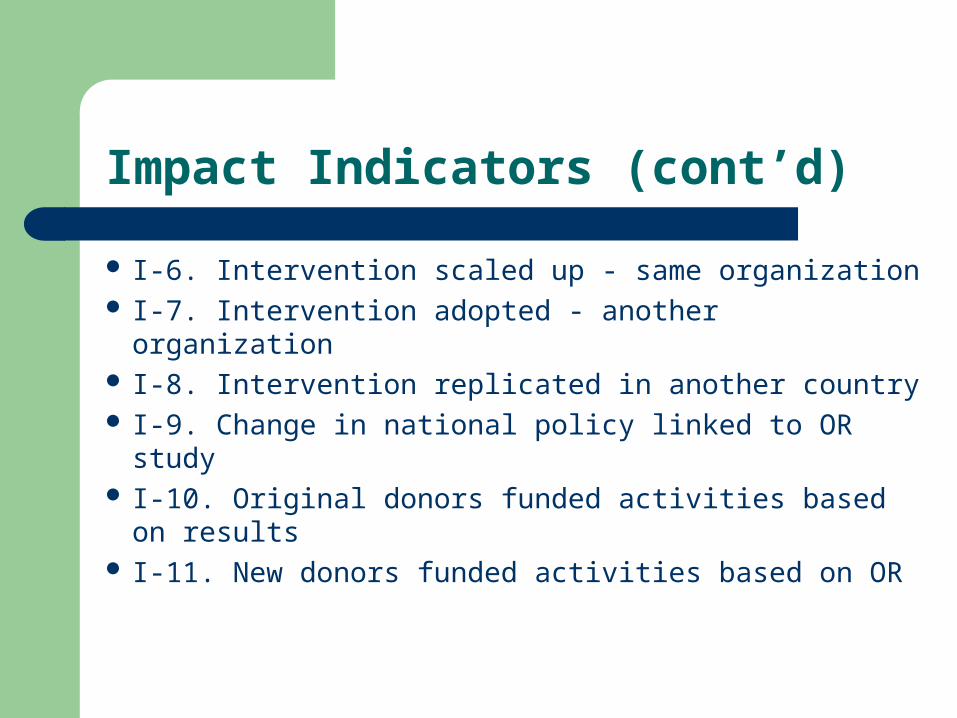
Impact Indicators (cont’d)
I-6. Intervention scaled up - same organization I-7. Intervention adopted - another organization I-8. Intervention replicated in another country I-9. Change in national policy linked to OR study I-10. Original donors funded activities based on
results I-11. New donors funded activities based on OR
Contextual factors:
Factors that facilitated:– Conduct of study– Utilization- of results
Factors that impeded:– Conduct of study– Utilization of results
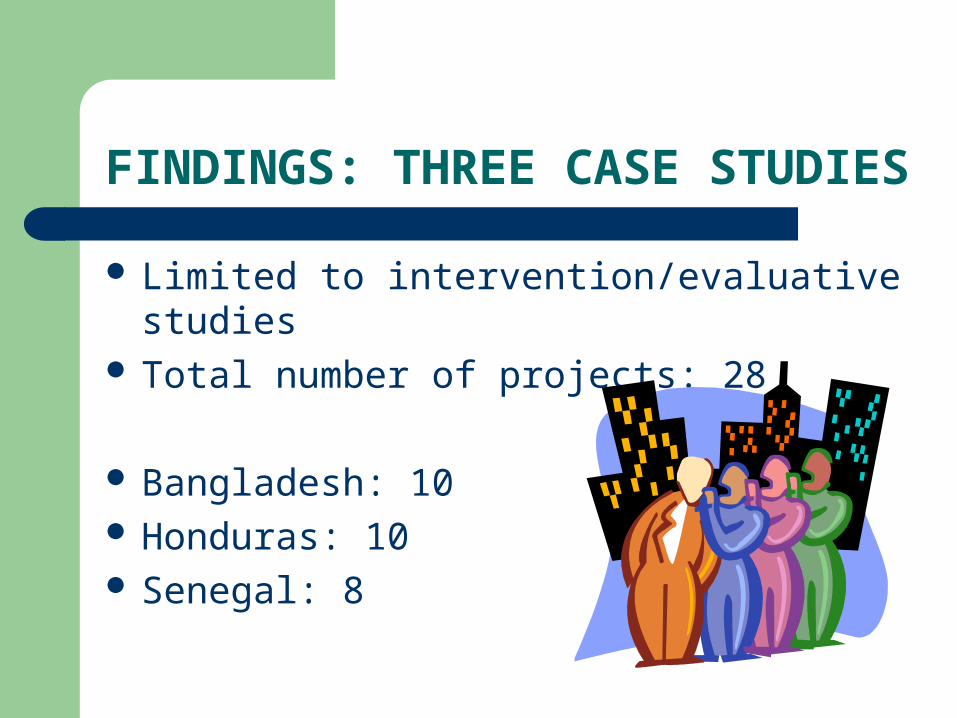
FINDINGS: THREE CASE STUDIES
Limited to intervention/evaluative studies Total number of projects: 28
Bangladesh: 10 Honduras: 10 Senegal: 8
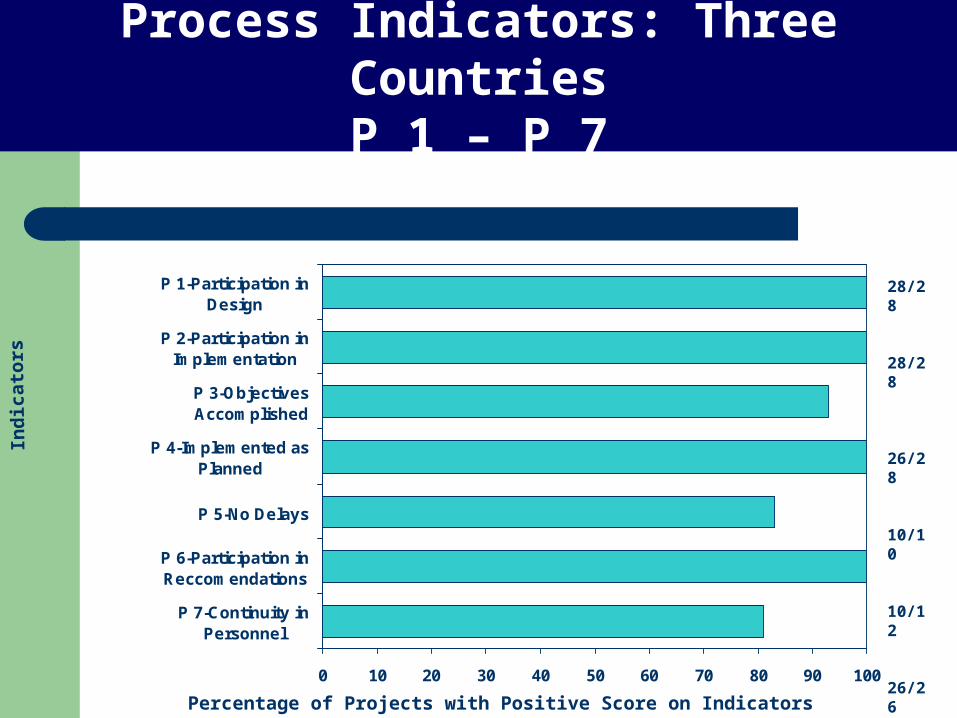
Process Indicators: Three CountriesP 1 – P 7
0 10 20 30 40 50 60 70 80 90 100
P 7-Continuity inPersonnel
P 6-Participation inReccomendations
P 5-No Delays
P 4-Implemented asPlanned
P 3-ObjectivesAccomplished
P 2-Participation inImplementation
P 1-Participation inDesign
Ind
icat
ors
Percentage of Projects with Positive Score on Indicators
28/28
28/28
26/28
10/10
10/12
26/26
21/26
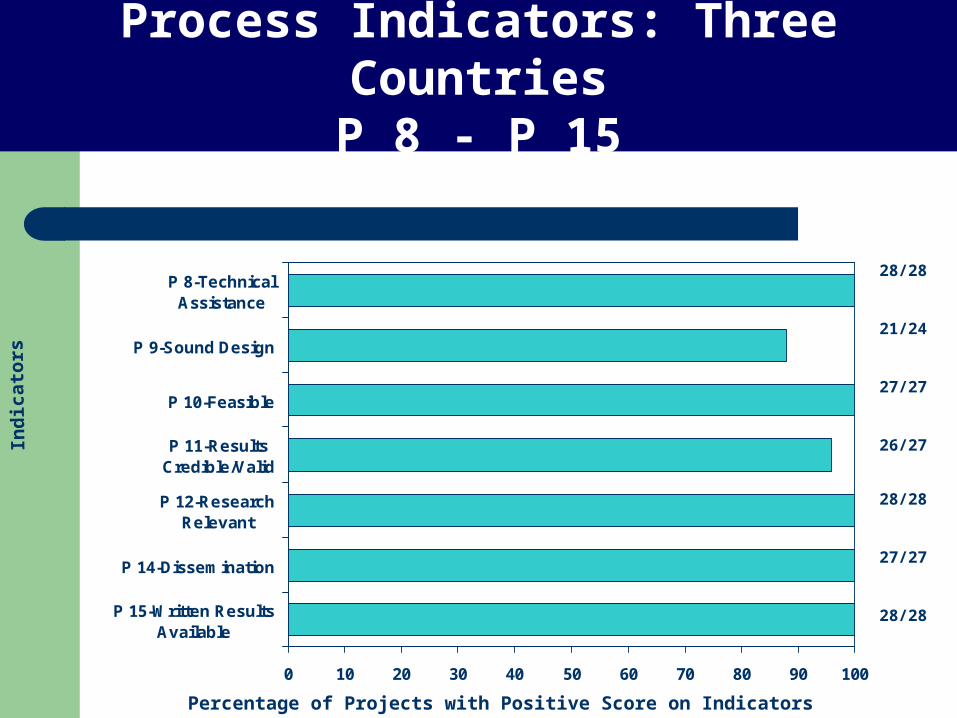
Process Indicators: Three CountriesP 8 - P 15
0 10 20 30 40 50 60 70 80 90 100
P 15-Written ResultsAvailable
P 14-Dissemination
P 12-ResearchRelevant
P 11-ResultsCredible/Valid
P 10-Feasible
P 9-Sound Design
P 8-TechnicalAssistance
28/28
21/24
27/27
26/27
28/28
27/27
28/28
Ind
icat
ors
Percentage of Projects with Positive Score on Indicators
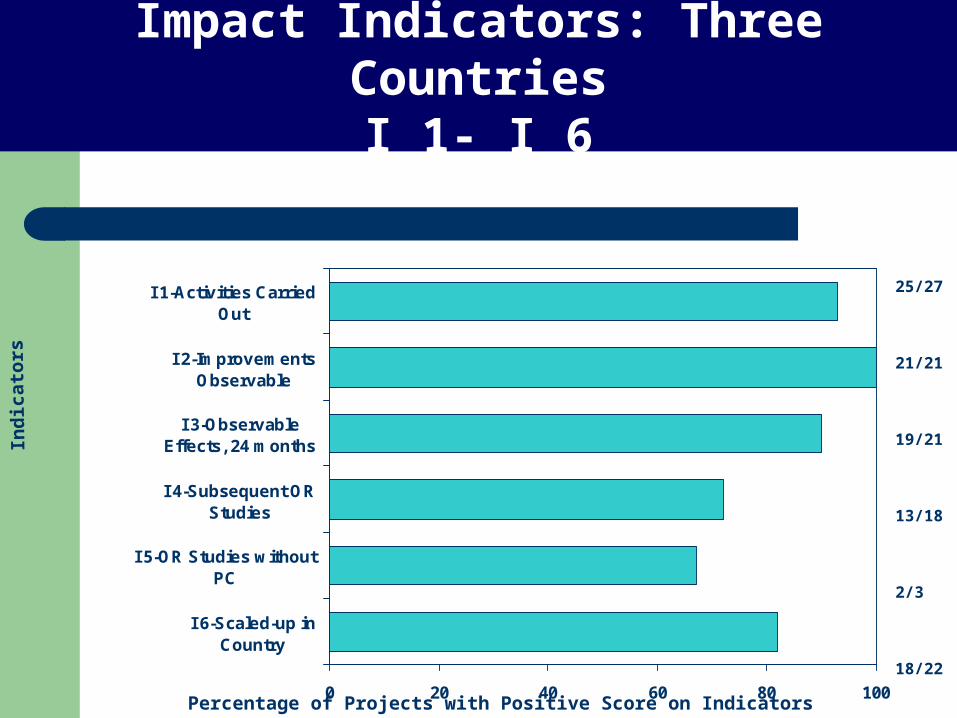
Impact Indicators: Three CountriesI 1- I 6
0 20 40 60 80 100
I 6-Scaled-up inCountry
I 5-OR Studies withoutPC
I 4-Subsequent ORStudies
I 3-ObservableEffects, 24 months
I 2-ImprovementsObservable
I 1-Activities CarriedOut
25/27
21/21
19/21
13/18
2/3
18/22
Ind
icat
ors
Percentage of Projects with Positive Score on Indicators
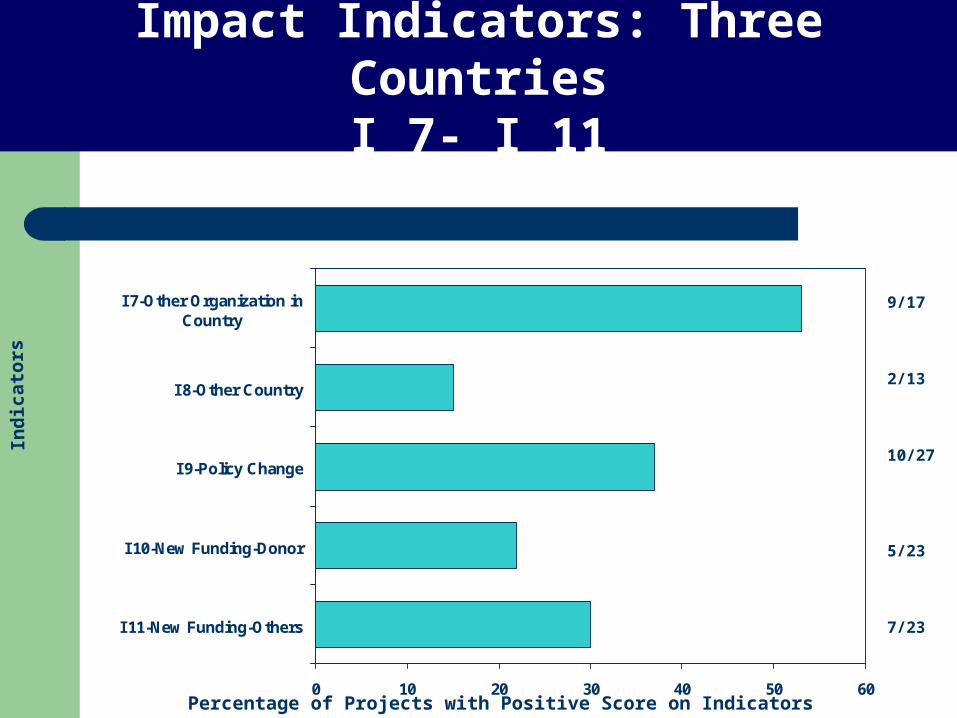
Impact Indicators: Three CountriesI 7- I 11
0 10 20 30 40 50 60
I 11-New Funding-Others
I 10-New Funding-Donor
I 9-Policy Change
I 8-Other Country
I 7-Other Organization inCountry
9/17
2/13
10/27
5/23
7/23
Ind
icat
ors
Percentage of Projects with Positive Score on Indicators
Advantages of Methodology
Both quantitative and qualitative Summary table of data easily produced and
interpreted Concrete examples included Provides rich information on factors affecting
utilization
Limitations
Can not prove cause and effect Rather: “plausible attribution” if:
– change in service delivery occurred after intervention, and
– change is consistent with OR results Requires some subjective judgements; potential
for bias Staff turnover may affect quality of data
Next steps
Apply methodology to all FRONTIERS projects (n=75+)
Timing: – At end of project– 36 months later
Project monitor to report Subset (25%) to be verified by external team Compile results in ACCESS data base
Analyses to be Conducted at Close of FRONTIERS
Creation of scale for performance of each project on process and impact
Correlations and cluster analysis of different indicators in the data set
Determinants of impact: what indicators of process are significantly related to impact?
Meta-analyses: by country, region, topic
…wish us luck
Stay tuned for the results.
Thanks for attending.