Embed Size (px)
Citation preview
Evaluating the Functionality of the Symmetry ETG and Medstat MEG Software in Forming Episodes of Care Using Medicare Data
August 2008 Thomas MaCurdy, Ph.D. Jason Kerwin Jonathan Gibbs Eugene Lin Carolyn Cotterman Margaret O’Brien-Strain, Ph.D. Nick Theobald, Ph.D. CMS Project Officer Frederick Thomas, Ph.D.
Acumen, LLC
500 Airport Blvd., Suite 365
Burlingame, CA 94010
ACKNOWLEDGEMENTS
This study was funded by the Centers for Medicare and Medicaid Services (CMS) under
contract numbers HHSM-500-01-0031, Task Order 0002, and HHSM-500-2006-00006I, Task
Order 0005. Our sincere thanks to Fred Thomas, Jesse Levy, Craig Caplan and other CMS staff
who have provided extensive feedback on numerous drafts of this report over two years of
research and analysis.
Our thanks go as well to Ingenix and Thomson Medstat. Over the course of this project,
these vendors have assisted us on working with multiple versions of the Ingenix Symmetry
Episodic Treatment Groups and Thomson/Reuters Medstat Medical Episode Grouper software
packages. In addition, the vendors provided critiques and comments on several earlier drafts of
this report. Prior to making this work public, CMS gave each vendor the opportunity to
comment on this final report. A copy of the final report was sent to each vendor along with a
letter asking for comments and an authorization to make those comments publicly available. The
vendors were asked to make their comments succinct and to focus only on technical issues of
analysis by Acumen, LLC. Both vendors submitted comments, and their responses appear in the
appendix of this report.
The statements contained in this report are solely those of the authors and do not
necessarily reflect the views or policies of the CMS. Acumen, LLC assumes responsibility for
the accuracy and completeness of the information contained in this report.
Functionality of the Symmetry ETG and Medstat MEG Software | August 2008 i
EXECUTIVE SUMMARY
Medicare health care costs are rising rapidly, and to stem this increase the Centers for
Medicare and Medicaid Services (CMS) has been exploring a variety of value-based purchasing
(VBP) initiatives aimed at improving quality of care while avoiding unnecessary costs. One
major concern involves the significant variation in practice patterns observed both across and
within regions, which prominent research has argued does not improve quality of care even
though these patterns entail large differences in resource utilization. To advance policymakers’
understanding of the nature and extent of variation in practice patterns, CMS and other
government agencies have conducted a series of projects evaluating alternative approaches for
comparing relative resource use for various types of medical care. A key initial goal of these
efforts consists of providing feedback and education to encourage more efficient practice by
physicians and hospitals, with the potential follow-on goal being the development of pay for
performance systems that could reward health care professionals for delivering cost-effective
medical care. Implementing such VBP concepts requires a reliable framework for measuring the
cost of care and the “value” contributed by providers. A popular candidate advocated for this
framework relies on software products known as episode groupers.
Episode grouping offers the potential to create measures of resource utilization and
expenditures for the treatment of different medical conditions, allowing comparisons of health-
care providers across a region or a specialty to rate individual performance. This report presents
an initial appraisal of two commercially available episodic grouper software packages applied to
Medicare claims: the INGENIX Symmetry Episode Treatment Groups (ETG) and the Thomson
Medstat Medical Episode Grouper (MEG). The specific aims of this study are to:
(1) Build an interface to use Medicare claims as inputs for the episodic groupers. (2) Implement the groupers by inputting Medicare data. (3) Document the properties of the groupers in constructing episodes of care and
associated costs. (4) Evaluate the impacts of altering the configuration options offered by the groupers
in assigning Medicare claims to episodes. (5) Compare the results of the two groupers.
This report focuses on understanding the properties of the grouper algorithms in forming
episodes out of Medicare claims data and in assigning costs to these episodes. Such an analysis
Functionality of the Symmetry ETG and Medstat MEG Software | August 2008 i
Executive Summary ii
provides key insights into the challenges that must be overcome to realize the potential put forth
by advocates of using the groupers to evaluate Medicare providers. The study does not explore
how the ETG and MEG groupers might be used to profile physicians, nor does it examine the
clinical logic underlying the groupers in their allocation of claims into meaningful clinical
events.
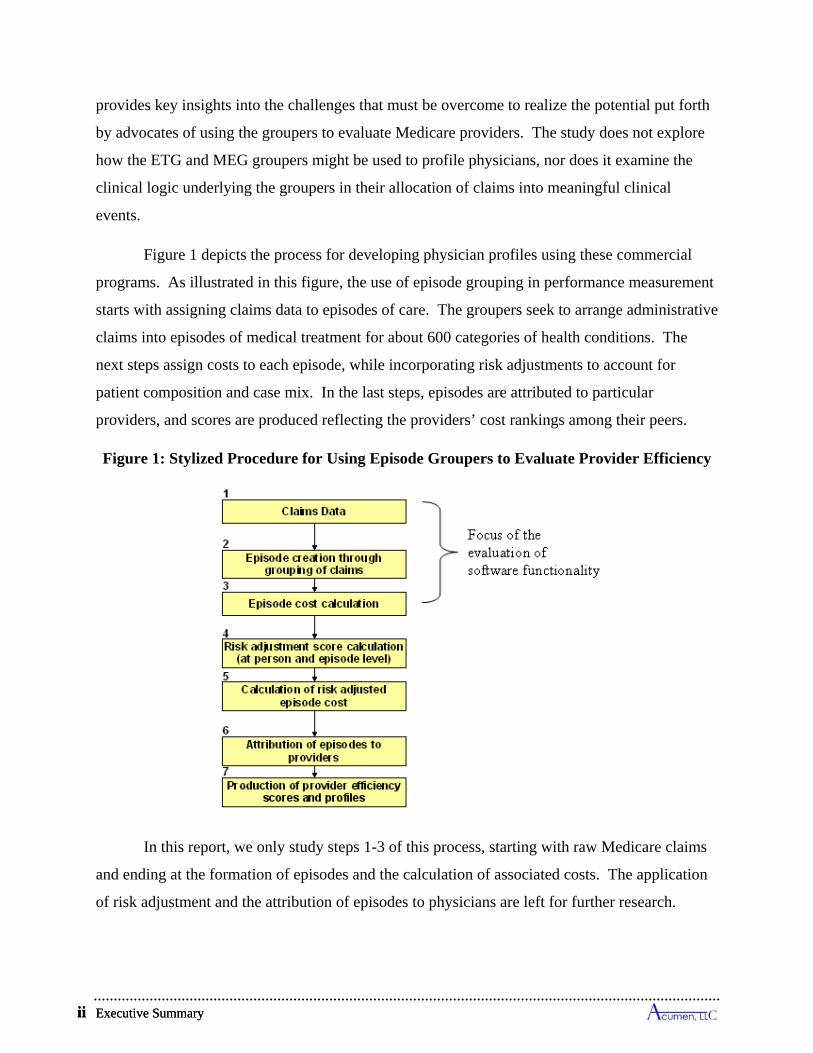
Figure 1 depicts the process for developing physician profiles using these commercial
programs. As illustrated in this figure, the use of episode grouping in performance measurement
starts with assigning claims data to episodes of care. The groupers seek to arrange administrative
claims into episodes of medical treatment for about 600 categories of health conditions. The
next steps assign costs to each episode, while incorporating risk adjustments to account for
patient composition and case mix. In the last steps, episodes are attributed to particular
providers, and scores are produced reflecting the providers’ cost rankings among their peers.
Figure 1: Stylized Procedure for Using Episode Groupers to Evaluate Provider Efficiency
In this report, we only study steps 1-3 of this process, starting with raw Medicare claims
and ending at the formation of episodes and the calculation of associated costs. The application
of risk adjustment and the attribution of episodes to physicians are left for further research.
Executive Summary ii
Functionality of the Symmetry ETG and Medstat MEG Software | August 2008 iii
Our analysis documents the challenges encountered in applying the Symmetry and
Medstat packages to Medicare data, not only due to the special configuration of Medicare claims,
but also arising from inherent features of the individual groupers. This report develops protocols
for translating all types of Medicare claims into input formats accepted by the ETG and MEG
software, and for presenting the software outputs in a comprehensive framework that permits
convenient comparisons of the outcomes produced by the two groupers. To understand the
options for making use of Part A and B claims in the ETG and MEG packages, this study begins
with a review of how the different types of Medicare claims report the essential information used
by grouping algorithms to construct episodes of care. The latter sections of this study examine
the impacts of the alternative strategies employed by the two software products, as well as the
effects on each grouper’s results from changing software configurations and the data elements
extracted from Medicare claims.
Adapting the Groupers for Use with Medicare Data
One encounters a variety of challenges in applying the Symmetry and Medstat software
in a Medicare setting to create episodes of care and in assigning costs to these episodes (the first
three steps of Figure 1). To depict practice in most health care organizations, grouping
algorithms essentially rely on three key assumptions:
(1) All claims relevant for treating a particular illness incident can be grouped into a distinctive episode of care.
(2) The component medical services making up any claim belong to one and only one episode.
(3) Episodes of care have clearly defined start and end dates.
The Medicare system introduces a variety of complications in the applicability of these
suppositions, which in turn induces challenges in implementation. Whereas some challenges are
specific to the individual software packages, others are common to both groupers. The following
discussion initially describes several of the complications commonly encountered in providing
medical care to Medicare beneficiaries, and it then outlines specific issues encountered in
implementing the ETG and MEG groupers using Medicare data.
Functionality of the Symmetry ETG and Medstat MEG Software | August 2008 iii
Executive Summary iv
General Challenges in Using Groupers to Infer Episodes of Care
The medical complexity of the health status of many Medicare beneficiaries often makes
the task of allocating individual medical services or claims to a single category of care or
treatment a significant problem. Such a task requires distinguishing which particular health
condition constitutes the ultimate cause for the provision of each service represented by a
Medicare claim. Yet numerous Medicare beneficiaries have multiple co-morbidities that
simultaneously affect a patient’s health status and the resulting administration of care. Given the
complexity of patients’ health circumstances, attributing services to distinct illnesses and health
conditions constitutes a serious quandary. Moreover, beneficiaries who look quite similar from
the perspective of services received may have different underlying causal conditions. To
complicate matters further, treatments for such illnesses can result in a large number of claims
being submitted for individual beneficiaries; in a three year period, nearly 7% of beneficiaries
have more than 300 claims paid on their behalf.
Moreover, the notion that episodes of care have clearly defined start and end dates is
questionable in the treatment of chronic conditions. Chronic condition episodes do not have
clearly defined end dates, because such conditions are progressive and, by definition, do not end.
To facilitate episode creation, administrative rules are used to define the duration of chronic
episodes. Without such rules, the episode would never end. Both groupers truncate chronic care
into fixed 12-month intervals, with the most common time interval being a calendar year.
Typically, one chronic “episode” immediately follows another. Chronic care episodes in the
Medicare population account for a large percentage of costs. Each grouper defines chronic
conditions differently. In ETG, chronic condition episodes constitute approximately 65% of the
costs, and 43% in MEG.
Finally, to a great extent, the applicability of the groupers to Medicare data depends on
how diagnoses are used by the various Medicare payment systems. Diagnoses are collected on
all claims, but they are used quite differently. The essential data elements from claims used by
grouping algorithms to construct episodes of care and associated costs include the following:
diagnosis codes, procedure and/or revenue codes, start and end dates, service payments, and
patient characteristics. The Parts A and B programs in fee-for service Medicare pay for services
using seven distinct types of claims— inpatient (IP), outpatient (OP), skilled nursing facility
Executive Summary iv
Functionality of the Symmetry ETG and Medstat MEG Software | August 2008 v
(SNF), hospice (HS), home health (HH), Part B or carrier (PB), and durable medical equipment
(DME)—which report the above data elements in different manners and with varying degrees of
consistency.
Although just one of several factors, diagnosis is the major determinant that affects the
level of payment to facilities for acute hospital inpatient stays and to home health agencies. The
IP DRG payment system keys off the principal diagnosis. In HH, diagnosis is one component in
constructing the home health resource groups. The physician fee schedule pays based on HCPCS
codes, which identify medical services, and diagnoses are sometimes used as a screen to
determine whether a service should be paid. Similarly, SNF payments do not use diagnoses
except to determine whether a SNF stay is a covered service. Finally, facility payments for
services provided in OP departments and payments for hospice care are not based on diagnosis.
Given that the groupers tend to group claims based in principal diagnoses, and the use of
diagnosis codes varies by claim type, it will not always be the case that claims from various
sources will go to the same episode even when, clinically, they appear related.
Specific Features of the ETG Grouper in Applications to Medicare Data
In the case of Symmetry, the following three aspects of the ETG framework govern the
construction of episodes of care and associated costs from Medicare claims:
The ETG software inputs each claim as a set of service-level records comprised of the revenue center and procedure codes on the claim, with each record individually assigned to an episode:
o For institutional claims, each input record consists of a single revenue center code identifying a form of service, an accompanying procedure code if available, and diagnoses listed on the parent claim.1 A claim has as many input records as it has revenue center codes. Whereas revenue center codes are universally reported on all institutional Medicare claims, HCPCS/CPT procedure codes—which often reveal more details about the form of service—are rarely available on IP, SNF, and HS claims (e.g., less than 9% IP claims list these codes); in contrast, these procedure codes commonly accompany revenue center codes on OP and HH claims (e.g., 99% in the case of HH claims).
o For non-institutional services, Medicare’s PB and DME claims are readily separated into line items associated with individual HCPCS or CPT codes; these claim types have no revenue center codes. Each input record constructed from a PB and DME claim consists of a single procedure code and its corresponding
1 Symmetry's input files accept up to 4 diagnosis codes, which is fewer than are often available on Medicare’s institutional claims. 82% of IP claims, 70% of SNF claims, and 38% of HH claims have more than 4 codes.
Functionality of the Symmetry ETG and Medstat MEG Software | August 2008 v
Executive Summary vi
line-item diagnosis. Consequently, in addition to diagnosis information in a Medicare setting, the ETG grouper primarily relies on revenue center codes to group IP/SNF/HS claims, procedure codes to group PB and DME claims, and it can use either or both types of codes to group OP and HH claims.
Institutional claims are often linked to multiple episodes: Symmetry's grouper can and often does assign the separate input records from a single parent claim to different episodes and, consequently, many institutional claims are essentially connected to more than one episode.
Users must devise their own procedure for allocating the cost of a multi-linked claim to its associated episodes: When the input records of an institutional claim are assigned to two or more episodes, the ETG grouper offers no guidance for how to divide the cost of this claim across its associated episodes. While a variety of candidate rules are available, none are free of substantive criticisms.
Specific Features of the MEG Grouper in Applications to Medicare Data
Medstat takes a somewhat different approach to the same data. We highlight two main
considerations important when using Medstat’s software to group Medicare claims into episodes:
Medstat’s grouping process inputs each claim as a single record, relying primarily on diagnosis information in its assignments to episodes: Regardless of whether a Medicare claim comes from an institutional or non-institutional source, the MEG grouper accepts one input record per claim. This record distinguishes IP and PB claims from other types of Medicare claims, but it does not differentiate among the other distinct types of Medicare claims as the source of diagnoses. Switching claims from one of these types to another results in no change in constructed episodes. An input record accepts data on procedure codes appearing on the claim (not revenue center codes). This procedure information is primarily used to determine whether a claim represents an x-ray/lab event—which cannot start an episode—and in some instances to assist the grouper in deciding how to interpret secondary diagnoses on the claim.
Medstat’s grouper does not offer the capacity to treat a claim as an aggregate of services potentially linkable to more than one episode: Institutional Medicare claims typically cover an array of medical services, and MEG ignores the possibility that such a claim might provide treatments relevant to more than one illness. The prospective payment system used by Medicare not only compensates based on diagnoses but also on procedures and the likelihood of various co-morbidities. MEG’s inability to associate the cost of claims paid under such a system with more than one episode constitutes a potential challenge in applying Medstat's grouper software to a Medicare setting.
Methods and Data
Our initial samples included all claims available in 2002-2004 for 100% of Medicare
beneficiaries aged 65 and older who resided in the states of Colorado, Florida, Pennsylvania and
Oregon in 2003 and who were continuously enrolled in fee-for-service (FFS) Part A and B
services while alive. The groupers are run using all claims paid for beneficiaries during the years
Executive Summary vi
Functionality of the Symmetry ETG and Medstat MEG Software | August 2008 vii
2002-2004. Because our analyses reached equivalent conclusions for the different states, this
report presents only findings for Colorado. Further, to lessen the computational burden involved
in carrying out grouping for the many different specifications of the groupers considered in this
study, most of our analyses rely on a randomly-selected 20% sample of the Colorado residents.
We validated the results against the 100% samples of Colorado, Florida, Pennsylvania, and
Oregon and found that the 20% Colorado sample was always representative of larger state
samples.
To present the findings produced by the different groupers on a level playing field, we
have developed a framework to output and analyze the results in common metrics.2 This
approach exploits the fact that both groupers map claims to episodes, making it possible to see,
claim by claim, to which episode the claim was assigned. We use this claim-level episode
assignment to construct our own matching output tables for the two groupers. Based on the
claims included in the episodes, we develop common measures of episode length, cost and
completeness. In this analysis, the start date refers to the earliest service date of all the claims
grouped into the episode, and the end date takes the latest date of the grouped claims. We
calculate an episode’s cost based on its assigned claims, with the cost of a claim composed of its
Medicare payments, excluding the capital payment portion of IP claims, pass-thru payments, and
deductibles and copayments made by beneficiaries. The results discussed in this report come
from the current versions of the ETG and MEG software (version 7 for INGENIX Symmetry and
version 7.1 for Thomson Medstat).3
Overview of Findings
Our analysis uncovered a number of insights into the properties of episode groupers
applied to Medicare claims data.
Comparisons of Grouping Results for a Medicare Population
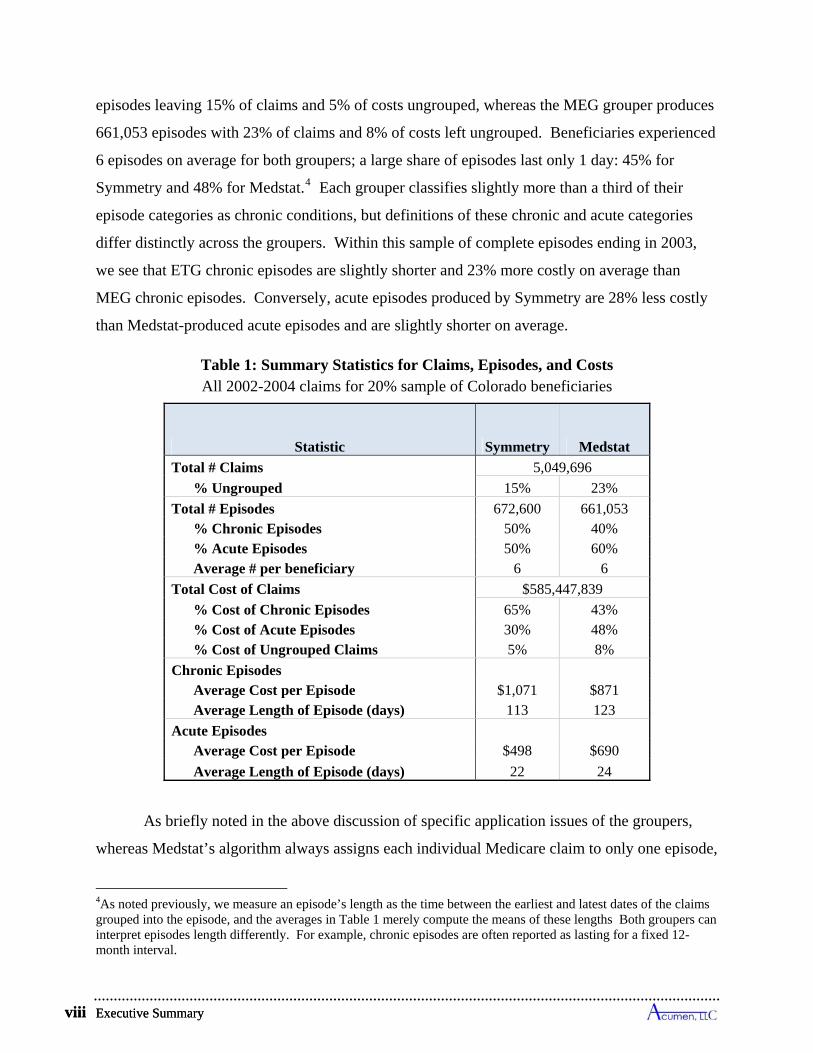
Table 1 presents summary statistics for such a sample comprised of 20% of the Medicare
beneficiaries residing in Colorado in 2003. Medicare paid $585.5 million for 5.05 million claims
on behalf of these beneficiaries between 2002 and 2004. The ETG grouper creates 672,600
2 The vendors have accepted this framework as a basis for comparison between the two packages. 3 In particular, we used INGENIX Symmetry Episode Treatment Groups Version 7.0.1 and Thomson Medstat Medical Episode Grouper Version 7.1.0 Build 7 Patch 1. We obtained similar key findings using prior releases of both software products available over the past two years.
Functionality of the Symmetry ETG and Medstat MEG Software | August 2008 vii
Executive Summary viii
episodes leaving 15% of claims and 5% of costs ungrouped, whereas the MEG grouper produces
661,053 episodes with 23% of claims and 8% of costs left ungrouped. Beneficiaries experienced
6 episodes on average for both groupers; a large share of episodes last only 1 day: 45% for
Symmetry and 48% for Medstat.4 Each grouper classifies slightly more than a third of their
episode categories as chronic conditions, but definitions of these chronic and acute categories
differ distinctly across the groupers. Within this sample of complete episodes ending in 2003,
we see that ETG chronic episodes are slightly shorter and 23% more costly on average than
MEG chronic episodes. Conversely, acute episodes produced by Symmetry are 28% less costly
than Medstat-produced acute episodes and are slightly shorter on average.
Table 1: Summary Statistics for Claims, Episodes, and Costs All 2002-2004 claims for 20% sample of Colorado beneficiaries
Statistic Symmetry Medstat
Total # Claims 5,049,696
% Ungrouped 15% 23%
Total # Episodes 672,600 661,053 % Chronic Episodes 50% 40% % Acute Episodes 50% 60% Average # per beneficiary 6 6
Total Cost of Claims $585,447,839
% Cost of Chronic Episodes 65% 43% % Cost of Acute Episodes 30% 48% % Cost of Ungrouped Claims 5% 8%
Chronic Episodes Average Cost per Episode $1,071 $871 Average Length of Episode (days) 113 123
Acute Episodes Average Cost per Episode $498 $690
Average Length of Episode (days) 22 24
As briefly noted in the above discussion of specific application issues of the groupers,
whereas Medstat’s algorithm always assigns each individual Medicare claim to only one episode,
4As noted previously, we measure an episode’s length as the time between the earliest and latest dates of the claims grouped into the episode, and the averages in Table 1 merely compute the means of these lengths Both groupers can interpret episodes length differently. For example, chronic episodes are often reported as lasting for a fixed 12-month interval.
Executive Summary viii
Functionality of the Symmetry ETG and Medstat MEG Software | August 2008 ix
Symmetry’s algorithm often links the services from a single parent claim to different episodes.
In the Table 0.1 sample, the ETG grouper splits 52% of SNF claims across episodes, 23% of IP
claims, 40% of HH claims, 13% of OP claims, and 15% of HS claims; each non-institutional PB
and DME claim is allocated to at most one episode. In instances where services from a parent
claim are grouped to multiple episodes, we allocated the cost of the claim to the episode that was
assigned the plurality of the claim’s service-level input records.
Illustration of Difficulties in Comparing Grouping Results for an Individual Beneficiary
Each grouper has its own system for classifying episodes into categories of medical care,
but these designations are typically not comparable. Symmetry classifies each episode to a base
ETG combined with a severity level, with there being essentially 679 such classifications
ignoring the residual ungrouped categories. Medstat’s grouper assigns each episode to a MEG
(disease classifications) along with main and detailed disease stages. There are a total of 560
MEG main classifications, and 2 or more disease stages per MEG.5 Often an ETG cannot be
matched to a MEG designation, and attempting to compare groups of ETGs to groups of MEG
typically yields dissimilar classifications as well.
To highlight the challenge of directly comparing outcomes from the two groupers, Tables
2 and 3 present grouping results for an individual beneficiary selected for illustrative purposes.
According to Table 2, this selected beneficiary filed 133 claims accounting for $31,705 in costs
during the period 2002-2004. Further, we see that Symmetry assigned the patient’s claims into
24 episodes, and Medstat allocated them into 21 episodes. Symmetry grouped 98% of this
individual’s claim costs, and Medstat grouped 96% of these costs.
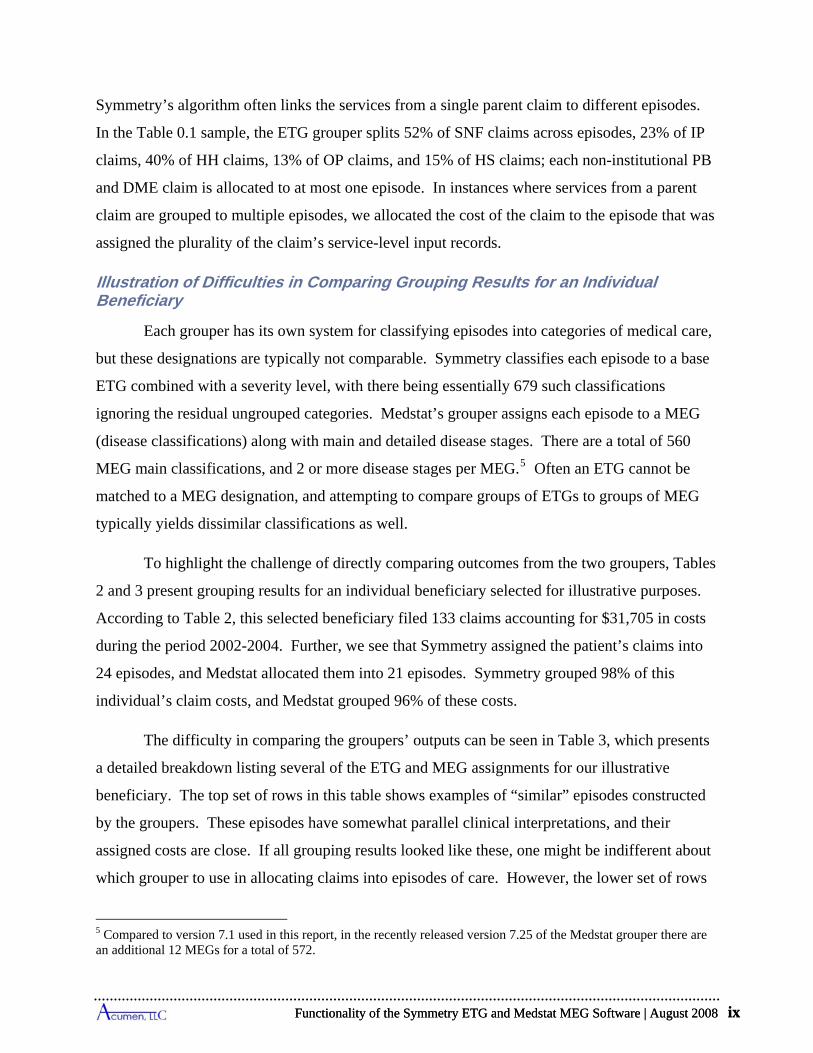
The difficulty in comparing the groupers’ outputs can be seen in Table 3, which presents
a detailed breakdown listing several of the ETG and MEG assignments for our illustrative
beneficiary. The top set of rows in this table shows examples of “similar” episodes constructed
by the groupers. These episodes have somewhat parallel clinical interpretations, and their
assigned costs are close. If all grouping results looked like these, one might be indifferent about
which grouper to use in allocating claims into episodes of care. However, the lower set of rows
5 Compared to version 7.1 used in this report, in the recently released version 7.25 of the Medstat grouper there are an additional 12 MEGs for a total of 572.
Functionality of the Symmetry ETG and Medstat MEG Software | August 2008 ix

Executive Summary x
Table 2: Summary Statistics for Claims, Episodes, and Costs All 2002-2004 claims for an Example Beneficiary
Statistic All Claims 2002-2004
Symmetry Medstat
Total # Claims 133 Total # Episodes 24 21
% Chronic Episodes 46% 29%
% Acute Episodes 54% 71%
Total Cost of Claims $31,705
% Cost of Ungrouped Claims 2% 4%
in Table 3 shows the examples of “dissimilar” episodes produced by the two groupers for this
beneficiary. In the first of these rows, the occurrence of a bacterial lung infection ETG and a
bacterial pneumonia MEG suggests an overlap in the beneficiary’s assessed clinical
circumstances, but Symmetry assigned a cost of $203 to this episode and Medstat allotted a cost
of $14,626 which is hardly comparable. Moving to the final rows, both groupers have an
episode classification for a chronic neurological condition, but only Symmetry identified this
beneficiary as having Alzheimer’s with a cost totaling $14,897. The only neurological condition
assessed by Medstat was an acute psychosis episode, with costs totaling $266. The findings for
this illustrative patient indicates that the Symmetry and Medstat software can present different
pictures of the health status and medical treatment circumstances of the same person. The
differences become more pronounced the greater the complications of a beneficiary’s medical
circumstances and the higher the costs.
Functionality of the S
ymm
etry ET
G and M
edstat ME
G S
oftware | A
ugust 2008 xi
Table 3: Comparison of Symmetry and Medstat Grouping Results for an Individual Beneficiary
2003 Episodes Selected to Illustrate Comparability Issues
Symmetry Medstat
ETG
# of Assigned Claims
# of Episodes
Total Cost MEG
# of Assigned Claims
# of Episodes
Total Cost
Similar Episodes
Closed fracture or dislocation - thigh, hip & pelvis, SL2 (ETG 713103L2 - Acute)
13 1 $9,554 Fracture: Femur, Head or Neck (MEG 348 - Acute)
8 1 $9,288
Hypo-functioning thyroid gland, SL1 (ETG 162200L1 - Chronic)
7 1 $138 Hypothyroidism (MEG 55 - Chronic) 9 1 $176
Other skin disorders, SL1 (ETG 669100L1 - Acute)
1 1 $41 Other Inflammations and Infections of Skin and Subcutaneous Tissue (MEG 545 - Acute)
1 1 $41
Dissimilar Episodes
Bacterial lung infections, SL4 (ETG 437400L4 - Acute)
8 1 $203 Pneumonia: Bacterial (MEG 510 - Acute) 11 1 $14,626
Alzheimer’s disease, SL1 (ETG 316400L1 - Chronic)
10 2 $14,897 -- -- -- --
-- -- -- -- Other Psychoses (MEG 494 - Acute) 4 1 $266
Executive Summary xii
Episodes Exhibit Large Variation in Costs (Adjusted Medicare Payments)
The evidence in this report documents considerable variation in costs across episodes
within episode types, regardless of whether one considers within individual ETG or MEG
classifications. For any of the top five highest-cost acute and chronic ETGs or MEGs, the level
of cost (Medicare payments, exclusive of co-pays and deductibles) demarking the most
expensive 10% of episodes always exceeds the level demarking the cheapest 10% by almost 5
times, and in many instances it is more than 100 times larger. For the top-five acute ETGs, the
top 5% of episodes alone account for 15% to 42% of total annual cost for the ETG, and for the
top five chronic ETGs this range is 26% to 50%. For the top five acute MEGs, the top 5% of
episodes alone account for 25% to 48% of total annual cost for the MEG, and for chronic MEGs
this range is 35% to 64%. This level of variation in raw episode costs suggests the need to
develop models of risk or severity adjustment applicable for Medicare populations prior to being
able to use the episodes produced by the ETG or MEG software for profiling Medicare
providers.
Effects of Altering Forms of Input Files and Software Configurations
Implementing the grouper packages requires decisions to be made in selecting the form
of the input file drawn from the Medicare claims and the settings of configuration options. Our
analysis compares a Baseline specification to a number of alternatives to evaluate the
appropriateness of using the Baseline:
Influence of alternative configuration settings for Symmetry: Varying the software and input settings for the ETG grouper produces modest differences in the share of ungrouped claims and in the number and distributional characteristics of episodes, but these settings can sometimes induce substantial shifts in the assignment of claims to particular episodes.6 For example, excluding all secondary diagnosis codes in all input records leads to nearly a 5% decrease in the number of episodes, an increase in the share of ungrouped claims from 14.6% to 16.4%, and only minor changes in the distributional properties of chronic and acute episodes. At the same time, this reliance on only primary diagnosis induces over a 20% reassignment of claims to different episodes, representing a shift of more than 34% of costs across episodes.
6 This generalization ignores several configuration choices that exert obvious effects on the number and distributional properties of episodes. For example, allowing episode lengths to be unlimited in the ETG software leads naturally to a 25% decrease in the number of episodes compared to the Baseline. It leaves the number of ungrouped claims essentially unchanged.
Executive Summary xii
e
Functionality of the Symmetry ETG and Medstat MEG Software | August 2008 xiii
Influence of alternative configuration settings for Medstat: Varying the software and input settings for the MEG grouper generally leads to modest differences in the fraction of claims grouped and in the number and distributional characteristics of episodes, but again changes in settings can cause notable shifts in the allocations of claims across episodes.7 For example, eliminating all secondary diagnosis codes in all input records leads to virtually no changes in the amount of grouped claims, in thnumber or compositional breakdown of episodes into acute and chronic classifications, or in the distributional properties of episodes. Using just the primary diagnosis reassigns 2.7% of claims and 8.7% of costs to different episodes, with just over a 1% of claims being shifted to episodes with different MEGs.
Medstat makes little use of procedure codes: Although Medstat allows for 15 procedure codes on an input record, these codes are, in fact, used only marginally in grouping. Unsurprisingly, altering the setting of the x-ray/lab flag (which prevents a record from starting an episode) sharply influences the number of episodes and ungrouped claims.
Extending the time horizon for claims coverage beyond the evaluation period can affect grouping outcomes: We explored the impact on 2003 episodes of dropping claims from the last six months of 2004. More specifically, instead of including claims from 1/1/02-12/31/04, the horizon selected to compute Baseline results, we input claims falling in the horizon 1/1/02-6/30/04. This shortening of the period for including claims causes the Symmetry grouper to reassign 2.5% of claims and 3.5% of costs in constructing its 2003 Complete Episodes. Although this difference is small, the fact that any complete episodes are altered by adding data beyond a six month period means that the use of episodes to assess resource utilization can produce different pictures depending on how long after the fact one delays evaluating past performance. In the same test, the MEG grouper reassigns only 0.09% of claims and 0.23% of costs in its construction of 2003 Complete Episodes.
Altering the sort order of input records can affect constructed episodes: Finally, while satisfying the specified sort order rules required by each grouper, we randomly reordered input records within cells and discovered that the Symmetry grouper reassigned 0.9% of claims and 1.1% of costs to different episodes, whereas the Medstat grouper reallocated 0.4% of claims and 0.6% of costs. This reassignment of costs to different episodes (and potentially to different providers) arises solely due to a user’s arrangement of input records, an arrangement that is likely to differ across users.
7 Similar to the previous footnote for Symmetry, several configuration choices for Medstat have non-surprising impacts on the number and distributional properties of episodes. For instance, increasing episode length limit to longer values considerably reduces the total number of episodes. Less obvious, the share of ungrouped claims and their associated costs also declines.
Functionality of the Symmetry ETG and Medstat MEG Software | August 2008 xiii
Executive Summary xiv
Grouping Algorithms Do Not Emulate Practice Patterns Common in the Medicare System
A challenge concerns the capability of the grouping algorithms to duplicate familiar
practice patterns observed in the Medicare system. For a grouper to work well within a
Medicare setting, it would be advantageous for its constructed episodes to capture existing
practice protocols and payment regimens. In this way, practitioners whose cost may be profiled
by a grouper would have a logical framework for interpreting results.
Medicare guides the flows of services and treatment norms through its benefit structure,
which in turn directly influences patterns of care across the different claim types. In essence,
Medicare already has some of its own concepts of episodes of care, with the most prominent
relating IP stays to post-acute care and physician services. In the case of post-acute care, this
episode concept is formally embedded in Medicare’s benefit rules. Post-acute care in the form of
SNF claims must follow a clinically-related IP claim with a minimum 3-day stay and must occur
within 30 days of the discharge date from the hospital. Medicare always considers SNF services
to be a continuation of an IP stay.
The grouper algorithms are not designed to follow all the service flows expected under
Medicare's program rules, and the findings in this study reveal that episodes constructed by the
groupers do not fully mirror some of the practice patterns seen in Medicare data. Under their
Baseline runs, both groupers link SNF claims to the same episodes as IP stays only about half the
time.
Inpatient Physician Services Often Do Not Group with Associated Hospital Stays
Moreover, neither grouper closely replicates the pattern of inpatient physician services
linked to hospital stays in Medicare. Medicare pays for daily Evaluation & Management (E&M)
services by a physician during a hospital admission, and the evidence strongly supports the
occurrence of daily (or near-daily) PB claims in the form of E&M visits for IP stays paid for by
medical DRGs. More specifically, in the Medicare data, 69% of IP stays show concurrent daily
E&M hospital visits considering stays of all lengths. Under the Baseline run of the ETG
Executive Summary xiv

Functionality of the Symmetry ETG and Medstat MEG Software | August 2008 xv
grouper, only 42% of IP stays have daily E&M visits grouped to the same episode as the IP
admission, and this figure reaches only 32% for the Medstat Baseline run.8
This report explores several options for re-configuring the groupers to build episodes in a
way that more closely mirrors Medicare treatment profiles. We consulted with both vendors in
exploring such options. In the case of the ETG grouper, we revised input records for PB claims
to include additional diagnoses from the header that accompanies Part B line items. This
expands the clinical information beyond the single line-item diagnosis with the idea that this
augmented information might enhance opportunities for matching PB diagnosis to IP diagnosis
inducing a linkage of these claims to the same episodes. While this modification changes the
number and composition of episode types, it does not regroup physician claims in a manner more
consistent with Medicare’s practice patterns.
In the case of the MEG grouper, we adapted the attributes of input records to invoke an
“All Services Admissions Build” feature. This feature is effective in linking IP claims to other
claims concurrent with the IP stay because it does so purely based on the timing of service dates.
Although the All Services Admissions Build offers a remedy for ensuring the bundling of
relevant Part B physician claims into the same episode as the hospital inpatient claims, this
option represents a philosophical shift in the meaning of an episode in the sense that claims
issued during an IP stay are no longer grouped according to diagnosis but are instead grouped
merely on the basis of whether their dates fall within the IP admission. For this reason, while
this reports summarizes the findings obtained using the All Services Admissions Build, this
specification does not serve as our Baseline setting for analyzing Medstat results due to its
significant impact on episode construction and, more importantly, its incomparability with
Symmetry's creation of episodes.
Concluding Remarks
This report identifies challenges in applying the ETG and MEG frameworks to Medicare
data. Questions arise as to how successfully the grouping algorithms capture common practice
patterns used by the Medicare payment system, and the problem of assigning costs from
8 Considering all PB claims concurrent with an IP stay, Symmetry links about 56% of these claims to the same episode as the IP claim, and Medstat associates 40% of these PB claims with the episode of the corresponding IP stay.
Functionality of the Symmetry ETG and Medstat MEG Software | August 2008 xv
Executive Summary xvi
aggregate payments for institutional claims remains a fundamental issue in using either software
package. For episode grouping of Medicare claims, the payment mechanism is a crucial
distinction between institutional and non-institutional claims. The integration of combined costs
in prospective payment systems – such as IP payments based on DRGs – is a central element of
Medicare reimbursement policy for institutional claims. By design, these claims do not offer a
clear strategy to disaggregate payments. Yet cost allocation is a vital issue for episode groupers.
Because institutional claims typically have multiple diagnoses, procedures, and/or revenue center
codes, it is plausible that the packages of services reflected in these codes can sometimes be
assignable to more than one episode type for the patient.
This dilemma – between the Medicare prospective payment approach to aggregate costs
and the need to divide payments for episode costs – is an unanswered challenge in using the
episode grouper software in the Medicare setting. Medstat offers no mechanism either for
carrying out such assignments or for dividing costs across services. Symmetry’s routines can
link a parent claim to different episodes, but the breakdown in services is entirely determined by
the institutional structure of Medicare claims, and the recorded service categories by construction
are not separately priced in claims. To divide aggregate prospective payments across services,
CMS would need to develop an allocation mechanism that splits costs using revenue center
codes, even supposing that each service signaled by a revenue center code is assignable to
treatment for only one health condition.
This review of the functionality of the Symmetry and Medstat grouping algorithms leaves
many important features of the ETG and MEG software packages as topics for future study.
Most notably, future topics include: (1) evaluating whether the clinical logic incorporated in the
grouper algorithms satisfies face validity as judged by medical practitioners; (2) appraising
whether the software adequately adjusts episode costs to account for patient composition and
case mix; and (3) assessing whether routines can be developed to attribute episode costs to
individual providers in a way that appropriately reflects their rank in resource utilization among
peers. This review does not address these topics and, therefore, reveals only part of the picture
needed to understand the capabilities of the ETG and MEG systems in achieving their ultimate
goal of producing reliable profiles of health-care providers and assignments of efficiency scores
in a Medicare setting.
Executive Summary xvi
Functionality of the Symmetry ETG and Medstat MEG Software | August 2008 xvii
As far as informing the next steps in developing measures of resource utilization of
Medicare providers, beyond the challenges noted above, the findings of this study suggest that
devising a reliable method of risk or severity adjustment for episodes and beneficiary costs in
Medicare settings will be required. This may require innovative approaches that are not yet
available in the existing literature or software packages. With the multiple co-morbidities and
the complexity of the patients, the risk and severity models developed for commercial
populations are unlikely to work as effectively in the Medicare population.
xviii
Table of Contents
Executive Summary......................................................................................................................................................i 1 Introduction.............................................................................................................................................................1 2 Application of Medicare Claims Data for Episodic Groupers ............................................................................3
2.1 Diagnosis Codes ................................................................................................................................................4 2.2 Procedure Codes and Revenue Center Codes ....................................................................................................6 2.3 Start and End Dates ...........................................................................................................................................8 2.4 Cost of Claims ...................................................................................................................................................8 2.5 Final Action Claims.........................................................................................................................................11 2.6 Expected Patterns of Care in Medicare............................................................................................................11
3 Framework for Understanding and Comparing Grouper Results...................................................................15 3.1 Characteristics of Episodes..............................................................................................................................15 3.2 Approach for Determining Episode Length and Cost......................................................................................16
3.2.1 Categories of Episodes for Analysis.........................................................................................................17 3.3 Tables Summarizing Characteristics of Episodes for Baseline Runs ..............................................................20
4 Specification of Baseline Application of Symmetry Grouper to Medicare Data.............................................27 4.1 Structure of Symmetry Input File for “Baseline” Run.....................................................................................27 4.2 Structure of Symmetry Configuration File for "Baseline" Run .......................................................................29 4.3 Structure of Symmetry Output Files ................................................................................................................30
5 Assessment of Results for Symmetry Grouper Using Medicare Data..............................................................37 5.1 Reference Results from Symmetry Baseline Run............................................................................................37 5.2 Specification of Complete Episodes ................................................................................................................46 5.3 Sensitivity of Findings to Changes in Symmetry Input and Configuration Files ............................................54
5.3.1 Varying Diagnosis Codes (Runs 2 through 4) ..........................................................................................56 5.3.2 Varying Procedure Codes (Run 5)............................................................................................................67 5.3.3 Reordering Input Records (Run 6) ...........................................................................................................68 5.3.4 Varying Symmetry Configuration File (Runs 7 through 12)....................................................................69 5.3.5 Overview of Sensitivities to Changes in Symmetry Input and Configuration Files .................................70
5.4 Practical Considerations in Applying Symmetry Grouper to Medicare Data ..................................................71 5.4.1 Patterns of Physician Services During IP Stays........................................................................................71 5.4.2 Linking SNF Care to IP Stays ..................................................................................................................77 5.4.3 Effect of Altering Time Horizon for Including Claims ............................................................................78
5.5 Overview of Applying Symmetry Grouper to Medicare Data.........................................................................80 6 Specification of Baseline Application of Medstat Grouper to Medicare Data.................................................85
6.1 Structure of Medstat Input File for Baseline Run ............................................................................................85 6.2 Structure of Medstat Configuration File for "Baseline" Run...........................................................................89 6.3 Structure of Medstat Output Files....................................................................................................................91
7 Assessment of Results for Medstat Grouper Using Medicare Data..................................................................94 7.1 Reference Results from Medstat Baseline Run................................................................................................94 7.2 Specification of Complete Episodes ..............................................................................................................101 7.3 Sensitivity of Findings to Changes in Medstat Input and Configuration Files ..............................................109
7.3.1 Varying Diagnosis Codes (Runs 2 through 4) ........................................................................................110 7.3.2 Varying Procedure Codes and X-ray/Lab Flags (Runs 5 through 7) ......................................................122 7.3.3 Reordering Input Records (Run 8) .........................................................................................................125 7.3.4 Varying Medstat Configuration File (Runs 9-15)...................................................................................126 7.3.5 Overview of Sensitivities to Changes in Medstat Options .....................................................................134
7.4 Practical Considerations in Applying Medstat Grouper to Medicare Data....................................................135 7.4.1 Patterns of Physician Services During IP Stays......................................................................................136 7.4.2 Linking Post-Acute Care to IP Claims ...................................................................................................140 7.4.3 Effect of Altering Time Horizon for Including Claims ..........................................................................142
7.5 Overview of Findings for Medstat Grouper...................................................................................................144 8 Conclusion and Next Steps.................................................................................................................................148
8.1 A Framework for Comparing the Episodes Created by Symmetry and Medstat Groupers ...........................149 8.1.1 Comparisons of Grouping Results for a Medicare Population ...............................................................150
xviii
Functionality of the Symmetry ETG and Medstat MEG Software | August 2008 xix
8.1.2 Comparisons of Grouping Results for an Illustrative Individual Beneficiary ........................................151 8.2 Applying the Symmetry and Medstat Groupers to Medicare Data................................................................152
8.2.1 Key Findings for Symmetry’s ETG Grouper .........................................................................................154 8.2.2 Key Findings for the Medstat MEG Grouper .........................................................................................158 8.2.3 Influence of Altering Software Configurations and Forms of Input Files ..............................................161
8.3 Discussion......................................................................................................................................................162 Bibliography.............................................................................................................................................................164 Appendix A: Symmetry Response..........................................................................................................................165 Appendix B: Medstat Response..............................................................................................................................168 List of Tables and Figures Figure 1: Stylized Procedure for Using Episode Groupers to Evaluate Provider Efficiency........................................ ii Table 1: Summary Statistics for Claims, Episodes, and Costs .................................................................................. viii Table 2: Summary Statistics for Claims, Episodes, and Costs ......................................................................................x Table 3: Comparison of Symmetry and Medstat Grouping Results for an Individual Beneficiary ..............................xi Table 2.1: Medicare Claims and Costs by Claim Type .................................................................................................3 Table 2.2: Information on Diagnosis Codes by Medicare Claim Type .........................................................................5 Table 2.3: Availability of Admitting and Line-Item Diagnosis Codes ..........................................................................5 Table 2.4: Distribution of Revenue Center and Procedure Codes by Medicare Claim Type .......................................7 Table 2.5: Start and End Date Used in Grouper Input ...................................................................................................8 Table 2.6: Medicare Payment Basis by Claim Type......................................................................................................9 Table 2.7: Distribution of Denied and Duplicate Line Items.......................................................................................11 Table 2.8: IP Claims with Concurrent “Daily” PB and E&M Claims .........................................................................14 Table Shell 3.1: Summary Statistics for Claims, Episodes and Costs .........................................................................20 Table Shell 3.2: Summary Statistics Episodes and Costs ............................................................................................21 Table Shell 3.3: Episode Cost and Length Percentiles ................................................................................................22 Table Shell 3.4: Episodes and Total Costs per Person.................................................................................................22 Table Shell 3.5: Major Practice Category Classifications ...........................................................................................23 Table Shell 3.6: Cost Statistics for Individual Focal Disease ETGs............................................................................25 Table Shell 3.7: Number, Length, and Timing of Episodes by Focal Disease MEG...................................................25 Table Shell 3.8: Ungrouped Claims by Claim Type....................................................................................................26 Table 4.1: Data Inputs Used in Baseline Symmetry Run ............................................................................................27 Table 4.2: Symmetry Configuration for Baseline Run ................................................................................................30 Figure 4.1: Role of Anchor Records in ETG Episode Dates ......................................................................................33 Table 4.3: Comparison Acute Episode of Start and End Dates ...................................................................................34 Table 4.4: Comparison of Chronic Episode Start and End Dates ................................................................................35 Table 5.1: Summary Statistics for Claims, Episodes and Costs ..................................................................................38 Table 5.2: Summary Statistics for Episodes and Costs................................................................................................38 Table 5.3: Episode Cost and Length Percentiles .........................................................................................................39 Table 5.4: Episodes and Total Costs per Person..........................................................................................................40 Table 5.5: Major Practice Category Classifications.....................................................................................................41 Table 5.6: Cost Statistics for Individual Focal Disease ETGs.....................................................................................42 Table 5.6: Cost Statistics for Individual Focal Disease ETGs (continued)..................................................................43 Table 5.7: Number, Length, and Timing of Episodes by Focal Disease ETG.............................................................44 Table 5.7: Number, Length, and Timing of Episodes by Focal Disease ETG (continued)..........................................45 Table 5.8: Ungrouped Claims by Claim Type .............................................................................................................46 Table 5.9: Clean Period Statistics by ETG ..................................................................................................................48 Table 5.10: Comparison of 2003 Touching and 2003 Complete Samples for Chronic ETGs.....................................51 Table 5.11: Comparison of 2003 Touching and 2003 Complete Samples for Acute ETGs ........................................52 Table 5.12: Cost Distributions of Top 5 Acute and Chronic ETGs by Total Cost ......................................................53 Table 5.13: Symmetry Input File and Configuration File Runs...................................................................................54 Table 5.14: Summary Statistics for Variations of Input and Configuration Files........................................................57 Table 5.15: Summary Statistics for Variations of Input and Configuration Files........................................................58
Functionality of the Symmetry ETG and Medstat MEG Software | August 2008 xix
xx
Table 5.16: Claims Grouped to Different Episodes by Variations on Input and Configuration Files .........................59 Table 5.17: Episode Cost and Length Percentiles for Variations on Input and Configuration Files ...........................60 Table 5.17: Episode Cost and Length Percentiles for Variations on Input and Configuration Files (Continued) .......61 Table 5.17: Episode Cost and Length Percentiles for Variations on Input and Configuration Files (Continued) .......62 Table 5.18: Episodes and Total Costs per Person for Variations on Input and Configuration Files............................63 Table 5.18: Episodes and Total Costs per Person for Variations on Input and Configuration Files (Continued) .......64 Table 5.18: Episodes and Total Costs per Person for Variations on Input and Configuration Files (Continued) .......65 Table 5.19: Ungrouped Claims by Claim Type for Variations on Input and Configuration Files...............................66 Table 5.20: Match Rate of Concurrent “Daily” PB and E&M Claims to Same Episode as IP Admission .................74 Table 5.21: Summary Statistics for Including PB Header Diagnoses Compared to Baseline .....................................75 Table 5.22: Impact of Including PB Header Diagnoses on IP-PB Linking Issue ........................................................75 Table 5.23: Match Rate of Concurrent “Daily” PB and E&M Claims to Same Episode as IP Claim.........................76 Table 5.24: Impact of Including PB Header Diagnoses on IP-SNF Linking Issue......................................................78 Table 5.25: Summary Statistics for Reduced Time Horizon Sample ..........................................................................79 Table 5.26: Changes in Grouping of Claims Due to Adding 6 Months of Medicare Data ..........................................80 Table 5.27: Claims with Pseudo-Claims Split Across Multiple Episodes by Claim Type ..........................................81 Table 6.1: Diagnosis and Procedure Data Used in Baseline Medstat Run ..................................................................86 Table 6.2: Distribution of X-ray/Lab Flags for Medstat Baseline Run........................................................................88 Table 6.3: Distribution of the Number of Procedure Codes for OP Claims ................................................................89 Table 6.4: Medstat Configuration for Baseline Run....................................................................................................90 Table 6.5: Comparison of Acute Episode Start and End Dates ...................................................................................92 Table 6.6: Comparison of Chronic Episode Start and End Dates ................................................................................93 Table 7.1: Summary Statistics for Claims, Episodes and Costs ..................................................................................94 Table 7.2: Episode Cost and Length Percentiles .........................................................................................................95 Table 7.3: Episode Cost and Length Percentiles .........................................................................................................96 Table 7.4: Episodes and Total Costs per Person..........................................................................................................97 Table 7.5: Major Diagnostic Category Classifications ................................................................................................98 Table 7.6: Cost Statistics for Individual Focal Disease MEGs....................................................................................99 Table 7.7: Number, Length, and Timing of Episodes by Focal Disease MEG..........................................................100 Table 7.8: Ungrouped Claims by Claim Type ...........................................................................................................101 Table 7.9: Clean Period Statistics by MEG ...............................................................................................................105 Table 7.10: Comparison of 2003 Touching and 2003 Complete Samples for Acute MEGs .....................................106 Table 7.11: Comparison of 2003 Touching and 2003 Complete Samples for Chronic MEGs..................................107 Table 7.12: Cost Distributions of Top 5 Acute and Chronic MEGs by Total Cost ...................................................108 Table 7.13: Medstat Input File and Configuration File Runs ....................................................................................110 Table 7.14: Summary Statistics for Variations on Input and Configuration Files .....................................................111 Table 7.15: Summary Statistics for Variations on Input and Configuration Files .....................................................112 Table 7.16: Claims Grouped to Different Episodes by Variations on Input and Configuration Files .......................113 Table 7.17: Episode Cost and Length Percentiles for Variations on Input and Configuration Files .........................114 Table 7.17: Episode Cost and Length Percentiles for Variations on Input and Configuration Files (Continued) .....115 Table 7.17: Episode Cost and Length Percentiles for Variations on Input and Configuration Files (Continued) .....116 Table 7.18: Episodes and Total Costs per Person for Variations on Input and Configuration Files..........................117 Table 7.18: Episodes and Total Costs per Person for Variations on Input and Configuration Files (Continued) .....118 Table 7.18: Episodes and Total Costs per Person for Variations on Input and Configuration Files (Continued) .....119 Table 7.19: Ungrouped Claims by Claim Type for Variations on Input and Configuration Files.............................120 Table 7.20: Change in Number of Ungrouped Claims when Varying Diagnosis Codes ...........................................121 Table 7.21: Comparison Statistics for Variations on Facility Admissions Build Feature, Medstat...........................129 Table 7.22: Comparison Statistics for Variations on Facility Admissions Build Feature, Medstat...........................129 Table 7.23: Cost and Length Percentiles for Variations on Facility Admissions Build Feature................................130 Table 7.24: Episodes and Costs per Person for Variations on Facility Admissions Build Feature............................131 Table 7.25: Medstat Created Admissions with One or More IP Claims....................................................................132 Table 7.26: Statistics for Variations on Medstat's Episode Limit Feature.................................................................133 Table 7.27: Match Rate of Concurrent “Daily” PB and E&M Claims to Same Episode as IP Claim.......................138 Table 7.28: Overview of All Services Admissions Build..........................................................................................139 Table 7.29: Summary Statistics for All Services Admissions Build Compared to Baseline .....................................139 Table 7.30: Impact of All Services Admissions Build on IP-PB Linking Issue ........................................................140
xx

Functionality of the Symmetry ETG and Medstat MEG Software | August 2008 xxi
Table 7.31: Impact of All Services Admissions Build on IP-SNF Linking Issue......................................................141 Table 7.32: Summary Statistics for Reduced Time Horizon Sample ........................................................................143 Table 7.33: Changes in Grouping of Claims Due to Adding 6 Months of Medicare Data ........................................144 Figure 8.1: Stylized Episode Grouping Procedure ....................................................................................................148 Table 8.1: Comparison of Symmetry and Medstat Results for a Sample Population ................................................150 Table 8.2: Summary Statistics for Claims, Episodes, and Costs ...............................................................................151 Table 8.3: Comparison of Symmetry and Medstat Grouping Results .......................................................................153

Functionality of the Symmetry ETG and Medstat MEG Software | August 2008 1
1 INTRODUCTION
This report describes the functionality of the Symmetry ETG and Medstat MEG software
packages for grouping Medicare claims data into distinct episodes of care. Episode grouping
creates a common measure of resource utilization and expenditures on the treatment of medical
conditions, allowing comparison across a community of health-care providers to rate individual
performance. In rating individual performance, any evaluation process must, of course, also
control for factors such as the quality of care, a patient’s illness, disease severity, and
demographic risk factors. Episode-based comparisons offer a possible framework for a payment
scheme that gives incentives for providers to make efficient use of resources.
The Symmetry ETG and Medstat MEG packages seek to group administrative medical
claims into episodes of medical treatment for various categories of health conditions or
diagnoses. This grouping creates measures of the intensity of medical treatment for each
episode, with intensity interpreted as the cost of the claims making up the episode and/or the
time taken to complete treatment, among other assessments of engagement by the health care
system. For a particular health condition, these constructed measures can then be compared
across different care settings to assess resource utilization in each setting. The grouper products
analyzed here assign claims into episodes of illness for a universe of over 500 categories of
health conditions.9
In this report, we focus only on the first stages of applying grouper software to construct
measures of resource utilization: the capacities of the Symmetry and Medstat groupers to form
episodes and associated measures of resource utilization relying on information available in
Medicare claims. The important questions about how to interpret episode measures as efficiency
indicators are left for a future report. The contribution of the discussion here is a careful
assessment of the options available for applying the Symmetry and Medstat groupers to
Medicare claims.10
9 Unfortunately, the disease classifications used by the two products are quite different, limiting the comparability of episodes for a disease across products. 10 As part of this study we exchanged Medicare claims data and grouping results with both Symmetry and Medstat to ensure that we ran the groupers according to the vendor’s specifications.
Functionality of the Symmetry ETG and Medstat MEG Software | August 2008 1

Introduction 2
The body of the report is divided into seven chapters. Chapter 2 reviews the elements of
claims used for episode grouping and the particular features of Medicare claims that are relevant
for understanding the challenges of episode grouping for Medicare. Because the output from the
two groupers is quite different in some respects, Chapter 3 develops a common empirical
framework to document and compare the findings produced by the two groupers. The remainder
of the report, Chapters 4 through 7, presents detailed findings and issues relevant in evaluating
the functionality and performance of the individual episode groupers. Chapters 4 and 5 review
the Symmetry grouper, and Chapters 6 and 7 review the Medstat grouper. Finally, Chapter 8
presents an overall summary of findings and concluding remarks.
2 APPLICATION OF MEDICARE CLAIMS DATA FOR EPISODIC GROUPERS
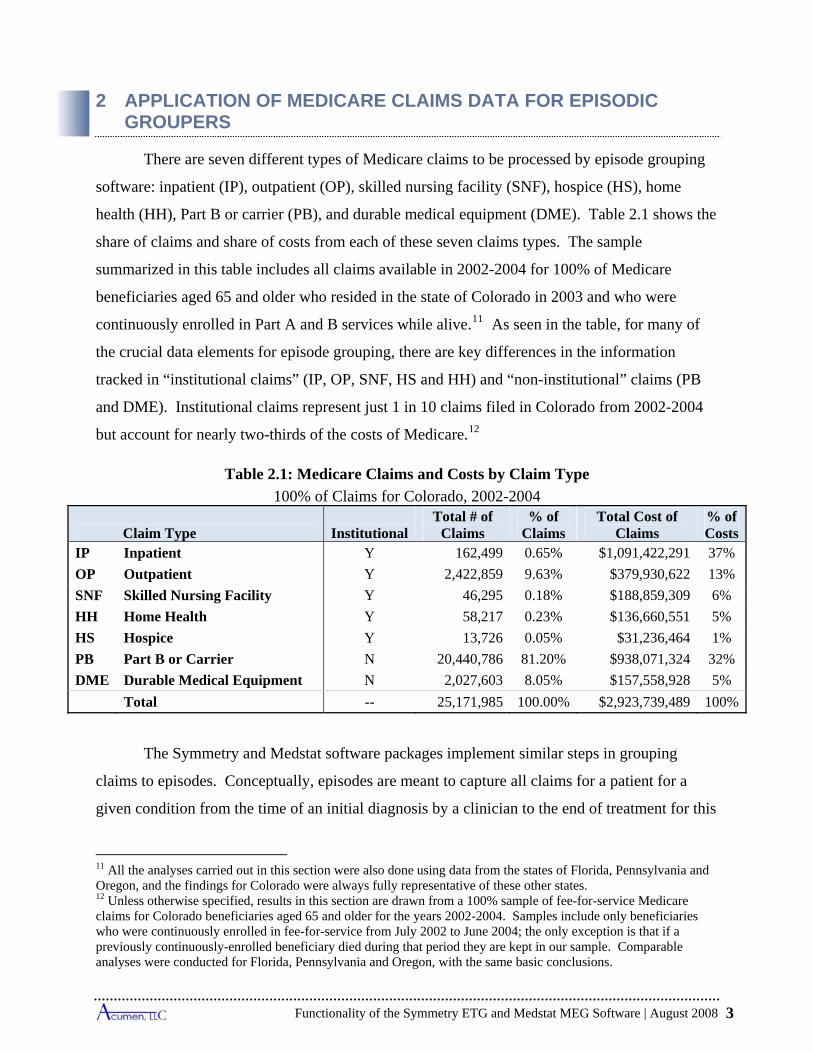
There are seven different types of Medicare claims to be processed by episode grouping
software: inpatient (IP), outpatient (OP), skilled nursing facility (SNF), hospice (HS), home
health (HH), Part B or carrier (PB), and durable medical equipment (DME). Table 2.1 shows the
share of claims and share of costs from each of these seven claims types. The sample
summarized in this table includes all claims available in 2002-2004 for 100% of Medicare
beneficiaries aged 65 and older who resided in the state of Colorado in 2003 and who were
continuously enrolled in Part A and B services while alive.11 As seen in the table, for many of
the crucial data elements for episode grouping, there are key differences in the information
tracked in “institutional claims” (IP, OP, SNF, HS and HH) and “non-institutional” claims (PB
and DME). Institutional claims represent just 1 in 10 claims filed in Colorado from 2002-2004
but account for nearly two-thirds of the costs of Medicare.12
Table 2.1: Medicare Claims and Costs by Claim Type
100% of Claims for Colorado, 2002-2004
Claim Type InstitutionalTotal # of
Claims % of
Claims Total Cost of
Claims % of Costs
IP Inpatient Y 162,499 0.65% $1,091,422,291 37%
OP Outpatient Y 2,422,859 9.63% $379,930,622 13%
SNF Skilled Nursing Facility Y 46,295 0.18% $188,859,309 6%
HH Home Health Y 58,217 0.23% $136,660,551 5%
HS Hospice Y 13,726 0.05% $31,236,464 1%
PB Part B or Carrier N 20,440,786 81.20% $938,071,324 32%
DME Durable Medical Equipment N 2,027,603 8.05% $157,558,928 5%
Total -- 25,171,985 100.00% $2,923,739,489 100%
The Symmetry and Medstat software packages implement similar steps in grouping
claims to episodes. Conceptually, episodes are meant to capture all claims for a patient for a
given condition from the time of an initial diagnosis by a clinician to the end of treatment for this
11 All the analyses carried out in this section were also done using data from the states of Florida, Pennsylvania and Oregon, and the findings for Colorado were always fully representative of these other states. 12 Unless otherwise specified, results in this section are drawn from a 100% sample of fee-for-service Medicare claims for Colorado beneficiaries aged 65 and older for the years 2002-2004. Samples include only beneficiaries who were continuously enrolled in fee-for-service from July 2002 to June 2004; the only exception is that if a previously continuously-enrolled beneficiary died during that period they are kept in our sample. Comparable analyses were conducted for Florida, Pennsylvania and Oregon, with the same basic conclusions.
Functionality of the Symmetry ETG and Medstat MEG Software | August 2008 3

Application of Medicare Claims Data for Episodic Groupers 4
diagnosis. Thus, episodes are groups of claims for the same diagnoses that occur together in
time, typically begun by a visit to a physician’s office or hospital. After the first claim, all
claims associated with the particular diagnosis are aggregated, until there are no additional
observed claims for the same disease for a given period of time (“a clean period”). The
aggregation of claims into an episode measures the time from diagnosis to last treatment, the
procedures provided, and the cost of care for the disease in that episode.
Given this basic approach, the episode grouping algorithms use specific data from the claims, including:
Diagnosis codes. Procedure and/or revenue center codes. Start and end dates. Costs. Patient characteristics.
To understand the use of the ETG and MEG packages in grouping Medicare claims, we begin
with a review of how these data elements are captured in different types of Medicare claims and
how this information is used by the two products. In doing so, we identify some of the
challenges faced in applying episode groupers to the Medicare claims. As we note in the last
part of this section, one of these challenges lies in which claims to include in the analysis. This
information provides a background for the later chapters of the report, which examine the impact
of the different strategies employed by the two software products, as well as the impact of
changing the input of these four data types.
2.1 Diagnosis Codes
The distinction between institutional and non-institutional claims matters first in the use
of diagnosis codes, which are used by the Symmetry and Medstat software packages to assign
claims to episode types. Institutional claims (IP, OP, SNF, HS, and HH) have up to ten diagnosis
codes (Table 2.2).
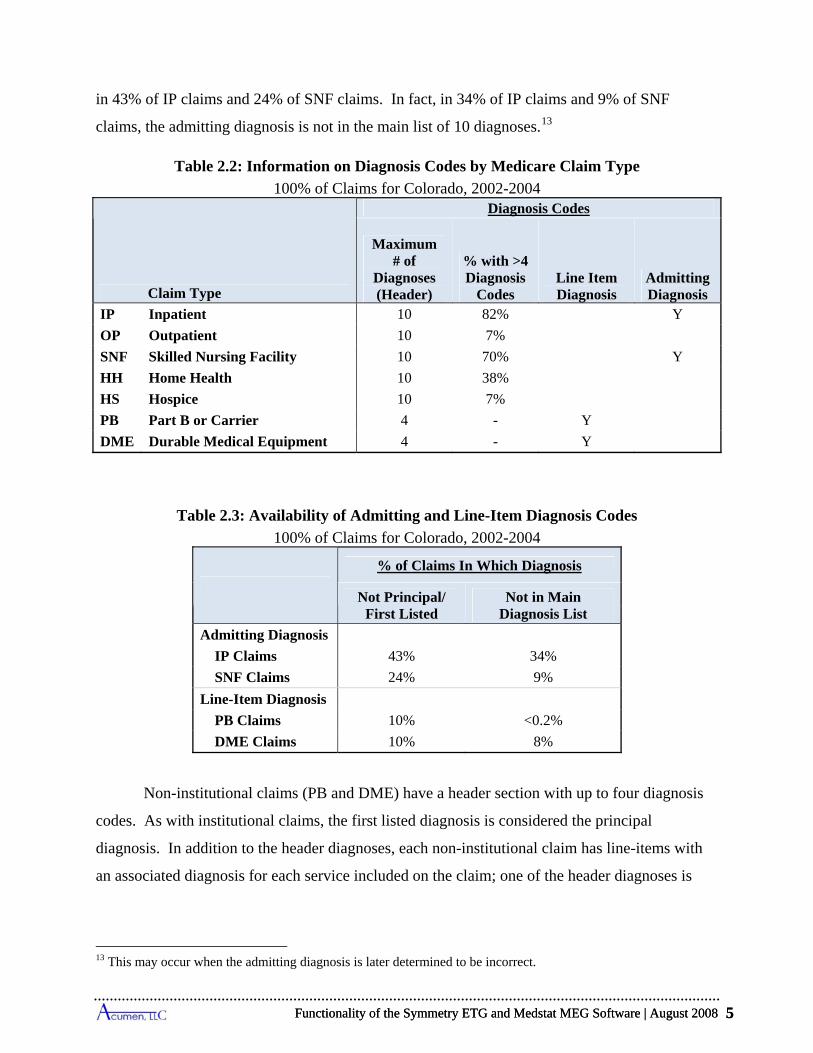
Among these diagnoses, the first diagnosis code always corresponds to the principal
diagnosis code for that claim. For IP and SNF claims, there is also a diagnosis code designated
as the admitting diagnosis. This code often (but not necessarily) corresponds with the first
(principal) diagnosis. As Table 2.3 shows, the admitting diagnosis is not the principal diagnosis
Application of Medicare Claims Data for Episodic Groupers 4
Functionality of the Symmetry ETG and Medstat MEG Software | August 2008 5
in 43% of IP claims and 24% of SNF claims. In fact, in 34% of IP claims and 9% of SNF
claims, the admitting diagnosis is not in the main list of 10 diagnoses.13
Table 2.2: Information on Diagnosis Codes by Medicare Claim Type
100% of Claims for Colorado, 2002-2004
Claim Type
Diagnosis Codes
Maximum # of
Diagnoses (Header)
% with >4 Diagnosis
Codes Line Item Diagnosis
Admitting Diagnosis
IP Inpatient 10 82% Y
OP Outpatient 10 7%
SNF Skilled Nursing Facility 10 70% Y
HH Home Health 10 38%
HS Hospice 10 7%
PB Part B or Carrier 4 - Y
DME Durable Medical Equipment 4 - Y
Table 2.3: Availability of Admitting and Line-Item Diagnosis Codes
100% of Claims for Colorado, 2002-2004
% of Claims In Which Diagnosis
Not Principal/ First Listed
Not in Main Diagnosis List
Admitting Diagnosis
IP Claims 43% 34%
SNF Claims 24% 9%
Line-Item Diagnosis
PB Claims 10% <0.2%
DME Claims 10% 8%
Non-institutional claims (PB and DME) have a header section with up to four diagnosis
codes. As with institutional claims, the first listed diagnosis is considered the principal
diagnosis. In addition to the header diagnoses, each non-institutional claim has line-items with
an associated diagnosis for each service included on the claim; one of the header diagnoses is
13 This may occur when the admitting diagnosis is later determined to be incorrect.
Functionality of the Symmetry ETG and Medstat MEG Software | August 2008 5
Application of Medicare Claims Data for Episodic Groupers 6
almost always associated with each line item. The vast majority of the time, the line-item
diagnosis corresponds to the first diagnosis listed on the header.
We review the number of diagnosis codes by claims type because the input for each
record in the Symmetry grouper accepts up to four diagnosis codes.14 Since the majority of IP
and SNF claims and a large share of HH claims have more than four diagnosis codes, and can
have up to ten codes, this four code limit may lead to the loss of diagnostic information that
would be relevant for grouping. We examine the effect of this limit later in the report. The
Medstat grouper does not limit the number of diagnosis codes as it accepts up to ten diagnosis
codes.
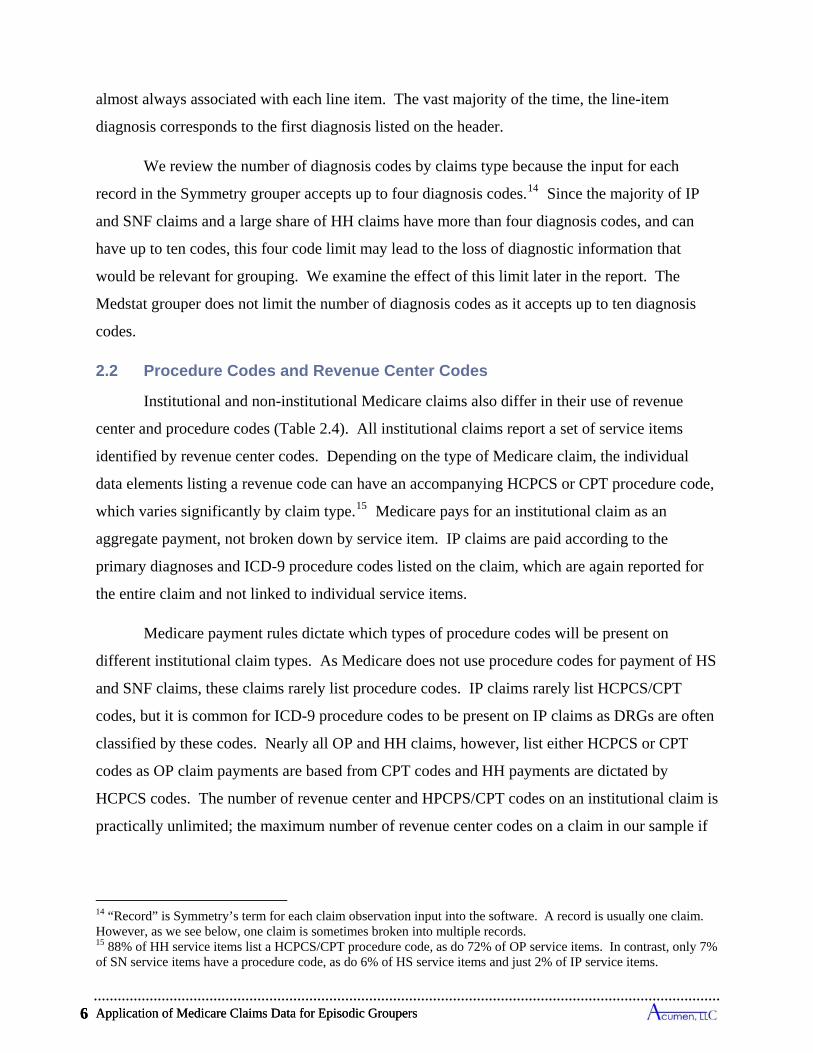
2.2 Procedure Codes and Revenue Center Codes
Institutional and non-institutional Medicare claims also differ in their use of revenue
center and procedure codes (Table 2.4). All institutional claims report a set of service items
identified by revenue center codes. Depending on the type of Medicare claim, the individual
data elements listing a revenue code can have an accompanying HCPCS or CPT procedure code,
which varies significantly by claim type.15 Medicare pays for an institutional claim as an
aggregate payment, not broken down by service item. IP claims are paid according to the
primary diagnoses and ICD-9 procedure codes listed on the claim, which are again reported for
the entire claim and not linked to individual service items.
Medicare payment rules dictate which types of procedure codes will be present on
different institutional claim types. As Medicare does not use procedure codes for payment of HS
and SNF claims, these claims rarely list procedure codes. IP claims rarely list HCPCS/CPT
codes, but it is common for ICD-9 procedure codes to be present on IP claims as DRGs are often
classified by these codes. Nearly all OP and HH claims, however, list either HCPCS or CPT
codes as OP claim payments are based from CPT codes and HH payments are dictated by
HCPCS codes. The number of revenue center and HPCPS/CPT codes on an institutional claim is
practically unlimited; the maximum number of revenue center codes on a claim in our sample if
14 “Record” is Symmetry’s term for each claim observation input into the software. A record is usually one claim. However, as we see below, one claim is sometimes broken into multiple records. 15 88% of HH service items list a HCPCS/CPT procedure code, as do 72% of OP service items. In contrast, only 7% of SN service items have a procedure code, as do 6% of HS service items and just 2% of IP service items.
Application of Medicare Claims Data for Episodic Groupers 6
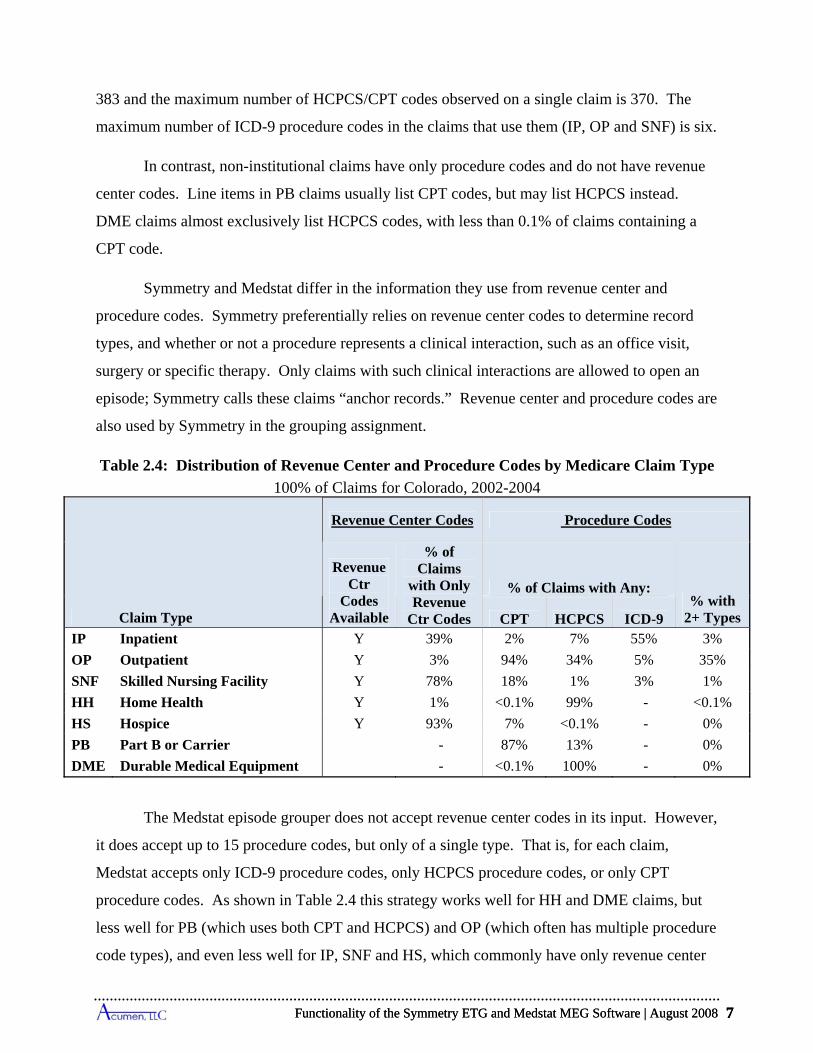
CPT
Functionality of the Symmetry ETG and Medstat MEG Software | August 2008 7
383 and the maximum number of HCPCS/CPT codes observed on a single claim is 370. The
maximum number of ICD-9 procedure codes in the claims that use them (IP, OP and SNF) is six.
In contrast, non-institutional claims have only procedure codes and do not have revenue
center codes. Line items in PB claims usually list CPT codes, but may list HCPCS instead.
DME claims almost exclusively list HCPCS codes, with less than 0.1% of claims containing a
CPT code.
Symmetry and Medstat differ in the information they use from revenue center and
procedure codes. Symmetry preferentially relies on revenue center codes to determine record
types, and whether or not a procedure represents a clinical interaction, such as an office visit,
surgery or specific therapy. Only claims with such clinical interactions are allowed to open an
episode; Symmetry calls these claims “anchor records.” Revenue center and procedure codes are
also used by Symmetry in the grouping assignment.
Table 2.4: Distribution of Revenue Center and Procedure Codes by Medicare Claim Type
100% of Claims for Colorado, 2002-2004
Claim Type
Revenue Center Codes Procedure Codes
Revenue Ctr
Codes Available
% of Claims
with Only Revenue
Ctr Codes
% of Claims with Any: % with
2+ Types HCPCS ICD-9 IP Inpatient Y 39% 2% 7% 55% 3%
OP Outpatient Y 3% 94% 34% 5% 35%
SNF Skilled Nursing Facility Y 78% 18% 1% 3% 1%
HH Home Health Y 1% <0.1% 99% - <0.1%
HS Hospice Y 93% 7% <0.1% - 0%
PB Part B or Carrier - 87% 13% - 0%
DME Durable Medical Equipment - <0.1% 100% - 0%
The Medstat episode grouper does not accept revenue center codes in its input. However,
it does accept up to 15 procedure codes, but only of a single type. That is, for each claim,
Medstat accepts only ICD-9 procedure codes, only HCPCS procedure codes, or only CPT
procedure codes. As shown in Table 2.4 this strategy works well for HH and DME claims, but
less well for PB (which uses both CPT and HCPCS) and OP (which often has multiple procedure
code types), and even less well for IP, SNF and HS, which commonly have only revenue center
Functionality of the Symmetry ETG and Medstat MEG Software | August 2008 7
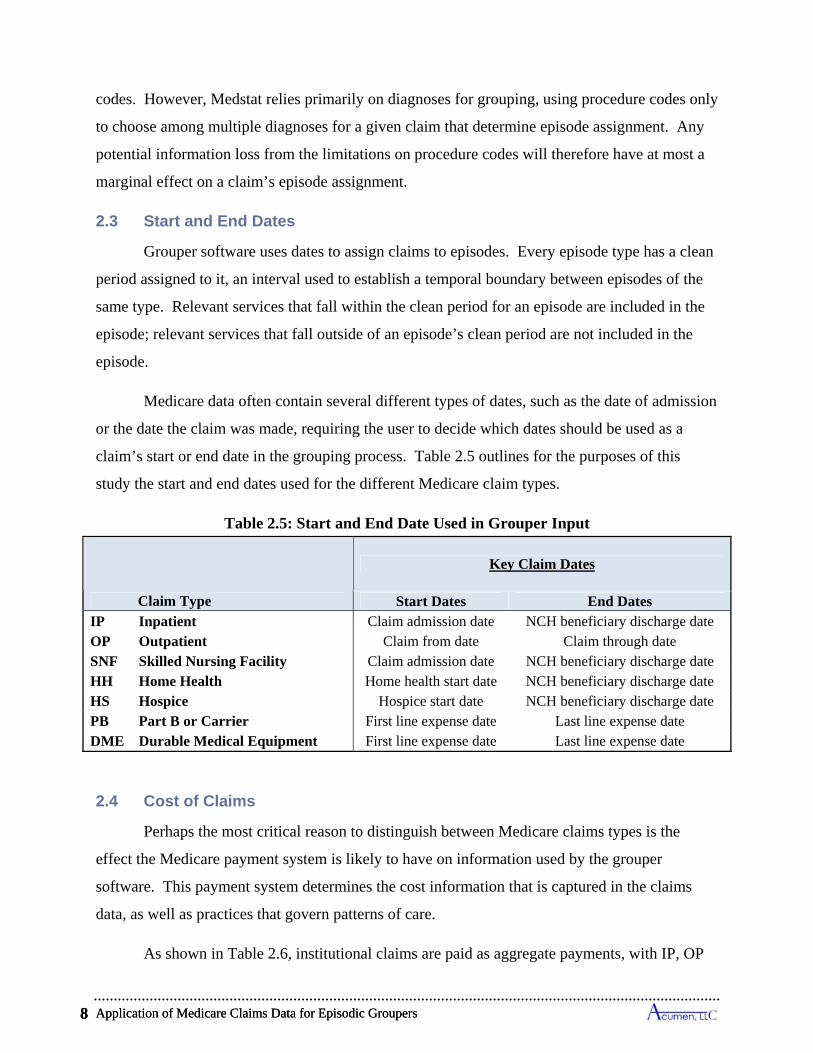
Application of Medicare Claims Data for Episodic Groupers 8
codes. However, Medstat relies primarily on diagnoses for grouping, using procedure codes only
to choose among multiple diagnoses for a given claim that determine episode assignment. Any
potential information loss from the limitations on procedure codes will therefore have at most a
marginal effect on a claim’s episode assignment.
2.3 Start and End Dates
Grouper software uses dates to assign claims to episodes. Every episode type has a clean
period assigned to it, an interval used to establish a temporal boundary between episodes of the
same type. Relevant services that fall within the clean period for an episode are included in the
episode; relevant services that fall outside of an episode’s clean period are not included in the
episode.
Medicare data often contain several different types of dates, such as the date of admission
or the date the claim was made, requiring the user to decide which dates should be used as a
claim’s start or end date in the grouping process. Table 2.5 outlines for the purposes of this
study the start and end dates used for the different Medicare claim types.
Table 2.5: Start and End Date Used in Grouper Input
Claim Type
Key Claim Dates
Start Dates End Dates IP Inpatient Claim admission date NCH beneficiary discharge date OP Outpatient Claim from date Claim through date SNF Skilled Nursing Facility Claim admission date NCH beneficiary discharge date HH Home Health Home health start date NCH beneficiary discharge date HS Hospice Hospice start date NCH beneficiary discharge date PB Part B or Carrier First line expense date Last line expense date DME Durable Medical Equipment First line expense date Last line expense date
2.4 Cost of Claims
Perhaps the most critical reason to distinguish between Medicare claims types is the
effect the Medicare payment system is likely to have on information used by the grouper
software. This payment system determines the cost information that is captured in the claims
data, as well as practices that govern patterns of care.
As shown in Table 2.6, institutional claims are paid as aggregate payments, with IP, OP
Application of Medicare Claims Data for Episodic Groupers 8
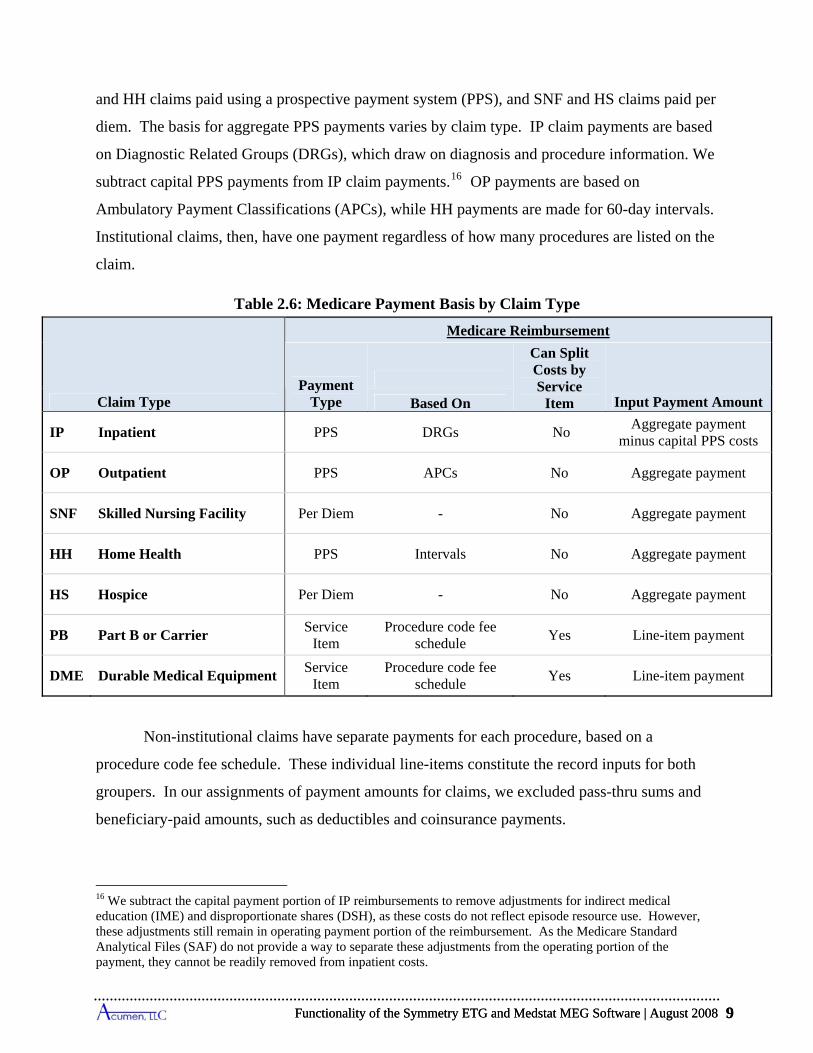
Functionality of the Symmetry ETG and Medstat MEG Software | August 2008 9
Based On
and HH claims paid using a prospective payment system (PPS), and SNF and HS claims paid per
diem. The basis for aggregate PPS payments varies by claim type. IP claim payments are based
on Diagnostic Related Groups (DRGs), which draw on diagnosis and procedure information. We
subtract capital PPS payments from IP claim payments.16 OP payments are based on
Ambulatory Payment Classifications (APCs), while HH payments are made for 60-day intervals.
Institutional claims, then, have one payment regardless of how many procedures are listed on the
claim.
Table 2.6: Medicare Payment Basis by Claim Type
Claim Type
Medicare Reimbursement
Payment Type
Can Split Costs by Service
Item Input Payment Amount
IP Inpatient PPS DRGs No Aggregate payment
minus capital PPS costs
OP Outpatient PPS APCs No Aggregate payment
SNF Skilled Nursing Facility Per Diem - No Aggregate payment
HH Home Health PPS Intervals No Aggregate payment
HS Hospice Per Diem - No Aggregate payment
PB Part B or Carrier Service
Item Procedure code fee
schedule Yes Line-item payment
DME Durable Medical Equipment Service
Item Procedure code fee
schedule Yes Line-item payment
Non-institutional claims have separate payments for each procedure, based on a
procedure code fee schedule. These individual line-items constitute the record inputs for both
groupers. In our assignments of payment amounts for claims, we excluded pass-thru sums and
beneficiary-paid amounts, such as deductibles and coinsurance payments.
16 We subtract the capital payment portion of IP reimbursements to remove adjustments for indirect medical education (IME) and disproportionate shares (DSH), as these costs do not reflect episode resource use. However, these adjustments still remain in operating payment portion of the reimbursement. As the Medicare Standard Analytical Files (SAF) do not provide a way to separate these adjustments from the operating portion of the payment, they cannot be readily removed from inpatient costs.
Functionality of the Symmetry ETG and Medstat MEG Software | August 2008 9

Application of Medicare Claims Data for Episodic Groupers 10
The use of aggregate payments, such as IP payments based on DRGs, is a central element
of Medicare reimbursement policy. By design, the claims data do not offer a clear strategy to
disaggregate these payments.17 Yet cost allocation is a fundamental issue for episode groupers
because episode groupers use cost as the measure of resource use associated with each episode.
If it were appropriate to allocate each procedure within an aggregated claim to the same episode,
the presence of aggregated payment amounts for institutional claims would not matter.
However, because institutional claims typically have multiple diagnoses and procedures, a user
can encounter situations whereby these services become assigned to multiple episodes, which
leads to the problem of how to divide a single parent claim’s cost across its linked episodes.
Symmetry requires that an input record represent a single medical service. The user must
decide, then, whether to treat an institutional claim as a single service by choosing just one
service from the claim, or instead to split the institutional claim into a set of service-level inputs.
We chose the latter option and create what we refer to as “pseudo-claims.” Each pseudo-claim
represents a single service on an institutional claim, identified by a revenue center code and
accompanying procedure code when available. This construction permits investigation of claims
going to multiple episode assignments. However, one also encounters the problem of how to
assign the aggregated payment for the parent claim across its pseudo-claims. We address this
question in more detail in Section 4.3 in our discussion of the implementation of the Symmetry
grouper.
Medstat uses claim-level inputs, and evaluates all services on a claim when assigning
claims to episodes. Whereas Symmetry requires the use of a single procedure code on an input,
Medstat accepts up to 15 procedure codes for a single input. Medstat uses procedure codes to
prioritize the secondary diagnoses code listed on the claim in its episode grouping, and assigns a
claim, regardless of the number of services associated listed on a claim, to a single episode. As a
17 Hospitals do provide revenue center level charge information for IP claims. The total charges created from the sum of revenue center charges have historically been used by CMS to weight DRGs. But whether revenue center charges should be used to allocate payments across episodes is questionable due to lack of specificity associated with these charges. Although charge data might provide the basis for identifying the relative share of resources allocable to revenue centers, the non-disease-specific nature of many revenue center codes seems to preclude straightforward algorithms that could sensibly allocate a revenue center’s share of resources to more than a single episode. For example there are 55 revenue center codes that refer to different types of room and board services (e.g. All inclusive rate-room and board plus ancillary (0100); All inclusive rate-room and board (0101); Private medical or general-general classification (0110); Private medical or general-medical/surgical/GYN (0111)), which are typically a large share of each IP claim.
Application of Medicare Claims Data for Episodic Groupers 10
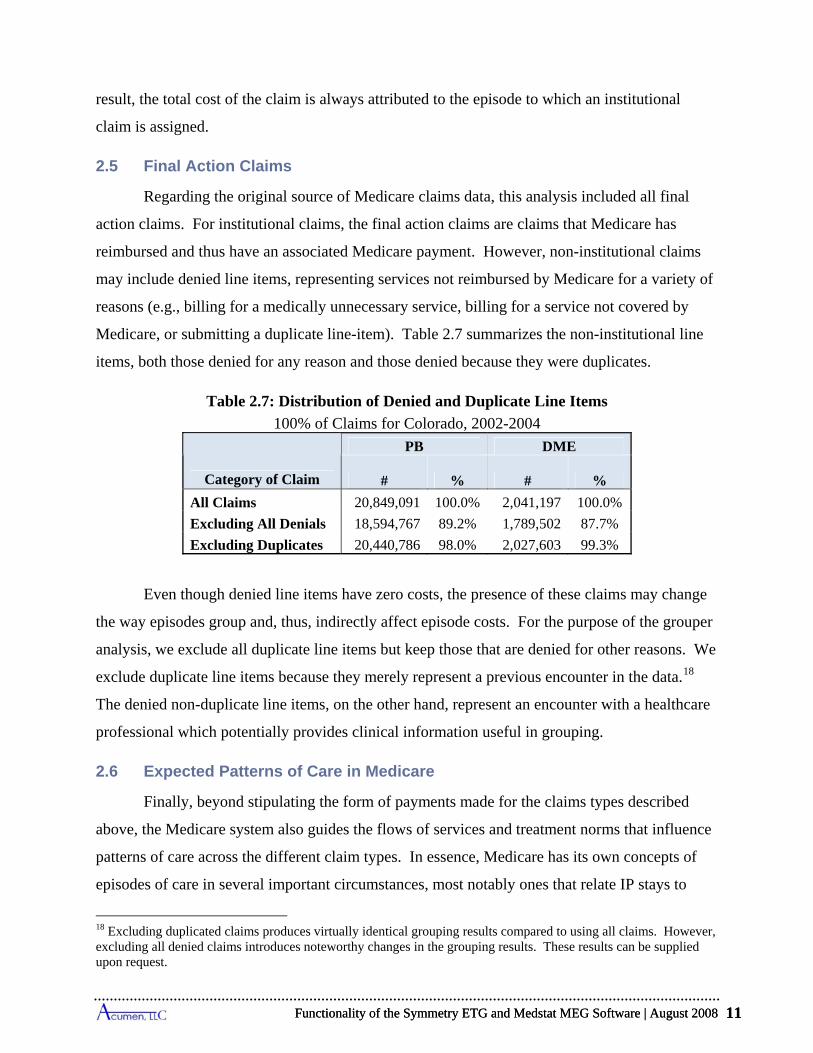
Functionality of the Symmetry ETG and Medstat MEG Software | August 2008 11
result, the total cost of the claim is always attributed to the episode to which an institutional
claim is assigned.
2.5 Final Action Claims
Regarding the original source of Medicare claims data, this analysis included all final
action claims. For institutional claims, the final action claims are claims that Medicare has
reimbursed and thus have an associated Medicare payment. However, non-institutional claims
may include denied line items, representing services not reimbursed by Medicare for a variety of
reasons (e.g., billing for a medically unnecessary service, billing for a service not covered by
Medicare, or submitting a duplicate line-item). Table 2.7 summarizes the non-institutional line
items, both those denied for any reason and those denied because they were duplicates.
Table 2.7: Distribution of Denied and Duplicate Line Items
100% of Claims for Colorado, 2002-2004
Category of Claim
PB DME
# % # %
All Claims 20,849,091 100.0% 2,041,197 100.0%
Excluding All Denials 18,594,767 89.2% 1,789,502 87.7%
Excluding Duplicates 20,440,786 98.0% 2,027,603 99.3%
Even though denied line items have zero costs, the presence of these claims may change
the way episodes group and, thus, indirectly affect episode costs. For the purpose of the grouper
analysis, we exclude all duplicate line items but keep those that are denied for other reasons. We
exclude duplicate line items because they merely represent a previous encounter in the data.18
The denied non-duplicate line items, on the other hand, represent an encounter with a healthcare
professional which potentially provides clinical information useful in grouping.
2.6 Expected Patterns of Care in Medicare
Finally, beyond stipulating the form of payments made for the claims types described
above, the Medicare system also guides the flows of services and treatment norms that influence
patterns of care across the different claim types. In essence, Medicare has its own concepts of
episodes of care in several important circumstances, most notably ones that relate IP stays to
18 Excluding duplicated claims produces virtually identical grouping results compared to using all claims. However, excluding all denied claims introduces noteworthy changes in the grouping results. These results can be supplied upon request.
Functionality of the Symmetry ETG and Medstat MEG Software | August 2008 11
Application of Medicare Claims Data for Episodic Groupers 12
post-acute care and physician services. For post-acute care, this concept is formally embedded in
Medicare payment rules. For physician services, the episode concept is supported by a common
but non-mandated payment practice. For any grouper to work well within a Medicare setting, it
would be advantageous for its constructed episodes to emulate expected practice patterns. In this
way, practitioners, whose costs may be profiled by a grouper, would have a logical framework
for interpreting results.
Within Medicare, SNF and HH services are provided as post-acute care. Care in a SNF is
considered a continuation of care from an IP stay. To be paid, each SNF claim must be clinically
related to an IP claim with a minimum 3-day stay and start within 30 days of the IP discharge
date. Similarly, HH services are intended to provide post-acute-care services in the home, rather
than in a SNF or hospital. Although HH services do not have to follow an IP claim, they are
intended as follow up treatment for a specific diagnosis, such as a joint replacement or
congestive heart disease. As such, the HH services would be expected to be linked to an earlier
claim. An HH claim covers services for a set period, typically 60 days. If a beneficiary is still
eligible for HH services at the end of a given period, another period can begin, and the care is
considered part of the same treatment plan.
In the case of physician services during hospital admissions, it is expected that doctors
will monitor beneficiaries during IP stays (e.g., daily visits). Given this expectation, Medicare
pays for evaluation and management (E&M) services by a physician during an IP admission for
a medical condition (i.e., an IP claim paid for by medical DRGs). These visits often show up as
PB claims representing E&M services provided in the hospital; and a common form of these
services list CPT codes denoting specific types of E&M visits, including hospital visits (99221-
99239), hospital consult codes (99251-99255), and critical care services (99291-99292). For
hospital admissions to perform surgery (i.e., IP claims paid for by surgical DRGs), Medicare
pays for PB services but not necessarily in the form of E&M claims, and some associated PB
claims may precede or follow the patient's time spent in the hospital. In any case, the flow of
services in Medicare invariably provides for treatment linkages between IP and PB claims.
Daily PB visits are, in fact, the norm for IP stays in Medicare, as shown in Table 2.8.
This table considers all IP claims paid for by medical DRGs. For these IP claims, we investigate
the pattern of PB claims that are concurrent with that claim, in order to identify daily or near
Application of Medicare Claims Data for Episodic Groupers 12
Functionality of the Symmetry ETG and Medstat MEG Software | August 2008 13
daily visits. The columns distinguish IP claims by the number of days spent in the hospital, with
a one-day stay occurring when the beneficiary is discharged on the same day as the admission
date and a two-day stay when the beneficiary is discharged on the day after admission. For each
stay length, the table reports the frequency of PB claims that are concurrent with that claim. The
top panel of the table looks at the frequency of all types of PB claims submitted during the stay.
For example, the first number in the table shows that, among one-day claims, 95% have at least
one concurrent PB claim. For 7-day admissions in the same row, 92% of IP stays show an
average of one or more PB claims per day submitted during the admission. If we look at the
“Overall” column in the first row, which summarizes frequencies for all lengths, we see that 93%
of IP stays show an average of at least one concurrent PB claim for each day of the IP admission.
The general pattern in this row reveals that the fraction of IP stays with an average of at least one
PB claim per day slowly falls as admissions lengthen. To allow for near daily visits for the
longer stays, the second and third rows of Table 2.8 show the share of IP stays reaching the one-
per-day average allowing for one and two days to be missed during the stay. For reference, the
fourth row lists the percentages of stays with at least one PB submission. The middle panel of
rows in the table presents comparable statistics considering only E&M PB claims, and the
bottom panel further focuses on E&M PB claims with HCPCS codes designating hospital visits
directly associated with the inpatient stay.
The profiles in Table 2.8 mirror the flow of physician services supported by Medicare's
payment structure for PB claims during IP stays. The findings reveal that virtually all IP stays
have at least one concurrent PB claim, and those that do not meet the one-per-day standard often
come close, as shown in the second and third rows of Table 2.8. Among the longest IP stays,
68% of stays have PB claims for all but two out of the 22+ days in the stay. Of course, these PB
claims may not all represent E&M claims. The middle panel shows that daily claims are very
much the norm counting only E&M PB claims, and the bottom panel further shows that the near
daily norm also applies for E&M PB claims with HCPCS codes directly associated with the
inpatient stay. Out of 20,957 inpatient stays with a medical DRG, 69% have daily hospital E&M
claims, and 88% have nearly daily E&M visits.
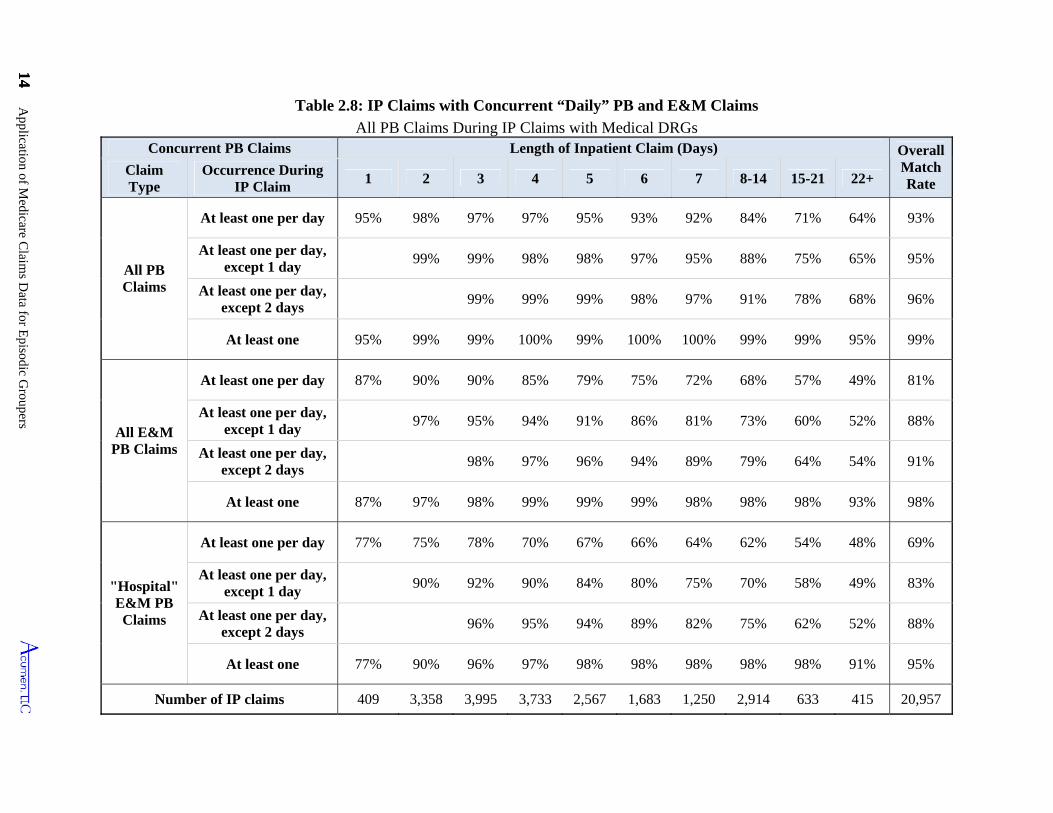
14 Application of M
edicare Claim
s Data for E
pisodic Groupers
14
Table 2.8: IP Claims with Concurrent “Daily” PB and E&M Claims
All PB Claims During IP Claims with Medical DRGs Concurrent PB Claims Length of Inpatient Claim (Days) Overall
Match Rate
Claim Type
Occurrence During IP Claim
1 2 3 4 5 6 7 8-14 15-21 22+
All PB Claims
At least one per day 95% 98% 97% 97% 95% 93% 92% 84% 71% 64% 93%
At least one per day, except 1 day
99% 99% 98% 98% 97% 95% 88% 75% 65% 95%
At least one per day, except 2 days
99% 99% 99% 98% 97% 91% 78% 68% 96%
At least one 95% 99% 99% 100% 99% 100% 100% 99% 99% 95% 99%
All E&M PB Claims
At least one per day 87% 90% 90% 85% 79% 75% 72% 68% 57% 49% 81%
At least one per day, except 1 day
97% 95% 94% 91% 86% 81% 73% 60% 52% 88%
At least one per day, except 2 days
98% 97% 96% 94% 89% 79% 64% 54% 91%
At least one 87% 97% 98% 99% 99% 99% 98% 98% 98% 93% 98%
"Hospital" E&M PB Claims
At least one per day 77% 75% 78% 70% 67% 66% 64% 62% 54% 48% 69%
At least one per day, except 1 day
90% 92% 90% 84% 80% 75% 70% 58% 49% 83%
At least one per day, except 2 days
96% 95% 94% 89% 82% 75% 62% 52% 88%
At least one 77% 90% 96% 97% 98% 98% 98% 98% 98% 91% 95%
Number of IP claims 409 3,358 3,995 3,733 2,567 1,683 1,250 2,914 633 415 20,957
Functionality of the Symmetry ETG and Medstat MEG Software | August 2008 15
3 FRAMEWORK FOR UNDERSTANDING AND COMPARING GROUPER RESULTS
To understand and compare the results from the two groupers, we need a common
framework for the output. Unfortunately, the summary output files produced by the Symmetry
and Medstat groupers use different approaches for assigning costs, lengths and types to episodes.
While these output differences do not necessarily reflect on the functionality of the groupers,
they do make it difficult to compare the results.
As a framework to compare the two groupers, we develop a common set of measures for
the two packages that rely on the fact that the groupers map claims to episodes. In other words,
it is possible to see, claim by claim, to which episode each claim is assigned. Using the claim-
episode mapping output from each grouper, we calculate episode length, cost and completeness.
Because the concept of completeness applies primarily to acute episodes, we also identify
episode types as either acute or chronic using each grouper’s classification. Drawing on these
common measures, we construct matching output tables for the two groupers.
In this section, we review our decision rules for calculating measures from the underlying
mapping of claims to episodes produced by the groupers. We then describe the output tables that
we use in the subsequent analyses of each software package. The main area in which the output
tables do not match across the two groupers is in the reporting of episode categories. As noted,
the two groupers have different disease classifications, which limits the direct comparability of
the output.
3.1 Characteristics of Episodes
Each grouper has its own episode classification system. For Symmetry, its software
assigns each episode to an ETG. At its most elaborate, an ETG designation consists of a 9 digit
code with the first 6 digits representing a disease classification—referred to as the Base ETG—
and the last three digits identifying complications, comorbidities and treatments. There are a
total of 524 Base ETG classes, of which 68 are categorized as “Ungroupable.” Symmetry also
distinguishes Base ETGs by up to 4 severity levels. Of the 456 Base ETGs that are assignable to
episodes, 129 have multiple severity levels which lead to a total of 679 Base ETG-Severity level
categories. For the purpose of attributing episodes to health-care providers using the current
version of its software, Symmetry recommends interpreting Base ETG plus its assessed severity
Functionality of the Symmetry ETG and Medstat MEG Software | August 2008 15
Framework for Understanding and Comparing Grouper Results 16
level as the episode categories for comparing cost outcomes. Consequently, when we use the
term ETG in this report, we interpret this designation of an episode type to be a Base ETG plus
an associated severity level.
Medstat’s grouper assigns each episode to a MEG (disease classifications) along with a
main disease stage and detailed disease stages. There are a total of 560 MEG classifications,
1883 combinations of MEGs and main disease stages, and 4727 combinations of MEGs and
detailed disease stages.19 Medstat recommends classifying episodes into MEGs as the relevant
categories for attributing incidents of care to providers. A primary use of disease stages arises in
adjusting episode costs within MEGs for risk factors, a topic not covered in this report. So, when
we use the term MEG in the subsequent discussion, we interpret this designation of an episode
type to be a simple MEG without distinguishing disease stages.
For the purpose of comparing the two groupers, we have established a common approach
for calculating key measures for the episodes and in identifying the sample of episodes to use for
analysis. We briefly review these concepts below.
3.2 Approach for Determining Episode Length and Cost
Using Symmetry’s and Medstat’s assignment of claims to episodes, we have developed
common measures of episode length and costs. These measures are not necessarily superior to
measures produced by the ETG and MEG software, but provide a reasonable basis for
comparison, as well as offering a strategy to understand the effects of different algorithms used
by the two packages. The strategies for calculating episode length and costs are straightforward.
Episode length: Because Symmetry and Medstat use different methods for calculating
start and end dates when calculating episode lengths, for purposes of comparison, we apply a
single rule to compute episode lengths. In this analysis, the start date is the earliest start date of
all the claims grouped into the episode, and the end date is the latest end date of all the claims
grouped into the episode.20 Neither Symmetry nor Medstat uses this method.
19 These figures reflect the number of MEGs in version 7.1 of the Medstat grouper. The recently released version 7.25 adds 12 additional MEGs, for a total of 572. 20 Symmetry inputs institutional claims as a set of “pseudo-claims”, one for each of the procedure codes or revenue center codes from the parent claim. These pseudo-claims are often grouped to multiple episodes. For the purposes of calculating episode dates for Symmetry, we consider all the dates on any record grouped to an episode, including all institutional pseudo-claims and non-institutional line items.
Framework for Understanding and Comparing Grouper Results 16
Functionality of the Symmetry ETG and Medstat MEG Software | August 2008 17
Episode cost: We also recalculate episode costs for both Symmetry and Medstat to
ensure that our costs were consistent across groupers. In our analysis, we compute an episode’s
costs by summing the payments of all the claims allocated to the episode. In the case of
Symmetry, for which we split institutional claims into multiple records (pseudo-claims) that can
be linked to more than one episode, we assign the entire cost of the institutional claim to
whichever episode was assigned the most records (i.e., pseudo-claims) from the original
Medicare claim.21 In the case of Medstat, which assigns whole claims to episodes, our method
precisely assesses the cost of each episode. This means our comparisons accurately capture the
costs for the claims in the episodes, based on each grouper’s assignment of claims to episodes.
3.2.1 Categories of Episodes for Analysis
Our analysis is divided in a number of key ways: based on the type of episode (acute
versus chronic) and based on which data are included in a particular examination of the episode
groupings:
Acute vs. chronic episode types: We distinguish acute episode types from chronic
episode types, using the categories defined by the groupers. For Medstat, the grouper
documentation lists which MEGs are chronic and which are acute.22 With its most recent
release, Symmetry now also classifies its episode types (ETGs) as either acute or chronic. The
distinction between acute and chronic types becomes most relevant when we examine only
complete episodes.
All Claims: All our analyses are based on claims from 2002 to 2004 for a sample of
continuously-enrolled fee-for-service (FFS) beneficiaries aged 65 and older with a residence in
Colorado. Our analyses primarily focus on a randomly-selected subsample of 20% of those
beneficiaries. When we refer to “All Claims” in this report, we mean all claims for those
beneficiaries.
21 If more than one episode is tied for having the greatest share of pseudo-claims for a claim, the claim’s cost is divided equally among the tied episodes. See Section 4.3 for more discussion of our plurality rule. 22 Medstat has five categories of MEGs: acute, chronic acute flare-up, chronic maintenance, chronic non-stratified, and well care. As chronic acute flare-ups represent a distinct episode from the underlying chronic condition, and have defined clean periods (unlike the 999 day clean period for other chronic episodes), we treat these episodes as acute. Chronic maintenance, chronic non-stratified, and well care (i.e., preventive care) are all treated as chronic episodes by Mestat, so we include them in our chronic episode statistics.
Functionality of the Symmetry ETG and Medstat MEG Software | August 2008 17

Framework for Understanding and Comparing Grouper Results 18
2003 Touching Episodes: Our analysis draws on data from 2002 to 2004 to understand
episodes in 2003. Our primary definition of episodes in 2003 is “2003 Touching Episodes.”
These are episodes that “touch” 2003 in that their start and end dates of the episodes occur in the
2002-2004 observation period, with at least one day of 2003 between. This includes episodes
that start in 2002 and end in 2003, episodes that both start and end in 2003, episodes that start in
2003 and end in 2004, and episodes that start in 2002 and end in 2004.23
2003 Complete Episodes: Although this report focuses largely on episodes that touch
2003, a narrower focus is appropriate when one turns to the issue of physician attribution. To
use the groupers to attribute episodes to physicians and especially to use them to attribute costs,
it is critical to concentrate on completed episodes. By using complete episodes we can be certain
that the attribution of an episode to a given provider will not change when more claims are added
to the data. In addition, the length and the final cost of episode can both only be determined for
complete episodes.
Conceptually, episodes are determined to be complete if we observe an appropriate
“clean period” ahead of the initial date on the claims and also observe an appropriate clean
period after the final date on the claims. Clean periods, or intervals during which there are no
claims associated with a given episode type, are used by the grouper packages to determine
whether two claims are close enough together in time to be considered part of the same episode.
Each episode type (ETG for Symmetry and MEG for Medstat) has an associated clean period
that is set by the groupers on consultation with physicians. These clean periods range from 0
days to 999 days. Acute episode types have shorter clean periods; chronic episode types have
longer clean periods.
With a three-year window of data, it is not possible to determine whether we are missing
claims for episodes near the beginning or end of the time period covered by our data. In other
words, episodes with start dates close to January 1, 2002 or with end dates close to December 31,
2004 could have claims that would have been counted in the episode if our data cover a longer
period. Episodes with claims not included because of the time cutoffs are not complete in the
clinical sense, or administratively, in that they do not include all clinical and cost information.
23 In a few extremely rare cases, our data includes episodes with that start before 2002 or end after 2004. We do not include these episodes in the 2003 Touching sample unless they either start or end in 2003.
Framework for Understanding and Comparing Grouper Results 18
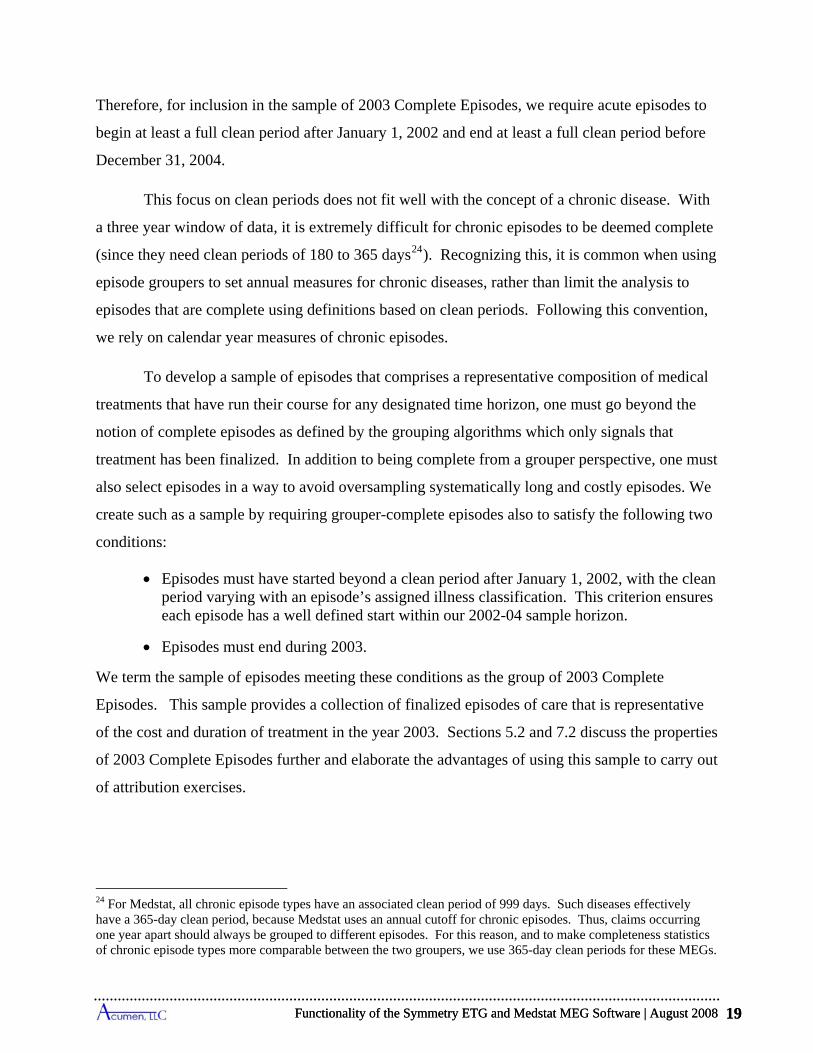
Functionality of the Symmetry ETG and Medstat MEG Software | August 2008 19
Therefore, for inclusion in the sample of 2003 Complete Episodes, we require acute episodes to
begin at least a full clean period after January 1, 2002 and end at least a full clean period before
December 31, 2004.
This focus on clean periods does not fit well with the concept of a chronic disease. With
a three year window of data, it is extremely difficult for chronic episodes to be deemed complete
(since they need clean periods of 180 to 365 days24). Recognizing this, it is common when using
episode groupers to set annual measures for chronic diseases, rather than limit the analysis to
episodes that are complete using definitions based on clean periods. Following this convention,
we rely on calendar year measures of chronic episodes.
To develop a sample of episodes that comprises a representative composition of medical
treatments that have run their course for any designated time horizon, one must go beyond the
notion of complete episodes as defined by the grouping algorithms which only signals that
treatment has been finalized. In addition to being complete from a grouper perspective, one must
also select episodes in a way to avoid oversampling systematically long and costly episodes. We
create such as a sample by requiring grouper-complete episodes also to satisfy the following two
conditions:
Episodes must have started beyond a clean period after January 1, 2002, with the clean period varying with an episode’s assigned illness classification. This criterion ensures each episode has a well defined start within our 2002-04 sample horizon.
Episodes must end during 2003.
We term the sample of episodes meeting these conditions as the group of 2003 Complete
Episodes. This sample provides a collection of finalized episodes of care that is representative
of the cost and duration of treatment in the year 2003. Sections 5.2 and 7.2 discuss the properties
of 2003 Complete Episodes further and elaborate the advantages of using this sample to carry out
of attribution exercises.
24 For Medstat, all chronic episode types have an associated clean period of 999 days. Such diseases effectively have a 365-day clean period, because Medstat uses an annual cutoff for chronic episodes. Thus, claims occurring one year apart should always be grouped to different episodes. For this reason, and to make completeness statistics of chronic episode types more comparable between the two groupers, we use 365-day clean periods for these MEGs.
Functionality of the Symmetry ETG and Medstat MEG Software | August 2008 19
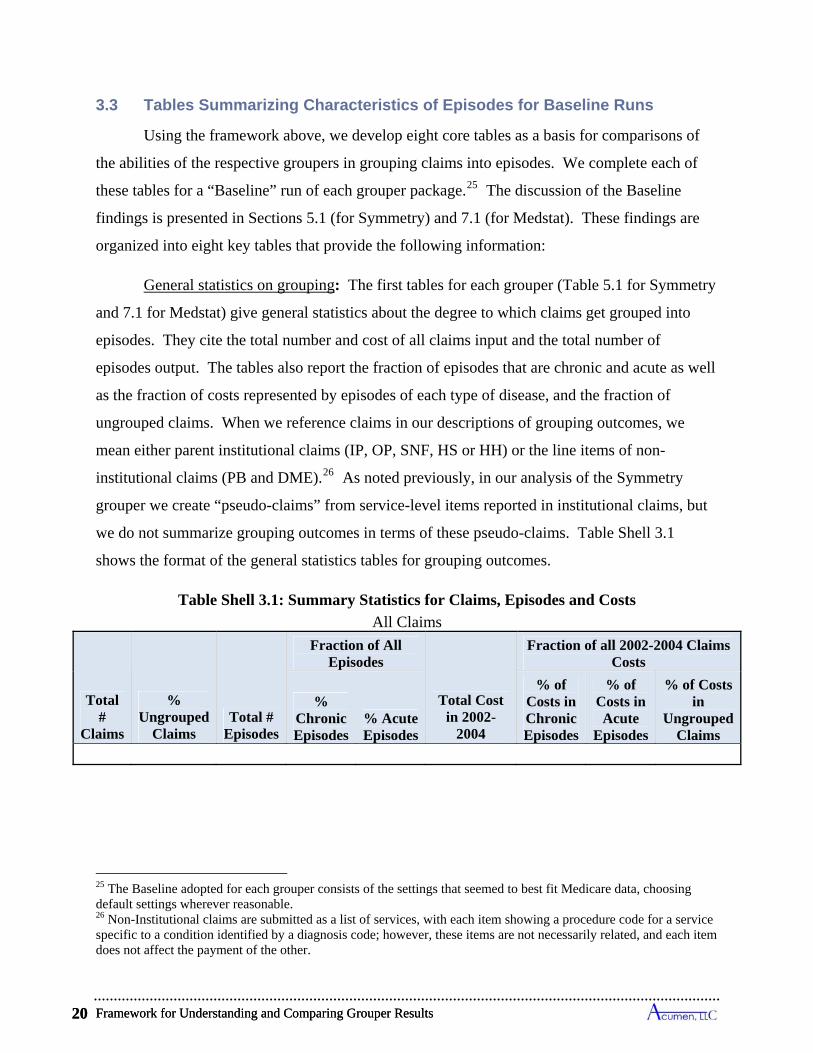
Framework for Understanding and Comparing Grouper Results 20
3.3 Tables Summarizing Characteristics of Episodes for Baseline Runs
Using the framework above, we develop eight core tables as a basis for comparisons of
the abilities of the respective groupers in grouping claims into episodes. We complete each of
these tables for a “Baseline” run of each grouper package.25 The discussion of the Baseline
findings is presented in Sections 5.1 (for Symmetry) and 7.1 (for Medstat). These findings are
organized into eight key tables that provide the following information:
General statistics on grouping: The first tables for each grouper (Table 5.1 for Symmetry
and 7.1 for Medstat) give general statistics about the degree to which claims get grouped into
episodes. They cite the total number and cost of all claims input and the total number of
episodes output. The tables also report the fraction of episodes that are chronic and acute as well
as the fraction of costs represented by episodes of each type of disease, and the fraction of
ungrouped claims. When we reference claims in our descriptions of grouping outcomes, we
mean either parent institutional claims (IP, OP, SNF, HS or HH) or the line items of non-
institutional claims (PB and DME).26 As noted previously, in our analysis of the Symmetry
grouper we create “pseudo-claims” from service-level items reported in institutional claims, but
we do not summarize grouping outcomes in terms of these pseudo-claims. Table Shell 3.1
shows the format of the general statistics tables for grouping outcomes.
Table Shell 3.1: Summary Statistics for Claims, Episodes and Costs
All Claims
Total #
Claims
% Ungrouped
Claims Total #
Episodes
Fraction of All Episodes
Total Cost in 2002-
2004
Fraction of all 2002-2004 Claims Costs
% Chronic Episodes
% Acute Episodes
% of Costs in Chronic Episodes
% of Costs in Acute
Episodes
% of Costs in
Ungrouped Claims
25 The Baseline adopted for each grouper consists of the settings that seemed to best fit Medicare data, choosing default settings wherever reasonable. 26 Non-Institutional claims are submitted as a list of services, with each item showing a procedure code for a service specific to a condition identified by a diagnosis code; however, these items are not necessarily related, and each item does not affect the payment of the other.
Framework for Understanding and Comparing Grouper Results 20

Functionality of the Symmetry ETG and Medstat MEG Software | August 2008 21
General statistics for 2003 Touching Episodes: The core of our analysis focuses on
episodes that fall at least partially in 2003, our analysis year. We refer to such episodes as “2003
Touching.”
The second table for each grouper (Table 5.2 for Symmetry and 7.2 for Medstat) gives
summary information on all episodes that touch 2003, as well as for acute episodes we deem
complete (see Section 3.1.2 above). They list the total number of episodes that touch 2003, and
fraction of for Touching acute and chronic episodes along with shares of Complete acute
episodes. The tables also give the share costs represented by each of these categories. Table
Shell 3.2 demonstrates the format of these tables.
Table Shell 3.2: Summary Statistics Episodes and Costs
2003 Touching Episodes
Total # 2003
Touching Episodes
Fraction of All 2003 Touching Episodes
Total Cost of
2003 Touching Episodes
Fraction of All 2003 Touching Episode Costs
% Chronic Episodes
% Acute Episodes
% 2003 Complete
Acute Episodes
% of Costs in Chronic Episodes
% of Costs in Acute
Episodes
% of Costs in
2003 Complete
Acute Episodes
Distribution of each type of episode by cost and length: Tables 5.3 for Symmetry and 7.3
for Medstat give the distribution of chronic, acute, and complete acute episodes both by cost and
length of episode, still focusing on 2003 Touching Episodes. The tables break the statistics into
percentiles (10, 25, 50, 75, 90, 95, and 98) as well as specify the mean and standard deviation
(Std Dev) for the cost and length of episodes. Table Shell 3.3 shows the format of these tables.
Functionality of the Symmetry ETG and Medstat MEG Software | August 2008 21
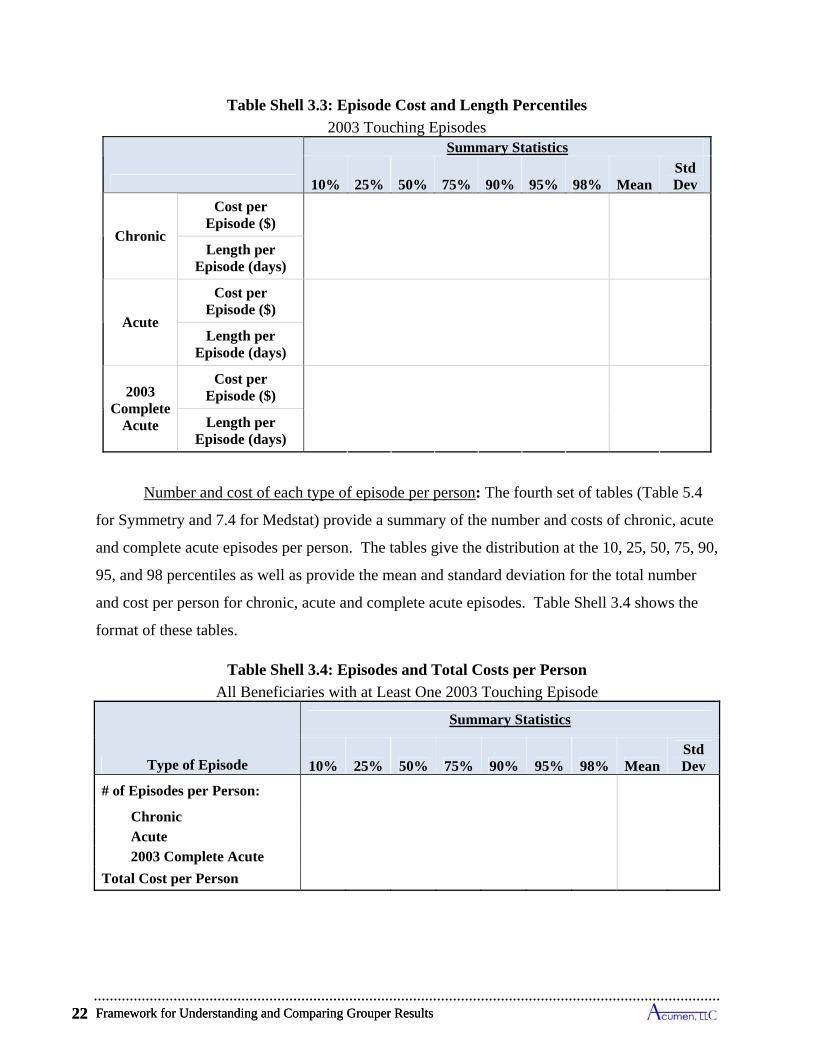
Framework for Understanding and Comparing Grouper Results 22
Table Shell 3.3: Episode Cost and Length Percentiles
2003 Touching Episodes
Summary Statistics
10% 25% 50% 75% 90% 95% 98% Mean Std Dev
Chronic
Cost per Episode ($)
Length per Episode (days)
Acute
Cost per Episode ($)
Length per Episode (days)
2003 Complete
Acute
Cost per Episode ($)
Length per Episode (days)
Number and cost of each type of episode per person: The fourth set of tables (Table 5.4
for Symmetry and 7.4 for Medstat) provide a summary of the number and costs of chronic, acute
and complete acute episodes per person. The tables give the distribution at the 10, 25, 50, 75, 90,
95, and 98 percentiles as well as provide the mean and standard deviation for the total number
and cost per person for chronic, acute and complete acute episodes. Table Shell 3.4 shows the
format of these tables.
Table Shell 3.4: Episodes and Total Costs per Person
All Beneficiaries with at Least One 2003 Touching Episode
Type of Episode
Summary Statistics
10% 25% 50% 75% 90% 95% 98% MeanStd Dev
# of Episodes per Person: Chronic Acute 2003 Complete Acute
Total Cost per Person
Framework for Understanding and Comparing Grouper Results 22
Functionality of the Symmetry ETG and Medstat MEG Software | August 2008 23
Breakdown of Episodes by Disease Type: The next table shell (Table 5.5 for Symmetry
and 7.5 for Medstat) provides a summary of general disease types. For each disease type, the
fraction of chronic, complete acute, incomplete acute and total episodes is given. For Symmetry,
general disease types are the “Major Practice Categories” (MPCs) specified in the software
documentation. The MPCs are general categories that can be further split into episode treatment
groups (ETGs). Although Medstat also groups its episode types into general categories, its
categories are more specific than Symmetry’s MPCs. For comparison purposes, Acumen further
groups Medstat’s categories so that they correspond to the 25 Major Diagnostic Categories or
MDCs.27 Although Symmetry’s MPCs and Medstat’s MDCs are similar, they do not have a one-
to-one correspondence and are therefore not necessarily comparable. Table Shell 3.5 provides
the format of these tables – the rows differ between the two software packages, according to the
MPC/MDC differences.
Table Shell 3.5: Major Practice Category Classifications
2003 Touching Episodes (Symmetry Example)
Major Practice Category % Chronic Episodes
% 2003 CompleteAcute
Episodes
% Incomplete Acute
Episodes % All
Episodes
Orthopedics & Rheumatology
Cardiology
TOTAL 100%
Episode Costs and Other Characteristics by Disease Types: Two tables look at specific
episode types (i.e. an ETG for Symmetry and a MEG for Medstat) and give statistics for chronic
and acute episodes of those types that touch 2003. These tables correspond to Tables 5.6 and 5.7
for Symmetry and Tables 7.6 and 7.7 for Medstat. For Tables 5.6 and 7.6, each row summarizes
a specific episode type’s cost data, indicating the rank in cost for that episode type and the rank
in standard deviation of cost. Information on the distribution of costs per episode for that
episode type include costs by percentiles (10, 50, 90, and 98), along with the mean and standard
27 These categories are commonly used diagnostic categories and usually correspond to either a single organ system or a medical specialty. The specific mapping from Medstat’s episode groups to MDCs is available upon request. More information regarding these categories can be found at health.utah.gov/opha/IBIShelp/codes/MDC.htm.
Functionality of the Symmetry ETG and Medstat MEG Software | August 2008 23
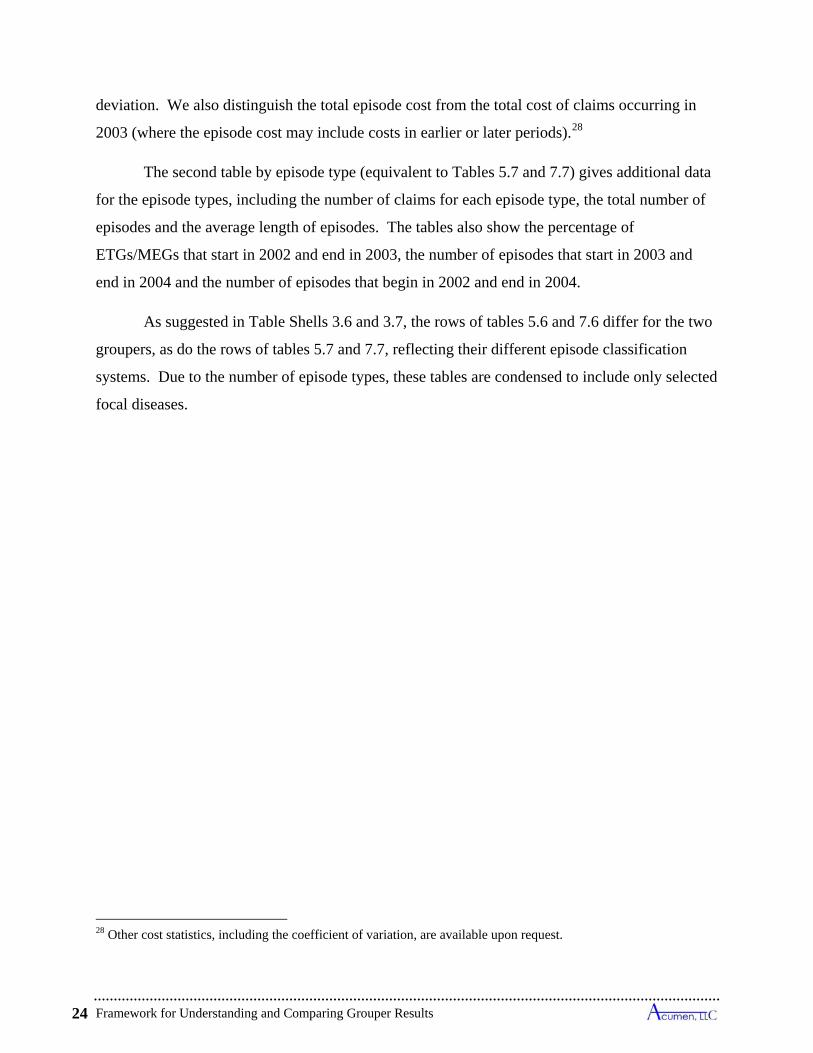
Framework for Understanding and Comparing Grouper Results 24
deviation. We also distinguish the total episode cost from the total cost of claims occurring in
2003 (where the episode cost may include costs in earlier or later periods).28
The second table by episode type (equivalent to Tables 5.7 and 7.7) gives additional data
for the episode types, including the number of claims for each episode type, the total number of
episodes and the average length of episodes. The tables also show the percentage of
ETGs/MEGs that start in 2002 and end in 2003, the number of episodes that start in 2003 and
end in 2004 and the number of episodes that begin in 2002 and end in 2004.
As suggested in Table Shells 3.6 and 3.7, the rows of tables 5.6 and 7.6 differ for the two
groupers, as do the rows of tables 5.7 and 7.7, reflecting their different episode classification
systems. Due to the number of episode types, these tables are condensed to include only selected
focal diseases.
28 Other cost statistics, including the coefficient of variation, are available upon request.
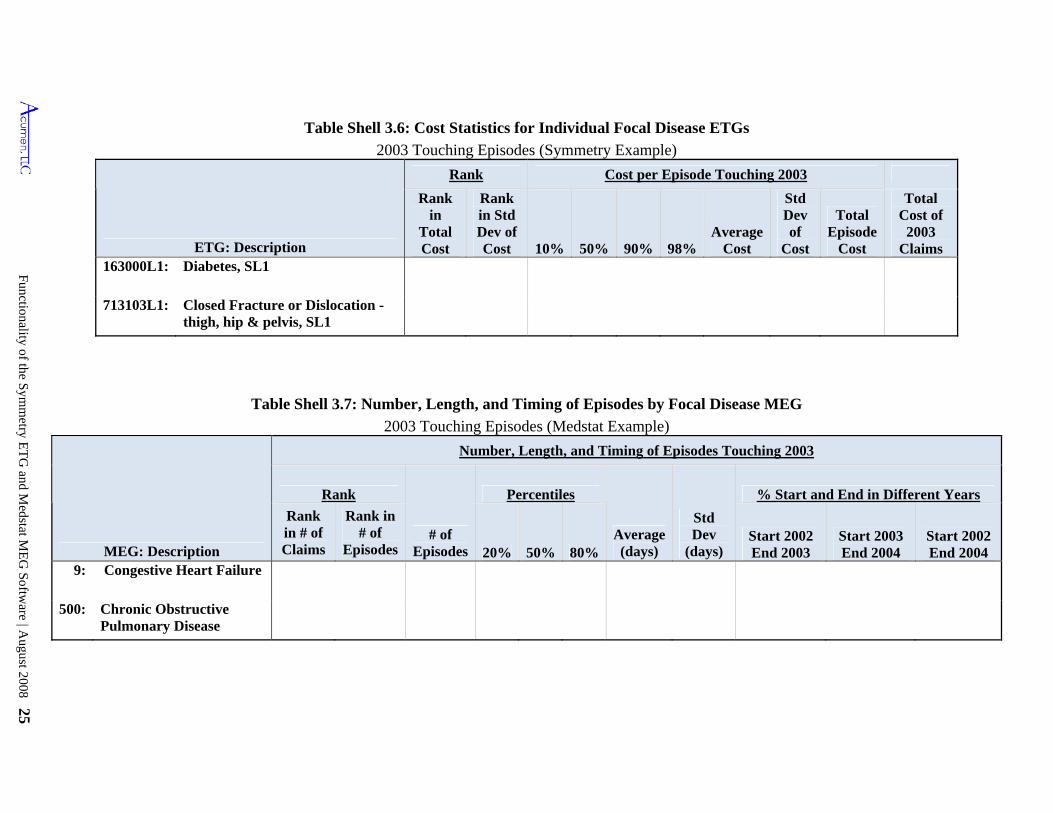
Functionality of the S
ymm
etry ET
G and M
edstat ME
G S
oftware | A
ugust 2008 25
20%
Table Shell 3.6: Cost Statistics for Individual Focal Disease ETGs
2003 Touching Episodes (Symmetry Example)
ETG: Description
Rank Cost per Episode Touching 2003
Rank in
Total Cost
Rank in Std Dev of Cost 10% 50% 90% 98%
Average Cost
Std Dev of
Cost
Total Episode
Cost
Total Cost of
2003 Claims
163000L1: Diabetes, SL1
713103L1: Closed Fracture or Dislocation - thigh, hip & pelvis, SL1
Table Shell 3.7: Number, Length, and Timing of Episodes by Focal Disease MEG
2003 Touching Episodes (Medstat Example)
MEG: Description
Number, Length, and Timing of Episodes Touching 2003
Rank
# of Episodes
Percentiles
Average (days)
Std Dev
(days)
% Start and End in Different Years
Rank in # of Claims
Rank in # of
Episodes 50% 80%Start 2002 End 2003
Start 2003 End 2004
Start 2002 End 2004
9: Congestive Heart Failure
500: Chronic Obstructive Pulmonary Disease
Framework for Understanding and Comparing Grouper Results 26
Ungrouped claims: Finally, the last table common to both groupers (corresponding to
Table 5.8 for Symmetry and 7.8 for Medstat) provides a distribution of ungrouped claims by the
seven claim types. It gives the number of ungrouped claims for each claim type and the fraction
of ungrouped claims within each claim type.
Table Shell 3.8: Ungrouped Claims by Claim Type
All Claims
Claim Type
# of Claims Ungrouped
% of Claims
Ungrouped
IP OP SNF HH HS PB
DME
All of the tables are presented for the Baseline runs. However, we do not replicate in this
report all of the tables for all of the runs associated with varying the input and configuration
settings. In particular, we include the tables by MPC/MDC and episode type only for the
Baseline runs. Versions of these tables for subsequent runs are available upon request.
Framework for Understanding and Comparing Grouper Results 26

Functionality of the Symmetry ETG and Medstat MEG Software | August 2008 27
4 SPECIFICATION OF BASELINE APPLICATION OF SYMMETRY GROUPER TO MEDICARE DATA
For the purpose of this analysis as well as future work using grouper software for
Medicare, we have developed a specification of input file characteristics and software
configuration settings that represent our “Baseline.” This Baseline reflects our determination of
the input file and configuration options that best suit the Medicare claims data, within the normal
settings of the software. This chapter describes the Baseline application of the Symmetry
grouper to Medicare claims. The Baseline specification details the structure of the input file, the
software configuration, and the structure of the output file. The following chapter presents the
findings from the Baseline run using these settings, as well as comparisons using alternative
specifications.
4.1 Structure of Symmetry Input File for “Baseline” Run
Using all Medicare claims between 2002 and 2004 filed for a 20% sample of all FFS
Colorado Medicare beneficiaries in 2003, we create an input file for the Symmetry software.29
This construction requires decisions on the use of diagnosis codes, procedure and revenue center
codes. Table 4.1 displays the use of diagnosis and procedure codes in our construction of the
Baseline input file. We review these choices below.
Table 4.1: Data Inputs Used in Baseline Symmetry Run
Claim Type
Diagnosis Codes Use of Revenue Center/HCPCS/CPT Codes
IP
First four listed
diagnosis codes
One input record created for each medical service, which is identified by a revenue center code and, when available, the
corresponding HCPCS/CPT code.
OP
SNF
HH
HS
PB Line-item diagnosis
code
Line items input using the single HCPCS/CPT procedure code on each line item. DME
29 We restrict our main analysis sample to be a randomly-selected 20% of Colorado residents to lessen the computational burden involved in carrying out grouping for the many different specifications of the ETG and MEG groupers considered in this report. In many instances, we validate results against the 100% samples of Colorado, Florida, Pennsylvania and Oregon and always find that the 20% Colorado sample produces representative findings.
Functionality of the Symmetry ETG and Medstat MEG Software | August 2008 27
Specification of Baseline Application of Symmetry Grouper to Medicare Data 28
Symmetry offers the ability to disaggregate institutional claims into individual service-
level inputs. This allows the different services listed on an institutional claim to be grouped to
distinct episodes as appropriate. We create service-level input records, which we term “pseudo-
claims,” following Symmetry’s recommendation to use information on revenue center codes and
corresponding HCPCS or CPT procedure codes. Services are always identified on an
institutional claim by a revenue center code, and if there are HCPCS/CPT codes on a claim, each
always corresponds to single revenue center code. So in creating pseudo-claims, we use a single
revenue center code as the principal designator of the service. All pseudo-claims constructed
from Medicare institutional claims, then, have a single revenue center code, but not all pseudo-
claims have an accompanying HCPCS/CPT code. Of pseudo-claims built from IP claims, 2%
have a HCPCS or CPT code; 7% of pseudo-claims from SNF claims have a HCPCS/CPT code;
6% of input records from HS claims have a procedure code; and 72% of pseudo-claims from OP
claims and 88% from HH claims have a HCPCS/CPT code.
Turning to non-institutional Medicare claims, PB and DME claims separate into
individual line items, each of which has a single associated diagnosis and HCPCS or CPT code.
As such, line items from PB and DME claims conform to Symmetry’s service-level standard for
inputs as they have a single HCPCS/CPT code.
Symmetry allows for up to four diagnosis codes for each input record. For pseudo-claims
constructed from institutional claims, our Baseline implementation uses the first four diagnoses
codes listed on the claim. Medicare institutional claims, particularly IP, SNF, and HH claims,
often have more than four diagnosis codes (see Table 2.2). However, since Symmetry does not
allow for more than four diagnoses codes per input record, the user must choose which four
codes to use. As there is no mapping between diagnoses codes and revenue center or procedure
codes on institutional claims, each pseudo-claim from a parent institutional claim receives the
same four diagnoses codes. So, if 20 pseudo-claims are constructed from a single institutional
claim, each of the 20 pseudo-claims will have the same four diagnoses codes. For PB and DME
claims, we use the single line-item diagnosis code instead of the header diagnosis list because it
corresponds directly to the procedure performed for non-institutional claims.
ICD-9 procedure codes are commonly present on IP claims because they are used in
constructing the DRGs used for determining payments, and Symmetry allows for up to 4 ICD-9
Specification of Baseline Application of Symmetry Grouper to Medicare Data 28
Functionality of the Symmetry ETG and Medstat MEG Software | August 2008 29
procedure codes on each input record. However, Symmetry’s algorithm does not use these codes
for the purpose of grouping. Instead, fields for ICD-9 codes and other codes, such as payments,
are provided so these variables can be used for post-grouping analysis. We tested the effect of
not using ICD-9 procedure codes as input for creating ETGs and, consistent with Symmetry
documentation, we found that these codes did not affect grouping.
In addition to diagnoses and procedure code information, date, cost and beneficiary
information is included as input. Start and end date information is used for grouping (see
Chapter 2), and beneficiary information (age and gender) is used by Symmetry to establish
severity level. Cost information is not used for grouping, but instead is included as input for the
purpose of post-grouping analysis.
4.2 Structure of Symmetry Configuration File for "Baseline" Run
In addition to using input files, the user can influence grouping outcomes through a
configuration file. Table 4.2 lists the options and our settings for the Baseline configuration. We
select “NO” for unlimited episode length, primary diagnosis indicator and alternate pregnancy
provider following the recommendations of Symmetry’s documentation and/or sample
configuration files. Similarly, we use Symmetry’s defaults for clean periods. Selecting “track
patient comorbidity = NO” ensures that patients with episodes with comorbidities are not
flagged, nor will the grouper assume a prior history for runs. While Symmetry’s documentation
suggests setting this option to YES, we want to have a clean slate for each run for comparability.
Setting “link facility records = YES” connects claims associated with hospital stays into
“confinements.”30 We set this value to YES since Medicare IP claims are not necessarily
separate admissions. Regarding the “summarize complete episodes only” indicator, the
documentation suggests using caution in setting this to NO because using incomplete episodes in
analysis may give unpredictable results. However, we set this to NO because we want to analyze
both incomplete and complete episodes. This setting also allows us to recalculate episode
completeness as we discuss in Section 3.1.2.
30 “Facility records” are designated by a flag on the input records given to Symmetry. A confinement is a group of facility records with the same beneficiary, provider and bed type that make up a single “stay” or confinement.
Functionality of the Symmetry ETG and Medstat MEG Software | August 2008 29
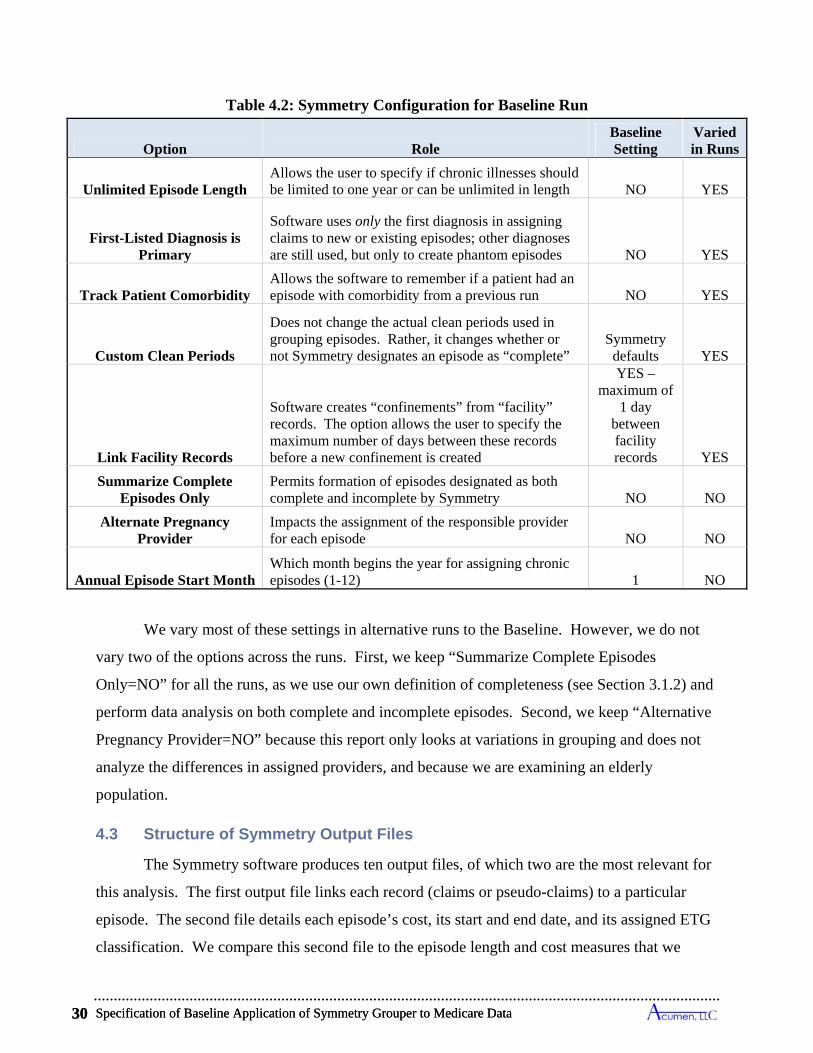
Specification of Baseline Application of Symmetry Grouper to Medicare Data 30
Table 4.2: Symmetry Configuration for Baseline Run
Option Role Baseline Setting
Varied in Runs
Unlimited Episode Length Allows the user to specify if chronic illnesses should be limited to one year or can be unlimited in length NO YES
First-Listed Diagnosis is Primary
Software uses only the first diagnosis in assigning claims to new or existing episodes; other diagnoses are still used, but only to create phantom episodes NO YES
Track Patient Comorbidity Allows the software to remember if a patient had an episode with comorbidity from a previous run NO YES
Custom Clean Periods
Does not change the actual clean periods used in grouping episodes. Rather, it changes whether or not Symmetry designates an episode as “complete”
Symmetry defaults YES
Link Facility Records
Software creates “confinements” from “facility” records. The option allows the user to specify the maximum number of days between these records before a new confinement is created
YES – maximum of
1 day between facility records YES
Summarize Complete Episodes Only
Permits formation of episodes designated as both complete and incomplete by Symmetry NO NO
Alternate Pregnancy Provider
Impacts the assignment of the responsible provider for each episode NO NO
Annual Episode Start Month Which month begins the year for assigning chronic episodes (1-12) 1 NO
We vary most of these settings in alternative runs to the Baseline. However, we do not
vary two of the options across the runs. First, we keep “Summarize Complete Episodes
Only=NO” for all the runs, as we use our own definition of completeness (see Section 3.1.2) and
perform data analysis on both complete and incomplete episodes. Second, we keep “Alternative
Pregnancy Provider=NO” because this report only looks at variations in grouping and does not
analyze the differences in assigned providers, and because we are examining an elderly
population.
4.3 Structure of Symmetry Output Files
The Symmetry software produces ten output files, of which two are the most relevant for
this analysis. The first output file links each record (claims or pseudo-claims) to a particular
episode. The second file details each episode’s cost, its start and end date, and its assigned ETG
classification. We compare this second file to the episode length and cost measures that we
Specification of Baseline Application of Symmetry Grouper to Medicare Data 30
Functionality of the Symmetry ETG and Medstat MEG Software | August 2008 31
calculate using our framework to gain a better understanding of how the Symmetry grouper
functions.
Our calculation of episode length differs substantially from Symmetry’s calculations. As
described in previous sections, we use the start date of the first claim associated with an episode
as the start date and the end date of the last claim as the end date, whereas Symmetry has two
distinct methods for assigning episode dates depending on whether the episode is for a chronic or
acute ETG. For chronic ailments, Symmetry breaks up care into episodes on an annual basis,
and assigns episode durations based on the start and end dates of the designated annual period,
and not based on the dates of assigned claims. As we set chronic episodes to begin on January 1,
every chronic episode has a start date of January 1. For acute episodes, Symmetry counts dates
from the first claim with an engaged clinician – during an office visit, a surgery, or other specific
treatment or therapy – to the last claim with an engaged clinician. In this way, it is grouping
claims into episodes defined by active treatment. Thus, Symmetry assigns acute episode start
and end dates based on first and last “anchor” records, which often differ from the actual first
and last records grouped into the episode. Symmetry determines whether or not a claim is an
anchor record by evaluating the revenue center and procedure codes present on the claim. For
Symmetry, then, “opening an episode” does not mean that the claim necessarily has the earliest
start date for the episode; rather, it means that other claims can be grouped with the anchor
record to form an episode.
Figure 4.1a illustrates how the use of anchor records creates a different episode length
calculation. The solid line represents the episode length as calculated by Symmetry, and the
dotted line shows a linked claim that does not figure into Symmetry’s date assignment for an
episode. In this figure, there are six claims for a given patient: three with a diagnosis code for
femur fracture and three with a diagnosis code for nutritional deficiency (evidenced by anemia,
for example). For the femur fracture episode, Acumen’s and Symmetry’s calculation approaches
would both result in a start date of 5/1/2006 and an end date of 6/21/2006. However, a blood test
(Claim A3) conducted at the same time as the fracture may reveal a nutritional deficiency. For
Symmetry, an episode for nutritional deficiency cannot start until there is an associated anchor
record, such as the office visit in claim A4. Claim A3 would be grouped with this episode, but
the start date would be that of the anchor claim. Therefore, Symmetry would assign a start date
Functionality of the Symmetry ETG and Medstat MEG Software | August 2008 31
Specification of Baseline Application of Symmetry Grouper to Medicare Data 32
of 5/7/2006 (the date of the anchor record), but Acumen would assign a start date of 5/1/2006
(the date of the first claim).
Because of Symmetry’s use of what is termed as “phantom records”, episodes might also
have a start or end date that comes from records grouped to a different episode. Phantom records
occur when an anchor claim has multiple unrelated diagnosis codes. Diagnosis codes that do not
match the revenue/procedure code are deemed phantom records and start “phantom clusters.” A
phantom cluster contains clinical information that can be used to start episodes. Phantom
clusters that do not gather claims become phantom episodes; these are episodes without any
associated claims, and simply represent a set of related diagnoses drawn from other claims.
Figure 4.1b shows another set of hypothetical claims, and how a phantom record can start
an episode and how Symmetry uses the phantom record to define an episode’s start date. As an
anchor record, Claim B1 starts, and is grouped to, the femur fracture episode; however it also
starts a phantom cluster for nutritional deficiency. If any other claims (including x-ray/lab
records) are identified with a nutritional deficiency condition, a new episode is created that does
not include Claim B1. In the example, the phantom record from Claim B1 would create an
episode for nutritional deficiency from Claim B3, even though Claim B3 is for lab work. And
although Claim B4 is the first anchor claim grouped to the nutritional deficiency episode, it is
our understanding of this feature in the Symmetry grouper that Claim B1 would provide the start
date of 5/1/2006 for the nutritional deficiency episode while being grouped to the femur fracture
episode. However, since Claim B1 is grouped to another episode, our method of assigning
episode dates would not define the start date with this claim, instead we would assign a start date
of 5/3/2006 using Claim B3. In this example, our end date would also differ from the date
assigned by Symmetry, as Symmetry would define an end date of 6/22/2006 using claim B6
since it is an anchor claim, but we would define an end date of 6/23/2006 from claim B7.
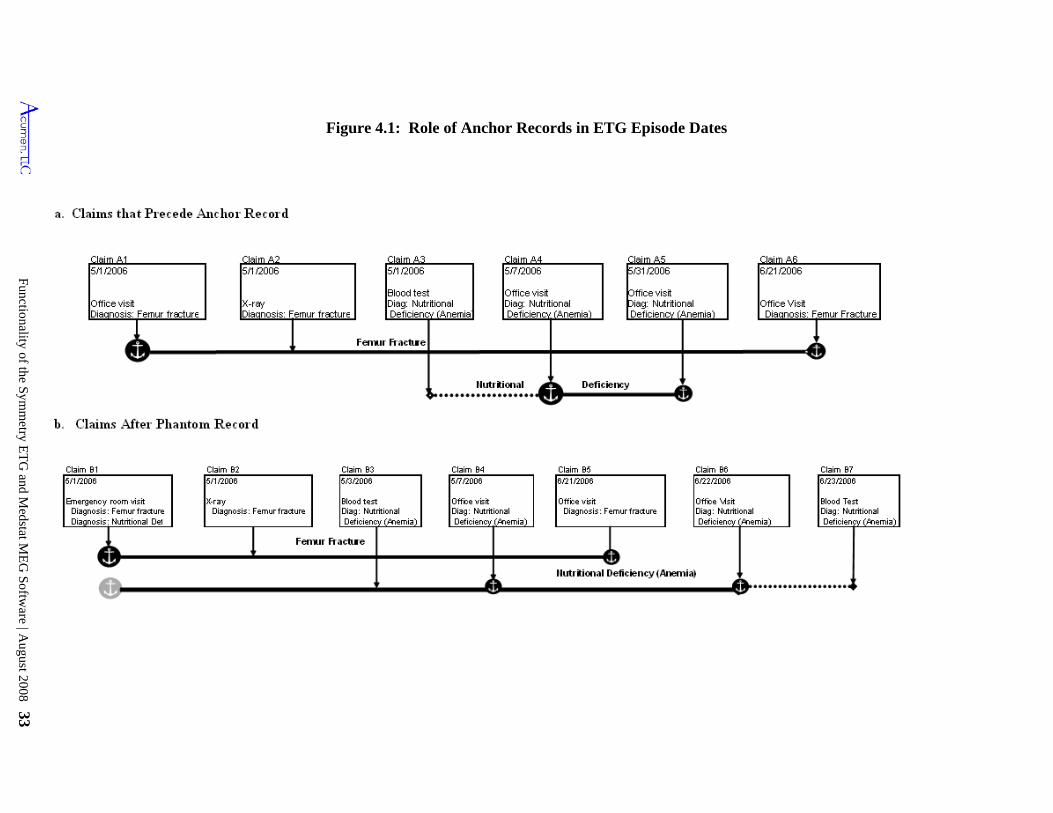
Functionality of the Symm
etry ET
G and M
edstat ME
G Softw
are | August 2008 33
Figure 4.1: Role of Anchor Records in ETG Episode Dates
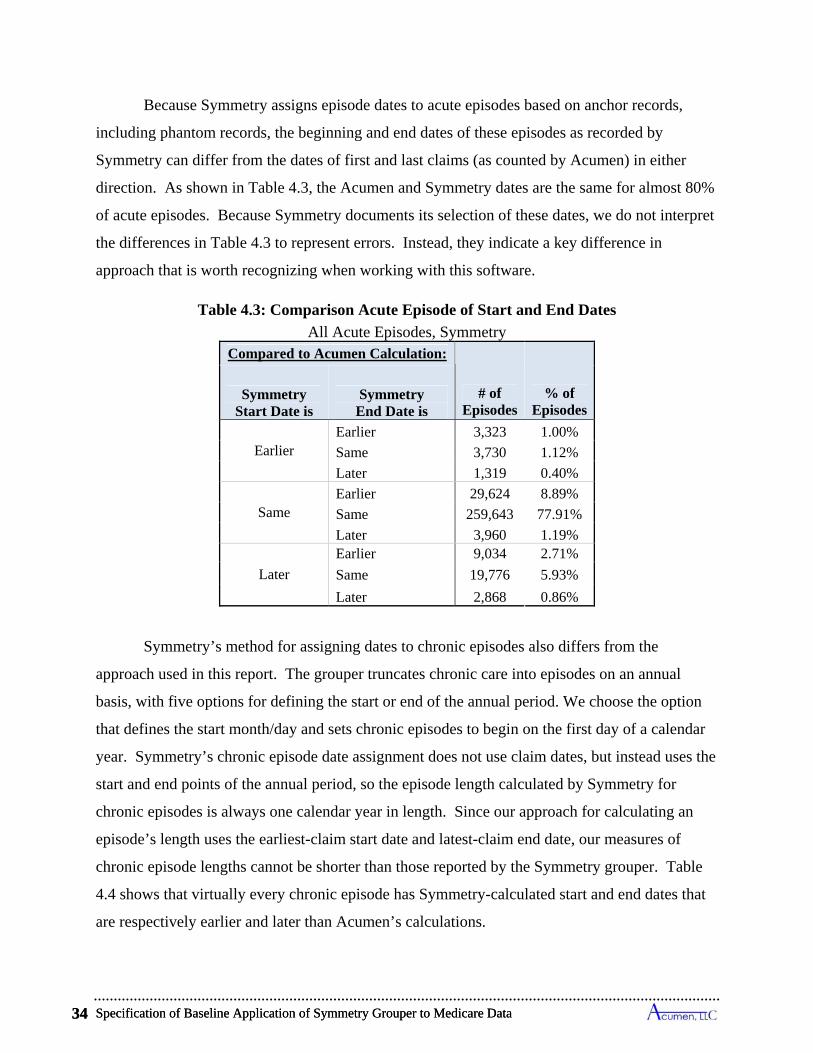
Specification of Baseline Application of Symmetry Grouper to Medicare Data 34
Because Symmetry assigns episode dates to acute episodes based on anchor records,
including phantom records, the beginning and end dates of these episodes as recorded by
Symmetry can differ from the dates of first and last claims (as counted by Acumen) in either
direction. As shown in Table 4.3, the Acumen and Symmetry dates are the same for almost 80%
of acute episodes. Because Symmetry documents its selection of these dates, we do not interpret
the differences in Table 4.3 to represent errors. Instead, they indicate a key difference in
approach that is worth recognizing when working with this software.
Table 4.3: Comparison Acute Episode of Start and End Dates
All Acute Episodes, Symmetry Compared to Acumen Calculation:
# of Episodes
% of Episodes
Symmetry Start Date is
Symmetry End Date is
Earlier Earlier 3,323 1.00%
Same 3,730 1.12%
Later 1,319 0.40%
Same Earlier 29,624 8.89%
Same 259,643 77.91%
Later 3,960 1.19%
Later
Earlier 9,034 2.71%
Same 19,776 5.93%
Later 2,868 0.86%
Symmetry’s method for assigning dates to chronic episodes also differs from the
approach used in this report. The grouper truncates chronic care into episodes on an annual
basis, with five options for defining the start or end of the annual period. We choose the option
that defines the start month/day and sets chronic episodes to begin on the first day of a calendar
year. Symmetry’s chronic episode date assignment does not use claim dates, but instead uses the
start and end points of the annual period, so the episode length calculated by Symmetry for
chronic episodes is always one calendar year in length. Since our approach for calculating an
episode’s length uses the earliest-claim start date and latest-claim end date, our measures of
chronic episode lengths cannot be shorter than those reported by the Symmetry grouper. Table
4.4 shows that virtually every chronic episode has Symmetry-calculated start and end dates that
are respectively earlier and later than Acumen’s calculations.
Specification of Baseline Application of Symmetry Grouper to Medicare Data 34
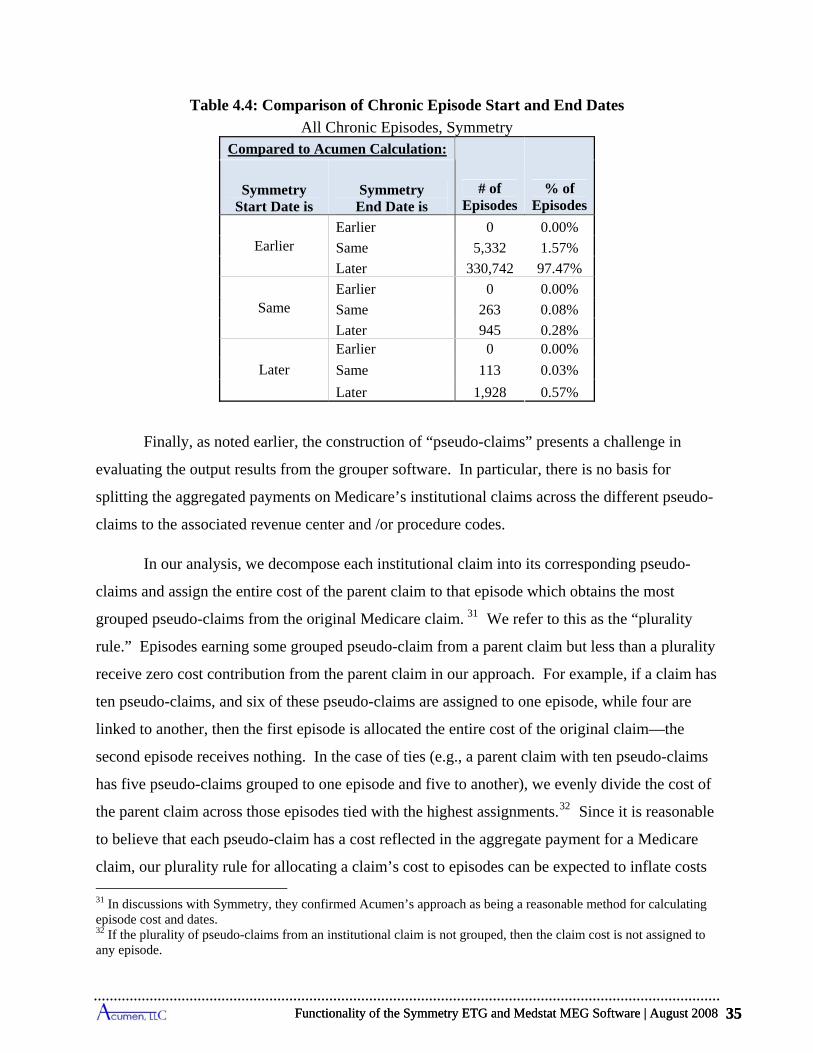
Functionality of the Symmetry ETG and Medstat MEG Software | August 2008 35
Table 4.4: Comparison of Chronic Episode Start and End Dates
All Chronic Episodes, Symmetry Compared to Acumen Calculation:
# of Episodes
% of Episodes
Symmetry Start Date is
Symmetry End Date is
Earlier Earlier 0 0.00%
Same 5,332 1.57%
Later 330,742 97.47%
Same Earlier 0 0.00%
Same 263 0.08%
Later 945 0.28%
Later
Earlier 0 0.00%
Same 113 0.03%
Later 1,928 0.57%
Finally, as noted earlier, the construction of “pseudo-claims” presents a challenge in
evaluating the output results from the grouper software. In particular, there is no basis for
splitting the aggregated payments on Medicare’s institutional claims across the different pseudo-
claims to the associated revenue center and /or procedure codes.
In our analysis, we decompose each institutional claim into its corresponding pseudo-
claims and assign the entire cost of the parent claim to that episode which obtains the most
grouped pseudo-claims from the original Medicare claim. 31 We refer to this as the “plurality
rule.” Episodes earning some grouped pseudo-claim from a parent claim but less than a plurality
receive zero cost contribution from the parent claim in our approach. For example, if a claim has
ten pseudo-claims, and six of these pseudo-claims are assigned to one episode, while four are
linked to another, then the first episode is allocated the entire cost of the original claim—the
second episode receives nothing. In the case of ties (e.g., a parent claim with ten pseudo-claims
has five pseudo-claims grouped to one episode and five to another), we evenly divide the cost of
the parent claim across those episodes tied with the highest assignments.32 Since it is reasonable
to believe that each pseudo-claim has a cost reflected in the aggregate payment for a Medicare
claim, our plurality rule for allocating a claim’s cost to episodes can be expected to inflate costs
31 In discussions with Symmetry, they confirmed Acumen’s approach as being a reasonable method for calculating episode cost and dates. 32 If the plurality of pseudo-claims from an institutional claim is not grouped, then the claim cost is not assigned to any episode.
Functionality of the Symmetry ETG and Medstat MEG Software | August 2008 35
Specification of Baseline Application of Symmetry Grouper to Medicare Data 36
for some episodes and mitigate costs for others when an institutional claim is grouped to multiple
episodes.
We explored several other methods for allocating costs across episodes in cases where
pseudo-claims from a single institutional claim were assigned to multiple episodes. These
included: (1) using shares of revenue center charges to distribute an institutional claim payment
to its multiple grouped episodes; (2) distributing the claim payment proportional to the number
of pseudo-claims from the institutional claim assigned to an episode; and (3) allocating all the
costs to the episode to which the room and board (R&B) revenue code was assigned. In the case
of IP and SNF claims, cost allocation using rule (3) based on R&B revenue codes yielded
essentially the same allotments as our plurality rule in those instances when these claims had
R&B codes.33 However, this R&B rule cannot be implemented for some IP and SNF claims
because not all have room and board codes.34 Moreover, the absence of R&B revenue codes on
OP, HH and HS claims means that rule (3) cannot be used to allocate the cost of these types of
institutional claims. As expected, the implementation of cost allocation rules (1) and (2) spreads
expenses of a parent claim more evenly across associated episodes, but none of the main findings
presented below were materially affected.
33 There is a 99.7% match rate between the R&B rule and our plurality rule for IP claims with R&B codes, and a 97.1% match rate for SNF claims with R&B codes. While nearly all SNF claims have a R&B code, almost 10% of IP claims do not. 34 A further variant of rule (3) for resolving the cost allocation issue is to input each IP and SNF institutional claim as a single record, with an R&B code listed as the lone service record. This approach was used by MedPAC in several of their evaluations of groupers (MedPAC Report to Congress, June 2006 ); this approach was implemented because MedPAC used MedPAR as the data source of IP and SNF stays which does not report revenue codes. In addition to not all the original IP and SNF claims not having R&B codes, many other have multiple R&B codes which leaves open the question of which one to include on the single input record representing the claim; in our Colorado data, we find up to 24 R&B codes on a single IP claim, and up to 3 R&B codes on a single SNF claim.
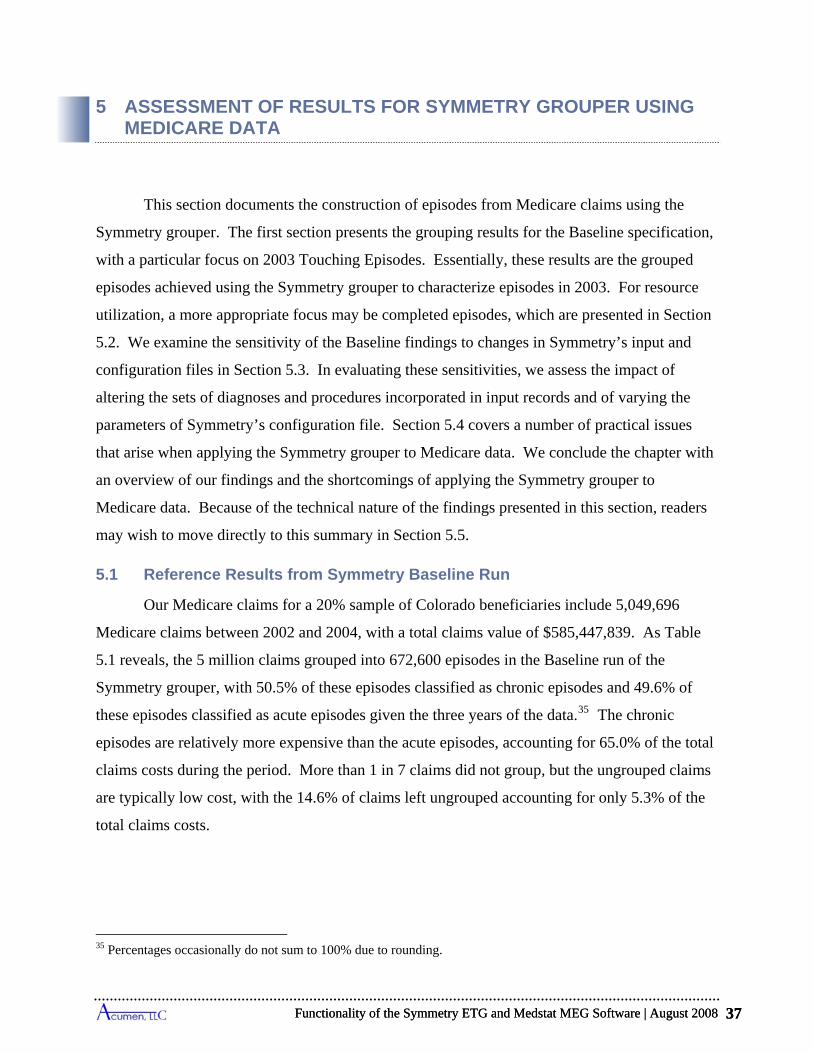
Functionality of the Symmetry ETG and Medstat MEG Software | August 2008 37
5 ASSESSMENT OF RESULTS FOR SYMMETRY GROUPER USING MEDICARE DATA
This section documents the construction of episodes from Medicare claims using the
Symmetry grouper. The first section presents the grouping results for the Baseline specification,
with a particular focus on 2003 Touching Episodes. Essentially, these results are the grouped
episodes achieved using the Symmetry grouper to characterize episodes in 2003. For resource
utilization, a more appropriate focus may be completed episodes, which are presented in Section
5.2. We examine the sensitivity of the Baseline findings to changes in Symmetry’s input and
configuration files in Section 5.3. In evaluating these sensitivities, we assess the impact of
altering the sets of diagnoses and procedures incorporated in input records and of varying the
parameters of Symmetry’s configuration file. Section 5.4 covers a number of practical issues
that arise when applying the Symmetry grouper to Medicare data. We conclude the chapter with
an overview of our findings and the shortcomings of applying the Symmetry grouper to
Medicare data. Because of the technical nature of the findings presented in this section, readers
may wish to move directly to this summary in Section 5.5.
5.1 Reference Results from Symmetry Baseline Run
Our Medicare claims for a 20% sample of Colorado beneficiaries include 5,049,696
Medicare claims between 2002 and 2004, with a total claims value of $585,447,839. As Table
5.1 reveals, the 5 million claims grouped into 672,600 episodes in the Baseline run of the
Symmetry grouper, with 50.5% of these episodes classified as chronic episodes and 49.6% of
these episodes classified as acute episodes given the three years of the data.35 The chronic
episodes are relatively more expensive than the acute episodes, accounting for 65.0% of the total
claims costs during the period. More than 1 in 7 claims did not group, but the ungrouped claims
are typically low cost, with the 14.6% of claims left ungrouped accounting for only 5.3% of the
total claims costs.
35 Percentages occasionally do not sum to 100% due to rounding.
Functionality of the Symmetry ETG and Medstat MEG Software | August 2008 37
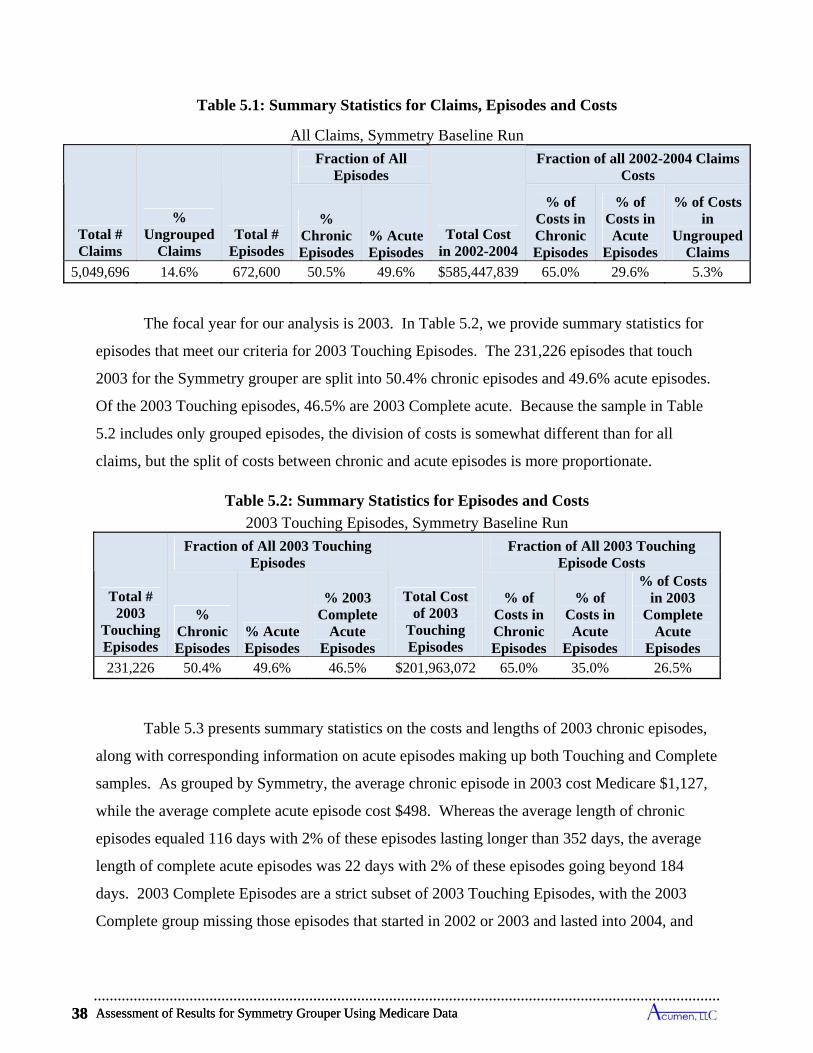
Assessment of Results for Symmetry Grouper Using Medicare Data 38
Table 5.1: Summary Statistics for Claims, Episodes and Costs
All Claims, Symmetry Baseline Run
Total # Claims
% Ungrouped
Claims Total #
Episodes
Fraction of All Episodes
Total Cost in 2002-2004
Fraction of all 2002-2004 Claims Costs
% Chronic Episodes
% Acute Episodes
% of Costs in Chronic Episodes
% of Costs in Acute
Episodes
% of Costs in
Ungrouped Claims
5,049,696 14.6% 672,600 50.5% 49.6% $585,447,839 65.0% 29.6% 5.3%
The focal year for our analysis is 2003. In Table 5.2, we provide summary statistics for
episodes that meet our criteria for 2003 Touching Episodes. The 231,226 episodes that touch
2003 for the Symmetry grouper are split into 50.4% chronic episodes and 49.6% acute episodes.
Of the 2003 Touching episodes, 46.5% are 2003 Complete acute. Because the sample in Table
5.2 includes only grouped episodes, the division of costs is somewhat different than for all
claims, but the split of costs between chronic and acute episodes is more proportionate.
Table 5.2: Summary Statistics for Episodes and Costs
2003 Touching Episodes, Symmetry Baseline Run
Total # 2003
Touching Episodes
Fraction of All 2003 Touching Episodes
Total Cost of 2003
Touching Episodes
Fraction of All 2003 Touching Episode Costs
% Chronic Episodes
% Acute Episodes
% 2003 Complete
Acute Episodes
% of Costs in Chronic Episodes
% of Costs in Acute
Episodes
% of Costs in 2003
Complete Acute
Episodes 231,226 50.4% 49.6% 46.5% $201,963,072 65.0% 35.0% 26.5%
Table 5.3 presents summary statistics on the costs and lengths of 2003 chronic episodes,
along with corresponding information on acute episodes making up both Touching and Complete
samples. As grouped by Symmetry, the average chronic episode in 2003 cost Medicare $1,127,
while the average complete acute episode cost $498. Whereas the average length of chronic
episodes equaled 116 days with 2% of these episodes lasting longer than 352 days, the average
length of complete acute episodes was 22 days with 2% of these episodes going beyond 184
days. 2003 Complete Episodes are a strict subset of 2003 Touching Episodes, with the 2003
Complete group missing those episodes that started in 2002 or 2003 and lasted into 2004, and
Assessment of Results for Symmetry Grouper Using Medicare Data 38
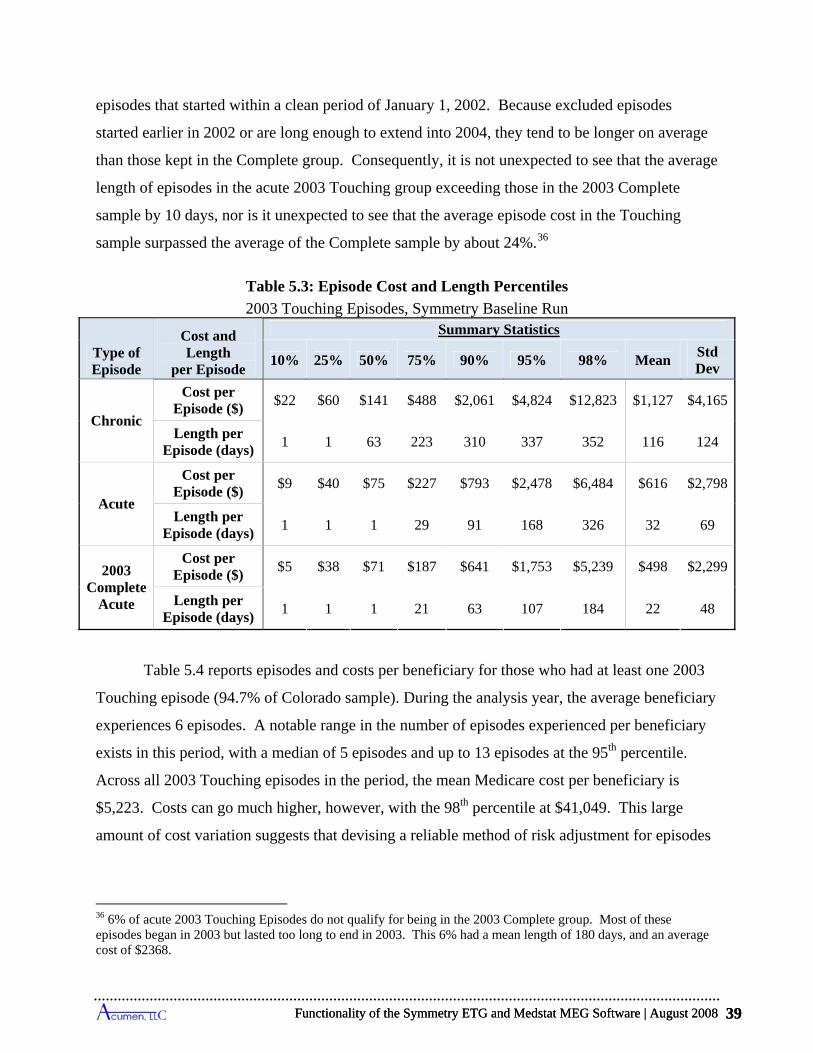
Functionality of the Symmetry ETG and Medstat MEG Software | August 2008 39
episodes that started within a clean period of January 1, 2002. Because excluded episodes
started earlier in 2002 or are long enough to extend into 2004, they tend to be longer on average
than those kept in the Complete group. Consequently, it is not unexpected to see that the average
length of episodes in the acute 2003 Touching group exceeding those in the 2003 Complete
sample by 10 days, nor is it unexpected to see that the average episode cost in the Touching
sample surpassed the average of the Complete sample by about 24%.36
Table 5.3: Episode Cost and Length Percentiles
2003 Touching Episodes, Symmetry Baseline Run
Type of Episode
Cost and Length
per Episode
Summary Statistics
10% 25% 50% 75% 90% 95% 98% Mean Std Dev
Chronic
Cost per Episode ($)
$22 $60 $141 $488 $2,061 $4,824 $12,823 $1,127 $4,165
Length per Episode (days)
1 1 63 223 310 337 352 116 124
Acute
Cost per Episode ($)
$9 $40 $75 $227 $793 $2,478 $6,484 $616 $2,798
Length per Episode (days)
1 1 1 29 91 168 326 32 69
2003 Complete
Acute
Cost per Episode ($)
$5 $38 $71 $187 $641 $1,753 $5,239 $498 $2,299
Length per Episode (days)
1 1 1 21 63 107 184 22 48
Table 5.4 reports episodes and costs per beneficiary for those who had at least one 2003
Touching episode (94.7% of Colorado sample). During the analysis year, the average beneficiary
experiences 6 episodes. A notable range in the number of episodes experienced per beneficiary
exists in this period, with a median of 5 episodes and up to 13 episodes at the 95th percentile.
Across all 2003 Touching episodes in the period, the mean Medicare cost per beneficiary is
$5,223. Costs can go much higher, however, with the 98th percentile at $41,049. This large
amount of cost variation suggests that devising a reliable method of risk adjustment for episodes
36 6% of acute 2003 Touching Episodes do not qualify for being in the 2003 Complete group. Most of these episodes began in 2003 but lasted too long to end in 2003. This 6% had a mean length of 180 days, and an average cost of $2368.
Functionality of the Symmetry ETG and Medstat MEG Software | August 2008 39
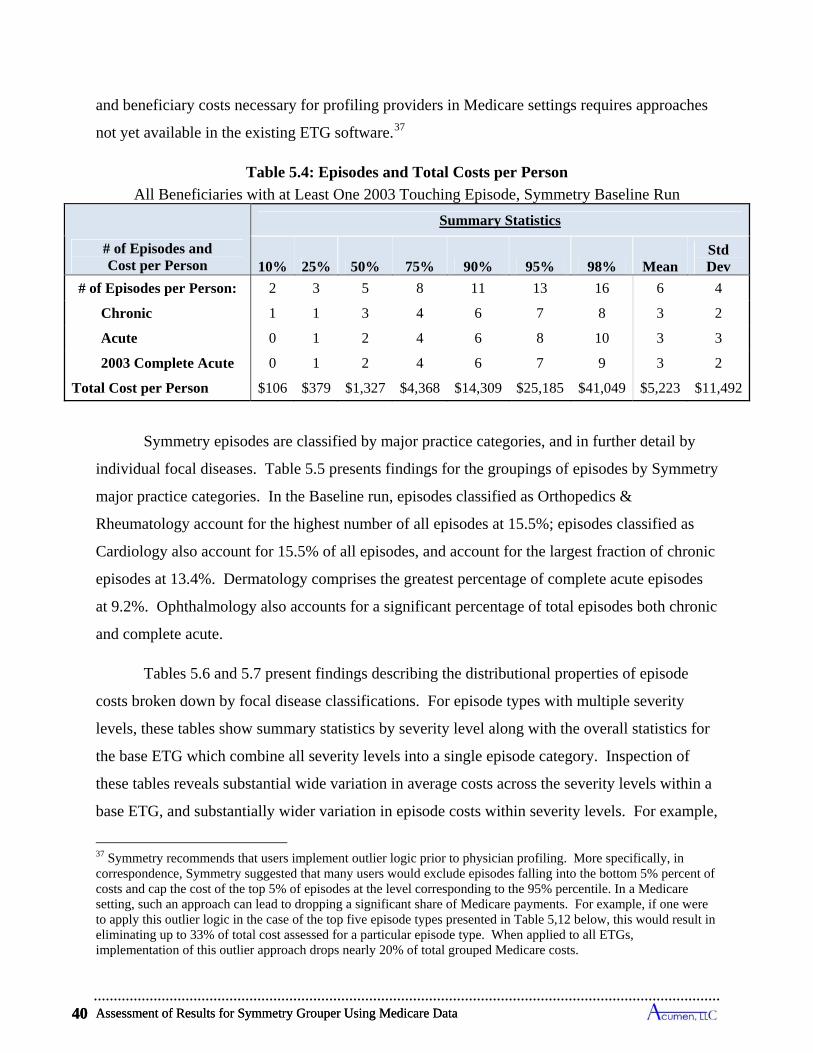
Assessment of Results for Symmetry Grouper Using Medicare Data 40
and beneficiary costs necessary for profiling providers in Medicare settings requires approaches
not yet available in the existing ETG software.37
Table 5.4: Episodes and Total Costs per Person
All Beneficiaries with at Least One 2003 Touching Episode, Symmetry Baseline Run
# of Episodes and Cost per Person
Summary Statistics
10% 25% 50% 75% 90% 95% 98% Mean Std Dev
# of Episodes per Person: 2 3 5 8 11 13 16 6 4
Chronic 1 1 3 4 6 7 8 3 2
Acute 0 1 2 4 6 8 10 3 3
2003 Complete Acute 0 1 2 4 6 7 9 3 2
Total Cost per Person $106 $379 $1,327 $4,368 $14,309 $25,185 $41,049 $5,223 $11,492
Symmetry episodes are classified by major practice categories, and in further detail by
individual focal diseases. Table 5.5 presents findings for the groupings of episodes by Symmetry
major practice categories. In the Baseline run, episodes classified as Orthopedics &
Rheumatology account for the highest number of all episodes at 15.5%; episodes classified as
Cardiology also account for 15.5% of all episodes, and account for the largest fraction of chronic
episodes at 13.4%. Dermatology comprises the greatest percentage of complete acute episodes
at 9.2%. Ophthalmology also accounts for a significant percentage of total episodes both chronic
and complete acute.
Tables 5.6 and 5.7 present findings describing the distributional properties of episode
costs broken down by focal disease classifications. For episode types with multiple severity
levels, these tables show summary statistics by severity level along with the overall statistics for
the base ETG which combine all severity levels into a single episode category. Inspection of
these tables reveals substantial wide variation in average costs across the severity levels within a
base ETG, and substantially wider variation in episode costs within severity levels. For example,
37 Symmetry recommends that users implement outlier logic prior to physician profiling. More specifically, in correspondence, Symmetry suggested that many users would exclude episodes falling into the bottom 5% percent of costs and cap the cost of the top 5% of episodes at the level corresponding to the 95% percentile. In a Medicare setting, such an approach can lead to dropping a significant share of Medicare payments. For example, if one were to apply this outlier logic in the case of the top five episode types presented in Table 5,12 below, this would result in eliminating up to 33% of total cost assessed for a particular episode type. When applied to all ETGs, implementation of this outlier approach drops nearly 20% of total grouped Medicare costs.
Assessment of Results for Symmetry Grouper Using Medicare Data 40
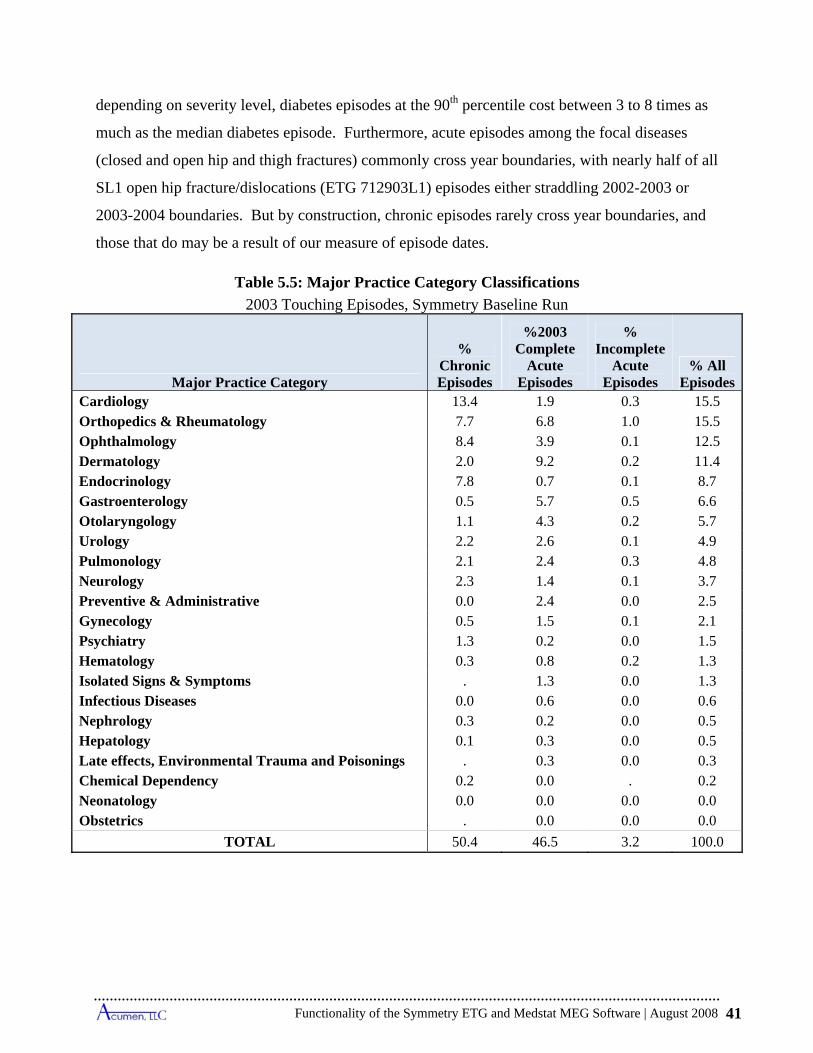
Functionality of the Symmetry ETG and Medstat MEG Software | August 2008 41
depending on severity level, diabetes episodes at the 90th percentile cost between 3 to 8 times as
much as the median diabetes episode. Furthermore, acute episodes among the focal diseases
(closed and open hip and thigh fractures) commonly cross year boundaries, with nearly half of all
SL1 open hip fracture/dislocations (ETG 712903L1) episodes either straddling 2002-2003 or
2003-2004 boundaries. But by construction, chronic episodes rarely cross year boundaries, and
those that do may be a result of our measure of episode dates.
Table 5.5: Major Practice Category Classifications
2003 Touching Episodes, Symmetry Baseline Run
Major Practice Category
% Chronic Episodes
%2003 Complete
Acute Episodes
% Incomplete
Acute Episodes
% All Episodes
Cardiology 13.4 1.9 0.3 15.5 Orthopedics & Rheumatology 7.7 6.8 1.0 15.5 Ophthalmology 8.4 3.9 0.1 12.5 Dermatology 2.0 9.2 0.2 11.4 Endocrinology 7.8 0.7 0.1 8.7 Gastroenterology 0.5 5.7 0.5 6.6 Otolaryngology 1.1 4.3 0.2 5.7 Urology 2.2 2.6 0.1 4.9 Pulmonology 2.1 2.4 0.3 4.8 Neurology 2.3 1.4 0.1 3.7 Preventive & Administrative 0.0 2.4 0.0 2.5 Gynecology 0.5 1.5 0.1 2.1 Psychiatry 1.3 0.2 0.0 1.5 Hematology 0.3 0.8 0.2 1.3 Isolated Signs & Symptoms . 1.3 0.0 1.3 Infectious Diseases 0.0 0.6 0.0 0.6 Nephrology 0.3 0.2 0.0 0.5 Hepatology 0.1 0.3 0.0 0.5 Late effects, Environmental Trauma and Poisonings . 0.3 0.0 0.3 Chemical Dependency 0.2 0.0 . 0.2 Neonatology 0.0 0.0 0.0 0.0 Obstetrics . 0.0 0.0 0.0
TOTAL 50.4 46.5 3.2 100.0
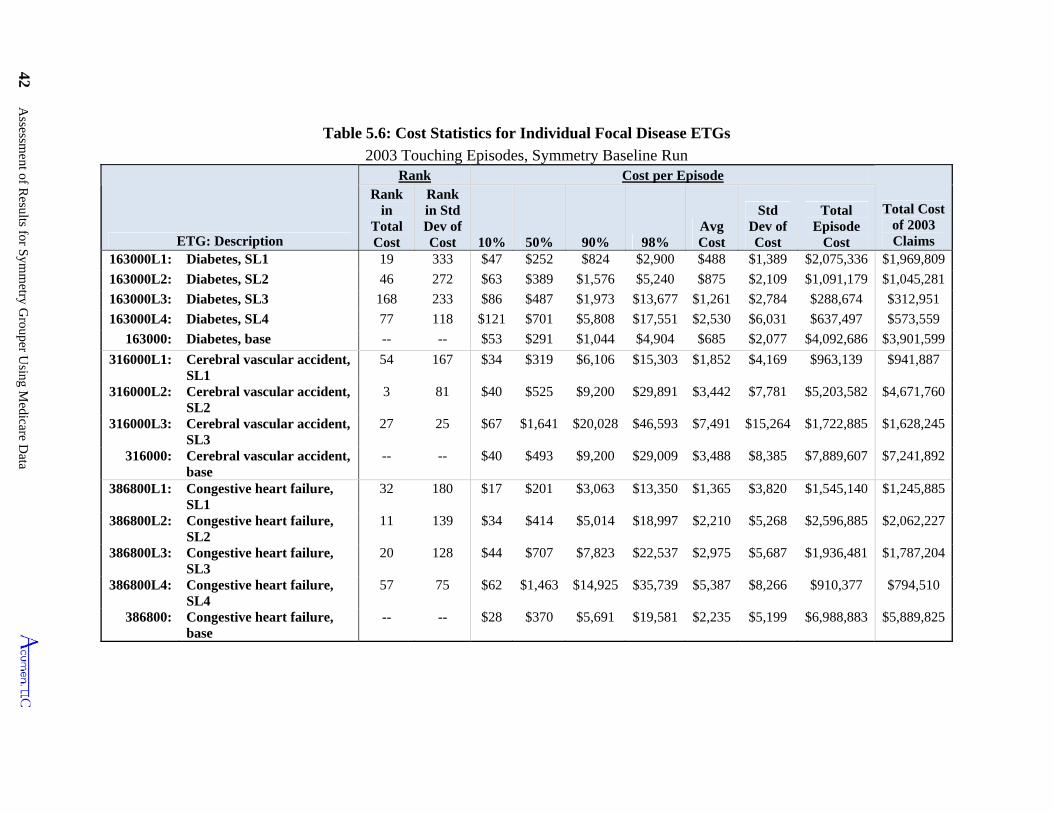
42 Assessm
ent of Results for S
ymm
etry Grouper U
sing Medicare D
ata
Table 5.6: Cost Statistics for Individual Focal Disease ETGs
2003 Touching Episodes, Symmetry Baseline Run
ETG: Description
Rank Cost per Episode
Total Cost of 2003 Claims
Rank in
Total Cost
Rank in Std Dev of Cost 10% 50% 90% 98%
Avg Cost
Std Dev of Cost
Total Episode
Cost 163000L1: Diabetes, SL1 19 333 $47 $252 $824 $2,900 $488 $1,389 $2,075,336 $1,969,809
163000L2: Diabetes, SL2 46 272 $63 $389 $1,576 $5,240 $875 $2,109 $1,091,179 $1,045,281
163000L3: Diabetes, SL3 168 233 $86 $487 $1,973 $13,677 $1,261 $2,784 $288,674 $312,951
163000L4: Diabetes, SL4 77 118 $121 $701 $5,808 $17,551 $2,530 $6,031 $637,497 $573,559
163000: Diabetes, base -- -- $53 $291 $1,044 $4,904 $685 $2,077 $4,092,686 $3,901,599
316000L1: Cerebral vascular accident, SL1
54 167 $34 $319 $6,106 $15,303 $1,852 $4,169 $963,139 $941,887
316000L2: Cerebral vascular accident, SL2
3 81 $40 $525 $9,200 $29,891 $3,442 $7,781 $5,203,582 $4,671,760
316000L3: Cerebral vascular accident, SL3
27 25 $67 $1,641 $20,028 $46,593 $7,491 $15,264 $1,722,885 $1,628,245
316000: Cerebral vascular accident, base
-- -- $40 $493 $9,200 $29,009 $3,488 $8,385 $7,889,607 $7,241,892
386800L1: Congestive heart failure, SL1
32 180 $17 $201 $3,063 $13,350 $1,365 $3,820 $1,545,140 $1,245,885
386800L2: Congestive heart failure, SL2
11 139 $34 $414 $5,014 $18,997 $2,210 $5,268 $2,596,885 $2,062,227
386800L3: Congestive heart failure, SL3
20 128 $44 $707 $7,823 $22,537 $2,975 $5,687 $1,936,481 $1,787,204
386800L4: Congestive heart failure, SL4
57 75 $62 $1,463 $14,925 $35,739 $5,387 $8,266 $910,377 $794,510
386800: Congestive heart failure, base
-- -- $28 $370 $5,691 $19,581 $2,235 $5,199 $6,988,883 $5,889,825
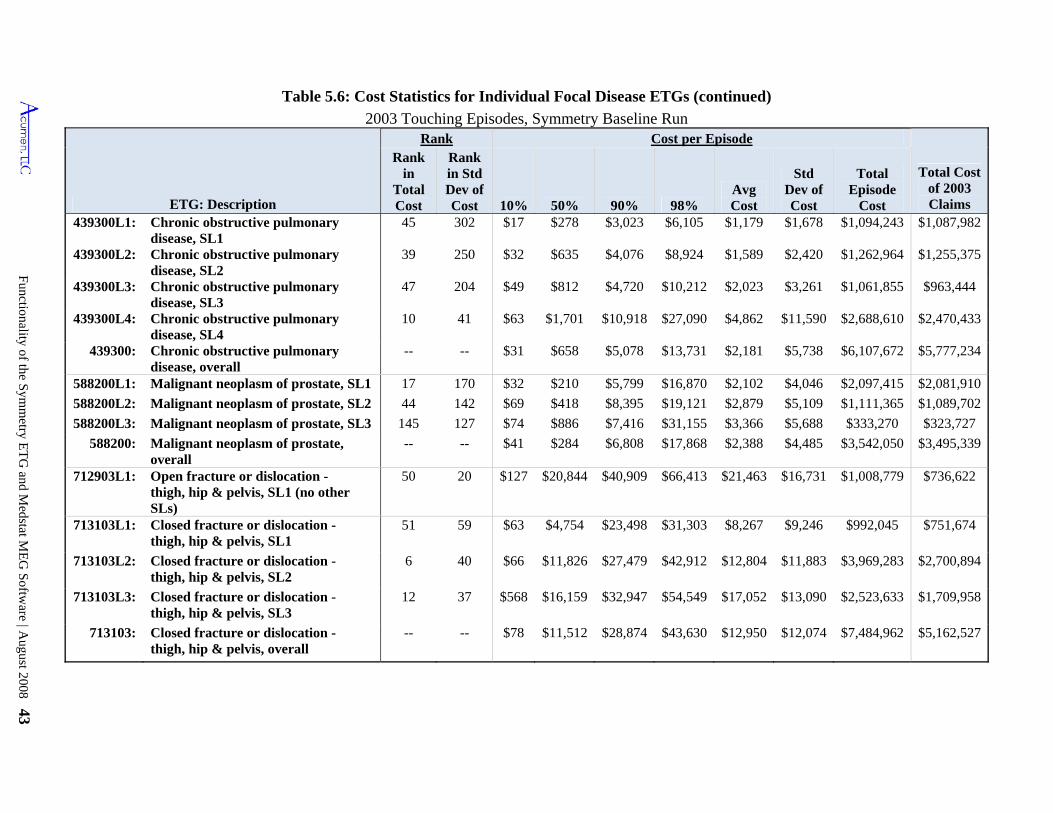
Functionality of the S
ymm
etry ET
G and M
edstat ME
G S
oftware | A
ugust 2008 43
Rank in Std Dev of Cost 10%
45
Chronic obstructive pulmonary disease, SL2
39
439300L4: $2,470,433
$6,107,672 $5,777,234
$4,046
$2,879 $5,109
$6,808 $17,868
$20,844
$63 $4,754
40
Table 5.6: Cost Statistics for Individual Focal Disease ETGs (continued)
2003 Touching Episodes, Symmetry Baseline Run Rank Cost per Episode
$11,826 $27,479 $42,912 $12,804 $11,883 $3,969,283 $2,700,894
713103L3: Closed fracture or dislocation - thigh, hip & pelvis, SL3
12 37 $568 $16,159 $32,947 $54,549 $17,052 $13,090 $2,523,633 $1,709,958
713103: Closed fracture or dislocation - thigh, hip & pelvis, overall
-- -- $78 $11,512 $28,874 $43,630 $12,950 $12,074 $7,484,962 $5,162,527
ETG: Description
Total Cost of 2003 Claims 50% 90% 98%
Avg Cost
Std Dev of Cost
Total Episode
Cost 439300L1: 302 $17 $278 $3,023 $6,105 $1,179 $1,678 $1,094,243 $1,087,982
250 $32 $635 $4,076 $8,924 $1,589 $2,420 $1,262,964 $1,255,375
439300L3: Chronic obstructive pulmonary disease, SL3
47 204 $49 $812 $4,720 $10,212 $2,023 $3,261 $1,061,855
Chronic obstructive pulmonary disease, SL4
10 41 $63 $1,701 $10,918 $27,090 $4,862 $11,590
439300: Chronic obstructive pulmonary disease, overall
-- -- $31 $658 $5,078 $13,731 $2,181
588200L1: Malignant neoplasm of prostate, SL1 17 170 $32 $210 $5,799 $16,870 $2,097,415 $2,081,910
588200L2: Malignant neoplasm of prostate, SL2 44 142 $69 $418 $8,395 $1,111,365 $1,089,702
588200L3: Malignant neoplasm of prostate, SL3 145 127 $74 $886 $31,155 $3,366 $5,688 $333,270 $323,727
588200: Malignant neoplasm of prostate, overall
-- -- $41 $2,388 $4,485 $3,542,050 $3,495,339
712903L1: Open fracture or dislocation - thigh, hip & pelvis, SL1 (no other SLs)
50 20 $40,909 $66,413 $21,463 $16,731 $1,008,779 $736,622
713103L1: Closed fracture or dislocation - thigh, hip & pelvis, SL1
51 $23,498 $31,303 $8,267 $9,246 $992,045 $751,674
713103L2: Closed fracture or dislocation - thigh, hip & pelvis, SL2
$66
Rank in
Total Cost
Chronic obstructive pulmonary disease, SL1
439300L2:
$963,444
$2,688,610
$5,738
$2,102
$19,121
$7,416
$284
$127
59
6
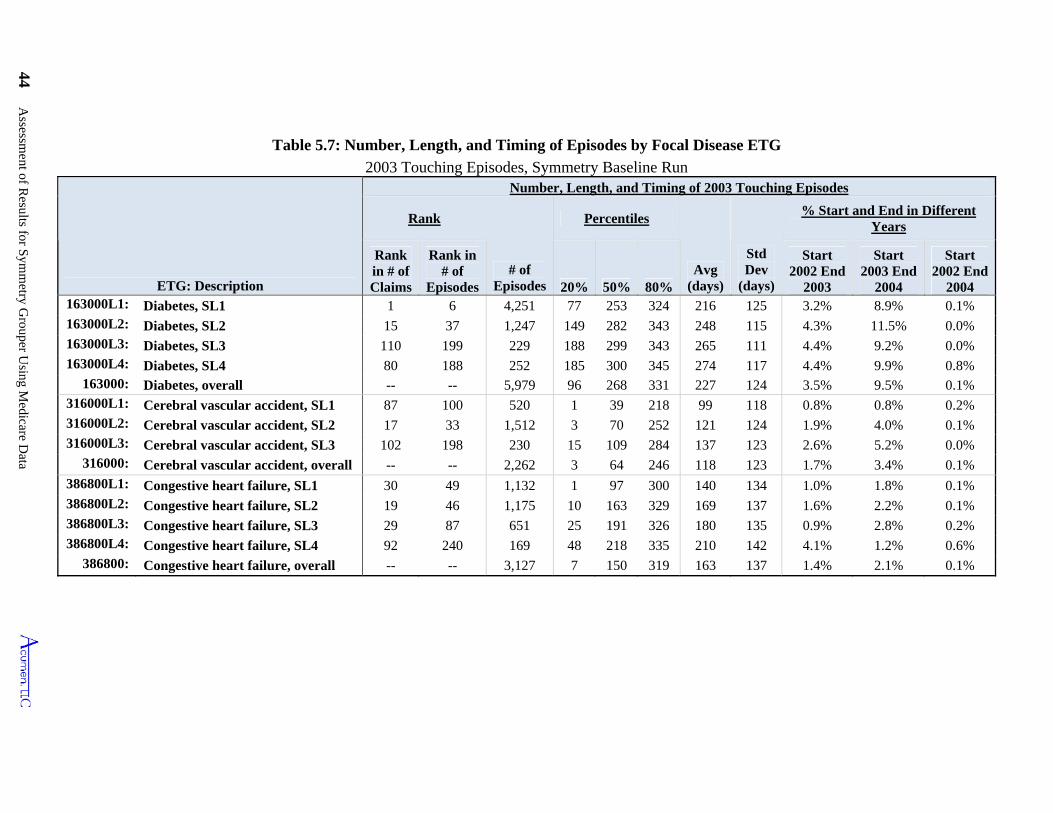
44 Assessm
ent of Results for S
ymm
etry Grouper U
sing Medicare D
ata
50%
Table 5.7: Number, Length, and Timing of Episodes by Focal Disease ETG
2003 Touching Episodes, Symmetry Baseline Run
ETG: Description
Number, Length, and Timing of 2003 Touching Episodes
Rank
# of Episodes
Percentiles
Avg (days)
Std Dev
(days)
% Start and End in Different Years
Rank in # of Claims
Rank in # of
Episodes 20% 80%
Start 2002 End
2003
Start 2003 End
2004
Start 2002 End
2004 163000L1: Diabetes, SL1 1 6 4,251 77 253 324 216 125 3.2% 8.9% 0.1% 163000L2: Diabetes, SL2 15 37 1,247 149 282 343 248 115 4.3% 11.5% 0.0% 163000L3: Diabetes, SL3 110 199 229 188 299 343 265 111 4.4% 9.2% 0.0% 163000L4: Diabetes, SL4 80 188 252 185 300 345 274 117 4.4% 9.9% 0.8%
163000: Diabetes, overall -- -- 5,979 96 268 331 227 124 3.5% 9.5% 0.1% 316000L1: Cerebral vascular accident, SL1 87 100 520 1 39 218 99 118 0.8% 0.8% 0.2% 316000L2: Cerebral vascular accident, SL2 17 33 1,512 3 70 252 121 124 1.9% 4.0% 0.1% 316000L3: Cerebral vascular accident, SL3 102 198 230 15 109 284 137 123 2.6% 5.2% 0.0%
316000: Cerebral vascular accident, overall -- -- 2,262 3 64 246 118 123 1.7% 3.4% 0.1% 386800L1: Congestive heart failure, SL1 30 49 1,132 1 97 300 140 134 1.0% 1.8% 0.1% 386800L2: Congestive heart failure, SL2 19 46 1,175 10 163 329 169 137 1.6% 2.2% 0.1% 386800L3: Congestive heart failure, SL3 29 87 651 25 191 326 180 135 0.9% 2.8% 0.2% 386800L4: Congestive heart failure, SL4 92 240 169 48 218 335 210 142 4.1% 1.2% 0.6%
386800: Congestive heart failure, overall -- -- 3,127 7 150 319 163 137 1.4% 2.1% 0.1%
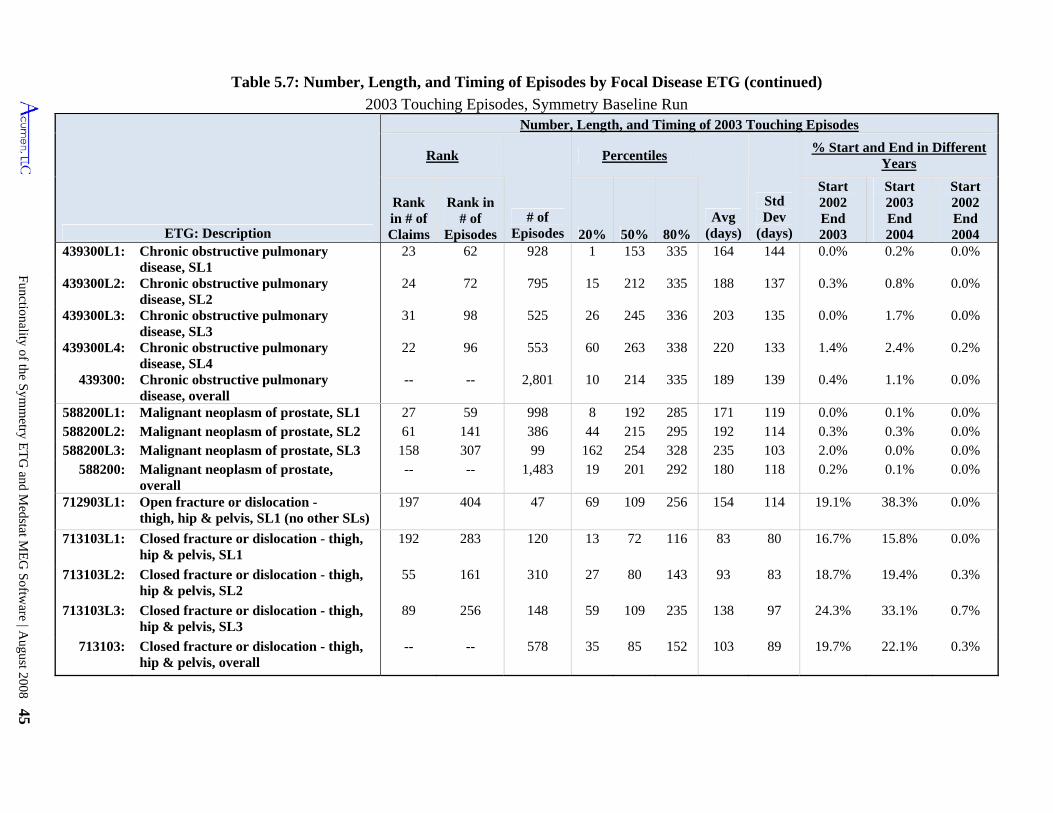
Functionality of the S
ymm
etry ET
G and M
edstat ME
G S
oftware | A
ugust 2008 45
20%
Table 5.7: Number, Length, and Timing of Episodes by Focal Disease ETG (continued)
2003 Touching Episodes, Symmetry Baseline Run
ETG: Description
Number, Length, and Timing of 2003 Touching Episodes
Rank
# of Episodes
Percentiles
Avg (days)
Std Dev
(days)
% Start and End in Different Years
Rank in # of Claims
Rank in # of
Episodes 50% 80%
Start 2002 End 2003
Start 2003 End 2004
Start 2002 End 2004
439300L1: Chronic obstructive pulmonary disease, SL1
23 62 928 1 153 335 164 144 0.0% 0.2% 0.0%
439300L2: Chronic obstructive pulmonary disease, SL2
24 72 795 15 212 335 188 137 0.3% 0.8% 0.0%
439300L3: Chronic obstructive pulmonary disease, SL3
31 98 525 26 245 336 203 135 0.0% 1.7% 0.0%
439300L4: Chronic obstructive pulmonary disease, SL4
22 96 553 60 263 338 220 133 1.4% 2.4% 0.2%
439300: Chronic obstructive pulmonary disease, overall
-- -- 2,801 10 214 335 189 139 0.4% 1.1% 0.0%
588200L1: Malignant neoplasm of prostate, SL1 27 59 998 8 192 285 171 119 0.0% 0.1% 0.0% 588200L2: Malignant neoplasm of prostate, SL2 61 141 386 44 215 295 192 114 0.3% 0.3% 0.0% 588200L3: Malignant neoplasm of prostate, SL3 158 307 99 162 254 328 235 103 2.0% 0.0% 0.0%
588200: Malignant neoplasm of prostate, overall
-- -- 1,483 19 201 292 180 118 0.2% 0.1% 0.0%
712903L1: Open fracture or dislocation - thigh, hip & pelvis, SL1 (no other SLs)
197 404 47 69 109 256 154 114 19.1% 38.3% 0.0%
713103L1: Closed fracture or dislocation - thigh, hip & pelvis, SL1
192 283 120 13 72 116 83 80 16.7% 15.8% 0.0%
713103L2: Closed fracture or dislocation - thigh, hip & pelvis, SL2
55 161 310 27 80 143 93 83 18.7% 19.4% 0.3%
713103L3: Closed fracture or dislocation - thigh, hip & pelvis, SL3
89 256 148 59 109 235 138 97 24.3% 33.1% 0.7%
713103: Closed fracture or dislocation - thigh, hip & pelvis, overall
-- -- 578 35 85 152 103 89 19.7% 22.1% 0.3%
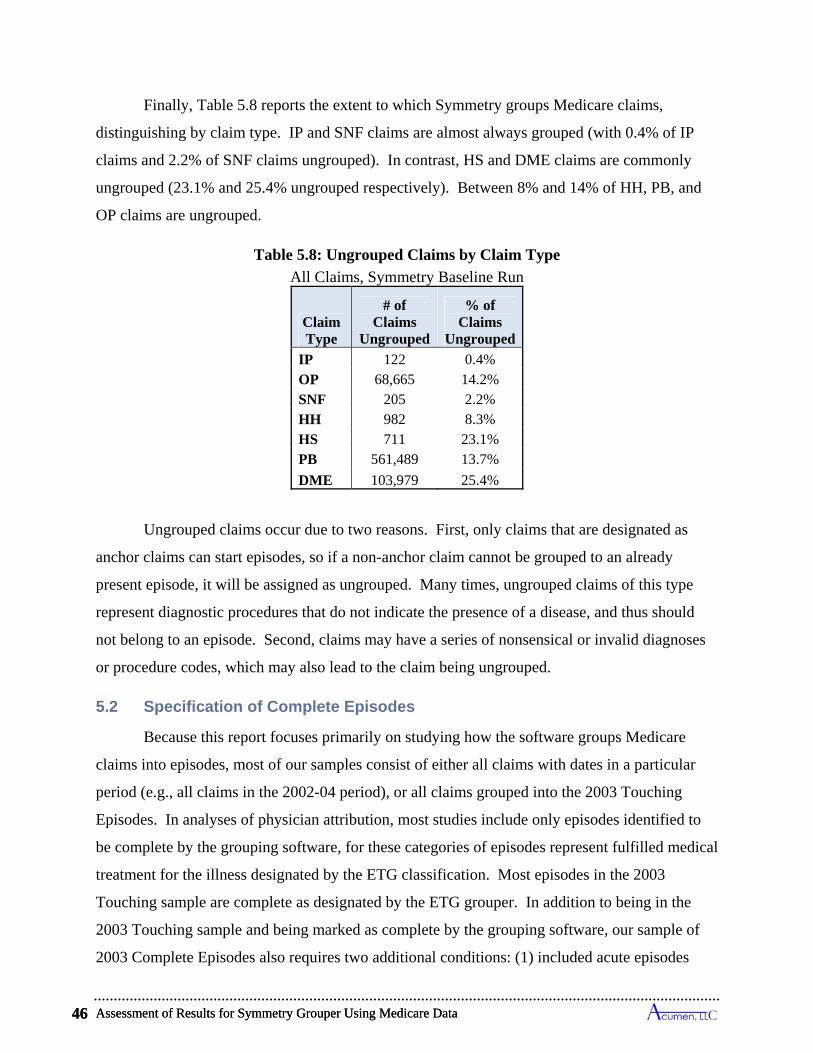
Assessment of Results for Symmetry Grouper Using Medicare Data 46
Finally, Table 5.8 reports the extent to which Symmetry groups Medicare claims,
distinguishing by claim type. IP and SNF claims are almost always grouped (with 0.4% of IP
claims and 2.2% of SNF claims ungrouped). In contrast, HS and DME claims are commonly
ungrouped (23.1% and 25.4% ungrouped respectively). Between 8% and 14% of HH, PB, and
OP claims are ungrouped.
Table 5.8: Ungrouped Claims by Claim Type
All Claims, Symmetry Baseline Run
Claim Type
# of Claims
Ungrouped
% of Claims
Ungrouped
IP 122 0.4% OP 68,665 14.2% SNF 205 2.2% HH 982 8.3% HS 711 23.1% PB 561,489 13.7%
DME 103,979 25.4%
Ungrouped claims occur due to two reasons. First, only claims that are designated as
anchor claims can start episodes, so if a non-anchor claim cannot be grouped to an already
present episode, it will be assigned as ungrouped. Many times, ungrouped claims of this type
represent diagnostic procedures that do not indicate the presence of a disease, and thus should
not belong to an episode. Second, claims may have a series of nonsensical or invalid diagnoses
or procedure codes, which may also lead to the claim being ungrouped.
5.2 Specification of Complete Episodes
Because this report focuses primarily on studying how the software groups Medicare
claims into episodes, most of our samples consist of either all claims with dates in a particular
period (e.g., all claims in the 2002-04 period), or all claims grouped into the 2003 Touching
Episodes. In analyses of physician attribution, most studies include only episodes identified to
be complete by the grouping software, for these categories of episodes represent fulfilled medical
treatment for the illness designated by the ETG classification. Most episodes in the 2003
Touching sample are complete as designated by the ETG grouper. In addition to being in the
2003 Touching sample and being marked as complete by the grouping software, our sample of
2003 Complete Episodes also requires two additional conditions: (1) included acute episodes
Assessment of Results for Symmetry Grouper Using Medicare Data 46
Functionality of the Symmetry ETG and Medstat MEG Software | August 2008 47
must have started longer than a clean period after January 1, 2002 and must have ended in 2003;
and (2) chronic episodes must have ended in 2003. Consequently, our sample of 2003 Complete
Episodes eliminates episodes that do not have a well defined start and episodes that start in 2002
or 2003 and do not end until 2004; most of these eliminated episodes become members of the
2004 Complete sample. As discussed further below, the group of 2003 Complete Episodes
provides a sample that is representative of the cost of finalized medical treatments for the year
2003.
Table 5.9 demonstrates the role of the clean periods in defining the share of 2003
Touching Episodes that we include in 2003 Complete Episodes. The top half of Table 5.9
presents summary statistics on the top 10 acute ETGs by cost. The first column lists the rank by
cost considering all episode types, and the second column shows the number of episodes for each
ETG in the 2003 Touching sample. The next column presents the fraction of 2003 Touching
episodes that start within a clean period of January 1st, 2002—the length of the relevant clean
period varies by ETG—and shows that only a small share of 2003 Touching episodes are
dropped by this requirement for defining our formulation of Complete episodes. Nine of the top
10 ETGs by cost have 3% or fewer of their episodes with a start date within a clean period of
January 1st, 2002. The exception is pulmonary embolism episodes, of which nearly 13% do not
meet either Symmetry’s or our definition of complete. The fourth column presents statistics on
the fraction of episodes that are separated from other episodes of the same type by less than a
clean period for the respective ETG, and the fifth column gives the number of episodes of the
same ETG that overlap in time. Using the service dates of claims included in an episode to
determine its start and finish, we do find episodes starting within a clean period of another
episode of the same ETG.38 Depending on the type of acute ETG considered in the table,
between 0.6% and 35.4% of the same-type episodes occur within clean periods. In some rare
instances, these episodes can even overlap, meaning that the start date we identify for an episode
occurs before an end date for an episode of the same ETG.
The lower half of Table 5.9 presents equivalent statistics for chronic episodes. It is clear
from the statistics in the fourth column that the concept of clean periods is not applicable for
38 The start and end dates of an ETG episode assigned by the Symmetry grouper can be defined by anchor claims that are not assigned to the episode. So the starts and ends as measured by Symmetry need not violate the clean period when our dating measure documents a violation.
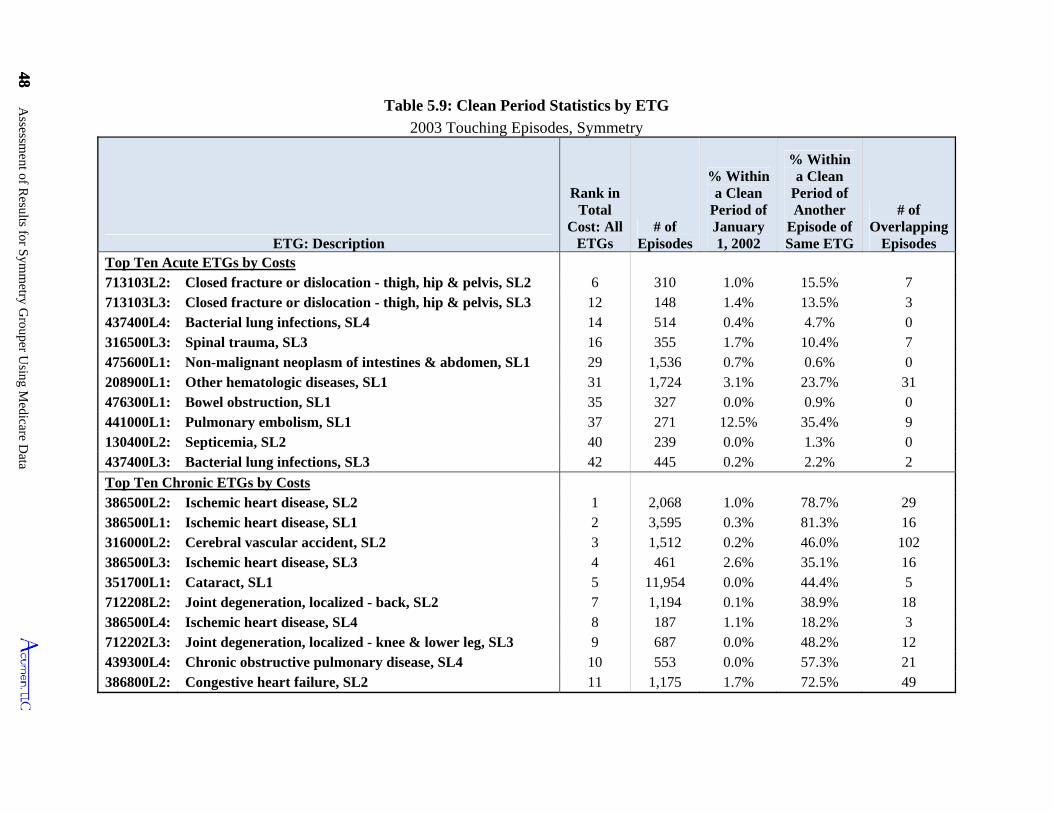
48 Assessm
ent of Results for S
ymm
etry Grouper U
sing Medicare D
ata
48
Table 5.9: Clean Period Statistics by ETG
2003 Touching Episodes, Symmetry
ETG: Description
Rank in Total
Cost: All ETGs
# of Episodes
% Within a Clean
Period of January 1, 2002
% Within a Clean
Period of Another
Episode of Same ETG
# of Overlapping
Episodes Top Ten Acute ETGs by Costs 713103L2: Closed fracture or dislocation - thigh, hip & pelvis, SL2 6 310 1.0% 15.5% 7 713103L3: Closed fracture or dislocation - thigh, hip & pelvis, SL3 12 148 1.4% 13.5% 3 437400L4: Bacterial lung infections, SL4 14 514 0.4% 4.7% 0 316500L3: Spinal trauma, SL3 16 355 1.7% 10.4% 7 475600L1: Non-malignant neoplasm of intestines & abdomen, SL1 29 1,536 0.7% 0.6% 0 208900L1: Other hematologic diseases, SL1 31 1,724 3.1% 23.7% 31 476300L1: Bowel obstruction, SL1 35 327 0.0% 0.9% 0 441000L1: Pulmonary embolism, SL1 37 271 12.5% 35.4% 9 130400L2: Septicemia, SL2 40 239 0.0% 1.3% 0 437400L3: Bacterial lung infections, SL3 42 445 0.2% 2.2% 2
Top Ten Chronic ETGs by Costs 386500L2: Ischemic heart disease, SL2 1 2,068 1.0% 78.7% 29 386500L1: Ischemic heart disease, SL1 2 3,595 0.3% 81.3% 16 316000L2: Cerebral vascular accident, SL2 3 1,512 0.2% 46.0% 102 386500L3: Ischemic heart disease, SL3 4 461 2.6% 35.1% 16 351700L1: Cataract, SL1 5 11,954 0.0% 44.4% 5 712208L2: Joint degeneration, localized - back, SL2 7 1,194 0.1% 38.9% 18 386500L4: Ischemic heart disease, SL4 8 187 1.1% 18.2% 3 712202L3: Joint degeneration, localized - knee & lower leg, SL3 9 687 0.0% 48.2% 12 439300L4: Chronic obstructive pulmonary disease, SL4 10 553 0.0% 57.3% 21 386800L2: Congestive heart failure, SL2 11 1,175 1.7% 72.5% 49
chronic episodes.39 For the vast majority of afflicted individuals, one chronic episode
immediately follows another. Among the top ten highest-cost chronic ETGs, chronic episodes of
the same ETG run as continuous events for individuals between 18% and 81% of the time
depending on the type of chronic condition. The observation of overlapping episodes, as well as
episodes starting less than one year after January 1, 2002 (since the clean periods are at most 365
days in Symmetry), is likely related to our calculation of dates. Among chronic ETG episodes
that have a significant share of their costs in 2003, only a tiny fraction of claims occur outside of
2003 by our dates. For example, among chronic episodes with at least 90% of their claim costs
in 2003, less than 0.5% of claims have dates in 2002 or 2004.
Drawing upon theorems in the statistical literature on duration analysis, one can interpret
the sample of 2003 Complete Episodes, for any individual or combination of ETGs, as being
representative of the composition of finalized incidents of medical treatments for the year 2003.
When faced with episodic data, an analyst can construct a representative sample by selecting
either all those episodes that start within a specified period or all those that end in this period. If
one instead considers all episodes that overlap a period, then it is well known that the resulting
sample will disproportionately include longer and more costly episodes, for these episodes have
an exaggerated likelihood of being included in the sample.40 The group of Touching Episodes is
such a sample, and for this reason it is not surprising to see its statistics overestimate costs and
lengths of episodes.41
For each ETG, the costs of 2003 Complete Episodes closely approximate the annual cost
of claims in 2003 that were grouped to the corresponding ETG. Table 5.10 supports this finding
for chronic episodes, and Table 5.11 presents analogous support for acute episodes. As
discussed previously, the claims linked to chronic episodes ending in 2003 are nearly equivalent
to the annual claims grouped to these chronic illnesses in 2003, so it is hardly surprising in Table
5.10 to see that annual and Complete episode costs closely mirror one another.42 Although one
observes some variation by ETG, the costs in 2003 Complete Episodes totals to 99% of the
39 Although Symmetry truncates chronic episodes on an annual basis and does not use clean periods to separate chronic diseases into episodes of care, the Symmetry documentation does provide clean period information for chronic ETGs. We used the provided clean period from Symmetry’s documentation in creating this table. 40 In the statistical duration literature, this problem is known as length-biased sampling. 41 Footnote 36 and Tables 5.10 and 5.11 illustrate the degree to which the Touching Episodes sample overestimates per episode costs of medical treatment overall and for particular ETGs. 42 2003 annual claims are defined by start date on claim.
Functionality of the Symmetry ETG and Medstat MEG Software | August 2008 49
Assessment of Results for Symmetry Grouper Using Medicare Data 50
annual claims costs. The costs of Touching episodes always exceeds annual costs since it
includes episodes that extend both into 2002 and 2004 as defined by our episode date
calculations.
Referring to Table 5.11, we see that the costs of 2003 Complete Episodes also closely
proxy the 2003 annual claims costs for acute ETGs as well. Although 2003 Complete Episodes
for acute ETGs include a substantial share of claims in 2002, these costs are offset by costs for
episodes that started in 2003 and did not end until 2004 or later. For the most expensive ten
acute episode types, we see that the 2003 Complete Episode costs are sometimes higher and
sometimes lower than 2003 annual costs for the corresponding ETG; the costs of Touching
Episodes are substantially higher than either Complete or annual costs due to the inclusion of
episodes that overlap both 2002 and 2004. Combining costs for all acute ETGs, we see at the
bottom of the table that the cost in 2003 Complete Episodes is slightly lower than the 2003
annual costs, but still represents over 93% of 2003 expenditures.
Table 5.12 presents statistics depicting the distribution of per episode costs for the top-5-
cost acute ETGs, the top-5 chronic ETGs, and for all ETGs combined reported at the bottom of
the table. These statistics show the mean and standard deviation for the sample of 2003
Complete episodes, along with several percentiles of the distributions to convey the extent of
variation in costs across episodes within ETG classifications. The distributions exhibit
substantial dispersion in costs across episodes within each ETG. For each of the top five
highest-cost acute and chronic ETGs, the level of cost demarking the most expensive 10% of
episodes (i.e., the 90th percentile) always exceeds the level demarking the cheapest 10% (i.e., the
10th percentile) by more than a factor of four, and in most instances more than two orders of
magnitude larger. The table further reveals that the highest-cost episodes account for large
shares of total ETG costs. The top 5% of episodes in these acute ETGs account for 15.4% to
41.7% of all costs in that ETG. The distribution is even wider for the most expensive chronic
ETGs, where the top 10% of episodes cost at least 100 times the cost of the cheapest 10%. For
these chronic ETGs, the top 5% of episodes account for 26% to 50% of the costs of that ETG.
Considering the total costs across all ETGs, the last row and column shows that 67.4% of these
costs are incurred by the most expensive 5% of episodes. Overall, Table 5.12 demonstrates that
considerable variation exists in the costs of individual episodes within an ETG.
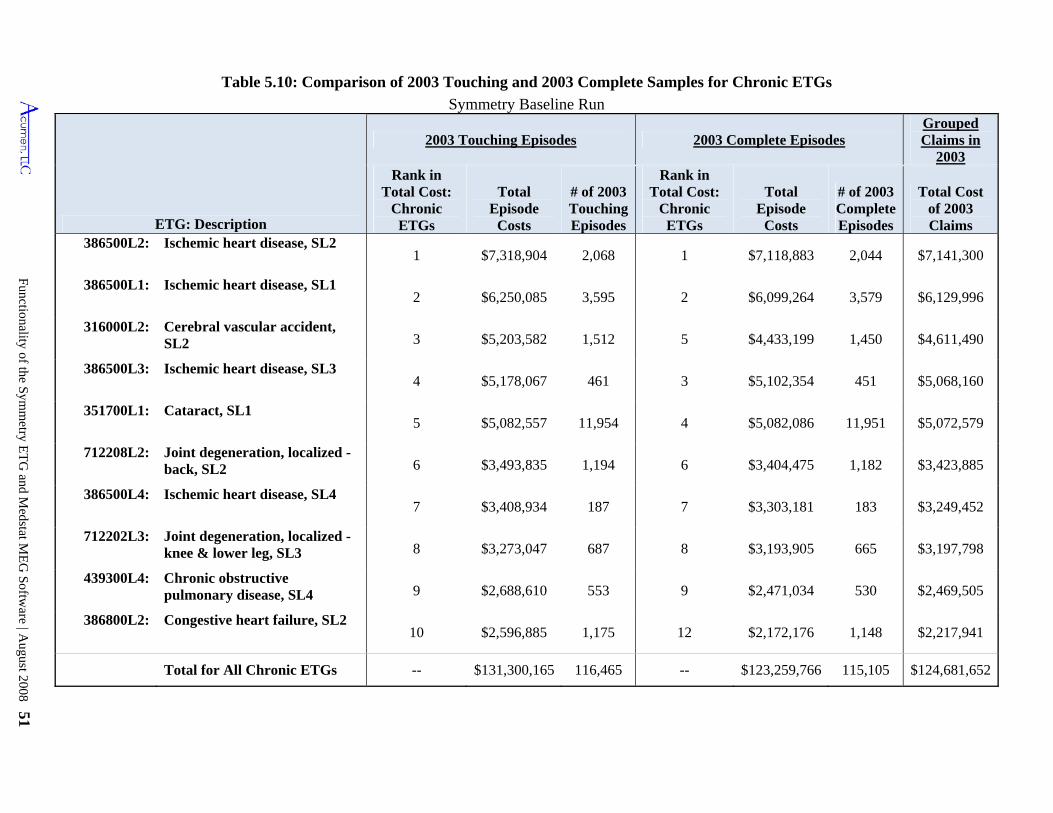
Functionality of the Symm
etry ET
G and M
edstat ME
G Softw
are | August 2008 51
Table 5.10: Comparison of 2003 Touching and 2003 Complete Samples for Chronic ETGs
Symmetry Baseline Run
ETG: Description
2003 Touching Episodes 2003 Complete Episodes Grouped Claims in
2003 Rank in
Total Cost: Chronic
ETGs
Total Episode
Costs
# of 2003 Touching Episodes
Rank in Total Cost:
Chronic ETGs
Total Episode
Costs
# of 2003 Complete Episodes
Total Cost of 2003 Claims
386500L2: Ischemic heart disease, SL2 1 $7,318,904 2,068 1 $7,118,883 2,044 $7,141,300
386500L1: Ischemic heart disease, SL1 2 $6,250,085 3,595 2 $6,099,264 3,579 $6,129,996
316000L2: Cerebral vascular accident, SL2 3 $5,203,582 1,512 5 $4,433,199 1,450 $4,611,490
386500L3: Ischemic heart disease, SL3 4 $5,178,067 461 3 $5,102,354 451 $5,068,160
351700L1: Cataract, SL1 5 $5,082,557 11,954 4 $5,082,086 11,951 $5,072,579
712208L2: Joint degeneration, localized - back, SL2 6 $3,493,835 1,194 6 $3,404,475 1,182 $3,423,885
386500L4: Ischemic heart disease, SL4 7 $3,408,934 187 7 $3,303,181 183 $3,249,452
712202L3: Joint degeneration, localized - knee & lower leg, SL3 8 $3,273,047 687 8 $3,193,905 665 $3,197,798
439300L4: Chronic obstructive pulmonary disease, SL4 9 $2,688,610 553 9 $2,471,034 530 $2,469,505
386800L2: Congestive heart failure, SL2 10 $2,596,885 1,175 12 $2,172,176 1,148 $2,217,941
Total for All Chronic ETGs -- $131,300,165 116,465 -- $123,259,766 115,105 $124,681,652
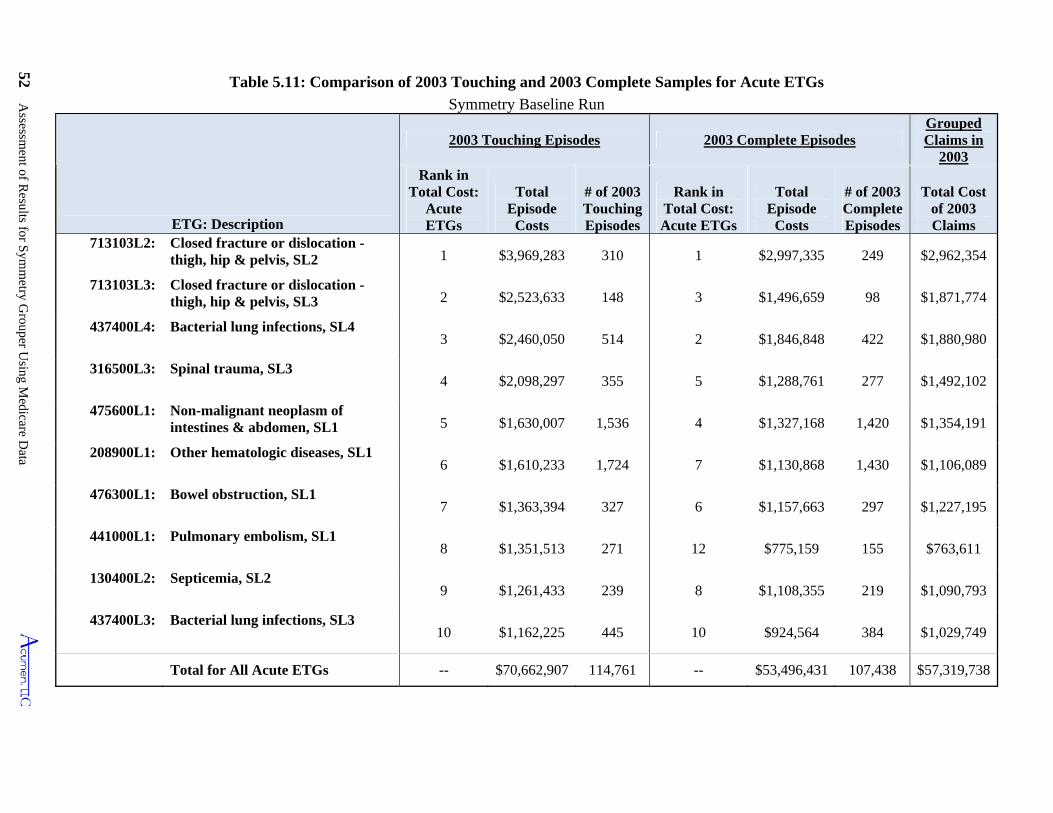
52 Assessm
ent of Results for S
ymm
etry Grouper U
sing Medicare D
ata
Table 5.11: Comparison of 2003 Touching and 2003 Complete Samples for Acute ETGs
Symmetry Baseline Run
ETG: Description
2003 Touching Episodes 2003 Complete Episodes Grouped Claims in
2003 Rank in
Total Cost: Acute ETGs
Total Episode
Costs
# of 2003 Touching Episodes
Rank in Total Cost: Acute ETGs
Total Episode
Costs
# of 2003 Complete Episodes
Total Cost of 2003 Claims
713103L2: Closed fracture or dislocation - thigh, hip & pelvis, SL2 1 $3,969,283 310 1 $2,997,335 249 $2,962,354
713103L3: Closed fracture or dislocation - thigh, hip & pelvis, SL3 2 $2,523,633 148 3 $1,496,659 98 $1,871,774
437400L4: Bacterial lung infections, SL4 3 $2,460,050 514 2 $1,846,848 422 $1,880,980
316500L3: Spinal trauma, SL3 4 $2,098,297 355 5 $1,288,761 277 $1,492,102
475600L1: Non-malignant neoplasm of intestines & abdomen, SL1 5 $1,630,007 1,536 4 $1,327,168 1,420 $1,354,191
208900L1: Other hematologic diseases, SL1 6 $1,610,233 1,724 7 $1,130,868 1,430 $1,106,089
476300L1: Bowel obstruction, SL1 7 $1,363,394 327 6 $1,157,663 297 $1,227,195
441000L1: Pulmonary embolism, SL1 8 $1,351,513 271 12 $775,159 155 $763,611
130400L2: Septicemia, SL2 9 $1,261,433 239 8 $1,108,355 219 $1,090,793
437400L3: Bacterial lung infections, SL3 10 $1,162,225 445 10 $924,564 384 $1,029,749
Total for All Acute ETGs -- $70,662,907 114,761 -- $53,496,431 107,438 $57,319,738
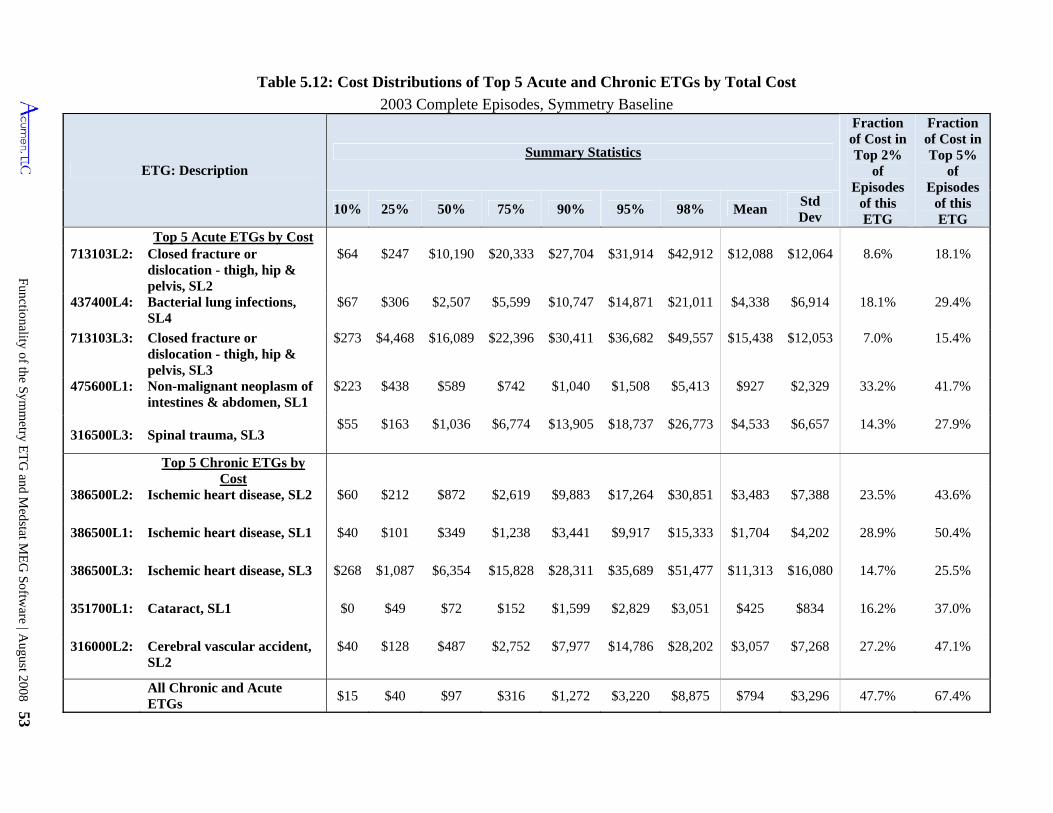
Functionality of the Symm
etry ET
G and M
edstat ME
G Softw
are | August 2008 53
Table 5.12: Cost Distributions of Top 5 Acute and Chronic ETGs by Total Cost
2003 Complete Episodes, Symmetry Baseline
ETG: Description Summary Statistics
Fraction of Cost in Top 2%
of Episodes
of this ETG
Fraction of Cost in Top 5%
of Episodes
of this ETG
10% 25% 50% 75% 90% 95% 98% Mean Std Dev
Top 5 Acute ETGs by Cost 713103L2: Closed fracture or
dislocation - thigh, hip & pelvis, SL2
$64 $247 $10,190 $20,333 $27,704 $31,914 $42,912 $12,088 $12,064 8.6% 18.1%
437400L4: Bacterial lung infections, SL4
$67 $306 $2,507 $5,599 $10,747 $14,871 $21,011 $4,338 $6,914 18.1% 29.4%
713103L3: Closed fracture or dislocation - thigh, hip & pelvis, SL3
$273 $4,468 $16,089 $22,396 $30,411 $36,682 $49,557 $15,438 $12,053 7.0% 15.4%
475600L1: Non-malignant neoplasm of intestines & abdomen, SL1
$223 $438 $589 $742 $1,040 $1,508 $5,413 $927 $2,329 33.2% 41.7%
316500L3: Spinal trauma, SL3 $55 $163 $1,036 $6,774 $13,905 $18,737 $26,773 $4,533 $6,657 14.3% 27.9%
Top 5 Chronic ETGs by
Cost
386500L2: Ischemic heart disease, SL2 $60 $212 $872 $2,619 $9,883 $17,264 $30,851 $3,483 $7,388 23.5% 43.6%
386500L1: Ischemic heart disease, SL1 $40 $101 $349 $1,238 $3,441 $9,917 $15,333 $1,704 $4,202 28.9% 50.4%
386500L3: Ischemic heart disease, SL3 $268 $1,087 $6,354 $15,828 $28,311 $35,689 $51,477 $11,313 $16,080 14.7% 25.5%
351700L1: Cataract, SL1 $0 $49 $72 $152 $1,599 $2,829 $3,051 $425 $834 16.2% 37.0%
316000L2: Cerebral vascular accident, SL2
$40 $128 $487 $2,752 $7,977 $14,786 $28,202 $3,057 $7,268 27.2% 47.1%
All Chronic and Acute ETGs
$15 $40 $97 $316 $1,272 $3,220 $8,875 $794 $3,296 47.7% 67.4%
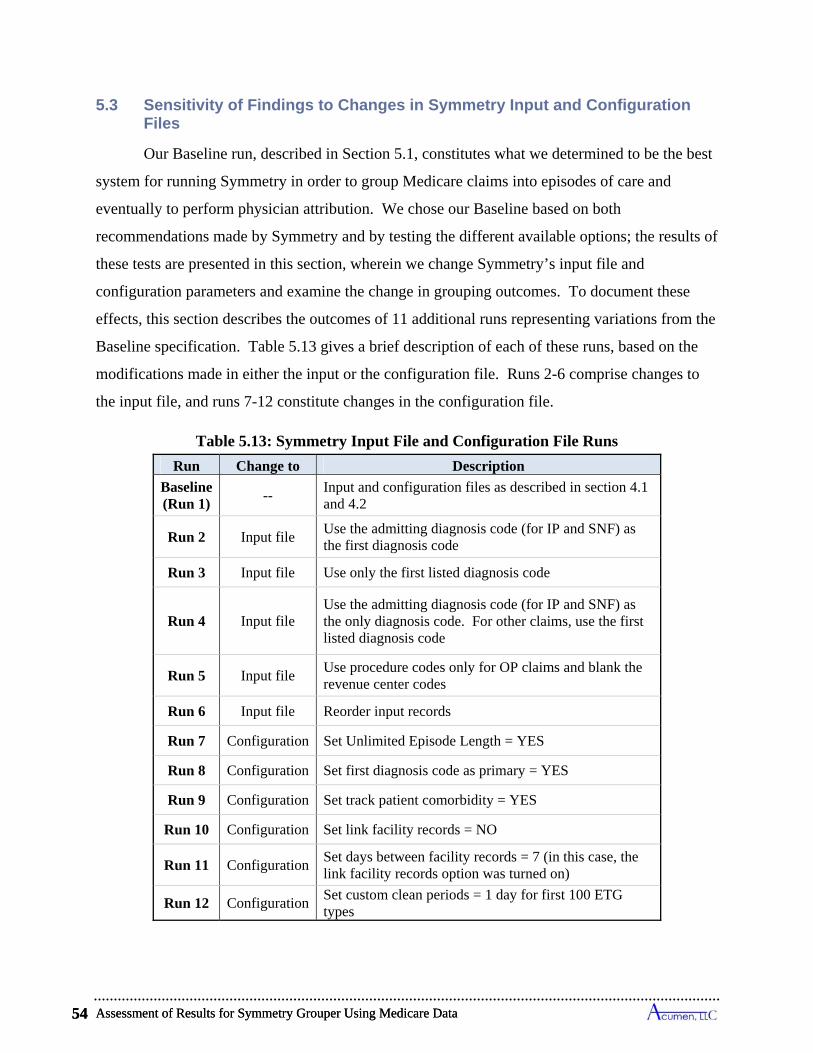
Assessment of Results for Symmetry Grouper Using Medicare Data 54
5.3 Sensitivity of Findings to Changes in Symmetry Input and Configuration Files
Our Baseline run, described in Section 5.1, constitutes what we determined to be the best
system for running Symmetry in order to group Medicare claims into episodes of care and
eventually to perform physician attribution. We chose our Baseline based on both
recommendations made by Symmetry and by testing the different available options; the results of
these tests are presented in this section, wherein we change Symmetry’s input file and
configuration parameters and examine the change in grouping outcomes. To document these
effects, this section describes the outcomes of 11 additional runs representing variations from the
Baseline specification. Table 5.13 gives a brief description of each of these runs, based on the
modifications made in either the input or the configuration file. Runs 2-6 comprise changes to
the input file, and runs 7-12 constitute changes in the configuration file.
Table 5.13: Symmetry Input File and Configuration File Runs
Run Change to Description
Baseline (Run 1)
-- Input and configuration files as described in section 4.1 and 4.2
Run 2 Input file Use the admitting diagnosis code (for IP and SNF) as the first diagnosis code
Run 3 Input file Use only the first listed diagnosis code
Run 4 Input file Use the admitting diagnosis code (for IP and SNF) as the only diagnosis code. For other claims, use the first listed diagnosis code
Run 5 Input file Use procedure codes only for OP claims and blank the revenue center codes
Run 6 Input file Reorder input records
Run 7 Configuration Set Unlimited Episode Length = YES
Run 8 Configuration Set first diagnosis code as primary = YES
Run 9 Configuration Set track patient comorbidity = YES
Run 10 Configuration Set link facility records = NO
Run 11 Configuration Set days between facility records = 7 (in this case, the link facility records option was turned on)
Run 12 Configuration Set custom clean periods = 1 day for first 100 ETG types
Assessment of Results for Symmetry Grouper Using Medicare Data 54
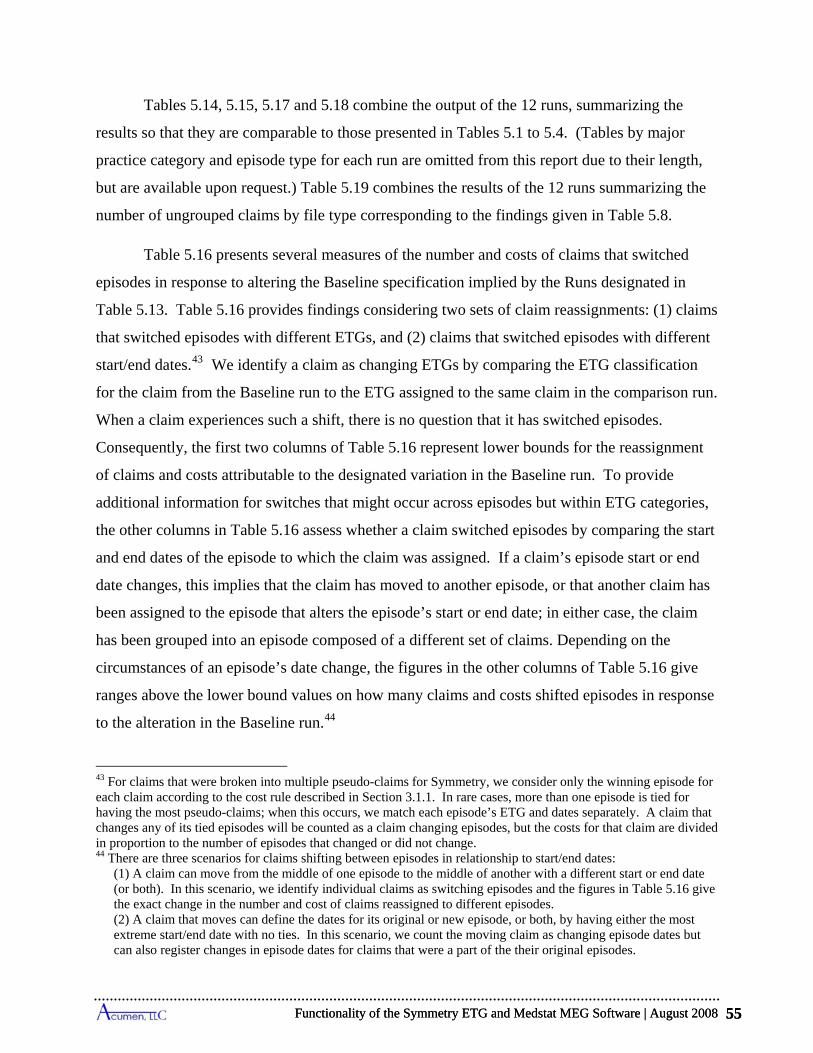
Functionality of the Symmetry ETG and Medstat MEG Software | August 2008 55
Tables 5.14, 5.15, 5.17 and 5.18 combine the output of the 12 runs, summarizing the
results so that they are comparable to those presented in Tables 5.1 to 5.4. (Tables by major
practice category and episode type for each run are omitted from this report due to their length,
but are available upon request.) Table 5.19 combines the results of the 12 runs summarizing the
number of ungrouped claims by file type corresponding to the findings given in Table 5.8.
Table 5.16 presents several measures of the number and costs of claims that switched
episodes in response to altering the Baseline specification implied by the Runs designated in
Table 5.13. Table 5.16 provides findings considering two sets of claim reassignments: (1) claims
that switched episodes with different ETGs, and (2) claims that switched episodes with different
start/end dates.43 We identify a claim as changing ETGs by comparing the ETG classification
for the claim from the Baseline run to the ETG assigned to the same claim in the comparison run.
When a claim experiences such a shift, there is no question that it has switched episodes.
Consequently, the first two columns of Table 5.16 represent lower bounds for the reassignment
of claims and costs attributable to the designated variation in the Baseline run. To provide
additional information for switches that might occur across episodes but within ETG categories,
the other columns in Table 5.16 assess whether a claim switched episodes by comparing the start
and end dates of the episode to which the claim was assigned. If a claim’s episode start or end
date changes, this implies that the claim has moved to another episode, or that another claim has
been assigned to the episode that alters the episode’s start or end date; in either case, the claim
has been grouped into an episode composed of a different set of claims. Depending on the
circumstances of an episode’s date change, the figures in the other columns of Table 5.16 give
ranges above the lower bound values on how many claims and costs shifted episodes in response
to the alteration in the Baseline run.44
43 For claims that were broken into multiple pseudo-claims for Symmetry, we consider only the winning episode for each claim according to the cost rule described in Section 3.1.1. In rare cases, more than one episode is tied for having the most pseudo-claims; when this occurs, we match each episode’s ETG and dates separately. A claim that changes any of its tied episodes will be counted as a claim changing episodes, but the costs for that claim are divided in proportion to the number of episodes that changed or did not change. 44 There are three scenarios for claims shifting between episodes in relationship to start/end dates:
(1) A claim can move from the middle of one episode to the middle of another with a different start or end date (or both). In this scenario, we identify individual claims as switching episodes and the figures in Table 5.16 give the exact change in the number and cost of claims reassigned to different episodes. (2) A claim that moves can define the dates for its original or new episode, or both, by having either the most extreme start/end date with no ties. In this scenario, we count the moving claim as changing episode dates but can also register changes in episode dates for claims that were a part of the their original episodes.
Functionality of the Symmetry ETG and Medstat MEG Software | August 2008 55

Assessment of Results for Symmetry Grouper Using Medicare Data 56
5.3.1 Varying Diagnosis Codes (Runs 2 through 4)
To improve our understanding of how the Symmetry grouper uses information on
diagnoses from Medicare claims, we explore the consequences of varying the diagnoses included
as input in constructed pseudo-claims. As demonstrated below, replacing the principal diagnosis
code with the admitting diagnosis does not produce substantial differences in grouping results;
varying the number of diagnoses codes makes a somewhat larger difference.
If we restrict the data in the input file to contain only one diagnosis code per claim as
done in runs 3 and 4, about 2% fewer claims are grouped into episodes and 5% fewer episodes
are created (Table 5.14). Less diagnosis information presumably limits the types of episodes that
can be used for each of the claims. Changing the first diagnosis to the admitting diagnosis (Run
2) has less of an impact than varying the number of diagnosis codes (runs 3 and 4). This may be
due to two reasons. First, the admitting diagnosis in many cases is similar, if not identical, to the
principal diagnosis. Second, the admitting diagnosis is present in only IP and SNF claims, which
represent a small minority of the claims data. The same analysis and trends hold if we restrict
our sample to episodes touching the analysis year of 2003 (Table 5.15).
An analysis of average episode cost and length and number of episodes shows that using
one diagnosis as opposed to four (Runs 3 and 4) results in virtually no change in episode lengths
or costs (Table 5.17). For instance, the 90th percentile has a cost per chronic episode of $2,061
and episode length of 310 days in the Baseline. Runs 3 and 4, which use a single diagnosis, have
a cost per chronic episode at the 90th percentile of $2,091 and $2,104 respectively; both have
episode lengths of 309 days at the 90th percentile. Acute episodes and complete acute episodes
also follow this pattern. Likewise, changing the first diagnosis code to the admitting diagnosis
(Run 2) produces a small effect on the episode cost and length distributions.
Consequently, the quantities in Table 5.16 describing switches in the number and cost of claim across episodes with different dates can overestimate the true measure of these changes. (3) A claim that does not define an episode start/end date can move between two episodes with the exact same start and end dates. In this scenario we do not register any episode date changes. As a consequence, the quantities in Table 5.16 describing switches in the number and cost of claim across episodes with different dates can underestimate the true measure of these changes.
Assessment of Results for Symmetry Grouper Using Medicare Data 56
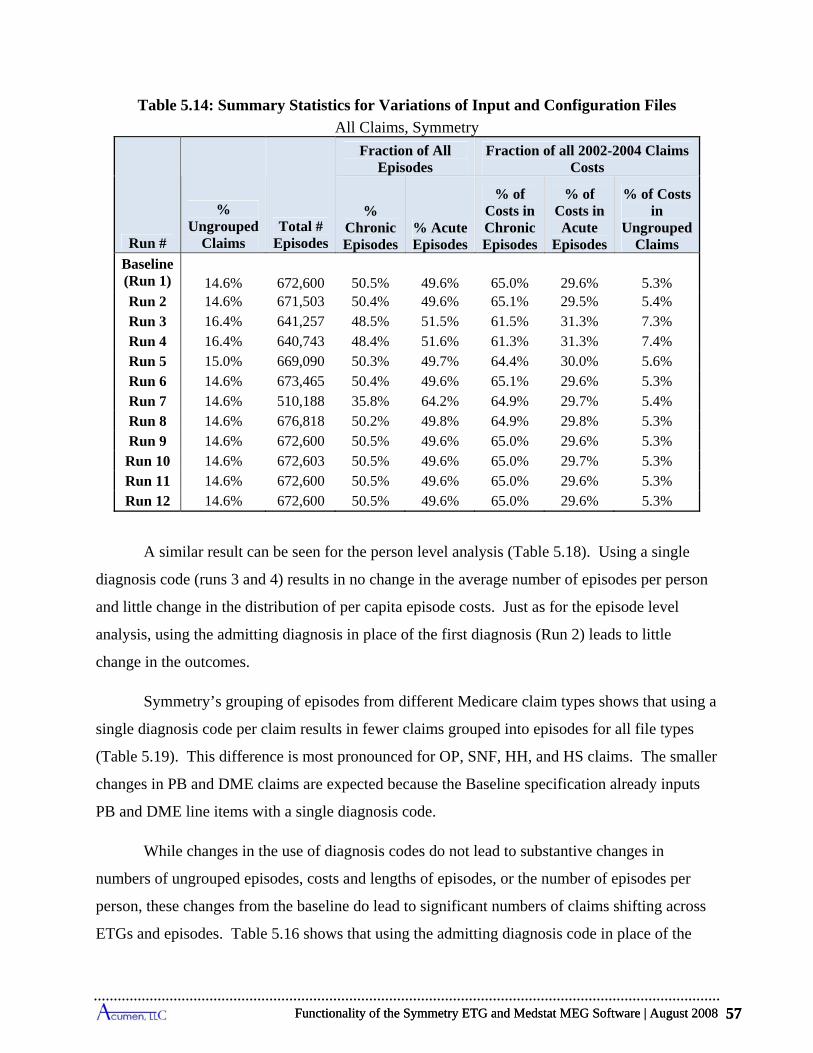
Functionality of the Symmetry ETG and Medstat MEG Software | August 2008 57
Table 5.14: Summary Statistics for Variations of Input and Configuration Files
All Claims, Symmetry
Run #
% Ungrouped
Claims Total #
Episodes
Fraction of All Episodes
Fraction of all 2002-2004 Claims Costs
% Chronic Episodes
% Acute Episodes
% of Costs in Chronic Episodes
% of Costs in Acute
Episodes
% of Costs in
Ungrouped Claims
Baseline (Run 1) 14.6% 672,600 50.5% 49.6% 65.0% 29.6% 5.3% Run 2 14.6% 671,503 50.4% 49.6% 65.1% 29.5% 5.4% Run 3 16.4% 641,257 48.5% 51.5% 61.5% 31.3% 7.3% Run 4 16.4% 640,743 48.4% 51.6% 61.3% 31.3% 7.4% Run 5 15.0% 669,090 50.3% 49.7% 64.4% 30.0% 5.6% Run 6 14.6% 673,465 50.4% 49.6% 65.1% 29.6% 5.3% Run 7 14.6% 510,188 35.8% 64.2% 64.9% 29.7% 5.4% Run 8 14.6% 676,818 50.2% 49.8% 64.9% 29.8% 5.3% Run 9 14.6% 672,600 50.5% 49.6% 65.0% 29.6% 5.3%
Run 10 14.6% 672,603 50.5% 49.6% 65.0% 29.7% 5.3% Run 11 14.6% 672,600 50.5% 49.6% 65.0% 29.6% 5.3% Run 12 14.6% 672,600 50.5% 49.6% 65.0% 29.6% 5.3%
A similar result can be seen for the person level analysis (Table 5.18). Using a single
diagnosis code (runs 3 and 4) results in no change in the average number of episodes per person
and little change in the distribution of per capita episode costs. Just as for the episode level
analysis, using the admitting diagnosis in place of the first diagnosis (Run 2) leads to little
change in the outcomes.
Symmetry’s grouping of episodes from different Medicare claim types shows that using a
single diagnosis code per claim results in fewer claims grouped into episodes for all file types
(Table 5.19). This difference is most pronounced for OP, SNF, HH, and HS claims. The smaller
changes in PB and DME claims are expected because the Baseline specification already inputs
PB and DME line items with a single diagnosis code.
While changes in the use of diagnosis codes do not lead to substantive changes in
numbers of ungrouped episodes, costs and lengths of episodes, or the number of episodes per
person, these changes from the baseline do lead to significant numbers of claims shifting across
ETGs and episodes. Table 5.16 shows that using the admitting diagnosis code in place of the
Functionality of the Symmetry ETG and Medstat MEG Software | August 2008 57
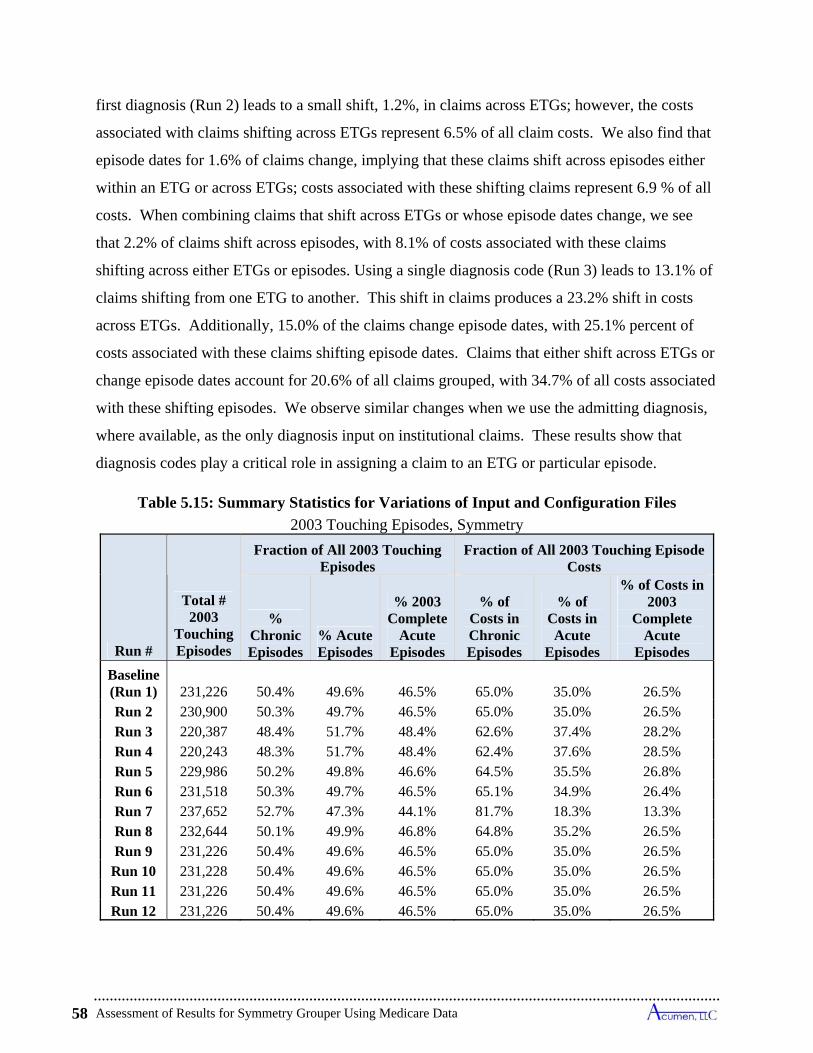
Assessment of Results for Symmetry Grouper Using Medicare Data 58
first diagnosis (Run 2) leads to a small shift, 1.2%, in claims across ETGs; however, the costs
associated with claims shifting across ETGs represent 6.5% of all claim costs. We also find that
episode dates for 1.6% of claims change, implying that these claims shift across episodes either
within an ETG or across ETGs; costs associated with these shifting claims represent 6.9 % of all
costs. When combining claims that shift across ETGs or whose episode dates change, we see
that 2.2% of claims shift across episodes, with 8.1% of costs associated with these claims
shifting across either ETGs or episodes. Using a single diagnosis code (Run 3) leads to 13.1% of
claims shifting from one ETG to another. This shift in claims produces a 23.2% shift in costs
across ETGs. Additionally, 15.0% of the claims change episode dates, with 25.1% percent of
costs associated with these claims shifting episode dates. Claims that either shift across ETGs or
change episode dates account for 20.6% of all claims grouped, with 34.7% of all costs associated
with these shifting episodes. We observe similar changes when we use the admitting diagnosis,
where available, as the only diagnosis input on institutional claims. These results show that
diagnosis codes play a critical role in assigning a claim to an ETG or particular episode.
Table 5.15: Summary Statistics for Variations of Input and Configuration Files
2003 Touching Episodes, Symmetry
Run #
Total # 2003
Touching Episodes
Fraction of All 2003 Touching Episodes
Fraction of All 2003 Touching Episode Costs
% Chronic Episodes
% Acute Episodes
% 2003 Complete
Acute Episodes
% of Costs in Chronic Episodes
% of Costs in Acute
Episodes
% of Costs in 2003
Complete Acute
Episodes
Baseline (Run 1) 231,226 50.4% 49.6% 46.5% 65.0% 35.0% 26.5% Run 2 230,900 50.3% 49.7% 46.5% 65.0% 35.0% 26.5% Run 3 220,387 48.4% 51.7% 48.4% 62.6% 37.4% 28.2% Run 4 220,243 48.3% 51.7% 48.4% 62.4% 37.6% 28.5% Run 5 229,986 50.2% 49.8% 46.6% 64.5% 35.5% 26.8% Run 6 231,518 50.3% 49.7% 46.5% 65.1% 34.9% 26.4% Run 7 237,652 52.7% 47.3% 44.1% 81.7% 18.3% 13.3% Run 8 232,644 50.1% 49.9% 46.8% 64.8% 35.2% 26.5% Run 9 231,226 50.4% 49.6% 46.5% 65.0% 35.0% 26.5%
Run 10 231,228 50.4% 49.6% 46.5% 65.0% 35.0% 26.5% Run 11 231,226 50.4% 49.6% 46.5% 65.0% 35.0% 26.5% Run 12 231,226 50.4% 49.6% 46.5% 65.0% 35.0% 26.5%
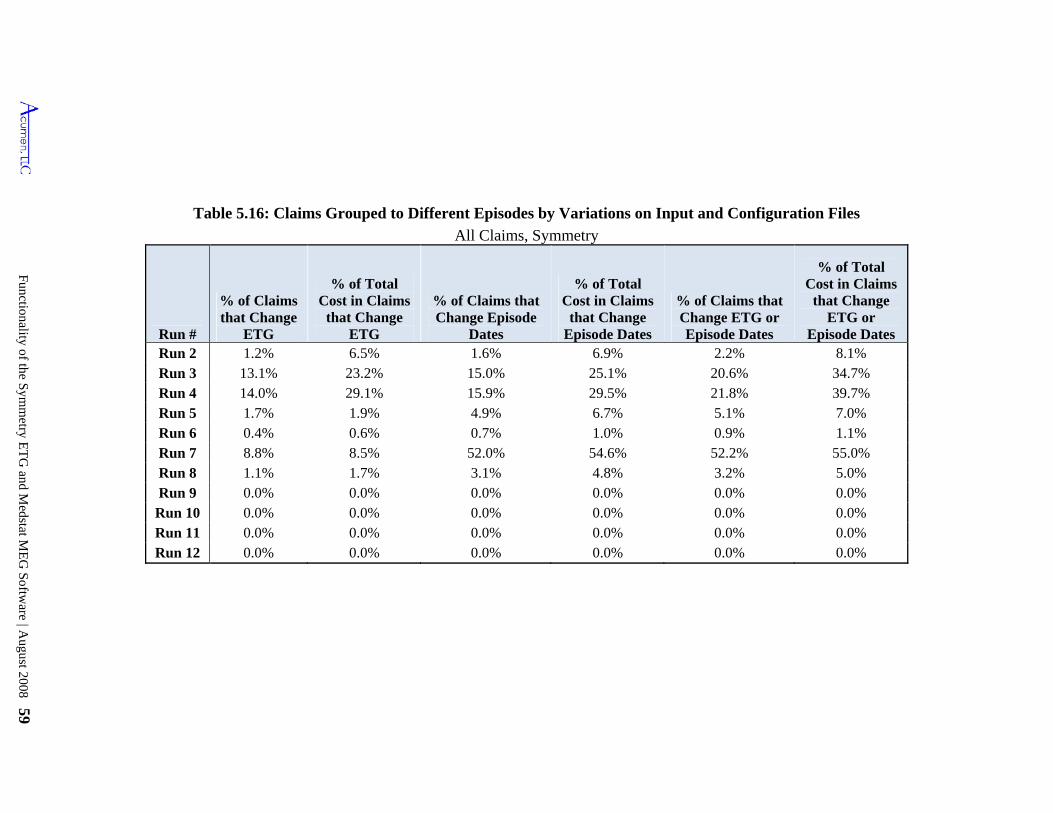
Functionality of the S
ymm
etry ET
G and M
edstat ME
G S
oftware | A
ugust 2008 59
Table 5.16: Claims Grouped to Different Episodes by Variations on Input and Configuration Files
All Claims, Symmetry
Run #
% of Claims that Change
ETG
% of Total Cost in Claims
that Change ETG
% of Claims that Change Episode
Dates
% of Total Cost in Claims
that Change Episode Dates
% of Claims that Change ETG or Episode Dates
% of Total Cost in Claims
that Change ETG or
Episode Dates Run 2 1.2% 6.5% 1.6% 6.9% 2.2% 8.1% Run 3 13.1% 23.2% 15.0% 25.1% 20.6% 34.7% Run 4 14.0% 29.1% 15.9% 29.5% 21.8% 39.7% Run 5 1.7% 1.9% 4.9% 6.7% 5.1% 7.0% Run 6 0.4% 0.6% 0.7% 1.0% 0.9% 1.1% Run 7 8.8% 8.5% 52.0% 54.6% 52.2% 55.0% Run 8 1.1% 1.7% 3.1% 4.8% 3.2% 5.0% Run 9 0.0% 0.0% 0.0% 0.0% 0.0% 0.0%
Run 10 0.0% 0.0% 0.0% 0.0% 0.0% 0.0% Run 11 0.0% 0.0% 0.0% 0.0% 0.0% 0.0% Run 12 0.0% 0.0% 0.0% 0.0% 0.0% 0.0%
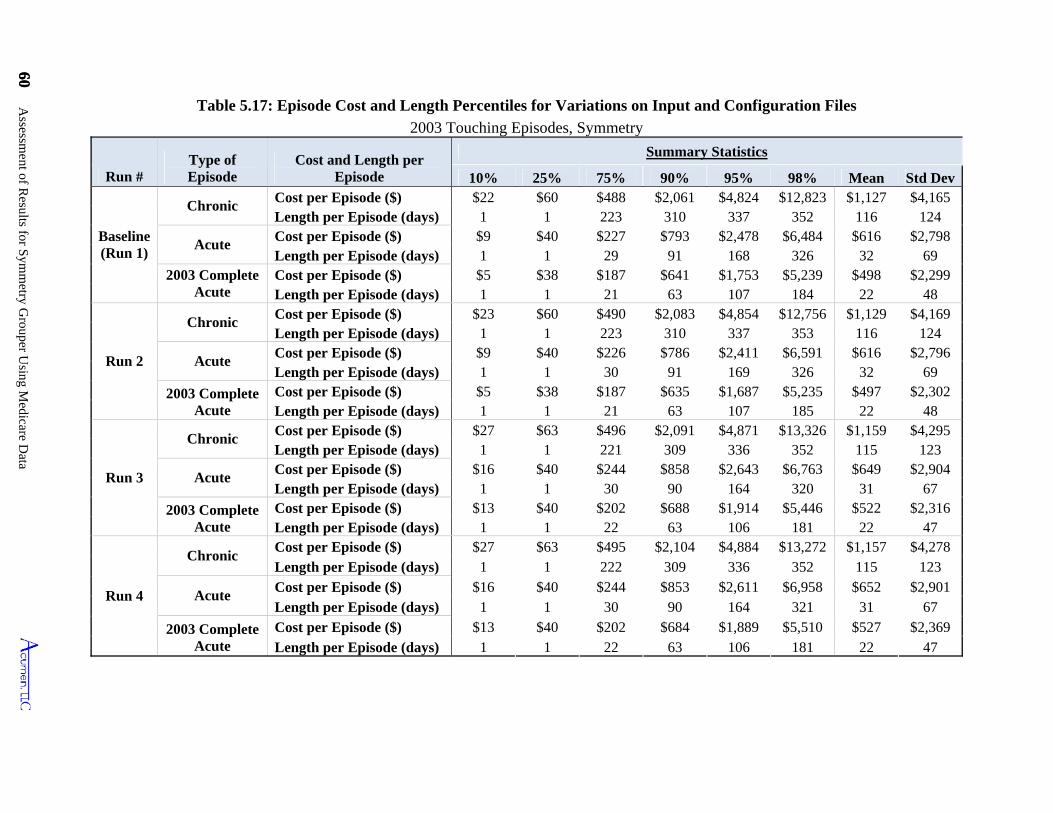
60 Assessm
ent of Results for S
ymm
etry Grouper U
sing Medicare D
ata
60
Table 5.17: Episode Cost and Length Percentiles for Variations on Input and Configuration Files
2003 Touching Episodes, Symmetry
Run # Type of Episode
Cost and Length per Episode
Summary Statistics
10% 25% 75% 90% 95% 98% Mean Std Dev
Baseline (Run 1)
Chronic Cost per Episode ($) $22 $60 $488 $2,061 $4,824 $12,823 $1,127 $4,165 Length per Episode (days) 1 1 223 310 337 352 116 124
Acute Cost per Episode ($) $9 $40 $227 $793 $2,478 $6,484 $616 $2,798 Length per Episode (days) 1 1 29 91 168 326 32 69
2003 Complete Acute
Cost per Episode ($) $5 $38 $187 $641 $1,753 $5,239 $498 $2,299 Length per Episode (days) 1 1 21 63 107 184 22 48
Run 2
Chronic Cost per Episode ($) $23 $60 $490 $2,083 $4,854 $12,756 $1,129 $4,169 Length per Episode (days) 1 1 223 310 337 353 116 124
Acute Cost per Episode ($) $9 $40 $226 $786 $2,411 $6,591 $616 $2,796 Length per Episode (days) 1 1 30 91 169 326 32 69
2003 Complete Acute
Cost per Episode ($) $5 $38 $187 $635 $1,687 $5,235 $497 $2,302 Length per Episode (days) 1 1 21 63 107 185 22 48
Run 3
Chronic Cost per Episode ($) $27 $63 $496 $2,091 $4,871 $13,326 $1,159 $4,295 Length per Episode (days) 1 1 221 309 336 352 115 123
Acute Cost per Episode ($) $16 $40 $244 $858 $2,643 $6,763 $649 $2,904 Length per Episode (days) 1 1 30 90 164 320 31 67
2003 Complete Acute
Cost per Episode ($) $13 $40 $202 $688 $1,914 $5,446 $522 $2,316 Length per Episode (days) 1 1 22 63 106 181 22 47
Run 4
Chronic Cost per Episode ($) $27 $63 $495 $2,104 $4,884 $13,272 $1,157 $4,278 Length per Episode (days) 1 1 222 309 336 352 115 123
Acute Cost per Episode ($) $16 $40 $244 $853 $2,611 $6,958 $652 $2,901 Length per Episode (days) 1 1 30 90 164 321 31 67
2003 Complete Acute
Cost per Episode ($) $13 $40 $202 $684 $1,889 $5,510 $527 $2,369 Length per Episode (days) 1 1 22 63 106 181 22 47
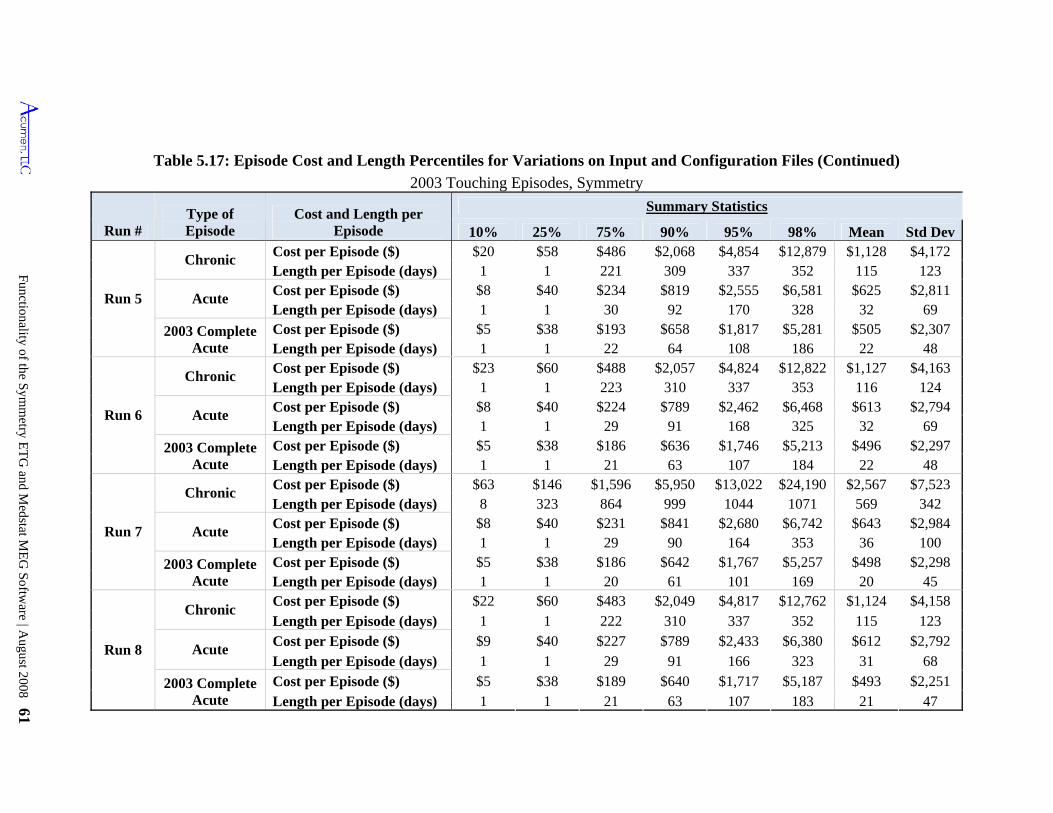
Functionality of the S
ymm
etry ET
G and M
edstat ME
G S
oftware | A
ugust 2008 61
Table 5.17: Episode Cost and Length Percentiles for Variations on Input and Configuration Files (Continued)
2003 Touching Episodes, Symmetry
Run # Type of Episode
Cost and Length per Episode
Summary Statistics
10% 25% 75% 90% 95% 98% Mean Std Dev
Run 5
Chronic Cost per Episode ($) $20 $58 $486 $2,068 $4,854 $12,879 $1,128 $4,172 Length per Episode (days) 1 1 221 309 337 352 115 123
Acute Cost per Episode ($) $8 $40 $234 $819 $2,555 $6,581 $625 $2,811 Length per Episode (days) 1 1 30 92 170 328 32 69
2003 Complete Acute
Cost per Episode ($) $5 $38 $193 $658 $1,817 $5,281 $505 $2,307 Length per Episode (days) 1 1 22 64 108 186 22 48
Run 6
Chronic Cost per Episode ($) $23 $60 $488 $2,057 $4,824 $12,822 $1,127 $4,163 Length per Episode (days) 1 1 223 310 337 353 116 124
Acute Cost per Episode ($) $8 $40 $224 $789 $2,462 $6,468 $613 $2,794 Length per Episode (days) 1 1 29 91 168 325 32 69
2003 Complete Acute
Cost per Episode ($) $5 $38 $186 $636 $1,746 $5,213 $496 $2,297 Length per Episode (days) 1 1 21 63 107 184 22 48
Run 7
Chronic Cost per Episode ($) $63 $146 $1,596 $5,950 $13,022 $24,190 $2,567 $7,523 Length per Episode (days) 8 323 864 999 1044 1071 569 342
Acute Cost per Episode ($) $8 $40 $231 $841 $2,680 $6,742 $643 $2,984 Length per Episode (days) 1 1 29 90 164 353 36 100
2003 Complete Acute
Cost per Episode ($) $5 $38 $186 $642 $1,767 $5,257 $498 $2,298 Length per Episode (days) 1 1 20 61 101 169 20 45
Run 8
Chronic Cost per Episode ($) $22 $60 $483 $2,049 $4,817 $12,762 $1,124 $4,158 Length per Episode (days) 1 1 222 310 337 352 115 123
Acute Cost per Episode ($) $9 $40 $227 $789 $2,433 $6,380 $612 $2,792 Length per Episode (days) 1 1 29 91 166 323 31 68
2003 Complete Acute
Cost per Episode ($) $5 $38 $189 $640 $1,717 $5,187 $493 $2,251 Length per Episode (days) 1 1 21 63 107 183 21 47
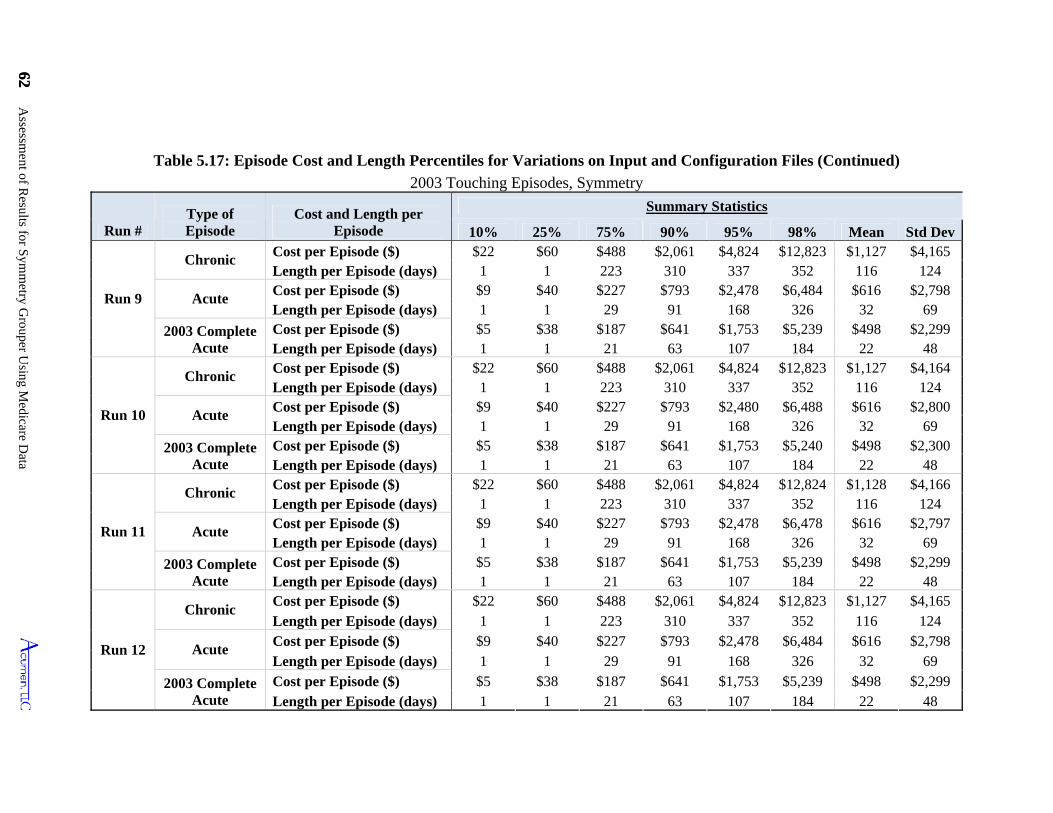
62 Assessm
ent of Results for S
ymm
etry Grouper U
sing Medicare D
ata
62
10%
Chronic
$38 $498 Length per Episode (days)
1 $40
Length per Episode (days) 168 $187 $2,300
Run 10
$22 1
Cost per Episode ($) $2,478 29 69
21 63 107 48
124
2003 Complete Acute
Cost per Episode ($) $5 $38 $187 $641 $1,753 $5,239 $498 $2,299
Summary Statistics
Length per Episode (days) 1 1 21 63 107 184 22 48
Table 5.17: Episode Cost and Length Percentiles for Variations on Input and Configuration Files (Continued)
2003 Touching Episodes, Symmetry
Run # Type of Episode 25% 75% 90% 98% Mean Std Dev
Cost per Episode ($) $22 $60 $2,061 $4,824 $12,823
Cost and Length per Episode 95%
Run 9
$488 $1,127 $4,165 Length per Episode (days) 1 223 310 337 116 124
Acute Cost per Episode ($) $9 $227 $793 $2,478
1 352 $40 $6,484 $616 $2,798
Length per Episode (days) 1 1 29 91 326 32 69
2003 Complete Acute
Cost per Episode ($) $5 $641 $1,753 $5,239 1 21 63 107 22 48
168 $187 $2,299
1 184
Chronic Cost per Episode ($) $22 $60 $488 $2,061 $4,824 $12,823 $1,127 $4,164 Length per Episode (days) 1 310 337 352 116
Acute Cost per Episode ($) $227 $793 $2,480 $616 $2,800
1 1 29 326 32 69
2003 Complete Acute
Cost per Episode ($) $5 $641 $1,753 $5,240
223 124 $9 $6,488
91 $38 $498
Length per Episode (days) 1 1 21 63 107 184 22 48
Chronic Cost per Episode ($) $60 $2,061 $4,824 $12,824 $1,128 Length per Episode (days) 223 310 337 116 124
$9 $40 $227 $6,478 $616 $2,797 Length per Episode (days) 1 91 168 326
2003 Complete Acute
Run 11
$488 $4,166 1 352
Acute $793
1 32 Cost per Episode ($) $5 $38 $187 $641 $1,753 $5,239 $498 $2,299 Length per Episode (days) 1 184 22
Run 12
Chronic $22 $60 $488 $2,061 $4,824 $12,823 $1,127 $4,165
1 Cost per Episode ($) Length per Episode (days) 1 1 223 310 337 352
Acute Cost per Episode ($) $9 $40 $227 $2,478 $6,484 $616 $2,798 Length per Episode (days)
116 $793
1 1 29 91 168 326 32 69
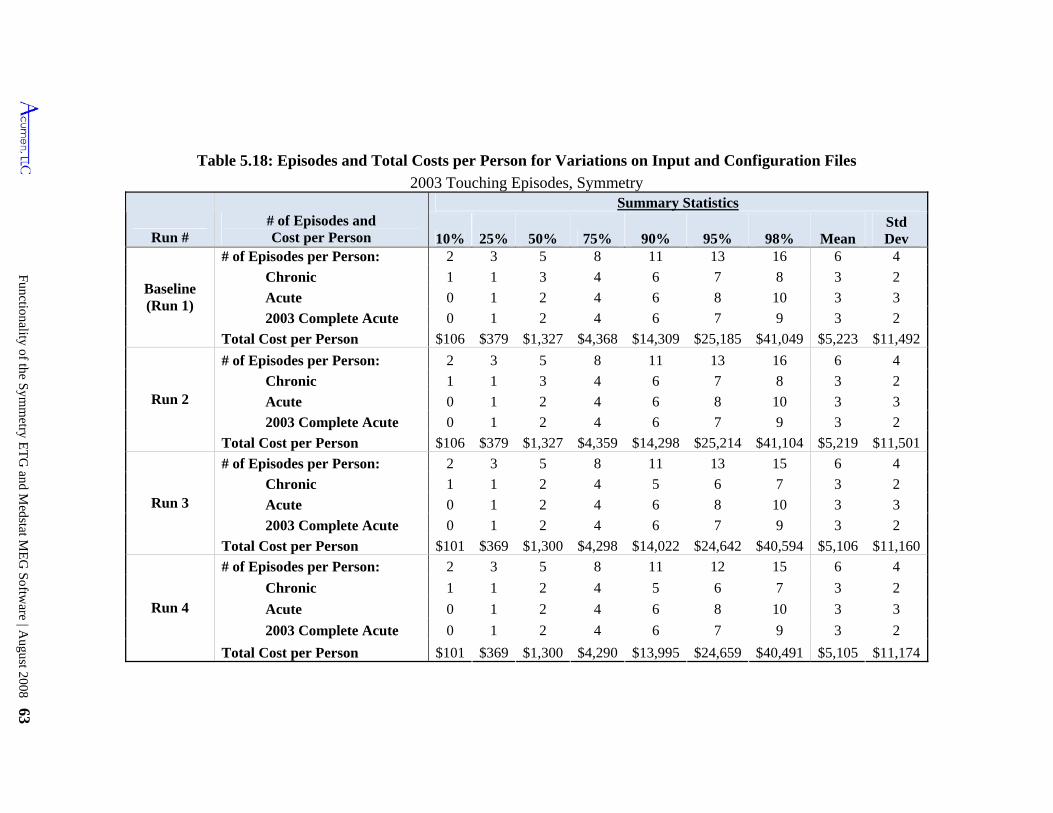
Functionality of the S
ymm
etry ET
G and M
edstat ME
G S
oftware | A
ugust 2008 63
Table 5.18: Episodes and Total Costs per Person for Variations on Input and Configuration Files
2003 Touching Episodes, Symmetry
Run # # of Episodes and Cost per Person
Summary Statistics
10% 25% 50% 75% 90% 95% 98% Mean Std Dev
Baseline (Run 1)
# of Episodes per Person: 2 3 5 8 11 13 16 6 4
Chronic 1 1 3 4 6 7 8 3 2
Acute 0 1 2 4 6 8 10 3 3
2003 Complete Acute 0 1 2 4 6 7 9 3 2
Total Cost per Person $106 $379 $1,327 $4,368 $14,309 $25,185 $41,049 $5,223 $11,492
Run 2
# of Episodes per Person: 2 3 5 8 11 13 16 6 4
Chronic 1 1 3 4 6 7 8 3 2
Acute 0 1 2 4 6 8 10 3 3
2003 Complete Acute 0 1 2 4 6 7 9 3 2
Total Cost per Person $106 $379 $1,327 $4,359 $14,298 $25,214 $41,104 $5,219 $11,501
Run 3
# of Episodes per Person: 2 3 5 8 11 13 15 6 4
Chronic 1 1 2 4 5 6 7 3 2
Acute 0 1 2 4 6 8 10 3 3
2003 Complete Acute 0 1 2 4 6 7 9 3 2
Total Cost per Person $101 $369 $1,300 $4,298 $14,022 $24,642 $40,594 $5,106 $11,160
Run 4
# of Episodes per Person: 2 3 5 8 11 12 15 6 4
Chronic 1 1 2 4 5 6 7 3 2
Acute 0 1 2 4 6 8 10 3 3
2003 Complete Acute 0 1 2 4 6 7 9 3 2
Total Cost per Person $101 $369 $1,300 $4,290 $13,995 $24,659 $40,491 $5,105 $11,174
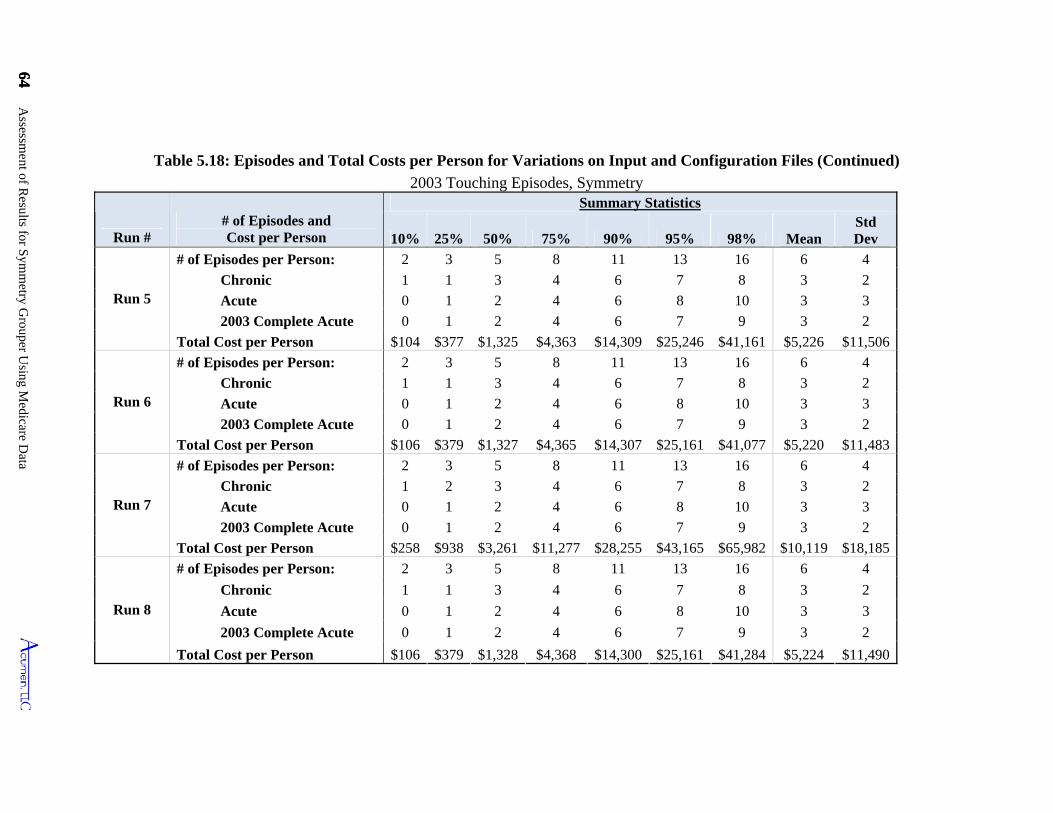
64 Assessm
ent of Results for S
ymm
etry Grouper U
sing Medicare D
ata
64
Table 5.18: Episodes and Total Costs per Person for Variations on Input and Configuration Files (Continued)
2003 Touching Episodes, Symmetry
Run # # of Episodes and Cost per Person
Summary Statistics
10% 25% 50% 75% 90% 95% 98% Mean Std Dev
Run 5
# of Episodes per Person: 2 3 5 8 11 13 16 6 4
Chronic 1 1 3 4 6 7 8 3 2
Acute 0 1 2 4 6 8 10 3 3
2003 Complete Acute 0 1 2 4 6 7 9 3 2
Total Cost per Person $104 $377 $1,325 $4,363 $14,309 $25,246 $41,161 $5,226 $11,506
Run 6
# of Episodes per Person: 2 3 5 8 11 13 16 6 4
Chronic 1 1 3 4 6 7 8 3 2
Acute 0 1 2 4 6 8 10 3 3
2003 Complete Acute 0 1 2 4 6 7 9 3 2
Total Cost per Person $106 $379 $1,327 $4,365 $14,307 $25,161 $41,077 $5,220 $11,483
Run 7
# of Episodes per Person: 2 3 5 8 11 13 16 6 4
Chronic 1 2 3 4 6 7 8 3 2
Acute 0 1 2 4 6 8 10 3 3
2003 Complete Acute 0 1 2 4 6 7 9 3 2
Total Cost per Person $258 $938 $3,261 $11,277 $28,255 $43,165 $65,982 $10,119 $18,185
Run 8
# of Episodes per Person: 2 3 5 8 11 13 16 6 4
Chronic 1 1 3 4 6 7 8 3 2
Acute 0 1 2 4 6 8 10 3 3
2003 Complete Acute 0 1 2 4 6 7 9 3 2
Total Cost per Person $106 $379 $1,328 $4,368 $14,300 $25,161 $41,284 $5,224 $11,490
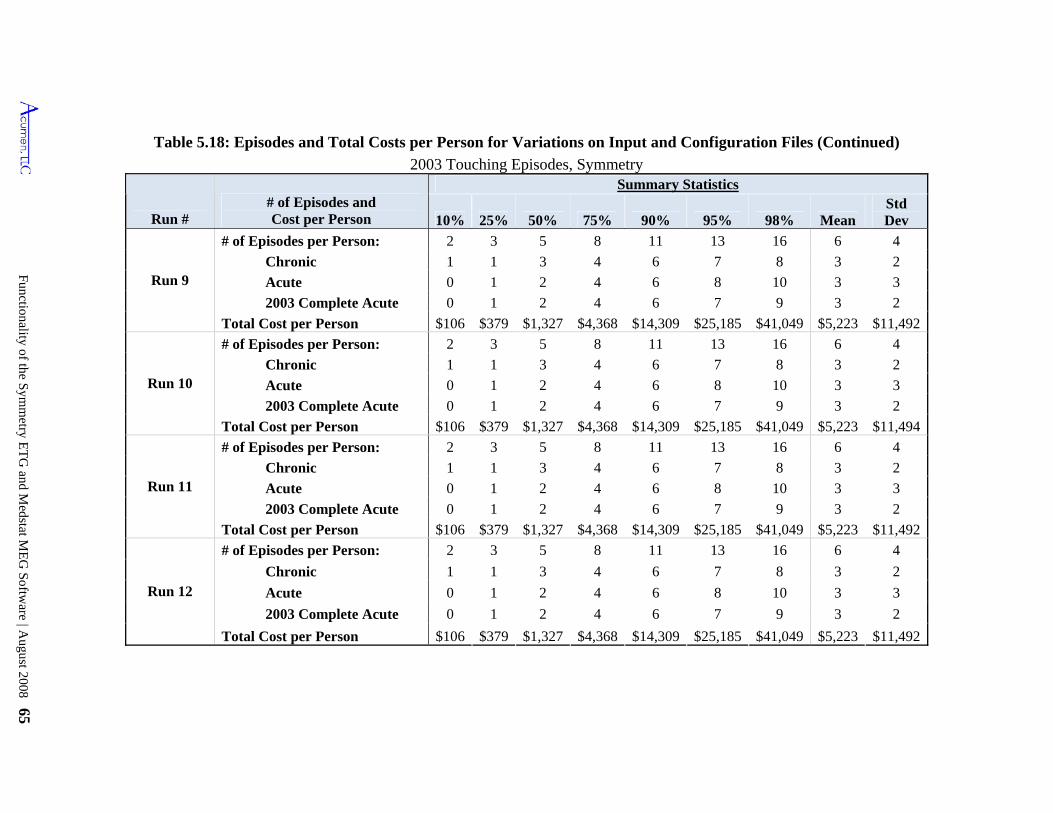
Functionality of the S
ymm
etry ET
G and M
edstat ME
G S
oftware | A
ugust 2008 65
Table 5.18: Episodes and Total Costs per Person for Variations on Input and Configuration Files (Continued)
2003 Touching Episodes, Symmetry
Run # # of Episodes and Cost per Person
Summary Statistics
10% 25% 50% 75% 90% 95% 98% Mean Std Dev
Run 9
# of Episodes per Person: 2 3 5 8 11 13 16 6 4
Chronic 1 1 3 4 6 7 8 3 2
Acute 0 1 2 4 6 8 10 3 3
2003 Complete Acute 0 1 2 4 6 7 9 3 2
Total Cost per Person $106 $379 $1,327 $4,368 $14,309 $25,185 $41,049 $5,223 $11,492
Run 10
# of Episodes per Person: 2 3 5 8 11 13 16 6 4
Chronic 1 1 3 4 6 7 8 3 2
Acute 0 1 2 4 6 8 10 3 3
2003 Complete Acute 0 1 2 4 6 7 9 3 2
Total Cost per Person $106 $379 $1,327 $4,368 $14,309 $25,185 $41,049 $5,223 $11,494
Run 11
# of Episodes per Person: 2 3 5 8 11 13 16 6 4
Chronic 1 1 3 4 6 7 8 3 2
Acute 0 1 2 4 6 8 10 3 3
2003 Complete Acute 0 1 2 4 6 7 9 3 2
Total Cost per Person $106 $379 $1,327 $4,368 $14,309 $25,185 $41,049 $5,223 $11,492
Run 12
# of Episodes per Person: 2 3 5 8 11 13 16 6 4
Chronic 1 1 3 4 6 7 8 3 2
Acute 0 1 2 4 6 8 10 3 3
2003 Complete Acute 0 1 2 4 6 7 9 3 2
Total Cost per Person $106 $379 $1,327 $4,368 $14,309 $25,185 $41,049 $5,223 $11,492
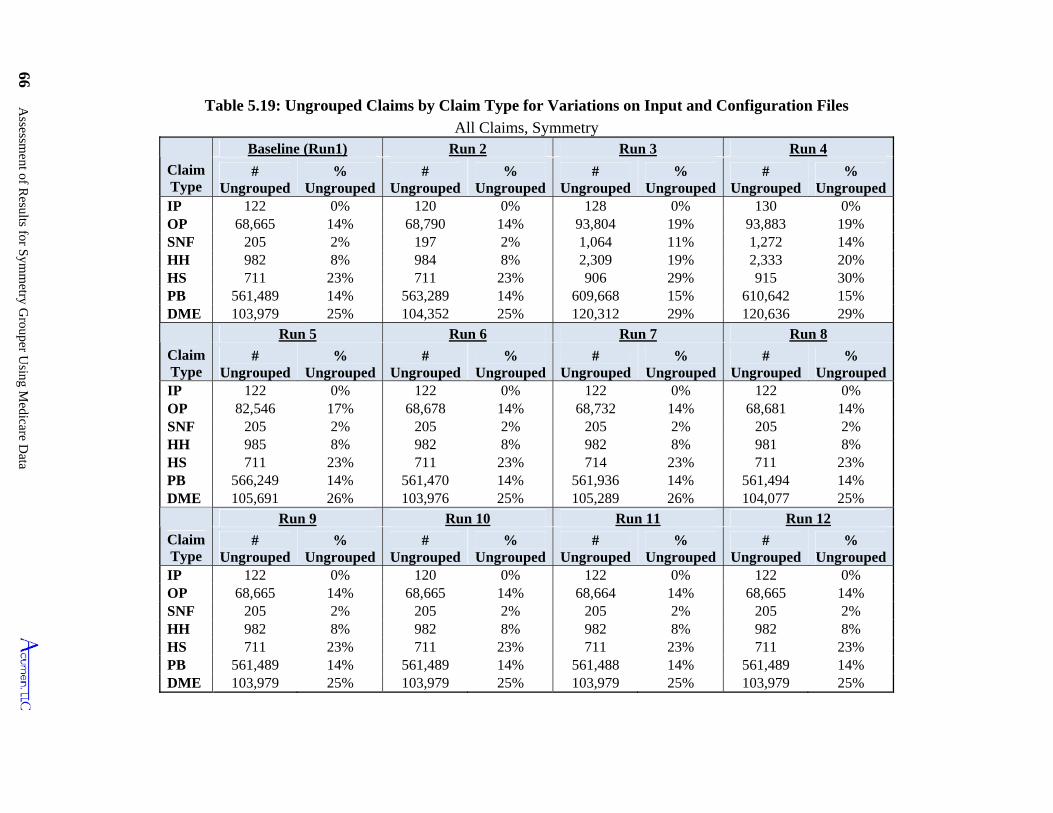
66 Assessm
ent of Results for S
ymm
etry Grouper U
sing Medicare D
ata
Table 5.19: Ungrouped Claims by Claim Type for Variations on Input and Configuration Files
All Claims, Symmetry
Claim Type
Baseline (Run1) Run 2 Run 3 Run 4
# Ungrouped
% Ungrouped
# Ungrouped
% Ungrouped
# Ungrouped
% Ungrouped
# Ungrouped
% Ungrouped
IP 122 0% 120 0% 128 0% 130 0% OP 68,665 14% 68,790 14% 93,804 19% 93,883 19% SNF 205 2% 197 2% 1,064 11% 1,272 14% HH 982 8% 984 8% 2,309 19% 2,333 20% HS 711 23% 711 23% 906 29% 915 30% PB 561,489 14% 563,289 14% 609,668 15% 610,642 15% DME 103,979 25% 104,352 25% 120,312 29% 120,636 29%
Claim Type
Run 5 Run 6 Run 7 Run 8
# Ungrouped
% Ungrouped
# Ungrouped
% Ungrouped
# Ungrouped
% Ungrouped
# Ungrouped
% Ungrouped
IP 122 0% 122 0% 122 0% 122 0% OP 82,546 17% 68,678 14% 68,732 14% 68,681 14% SNF 205 2% 205 2% 205 2% 205 2% HH 985 8% 982 8% 982 8% 981 8% HS 711 23% 711 23% 714 23% 711 23% PB 566,249 14% 561,470 14% 561,936 14% 561,494 14% DME 105,691 26% 103,976 25% 105,289 26% 104,077 25%
Claim Type
Run 9 Run 10 Run 11 Run 12
# Ungrouped
% Ungrouped
# Ungrouped
% Ungrouped
# Ungrouped
% Ungrouped
# Ungrouped
% Ungrouped
IP 122 0% 120 0% 122 0% 122 0% OP 68,665 14% 68,665 14% 68,664 14% 68,665 14% SNF 205 2% 205 2% 205 2% 205 2% HH 982 8% 982 8% 982 8% 982 8% HS 711 23% 711 23% 711 23% 711 23% PB 561,489 14% 561,489 14% 561,488 14% 561,489 14% DME 103,979 25% 103,979 25% 103,979 25% 103,979 25%
Functionality of the Symmetry ETG and Medstat MEG Software | August 2008 67
5.3.2 Varying Procedure Codes (Run 5)
We now turn to the question of how the Symmetry grouper uses information on
procedure codes and revenue center codes from Medicare claims.
The Symmetry grouper allows the user to include both revenue center and HCPCS/CPT
procedure codes on input records. IP, SNF and HS claims generally have only revenue center
codes for their individual service items. In contrast, OP and HH claims almost universally have
both revenue center and HCPCS/CPT procedure codes, allowing the user to decide whether to
use either one or both. Our baseline run of the grouper uses revenue center codes and, when
available, associated HCPCS/CPT in creating the pseudo-claim input records from institutional
claims.
Run 5 explores the impact of using procedure codes alone when creating the pseudo-
claims for OP claims. Instead of using revenue center codes along with their corresponding
procedure codes to construct pseudo-claims from OP, we use HCPCS/CPT codes alone to define
an input record in this run.45 Omitting revenue center codes from OP input records leads to a
0.4% increase in the fraction of ungrouped claims and a 0.3% increase in the share of cost in
ungrouped claims (Table 5.14). The additional ungrouped claims are almost entirely OP claims
(Table 5.19); an additional 3% of OP claims fail to group under this modification. This increase
in the number of ungrouped OP claims is likely related to the fact that 3% of OP claims have
only revenue center codes, and hence are input with no procedure codes under this modification.
Run 5 produces only marginal effects on the other statistics: the total number of episodes barely
changes, declining by just 0.5%, and the distributions of the costs and lengths of episodes barely
changes as a result of this modification. However, 5.1% of claims shift across episodes (Table
5.16), either within the same episode type or across ETGs. These shifting claims represent 7.0%
of all costs. These results are consistent with Symmetry’s overall episode grouping philosophy,
which relies on procedure codes as well as diagnosis codes to attach claims to episodes.
An additional run (results not presented in the tables) assessed the impact of blanking all
procedure codes and revenue center codes from the data. In this case, all claims remain
45 More specifically, we create a single pseudo-claim for every HCPCS/CPT code listed on the claim, leaving blank the revenue center code. In those instances when a revenue code on an OP claim has no corresponding procedure code, we input a single pseudo-claim with blank revenue center code and procedure code variables.
Functionality of the Symmetry ETG and Medstat MEG Software | August 2008 67
Assessment of Results for Symmetry Grouper Using Medicare Data 68
ungrouped. This happens because revenue center codes or procedure codes are necessary for
Symmetry to assign anchor records.46 If revenue center and procedure codes are absent, then
Symmetry will assign the claim as an ancillary service. Thus blanking all procedure and revenue
center codes precludes claims from being anchors, which leads to all claims being ungrouped.
5.3.3 Reordering Input Records (Run 6)
In conducting our empirical analyses, we incidentally discovered that a reorganization of
input files induced an unexpected change in findings. Symmetry’s software requires input
records be sorted by person, start date and end date, which creates start-end date categories for
each person. All of our runs use input files that obey this structure, with the Baseline run relying
on a pre-sorted input file extracted directly from the Medicare SAFs with input records
constructed as they appear on the claim. However, in some cases there are multiple records for
the same person that have identical start and end dates, and Symmetry’s documentation does not
state as to how such claims should be ordered.
In Run 6, our input file continues to obey this structure, but we randomly reorder input
records within the required person - start date - end date categories and reapplied Symmetry’s
grouping algorithm. The row corresponding to Run 6 in Table 5.14 shows an almost
imperceptible change occurs in the main results compared to the Baseline run, with the number
of episodes increasing by merely 865. The changes are also miniscule for the statistics presented
in Tables 5.15, 5.17, and 5.18.
The more important, though, is finding that records and claims are reallocated to different
episodes in Run 6 compared to the Baseline run (Table 5.16). The reordering of the input
records produces a change in the assignment of 0.4% of the claims to different ETGs.
Assignment to a new ETG implies association with a different health-care treatment.
Furthermore, 0.9% of claims are assigned to different episodes, differing either in terms of ETG
or in episode start or end dates. This reassignment implies that as approximately 1% of total
costs are reallocated to different episodes of care (and potentially to different providers). We
initially presumed that the same input data and configuration parameters would produce exactly
the same grouping results, and this is not true. While the changes appear to be minor, costs are
46 Anchor records are claims that are allowed to start an episode. For a brief discussion of anchor records, go to section 4.3.
Assessment of Results for Symmetry Grouper Using Medicare Data 68
Functionality of the Symmetry ETG and Medstat MEG Software | August 2008 69
reallocated simply based on the order in which the user inputs the data, moving nearly $6.5
million worth of claims to different episodes for our sample of 20% of Colorado beneficiaries;
this would be over $32 million for 100% of Colorado.
5.3.4 Varying Symmetry Configuration File (Runs 7 through 12)
Altering parameter values in the configuration file, for the most part, induces only
minimal changes on the statistics presented here to describe episode creation. Tracking patient
co-morbidity (Run 9) or setting the custom clean periods to 1 for the first 100 ETG types (Run
12) produces no change on the number of episodes created (Table 5.15 and Table 5.17), and no
shifts in claims across episodes or ETGs (Table 5.16). 47
Changing the options for the “link facility records” parameter (either by deactivating
linking in Run 10 or letting the days between facility records be the max in Run 11) makes little
difference in the summary statistics describing either the numbers or distributional properties of
episodes, and almost no difference in claims being linked to individual episodes or ETGs.48 This
is unsurprising because the “link facility records” feature is designed to combine multiple claims
for a single hospital stay. Multiple IP claims for a single hospital admission are quite rare; the
32,590 IP claims in our 20% Colorado sample comprise 32,486 admissions, so just 104 of the IP
claims are later claims for an ongoing hospital stay.49 (See Section 7.3.4 for more details about
these calculations and numbers.) One would expect that varying the options for this feature in
this analysis is likely to have little effect on the integration of IP claims because the vast majority
of IP claims represent distinct admissions.
Most of these runs also do not affect the total number of ungrouped claims (Table 5.14)
and the number of ungrouped claims by claim type (Table 5.19). However, using the first
diagnosis code as primary (Run 8) results in a slight increase in the number of episodes created,
even though the same percentage of ungrouped claims results. Examining the number of
47 Symmetry uses the custom clean periods option to create an alternative measure of episode completeness. They are not used in the grouping process; changing the custom clean period for an ETG does not alter the clean period used by the grouper for that ETG. 48 There were marginal grouping changes affected by these options but they were less than 0.05% and were rounded down to 0.0%. 49 Multiple claims for a single stay occur for two reasons. First, CMS sometimes makes interim payments during an admission with the final claim covering the remaining part of the payment assessed to the complete admission. Second, CMS occasionally issues outlier payments that can generate multiple claims. Information available on IP claims identifies whether they are part of the same admission.
Functionality of the Symmetry ETG and Medstat MEG Software | August 2008 69
Assessment of Results for Symmetry Grouper Using Medicare Data 70
ungrouped claims by claim type shows that the number of ungrouped claims changes marginally.
Looking at claims changing across episodes (Table 5.16), we find that 3.2% of claims shift
across episodes, and 5.0% of costs shift with these claims.
Setting the episode length limit to unlimited (Run 7) results in significantly fewer
episodes created, since restricting episode length forces the creation of additional episodes.
Additionally, chronic episodes now make up a lower proportion of the number of episodes
(35.8%, versus 50.5% in the Baseline run), while accounting for almost the same share of the
total cost. This result is consistent with what one would expect from this setting because
multiple chronic episodes are more likely to be combined into a single lengthier and more
expensive episode, while acute episodes are mainly unaffected. We also find that 52.0% of
claims change episode dates (Table 5.16), and 8.8% change ETGs when episode length is not
restricted. Again, the change in claim dates is likely a result of annualized chronic episodes
combining into longer chronic episodes.
Most configuration file changes also produce relatively minimal changes in cost per
episode, episode length, and number of episodes per person (Tables 5.17 and 5.18). However,
allowing unlimited episode length leads to chronic episodes with significantly greater cost and
length, particularly above the 75th percentile. This is also the result of chronic episodes grouping
into longer, expensive episodes. Unlimited episode length has the opposite effect on complete
acute episodes as they have slightly shorter lengths. This effect happens because longer acute
episodes are likely to be considered incomplete. When looking at all chronic and acute episodes,
allowing unlimited episode length results in significantly longer episode lengths and higher cost
(Table 5.17).
5.3.5 Overview of Sensitivities to Changes in Symmetry Input and Configuration Files
The results in this section reveal how the overall picture of Symmetry’s grouping
outcomes varies in response to choices made in structuring its input file and in setting its
configuration options. The following points summarize these findings.
Not including secondary diagnoses in input records (runs 3 and 4) leads to nearly a 5% decrease in the number of episodes, an increase in the share of ungrouped claims from 14.6% to 16.4%, and only minor changes in the distributional properties of chronic and acute episodes. More significantly, it induces the reassignment of over 20% of claims to
Assessment of Results for Symmetry Grouper Using Medicare Data 70
Functionality of the Symmetry ETG and Medstat MEG Software | August 2008 71
different episodes, by ETG or date change, representing more than a 34% shift of costs across episodes.
Switching from using both revenue center and HCPCS/CPT codes to HCPCS/CPT codes alone for OP claims barely affects most of the summary statistics on episode grouping, but causes 3% more OP claims to remain ungrouped and produces a 5% reassignment of claims to different episodes resulting in a corresponding 7% reallocation of costs.
Randomly reordering input records within beneficiary/start-date/end-date categories (Run 6) produces a distinguishable effect on the number of episodes and regroups 0.9% of claims and 1.1% of costs to different episodes.
Extending the episode length limit from 365 to unlimited (Run 7) decreases the number of episodes by nearly 25%, increases the average length of chronic episodes, and produces almost a 9% reassignment of claims and costs to different ETGs.
Other adjustments of Symmetry’s configuration – first diagnosis as primary (Run 8), track comorbidity (Run 9), link facility records (Run 10), days between facility records (Run 11), and custom clean periods (Run 12) – generate only marginal differences in the summary statistics on episodes.
5.4 Practical Considerations in Applying Symmetry Grouper to Medicare Data
In considering the functionality of the Symmetry grouper, we also explore several
practical issues that arise in applying the grouper to capture Medicare practice patterns for
physician attribution. This section highlights two potential considerations. First, we analyze the
ability of Symmetry's episode groupings to emulate two important patterns of care expected
under Medicare’s payment policies: (1) IP stays are normally accompanied by physician
services; and (2) SNF stays constitute a continuation of inpatient care. Second, we investigate
the impact of waiting different lengths of time for claims data to accrue before implementing the
episode grouper. Essentially, this tests the effect of grouping the Medicare claims sooner after
the end of an analysis period (such as 2003) compared to waiting for a longer history of claims
data.
5.4.1 Patterns of Physician Services During IP Stays
As described in Section 2.6, Medicare’s benefit structure pays for flows of services that
influence linkages of IP claims to PB claims. In particular, Medicare pays for E&M services by
a physician during a hospital admission for a medical condition. As a result, one would expect to
see these payments affecting practice patterns. Indeed, the evidence in Table 2.8 clearly
documents that this practice is the norm. The findings in this table reveal that the frequency of
Functionality of the Symmetry ETG and Medstat MEG Software | August 2008 71
Assessment of Results for Symmetry Grouper Using Medicare Data 72
PB claims concurrent with IP stays almost always attains the one-per-day average for the shorter
lengths of stay, and typically attains nearly this average for the longer IP claims.
A question arises concerning the extent to which Symmetry’s episodes link concurrent
PB claims to IP episodes. To answer this question, Table 5.20 mimics the structure of Table 2.8.
In addition to reproducing the information in Table 2.8 showing the share of IP claims with at
least an average of one daily physician visit as counted by all concurrent PB claims, Table 5.20
incorporates rows showing the share of IP claims with concurrent PB claims assigned to the
same episode under the Baseline run of the Symmetry grouper.50 The new column in Table 5.20
designated “Episode Assignment” distinguishes two sets of frequencies. The rows identified as
“No restriction” count concurrent PB claims irrespective of how they are grouped; these
percentages merely replicate the contents of Table 2.8. The rows marked “Same as IP claim”
count only those concurrent PB claims that are grouped to the same episode as their
corresponding IP stay. The second row, for instance, reports the percentage of IP stays that have
an average of one or more PB claims per day assigned to the IP claim’s episode, with rates listed
by length of claim.
Although daily PB and E&M services appear to be the norm in Table 5.20, the PB and
E&M claims for these services are often grouped to different episodes than the IP stay.
Moreover, the longer the IP stay, the more likely these PB services and E&M services are
grouped to other episodes. The middle panel of the table shows the amounts of concurrent PB
services that occur during IP stays along with the degree to which these services are grouped to
their concurrent IP stay. Examining the results for two-day IP stays in Table 5.20, 83% of
inpatient claims have at least daily PB claims grouped to the same episode. Inspection of the
figure directly above this number indicates that this share could be as high as 98% given the
number of concurrent PB claims in the raw data. Moreover, whereas 95% of the 5-day stays
have concurrent PB submissions equaling or exceeding the one-per-day average, only 69% of
these 5-day admissions achieve this daily average when counting only those PB claims grouped
to the same episode as the hospital admission. Turning to the middle panel of the table which
shows the extent of E&M services concurrent with IP stays and the linkage of these services with
50 When pseudo-claims from an IP claim are grouped to different episodes, a PB claim is considered to be assigned to the same episode as the IP claim when it is grouped to the episode that is assigned the cost of the IP claim under the plurality rule.
Assessment of Results for Symmetry Grouper Using Medicare Data 72
Functionality of the Symmetry ETG and Medstat MEG Software | August 2008 73
their respective IP claims, the patterns here mirror those seen for the PB claims in the upper
panel. Referring to the lower panel of the table that restricts E&M claims to include only CPT
codes reflecting hospital visits, one sees that 62% of IP stays lasting 8 to 14 days have sufficient
claims to achieve daily E&M hospital visits, but only 26% of IP claims have enough E&M
hospital-visit claims grouped to them to attain daily visits during the stay. Inspection of the last
entries in the "Overall Match Rate" column reveals that virtually all IP stays (95%) have at least
one PB claim for an E&M hospital visit, but only 77% have at least one of these claims grouped
to the same episode. Entries in this column above these indicate that 69% of IP stays have daily
E&M hospital visits, but only 42% have daily visits grouped to the same episode.
Given these findings, we explored alternatives to the Baseline run of the Symmetry
grouper to investigate whether a closer match could be attained between assignments of IP
claims and concurrent PB claims. One reason that physician claims may not group with
institutional claims is that more than one diagnosis may be needed to enhance linkage of claims.
To expand the information on the PB claim beyond the single line item diagnosis, we added
diagnoses from the header record that accompanies Part B claims. Up to four "header" diagnoses
are found on each Medicare PB claim, which apply to all of the individual line items on the
claim. This modification essentially expands the number of diagnoses from one to as many as
four: the primary diagnoses being the line-tem diagnosis, and up to three being co-morbid
conditions. Our Baseline run relies on only the line diagnosis for both PB and DME claims.
Table 5.21 presents summary statistics describing the grouping results produced by this
modification of the input files used to run the ETG grouper. Including PB header diagnoses in
addition to the line-item diagnosis leads to a fairly large drop in the percentage of ungrouped
claims, from 14.6% to 8.9%, and a 5.1 percentage point increase in the share of chronic episodes.
This is what one would expect: the additional diagnoses on PB claims allow them to be grouped
to more often to different episodes. One motivation behind including these additional diagnoses
is to allow more PB claims (especially E&M claims) that occur during the course of a Room &
Board (R&B) IP claim to be grouped to the same episode as that stay.
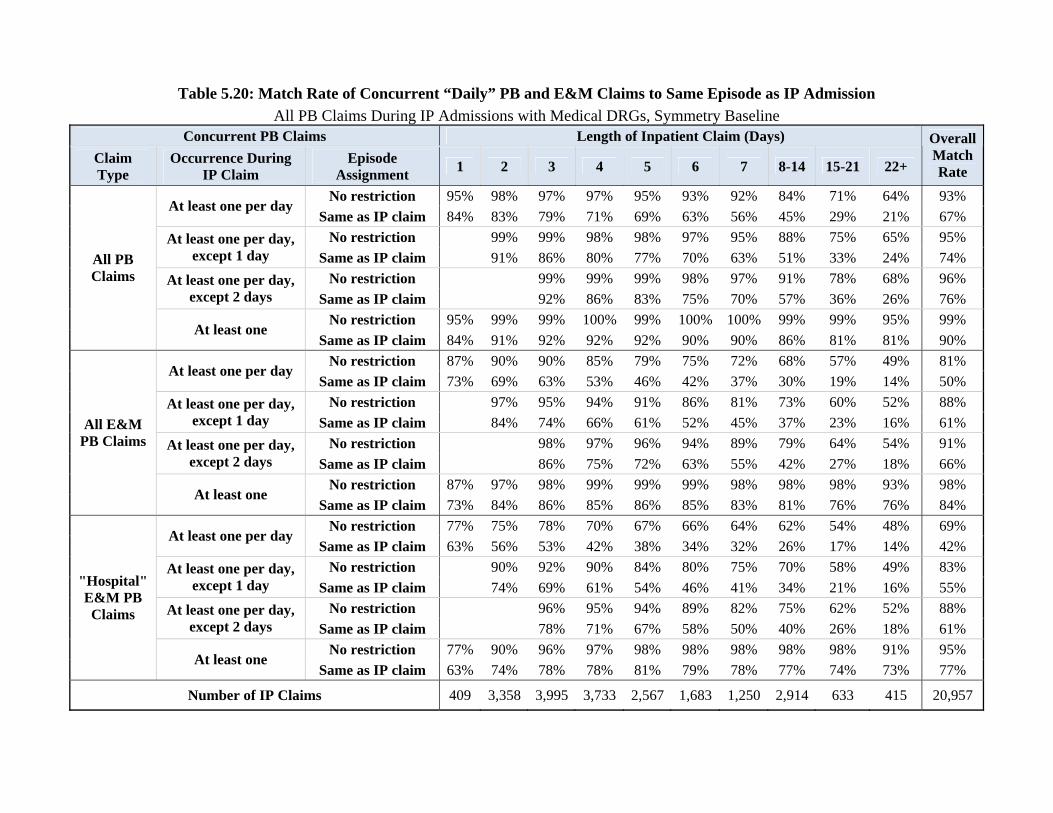
Table 5.20: Match Rate of Concurrent “Daily” PB and E&M Claims to Same Episode as IP Admission
All PB Claims During IP Admissions with Medical DRGs, Symmetry Baseline Concurrent PB Claims Length of Inpatient Claim (Days)
Claim Type
Occurrence During IP Claim
Episode Assignment
1 2 3 4 5 6 7 8-14 15-21 22+
OverallMatchRate
No restriction 95% 98% 97% 97% 95% 93% 92% 84% 71% 64% 93% At least one per day
Same as IP claim 84% 83% 79% 71% 69% 63% 56% 45% 29% 21% 67%
No restriction 99% 99% 98% 98% 97% 95% 88% 75% 65% 95% At least one per day, except 1 day Same as IP claim 91% 86% 80% 77% 70% 63% 51% 33% 24% 74%
No restriction 99% 99% 99% 98% 97% 91% 78% 68% 96% At least one per day, except 2 days Same as IP claim 92% 86% 83% 75% 70% 57% 36% 26% 76%
No restriction 95% 99% 99% 100% 99% 100% 100% 99% 99% 95% 99%
All PB Claims
At least one Same as IP claim 84% 91% 92% 92% 92% 90% 90% 86% 81% 81% 90%
No restriction 87% 90% 90% 85% 79% 75% 72% 68% 57% 49% 81% At least one per day
Same as IP claim 73% 69% 63% 53% 46% 42% 37% 30% 19% 14% 50%
No restriction 97% 95% 94% 91% 86% 81% 73% 60% 52% 88% At least one per day, except 1 day Same as IP claim 84% 74% 66% 61% 52% 45% 37% 23% 16% 61%
No restriction 98% 97% 96% 94% 89% 79% 64% 54% 91% At least one per day, except 2 days Same as IP claim 86% 75% 72% 63% 55% 42% 27% 18% 66%
No restriction 87% 97% 98% 99% 99% 99% 98% 98% 98% 93% 98%
All E&M PB Claims
At least one Same as IP claim 73% 84% 86% 85% 86% 85% 83% 81% 76% 76% 84%
No restriction 77% 75% 78% 70% 67% 66% 64% 62% 54% 48% 69% At least one per day
Same as IP claim 63% 56% 53% 42% 38% 34% 32% 26% 17% 14% 42%
No restriction 90% 92% 90% 84% 80% 75% 70% 58% 49% 83% At least one per day, except 1 day Same as IP claim 74% 69% 61% 54% 46% 41% 34% 21% 16% 55%
No restriction 96% 95% 94% 89% 82% 75% 62% 52% 88% At least one per day, except 2 days Same as IP claim 78% 71% 67% 58% 50% 40% 26% 18% 61%
No restriction 77% 90% 96% 97% 98% 98% 98% 98% 98% 91% 95%
"Hospital" E&M PB Claims
At least one Same as IP claim 63% 74% 78% 78% 81% 79% 78% 77% 74% 73% 77%
Number of IP Claims 409 3,358 3,995 3,733 2,567 1,683 1,250 2,914 633 415 20,957
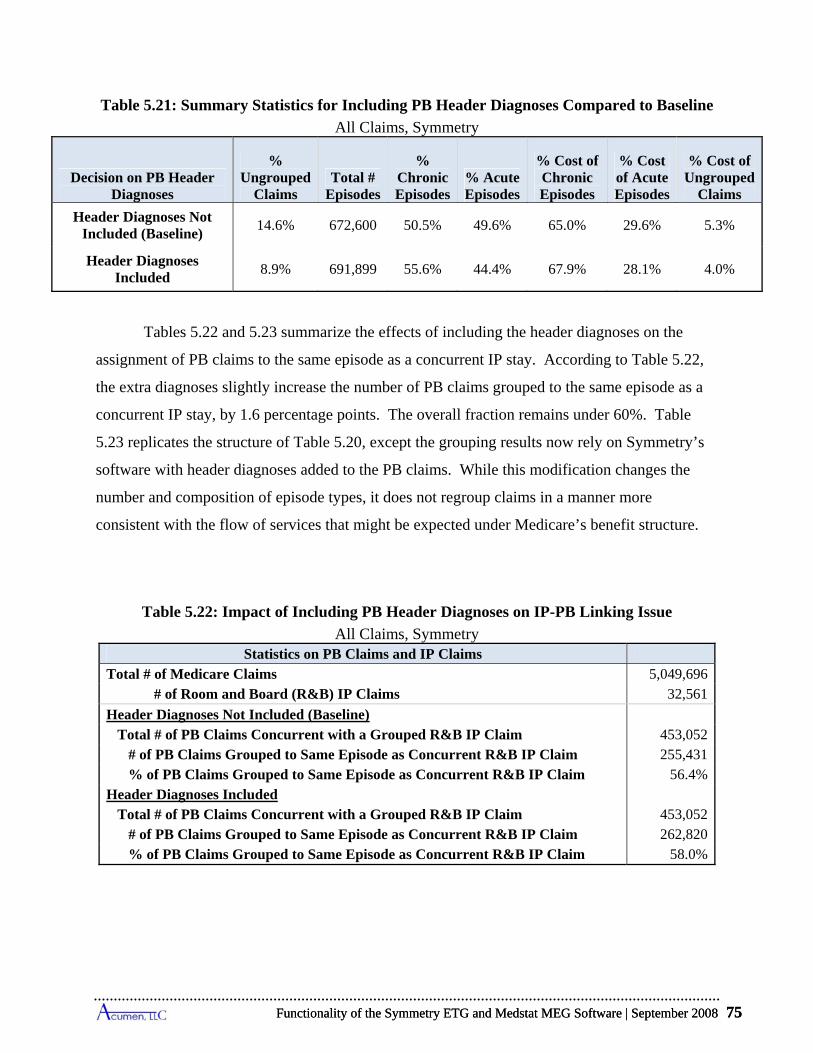
Functionality of the Symmetry ETG and Medstat MEG Software | September 2008 75
Table 5.21: Summary Statistics for Including PB Header Diagnoses Compared to Baseline
All Claims, Symmetry
Decision on PB Header Diagnoses
% Ungrouped
Claims Total #
Episodes
% Chronic Episodes
% Acute Episodes
% Cost of Chronic Episodes
% Cost of Acute Episodes
% Cost of Ungrouped
Claims
Header Diagnoses Not Included (Baseline)
14.6% 672,600 50.5% 49.6% 65.0% 29.6% 5.3%
Header Diagnoses Included
8.9% 691,899 55.6% 44.4% 67.9% 28.1% 4.0%
Tables 5.22 and 5.23 summarize the effects of including the header diagnoses on the
assignment of PB claims to the same episode as a concurrent IP stay. According to Table 5.22,
the extra diagnoses slightly increase the number of PB claims grouped to the same episode as a
concurrent IP stay, by 1.6 percentage points. The overall fraction remains under 60%. Table
5.23 replicates the structure of Table 5.20, except the grouping results now rely on Symmetry’s
software with header diagnoses added to the PB claims. While this modification changes the
number and composition of episode types, it does not regroup claims in a manner more
consistent with the flow of services that might be expected under Medicare’s benefit structure.
Table 5.22: Impact of Including PB Header Diagnoses on IP-PB Linking Issue
All Claims, Symmetry Statistics on PB Claims and IP Claims
Total # of Medicare Claims 5,049,696 # of Room and Board (R&B) IP Claims 32,561
Header Diagnoses Not Included (Baseline) Total # of PB Claims Concurrent with a Grouped R&B IP Claim 453,052 # of PB Claims Grouped to Same Episode as Concurrent R&B IP Claim 255,431 % of PB Claims Grouped to Same Episode as Concurrent R&B IP Claim 56.4%Header Diagnoses Included Total # of PB Claims Concurrent with a Grouped R&B IP Claim 453,052 # of PB Claims Grouped to Same Episode as Concurrent R&B IP Claim 262,820 % of PB Claims Grouped to Same Episode as Concurrent R&B IP Claim 58.0%
Functionality of the Symmetry ETG and Medstat MEG Software | September 2008 75
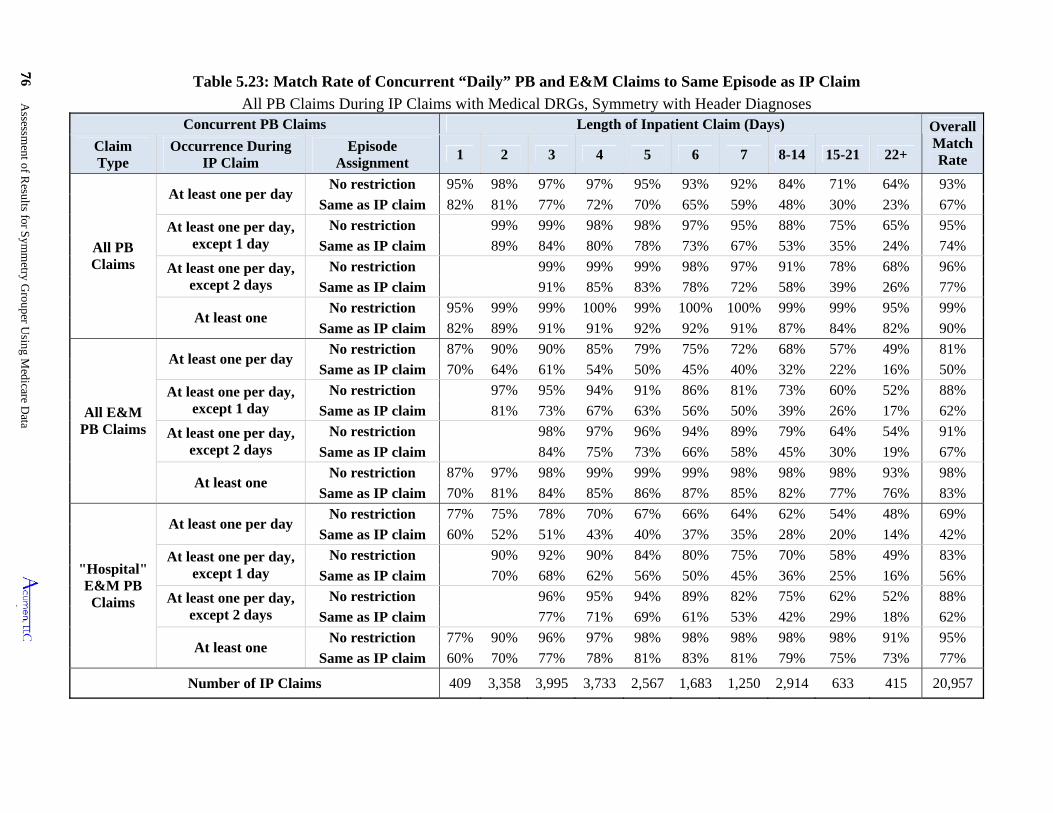
76 Assessm
ent of Results for S
ymm
etry Grouper U
sing Medicare D
ata
7
Table 5.23: Match Rate of Concurrent “Daily” PB and E&M Claims to Same Episode as IP Claim
All PB Claims During IP Claims with Medical DRGs, Symmetry with Header Diagnoses Concurrent PB Claims Length of Inpatient Claim (Days) Overall
Match Rate
Claim Type
Occurrence During IP Claim
Episode Assignment
1 2 3 4 5 6 7 8-14 15-21 22+
All PB Claims
At least one per day No restriction 95% 98% 97% 97% 95% 93% 92% 84% 71% 64% 93%
Same as IP claim 82% 81% 77% 72% 70% 65% 59% 48% 30% 23% 67%
At least one per day, except 1 day
No restriction 99% 99% 98% 98% 97% 95% 88% 75% 65% 95%
Same as IP claim 89% 84% 80% 78% 73% 67% 53% 35% 24% 74%
At least one per day, except 2 days
No restriction 99% 99% 99% 98% 97% 91% 78% 68% 96%
Same as IP claim 91% 85% 83% 78% 72% 58% 39% 26% 77%
At least one No restriction 95% 99% 99% 100% 99% 100% 100% 99% 99% 95% 99%
Same as IP claim 82% 89% 91% 91% 92% 92% 91% 87% 84% 82% 90%
All E&M PB Claims
At least one per day No restriction 87% 90% 90% 85% 79% 75% 72% 68% 57% 49% 81%
Same as IP claim 70% 64% 61% 54% 50% 45% 40% 32% 22% 16% 50%
At least one per day, except 1 day
No restriction 97% 95% 94% 91% 86% 81% 73% 60% 52% 88%
Same as IP claim 81% 73% 67% 63% 56% 50% 39% 26% 17% 62%
At least one per day, except 2 days
No restriction 98% 97% 96% 94% 89% 79% 64% 54% 91%
Same as IP claim 84% 75% 73% 66% 58% 45% 30% 19% 67%
At least one No restriction 87% 97% 98% 99% 99% 99% 98% 98% 98% 93% 98%
Same as IP claim 70% 81% 84% 85% 86% 87% 85% 82% 77% 76% 83%
"Hospital" E&M PB Claims
At least one per day No restriction 77% 75% 78% 70% 67% 66% 64% 62% 54% 48% 69%
Same as IP claim 60% 52% 51% 43% 40% 37% 35% 28% 20% 14% 42%
At least one per day, except 1 day
No restriction 90% 92% 90% 84% 80% 75% 70% 58% 49% 83%
Same as IP claim 70% 68% 62% 56% 50% 45% 36% 25% 16% 56%
At least one per day, except 2 days
No restriction 96% 95% 94% 89% 82% 75% 62% 52% 88%
Same as IP claim 77% 71% 69% 61% 53% 42% 29% 18% 62%
At least one No restriction 77% 90% 96% 97% 98% 98% 98% 98% 98% 91% 95%
Same as IP claim 60% 70% 77% 78% 81% 83% 81% 79% 75% 73% 77%
Number of IP Claims 409 3,358 3,995 3,733 2,567 1,683 1,250 2,914 633 415 20,957
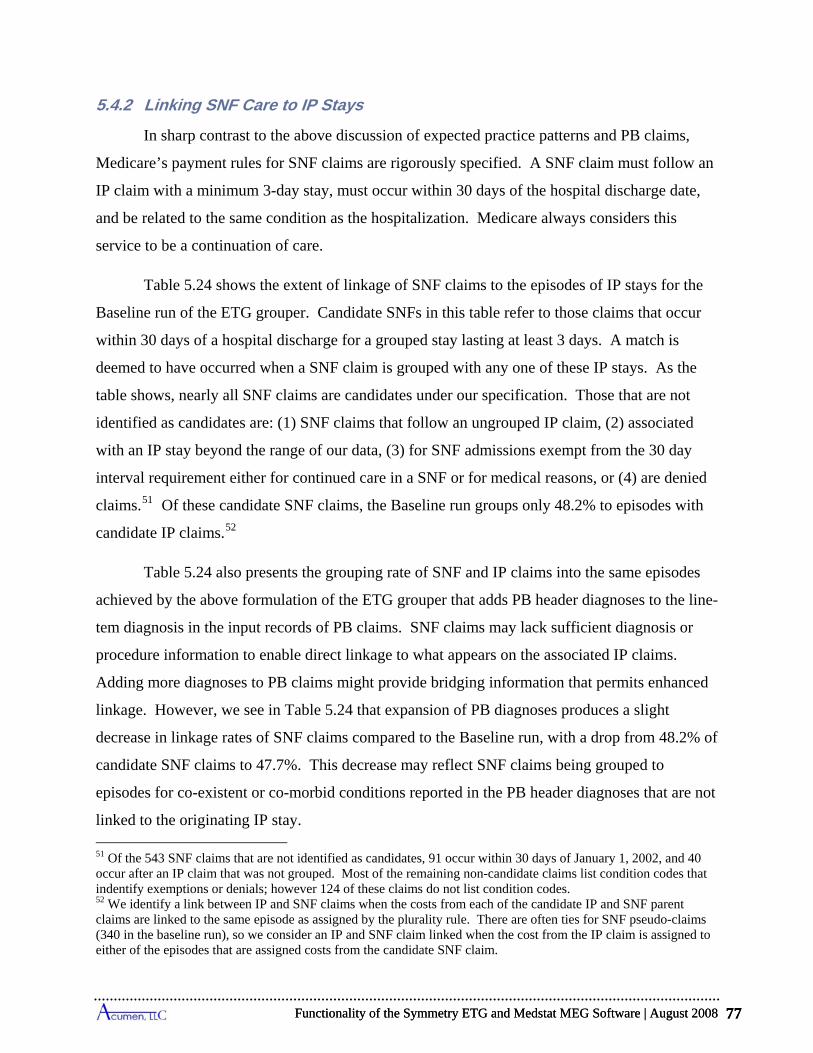
Functionality of the Symmetry ETG and Medstat MEG Software | August 2008 77
5.4.2 Linking SNF Care to IP Stays
In sharp contrast to the above discussion of expected practice patterns and PB claims,
Medicare’s payment rules for SNF claims are rigorously specified. A SNF claim must follow an
IP claim with a minimum 3-day stay, must occur within 30 days of the hospital discharge date,
and be related to the same condition as the hospitalization. Medicare always considers this
service to be a continuation of care.
Table 5.24 shows the extent of linkage of SNF claims to the episodes of IP stays for the
Baseline run of the ETG grouper. Candidate SNFs in this table refer to those claims that occur
within 30 days of a hospital discharge for a grouped stay lasting at least 3 days. A match is
deemed to have occurred when a SNF claim is grouped with any one of these IP stays. As the
table shows, nearly all SNF claims are candidates under our specification. Those that are not
identified as candidates are: (1) SNF claims that follow an ungrouped IP claim, (2) associated
with an IP stay beyond the range of our data, (3) for SNF admissions exempt from the 30 day
interval requirement either for continued care in a SNF or for medical reasons, or (4) are denied
claims.51 Of these candidate SNF claims, the Baseline run groups only 48.2% to episodes with
candidate IP claims.52
Table 5.24 also presents the grouping rate of SNF and IP claims into the same episodes
achieved by the above formulation of the ETG grouper that adds PB header diagnoses to the line-
tem diagnosis in the input records of PB claims. SNF claims may lack sufficient diagnosis or
procedure information to enable direct linkage to what appears on the associated IP claims.
Adding more diagnoses to PB claims might provide bridging information that permits enhanced
linkage. However, we see in Table 5.24 that expansion of PB diagnoses produces a slight
decrease in linkage rates of SNF claims compared to the Baseline run, with a drop from 48.2% of
candidate SNF claims to 47.7%. This decrease may reflect SNF claims being grouped to
episodes for co-existent or co-morbid conditions reported in the PB header diagnoses that are not
linked to the originating IP stay.
51 Of the 543 SNF claims that are not identified as candidates, 91 occur within 30 days of January 1, 2002, and 40 occur after an IP claim that was not grouped. Most of the remaining non-candidate claims list condition codes that indentify exemptions or denials; however 124 of these claims do not list condition codes. 52 We identify a link between IP and SNF claims when the costs from each of the candidate IP and SNF parent claims are linked to the same episode as assigned by the plurality rule. There are often ties for SNF pseudo-claims (340 in the baseline run), so we consider an IP and SNF claim linked when the cost from the IP claim is assigned to either of the episodes that are assigned costs from the candidate SNF claim.
Functionality of the Symmetry ETG and Medstat MEG Software | August 2008 77
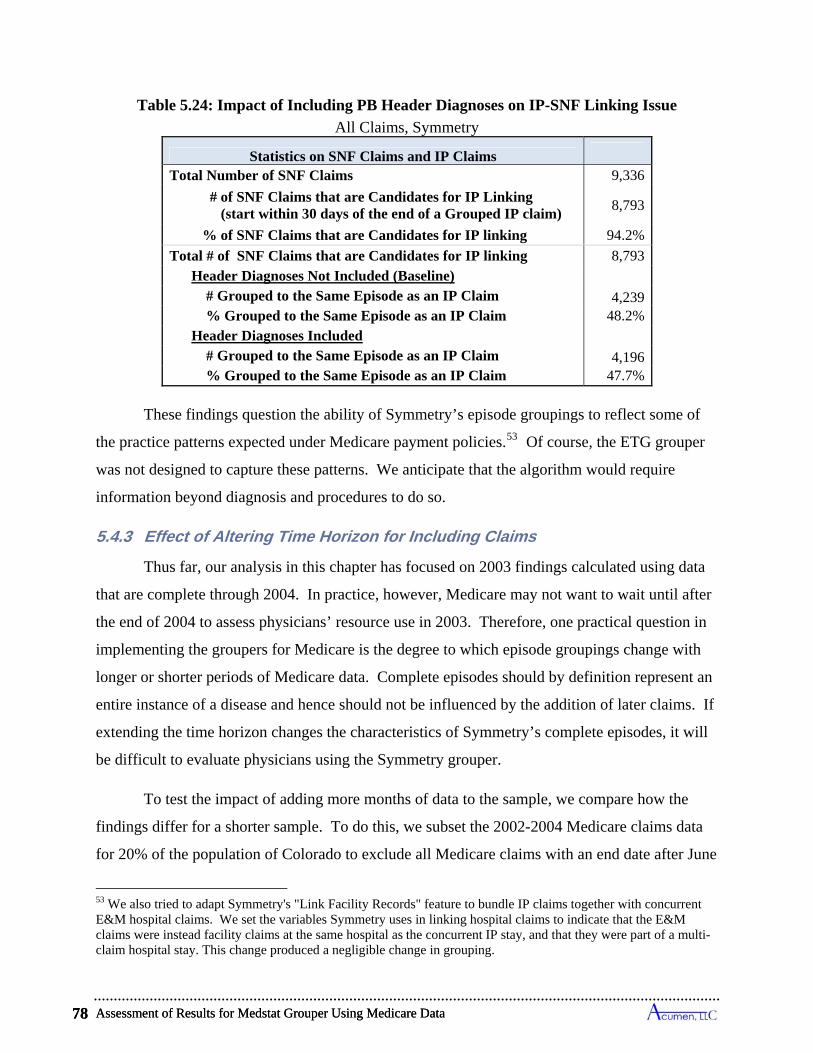
Assessment of Results for Medstat Grouper Using Medicare Data 78
Table 5.24: Impact of Including PB Header Diagnoses on IP-SNF Linking Issue
All Claims, Symmetry
Statistics on SNF Claims and IP Claims
Total Number of SNF Claims 9,336
# of SNF Claims that are Candidates for IP Linking (start within 30 days of the end of a Grouped IP claim)
8,793
% of SNF Claims that are Candidates for IP linking 94.2%
Total # of SNF Claims that are Candidates for IP linking 8,793 Header Diagnoses Not Included (Baseline) # Grouped to the Same Episode as an IP Claim 4,239 % Grouped to the Same Episode as an IP Claim 48.2% Header Diagnoses Included # Grouped to the Same Episode as an IP Claim 4,196 % Grouped to the Same Episode as an IP Claim 47.7%
These findings question the ability of Symmetry’s episode groupings to reflect some of
the practice patterns expected under Medicare payment policies.53 Of course, the ETG grouper
was not designed to capture these patterns. We anticipate that the algorithm would require
information beyond diagnosis and procedures to do so.
5.4.3 Effect of Altering Time Horizon for Including Claims
Thus far, our analysis in this chapter has focused on 2003 findings calculated using data
that are complete through 2004. In practice, however, Medicare may not want to wait until after
the end of 2004 to assess physicians’ resource use in 2003. Therefore, one practical question in
implementing the groupers for Medicare is the degree to which episode groupings change with
longer or shorter periods of Medicare data. Complete episodes should by definition represent an
entire instance of a disease and hence should not be influenced by the addition of later claims. If
extending the time horizon changes the characteristics of Symmetry’s complete episodes, it will
be difficult to evaluate physicians using the Symmetry grouper.
To test the impact of adding more months of data to the sample, we compare how the
findings differ for a shorter sample. To do this, we subset the 2002-2004 Medicare claims data
for 20% of the population of Colorado to exclude all Medicare claims with an end date after June
53 We also tried to adapt Symmetry's "Link Facility Records" feature to bundle IP claims together with concurrent E&M hospital claims. We set the variables Symmetry uses in linking hospital claims to indicate that the E&M claims were instead facility claims at the same hospital as the concurrent IP stay, and that they were part of a multi-claim hospital stay. This change produced a negligible change in grouping.
Assessment of Results for Medstat Grouper Using Medicare Data 78
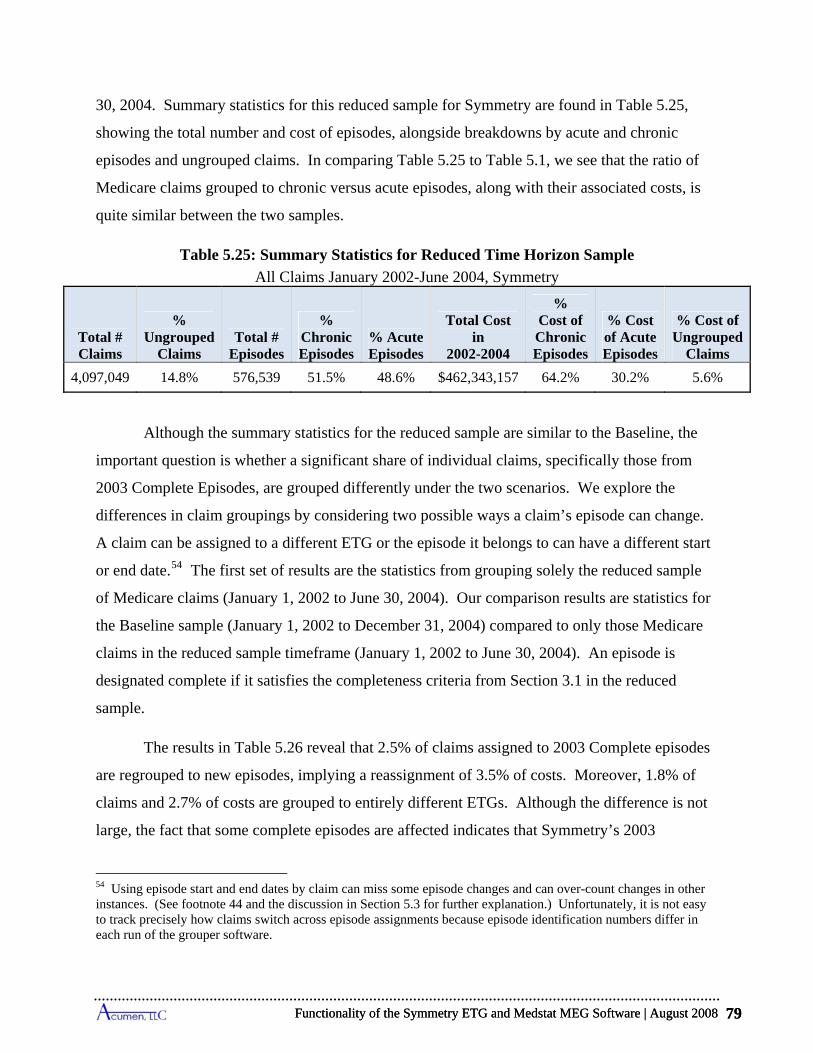
re
Functionality of the Symmetry ETG and Medstat MEG Software | August 2008 79
30, 2004. Summary statistics for this reduced sample for Symmetry are found in Table 5.25,
showing the total number and cost of episodes, alongside breakdowns by acute and chronic
episodes and ungrouped claims. In comparing Table 5.25 to Table 5.1, we see that the ratio of
Medicare claims grouped to chronic versus acute episodes, along with their associated costs, is
quite similar between the two samples.
Table 5.25: Summary Statistics for Reduced Time Horizon Sample
All Claims January 2002-June 2004, Symmetry
Total # Claims
% Ungrouped
Claims Total #
Episodes
% Chronic Episodes
% Acute Episodes
Total Cost in
2002-2004
% Cost of Chronic Episodes
% Cost of Acute Episodes
% Cost of Ungrouped
Claims
4,097,049 14.8% 576,539 51.5% 48.6% $462,343,157 64.2% 30.2% 5.6%
Although the summary statistics for the reduced sample are similar to the Baseline, the
important question is whether a significant share of individual claims, specifically those from
2003 Complete Episodes, are grouped differently under the two scenarios. We explore the
differences in claim groupings by considering two possible ways a claim’s episode can change.
A claim can be assigned to a different ETG or the episode it belongs to can have a different start
or end date.54 The first set of results are the statistics from grouping solely the reduced sample
of Medicare claims (January 1, 2002 to June 30, 2004). Our comparison results are statistics for
the Baseline sample (January 1, 2002 to December 31, 2004) compared to only those Medica
claims in the reduced sample timeframe (January 1, 2002 to June 30, 2004). An episode is
designated complete if it satisfies the completeness criteria from Section 3.1 in the reduced
sample.
The results in Table 5.26 reveal that 2.5% of claims assigned to 2003 Complete episodes
are regrouped to new episodes, implying a reassignment of 3.5% of costs. Moreover, 1.8% of
claims and 2.7% of costs are grouped to entirely different ETGs. Although the difference is not
large, the fact that some complete episodes are affected indicates that Symmetry’s 2003
54 Using episode start and end dates by claim can miss some episode changes and can over-count changes in other instances. (See footnote 44 and the discussion in Section 5.3 for further explanation.) Unfortunately, it is not easy to track precisely how claims switch across episode assignments because episode identification numbers differ in each run of the grouper software.
Functionality of the Symmetry ETG and Medstat MEG Software | August 2008 79
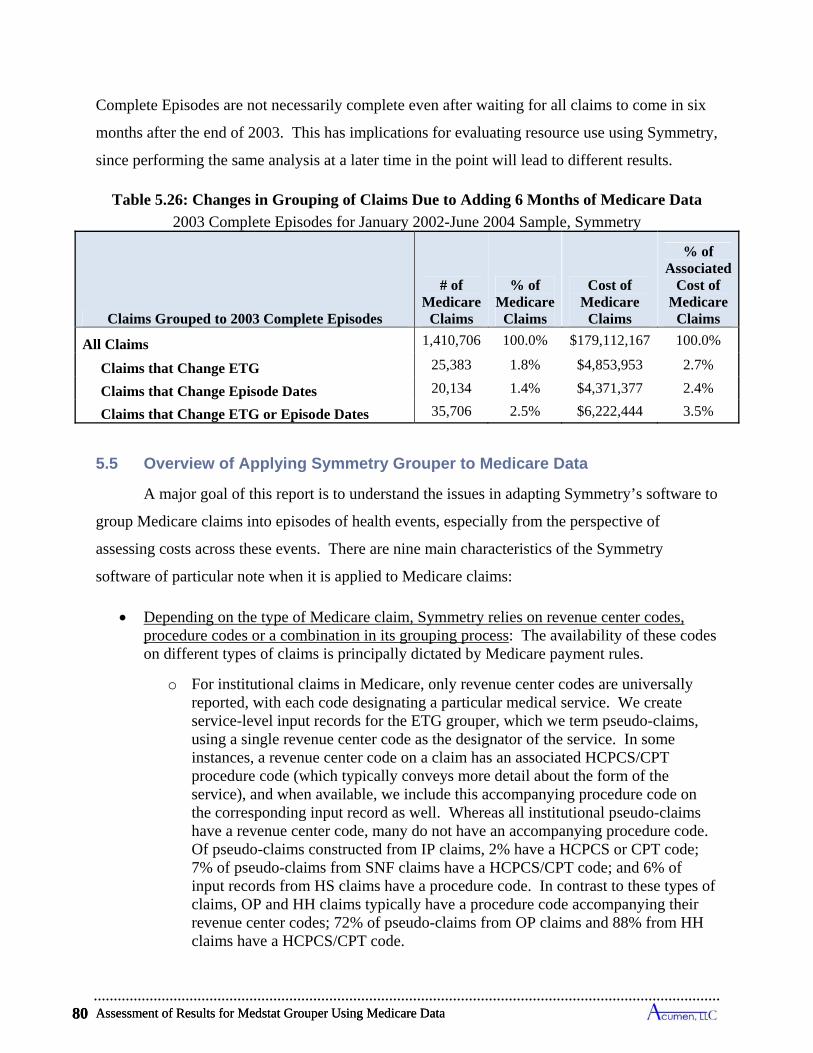
Assessment of Results for Medstat Grouper Using Medicare Data 80
Complete Episodes are not necessarily complete even after waiting for all claims to come in six
months after the end of 2003. This has implications for evaluating resource use using Symmetry,
since performing the same analysis at a later time in the point will lead to different results.
Table 5.26: Changes in Grouping of Claims Due to Adding 6 Months of Medicare Data
2003 Complete Episodes for January 2002-June 2004 Sample, Symmetry
Claims Grouped to 2003 Complete Episodes
# of Medicare
Claims
% of Medicare
Claims
Cost of Medicare
Claims
% of Associated
Cost of Medicare
Claims
All Claims 1,410,706 100.0% $179,112,167 100.0%
Claims that Change ETG 25,383 1.8% $4,853,953 2.7%
Claims that Change Episode Dates 20,134 1.4% $4,371,377 2.4%
Claims that Change ETG or Episode Dates 35,706 2.5% $6,222,444 3.5%
5.5 Overview of Applying Symmetry Grouper to Medicare Data
A major goal of this report is to understand the issues in adapting Symmetry’s software to
group Medicare claims into episodes of health events, especially from the perspective of
assessing costs across these events. There are nine main characteristics of the Symmetry
software of particular note when it is applied to Medicare claims:
Depending on the type of Medicare claim, Symmetry relies on revenue center codes, procedure codes or a combination in its grouping process: The availability of these codes on different types of claims is principally dictated by Medicare payment rules.
o For institutional claims in Medicare, only revenue center codes are universally reported, with each code designating a particular medical service. We create service-level input records for the ETG grouper, which we term pseudo-claims, using a single revenue center code as the designator of the service. In some instances, a revenue center code on a claim has an associated HCPCS/CPT procedure code (which typically conveys more detail about the form of the service), and when available, we include this accompanying procedure code on the corresponding input record as well. Whereas all institutional pseudo-claims have a revenue center code, many do not have an accompanying procedure code. Of pseudo-claims constructed from IP claims, 2% have a HCPCS or CPT code; 7% of pseudo-claims from SNF claims have a HCPCS/CPT code; and 6% of input records from HS claims have a procedure code. In contrast to these types of claims, OP and HH claims typically have a procedure code accompanying their revenue center codes; 72% of pseudo-claims from OP claims and 88% from HH claims have a HCPCS/CPT code.
Assessment of Results for Medstat Grouper Using Medicare Data 80
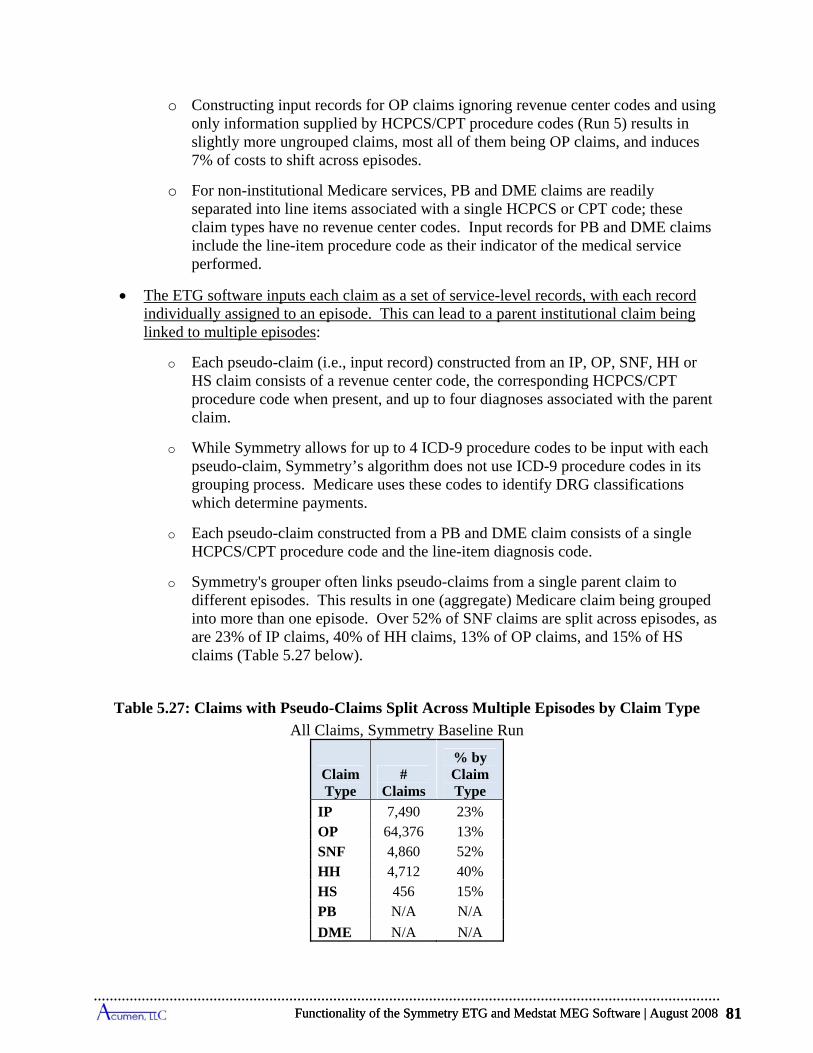
Functionality of the Symmetry ETG and Medstat MEG Software | August 2008 81
o Constructing input records for OP claims ignoring revenue center codes and using only information supplied by HCPCS/CPT procedure codes (Run 5) results in slightly more ungrouped claims, most all of them being OP claims, and induces 7% of costs to shift across episodes.
o For non-institutional Medicare services, PB and DME claims are readily separated into line items associated with a single HCPCS or CPT code; these claim types have no revenue center codes. Input records for PB and DME claims include the line-item procedure code as their indicator of the medical service performed.
The ETG software inputs each claim as a set of service-level records, with each record individually assigned to an episode. This can lead to a parent institutional claim being linked to multiple episodes:
o Each pseudo-claim (i.e., input record) constructed from an IP, OP, SNF, HH or HS claim consists of a revenue center code, the corresponding HCPCS/CPT procedure code when present, and up to four diagnoses associated with the parent claim.
o While Symmetry allows for up to 4 ICD-9 procedure codes to be input with each pseudo-claim, Symmetry’s algorithm does not use ICD-9 procedure codes in its grouping process. Medicare uses these codes to identify DRG classifications which determine payments.
o Each pseudo-claim constructed from a PB and DME claim consists of a single HCPCS/CPT procedure code and the line-item diagnosis code.
o Symmetry's grouper often links pseudo-claims from a single parent claim to different episodes. This results in one (aggregate) Medicare claim being grouped into more than one episode. Over 52% of SNF claims are split across episodes, as are 23% of IP claims, 40% of HH claims, 13% of OP claims, and 15% of HS claims (Table 5.27 below).
Table 5.27: Claims with Pseudo-Claims Split Across Multiple Episodes by Claim Type
All Claims, Symmetry Baseline Run
ClaimType
# Claims
% by Claim Type
IP 7,490 23% OP 64,376 13% SNF 4,860 52% HH 4,712 40% HS 456 15% PB N/A N/A
DME N/A N/A
Functionality of the Symmetry ETG and Medstat MEG Software | August 2008 81

Assessment of Results for Medstat Grouper Using Medicare Data 82
Medicare claims data commonly have more diagnosis codes than are accepted in Symmetry input records:
o The ETG grouper’s input records can incorporate up to 4 diagnosis codes. 82% of IP claims, 70% of SNF claims, and 38% of HH claims have more than 4 codes.
o Our investigations suggest that the inclusion of extra diagnoses on input records is unlikely to alter the number and distributional characteristics of episodes, but it could induce appreciable shifts in claims across episode types. Using just the primary diagnosis code (Run 3) leads to only a 5% decrease in the number of episodes, small changes in the distributions of their costs and lengths, and only a 1.8 percentage point rise in the cost of ungrouped claims compared to using the first 4 codes. However, without any secondary diagnoses, 21% of claims either change ETGs or episode dates (implying episode shifts), which results in 35% of claim costs being redistributed to other episodes.
The construction of Complete Episodes generally approximates the annual cost of claims assigned to the different ETG categories: Complete episodes include all chronic episodes ending in 2003, and only those acute episodes that begin at least one clean period after the beginning of 2002 and end in 2003.
o The costs of claims grouped to 2003 Complete Episodes for an ETG closely approximate the annual costs assignable to ETGs within a calendar year. The cost of 2003 Complete Chronic Episodes equals 99% of the annual claims costs assigned to chronic episodes in the year 2003; and the corresponding figure for all acute episodes is 93% of annual claims cost.
o Symmetry divides acute conditions into complete episodes using clean periods. For the top ten highest-cost acute ETGs, episodes of the same type sometimes occur within the designated clean period when the dates of claims are used to identify the beginnings and ends of episodes. In particular, depending on the type of ETG, between 0.6% and 35.4% of the same-type episodes take place within clean periods. In some rare instances, these episodes can even overlap, meaning that one episode starts before the prior one ends.
o Symmetry starts and terminates chronic episodes in fixed 12-month periods. For the vast majority of afflicted individuals, one chronic episode immediately follows another. For the top ten highest-cost chronic ETGs, chronic episodes of the same ETG run as continuous events for individuals between 18% and 81% of the time depending on the type of chronic condition.
Considerable variation exists in the costs of individual episodes within an ETG:
o The distributions of costs across episodes within an ETG exhibit substantial dispersion. For instance, for each of the top five highest-cost acute and chronic ETGs, the level of cost demarking the most expensive 10% of episodes always exceeds the level demarking the cheapest 10% by at least a factor of four, and in most instances it is far more than two orders of magnitude larger.
Assessment of Results for Medstat Grouper Using Medicare Data 82
Functionality of the Symmetry ETG and Medstat MEG Software | August 2008 83
o These distributions also reveal that the highest-cost episodes account for large shares of total ETG costs. For the top five acute ETGs, the most expensive 5% of episodes alone account for 15% to 42% of total annual cost for the ETG, and for the top five chronic ETGs this range is 26% to 50%.
o This large amount of cost variation suggests that devising a reliable method of risk adjustment for episodes and beneficiary costs necessary for profiling providers in Medicare settings requires approaches not yet available in the existing ETG software. With multiple comorbidities often present and patients that tend to be much more complex, the risk and severity models developed for commercial populations are unlikely to work as effectively in the Medicare population.
Symmetry’s grouping results depend on the order in which records are input into the grouper:
o The ETG grouper requires input records be sorted by beneficiary as well as claim start and end dates. The sort order of records within these beneficiary/start-date/end-date compilations is arbitrary, and yet changing this order produces different grouping results for a notable number of beneficiaries.
o In a typical example (Run 6), we show that reordering within these beneficiary/start-date/end-date compilations leads to a change in the assigned ETG type for 0.4% of Medicare claims. More significantly, 0.9% of Medicare claims change their assigned ETGs or episode dates, implying a 1.1% reallocation of Medicare costs to different episodes of care.
Symmetry’s groupings of 2003 Complete Episodes depend on the time horizons used to include claims in 2004:
o Even after including claims from the first half of 2004, adding claims for the second 6 months of 2004 produces changes in the formulation of 2003 Complete Episodes. In particular, 2.5% of claims accounting for 3.5% of costs are moved to a different 2003 episode by adding the 6-month extension of the time horizon in 2004. While this shift is not large, one might expect virtually no impact on 2003 Complete Episodes since the first 6 months of 2004 already well exceeds the longest clean period of any acute ETG and chronic ETGs are truncated on an annual basis.
o In a Medicare policy setting, this finding implies that 2003 grouping results will depend on the horizon specified in 2004 when claims will no longer be counted; counting claims with service dates up until mid-year 2004 will produce somewhat different findings than waiting for all claims in 2004.
Symmetry offers no guidance on how to allocate the cost of a Medicare claim to its pseudo-claims, leaving questions about how to apportion the cost of the claim across its linked episodes:
Functionality of the Symmetry ETG and Medstat MEG Software | August 2008 83
Assessment of Results for Medstat Grouper Using Medicare Data 84
o When Symmetry assigns the pseudo-claims of a single Medicare claim to multiple episodes, one faces the challenge of how to distribute the cost of this claim across these episodes. Our analysis allocates the entire claim payment to only one of its episodes based on a majority rule, with all remaining episodes receiving none of the claim’s cost. Like any such allocation rule, ours may be inappropriate for assessing the costs of episodes.
o An alternative way to resolve the cost allocation problem is to input each institutional claim as a single record. Symmetry limits this record to include at most one revenue center code and one procedure code from the original claim. With many codes appearing on claims, the choice of which single revenue and/or procedure code to include on the single input record may be somewhat subjective. (Selecting the room and board revenue center code is a popular option, but many institutional claims lack this code.) The choice will affect the way Symmetry groups claims to episodes (a logical inference because pseudo-claims, which differ only by revenue/procedure codes, do get grouped into different episodes).
The ETG grouping algorithms are not designed to follow the flow of services expected under Medicare’s benefit structures, and episodes constructed by Symmetry often do not emulate some of the practice patterns seen in Medicare data.
o Medicare’s payment polices promote medical care that link IP stays to post-acute care and to physician services. For post-acute care, this concept is embedded in the Medicare benefit rules; SNF claims are only paid when they are a continuation of inpatient care. For physician claims, Medicare pays for E&M services during IP stays (e.g., daily visits during an admission for a medical condition). Near daily PB visits are, in fact, the norm for IP stays in Medicare data.
o The ETG grouper does not explicitly incorporate these Medicare practice norms and does not fully capture them in its construction of episodes. Only 48% of SNF claims are grouped to the same episodes as the initiating IP claims. Overall, 69% of IP stays have daily E&M hospital visits, but only 42% have daily visits grouped to the same episode by Symmetry. Moreover, the ETG grouper often assigns components of a single IP claim to multiple episodes, which raises the issue of how to allocate the various SNF and IP-affiliated PB claims to the candidate episodes.
o In an attempt to strengthen agreement with Medicare policies, we expanded the number of diagnoses on PB claims by adding "header" diagnoses. Including these additional diagnoses only slightly increases the fraction of PB claims assigned to the same episode as a concurrent IP stay, from 56.4% to 58%. This approach also slightly decreases the fraction of SNF claims grouped to the same episode as an IP stay from 48.2% to 47.7%. While this modification significantly changes the number and composition of episodes, it fails to regroup claims in a manner more consistent with Medicare’s concept of treatment episodes.
Assessment of Results for Medstat Grouper Using Medicare Data 84
Functionality of the Symmetry ETG and Medstat MEG Software | August 2008 85
6 SPECIFICATION OF BASELINE APPLICATION OF MEDSTAT GROUPER TO MEDICARE DATA
For each of the groupers, we establish a specification of input file characteristics and
software configuration settings that represent our “Baseline” application of the grouper software.
Within the normal settings of the software, the Baseline represents our determination of the input
file and configuration options that best suit the Medicare claims data. This chapter describes the
Baseline application of the Medstat grouper to Medicare claims, including the major decisions
that go into the selection of this application. We also describe the output file produced by
Medstat and its role in our analysis. The following chapter presents the findings from the
Baseline run using these settings, as well as comparisons using alternative specifications.
6.1 Structure of Medstat Input File for Baseline Run
The Medstat MEG software organizes its input files so that each record represents a
single claim. In structuring the input file for the Medstat software, however, decisions must be
made regarding the use of diagnosis codes and procedure codes; revenue center codes are not
used by Medstat. Additionally, Medstat does call for the inclusion of x-ray/lab flags for
appropriate procedures. Start and end dates, and payment amounts for each claim are also
entered, but are not discussed here (see Chapter 2). In this subsection, we describe the choices
made on each of these input elements for the Baseline run. These decisions are summarized in
Table 6.1, which shows how we structure the input file by claim type.
In our Baseline input file structure, we include all diagnosis codes in each record. For PB
and DME claims, we use the line-item diagnosis code instead of the header diagnosis list because
it is the relevant diagnosis that corresponds to the procedure performed for non-institutional
claims. We input aggregate payments for institutional claims and line-item payments for non-
institutional claims. Although not shown on Table 6.1, claims dates are also included in the
input file; we use the start and end dates from the claim, as described in Table 2.5.
Functionality of the Symmetry ETG and Medstat MEG Software | August 2008 85
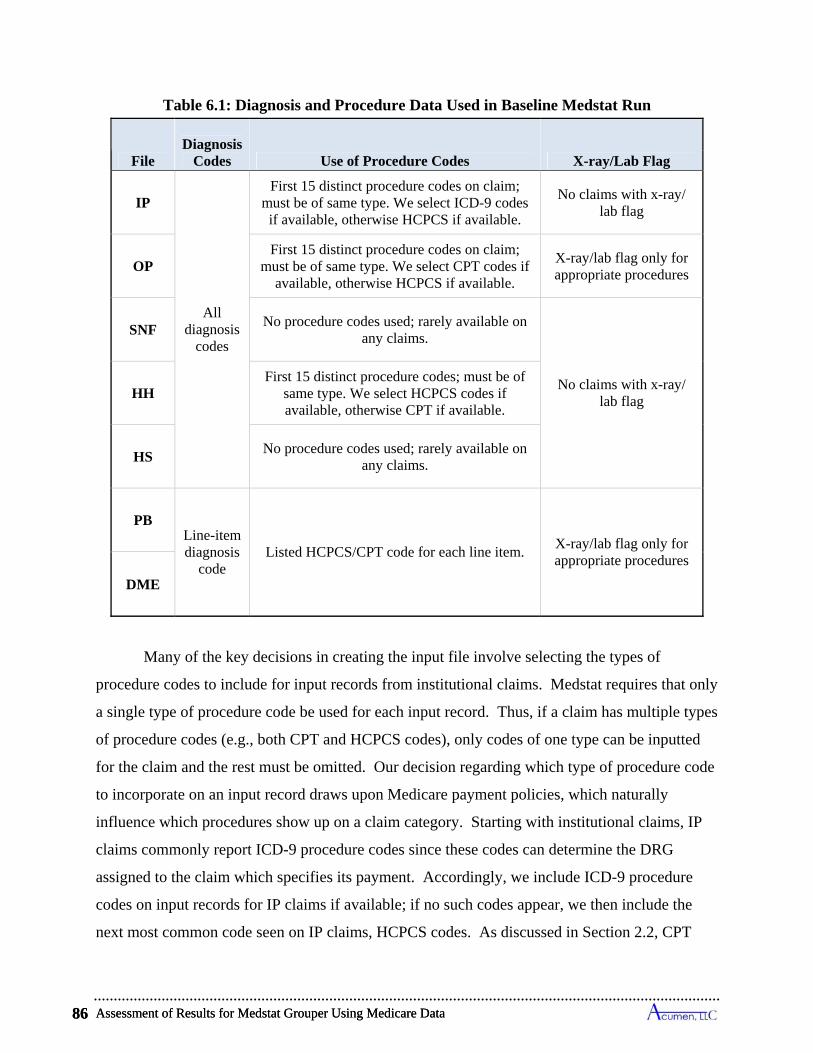
Assessment of Results for Medstat Grouper Using Medicare Data 86
Table 6.1: Diagnosis and Procedure Data Used in Baseline Medstat Run
File Diagnosis
Codes Use of Procedure Codes X-ray/Lab Flag
IP
All diagnosis
codes
First 15 distinct procedure codes on claim; must be of same type. We select ICD-9 codes if available, otherwise HCPCS if available.
No claims with x-ray/ lab flag
OP First 15 distinct procedure codes on claim;
must be of same type. We select CPT codes if available, otherwise HCPCS if available.
X-ray/lab flag only for appropriate procedures
SNF No procedure codes used; rarely available on
any claims.
No claims with x-ray/ lab flag HH
First 15 distinct procedure codes; must be of same type. We select HCPCS codes if available, otherwise CPT if available.
HS No procedure codes used; rarely available on
any claims.
PB Line-item diagnosis
code Listed HCPCS/CPT code for each line item.
X-ray/lab flag only for appropriate procedures
DME
Many of the key decisions in creating the input file involve selecting the types of
procedure codes to include for input records from institutional claims. Medstat requires that only
a single type of procedure code be used for each input record. Thus, if a claim has multiple types
of procedure codes (e.g., both CPT and HCPCS codes), only codes of one type can be inputted
for the claim and the rest must be omitted. Our decision regarding which type of procedure code
to incorporate on an input record draws upon Medicare payment policies, which naturally
influence which procedures show up on a claim category. Starting with institutional claims, IP
claims commonly report ICD-9 procedure codes since these codes can determine the DRG
assigned to the claim which specifies its payment. Accordingly, we include ICD-9 procedure
codes on input records for IP claims if available; if no such codes appear, we then include the
next most common code seen on IP claims, HCPCS codes. As discussed in Section 2.2, CPT
Assessment of Results for Medstat Grouper Using Medicare Data 86
Functionality of the Symmetry ETG and Medstat MEG Software | August 2008 87
codes are used for payments by the OP PPS, and HCPCS codes are principally used by the HH
PPS. Consequently, for OP claims we input CPT codes if available, and otherwise input HCPCS
codes. For HH claims, we input HCPCS codes if available, and otherwise input CPT codes.
One rarely sees any procedure codes on SNF and HS claims, as Medicare reimbursements for
these claims are determined by prospective payment systems that do not consider procedure
codes. Consequently, we do not include any procedure codes for SNF and HS claim types. In
the analyses presented below, we examine the impacts of altering the choices of which procedure
codes to input for the various claim categories, including deletion of procedure codes all
together, and our findings generally reveal that alternative selections lead to little change in
episode grouping outcomes.
Turning to non-institutional claims, PB and DME claims only list one procedure code per
input record because the claims are broken into line items at the service level. So, no decision
need be made regarding which procedure code to use for these input records.
One critical use of the procedure codes in applications of the Medstat grouper involves
the setting an x-ray/lab flags. This flag plays a vital role in the MEG grouper in that it
determines whether a claim can start an episode—Medstat’s software prevents claims flagged as
an x-ray or lab procedure from starting an episode. The flag must be set to ‘0’ (not flagged) or
‘1’ (flagged) by the user for each input record depending on whether or not it is an x-ray or lab
procedure. Medstat supplies a recommended list of procedure codes for setting the x-ray/lab
flag.55 In assigning x-ray/lab flags, we generally follow Medstat’s recommendation; we use
procedure codes to flag all claims as x-ray/lab with the exception of IP claims. For the Baseline
run, we allow all IP claims to start an episode (that is, lab/x-ray is automatically unflagged) and
use any available procedure codes to flag claims from other file types. Permitting all IP claims
to start an episode is sensible, and such a blanket rule is required since the IP claims typically
55 List of HCPCS/CPT Procedure Codes Corresponding to Setting Medstat X-ray/Lab Flags: '70000 - 89999', '92531 - 92605', '95812 - 95852', '96110 - 96120', 'D8000 – D9248', '90765 - 90775', '92610 - 92633', '95860 - 95904', '97750 - 97755', 'D9610 – D9999', '90801 - 90802', '93000 - 93278', '95921 - 95937', '99000 - 99140', 'E0000 – E9999', '91000 - 91065', '93307 - 93350', '95951 - 95951' '99170 - 99173', 'G0001 – G0127', '91110 - 91299', '93600 - 93623', '95954 - 95955', 'A0000 - C9999', 'G0130 – G0148', '92015 - 92506', '93875 - 95078', '95958 - 95967', 'D0120 - D0999' 'G0175 – G0180', '92511 - 92520', '95805 - 95810', '96000 - 96103', 'D5110 - D7140', 'G0202 – G0234'
Functionality of the Symmetry ETG and Medstat MEG Software | August 2008 87
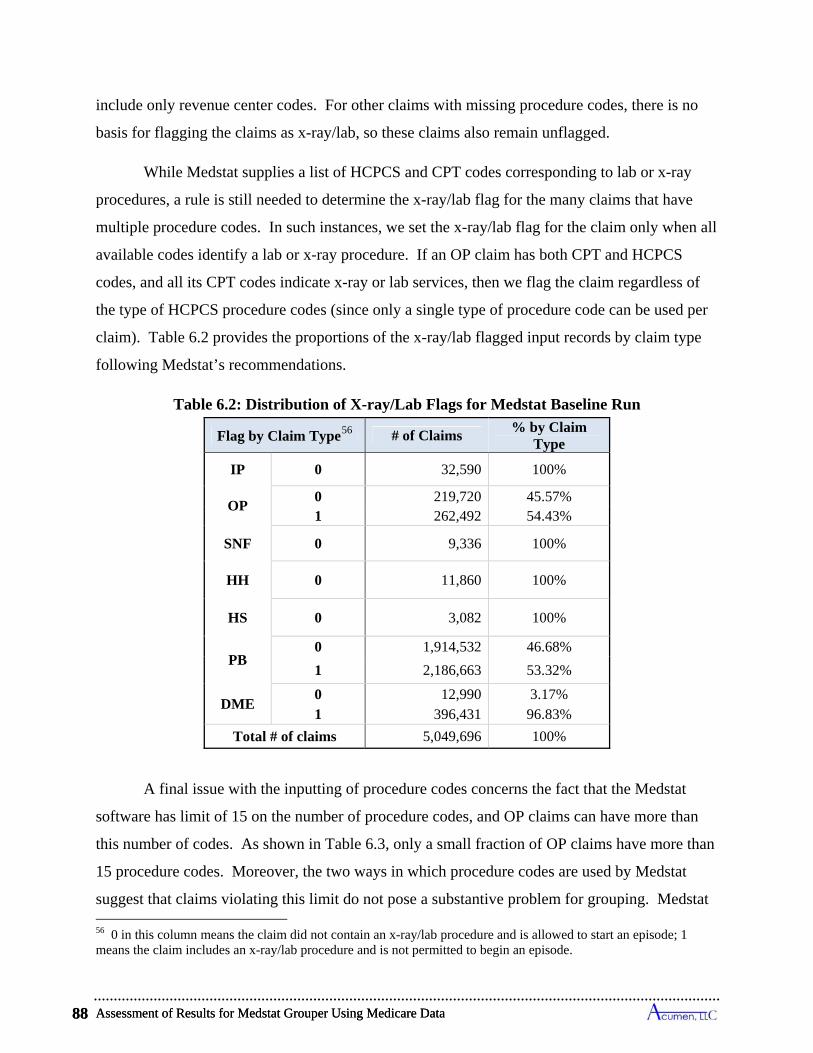
Assessment of Results for Medstat Grouper Using Medicare Data 88
3,082 100% HS 0
1 2,186,663 53.32%
DME 0 12,990 3.17% 1 396,431 96.83%
Total # of claims 5,049,696 100%
Flag by Claim Type56 # of Claims % by Claim
Type
IP 0 32,590 100%
OP 0 219,720 45.57% 1 262,492 54.43%
SNF 0 9,336 100%
HH 0 11,860 100%
PB 0 1,914,532 46.68%
include only revenue center codes. For other claims with missing procedure codes, there is no
basis for flagging the claims as x-ray/lab, so these claims also remain unflagged.
While Medstat supplies a list of HCPCS and CPT codes corresponding to lab or x-ray
procedures, a rule is still needed to determine the x-ray/lab flag for the many claims that have
multiple procedure codes. In such instances, we set the x-ray/lab flag for the claim only when all
available codes identify a lab or x-ray procedure. If an OP claim has both CPT and HCPCS
codes, and all its CPT codes indicate x-ray or lab services, then we flag the claim regardless of
the type of HCPCS procedure codes (since only a single type of procedure code can be used per
claim). Table 6.2 provides the proportions of the x-ray/lab flagged input records by claim type
following Medstat’s recommendations.
Table 6.2: Distribution of X-ray/Lab Flags for Medstat Baseline Run
A final issue with the inputting of procedure codes concerns the fact that the Medstat
software has limit of 15 on the number of procedure codes, and OP claims can have more than
this number of codes. As shown in Table 6.3, only a small fraction of OP claims have more than
15 procedure codes. Moreover, the two ways in which procedure codes are used by Medstat
suggest that claims violating this limit do not pose a substantive problem for grouping. Medstat
56 0 in this column means the claim did not contain an x-ray/lab procedure and is allowed to start an episode; 1 means the claim includes an x-ray/lab procedure and is not permitted to begin an episode.
Assessment of Results for Medstat Grouper Using Medicare Data 88
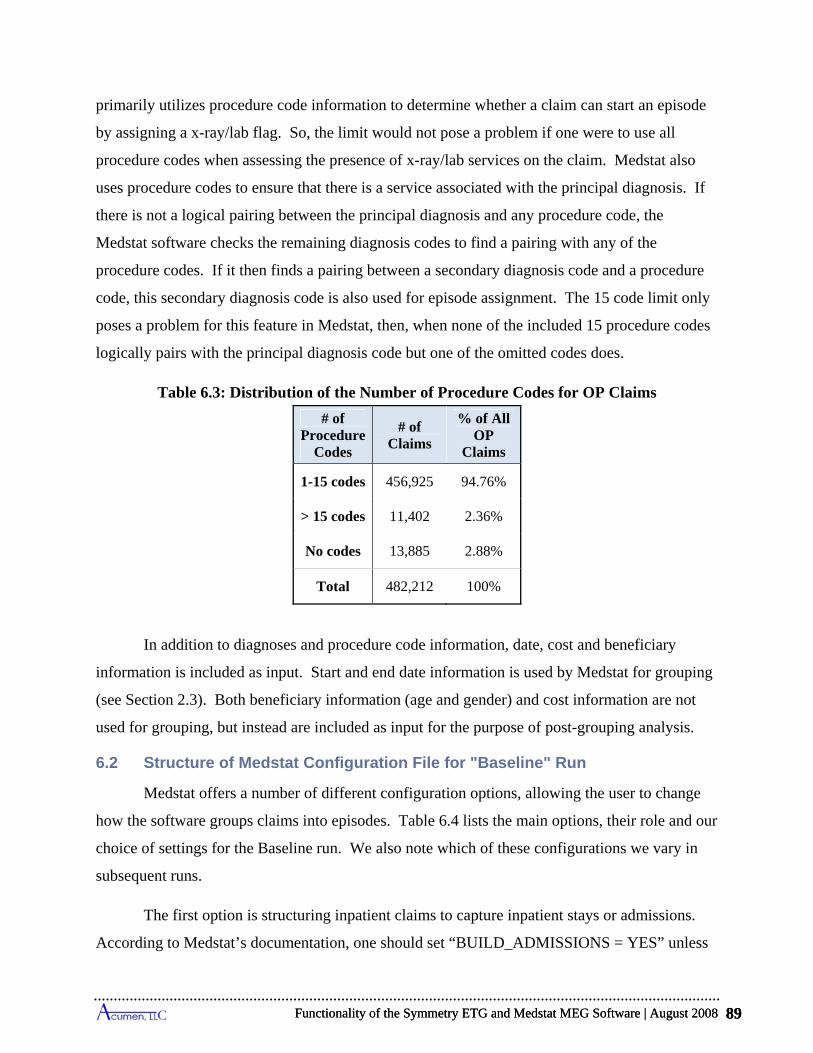
Functionality of the Symmetry ETG and Medstat MEG Software | August 2008 89
# of Claims
% of All OP
Claims
# of Procedure
Codes
1-15 codes 456,925 94.76%
> 15 codes 11,402 2.36%
No codes 13,885 2.88%
Total 482,212 100%
In addition to diagnoses and procedure code information, date, cost and beneficiary
information is included as input. Start and end date information is used by Medstat for grouping
(see Section 2.3). Both beneficiary information (age and gender) and cost information are not
used for grouping, but instead are included as input for the purpose of post-grouping analysis.
primarily utilizes procedure code information to determine whether a claim can start an episode
by assigning a x-ray/lab flag. So, the limit would not pose a problem if one were to use all
procedure codes when assessing the presence of x-ray/lab services on the claim. Medstat also
uses procedure codes to ensure that there is a service associated with the principal diagnosis. If
there is not a logical pairing between the principal diagnosis and any procedure code, the
Medstat software checks the remaining diagnosis codes to find a pairing with any of the
procedure codes. If it then finds a pairing between a secondary diagnosis code and a procedure
code, this secondary diagnosis code is also used for episode assignment. The 15 code limit only
poses a problem for this feature in Medstat, then, when none of the included 15 procedure codes
logically pairs with the principal diagnosis code but one of the omitted codes does.
Table 6.3: Distribution of the Number of Procedure Codes for OP Claims
6.2 Structure of Medstat Configuration File for "Baseline" Run
Medstat offers a number of different configuration options, allowing the user to change
how the software groups claims into episodes. Table 6.4 lists the main options, their role and our
choice of settings for the Baseline run. We also note which of these configurations we vary in
subsequent runs.
The first option is structuring inpatient claims to capture inpatient stays or admissions.
According to Medstat’s documentation, one should set “BUILD_ADMISSIONS = YES” unless
Functionality of the Symmetry ETG and Medstat MEG Software | August 2008 89
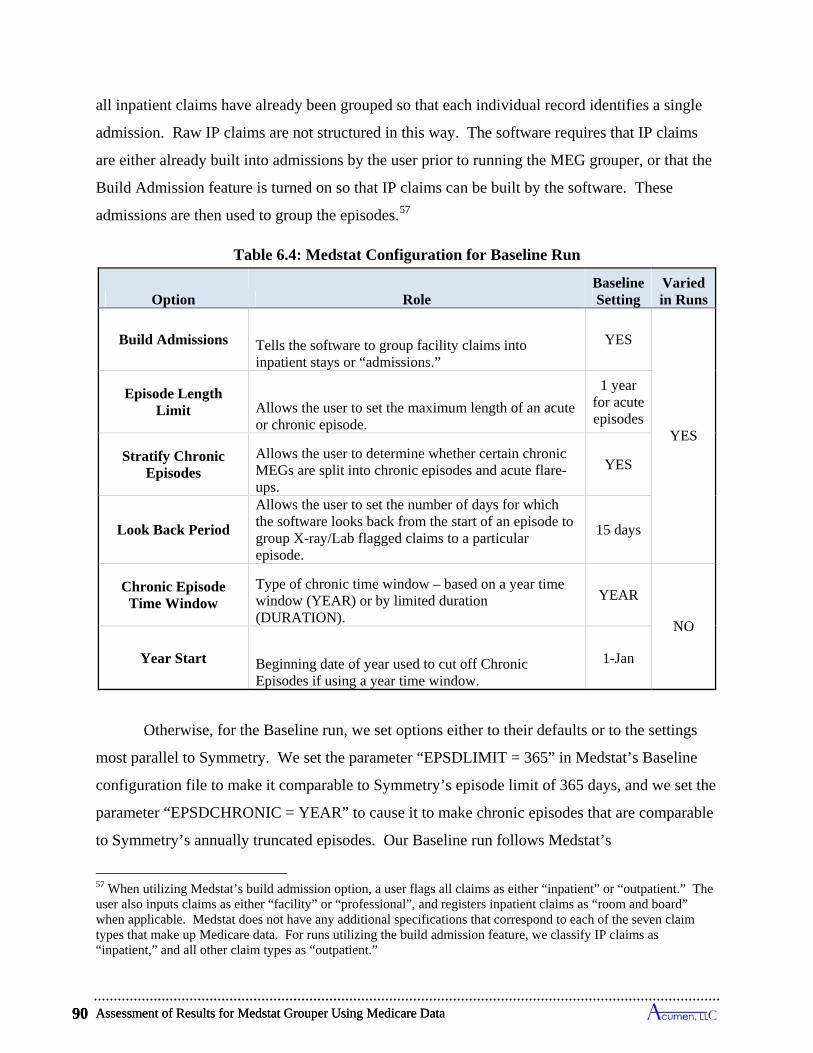
Assessment of Results for Medstat Grouper Using Medicare Data 90
Table 6.4: Medstat Configuration for Baseline Run
Option Role Baseline Setting
Varied in Runs
Build Admissions Tells the software to group facility claims into inpatient stays or “admissions.”
YES
YES
Episode Length Limit Allows the user to set the maximum length of an acute
or chronic episode.
1 year for acute episodes
Stratify Chronic Episodes
Allows the user to determine whether certain chronic MEGs are split into chronic episodes and acute flare-ups.
YES
Chronic Episode Time Window
Type of chronic time window – based on a year time window (YEAR) or by limited duration (DURATION).
YEAR
NO
Year Start Beginning date of year used to cut off Chronic Episodes if using a year time window.
1-Jan
Look Back Period
Allows the user to set the number of days for which the software looks back from the start of an episode to group X-ray/Lab flagged claims to a particular episode.
15 days
Otherwise, for the Baseline run, we set options either to their defaults or to the settings
most parallel to Symmetry. We set the parameter “EPSDLIMIT = 365” in Medstat’s Baseline
configuration file to make it comparable to Symmetry’s episode limit of 365 days, and we set the
parameter “EPSDCHRONIC = YEAR” to cause it to make chronic episodes that are comparable
to Symmetry’s annually truncated episodes. Our Baseline run follows Medstat’s
all inpatient claims have already been grouped so that each individual record identifies a single
admission. Raw IP claims are not structured in this way. The software requires that IP claims
are either already built into admissions by the user prior to running the MEG grouper, or that the
Build Admission feature is turned on so that IP claims can be built by the software. These
admissions are then used to group the episodes.57
57 When utilizing Medstat’s build admission option, a user flags all claims as either “inpatient” or “outpatient.” The user also inputs claims as either “facility” or “professional”, and registers inpatient claims as “room and board” when applicable. Medstat does not have any additional specifications that correspond to each of the seven claim types that make up Medicare data. For runs utilizing the build admission feature, we classify IP claims as “inpatient,” and all other claim types as “outpatient.”
Assessment of Results for Medstat Grouper Using Medicare Data 90
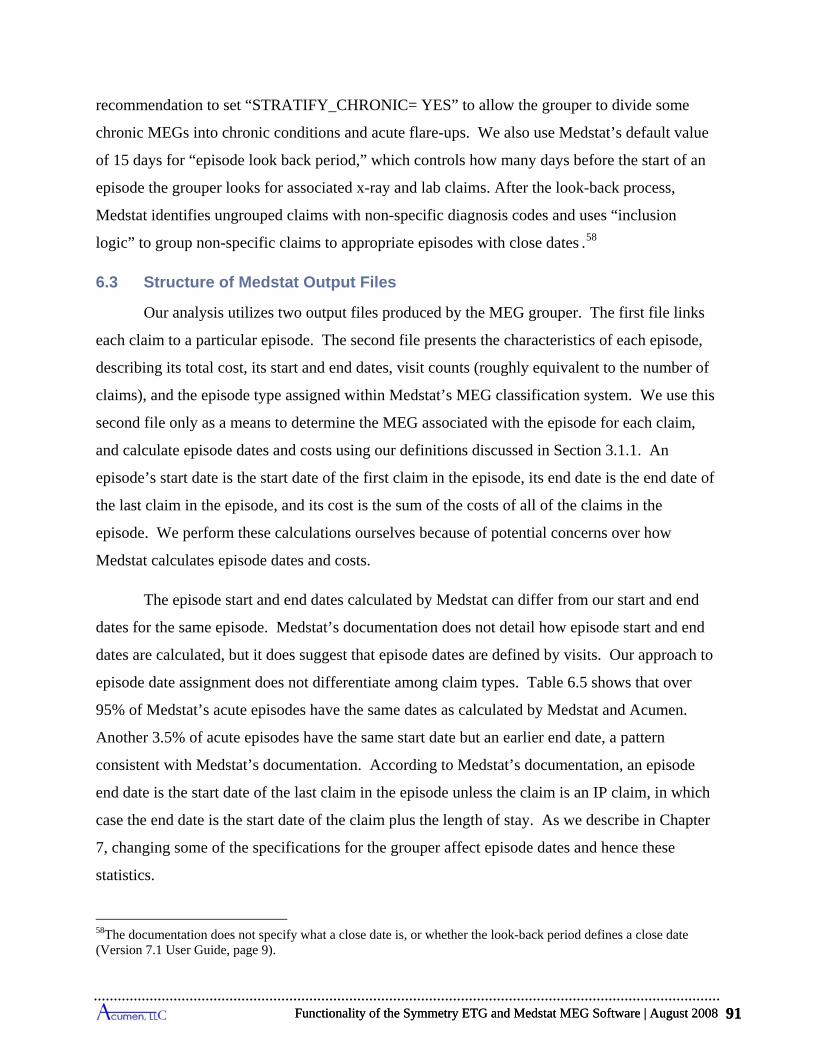
Functionality of the Symmetry ETG and Medstat MEG Software | August 2008 91
recommendation to set “STRATIFY_CHRONIC= YES” to allow the grouper to divide some
chronic MEGs into chronic conditions and acute flare-ups. We also use Medstat’s default value
of 15 days for “episode look back period,” which controls how many days before the start of an
episode the grouper looks for associated x-ray and lab claims. After the look-back process,
Medstat identifies ungrouped claims with non-specific diagnosis codes and uses “inclusion
logic” to group non-specific claims to appropriate episodes with close dates .58
6.3 Structure of Medstat Output Files
Our analysis utilizes two output files produced by the MEG grouper. The first file links
each claim to a particular episode. The second file presents the characteristics of each episode,
describing its total cost, its start and end dates, visit counts (roughly equivalent to the number of
claims), and the episode type assigned within Medstat’s MEG classification system. We use this
second file only as a means to determine the MEG associated with the episode for each claim,
and calculate episode dates and costs using our definitions discussed in Section 3.1.1. An
episode’s start date is the start date of the first claim in the episode, its end date is the end date of
the last claim in the episode, and its cost is the sum of the costs of all of the claims in the
episode. We perform these calculations ourselves because of potential concerns over how
Medstat calculates episode dates and costs.
The episode start and end dates calculated by Medstat can differ from our start and end
dates for the same episode. Medstat’s documentation does not detail how episode start and end
dates are calculated, but it does suggest that episode dates are defined by visits. Our approach to
episode date assignment does not differentiate among claim types. Table 6.5 shows that over
95% of Medstat’s acute episodes have the same dates as calculated by Medstat and Acumen.
Another 3.5% of acute episodes have the same start date but an earlier end date, a pattern
consistent with Medstat’s documentation. According to Medstat’s documentation, an episode
end date is the start date of the last claim in the episode unless the claim is an IP claim, in which
case the end date is the start date of the claim plus the length of stay. As we describe in Chapter
7, changing some of the specifications for the grouper affect episode dates and hence these
statistics.
58The documentation does not specify what a close date is, or whether the look-back period defines a close date (Version 7.1 User Guide, page 9).
Functionality of the Symmetry ETG and Medstat MEG Software | August 2008 91
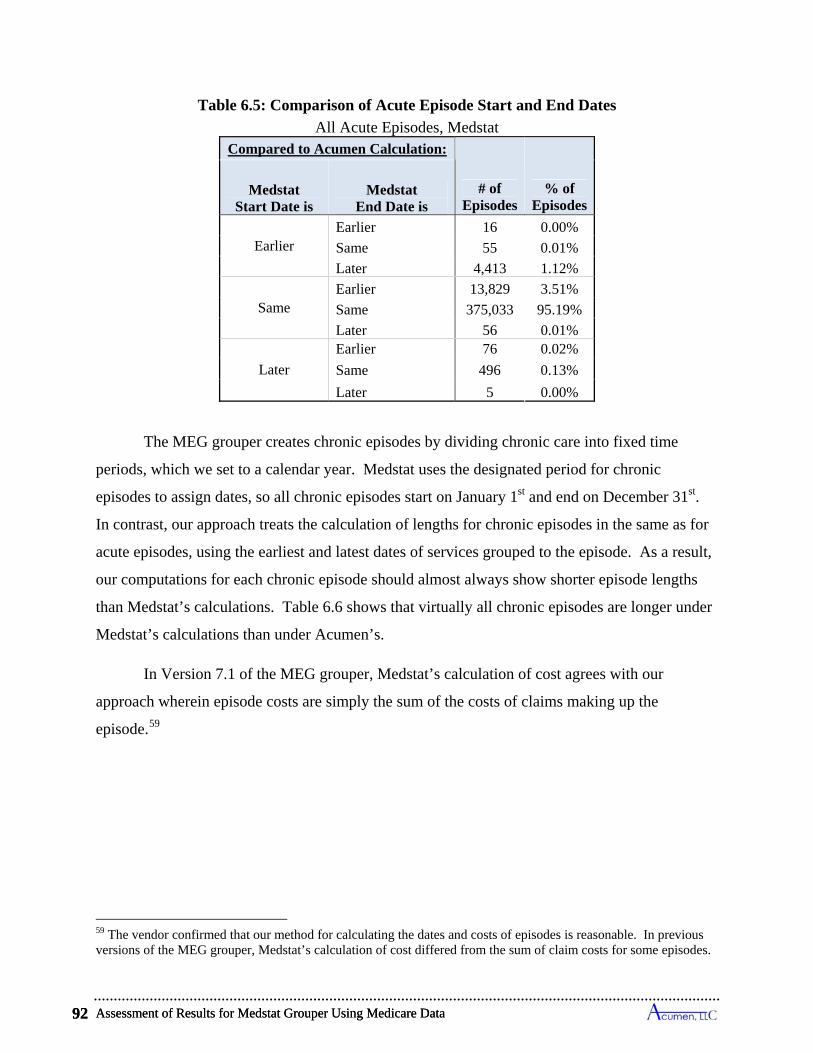
Assessment of Results for Medstat Grouper Using Medicare Data 92
Table 6.5: Comparison of Acute Episode Start and End Dates
All Acute Episodes, Medstat Compared to Acumen Calculation:
# of Episodes
% of Episodes
Medstat End Date is
Medstat Start Date is
Earlier Earlier 16 0.00%
55 0.01% Same
Later 4,413 1.12%
Same Earlier 13,829 3.51%
Same 375,033 95.19%
Later 56 0.01% Earlier 76 0.02%
Later Same 496 0.13%
Later 5 0.00%
The MEG grouper creates chronic episodes by dividing chronic care into fixed time
periods, which we set to a calendar year. Medstat uses the designated period for chronic
episodes to assign dates, so all chronic episodes start on January 1st and end on December 31st.
In contrast, our approach treats the calculation of lengths for chronic episodes in the same as for
acute episodes, using the earliest and latest dates of services grouped to the episode. As a result,
our computations for each chronic episode should almost always show shorter episode lengths
than Medstat’s calculations. Table 6.6 shows that virtually all chronic episodes are longer under
Medstat’s calculations than under Acumen’s.
In Version 7.1 of the MEG grouper, Medstat’s calculation of cost agrees with our
approach wherein episode costs are simply the sum of the costs of claims making up the
episode.59
59 The vendor confirmed that our method for calculating the dates and costs of episodes is reasonable. In previous versions of the MEG grouper, Medstat’s calculation of cost differed from the sum of claim costs for some episodes.
Assessment of Results for Medstat Grouper Using Medicare Data 92
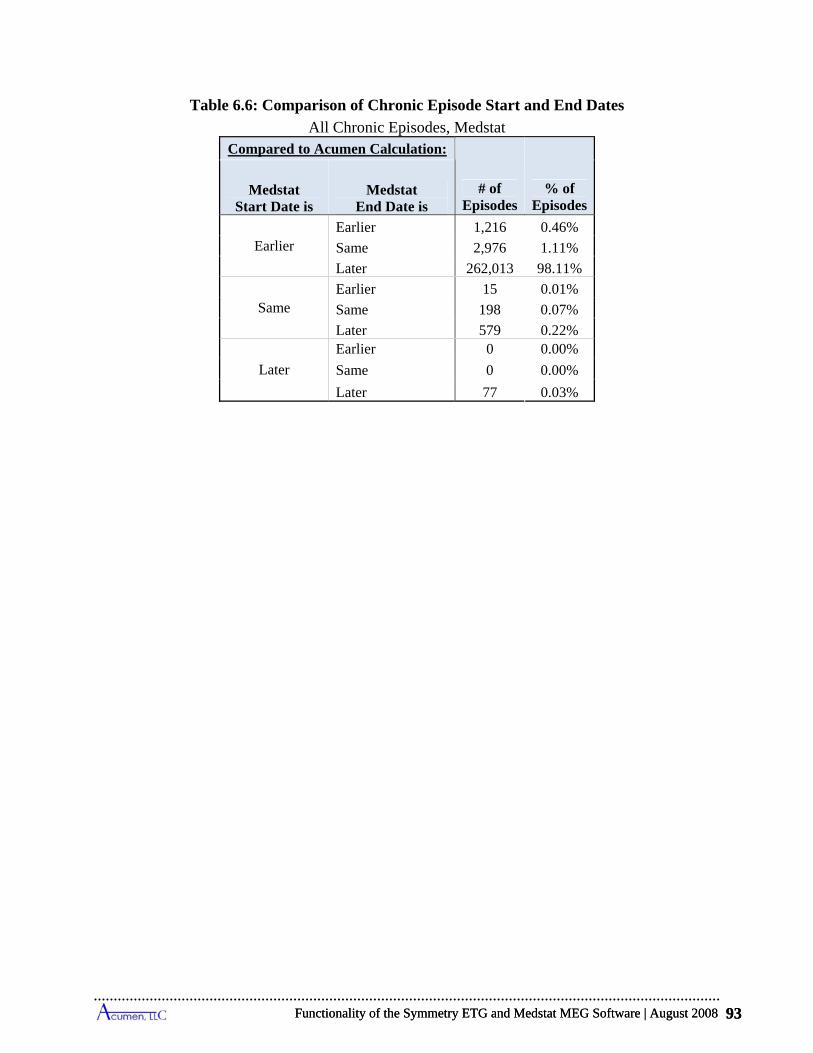
Functionality of the Symmetry ETG and Medstat MEG Software | August 2008 93
Table 6.6: Comparison of Chronic Episode Start and End Dates
All Chronic Episodes, Medstat Compared to Acumen Calculation:
# of Episodes
% of Episodes
Medstat Start Date is
Medstat End Date is
Earlier Earlier 1,216 0.46%
1.11% Same 2,976
Later 262,013 98.11%
Same Earlier 15 0.01%
Same 198 0.07%
Later 579 0.22% 0 0.00%
Later
Earlier
Same 0 0.00%
0.03% Later 77
Functionality of the Symmetry ETG and Medstat MEG Software | August 2008 93

Assessment of Results for Medstat Grouper Using Medicare Data 94
7 ASSESSMENT OF RESULTS FOR MEDSTAT GROUPER USING MEDICARE DATA
This chapter provides results on episode groupings obtained for Medicare claims using
the Medstat MEG software. We begin in the first section with an overview of the grouping
results for the Baseline run, focusing on 2003 Touching Episodes. These are the results one
would obtain using the Baseline settings to group claims to understand resource utilization in
2003. In practice, performance measurement may focus primarily on completed episodes.
Therefore, the second section of this chapter examines the results for completed episodes.
Recognizing that the Baseline settings are not the only options for running the Medstat software,
the third section examines the sensitivity of the Medstat findings to changes in the input file and
configuration settings. In Section 7.4, the discussion then turns to specific difficulties have
encountered in applying the Medstat grouping software to Medicare claims data. The final
section, 7.5, summarizes the Medstat results; due to the technical nature of the findings, some
readers may wish to go directly to this summary.
7.1 Reference Results from Medstat Baseline Run
Our 20% sample of continuously enrolled Colorado beneficiaries between 2002 and 2004
consists of 5,049,696 Medicare claims, totaling $585,447,839 in value. As Table 7.1 reveals, the
Medstat Baseline run groups these 5.05 million claims into 661,053 episodes in the three year
period, with 40.4% of these episodes determined to be chronic and 59.6% determined to be
acute. The chronic episodes are relatively more expensive than the acute episodes, accounting
for 43.4% of the total claims costs during the period. Nearly 1 in 4 claims are not grouped,
although the ungrouped claims account for only 8.4% of the total claims costs.
Table 7.1: Summary Statistics for Claims, Episodes and Costs
All Claims, Medstat Baseline Run
Total # Claims
Total Cost in 2002-2004
Fraction of all 2002-2004 Claims Costs
% Ungrouped
Claims Total #
Episodes
Fraction of All Episodes
% Chronic Episodes
% Acute Episodes
% of Costs in Acute
Episodes
% of Costs in
Ungrouped Claims
% of Costs in Chronic Episodes
5,049,696 23.2% 661,053 40.4% 59.6% $585,447,839 43.4% 48.1% 8.4%
Assessment of Results for Medstat Grouper Using Medicare Data 94

Functionality of the Symmetry ETG and Medstat MEG Software | August 2008 95
As shown in Table 7.2, about 230,000 of the episodes between 2002 and 2004 are 2003
Touching Episodes, as 2003 is the relevant analysis year. The 2003 Touching Episodes for the
Medstat grouper are split between chronic and acute MEGs at about the same rates, with 60.5%
acute episodes and 39.5% chronic episodes. Of the 2003 Touching episodes, 56% are deemed
complete acute. The higher cost of chronic episodes over the whole period is also true when we
restrict our sample to 2003 Touching Episodes; chronic episodes make up a disproportionately
large percentage of the cost in the analysis year (though still less than acute episodes in total).
Table 7.2: Episode Cost and Length Percentiles
2003 Touching Episodes, Medstat Baseline Run
Total # 2003
Touching Episodes
Fraction of All 2003 Touching Episodes
Total Cost of 2003
Touching Episodes
Fraction of All 2003 Touching Episode Costs
% 2003 Complete
Acute Episodes
% of Costs in Chronic Episodes
% of Costs in Acute
Episodes
% of Costs in 2003
Complete Acute
Episodes
% Chronic Episodes
% Acute Episodes
229,925 39.5% 60.5% 56.0% 44.3% $200,786,393 41.4% 58.6%
Table 7.3 presents summary statistics on the costs and lengths of 2003 chronic episodes,
along with corresponding information on acute episodes making up both Touching and Complete
samples. As grouped by the Baseline Medstat run, the average chronic episode in 2003 cost
Medicare $916, while the average complete acute episode cost $690. Whereas the average
length of chronic episodes equaled 125 days with 2% of these episodes lasting longer than 346
days, the average length of complete acute episodes was 24 days with 2% of these episodes
going beyond 255 days. Complete Episodes are a strict subset of Touching Episodes, with the
Complete group excluding those episodes that: (1) started in 2003 (or 2002) and lasted into 2004,
and (2) started with a clean period overlapping January 1, 2002. Because the excluded episodes
either were long enough to extend into 2004 or started earlier in 2002, they tend to have greater
lengths on average than those making up the Complete group. Consequently, it is not surprising
to see that the average length of episodes in the acute 2003 Touching group exceeded those in
Functionality of the Symmetry ETG and Medstat MEG Software | August 2008 95
Assessment of Results for Medstat Grouper Using Medicare Data 96
the Complete sample by 13 days, nor is it unexpected to see that the average episode cost in the
Touching sample surpassed the average of the Complete sample by about 23%.60
Table 7.3: Episode Cost and Length Percentiles
2003 Touching Episodes, Medstat Baseline Run Summary Statistics
10% 25% 50% 75% 90% 95% 98% MeanStd Dev
Chronic
Cost per Episode ($)
$18 $44 $120 $342 $1,447 $3,982 $11,170 $916 $3,523
Length per Episode (days)
1 1 101 231 298 328 346 125 120
Acute
Cost per Episode ($)
$21 $40 $83 $341 $1,510 $3,797 $9,082 $845 $3,539
Length per Episode (days)
1 1 1 30 109 257 357 37 82
2003 Complete
Acute
Cost per Episode ($)
$18 $40 $73 $257 $1,202 $3,003 $7,316 $690 $2,850
Length per Episode (days)
1 1 1 18 65 122 255 24 57
Table 7.4 reports episodes and costs per beneficiary for those who had at least one 2003
Touching episode (96.3% of our Colorado sample). During the analysis year, the average
beneficiary experiences 6 episodes. A notable range in the number of episodes experienced per
beneficiary exists in this period, with the median beneficiary having 5 episodes and the
beneficiary at the 95th percentile having 13 episodes. Across all episodes in the period, the
average Medicare cost per beneficiary is $5,110. Costs can go much higher, however, with the
98th percentile at $40,842.
60 7% of acute Touching Episodes do not qualify for being in the Complete group. Most of these episodes began in 2003 but lasted too long to end in 2003. This 7% had a mean length of 204 days, and an average cost of $2786.
Type of Episode
Cost and Length per Episode
Assessment of Results for Medstat Grouper Using Medicare Data 96
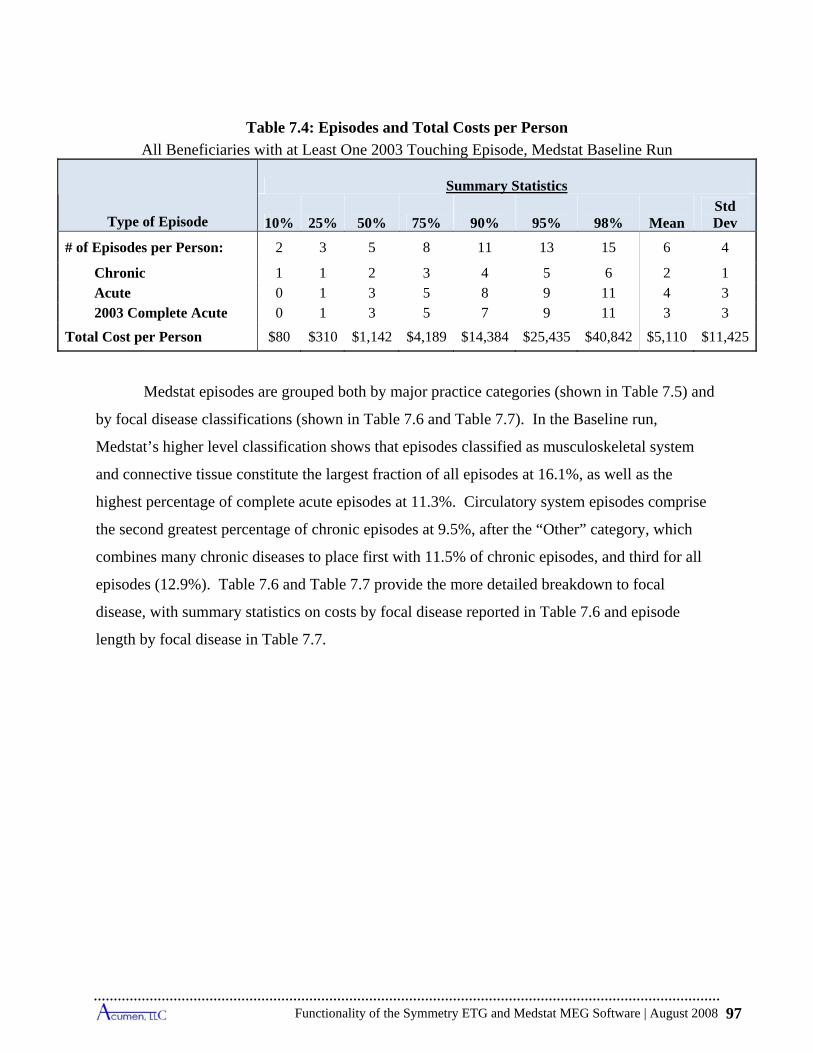
Functionality of the Symmetry ETG and Medstat MEG Software | August 2008 97
Table 7.4: Episodes and Total Costs per Person
All Beneficiaries with at Least One 2003 Touching Episode, Medstat Baseline Run
Type of Episode
Summary Statistics
10% 25% 50% 75% 90% 95% 98% Mean Std Dev
# of Episodes per Person: 2 3 5 8 11 13 15 6 4
Chronic 1 1 2 3 4 5 6 2 1 Acute 0 1 3 5 8 9 11 4 3 2003 Complete Acute 0 1 3 5 7 9 11 3 3
Total Cost per Person $80 $310 $1,142 $4,189 $14,384 $25,435 $40,842 $5,110 $11,425
Medstat episodes are grouped both by major practice categories (shown in Table 7.5) and
by focal disease classifications (shown in Table 7.6 and Table 7.7). In the Baseline run,
Medstat’s higher level classification shows that episodes classified as musculoskeletal system
and connective tissue constitute the largest fraction of all episodes at 16.1%, as well as the
highest percentage of complete acute episodes at 11.3%. Circulatory system episodes comprise
the second greatest percentage of chronic episodes at 9.5%, after the “Other” category, which
combines many chronic diseases to place first with 11.5% of chronic episodes, and third for all
episodes (12.9%). Table 7.6 and Table 7.7 provide the more detailed breakdown to focal
disease, with summary statistics on costs by focal disease reported in Table 7.6 and episode
length by focal disease in Table 7.7.
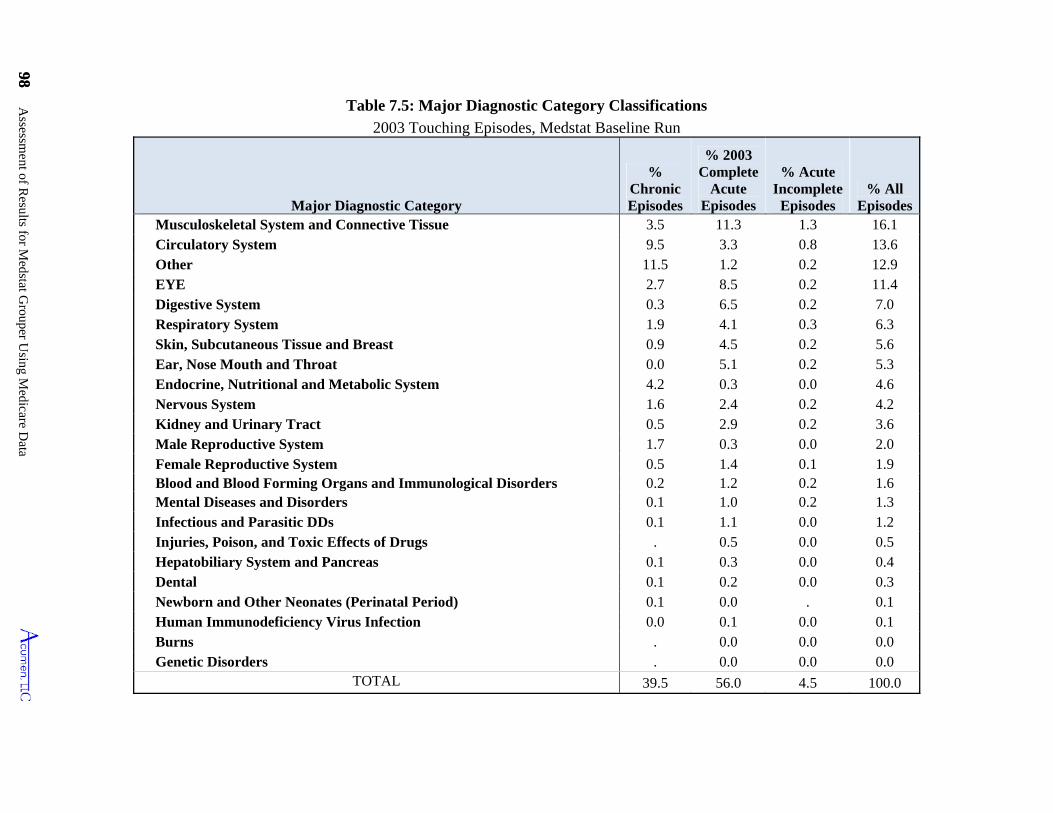
98 Assessm
ent of Results for M
edstat Grouper U
sing Medicare D
ata
98
Table 7.5: Major Diagnostic Category Classifications
2003 Touching Episodes, Medstat Baseline Run
Major Diagnostic Category
% Chronic Episodes
% 2003 Complete
Acute Episodes
% Acute Incomplete
Episodes % All
EpisodesMusculoskeletal System and Connective Tissue 3.5 11.3 1.3 16.1 Circulatory System 9.5 3.3 0.8 13.6 Other 11.5 1.2 0.2 12.9 EYE 2.7 8.5 0.2 11.4 Digestive System 0.3 6.5 0.2 7.0 Respiratory System 1.9 4.1 0.3 6.3 Skin, Subcutaneous Tissue and Breast 0.9 4.5 0.2 5.6 Ear, Nose Mouth and Throat 0.0 5.1 0.2 5.3 Endocrine, Nutritional and Metabolic System 4.2 0.3 0.0 4.6 Nervous System 1.6 2.4 0.2 4.2 Kidney and Urinary Tract 0.5 2.9 0.2 3.6 Male Reproductive System 1.7 0.3 0.0 2.0 Female Reproductive System 0.5 1.4 0.1 1.9 Blood and Blood Forming Organs and Immunological Disorders 0.2 1.2 0.2 1.6 Mental Diseases and Disorders 0.1 1.0 0.2 1.3 Infectious and Parasitic DDs 0.1 1.1 0.0 1.2 Injuries, Poison, and Toxic Effects of Drugs . 0.5 0.0 0.5 Hepatobiliary System and Pancreas 0.1 0.3 0.0 0.4 Dental 0.1 0.2 0.0 0.3 Newborn and Other Neonates (Perinatal Period) 0.1 0.0 . 0.1 Human Immunodeficiency Virus Infection 0.0 0.1 0.0 0.1 Burns . 0.0 0.0 0.0 Genetic Disorders . 0.0 0.0 0.0
TOTAL 39.5 56.0 4.5 100.0
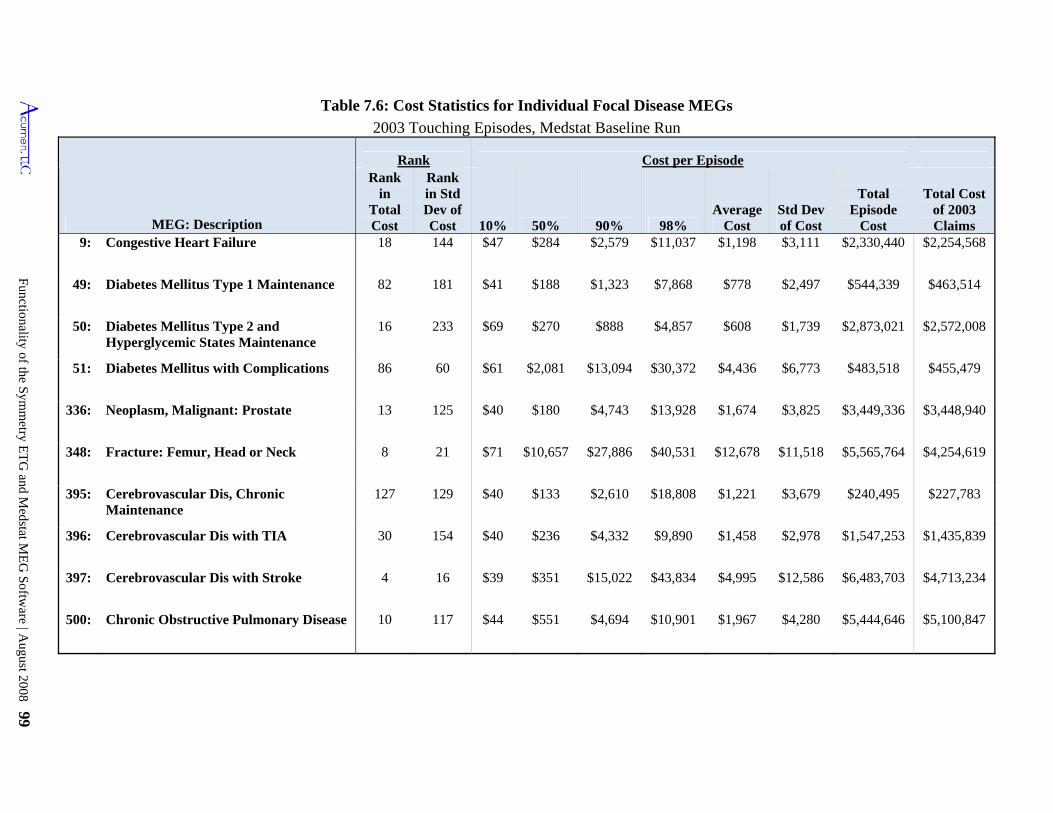
Functionality of the Symm
etry ET
G and M
edstat ME
G Softw
are | August 2008 99
Table 7.6: Cost Statistics for Individual Focal Disease MEGs
2003 Touching Episodes, Medstat Baseline Run
MEG: Description
Rank Cost per EpisodeRank
in Total Cost
Rank in Std Dev of Cost 10% 50% 90% 98%
Average Cost
Std Dev of Cost
Total Episode
Cost
Total Cost of 2003 Claims
9: Congestive Heart Failure 18 144 $47 $284 $2,579 $11,037 $1,198 $3,111 $2,330,440 $2,254,568
49: Diabetes Mellitus Type 1 Maintenance 82 181 $41 $188 $1,323 $7,868 $778 $2,497 $544,339 $463,514
50: Diabetes Mellitus Type 2 and Hyperglycemic States Maintenance
16 233 $69 $270 $888 $4,857 $608 $1,739 $2,873,021 $2,572,008
51: Diabetes Mellitus with Complications 86 60 $61 $2,081 $13,094 $30,372 $4,436 $6,773 $483,518 $455,479
336: Neoplasm, Malignant: Prostate 13 125 $40 $180 $4,743 $13,928 $1,674 $3,825 $3,449,336 $3,448,940
348: Fracture: Femur, Head or Neck 8 21 $71 $10,657 $27,886 $40,531 $12,678 $11,518 $5,565,764 $4,254,619
395: Cerebrovascular Dis, Chronic Maintenance
127 129 $40 $133 $2,610 $18,808 $1,221 $3,679 $240,495 $227,783
396: Cerebrovascular Dis with TIA 30 154 $40 $236 $4,332 $9,890 $1,458 $2,978 $1,547,253 $1,435,839
397: Cerebrovascular Dis with Stroke 4 16 $39 $351 $15,022 $43,834 $4,995 $12,586 $6,483,703 $4,713,234
500: Chronic Obstructive Pulmonary Disease 10 117 $44 $551 $4,694 $10,901 $1,967 $4,280 $5,444,646 $5,100,847
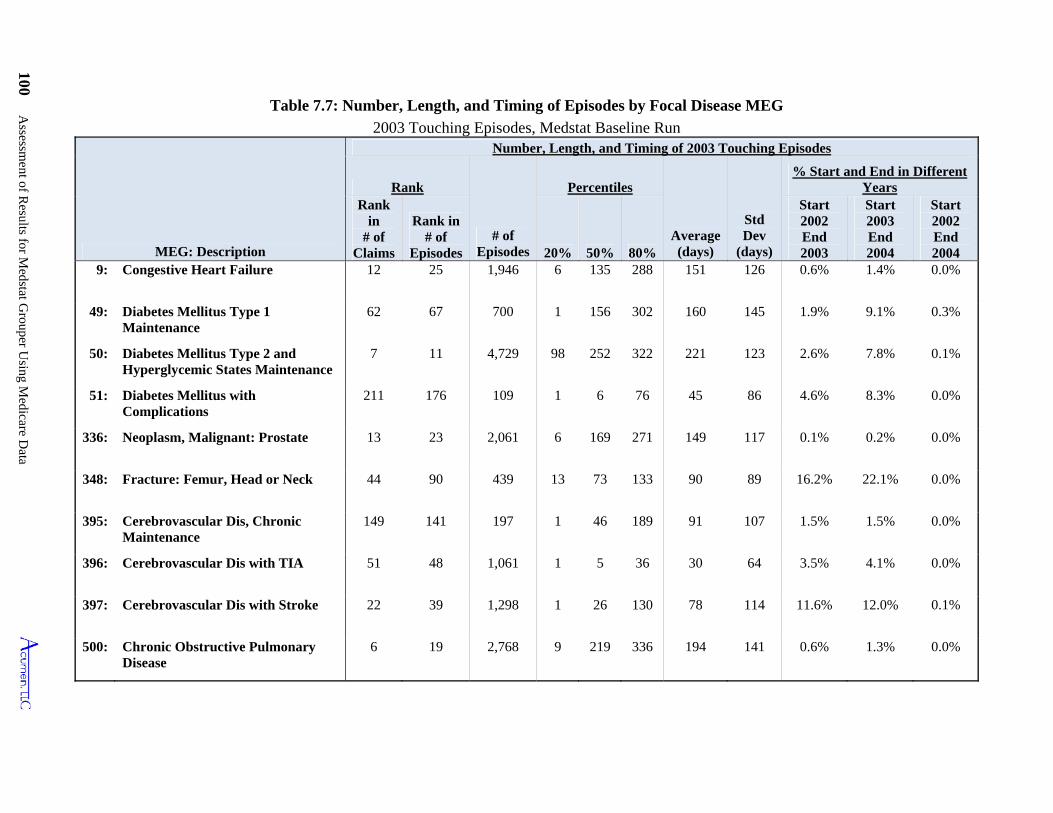
100 Assessm
ent of Results for M
edstat Grouper U
sing Medicare D
ata
20%
Table 7.7: Number, Length, and Timing of Episodes by Focal Disease MEG
2003 Touching Episodes, Medstat Baseline Run
MEG: Description
Number, Length, and Timing of 2003 Touching Episodes
Rank
# of Episodes
Percentiles
Average (days)
Std Dev
(days)
% Start and End in Different Years
Rank in
# of Claims
Rank in # of
Episodes 50% 80%
Start 2002 End 2003
Start 2003 End 2004
Start 2002 End 2004
9: Congestive Heart Failure 12 25 1,946 6 135 288 151 126 0.6% 1.4% 0.0%
49: Diabetes Mellitus Type 1 Maintenance
62 67 700 1 156 302 160 145 1.9% 9.1% 0.3%
50: Diabetes Mellitus Type 2 and Hyperglycemic States Maintenance
7 11 4,729 98 252 322 221 123 2.6% 7.8% 0.1%
51: Diabetes Mellitus with Complications
211 176 109 1 6 76 45 86 4.6% 8.3% 0.0%
336: Neoplasm, Malignant: Prostate 13 23 2,061 6 169 271 149 117 0.1% 0.2% 0.0%
348: Fracture: Femur, Head or Neck 44 90 439 13 73 133 90 89 16.2% 22.1% 0.0%
395: Cerebrovascular Dis, Chronic Maintenance
149 141 197 1 46 189 91 107 1.5% 1.5% 0.0%
396: Cerebrovascular Dis with TIA 51 48 1,061 1 5 36 30 64 3.5% 4.1% 0.0%
397: Cerebrovascular Dis with Stroke 22 39 1,298 1 26 130 78 114 11.6% 12.0% 0.1%
500: Chronic Obstructive Pulmonary Disease
6 19 2,768 9 219 336 194 141 0.6% 1.3% 0.0%
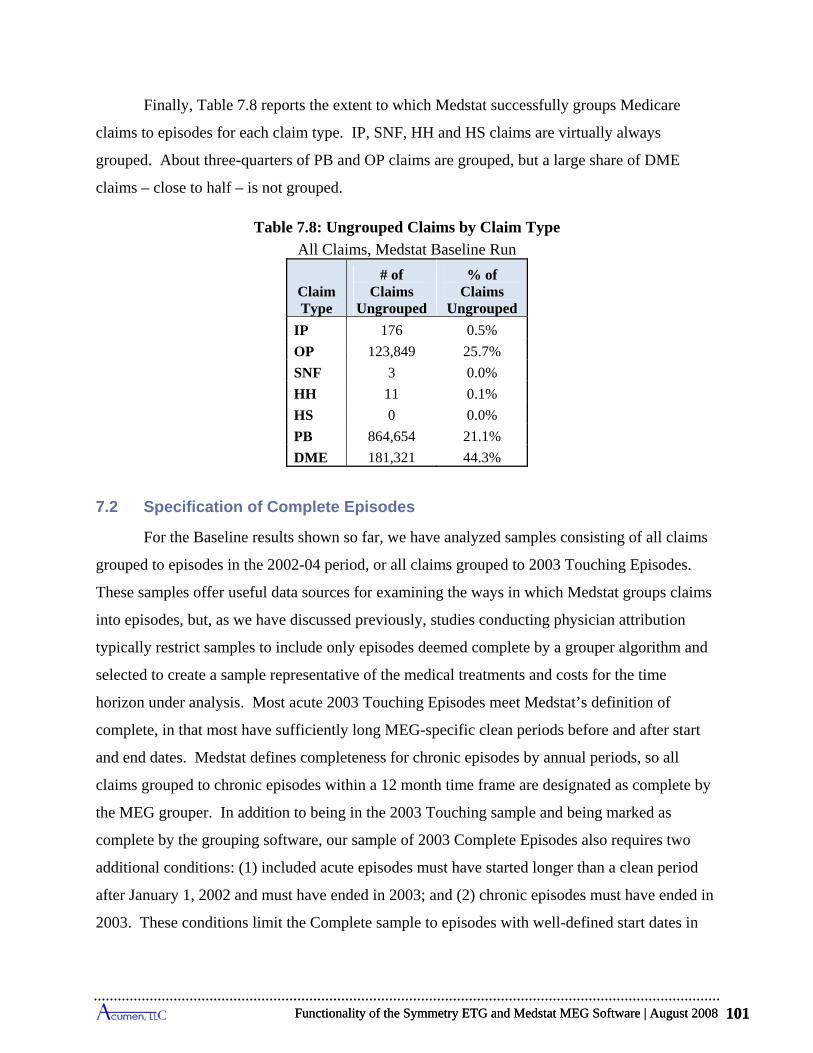
Functionality of the Symmetry ETG and Medstat MEG Software | August 2008 101
Finally, Table 7.8 reports the extent to which Medstat successfully groups Medicare
claims to episodes for each claim type. IP, SNF, HH and HS claims are virtually always
grouped. About three-quarters of PB and OP claims are grouped, but a large share of DME
claims – close to half – is not grouped.
Table 7.8: Ungrouped Claims by Claim Type
All Claims, Medstat Baseline Run
ClaimType
# of Claims
Ungrouped
% of Claims
Ungrouped
IP 176 0.5%
OP 123,849 25.7%
SNF 3 0.0%
HH 11 0.1%
HS 0 0.0%
PB 864,654 21.1%
DME 181,321 44.3%
7.2 Specification of Complete Episodes
For the Baseline results shown so far, we have analyzed samples consisting of all claims
grouped to episodes in the 2002-04 period, or all claims grouped to 2003 Touching Episodes.
These samples offer useful data sources for examining the ways in which Medstat groups claims
into episodes, but, as we have discussed previously, studies conducting physician attribution
typically restrict samples to include only episodes deemed complete by a grouper algorithm and
selected to create a sample representative of the medical treatments and costs for the time
horizon under analysis. Most acute 2003 Touching Episodes meet Medstat’s definition of
complete, in that most have sufficiently long MEG-specific clean periods before and after start
and end dates. Medstat defines completeness for chronic episodes by annual periods, so all
claims grouped to chronic episodes within a 12 month time frame are designated as complete by
the MEG grouper. In addition to being in the 2003 Touching sample and being marked as
complete by the grouping software, our sample of 2003 Complete Episodes also requires two
additional conditions: (1) included acute episodes must have started longer than a clean period
after January 1, 2002 and must have ended in 2003; and (2) chronic episodes must have ended in
2003. These conditions limit the Complete sample to episodes with well-defined start dates in
Functionality of the Symmetry ETG and Medstat MEG Software | August 2008 101
Assessment of Results for Medstat Grouper Using Medicare Data 102
2002 or 2003, and eliminate episodes that end in 2004. Most episodes that end in 2004 become
members of the 2004 Complete sample. As already discussed in Sections 3.1.2 and 5.2, and as
will be shown below for Medstat, the collection of 2003 Complete Episodes provides a sample
that is representative of the cost of finalized medical treatments for the year 2003.
Table 7.9 displays the role of clean periods in defining the share of 2003 Touching
Episodes allocated to 2003 Complete Episodes. The top portion of the table presents summary
statistics for the top 10 cost acute MEGs, and the bottom part of the table lists analogous findings
for the top 10 chronic MEGs. The first column lists the rank by cost considering all episode
types, and the second column shows the number of episodes for each MEG in the 2003 Touching
sample. The next column presents the fraction of 2003 Touching episodes that start within a
clean period of January 1st, 2002—the length of the relevant clean period varies by MEG—and
shows that only a small share of 2003 Touching episodes are dropped by this requirement for
defining our formulation of Complete episodes. Arrhythmias episodes show the largest share
within the MEG’s clean period from the beginning of 2002, at 4.5%, with the remaining top 10
acute MEGs showing less than 2% of episodes that cannot be considered complete by this
criterion. The fourth column presents statistics on the fraction of episodes that are separated
from other episodes of the same type by less than a clean period, using our designation of
episode dates and the clean period for the assigned MEG. The results show that the share of
acute episodes starting within a clean period of an adjacent episode in the same MEG ranges
from a low of 0.1% for cataract episodes to a high of 20.3% for arrhythmias episodes. Finally,
the fifth column shows that, although rare, there are a number of acute MEG episodes of the
same type that overlap in time.
For chronic MEGs, Table 7.9 demonstrates that the majority of episodes in the 2003
Touching group immediately follow an episode of the same type.61 Chronic episodes run as
uninterrupted events for individuals between 53% and 87% of the time depending on the type of
chronic condition. This is consistent with the perspective that chronic conditions embody a
persistent illness that the MEG grouper divides into annual observation periods. We also see a
61 Medstat assigns all chronic MEGs a clean period of 999 as a placeholder. In this report we use 365 days as the clean period for chronic MEGs, since Medstat uses an annual cutoff for such episodes rather than actually using the clean periods. Under an annual cutoff, claims dated one year apart should always be grouped to different episodes.
Assessment of Results for Medstat Grouper Using Medicare Data 102
Functionality of the Symmetry ETG and Medstat MEG Software | August 2008 103
number of overlapping chronic episodes in the last column of the table, although this is likely a
consequence of our episode dates differing from dates assigned by Medstat. Among chronic
MEGs with more than 90% of their claim costs in 2003, 8% include claims in either 2002 or
2004, with most of those in 2004.
As discussed in Section 5.2, statistics calculated using the 2003 Touching Episodes
overestimate the length and cost of treatments that occurred during 2003. Episodes that overlap
periods are, on average, longer and more costly than those that are inclusive within a period. The
Touching sample disproportionately incorporates such overlap episodes since it includes
episodes that straddle either 2002-03 or 2003-04. To create a sample that is representative of
finalized medical care for an annual period, researchers can select episodes either that end in the
period or that start in the period; this limits the sample to include only episodes that overlap one
end of a period, along with episodes fully contained within the period. The group of 2003
Complete Episodes is such a sample.62
Table 7.10 compares the total costs of the top 10 cost acute MEGs using the 2003
Complete and Touching samples along with the samples consisting of all claims in 2003 grouped
to the corresponding MEG types.63 Inspection of the results reveals that costs for Complete
Episodes are sometimes higher and at other time lower than total cost of annual claims for
individual acute MEGs, but in all instances Complete Episodes costs more closely approximate
annual claim costs than do Touching Episodes. Accumulating across all acute MEGs reported at
the bottom of the table, Complete Episodes are about 94% of annual claims costs. This occurs
even though 2003 Complete Episodes include a significant share of costs from 2002 claims.
These costs, however, are offset by the set of claims that contribute to 2003 claims costs but are
grouped to episodes ending in 2004.
Table 7.11 shows a similar pattern for chronic MEGs. For 8 of the top 10 chronic MEGs,
we see at most only a 3% difference between Complete total costs and annual costs for grouped
2003 claims. Type 2 diabetes and congestive heart failure episodes are the exceptions, with
Complete costs being 89% and 87% of annual claims costs respectively. Considering total costs
62 Footnote 59 and Tables 7.10 and 7.11 illustrate the degree to which the Touching Episodes sample overestimates per episode costs of medical care overall and for particular MEGs. As noted previously, this phenomena is termed length-biased in the sampling statistical duration literature. 63 We define a 2003 claim as one that has a service start date in 2003.
Functionality of the Symmetry ETG and Medstat MEG Software | August 2008 103
Assessment of Results for Medstat Grouper Using Medicare Data 104
aggregated across all chronic MEGs listed in the bottom row of the table, we see that less than a
2% difference exists in cost between 2003 Complete Episodes and 2003 claims grouped to
chronic ETGs; the costs for the Touching sample exceed 2003 annual costs by more than 4%.
Table 7.12 presents statistics depicting the distribution of per episode costs for the top-5-
cost acute MEGs, the top-5 chronic MEGs, and for all MEGs combined reported at the bottom of
the table. In addition to means and standard deviations, this table reports several percentiles of
the distributions to convey the extent of variation in costs across episodes within MEG
classifications. The distributions exhibit substantial dispersion in costs across episodes within a
MEG. For each of the top five highest-cost acute and chronic MEGs, the level of cost demarking
the most expensive 10% of episodes (i.e., the 90th percentile) always exceeds the level demarking
the cheapest 10% (i.e., the 10th percentile) by at least an order of magnitude, and in most
instances it is more than two orders of magnitude larger. Even for Pneumonia, which is one of
the less extreme cases, its cheapest 10% of episodes costs $40 or less, while the most expensive
10% of episodes cost $7,332 or more per episode. The table further reveals that the highest-cost
episodes account for large shares of total MEG costs. Considering the total costs for all MEGs,
the last row and column shows that 67.3% of these costs are incurred by the most expensive 5%
of episodes. Among the top 5 acute MEGs, the most expensive 5% of episodes account for
25.2% to 48.4% of total MEG costs. For the top 5 chronic MEGs, the most expensive 5%
account for 34.6% to 63.8% of all costs in that MEG. Overall, Table 7.12 demonstrates that
considerable variation exists in the costs of individual episodes within a MEG.
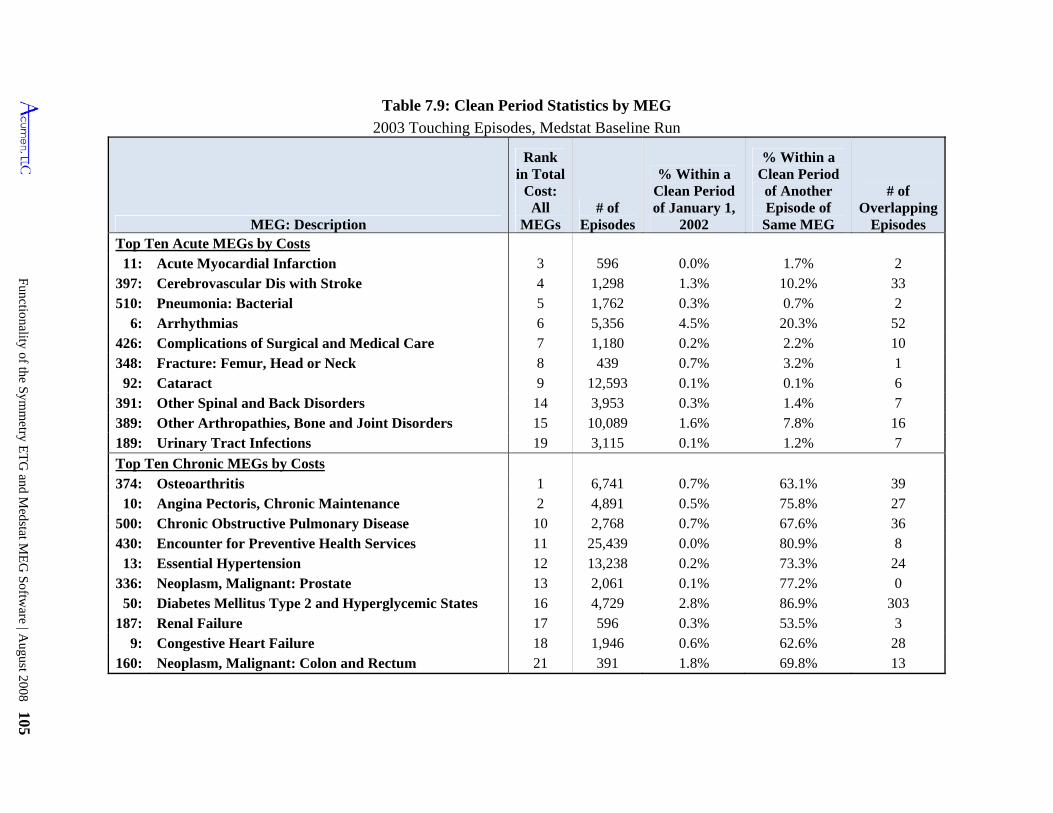
Functionality of the Symm
etry ET
G and M
edstat ME
G Softw
are | August 2008 105
Table 7.9: Clean Period Statistics by MEG
2003 Touching Episodes, Medstat Baseline Run
MEG: Description
Rank in Total
Cost: All
MEGs # of
Episodes
% Within a Clean Period of January 1,
2002
% Within a Clean Period of Another Episode of Same MEG
# of Overlapping
Episodes Top Ten Acute MEGs by Costs
11: Acute Myocardial Infarction 3 596 0.0% 1.7% 2 397: Cerebrovascular Dis with Stroke 4 1,298 1.3% 10.2% 33 510: Pneumonia: Bacterial 5 1,762 0.3% 0.7% 2
6: Arrhythmias 6 5,356 4.5% 20.3% 52 426: Complications of Surgical and Medical Care 7 1,180 0.2% 2.2% 10 348: Fracture: Femur, Head or Neck 8 439 0.7% 3.2% 1
92: Cataract 9 12,593 0.1% 0.1% 6 391: Other Spinal and Back Disorders 14 3,953 0.3% 1.4% 7 389: Other Arthropathies, Bone and Joint Disorders 15 10,089 1.6% 7.8% 16 189: Urinary Tract Infections 19 3,115 0.1% 1.2% 7
Top Ten Chronic MEGs by Costs 374: Osteoarthritis 1 6,741 0.7% 63.1% 39
10: Angina Pectoris, Chronic Maintenance 2 4,891 0.5% 75.8% 27 500: Chronic Obstructive Pulmonary Disease 10 2,768 0.7% 67.6% 36 430: Encounter for Preventive Health Services 11 25,439 0.0% 80.9% 8
13: Essential Hypertension 12 13,238 0.2% 73.3% 24 336: Neoplasm, Malignant: Prostate 13 2,061 0.1% 77.2% 0
50: Diabetes Mellitus Type 2 and Hyperglycemic States 16 4,729 2.8% 86.9% 303 187: Renal Failure 17 596 0.3% 53.5% 3
9: Congestive Heart Failure 18 1,946 0.6% 62.6% 28 160: Neoplasm, Malignant: Colon and Rectum 21 391 1.8% 69.8% 13
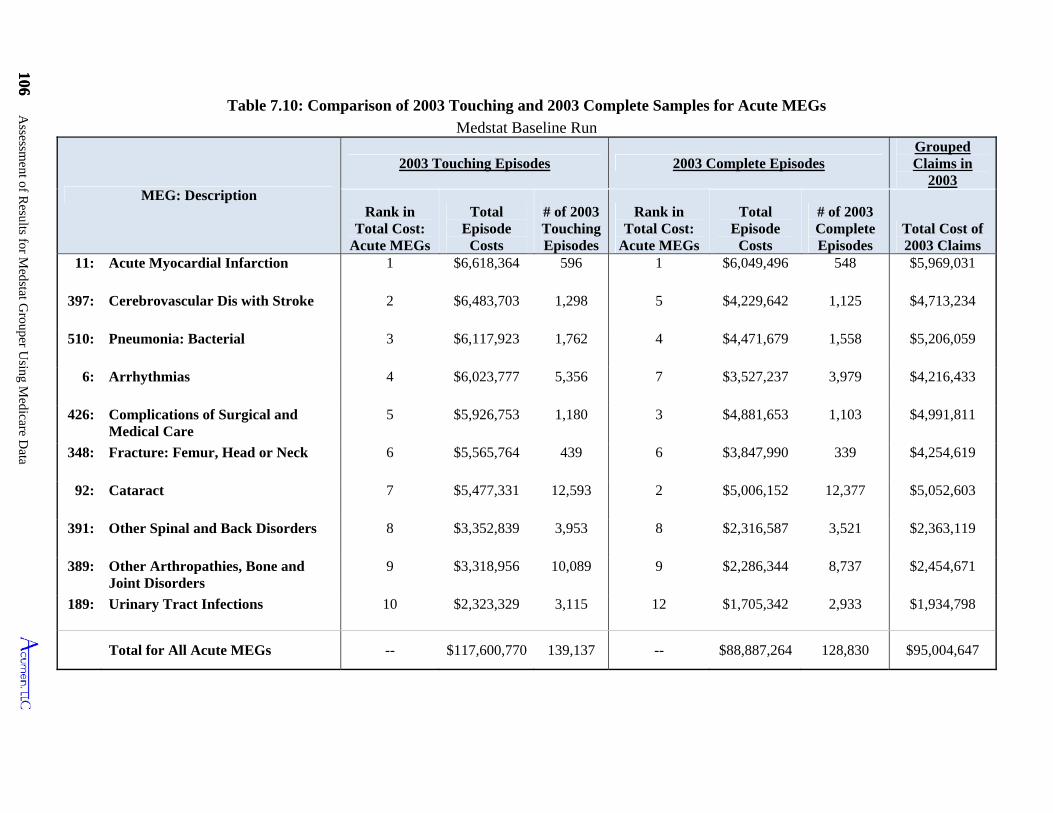
106 Assessm
ent of Results for M
edstat Grouper U
sing Medicare D
ata
106 Table 7.10: Comparison of 2003 Touching and 2003 Complete Samples for Acute MEGs
Medstat Baseline Run
MEG: Description
2003 Touching Episodes 2003 Complete Episodes Grouped Claims in
2003
Rank in Total Cost:
Acute MEGs
Total Episode
Costs
# of 2003 Touching Episodes
Rank in Total Cost:
Acute MEGs
Total Episode
Costs
# of 2003 Complete Episodes
Total Cost of 2003 Claims
11: Acute Myocardial Infarction 1 $6,618,364 596 1 $6,049,496 548 $5,969,031
397: Cerebrovascular Dis with Stroke 2 $6,483,703 1,298 5 $4,229,642 1,125 $4,713,234
510: Pneumonia: Bacterial 3 $6,117,923 1,762 4 $4,471,679 1,558 $5,206,059
6: Arrhythmias 4 $6,023,777 5,356 7 $3,527,237 3,979 $4,216,433
426: Complications of Surgical and Medical Care
5 $5,926,753 1,180 3 $4,881,653 1,103 $4,991,811
348: Fracture: Femur, Head or Neck 6 $5,565,764 439 6 $3,847,990 339 $4,254,619
92: Cataract 7 $5,477,331 12,593 2 $5,006,152 12,377 $5,052,603
391: Other Spinal and Back Disorders 8 $3,352,839 3,953 8 $2,316,587 3,521 $2,363,119
389: Other Arthropathies, Bone and Joint Disorders
9 $3,318,956 10,089 9 $2,286,344 8,737 $2,454,671
189: Urinary Tract Infections 10 $2,323,329 3,115 12 $1,705,342 2,933 $1,934,798
Total for All Acute MEGs -- $117,600,770 139,137 -- $88,887,264 128,830 $95,004,647
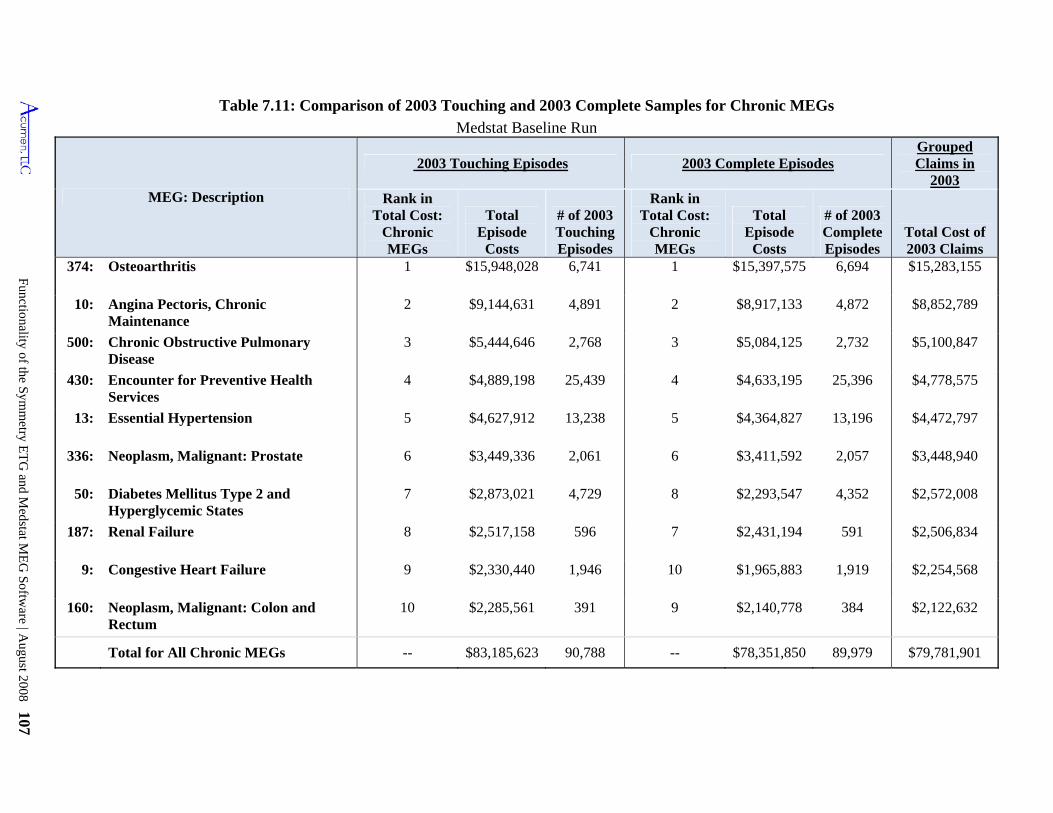
Functionality of the Symm
etry ET
G and M
edstat ME
G Softw
are | August 2008 107
Table 7.11: Comparison of 2003 Touching and 2003 Complete Samples for Chronic MEGs
Medstat Baseline Run
MEG: Description
2003 Touching Episodes 2003 Complete Episodes Grouped Claims in
2003 Rank in
Total Cost: Chronic MEGs
Total Episode
Costs
# of 2003 Touching Episodes
Rank in Total Cost:
Chronic MEGs
Total Episode
Costs
# of 2003 Complete Episodes
Total Cost of 2003 Claims
374: Osteoarthritis 1 $15,948,028 6,741 1 $15,397,575 6,694 $15,283,155
10: Angina Pectoris, Chronic Maintenance
2 $9,144,631 4,891 2 $8,917,133 4,872 $8,852,789
500: Chronic Obstructive Pulmonary Disease
3 $5,444,646 2,768 3 $5,084,125 2,732 $5,100,847
430: Encounter for Preventive Health Services
4 $4,889,198 25,439 4 $4,633,195 25,396 $4,778,575
13: Essential Hypertension 5 $4,627,912 13,238 5 $4,364,827 13,196 $4,472,797
336: Neoplasm, Malignant: Prostate 6 $3,449,336 2,061 6 $3,411,592 2,057 $3,448,940
50: Diabetes Mellitus Type 2 and Hyperglycemic States
7 $2,873,021 4,729 8 $2,293,547 4,352 $2,572,008
187: Renal Failure 8 $2,517,158 596 7 $2,431,194 591 $2,506,834
9: Congestive Heart Failure 9 $2,330,440 1,946 10 $1,965,883 1,919 $2,254,568
160: Neoplasm, Malignant: Colon and Rectum
10 $2,285,561 391 9 $2,140,778 384 $2,122,632
Total for All Chronic MEGs -- $83,185,623 90,788 -- $78,351,850 89,979 $79,781,901
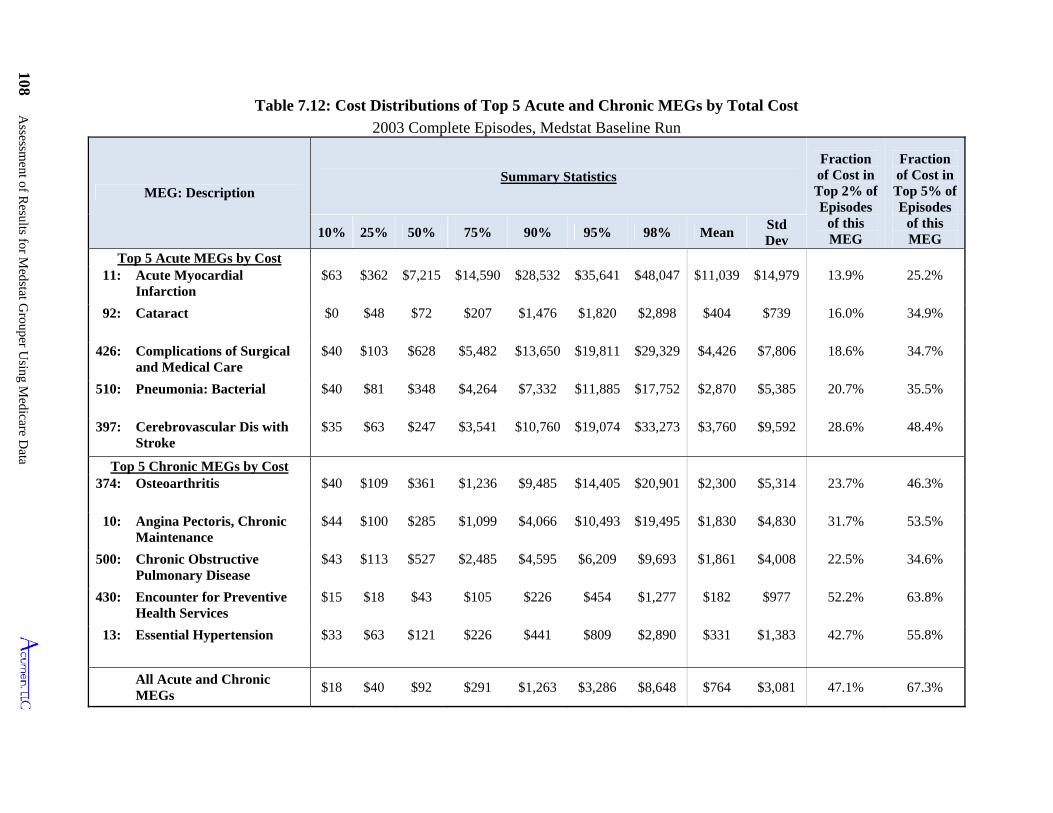
108 Assessm
ent of Results for M
edstat Grouper U
sing Medicare D
ata
Table 7.12: Cost Distributions of Top 5 Acute and Chronic MEGs by Total Cost
2003 Complete Episodes, Medstat Baseline Run
MEG: Description Summary Statistics
Fraction of Cost in Top 2% of Episodes
of this MEG
Fraction of Cost in Top 5% of Episodes
of this MEG 10% 25% 50% 75% 90% 95% 98% Mean
Std Dev
Top 5 Acute MEGs by Cost 11: Acute Myocardial
Infarction $63 $362 $7,215 $14,590 $28,532 $35,641 $48,047 $11,039 $14,979 13.9% 25.2%
92: Cataract $0 $48 $72 $207 $1,476 $1,820 $2,898 $404 $739 16.0% 34.9%
426: Complications of Surgical and Medical Care
$40 $103 $628 $5,482 $13,650 $19,811 $29,329 $4,426 $7,806 18.6% 34.7%
510: Pneumonia: Bacterial $40 $81 $348 $4,264 $7,332 $11,885 $17,752 $2,870 $5,385 20.7% 35.5%
397: Cerebrovascular Dis with Stroke
$35 $63 $247 $3,541 $10,760 $19,074 $33,273 $3,760 $9,592 28.6% 48.4%
Top 5 Chronic MEGs by Cost 374: Osteoarthritis $40 $109 $361 $1,236 $9,485 $14,405 $20,901 $2,300 $5,314 23.7% 46.3%
10: Angina Pectoris, Chronic Maintenance
$44 $100 $285 $1,099 $4,066 $10,493 $19,495 $1,830 $4,830 31.7% 53.5%
500: Chronic Obstructive Pulmonary Disease
$43 $113 $527 $2,485 $4,595 $6,209 $9,693 $1,861 $4,008 22.5% 34.6%
430: Encounter for Preventive Health Services
$15 $18 $43 $105 $226 $454 $1,277 $182 $977 52.2% 63.8%
13: Essential Hypertension $33 $63 $121 $226 $441 $809 $2,890 $331 $1,383 42.7% 55.8%
All Acute and Chronic MEGs
$18 $40 $92 $291 $1,263 $3,286 $8,648 $764 $3,081 47.1% 67.3%
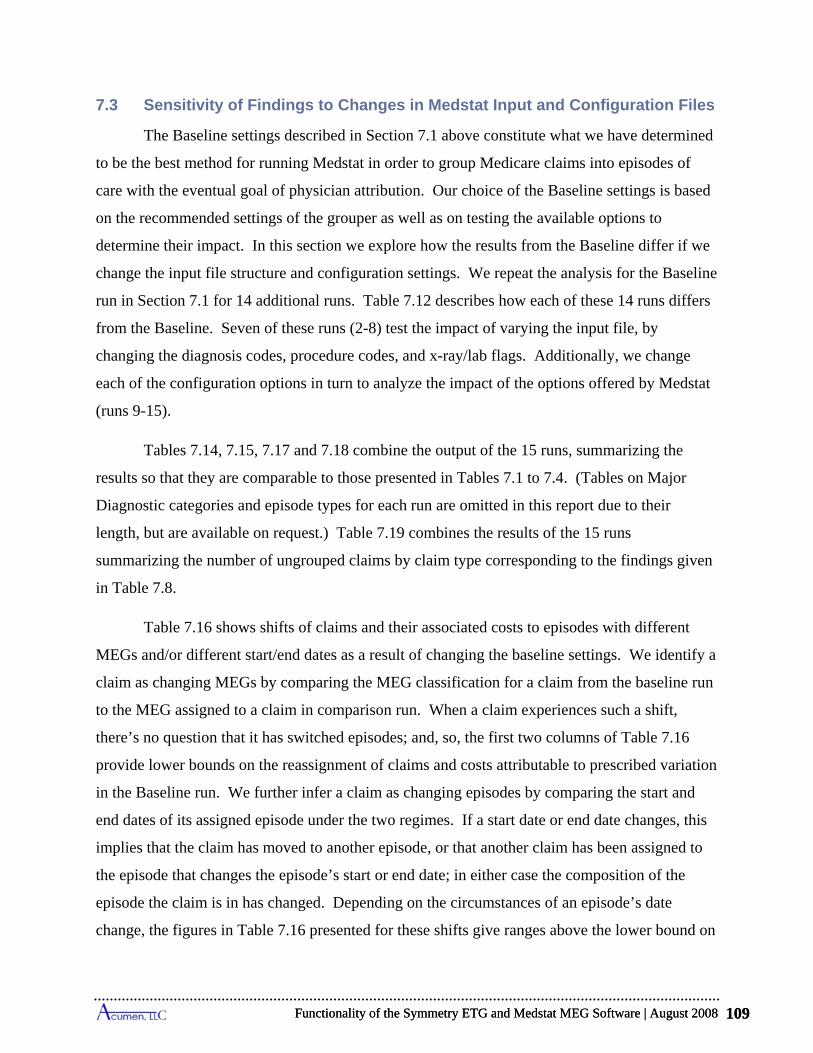
Functionality of the Symmetry ETG and Medstat MEG Software | August 2008 109
7.3 Sensitivity of Findings to Changes in Medstat Input and Configuration Files
The Baseline settings described in Section 7.1 above constitute what we have determined
to be the best method for running Medstat in order to group Medicare claims into episodes of
care with the eventual goal of physician attribution. Our choice of the Baseline settings is based
on the recommended settings of the grouper as well as on testing the available options to
determine their impact. In this section we explore how the results from the Baseline differ if we
change the input file structure and configuration settings. We repeat the analysis for the Baseline
run in Section 7.1 for 14 additional runs. Table 7.12 describes how each of these 14 runs differs
from the Baseline. Seven of these runs (2-8) test the impact of varying the input file, by
changing the diagnosis codes, procedure codes, and x-ray/lab flags. Additionally, we change
each of the configuration options in turn to analyze the impact of the options offered by Medstat
(runs 9-15).
Tables 7.14, 7.15, 7.17 and 7.18 combine the output of the 15 runs, summarizing the
results so that they are comparable to those presented in Tables 7.1 to 7.4. (Tables on Major
Diagnostic categories and episode types for each run are omitted in this report due to their
length, but are available on request.) Table 7.19 combines the results of the 15 runs
summarizing the number of ungrouped claims by claim type corresponding to the findings given
in Table 7.8.
Table 7.16 shows shifts of claims and their associated costs to episodes with different
MEGs and/or different start/end dates as a result of changing the baseline settings. We identify a
claim as changing MEGs by comparing the MEG classification for a claim from the baseline run
to the MEG assigned to a claim in comparison run. When a claim experiences such a shift,
there’s no question that it has switched episodes; and, so, the first two columns of Table 7.16
provide lower bounds on the reassignment of claims and costs attributable to prescribed variation
in the Baseline run. We further infer a claim as changing episodes by comparing the start and
end dates of its assigned episode under the two regimes. If a start date or end date changes, this
implies that the claim has moved to another episode, or that another claim has been assigned to
the episode that changes the episode’s start or end date; in either case the composition of the
episode the claim is in has changed. Depending on the circumstances of an episode’s date
change, the figures in Table 7.16 presented for these shifts give ranges above the lower bound on
Functionality of the Symmetry ETG and Medstat MEG Software | August 2008 109
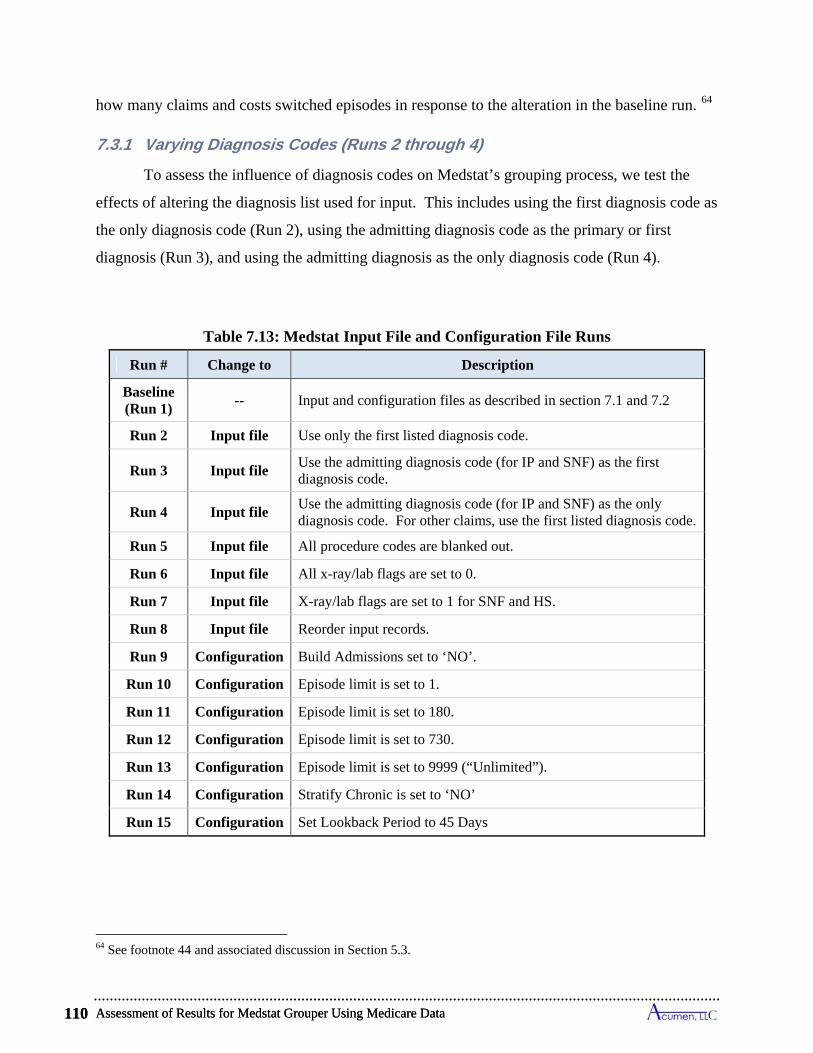
Assessment of Results for Medstat Grouper Using Medicare Data 110
how many claims and costs switched episodes in response to the alteration in the baseline run. 64
7.3.1 Varying Diagnosis Codes (Runs 2 through 4)
To assess the influence of diagnosis codes on Medstat’s grouping process, we test the
effects of altering the diagnosis list used for input. This includes using the first diagnosis code as
the only diagnosis code (Run 2), using the admitting diagnosis code as the primary or first
diagnosis (Run 3), and using the admitting diagnosis as the only diagnosis code (Run 4).
Table 7.13: Medstat Input File and Configuration File Runs
Run # Change to Description
Baseline (Run 1)
-- Input and configuration files as described in section 7.1 and 7.2
Run 2 Input file Use only the first listed diagnosis code.
Run 3 Input file Use the admitting diagnosis code (for IP and SNF) as the first diagnosis code.
Run 4 Input file Use the admitting diagnosis code (for IP and SNF) as the only diagnosis code. For other claims, use the first listed diagnosis code.
Run 5 Input file All procedure codes are blanked out.
Run 6 Input file All x-ray/lab flags are set to 0.
Run 7 Input file X-ray/lab flags are set to 1 for SNF and HS.
Run 8 Input file Reorder input records.
Run 9 Configuration Build Admissions set to ‘NO’.
Run 10 Configuration Episode limit is set to 1.
Run 11 Configuration Episode limit is set to 180.
Run 12 Configuration Episode limit is set to 730.
Run 13 Configuration Episode limit is set to 9999 (“Unlimited”).
Run 14 Configuration Stratify Chronic is set to ‘NO’
Run 15 Configuration Set Lookback Period to 45 Days
64 See footnote 44 and associated discussion in Section 5.3.
Assessment of Results for Medstat Grouper Using Medicare Data 110
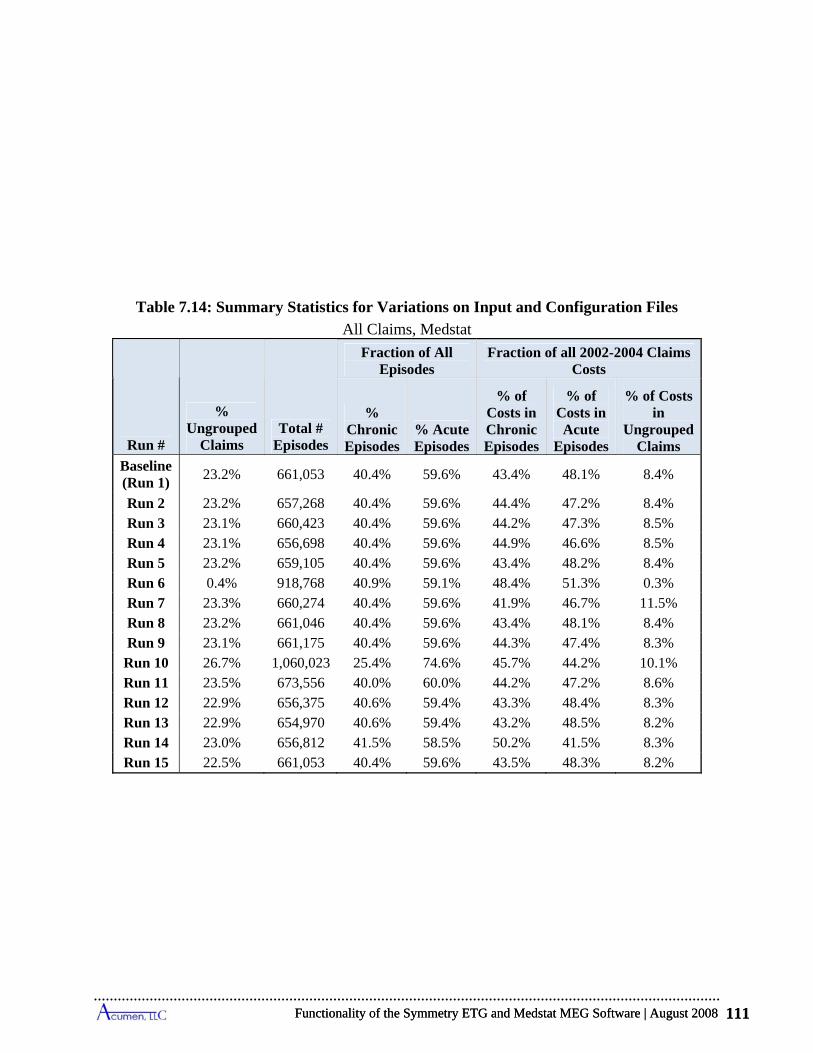
Functionality of the Symmetry ETG and Medstat MEG Software | August 2008 111
Table 7.14: Summary Statistics for Variations on Input and Configuration Files
All Claims, Medstat
Run #
% Ungrouped
Claims Total #
Episodes
Fraction of All Episodes
Fraction of all 2002-2004 Claims Costs
% Chronic Episodes
% Acute Episodes
% of Costs in Chronic Episodes
% of Costs in Acute
Episodes
% of Costs in
Ungrouped Claims
Baseline (Run 1)
23.2% 661,053 40.4% 59.6% 43.4% 48.1% 8.4%
Run 2 23.2% 657,268 40.4% 59.6% 44.4% 47.2% 8.4% Run 3 23.1% 660,423 40.4% 59.6% 44.2% 47.3% 8.5% Run 4 23.1% 656,698 40.4% 59.6% 44.9% 46.6% 8.5% Run 5 23.2% 659,105 40.4% 59.6% 43.4% 48.2% 8.4% Run 6 0.4% 918,768 40.9% 59.1% 48.4% 51.3% 0.3% Run 7 23.3% 660,274 40.4% 59.6% 41.9% 46.7% 11.5% Run 8 23.2% 661,046 40.4% 59.6% 43.4% 48.1% 8.4% Run 9 23.1% 661,175 40.4% 59.6% 44.3% 47.4% 8.3% Run 10 26.7% 1,060,023 25.4% 74.6% 45.7% 44.2% 10.1% Run 11 23.5% 673,556 40.0% 60.0% 44.2% 47.2% 8.6% Run 12 22.9% 656,375 40.6% 59.4% 43.3% 48.4% 8.3% Run 13 22.9% 654,970 40.6% 59.4% 43.2% 48.5% 8.2% Run 14 23.0% 656,812 41.5% 58.5% 50.2% 41.5% 8.3% Run 15 22.5% 661,053 40.4% 59.6% 43.5% 48.3% 8.2%
Functionality of the Symmetry ETG and Medstat MEG Software | August 2008 111

Assessment of Results for Medstat Grouper Using Medicare Data 112
Table 7.15: Summary Statistics for Variations on Input and Configuration Files
2003 Touching Episodes, Medstat
Run #
Total # 2003
Touching Episodes
Fraction of All 2003 Touching Episodes
Fraction of All 2003 Touching Episode Costs
% Chronic Episodes
% Acute Episodes
% 2003 Complete
Acute Episodes
% of Costs in Chronic Episodes
% of Costs in Acute
Episodes
% of Costs in
2003 Complete
Acute Episodes
Baseline (Run 1)
229,925 39.5% 60.5% 56.0% 41.4% 58.6% 44.3%
Run 2 228,721 39.5% 60.6% 56.1% 42.2% 57.9% 43.3% Run 3 229,766 39.5% 60.5% 56.0% 41.8% 58.2% 43.6% Run 4 228,581 39.4% 60.6% 56.0% 42.1% 57.9% 42.9% Run 5 229,333 39.5% 60.5% 56.0% 41.4% 58.6% 44.3% Run 6 317,498 39.7% 60.3% 55.8% 42.1% 57.9% 42.5% Run 7 229,648 39.5% 60.5% 56.1% 41.4% 58.6% 44.7% Run 8 229,923 39.5% 60.5% 56.0% 41.4% 58.6% 44.3% Run 9 229,958 39.5% 60.5% 56.0% 42.2% 57.8% 43.5%
Run 10 356,768 25.7% 74.3% 74.1% 50.1% 49.9% 47.5% Run 11 233,716 39.2% 60.8% 57.1% 43.5% 56.5% 45.6% Run 12 228,313 39.6% 60.4% 55.4% 40.3% 59.7% 41.3% Run 13 228,286 39.6% 60.4% 55.4% 39.9% 60.1% 40.8% Run 14 228,390 40.5% 59.5% 55.1% 48.7% 51.3% 38.4%
Run 15 230,302 39.5% 60.5% 56.0% 41.5% 58.5% 44.0%

Functionality of the S
ymm
etry ET
G and M
edstat ME
G S
oftware | A
ugust 2008 113
Table 7.16: Claims Grouped to Different Episodes by Variations on Input and Configuration Files
All Claims, Medstat
Run #
% of Claims that Change
MEG
% of Total Cost in Claims
that Change MEG
% of Claims that Change Episode
Dates
% of Total Cost in Claims
that Change Episode Dates
% of Claims that Change MEG or
Episode Dates
% of Total Cost in Claims
that Change MEG or
Episode Dates Run 2 1.1% 5.6% 2.5% 8.1% 2.7% 8.7% Run 3 0.7% 10.2% 1.5% 11.0% 1.6% 12.1% Run 4 1.7% 14.7% 3.8% 17.6% 4.1% 19.1% Run 5 0.6% 1.1% 1.7% 3.3% 1.8% 3.4% Run 6 28.9% 15.0% 37.0% 27.5% 38.5% 28.9% Run 7 0.2% 2.3% 0.4% 3.7% 0.4% 3.7% Run 8 0.2% 0.2% 0.3% 0.5% 0.4% 0.6% Run 9 0.1% 3.8% 0.4% 5.0% 0.4% 5.0%
Run 10 8.6% 7.3% 29.7% 39.7% 29.9% 40.1% Run 11 2.2% 1.6% 9.3% 8.1% 9.5% 8.2% Run 12 1.3% 1.0% 5.9% 4.3% 5.9% 4.3% Run 13 1.6% 1.1% 6.3% 4.5% 6.3% 4.5% Run 14 1.6% 7.0% 1.5% 5.9% 2.0% 7.6% Run 15 0.6% 0.3% 3.3% 3.5% 3.3% 3.5%
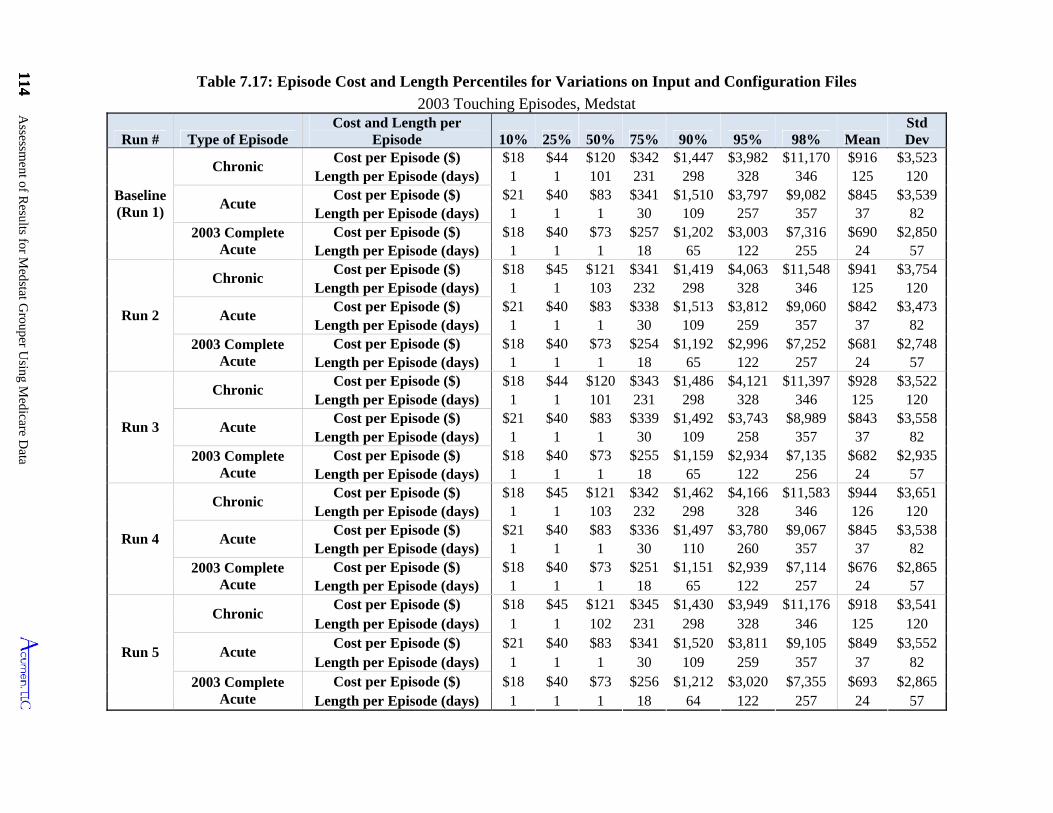
114 Assessm
ent of Results for M
edstat Grouper U
sing Medicare D
ata
114
Table 7.17: Episode Cost and Length Percentiles for Variations on Input and Configuration Files
2003 Touching Episodes, Medstat
Run # Type of Episode Cost and Length per
Episode 10% 25% 50% 75% 90% 95% 98% MeanStd Dev
Baseline (Run 1)
Chronic Cost per Episode ($) $18 $44 $120 $342 $1,447 $3,982 $11,170 $916 $3,523
Length per Episode (days) 1 1 101 231 298 328 346 125 120
Acute Cost per Episode ($) $21 $40 $83 $341 $1,510 $3,797 $9,082 $845 $3,539
Length per Episode (days) 1 1 1 30 109 257 357 37 82 2003 Complete
Acute Cost per Episode ($) $18 $40 $73 $257 $1,202 $3,003 $7,316 $690 $2,850
Length per Episode (days) 1 1 1 18 65 122 255 24 57
Run 2
Chronic Cost per Episode ($) $18 $45 $121 $341 $1,419 $4,063 $11,548 $941 $3,754
Length per Episode (days) 1 1 103 232 298 328 346 125 120
Acute Cost per Episode ($) $21 $40 $83 $338 $1,513 $3,812 $9,060 $842 $3,473
Length per Episode (days) 1 1 1 30 109 259 357 37 82 2003 Complete
Acute Cost per Episode ($) $18 $40 $73 $254 $1,192 $2,996 $7,252 $681 $2,748
Length per Episode (days) 1 1 1 18 65 122 257 24 57
Run 3
Chronic Cost per Episode ($) $18 $44 $120 $343 $1,486 $4,121 $11,397 $928 $3,522
Length per Episode (days) 1 1 101 231 298 328 346 125 120
Acute Cost per Episode ($) $21 $40 $83 $339 $1,492 $3,743 $8,989 $843 $3,558
Length per Episode (days) 1 1 1 30 109 258 357 37 82 2003 Complete
Acute Cost per Episode ($) $18 $40 $73 $255 $1,159 $2,934 $7,135 $682 $2,935
Length per Episode (days) 1 1 1 18 65 122 256 24 57
Run 4
Chronic Cost per Episode ($) $18 $45 $121 $342 $1,462 $4,166 $11,583 $944 $3,651
Length per Episode (days) 1 1 103 232 298 328 346 126 120
Acute Cost per Episode ($) $21 $40 $83 $336 $1,497 $3,780 $9,067 $845 $3,538
Length per Episode (days) 1 1 1 30 110 260 357 37 82 2003 Complete
Acute Cost per Episode ($) $18 $40 $73 $251 $1,151 $2,939 $7,114 $676 $2,865
Length per Episode (days) 1 1 1 18 65 122 257 24 57
Run 5
Chronic Cost per Episode ($) $18 $45 $121 $345 $1,430 $3,949 $11,176 $918 $3,541
Length per Episode (days) 1 1 102 231 298 328 346 125 120
Acute Cost per Episode ($) $21 $40 $83 $341 $1,520 $3,811 $9,105 $849 $3,552
Length per Episode (days) 1 1 1 30 109 259 357 37 82 2003 Complete
Acute Cost per Episode ($) $18 $40 $73 $256 $1,212 $3,020 $7,355 $693 $2,865
Length per Episode (days) 1 1 1 18 64 122 257 24 57
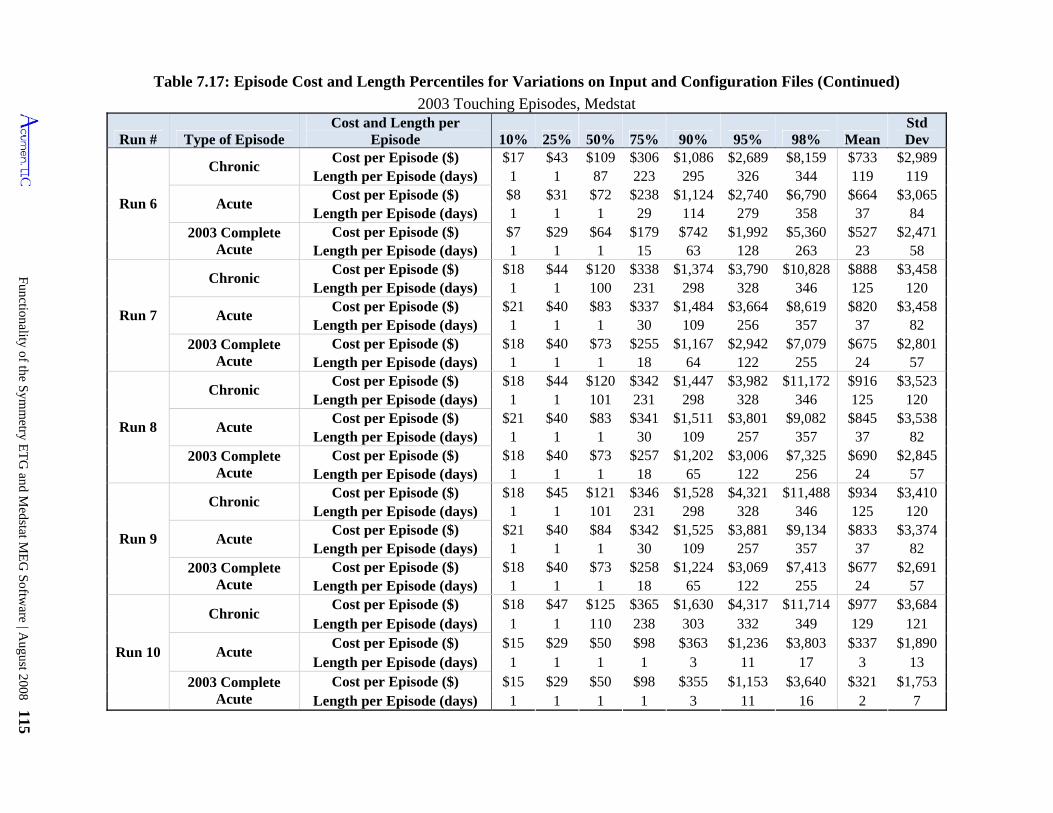
Functionality of the S
ymm
etry ET
G and M
edstat ME
G S
oftware | A
ugust 2008 115
Chronic
Cost per Episode ($) Acute
Cost per Episode ($) 2003 Complete Acute
Cost per Episode ($) Chronic
346 125
109 $255
1 $44
Cost per Episode ($)
$934
Run # Type of Episode Cost and Length per
Episode 10% 25% 50% 75% 90% 95% 98% MeanStd Dev
Cost per Episode ($) $17 $43 $109 $306 $1,086 $2,689 $8,159 $733 $2,989
Length per Episode (days) 1 1 101 231 298 328 346 125 120
Acute Cost per Episode ($) $21 $40 $84 $342 $1,525 $3,881 $9,134 $833 $3,374
Length per Episode (days) 1 1 1 30 109 257 357 37 82 2003 Complete
Acute Cost per Episode ($) $18 $40 $73 $258 $1,224 $3,069 $7,413 $677 $2,691
Length per Episode (days) 1 1 1 18 65 122 255 24 57
Run 10
Chronic Cost per Episode ($) $18 $47 $125 $365 $1,630 $4,317 $11,714 $977 $3,684
Length per Episode (days) 1 1 110 238 303 332 349 129 121
Acute Cost per Episode ($) $15 $29 $50 $98 $363 $1,236 $3,803 $337 $1,890
Length per Episode (days) 1 1 1 1 3 11 17 3 13 2003 Complete
Acute Cost per Episode ($) $15 $29 $50 $98 $355 $1,153 $3,640 $321 $1,753
Length per Episode (days) 1 1 1 1 3 11 16 2 7
Table 7.17: Episode Cost and Length Percentiles for Variations on Input and Configuration Files (Continued)
2003 Touching Episodes, Medstat
Run 6
Length per Episode (days) 1 1 87 223 295 326 344 119 119 $8 $31 $72 $238 $1,124 $2,740 $6,790 $664 $3,065
Length per Episode (days) 1 1 1 29 114 279 358 37 84 $7 $29 $64 $179 $742 $1,992 $5,360 $527 $2,471
Length per Episode (days) 1 1 1 15 63 128 263 23 58 $18 $44 $120 $338 $1,374 $3,790 $10,828 $888 $3,458
Run 7
Length per Episode (days) 1 1 100 231 298 120
Acute Cost per Episode ($) $21 $40 $83 $337 $3,664 $8,619 $820 $3,458
Length per Episode (days) 1 1 1 256 357 37 82 2003 Complete
Acute Cost per Episode ($) $18 $40 $1,167 $2,942 $7,079 $675 $2,801
Length per Episode (days) 1 18 64 122 255 24 57
Run 8
Chronic Cost per Episode ($) $120 $342 $1,447 $3,982 $11,172 $916 $3,523
1 1 101 231 298 328 346 125 120 $21 $40 $83 $341 $1,511 $3,801 $9,082 $845 $3,538
Length per Episode (days) 1 1 1 30 109 257 357 37 82 2003 Complete
Acute Cost per Episode ($) $18 $40 $73 $257 $1,202 $3,006 $7,325 $690
Length per Episode (days) 1 1 1 18 65 122 256 57
Run 9
Chronic Cost per Episode ($) $18 $45 $121 $346 $1,528 $4,321 $3,410
328 $1,484
30 $73
1 $18
Length per Episode (days)
Acute
$2,845 24
$11,488
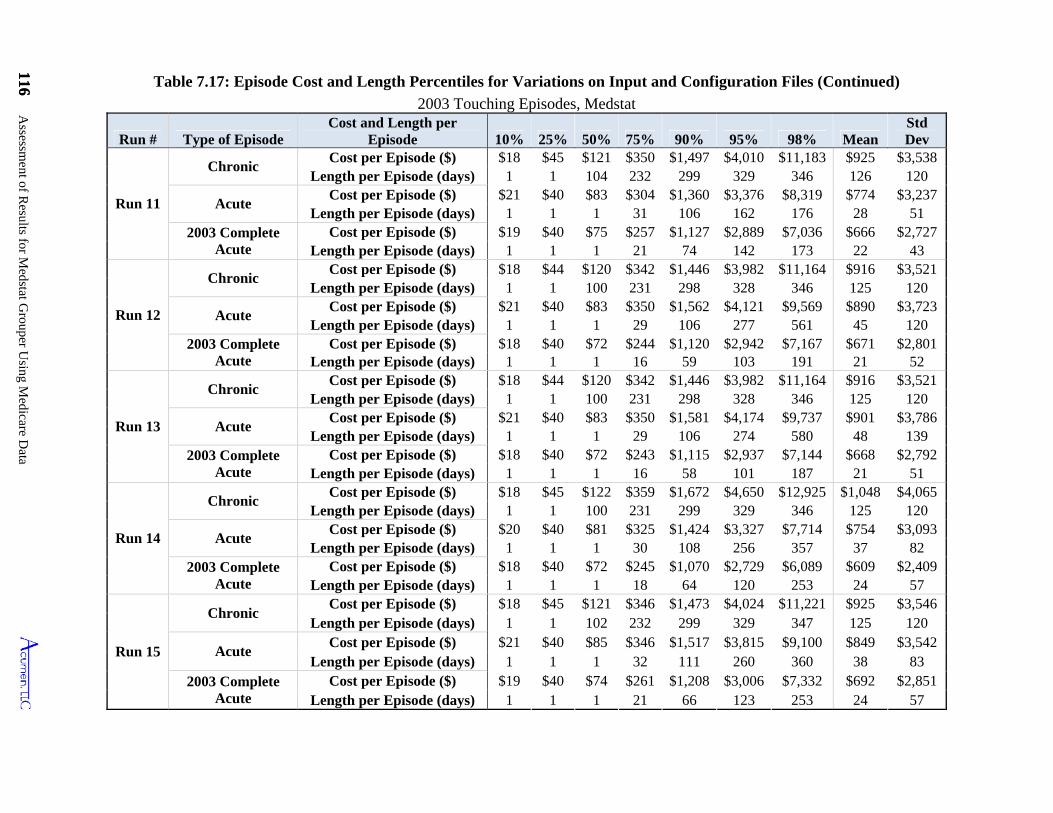
116 Assessm
ent of Results for M
edstat Grouper U
sing Medicare D
ata
116
Table 7.17: Episode Cost and Length Percentiles for Variations on Input and Configuration Files (Continued)
2003 Touching Episodes, Medstat
Run # Type of Episode Cost and Length per
Episode 10% 25% 50% 75% 90% 95% 98% Mean Std Dev
Run 11
Chronic Cost per Episode ($) $18 $45 $121 $350 $1,497 $4,010 $11,183 $925 $3,538
Length per Episode (days) 1 1 104 232 299 329 346 126 120
Acute Cost per Episode ($) $21 $40 $83 $304 $1,360 $3,376 $8,319 $774 $3,237
Length per Episode (days) 1 1 1 31 106 162 176 28 51 2003 Complete
Acute Cost per Episode ($) $19 $40 $75 $257 $1,127 $2,889 $7,036 $666 $2,727
Length per Episode (days) 1 1 1 21 74 142 173 22 43
Run 12
Chronic Cost per Episode ($) $18 $44 $120 $342 $1,446 $3,982 $11,164 $916 $3,521
Length per Episode (days) 1 1 100 231 298 328 346 125 120
Acute Cost per Episode ($) $21 $40 $83 $350 $1,562 $4,121 $9,569 $890 $3,723
Length per Episode (days) 1 1 1 29 106 277 561 45 120 2003 Complete
Acute Cost per Episode ($) $18 $40 $72 $244 $1,120 $2,942 $7,167 $671 $2,801
Length per Episode (days) 1 1 1 16 59 103 191 21 52
Run 13
Chronic Cost per Episode ($) $18 $44 $120 $342 $1,446 $3,982 $11,164 $916 $3,521
Length per Episode (days) 1 1 100 231 298 328 346 125 120
Acute Cost per Episode ($) $21 $40 $83 $350 $1,581 $4,174 $9,737 $901 $3,786
Length per Episode (days) 1 1 1 29 106 274 580 48 139 2003 Complete
Acute Cost per Episode ($) $18 $40 $72 $243 $1,115 $2,937 $7,144 $668 $2,792
Length per Episode (days) 1 1 1 16 58 101 187 21 51
Run 14
Chronic Cost per Episode ($) $18 $45 $122 $359 $1,672 $4,650 $12,925 $1,048 $4,065
Length per Episode (days) 1 1 100 231 299 329 346 125 120
Acute Cost per Episode ($) $20 $40 $81 $325 $1,424 $3,327 $7,714 $754 $3,093
Length per Episode (days) 1 1 1 30 108 256 357 37 82 2003 Complete
Acute Cost per Episode ($) $18 $40 $72 $245 $1,070 $2,729 $6,089 $609 $2,409
Length per Episode (days) 1 1 1 18 64 120 253 24 57
Run 15
Chronic Cost per Episode ($) $18 $45 $121 $346 $1,473 $4,024 $11,221 $925 $3,546
Length per Episode (days) 1 1 102 232 299 329 347 125 120
Acute Cost per Episode ($) $21 $40 $85 $346 $1,517 $3,815 $9,100 $849 $3,542
Length per Episode (days) 1 1 1 32 111 260 360 38 83 2003 Complete
Acute Cost per Episode ($) $19 $40 $74 $261 $1,208 $3,006 $7,332 $692 $2,851
Length per Episode (days) 1 1 1 21 66 123 253 24 57
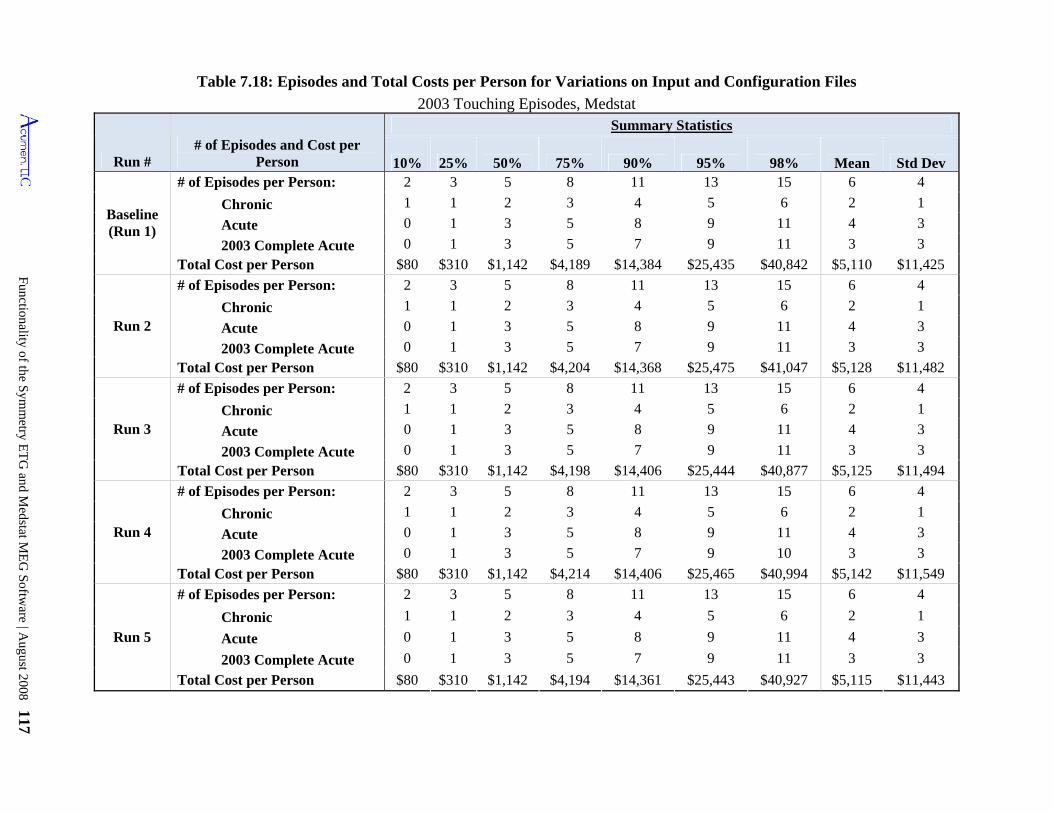
Functionality of the S
ymm
etry ET
G and M
edstat ME
G S
oftware | A
ugust 2008 117
Table 7.18: Episodes and Total Costs per Person for Variations on Input and Configuration Files
2003 Touching Episodes, Medstat
Run # # of Episodes and Cost per
Person
Summary Statistics
10% 25% 50% 75% 90% 95% 98% Mean Std Dev
Baseline (Run 1)
# of Episodes per Person: 2 3 5 8 11 13 15 6 4
Chronic 1 1 2 3 4 5 6 2 1
Acute 0 1 3 5 8 9 11 4 3
2003 Complete Acute 0 1 3 5 7 9 11 3 3
Total Cost per Person $80 $310 $1,142 $4,189 $14,384 $25,435 $40,842 $5,110 $11,425
Run 2
# of Episodes per Person: 2 3 5 8 11 13 15 6 4
Chronic 1 1 2 3 4 5 6 2 1
Acute 0 1 3 5 8 9 11 4 3
2003 Complete Acute 0 1 3 5 7 9 11 3 3
Total Cost per Person $80 $310 $1,142 $4,204 $14,368 $25,475 $41,047 $5,128 $11,482
Run 3
# of Episodes per Person: 2 3 5 8 11 13 15 6 4
Chronic 1 1 2 3 4 5 6 2 1
Acute 0 1 3 5 8 9 11 4 3
2003 Complete Acute 0 1 3 5 7 9 11 3 3
Total Cost per Person $80 $310 $1,142 $4,198 $14,406 $25,444 $40,877 $5,125 $11,494
Run 4
# of Episodes per Person: 2 3 5 8 11 13 15 6 4
Chronic 1 1 2 3 4 5 6 2 1
Acute 0 1 3 5 8 9 11 4 3
2003 Complete Acute 0 1 3 5 7 9 10 3 3
Total Cost per Person $80 $310 $1,142 $4,214 $14,406 $25,465 $40,994 $5,142 $11,549
Run 5
# of Episodes per Person: 2 3 5 8 11 13 15 6 4
Chronic 1 1 2 3 4 5 6 2 1
Acute 0 1 3 5 8 9 11 4 3
2003 Complete Acute 0 1 3 5 7 9 11 3 3
Total Cost per Person $80 $310 $1,142 $4,194 $14,361 $25,443 $40,927 $5,115 $11,443
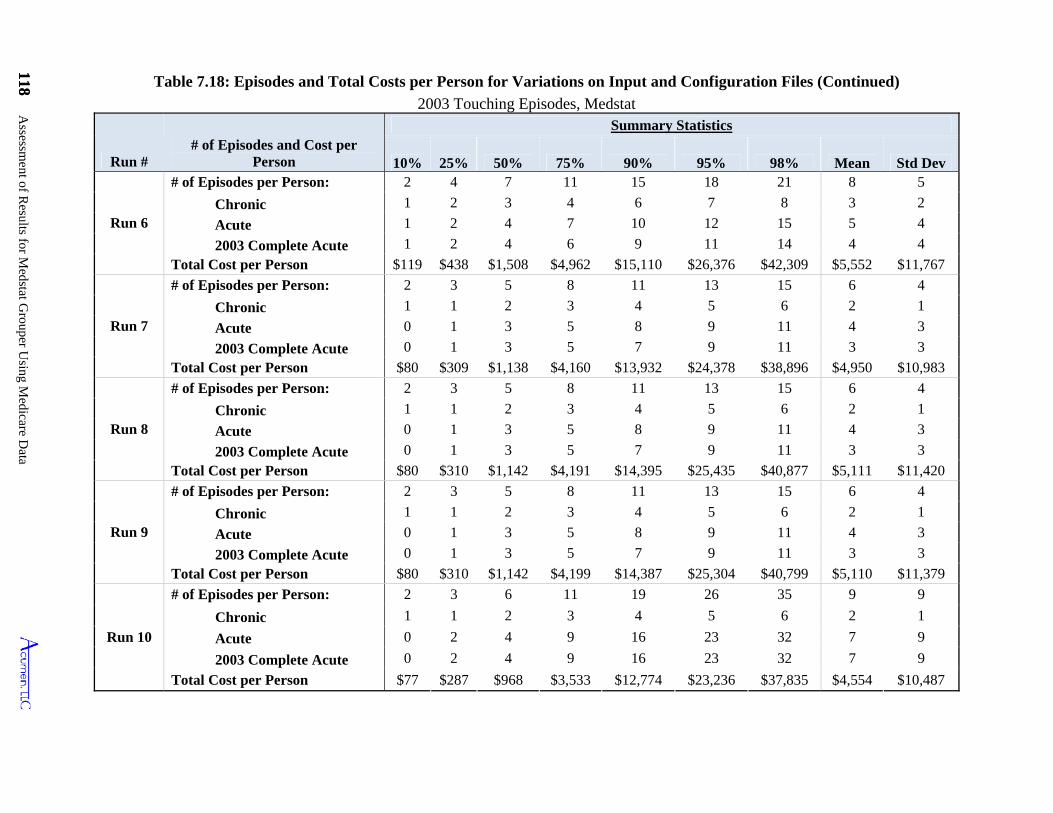
118 Assessm
ent of Results for M
edstat Grouper U
sing Medicare D
ata
118
10%
Table 7.18: Episodes and Total Costs per Person for Variations on Input and Configuration Files (Continued)
2003 Touching Episodes, Medstat
Run # # of Episodes and Cost per
Person
Summary Statistics
25% 50% 75% 90% 95% 98% Mean Std Dev
Run 6
# of Episodes per Person: 2 4 7 11 15 18 21 8 5
Chronic 1 2 3 4 6 7 8 3 2
Acute 1 2 4 7 10 12 15 5 4
2003 Complete Acute 1 2 4 6 9 11 14 4 4
Total Cost per Person $119 $438 $1,508 $4,962 $15,110 $26,376 $42,309 $5,552 $11,767
Run 7
# of Episodes per Person: 2 3 5 8 11 13 15 6 4
Chronic 1 1 2 3 4 5 6 2 1
Acute 0 1 3 5 8 9 11 4 3
2003 Complete Acute 0 1 3 5 7 9 11 3 3
Total Cost per Person $80 $309 $1,138 $4,160 $13,932 $24,378 $38,896 $4,950 $10,983
Run 8
# of Episodes per Person: 2 3 5 8 11 13 15 6 4
Chronic 1 1 2 3 4 5 6 2 1
Acute 0 1 3 5 8 9 11 4 3
2003 Complete Acute 0 1 3 5 7 9 11 3 3
Total Cost per Person $80 $310 $1,142 $4,191 $14,395 $25,435 $40,877 $5,111 $11,420
Run 9
# of Episodes per Person: 2 3 5 8 11 13 15 6 4
Chronic 1 1 2 3 4 5 6 2 1
Acute 0 1 3 5 8 9 11 4 3
2003 Complete Acute 0 1 3 5 7 9 11 3 3
Total Cost per Person $80 $310 $1,142 $4,199 $14,387 $25,304 $40,799 $5,110 $11,379
Run 10
# of Episodes per Person: 2 3 6 11 19 26 35 9 9
Chronic 1 1 2 3 4 5 6 2 1
Acute 0 2 4 9 16 23 32 7 9
2003 Complete Acute 0 2 4 9 16 23 32 7 9
Total Cost per Person $77 $287 $968 $3,533 $12,774 $23,236 $37,835 $4,554 $10,487
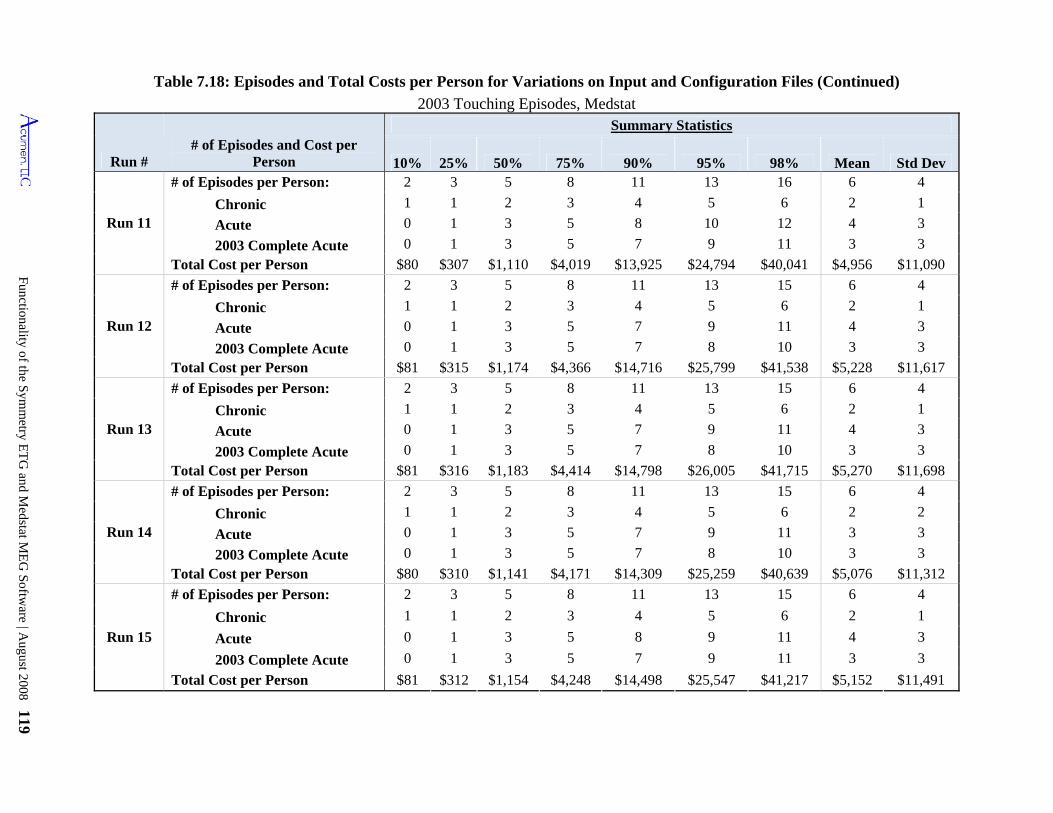
Functionality of the S
ymm
etry ET
G and M
edstat ME
G S
oftware | A
ugust 2008 119
Table 7.18: Episodes and Total Costs per Person for Variations on Input and Configuration Files (Continued)
2003 Touching Episodes, Medstat
Run # # of Episodes and Cost per
Person
Summary Statistics
10% 25% 50% 75% 90% 95% 98% Mean Std Dev
Run 11
# of Episodes per Person: 2 3 5 8 11 13 16 6 4
Chronic 1 1 2 3 4 5 6 2 1
Acute 0 1 3 5 8 10 12 4 3
2003 Complete Acute 0 1 3 5 7 9 11 3 3
Total Cost per Person $80 $307 $1,110 $4,019 $13,925 $24,794 $40,041 $4,956 $11,090
Run 12
# of Episodes per Person: 2 3 5 8 11 13 15 6 4
Chronic 1 1 2 3 4 5 6 2 1
Acute 0 1 3 5 7 9 11 4 3
2003 Complete Acute 0 1 3 5 7 8 10 3 3
Total Cost per Person $81 $315 $1,174 $4,366 $14,716 $25,799 $41,538 $5,228 $11,617
Run 13
# of Episodes per Person: 2 3 5 8 11 13 15 6 4
Chronic 1 1 2 3 4 5 6 2 1
Acute 0 1 3 5 7 9 11 4 3
2003 Complete Acute 0 1 3 5 7 8 10 3 3
Total Cost per Person $81 $316 $1,183 $4,414 $14,798 $26,005 $41,715 $5,270 $11,698
Run 14
# of Episodes per Person: 2 3 5 8 11 13 15 6 4
Chronic 1 1 2 3 4 5 6 2 2
Acute 0 1 3 5 7 9 11 3 3
2003 Complete Acute 0 1 3 5 7 8 10 3 3
Total Cost per Person $80 $310 $1,141 $4,171 $14,309 $25,259 $40,639 $5,076 $11,312
Run 15
# of Episodes per Person: 2 3 5 8 11 13 15 6 4
Chronic 1 1 2 3 4 5 6 2 1
Acute 0 1 3 5 8 9 11 4 3
2003 Complete Acute 0 1 3 5 7 9 11 3 3
Total Cost per Person $81 $312 $1,154 $4,248 $14,498 $25,547 $41,217 $5,152 $11,491

120 Assessm
ent of Results for M
edstat Grouper U
sing Medicare D
ata
Table 7.19: Ungrouped Claims by Claim Type for Variations on Input and Configuration Files
All Claims, Medstat
Claim Type
Baseline (Run 1) Run 2 Run 3 Run 4 Run 5
# Ungrouped
% Ungrouped
# Ungrouped
% Ungrouped
# Ungrouped
% Ungrouped
# Ungrouped
% Ungrouped
# Ungrouped
% Ungrouped
IP 176 0.5% 176 0.5% 170 0.5% 170 0.5% 176 0.5% OP 123,849 25.7% 122,751 25.5% 123,795 25.7% 122,675 25.4% 123,128 25.5% SNF 3 0.0% 7 0.1% 139 1.5% 145 1.6% 3 0.0% HH 11 0.1% 11 0.1% 11 0.1% 11 0.1% 11 0.1% HS 0 0.0% 0 0.0% 0 0.0% 0 0.0% 0 0.0% PB 864,654 21.1% 865,678 21.1% 861,098 21.0% 862,120 21.0% 865,300 21.1% DME 181,321 44.3% 181,661 44.4% 181,126 44.2% 181,479 44.3% 181,682 44.4%
Claim Type
Run 6 Run 7 Run 8 Run 9 Run 10
# Ungrouped
% Ungrouped
# Ungrouped
% Ungrouped
# Ungrouped
% Ungrouped
# Ungrouped
% Ungrouped
# Ungrouped
% Ungrouped
IP 176 0.5% 176 0.5% 176 0.5% 11 0.0% 176 0.5% OP 56 0.0% 124,099 25.7% 123,849 25.7% 123,720 25.7% 148,589 30.8% SNF 3 0.0% 3,394 36.4% 3 0.0% 3 0.0% 3 0.0% HH 11 0.1% 11 0.1% 11 0.1% 11 0.1% 11 0.1% HS 0 0.0% 1,773 57.5% 0 0.0% 0 0.0% 0 0.0% PB 12,123 0.3% 865,759 21.1% 864,654 21.1% 863,841 21.1% 976,571 23.8% DME 8,681 2.1% 181,750 44.4% 181,321 44.3% 181,156 44.2% 223,813 54.7%
Claim Type
Run 11 Run 12 Run 13 Run 14 Run 15
# Ungrouped
% Ungrouped
# Ungrouped
% Ungrouped
# Ungrouped
% Ungrouped
# Ungrouped
% Ungrouped
# Ungrouped
% Ungrouped
IP 176 0.5% 176 0.5% 176 0.5% 176 0.5% 176 0.5% OP 125,407 26.0% 123,117 25.5% 122,845 25.5% 122,918 25.5% 119,101 24.7% SNF 3 0.0% 3 0.0% 3 0.0% 3 0.0% 3 0.0% HH 11 0.1% 11 0.1% 11 0.1% 11 0.1% 11 0.1% HS 0 0.0% 0 0.0% 0 0.0% 0 0.0% 0 0.0% PB 869,427 21.2% 862,302 21.0% 861,444 21.0% 859,812 21.0% 840,501 20.5% DME 192,104 46.9% 173,081 42.3% 170,474 41.6% 180,213 44.0% 178,695 43.6%
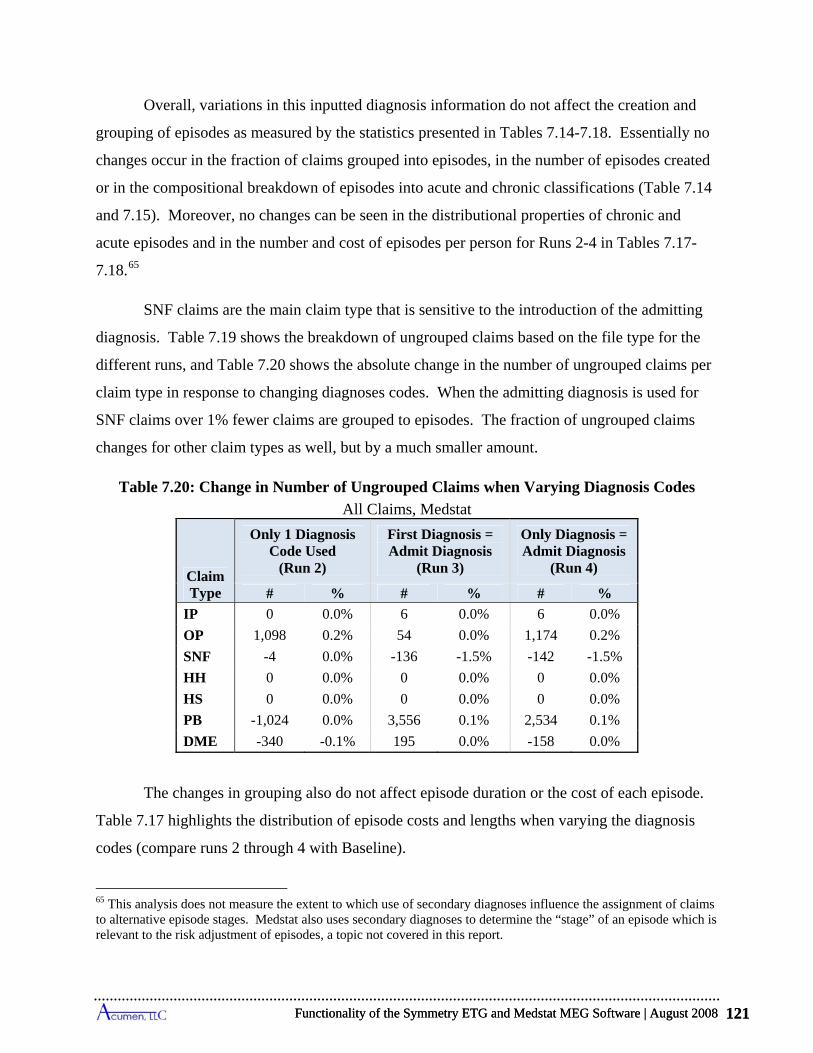
Functionality of the Symmetry ETG and Medstat MEG Software | August 2008 121
Overall, variations in this inputted diagnosis information do not affect the creation and
grouping of episodes as measured by the statistics presented in Tables 7.14-7.18. Essentially no
changes occur in the fraction of claims grouped into episodes, in the number of episodes created
or in the compositional breakdown of episodes into acute and chronic classifications (Table 7.14
and 7.15). Moreover, no changes can be seen in the distributional properties of chronic and
acute episodes and in the number and cost of episodes per person for Runs 2-4 in Tables 7.17-
7.18.65
SNF claims are the main claim type that is sensitive to the introduction of the admitting
diagnosis. Table 7.19 shows the breakdown of ungrouped claims based on the file type for the
different runs, and Table 7.20 shows the absolute change in the number of ungrouped claims per
claim type in response to changing diagnoses codes. When the admitting diagnosis is used for
SNF claims over 1% fewer claims are grouped to episodes. The fraction of ungrouped claims
changes for other claim types as well, but by a much smaller amount.
Table 7.20: Change in Number of Ungrouped Claims when Varying Diagnosis Codes
All Claims, Medstat
Claim Type
Only 1 Diagnosis Code Used
(Run 2)
First Diagnosis = Admit Diagnosis
(Run 3)
Only Diagnosis = Admit Diagnosis
(Run 4)
# % # % # %
IP 0 0.0% 6 0.0% 6 0.0%
OP 1,098 0.2% 54 0.0% 1,174 0.2%
SNF -4 0.0% -136 -1.5% -142 -1.5%
HH 0 0.0% 0 0.0% 0 0.0%
HS 0 0.0% 0 0.0% 0 0.0%
PB -1,024 0.0% 3,556 0.1% 2,534 0.1%
DME -340 -0.1% 195 0.0% -158 0.0%
The changes in grouping also do not affect episode duration or the cost of each episode.
Table 7.17 highlights the distribution of episode costs and lengths when varying the diagnosis
codes (compare runs 2 through 4 with Baseline).
65 This analysis does not measure the extent to which use of secondary diagnoses influence the assignment of claims to alternative episode stages. Medstat also uses secondary diagnoses to determine the “stage” of an episode which is relevant to the risk adjustment of episodes, a topic not covered in this report.
Functionality of the Symmetry ETG and Medstat MEG Software | August 2008 121

Assessment of Results for Medstat Grouper Using Medicare Data 122
While changes in the use of diagnosis codes do not lead to significant changes in
ungrouped episodes, costs and lengths of episodes, or the number of episodes per person, these
changes from the baseline do lead to significant numbers of claims shifting across MEGs and
episodes. Table 7.16 shows that using the admitting diagnosis code in place of the first diagnosis
(Run 3) leads to a small shift, 0.7%, in claims across MEGs; however the costs associated with
claims shifting across MEGs represent 10.2% of all claim costs. We also find that 1.6% of
claims change either episode dates or MEGs, implying that these claims shift across episodes
either within an MEG or across MEGs; costs associated with these shifting claims represent
12.1% of all costs. Using a single diagnosis code leads to a 1.1% (Run 2) and 1.7% (Run 4) shift
in claims from one MEG to another. These shifts in claims produce 5.6% and 14.7% shifts in
costs across MEGs respectively. Claims that either shift across MEGs or change episode dates
account for 2.7% and 4.1% of all claims depending on the diagnosis code used, with 8.7% and
19.1% of all costs associated with these claims shifting episodes. These results show that
diagnosis codes play a critical role in assigning a claim to an MEG or particular episode.
With regard to the specific episodes and in particular the focal diseases, the number of
diagnosis codes specified in the claims (either one or all) does not significantly change the cost,
number of episodes, and number of claims grouped into the episode type. Using the admitting
diagnosis as the first diagnosis also does not significantly change the results. Because the tables
by run and episode type are quite large, they have been omitted from this report but can be
furnished upon request.
7.3.2 Varying Procedure Codes and X-ray/Lab Flags (Runs 5 through 7)
To test the impact of varying the procedure codes and the x-ray/lab flags, a number of
different changes are made to both the procedure codes used as well as the x-ray/lab flags used
for the input file.
Although Medstat allows up to 15 procedure codes from its input records, this
information has little impact on its actual grouping process. Procedure codes are relevant mainly
in that they are used in the setting of the x-ray/lab flags and thus dictate whether or not a claim
may start an episode. Run 5 tests the role of procedure codes by keeping the x-ray/lab flags
constant from the Baseline run and blanking all procedure codes in the claims. Thus, x-ray/labs
are still not allowed to start an episode, but the claims in this run do not provide specific
Assessment of Results for Medstat Grouper Using Medicare Data 122
Functionality of the Symmetry ETG and Medstat MEG Software | August 2008 123
information as to what type of procedure is covered. Table 7.14 shows only a tiny deviation in
the total number of episodes resulting from blanking out procedure codes (Run 5). This result
confirms the statement in the Medstat manual that the grouper uses procedure codes to choose
among valid diagnosis codes for grouping claims: “When a procedure code and two diagnoses
are available, the MEG grouper considers logical pairings of diagnoses and procedures to
determine which diagnosis should be used to assign the episode group for a detail record.”66
Medstat’s documentation also indicates that procedure codes are not used in the disease staging
process.
Table 7.16 does show some shifts, albeit relatively small, of claims across MEGS and
episodes resulting from blanking all procedure codes on claims. A total of 1.8% of claims either
shift across MEGs or episodes as a result of this change from Baseline settings, with 3.4% of
costs shifting with these claims.
As noted above, the main role of procedure codes in Medstat’s grouping process is to set
the x-ray/lab flags that dictate whether a claim is permitted by the software to begin an episode.
To understand the role played by these x-ray/lab flags in the grouping process, we conduct three
runs to test the consequences of three cases: (i) all x-ray/lab flags set to 1, (ii) all x-ray/lab flags
set to 0 (Run 6), and (iii) change SNF and HS x-ray/lab flags to 1 (Run 7).
(i) All x-ray/lab flags set to 1
Flagging all claims (i.e. setting the x-ray/lab flag to 1) causes all of the claims to remain
ungrouped. Since no further analysis can be performed in this case, we leave this run out of the
tables.
(ii) All x-ray/lab flags set to 0 (Run 6)
When all the x-ray/lab flags are set to 0 (unflagged), virtually all of the claims are
grouped (Table 7.14). This confirms that x-ray/lab flags are responsible for informing the
software whether a claim can start an episode, and that allowing all claims to start episodes
66 This feature of MEG 7.1 marks a change from version 6. As we confirmed in previous testing, Medstat documented that MEG 6.0 groups “based solely on diagnosis codes and does not take into account procedure codes.”
Functionality of the Symmetry ETG and Medstat MEG Software | August 2008 123
Assessment of Results for Medstat Grouper Using Medicare Data 124
results in virtually 100% grouping. The total number of 2003 Touching Episodes increases to
317,498, a 38% increase over the Baseline (Table 7.15).
Although the proportion of complete acute episodes remains almost constant, the average
cost of a complete acute episode decreases by roughly 24%, from $690 to $527 (Table 7.17).
The decrease in average cost can be explained by the sharp increase in number of episodes, a
result of previously ungrouped lab and x-ray claims constituting their own, low-cost episodes.
Looking at ungrouped claims by claim type (Table 7.19, Run 6), we see that setting the x-
ray/lab flags to 0 causes only a small fraction of claims (less than 0.5% for all file types except
for IP and DME) to remain ungrouped. These remaining ungrouped claims most likely persist
because of the presence of improper diagnosis codes that the software cannot use. Additionally,
the only changes occur in DME, OP, and PB claims because the Baseline run has the x-ray/lab
flags for almost all the IP, HS, HH, and SNF claims set to 0.67
We also see a significant number of claims shifting across MEGs and episodes (Table
7.16). Setting the flag to 0 leads to 38.5% of claims either changing MEGs or episode dates.
Given that this run results in nearly all claims grouping, most of this shifting is likely the result
of ungrouped claims grouping. This results in 28.9% of costs being reassigned to different
MEGs or episodes.
(iii) Change SNF and HS x-ray/lab flags to 1 (Run 7)
For the Baseline run, the x-ray/lab flags for all HS claims are set to 0 (unflagged), since
there are never any codes indicating x-ray or laboratory procedures on HS claims, and almost all
SNF claims have the flag set to 0 as procedure codes are only very rarely included on these
claims. In Run 7, all SNF and HS claims have x-ray/lab flags set to 1 (flagged) to determine the
impact the x-ray/lab flags have on the grouper and these specific claim types in particular.
Compared to the Baseline findings, inspection of Table 7.14 reveals that flagging SNF
and HS claims leads to little change in number and composition of episodes, but it produces a
substantial increase in the cost of ungrouped claims even though the overall proportion of
67 The Medstat Baseline run uses any available procedure codes for HS and SNF claims to set the x-ray/lab flag. Since almost none of those claims have procedure codes it is almost always set to 0. IP claims are also, by construction, not flagged.
Assessment of Results for Medstat Grouper Using Medicare Data 124
Functionality of the Symmetry ETG and Medstat MEG Software | August 2008 125
ungrouped claims remains almost unchanged. This is likely due to the fact that while these two
claim types represent a small fraction of all claims, they comprise a large share of costs. The
number of ungrouped SNF and HS claims increases from 3 to 3,394 for SNF and 0 to 1,773 for
HS claims. Even though all SNF and HS claims are flagged, only 36% of SNF claims and 58%
of HS claims remain ungrouped, indicating that the software is still able to group many of these
claim types into already existent episodes (Table 7.19, Run 7).
Additionally, the slightly smaller number of total episodes likely results from SNF and
HS not being able to start episodes. If the episodes that were once started by SNF or HS claims
only consisted of the SNF/HS claim and other x-ray/lab claims, then flagging the SNF/HS claims
would mean that these episodes would not be created in this run.
Setting x-ray/lab flags for SNF and HS claims to 1 leads to relatively small changes in
claim reassignment to different MEGs or episodes. Combining both claims changing MEGs and
claims whose episode dates have changed, we see that 0.4% of claims shift MEGs or episode
dates. This leads to a reallocation of 3.7% of total costs across episodes.
7.3.3 Reordering Input Records (Run 8)
Medstat requires that claims be sorted a certain way in order for the grouper to work. Per
their recommendations, we sort input records by beneficiary (required by Medstat), start date
(also required), and end date in all of our runs. However, there are many cases where two claims
for the same person share the same start and end dates, so the user still has a choice as to how to
order the input records when following Medstat’s ordering rules, even after applying the non-
required condition that claims be sorted by end date. We test whether the order of these claims
influences grouping outcomes in Run 8. To these this, we use the Baseline claim ordering
(sorted by person, start date, and end date categories), but within this sorting reorder the claims
at random. That is, we change the input order of claims with identical beneficiaries, start dates
and end dates.
The rows corresponding to Run 8 in Table 7.14 and Table 7.15 reveal that almost
unnoticeable changes occurred in the main results compared to the Baseline run, with the number
of episodes decreasing by just seven. Although the summary statistics show little difference
from the Baseline, a number of claims are reallocated to different episodes in Run 8 compared to
Functionality of the Symmetry ETG and Medstat MEG Software | August 2008 125

Assessment of Results for Medstat Grouper Using Medicare Data 126
the Baseline run (Table 7.16). The reordering of the input records induces changes in the
assignment of 0.2% of Medicare claims to new MEGs, implying switches to different health-care
treatments. Further, 0.4% of Medicare claims are assigned to different episodes, with different
episodes interpreted as being either a new type or having a new start date. This reassignment
means that 0.6% of total costs are reallocated to different episodes of care (and potentially to
different providers). This shows that costs are reallocated simply based on the order in which the
user inputs the data, shifting nearly $4 million worth of claims to different episodes for our
sample of 20% of Colorado beneficiaries; this would be almost $20 million for 100% of
Colorado.
7.3.4 Varying Medstat Configuration File (Runs 9-15)
A number of our runs alter key parameters of Medstat's configuration file. In this
subsection, we consider the effect of these changes on its episode grouping results. These
parameters include: (i) build admissions for facility records and (ii) episode limit length,68 (iii)
stratifying chronic episodes, and (iv) setting the look-back period.
(i) Facility Admissions Build Feature
Medstat’s Admission Build feature designates an “admission time window” that specifies
a period of time encompassed by a single admission. Multiple room and board facility records
can be joined together to make one admission. In a commercial setting, for example, a patient
can be hospitalized for several weeks and the hospital can submit multiple claims to pay for the
stay. The purpose of the Facility Admissions Build feature is to combine these claims. Medstat
requests that all inpatient data be grouped into stays of admission, either manually or by using
the software’s build admission feature on facility records.69
In Medicare, more than one claim can show up for a single stay, since CMS sometimes
makes interim payments during an admission with the final claim covering the remaining part of
the payment assessed to the complete admission. (There can also be outlier payments or
adjustments for admissions that generate multiple claims.) Information available on inpatient
claims identifies whether they are part of the same admission. CMS uses this information to
68 The episode length setting uses Medstat’s episode date assignments; however, we present the results using our date assignments. 69 The "Admission Build" feature is described on pages 12 and 13 of the Version 7.1 User Guide.
Assessment of Results for Medstat Grouper Using Medicare Data 126
Functionality of the Symmetry ETG and Medstat MEG Software | August 2008 127
build its MedPAR files, which provide data for stays rather than for claims. If the inpatient data
have not already been grouped into admissions by implementing a MEDPAR-type procedure, the
user must utilize the “Build Admissions” feature in Medstat’s configuration file to build
admissions out of facility records. Otherwise, the software assumes that each record is a separate
admission. Since Medicare IP claims do not always represent complete admissions, we use
Medstat’s Build Admissions feature for the Baseline run.
To assess the influence of this feature on grouping, we create two sets of IP input data.
The first set uses raw IP claims that do not correspond to admissions. The second dataset
manually combines all the IP claims into admissions, and then treats these combined claims as
input records. This manual combination of IP claims uses information from individual Medicare
claims to infer whether this claim represents a partial record for an admission to a hospital and, if
so, the other claims that cover the associated admission. For Medicare data, IP claims make up
an admission when they belong to the same beneficiary, have the same admission date, and have
the same provider. However, the vast majority of Medicare IP claims represent a single
admission. Manually building admissions produces 32,486 admissions from 32,590 IP claims.
The second dataset with manually built admissions, then, has only 104 fewer records than the
one associated with IP claims. Tables 7.21 to 7.24 compare findings for the different data sets
with the build admissions feature set to YES or NO.
The Baseline run uses the raw IP claims with the facility admissions build feature.
Turning off Medstat’s facility admissions build feature does not produce significant variation in
the output from Baseline. Setting the “Build Admissions” option to “NO” (Run 9) leads to a
slight increase in the number of episodes from 661,053 to 661,175 (summarized in Table 7.21).
The average cost of complete acute episodes decreases marginally (from $690 to $677), as does
the average cost of all acute episodes (from $845 to $833). The average cost of chronic episodes
shows a slight increase (from $916 to $934).
When we manually build admissions using the rules specified above, changing the Build
Admission setting from YES to NO produces similar results to those seen with the raw claims.
In particular, when manually building admissions and keeping Medstat’s Facility Admissions
Functionality of the Symmetry ETG and Medstat MEG Software | August 2008 127

Assessment of Results for Medstat Grouper Using Medicare Data 128
Build feature enabled,70 the number of total episodes remains almost unchanged from the
Baseline result, going from 661,053 episodes to 661,120 (Table 7.21). The cost and length of
complete episodes (Table 7.24) as well as the number and cost of episodes per person (Table
7.24) also remain virtually unchanged.
Manually building admissions also does not change outcomes appreciably when the
configuration file for Medstat is set to “Build Admissions” = NO. This setting increases the
number of episodes from the Baseline figure of 661,053 to 661,239, which is a larger increase
than when using the Baseline data with Facility Admissions Build disabled. The average cost,
length, and number per person of complete acute episodes do not change between the two runs in
which build admissions is set to NO. The total cost of all episodes per person is also almost
unchanged.
Running the grouper with “Build Admissions” = NO does produce some shifts in claims
across MEGs and episodes (Table 7.16). In total, 0.4% of claims either shift MEGs or episodes.
While this appears to be a small shift, it does lead to 5% of costs shifting across MEGs or
episodes.
70 If MEG builds admissions from IP claims using the same method as MedPAR does, using the Facility Admissions Build feature on IP claims that have already been manually built into admissions should lead to no changes at all. While this is approximately true, the groupings are slightly different for the two settings.
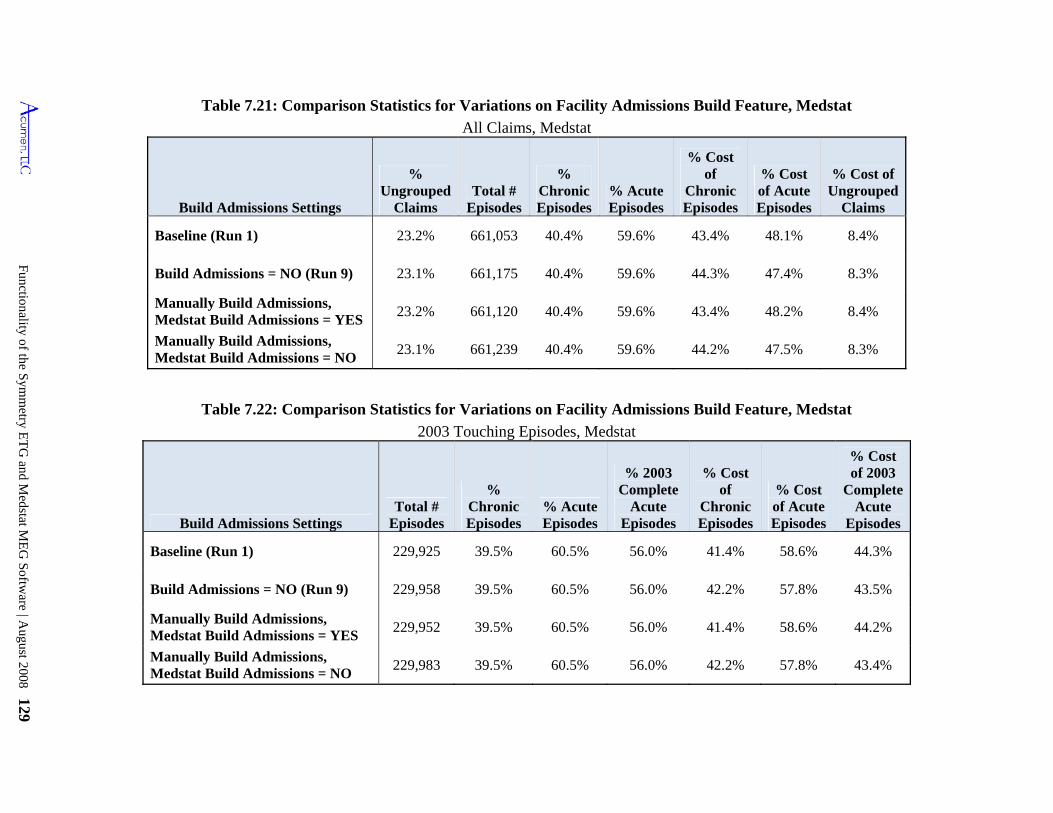
Functionality of the S
ymm
etry ET
G and M
edstat ME
G S
oftware | A
ugust 2008 129
Table 7.21: Comparison Statistics for Variations on Facility Admissions Build Feature, Medstat
All Claims, Medstat
Build Admissions Settings
% Ungrouped
Claims Total #
Episodes
% Chronic Episodes
% Acute Episodes
% Cost of
Chronic Episodes
% Cost of Acute Episodes
% Cost of Ungrouped
Claims
Baseline (Run 1) 23.2% 661,053 40.4% 59.6% 43.4% 48.1% 8.4%
Build Admissions = NO (Run 9) 23.1% 661,175 40.4% 59.6% 44.3% 47.4% 8.3%
Manually Build Admissions, Medstat Build Admissions = YES
23.2% 661,120 40.4% 59.6% 43.4% 48.2% 8.4%
Manually Build Admissions, Medstat Build Admissions = NO
23.1% 661,239 40.4% 59.6% 44.2% 47.5% 8.3%
Table 7.22: Comparison Statistics for Variations on Facility Admissions Build Feature, Medstat
2003 Touching Episodes, Medstat
Build Admissions Settings Total #
Episodes
% Chronic Episodes
% Acute Episodes
% 2003 Complete
Acute Episodes
% Cost of
Chronic Episodes
% Cost of Acute Episodes
% Cost of 2003
Complete Acute
Episodes
Baseline (Run 1) 229,925 39.5% 60.5% 56.0% 41.4% 58.6% 44.3%
Build Admissions = NO (Run 9) 229,958 39.5% 60.5% 56.0% 42.2% 57.8% 43.5%
Manually Build Admissions, Medstat Build Admissions = YES
229,952 39.5% 60.5% 56.0% 41.4% 58.6% 44.2%
Manually Build Admissions, Medstat Build Admissions = NO
229,983 39.5% 60.5% 56.0% 42.2% 57.8% 43.4%
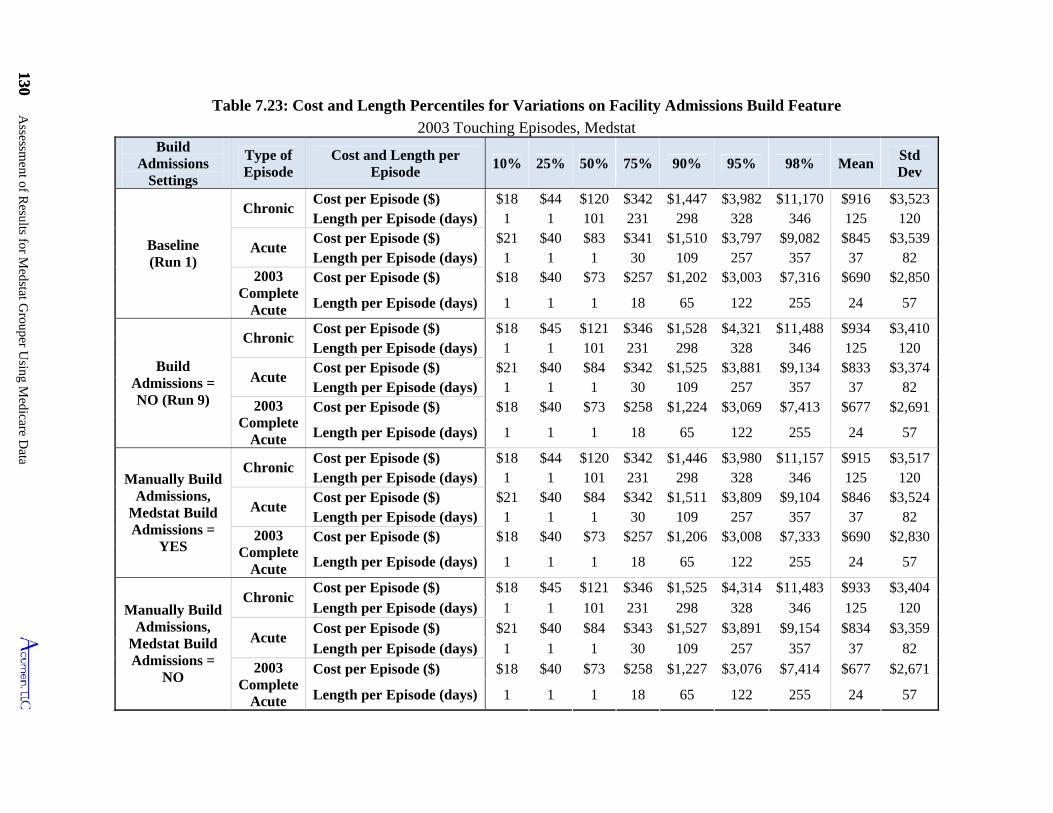
130 Assessm
ent of Results for M
edstat Grouper U
sing Medicare D
ata
130
Chronic Cost per Episode ($) $18 $45 $121 $346 $1,525 $4,314 $11,483 $933
Manually Build Admissions,
Medstat Build Admissions =
NO
$3,404
Length per Episode (days) 1 1 101 231 298 328 346 125 120
Acute Cost per Episode ($) $21 $40 $84 $343 $1,527 $3,891 $9,154 $834 $3,359
Length per Episode (days) 1 1 1 30 109 257 357 37 82 2003
Complete Acute
Cost per Episode ($) $18 $40 $73 $258 $1,227 $3,076 $7,414 $677 $2,671
Length per Episode (days) 1 1 1 18 65 122 255 24 57
Build Admissions
Settings
Type of Episode
Cost and Length per Episode
10% 25% 50% 75% 90% 95% 98% MeanStd Dev
Baseline (Run 1)
Chronic Cost per Episode ($) $18 $44 $120 $342 $1,447 $3,982 $11,170 $916 $3,523 Length per Episode (days) 1 1 101 231 298 328 346 125 120
Acute Cost per Episode ($) $21 $40 $83 $341 $1,510 $3,797 $9,082 $845 $3,539 Length per Episode (days) 1 1 1 30 109 257 357 37 82
2003 Complete
Acute
Cost per Episode ($) $18 $40 $73 $257 $1,202 $3,003 $7,316 $690 $2,850
Length per Episode (days) 1 1 1 18 65 122 255 24 57
Build Admissions = NO (Run 9)
Chronic Cost per Episode ($) $18 $45 $121 $346 $1,528 $4,321 $11,488 $934 $3,410 Length per Episode (days) 1 1 101 231 298 328 346 125 120
Acute Cost per Episode ($) $21 $40 $84 $342 $1,525 $3,881 $9,134 $833 $3,374 Length per Episode (days) 1 1 1 30 109 257 357 37 82
2003 Complete
Acute
Cost per Episode ($) $18 $40 $73 $258 $1,224 $3,069 $7,413 $677 $2,691
Length per Episode (days) 1 1 1 18 65 122 255 24 57
Manually Build Admissions,
Medstat Build Admissions =
YES
Chronic Cost per Episode ($) $18 $44 $120 $342 $1,446 $3,980 $11,157 $915 $3,517 Length per Episode (days) 1 1 101 231 298 328 346 125 120
Acute Cost per Episode ($) $21 $40 $84 $342 $1,511 $3,809 $9,104 $846 $3,524 Length per Episode (days) 1 1 1 30 109 257 357 37 82
2003 Complete
Acute
Cost per Episode ($) $18 $40 $73 $257 $1,206 $3,008 $7,333 $690 $2,830
Length per Episode (days) 1 1 1 18 65 122 255 24 57
Table 7.23: Cost and Length Percentiles for Variations on Facility Admissions Build Feature
2003 Touching Episodes, Medstat
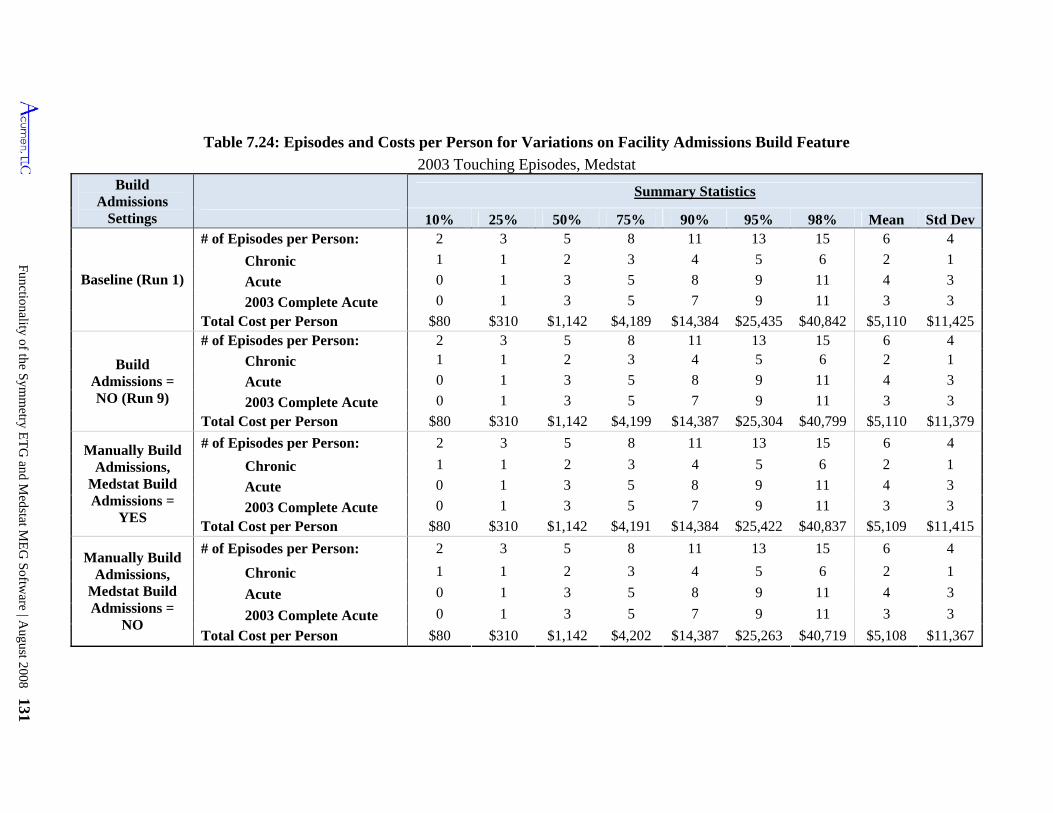
Functionality of the S
ymm
etry ET
G and M
edstat ME
G S
oftware | A
ugust 2008 131
Table 7.24: Episodes and Costs per Person for Variations on Facility Admissions Build Feature
2003 Touching Episodes, Medstat Build
Admissions Settings
Summary Statistics
10% 75% 90% 95% 98% Mean Std Dev25% 50%
Baseline (Run 1)
# of Episodes per Person: 2 3 13 15 6 4 5 8 11
Chronic 1 1 2 5 6 2 1 3 4
Acute 0 1 3 5 4 3 8 9 11
2003 Complete Acute 0 1 3 5 7 11 3 3 9
Total Cost per Person $80 $310 $1,142 $4,189 $14,384 $25,435 $40,842 $5,110 $11,425
Build Admissions = NO (Run 9)
# of Episodes per Person: 2 3 5 8 11 13 15 6 4
Chronic 1 1 2 3 4 5 6 2 1
Acute 0 1 3 5 8 9 11 4 3
2003 Complete Acute 0 1 3 5 7 9 11 3 3
$310 $1,142 $4,199 $14,387 $25,304 $40,799 $5,110 $11,379 Total Cost per Person $80
Manually Build Admissions,
Medstat Build Admissions =
YES
2 3 5 8 11 13 15 6 4 # of Episodes per Person:
Chronic 1 1 2 3 4 5 6 2 1
Acute 0 1 3 5 8 9 11 4 3
2003 Complete Acute 0 1 3 5 7 9 11 3 3
Total Cost per Person $80 $310 $1,142 $4,191 $14,384 $25,422 $40,837 $5,109 $11,415
Manually Build Admissions,
Medstat Build Admissions =
NO
# of Episodes per Person: 2 3 5 8 11 13 15 6 4
Chronic 1 1 2 3 4 5 6 2 1
Acute 0 1 3 5 8 9 11 4 3
2003 Complete Acute 0 1 3 5 7 9 11 3 3
Total Cost per Person $80 $310 $1,142 $4,202 $14,387 $25,263 $40,719 $5,108 $11,367
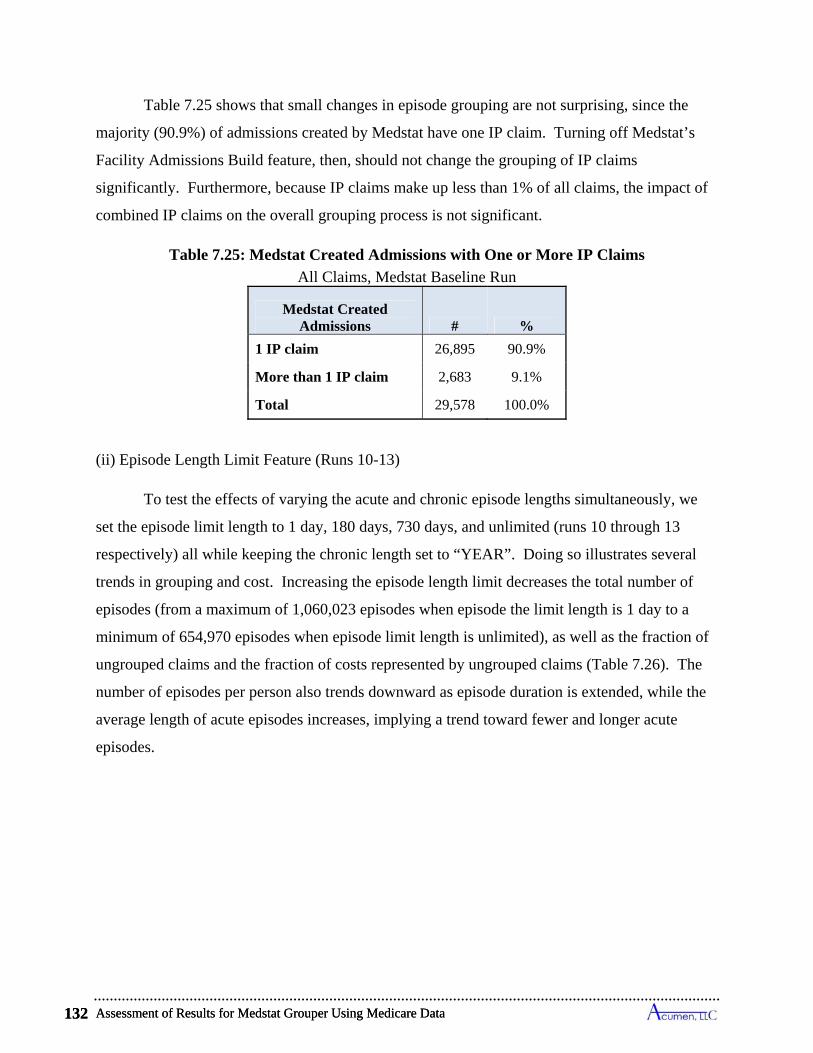
Assessment of Results for Medstat Grouper Using Medicare Data 132
Table 7.25 shows that small changes in episode grouping are not surprising, since the
majority (90.9%) of admissions created by Medstat have one IP claim. Turning off Medstat’s
Facility Admissions Build feature, then, should not change the grouping of IP claims
significantly. Furthermore, because IP claims make up less than 1% of all claims, the impact of
combined IP claims on the overall grouping process is not significant.
Table 7.25: Medstat Created Admissions with One or More IP Claims
All Claims, Medstat Baseline Run
Medstat Created Admissions # %
1 IP claim 26,895 90.9%
More than 1 IP claim 2,683 9.1%
Total 29,578 100.0%
(ii) Episode Length Limit Feature (Runs 10-13)
To test the effects of varying the acute and chronic episode lengths simultaneously, we
set the episode limit length to 1 day, 180 days, 730 days, and unlimited (runs 10 through 13
respectively) all while keeping the chronic length set to “YEAR”. Doing so illustrates several
trends in grouping and cost. Increasing the episode length limit decreases the total number of
episodes (from a maximum of 1,060,023 episodes when episode the limit length is 1 day to a
minimum of 654,970 episodes when episode limit length is unlimited), as well as the fraction of
ungrouped claims and the fraction of costs represented by ungrouped claims (Table 7.26). The
number of episodes per person also trends downward as episode duration is extended, while the
average length of acute episodes increases, implying a trend toward fewer and longer acute
episodes.
Assessment of Results for Medstat Grouper Using Medicare Data 132
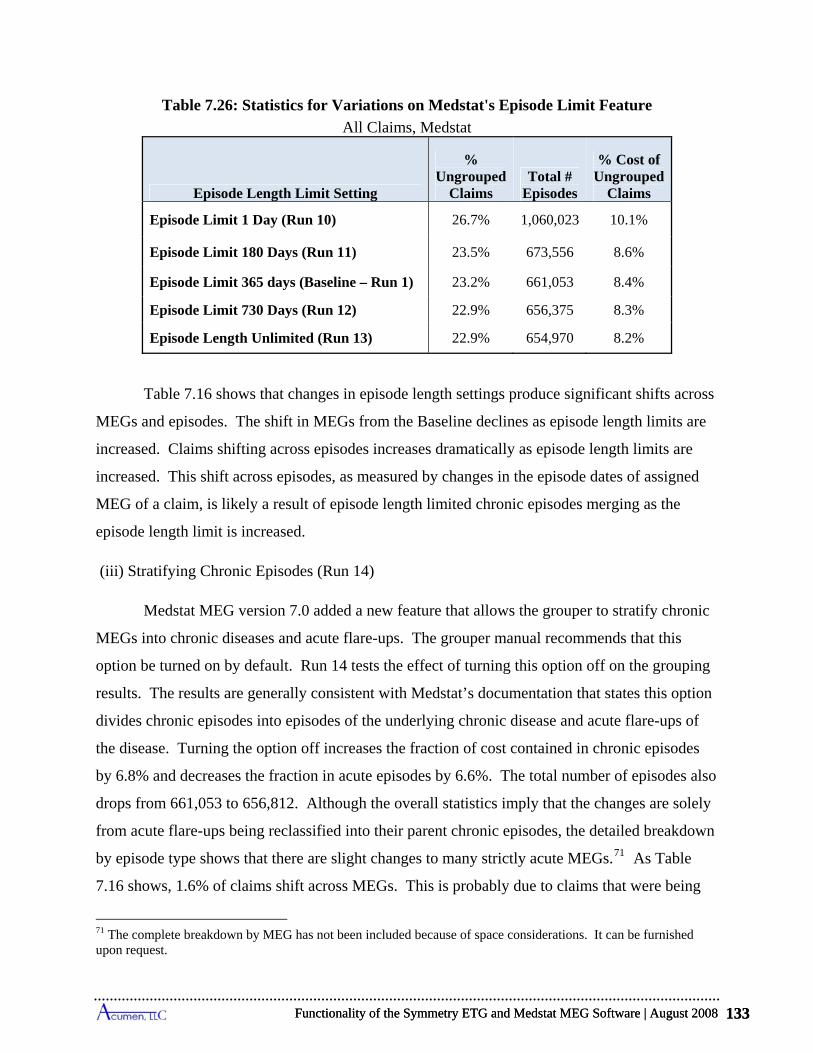
Functionality of the Symmetry ETG and Medstat MEG Software | August 2008 133
Table 7.26: Statistics for Variations on Medstat's Episode Limit Feature
All Claims, Medstat
Episode Length Limit Setting
% Ungrouped
Claims Total #
Episodes
% Cost of Ungrouped
Claims
Episode Limit 1 Day (Run 10) 26.7% 1,060,023 10.1%
Episode Limit 180 Days (Run 11) 23.5% 673,556 8.6%
Episode Limit 365 days (Baseline – Run 1) 23.2% 661,053 8.4%
Episode Limit 730 Days (Run 12) 22.9% 656,375 8.3%
Episode Length Unlimited (Run 13) 22.9% 654,970 8.2%
Table 7.16 shows that changes in episode length settings produce significant shifts across
MEGs and episodes. The shift in MEGs from the Baseline declines as episode length limits are
increased. Claims shifting across episodes increases dramatically as episode length limits are
increased. This shift across episodes, as measured by changes in the episode dates of assigned
MEG of a claim, is likely a result of episode length limited chronic episodes merging as the
episode length limit is increased.
(iii) Stratifying Chronic Episodes (Run 14)
Medstat MEG version 7.0 added a new feature that allows the grouper to stratify chronic
MEGs into chronic diseases and acute flare-ups. The grouper manual recommends that this
option be turned on by default. Run 14 tests the effect of turning this option off on the grouping
results. The results are generally consistent with Medstat’s documentation that states this option
divides chronic episodes into episodes of the underlying chronic disease and acute flare-ups of
the disease. Turning the option off increases the fraction of cost contained in chronic episodes
by 6.8% and decreases the fraction in acute episodes by 6.6%. The total number of episodes also
drops from 661,053 to 656,812. Although the overall statistics imply that the changes are solely
from acute flare-ups being reclassified into their parent chronic episodes, the detailed breakdown
by episode type shows that there are slight changes to many strictly acute MEGs.71 As Table
7.16 shows, 1.6% of claims shift across MEGs. This is probably due to claims that were being
71 The complete breakdown by MEG has not been included because of space considerations. It can be furnished upon request.
Functionality of the Symmetry ETG and Medstat MEG Software | August 2008 133
Assessment of Results for Medstat Grouper Using Medicare Data 134
separated into acute flare-ups of chronic episodes now being grouped together with the parent
episode. These results are essentially in line with what we would expect from Medstat’s
description of the option.
(iv) Set Look-back Period to 45 Days (Run 15)
Medstat allows the user to manually set the look-back period the software uses to check
for laboratory claims prior to the first specifically grouped claim in an episode. X-ray/labs that
are initially ungrouped are assigned to open, valid episodes if they occur within the look-back
period for an episode identified with the x-ray/lab service. After the look-back process, non-
specific claims that occur close to open episodes are grouped using “inclusion logic.” In Run 15
we test this feature by increasing the look-back period from 15 to 45 days. As one would expect,
this leads to a minor decrease in the percentage of ungrouped claims and no change in the actual
number of episodes or the proportion that are acute or chronic. The share of costs in acute versus
chronic episodes does change very slightly, because some cost is moved from ungrouped claims
to claims grouped into episodes. Claims also shift across MEGs and episodes, with 0.6% of
claims shifting across MEGs and 3.3% of claims changing episode dates. The fraction of claims
changing either episode dates or MEGs is also 3.3%, indicating that nearly every claim that
changed MEG also changed episode dates. This implies that the look-back period operates as
described, only adding non-specific claims to existing episodes and not creating new ones.
7.3.5 Overview of Sensitivities to Changes in Medstat Options
The results in this section reveal how the overall picture of MEG’s grouping varies in
response to choices made in structuring its input file and in setting its configuration options. The
following points summarize these findings.
Eliminating all secondary diagnosis codes in all of Medstat’s input records (Run 2) leads to virtually no changes in the fraction of claims grouped into episodes, the number of created episodes, the compositional breakdown of episodes into acute and chronic classifications, or the distributional properties of the number and costs of chronic and acute episodes per person. This change in settings does, however, reassign just over 1% of claims and nearly 6% of costs to different MEGs. When considering both MEG reassignment and episode date changes, 2.7% of claims shift across episodes, accounting for a shift of 8.7% in costs.
Substituting admitting diagnosis for the primary diagnosis (Runs 3 and 4) produces little change in the statistics describing the number and characteristics of episodes, but it does
Assessment of Results for Medstat Grouper Using Medicare Data 134
Functionality of the Symmetry ETG and Medstat MEG Software | August 2008 135
induce slightly more than a 10% reassignment of costs across MEGs, and 15% when used as the only diagnosis code.
Although Medstat's input records allow for up to 15 procedure codes, these codes have little effect on grouping outcomes. Blanking out all procedure codes (Run 5) decreases the number of episodes by merely 0.3%, and 1.8% of claims and 3.4% of their corresponding costs shift episodes. In sharp contrast, Medstat’s use of procedure codes to set the x-ray/lab flag significantly influences grouping results. This flag prevents records from starting episodes. Turning this flag off for all claims (Run 6) decreases the fraction of ungrouped claims from 23.2% to 0.4%, and leads to a significant number of claims changing MEGs or episodes. Additionally, 38.5% of claims and 28.9% of the claims’ corresponding costs shift across episodes. Turning the flag on for all SNF and HS claims (Run 7) only marginally affects grouping outcomes. Only 0.4% of claims shift across episodes, resulting in a shift of 3.7% of costs across episodes.
Randomly resorting input records within beneficiary/start-date/end-date categories (Run 8) produces a discernible effect on the number of episodes and reassigns 0.4% of claims and 0.6% of costs to different episodes.
Extending the acute episode length limit from 1 day up to 9999 days (Runs 10 to 13) significantly decreases the number of episodes and increases the average length of acute episodes. It also can lead to as much as 6-30% reassignment of claims and 4-40% of costs to different episodes compared to the Baseline assignments.
Conversely, other modifications of Medstat’s configuration – Facility Admissions Build (Run 9), stratifying chronic episodes (Run 14), and altering the look-back period (Run 15) – produce relatively minor effects on grouping outcomes. The largest impact results from stratifying chronic episodes, where 2% of claims shift episodes, resulting in shift in 7.6% of costs across episodes.
7.4 Practical Considerations in Applying Medstat Grouper to Medicare Data
Beyond exploring the functionality of the MEG grouper, we also examine several
practical considerations relevant in the application of this grouper in the attribution of resource
utilization in a Medicare setting In this section, we review two of these potential issues: the
extent to which Medstat's constructed episodes reflect the patterns of care expected under
Medicare benefit structures, and the effect of waiting different lengths of time for claims data to
accrue before implementing the episode grouper. Section 7.4.1 evaluates the extent to which
Medstat episodes group concurrent PB claims with institutional inpatient claims, and Section
7.4.2 examines Medstat’s capacity to link SNF stays to inpatient admissions. Finally, Section
7.4.3 assesses the impact of implementing the MEG grouper with claims data ending sooner in
2004 to see the effect on 2003 episodes of using a shorter time horizon.
Functionality of the Symmetry ETG and Medstat MEG Software | August 2008 135
Assessment of Results for Medstat Grouper Using Medicare Data 136
7.4.1 Patterns of Physician Services During IP Stays
As described in Section 2.6, Medicare pays for E&M services during hospital admissions
for medical conditions. This benefit structure influences practice which results in the linkage of
IP claims to particular varieties of PB claims. While daily physician visits are not mandated in
Medicare’s policy, the evidence (see Table 2.8) demonstrates that in practice IP claims link to a
considerable number of concurrent PB and E&M claims. According to these findings, the
frequency of PB claims concurrent with IP claims almost always attains the one-per-day average
for shorter lengths of claim, and typically attains nearly this average for longer IP claims.
Given the evidence of this pattern in Medicare data, we seek to examine how this pattern
is reflected in Medstat’s episode grouping. Table 7.27 parallels the structure of Tables 2.8 and
5.20. As well as reproducing the statistics from Table 2.8 that give the fraction of IP stays with
concurrent PB claims totaling daily or greater averages, Table 7.27 incorporates rows showing
the share of IP claims with concurrent PB claims grouped to the same episode under the Baseline
run. The column in Table 7.27 designated “Episode Assignment” distinguishes two sets of
statistics. The rows labeled as “No restriction” list shares of stays with concurrent PB claims
irrespective of episode assignment by IP stay length; these figures merely replicate the contents
of Table 2.8. The rows identified as "Same as IP claim" present shares for only those PB claims
that are grouped to the same episode as their concurrent IP claim. The second row, for example,
gives the fraction of IP stays with an average of one or more PB claims per day assigned to the
IP stay's episode, with rates broken down by length of claim.
One sees in Table 7.20 that daily or near-daily PB and E&M services appear as a norm
for most Medicare hospital stays, but the claims for these services are often grouped by Medstat
to different episodes than the concurrent IP admission. According to the second column in the
table, 98% of two-day IP stays have at least daily PB claims in the raw Medicare data; only 71%
of inpatient stays have sufficient PB claims grouped to them to provide for daily visit rates.
Whereas 95% of the 5-day stays have concurrent PB submissions equaling or exceeding the one-
per-day average, only 49% of these 5-day admissions have daily averages attaining this value
when counting only those PB claims grouped to the same episode as the hospital admission. For
the longest stays, only 14% have daily or greater PB visits grouped to the same episode, even
though the figure above suggests that more than 4 times as many of these long stays have daily
Assessment of Results for Medstat Grouper Using Medicare Data 136
Functionality of the Symmetry ETG and Medstat MEG Software | August 2008 137
physician visits. These figures for long stays change little when the visit rate allows for up to
two days without a visit.
Turning to E&M services, the middle panel of Table 7.27 suggests that daily E&M visits
are also the norm, with the overall match rate indicating that 81% of IP stays are accompanied by
E&M visits at daily or greater rates. The grouping outcomes, however, do not reflect this
pattern, as only 38% of IP claims are assigned to episodes along with E&M claims equaling or
exceeding one-per-day averages. Moreover, the longer the IP stay, the more likely that E&M
claims are grouped to other episodes. More than two-thirds of IP stays lasting 8 to 14 days show
daily E&M visits, but only 21% have these daily visits grouped in the same episode. When
considering E&M claims for hospital services, as identified by CPT codes, the final panel shows
that virtually all IP admissions (95%) show at least one hospital service visit, but only 64% have
at least one of these claims assigned to the same episode. Overall, 69% of IP stays show daily or
greater E&M hospital visits, but less than a third of stays are grouped with hospital visits at daily
or greater rates. The overall grouping rates increase when the daily restriction is relaxed, but we
still only find that less than half of all IP admissions are assigned to episodes along with near-
daily or greater E&M hospital services.
In light of these findings, we explore an alternative to the Baseline run to examine
whether a closer match rate can be attained between assignments of IP claims and concurrent PB
claims. In a discussion of this issue with the vendor, Thomson Medstat suggested a variant of
the Admissions Build feature that groups all claims within the dates of service of an inpatient
claim into the same episode as the inpatient claim. Implementing this “All Services” Admissions
Build consists of modifying input files in a way that registers all Medicare claim types other than
IP as an “unknown” record type.72 This option results in a philosophical shift in the concept of
an episode of care: claims that occur during an IP stay are no longer grouped according to
diagnosis, and instead are automatically grouped to the same episode as the IP claim based on
72 The MEG grouper distinguishes inpatient from outpatient claims using the “Record Type” flag. In our baseline run-which follows the recommendations in the Medstat manual for specifying configuration and input files-we flag IP claims flagged as inpatient and all other Medicare claim types (e.g., Part B) flagged as outpatient. The approach suggested by Medstat explicitly requires that physician claims not be flagged and relegated to an "unknown" claim type. This is the core feature of the All Services Admissions Build. In addition, IP claims must be input with a "room and board" designation regardless of whether such a revenue center code appears on the IP claim.
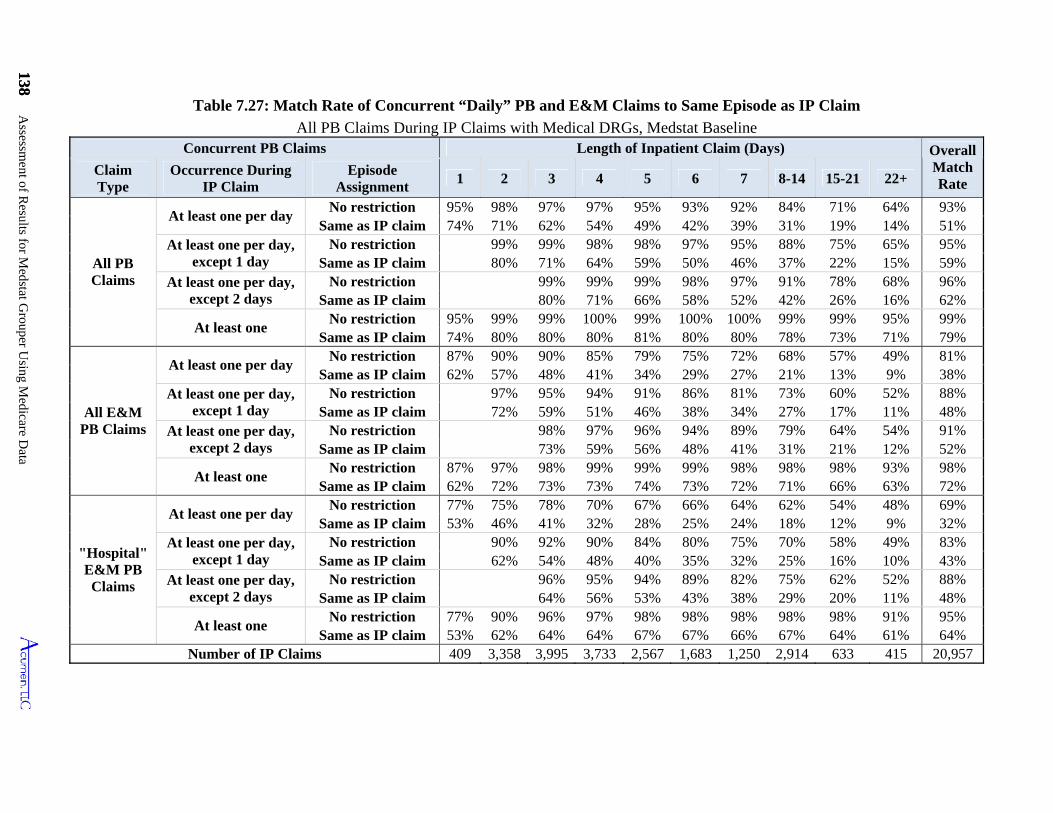
138 Assessm
ent of Results for M
edstat Grouper U
sing Medicare D
ata
138
Same as IP claim
Same as IP claim
Same as IP claim
Same as IP claim
Same as IP claim
Same as IP claim
Same as IP claim
Same as IP claim
Same as IP claim
Same as IP claim
Same as IP claim
Same as IP claim
Table 7.27: Match Rate of Concurrent “Daily” PB and E&M Claims to Same Episode as IP Claim
All PB Claims During IP Claims with Medical DRGs, Medstat Baseline Concurrent PB Claims Length of Inpatient Claim (Days) Overall
Match Rate
Claim Type
Occurrence During IP Claim
Episode Assignment
1 2 3 4 5 6 7 8-14 15-21 22+
All PB Claims
At least one per day No restriction 95% 98% 97% 97% 95% 93% 92% 84% 71% 64% 93%
74% 71% 62% 54% 49% 42% 39% 31% 19% 14% 51% At least one per day,
except 1 day No restriction 99% 99% 98% 98% 97% 95% 88% 75% 65% 95%
80% 71% 64% 59% 50% 46% 37% 22% 15% 59% At least one per day,
except 2 days No restriction 99% 99% 99% 98% 97% 91% 78% 68% 96%
80% 71% 66% 58% 52% 42% 26% 16% 62%
At least one No restriction 95% 99% 99% 100% 99% 100% 100% 99% 99% 95% 99%
74% 80% 80% 80% 81% 80% 80% 78% 73% 71% 79%
All E&M PB Claims
At least one per day No restriction 87% 90% 90% 85% 79% 75% 72% 68% 57% 49% 81%
62% 57% 48% 41% 34% 29% 27% 21% 13% 9% 38% At least one per day,
except 1 day No restriction 97% 95% 94% 91% 86% 81% 73% 60% 52% 88%
72% 59% 51% 46% 38% 34% 27% 17% 11% 48% At least one per day,
except 2 days No restriction 98% 97% 96% 94% 89% 79% 64% 54% 91%
73% 59% 56% 48% 41% 31% 21% 12% 52%
At least one No restriction 87% 97% 98% 99% 99% 99% 98% 98% 98% 93% 98%
62% 72% 73% 73% 74% 73% 72% 71% 66% 63% 72%
"Hospital" E&M PB Claims
At least one per day No restriction 77% 75% 78% 70% 67% 66% 64% 62% 54% 48% 69%
53% 46% 41% 32% 28% 25% 24% 18% 12% 9% 32% At least one per day,
except 1 day No restriction 90% 92% 90% 84% 80% 75% 70% 58% 49% 83%
62% 54% 48% 40% 35% 32% 25% 16% 10% 43% At least one per day,
except 2 days No restriction 96% 95% 94% 89% 82% 75% 62% 52% 88%
64% 56% 53% 43% 38% 29% 20% 11% 48%
At least one No restriction 77% 90% 96% 97% 98% 98% 98% 98% 98% 91% 95%
53% 62% 64% 64% 67% 67% 66% 67% 64% 61% 64% Number of IP Claims 409 3,358 3,995 3,733 2,567 1,683 1,250 2,914 633 415 20,957
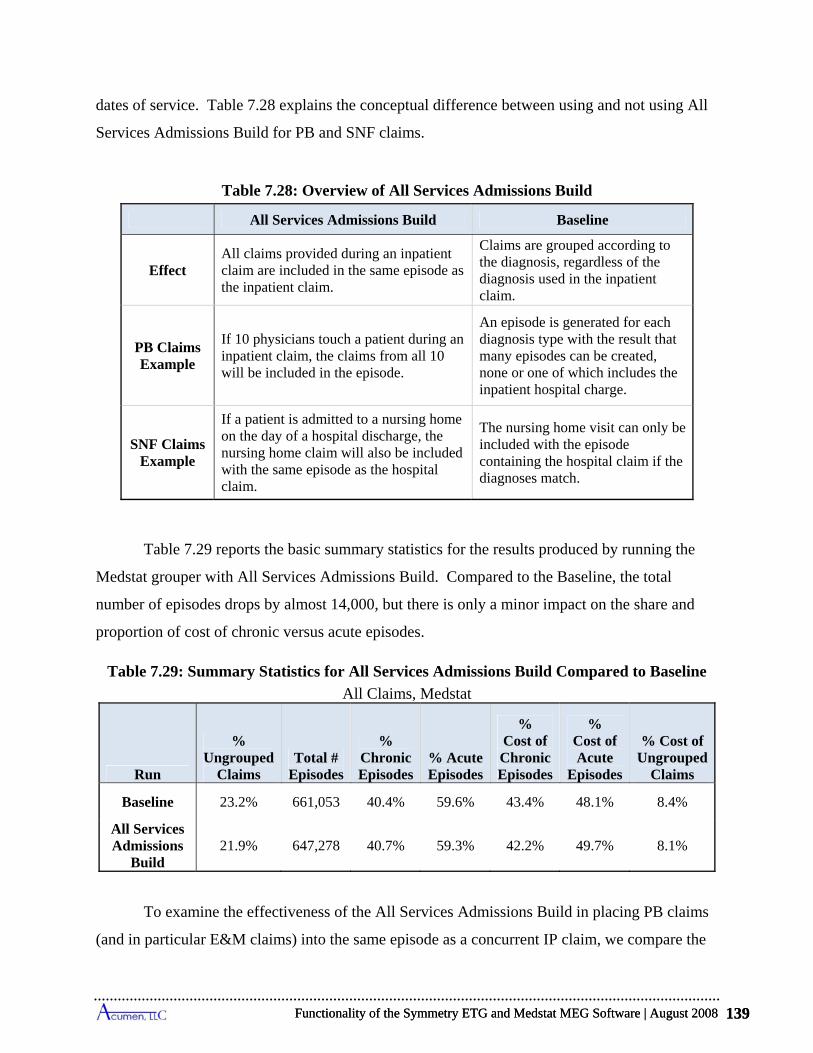
Functionality of the Symmetry ETG and Medstat MEG Software | August 2008 139
dates of service. Table 7.28 explains the conceptual difference between using and not using All
Services Admissions Build for PB and SNF claims.
Table 7.28: Overview of All Services Admissions Build
All Services Admissions Build Baseline
Effect All claims provided during an inpatient claim are included in the same episode as the inpatient claim.
Claims are grouped according to the diagnosis, regardless of the diagnosis used in the inpatient claim.
PB Claims Example
If 10 physicians touch a patient during an inpatient claim, the claims from all 10 will be included in the episode.
An episode is generated for each diagnosis type with the result that many episodes can be created, none or one of which includes the inpatient hospital charge.
SNF Claims Example
If a patient is admitted to a nursing home on the day of a hospital discharge, the nursing home claim will also be included with the same episode as the hospital claim.
The nursing home visit can only be included with the episode containing the hospital claim if the diagnoses match.
Table 7.29 reports the basic summary statistics for the results produced by running the
Medstat grouper with All Services Admissions Build. Compared to the Baseline, the total
number of episodes drops by almost 14,000, but there is only a minor impact on the share and
proportion of cost of chronic versus acute episodes.
Table 7.29: Summary Statistics for All Services Admissions Build Compared to Baseline
All Claims, Medstat
Run
% Ungrouped
Claims Total #
Episodes
% Chronic Episodes
% Acute Episodes
% Cost of Chronic Episodes
% Cost of Acute
Episodes
% Cost of Ungrouped
Claims
Baseline 23.2% 661,053 40.4% 59.6% 43.4% 48.1% 8.4%
All Services Admissions
Build 21.9% 647,278 40.7% 59.3% 42.2% 49.7% 8.1%
To examine the effectiveness of the All Services Admissions Build in placing PB claims
(and in particular E&M claims) into the same episode as a concurrent IP claim, we compare the
Functionality of the Symmetry ETG and Medstat MEG Software | August 2008 139
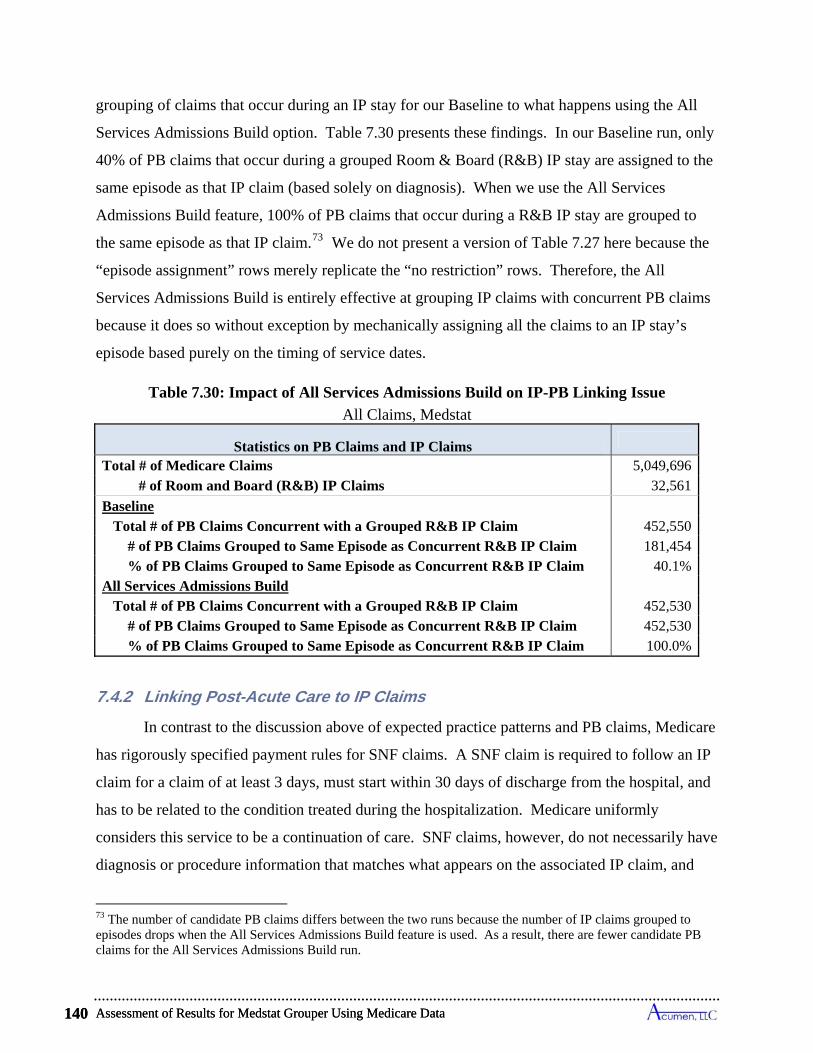
Assessment of Results for Medstat Grouper Using Medicare Data 140
grouping of claims that occur during an IP stay for our Baseline to what happens using the All
Services Admissions Build option. Table 7.30 presents these findings. In our Baseline run, only
40% of PB claims that occur during a grouped Room & Board (R&B) IP stay are assigned to the
same episode as that IP claim (based solely on diagnosis). When we use the All Services
Admissions Build feature, 100% of PB claims that occur during a R&B IP stay are grouped to
the same episode as that IP claim.73 We do not present a version of Table 7.27 here because the
“episode assignment” rows merely replicate the “no restriction” rows. Therefore, the All
Services Admissions Build is entirely effective at grouping IP claims with concurrent PB claims
because it does so without exception by mechanically assigning all the claims to an IP stay’s
episode based purely on the timing of service dates.
Table 7.30: Impact of All Services Admissions Build on IP-PB Linking Issue
All Claims, Medstat
Statistics on PB Claims and IP Claims
Total # of Medicare Claims 5,049,696 # of Room and Board (R&B) IP Claims 32,561
Baseline Total # of PB Claims Concurrent with a Grouped R&B IP Claim 452,550 # of PB Claims Grouped to Same Episode as Concurrent R&B IP Claim 181,454 % of PB Claims Grouped to Same Episode as Concurrent R&B IP Claim 40.1%All Services Admissions Build Total # of PB Claims Concurrent with a Grouped R&B IP Claim 452,530 # of PB Claims Grouped to Same Episode as Concurrent R&B IP Claim 452,530 % of PB Claims Grouped to Same Episode as Concurrent R&B IP Claim 100.0%
7.4.2 Linking Post-Acute Care to IP Claims
In contrast to the discussion above of expected practice patterns and PB claims, Medicare
has rigorously specified payment rules for SNF claims. A SNF claim is required to follow an IP
claim for a claim of at least 3 days, must start within 30 days of discharge from the hospital, and
has to be related to the condition treated during the hospitalization. Medicare uniformly
considers this service to be a continuation of care. SNF claims, however, do not necessarily have
diagnosis or procedure information that matches what appears on the associated IP claim, and
73 The number of candidate PB claims differs between the two runs because the number of IP claims grouped to episodes drops when the All Services Admissions Build feature is used. As a result, there are fewer candidate PB claims for the All Services Admissions Build run.
Assessment of Results for Medstat Grouper Using Medicare Data 140
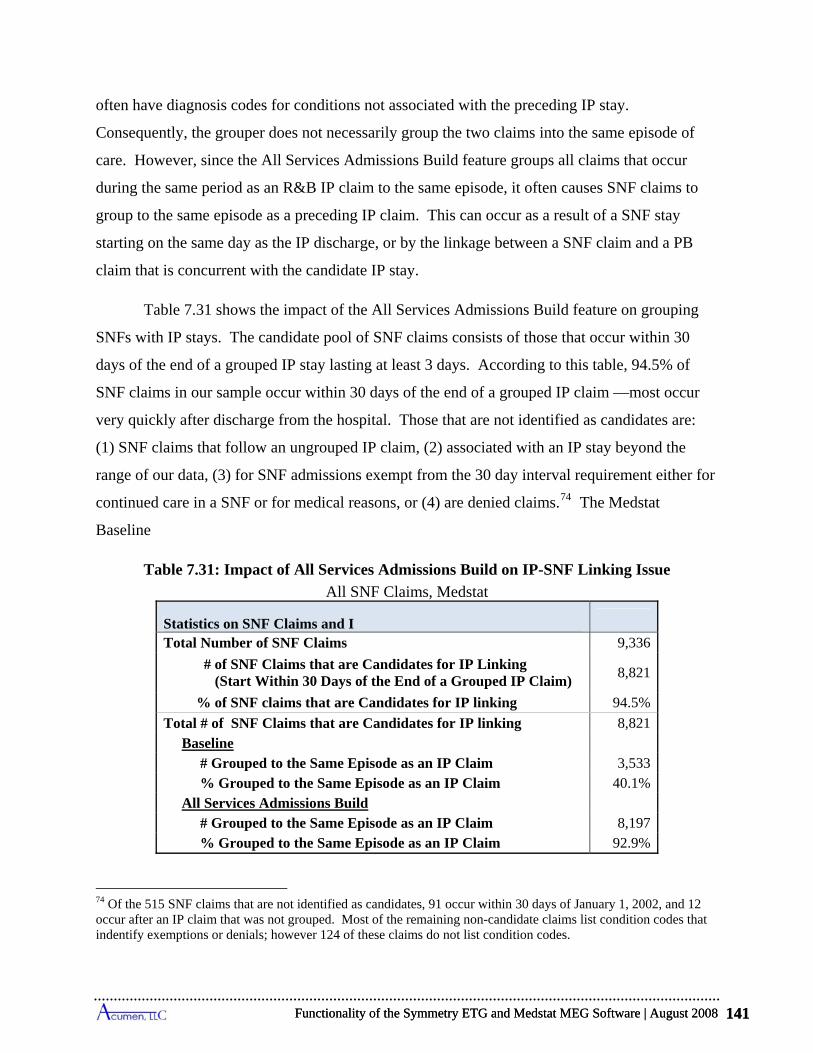
Baseline
Table 7.31: Impact of All S on IP-SNF Linking Issue
s, Medstat
P Claims
Claim)
9
4
% Grouped to the Same Episode as an IP Claim 92.9%
Functionality of the Symmetry ETG and Medstat MEG Software | August 2008 141
often have diagnosis codes for conditions not associated with the preceding IP stay.
Consequently, the grouper does not necessarily group the two claims into the same episode of
care. However, since the All Services Admissions Build feature groups all claims that occur
during the same period as an R&B IP claim to the same episode, it often causes SNF claims to
group to the same episode as a preceding IP claim. This can occur as a result of a SNF stay
starting on the same day as the IP discharge, or by the linkage between a SNF claim and a PB
claim that is concurrent with the candidate IP stay.
Table 7.31 shows the impact of the All Services Admissions Build feature on grouping
SNFs with IP stays. The candidate pool of SNF claims consists of those that occur within 30
days of the end of a grouped IP stay lasting at least 3 days. According to this table, 94.5% of
SNF claims in our sample occur within 30 days of the end of a grouped IP claim —most occur
very quickly after discharge from the hospital. Those that are not identified as candidates are:
(1) SNF claims that follow an ungrouped IP claim, (2) associated with an IP stay beyond the
range of our data, (3) for SNF admissions exempt from the 30 day interval requirement either for
continued care in a SNF or for medical reasons, or (4) are denied claims.74 The Medstat
ervices Admissions Build
All SNF Claim
Statistics on SNF Claims and I
Total Number of SNF Claims 9,336
# of SNF Claims that are Candidates for IP Linking (Start Within 30 Days of the End of a Grouped IP
8,821
% of SNF claims that are Candidates for IP linking 4.5%
Total # of SN 1 F Claims that are Candidates for IP linking Baseline
8,82
# Grouped to the Same Episode as an IP Claim 3,533 % Grouped to the Same Epi sode as an IP Claim All Services Admissions Build
0.1%
# Grouped to the Same Episode as an IP Claim 8,197
74 Of the 515 SNF claims that are not identified as candidates, 91 occur within 30 days of January 1, 2002, and 12 occur after an IP claim that was not grouped. Most of the remaining non-candidate claims list condition codes that indentify exemptions or denials; however 124 of these claims do not list condition codes.
Functionality of the Symmetry ETG and Medstat MEG Software | August 2008 141
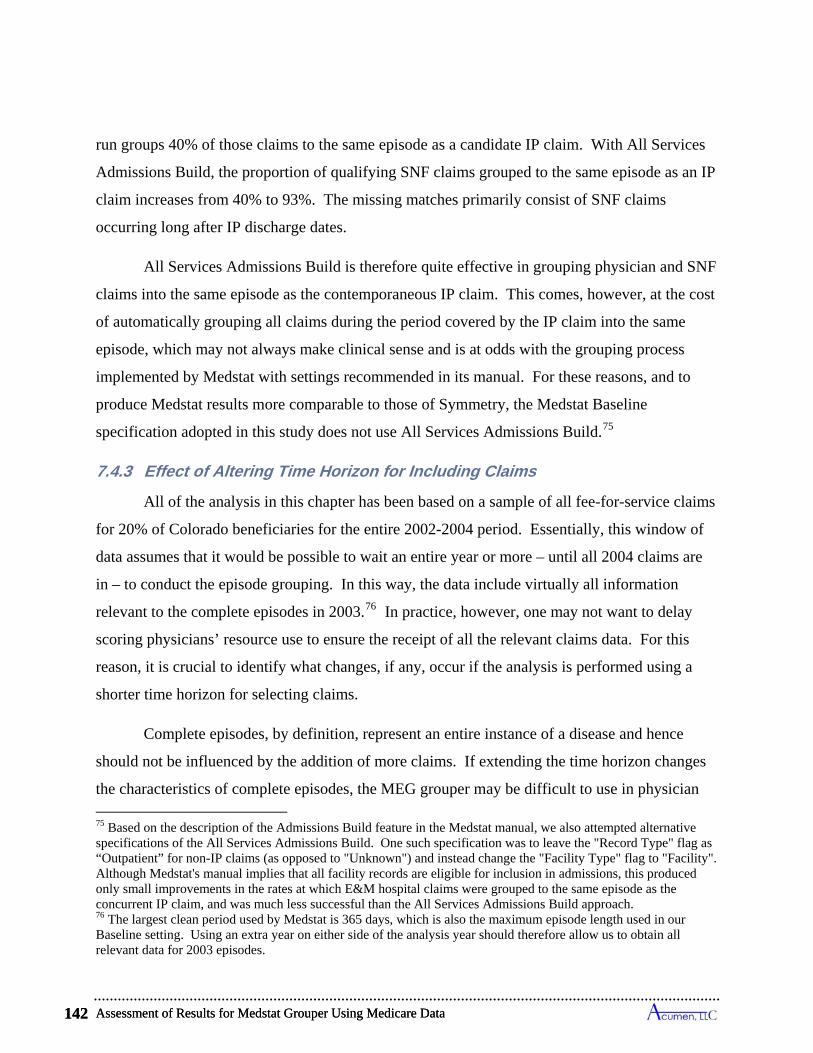
Assessment of Results for Medstat Grouper Using Medicare Data 142
run groups 40% of those claims to the same episode as a candidate IP claim. With All Services
Admissions Build, the proportion of qualifying SNF claims grouped to the same episode as an IP
claim increases from 40% to 93%. The missing matches primarily consist of SNF claims
occurring long after IP discharge dates.
All Services Admissions Build is therefore quite effective in grouping physician and SNF
claims into the same episode as the contemporaneous IP claim. This comes, however, at the cost
of automatically grouping all claims during the period covered by the IP claim into the same
episode, which may not always make clinical sense and is at odds with the grouping process
implemented by Medstat with settings recommended in its manual. For these reasons, and to
produce Medstat results more comparable to those of Symmetry, the Medstat Baseline
specification adopted in this study does not use All Services Admissions Build.75
7.4.3 Effect of Altering Time Horizon for Including Claims
All of the analysis in this chapter has been based on a sample of all fee-for-service claims
for 20% of Colorado beneficiaries for the entire 2002-2004 period. Essentially, this window of
data assumes that it would be possible to wait an entire year or more – until all 2004 claims are
in – to conduct the episode grouping. In this way, the data include virtually all information
relevant to the complete episodes in 2003.76 In practice, however, one may not want to delay
scoring physicians’ resource use to ensure the receipt of all the relevant claims data. For this
reason, it is crucial to identify what changes, if any, occur if the analysis is performed using a
shorter time horizon for selecting claims.
Complete episodes, by definition, represent an entire instance of a disease and hence
should not be influenced by the addition of more claims. If extending the time horizon changes
the characteristics of complete episodes, the MEG grouper may be difficult to use in physician
75 Based on the description of the Admissions Build feature in the Medstat manual, we also attempted alternative specifications of the All Services Admissions Build. One such specification was to leave the "Record Type" flag as “Outpatient” for non-IP claims (as opposed to "Unknown") and instead change the "Facility Type" flag to "Facility". Although Medstat's manual implies that all facility records are eligible for inclusion in admissions, this produced only small improvements in the rates at which E&M hospital claims were grouped to the same episode as the concurrent IP claim, and was much less successful than the All Services Admissions Build approach. 76 The largest clean period used by Medstat is 365 days, which is also the maximum episode length used in our Baseline setting. Using an extra year on either side of the analysis year should therefore allow us to obtain all relevant data for 2003 episodes.
Assessment of Results for Medstat Grouper Using Medicare Data 142
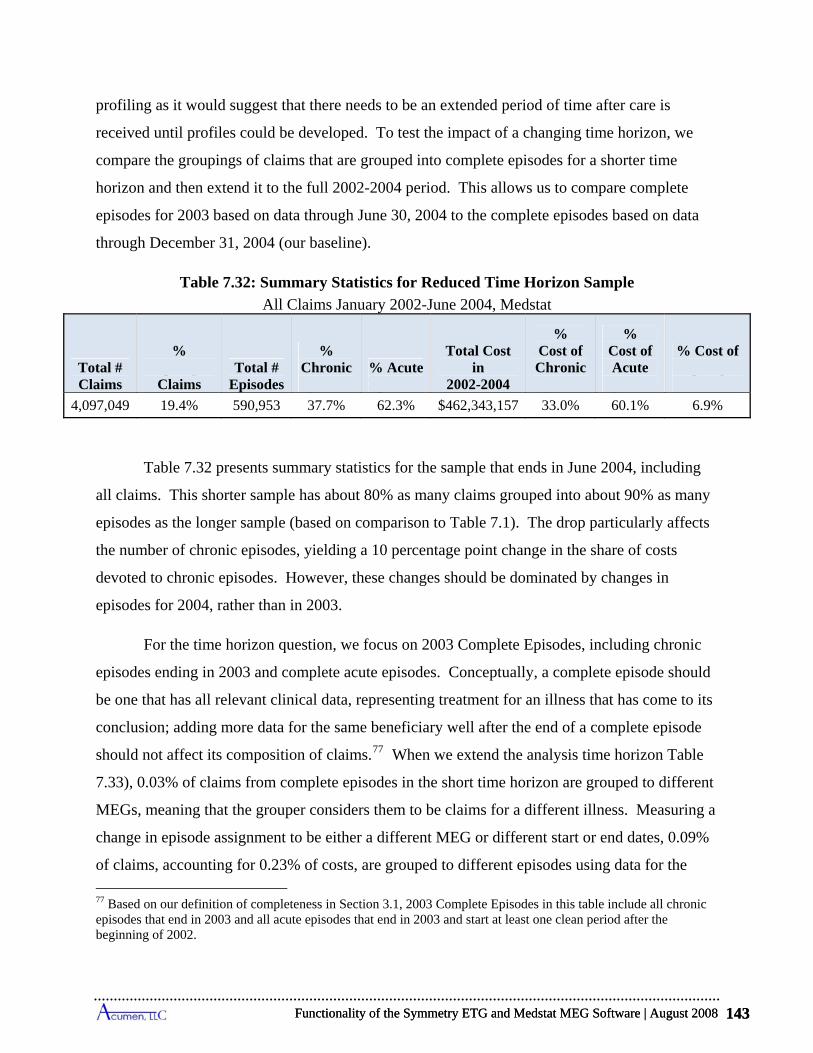
Ungrouped Episodes Episodes Episodes Episodes
Ungrouped Claims
4,097,049 19.4% 590,953 37.7% 62.3% $462,343,157 33.0% 60.1% 6.9%
ects
these changes should be dominated by changes in
episodes for 2004, rather than in 2003.
%
of claims, accounting for 0.23% of costs, are grouped to different episodes using data for the
Functionality of the Symmetry ETG and Medstat MEG Software | August 2008 143
profiling as it would suggest that there needs to be an extended period of time after care is
received until profiles could be developed. To test the impact of a changing time horizon, we
compare the groupings of claims that are grouped into complete episodes for a shorter time
horizon and then extend it to the full 2002-2004 period. This allows us to compare complete
episodes for 2003 based on data through June 30,
through Decem
plete episodes based on data 2004 to the com
ber 31, 2004 (our baseline).
Table 7.32: Summary Statistics for Reduced Time Horiz
s January 2002-June 2004, MedstatAll Claim
on Sample
% % Chronic % Acute
Total Cost
% Cost of Chronic
% Cost of % Cost of
Total # Claims Claims
Total # Episodes
in 2002-2004
Acute
Table 7.32 presents summary statistics for the sample that ends in June 2004, including
all claims. This shorter sample has about 80% as many claims grouped into about 90% as many
episodes as the longer sample (based on comparison to Table 7.1). The drop particularly aff
the number of chronic episodes, yielding a 10 percentage point change in the share of costs
devoted to chronic episodes. However,
For the time horizon question, we focus on 2003 Complete Episodes, including chronic
episodes ending in 2003 and complete acute episodes. Conceptually, a complete episode should
be one that has all relevant clinical data, representing treatment for an illness that has come to its
conclusion; adding more data for the same beneficiary well after the end of a complete episode
should not affect its composition of claims.77 When we extend the analysis time horizon Table
7.33), 0.03% of claims from complete episodes in the short time horizon are grouped to different
MEGs, meaning that the grouper considers them to be claims for a different illness. Measuring a
change in episode assignment to be either a different MEG or different start or end dates, 0.09
77 Based on our definition of completeness in Section 3.1, 2003 Complete Episodes in this table include all chronic episodes that end in 2003 and all acute episodes that end in 2003 and start at least one clean period after the beginning of 2002.
Functionality of the Symmetry ETG and Medstat MEG Software | August 2008 143
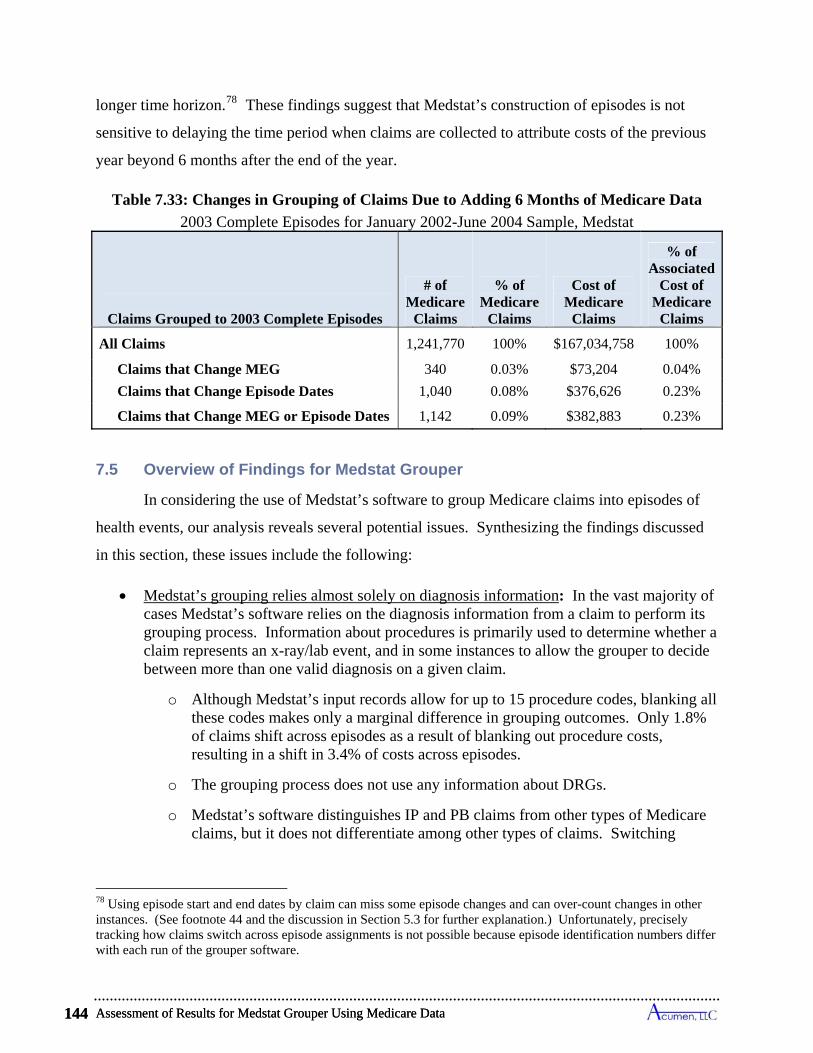
Assessment of Results for Medstat Grouper Using Medicare Data 144
longer time horizon.78 These findings suggest that Medstat’s construction of episodes is not
sensitive to delaying the time period when claims are collected to attribute costs of the previous
year beyond 6 months after the end of the year.
Table 7.33: Changes in Grouping of Claims Due to Adding 6 Months of Medicare Data
2003 Complete Episodes for January 2002-June 2004 Sample, Medstat
Claims Grouped to 2003 Complete Episodes
# of Medicare
Claims
% of Medicare
Claims
Cost of Medicare
Claims
% of Associated
Cost of Medicare
Claims
All Claims 1,241,770 100% $167,034,758 100%
Claims that Change MEG 340 0.03% $73,204 0.04%
Claims that Change Episode Dates 1,040 0.08% $376,626 0.23%
Claims that Change MEG or Episode Dates 1,142 0.09% $382,883 0.23%
7.5 Overview of Findings for Medstat Grouper
In considering the use of Medstat’s software to group Medicare claims into episodes of
health events, our analysis reveals several potential issues. Synthesizing the findings discussed
in this section, these issues include the following:
Medstat’s grouping relies almost solely on diagnosis information: In the vast majority of cases Medstat’s software relies on the diagnosis information from a claim to perform its grouping process. Information about procedures is primarily used to determine whether a claim represents an x-ray/lab event, and in some instances to allow the grouper to decide between more than one valid diagnosis on a given claim.
o Although Medstat’s input records allow for up to 15 procedure codes, blanking all these codes makes only a marginal difference in grouping outcomes. Only 1.8% of claims shift across episodes as a result of blanking out procedure costs, resulting in a shift in 3.4% of costs across episodes.
o The grouping process does not use any information about DRGs.
o Medstat’s software distinguishes IP and PB claims from other types of Medicare claims, but it does not differentiate among other types of claims. Switching
78 Using episode start and end dates by claim can miss some episode changes and can over-count changes in other instances. (See footnote 44 and the discussion in Section 5.3 for further explanation.) Unfortunately, precisely tracking how claims switch across episode assignments is not possible because episode identification numbers differ with each run of the grouper software.
Assessment of Results for Medstat Grouper Using Medicare Data 144
Functionality of the Symmetry ETG and Medstat MEG Software | August 2008 145
claims from one of these sources to another causes no change in constructed episodes.
Medstat’s grouper cannot treat a claim as an aggregate of services possibly linkable to more than one episode:
o Institutional Medicare claims typically cover a multitude of medical services. Each of these claims is allocated to one and only one episode, and the entire cost associated with this claim is attributed to this single health event.
o Most Medicare institutional claims are paid with prospective payment systems. Prospective payments not only depend on diagnoses, but also on procedures and the likelihood of comorbidities. The presence of comorbidities can imply existence of multiple episodes of care open at the same time. The inability to associate the cost of any such claim with more than one episode represents a serious challenge in applying Medstat's grouper software to a Medicare population.
The construction of Complete Episodes generally approximates the annual cost of claims assigned to the different MEG categories: Complete episodes include all chronic episodes ending in 2003, and only those acute episodes that begin at least one clean period after the beginning of 2002 and end in 2003.
o The costs of claims grouped to 2003 Complete Episodes for a MEG closely approximate the annual costs assignable to MEGs within a calendar year. The cost of 2003 Complete Chronic Episodes equals 98% of the annual claims costs assigned to chronic episodes in the year 2003; and the corresponding figure for all acute episodes is 94% of annual claims cost
o Medstat divides acute conditions into complete episodes using clean periods. For the top ten highest-cost acute MEGs, episodes of the same type sometimes occur within the designated clean period when the dates of claims are used to identify the beginnings and ends of episodes. In particular, depending on the type of MEG, between 0.1% and 20.3% of the same-type episodes take place within clean periods. In some rare instances, these episodes even overlap, meaning that one episode starts before the prior one ends.
o Medstat starts and terminates chronic episodes in 12-month periods. For the vast majority of afflicted individuals, one chronic episode immediately follows another. For the top ten highest-cost chronic MEGs, chronic episodes of the same MEG run as uninterrupted events for individuals between 54% and 87% of the time depending on the type of chronic condition. In rare cases, chronic episode of the same type even overlap.
Functionality of the Symmetry ETG and Medstat MEG Software | August 2008 145
Assessment of Results for Medstat Grouper Using Medicare Data 146
Considerable variation exists in the costs of individual episodes within a MEG:
o The distributions of costs across episodes within a MEG exhibit substantial dispersion. For instance, for each of the top five highest-cost acute and chronic MEGs, the level of cost demarking the most expensive 10% of episodes always exceeds the level demarking the cheapest 10% by at least an order of magnitude, and in most instances it is far more than two orders of magnitude larger.
o These distributions also reveal that the highest-cost episodes account for large shares of total MEG costs. For top five acute MEGs, the top 5% of episodes alone account for 25% to 48% of total annual cost for the MEG, and for chronic MEGs this range is 35% to 64%.
o This large amount of cost variation suggests that devising a reliable method of risk adjustment for episodes and beneficiary costs necessary for profiling providers in Medicare settings requires approaches not yet available in the existing MEG software. With the multiple comorbidities and the complexity of the patients, the risk and severity models developed for commercial populations are unlikely to work as effectively in the Medicare population.
Medstat’s grouping results depend on the order in which records are input into the grouper:
o The MEG grouper requires input records be sorted by beneficiary and claim start-dates. In addition, we always sort claims by end date as well within these beneficiary/start-date categories to create beneficiary/start-date/end-date compilations. The sort order of records within these compilations is an arbitrary decision of the user, and yet changing this order produces different grouping results for a notable number of beneficiaries.
o In a typical example (Run 8), we show that reordering records within these beneficiary/start-date/end-date compilations leads to a reassignment of 0.4% of Medicare claims to different episodes, implying a 0.6% reallocation of Medicare costs to different episodes of care; 0.2% of claims are reallocated to entirely distinct MEG types.
Medstat’s grouping algorithms can be adapted to bundle all Part B physician and other claims incurred during a hospital stay, as well as SNF claims that immediately follow the stay, into the same episode as the inpatient stay:
o The MEG grouper does not explicitly incorporate logic that links claims emulating some important patterns of care common to Medicare settings, patterns supported by Medicare's payment policies. This grouper is not designed, for example, to incorporate expectations that an IP stay (paid for by a medical DRG) be associated with near-daily E&M physician claims; nor does it necessarily treat SNF claims as a continuation of inpatient care. The MEG grouper cannot distinguish E&M claims from other PB claims, nor does it distinguish SNF from many other types of non-IP claims.
Assessment of Results for Medstat Grouper Using Medicare Data 146
Functionality of the Symmetry ETG and Medstat MEG Software | August 2008 147
o For the Baseline run of the MEG grouper, only 40% of SNF claims are grouped to the same episodes as the initiating IP claims. Overall, 69% of IP stays have daily E&M hospital visits, but only 32% have daily visits grouped to the same episode by Medstat.
o Medstat suggested an adaptation of its Admissions Build feature to assist in mimicking aspects of Medicare norms involving IP stays. The All Services Admissions Build changes the concept of an episode: when enabled, it groups all claims concurrent with an IP stay to the same episode, regardless of diagnosis.
o With the All Services Admissions Build, a SNF admission that starts on or near the day of discharge will be included in the same episode as the inpatient stay. Using the All Services Admissions Build increases the fraction of SNF claims grouped to the same episode as an IP claim from 40% to 93%.
o Application of the All Services Admissions Build is effective in linking IP claims to concurrent PB claims: it increases the fraction of linkage PB claims grouped to the same episode as a concurrent IP stay from 40% to 100%. At the same time this All Services Admissions Build is a blunt tool in that it groups claims purely based on timing of service dates.
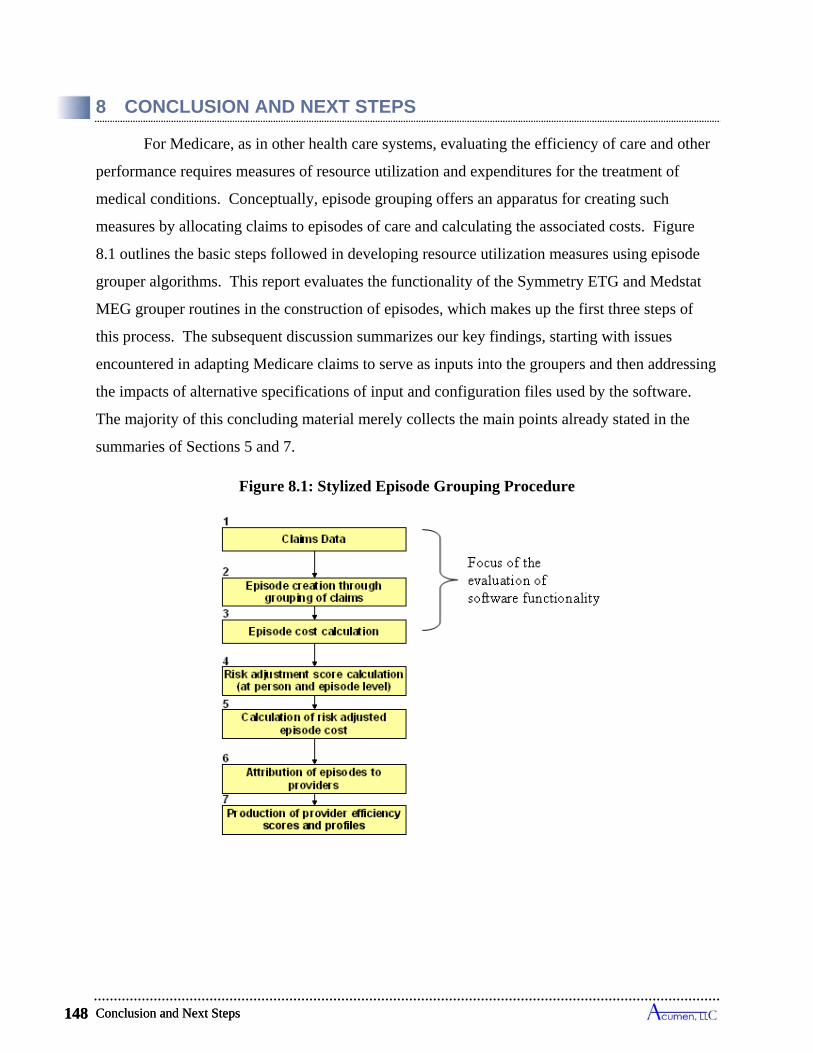
Conclusion and Next Steps 148
8 CONCLUSION AND NEXT STEPS
For Medicare, as in other health care systems, evaluating the efficiency of care and other
performance requires measures of resource utilization and expenditures for the treatment of
medical conditions. Conceptually, episode grouping offers an apparatus for creating such
measures by allocating claims to episodes of care and calculating the associated costs. Figure
8.1 outlines the basic steps followed in developing resource utilization measures using episode
grouper algorithms. This report evaluates the functionality of the Symmetry ETG and Medstat
MEG grouper routines in the construction of episodes, which makes up the first three steps of
this process. The subsequent discussion summarizes our key findings, starting with issues
encountered in adapting Medicare claims to serve as inputs into the groupers and then addressing
the impacts of alternative specifications of input and configuration files used by the software.
The majority of this concluding material merely collects the main points already stated in the
summaries of Sections 5 and 7.
Figure 8.1: Stylized Episode Grouping Procedure
Conclusion and Next Steps 148

Functionality of the Symmetry ETG and Medstat MEG Software | August 2008 149
8.1 A Framework for Comparing the Episodes Created by Symmetry and Medstat Groupers
To relate the outputs of the two groupers, we develop a comprehensive framework and a
common set of metrics to report and analyze the results. This framework exploits the fact that
both groupers map claims to episodes. Tracking the claims linked to each episode, we define
measures of episode length and costs that can be compared for Symmetry and Medstat output.
Differences in how the two groupers calculate episode length necessitates the
development of a single measure of episode length for purposes of evaluation. Symmetry uses
anchor claims – claims that represent a clinical interaction – to open and close episodes. These
anchor claims can be grouped to one episode while still serving as an anchor for another episode.
Medstat calculates episode end dates as the start date of the last claim in the episode, rather than
the end date, with the exception of IP claims for which the end date is used. Our approach to
calculating episode length starts an episode using the earliest start date on any claim(s),
regardless of claim type, and ends an episode using the latest end date on any claim in the
episode. This episode length assignment also applies to chronic episodes, meaning that even
though chronic episodes are grouped annually, an episode length will be calculated from the
earliest date and the latest date within a year; the groupers’ define episode length for chronic
conditions as the chronic episode length set by the user. For an overwhelming majority of acute
episodes for both groupers, there is no difference between our length assignment and Symmetry
and Medstat’s assignments. But since both groupers set chronic episode length according to a
fixed 12-month period, our episode length assignments almost always yields shorter chronic
episodes than those reported by the groupers.
We calculate an episode’s cost based on its assigned claims. The cost of a claim consists
of its Medicare payments, excluding the pass-thru payments, deductibles and copayments made
by enrollees, and capital PPS payments for IP claims. When a claim is grouped to only one
episode, we assign its entire cost to that episode. This situation applies for all of the claims
grouped by Medstat, and for all non-institutional claims grouped by Symmetry. However,
Symmetry’s use of service-level inputs (i.e., pseudo-claims) for inputting information on
institutional claims, which commonly links the input records from a single parent claim to more
than one episode, requires an allocation rule for distributing the cost of a multiple-assigned
institutional claim to its linked episodes. In the analysis reported here, we allocate the entire cost
Functionality of the Symmetry ETG and Medstat MEG Software | August 2008 149
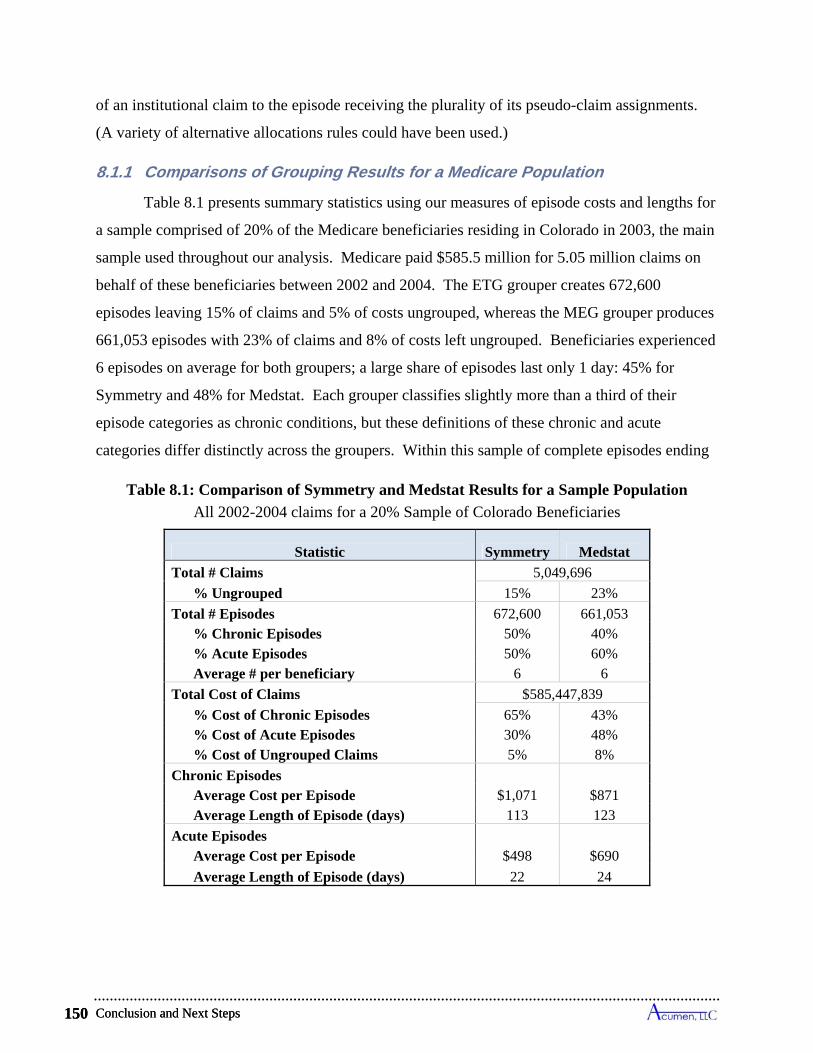
Conclusion and Next Steps 150
of an institutional claim to the episode receiving the plurality of its pseudo-claim assignments.
(A variety of alternative allocations rules could have been used.)
8.1.1 Comparisons of Grouping Results for a Medicare Population
Table 8.1 presents summary statistics using our measures of episode costs and lengths for
a sample comprised of 20% of the Medicare beneficiaries residing in Colorado in 2003, the main
sample used throughout our analysis. Medicare paid $585.5 million for 5.05 million claims on
behalf of these beneficiaries between 2002 and 2004. The ETG grouper creates 672,600
episodes leaving 15% of claims and 5% of costs ungrouped, whereas the MEG grouper produces
661,053 episodes with 23% of claims and 8% of costs left ungrouped. Beneficiaries experienced
6 episodes on average for both groupers; a large share of episodes last only 1 day: 45% for
Symmetry and 48% for Medstat. Each grouper classifies slightly more than a third of their
episode categories as chronic conditions, but these definitions of these chronic and acute
categories differ distinctly across the groupers. Within this sample of complete episodes ending
Table 8.1: Comparison of Symmetry and Medstat Results for a Sample Population
All 2002-2004 claims for a 20% Sample of Colorado Beneficiaries
Statistic Symmetry Medstat
Total # Claims 5,049,696
% Ungrouped 15% 23%
Total # Episodes 672,600 661,053 % Chronic Episodes 50% 40% % Acute Episodes 50% 60% Average # per beneficiary 6 6
Total Cost of Claims $585,447,839
% Cost of Chronic Episodes 65% 43% % Cost of Acute Episodes 30% 48% % Cost of Ungrouped Claims 5% 8%
Chronic Episodes Average Cost per Episode $1,071 $871 Average Length of Episode (days) 113 123
Acute Episodes Average Cost per Episode $498 $690
Average Length of Episode (days) 22 24
Conclusion and Next Steps 150
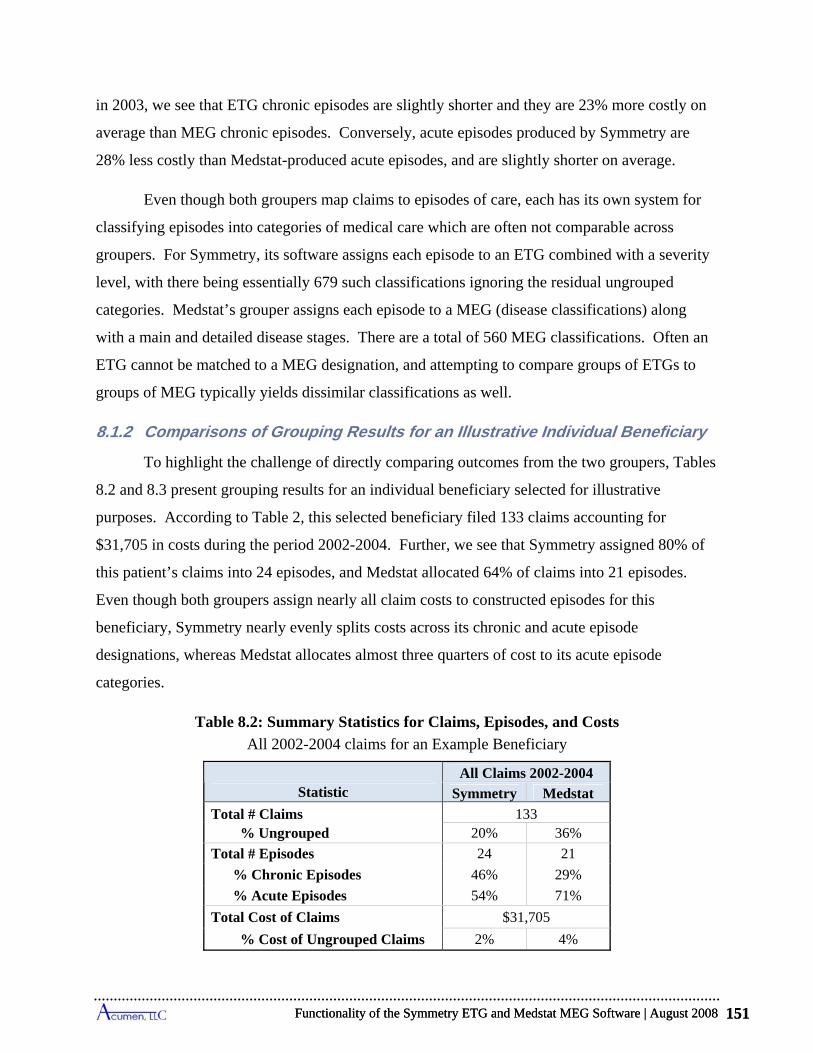
Functionality of the Symmetry ETG and Medstat MEG Software | August 2008 151
in 2003, we see that ETG chronic episodes are slightly shorter and they are 23% more costly on
average than MEG chronic episodes. Conversely, acute episodes produced by Symmetry are
28% less costly than Medstat-produced acute episodes, and are slightly shorter on average.
Even though both groupers map claims to episodes of care, each has its own system for
classifying episodes into categories of medical care which are often not comparable across
groupers. For Symmetry, its software assigns each episode to an ETG combined with a severity
level, with there being essentially 679 such classifications ignoring the residual ungrouped
categories. Medstat’s grouper assigns each episode to a MEG (disease classifications) along
with a main and detailed disease stages. There are a total of 560 MEG classifications. Often an
ETG cannot be matched to a MEG designation, and attempting to compare groups of ETGs to
groups of MEG typically yields dissimilar classifications as well.
8.1.2 Comparisons of Grouping Results for an Illustrative Individual Beneficiary
To highlight the challenge of directly comparing outcomes from the two groupers, Tables
8.2 and 8.3 present grouping results for an individual beneficiary selected for illustrative
purposes. According to Table 2, this selected beneficiary filed 133 claims accounting for
$31,705 in costs during the period 2002-2004. Further, we see that Symmetry assigned 80% of
this patient’s claims into 24 episodes, and Medstat allocated 64% of claims into 21 episodes.
Even though both groupers assign nearly all claim costs to constructed episodes for this
beneficiary, Symmetry nearly evenly splits costs across its chronic and acute episode
designations, whereas Medstat allocates almost three quarters of cost to its acute episode
categories.
Table 8.2: Summary Statistics for Claims, Episodes, and Costs
All 2002-2004 claims for an Example Beneficiary
Statistic All Claims 2002-2004
Symmetry Medstat
Total # Claims 133 % Ungrouped 20% 36%
Total # Episodes 24 21
% Chronic Episodes 46% 29%
% Acute Episodes 54% 71%
Total Cost of Claims $31,705
% Cost of Ungrouped Claims 2% 4%
Functionality of the Symmetry ETG and Medstat MEG Software | August 2008 151
Conclusion and Next Steps 152
The difficulty in comparing the groupers’ outputs can be seen in Table 3, which presents
a detailed breakdown listing several of the ETG and MEG assignments for our illustrative
beneficiary. The top set of rows of this table shows examples of “similar” episodes constructed
by the groupers. These episodes have somewhat parallel clinical interpretations, and their
assigned costs are close. If all grouping results looked like these, one might be indifferent about
which grouper to use in allocating claims into episodes of care. However, the lower set of rows
in Table 3 shows the examples of “dissimilar” episodes produced by the two groupers for this
beneficiary. In the first of these rows, the occurrence of a bacterial lung infection ETG and a
bacterial pneumonia MEG suggests an overlap in the beneficiary’s assessed clinical
circumstances, but Symmetry assigned a cost of $203 to this episode and Medstat allotted a cost
of $14,626 which is hardly comparable. Moving to the last rows, whereas both groupers have an
episode classification for Alzheimer’s, only Symmetry identified this beneficiary has having this
chronic neurological condition, with costs totaling $14,897. The only neurological condition
assessed by Medstat was an acute psychosis episode, with costs totaling $266. Finally, Medstat
created a chronic obstructive pulmonary disorder episode for this beneficiary and Symmetry
identified congestive heart failure, but neither groupers produced respective episodes for the two
chronic conditions. The findings for this illustrative patient are representative of what we found
for many Medicare enrollees: the outputs produced by the Symmetry and Medstat software
commonly present different pictures of the health status and medical treatment circumstances of
the same person. The differences become more pronounced the greater the complications of a
beneficiary’s medical circumstances and the higher the costs
8.2 Applying the Symmetry and Medstat Groupers to Medicare Data
As the Symmetry ETG and Medstat MEG are designed to generate episodes of care using
private insurance claims, the specific structure of Medicare claims data poses several challenges
that must be addressed in order for these programs to generate valid and reliable episodes of care
for Medicare beneficiaries. Our analysis highlights a number of issues specific to using the
grouper packages with Medicare claims data. The following discussion first addresses
considerations in using the ETG grouper software, and then identifies issues pertinent to using
the MEG grouper.
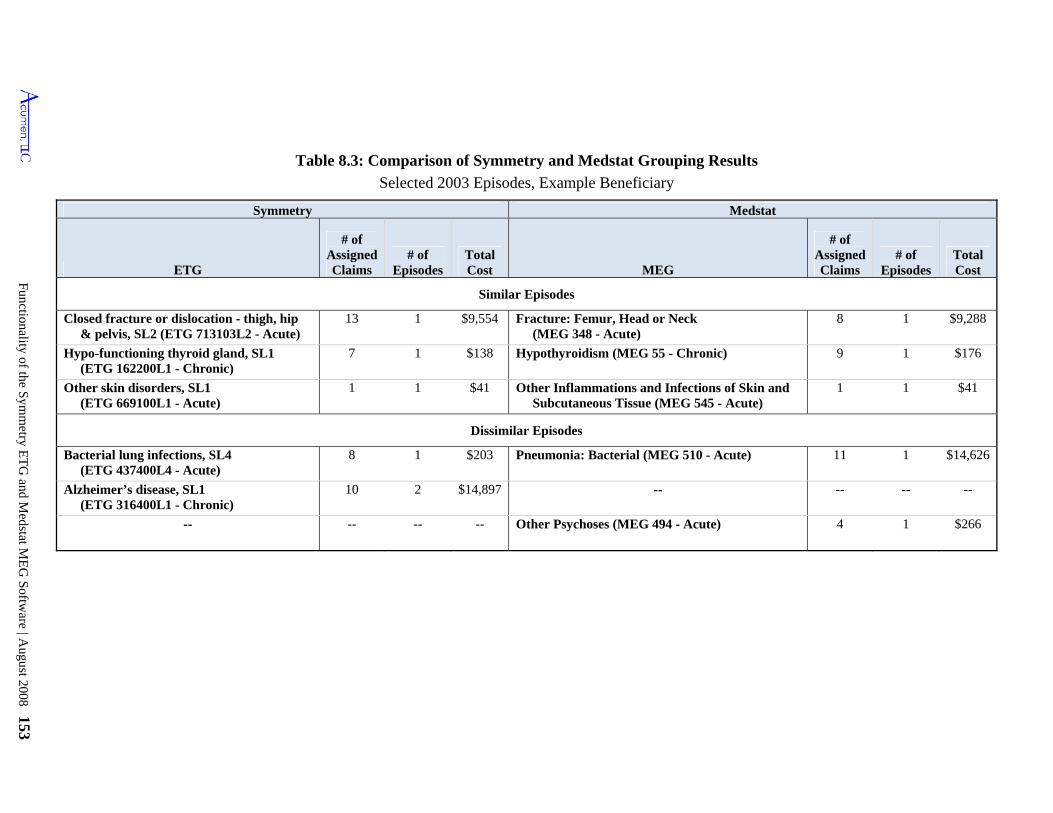
Functionality of the S
ymm
etry ET
G and M
edstat ME
G S
oftware | A
ugust 2008 153
Table 8.3: Comparison of Symmetry and Medstat Grouping Results
Selected 2003 Episodes, Example Beneficiary
Symmetry Medstat
ETG
# of Assigned Claims
# of Episodes
Total Cost MEG
# of Assigned Claims
# of Episodes
Total Cost
Similar Episodes
Closed fracture or dislocation - thigh, hip & pelvis, SL2 (ETG 713103L2 - Acute)
13 1 $9,554 Fracture: Femur, Head or Neck (MEG 348 - Acute)
8 1 $9,288
Hypo-functioning thyroid gland, SL1 (ETG 162200L1 - Chronic)
7 1 $138 Hypothyroidism (MEG 55 - Chronic) 9 1 $176
Other skin disorders, SL1 (ETG 669100L1 - Acute)
1 1 $41 Other Inflammations and Infections of Skin and Subcutaneous Tissue (MEG 545 - Acute)
1 1 $41
Dissimilar Episodes
Bacterial lung infections, SL4 (ETG 437400L4 - Acute)
8 1 $203 Pneumonia: Bacterial (MEG 510 - Acute) 11 1 $14,626
Alzheimer’s disease, SL1 (ETG 316400L1 - Chronic)
10 2 $14,897 -- -- -- --
-- -- -- -- Other Psychoses (MEG 494 - Acute) 4 1 $266
Conclusion and Next Steps 154
8.2.1 Key Findings for Symmetry’s ETG Grouper
Our summary of Symmetry’s functionality noted nine characteristics of the software to
keep in mind when applying the grouper to Medicare claims. Five involve features of the basic
operation of the ETG grouper in constructing episodes and associated costs from Medicare data,
including two that give rise to significant challenges when using this grouper in a Medicare
setting:
Depending on the type of Medicare claim, Symmetry relies on revenue center codes, procedure codes or a combination in its grouping process: The availability of these codes on different types of claims is principally dictated by Medicare payment rules.
o For institutional claims in Medicare, only revenue center codes are universally reported, with each code designating a particular medical service. We create service-level input records for the ETG grouper, which we term pseudo-claims, using a single revenue center code as the designator of the service. In some instances, a revenue center code on a claim has an associated HCPCS/CPT procedure code (which typically conveys more detail about the form of the service), and when available, we include this accompanying procedure code on the corresponding input record as well. Whereas all institutional pseudo-claims have a revenue center code, many do not have an accompanying procedure code. Of pseudo-claims constructed from IP claims, 2% have a HCPCS or CPT code; 7% of pseudo-claims from SNF claims have a HCPCS/CPT code; and 6% of input records from HS claims have a procedure code. In contrast to these types of claims, OP and HH claims typically have a procedure code accompanying their revenue center codes; 72% of pseudo-claims from OP claims and 88% from HH claims have a HCPCS/CPT code.
o Constructing input records for OP claims ignoring revenue center codes and using only information supplied by HCPCS/CPT procedure codes results in slightly more ungrouped claims, most of them being OP claims, and induces 7% of costs to shift across episodes.
o For non-institutional Medicare services, PB and DME claims are readily separated into line items associated with a single HCPCS or CPT code; these claim types have no revenue center codes. Input records for PB and DME claims include the line-item procedure code as their indicator of the medical service performed.
The ETG software inputs each claim as a set of service-level records, with each record individually assigned to an episode. This can lead to a parent institutional claim being linked to multiple episodes:
o Each pseudo-claim (i.e., input record) constructed from an IP, OP, SNF, HH or HS claim consists of a revenue center code, the corresponding HCPCS/CPT
Conclusion and Next Steps 154
Functionality of the Symmetry ETG and Medstat MEG Software | August 2008 155
procedure code when present, and up to four diagnoses associated with the parent claim.
o While Symmetry allows for up to 4 ICD-9 procedure codes to be input with each pseudo-claim, Symmetry’s algorithm does not use ICD-9 procedure codes in its grouping process. Medicare uses these codes to identify DRG classifications which determine payments.
o Each pseudo-claim constructed from a PB and DME claim consists of a single HCPCS/CPT procedure code and the line-item diagnosis code.
o Symmetry's grouper often links pseudo-claims from a single parent claim to different episodes. This results in one (aggregate) Medicare claim being grouped into more than one episode. Over 52% of SNF claims are split across episodes, as are 23% of IP claims, 40% of HH claims, 13% of OP claims, and 15% of HS claims.
Medicare claims data commonly have more diagnosis codes than are accepted in Symmetry input records:
o The ETG grouper’s input records can incorporate up to 4 diagnosis codes. 82% of IP claims, 70% of SNF claims, and 38% of HH claims have more than 4 codes.
o Our investigations suggest that the inclusion of extra diagnoses on input records is unlikely to alter the number and distributional characteristics of episodes, but it could induce appreciable shifts in claims across episode types. Using just the primary diagnosis code leads to only a 5% decrease in the number of episodes, small changes in the distributions of their costs and lengths, and only a 1.8 percentage point rise in the cost of ungrouped claims compared to using the first 4 codes. However, without any secondary diagnoses, 21% of claims either change ETGs or episode dates (implying episode shifts), which results in 35% of claim costs being redistributed to other episodes.
Symmetry does not state how to allocate the cost of a Medicare claim to its pseudo-claims, leaving questions about how to apportion the cost of the claim across its linked episodes:
o When Symmetry assigns the pseudo-claims of a single Medicare claim to multiple episodes, one faces the challenge of how to distribute the cost of this claim across these episodes. Our analysis allocates the entire claim payment to only one of its episodes based on a majority rule, with all remaining episodes receiving none of the claim’s cost. Like any such allocation rule, ours may be inappropriate for assessing the costs of episodes.
o An alternative way to resolve the cost allocation problem is to input each institutional claim as a single record. Symmetry limits this record to include at most one revenue center code and one procedure code from the original claim. With many codes appearing on claims, the choice of which single revenue and/or procedure code to include on the single input record may be subjective.
Functionality of the Symmetry ETG and Medstat MEG Software | August 2008 155

Conclusion and Next Steps 156
(Selecting the room and board revenue center code is a popular option, but many institutional claims lack this code.) The choice will affect the way Symmetry groups claims to episodes (a logical inference because pseudo-claims, which differ only by revenue/procedure codes, do get grouped into different episodes).
The ETG grouping algorithms are not designed to follow the flow of services expected under Medicare’s benefit structures, and episodes constructed by Symmetry do not fully emulate some of the practice patterns seen in Medicare data.
o Medicare’s payment polices promote medical care that link IP stays to post-acute care and to physician services. For post-acute care, this concept is embedded in the Medicare benefit rules; SNF stays are only paid when they are a continuation of inpatient care. For physician claims, Medicare pays for E&M services during IP stays (e.g., daily visits during an admission for a medical condition). Near daily PB visits are, in fact, the norm for IP stays in Medicare data.
o The ETG grouper does not explicitly incorporate these Medicare policies and practices and thus does not fully capture them in its construction of episodes. Only 48% of SNF claims are grouped to the same episodes as the initiating IP claims. Overall, 69% of IP stays show daily E&M hospital visits, but only 42% have daily visits grouped to the same episode by Symmetry. Moreover, the ETG grouper often assigns components of a single IP claim to multiple episodes, which raises the issue of how to allocate the various SNF and IP-affiliated PB claims to the candidate episodes.
o In an attempt to strengthen agreement with Medicare policies, we expanded the number of diagnoses on PB claims by adding "header" diagnoses. Including these additional diagnoses only slightly increases the fraction of PB claims assigned to the same episode as a concurrent IP stay, from 56% to 58%. This approach also slightly decreases the fraction of SNF claims grouped to the same episode as an IP claim from 48% to 47.5%. While this modification significantly changes the number and composition of episodes, it fails to regroup claims in a manner more consistent with Medicare’s concept of treatment episodes.
Four additional properties of Symmetry’s grouping results should be kept in mind when
using its episode outputs to create attribution rules and resource utilization measures:
The construction of Complete Episodes generally approximates the annual cost of claims assigned to the different ETG categories: Complete episodes include all chronic episodes ending in 2003, and only those acute episodes that begin at least one clean period after the beginning of 2002 and end in 2003.
o The costs of claims grouped to 2003 Complete Episodes for an ETG closely approximate the annual costs assignable to ETGs within a calendar year. The cost of 2003 Complete Chronic Episodes equals 99% of the annual claims costs assigned to chronic episodes in the year 2003; and the corresponding figure for all acute episodes is 93% of annual claims cost.
Conclusion and Next Steps 156
Functionality of the Symmetry ETG and Medstat MEG Software | August 2008 157
o Symmetry divides acute conditions into complete episodes using clean periods. For the top ten highest-cost acute ETGs, episodes of the same type sometimes occur within the designated clean period when the dates of claims are used to identify the beginnings and ends of episodes. In particular, depending on the type of ETG, between 0.6% and 35.4% of the same-type episodes take place within clean periods. In some rare instances, these episodes can even overlap, meaning that one episode starts before the prior one ends.
o Symmetry starts and terminates chronic episodes in fixed 12-month periods. For the vast majority of afflicted individuals, one chronic episode immediately follows another. For the top ten highest-cost chronic ETGs, chronic episodes of the same ETG run as continuous events for individuals between 18% and 81% of the time depending on the type of chronic condition.
Considerable variation exists in the costs of individual episodes within an ETG:
o The distributions of costs across episodes within an ETG exhibit substantial dispersion. For instance, for each of the top five highest-cost acute and chronic ETGs, the level of cost demarking the most expensive 10% of episodes always exceeds the level demarking the cheapest 10% by at least a factor of four, and in most instances it is far more than two orders of magnitude larger.
o These distributions also reveal that the highest-cost episodes account for large shares of total ETG costs. For the top five acute ETGs, the top 5% of episodes alone account for 15% to 42% of total annual cost for the ETG, and for the top five chronic ETGs this range is 26% to 50%.
o This large amount of cost variation suggests that developing a reliable method of risk adjustment for episodes and beneficiary costs necessary for profiling providers in Medicare settings requires approaches not yet available in the existing ETG software. With multiple comorbidities often present and patients that tend to be much more complex, the risk and severity models developed for commercial populations are unlikely to work effectively in the Medicare population.
Symmetry’s grouping results depend on the order in which records are input into the grouper:
o The ETG grouper requires input records be sorted by beneficiary as well as claim start and end dates. The sort order of records within these beneficiary/start-date/end-date compilations is arbitrary, and yet changing this order produces different grouping results for a notable number of beneficiaries.
o In a typical example, we show that reordering within these beneficiary/start-date/end-date compilations leads to a change in the assigned ETG type for 0.4% of Medicare claims. More significantly, 0.9% of Medicare claims change their assigned ETGs or episode dates, implying a 1.1% reallocation of Medicare costs to different episodes of care.
Functionality of the Symmetry ETG and Medstat MEG Software | August 2008 157
Conclusion and Next Steps 158
Symmetry’s groupings of 2003 Complete Episodes depend on the time horizons used to include claims in 2004:
o Even after including claims from the first half of 2004, adding claims for the second 6 months of 2004 produces changes in the formulation of 2003 Complete Episodes. In particular, 2.5% of claims accounting for 3.5% of costs are moved to a different 2003 episode by adding the 6-month extension of the time horizon in 2004. While this shift is not large, one might expect an even smaller impact on 2003 Complete Episodes since the first 6 months of 2004 already well exceeds the longest clean period of any acute ETG and chronic ETGs are truncated on an annual basis.
o In a Medicare policy setting, this finding implies that 2003 grouping results will depend on the horizon specified in 2004 when claims will no longer be counted; counting claims with service dates up until mid-year 2004 will produce somewhat different findings than waiting for all claims in 2004.
8.2.2 Key Findings for the Medstat MEG Grouper
Medstat takes a somewhat different approach to the same data. We highlight three main
features that are important considerations when using Medstat’s software to group Medicare
claims into episodes. The last two represent significant challenges when using this grouper in a
Medicare setting:
Medstat’s grouping relies almost solely on diagnosis information: In the vast majority of cases Medstat’s software relies on the diagnosis information from a claim to perform its grouping process. Information about procedures is primarily used to determine whether a claim represents an x-ray/lab event, and in some instances to allow the grouper to decide between more than one valid diagnosis on a given claim.
o Although Medstat’s input records allow for up to 15 procedure codes, blanking all these codes makes only a marginal difference in grouping outcomes. Only 1.8% of claims shift across episodes as a result of blanking out procedure costs, resulting in a shift in 3.4% of costs across episodes.
o The grouping process entirely ignores any information about DRGs.
o Medstat's software distinguishes IP and PB claims from other types of Medicare claims, but it does not differentiate among other types of claims. Switching claims from one of these sources to another results in no change in constructed episodes.
Medstat’s grouper does not offer the capacity to treat a claim as an aggregate of services possibly linkable to more than one episode:
o Institutional Medicare claims typically cover a number of medical services. Each of these claims is allocated to one and only one episode, and the entire cost associated with this claim is attributed to this single health event.
Conclusion and Next Steps 158
Functionality of the Symmetry ETG and Medstat MEG Software | August 2008 159
o Most Medicare institutional claims are paid with prospective payment systems. Prospective payments not only depend on diagnoses, but also on procedures and the likelihood of comorbidities. The presence of comorbidities can imply existence of multiple episodes of care open at the same time. The inability to associate the cost of any such claim with more than one episode represents a challenge in applying Medstat's grouper software to a Medicare population.
Medstat’s grouping algorithms can be adapted to bundle all Part B physician and other claims incurred during a hospital stay, as well as SNF claims that immediately follow the stay, into the same episode as the inpatient stay:
o The MEG grouper does not explicitly incorporate logic that links claims emulating some important patterns of care common to Medicare settings, patterns supported by Medicare's payment policies. This grouper is not designed, for example, to incorporate expectations that an IP stay (paid for by a medical DRG) be associated with near-daily E&M physician claims; nor does it necessarily treat SNF claims as a continuation of inpatient care. The MEG grouper cannot distinguish E&M claims from other PB claims, nor does it distinguish SNF from many other types of non-IP claims.
o For the Baseline run of the MEG grouper, only 40% of SNF claims are grouped to the same episodes as the initiating IP claims. Overall, 69% of IP stays show daily E&M hospital visits, but only 32% have daily visits grouped to the same episode by Medstat.
o Medstat suggested an adaptation of its Admissions Build feature to assist in mimicking aspects of Medicare norms involving IP stays. The All Services Admissions Build changes the concept of an episode: when enabled, it groups all claims concurrent with an IP stay to the same episode, regardless of diagnosis.
o With the All Services Admissions Build, a SNF claim that starts on or near the day of discharge will be included in the same episode as the inpatient stay. The All Services Admissions Build increases the fraction of SNF claims grouped to the same episode as an IP stay from 40% to 93%.
o Application of the All Services Admissions Build is effective in linking IP claims to concurrent PB claims: it increases the fraction of linkage PB claims grouped to the same episode as a concurrent IP claim from 40% to 100%. At the same time the All Services Admissions Build is a blunt tool in that it groups claims purely based on timing of service dates.
Three additional traits of Medstat’s grouping results should be considered when utilizing
its episode outputs to formulate attribution rules and resource utilization measures:
The construction of Complete Episodes generally approximates the annual cost of claims assigned to the different MEG categories: Complete episodes include all chronic episodes ending in 2003, and only those acute episodes that begin at least one clean period after the beginning of 2002 and end in 2003.
Functionality of the Symmetry ETG and Medstat MEG Software | August 2008 159
Conclusion and Next Steps 160
o The costs of claims grouped to 2003 Complete Episodes for a MEG closely approximate the annual costs assignable to MEGs within a calendar year. The cost of 2003 Complete Chronic Episodes equals 98% of the annual claims costs assigned to chronic episodes in the year 2003; and the corresponding figure for all acute episodes is 94% of annual claims cost
o Medstat divides acute conditions into complete episodes using clean periods. For the top ten highest-cost acute MEGs, episodes of the same type sometimes occur within the designated clean period when the dates of claims are used to identify the beginnings and ends of episodes. In particular, depending on the type of MEG, between 0.1% and 20.3% of the same-type episodes take place within clean periods. In some rare instances, these episodes even overlap, meaning that one episode starts before the prior one ends.
o Medstat starts and terminates chronic episodes using 12-month periods. For the vast majority of afflicted individuals, one chronic episode immediately follows another. For the top ten highest-cost chronic MEGs, chronic episodes of the same MEG run as uninterrupted events for individuals between 53% and 87% of the time depending on the type of chronic condition. In rare cases, chronic episode of the same time sometimes even overlap.
Considerable variation exists in the costs of individual episodes within a MEG:
o The distributions of costs across episodes within a MEG exhibit substantial dispersion. For instance, for each of the top five highest-cost acute and chronic MEGs, the level of cost demarking the most expensive 10% of episodes always exceeds the level demarking the cheapest 10% by at least an order of magnitude, and in most instances it is more than two orders of magnitude larger.
o These distributions also reveal that the highest-cost episodes account for large shares of total MEG costs. For the top five acute MEGs, the top 5% of episodes alone account for 25% to 48% of total annual cost for the MEG, and for chronic MEGs this range is 35% to 64%.
o This large amount of cost variation suggests that developing a reliable method of risk adjustment for episodes and beneficiary costs necessary for profiling providers in Medicare settings requires approaches not yet available in the existing MEG software. With the common presence of multiple comorbidities and the complexity of the patients, the risk and severity models developed for commercial populations are unlikely to work as effectively in the Medicare population.
Medstat’s grouping results depend on the order in which records are input into the grouper:
o The MEG grouper requires that input records be sorted by beneficiary and claim start dates. In addition, we always sort claims by end date as well to create beneficiary/start date/end date compilations. The sort order of records within
Conclusion and Next Steps 160
Functionality of the Symmetry ETG and Medstat MEG Software | August 2008 161
these compilations is arbitrary, and yet changing this order produces different grouping results for a notable number of beneficiaries.
o In a typical example, we show that reordering records within these beneficiary/start-date/end-date compilations leads to a reassignment of 0.4% of Medicare claims to different episodes, implying a 0.6% reallocation of Medicare costs to different episodes of care; 0.2% of claims are reallocated to entirely distinct MEG types.
8.2.3 Influence of Altering Software Configurations and Forms of Input Files
Implementing the grouper packages requires choices in selecting the form of the input
file drawn from the Medicare claims and the settings of configuration options. The features
summarized above rely primarily on results from "Baseline" specifications. Our analysis also
compares this Baseline to alternative choices in the input file creation and configuration settings.
These alternative specifications both identify the representativeness of the Baseline findings and
the sensitivity of the results to these choices.
For Symmetry, we find the results are sensitive to including available secondary
diagnoses when inputting institutional claims, to switching between revenue center and
procedure codes, and to extending the episode length limit. More specifically, altering options in
running the ETG grouper revealed the following main results:
Not including secondary diagnoses in input records decreases the number of episodes by 5% and increases the share of ungrouped claims from 14.6% to 16.4%. More significant, eliminating all but the primary diagnosis induces more than a 20% reassignment of claims to different episodes, representing over 34% of costs shifted across episodes.
Switching from using both revenue center and HCPCS/CPT codes to HCPCS/CPT codes alone for OP claims barely affects most of the summary statistics on episode grouping, but causes 3% more OP claims to remain ungrouped and produces a 5% reassignment of claims to different episodes resulting in a corresponding 7% reallocation of costs.
Extending the episode length limit from 365 to unlimited decreases the number of episodes by nearly 25%, increases the average length of chronic episodes, and produces almost a 9% reassignment of claims and costs to different ETGs.
Other adjustments of Symmetry’s configuration – first diagnosis as primary, track comorbidity, link facility records, days between facility records, and custom clean periods – generate only marginal differences in the summary statistics describing episodes.
Functionality of the Symmetry ETG and Medstat MEG Software | August 2008 161
Conclusion and Next Steps 162
We find that Medstat’s results are sensitive to the x-ray/lab flag and to increases in the
episode length limit. In particular, the major results of different choices in running the MEG
grouper include:
Eliminating all secondary diagnosis codes in all of Medstat's input records (Run 2) leads to virtually no changes in the fraction of claims grouped into episodes, the number of created episodes, the compositional breakdown of episodes into acute and chronic classifications, or the distributional properties of the number and costs of chronic and acute episodes per person. Moreover, it reassigns just over a 1% of claims and nearly 6% of costs to different MEGs. When considering both MEG reassignment and episode date changes, 2.7% of claims shift across episodes, accounting for a shift of 8.7% in costs.
Although Medstat's input records allow for up to 15 procedure codes, these codes are essentially not used in grouping outcomes. Blanking out all procedure codes decreases the number of episodes by merely 0.3%, and 1.8% of claims and 3.4% of their corresponding costs shift episodes. In sharp contrast, Medstat's use of procedure codes to set the x-ray/lab flag significantly influences grouping results. This flag prevents records from starting episodes. Turning this flag off for all claims decreases the fraction of ungrouped claims from 23.2% to 0.4%. Additionally, 38.5% of claims and 28.9% of the claims' corresponding costs shift across episodes. Turning the flag on for all SNF and HS claims only marginally affects grouping outcomes. Only 0.4% of claims shift across episodes, resulting in a shift of 3.7% of costs across episodes.
Extending the acute episode length limit from 1 day to 9999 days significantly decreases the number of episodes and increases the average length of acute episodes. It also can lead to as much as 6-30% reassignment of claims and 4-40% of costs to different MEGs.
Conversely, other modifications of Medstat’s configuration – Facility Admissions Build stratifying chronic episodes, and altering the look-back period – produce minor effects on grouping outcomes.
8.3 Discussion
This study reveals several fundamental challenges in using the ETG and MEG software
packages in a Medicare setting. One critical issue concerns assigning costs from aggregate
payments for institutional claims. In this study, the aggregate costs for institutional payments are
assigned to only one episode, even if the services within the claim cover different health issues.
Medstat has no strategy to divide costs across these services. Symmetry has the ability to assign
costs of different services using pseudo-claims, but this would require an allocation method that
uses revenue center codes to apportion payments across services aggregated in the same
prospective payment. Without such an allocation method, the cost from an institutional claim –
from a SNF or an IP admission – is assigned to only one episode, even though multiple
Conclusion and Next Steps 162
Functionality of the Symmetry ETG and Medstat MEG Software | August 2008 163
diagnoses may be involved. This dilemma – between the Medicare prospective payment
approach to aggregate payments and the need to divide payments for episode costs – is a basic
challenge in using the episode grouper software in the Medicare setting.
Another challenge concerns the capability of the grouping algorithms to emulate common
practice patterns observed in the Medicare system. Through its benefit structure, Medicare
guides the flows of services and treatment norms that influence patterns of care across the
different claim types. In essence, Medicare has it own concepts of episodes of care in several
prominent situations, most notably ones that relate IP stays to post-acute care and physician
services. For post-acute care, this concept is formally embedded in Medicare benefit rules by
expecting SNF claims to be directly linked to proceeding IP stays. For physician services, the
episode concept is supported by Medicare’s payment authorization for daily visits by a physician
during a hospital admission. One sees direct evidence of practice pattern consistent with these
norms of care in Medicare data, and the application of the groupers in this study raise some
questions regarding the ability of the groupers to perform the linkage of claims expected by
Medicare practitioners. For a grouper to work well within a Medicare setting, it would be
advantageous for its constructed episodes to emulate expected practice patterns. In this way,
practitioners, whose costs may be profiled by a grouper, would have a logical framework for
interpreting results.
Nevertheless, this review of the functionality of the Symmetry ETG and Medstat MEG
software packages explores only the first steps involved in utilizing the episode groupers to
develop measures of resource utilization by Medicare providers. The next steps are left for
future analyses. One formidable task must tackle the problem of devising a reliable method of
risk adjustment for the Medicare population. The evidence in this study showing the high
variation in costs across episodes and the high frequency of individual beneficiaries experiencing
many different episodes suggests that this will require additional studies and new solutions in
Medicare populations. Another challenging task consists of creating an approach for attributing
episode costs to providers. The Symmetry and Medstat software packages are silent about
attribution rules, but clearly development of any approach must recognize how the various
options of the groupers alter their construction of episodes, which is the subject of this study.
Bibliography 164
BIBLIOGRAPHY
Ingenix Symmetry Episode Treatment Groups: Concepts Guide Version 7.0. Waltham, MA: Ingenix, 2007.
Lake, Timothy, Margeret Colby and Stephanie Peterson. Health Plan’s Use of Physician Resource Use and Quality Measures. Washington, DC: Mathematica Policy Research, Inc, October 2007.
Medical Episode Grouper: Version 7.1 User Guide. Ann Arbor, MI: Thomson Medstat, 2006.
Medicare Payment Advisory Commission.. Report to Congress: Increasing the Value of Medicare. Washington, DC: MedPAC, June 2006
Medicare Payment Advisory Commission. Assessing Alternatives to the Sustainable Growth Rate System. Washington, DC: MedPAC March 2007
U.S. Government Accountability Office. Medicare: Providing Systematic Feedback to Physicians on their Practice Patterns Is a Promising Step Toward Encouraging Program Efficiency. Washington, DC: GAO, April 2007.
Bibliography 164
Functionality of the Symmetry ETG and Medstat MEG Software | August 2008 165
APPENDIX A: SYMMETRY RESPONSE
Below are the comments from Ingenix mentioned in the Acknowledgements of this report.
Appendix A: Symmetry Response 166
VIA EMAIL August 29, 2008 Mr. Fred Thomas Project Officer Department of Health and Human Services Centers for Medicaid and Medicare Services Dear Fred, On behalf of our Ingenix/Symmetry, I wanted to extend our most sincere congratulations for your efforts in this project which is aimed primarily at the evaluation of different approaches to grouping Medicare claims data to create episodes of care. We especially congratulate you for producing this final comparative report. We have been happy to collaborate with your team on this project for the past two years and appreciate the careful work undertaken by CMS and Acumen in preparing the report. We have formulated some specific, technical comments that we would appreciate being added to an appendix to the final, public report. These comments have been previously communicated to you and your team and center on some fundamental and foundational issues that we have with some of the approaches taken in the project. You have our formal authorization to include the comments, along with this letter, into your publicly available document. We look forward to continued collaboration on the proposed next Phase of this comparison study which will revolve around the clinical accuracy of the groupers. Until that time, we wish you continued success! Best regards, Dan Dunn, PhD Senior Vice President, Business Solutions Health Management Solutions Ingenix
Appendix A: Symmetry Response 166

Functionality of the Symmetry ETG and Medstat MEG Software | August 2008 167
Ingenix Formal Response Specific Technical Notes
On the issue of Acumen resetting episode start and end dates:
In an effort to compare the results of the two groupers, this study recalculates the key dates describing an ETG episode. As part of standard outputs, ETG identifies a start and end date for each episode, taking into account the clinical and service information relevant to the episode. For example, as part of this logic, ETG uses medical services called anchor records. Anchor records are services provided by a clinician where a definitive diagnosis has been made. Anchor records exclude ancillary services such as drug, diagnostic imaging and laboratory, and medical services and supplies. Given their nature, ETG does not use ancillary services in defining episode start and end dates. Further, ETG uses special logic for chronic conditions, using annual periods of time. The study recomputed episode start and end dates using non-anchor services and did not treat chronic episodes in a standard manner. Thus, in the study, drugs and ancillary claims can determine the start or end of a clinical episode, and, in some cases, an anchor service would not extend the episode's dates. This recalculation can lead to episode overlaps, truncated or extended episode lengths, and misleading statistics. We do not recommend using this method to analyze ETG results.
On the issue of Acumen adding six months of data and comparing episode results:
In section 5 of the grouper comparison report, Acumen runs an experiment in which the data is run twice with the second run excluding the last 6 months of available data. Table 5.26 reports that even for complete episodes, 1.8 % of claims change their ETG assignment. The report admits that this is a small variation, but is alarmed because their expectation was that 0 of the claims would have changed ETG result.
The result of adding data to a grouping impacting ETG results is not surprising. As a condition progresses for a patient or further information is made available, ETG takes advantage of that data to improve the accuracy of the grouping. Further, the interpretation of the true impact of adding six months of data to the grouping is further challenged by the study’s approach to reassigning the start and end date of an episode and their own definition of complete episodes, using a different method from the method used by the ETG software. This artifact also contributes to the observed change. In particular, ETG Episodes are changing when Acumen measures them to be complete, but the grouper itself does not consider them to be complete. Caution should be used in generalizing the findings to other applications of ETG.

Appendix B: Medstat Response 168 Appendix B: Medstat Response 168
APPENDIX B: MEDSTAT RESPONSE
Below are the comments from Thomson/Reuters mentioned in the Acknowledgements of this report.
Appendix B: Medstat Response 168

Functionality of the Symmetry ETG and Medstat MEG Software | August 2008 169
Scott B. McCracken 777 E Eisenhower Pkwy Ann Arbor, MI 48108
734.913.3426 [email protected]
September 4, 2008
Fredrick Thomas Project Officer Centers for Medicare and Medicaid Services 7500 Security Boulevard Baltimore, MD 21244-1850 Dear Fred,
Thank you for the opportunity to offer our comments on the comparative study of episode groupers; “Evaluating the Functionality of the Symmetry ETG and Medstat MEG Software in Forming Episodes of Care Using Medicare Data.” We recognize that a thorough examination and discussion of episodes of care claims grouping methodologies was beyond the scope of this study and view the report as a competent overview of the mechanical workings of the profiled software packages.
We suggest that future investigations look beyond software functionality and focus on the fundamental issues, constraints and inherent trade-offs involved in the grouping of administrative data into episodes of care. For example:
An evaluation of the differences in approaches to the underlying definitions of episode-of-cares – i.e., clinical or resource-based approaches – in light of the intended uses of the groupings would facilitate a better understanding of the differences between the MEG and ETG grouping results but more importantly help guide CMS in the development of an episode grouping algorithm for the Medicare population.
An assessment of the constraints placed on episode grouping algorithms by CMS and industry billing practices and guidelines is recommended. For example, given current billing and coding protocols, could services on an institutional claim be reliably disaggregated and assigned to appropriate episodes of care or would reasonable approximations be acceptable?
A discussion of “ungroupable” claims is warranted. The percent of claims not assigned to an episode is directly related to the decisions made by the user of the software based on assumptions regarding the reliability of information found on certain claims. For example should rule-out diagnoses on the claims submitted by freestanding lab and imaging centers or the diagnosis reported by an ambulance service be allowed to start an episode? As the report documents, it is possible for MEG to assign all claims to episodes but this is at the risk of creating false episodes.
Finally, it is not clear to us why the ETG severity stratification scheme was profiled in the report and the MEG severity levels were not. Since the introduction of the Disease Staging severity-stratified case mix methodology in the Journal of the American Medical Association in 1984, the clinically-defined biological progression of severity stages within
Functionality of the Symmetry ETG and Medstat MEG Software | August 2008 169
Appendix B: Medstat Response 170
a disease have been the foundation of the classification system; the MEG software and episode group definitions; and integral to the analyses performed by the users of MEG. It has also been the subject of over 100 peer reviewed journal articles, discussed in the MEG user documentation and profiled in recent Medicare Payment Advisory Commission (MedPAC) studies referenced in this report. The MEG severity stages were introduced to Acumen in a presentation in March 2006 and in subsequent critiques of draft reports in November 2006 and March 2008.
The rationale for using the severity levels of one grouper and not the other is also confusing to me. On pages 25-26, the report states:
“Symmetry recommends interpreting Base ETGs plus its assessed severity level as the episode categories for comparing costs. Consequently, when we use the term ETG in this report, we interpret this designation of an episode type to be the Base ETG plus an associated severity level.”
“A primary use of the disease stages [severity levels] arises in adjusting episode costs within a MEG for risk factors, a topic not covered in this report. So when we use the term MEG in the subsequent discussion, we interpret this designation of an episode type to be a simple MEG without distinguishing disease stages.”
If risk adjustment can be thought of as a “generic reference to accounting for patient-related factors before examining outcomes of care, regardless of context”79 and severity of illness is a generally accepted risk factor then there would seem to be no difference between two statements.
We make this point so that the readers of this report and the many users of MEG will not interpret the omission of the MEG episode group severity stages from the analysis to be an implicit comment on their value but simply an analytic decision made by Acumen.
Sincerely,
Scott B. McCracken Manager, Healthcare Analytics
79Iezzoni, L.I., editor, Risk Adjustment for Measuring Health Care Outcomes, Third Edition, Health Administration Press, Chicago, IL, 2003, page 17.